Reliable wireless connectivity is crucial for ensuring public safety, especially during emergencies. First responders and civilians alike depend on uninterrupted communication to coordinate efforts, gather critical information, and ultimately save lives.
Wireless infrastructure providers play a vital role in ensuring this connectivity, and many are turning to crowdsourced insights to help identify and address coverage gaps. One such organization is Public Safety Towers Company (PSTC), which has been using Ookla’s Cell Analytics® solution for years to make data-driven decisions to improve public safety connectivity.
This article will explore the critical role of consistently strong connectivity in public safety, the challenges facing public safety communication, and how Public Safety Towers Company uses Ookla Cell Analytics data to identify and address coverage gaps to help emergency responders.
To learn more, watch our webinar: How Wireless Infrastructure Providers Can Improve Public Safety Connectivity with Crowdsourced Insights.
Connectivity in Public Safety: Critical Role and Challenges Faced
With over 80% of 911 calls originating from mobile devices, the need for robust cellular coverage has never been greater. Reliable, uninterrupted communications are essential for fire, police, and EMS personnel to effectively coordinate and respond to emergencies. When first responders experience poor coverage, they may face severe consequences, such as:
- Inability to communicate with dispatch or other team members
- Limited access to critical data and pre-arrival intelligence
- Hindered situational awareness and decision-making capabilities
Dispatchers play a crucial role in gathering information from callers to provide first responders with a comprehensive understanding of the situation they are about to face. However, when connectivity is poor, this process can be disrupted, leaving first responders with incomplete or inaccurate information, potentially compromising public safety.
Chief Barry Hutchings, Senior Operations Advisor at The Western Fire Chiefs Association, shared an example during our recent webinar of arriving on scene and having no portable radio or cell coverage, forcing him to rely on a 100-watt radio in his engine for communication. Such situations highlight the critical need for reliable wireless connectivity in emergency responses.
Despite the critical importance of reliable wireless connectivity, several challenges hinder the development of comprehensive coverage:
- Historical gaps in coverage due to narrowed communication bands have left many areas with inadequate service, making it difficult for first responders to communicate effectively
- Difficulties in building new towers to address coverage gaps, including identifying optimal locations, navigating regulatory hurdles, and securing funding
- Growing importance of pre-arrival intelligence for first responders, which requires expansive coverage and reliable data connections
Addressing these challenges requires collaborative efforts between public safety organizations and wireless infrastructure providers. By leveraging crowdsourced insights and innovative solutions such as Ookla Cell Analytics, stakeholders can work together to identify coverage gaps, prioritize improvements, and ultimately build more resilient and responsive networks that better serve our communities.
Using Ookla Cell Analytics to Identify Coverage Gaps
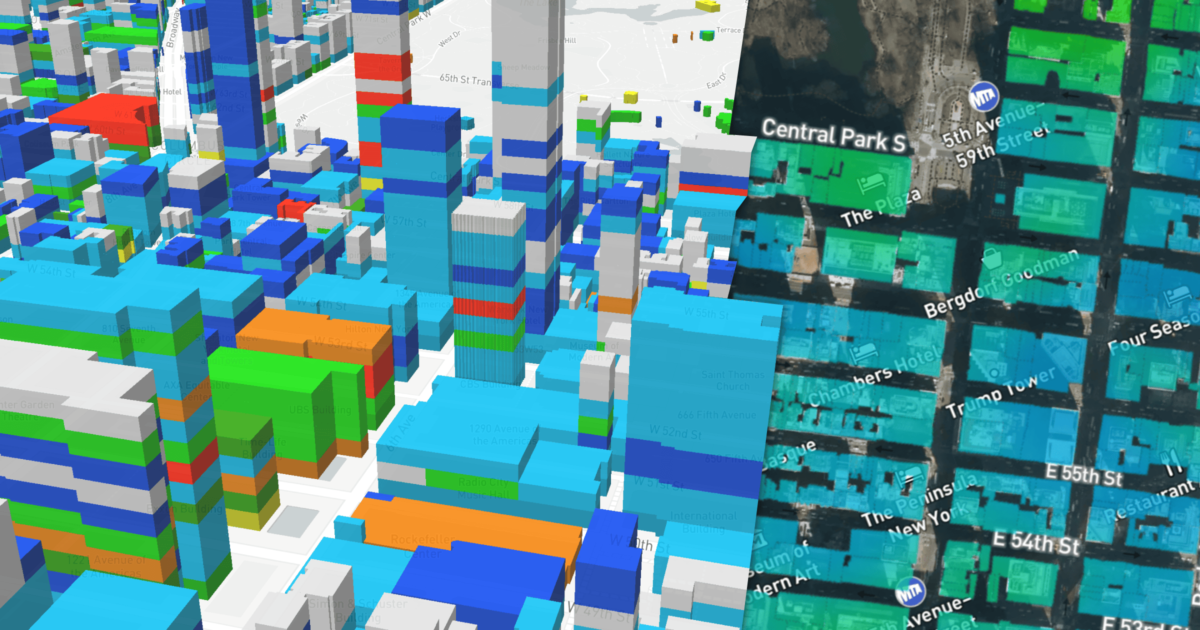
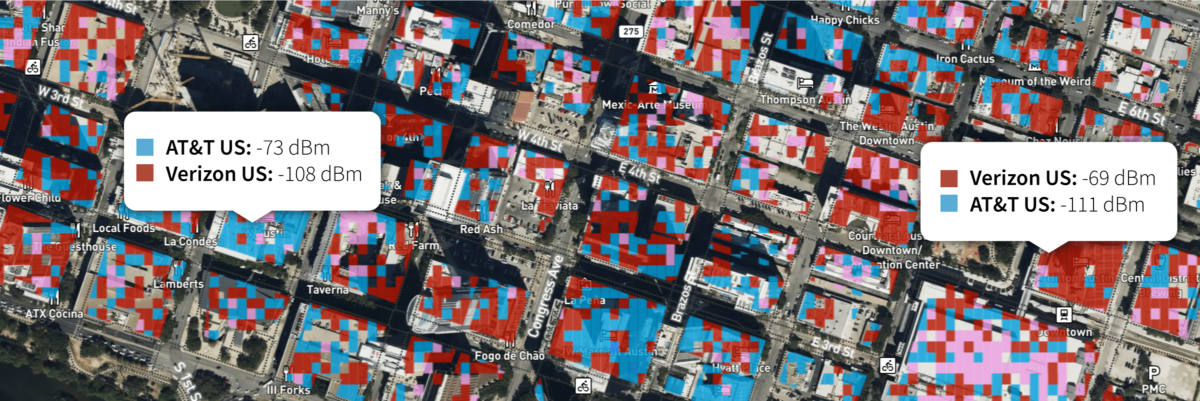
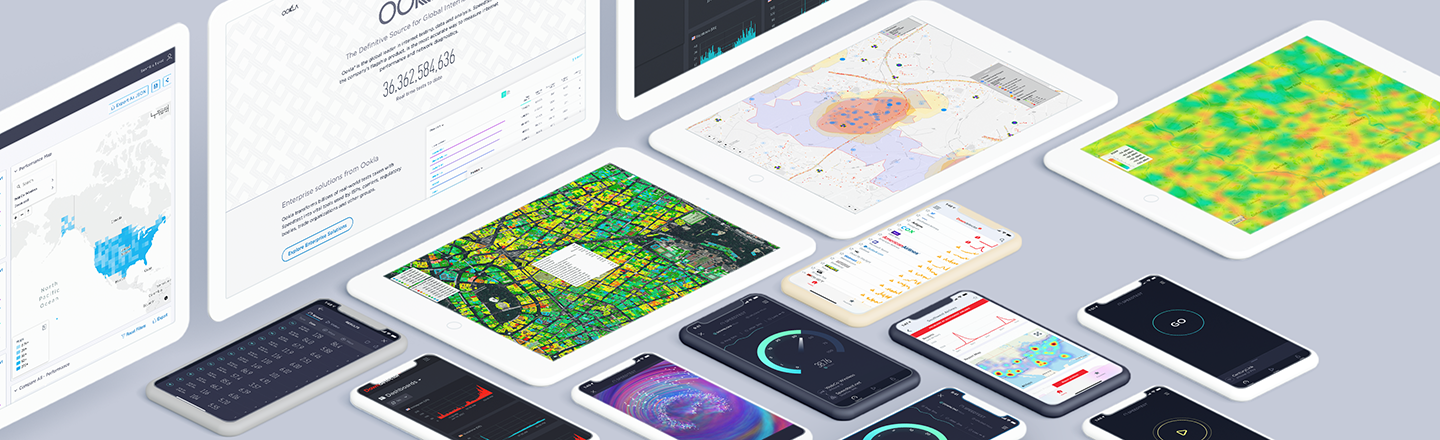
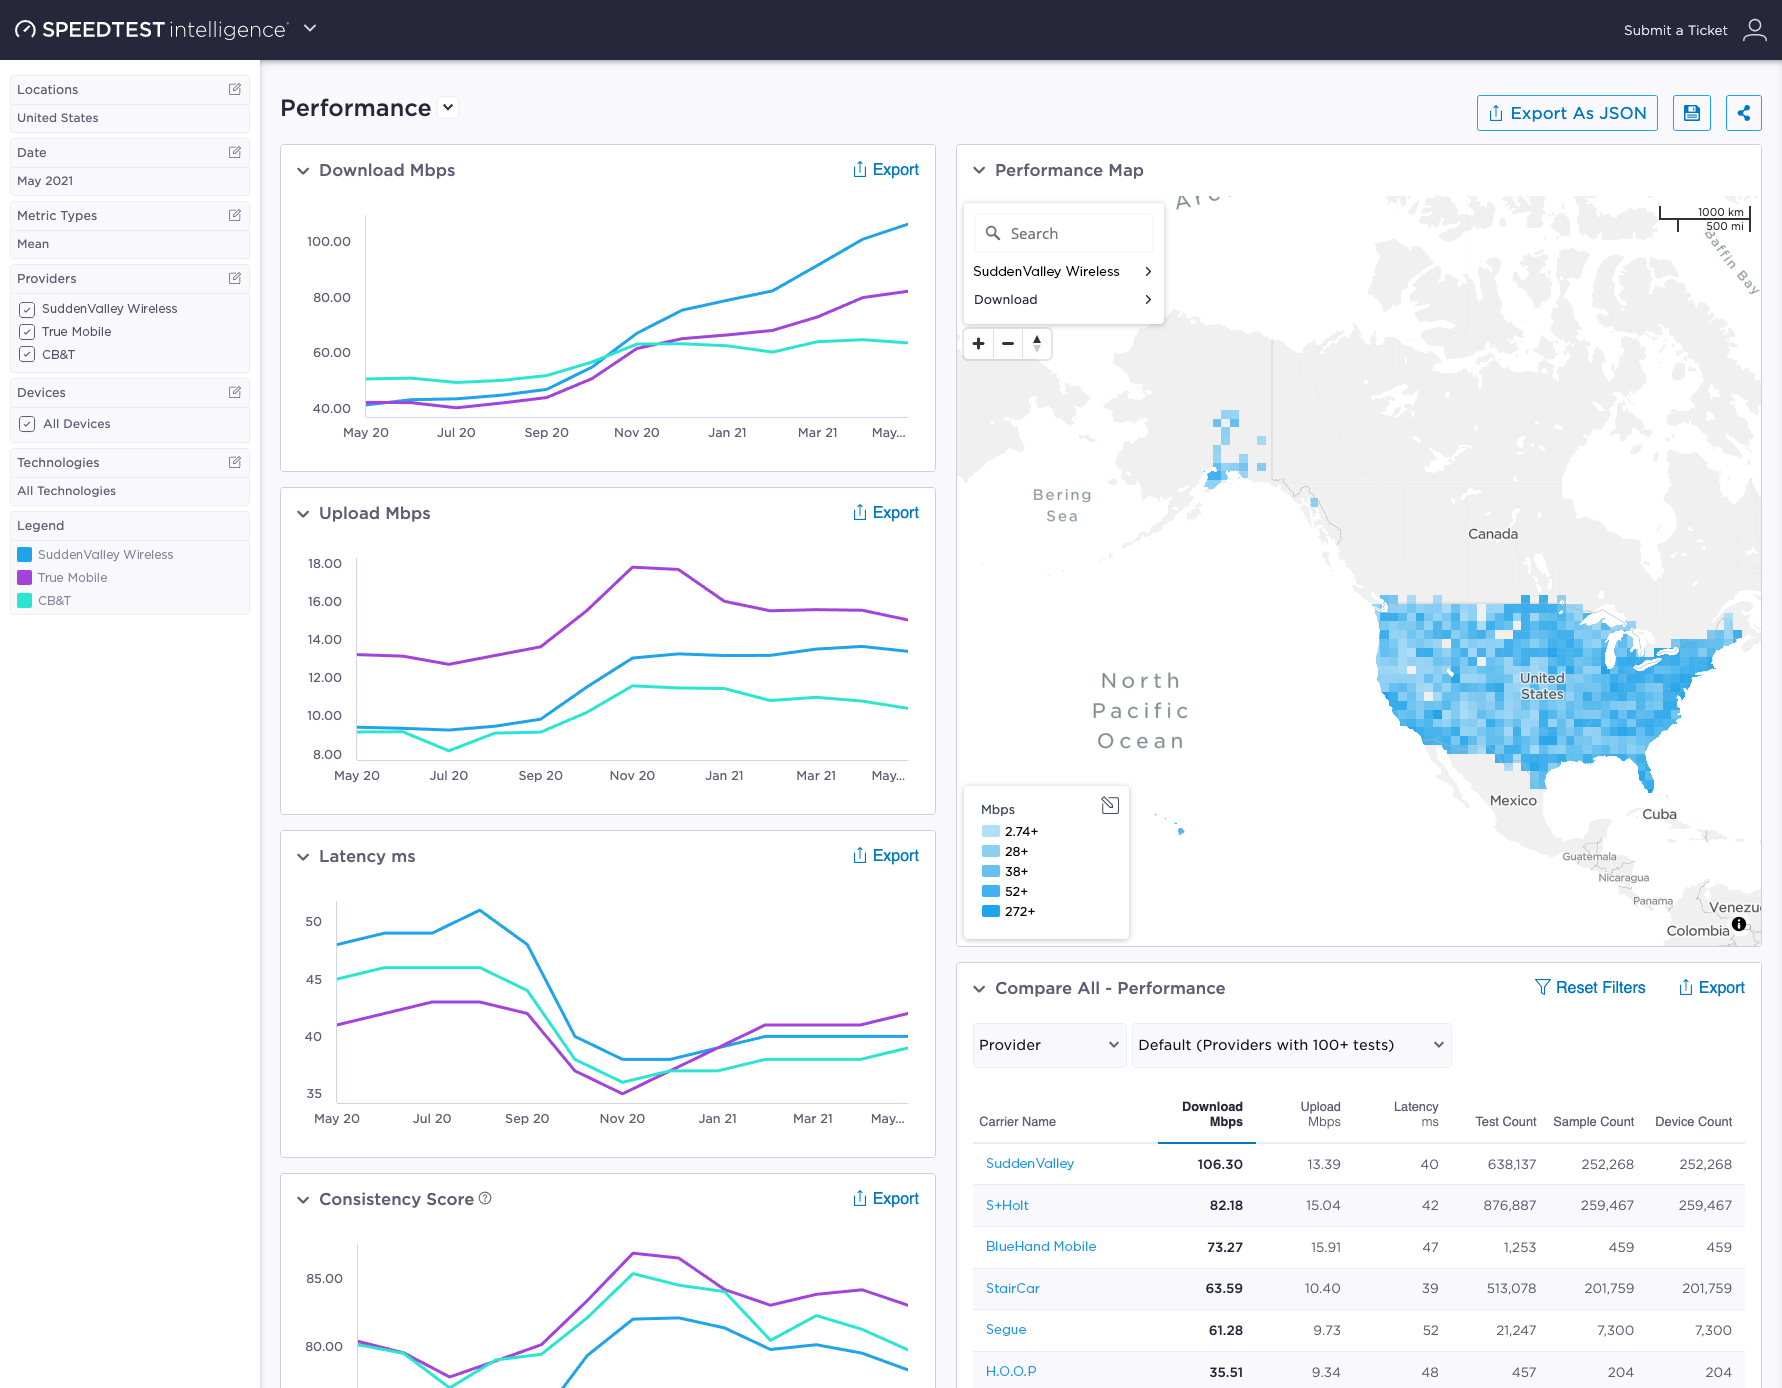
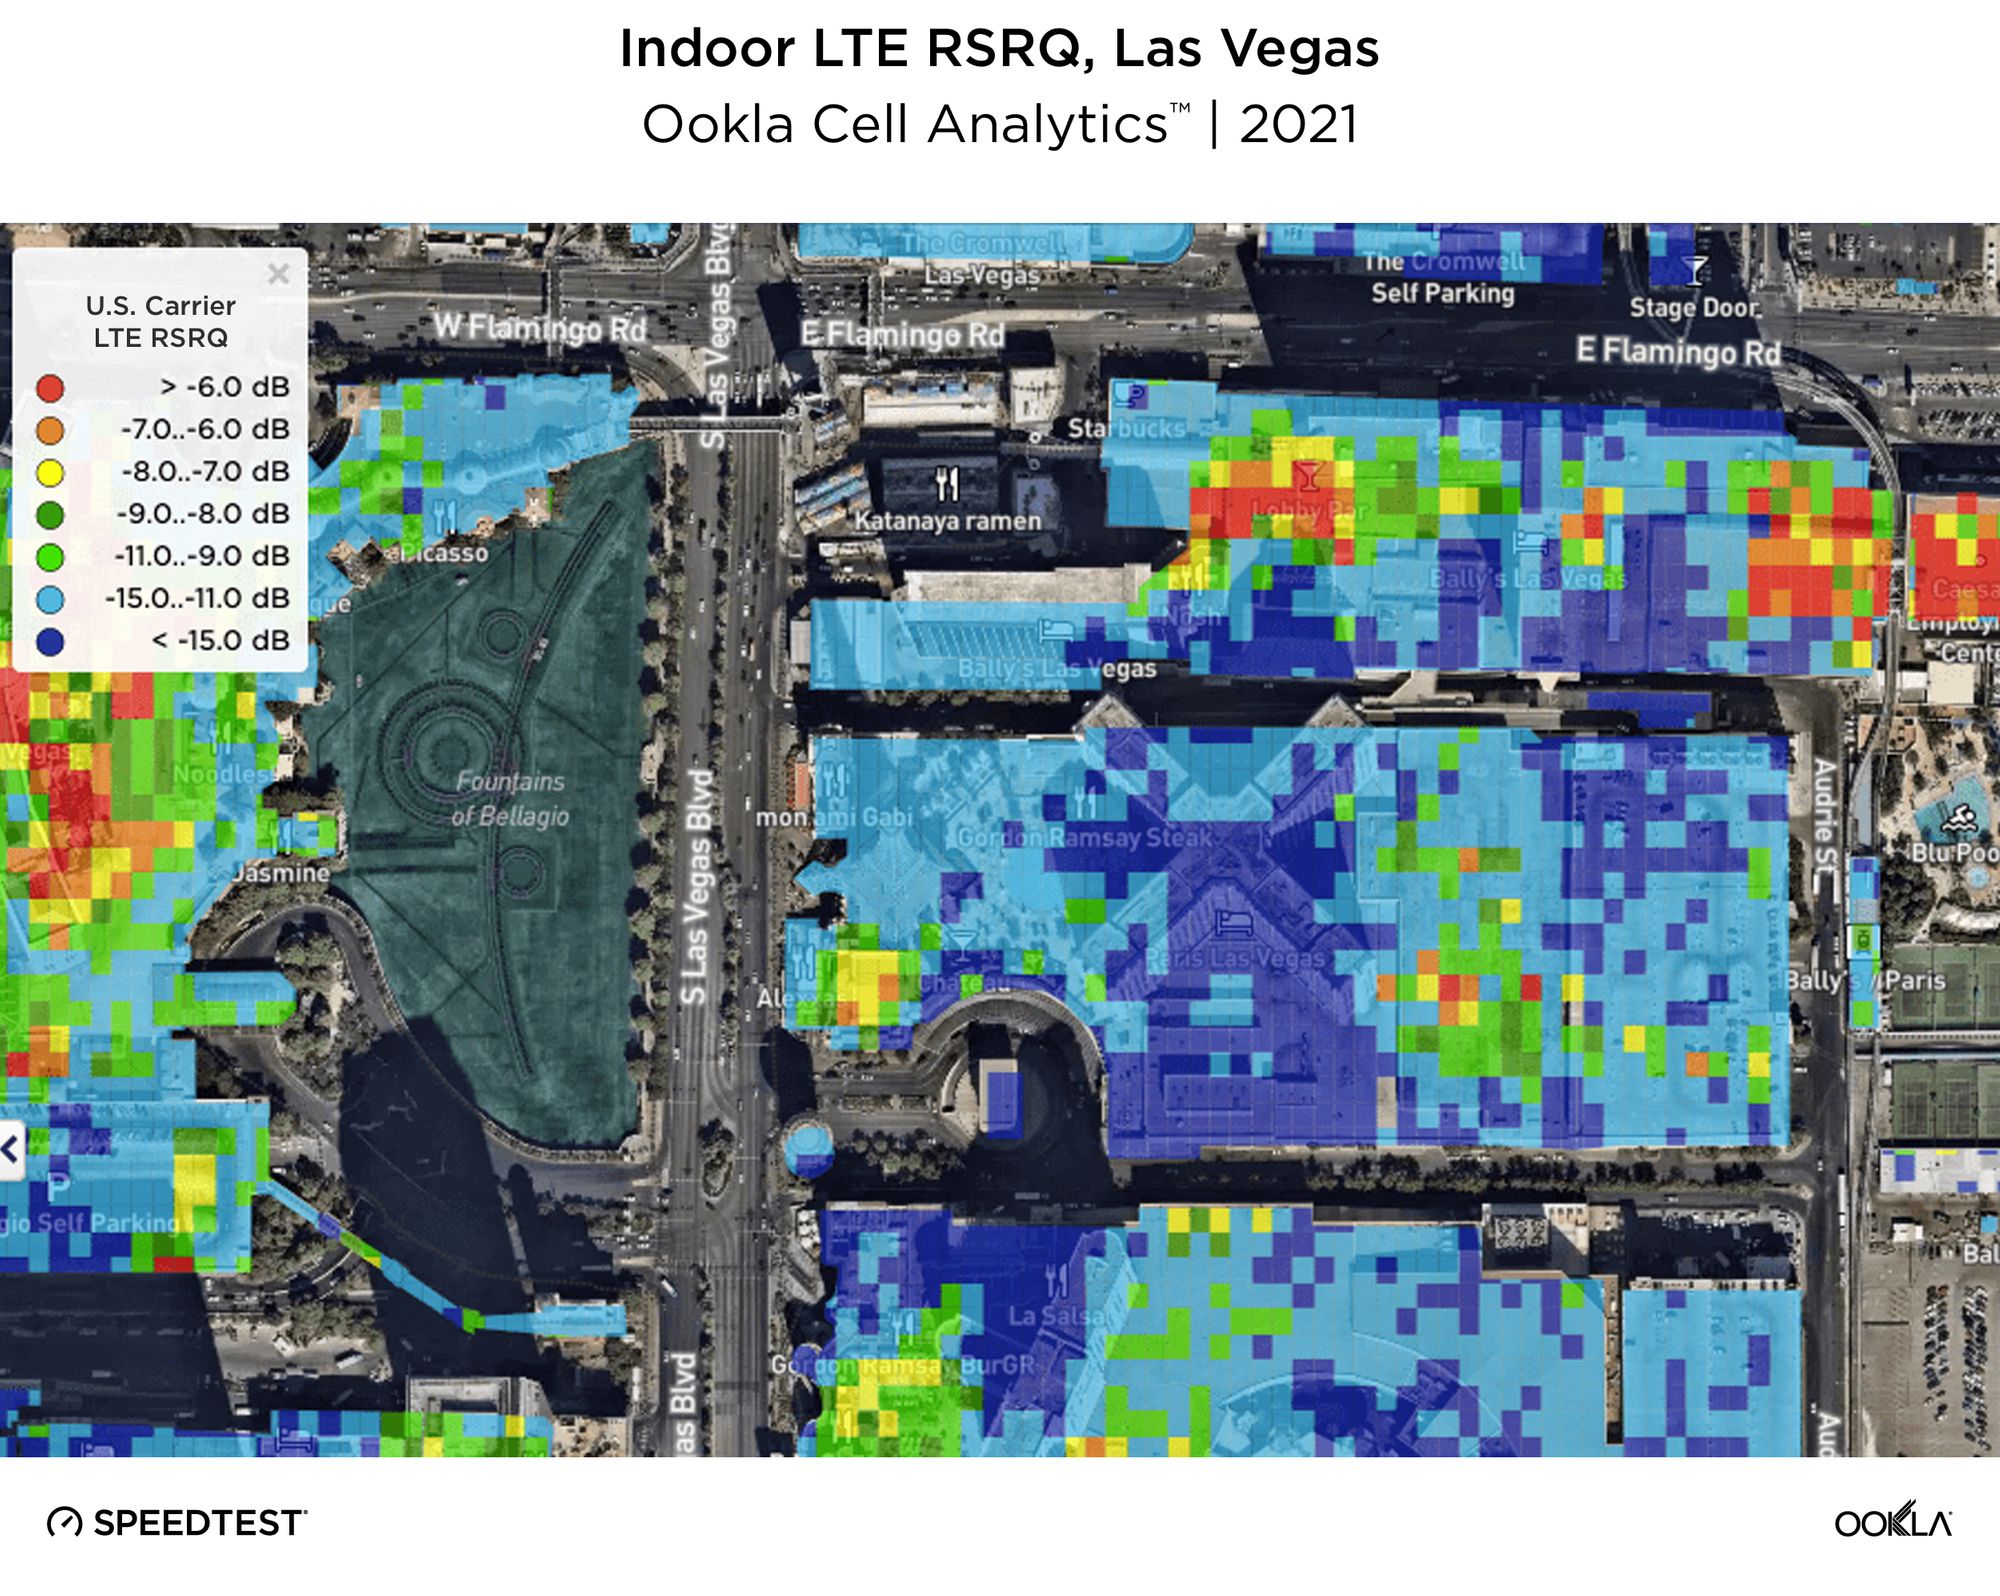
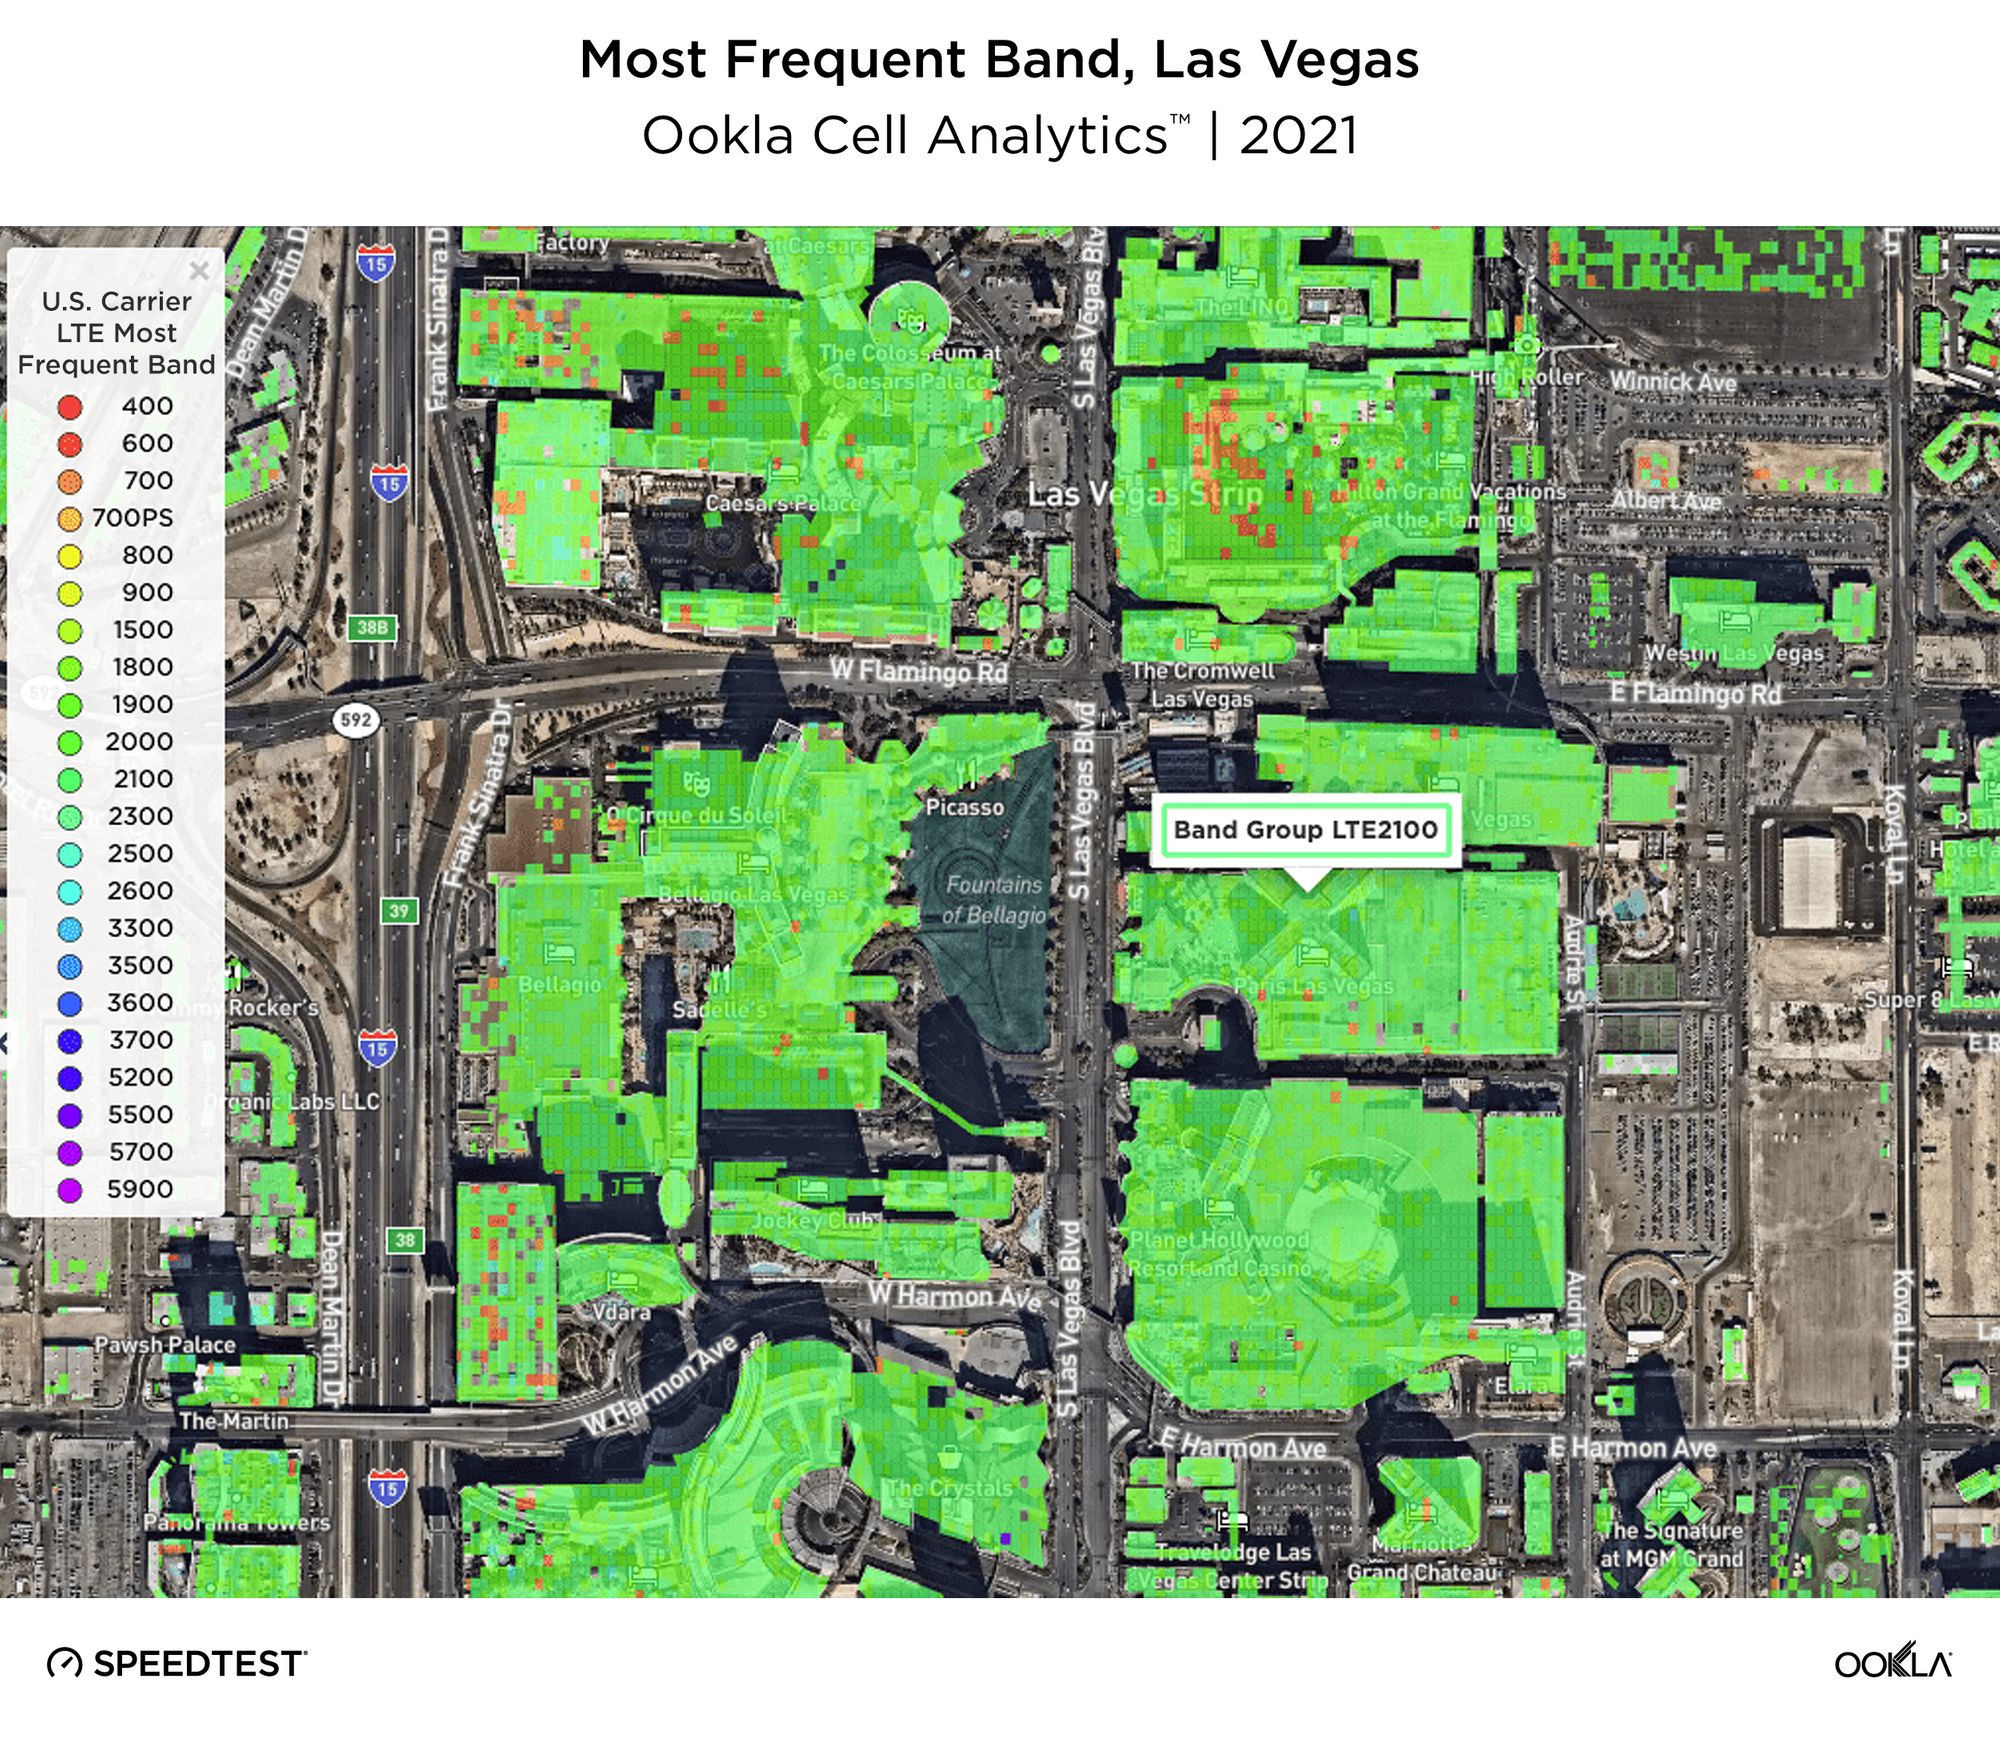
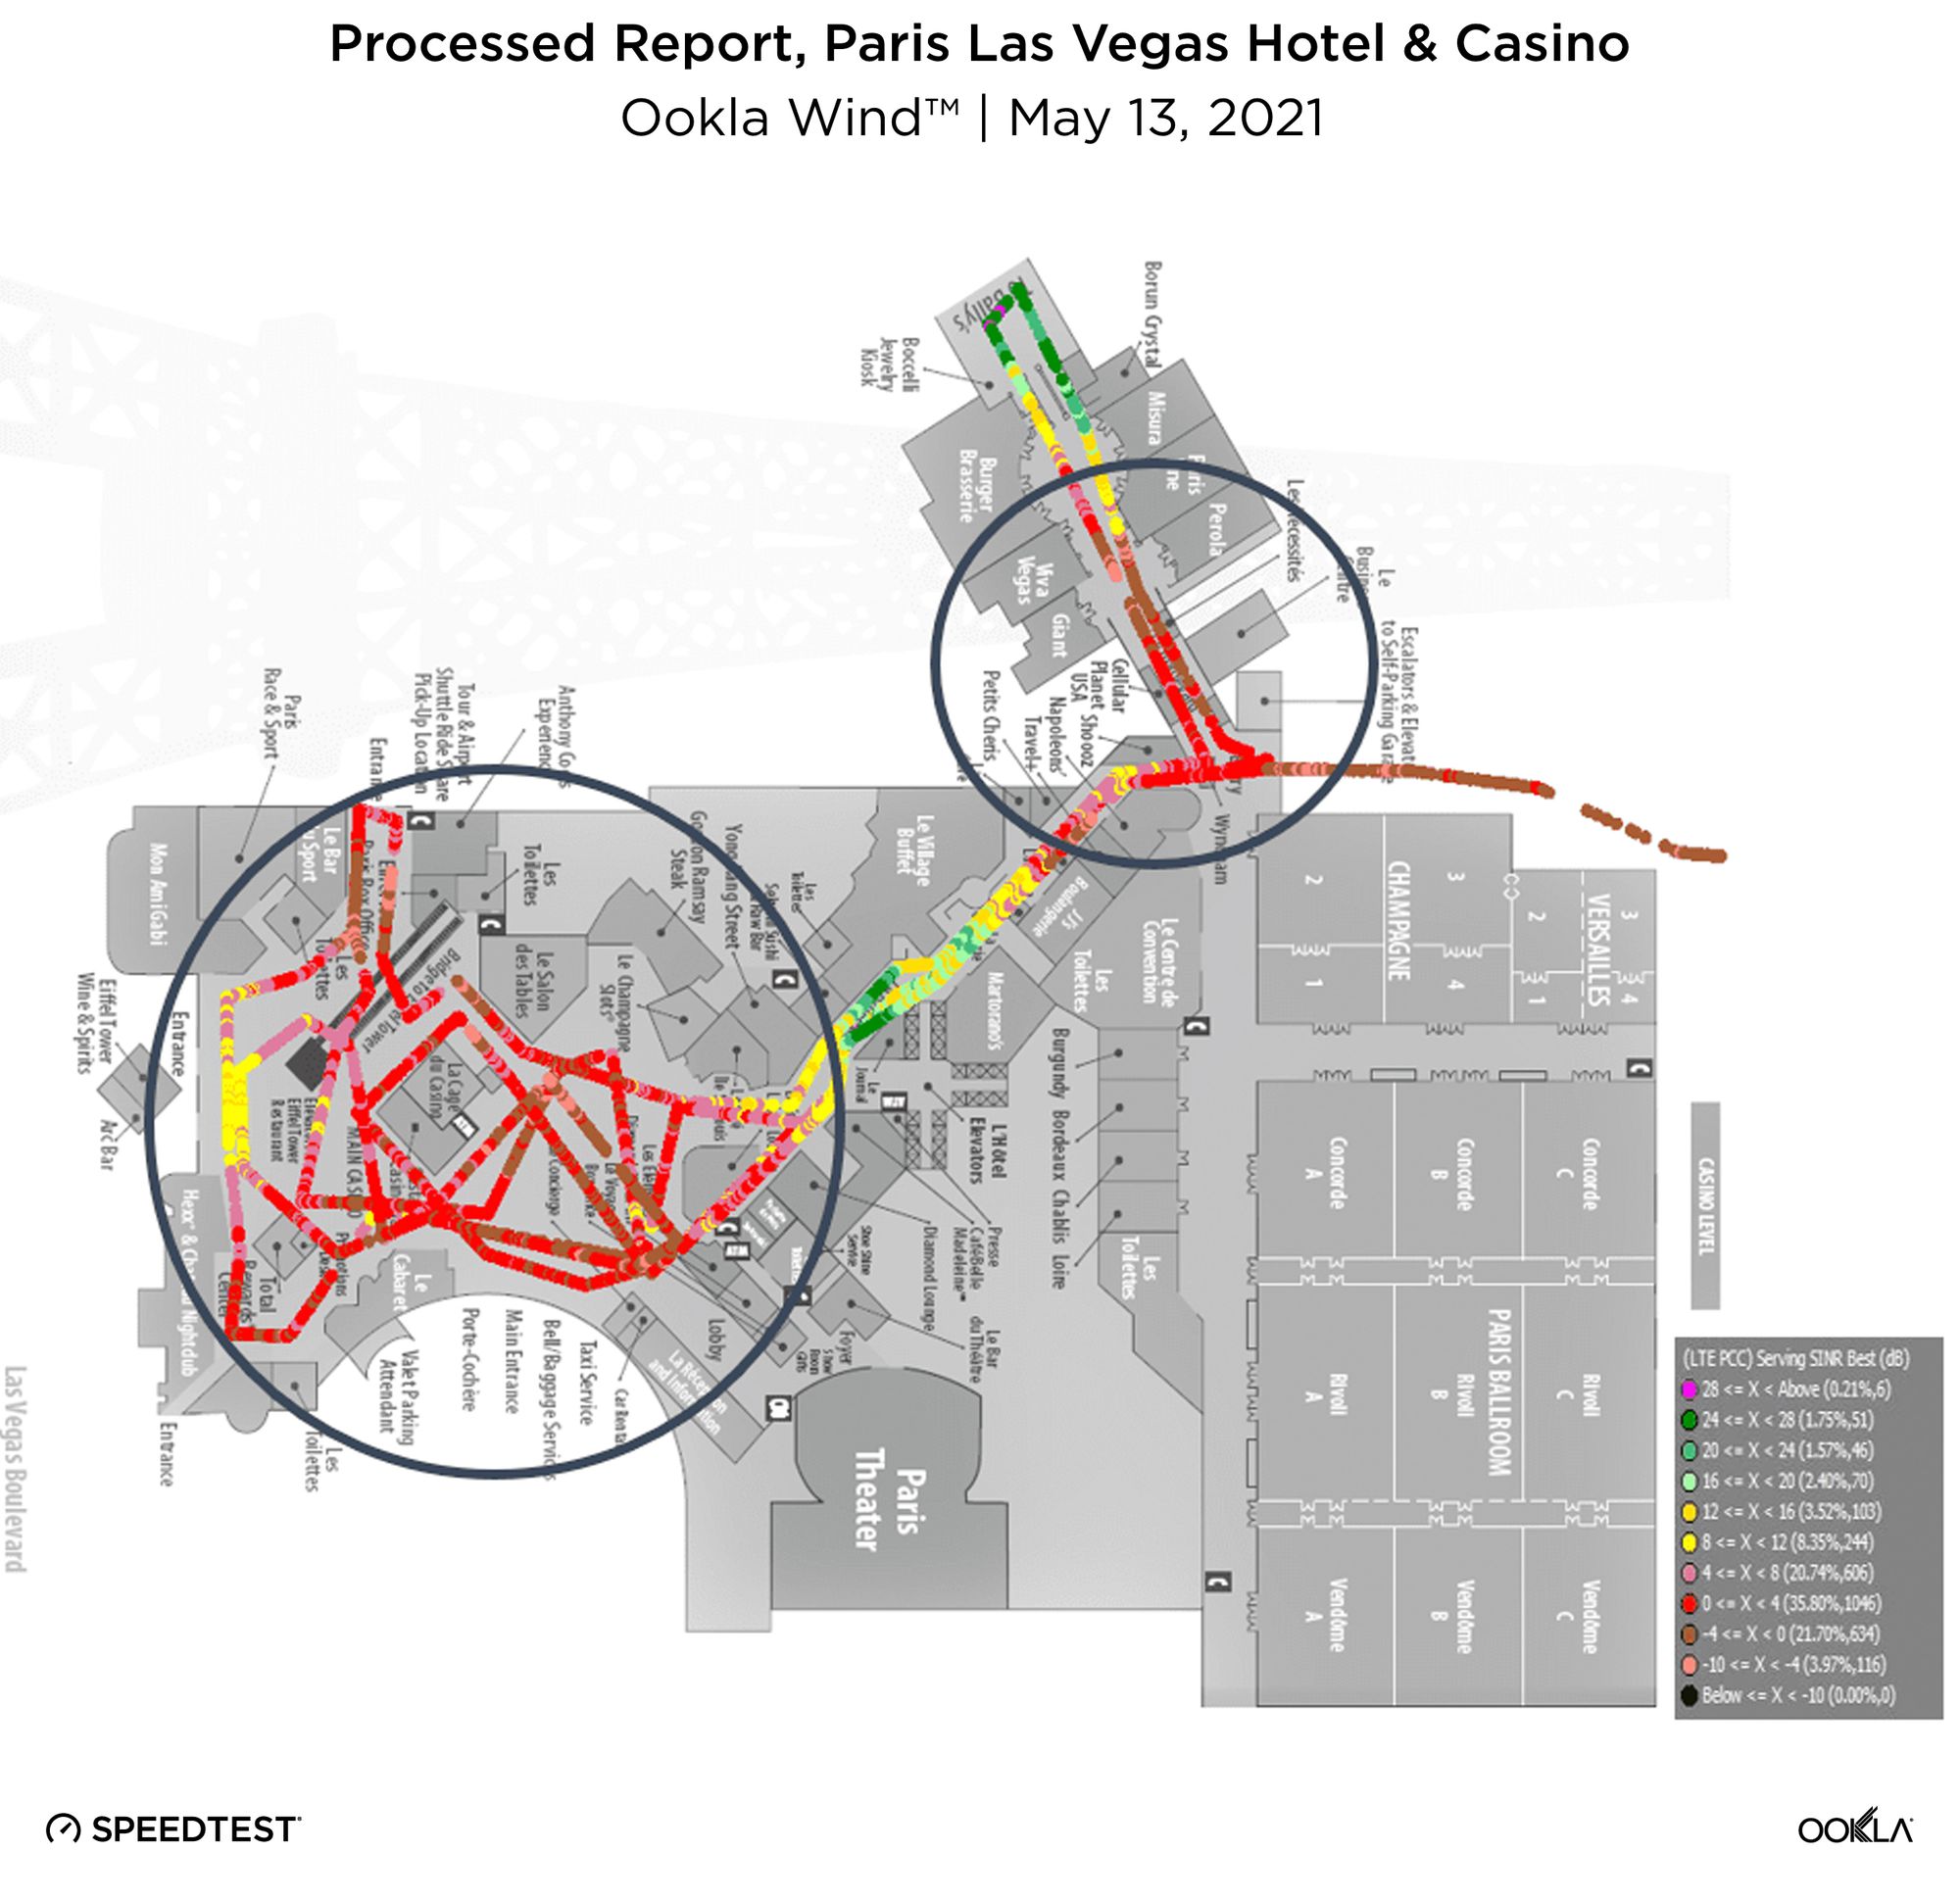
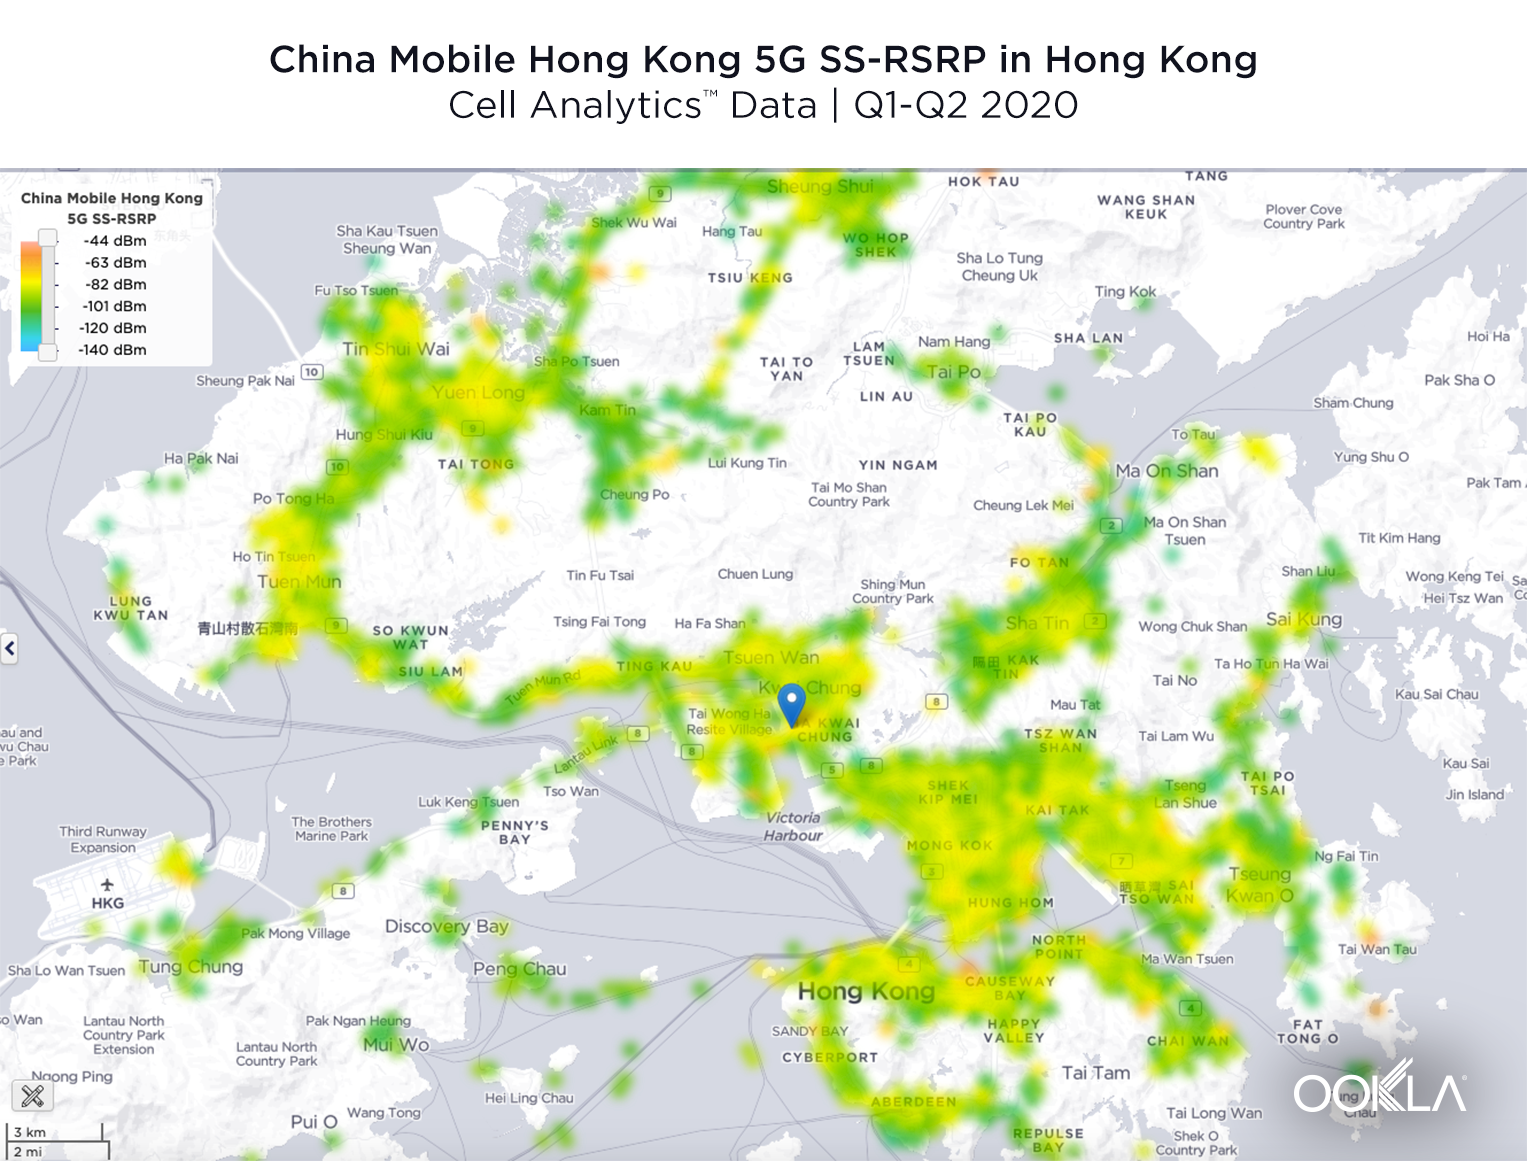
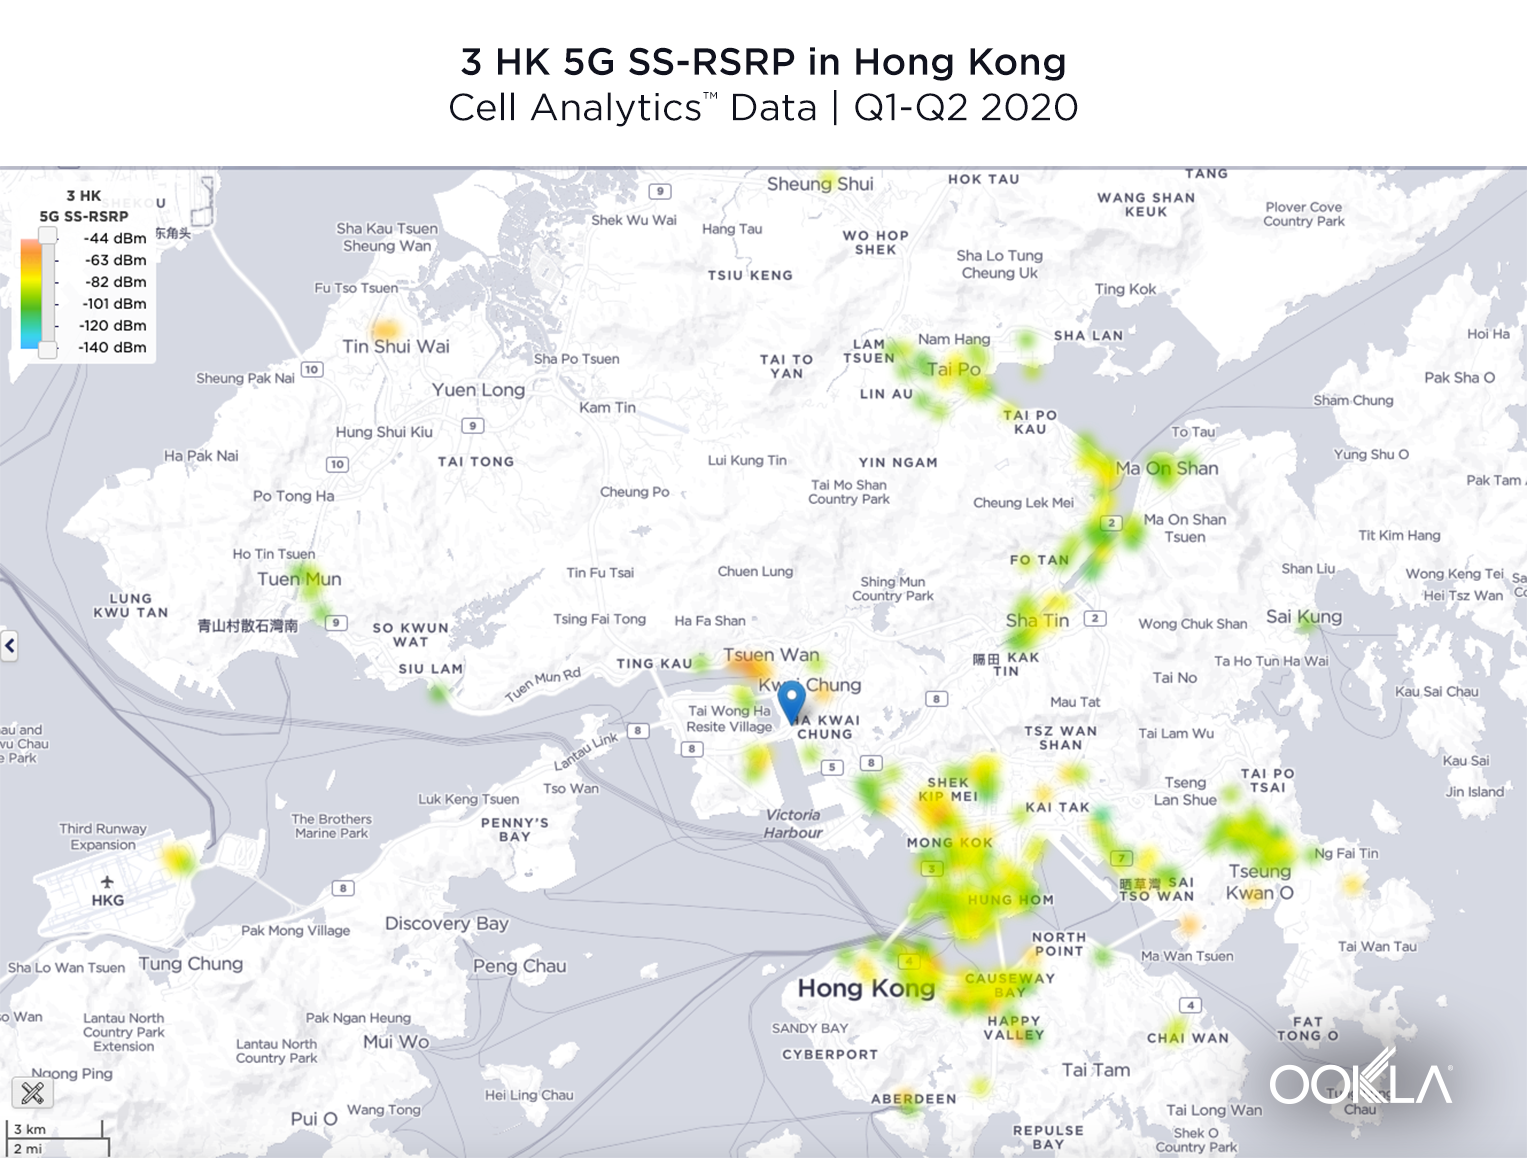
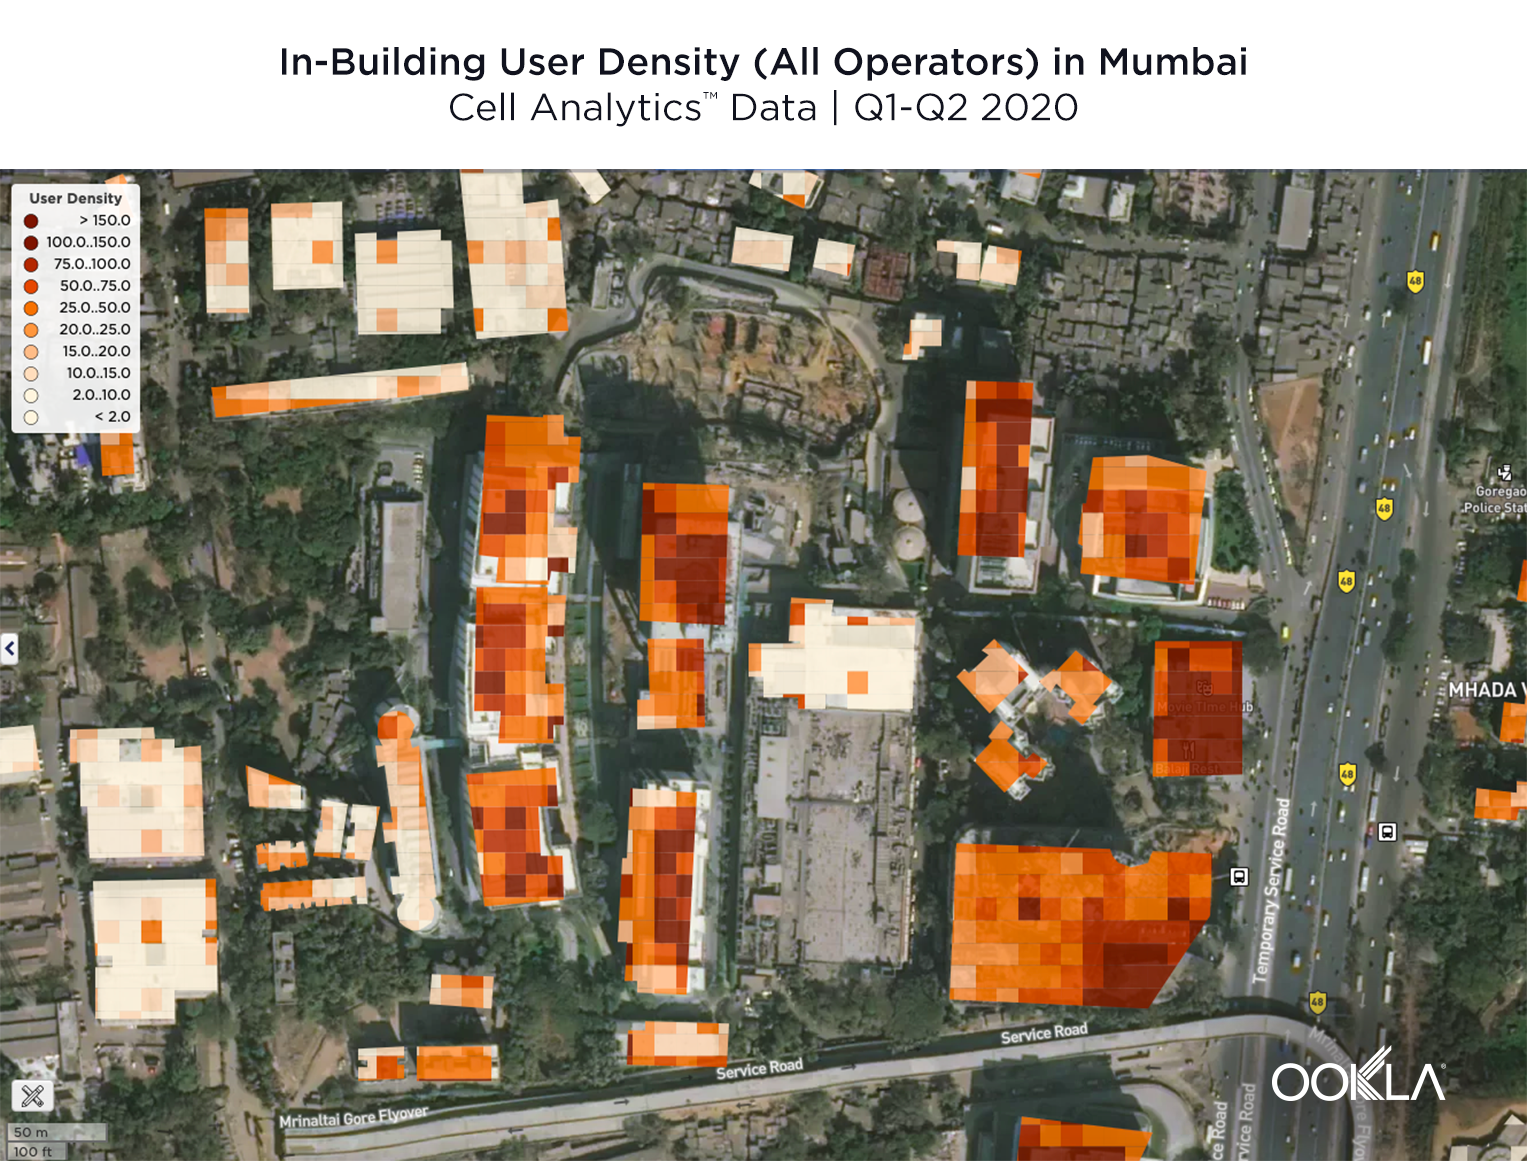
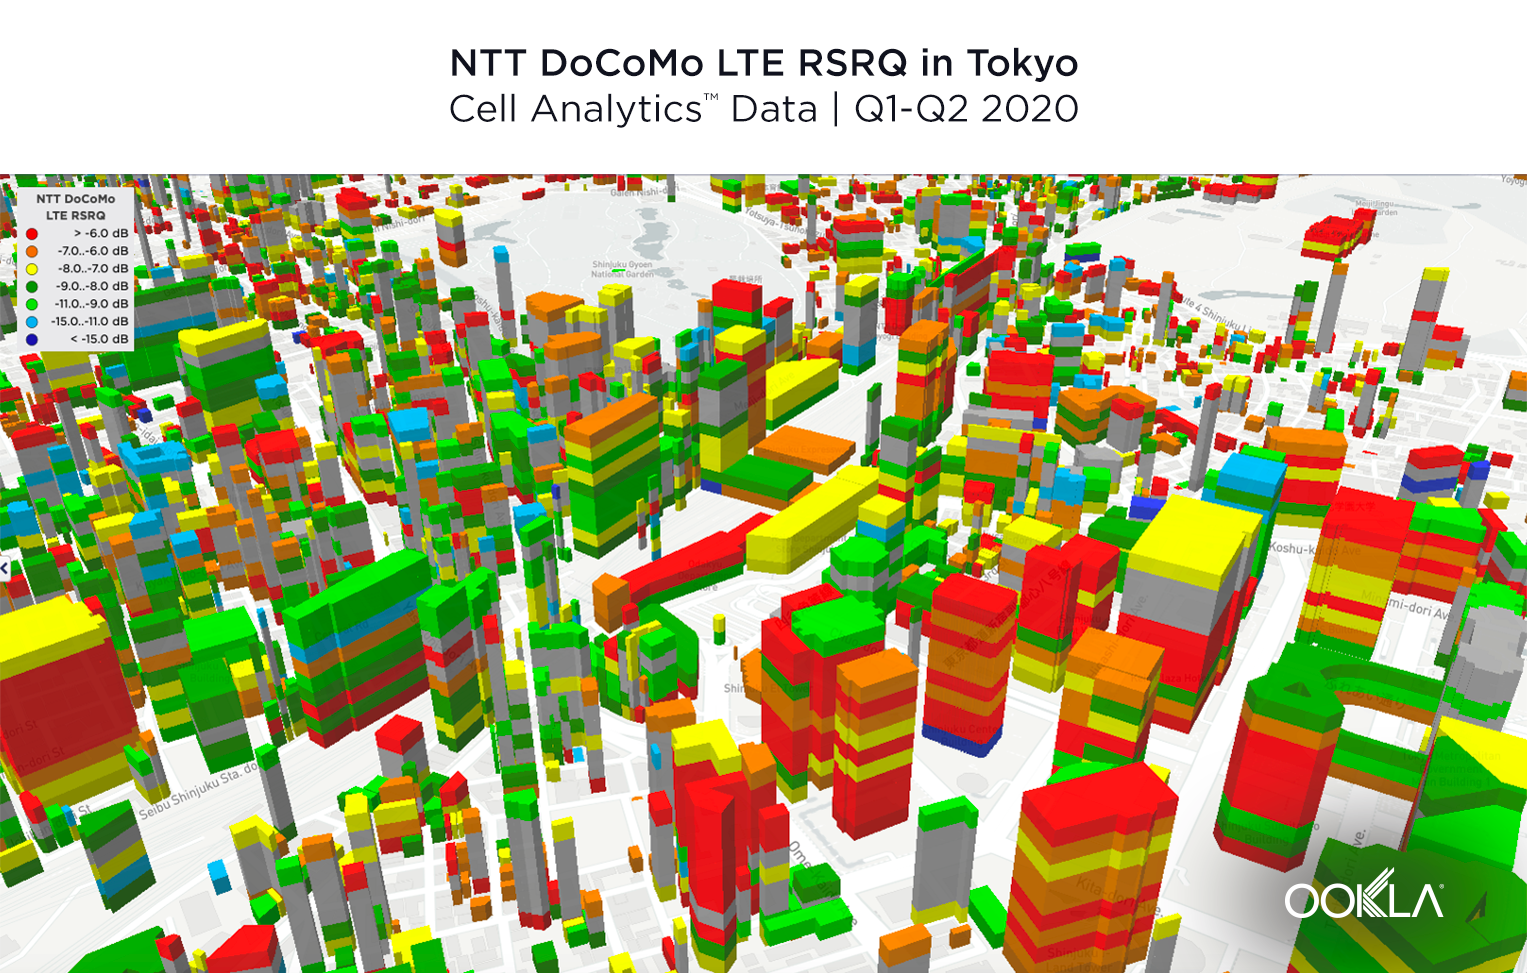
Ookla Cell Analytics has proven to be an invaluable tool for public safety organizations and wireless infrastructure providers looking to improve connectivity. By leveraging crowdsourced data, Cell Analytics provides accurate and unbiased insights on wireless network performance and coverage, enabling data-driven decision-making. The platform is powered by billions of daily network samples from Speedtest® users, offering information on:
- Service quality and performance
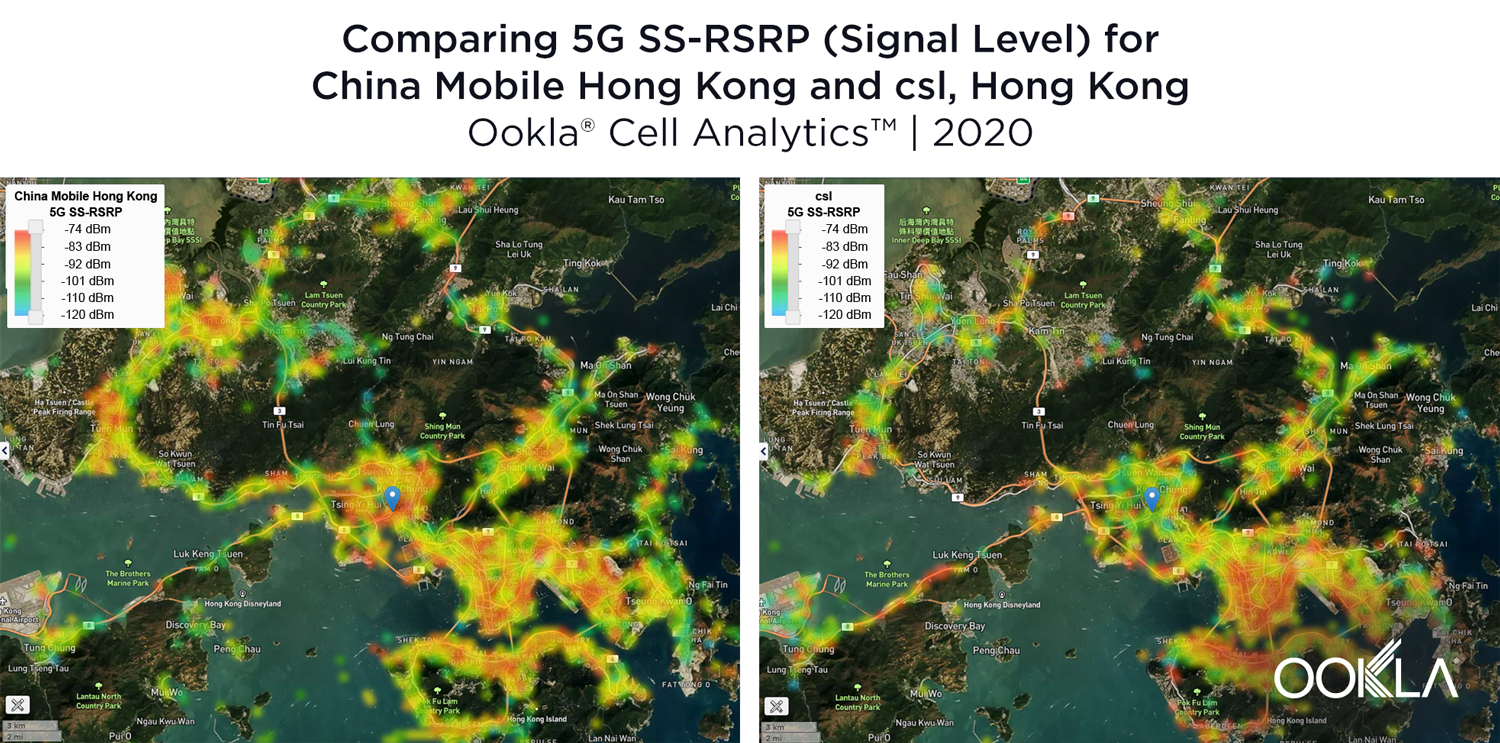
- RF conditions
- Data usage
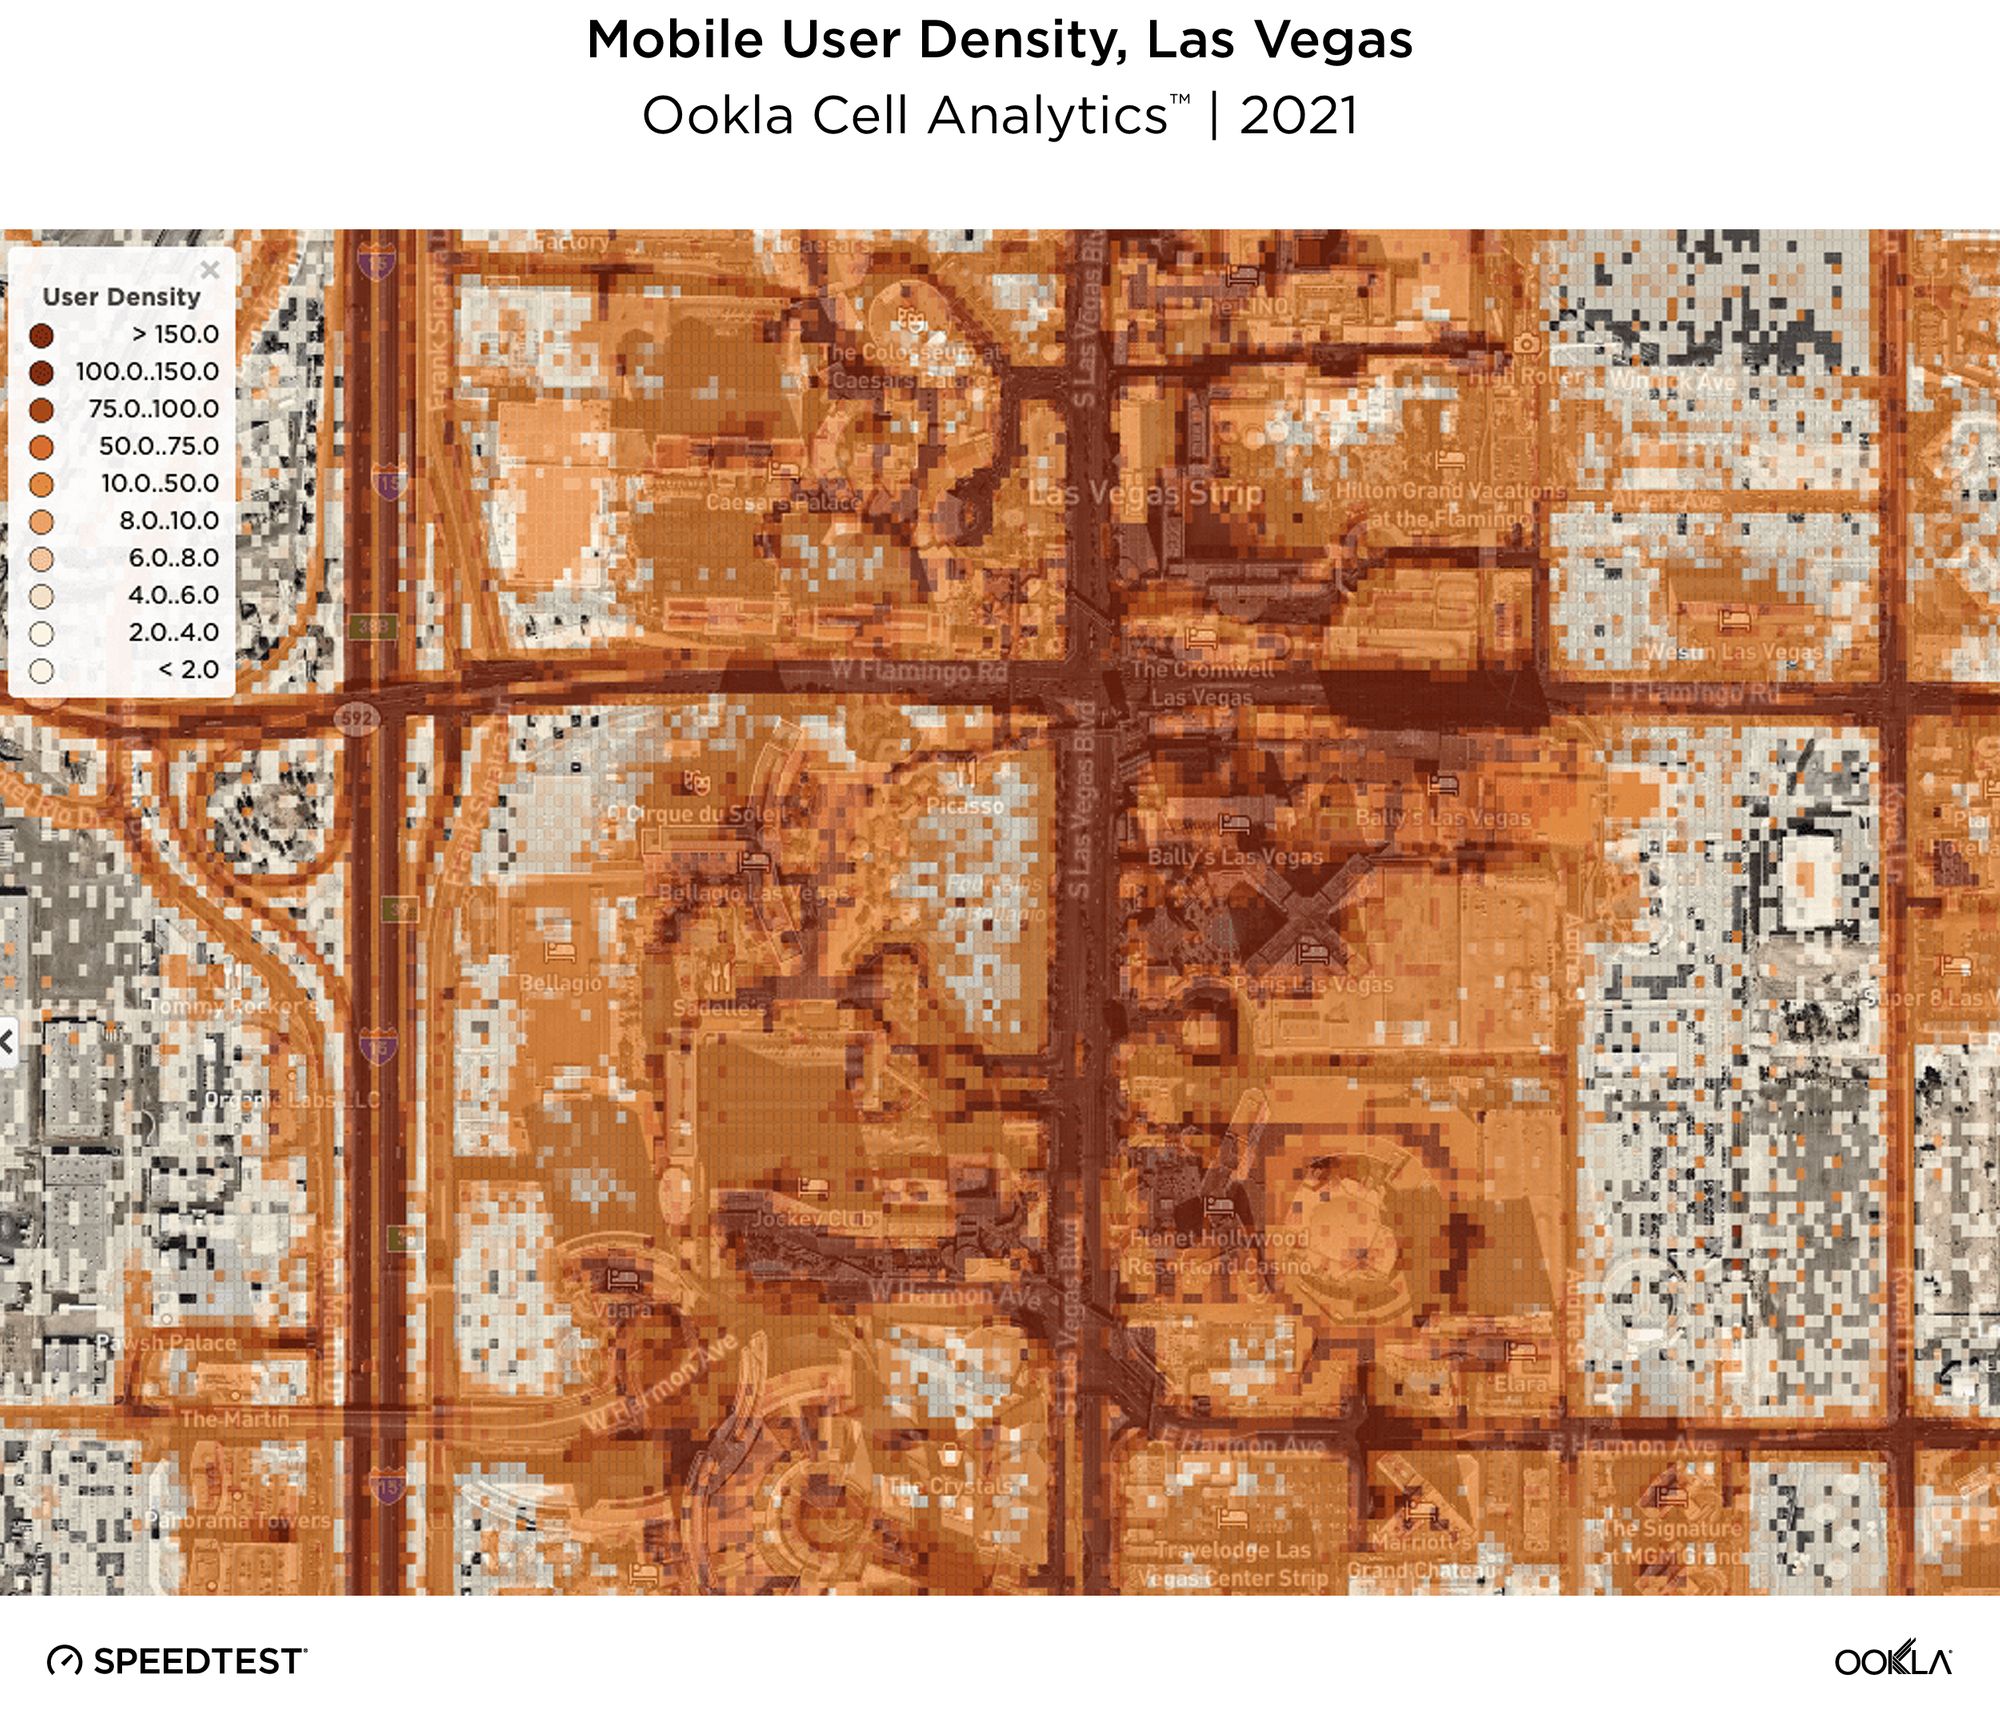
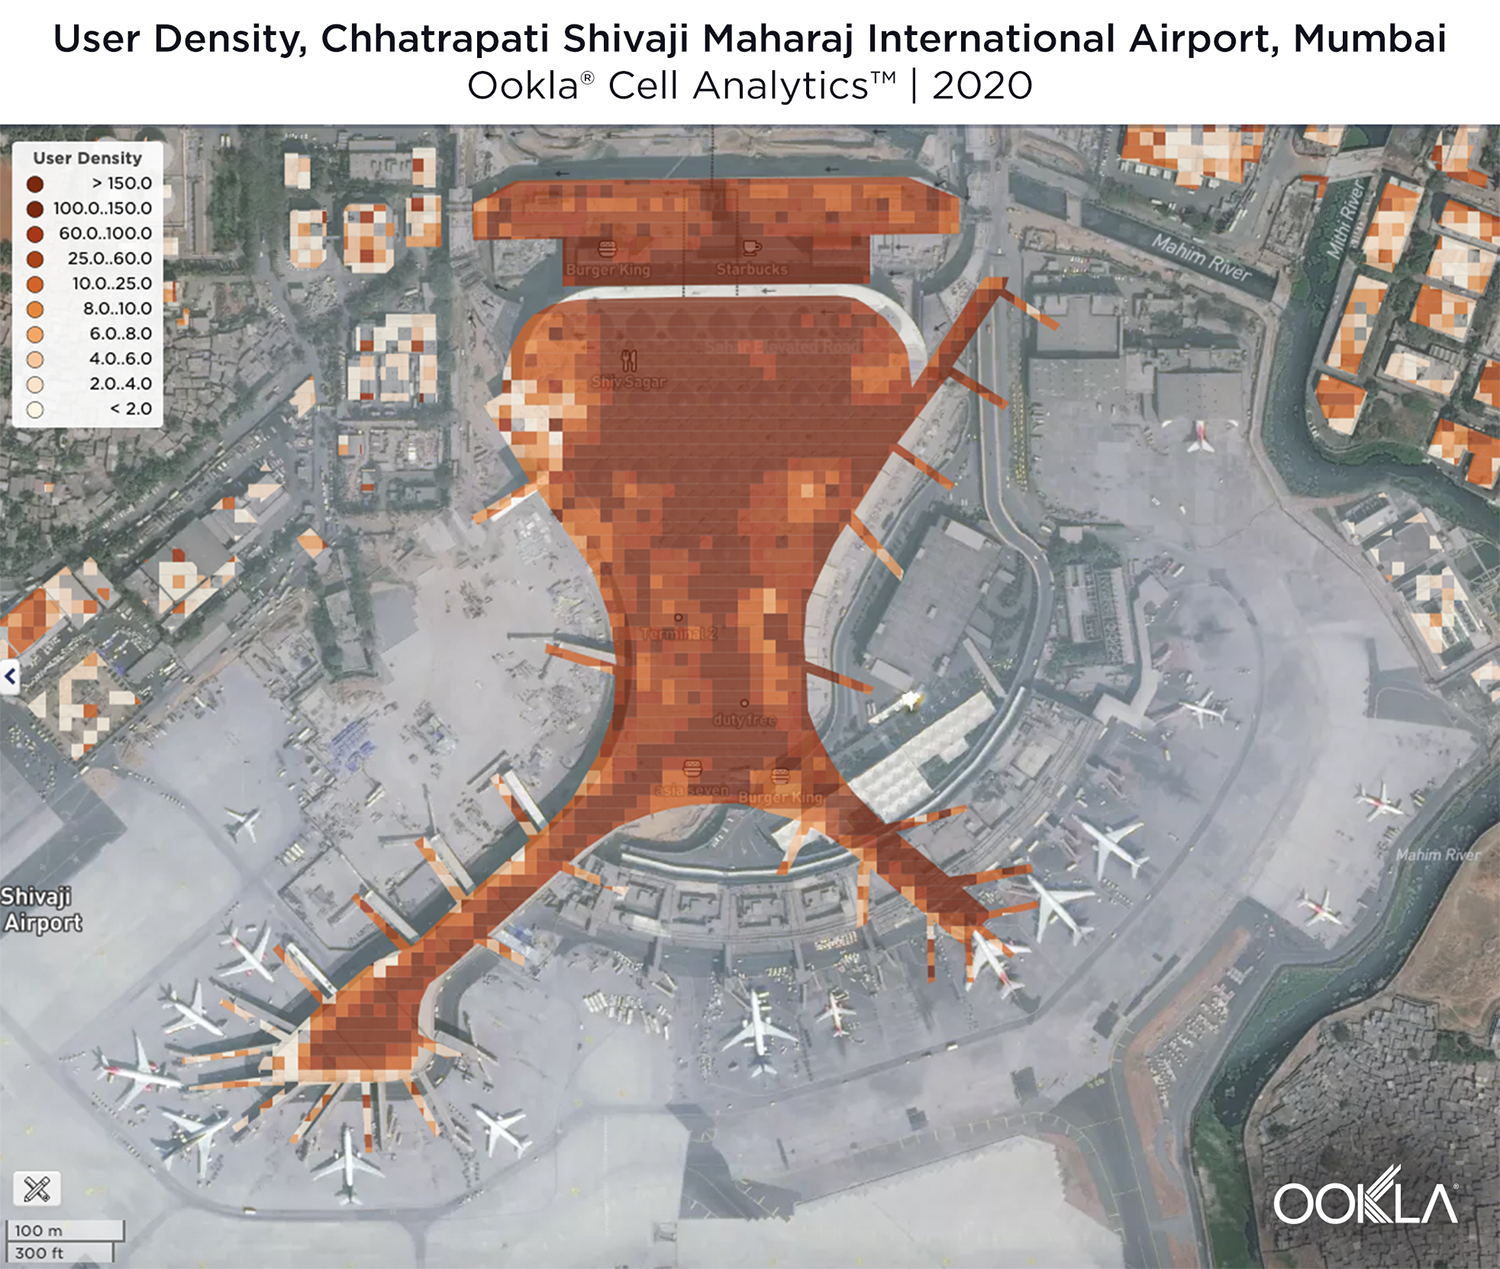
- User density
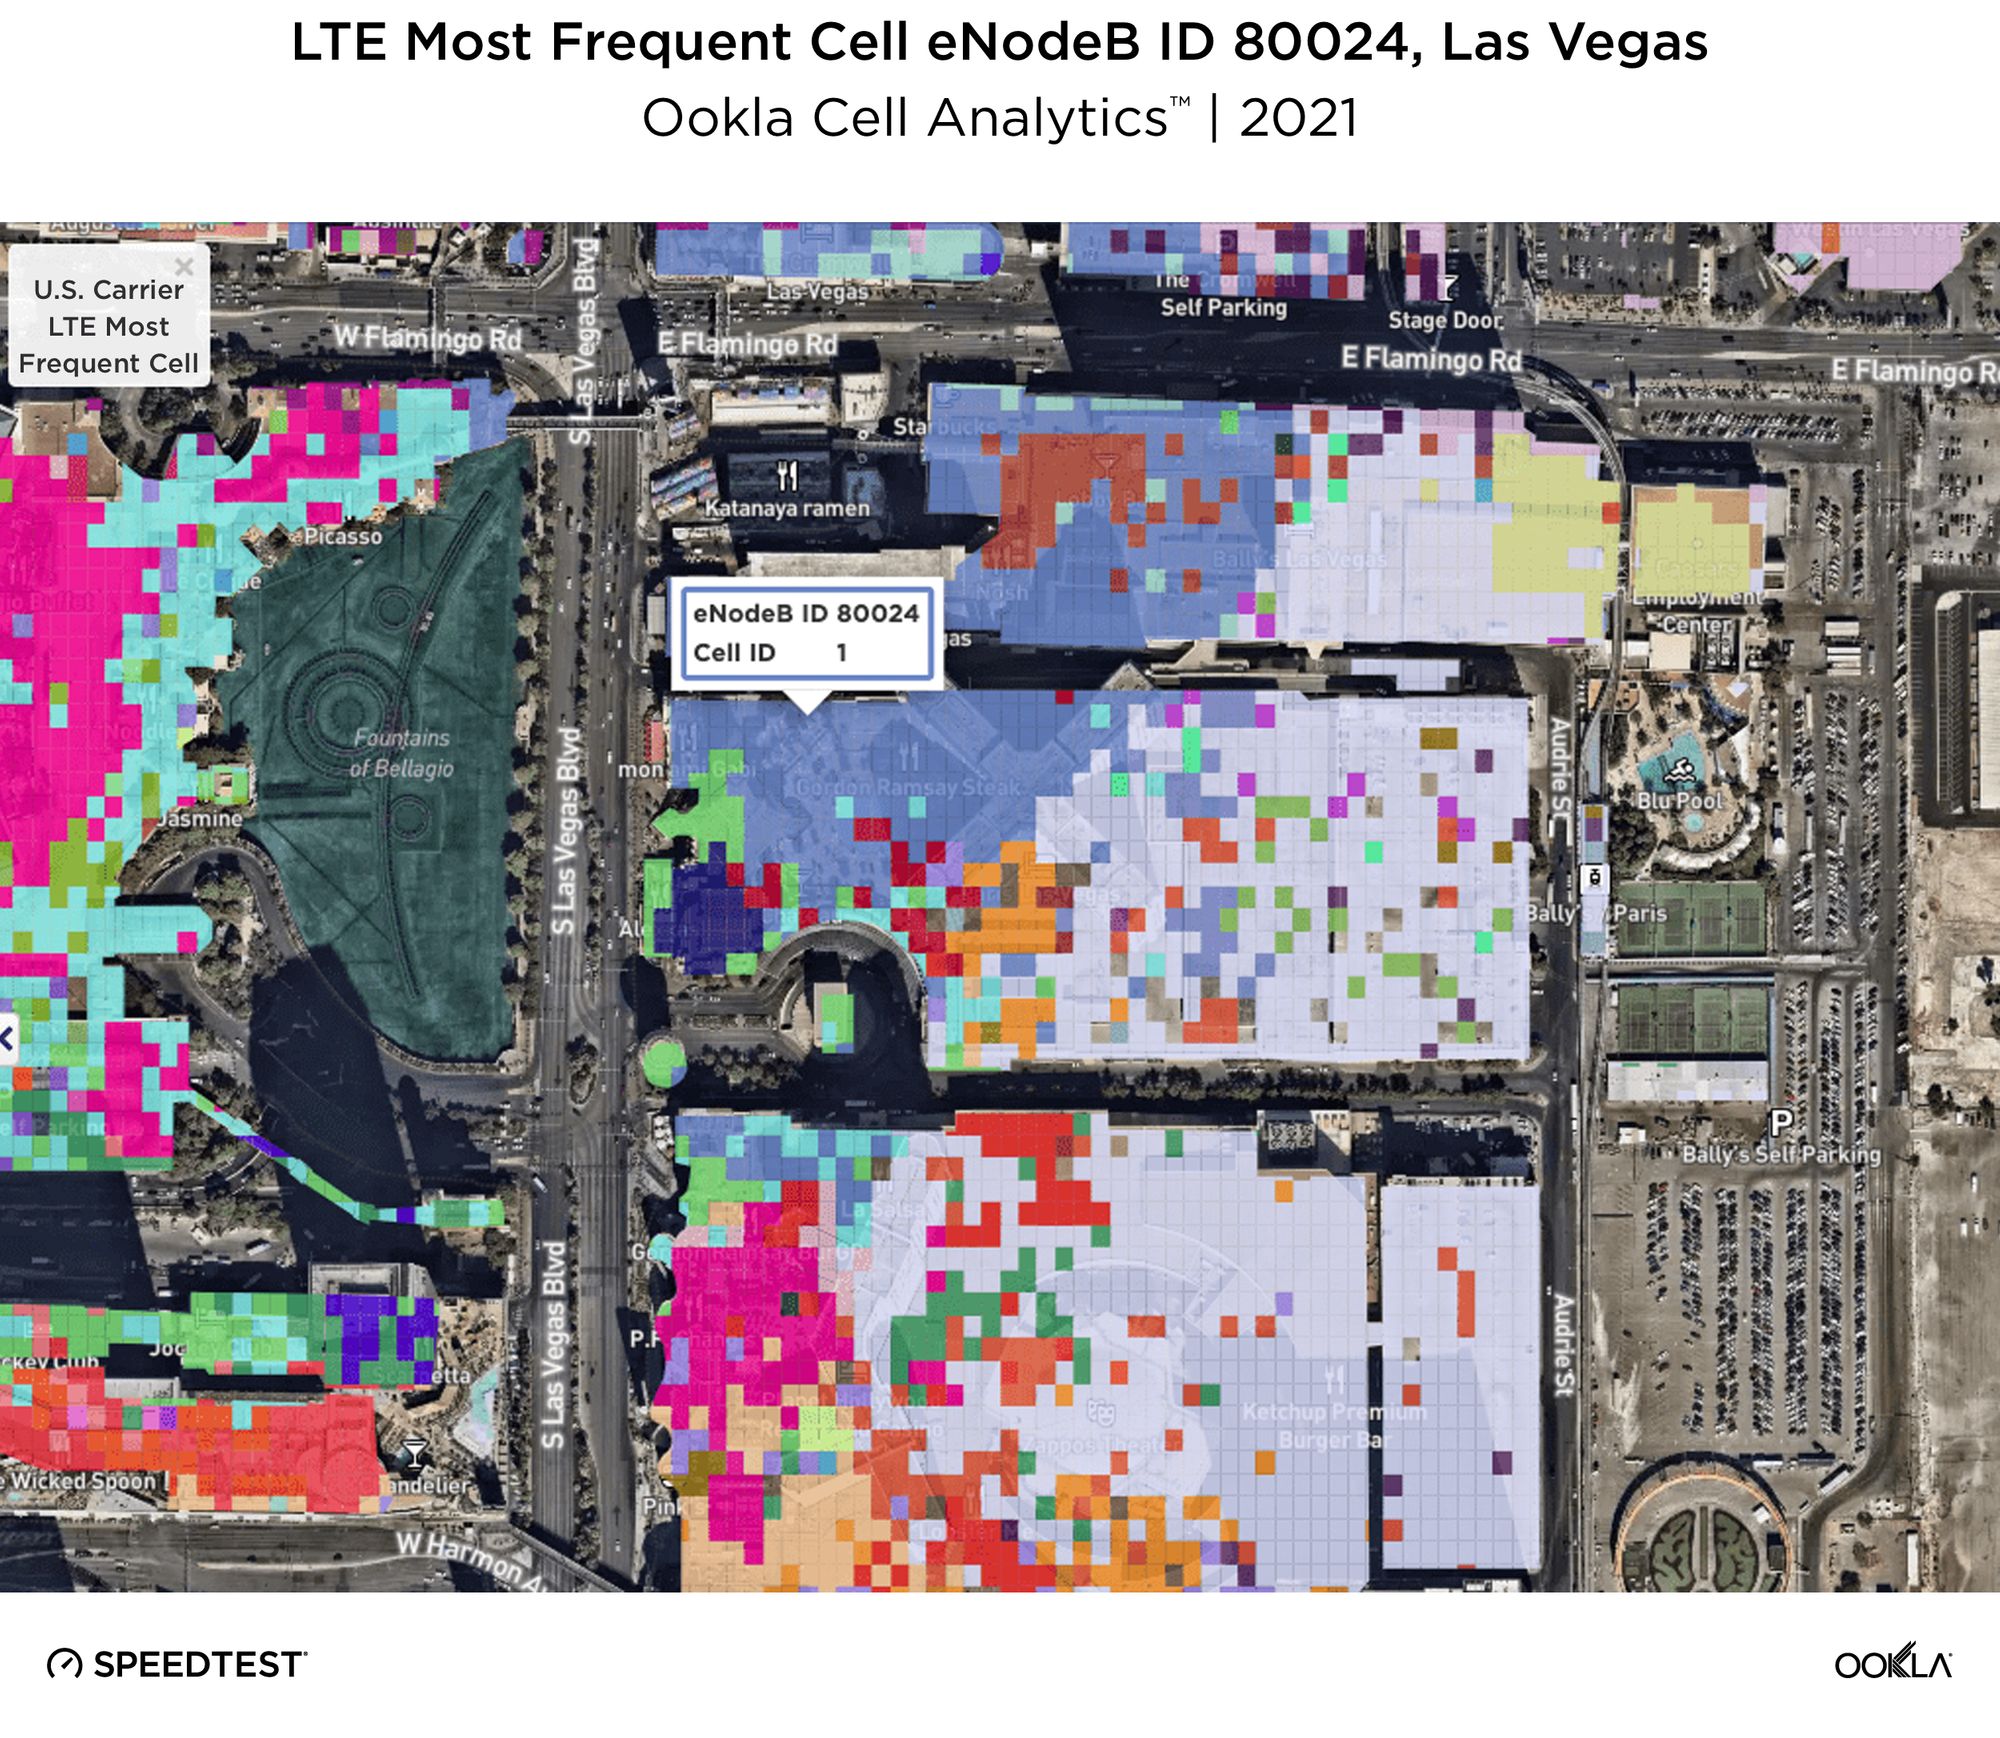
- Cell site locations
- And more!
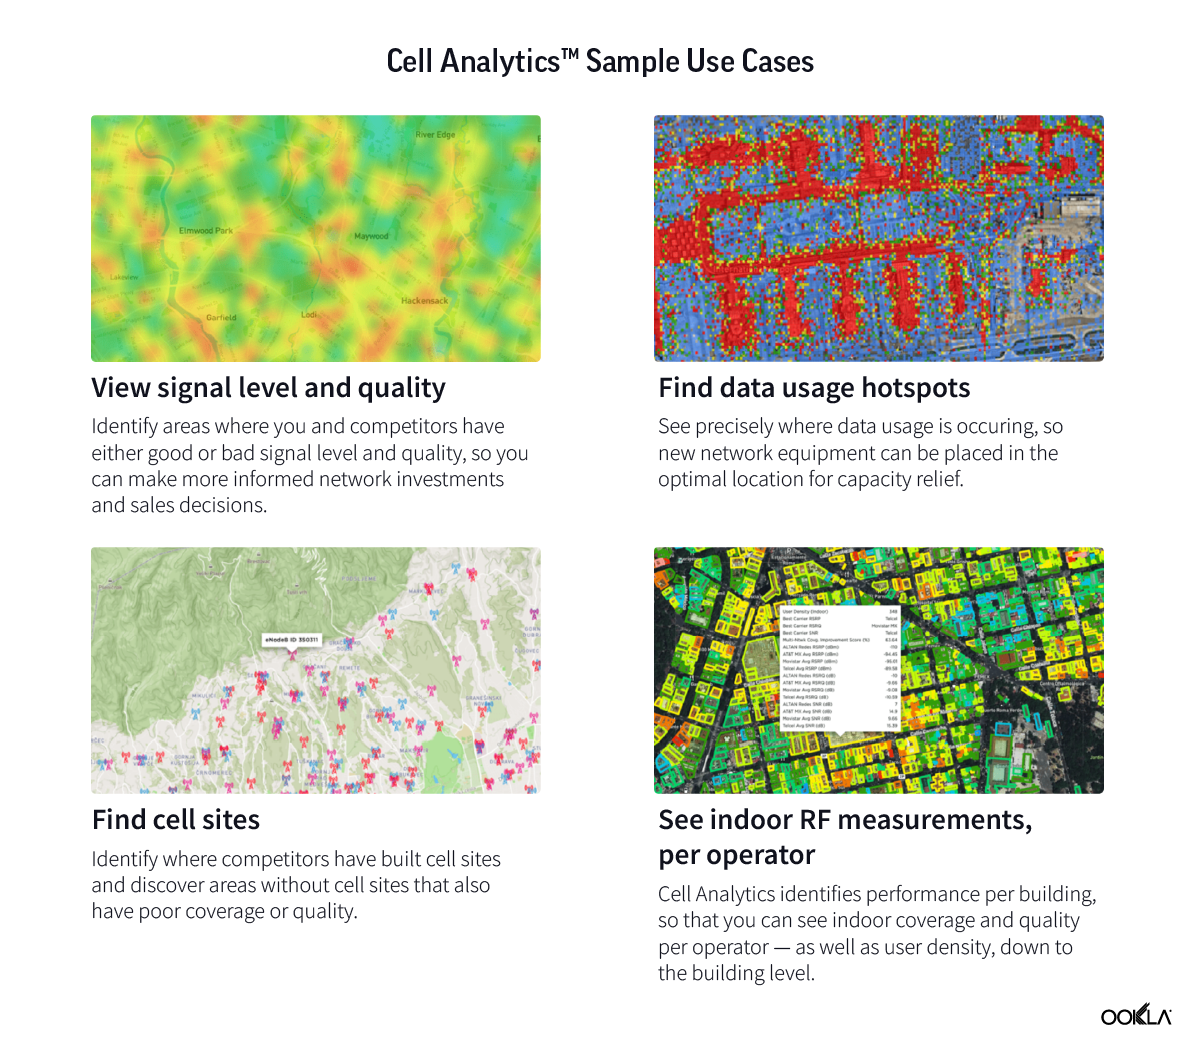
This easy-to-navigate platform enables wireless infrastructure providers to:
- Identify locations for new cell sites and tower colocation
- Find viable sites to lease to operators
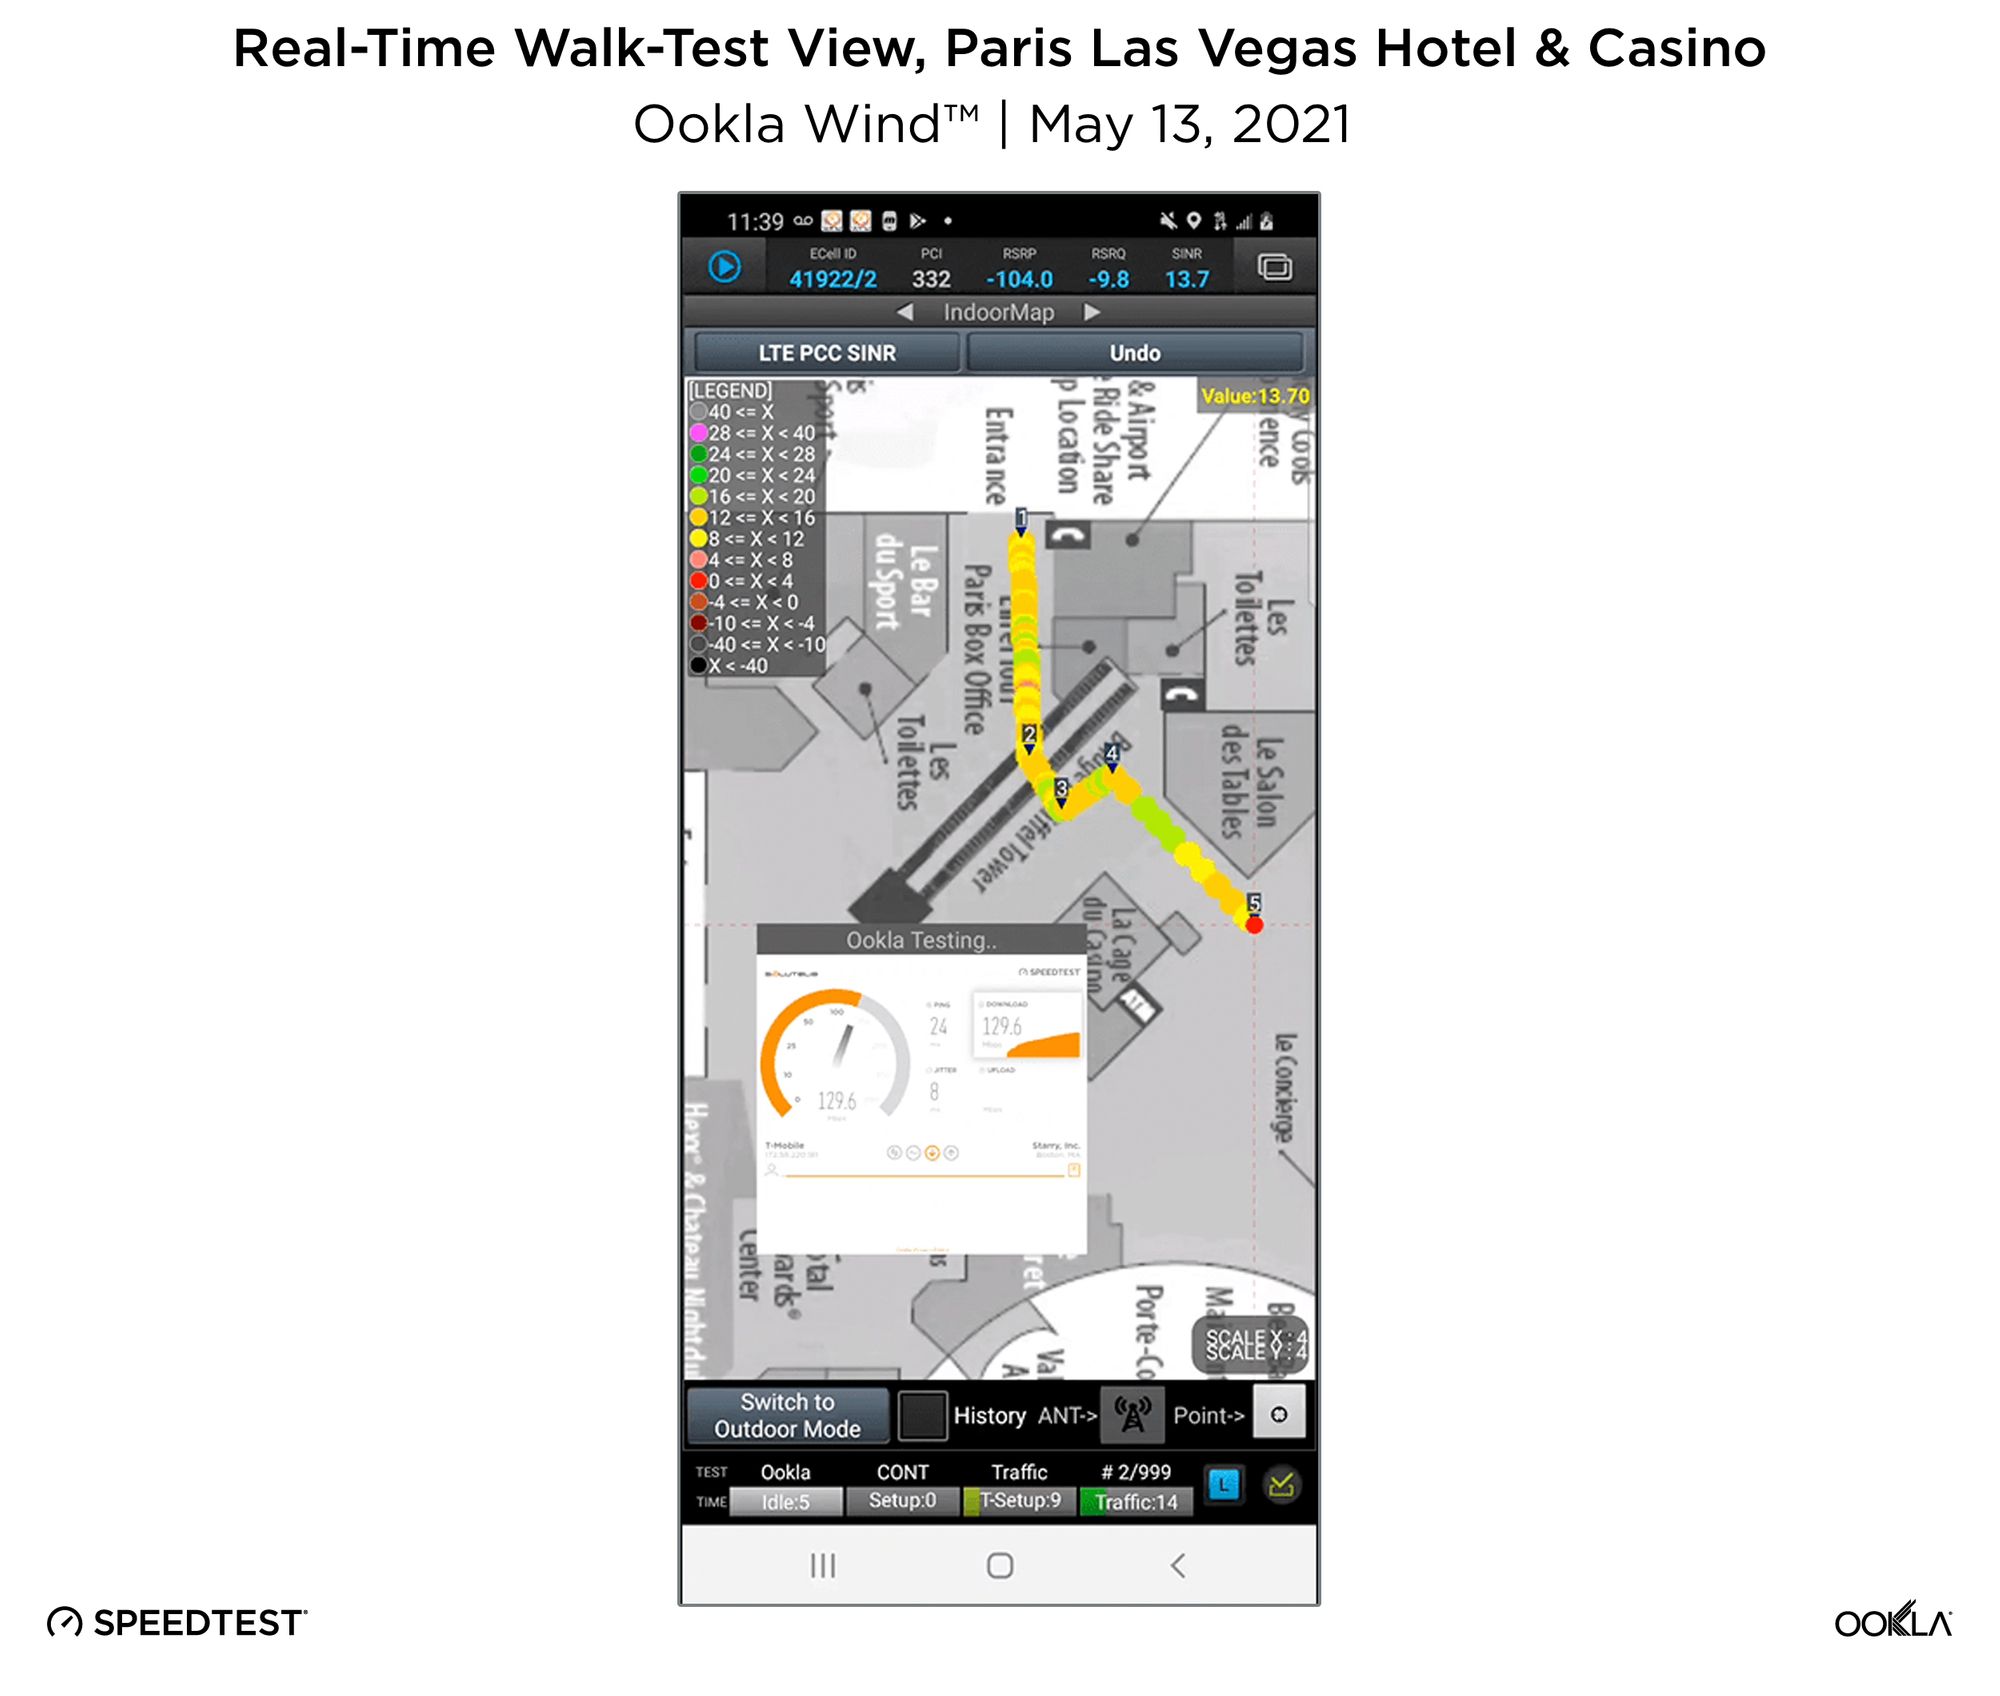
- Monitor RF and performance of networks
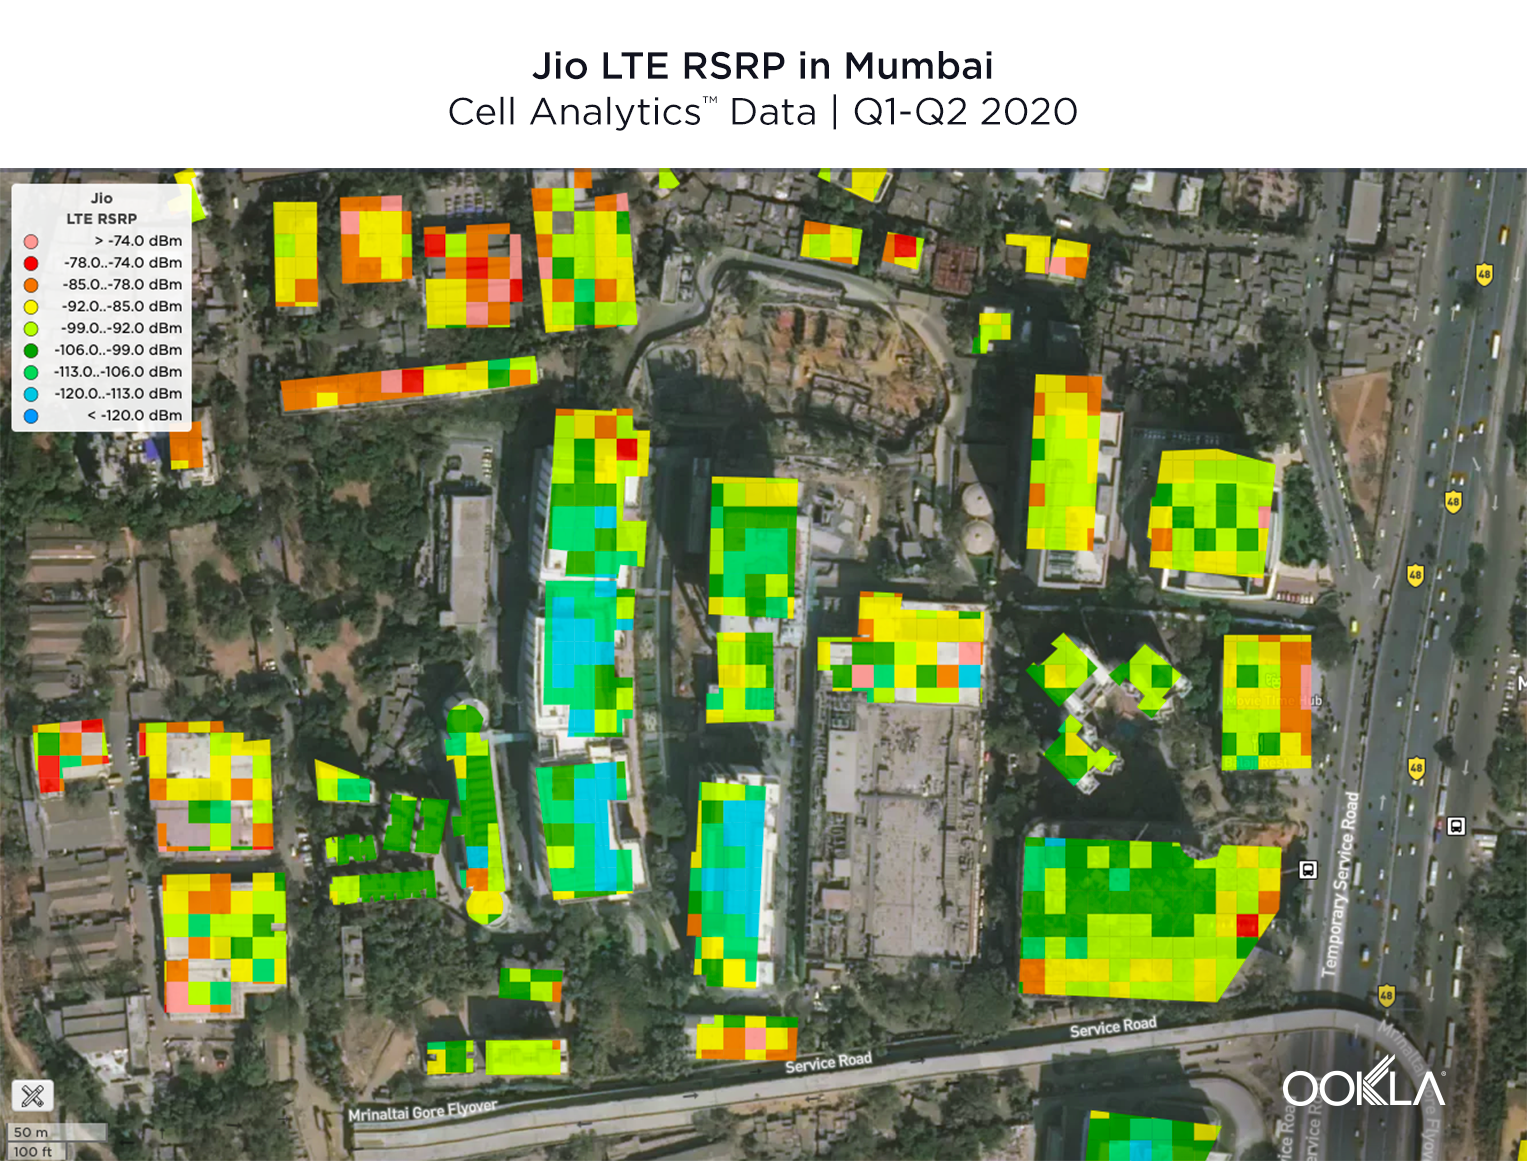
- Identify buildings with poor indoor coverage
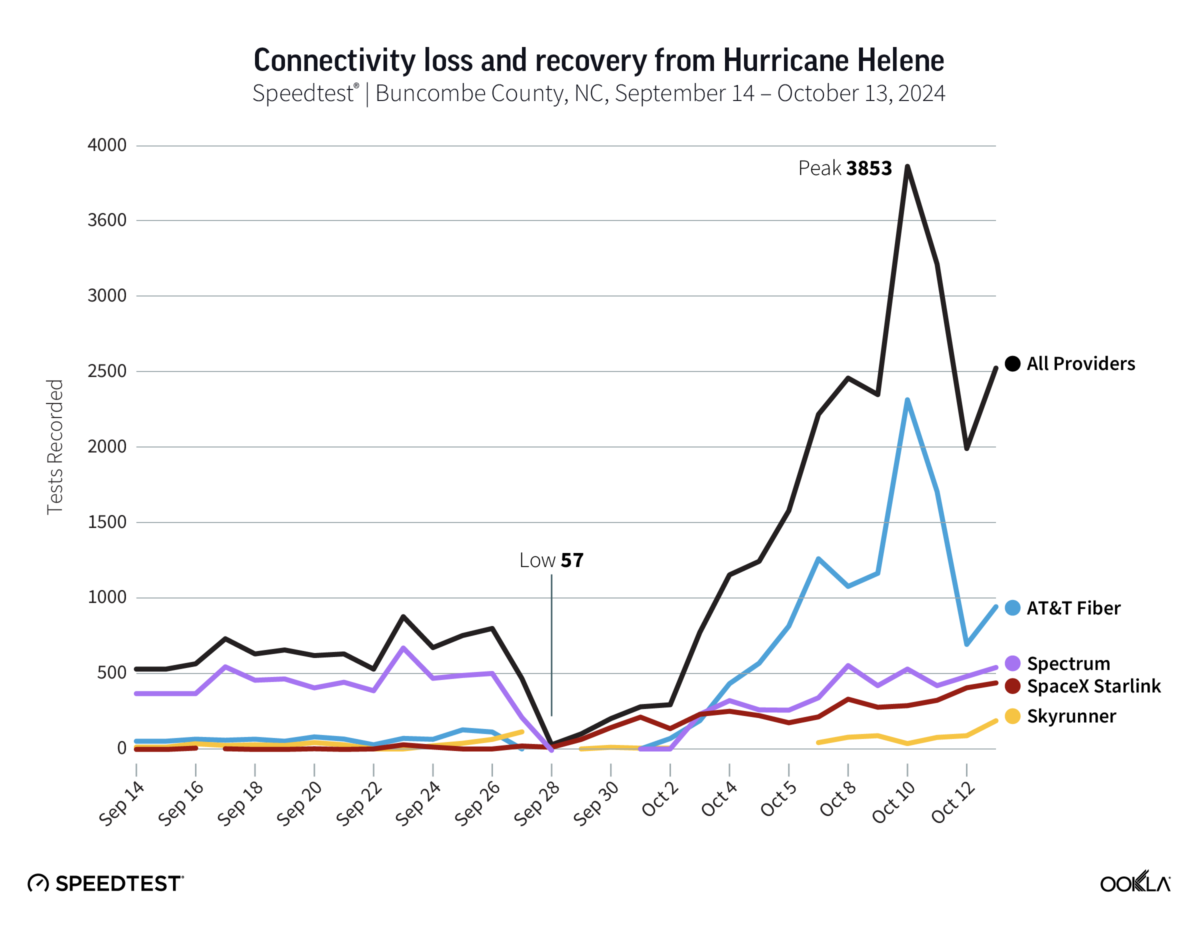
- Assess the impact of disasters on infrastructure
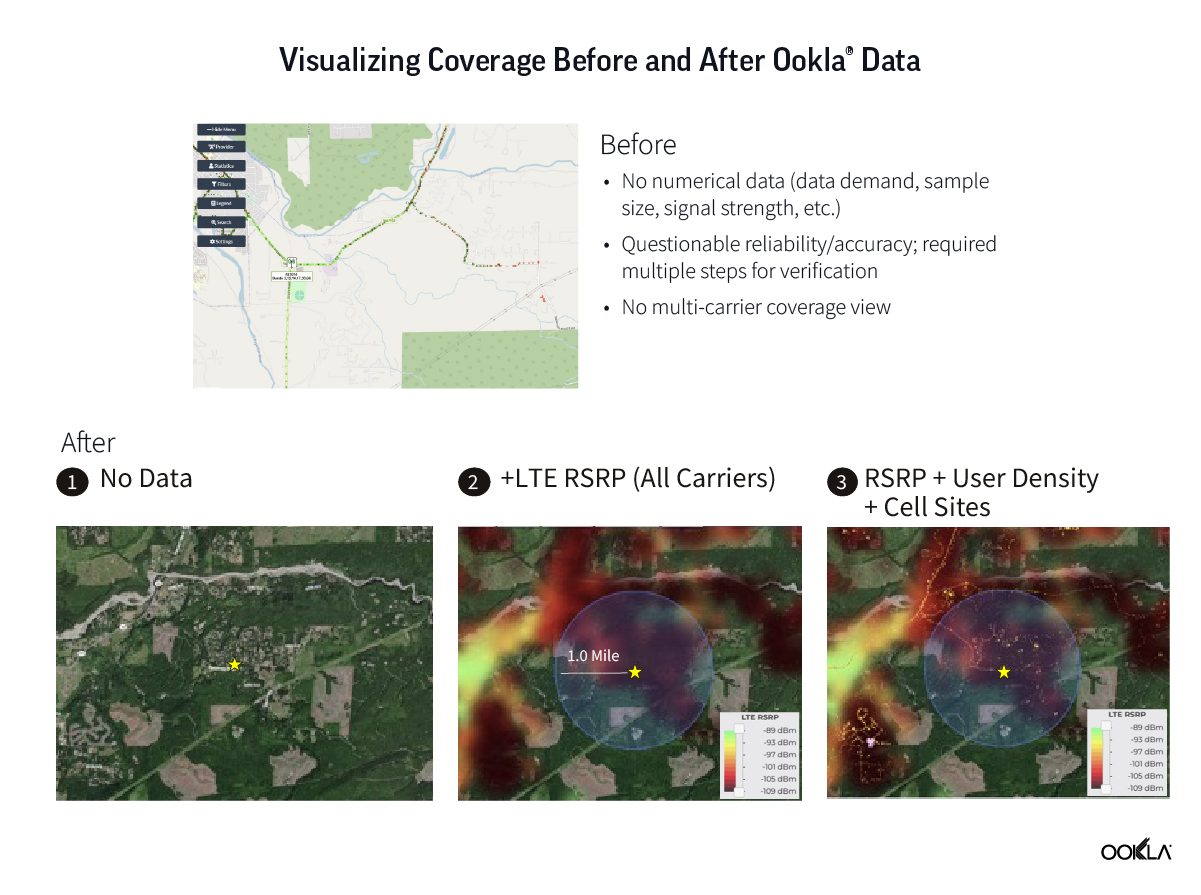
Ookla’s data has been a game-changer for PSTC. Before using Cell Analytics, PSTC had trouble getting a clear picture of connectivity, and their decision-making process was slow and relied on limited, anecdotal evidence. The tools they were using previously had no numerical data, no multi-carrier views, and was less accurate overall.
However, Ookla’s “data with no agenda” (as Chief Hutchings noted) approach revolutionized PSTC’s methodology, significantly accelerating their ability to identify coverage gaps and make informed decisions.
How PSTC Leverages Cell Analytics Insights
PSTC has developed a comprehensive approach to leverage the insights provided by Ookla Cell Analytics. Their step-by-step process involves:
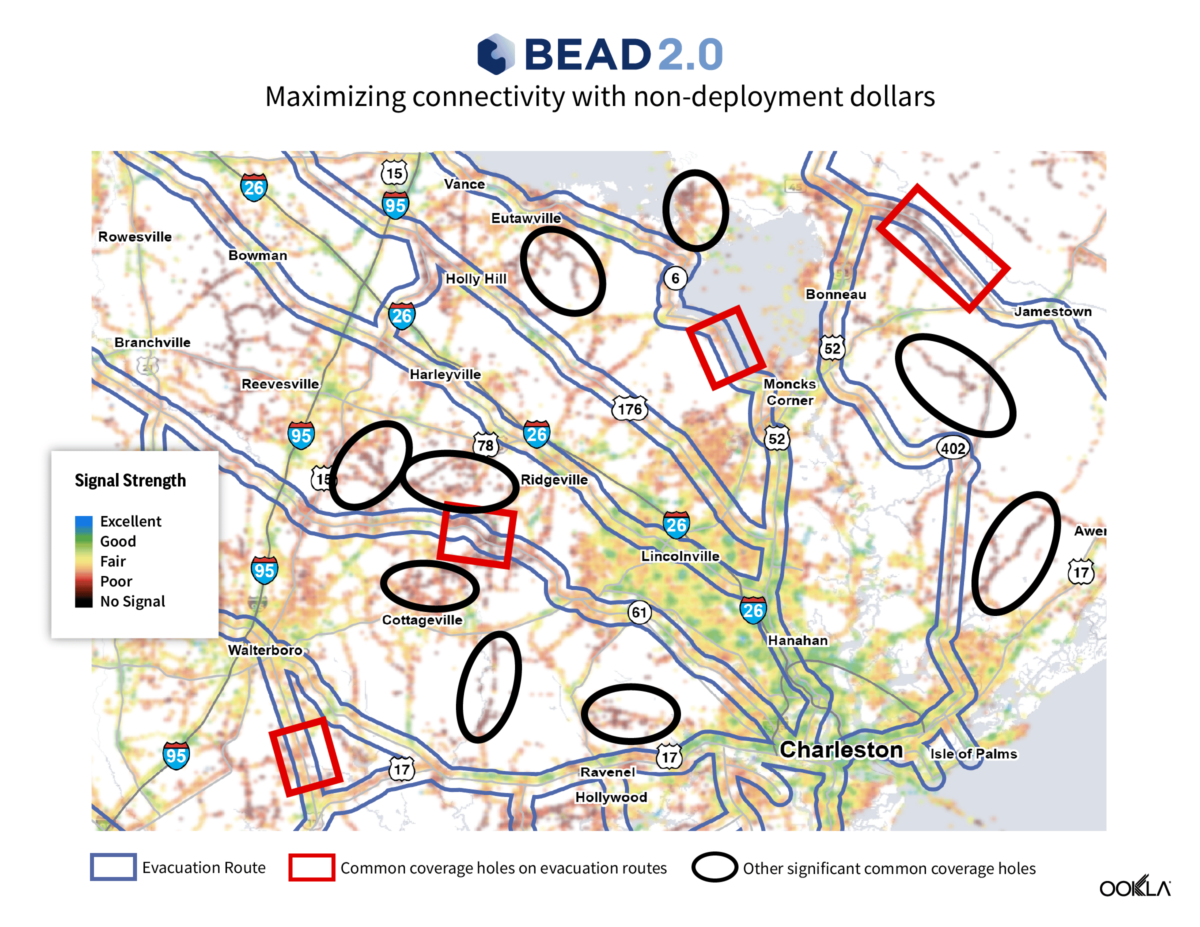
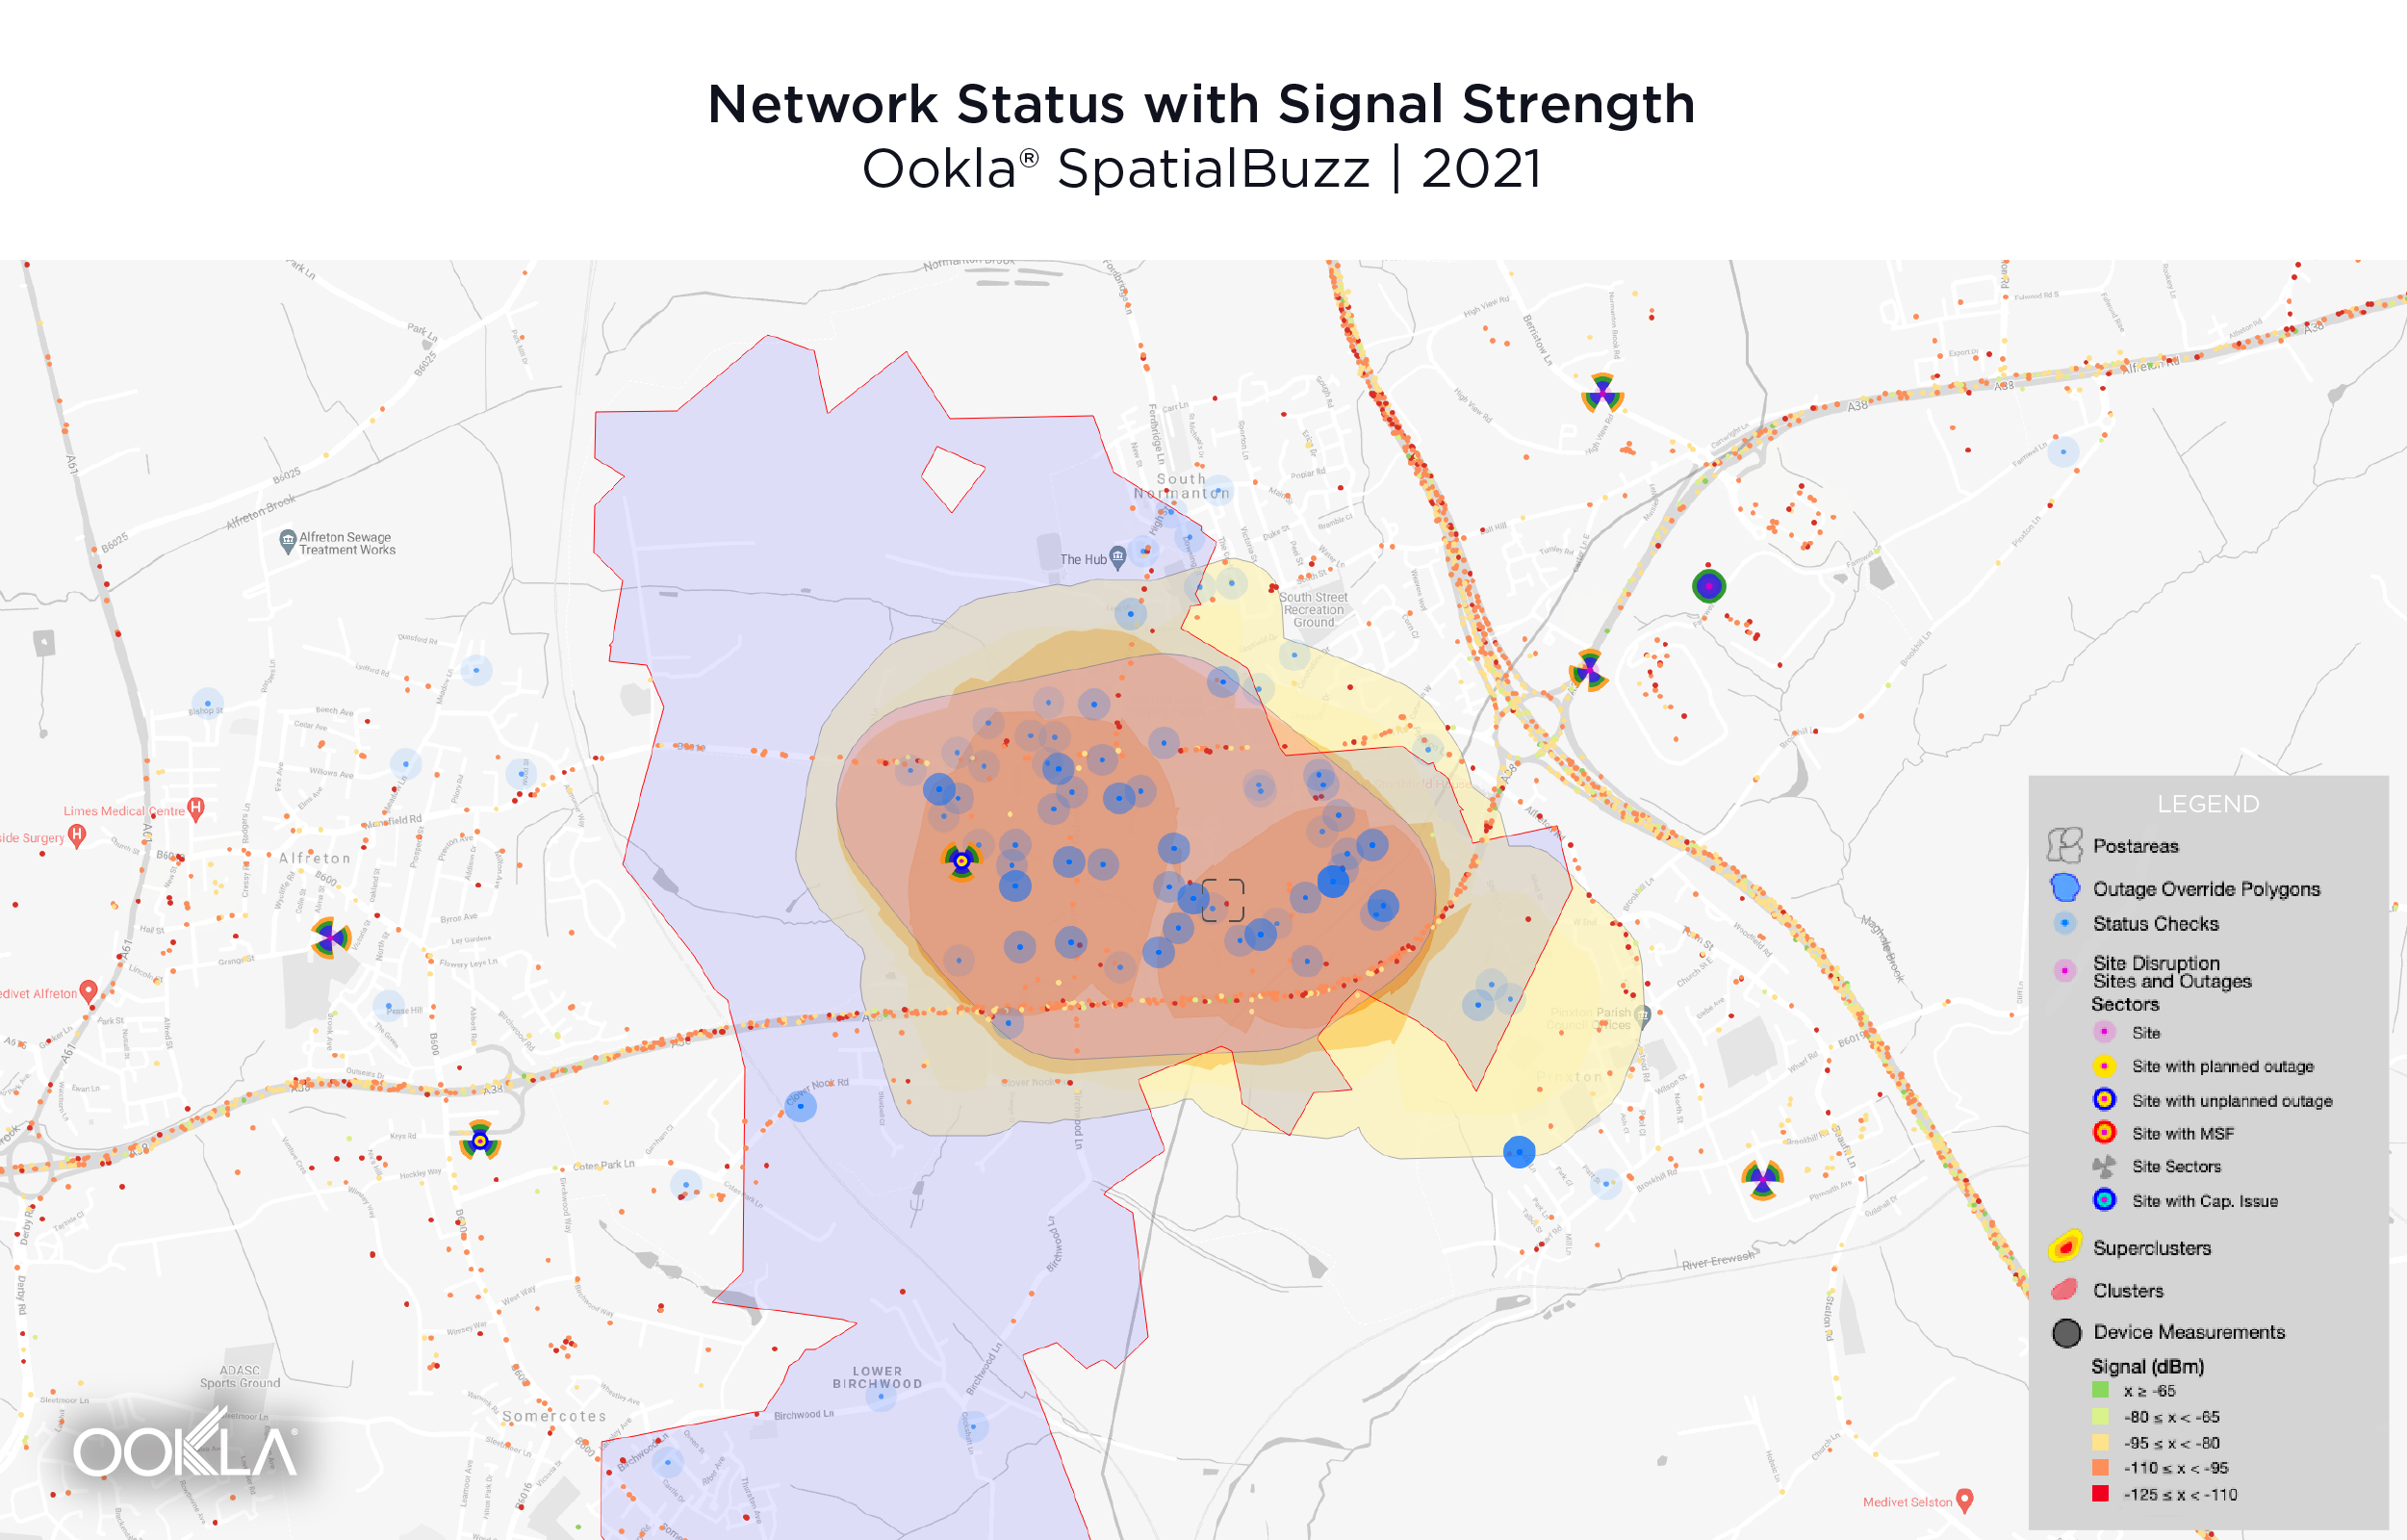
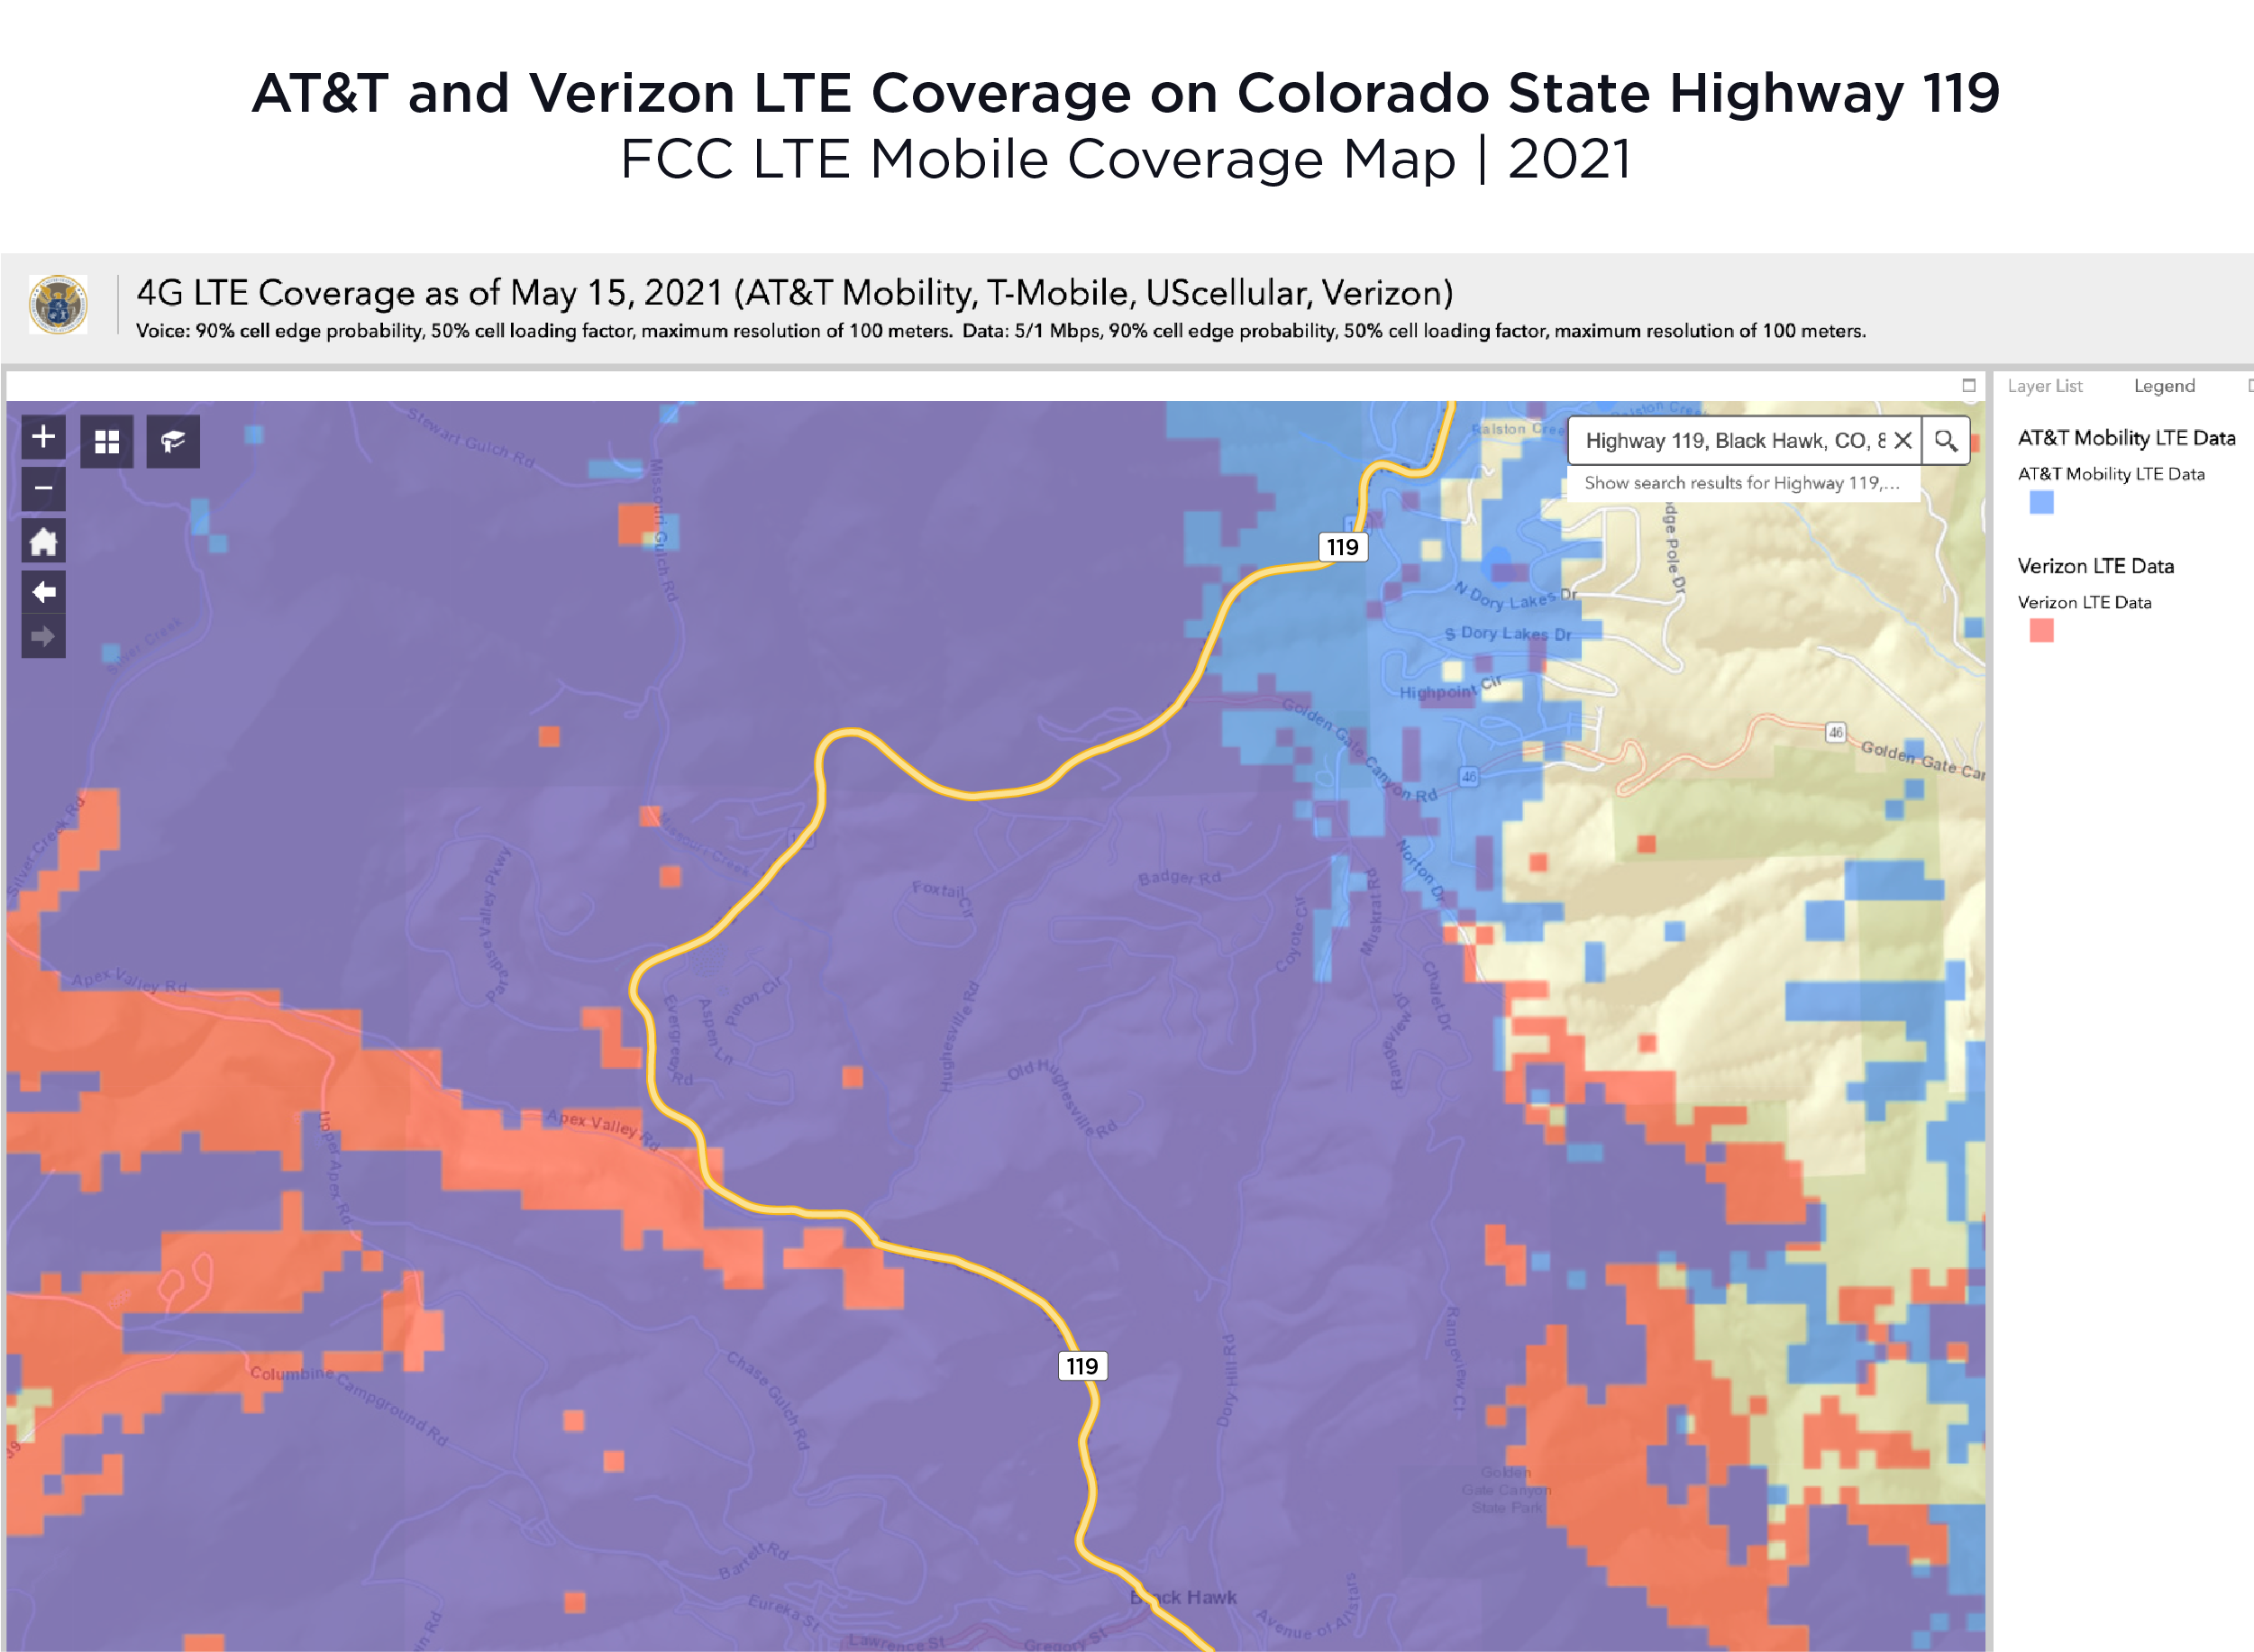
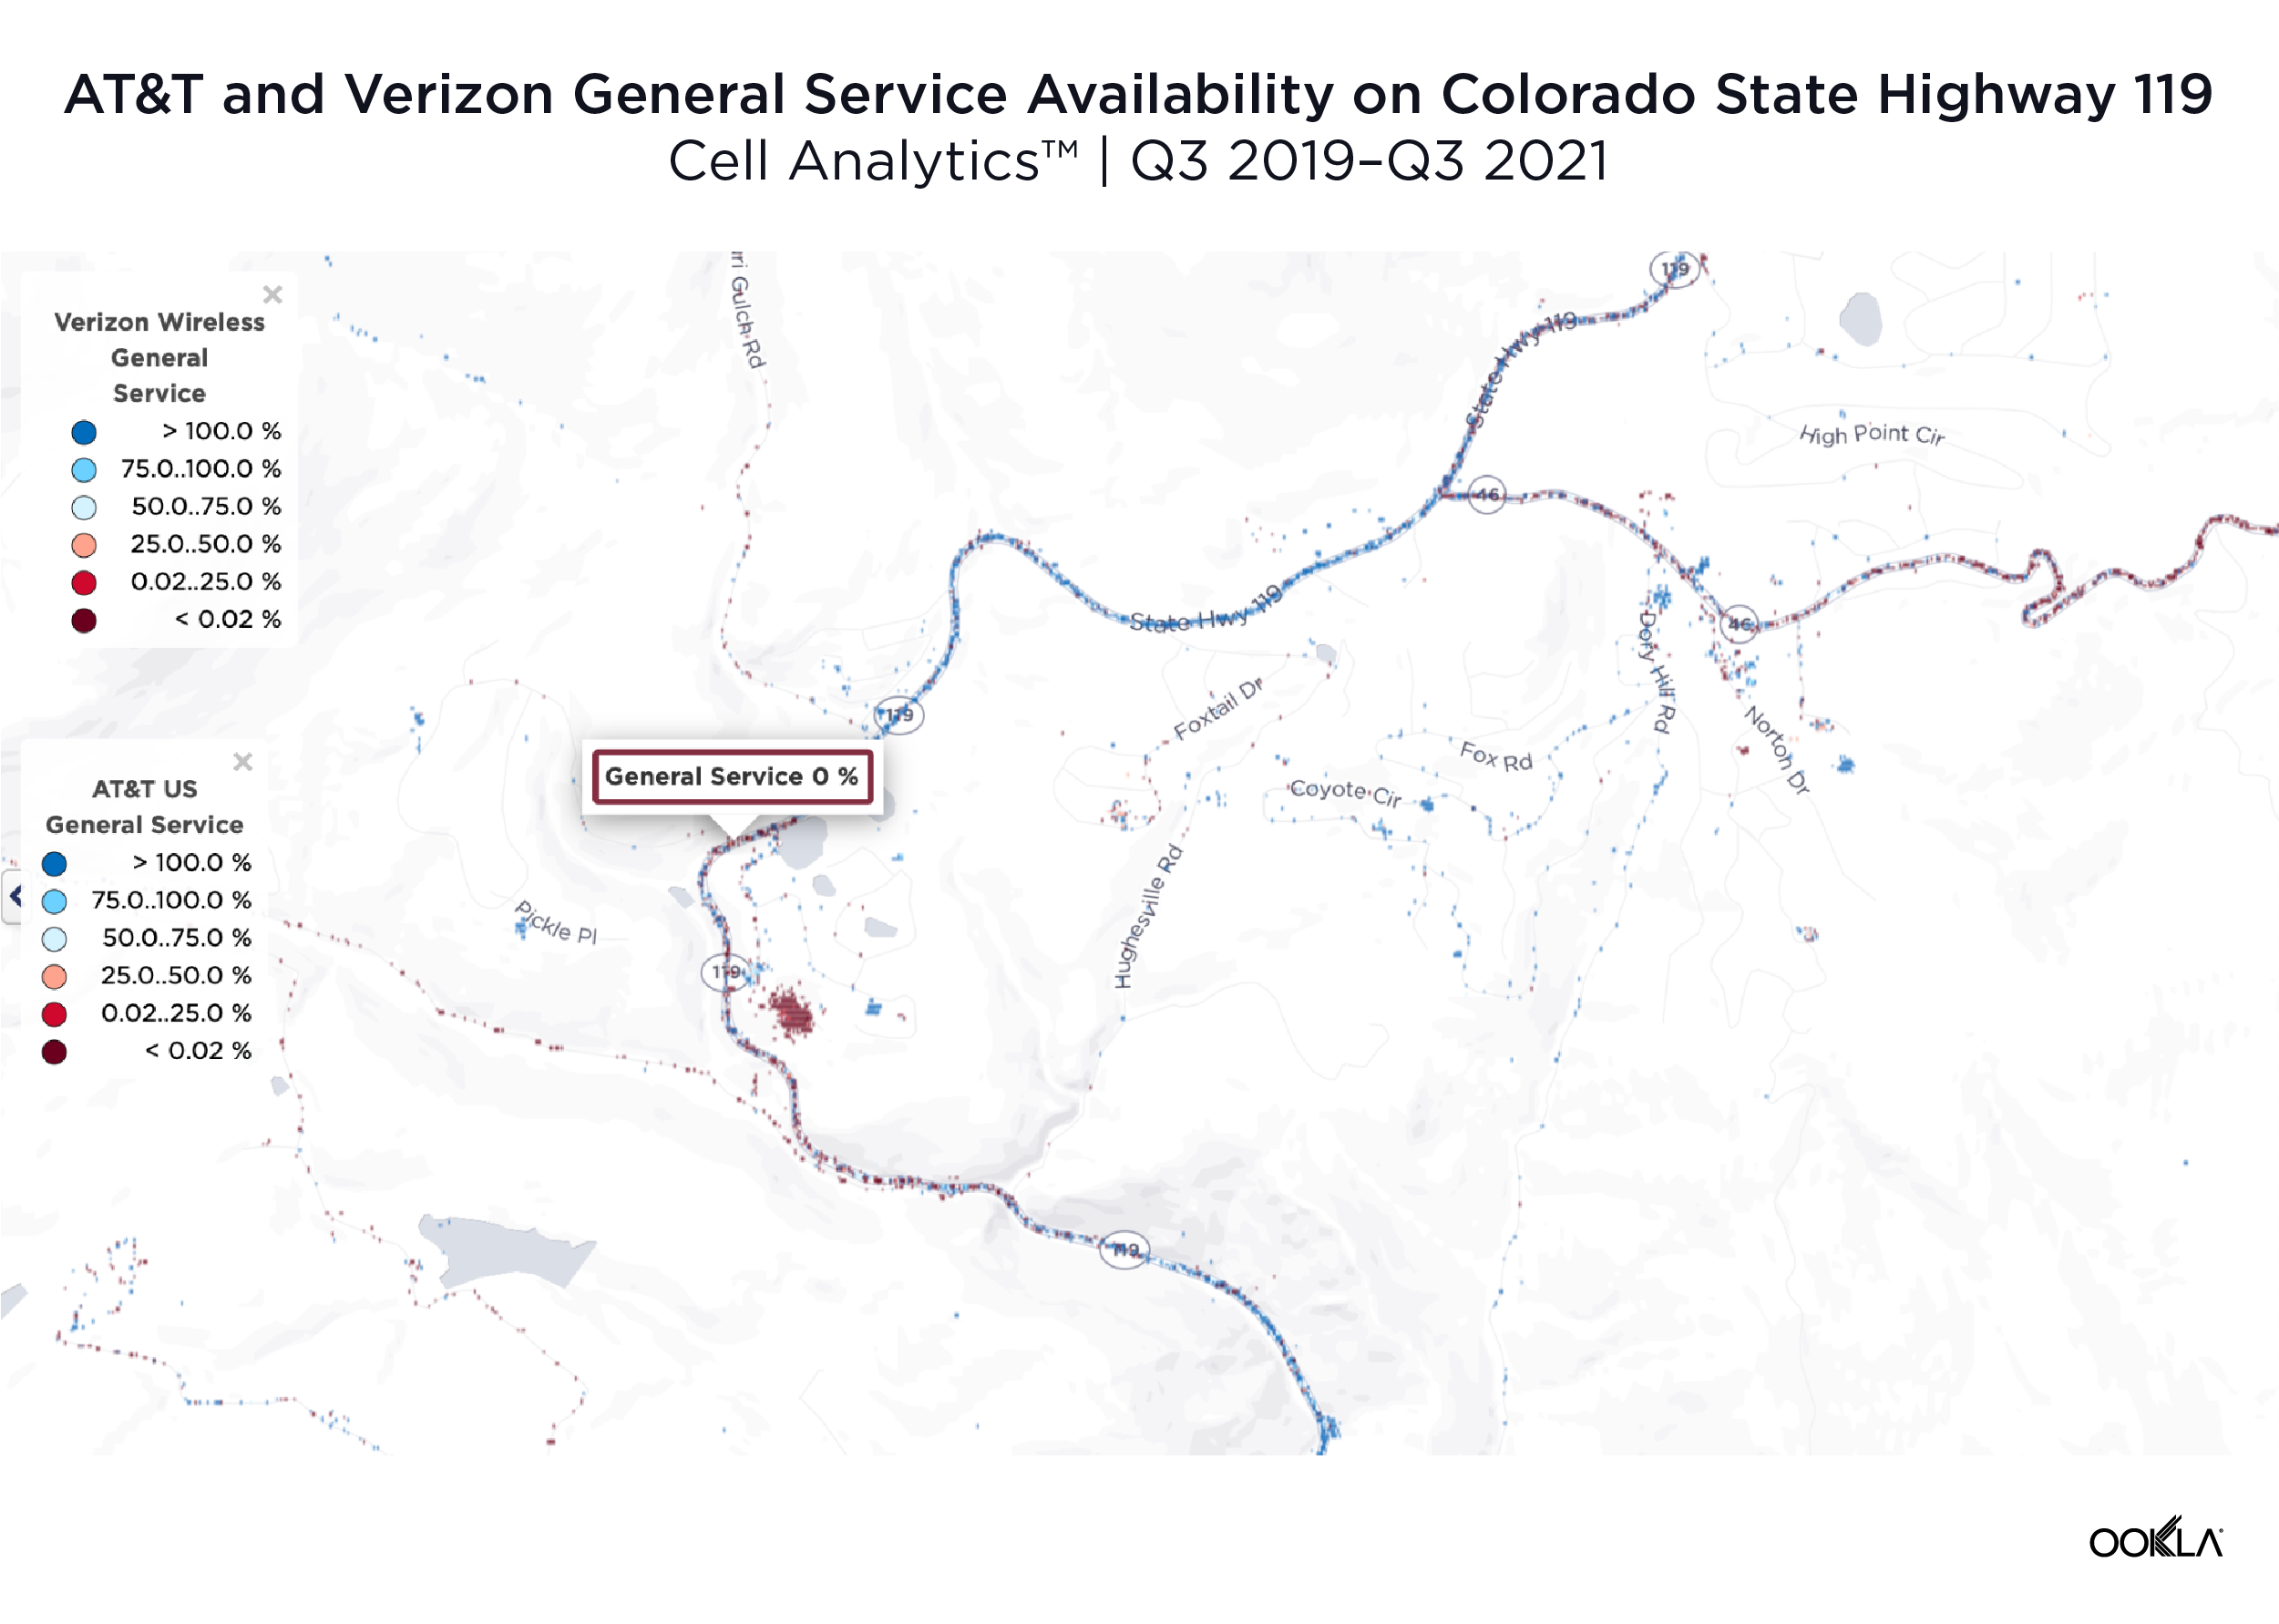
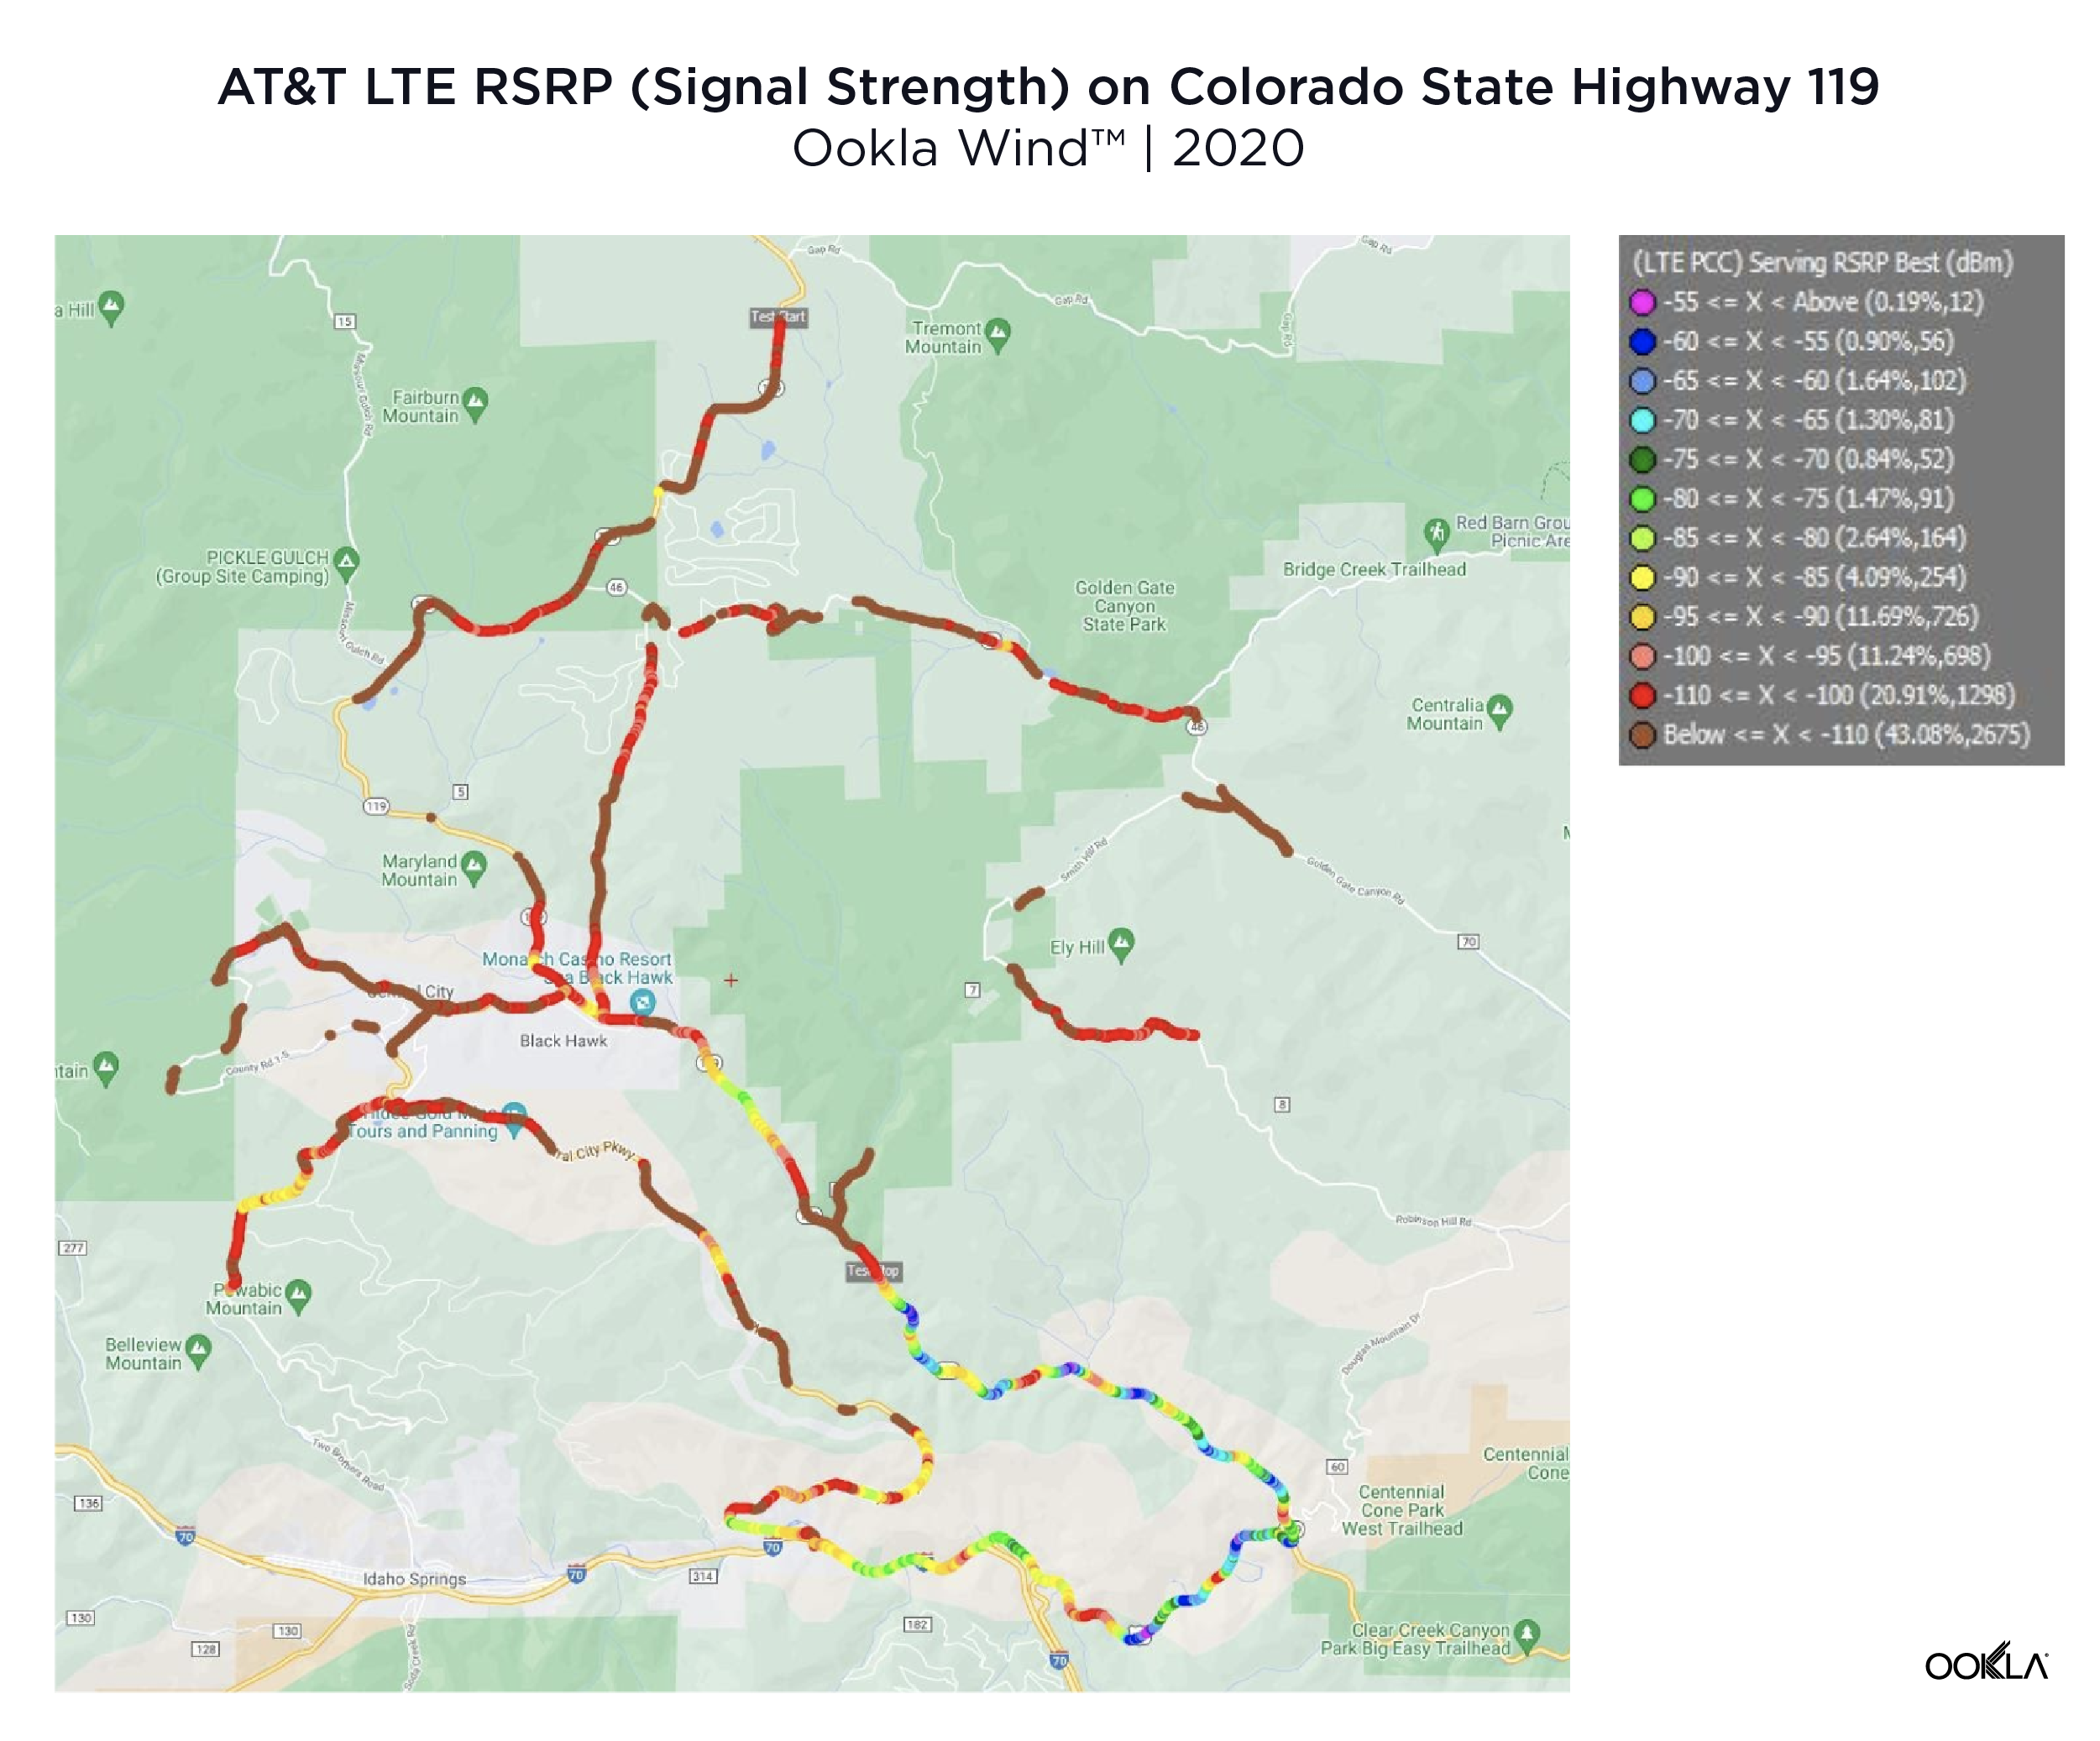
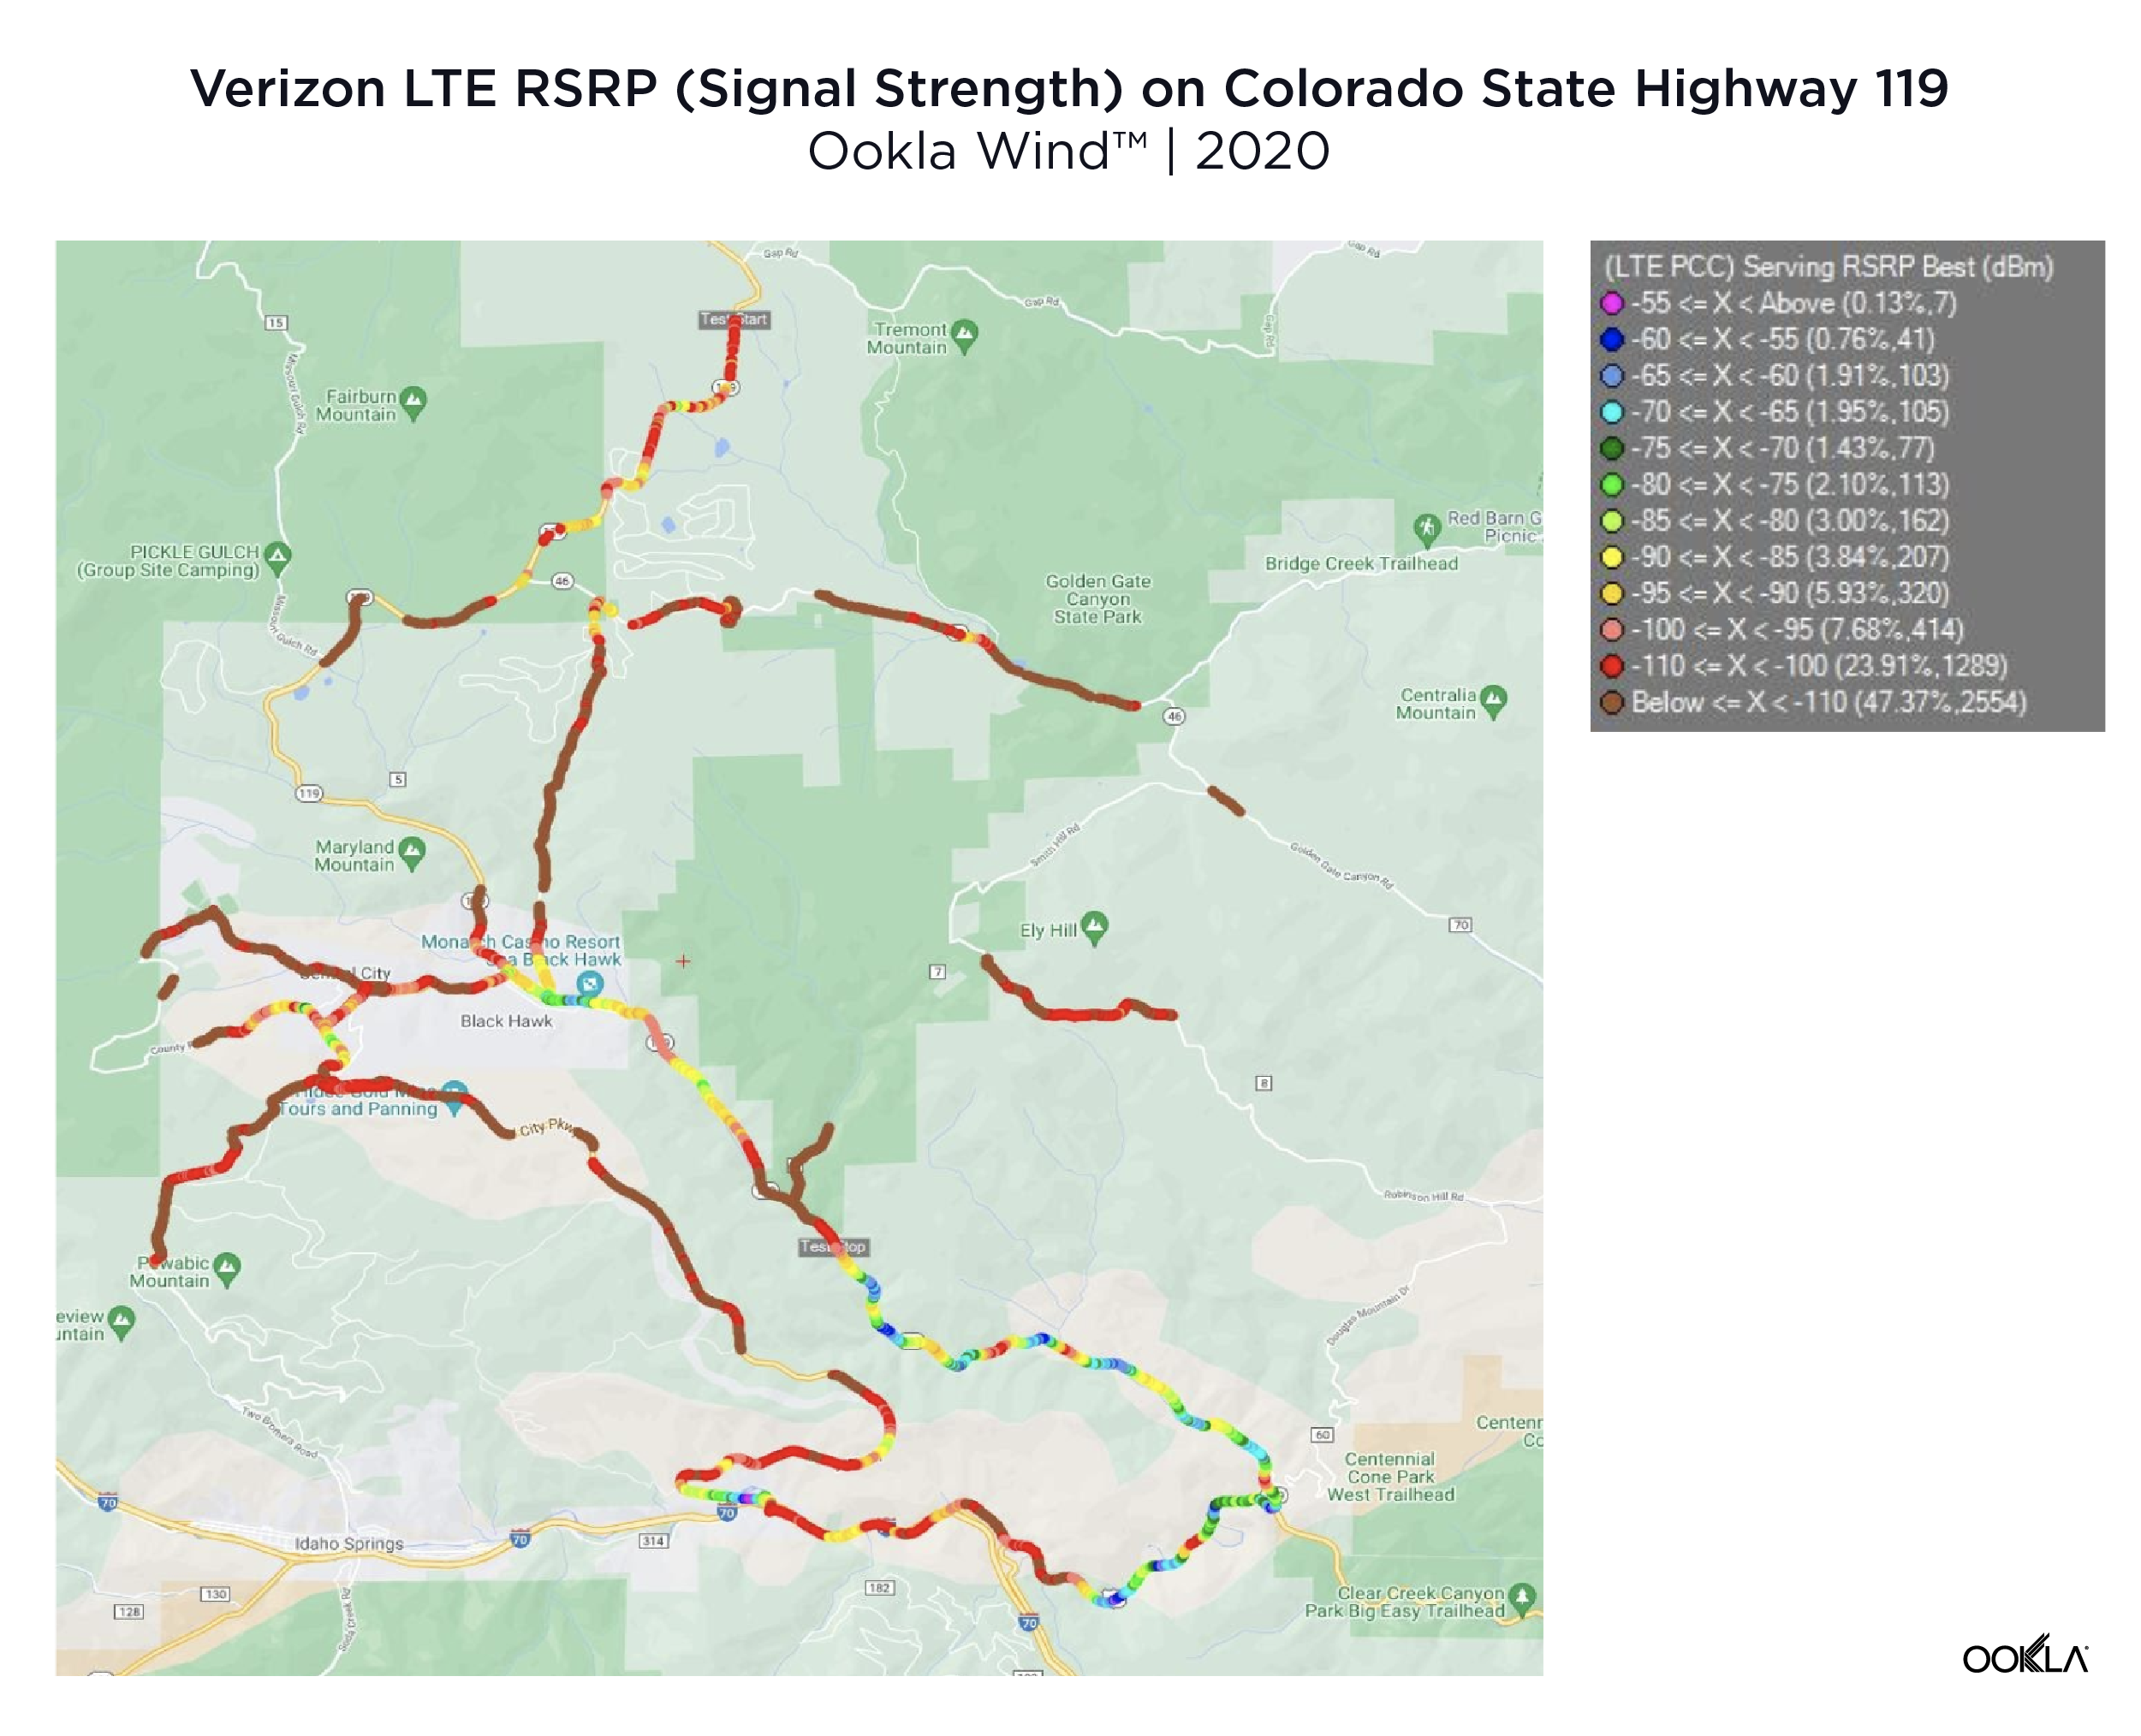
- Visualizing signal strength, user density, and existing infrastructure to identify areas of concern and potential sites for improvement
- Collaborating with public safety partners — like the Western Fire Chiefs Association — to pinpoint optimal tower placement and develop targeted solutions that address the specific needs of each community
- Using the visuals from Cell Analytics to show internal and external stakeholders exactly where coverage gaps exist
PSTC uses insights from Cell Analytics both Internally and externally. For internal stakeholders, the data drives decision-making processes, helping PSTC prioritize projects and allocate resources effectively. Externally, the information is used to communicate with stakeholders, including public safety organizations and local government officials, to build consensus and secure support for infrastructure improvements.
PSTC’s data-driven approach has already led to significant improvements in wireless connectivity for public safety. In Washington state, for example, PSTC’s efforts resulted in the construction of a new tower that addressed a critical coverage gap, enabling first responders to communicate effectively and access vital information during emergencies.
Lessons for Improving Wireless Networks
The success of PSTC in using Ookla Cell Analytics data to improve connectivity for public safety offers valuable lessons for other organizations looking to enhance their wireless networks:
- Identify coverage gaps using crowdsourced data to make data-driven decisions
- Benchmark network performance, quality, and availability to prioritize improvements
- Strategically place new cell sites or pursue tower colocation opportunities
- Foster collaboration between public safety organizations and wireless infrastructure providers
By applying these lessons and working together, organizations can stay ahead of evolving challenges and leverage emerging technologies to build safer, more connected communities.
Conclusion & Looking Ahead
Consistently reliable wireless connectivity is critical for ensuring public safety. As the reliance on mobile devices and data keeps growing, comprehensive coverage and strong connectivity will continue to become even more essential.
Looking ahead, the potential for leveraging crowdsourced data to improve public safety connectivity is immense. In the future, for example, public safety teams responding to emergencies may be able to access critical information from crashed vehicles, such as Teslas, including speed, the number of occupants, and the status of airbag deployments – but only if good connectivity is available.
Wireless infrastructure providers and public safety organizations must work together to identify and address coverage gaps, leveraging crowdsourced insights to make data-driven decisions. By exploring how solutions like Ookla Cell Analytics can help improve public safety connectivity, we can build more resilient and responsive networks that better serve our communities.
To learn more, watch our webinar on-demand and discover how Ookla’s solutions can help you improve wireless connectivity in your community.
Ookla retains ownership of this article including all of the intellectual property rights, data, content graphs and analysis. This article may not be quoted, reproduced, distributed or published for any commercial purpose without prior consent. Members of the press and others using the findings in this article for non-commercial purposes are welcome to publicly share and link to report information with attribution to Ookla.