| December 20, 2021

Growing and Slowing: The State of 5G Worldwide in 2021


5G continues to offer new and exciting ways of rethinking everything from streaming video to performing remote surgery. However, not everyone shares equally in these possibilities as many countries do not have access to 5G and even those that do, do not experience the same level of performance from their 5G connections. We examined Speedtest Intelligence® data from Q3 2021 Speedtest® results to see how 5G speeds have changed, where download speeds are the fastest at the country and capital level, where 5G deployments have increased and what worldwide 5G Availability looked like in Q3 2021. We also looked at countries that don’t yet have 5G to understand where consumers are seeing improvements in 4G access.

5G slowed down at the global level
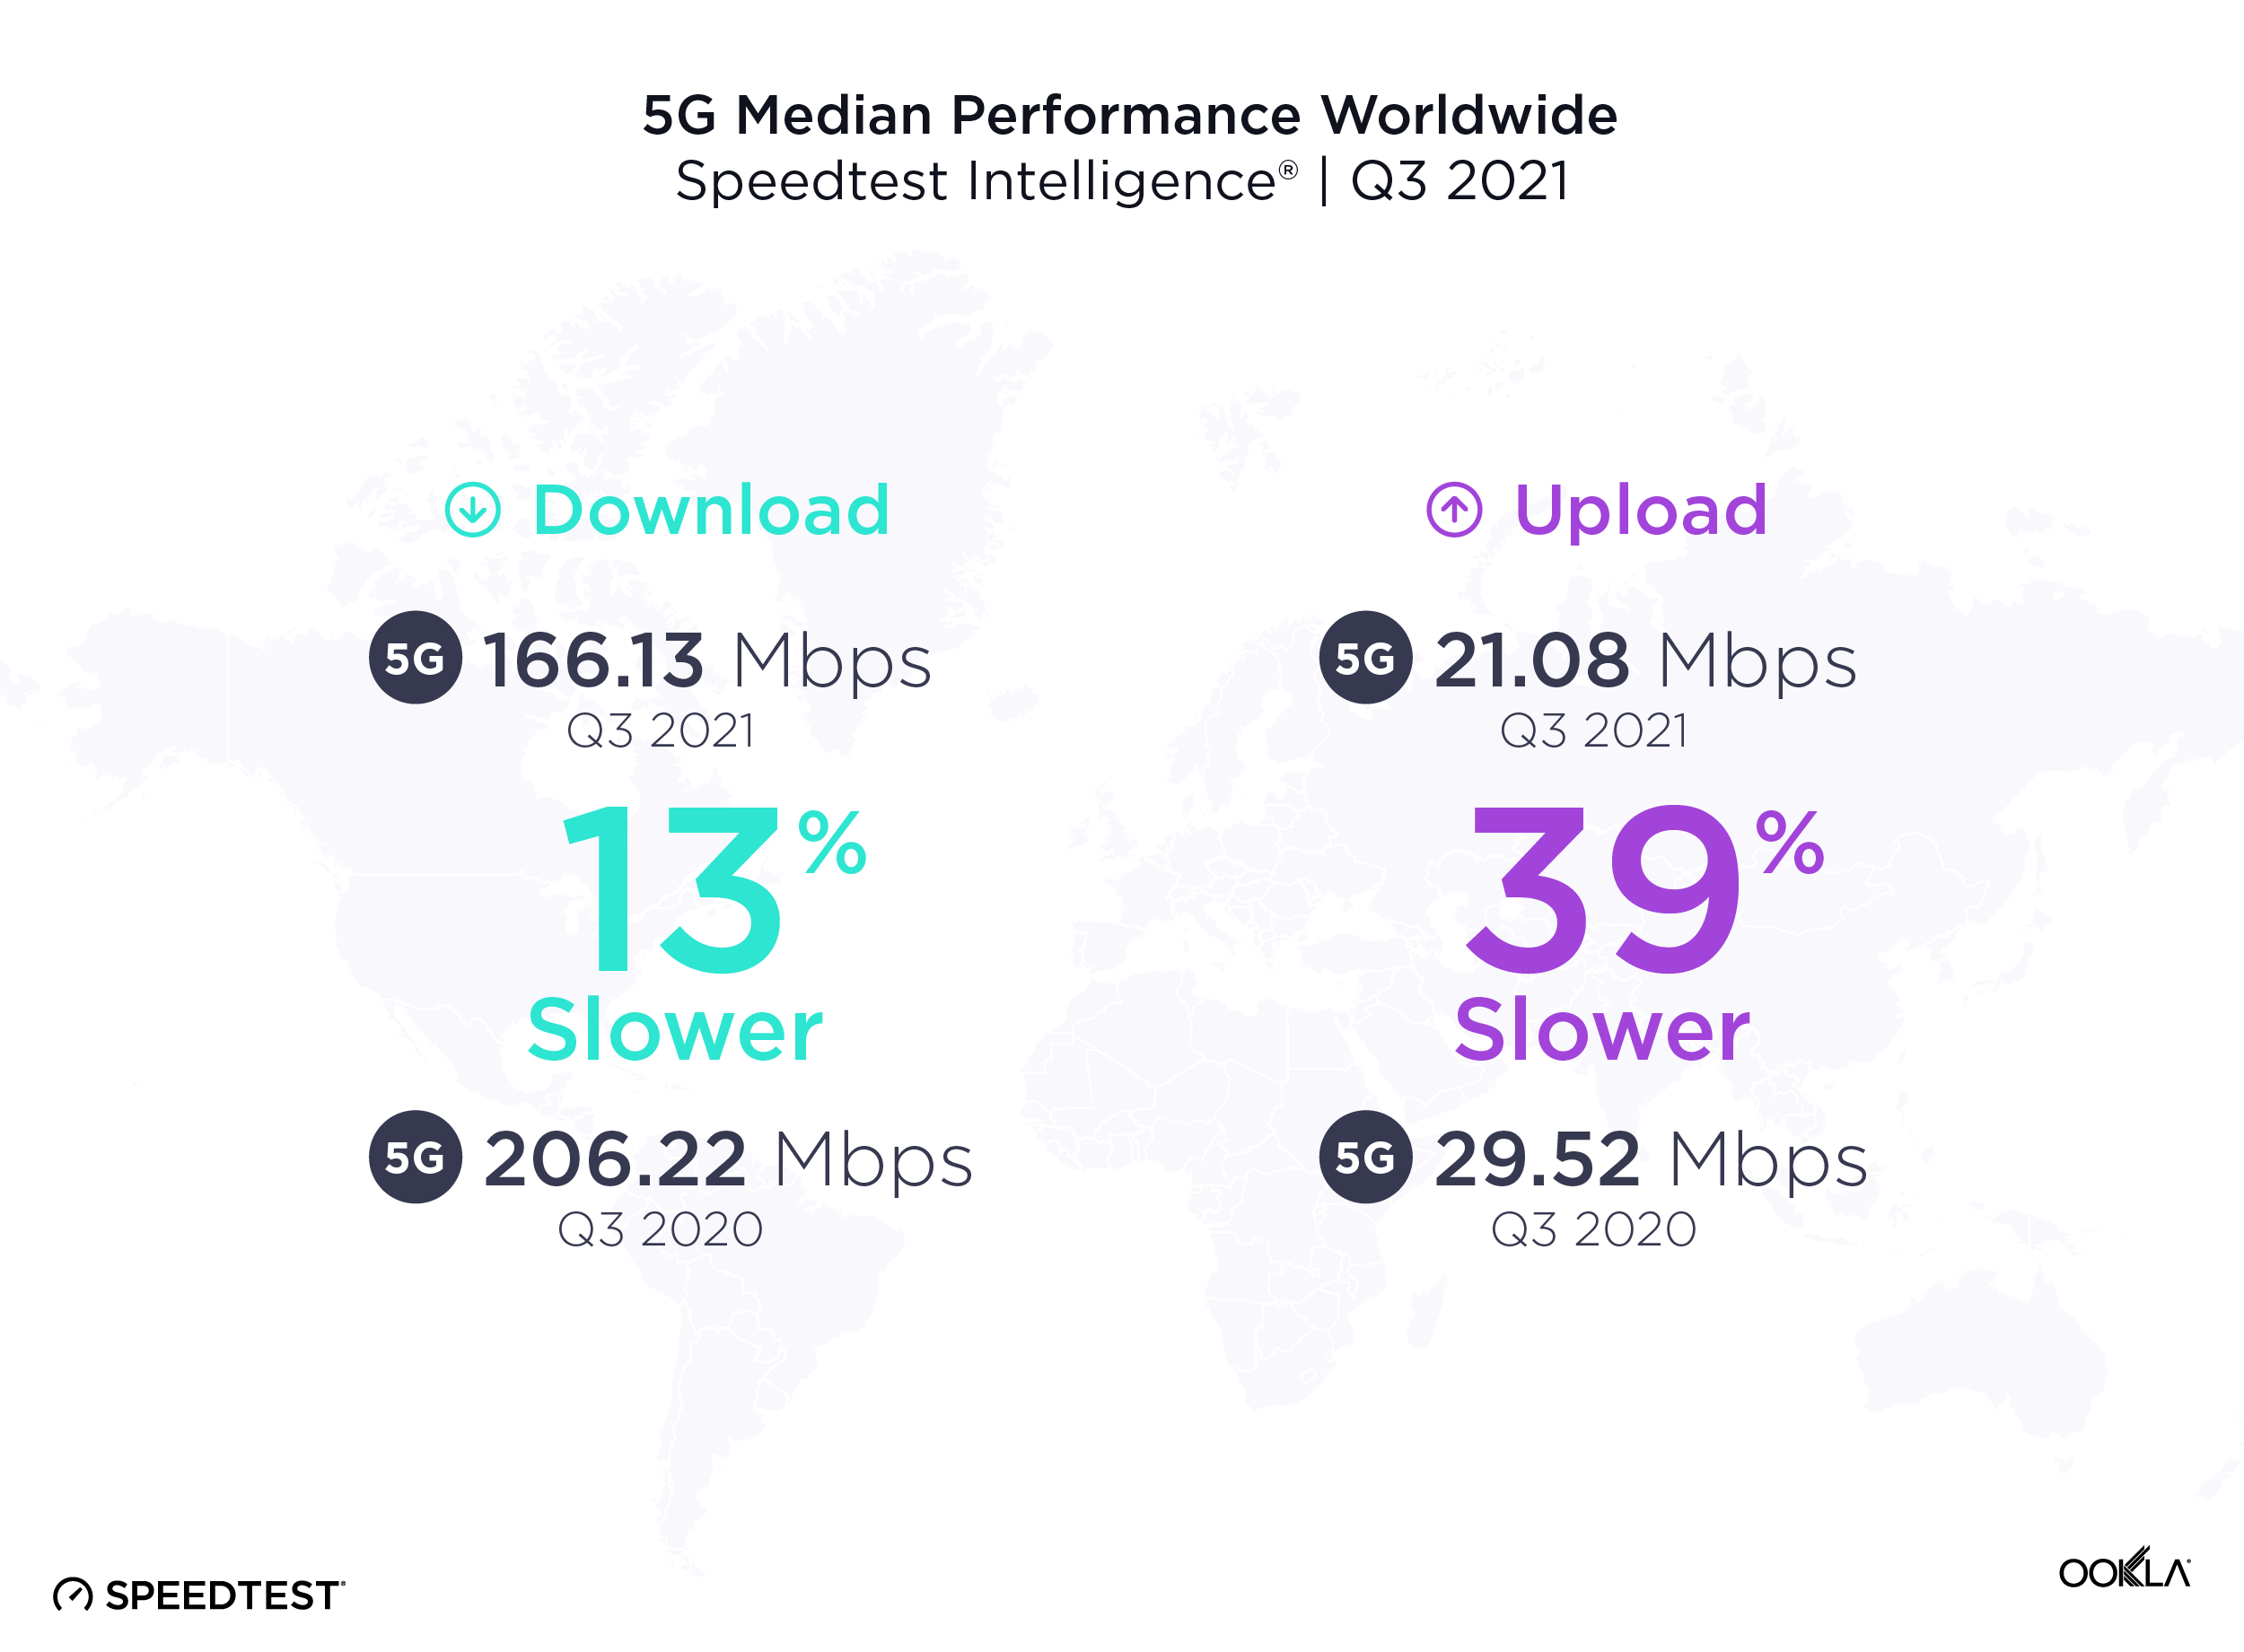
Median-Speeds-Worldwide_1221-01

It’s common to see new mobile access technologies slow down as adoption scales, particularly early on in the tech cycle. Over the past year from Q3 2020 to Q3 2021, the median global 5G download speed fell to 166.13 Mbps, down from 206.22 Mbps in Q3 2020. Median upload speed over 5G also slowed to 21.08 Mbps (from 29.52 Mbps) during the same period.

More users are logging on to existing 5G networks, and we’re also at the stage in the evolution of 5G where countries that have historically had slower speeds are starting to offer 5G. In addition, the widespread use of dynamic spectrum sharing that has been used to boost early 5G coverage weighs on 5G download speeds. While the dip in speeds looks like a letdown, it’s more of a compromise to enable broader access. With additional spectrum and further deployments slated for 2022, we anticipate speeds will begin to pick up again.

South Korea had the fastest 5G in the world

ookla_5g-download_performance_countries_1221-01-1

South Korea had the fastest median download speed over 5G during Q3 2021, leading a top 10 list that included Norway, United Arab Emirates, Saudi Arabia, Qatar, Kuwait, Sweden, China, Taiwan and New Zealand. Sweden, China, Taiwan and New Zealand were new to the top 10 in 2021 while South Africa (whose 5G was brand new last year), Spain and Hungary fell out of the top 10.

5G expanded to 13 additional countries

ookla_5G-map_1221-01

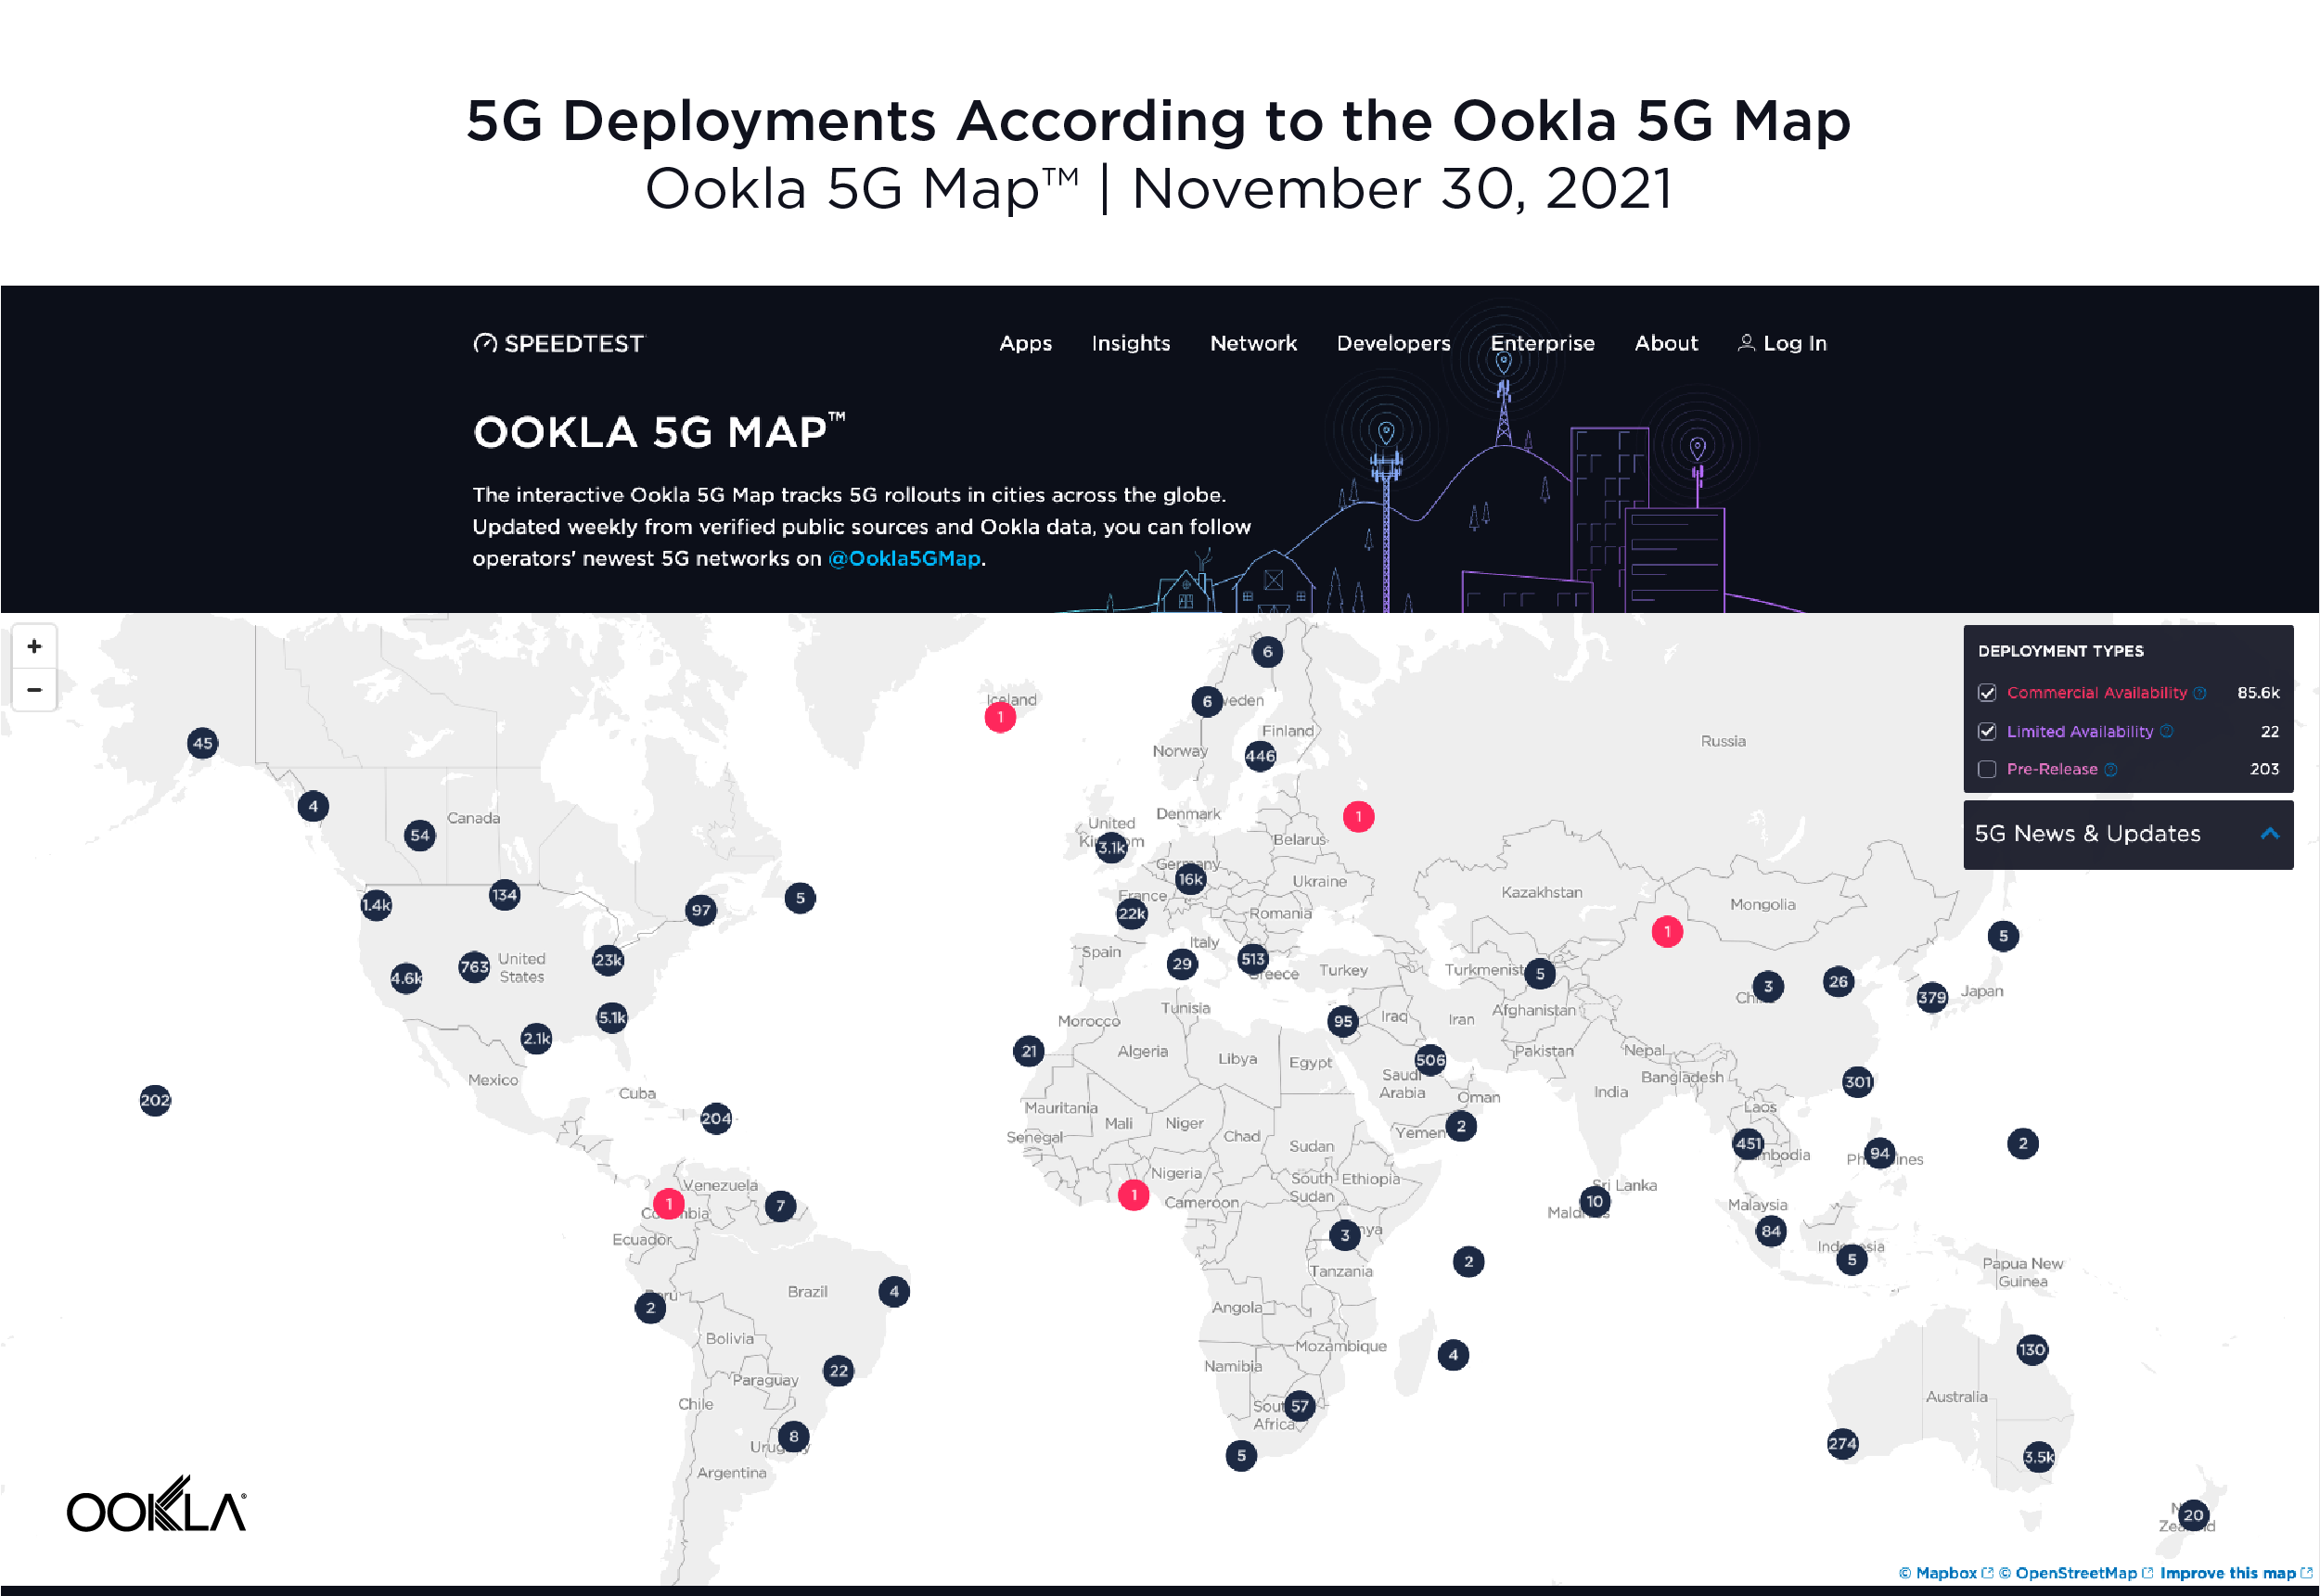
According to the Ookla® 5G Map, there were 5G deployments in 112 countries as of November 30, 2021. That’s up from 99 countries on the same date a year ago. The total number of deployments increased dramatically during the same time period with 85,602 deployments on November 30, 2021 compared to 17,428 on November 30, 2020, highlighting the degree to which 5G networks scaled during the year. Note that there are often multiple deployments in a given city.

Seoul and Oslo lead world capitals for 5G
ookla_5g-download_performance_capitals_1221-01

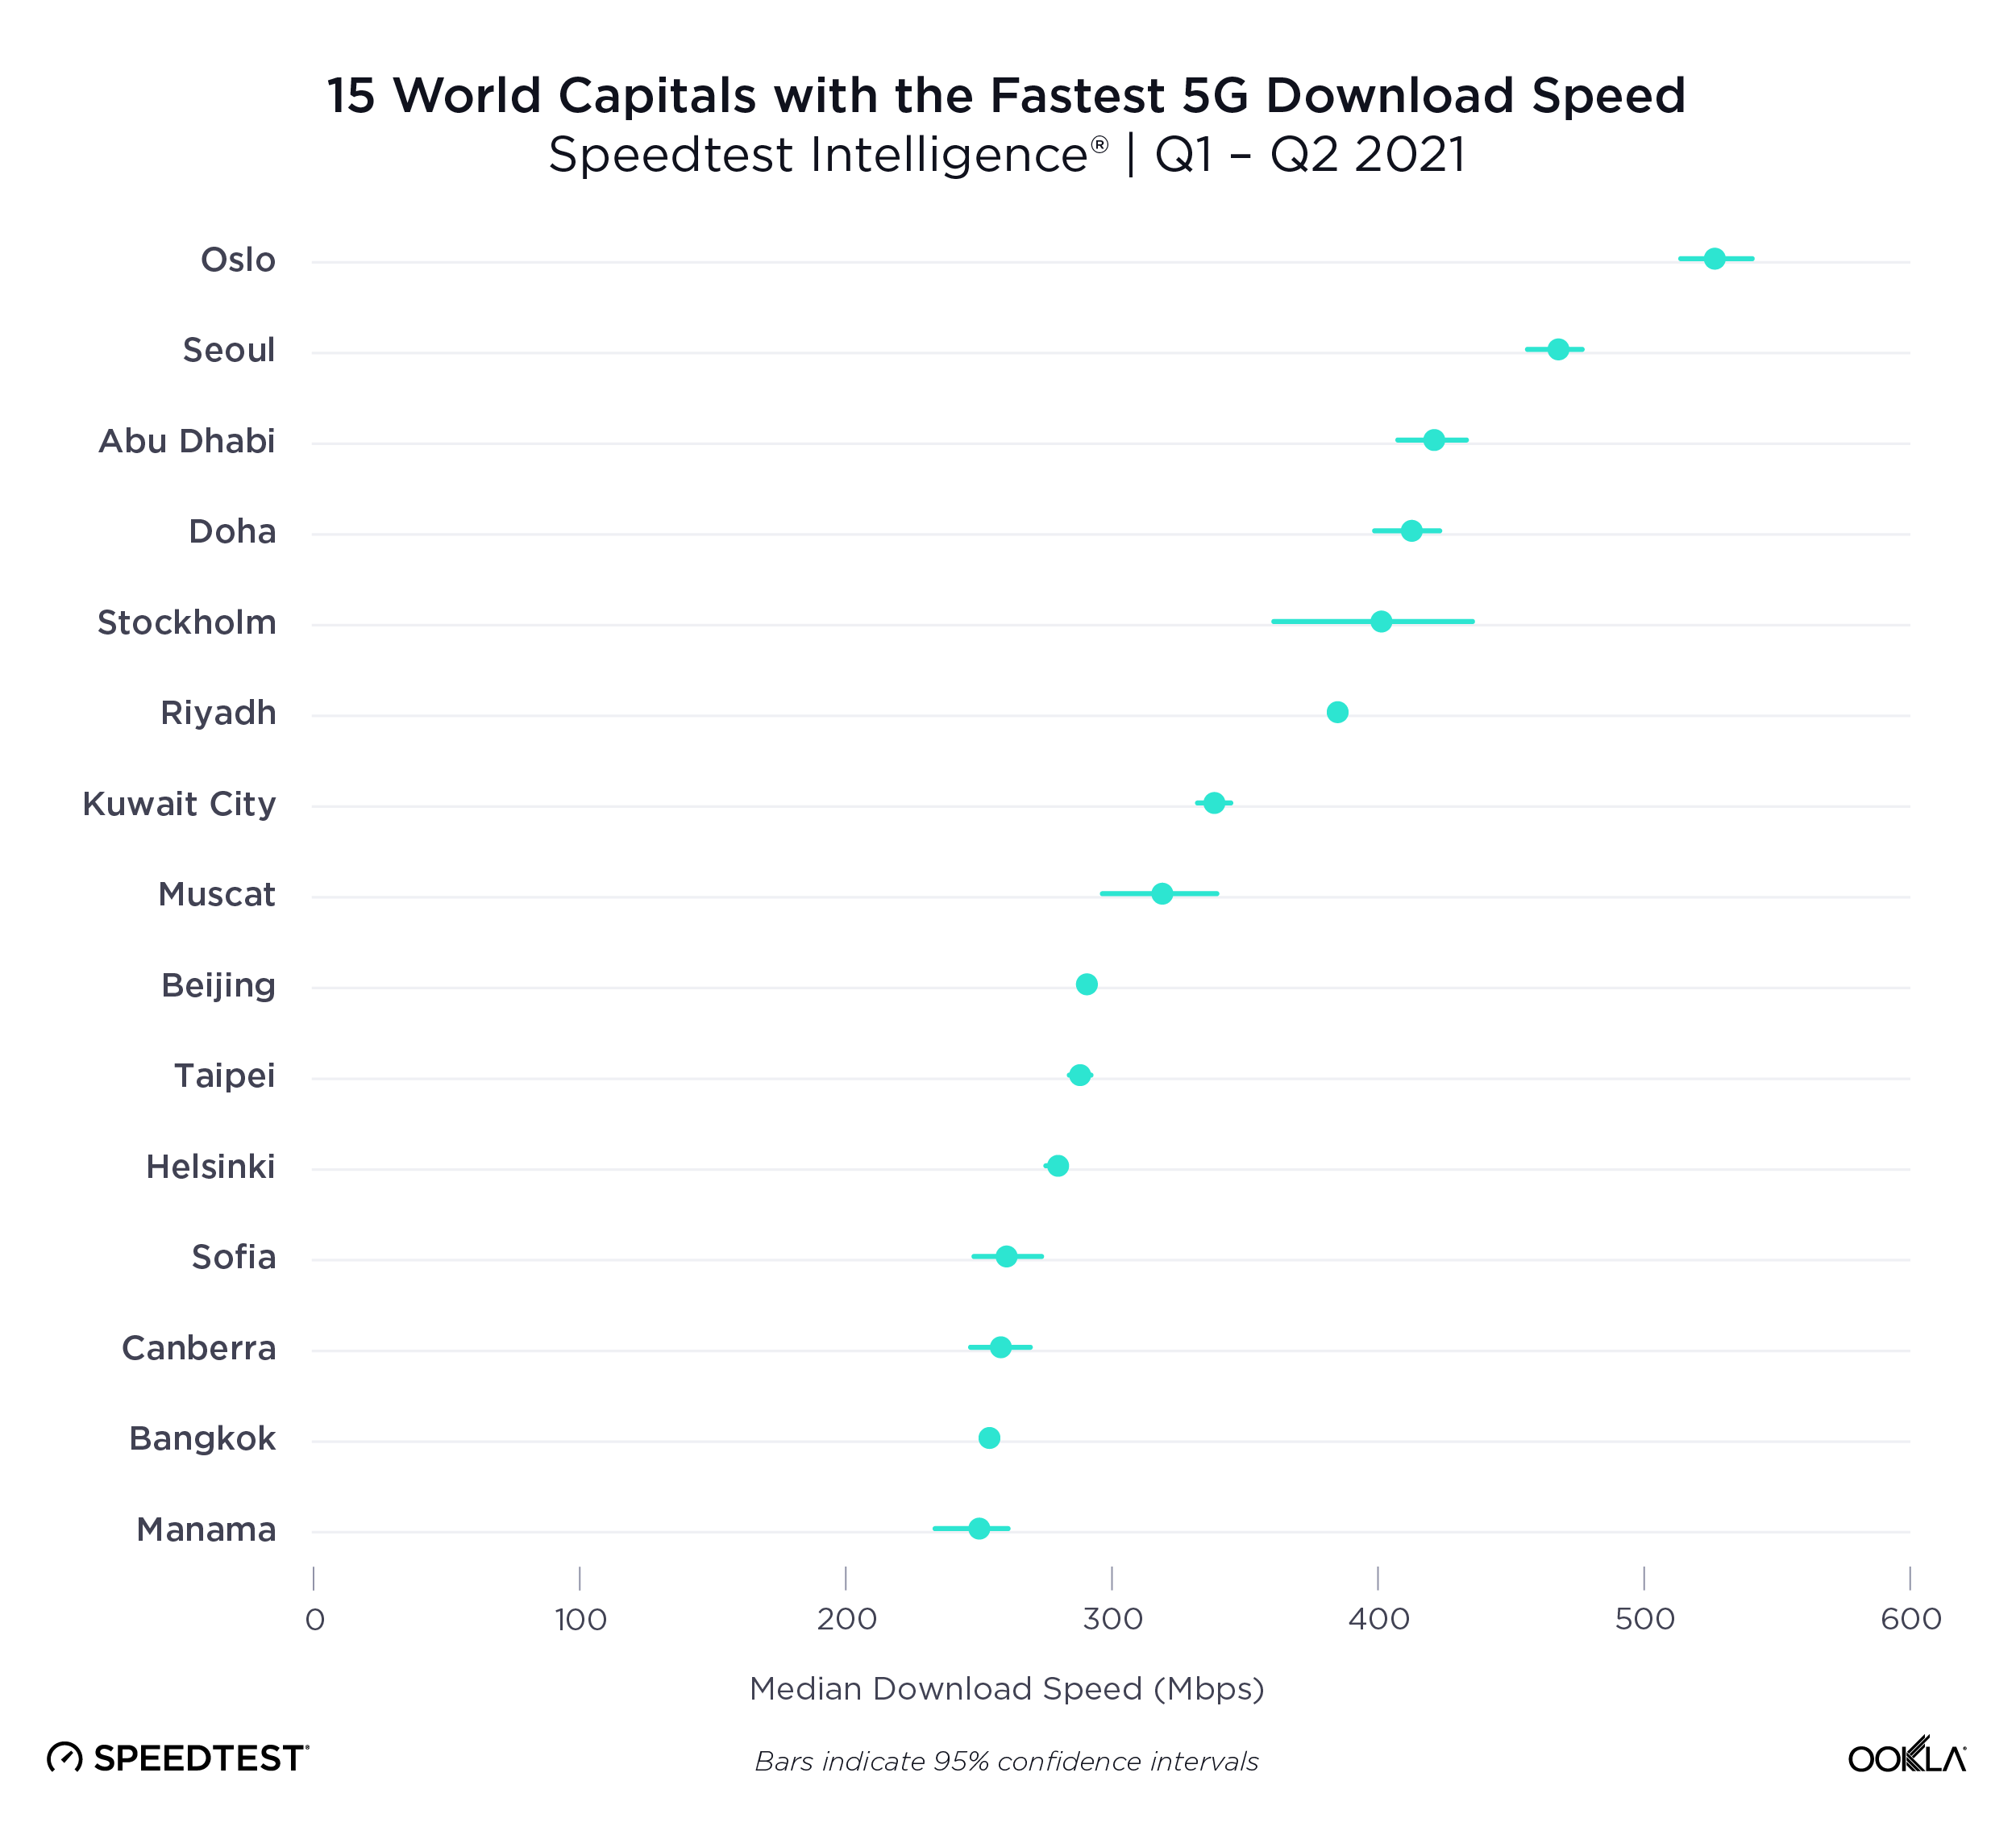
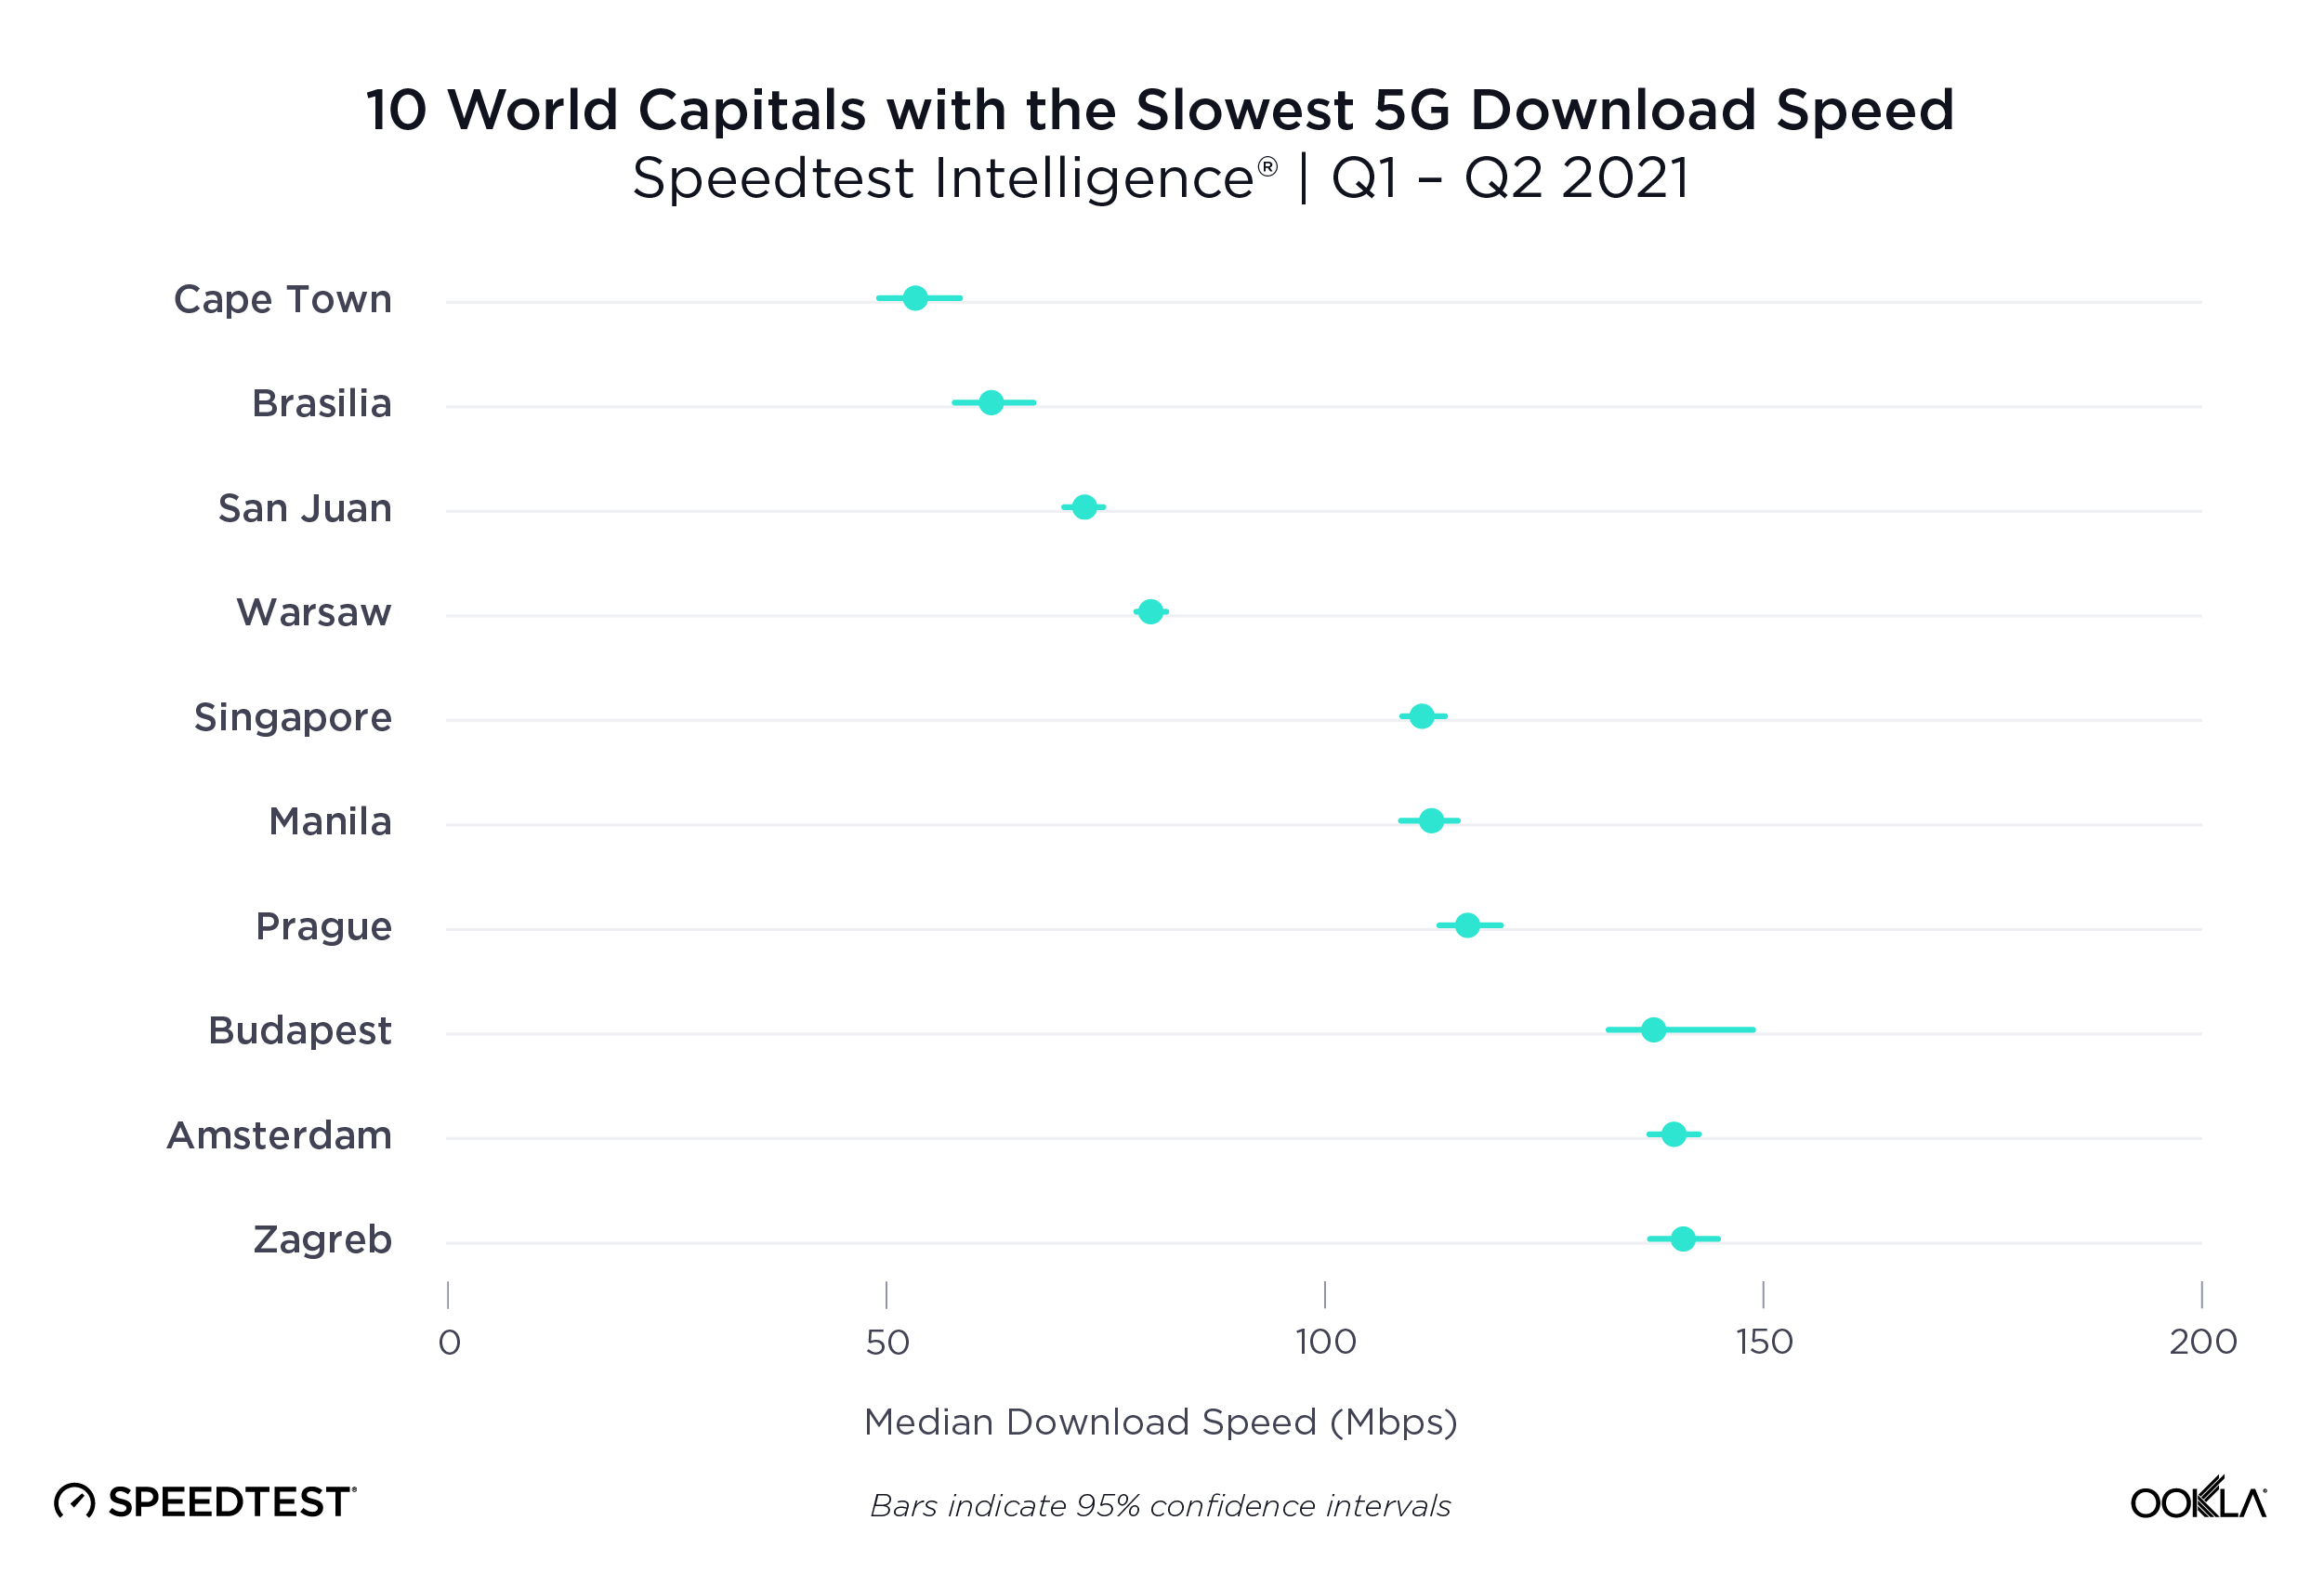
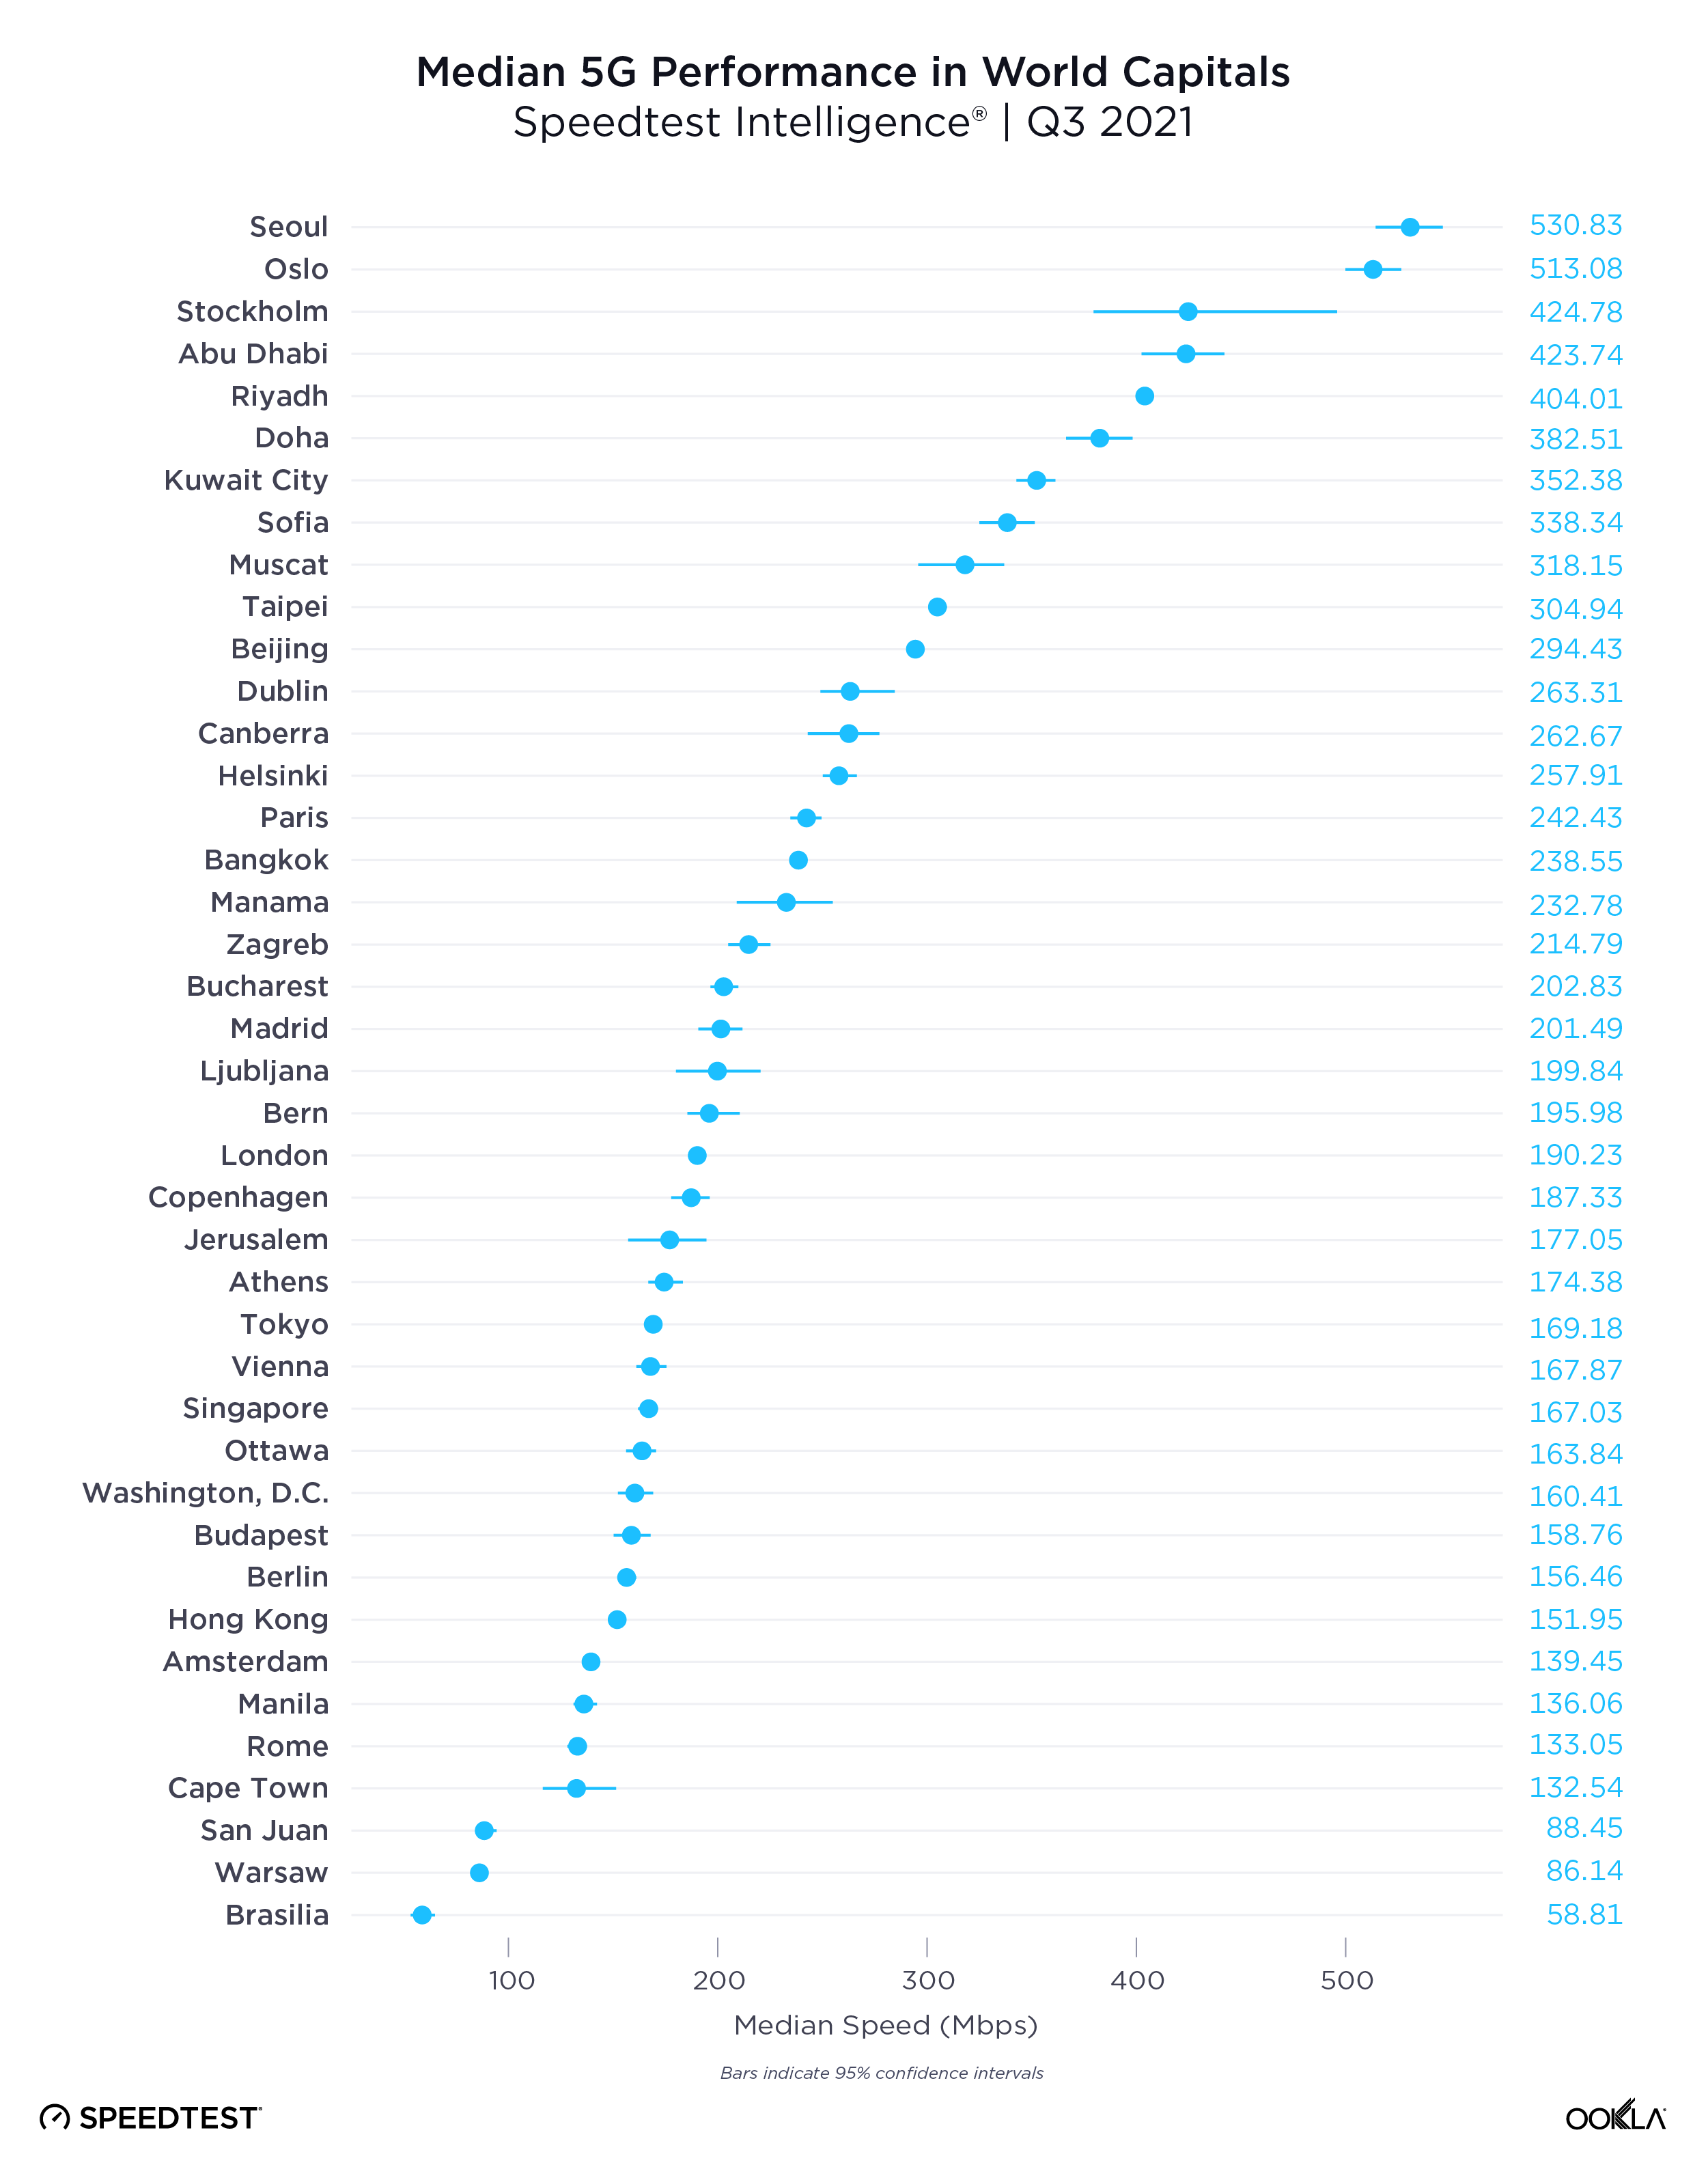
Speedtest Intelligence data from Q3 2021 shows a wide range of median 5G speeds among global capitals. Seoul, South Korea and Oslo, Norway were in the lead with 530.83 Mbps and 513.08 Mbps, respectively; Abu Dhabi, United Arab Emirates; Riyadh, Saudi Arabia and Doha Qatar followed. Brasilia, Brazil had the slowest median download speed over 5G on our list, followed by Warsaw, Poland; Cape Town, South Africa and Rome, Italy. Stockholm, Sweden and Oslo, Norway had some of the the fastest median upload speeds over 5G at 56.26 Mbps and 49.95 Mbps, respectively, while Cape Town had the slowest at 14.53 Mbps.

The U.S. had the highest 5G Availability

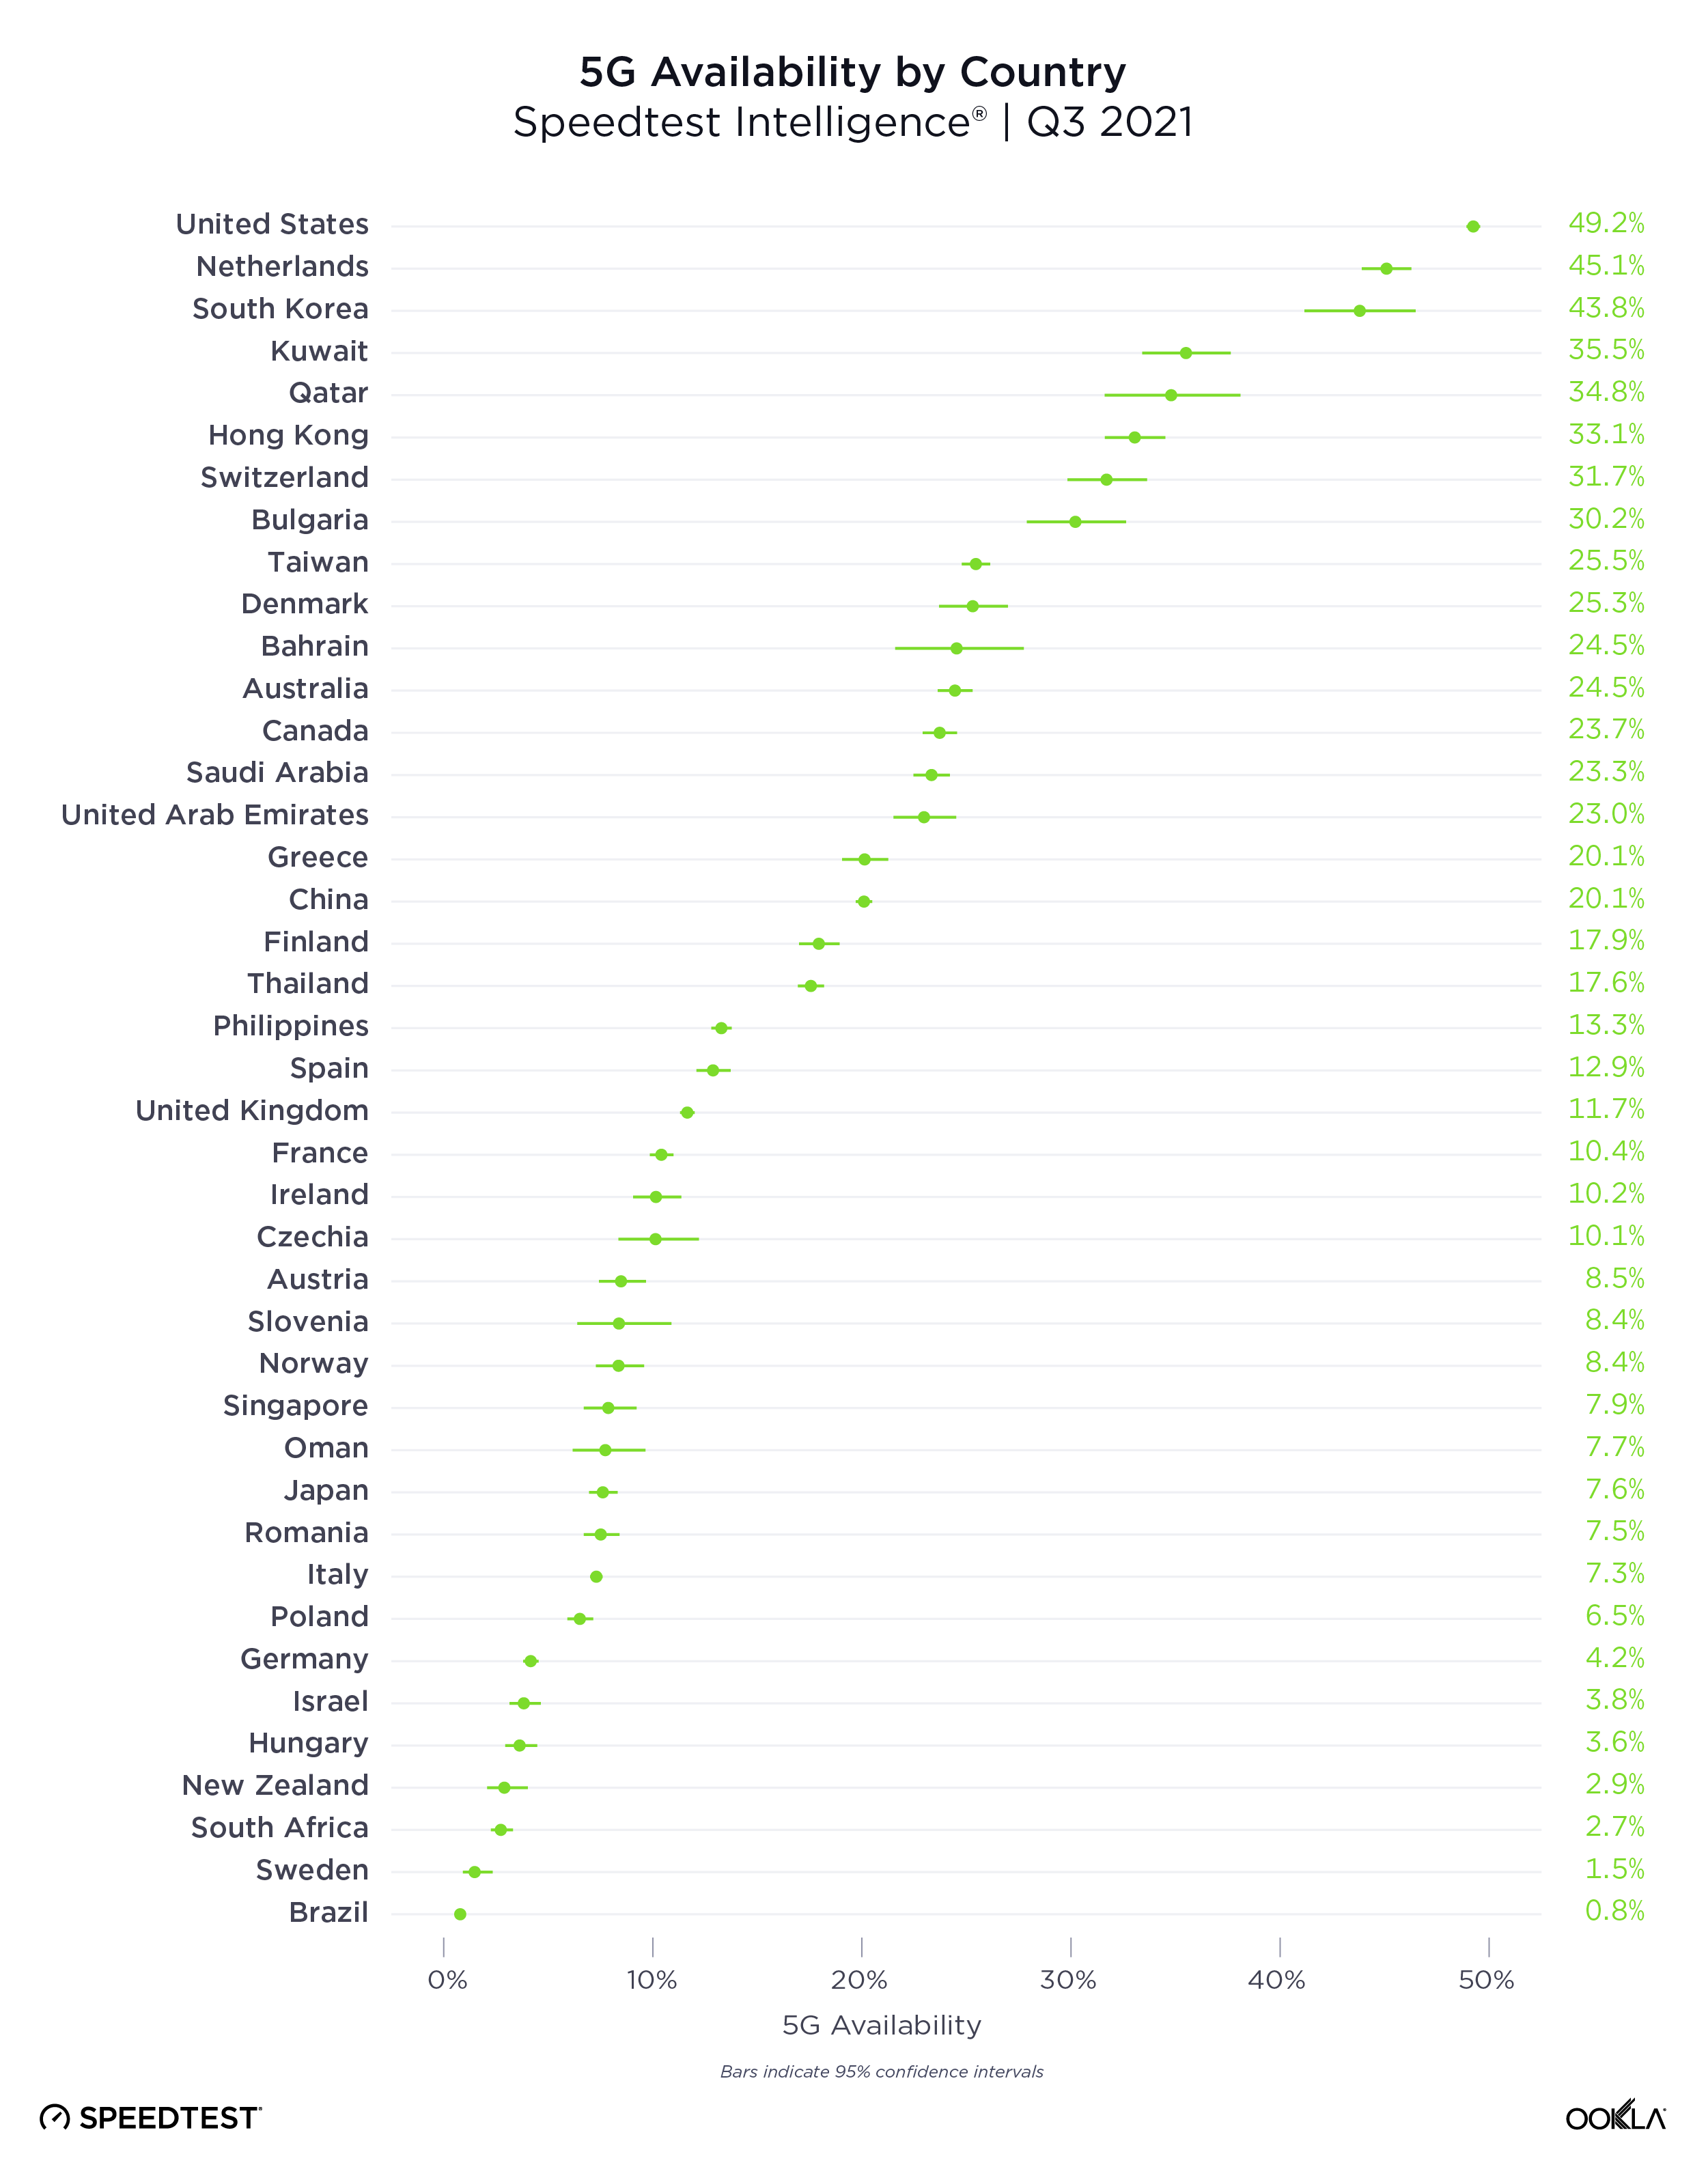
The presence of 5G is only one indicator in a market, because even in markets where 5G has launched, coverage and adoption can be pretty low. We analyzed 5G Availability to see what percent of users on 5G-capable devices spent the majority of their time on 5G, both roaming and on-network during Q3 2021.
ookla_5g-availability_countries_1221-01

The United States had the highest 5G Availability at 49.2%, followed by the Netherlands (45.1%), South Korea (43.8%), Kuwait (35.5%) and Qatar (34.8%). Brazil had the lowest 5G Availability on our list at 0.8%, followed by Sweden (1.5%), South Africa (2.7%), New Zealand (2.9%) and Hungary (3.6%).

Not all 5G networks are created equal

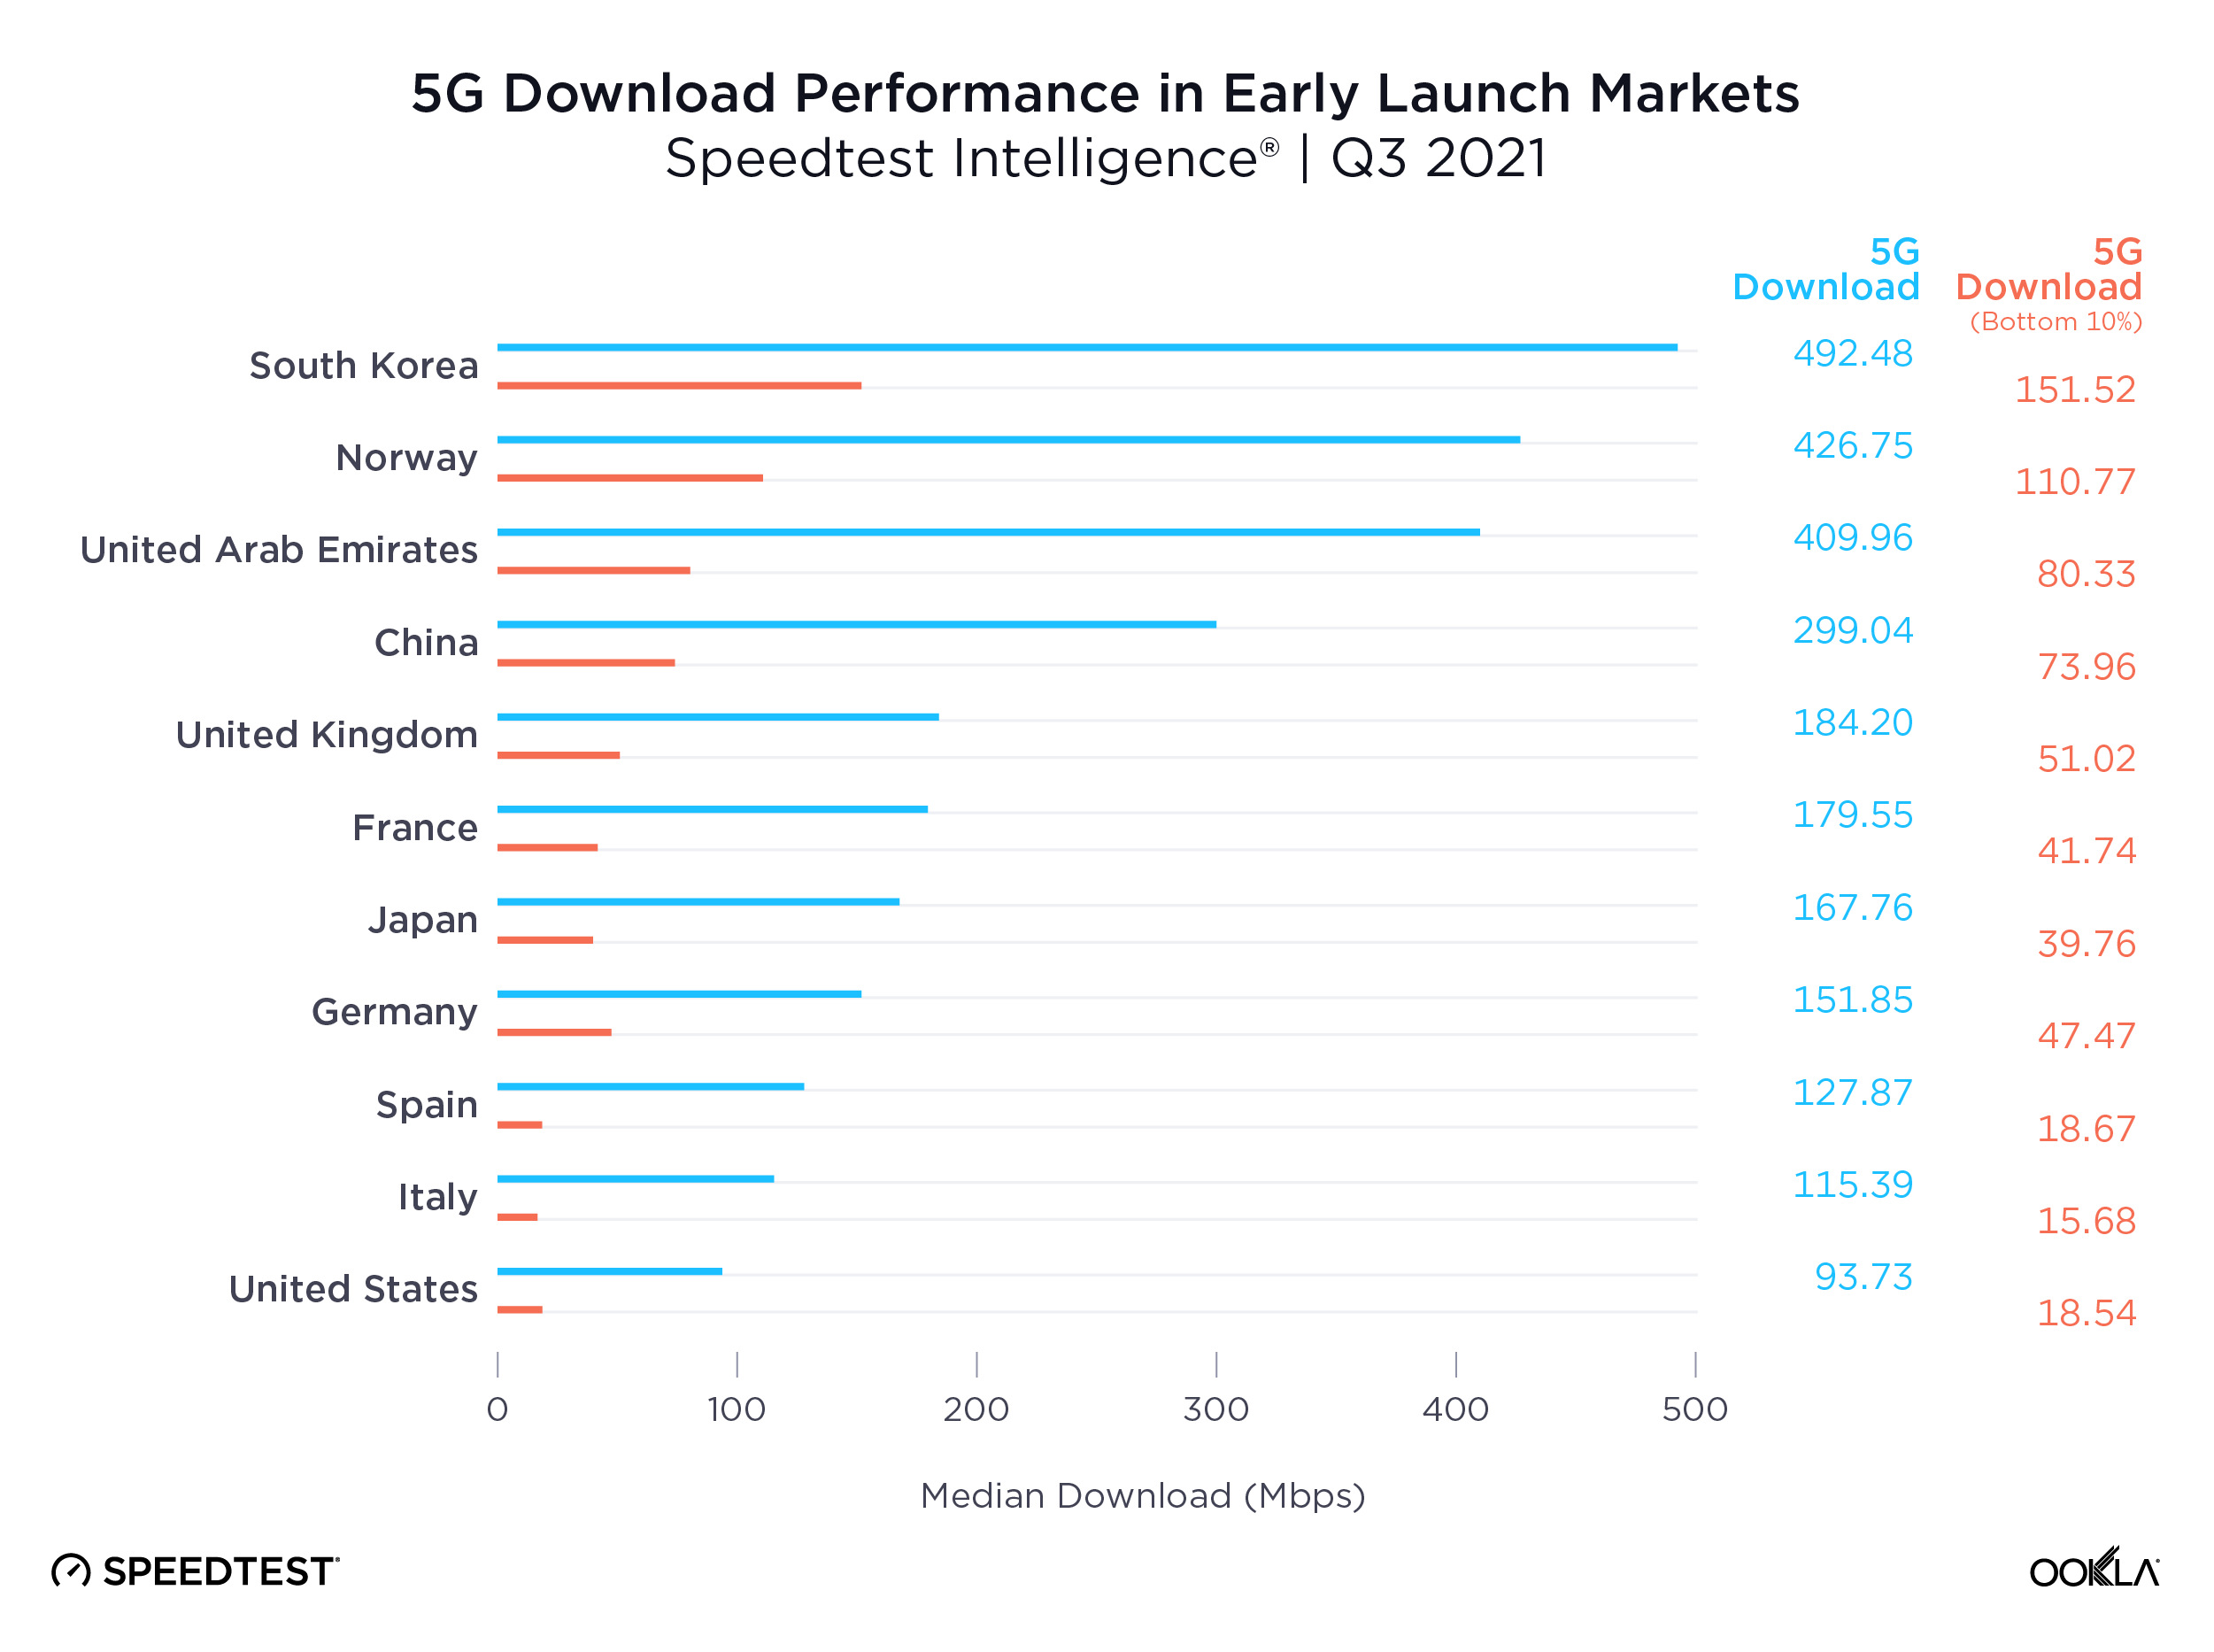
Ookla Speedtest Intelligence data shows a growing disparity in the performance of 5G networks worldwide, even among the pioneer markets who were among the first to launch the new technology. We see leading markets such as South Korea, Norway, the UAE and China pulling well ahead of key European markets, the U.S. and Japan on 5G download speeds, creating what increasingly looks like two tiers of 5G markets.
ookla_5g-download_performance_1221-01

Part of the reason for this divergence is access to key 5G spectrum bands, with Verizon and AT&T in the U.S. for example, soon to deploy their C-band spectrum holdings for 5G use. However, what really seems to separate these markets is the level of 5G network densification. The number of people per 5G base station ranges from 319 in South Korea and 1,531 in China, to 4,224 in the EU and 6,590 in the US, according to the European 5G Observatory’s International Scoreboard during October 2021.

Despite the noise around 6G, 5G still has a long way to run

Median 5G mobile download speeds across these markets are respectable relative to the International Telecommunication Union’s (ITU) IMT-2020 target of 100 Mbps for user experienced download data rates. However, 5G Speedtest® results in each market demonstrate significant variability, with the bottom 10th percentile only recording speeds in excess of the IMT-2020 target in South Korea and Norway, and falling significantly short in many other markets, with Spain, Italy and the U.S. below 20 Mbps.

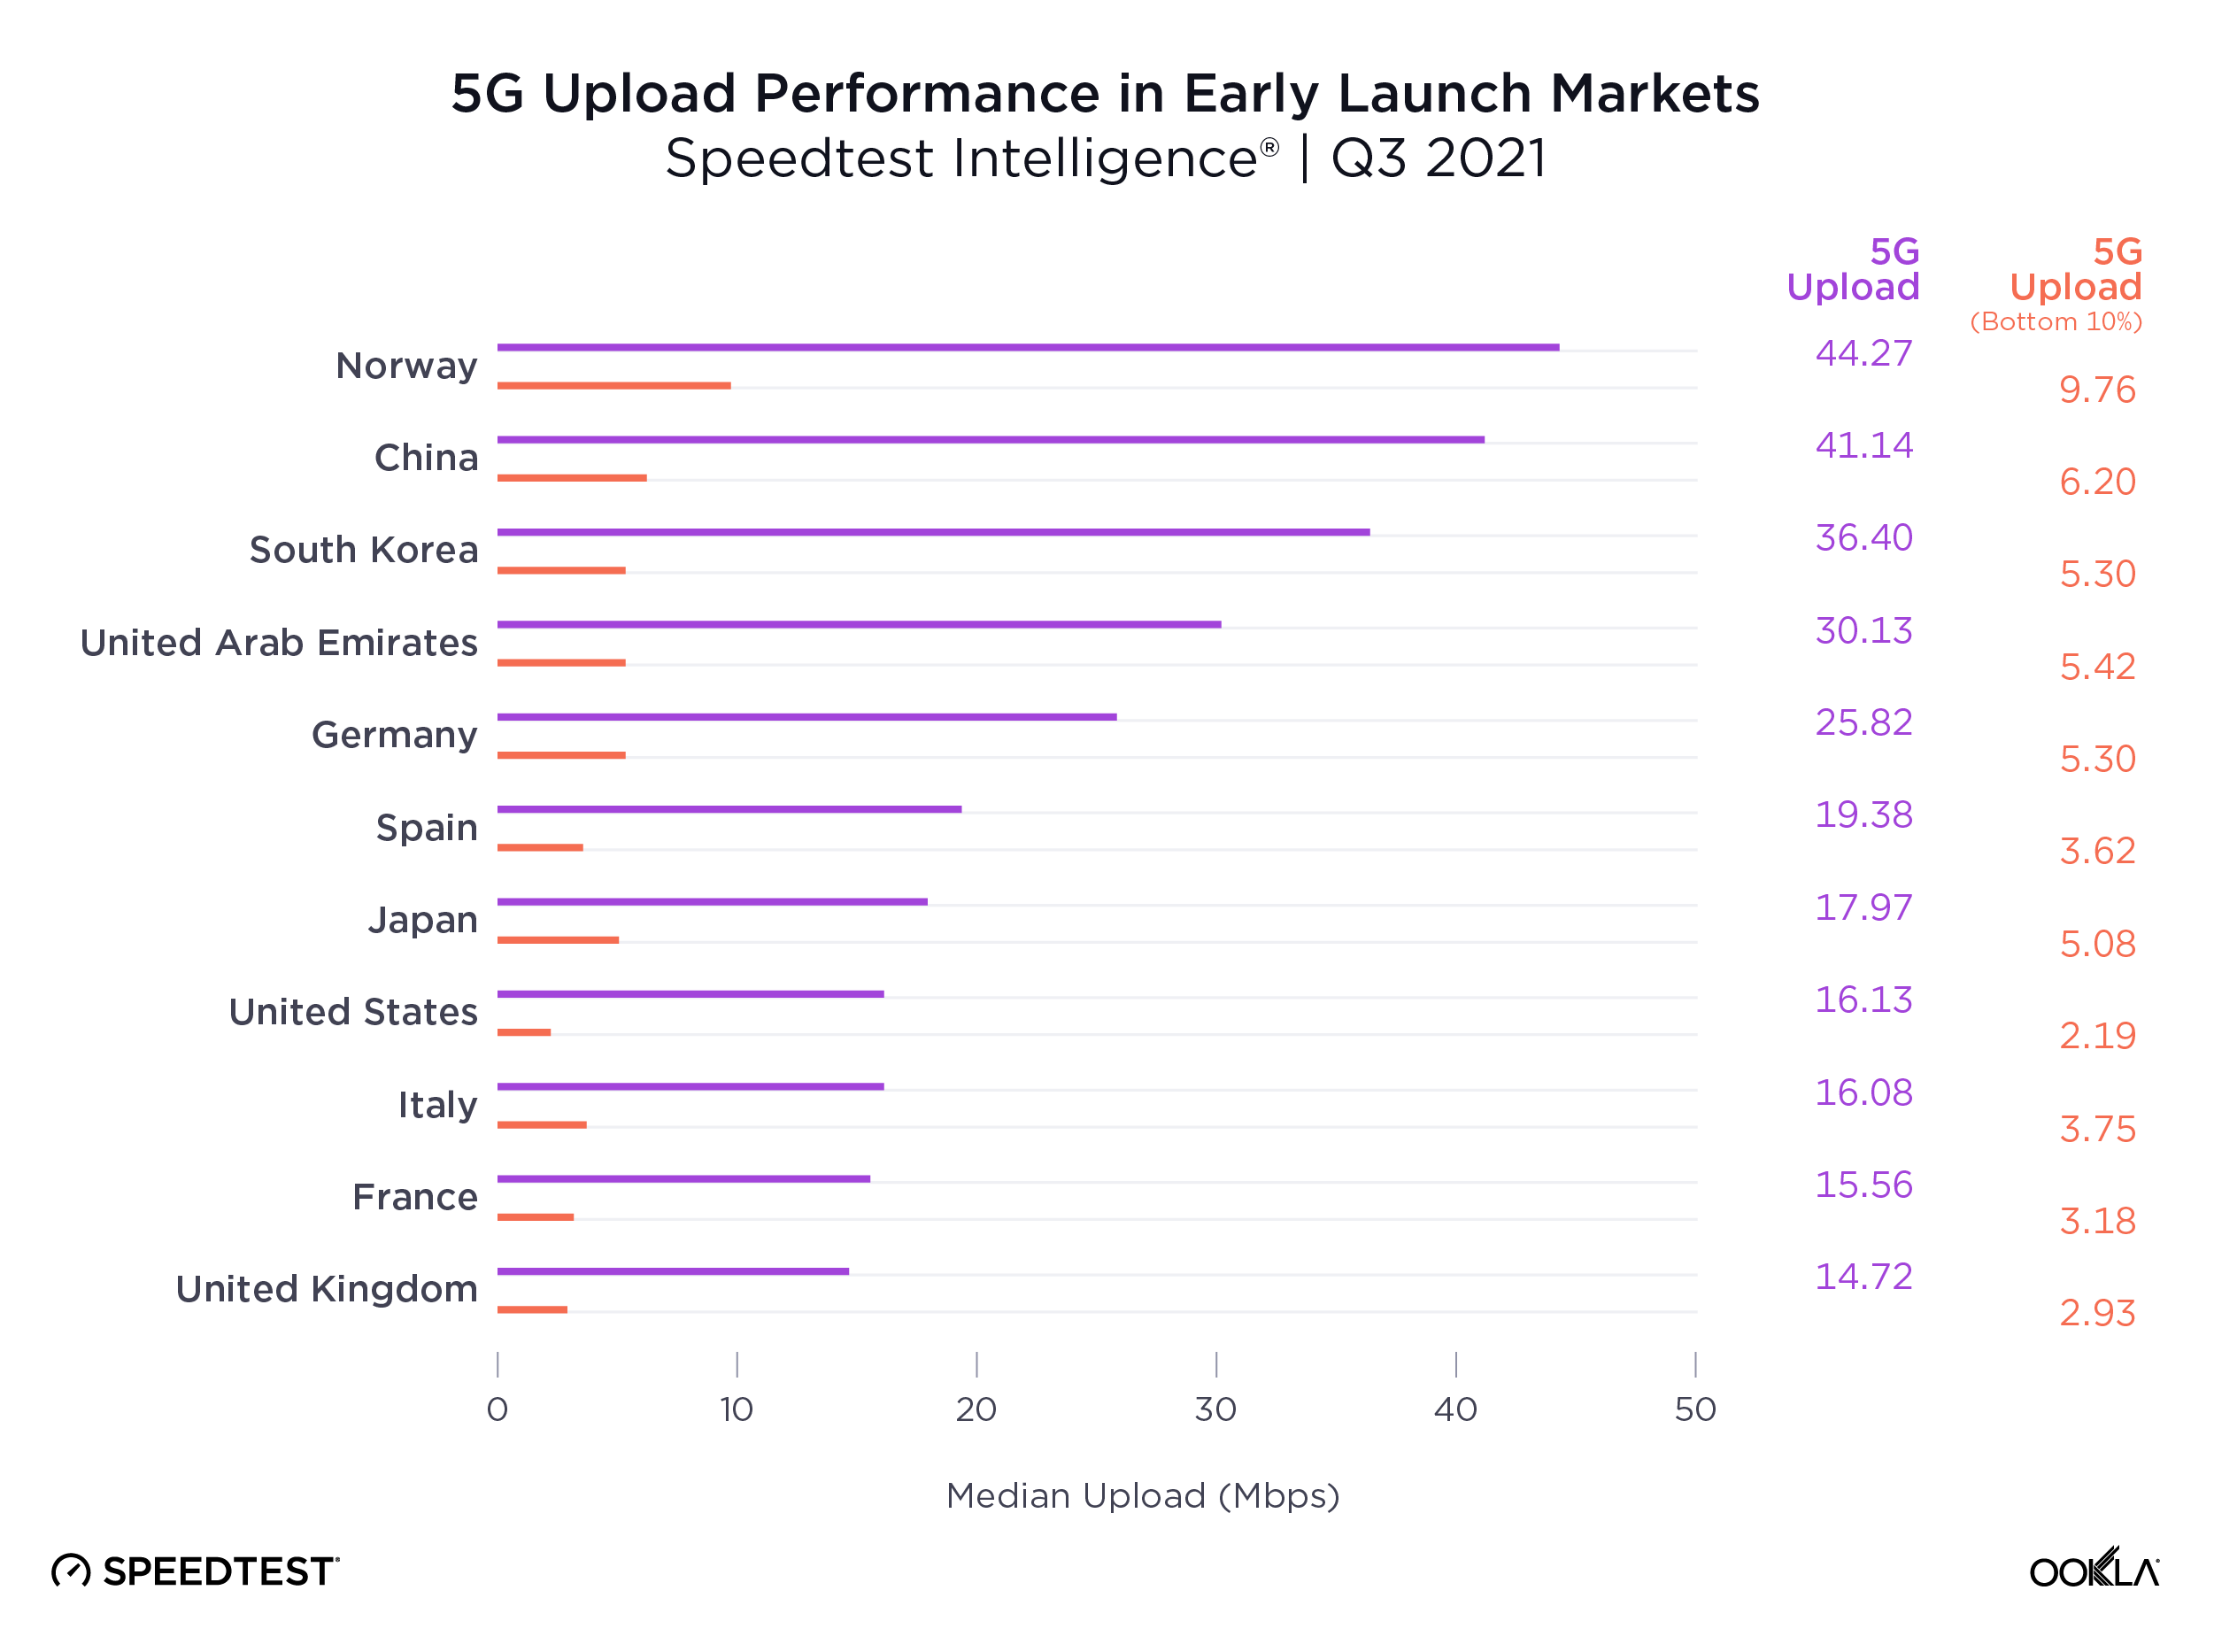
The story gets worse for upload speeds, where no market’s median speed broke the IMT-2020 recommended 50 Mbps, and where the bottom 10th percentile lay in single digits across the board. Operators are clearly prioritizing download speeds over upload, which makes sense given the asymmetric nature of demand, with most consumer applications requiring higher download speeds. However, as operators increasingly look to target the enterprise market with 5G connectivity and consumer demand for services such as video calling and mobile gaming continues to rise, operators will need to boost upload speeds.
ookla_5g-upload_performance_1221-01-1

Demand for mobile internet bandwidth continues to grow, up 43% year-on-year in Q3 2021 according to Ericsson’s latest mobility report. Looking ahead to 2022, operators will need to increase the capacity of their 5G networks to tackle this growing demand while driving network speeds to new heights. We’ve seen the impact the deployment of new spectrum can have on congested networks during 2021, with Reliance Jio witnessing a bump in 4G LTE performance and consumer sentiment following its acquisition of additional spectrum in India.

Where 5G still fails to reach

Speedtest Intelligence showed 70 countries in the world where more than 20% of samples were from 2G and 3G connections (combined) during Q3 2021 and met our statistical threshold to be included. These are mostly countries where 5G is still aspirational for a majority of the population. As excited as we are about the expansion of 5G, we do not want to see these countries left behind. Not only are 2G and 3G decades old, they are only sufficient for basic voice and texting, social media and navigation apps. To deliver rich media experiences or video calling, users need access to 4G or higher. Having so many consumers on 2G and 3G also prevents mobile operators from refarming that spectrum to make 4G and 5G networks more efficient.

Countries That Still Rely Heavily on 2G and 3G Connections
Speedtest IntelligenceⓇ | Q3 2021
Country 2G & 3G Samples
Central African Republic 89.9%
Palestine 84.7%
Yemen 72.4%
Turkmenistan 71.8%
Micronesia 56.3%
Madagascar 55.0%
Belarus 53.2%
Rwanda 51.7%
Kiribati 48.4%
Equatorial Guinea 47.6%
Afghanistan 44.4%
South Sudan 43.4%
Guyana 42.3%
Guinea 37.0%
Angola 36.8%
Cape Verde 35.9%
Tajikistan 35.6%
Zimbabwe 34.7%
Benin 34.4%
Togo 33.8%
Ghana 33.0%
Sierra Leone 31.7%
Antigua and Barbuda 30.2%
Vanuatu 30.1%
Lesotho 30.0%
Syria 29.6%
Moldova 29.4%
Saint Kitts and Nevis 28.9%
Mozambique 28.8%
Sudan 28.4%
Palau 28.3%
Grenada 28.1%
Tanzania 27.6%
Uganda 27.5%
Niger 27.5%
Gabon 27.5%
Haiti 27.4%
Suriname 27.4%
Tonga 27.3%
Liberia 27.0%
Namibia 26.7%
Swaziland 26.5%
The Gambia 26.3%
Saint Vincent and the Grenadines 26.3%
Dominica 26.3%
Somalia 26.1%
Cook Islands 26.0%
Zambia 25.9%
Barbados 25.7%
Armenia 25.5%
Algeria 25.4%
Papua New Guinea 25.2%
Jamaica 24.5%
Venezuela 24.2%
Ethiopia 24.1%
Uzbekistan 24.0%
El Salvador 23.5%
Honduras 23.1%
Nigeria 23.0%
Solomon Islands 22.8%
Caribbean Netherlands 22.7%
Botswana 22.3%
Anguilla 21.7%
Mauritania 20.6%
Saint Lucia 20.5%
Bosnia and Herzegovina 20.3%
Burundi 20.3%
Ecuador 20.2%
Ukraine 20.1%
Trinidad and Tobago 20.0%

We were pleased to see the following countries come off the list from last year, having dropped below the 20% threshold: Azerbaijan, Bangladesh, Belize, Burkina Faso, Cameroon, Costa Rica, Côte d’Ivoire, DR Congo, Iraq, Kenya, Laos, Libya, Maldives, Mali, Mauritius, Mongolia, Nicaragua, Paraguay and Tunisia. While countries like Palestine, Suriname, Ethiopia, Haiti and Antigua and Barbuda are still on this list, they have improved the percentage of their samples on these outmoded technologies when compared to last year (dropping 10-15 points, respectively), 2G and 3G samples in Belarus increased 6.7 points when comparing Q3 2021 to Q3 2020.

We’re excited to see how performance levels will normalize as 5G expands to more and more countries and access improves. Keep track of how well your country is performing on Ookla’s Speedtest Global Index.

Ookla retains ownership of this article including all of the intellectual property rights, data, content graphs and analysis. This article may not be quoted, reproduced, distributed or published for any commercial purpose without prior consent. Members of the press and others using the findings in this article for non-commercial purposes are welcome to publicly share and link to report information with attribution to Ookla.
| May 17, 2023

ISPs Need to Do More to Improve Wi-Fi Performance in the Home

Key messages

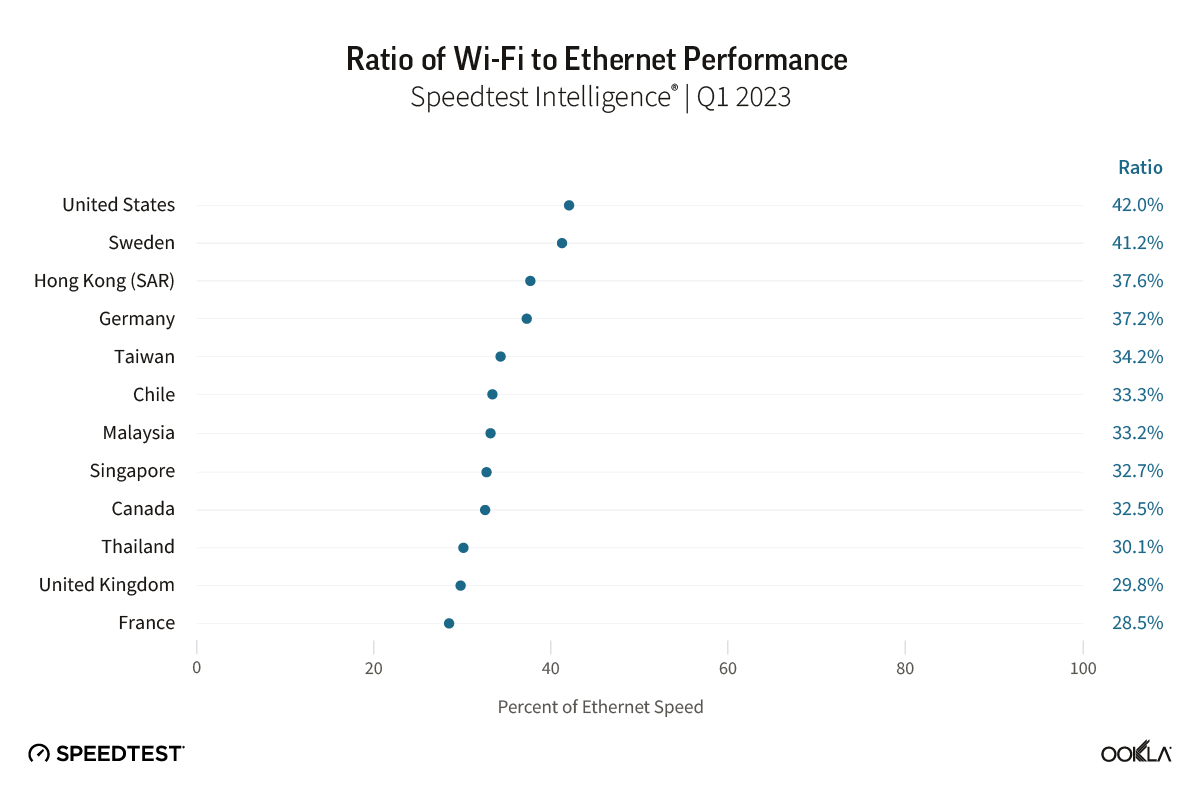
  • Wi-Fi woes continue. Ookla® Speedtest Intelligence® data shows Wi-Fi performance continues to lag behind ethernet performance within home networks in many advanced fixed broadband markets, with Wi-Fi speeds typically ranging from between 30-40% of ethernet speeds during Q1 2023.
  • Developed Asian and North American markets lead the charge to Wi-Fi 6/6E. Wi-Fi 4 and 5 remain the dominant Wi-Fi access technologies globally, accounting for a combined 89% of Speedtest® samples during Q1 2023. However, a number of advanced fixed broadband markets are rapidly migrating to Wi-Fi 6 and 6E, with China, Hong Kong (SAR), Singapore, Canada, and the U.S. leading the charge.
  • Growing Wi-Fi 6/6E adoption helps narrow the gap in Wi-Fi performance. In markets such as Canada, France, Germany, Singapore, Sweden, and the U.S., where the transition to fiber is more advanced, and where ISPs are actively driving adoption of Wi-Fi 6/6E routers, we see Wi-Fi performance closing the gap to ethernet. However, more needs to be done in other markets, where migration to more advanced fixed access networks is exposing the limitations of the installed base of Wi-Fi routers.
  • Router vendors pushing the envelope with Wi-Fi 7 capable launches. ASUS leads the market for Wi-Fi 6/6E routers among Speedtest samples, and both ASUS and other leading router vendors have been quick to launch Wi-Fi 7 capable routers. Despite this, Wi-Fi 6 and 6E remain the growing component of their installed bases. ASUS leads the market according to Speedtest Intelligence with 39% of its routers we sampled supporting Wi-Fi 6/6E during Q1 2023, well ahead of second placed NETGEAR with 26%.
  • Smartphone device support indicates Wi-Fi 6/6E should remain the immediate focus for ISPs. With the two largest smartphone vendors globally, Samsung and Apple, currently shunning Wi-Fi 7, ISPs waiting to see if they can leapfrog Wi-Fi 6E to Wi-Fi 7 should stay their hands. The fact that China still needs to allocate the 6 GHz spectrum band — key for Wi-Fi 6E and 7 — for unlicensed use is also significant, and appears to have weighed on the Wi-Fi 6E adoption among China’s leading Android smartphone manufacturers.

Wi-Fi performance continues to lag ethernet within the home

ISPs in advanced fixed broadband markets are increasingly looking to offer more advanced Wi-Fi routers and solutions such as mesh networks, which are designed to improve Wi-Fi coverage and performance. However, Speedtest Intelligence data shows that more needs to be done to improve Wi-Fi performance, which typically ranged from between 30-40% of ethernet speeds. Median Wi-Fi performance as measured by Speedtest will tend to lag behind median ethernet performance, depending on distance of the end-user device from the router, including any obstacles and signal interference the Wi-Fi signal needs to traverse to reach the device.

Chart of Ratio of Wi-Fi to Ethernet Performance

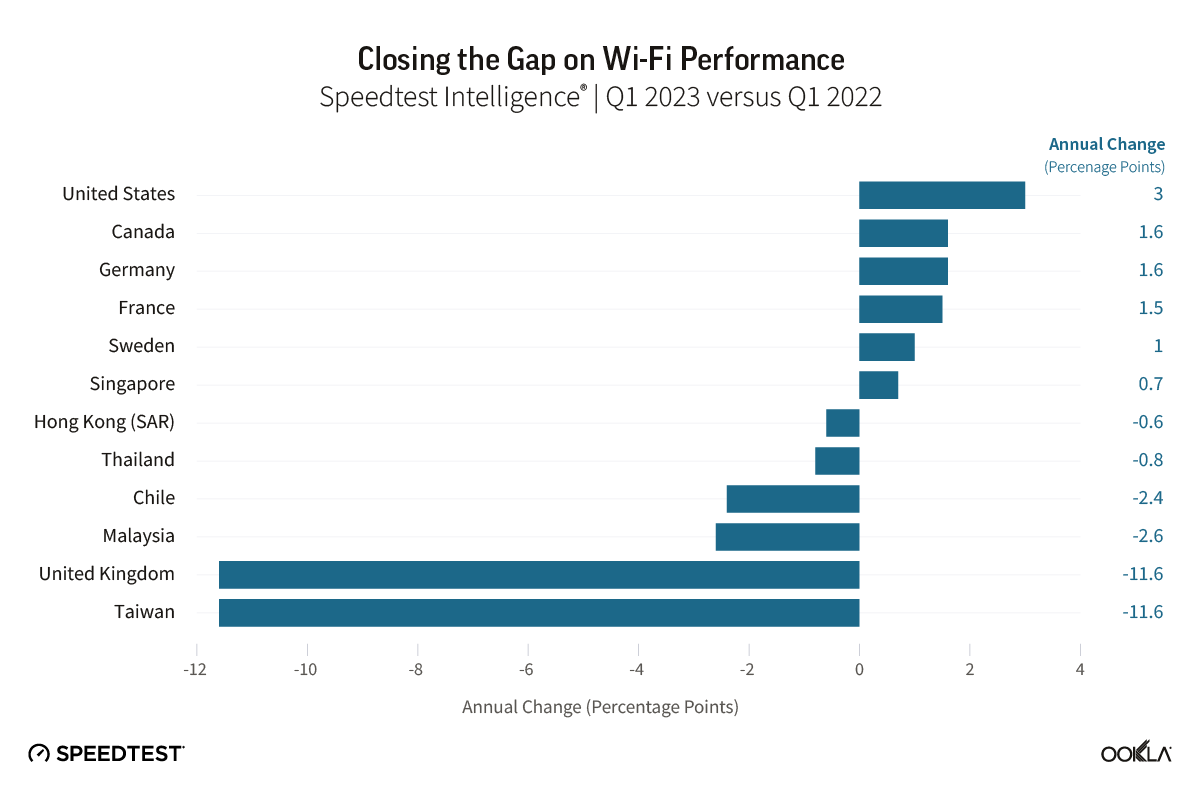
Our analysis of Speedtest Intelligence data reveals that driving greater adoption of more advanced Wi-Fi routers can help ISPs narrow the gap between Wi-Fi and ethernet performance, with ISPs in Canada, France, Germany, Singapore, Sweden, and the U.S. already successfully doing so over the past year.

Chart of Closing the Gap on Wi-Fi Performance

Despite this, the results are not always positive, with the gap between Wi-Fi and ethernet performance widening, in particular in the U.K. and Taiwan. Where markets are rapidly migrating from more legacy fixed broadband technology to advanced cable and fiber connections, Wi-Fi performance can lag relative to ethernet, indicating a need to accelerate the adoption of more advanced Wi-Fi technologies.

Older generations of Wi-Fi 4 and Wi-Fi 5 remain dominant globally

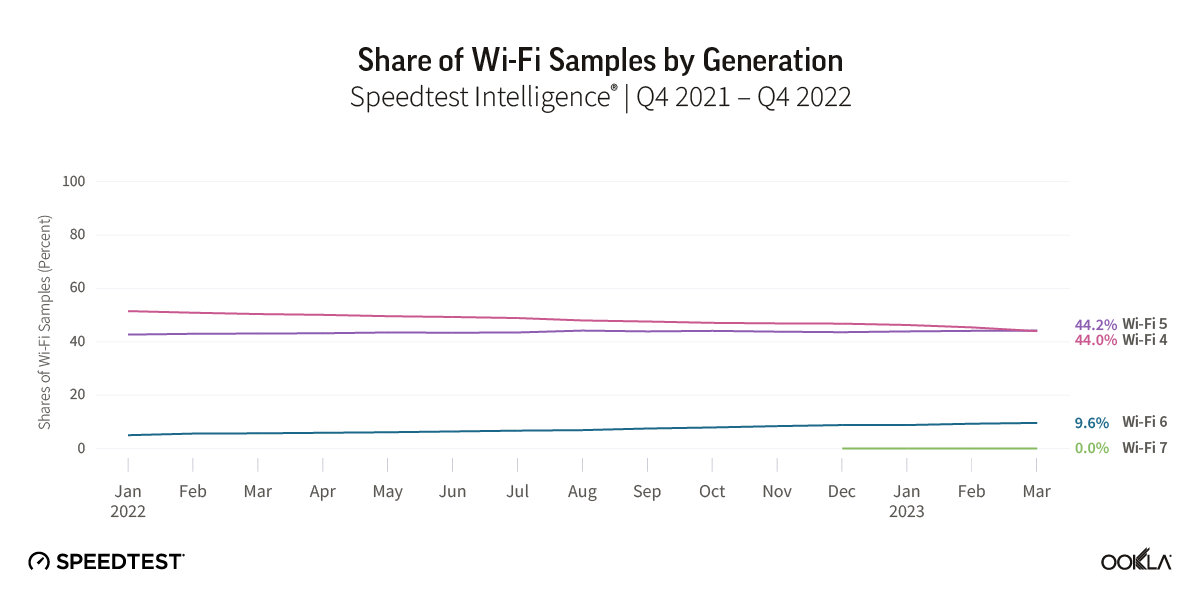
While much of the focus of the device ecosystem is on spurring adoption of the latest Wi-Fi standards, there is a long way to go before even Wi-Fi 6 becomes a dominant standard globally. Based on Speedtest Intelligence data, the proportion of Wi-Fi tests by generation (a good proxy for adoption) shows that Wi-Fi 4 and Wi-Fi 5 remain the dominant router technology, with Wi-Fi 6 representing just under 10% as of February 2023, and Wi-Fi 7 showing very few samples. The share of samples from Wi-Fi 4 routers has fallen by 6 ppts year-over-year, while Wi-Fi 5’s share of samples has marginally increased.

Chart of Share of wi-Fi Samples by Generation

Asian and North American ISPs lead the charge to Wi-Fi 6 and beyond

ISPs are the main driver behind the adoption of new Wi-Fi standards, as highlighted by a 2022 study by Parks Associates, which found that 52% of U.S. consumers acquired their router from their ISP. Rolling out more advanced routers to their customer bases enables them to take advantage of the increased performance of newer generations of Wi-Fi technology, and helps to ensure ISPs deliver faster speeds, particularly over fiber access networks.

Adoption of Wi-Fi 6 varies by market, even among the most developed fixed broadband markets globally. ISPs in a number of advanced fixed markets have already begun offering Wi-Fi 6E routers to their customer bases, with ISPs in North America in particular moving in this direction, including Bell Canada, Rogers, Telus, Verizon, XFINITY, Charter, and Frontier, as well as leading ISPs in advanced Asian and European markets.

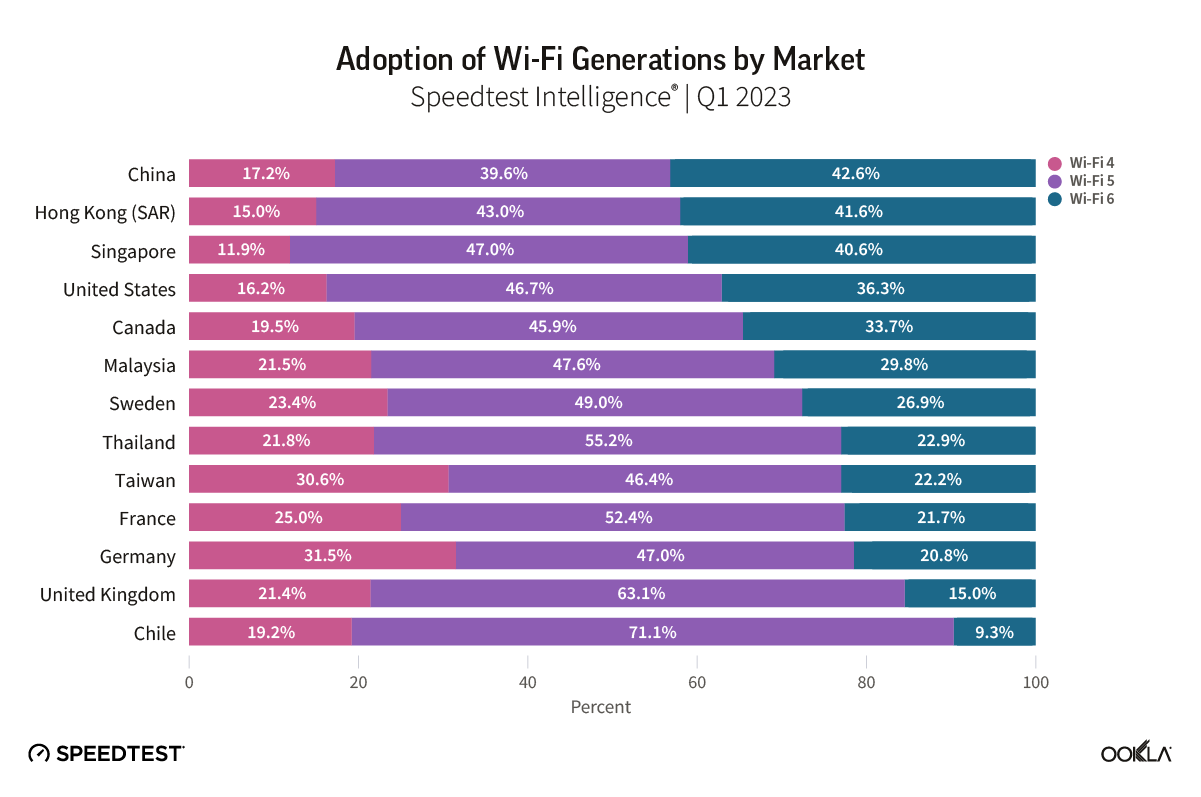
Markets in Asia led the way on Wi-Fi 6 adoption, with China and Hong Kong both recording 42% adoption, followed by Singapore with 37%. Outside of Asia, North America showed the next highest level of adoption, with the U.S. and Canada recording 32% and 30%, respectively. European fixed markets lagged behind, with adoption ranging from 13% in the U.K., to 24% in Sweden. For markets such as Chile, which placed towards the top of the Ookla Speedtest Global Index™ for median fixed broadband speeds, a relatively low-level of Wi-Fi 6 adoption (8% in Q4 2022) signals further opportunity for ISPs in the market to boost performance.

Chart of Adoption of Wi-Fi Generations by Market

The fastest growing markets, in terms of increasing share of Wi-Fi 6 of Speedtest samples year-over-year in Q1 2023, were Canada and Malaysia (+15 ppts), Singapore (+14 ppts), and Hong Kong (+12 ppts). While there was considerable variance between ISPs within each market, leading ISPs such as SmarTone (Hong Kong), DiGi (Malaysia), and ViewQwest (Singapore), are prompting a competitive response so that even ISPs with lower levels of Wi-Fi 6 adoption are prioritizing the technology and seeing adoption grow steadily.

CountryISPWi-Fi 6 %, Q1 2023
Hong Kong (SAR)SmarTone62.4%
CanadaBell pure fibre57.3%
SingaporeViewQwest53.7%
SingaporeMyRepublic50.3%
MalaysiaDigi50.2%
MalaysiaMaxis49.0%
Hong Kong (SAR)NETVIGATOR44.2%
CanadaRogers43.4%
SingaporeM141.7%
SingaporeSingTel41.4%
CanadaTelus PureFibre41.0%
Hong Kong (SAR)HKBN41.0%
CanadaShaw39.0%
SingaporeStarHub35.6%
Hong Kong (SAR)HGC30.0%
MalaysiaTIME28.8%
MalaysiaTM21.5%

In addition to providing newer routers, ISPs are increasingly positioned to help consumers solve Wi-Fi performance issues in the home, such as offering mesh Wi-Fi solutions. For some ISPs, this has even taken precedence over offering newer Wi-Fi 6E routers, as they look to improved coverage within the home as a faster route to improving Wi-Fi performance. 

In the U.K., BT has prioritized whole-home coverage over Wi-Fi 6E with its BT Complete Wi-Fi (mesh) offer, despite the U.K. regulator Ofcom having released the lower portion of the 6 GHz band for unlicensed use in 2020. In Canada, Telus, while having recently released a Wi-Fi 6E router for its broadband users, also offers its WiFi Plus package, which includes professional installation and “wall-to-wall coverage” throughout the home. Rogers also offers guaranteed Wi-Fi coverage throughout the home, as well as Wi-Fi 6E routers. Plume offers a subscription-based service, HomePass, across a number of markets, which allows users to add additional access points to help eradicate not-spots or poor Wi-Fi signal within the home and also offers solutions for ISPs looking to improve their Wi-Fi offerings. In Hong Kong, China Mobile Hong Kong (CMHK) was the first ISP in the market to offer a fiber-to-the-room service, while it and other ISPs such as NETVIGATOR offer consumers the option to subscribe to multiple channels over fiber with separate IP addresses, allowing them to divide their activities across channels and thereby help avoid congestion.

To capture the full performance benefits of Wi-Fi 6E and Wi-Fi 7, countries must allocate 6 GHz spectrum for unlicensed use, therefore allowing Wi-Fi devices to access this higher frequency, higher capacity spectrum, and utilize wider channels. At present, according to the Wi-Fi Alliance, allocation of the lower portion of the 6 GHz spectrum band (5,925 MHz to 6,425 MHz) is common among developed economies, with some notable exceptions in some developed markets in Asia and Asia Pacific, in particular China, while allocation of the full 6 GHz band is more limited, available across North America and some Latin American markets, as well as Saudi Arabia and South Korea.

Wi-Fi 7 on the horizon as router vendors continue to push the envelope on performance

Wi-Fi performance continues to scale, and with Wi-Fi 7 routers and smartphones having launched in the second half of 2022, that trend is set to continue. In addition to higher throughput, successive Wi-Fi generations also support lower latency, helping to better support higher quality video streaming, cloud gaming, and future use cases linked to concepts such as the Metaverse and other uses of extended reality (XR).

The major silicon vendors, Broadcom, Qualcomm, and Mediatek, were quick to update their solutions to support the emerging Wi-Fi 7 standard, and hardware vendors have followed suit. Chinese vendor H3C was the first to launch with its H3C Magic BE18000 Wi-Fi 7 router in July 2022, and it has since been followed by other major vendors including tp-link, ASUS, and more recently NETGEAR. However, the prices of early Wi-Fi 7 routers that take advantage of Wi-Fi 7’s range of enhanced performance capabilities will be a barrier to entry for many, with tp-link’s flagship Archer BE900 currently retailing at a cost of $699.99. 

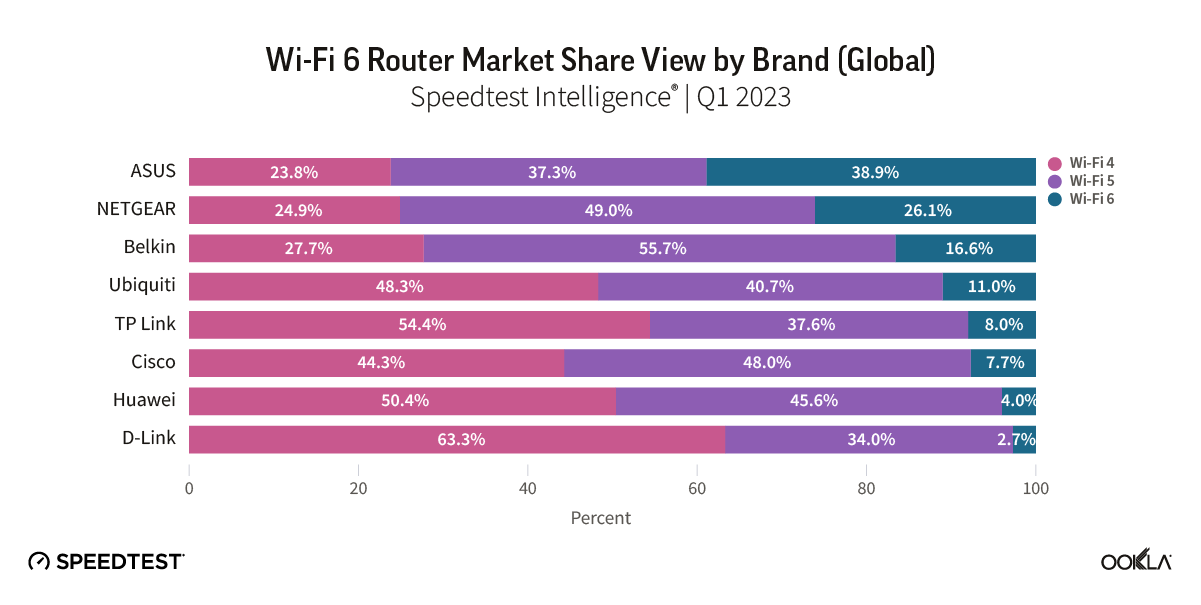
Speedtest Intelligence data shows minimal Wi-Fi 7 adoption as of March 2023, however we are likely to see the same vendors drive Wi-Fi 7 adoption that are currently leading on Wi-Fi 6. Based on global Speedtest Intelligence samples, we see ASUS leading the market in Wi-Fi 6 penetration, with 39% of samples recorded using Wi-Fi 6 compatible routers. NETGEAR and Belkin followed, but for the remaining major router vendors, Wi-Fi 6 penetration currently stands at close to 10% or below. Wi-Fi 6E remains a small but growing subset of Wi-Fi 6 certified devices, currently standing at 7.7% of products based on the latest Wi-Fi Alliance data. Of these, a majority are either routers or smartphones, with an almost even split between the two.

Chart of Wi-Fi 6 Router Market Share view by Brand (Global)

Smartphone support indicates ISPs should focus on Wi-Fi 6E for now

With Samsung releasing its Galaxy S23 range in February 2023 without Wi-Fi 7 support, and Apple’s latest iPhone 14 smartphones limited to Wi-Fi 6, it’s clear that, for now, ISPs should prioritize the rollout of Wi-Fi 6/6E among their customer bases rather than consider leapfrogging to Wi-Fi 7. The Xiaomi Mi13 Pro was the first Wi-Fi 7 capable smartphone to hit the market, launching in December 2022, although it was limited to Wi-Fi 6E initially, requiring a software update to enable Wi-Fi 7. The availability of Wi-Fi 7 supporting Android smartphones will grow through 2023, enabled by SoCs from leading vendor Qualcomm with its flagship Snapdragon 8 Gen 2, and MediaTek with its Dimensity 9200. Apple, on the other hand, lags on the latest Wi-Fi standard support, with the iPhone 14 series featuring Wi-Fi 6, and with its fall 2023 models rumored to be adding Wi-Fi 6E to their feature list.

Chart of Android Smartphone Vendor Installed Base, by Wi-Fi Standard, Global

Samsung, as the leading Android smartphone vendor globally, has the largest installed base of smartphones supporting Wi-Fi 6 and Wi-Fi 6E, and has stolen a march on its main rivals Xiaomi, OPPO, and Vivo. While the major Chinese smartphone vendors have launched Wi-Fi 7 compatible devices, the lack of assignment of 6 GHz spectrum for unlicensed use in China does appear to have held them back relative to brands such as Samsung and ASUS.

The outlook for Wi-Fi in the home

It’s clear from the gap between Wi-Fi and ethernet performance that ISPs need to do more to improve the customer experience for Wi-Fi users within the home. Part of the solution lies in rolling out more advanced generations of Wi-Fi technology, given Wi-Fi 4 and 5 remain the dominant technologies deployed globally. However, evidence linking increased adoption of Wi-Fi 6 to overall Wi-Fi closing the gap to ethernet performance is mixed, and validates the approach of ISPs looking to also offer mesh networking Wi-Fi solutions. Contact us to find out more about how Ookla Research can help you monitor the performance of your networks, and stay ahead of the competition.

Ookla retains ownership of this article including all of the intellectual property rights, data, content graphs and analysis. This article may not be quoted, reproduced, distributed or published for any commercial purpose without prior consent. Members of the press and others using the findings in this article for non-commercial purposes are welcome to publicly share and link to report information with attribution to Ookla.
| July 24, 2023

5G in Asia Pacific: Deployment Momentum Continues

The Asia Pacific region has successfully implemented 5G technology despite the challenges posed by the pandemic, global economy, and geopolitical climate. South Korea, China, and Japan have led the way in 5G network deployment. With the continued rollout of 5G networks in other regional markets, Asia Pacific is on track to become the largest 5G market globally.

Key messages

  • Advanced Asia Pacific markets have taken the lead in the 5G rollout. Countries such as South Korea, Australia, and China, were among the first in the world to launch commercial 5G networks as more markets joined the ranks.
  • 5G performance outranks Europe. Early adopters in the Asia Pacific region have outperformed major European markets in terms of 5G performance. This is mainly due to factors like early spectrum availability and supportive government policies. 
  • 5G Availability varies. The region experiences varying levels of 5G Availability and adoption due to factors like population density, device affordability, and tariffs.
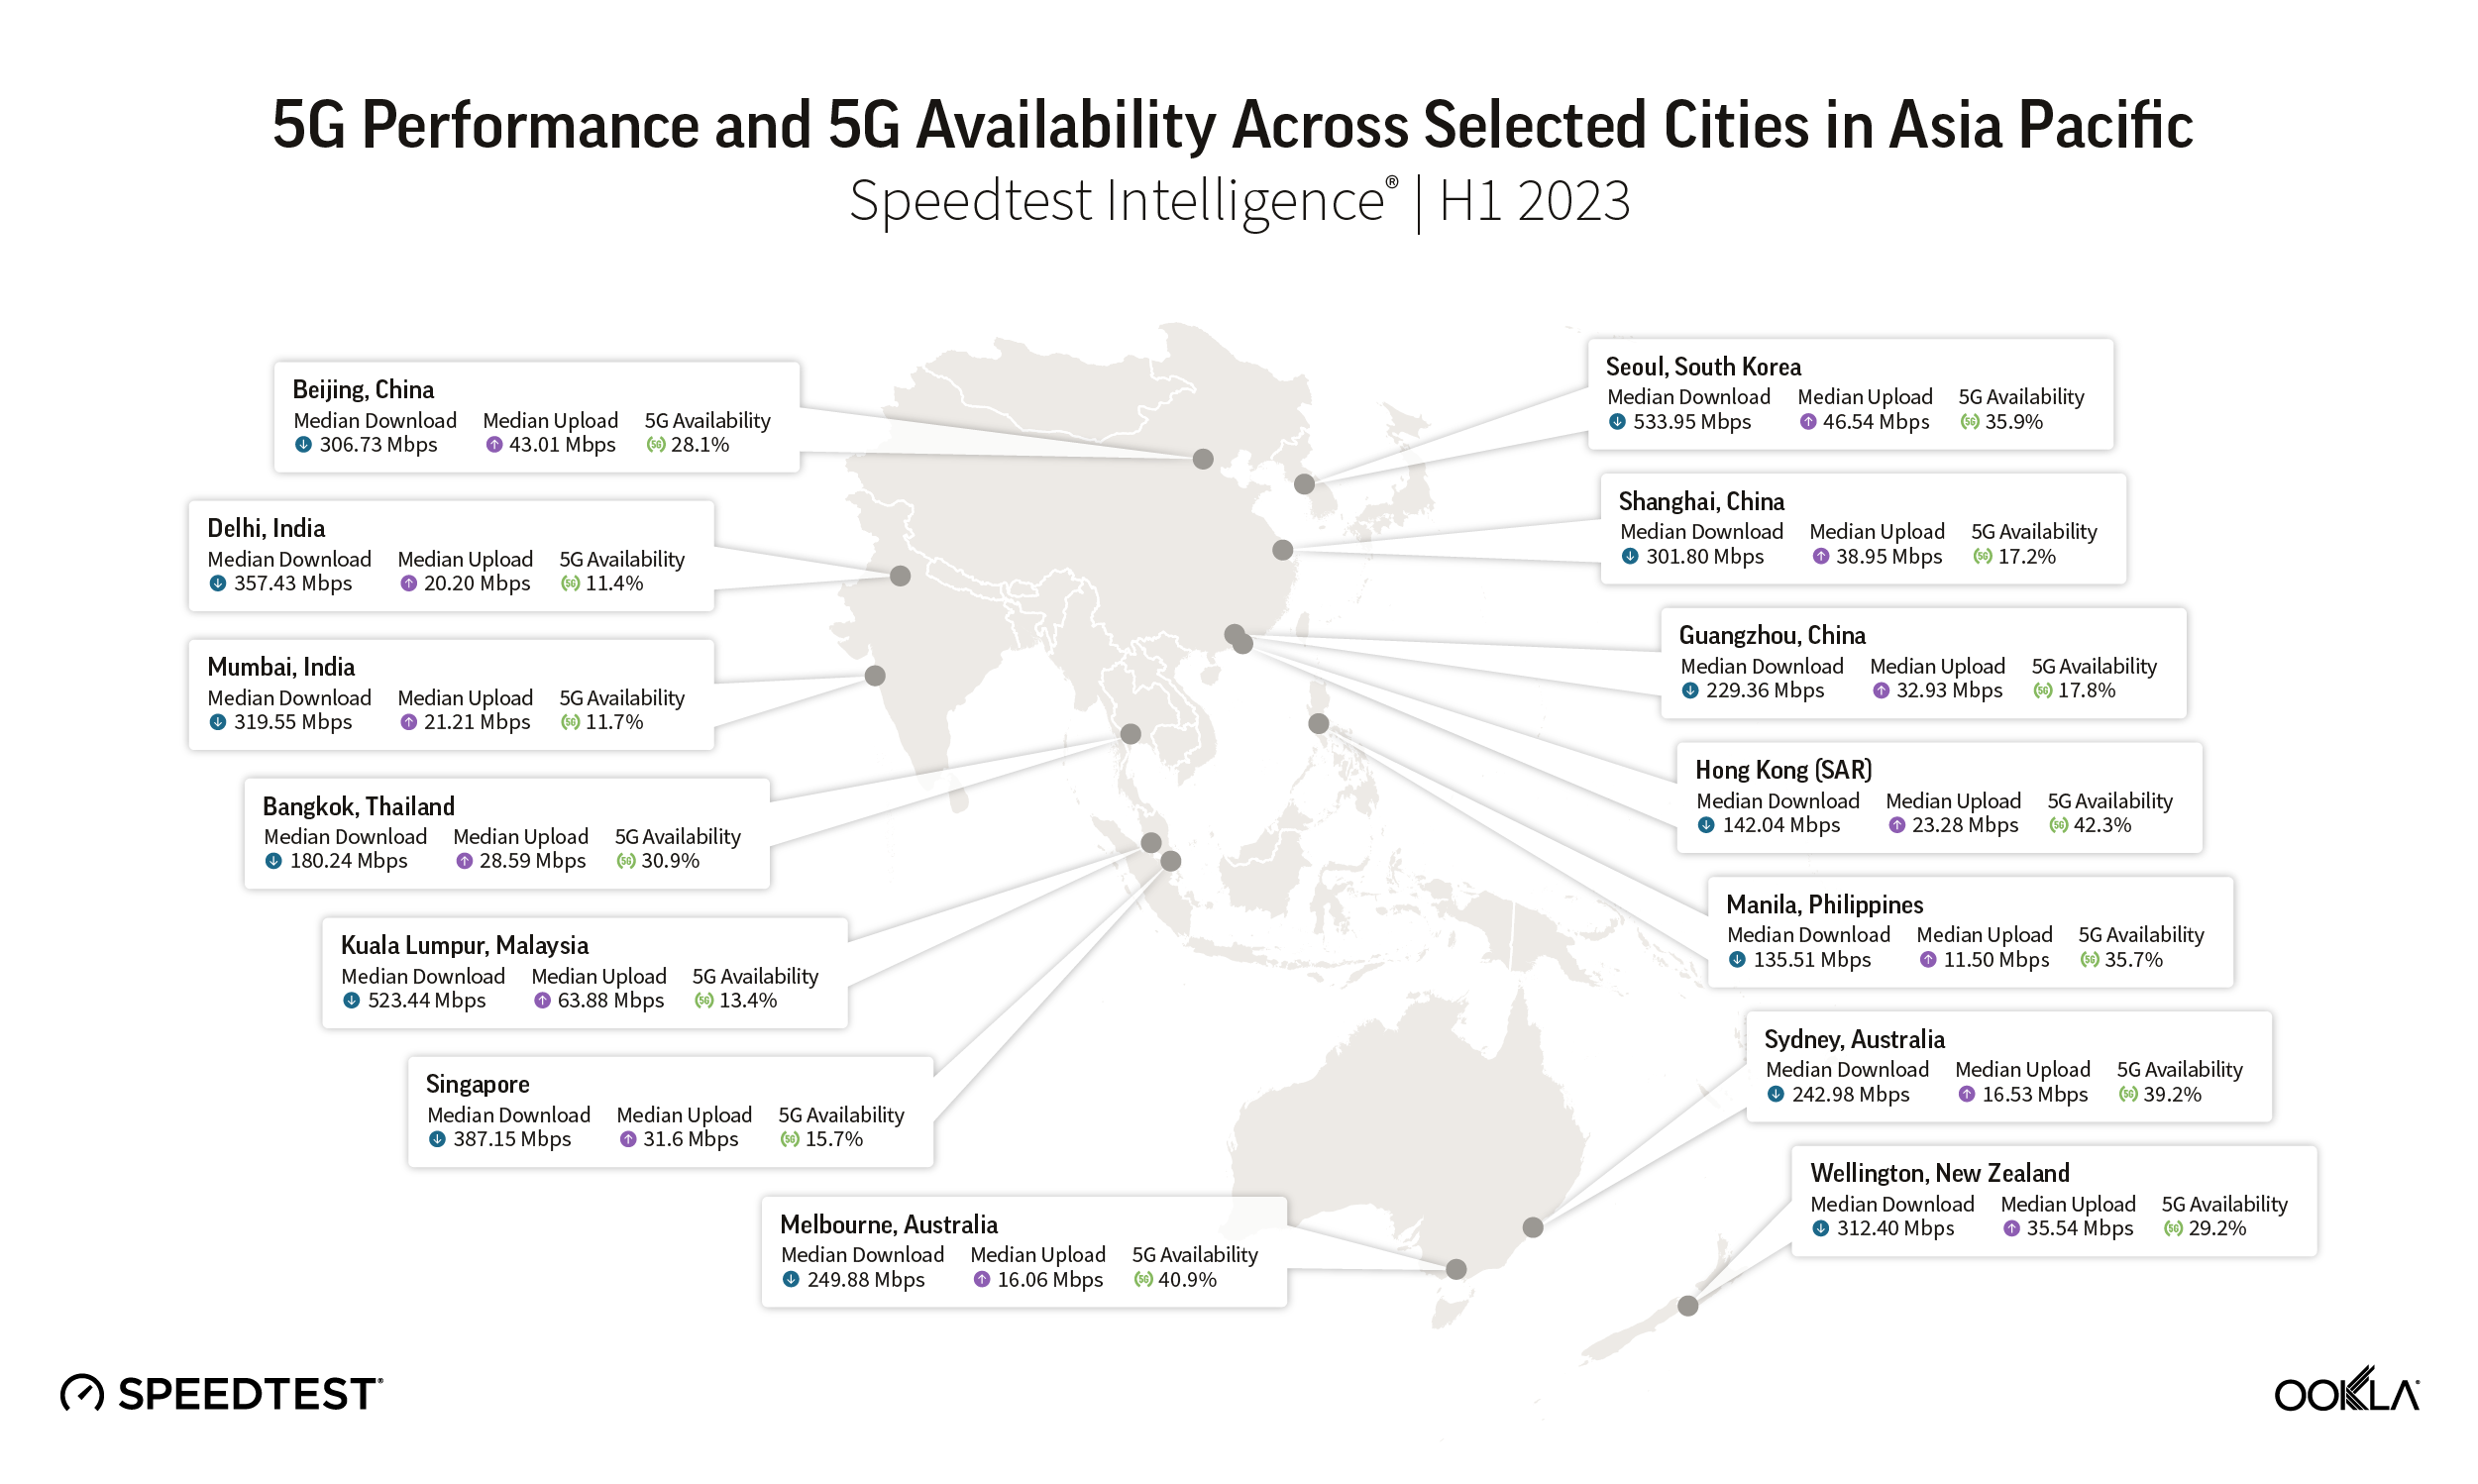
  • Seoul and Kuala Lumpur are the top cities for 5G performance, boasting median download speeds of 533.95 Mbps and 523.44 Mbps, respectively.
  • 5G helps to narrow the digital divide. 5G FWA is a viable alternative to traditional fixed broadband to narrow down the digital divide in the region

South Korea sets the pace as 5G networks expand across the region

Many of the more advanced markets in the Asia Pacific have been the frontrunners in terms of 5G rollout. South Korea was the first market in the world to deploy a nationwide 5G network in April 2019, followed by Australia, the Philippines, China, and New Zealand later that year. As predicted by GSMA Intelligence, the recent second wave of 5G rollouts in the region in countries such as Indonesia, India, and Malaysia will see Asia Pacific becoming one of the largest 5G markets in the world by 2025.

5G Launch Timeline in Selected Asia Pacific and European Markets

Allocation of spectrum resources is crucial

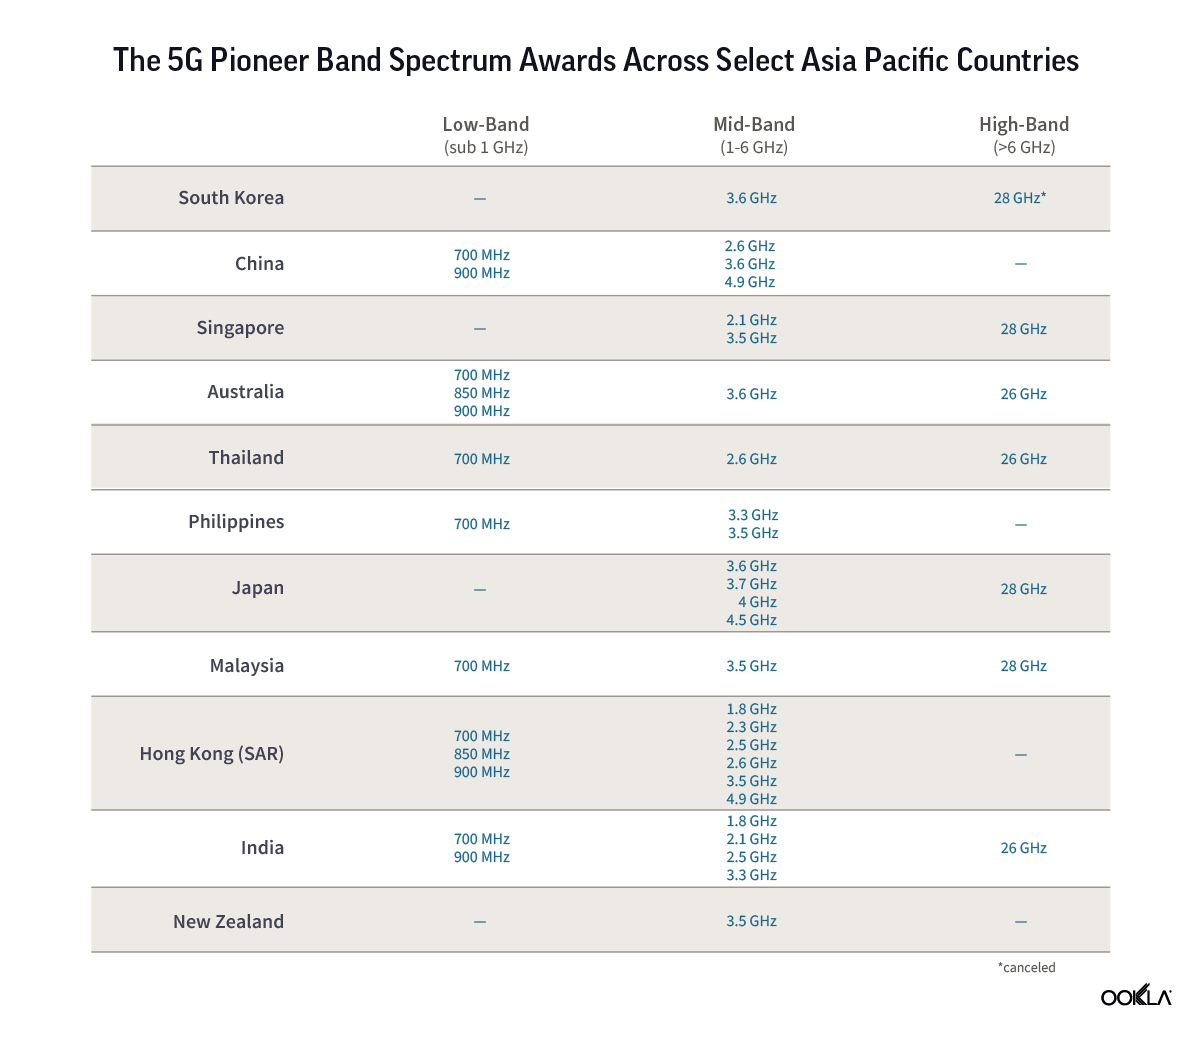
In our recent spectrum analysis, we discussed how important spectrum is for the performance and coverage of 5G. In general, regulators in the Asia Pacific region have been quick to allocate spectrum for 5G applications, and in many cases, operators have been able to secure substantial bandwidth in the key C-band.

List of the 5G Pioneer Band Spectrum Awards Across Select Asia Pacific Countries

The mid-band spectrum is the most frequently awarded spectrum band in the Asia Pacific region. It is the top choice for commercial 5G deployment because it balances 5G coverage and capacity. In some markets, 5G deployment uses low-band (sub 1 GHz) frequencies, allowing for wider outdoor 5G coverage and better penetration inside buildings in urban and suburban areas. However, this may come at the expense of the median download speed, which typically peaks at around 100 Mbps.

For some markets, 5G spectrum awards are subject to strict milestones and requirements. Operators in South Korea were required to have 22,500 base stations by the end of 2021, 45,000 by the end of 2023, and 150,000 base stations upon completion of their 3.5 GHz spectrum rollout. Additionally, within three years, there were required to install 15,000 base stations utilizing 28 GHz. However, a review by South Korea’s Ministry of Science and ICT (MSIT) found that all mobile operators met the minimum requirements for the 3.5GHz spectrum but not the 28GHz spectrum. Consequently, the ministry has withdrawn all operators’ spectrum licenses in the 28GHz band. In our recent mmWave analysis, we thoroughly covered the performance and progress inherent in that spectrum band.

Asia Pacific outpaced major European markets in terms of 5G performance

While Europe and the Asia Pacific markets share similarities such as large cultural diversity, customers with varying demographics, and mixed regulations and policies, our recent analysis of European 5G performance revealed that early 5G adopters in the Asia Pacific region performed better than some major European markets. 

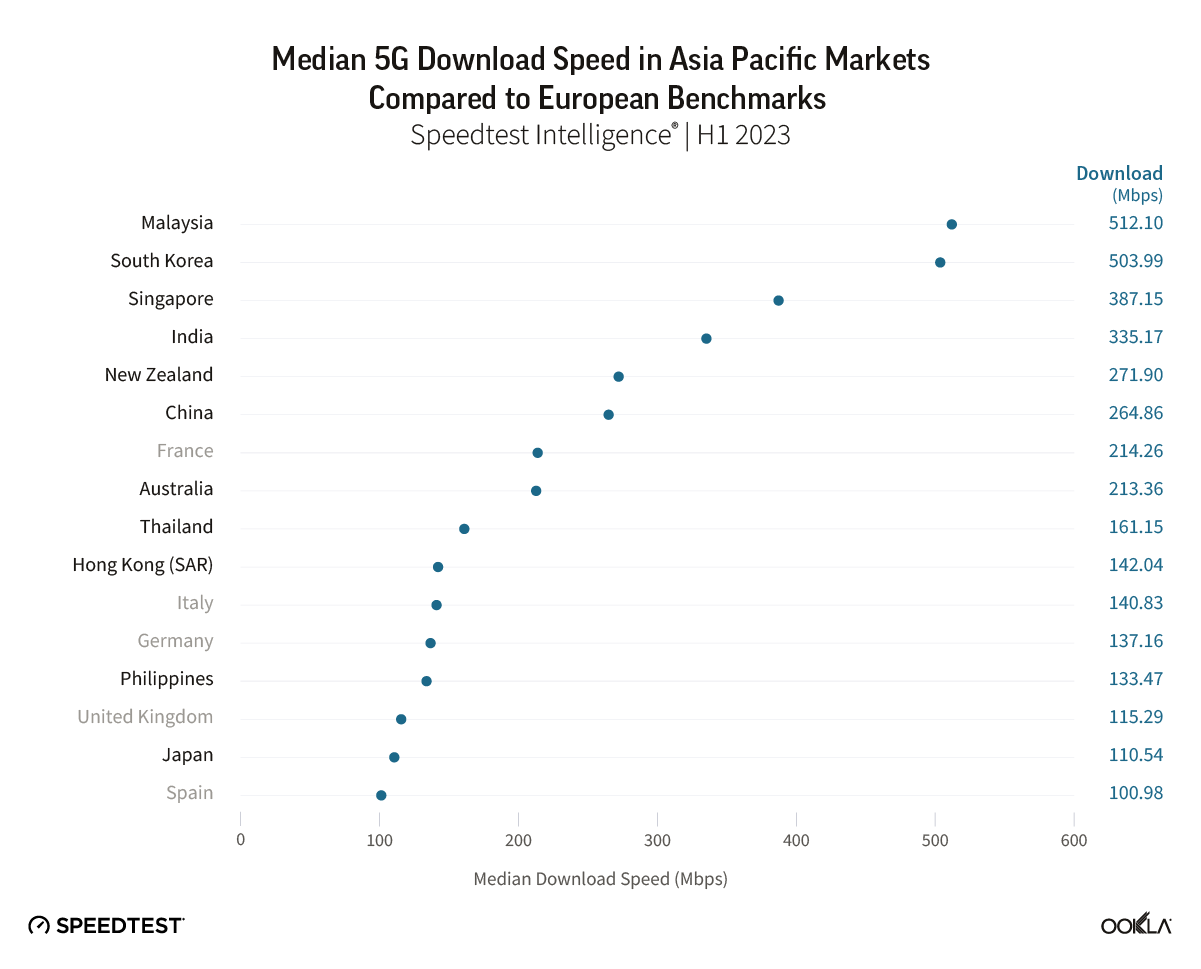
Chart of Median 5G Download Speed in Asia Pacific Markets Compared to European Benchmarks

According to Speedtest Intelligence® H1 2023 data, several markets in the Asia Pacific region had faster median download performance compared to the top five European economies. Malaysia and South Korea led the pack with speeds of over 500 Mbps, with Malaysia reporting a median download performance of 512.10 Mbps, and South Korea at 503.99 Mbps  – an impressive accomplishment for Malaysia, which launched 5G 3.5 years after South Korea and has caught up to them in performance. Both countries have notable differences in terms of their telecommunications landscapes. The Malaysian government went with a nationwide single wholesale network (SWN) approach as its 5G deployment plan. Digital Nasional Berhad (DNB) was established in 2021 to construct and operate the 5G network infrastructure and provide 5G services to mobile network operators at wholesale prices. South Korea has long been at the forefront of mobile technology and boasts one of the highest internet penetration rates globally. As a result of its early commitment to 5G development, South Korea became the first market in the world to launch a commercial 5G network.

During the same period, Singapore, India, New Zealand, China, and Australia achieved a median 5G download speed exceeding 200 Mbps. In comparison, only France recorded speeds above 200 Mbps among the European countries mentioned, while Italy, Germany, United Kingdom, and Spain, recorded median download speeds below 150 Mbps.

5G Availability and adoption vary across the region

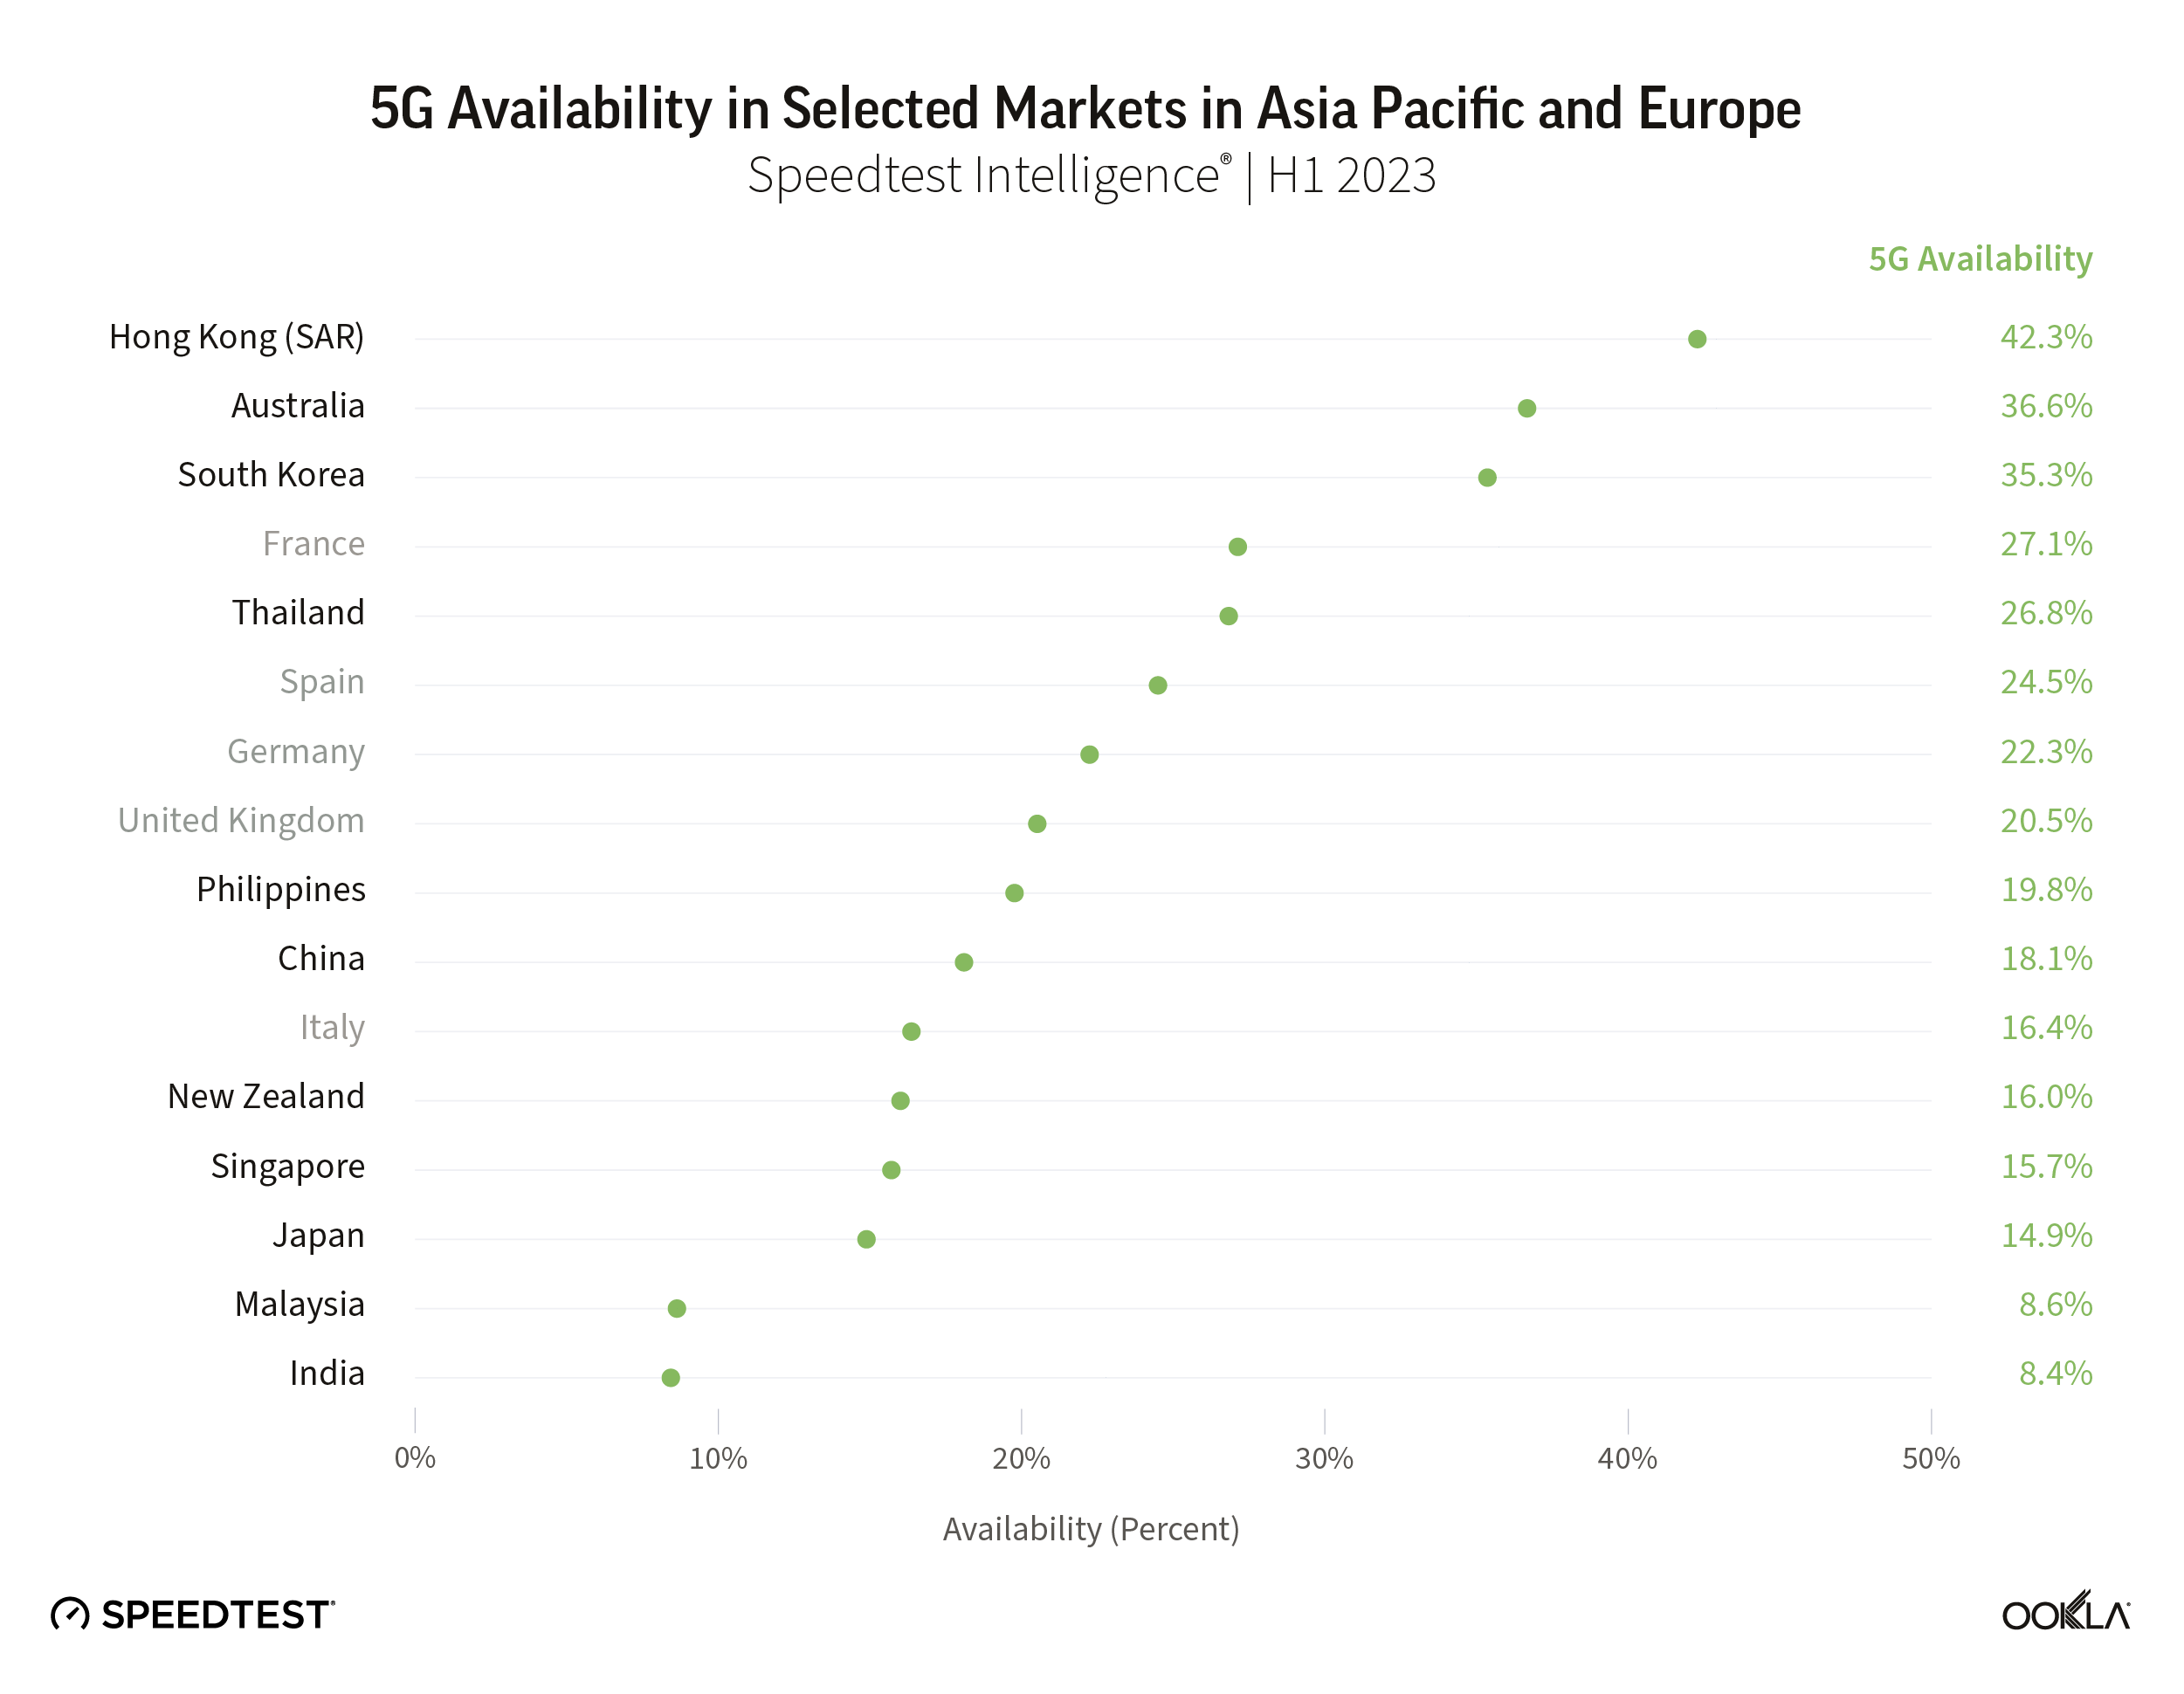
Chart of 5G Availability in Selected Markets in Asia Pacific and Europe

5G Availability (the percentage of users on 5G-capable devices that spend most of the time with access to 5G networks) varied widely across the Asia Pacific region during H1 2023. Factors such as access to low-band spectrum and affordability and availability of 5G devices influence each market’s reported 5G Availability. Analysis based on data from Speedtest Intelligence shows that Hong Kong stands out as the only country analyzed to have surpassed 40% 5G Availability, reaching 42.3% in H1 2023. Part of the reason is the city’s high population density, 5G coverage that reaches over 90% of the population, and a high 5G smartphone penetration rate, which Counterpoint Research reported as 78% in Q1 of 2023.

Despite Australia being 78 times larger than South Korea, and being one of the least densely populated countries, both countries reported similar 5G Availability rates, at around 36.6%. Counterpoint Research reported a 5G smartphone penetration rate of more than 80% for both countries, with South Korea at 88% and Australia at 82%. Across the European markets, France, Spain, Germany, and the U.K. ranged between 20%-30%. Similarly, Thailand also falls within this range at 26.8%. 

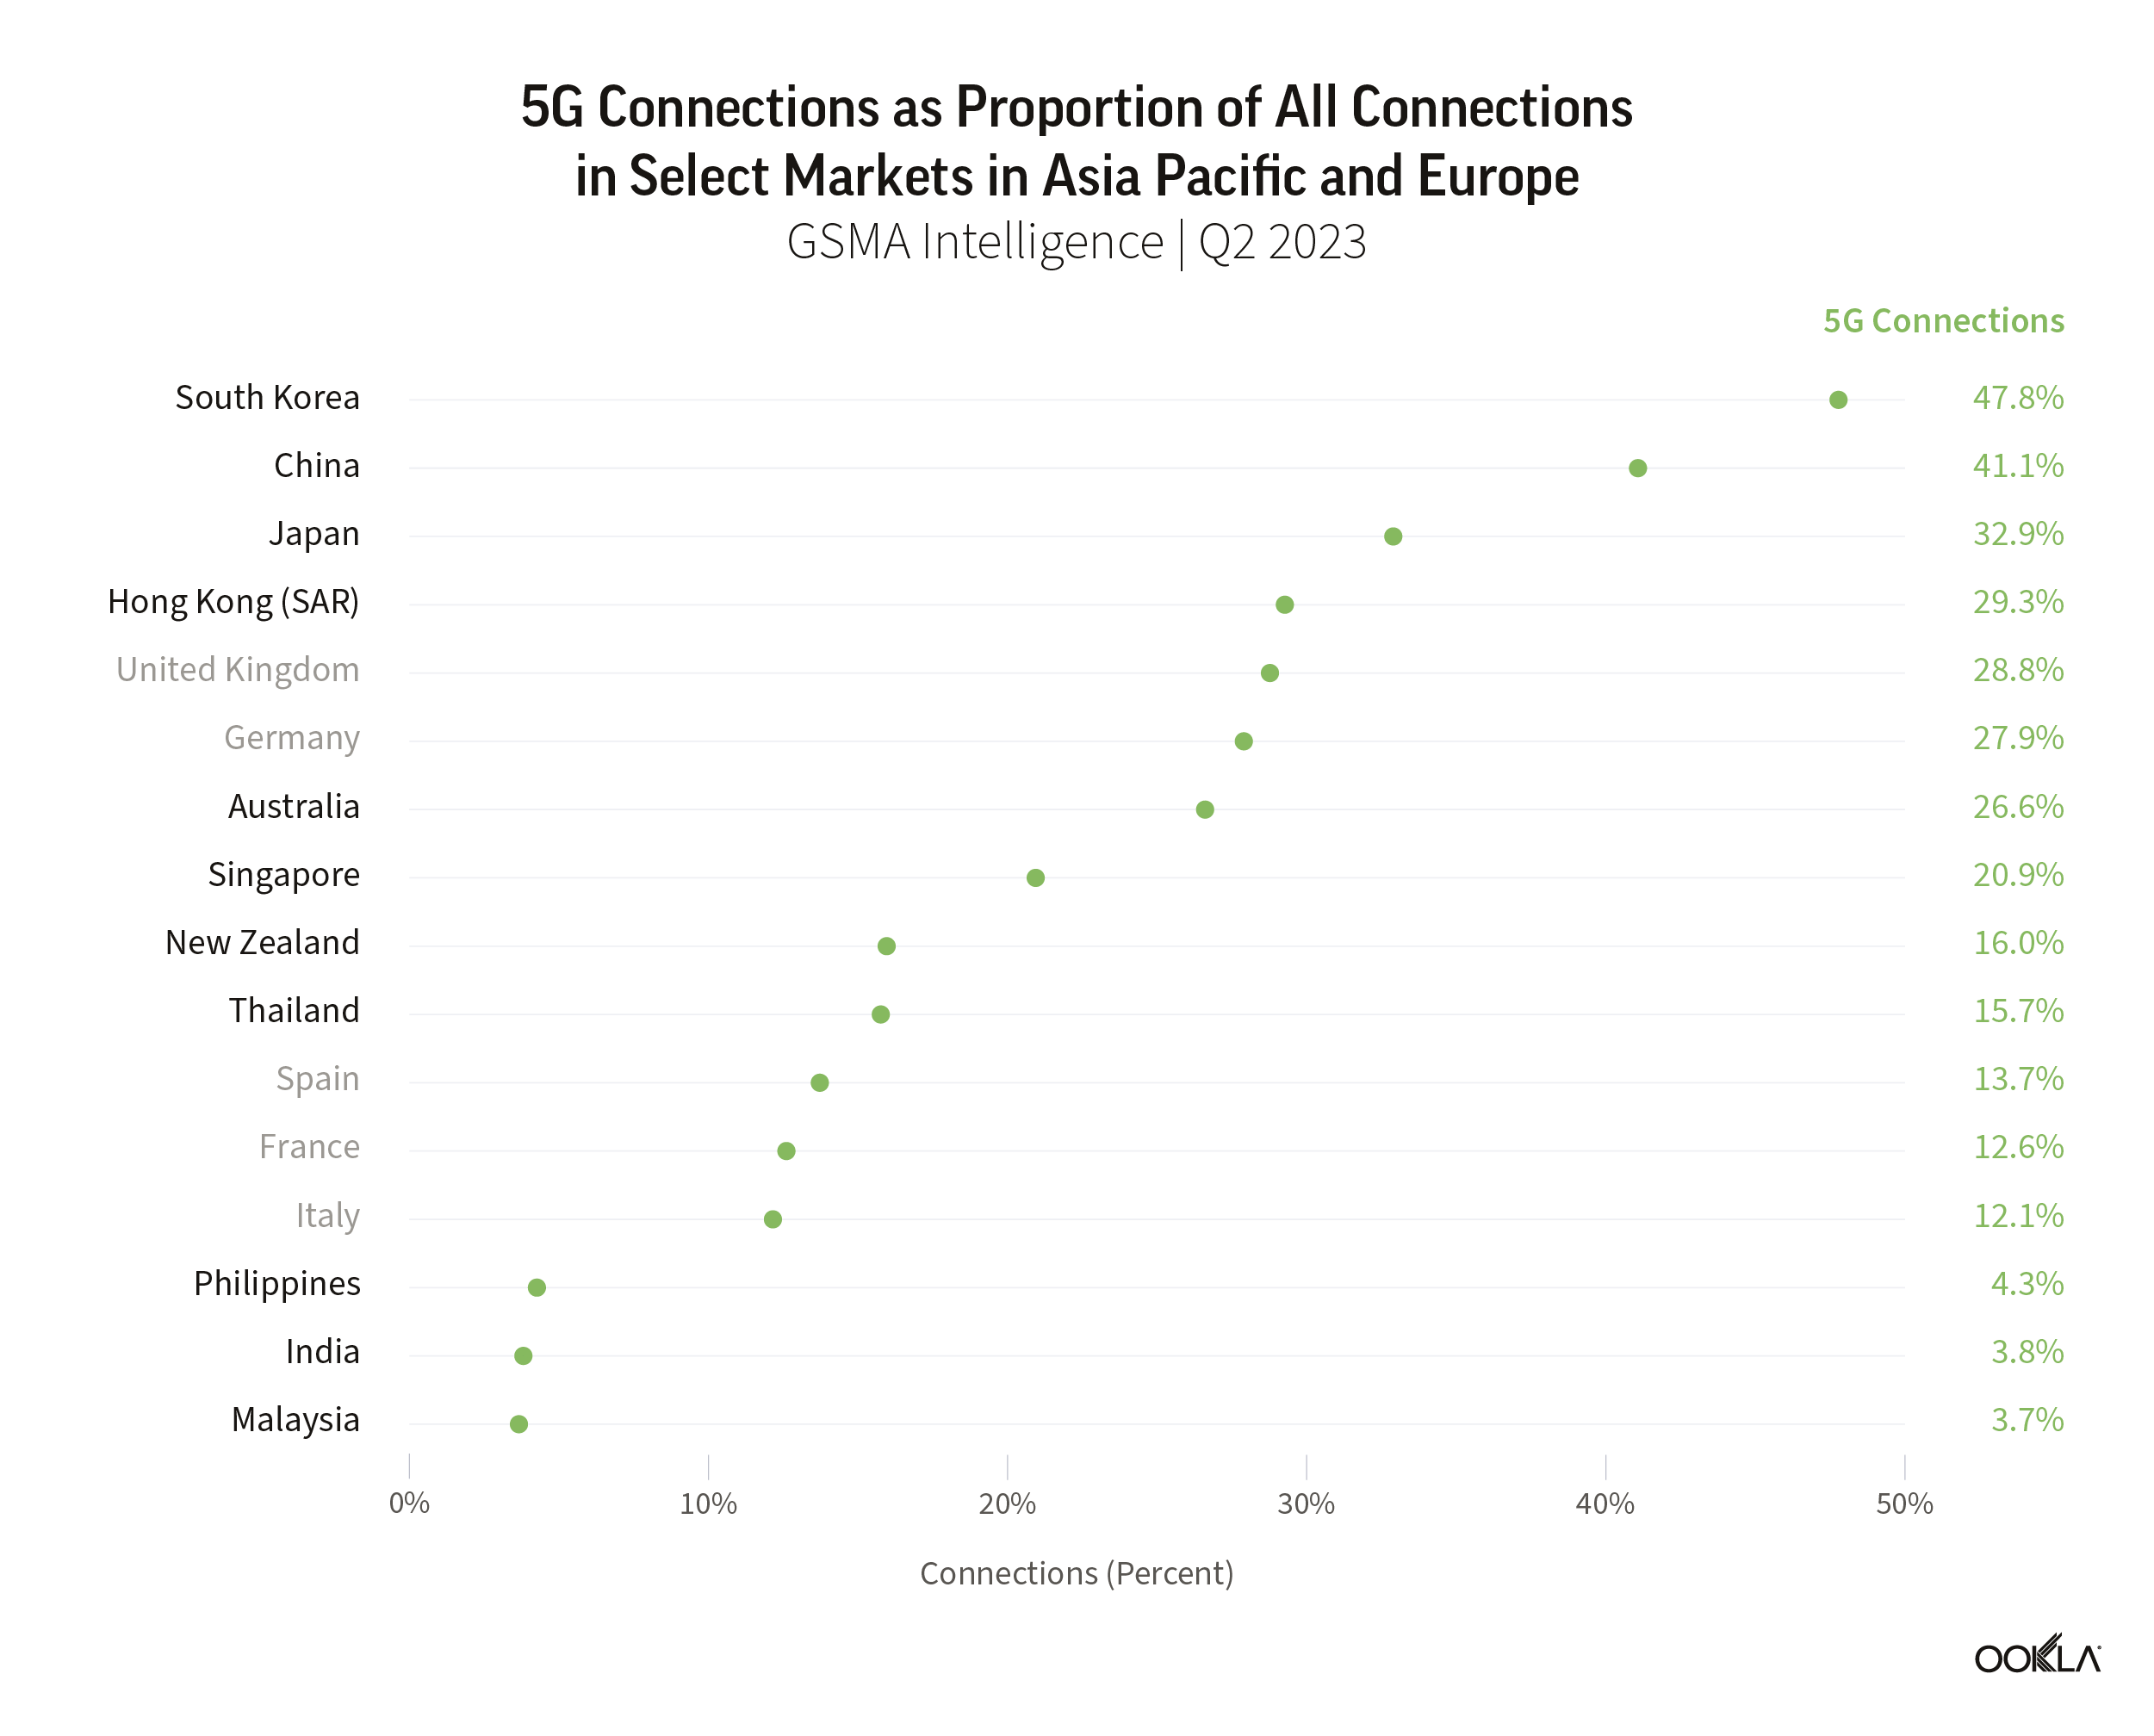
Chart of 5G Connections as Proportion of All Connections in Select Markets in Asia Pacific and Europe

Based on Q2 2023 data from GSMA Intelligence, South Korea, China, and Japan led in 5G adoption, measured as the percentage of 5G connections compared to total connections, higher than the selected European markets looked at in this report. South Korea had a total of 31.3 million 5G connections, which accounted for more than 48% of all mobile connections in the country, while China boasts over 700 million 5G connections, equivalent to 41% of connections. Other early adopters of 5G in the region, such as Japan, Hong Kong, and Australia, have all seen a considerable rise in their total 5G connections from the previous year. Japan experienced a 76% increase of 5G connections between Q2 2022 to Q2 2023, to 60.8 million connections. Hong Kong increased by 65% to 4.8 million, and Australia had 8.8 million connections, up by almost 40% during the same period of time.

Seoul and Kuala Lumpur are the top cities in the Asia Pacific region for 5G speeds.

Map of 5G Performance and 5G Availability Across Selected Cities in Asia Pacific

Given that both Malaysia and South Korea are ahead in 5G performance among their peers, it is unsurprising that their capital cities came first as well in the ranking of selected cities. In H1 2023, Seoul had a median download speed of 533.95 Mbps, while Malaysia’s capital, Kuala Lumpur, reported a median download speed of 523.44 Mbps. Digital Nasional Berhad (DNB), Malaysia’s designated 5G wholesale provider, reported 90% 5G coverage of populated areas (COPA) throughout Kuala Lumpur at the end of 2022. 

Despite being one of the latest markets to launch 5G, the Indian cities of Delhi and Mumbai performed well in the cities’ speeds ranking. Both cities reported median download speeds of over 300 Mbps in H1 2023, with Delhi at 357.43 Mbps and Mumbai at 319.45 Mbps. While Kuala Lumpur, Mumbai, and Delhi have shown 5G performance comparable to or even exceeding those of well-established 5G markets in the region, their 5G networks are still relatively new. As a result, these cities have lower 5G Availability than others as anticipated.

Metro Manila, with one-third of the population of the Philippines, had the lowest median download speed among all the cities in this report for H1 2023, with a speed of 135.51 Mbps. During the same period, Metro Manila reported a 5G availability rate of 35.7%, slightly lower than Seoul (35.9%) and Sydney (39.2%).

Breaking the digital divide with 5G FWA

The benefits of 5G go beyond the faster speeds compared to 4G. It also plays a role in bringing connectivity to underserved areas. Although developed markets in the Asia Pacific are leading in ultra-fast, fixed fiber broadband, there is still a portion of the region where internet connectivity is expensive, unavailable, or insufficient. Many people in these underserved regions rely on mobile devices to access the internet. According to GSMA Intelligence, mobile broadband networks are accessible to more than 96% of the population, making it the primary option for internet access in many households. 

In some markets, mobile operators see 5G, particularly 5G fixed-wireless access (FWA) services, as a viable alternative to traditional fixed broadband. While FWA is not a new concept, the use of 5G technology is expected to accelerate its growth, especially in areas where it is not economically feasible to deploy high-speed fixed broadband networks. According to GSMA Intelligence, nearly three in five users who either have upgraded or plan to upgrade to 5G find the idea of using 5G for home broadband appealing. FWA is becoming one of the operators’ primary 5G use cases, providing an opportunity to increase revenue and monetize network investments and wireless spectrum.

The Asia-Pacific region is seeing a rise in the adoption of 5G FWA, with Southeast Asia leading the way. In 2019, Globe Telecom in the Philippines, became the first country in the region to launch FWA. Other regional operators, such as Telkomsel in Indonesia and AIS in Thailand, have also begun offering FWA services. In New Zealand, operators plan to provide FWA coverage to 90% of the population by the end of 2023.

While 5G FWA shows promising growth potential, operators need to ensure that as 5G adoption in the network increases, they have the capacity to support their FWA services and the spectrum to guarantee quality. When the demand for 5G FWA service grows, operators may have to look at utilizing the mmWave spectrum to maintain the quality of their FWA services while keeping network capacity intact.

We will keep a close eye on the progress and effectiveness of 5G implementation throughout the Asia Pacific region. If you are interested in benchmarking your performance or if you’d like to learn more about internet speeds and performance in other markets around the world, visit the Speedtest Global Index.

Ookla retains ownership of this article including all of the intellectual property rights, data, content graphs and analysis. This article may not be quoted, reproduced, distributed or published for any commercial purpose without prior consent. Members of the press and others using the findings in this article for non-commercial purposes are welcome to publicly share and link to report information with attribution to Ookla.
| December 22, 2024

Ringing in the New Year - How do 5G Networks Cope Under Stress?

5G Networks Support NYE Festivities Across Major Cities

Major events present a unique challenge for mobile networks, particularly sporting events where users congregate in concentrated numbers, and where sharing of video to social media, and to friends and family is a key use case. Ringing in the New Year is another case in point – for many years network operators published statistics on the number of voice calls made, messages sent, and the amount of data traffic their networks handled. While the rise of over-the-top (OTT) communications platforms such as WhatsApp have put a damper on these press releases, there remains a sizeable impact on operators’ networks. For example, Belgian operator Proximus noted a 95% increase in mobile data traffic on New Year’s Eve in 2023 compared to 2022. The trend isn’t uniform across markets, with Australia’s Telstra consistently seeing lower data usage on New Year’s Eve, with its customers using 30% less data than average, according to a news source. What is clear is that the New Year presents network operators with the challenge of serving sufficient bandwidth to customers attending major New Year celebrations, allowing them to share the moment, but also to support the mass wishing of “Happy New Year” across a variety of channels.

We reviewed Speedtest Intelligence data for New Year’s Eve 2023/24, to analyse how 5G networks coped with the surge in demand and change in traffic patterns at New Year, across a selection of major cities featuring some of the largest New Year celebrations around the globe. We focused in on median performance alongside the 10th percentile, in order to evaluate the spread of performance from the median user to those experiencing more challenging network conditions which would impact their experience at New Year.

Worst 10% of Speedtest samples reveal network challenges

We zeroed in on 5G upload performance first. Network operators universally allocate more spectral capacity to the downlink, as most mobile use cases lean more heavily on downloading data to the end-user device. However, the usage profile at the New Year is different, with video sharing, video streaming and calling, as well as uploading content to social media, more prevalent. These are all activities that are supported by uplink from the device.

Our data shows a significant gap between upload performance for the median user, and those in the lower 10th percentile – those experiencing the worst 10% of performance samples. Half the cities in our analysis recorded 10th percentile upload performance of less than 1 Mbps, with speeds ranging from 0.30 Mbps in Berlin, to 6.09 Mbps in Dubai. These sub-par speeds make it nearly impossible to upload photos or videos.

User Experience – Assessing the Worst 10% of Performance Samples on New Year's Eve
Speedtest data, New Year's Eve 23/24, 8pm – 1am

It was a similar picture for New Year revellers based on download speeds and latency. Despite more capacity being allocated to the downlink, performance for the lowest 10% of samples tumbled significantly compared to the median experience, with cities in APAC (Bangkok, Hong Kong, Sydney and Tokyo) in particular suffering, recording 10th percentile 5G download speeds of less than 10 Mbps. Latency was more of a mixed story across cities. At one end of the scale, Tokyo recorded a variance in latency between the median and 90th percentile (the worst 10% of latency samples) of just 19 ms, while Sydney saw a much wider gap of almost 200 ms. At 200 ms of latency users are likely to experience frustratingly slow loading times, unresponsive applications, and poor video quality.

Our data also showed the degree to which New Year usage pulled down 5G performance for the worst 10% of samples. New York, and cities in Europe saw less of an impact at New Year’s Eve compared to their global counterparts. Berlin, London, New York and Paris saw 5G download speeds for 10th percentile drop by between 1.13 Mbps and 6.88 Mbps. In contrast, Bangkok, Hong Kong and Sydney saw performance drop by between 15.13 Mbps and 21.44 Mbps. Dubai and Rio de Janeiro recorded the largest variance, however with faster 5G speeds they still outpaced the remaining markets by a significant margin. Upload performance for the worst 10% of samples followed a similar trend to download, however latency performance was more varied. Berlin, Dubai, New York, Rio de Janeiro and Tokyo saw very little difference between New Year Eve latency performance and the Q4 2023 average. However, Paris, Hong Kong and London saw an increase in latency for the worst 10% off samples of between 22 ms and 36 ms, while Bangkok and Sydney fared worst, with an increase of 61 ms and 171 ms respectively.

Impact of New Year's Eve Traffic on Users With the Worst 10% of Samples
Speedtest data, Q4 2023 vs New Year's Eve 23/24, 8pm – 1am

Addressing network pain points

Addressing network pain points for users affected by poor performance in dense urban areas is a challenging task. For major events like the recent Paris Olympics, which we reported on earlier this year, network operators will typically deploy temporary network assets such as cells on wheels (CoWs) to add extra network capacity, which can then be removed once the event concludes. Network operators can also look to build private networks, to provide dedicated capacity to support the operations of the event, including routing traffic for broadcasting purposes. However, city authorities also have an important role to play here, as highlighted in our recent whitepaper with Dublin City Council and the City Telecoms Association. Having a holistic view of network performance and its evolution across a city, as well as international benchmarks, provides city authorities with the data and insights to engage more constructively with network operators and regulators, and help introduce more effective policies to deliver meaningful change for end-users. We’ll continue to benchmark and report on city and state performance, based on Speedtest Intelligence data. For more information, please contact us.

Ookla retains ownership of this article including all of the intellectual property rights, data, content graphs and analysis. This article may not be quoted, reproduced, distributed or published for any commercial purpose without prior consent. Members of the press and others using the findings in this article for non-commercial purposes are welcome to publicly share and link to report information with attribution to Ookla.
| June 12, 2024

Exploring 5G Indoor Connectivity Within the Greater Bay Area

繁體字

The Guangdong-Hong Kong-Macao Greater Bay Area (GBA) is one of the regions with the fastest urbanization process in China in the past 4 decades. With the highest concentration of skyscrapers in the world, operators in the region must prioritize seamless indoor and outdoor 5G coverage to optimize services and meet customer needs.

In this report, we use data from Cell Analytics™ to examine the 5G indoor performance and signal quality across Guangzhou, Shenzhen, Hong Kong, and Macau, the four major cities in GBA.

Key Takeaways

  • Guangzhou and Shenzhen showed better city-wide indoor 5G coverage and quality compared to Hong Kong and Macau. Guangzhou reported a mean RSRP of -82.89 dBm, with Shenzhen slightly lower at -86.96 dBm. Additionally, both cities boast better 5G indoor quality with scores of 10.09 dB and 10.98 dB, respectively. In contrast, Hong Kong’s mean RSRP was at -87.36 dBm, while Macau’s was at -91.02 dBm.
  • China Mobile in Guangzhou stands out for offering better indoor 5G coverage in the city. The operator reported a mean RSRP of -79.17 dBm, which is significantly better by approximately 8 dB compared to China Unicom’s mean RSRP of -87.2 dBm. There were only minor differences in 5G indoor signal strength between operators in the other cities, but in Macau, the operators had significantly weaker indoor signal strength than almost all other operators in the other selected cities.

Indoor 5G Traffic Continue to Rise Among the Greater Bay Area Cities

The Guangdong-Hong Kong-Macao Greater Bay Area, commonly known as the Greater Bay Area (GBA), comprises nine cities in the Guangdong region of China and the two Special Administrative Regions (SAR) of Hong Kong and Macau. These cities are connected by an extensive transportation network, including high-speed rail, bridges, and tunnels, due to their proximity. As a key economic and technological hub in China, the adoption of 5G technology has become a key driver in the region, enabling the transformation of various industries and promoting automation and digitalization. In our recent article, we delved into the factors driving the rollout of 5G technology and examined its performance in the GBA region.

Indoor coverage is particularly important for the major “core” cities of GBA; Guangzhou, Shenzhen, Hong Kong, and Macau, where high-rise buildings dominate the skyline and indoor spaces play essential roles in commercial and tourist activities. In this recent article, we touched on the different technical solutions to address indoor cellular coverage challenges. 

Chart of Top Cities with Highest Number of Buildings More Than 150 Meters Height

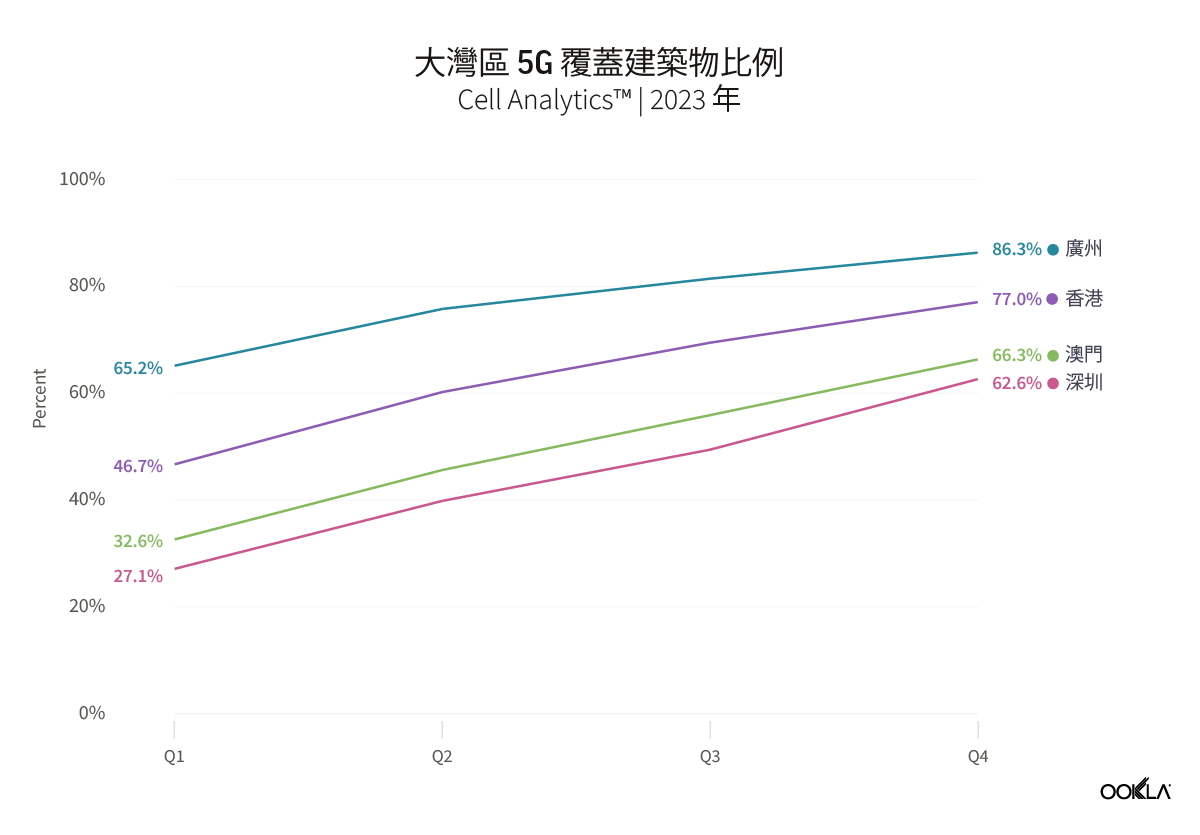
In order to assess the reach of 5G coverage inside buildings, we analyzed data from Ookla® Cell Analytics™ to measure the percentage of buildings in Hong Kong, Macau, Shenzhen, and Guangzhou with reported indoor 5G samples between Q1 2023 to Q4 2023. In this analysis, we have only considered buildings taller than 10 meters, which is the height of a typical three-story building or more.

Chart of Percentage of Buildings with 5G Coverage in the Greater Bay Area

The chart shows an increase in the number of buildings with detected indoor 5G samples for every quarter from Q1 2023 to Q4 2023 across all four cities. Guangzhou, Shenzhen, and Macau all had an increase of more than 30 percentage points between Q1 2023 and Q4 2023, while Hong Kong saw a rise of 21 percentage points within the same period. The significant increase in the number of 5G base stations in China and its Special Administrative Regions has been the driving force behind the growth of indoor traffic. The Ministry of Industry and Information Technology (MIIT) of China announced that there were 3.38 million 5G sites in China at the end of 2023, which would have included a significant number of dedicated 5G indoor sites.

As 5G traffic continues to proliferate, subscribers are increasingly demanding optimal indoor coverage to ensure a seamless experience. Meeting these expectations requires a comprehensive strategy by the service providers that accounts for the unique challenges of the different indoor environments in each city.

5G indoor coverage and quality differs across the core cities of the Greater Bay Area

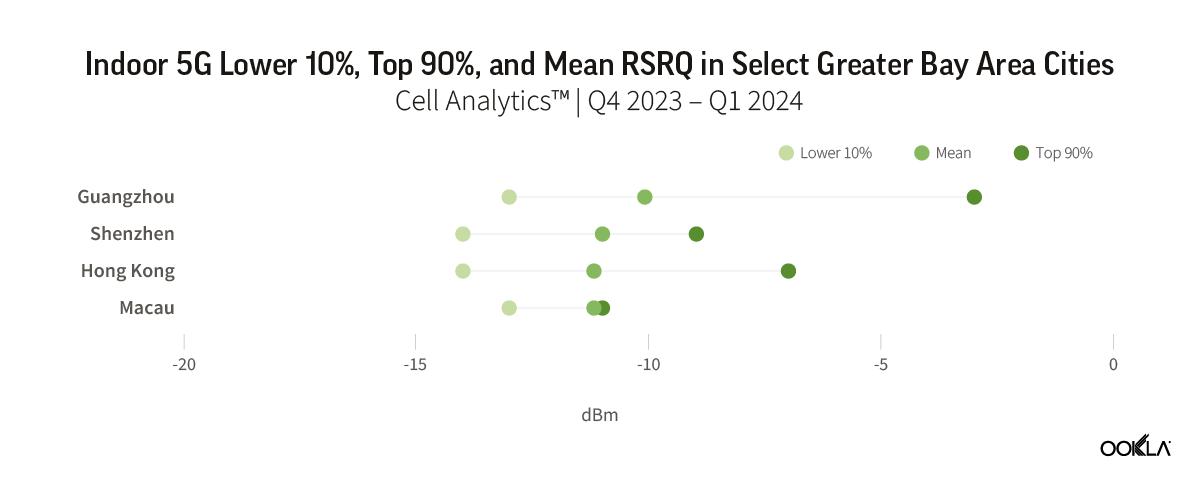
Drilling down into Cell Analytics data at the city level from Q4 2023 to Q1 2024, we evaluated subscribers’ 5G indoor experience by measuring the average Reference Signal Received Power (RSRP) and Reference Signal Received Quality (RSRQ). RSRP represents the network signal strength received by a mobile phone. An RSRP value that exceeds -90 dBm indicates superior coverage. If the signal strength is between -90 dBm and -100 dBm, then network coverage is considered good. Below this range, expect slower download speeds and potential network disconnections. RSRQ is a metric used to evaluate the quality of the reference signal received by a device. A value of -10 dB or higher indicates excellent network quality while a value between -10 dB and -15 dB is considered good. An RSRQ value lower than -15 dB is poor or indicates no signal at all.

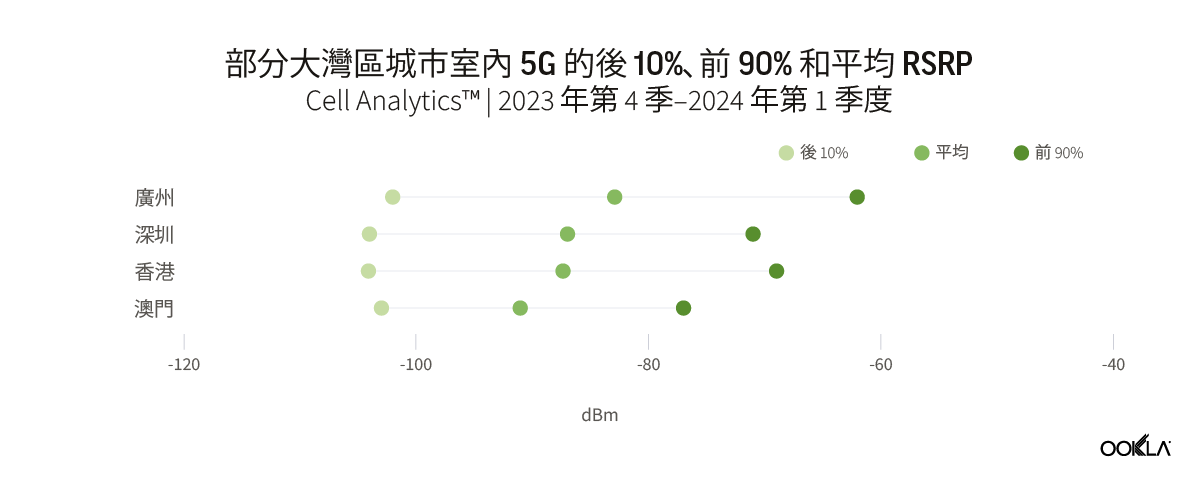
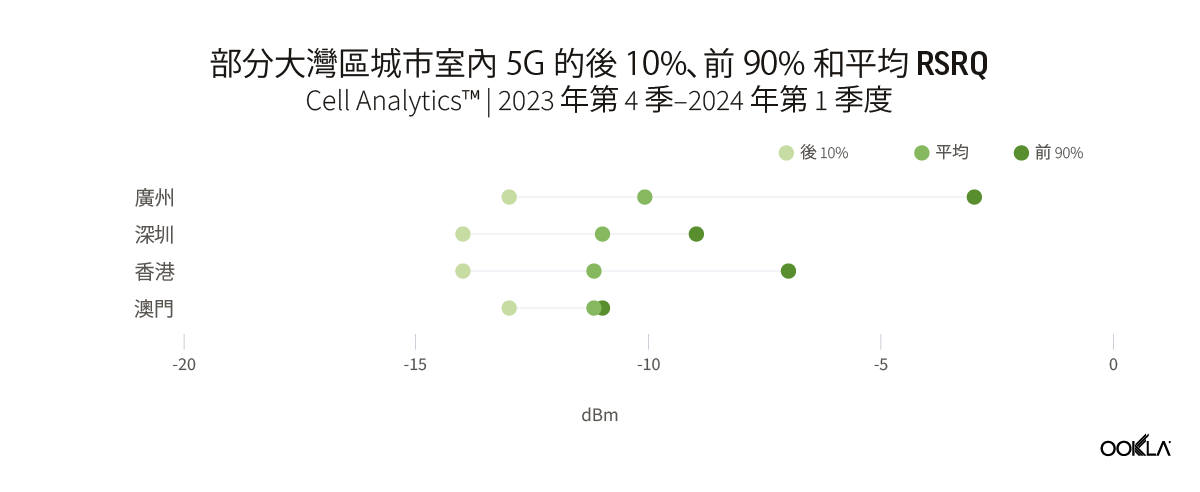
We compared the average RSRP and RSRQ for each of the four major cities in GBA and plotted out the range between the values of the Lower 10% and the Top 90% to examine the variations in the signal strength and quality of each city.

Chart of Indoor 5G Lower 10%, Top 90%, and Mean RSRP in Select Greater Bay Area Cities
Chart of Indoor 5G Lower 10%, Top 90%, and Mean RSRQ in Select Greater Bay Area Cities

Overall, the Chinese cities of Guangzhou and Shenzhen reported better city-wide 5G indoor coverage than those of Hong Kong and Macau. Guangzhou reported a weighted average RSRP of -82.9 dBm of all samples detected inside buildings, followed by Shenzhen with RSRP of -87.0 dBm. Both cities also reported better city-wide 5G indoor quality compared to Hong Kong and Macau, at -10.1 dB and -11.0 dB, respectively.

The data shows a substantial variance in performance and quality between the top and bottom 10% of users when connected to 5G indoors in these cities. The Upper 90% of samples in all cities had extremely good RSRP, ranging from -77 dBm in Macau to -62 dBm in Guangzhou. While the Lower 10% reported signal strength of around -104 dBm. This indicates that while, in general, users were experiencing reasonable 5G average speeds indoors, there are still hotspots with a concentration of users who are experiencing poor performance and coverage.

5G performance uplift accentuates the need for better indoor coverage

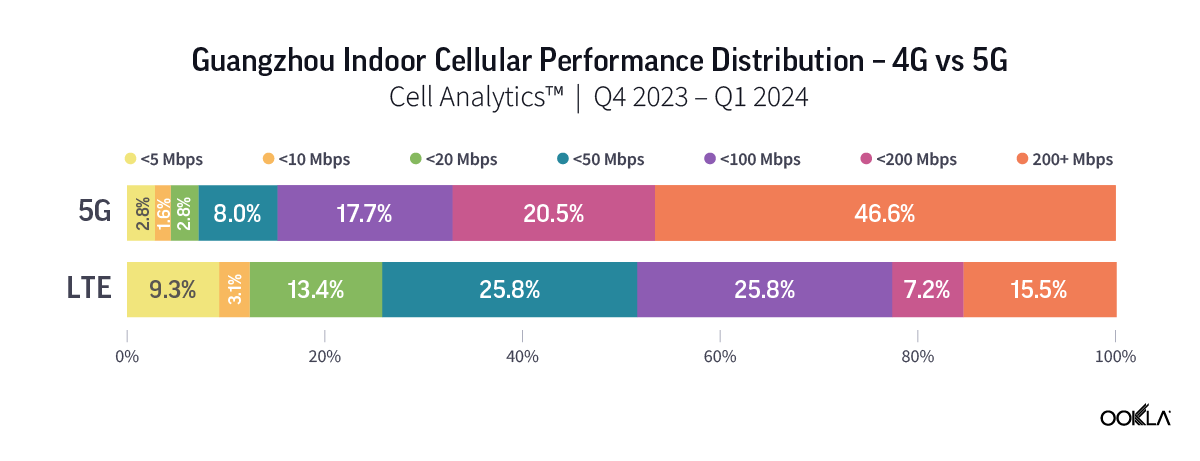
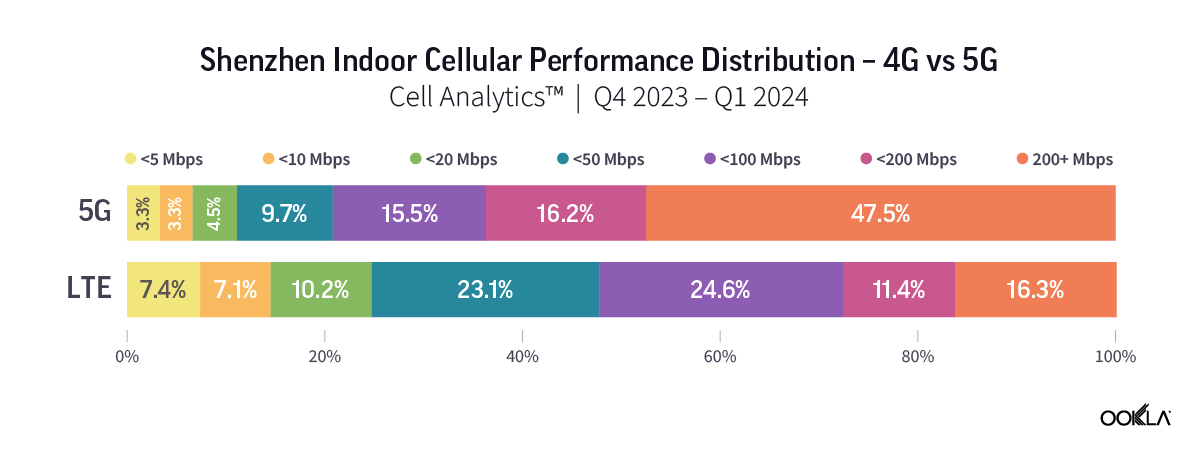
While today’s indoor 4G and Wi-Fi networks may meet the current connectivity demands, having dedicated in-building 5G networks provides a more seamless and efficient connectivity experience, bridging the gap between 4G’s inherent limitations in terms of latency and performance with the requirements of newer data-intensive use cases and low-latency applications.

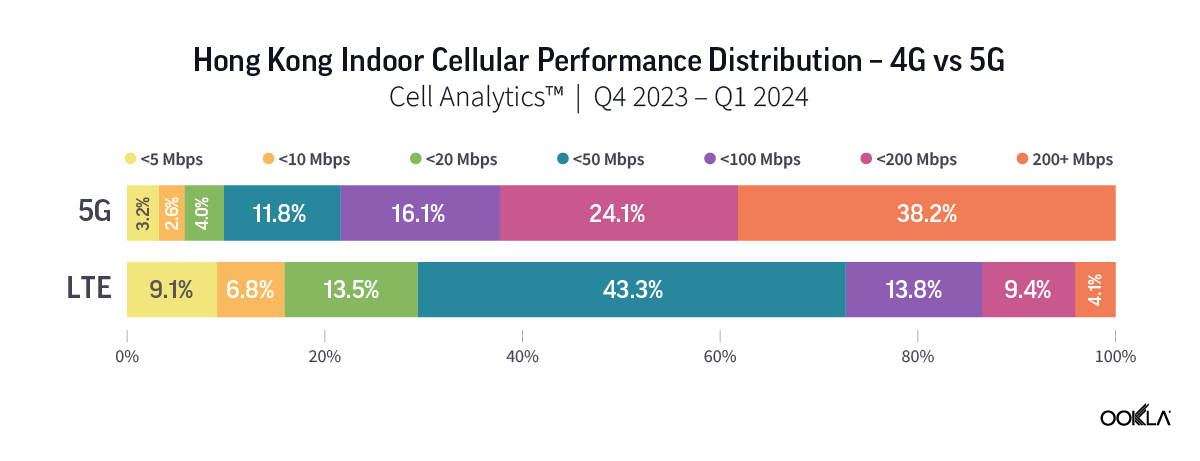
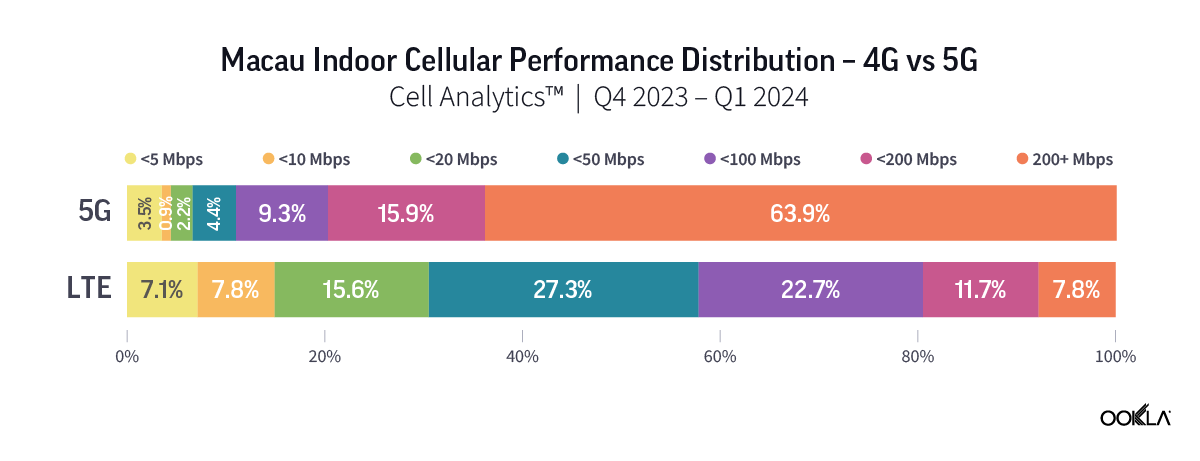
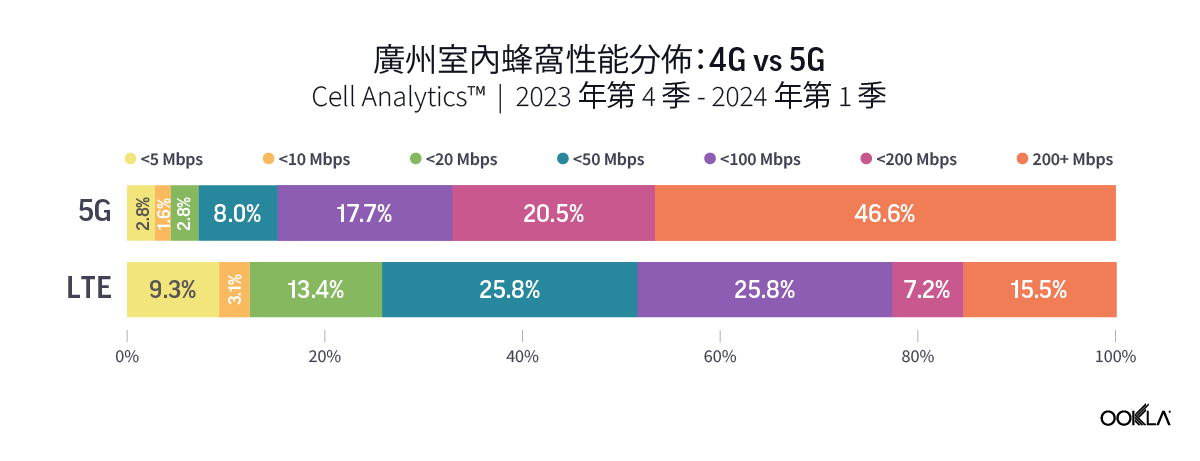
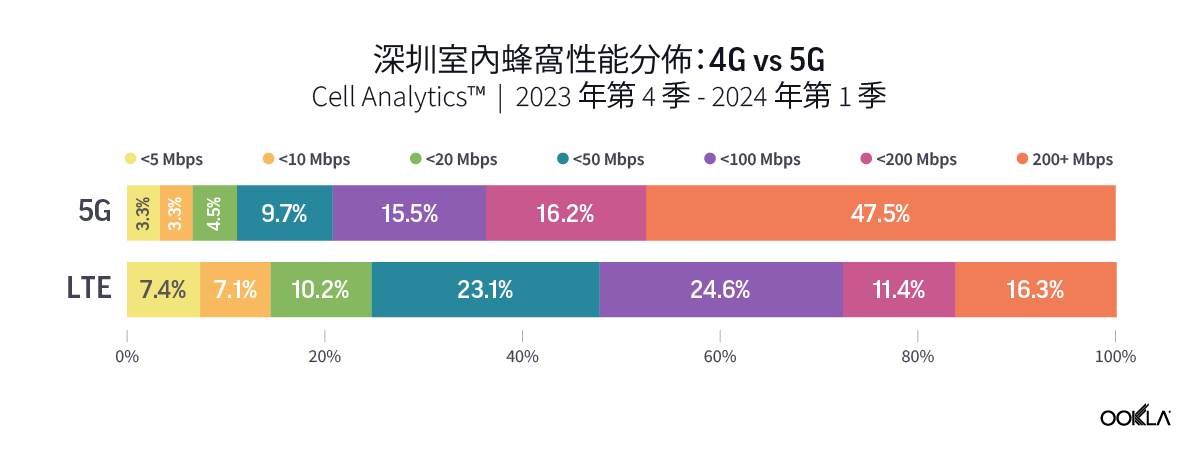
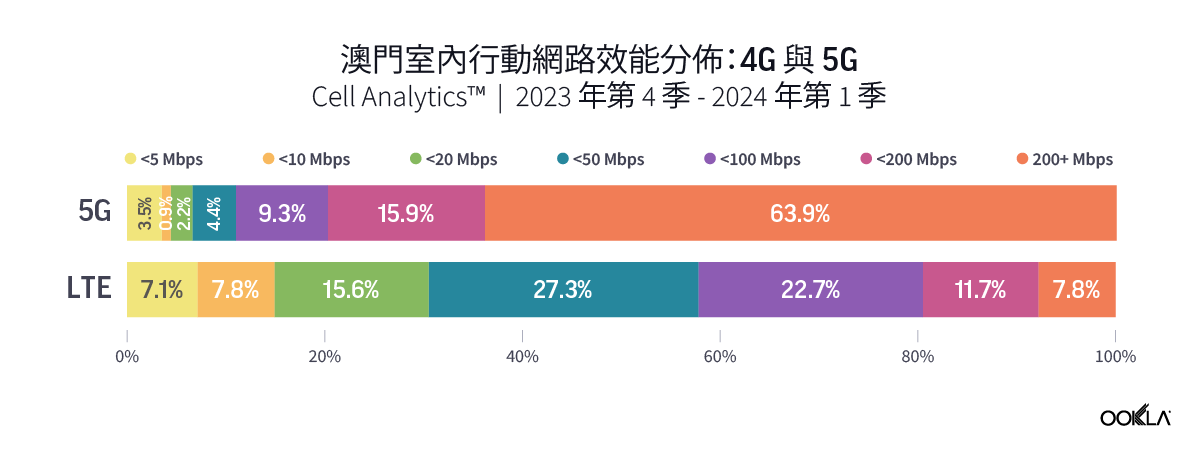
Ookla’s data for Q4 2023 to Q1 2024 reveal a higher percentage of users experiencing significant performance improvement when connected to 5G networks indoors. In Guangzhou and Shenzhen, over 45% of indoor 5G samples achieved speeds of 200 Mbps or higher, while only approximately 15% of 4G users experienced the same speed. The percentage is much higher in Macau, where more than 60% of indoor 5G users were on speeds of more than 200 Mbps, as compared to only 7.8% for those on 4G indoor networks.

Significant variations in 5G coverage among operators in Guangzhou, while operators in other cities exhibit only minor differences

Given the increasing reliance on mobile services for commercial transactions, ensuring uninterrupted 5G connectivity within buildings is paramount for service providers and building owners, particularly in buildings with a high concentration of users. This can be achieved by deploying advanced technologies such as small cells, distributed antenna systems (DAS), and network function virtualization (NFV). This enhances the consumer experience and adds substantial value to businesses by enabling various digital services, such as 8K video, augmented and virtual reality, and the Internet of Things (IoT). The building tenants can also leverage the 5G network to connect video cameras, point-of-sale (PoS) devices, and signage systems, which can attract customers who rely on mobile services for digital store deals and commercial transactions.

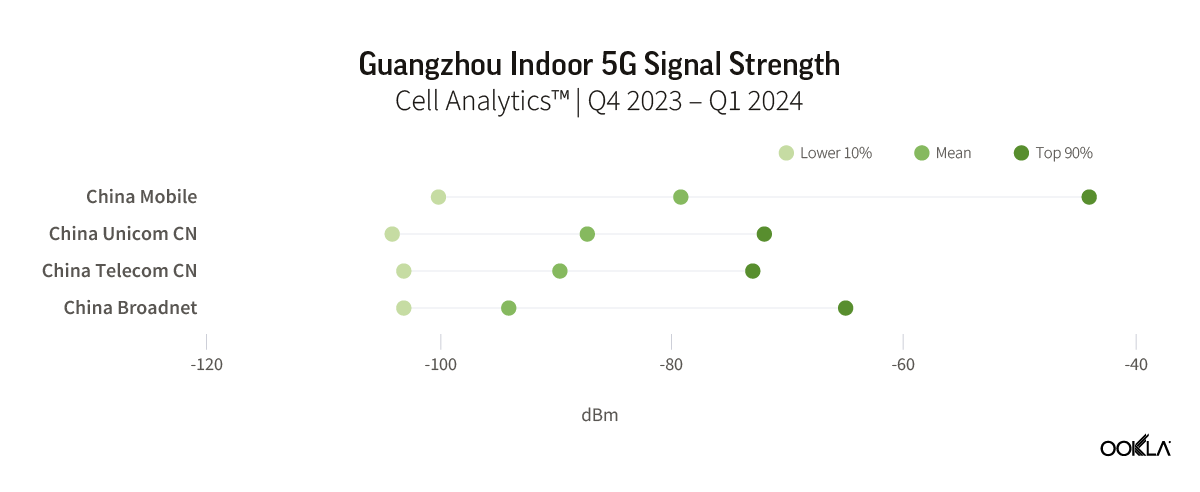
Through Cell Analytics data, we compared the 5G signal strength (RSRP) of top operators in Guangzhou, Shenzhen, Hong Kong, and Macau from Q4 2023 to Q1 2024. For each location, we compare operators’ RSRP values of samples detected inside buildings with a height of more than 10 meters to determine which ones offer better 5G coverage.

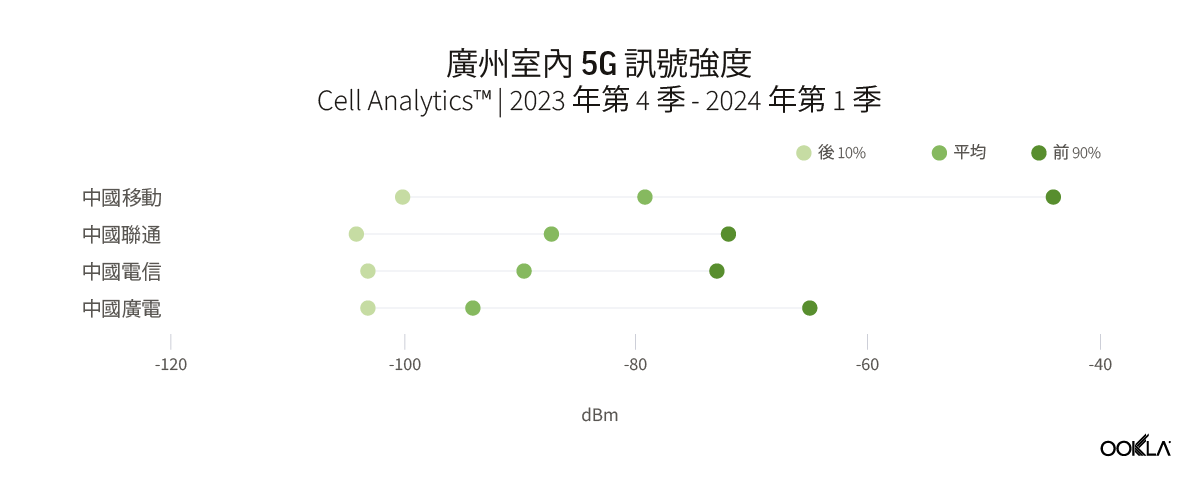
In Guangzhou, China Mobile had the best indoor 5G coverage across the city. Their weighted mean RSRP was -79.2 dBm, which is around 8 dB stronger than China Unicom’s mean RSRP of -87.2 dBm. The Upper 90% of China Mobile’s 5G network users reported a strong signal strength with an RSRP of -44 dBm when they were indoors. This indicates that there could be more buildings with dedicated wireless 5G networks in the city.

Chart of Guangzhou Indoor 5G Signal Strength

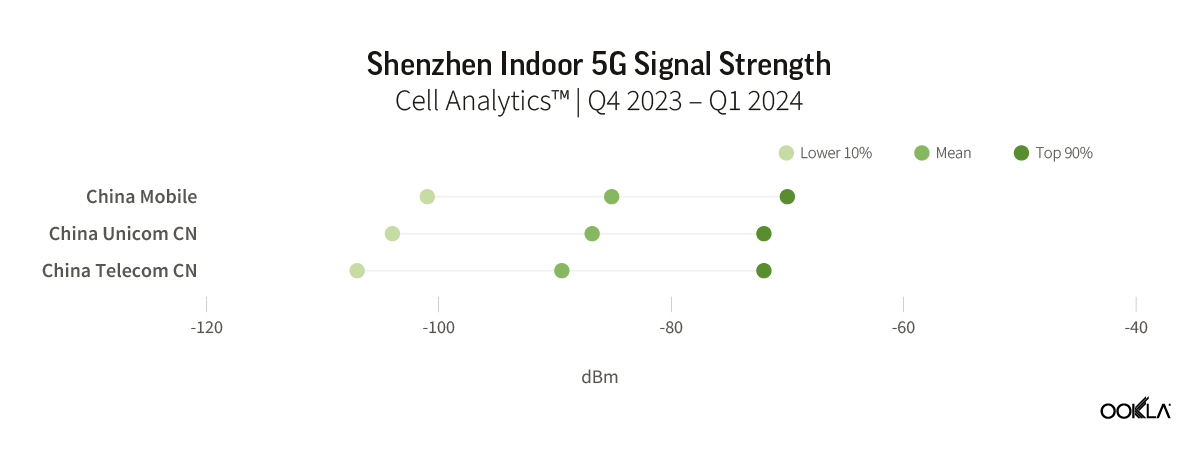
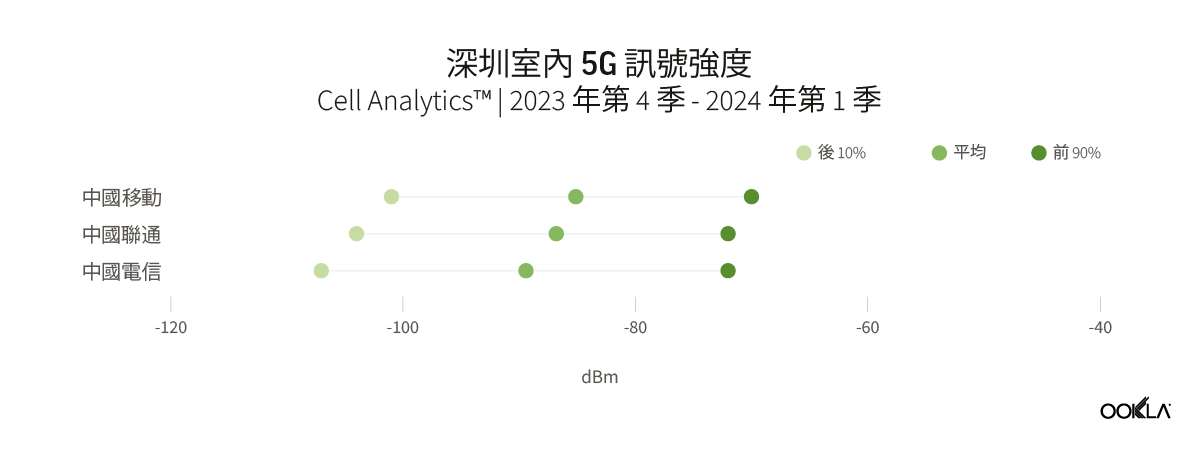
The three service providers in Shenzhen reported a small variation in their 5G indoor signal strength. China Mobile had a slightly better mean RSRP at -85.1 dBm, compared to China Unicom’s -86.8 dBm and China Telecom’s -89.4 dBm. Overall, there is unlikely to be a significant difference in 5G coverage when indoors, and consumers in the city may not notice any major differences. During the period, there were insufficient samples available for China Broadnet to be included in the analysis.

Chart of Shenzhen Indoor 5G Signal Strength

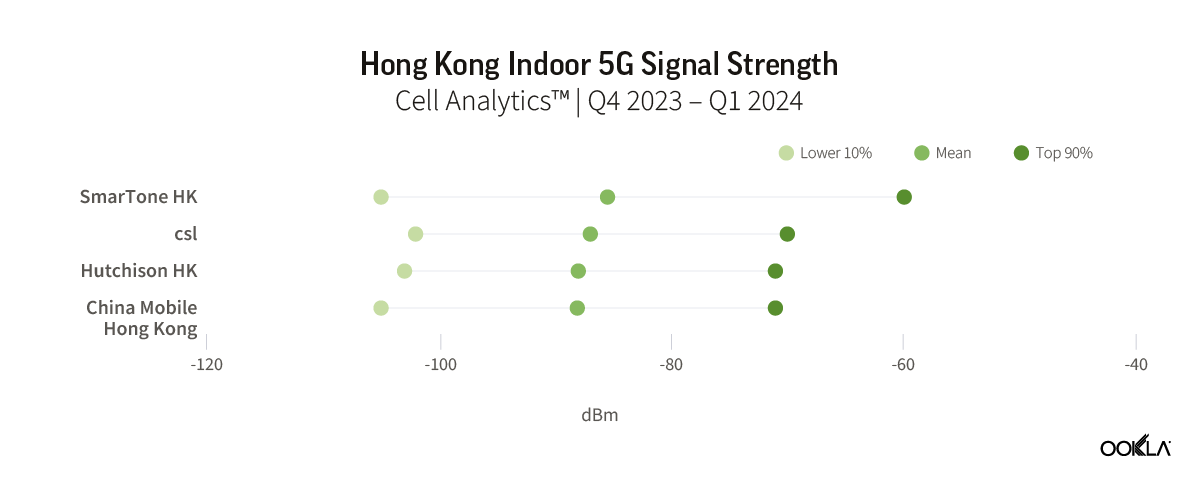
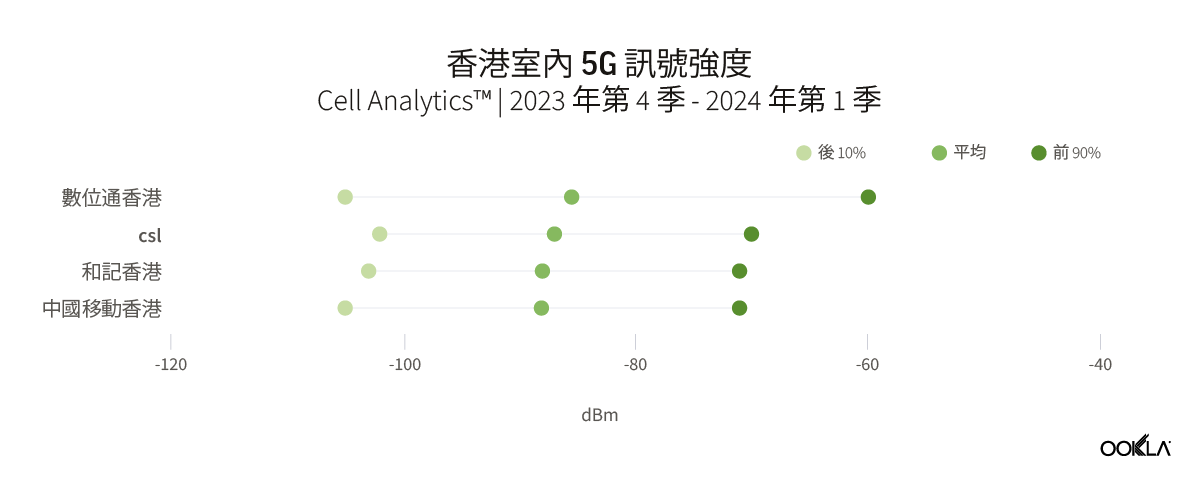
In Hong Kong, much like what was observed in Shenzhen, the difference in average signal strength among the top four telecom operators was marginal. Between Q4 2023 and Q1 2024, the difference in the mean RSRP between the carriers was only 1.5 dB. SmarTone stood out slightly by having the highest RSRP at -85.5 dBm. This indicates a competitive and closely matched performance among the operators, with opportunities for further improvements in indoor connectivity and quality.

Chart of Hong Kong Indoor 5G Signal Strength

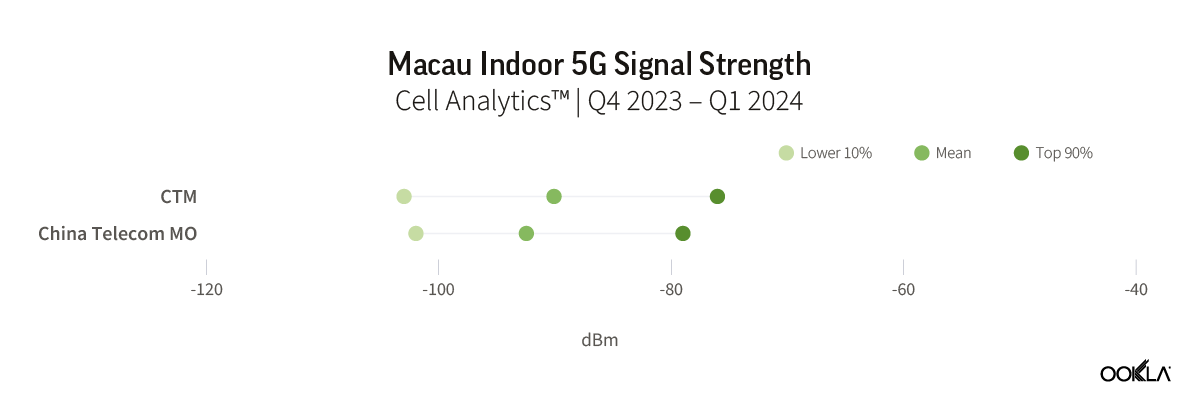
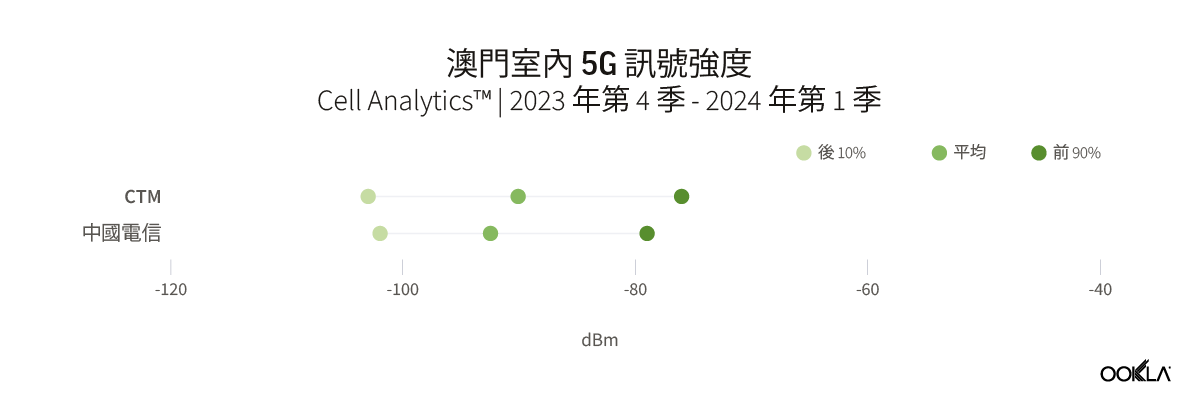
Macau is the most recent city in GBA to launch its 5G network, with CTM and China Telecom Macau receiving their 5G licenses in November 2022. In our previous report, we discussed how Macau, being a newly launched network, was rated higher than the other three cities in terms of overall 5G performance. However, the latest data reveals that in terms of indoor 5G signal strength, both operators are trailing behind other operators in the selected cities, except for China Broadnet in Guangzhou. Both CTM and China Telecom Macau reported 5G indoor mean RSCP lower than -90 dBm, with CTM at -90.1 dBm and China Telecom Macau at -92.5 dBm.

Chart of Macau Indoor 5G Signal Strength

The imperative of 5G indoor network expansion

With the increasing adoption of 5G technology, consumers are expecting faster network speeds and consistent connectivity. As most 5G data traffic is expected to occur indoors, prioritizing the expansion of indoor coverage is crucial for operators to meet users’ expectations. 5G indoor deployments are a strategic avenue for operators to monetize their investments through advances such as massive IoT (IoT), enhanced mobile broadband (eMBB), and fixed wireless access (FWA), which will all play an important role in transformation across sectors such as industrial automation, retail applications, and smart cities. The primary challenge lies in delivering consistent performance and quality across various indoor settings, where issues may be confined to certain floors or sections.

Regulators can have a proactive role in reducing bureaucratic hurdles and encouraging government-industry collaboration, such as promoting the parallel development of indoor and outdoor 5G coverage across the country. As a step towards prioritizing 5G indoor coverage, China’s Ministry of Industry and Information Technology (MIIT) mandated that operators share the mid-band spectrum (3.3-3.4 GHz) for indoor coverage to promote co-development and cost-sharing. 

There is also a significant push in the GBA to extend 5G coverage, making it readily available in public transport infrastructures. One such example is CSL, which provides 5G network coverage along the MTR lines in Hong Kong, with some routes utilizing dedicated 5G spectrum. 

Ookla can assist operators in identifying buildings or indoor venues with coverage or capacity issues using crowdsourced data and diagnosis. Powered by millions of signal measurements collected daily by Speedtest®, Cell Analytics provides intelligence about wireless service quality, RF measurements, data usage, user density, cell site locations, and much more. It helps operators to track their own and competitors’ performance and understand how new 5G deployments are affecting user experience and quality of service. To find out more about Cell Analytics, please get in touch.


探索大灣區 5G 網路室內鏈接

粵港澳大灣區 (GBA) 是過去 40 多年來,中國都市化最快的地區之一。該地區是全球摩天大樓最集中的地區,營運商必須優先考慮室內外 5G 無縫覆蓋,以優化服務並滿足客戶需求。

在本報告中,我們使用 Cell Analytics™ 的資料,檢驗廣州、深圳、香港和澳門這四個 GBA 主要城市的 5G 室內效能和訊號品質。

關鍵摘要

  • 與香港和澳門相比,廣州和深圳的全市室內 5G 覆蓋範圍和品質更好。廣州報告的平均 RSRP 為 -82.9 dBm,深圳略低,為 -87.0 dBm。此外,兩個城市的 5G 室內品質均較好,得分分別為 10.1 dB 和 11.0 dB。相比之下,香港的平均 RSRP 為 -87.4 dBm,而澳門為 -91.0 dBm。
  • 廣州移動因在該市提供更好的室內 5G 覆蓋而脫穎而出。該營運商的平均 RSRP 為 -79.17 dBm,以 8 dB 的差距,明顯優於中國聯通的平均 RSRP -87.2 dBm。其他城市營運商之間的 5G 室內訊號強度僅有微小差異,但在澳門,營運商的室內訊號強度明顯弱於其他選定城市的幾乎所有其他營運商。

大灣區城市室內 5G 流量持續上升

粵港澳大灣區普遍稱為大灣區 (GBA),由中國廣東地區九個城市及香港、澳門兩個特別行政區組成。由於鄰近,這些城市由廣泛的交通網絡連接起來,包括高鐵、橋樑和隧道。這裡是中國重要的經濟和技術中心,而 5G 技術的採用已成為該地區的關鍵驅動力,推動著各行各業轉型,並促進自動化和數位化。在我們最近的 文章中,我們深入研究了推動 5G 技術推出的因素,並研究了其在大灣區的表現。

室內涵蓋率對於 GBA 主要「中心」城市尤為重要,廣州、深圳、香港和澳門的高樓大廈主宰著天際線,室內空間在商業和旅遊活動中扮演著重要角色。在最近的這篇文章中,我們探討了解決室內蜂窩覆蓋挑戰的不同技術解決方案。

图形:最多建築物高度超過 150 公尺的城市

為了評估建築物內的 5G 涵蓋率,我們分析了 Ookla® Cell Analytics™ 的資料,以衡量在 2023 年第 1 季到 2023 年第 4 季期間,香港、澳門、深圳和廣州回報室內 5G 樣本的建築物比例。在此分析中,我們只考慮了高於 10 公尺的建築物,亦即典型三層樓以上建築的高度。

图形:大灣區 5G 覆蓋建築物比例

圖表顯示,從 2023 年第 1 季到 2023 年第 4 季,四個城市偵測到室內 5G 樣本的建築物數量,每一季均有增加。廣州、深圳和澳門在 2023 年第 1 季到 2023 年第 4 季期間的成長幅度均超過 30 個百分點,而香港在同一期間的成長幅度為 21 個百分點。 中國和特別行政區 5G 基地台數量大幅成長,是室內流量成長的驅動力。根據中國工業和資訊化部 (MIIT) 公告,在 2023 年底,中國有 338 萬座 5G 基地台,其中包括大量專用的 5G 室內基地台。

隨著 5G 流量持續激增,訂閱用戶為了獲得無縫的體驗,對最佳室內涵蓋率的要求也愈來愈高。滿足這些期望需要服務提供者制定全面的策略,以應對每個城市不同室內環境的獨特挑戰。

大灣區中心城市的 5G 室內涵蓋率與品質各不相同

我們深入研究 2023 年第四季至 2024 年第一季城市層級的 Cell Analytics 數據,透過測量平均參考訊號接收功率 (RSRP) 和參考訊號接收品質 (RSRQ) 來評估使用者的 5G 室內體驗。RSRP 代表手機接收到的網路訊號強度。RSRP 值超過 -90 dBm,表示涵蓋率優異。如果訊號強度在 -90 dBm 和 -100 dBm 之間,則認為網路覆蓋範圍良好。 低於此範圍,下載速度會變慢,並且可能會出現網路連線中斷的情況。RSRQ 是用於評估設備接收的參考訊號品質的指標。-10 dB 或更高的值表示網路品質極佳,介於 -10 dB 和 -15 dB 之間的值則是尚可。RSRQ 值低於 -15 dB 表示訊號較差或根本沒有訊號。

我們比較了 GBA 四個主要城市的平均 RSRP 和 RSRQ,並繪製出後 10% 與前 90% 之間的範圍,以檢視每個城市訊號強度和品質的差異。

图形:部分大灣區城市室內 5G 的後 10%、前 90% 和平均 RSRP

图形:部分大灣區城市室內 5G 的後 10%、前 90% 和平均 RSRQ

整體而言,中國城市廣州和深圳的 5G 室內覆蓋範圍優於香港和澳門。廣州報告在建築物內檢測到的所有樣本的加權平均 RSRP 為 -82.9 dBm,其次是深圳,RSRP 為 -87.0 dBm。與香港和澳門相比,這兩個城市的全市 5G 室內品質也更好,分別為 -10.1 dB 和 -11.0 dB。

資料顯示,這些城市中,前 10% 使用者和後 10% 的使用者在室內連接 5G 時,效能和品質有顯著差異。所有城市上 90%的樣本都具有非常好的 RSRP,範圍從澳門的-77 dBm 到廣州的-62 dBm。後 10% 的樣本則顯示訊號強度約為 -104 dBm。這說明雖然整體而言,使用者在室內能體驗到合理的 5G 平均速度,但在使用者集中的熱點,效能和涵蓋率體驗仍然不佳。

5G 性能提升凸顯對更好室內覆蓋的需求

雖然現在的室內 4G 和 Wi-Fi 網路可以滿足目前的連線需求,但擁有專用的室內 5G 網路,能夠提供更順暢、有效率的連線體驗,以滿足新的資料密集型使用案例和低延遲應用需求,彌補 4G 在延遲和效能方面的固有限制。

Ookla 2023 年第四季至 2024 年第一季的數據顯示,在室內連接 5G 網路時,體驗到效能顯著提升的用戶比例更高。在廣州和深圳,超過 45% 的室內 5G 樣本實現了 200 Mbps 或更高的速度,而只有約 15% 的 4G 使用者體驗到了相同的速度。該比例在澳門高出許多,室內 5G 使用者速度超過 200 Mbps 的比例超過 60%,4G 室內網路的使用者則僅有 7.8%。

廣州業者 5G 覆蓋差異較大,其他城市業者差異較小

由於商業交易愈來愈依賴行動服務,因此對服務提供者和建築物擁有者而言,確保建築物內的 5G 連線不中斷是首要之務,在使用者密集高的建築物中更是如此。這可以透過部署小型蜂窩、分散式天線系統 (DAS) 和網路功能虛擬化 (NFV) 等先進技術來實現。如此一來,就能夠提供 8K 影片、擴增實境和虛擬實境及物聯網 (IoT) 等多種數位服務,藉此提升用戶體驗,並為企業增加巨大價值。大樓租戶還可以利用 5G 網路連接攝影機、銷售點 (PoS) 設備和標牌系統,這可以吸引依賴行動服務進行數位商店交易和商業交易的客戶。

透過 Cell Analytics 資料,我們比較了廣州、深圳、香港和澳門頂尖營運商在 2023 年第 4 季到 2024 年第 1 季的 5G 訊號強度 (RSRP)。在每個地點,我們利用在超過 10 公尺高的建築物內偵測到的樣本,比較了營運商 RSRP 值,以判斷哪些城市提供的 5G 涵蓋率更佳。

在廣州,中國移動擁有全市最好的室內 5G 覆蓋範圍。他們的加權平均 RSRP 為 -79.2 dBm,比中國聯通的平均 RSRP -87.2 dBm 高出約 8 dB。中國移動前 90% 5G 網路使用者回報的室內訊號強度較強,為 RSRP -44 dBm。這表明該市可能會有更多擁有專用無線 5G 網路的建築物。

图形:廣州室內 5G 訊號強度

深圳的三家服務提供者報告其 5G 室內訊號強度略有差異。與中國聯通的 -86.8 dBm 和中國電信的 -89.4 dBm 相比,中國移動的平均 RSRP 略高,為 -85.1 dBm。總體而言,室內 5G 覆蓋範圍不太可能出現顯著差異,城市消費者可能不會注意到任何重大差異。在此期間,中國廣電沒有足夠的樣本可供分析。

图形:深圳室內 5G 訊號強度

在香港,與深圳的情況非常相似,四大電信業者之間的平均訊號強度差異微乎其微。2023 年第四季和 2024 年第一季之間,各載波之間的平均 RSRP 差異僅為 1.5 dB。SmarTone 的 RSRP 最高為 -85.5 dBm,稍微突出。這表明運營商之間的競爭和緊密匹配的表現,以及進一步改善室內連接和品質的機會。

图形:香港室內 5G 訊號強度

澳門是 GBA 最晚推出 5G 網路的城市,CTM 和中國電信 (澳門) 於 2022 年 11 月獲得 5G 執照。我們先前的報告討論過,澳門新推出的網路整體 5G 效能為何比其他三個城市更優異。然而,最新資料顯示,就室內 5G 訊號強度而言,除了廣州的中國廣電之外,這兩家營運商都落後於選定城市的其他營運商。CTM 和中國電信澳門均報告 5G 室內平均 RSCP 低於-90 dBm,其中 CTM 為-90.1 dBm,中國電信澳門為-92.5 dBm。

图形:澳門室內 5G 訊號強度

5G 室內網路擴容勢在必行

5G 技術日益普及,消費者對網路速度和連線穩定度的期望也隨之提高。由於大部分 5G 數據流量預計發生在室內,因此優先擴大室內覆蓋範圍對於營運商滿足用戶期望至關重要。營運商能夠經由 5G 室內部署這個策略途徑,透過大規模物聯網 (IoT)、增強型行動寬頻 (eMBB) 和固定無線接取 (FWA) 等先進技術,將投資變現。這些技術將在工業自動化、零售應用和智慧城市等領域的轉型中,佔有一席之地。主要挑戰在於在各種室內環境中提供一致的性能和質量,其中問題可能僅限於某些樓層或部分。

監管機構可以在減少官僚障礙和鼓勵政府與行業合作方面發揮積極作用,例如促進全國室內和室外 5G 覆蓋的並行發展。中國工業和資訊化部 (MIIT) 為了優先發展 5G 室內涵蓋率,要求營運商共享中頻段頻譜 (3.3-3.4 GHz),以促進共同開發和成本分攤。

大灣區也大力推動擴大 5G 覆蓋範圍,使其在公共交通基礎設施中隨時可用。其中一個例子是 CSL,他們在香港地鐵沿線提供 5G 網路涵蓋率,其中幾個路線使用了專用的 5G 頻譜。

Ookla 可以利用群眾外包的資料和診斷,協助營運商識別有涵蓋率或容量問題的建築物或室內場所。Cell Analytics 利用 Speedtest® 每天收集的數百萬個訊號測量資料,提供有關無線服務品質、RF 測量值、資料使用量、使用者密度、行動網路基地台位置等資訊的相關情報。它可以幫助營運商追蹤自己和競爭對手的表現,並了解新的 5G 部署如何影響用戶體驗和服務品質。要了解有關 Cell Analytics 的更多信息,請 與我們聯繫

Ookla retains ownership of this article including all of the intellectual property rights, data, content graphs and analysis. This article may not be quoted, reproduced, distributed or published for any commercial purpose without prior consent. Members of the press and others using the findings in this article for non-commercial purposes are welcome to publicly share and link to report information with attribution to Ookla.
| April 15, 2021

Speedtest Global Index Market Analyses Now Available for 21 Countries

Speedtest Global Index Market Analyses from Ookla® identify key data about internet performance in countries across the world. This quarter we’ve provided updated analyses for 21 markets about top mobile and fixed broadband providers as well as device and chipset manufacturers and some city-level data. Click a country in this list to see highlights or scroll through the article to learn about all 21 markets:

United States | Canada | China

Algeria | Austria | Belgium

Denmark | Finland | Hong Kong (SAR)

Hungary | Kenya | Luxembourg

Malta | Morocco | Nigeria

Portugal | Serbia | Slovakia

South Africa | Taiwan | Vietnam

Algeria

  • Mobile provider Ooredoo attained the best Speed Score and Consistency Score in Algeria during Q1 2021.
  • DJEZZY had the best 4G Availability in Algeria.
  • Devices from Apple provided the fastest mean download speeds in Algeria during Q1 2021 with 20.86 Mbps, 47.1% faster than Samsung.

Austria

  • A1 was the fastest mobile operator in Austria with a Speed Score of 66.21 while yesss! ranked second at 58.60.
  • yesss! edged out A1 for Consistency Score, earning a 93.8% to A1’s 93.5%.
  • Magenta blazed ahead of the competition with the fastest fixed broadband Speed Score of 123.45 and highest Consistency Score with 85.8%.

Belgium

  • Speedtest Intelligence® shows that Telenet had the fastest fixed broadband in Belgium during Q1 2021 with a Speed Score of 97.13, and it had the fastest Speed Score on mobile at 69.74.
  • Telenet also had the best fixed broadband Consistency Score with 87.9%, while BASE had the best mobile Consistency Score with 92.9%.
  • Ghent edged out Antwerp for Belgium’s fastest median download speed over mobile and fixed broadband.

Canada

  • In Q1 2021, Shaw was the fastest fixed broadband provider in Canada with a Speed Score of 164.40, edging out Rogers.
  • The fastest mobile provider was TELUS with a Speed Score of 87.54. Videotron had the highest mobile Consistency Score at 91.3%.
  • TELUS and Bell Canada tied for the lowest median latency for fixed broadband at 6 ms.
  • Newfoundland and Labrador had the fastest median fixed broadband speed among Canada’s provinces at 112.64 Mbps.
  • Calgary had Canada’s fastest median fixed broadband speed of any major city at 115.40 Mbps.

China

  • Speedtest Intelligence shows that China Mobile was the fastest mobile operator in China during Q1 2021 with a Speed Score of 101.62.
  • Competition for fastest median 5G performance was high, but China Telecom outpaced other providers with a 316.02 Mbps median download speed. Speedtest® results show that China Mobile’s 5G performance was second fastest with a median download speed of 308.44 Mbps and China Unicom was third.
  • Huawei’s P40 5G had the fastest median 5G download speed among the most popular devices in China at 291.77 Mbps. This contributed to Huawei’s top position as the device manufacturer with the fastest median download speed with a combined median download speed of 89.11 Mbps. That was 79.4% faster than the next fastest manufacturer, Apple.
  • China Telecom was the fastest fixed broadband provider, achieving a Speed Score of 107.10.
  • Tianjin was the Chinese city with the fastest fixed broadband with tests showing median download speeds of 180.61 Mbps, 29.7% faster than the next fastest city, Chengdu.

Denmark

  • According to Q1 data from Speedtest Intelligence, YouSee was the fastest mobile operator in Denmark with a Speed Score of 86.40.
  • Hiper was the fastest fixed broadband provider in Denmark with a Speed Score of 205.32.
  • The iPhone 12 Pro Max 5G was the fastest popular device in Denmark, with a median download speed of 96.90 Mbps.

Finland

  • Telia was the fastest fixed broadband provider in Finland during Q1 2021 with a Speed Score of 77.05. Telia was also the most consistent, earning a Consistency Score of 80.3%.
  • DNA had the fastest mobile Speed Score (61.73) as well as the highest Consistency Score (93.6%).
  • DNA also had the fastest 5G performance with a median download speed of 337.21 Mbps.

Hong Kong (SAR)

  • During Q1 2021, China Mobile Hong Kong was the fastest mobile provider in Hong Kong, achieving a Speed Score of 65.16.
  • Huawei’s P40 Pro 5G edged out Samsung’s Galaxy S20 Ultra 5G as the fastest popular device in Hong Kong. The P40 Pro 5G achieved a median download speed of 150.67 Mbps, beating the Galaxy 220 Ultra 5G by 1.5 Mbps.
  • Samsung had the best combined performance by a major cell phone manufacturer with its devices reaching mean download speeds of 76.41 Mbps.
  • Devices using Qualcomm’s Snapdragon 888 5G had the fastest mean download speed of any chipset at 137.76 Mbps. Devices with Hisilicon’s Kirin 990 came in second at 136.52 Mbps.

Hungary

  • Magyar Telekom had the fastest mobile Speed Score in Hungary during Q1 2021, as well as the best mobile Consistency Score (90.9%) and highest 4G availability (97.7%).
  • DIGI beat out Vodafone as the fastest fixed broadband provider in Hungary by attaining a Speed Score of 138.74 to Vodafone’s 137.06 and UPC’s 134.08.
  • Apple devices had the fastest median mobile download speeds among popular manufacturers at 36.59 Mbps.

Kenya

  • Safaricom had the fastest Speed Score among mobile providers in Kenya during Q1 2021 at 29.80 as well as the top mobile Consistency Score (86.3%) and highest 4G Availability (88.1%).
  • Mombasa had the fastest mean mobile download speed at 27.79 Mbps while Nairobi was the fastest over fixed broadband with a download speed of 22.65 Mbps.
  • Faiba had the fastest fixed broadband Speed Score at 22.70 and best Consistency Score at 44.0%.

Luxembourg

  • POST was Luxembourg’s fastest mobile operator in Q1 2021 as well as Luxembourg’s most consistent. POST had a Speed Score of 86.31 and a Consistency Score of 95.9%.
  • Orange had the best 4G Availability in Luxembourg at 98.7%.
  • Apple beat out Samsung as the fastest popular device manufacturer by earning a median download speed of 51.13 Mbps to Samsung’s 46.40 Mbps.
  • Tango had the fastest fixed broadband Speed Score at 120.35, while Eltrona had the best fixed broadband Consistency Score with 85.9%.

Malta

  • Mobile providers GO and epic were in close competition for the fastest Speed Score in Q1 2021. GO beat out epic by a fraction by scoring 47.82 to epic’s 47.36.
  • Apple devices had the fastest mean download speed in Malta among popular manufacturers at 51.31 Mbps.
  • Melita had the fastest fixed broadband Speed Score at 118.58 and highest fixed broadband Consistency Score at 84.2%.

Morocco

  • Maroc Telecom was the fastest provider for both fixed broadband and mobile in Morocco during Q1 2021. Maroc Telecom achieved the fastest mobile Speed Score (54.32) and the highest mobile Consistency Score (92.0%).
  • Maroc Telecom also narrowly beat out inwi for the highest 4G Availability with 91.5% to inwi’s 91.3%.
  • Apple devices had the fastest mean download speed in Morocco among popular manufacturers at 50.31 Mbps.
  • Casablanca had the fastest fixed broadband speeds, achieving a mean download speed of 25.93 Mbps while Marrakesh had the fastest mean mobile download speed at 38.33 Mbps.

Nigeria

  • During Q1 2021, tests showed that Airtel had Nigeria’s fastest mobile Speed Score (27.18) and best mobile Consistency Score (84.7%).
  • Port Harcourt had the fastest mean mobile download speed in Nigeria at 23.02 Mbps.
  • ipNX was the fastest fixed broadband provider with a Speed Score of 18.00. ipNX also had the best fixed broadband Consistency Score at 36.2%.

Portugal

  • Vodafone was the fastest fixed broadband provider in Portugal during Q1 2021 with a Speed Score of 113.75, the lowest mean latency (11 ms) and highest Consistency Score (81.9%).
  • MEO was the fastest mobile operator with a Speed Score of 46.92.
  • OnePlus had the fastest mean download speed of any popular device manufacturer at 56.93 Mbps.
  • Among Portugal’s most populous cities, Vila Nova de Gaia had the fastest mean fixed broadband download speed at 155.61 Mbps, while Braga had the fastest mean mobile download speed at 70.95 Mbps.

Serbia

  • During Q1 2021, SBB was Serbia’s fastest fixed broadband provider with a Speed Score of 78.09 and showed the highest Consistency Score of any provider at 81.3%.
  • Speedtest Intelligence revealed that Telenor narrowly edged out VIP for the fastest mobile Speed Score at 50.63 to VIP’s 50.47.
  • Telenor had the highest mobile Consistency Score with 93.4%. Telenor also delivered the highest 4G Availability in Serbia with 90.3%.
  • Devices using Qualcomm’s Snapdragon X55 5G delivered Serbia’s fastest median mobile download speeds at 76.14 Mbps.

Slovakia

  • During Q1 2021, UPC beat out Antik for the fastest fixed broadband operator in Slovakia with a Speed Score of 113.17 to Antik’s 110.46.
  • Antik had the lowest median fixed broadband latency in the country at 3 ms.
  • Orange had the fastest mobile Speed Score in the country with a score of 52.41, followed by Telekom at 49.09.
  • Devices using Samsung’s Exynos 2100 chipset achieved the fastest median download speed (70.13 Mbps).

South Africa

  • Speedtest Intelligence shows that MTN had the fastest mobile download Speed Score in South Africa during Q1 2021 at 54.38.
  • MTN also had the highest 4G Availability in the country with 90.5%.
  • Cool Ideas was the fastest fixed broadband provider in South Africa with a Speed Score of 37.80, followed by Afrihost at 31.32 and Webafrica at 30.87.
  • Johannesburg had the fastest mean fixed broadband download speed at 53.48 Mbps and the fastest download speed over mobile at 54.64 Mbps.

Taiwan

  • According to a Speedtest Intelligence, Chunghwa Telecom was the fastest mobile operator in Taiwan during Q1 2021 with a Speed Score of 71.73.
  • FarEasTone had the fastest median download speed on 5G at 361.48 Mbps.
  • Sony’s Xperia 1 II 5G achieved the fastest mean download speed among popular devices (181.93 Mbps). Apple devices overall attained the fastest mean mobile download speed among popular manufacturers (82.57 Mbps).
  • Taichung had the fastest mean download speed among Taiwan’s most populous cities at 83.35 Mbps. Taipei was second fastest with 80.50 Mbps.

United States

  • Speedtest Intelligence revealed that T-Mobile overtook AT&T in Q1 2021 as the fastest mobile operator in the United States, achieving a Speed Score of 50.21 to AT&T’s 48.38.
  • T-Mobile also had the fastest 5G performance of any operator, achieving a median download speed of 82.35 Mbps while having the highest 5G time spent in the country at 65.4%.
  • OnePlus devices had the fastest mean download speed among popular devices at 50.79 Mbps.
  • Qualcomm had all five of the fastest chipsets in the United States. The Snapdragon X55 5G was fastest with a median download speed of 66.63 Mbps, followed by the Snapdragon 888 5G at 64.63 Mbps and the Snapdragon 865 at 56.50 Mbps.
  • Verizon was the fastest fixed broadband provider with a Speed Score of 160.07, outperforming Cox and XFINITY, which scored 153.57 and 139.33, respectively.
  • Spectrum displayed the most consistent speeds among fixed broadband providers with a Consistency Score of 88.3%.
  • Verizon had the best median fixed broadband latency at 8 ms, while Cox ranked second (12 ms) and XFINITY third (14 ms).

Vietnam

  • Viettel achieved Vietnam’s fastest mobile and fixed broadband during Q1 2021. Viettel showed a Speed Score of 59.76 for fixed broadband and 38.55 for mobile.
  • Vinaphone had the best mobile Consistency Score with 91.1%.
  • Viettel had the highest 4G Availability with 94.4%.
  • Xiaomi’s Mi 10T Pro 5G achieved the fastest mean download speed at 80.17 Mbps and beat out Samsung’s Galaxy Note20 Ultra 5G, which had a median download speed of 59.96 Mbps.

Read the full market analyses and follow monthly ranking updates on the Speedtest Global Index.

The contents of this article are the property of Ookla, LLC and may not be copied, redistributed, published, displayed, performed, modified, exploited or used for commercial purposes, including use in advertisements or other promotional content, without express written permission. This includes, but is not limited to, data, written analysis, images, logos, charts and graphs and other items that may appear on this page. Members of the press, academics, non-profit researchers and others using the findings in this report for non-commercial purposes are welcome to publicly share and link to report information with attribution to Ookla. For more information, please contact press@ookla.com.
Ookla retains ownership of this article including all of the intellectual property rights, data, content graphs and analysis. This article may not be quoted, reproduced, distributed or published for any commercial purpose without prior consent. Members of the press and others using the findings in this article for non-commercial purposes are welcome to publicly share and link to report information with attribution to Ookla.
| July 15, 2021

Speedtest Global Index Market Analyses Now Available for 37 Countries

Speedtest Global IndexTM Market Analyses from Ookla® identify key data about internet performance in countries across the world. This quarter we’ve provided updated analyses for 37 markets that includes details on fastest mobile and fixed broadband providers, performance of most popular devices and chipsets and internet speeds in cities. Click a country on the list below to see highlights or scroll through the article to learn what Speedtest Intelligence® revealed in all 37 markets:

Africa and the Middle East

Algeria | Jordan | Kenya
Morocco | Nigeria | Qatar
South Africa | Tunisia | Turkey

Asia and Oceania

China | Hong Kong (SAR) | Indonesia
Malaysia | Singapore | Taiwan
Vietnam

Europe

Austria | Belgium | Czechia
Denmark | Finland | France
Germany | Hungary | Latvia
Luxembourg | Malta | Serbia
Slovakia | Spain

North and South America

Argentina | Brazil | Canada
Ecuador | Mexico | Peru
United States

Africa and the Middle East

Algeria

  • For the second quarter in a row, mobile provider Ooredoo had the highest Speed Score (24.27) and Consistency Score (84.5%) in Algeria during Q2 2021.
  • Apple devices achieved a mean download speed of 26.37 Mbps during Q2 2021, 26.4% faster than Apple’s speeds in Q1 2021 (20.86 Mbps).
  • The Apple iPhone 12 Pro Max 5G was the fastest popular device in Algeria with a mean download speed of 38.15 Mbps.

    Jordan

  • Fixed broadband provider Orange had the highest Speed Score (70.99) and Consistency Score (72.6%) in Jordan during Q2 2021.
  • Umniah achieved the fastest mobile Speed Score at 34.28 and best Consistency Score at 93.4%.
  • Amman had the fastest median fixed broadband download and upload speeds among the most populous cities in Jordan at 43.27 Mbps and 40.29 Mbps, respectively.
  • Among popular mobile devices, Apple’s iPhone 12 Pro Max 5G narrowly beat out the iPhone 12 Pro 5G for fastest median download and upload speeds at 36.06 Mbps and 17.90 Mbps.

    Kenya

  • Mobile provider Safaricom had the highest Speed Score (27.54) and Consistency Score (84.0%) in Kenya during Q2 2021, though both these scores were slightly lower than in Q1 2021.
  • For fixed broadband, Faiba was the provider that had the best Speed Score (23.19) and Consistency Score (43.9%) in Kenya during Q2 2021.
  • Mombasa had the fastest mean mobile download and upload speeds in Kenya’s most populous cities at 32.12 Mbps and 17.13 Mbps, respectively.
  • Eldoret had the fastest mean fixed broadband download speed in Kenya during Q2 2021 at 23.68 Mbps. Nairobi dropped three places from the fastest city for mean fixed broadband download speed during Q1 2021.

    Morocco

  • Fixed broadband provider Orange beat out Q1 2021 winner Maroc Telecom for fastest provider in Morocco with a Speed Score of 19.27, a 35.0% increase from Q1 2021.
  • For fixed broadband, Maroc Telecom continued to have the best Consistency Score at 32.4% during Q2 2021.
  • On mobile, Maroc Telecom achieved the best Speed Score (59.24) and Consistency Score (92.6%) during Q2 2021.
  • Salé surpassed Marrakesh as the fastest city among Morocco’s most populous cities with the fastest mobile download and upload speeds at 40.78 Mbps and 13.80 Mbps, respectively.

    Nigeria

  • For the second quarter in a row, mobile provider Airtel had the fastest Speed Score in Nigeria at 28.82 during Q2 2021. While MTN was second, it improved its Speed Score 37.9% quarter over quarter, 18.70 to 25.78.
  • MTN edged out Airtel’s Q1 2021 top spot for best Consistency Score on mobile during Q2 2021, 83.4% to Airtel’s 82.5%.
  • Fixed broadband provider ipNX continued to have the best Speed Score (19.25) and Consistency Score (39.6%) in Nigeria during Q2 2021.
  • Port Harcourt continued to have the best mobile mean download speeds of any Nigerian city at 26.34 Mbps, but Kano made huge strides forward, improving its download speed by 61.8% over Q1 2021.

    Qatar

  • Ooredoo had the best mobile and fixed broadband Speed Scores in Qatar during Q2 2021 at 149.01 and 69.45, respectively.
  • 5G performance was extremely competitive with Ooredoo achieving the fastest median 5G download speed at 393.89 Mbps, while Vodafone achieved 354.27 Mbps.
  • Ooredoo also had the best fixed broadband Consistency Score at 81.5%.
  • Vodafone had the best mobile Consistency Score at 93.7%, edging out Ooredoo’s 92.9%.
  • Umm Salal Muhammed had the fastest median mobile and fixed broadband download speeds in Qatar at 147.65 Mbps and 80.57 Mbps, respectively.
  • Speedtest Intelligence reveals that among popular devices, Samsung’s Galaxy S21 Ultra 5G achieved the fastest median mobile download speed at 284.32 Mbps, edging out Apple’s iPhone 12 Pro Max 5G (278.42 Mbps).

    South Africa

  • Speedtest Intelligence shows Cool Ideas had the fastest fixed broadband Speed Score (45.76) and Consistency Score (65.4%) during Q2 2021. That was an increase in Speed Score of 21.1% from Q1 2021.
  • Among mobile providers, MTN had the fastest Speed Score (60.44) and best Consistency Score (90.5%).
  • Apple devices had the fastest combined mean download speed at 52.59 Mbps and fastest mean upload speed at 12.22 Mbps during Q2 2021. The iPhone 12 Pro Max 5G took top honors as the fastest popular device, achieving a mean download speed of 93.36 Mbps.
  • Johannesburg had the fastest mean fixed broadband and mobile download speeds during Q2 2021 at 61.85 Mbps and 58.06 Mbps, respectively.

    Tunisia

  • During Q2 2021, Ooredoo achieved the highest mobile Speed Score in Tunisia at 46.47.
  • Tunisie Telecom edged out Ooredoo for the highest fixed broadband Speed Score with 9.07 and 8.28, respectively.
  • Apple’s iPhone 12 Pro Max 5G had the fastest mean download speed in Tunisia among popular devices during Q2 2021 at 73.21 Mbps.
  • Among popular chipsets, Qualcomm’s Snapdragon X55 5G had the fastest mean download speed at 70.43 Mbps.
  • Sfax had the fastest mean mobile download speed in Tunisia during Q2 2021 at 45.53 Mbps.

    Turkey

  • Speedtest Intelligence revealed mobile provider Turkcell had the highest Speed Score and Consistency Score in Turkey during Q2 2021 at 61.39 and 93.2%, respectively.
  • For fixed broadband, Turksat Kablo had the highest Speed Score (35.67).
  • During Q2 2021, Turknet had the highest Consistency Score for fixed broadband at 66.6%.
  • Istanbul had the fastest mean fixed broadband and mobile download speed at 40.16 Mbps and 50.21 Mbps, respectively.
  • Among top device manufacturers, Apple beat out Samsung for fastest mean download speed at 51.62 Mbps to 41.69 Mbps.

    Asia and Oceania

    China

  • According to Speedtest Intelligence, China Telecom was the fastest fixed broadband provider in China during Q2 2021 with a Speed Score of 117.02, 9.3% higher than Q1 2021.
  • However, China Mobile continued to have the highest Consistency Score in China for fixed broadband during Q2 2021 at 90.0%, edging out China Telecom’s 86.8% and China Unicom’s 86.5%.
  • China Mobile achieved the highest Speed Score (113.06) and Consistency Score (92.1%) among China’s top mobile providers during Q2 2021.
  • During Q2 2021, China Telecom achieved a median 5G download speed of 304.55 Mbps, edging out China Mobile’s 303.44 Mbps. China Unicom was third at 292.04 Mbps.
  • Among top device manufacturers, Huawei had the fastest median download speed at 86.33 Mbps in China during Q2 2021. Vivo followed at 56.68 Mbps, then Xiaomi (56.48 Mbps), Oppo (55.35 Mbps) and Apple (49.65 Mbps).
  • Among popular devices, Huawei also dominated. The Huawei P40 Pro 5G had the fastest median download speed in China during Q2 2021 at 287.18 Mbps.
  • During Q2 2021, Huawei’s Kirin 9000 5G was the fastest chipset in China, achieving a median download speed of 284.74 Mbps.
  • Tianjin had the fastest median fixed broadband download speed among China’s most populous cities at 199.91 Mbps, 10.7% faster than its first place Q1 2021 results.
  • Hangzhou had the fastest median mobile download speed among China’s most populous cities at 72.97 Mbps, followed closely by Shenzhen at 70.74 Mbps and Nanjing at 69.22 Mbps.

    Hong Kong (SAR)

  • For the second quarter in a row, China Mobile Hong Kong was the fastest mobile operator in Hong Kong, earning a Speed Score of 72.21 in Q2 2021, 10.8% higher than Q1 2021.
  • China Mobile Hong Kong also blazed ahead of the competition for the fastest 5G download speed, achieving a median speed of 218.60 Mbps during Q2 2021, 7.2% faster than its Q1 2021 results. Mobile provider 3 followed at 165.35 Mbps, csl at 134.75 Mbps and SmarTone at 124.31 Mbps.
  • Among top manufacturers during Q2 2021, Samsung had the fastest median download speed at 44.68 Mbps.
  • Samsung devices also took the top four spots for fastest popular devices in Hong Kong during Q2 2021 with the Galaxy S20 Ultra 5G achieving the top spot at 124.25 Mbps, edging out the Galaxy S21 Ultra 5G’s 123.28 Mbps.
  • During Q2 2021, Qualcomm’s Snapdragon 888 5G achieved the fastest median download speed among modern chipsets at 111.91 Mbps.

    Indonesia

  • According to Speedtest Intelligence, Biznet was Indonesia’s fastest fixed broadband provider during Q2 2021, earning a Speed Score of 40.66. MyRepublic was second at 35.63.
  • Biznet also had the highest Consistency Score in Indonesia during Q2 2021, edging out MyRepublic 66.6% to 63.5%.
  • Telkomsel was the fastest major mobile provider in Indonesia during Q2 2021, earning a Speed Score of 28.02. Telkomsel also achieved the top Consistency Score at 84.1%, beating out IM3 Ooredoo’s 83.5%.
  • Jakarta had the fastest mean fixed broadband download speed of Indonesia’s most populous cities at 32.86 Mbps, while Tangerang achieved the fastest mean mobile download speed at 24.69 Mbps.

    Malaysia

  • During Q2 2021, Speedtest Intelligence reveals that TIME was the fastest fixed broadband provider in Malaysia, earning a Speed Score of 116.36. TIME also achieved the highest Consistency Score (86.7%).
  • On mobile, Digi edged out Maxis for the fastest mobile provider, earning a Speed Score of 30.20 to Maxis’ 29.92. U Mobile was third at 27.40.
  • Apple earned the top spot as Malaysia’s fastest device manufacturer during Q2 2021, with Apple devices achieving a mean download speed of 34.22 Mbps. Samsung was second at 28.77 Mbps and Huawei third at 27.68 Mbps.
  • Among Malaysia’s most populous cities, Nusajaya had the fastest mean fixed broadband speed during Q2 2021, achieving 125.88 Mbps download and 81.29 Mbps upload. Petaling Jaya was second, achieving 122.91 Mbps download and 82.56 Mbps upload.
  • Nusajaya also had the fastest mean mobile download speed at 38.51 Mbps during Q2 2021.

    Singapore

  • Speedtest Intelligence shows ViewQuest was the fastest fixed broadband provider in Singapore in Q2 2021, achieving a Speed Score of 268.70.
  • During Q2 2021, Singtel was the fastest mobile provider in Singapore, achieving a Speed Score of 83.83.
  • Singtel also blew the competition away for fastest median 5G download speed at 189.55 Mbps during Q2 2021. M1 was second at 110.43 Mbps.
  • Apple edged out Samsung for fastest device manufacturer during Q2 2021, with Apple devices achieving a mean download speed of 87.66 Mbps to Samsung’s 85.48 Mbps. Oppo followed in third with 82.10 Mbps.

    Taiwan

  • Speedtest Intelligence® reveals Chunghwa Telecom was the fastest mobile operator among top providers in Taiwan in Q2 2021 with a Speed Score of 66.47 on modern chipsets — edging out FarEasTone’s 64.46.
  • During Q2 2021, Chunghwa Telecom surpassed FarEasTone as the fastest 5G provider in Taiwan. Chunghwa Telecom achieved a blazing median download speed of 471.73 Mbps — 42.2% faster than its Q1 2021 median download speed.
  • FarEasTone had the highest Consistency Score in Taiwan during Q2 2021 at 92.1%. Chunghwa Telecom followed at 89.4% and Taiwan Mobile was third at 87.5%.
  • Among top device manufacturers during Q2 2021, Apple devices achieved the fastest mean download speed at 79.30 Mbps, edging out Oppo (77.53 Mbps) and Samsung (74.23 Mbps).
  • The Sony Xperia 1 II 5G had the fastest mean download speed at 235.44 Mbps during Q2 2021.

    Vietnam

  • Viettel once again claimed the top spot as Vietnam’s fastest mobile and fixed broadband provider during Q2 2021, earning a mobile Speed Score of 44.16 and fixed broadband Speed Score of 66.77.
  • Viettel also achieved the best fixed broadband Consistency Score at 80.9%, tightly edging out FPT Telecom’s 80.0% and Vinaphone’s 79.6% for the fastest mean fixed broadband download speed
  • Vinaphone had the highest mobile Consistency Score at 94.1%.
  • Apple’s iPhone 12 Pro 5G had the fastest mean download speed at 99.43 Mbps.
  • Ho Chi Minh City overtook the top spot for the fastest mean fixed broadband download speed among Vietnam’s most populous cities with 77.14 Mbps (69.92 Mbps upload).
  • Hanoi edged out Ho Chi Minh City (43.70 Mbps) and Da Nang (43.22 Mbps) for fastest mean mobile download speed at 43.83 Mbps.

    Europe

    Austria

  • Magenta retained its top spot as Austria’s fastest fixed broadband provider, increasing its Speed Score 28.8% from Q1 2021 from 123.45 to 158.94 in Q2 2021.
  • Magenta also had the highest Consistency Score at 88.8% for fixed broadband in Q2 2021.
  • A1 was the fastest mobile provider in Austria during Q2 2021, achieving a Speed Score of 72.64. yesss! followed at 62.49.
  • For the second quarter in a row, yesss! narrowly edged out A1 for the highest mobile Consistency Score in Austria with yesss! achieving 93.7% and A1 achieving 93.4%. Magenta Telekom ad 3 followed at 90.5%.

    Belgium

  • During Q2 2021 — much like Q1 2021 — Telenet and VOO had a fierce competition for Belgium’s fastest fixed broadband provider. However, Telenet earned the top spot again, achieving a Speed Score of 104.24 to VOO’s 102.64.
  • VOO also challenged Telenet for the highest Consistency Score for fixed broadband providers, but Telenet edged VOO out for the top place, 87.8% to 86.8%.
  • Among mobile providers, Telenet fended off competition from BASE as the fastest mobile provider, earning a mobile Speed Score of 72.34 to BASE’s 68.50.
  • Antwerp overtook Ghent for the fastest median fixed broadband download speed 81.31 Mbps to Ghent’s 80.13 Mbps.
  • However, Ghent retained its top place for fastest median mobile download speed among Belgium’s most populous cities achieving a median speed of 72.56 Mbps during Q2 2021.

    Czechia

  • Speedtest Intelligence reveals T-Mobile was Czechia’s fastest mobile provider during Q2 2021, earning a Speed Score of 60.73.
  • However, Vodafone claimed the best mobile Consistency Score during Q2 2021, earning 94.6% to O2’s 91.1%.
  • There was no statistical winner for fastest median 5G download speed in Czechia during Q2 2021, though O2 achieved a median download speed of 128.01 Mbps and T-Mobile achieved 124.69 Mbps.
  • Vodafone dominated as Czechia’s fastest fixed broadband provider during Q2 2021. Vodafone achieved a Speed Score of 100.26.
  • Vodafone also had the best Consistency Score for fixed broadband during Q2 2021 at 79.4%.
  • Pilsen had the fastest mean fixed broadband speeds among Czechia’s most populous cities, achieving a mean download of 111.01 Mbps and a mean upload of 82.82 Mbps.

    Denmark

  • During Q2 2021 in Denmark, Fastspeed was the fastest fixed broadband provider, earning a Speed Score of 303.16 — an increase of 47.7% from Q1 2021. Hiper was second at 231.14 and Fibia third at 164.80.
  • YouSee once again earned the top spot as Denmark’s fastest mobile provider during Q2 2021, achieving a Speed Score of 91.19.
  • An analysis of performance on some of the most popular phones in Denmark revealed the iPhone 12 Pro Max 5G had the fastest median download speed during Q2 2021 at 111.80 Mbps. The iPhone Pro 5G was second at 109.79 Mbps, edging out the iPhone 12 5G at 109.63 Mbps.

    Finland

  • According to Speedtest Intelligence, DNA retained its top spot as Finland’s fastest mobile provider in Q2 2021, earning a Speed Score of 68.20. DNA also edged out Telia for the highest Consistency Score, achieving 90.9% to Telia’s 90.0%.
  • Telia overtook DNA in Q2 2021 as Finland’s fastest 5G provider, achieving a median download speed of 304.22 Mbps to DNA’s 276.20 Mbps.
  • Telia retained its top spot as the fastest fixed broadband provider during Q2 2021, increasing its Speed Score 11.2% from Q1 2021. Telia was also the most consistent, achieving a Consistency Score of 82.7%.
  • Among popular device manufacturers, OnePlus had the fastest median download speed in Finland during Q2 2021 at 67.23 Mbps. However, the Samsung Galaxy S21 Ultra 5G had the fastest median download speeds among major devices at 121.57 Mbps.

    France

  • Speedtest Intelligence revealed a fierce competition for France’s fastest fixed broadband provider during Q2 2021, though Orange narrowly edged out Free with a Speed Score of 117.15 to 115.89.
  • SFR achieved the highest Consistency Score at 68.2%.
  • Orange earned the top spot as France’s fastest and most consistent mobile provider, earning a mobile Speed Score of 81.00 and a Consistency Score of 89.9%.
  • Orange also blew away the competition as France’s fastest 5G provider by achieving a median 5G download speed of 345.10 Mbps. SFR was next fastest at 204.98 Mbps.
  • Lyon achieved the fastest median fixed broadband download and upload speeds at 127.51 Mbps and 93.46 Mbps, respectively. Nice had the fastest median mobile download speed at 64.63 Mbps.

    Germany

  • According to Speedtest Intelligence, Vodafone was Germany’s fastest fixed broadband provider during Q2 2021, earning a Speed Score of 120.68.
  • 1&1 edged out Vodafone for the highest Consistency Score, 80.4% to Vodafone’s 79.3%.
  • For mobile providers, Telekom achieved the highest Speed Score (76.79) and Consistency Score (91.7%) during Q2 2021.
  • O2 was the fastest 5G provider during Q2 2021 earning the fastest median 5G download speed at 172.24 Mbps. Telekom followed at 154.30.
  • The iPhone 12 Pro 5G had the fastest median download speed among popular devices in Germany during Q2 2021, edging out the iPhone 12 Pro Max 5G 92.25 Mbps to 91.94 Mbps.

    Hungary

  • Vodafone overtook DIGI as Hungary’s fastest fixed broadband provider in Q2 2021, achieving an 8.6% increase in Speed Score from 137.06 in Q1 2021 to 148.79. Vodafone retained the top spot for highest Consistency Score at 87.2% during Q2 2021.
  • Magyar Telekom retained its top spot as Hungary’s fastest and most consistent mobile provider during Q2 2021, earning a Speed Score of 52.59 and Consistency Score of 90.9%.
  • OnePlus overtook Apple during Q2 2021 as the fastest device manufacturer, with OnePlus devices achieving a combined median download speed of 47.29 Mbps to Apple’s 41.81 Mbps.
  • However, Apple’s iPhone 12 Pro Max 5G achieved the fastest median download speed among popular devices during Q2 2021, with an increase in download speed of 17.3% from 70.12 Mbps in Q1 2021 to 82.22 Mbps in Q2 2021.

    Latvia

  • Speedtest Intelligence revealed that Balticom was the fastest and most consistent fixed broadband provider in Latvia during Q2 2021 achieving a Speed Score of 171.56 and Consistency Score of 90.5%.
  • LMT was the fastest provider in Latvia during Q2 2021 with a Speed Score of 41.13.
  • Tele2 narrowly edged out BITE and LMT as Latvia’s most consistent provider, earning a Consistency Score of 86.0% to BITE’s 85.1% and LMT’s 83.3%.
  • Olaine had the fastest median fixed broadband download and upload speeds, 94.16 Mbps and 94.51 Mbps, respectively.

    Luxembourg

  • Tango retained its top spot as Luxembourg’s fastest fixed broadband provider during Q2 2021 by achieving a Speed Score of 125.73, an increase of 4.5% over Q1 2021.
  • Tango and Eltrona tied for the highest Consistency Score during Q2 2021 at 86.3%.
  • POST again was the fastest mobile provider in Luxembourg during Q2 2021, achieving an 18.3% increase in Speed Score from 86.31 in Q1 2021 to 102.09 in Q2 2021. POST also remained the most consistent provider with a Consistency Score of 96.3%.
  • Among Luxembourg’s most populous cities, Differdange achieved the fastest median fixed broadband download and upload speeds at 131.26 Mbps and 93.32 Mbps, respectively.
  • Ettelbruck had the fastest median mobile download and upload speeds at 117.76 Mbps and 21.64 Mbps, respectively.

    Malta

  • Melita retained its top spot as Malta’s fastest and most consistent fixed broadband provider during Q2 2021, earning a Speed Score of 113.64 and Consistency Score of 83.9%.
  • GO was Malta’s fastest and most consistent mobile provider during Q2 2021, achieving a Speed Score of 56.36 and Consistency Score of 92.8%.
  • Among popular devices, Apple’s iPhone 12 Pro Max 5G achieved the fastest mean download speed at 75.81 Mbps.

    Serbia

  • SBB retained its top spot as Serbia’s fastest and most consistent fixed broadband provider during Q2 2021 with a Speed Score of 81.09 and Consistency Score of 81.8%.
  • A1 knocked Telenor out of the top place during Q2 2021 as Serbia’s fastest mobile provider, achieving a Speed Score of 54.26 to Telenor’s 49.99.
  • A1 and Telenor tied for the most consistent provider by earning a Consistency Score of 92.5%. mts trailed at 91.0%
  • The fastest chipset in Serbia during Q2 2021 was Qualcomm’s Snapdragon X55 5G, which had a median download speed of 74.21 Mbps. Samsung’s Exynos 2100 was second at 57.97 Mbps and Hisilicon’s Kirin 990 at 57.49 Mbps.

    Slovakia

  • Telekom knocked Orange out of first place as Slovakia’s fastest mobile operator during Q2 2021 with a Speed Score of 58.17 to Orange’s 56.22. Telekom increased its Speed Score 18.5% from Q1 2021 to Q2 2021.
  • UPC retained its top spot as Slovakia’s fastest and most consistent fixed broadband provider with a Speed Score of 139.35 — an increase of 23.1% from Q1 2021 — and a Consistency Score of 87.2%.
  • The Apple iPhone 12 Pro Max 5G had the fastest median download speed among popular devices at 86.11 Mbps during Q2 2021, an increase of 33.3% over Q1 2021.

    Spain

  • DIGI sped ahead of the competition, earning its place as fastest and most consistent fixed broadband provider in Q2 2021 with a Speed Score of 259.90 and Consistency Score of 91.5%. Orange was second at 154.03, Movistar third (139.65) and Yoigo fourth (134.71).
  • Movistar provided the fastest and most consistent mobile experience among Spanish mobile providers with a Speed Score of 58.47 and Consistency Score of 90.8%.
  • Vodafone more than doubled its closest competitor as Spain’s fastest 5G provider by achieving a median download speed of 322.81 Mbps.
  • Madrid had the fastest median fixed broadband download and upload speeds at 142.97 Mbps and 111.48, respectively, as well as the fastest median mobile download speed at 41.66 Mbps. Barcelona trailed closely behind for fixed broadband at 134.73 Mbps download and 104.54 Mbps upload, as well as for mobile download at 40.10 Mbps.

    North and South America

    Argentina

  • Telecentro achieved the highest fixed broadband Speed Score (57.16) in Argentina during Q2 2021.
  • Speedtest Intelligence revealed Personal was the fastest mobile operator in Argentina during Q2 2021 with a Speed Score of 38.49.
  • Buenos Aires achieved the fastest mean fixed broadband download speed among Argentina’s most populous cities, recording a download speed of 77.79 Mbps.
  • For mobile download speeds, La Plata recorded the fastest mean mobile download speed in Argentina at 40.28 Mbps during Q2 2021.

    Brazil

  • Speedtest Intelligence reveals Claro was the fastest and most consistent mobile operator in Brazil among top providers during Q2 2021, achieving the highest Speed Score of 42.61 and Consistency Score of 87.8%.
  • Vivo was the fastest fixed broadband provider among top providers in Brazil in Q2 2021 with a Speed Score of 93.23.
  • Among Brazil’s most populous cities, seven cities achieved mean fixed broadband download speeds of over 100 Mbps, with Goiânia having the fastest download and upload speeds at 130.15 Mbps and 76.98 Mbps, respectively.
  • Brasilia had the fastest mean mobile download speed at 43.74 Mbps.

    Canada

  • Shaw and Rogers blazed above the competition for Canada’s fastest fixed broadband providers in Q2 2021, earning Speed Scores of 181.66 and 179.95, respectively.
  • Rogers edged out Shaw for the highest Consistency Score in Canada during Q2 2021 by earning 89.0% to Shaw’s 87.0%.
  • TELUS retained its top spot as the fastest mobile operator in Canada during Q2 2021, achieving a Speed Score of 82.93.
  • Videotron also retained its top spot during Q2 2021 as Canada’s most consistent mobile operator, achieving a Consistency Score of 89.6%.
  • Competition for the fastest median 5G download speed was competitive with no statistical winner during Q2 2021. Bell achieved a median download speed of 191.26 Mbps and TELUS achieved 184.45 Mbps.
  • Rogers achieved the highest 5G Availability in Canada during Q2 2021.
  • Newfoundland and Labrador retained its top spot as Canada’s fastest region for fixed broadband during Q2 2021, achieving a median download speed of 119.77 Mbps.
  • Calgary also retained its top spot among the most populous cities with the fastest median fixed broadband download speed at 129.60 Mbps. Winnipeg retained its top spot for mobile download speed by edging out Edmonton 93.12 Mbps to 91.25 Mbps.
  • Samsung devices had the fastest combined performance, achieving a median download speed of 70.72 Mbps. The Samsung Galaxy S21+ 5G edged out the Samsung Galaxy S21 Ultra 5G for the fastest popular device median download speed 141.44 Mbps to 137.97 Mbps.

    Ecuador

  • According to Speedtest Intelligence, Netlife was Ecuador’s fastest and most consistent fixed broadband provider during Q2 2021, achieving a Speed Score of 38.72 and Consistency Score of 69.6%.
  • CNT was the fastest and most consistent mobile operator in Ecuador during Q2 2021, achieving a Speed Score of 38.11 and Consistency Score of 86.9%.

    Mexico

  • Speedtest Intelligence reveals Telcel was Mexico’s fastest mobile operator during Q2 2021, earning a Speed Score of 47.80.
  • Telcel was also Mexico’s most consistent mobile operator, achieving a Consistency Score of 89.2%.
  • Veracruz showed the fastest mean mobile download and upload speeds among Mexico’s most populous cities during Q2 2021, recording a mean download speed of 46.24 Mbps and mean upload speed of 19.36 Mbps.
  • Apple devices had the five fastest mean download speeds in Mexico. The iPhone 12 Pro 5G narrowly beat out the iPhone 12 Pro Max 5G and iPhone 12 5G for the fastest popular device during Q2 2021, achieving respective speeds of 74.65 Mbps, 72.63 Mbps and 72.37 Mbps.

    Peru

  • Among Peru’s top providers, Claro was the fastest mobile provider during Q2 2021, achieving a Speed Score of 36.91.
  • Apple devices achieved the highest mean download speeds among top device manufacturers during Q2 2021, recording a mean download speed of 40.32 Mbps.
  • Among popular mobile devices, the Apple iPhone 12 Pro 5G had the fastest mean download speed at 80.30 Mbps. The Apple iPhone 12 Pro Max 5G was second at 77.02 Mbps and the Apple iPhone 12 5G third at 75.63 Mbps.

    United States

  • Speedtest Intelligence reveals Verizon was the fastest fixed broadband provider in the United States during Q2 2021, earning a Speed Score of 170.22 — 6.3% increase over Q1 2021.
  • Speedtest Intelligence also reveals that T-Mobile was the fastest and most consistent mobile operator in the United States during Q2 2021, achieving a median download speed of 54.13 Mbps and a Consistency Score of 84.8%.
  • After looking at tests taken only on 5G, T-Mobile achieved the fastest median 5G download speed during Q2 2021 at 99.84 Mbps, a 21.2% increase over Q1 2021.
  • During Q2 2021, T-Mobile had the best 5G Availability of 69.0%.
  • Mobile download speeds blazed ahead in the most populous U.S. cities during Q2 2021 with Tampa, Florida supplanting St. Paul, Minnesota as the fastest city for median mobile download speed during Q2 2021 at 79.75 Mbps, an increase of 14.6% over St. Paul’s fastest median speed during Q1 2021.
  • San Antonio, Texas knocked Gilbert, Arizona out of first place as the fastest city for fixed broadband among the United State’s most populous cities, edging out Raleigh, North Carolina with a median download speed of 183.60 Mbps to Raleigh’s 183.04 Mbps.

    Read the full market analyses and follow monthly ranking updates on the Speedtest Global Index. Want to see how your internet speeds compare? Take a Speedtest® now.

Ookla retains ownership of this article including all of the intellectual property rights, data, content graphs and analysis. This article may not be quoted, reproduced, distributed or published for any commercial purpose without prior consent. Members of the press and others using the findings in this article for non-commercial purposes are welcome to publicly share and link to report information with attribution to Ookla.
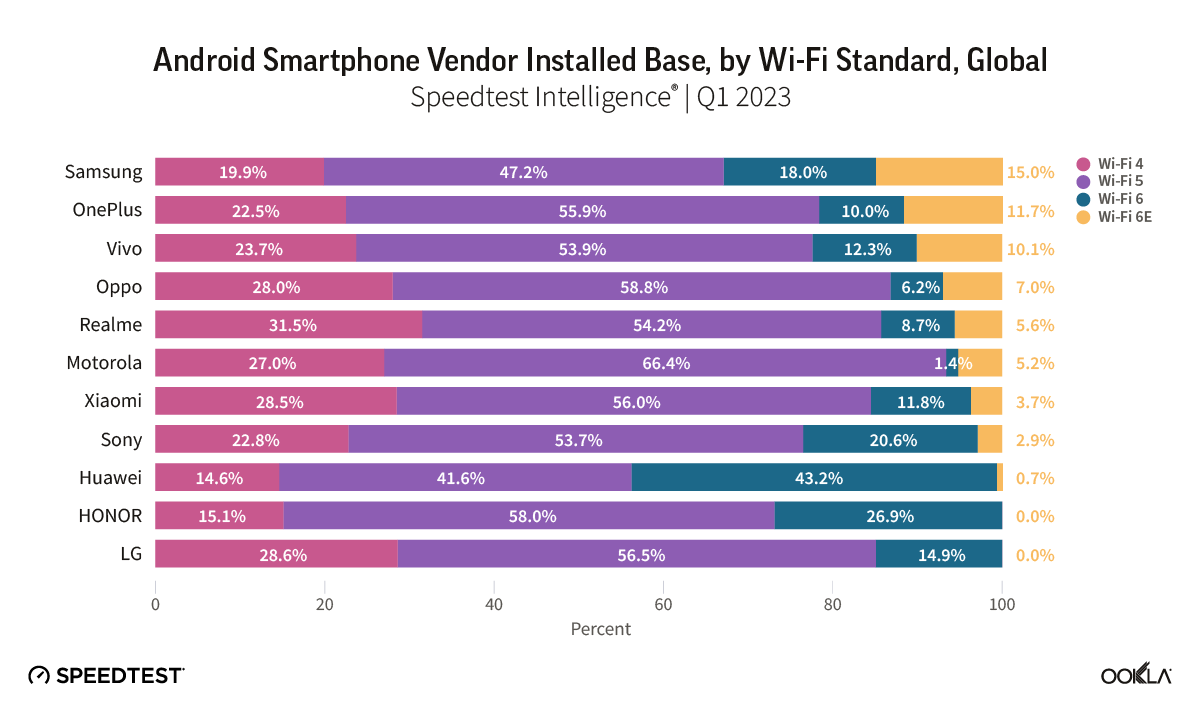
| July 27, 2021

Oslo Tops the List of World Capitals with the Fastest 5G in Q1-Q2 2021

Mobile operators are rapidly expanding 5G deployments across the globe, with 16,410 new 5G deployments across 109 countries added to the Ookla 5G Map in June 2021 alone. Huge investments in 5G are being made to increase performance, especially in major cities. We used Speedtest Intelligence® to see which world capitals have the best 5G speeds and availability, based on locations with commercially available 5G during Q1-Q2 2021.

Oslo, Norway was the fastest world capital for 5G during Q1-Q2 2021

ookla_fastest_5g_download_speed_world_capitals_0721

The race for fastest 5G performance among world capitals was extremely competitive during Q1-Q2 2021. Oslo, Norway had the fastest 5G of any world capital, clocking in with a median download speed of 526.74 Mbps. Seoul, South Korea had the second fastest median download speed over 5G at 467.84 Mbps; Abu Dhabi, United Arab Emirates was third (421.26 Mbps); Doha, Qatar fourth (413.40 Mbps) and Stockholm, Sweden fifth (401.30 Mbps). Riyadh, Saudi Arabia (384.66 Mbps); Kuwait City, Kuwait (338.97 Mbps), Muscat, Oman (318.95 Mbps); Beijing, China (291.19 Mbps); and Taipei, Taiwan (287.86 Mbps); rounded out the top 10. Helsinki, Finland showed a median 5G download speed of 279.59 Mbps; Sofia, Bulgaria 260.55 Mbps; Canberra, Australia 258.39 Mbps; Bangkok, Thailand 253.73 Mbps; Manama, Bahrain 249.71; Dublin, Ireland 223.01; Luxembourg City, Luxembourg 209.98 Mbps; Paris, France 208.48 Mbps and Bucharest, Romania 203.44 Mbps.

We saw median 5G download speeds between 150 Mbps and 200 Mbps in the following world capitals during Q1-Q2 2021: Ottawa, Canada (196.11 Mbps); Hanoi, Vietnam (195.99 Mbps); Bratislava, Slovakia (188.23 Mbps); Madrid, Spain (183.37 Mbps); Bern, Switzerland (175.69 Mbps); Rome, Italy (171.79 Mbps); London, United Kingdom (167.50 Mbps); Tokyo, Japan (167.02 Mbps); Athens, Greece (164.95 Mbps); Copenhagen, Denmark (162.75 Mbps); Ljubljana, Slovenia (158.50 Mbps); Hong Kong (153.78) and Washington, D.C., United States (151.80 Mbps).

Cape Town, South Africa was the slowest world capital for 5G in Q1-Q2 2021

ookla_slowest_5g_download_speed_world_capitals_0721

Speedtest Intelligence shows Capetown, South Africa had the slowest median download speed over 5G during Q1-Q2 2021 at 53.33 Mbps. Other world capitals with slower median 5G download speeds included: Brasilia, Brazil (62.18 Mbps); San Juan, Puerto Rico (72.59 Mbps); Warsaw, Poland (80.18 Mbps); Singapore (111.20 Mbps); Manila, Philippines (112.23 Mbps); Prague, Czechia (116.30 Mbps); Budapest, Hungary (137.54 Mbps); Amsterdam, Netherlands (139.75 Mbps); Zagreb, Croatia (140.92 Mbps); Vienna, Austria (144.93 Mbps); Jerusalem, Israel (145.17 Mbps); and Berlin, Germany (148.16 Mbps).

Capitals not mentioned on either of these lists did not have sufficient 5G samples during Q1-Q2 2021 to be included in this report.

The fastest 5G speeds are yet to come

5G is rapidly improving across the world and we’re eager to see how countries, cities and operators continue to perform during Q3 2021 and beyond. If you want to see how your 5G network performs against these benchmarks, please download the Android or iOS app, and take a Speedtest®. Learn more about 5G provider performance in select cities here, and visit the Ookla 5G MapTM to see which providers are offering 5G in your area.

Editor’s note: This article was updated on July 28 to reorganize the content for clarity.

Ookla retains ownership of this article including all of the intellectual property rights, data, content graphs and analysis. This article may not be quoted, reproduced, distributed or published for any commercial purpose without prior consent. Members of the press and others using the findings in this article for non-commercial purposes are welcome to publicly share and link to report information with attribution to Ookla.

| December 6, 2021

Ookla Video Analytics Reveals the State of Global Video Experience


Video is essential to today’s internet across the world. We use it to watch shows and movies, stream live events and even keep up to date on our favorite cats on social media. Ookla® launched video testing in the Speedtest® app for iOS and Android earlier this year so consumers can measure the quality of their video experience. Already, millions of video tests have been initiated by consumers. Today we’re sharing some of that data to provide insight into video experience around the world, specifically, we’ve analyzed adaptive start time and highest overall video resolution over all mobile technologies, 5G and fixed broadband in select countries during Q3 2021.

Switzerland had the fastest adaptive start time for all mobile technologies, South Africa fastest for 5G

Video streaming services use adaptive bitrate technology

All modern video streaming platforms use adaptive bitrate technology to automatically adjust video quality based on network conditions and device capabilities in order to display the highest quality video that a device can support, while minimizing buffering and slow video start time. Speedtest Video Analytics provides deep insights and competitive benchmarking for device and network video streaming capabilities.

Adaptive start time — the time it takes for adaptive bitrate playback to initiate — allows us to see how quickly videos are loading. A 2012 study found that users will leave a video if it doesn’t begin playing within two seconds. We have to imagine in 2021, that timeframe is being squeezed even further. Our analysis shows how countries are performing against this important benchmark.

ookla_adaptive-start-time_all-mobile-tech_1121-01-3

Speedtest Intelligence® reveals that Switzerland had the fastest median adaptive start time for all mobile technologies combined among the countries we analyzed at 1.02 seconds during Q3 2021. South Korea and Norway were close behind at 1.07 seconds and 1.10 seconds, respectively. Five more countries achieved a median adaptive start time at or under 1.25 seconds during Q3 2021, including Hong Kong (SAR) and Croatia (1.17 seconds), Portugal (1.24 seconds), and Kuwait and Mexico (1.25 seconds). All but three of the remaining countries we surveyed achieved a median adaptive start time between 1.25 seconds and 2.00 seconds during Q3 2021 except Colombia (2.11 seconds), Saudi Arabia (2.12 seconds) and India (2.13 seconds).

Most 5G-capable video tests showed blazing fast adaptive start times

ookla_adaptive-start-time_5g_1121-01

We’ve seen median 5G download speeds zoom ahead of traditional mobile technologies, even reaching median download speeds 10 times faster than on 4G LTE. It’s no surprise Video Analytics revealed adaptive start time was often much faster on 5G than on all mobile technologies combined. Five countries achieved median adaptive start times faster than 1.00 second during Q3 2021: South Africa (0.73 seconds), Switzerland (0.79 seconds), Norway (0.82 seconds), Hong Kong (0.86 seconds) and South Korea (0.90 seconds). Video Analytics shows the only countries with a median 5G adaptive start time slower than 1.25 seconds were the United States (1.27 seconds), Brazil (1.42 seconds) and Saudi Arabia (1.94 seconds).

Five countries’ adaptive start time improved more than 0.25 seconds on 5G compared to all technologies combined during Q3 2021: the Philippines (-0.62 seconds), South Africa (-0.53 seconds), Brazil (-0.39 seconds), Hong Kong (-0.31 seconds) and Norway (-0.29 seconds). However, several countries showed a less than 0.20 second improvement when comparing adaptive start rate on 5G to that on all technologies combined during Q3 2021: the U.S. (-0.14 seconds), Bahrain (-0.16 seconds), South Korea and Saudi Arabia (-0.17 seconds), and the United Kingdom (U.K.) and France (-0.18 seconds).

Adaptive start time is not always faster on fixed broadband

ookla_adaptive-start-time_fixed_1121-01-1

Speedtest Intelligence showed a narrower range for adaptive start time on fixed broadband than on 5G with every country on our list achieving between 0.67 and 1.85 seconds during Q3 2021. Ten countries on our list achieved a median adaptive start time faster than 1.00 second during Q3 2021: South Korea (0.67 seconds), Norway (0.74 seconds), Hong Kong (0.75 seconds), Switzerland (0.76 seconds), the U.K. (0.79 seconds), France (0.86 seconds), the U.S. (0.87 seconds), Spain (0.88 seconds), Portugal (0.89 seconds) and Italy (0.98 seconds).

Twenty out of the 24 countries we surveyed had a median fixed broadband adaptive start time faster than 1.50 seconds during Q3 2021. Colombia (1.50 seconds), Egypt (1.59 seconds), Turkey (1.64 seconds) and Saudi Arabia (1.85 seconds) were the only countries with a median adaptive start time slower than 1.50 seconds on fixed broadband during Q3 2021.

South Korea video tests reached 4K resolutions at the highest proportion on mobile and fixed broadband

Video resolution is incredibly important in the experience of streaming video and the higher the resolution, the more definition and clarity we are able to see. These days, the difference between an SD and 4K experience is gigantic. Resolution is measured in the numbers of pixels in a 16:9 ratio, with 2160 pixel height representing a 4K picture. Video Analytics measures the resolution rates, which represent the portion of samples that reach a particular resolution. In this analysis, we evaluated the resolution rates for 4K, typically the highest resolution users will need.

ookla_highest-video-resolution_all-mobile-tech_1121-01

Using Speedtest Intelligence, we found South Korea and Switzerland had the highest overall successful resolution rates for all mobile technologies combined during Q3 2021, reaching 4K resolutions 80.4% and 80.3% of the time, respectively. Croatia (79.7%), Kuwait (77.4%) and Norway (75.4%) were the only other countries on our list that achieved 4K video resolution more than 75.0% of the time. Only seven countries on our list did not reach a 4K resolution at least 50% of the time on all mobile technologies combined: the Philippines (38.4%), India (41.1%), Indonesia (44.8%), Colombia (45.3%), Mexico (46.3%), Russia (49.7%) and Egypt (49.9%).

5G led to higher video resolution, but 4K mobile devices still remain rare

ookla_highest-video-resolution_5g_1121-01

5G provided a higher resolution for mobile devices during Q3 2021 than all technologies combined. Every country we surveyed reached a 4K resolution over 80.0% of the time over 5G. In fact, six out of the 14 countries we surveyed for 5G achieved a 4K resolution more than 90.0% of the time, including South Korea (95.9%), Norway (94.5%), Kuwait (94.0%), South Africa (93.6%), Switzerland (92.6%) and France (91.5%). On the lower end of our list, only Italy (81.9%), Brazil (83.9%) and the U.S. (83.9%) achieved 4K resolutions less than 85.0% of the time.

While this is great news for the future of mobile devices, 4K resolutions in mobile devices still aren’t common: Sony is the only popular device manufacturer producing 4K mobile devices. In the meantime, users who can connect to 5G through either a hot spot or fixed wireless access (FWA) will reap the benefits of being able to stream on 4K devices like computers, televisions or tablets.

South Korean fixed broadband delivers ultra-high definition resolutions

ookla_highest-video-resolution_fixed_1121-01

Speedtest Intelligence reveals South Korea had the highest fixed broadband 4K resolution rate among countries surveyed at 92.2% during Q3 2021. Other countries that achieved 4K resolution rates above 85.0% on fixed broadband during Q3 2021 included: Switzerland (89.4%), Hong Kong (87.6%), Norway (87.1%) and the U.S. (86.7%). Every other country in our analysis achieved 4K resolution rates between 65.0% and 85.0%, except Egypt (49.5%), Indonesia (52.5%), the Philippines (64.2%) and Turkey (64.3%).

Video Analytics gives you the information you need about your video playback

We’re excited to share more about video performance and quality of experience using Video Analytics in the coming months. In the meantime, if you want to learn more about Video Analytics and how it can help you benchmark and improve your network, please join our upcoming webinar, December 9 by clicking here.

Ookla retains ownership of this article including all of the intellectual property rights, data, content graphs and analysis. This article may not be quoted, reproduced, distributed or published for any commercial purpose without prior consent. Members of the press and others using the findings in this article for non-commercial purposes are welcome to publicly share and link to report information with attribution to Ookla.

| December 21, 2021

Taiwan’s Fixed Broadband Performance Remains Flat


用中文閱讀

Internet speeds in East Asia and the Greater China region are some of the fastest in the world for both mobile and fixed broadband. During November 2021, five countries ranked in the top 30 of the Ookla® Global Index™ for fixed broadband internet speeds: Hong Kong (SAR) (4th), Mainland China (6th), South Korea (16th), Taiwan (24th) and Japan (27th). We decided to look further into Taiwan’s fixed broadband performance after evaluating the country’s mobile performance in our Global Index Market Analyses earlier this quarter. The following article uses Ookla Speedtest Intelligence® to examine how Taiwan’s fixed broadband performance compared to the rest of East Asia during Q3 2021, evaluate performance for Taiwan’s top providers and discover how fixed broadband performance fared among Taiwan’s largest cities.
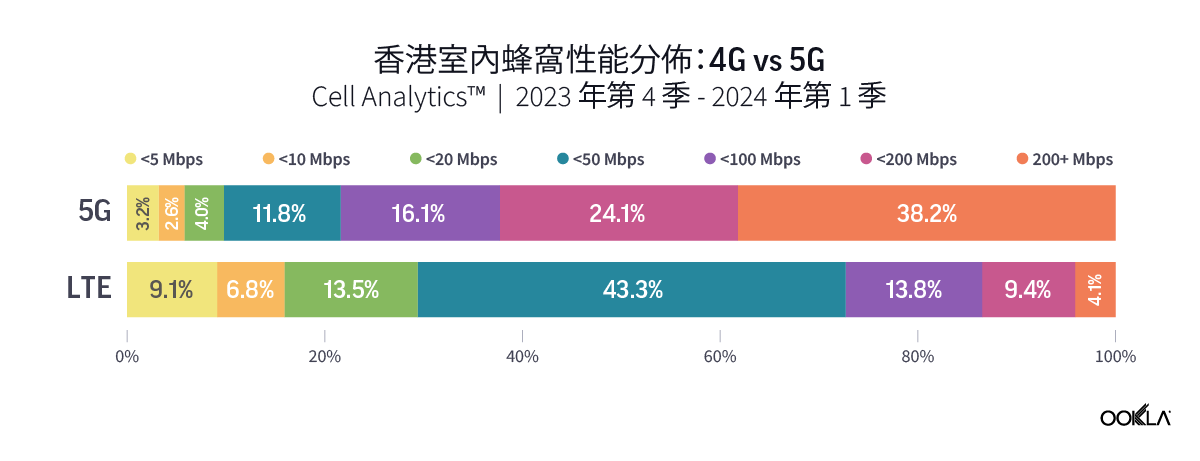
Hong Kong and China saw download speeds rapidly increase over the past year

ookla_fixed_performance_east-asia_1221_en-01

Speedtest Intelligence revealed a divide in East Asia’s fixed broadband performance over the past year: China and Hong Kong have seen median download and upload speeds rapidly increase over the past year, while Japan, South Korea and Taiwan have seen speeds remain relatively unchanged. Hong Kong had the fastest median download speed in the countries we surveyed at 151.75 Mbps during Q3 2021. China followed at 120.25 Mbps. South Korea (96.00 Mbps), Japan (92.01 Mbps) and Taiwan (88.34 Mbps) rounded out our list.

Hong Kong and South Korea had upload speeds near 100 Mbps

Speedtest Intelligence discovered another divide in East Asia during Q3 2021: South Korea (94.72 Mbps), Hong Kong (94.47 Mbps) and Japan (86.11 Mbps) all had median upload speeds above 85 Mbps while Taiwan and China only had upload speeds at 38.42 Mbps and 35.71 Mbps, respectively.

Competition was tight among Taiwan’s top fixed broadband providers

ookla_fixed_performance_taiwan-providers_1221_en-01

Competition was extremely close among Taiwan’s top fixed broadband providers for fastest median download speed during Q3 2021, with Home+ (93.73 Mbps) edging out kbro (92.72 Mbps) and HiNet (89.90 Mbps). TWM Broadband followed at 72.53 Mbps.

HiNet had the fastest median upload speed at 39.82 Mbps, followed by Home+ (31.26 Mbps), kbro (27.89 Mbps) and TWM Broadband (26.65 Mbps).

Taipei City had the fastest speeds in Taiwan

ookla_fixed_performance_taiwan-map_1221_en-01

Taipei City had the fastest median download and upload speeds among Taiwan’s most populous cities at 108.71 Mbps and 47.37 Mbps, respectively, during Q3 2021. New Taipei City (87.18 Mbps), Keelung City (84.69 Mbps) and Taoyuan City (80.75 Mbps) all reached median download speeds above 80 Mbps during Q3 2021. Chiayi City was the only city on our list to not reach median download speeds above 65 Mbps at 60.34 Mbps. For median upload speed, New Taipei City (36.97 Mbps) and Kaohsiung (36.17 Mbps) were the only cities with median upload speeds above 35 Mbps during Q3 2021. Every other city except Changhua achieved a median upload speed between 30 and 35 Mbps.

Taiwan’s top ISPs remain locked in tight competition, face new contenders in 5G

Taiwanese ISPs have risen to the challenge to deliver fast internet for consumers during the COVID-19 pandemic. But as life begins to move away from these extraordinary circumstances, ISPs face a new reality: 5G operators are able to compete with ISPs with lightning fast speeds. For all mobile 5G operators combined, Taiwan had a median 5G download speed at 296.63 Mbps during Q3 2021 — though Chunghwa Telecom achieved a blistering fast 440.93 Mbps, a far cry ahead of FarEastTone’s 335.17 Mbps, which was next on our list. That makes 5G operators very much in competition with Taiwanese ISPs.

We’ll continue monitoring how fixed broadband and mobile providers perform in Taiwan. If you want to learn more about Speedtest Intelligence, please inquire here.


台灣固定寬帶錶現持平

東亞和大中華地區的移動和固定寬帶網速在全世界名列前茅。 2021年11月,在Ookla® Global Index™排名前30位的國家/地區中,有5個來自上述地區:香港(第4位)、中國大陸(第6位)、韓國(第16位)、台灣(第24位)和日本(第27位)。本季度早些時候,我們在《全球指數市場分析》(Global Index Market Analyses)中評估了台灣的移動業務表現後,決定進一步研究台灣固定寬帶業務的表現。以下文章使用了Ookla Speedtest Intelligence®的數據,研究在2021年第三季度台灣固定寬帶性能的表現與東亞其他地區的比較,評估台灣主要服務提供商的表現情況,並探討台灣各大城市的固定寬帶性能表現如何。

在過去的一年中,香港和中國大陸的網絡下載速度迅速提高

ookla_fixed_performance_east-asia_1221_cnt-01

Speedtest Intelligence揭示了過去一年中東亞地區固定寬帶錶現的差異:中國大陸和香港的下載和上傳速度中值在過去一年裡迅速增長,而日本、韓國和台灣的速度則相對保持不變。在2021年第三季度我們調查的國家/地區中,香港的下載速度中值最高,為151.75Mbps。而中國大陸則以120.25Mbps的速度緊隨其後。韓國(96.00Mbps)、日本(92.01Mbps)和台灣(88.34Mbps)也榜上有名。

香港和韓國的上傳速度接近100 Mbps

Speedtest Intelligence在2021年第三季度發現了東亞地區的另一個明顯差距:韓國(94.72 Mbps)、香港(94.47 Mbps)和日本(86.11 Mbps)的上傳速度中值均高於85 Mbps,而台灣和中國大陸的上傳速度分別只有38.42 Mbps和35.71 Mbps。

台灣主要固定寬帶服務商之間競爭激烈

ookla_fixed_performance_taiwan-providers_1221_cnt-01

在2021年第三季度,台灣各主要固定寬帶服務提供商在最快下載速度中值方面的競爭異常激烈:Home+ (93.73 Mbps)超過了kbro (92.72 Mbps)和HiNet (89.90 Mbps),而TWM寬帶則以72.53 Mbps的速度次之。

在上傳速度方面,HiNet的上傳速度中值為39.82 Mbps,其次是Home+ (31.26 Mbps)、kbro (27.89 Mbps)和TWM寬帶 (26.65 Mbps)。

台北市是全台灣網速最快的城市

ookla_fixed_performance_taiwan-map_1221_cnt-01

在2021年第三季度,對於台灣各大城市而言,台北市的下載和上傳速度中值是最快的,分別為108.71 Mbps和47.37 Mbps。新北市(87.18 Mbps)、基隆市(84.69 Mbps)和桃園市(80.75 Mbps)均達到了80Mbps以上的下載速度中值。而嘉義市是我們名單上唯一一個下載速度中值沒有超過65Mbps的城市(60.34 Mbps)。就上傳速度中值而言,新北市(36.97 Mbps)和高雄市(36.17 Mbps)是僅有的兩個在2021年第三季度上傳速度中值高於35 Mbps的城市。除了彰化市,其他城市的上傳速度中值在30Mbps到35Mbps之間。

台灣的主要互聯網服務提供商仍處於激烈競爭中,而且將面對5G領域新加入者的挑戰

在新冠肺炎疫情蔓延期間,台灣的互聯網服務提供商迎接挑戰,為消費者提供快速互聯網服務。但隨著生活開始恢復正常,各服務商又面臨著一個全新的現實情況:5G運營商將憑藉閃電般的網速與傳統互聯網服務提供商展開激烈競爭。就所有的移動5G運營商而言,在2021年第三季度,台灣的5G下載速度中值為296.63 Mbps——其中,中華電信的速度達到了440.93 Mbps,遠高於排名第二的遠傳電信的335.17 Mbps。這使得5G運營商與台灣互聯網服務提供商之間的競爭日益激烈。

我們將繼續關注台灣固定寬帶及移動服務提供商的表現。如果您想了解更多關於Speedtest Intelligence的更多信息,請點擊此處查詢

Ookla retains ownership of this article including all of the intellectual property rights, data, content graphs and analysis. This article may not be quoted, reproduced, distributed or published for any commercial purpose without prior consent. Members of the press and others using the findings in this article for non-commercial purposes are welcome to publicly share and link to report information with attribution to Ookla.