| February 12, 2025

PlayStation Outage Leaves Gamers in the Dark

On February 7th, signs of a major outage impacting the gaming industry surfaced on Downdetector as early as 3:00 PM PDT. The outage, experienced by PlayStation Network (PSN), lasted over 24 hours and generated more than 3 million reports globally in Downdetector. This article provides a full breakdown of the outage as seen through Downdetector data and PlayStation’s response.

This isn’t the first time PlayStation has faced an outage of this magnitude, leaving gamers uncertain about resolution timelines. Just last October, a PlayStation outage generated over 600,000 reports in Downdetector and lasted more than four hours. However, for many longtime PlayStation users, this incident sparked flashbacks to the infamous 2011 PlayStation Network breach—a cyberattack that led to a 23-day outage.

While this recent outage was nowhere near as prolonged, it underscored the need for swift response and transparency from affected companies.

February 7th

3:00 PM PDT — Signs of a Massive Gaming Outage Surface

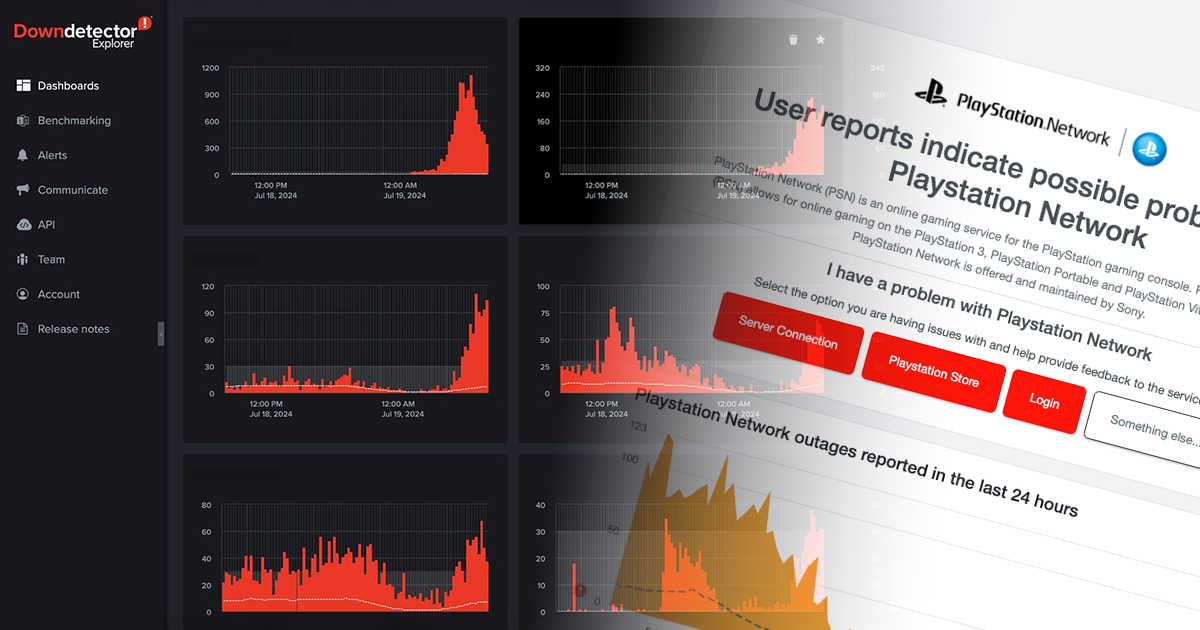
Downdetector began receiving a sudden spike in reports on gaming services, signaling the early stages of a significant disruption. Over the next few minutes, many major games and services, in addition to PSN, flooded the Downdetector homepage with reports of an outage. Meanwhile, Steam and Xbox users remained largely unaffected. With these insights, it became clear almost immediately that the issue was limited to PSN, well before PSN’s own status page showed signs of a disruption.


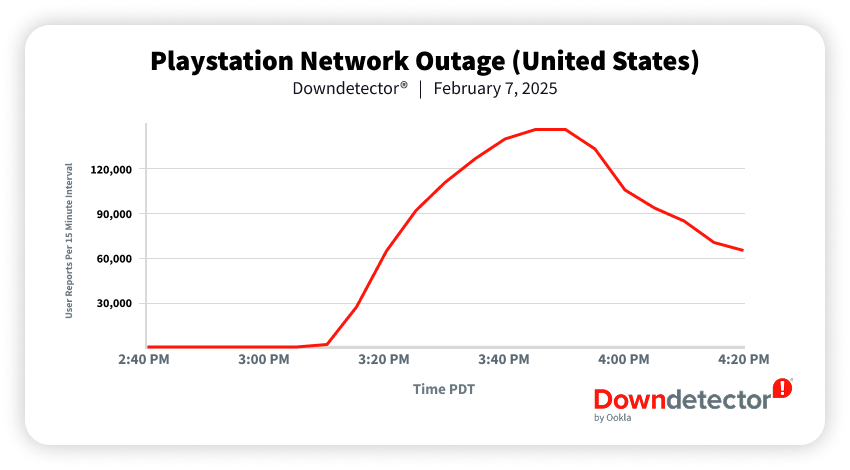
3:45 PM PDT — Outage Numbers Peak

With the source of the issue identified, reports for PSN peaked as users flooded to Downdetector to report, track, and discuss the ongoing disruption. Over the course of the outage, Downdetector remained a popular forum for discussion as gamers waited for any signs of resolution.

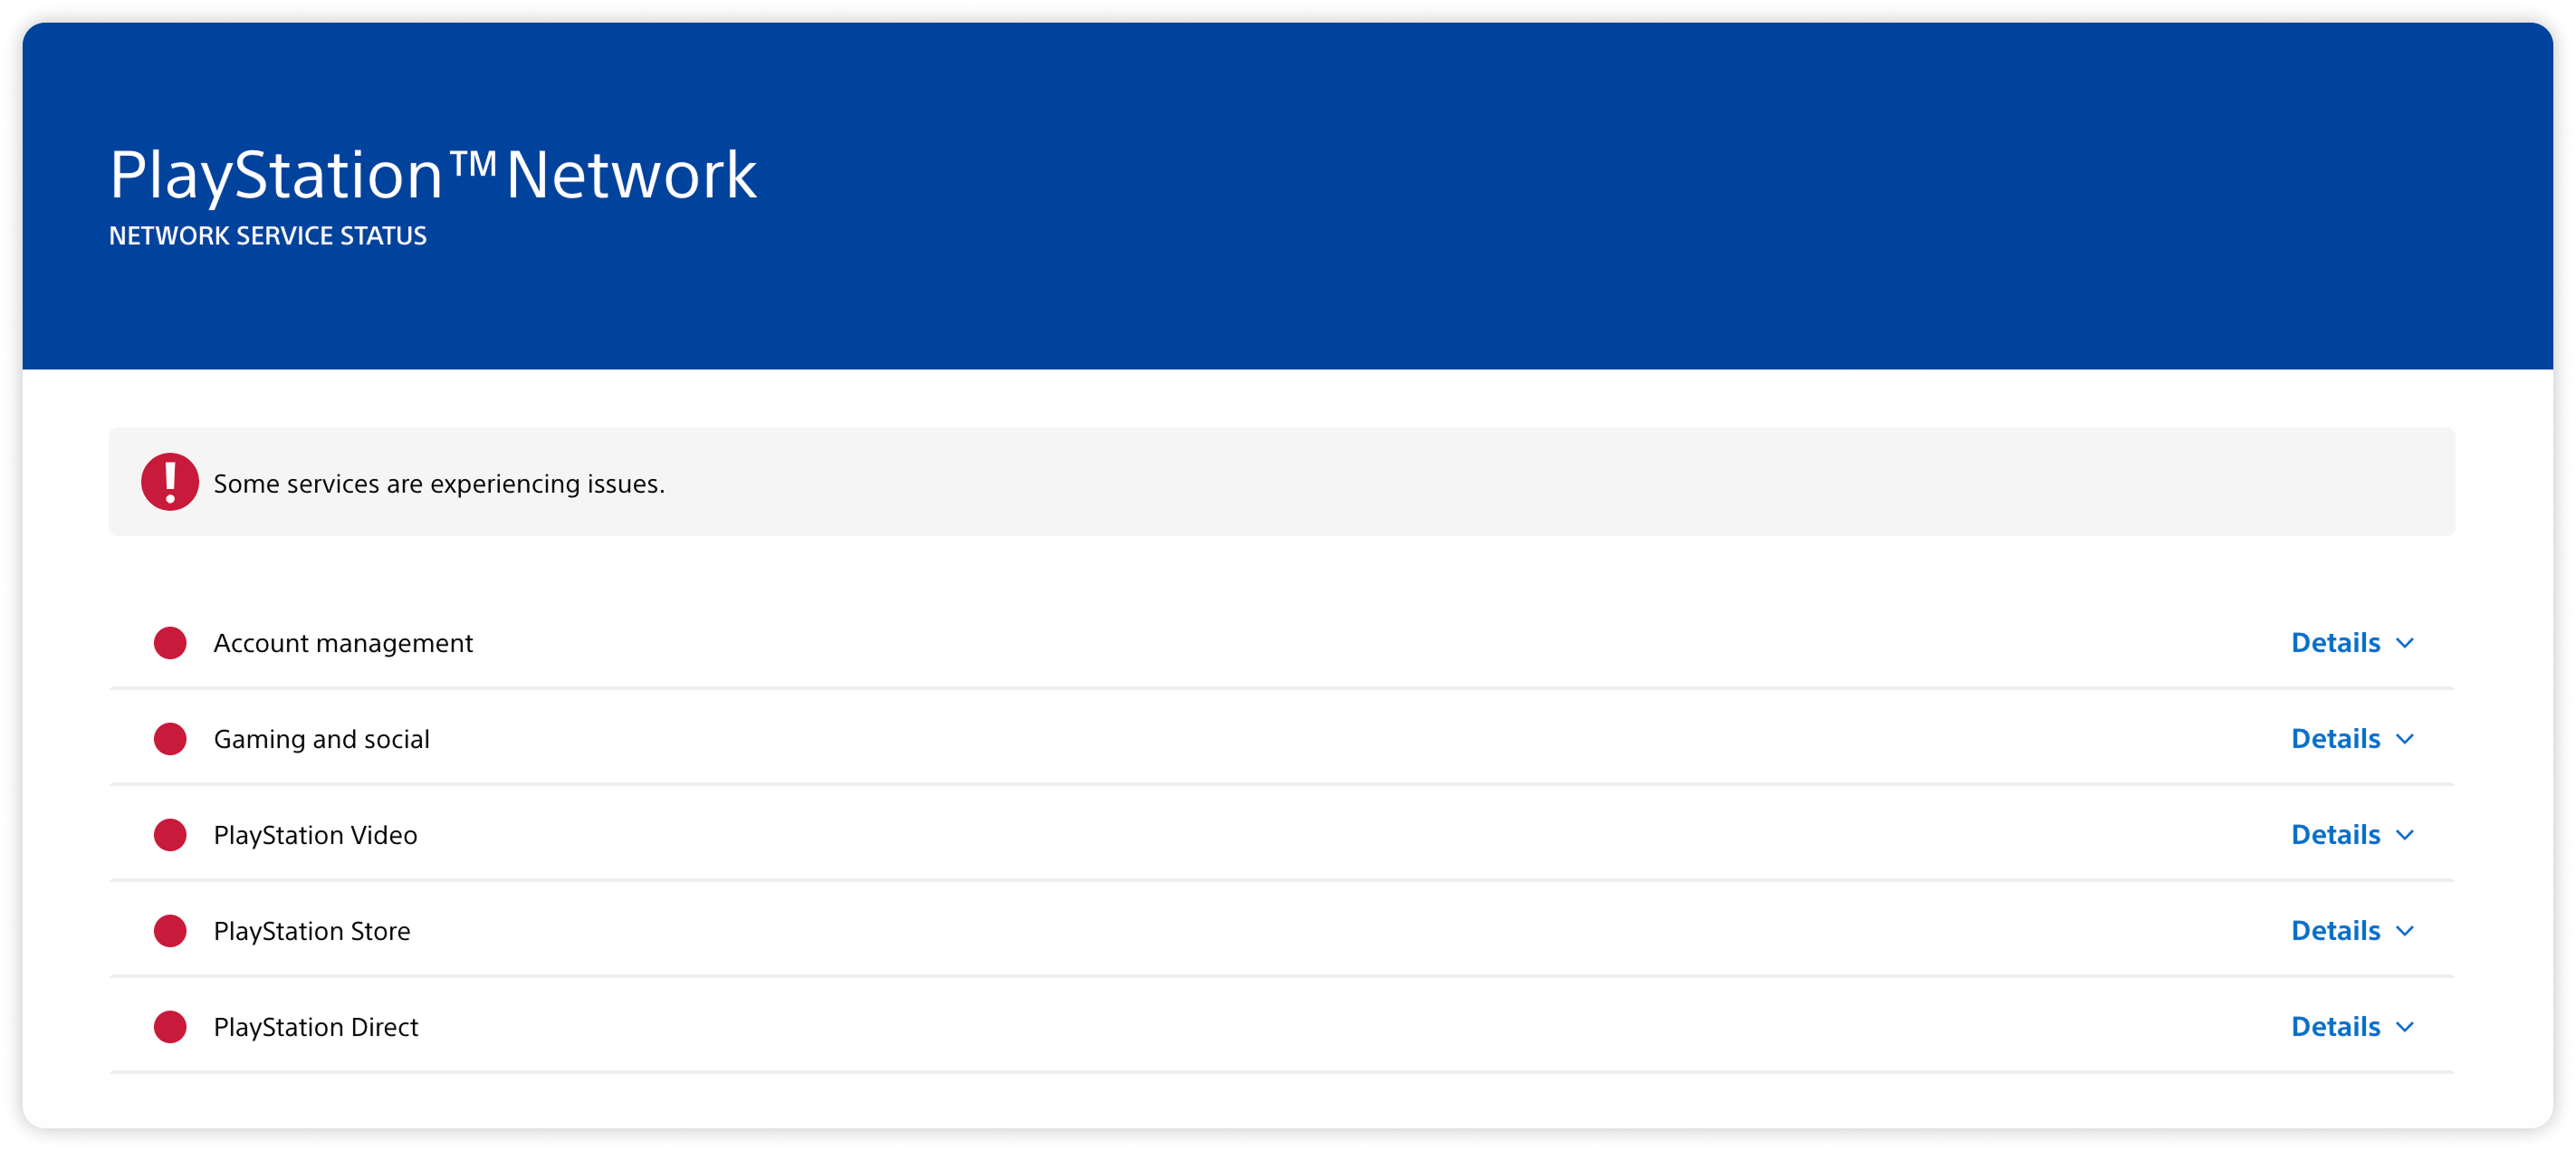
4:00 PM PDT — PlayStation Status Page Updated

Almost an hour after Downdetector users were already well aware of the outage, PlayStation acknowledged the issue by updating their status page with a vague message: “Some services are experiencing issues.”

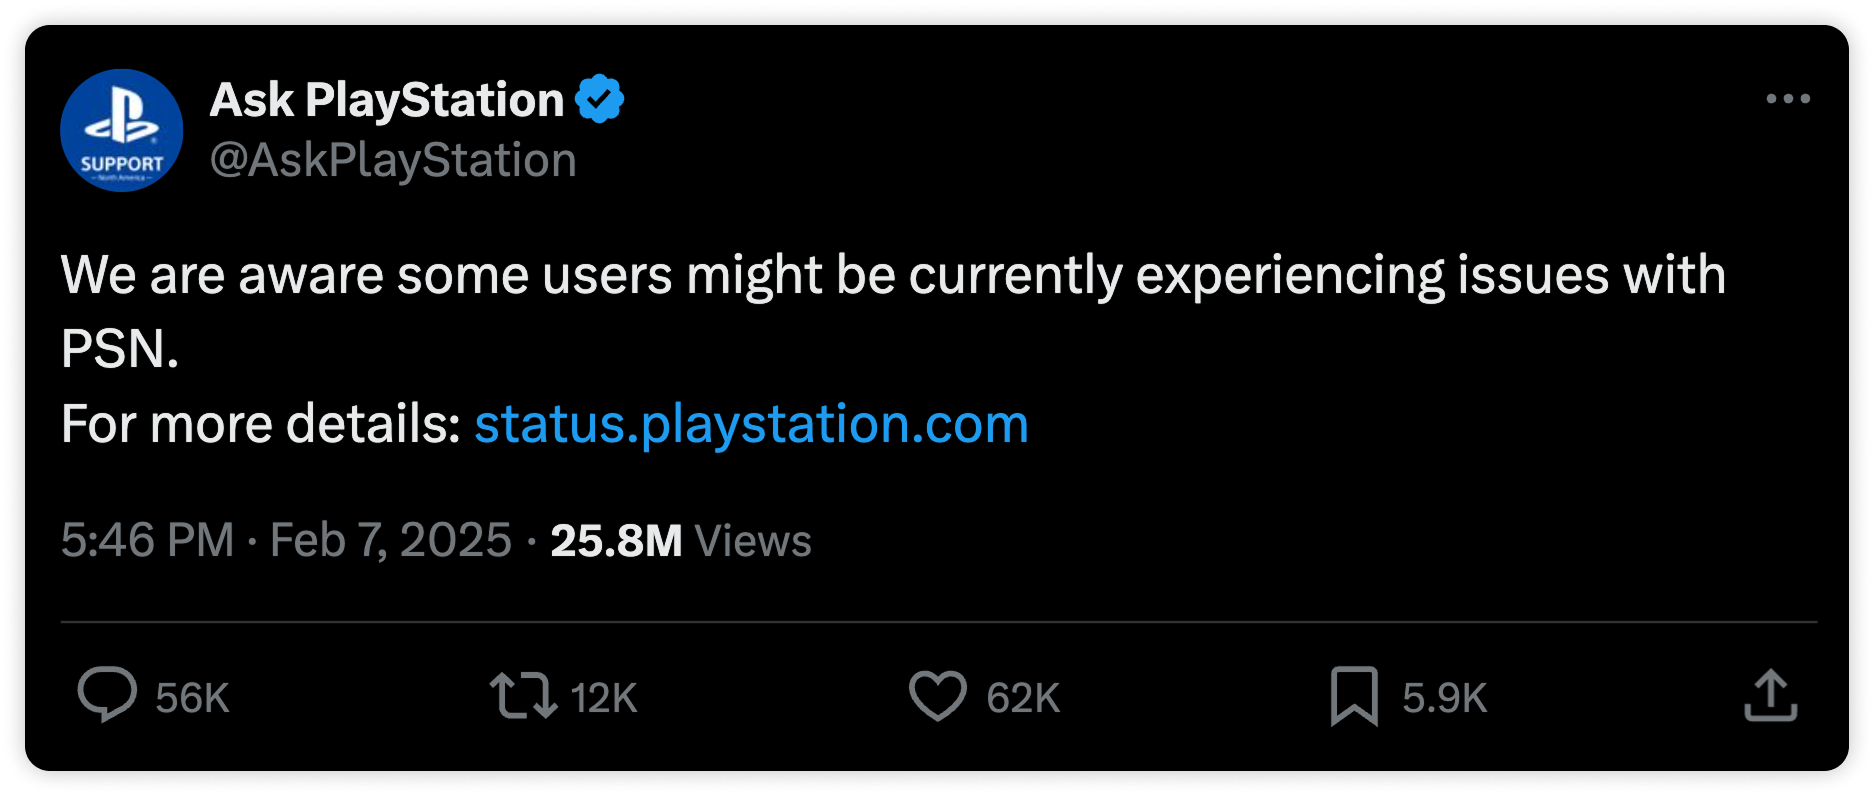
5:46 PM PDT — PlayStation Acknowledges Outage Publicly

Even after the status page was updated, it took until 5:46 PM for PlayStation to release a public statement on their X page, Ask PlayStation. Users were met with a message that offered no insight into the causes of the disruption or any timeline for resolution.

February 8th

2:00 PM PDT — Global Reports Exceed 3 Million

As the outage continued into the next day, the volume of reports surpassed 3 million globally, with the most reports coming from the United States, Germany, United Kingdom, and France. While the number of new reports began to slow down, Downdetector’s comment section remained active. Downdetector received more than 30,000 comments, ranging from anger and frustration to lighthearted exchanges as gamers looked for alternative ways to pass the time. This ongoing flood of commentary underscored how Downdetector served not only as a monitoring tool but also as a real-time forum for users to vent, discuss, and stay informed during disruptions.


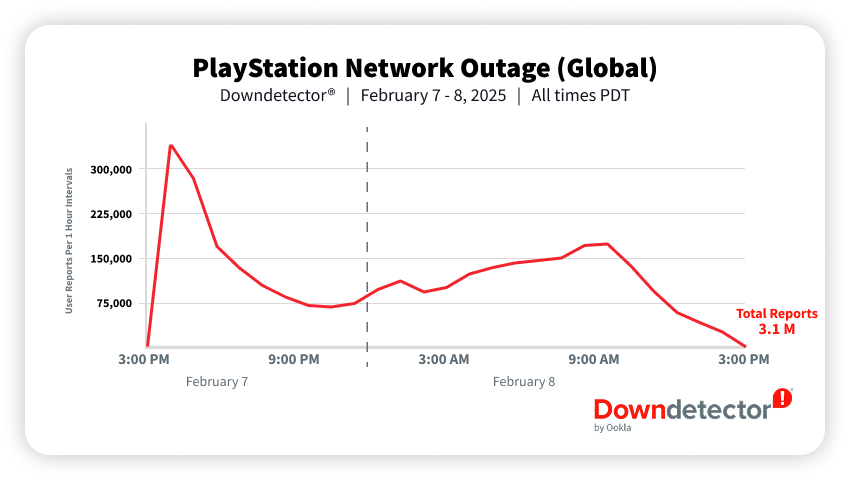
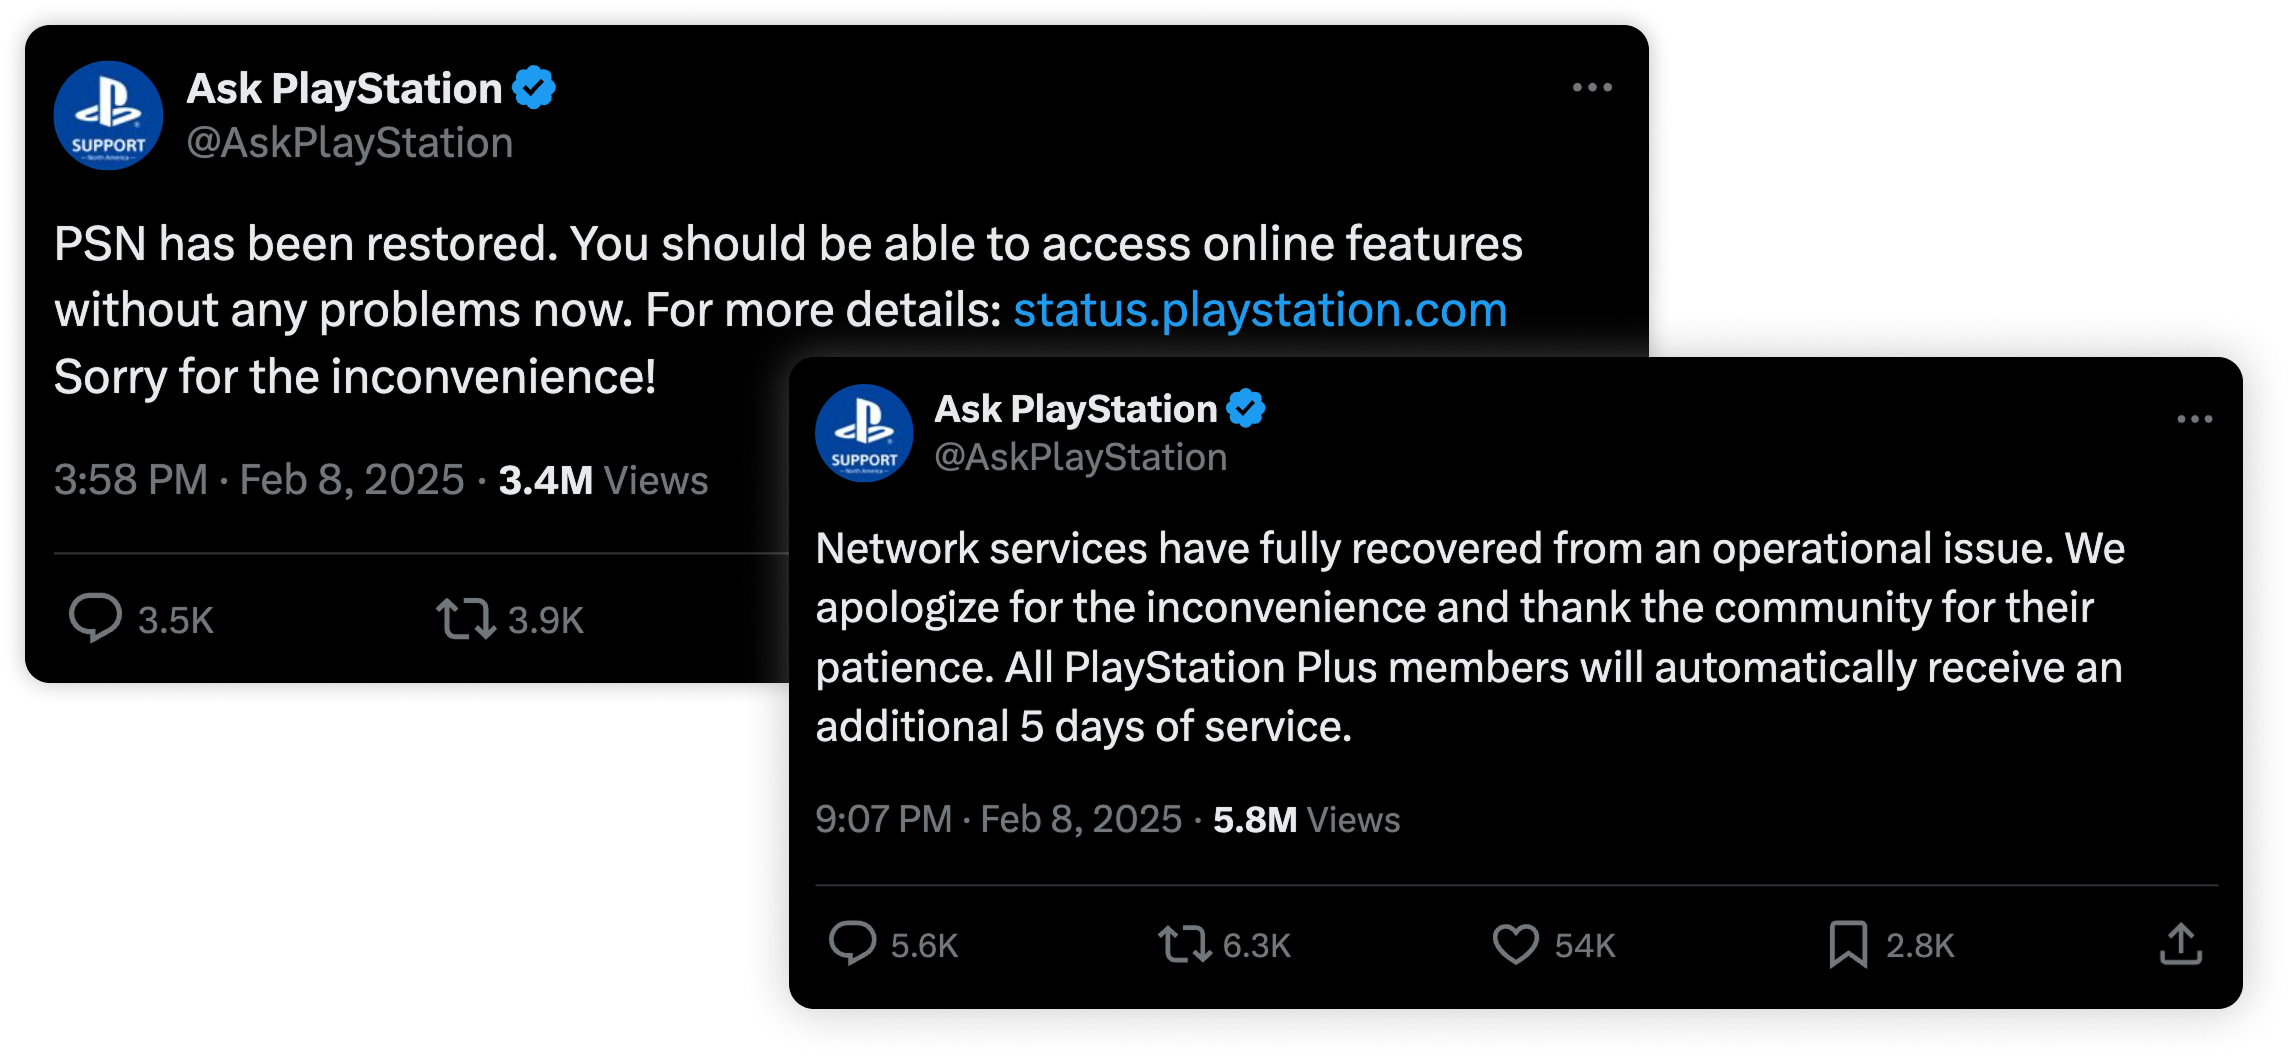
3:58 PM PDT — Outage Resolved

More than 24 hours after the outage first appeared on Downdetector, PlayStation announced that the issue had finally been resolved via a post on X. While the official cause of the outage remains unknown, later that night another update was posted, attributing the cause to an “operational issue” and offering 5 free days of PlayStation Plus membership to existing members as a gesture of goodwill.

Throughout the duration of the outage, Downdetector demonstrated the power of real-time, crowdsourced insights, with user reports helping identify the source of the disruption and when the issue was resolved. Thanks to the continuous stream of comments and reports from gamers, Downdetector served as a vital resource for users looking for updates on the situation in real-time, ahead of any official statements.


For businesses, Downdetector provides access to dashboards that deliver early alerts, enable outage correlation, and allow for direct communication with users, ensuring a proactive approach to incident management. Learn how you can leverage Downdetector to be better prepared for outages here.

Ookla retains ownership of this article including all of the intellectual property rights, data, content graphs and analysis. This article may not be quoted, reproduced, distributed or published for any commercial purpose without prior consent. Members of the press and others using the findings in this article for non-commercial purposes are welcome to publicly share and link to report information with attribution to Ookla.

| December 20, 2024

Meta Outage Impacts Services Across Facebook, Instagram, and WhatsApp Globally

On December 11th, 2024, a significant outage affected Meta services, disrupting Facebook, WhatsApp, Instagram, and Messenger users worldwide. Reports of the outage flooded into Downdetector, with the platform providing real-time insights as the event unfolded. The scale of the disruption underscored the critical role Downdetector plays in tracking and identifying service issues for businesses and consumers alike.

Here’s a timeline of how the outage progressed, based on data captured in Downdetector.

9:45 AM PST — Initial Reports Appear in Downdetector

Reports of a Meta service disruption began to surface, with users globally reporting issues on Facebook, WhatsApp, and Instagram. Users received error messages when attempting to access the services.

10:00-10:15 AM PST — Outage Number Peaks

With the outage peaking across the world during this time, using Downdetector data we compared the reporting numbers on Meta’s services across the Americas. In the United States, Facebook reported the highest number of disruptions, with nearly 100,000 user-submitted incidents during this 15 minute window.

Meanwhile, in Brazil, WhatsApp saw the most significant impact, with 66,000 reports in the same timeframe.

In Canada, Instagram peaked with the most reports with 17,000 reports during this time.

These figures highlight the global reach of the outage and shows how the popularity of Meta’s services vary by region, with different platforms experiencing peak number of reports in different countries.

10:48 AM PST — Meta Acknowledges the Outage

Over an hour after Downdetector users were first notified of a potential disruption, Meta addressed the issue on X, assuring users that they were aware of the outage and were actively working to resolve it.

11:30 AM PST — Reports Exceed 3 Million Globally

As Meta worked on resolving the issue, users were still impacted and reports continued to flood into Downdetector. As of 11:30 AM PST the total number of reports exceeded 3 million globally.

12:00 PM PST — Speedtest Counts Peak

During the outage, many users turned to Speedtest to troubleshoot their internet connections, unsure if the issue stemmed from their provider or Meta’s services. As a result, Speedtest Intelligence® recorded a sharp increase in test counts throughout the outage. Starting at 10:00 AM PST, test activity began to rise, peaking at over 110,000 tests on fixed providers in Brazil alone by 12:00 PM PST.

This surge demonstrates a clear correlation between Speedtest and Downdetector, as users rely on both platforms as essential tools for diagnosing connectivity and service issues.

2:26 PM PST — Resolution Announced

After 5 hours and nearly 4 million reports across Facebook, WhatsApp, and Instagram globally, Meta announced that 99% of the outage had been resolved, with services returning to normal. As of this time, the exact cause of the disruption has not been disclosed.

Downdetector has proven to be an invaluable tool for real-time outage reporting, identifying issues faster than official communications from service providers. If you’re interested in learning how Downdetector can help you identify and prevent disruptions from becoming major outages contact us here.

Ookla retains ownership of this article including all of the intellectual property rights, data, content graphs and analysis. This article may not be quoted, reproduced, distributed or published for any commercial purpose without prior consent. Members of the press and others using the findings in this article for non-commercial purposes are welcome to publicly share and link to report information with attribution to Ookla.

| October 1, 2024

How Google Fiber has Elevated Connectivity using Speedtest® Data [Case Study]

Fiber internet has transformed connectivity in the U.S. — enabling faster, more reliable internet access for users in urban, suburban, and rural areas. Google Fiber is a U.S. internet provider that uses fiber optic technology to deliver superior speeds to its expanding list of markets.

GFiber is dedicated to delivering the best internet service nationwide, aiming to provide all of its fiber customers – regardless of location – with ultra-fast speeds of up to 8 Gbps over state-of-the-art infrastructure that ensures consistent, high-performance connectivity across all markets. This applies to established markets as well as new areas where GFiber is expanding. GFiber utilizes Speedtest data to validate actual speeds its customers experience given their individual real world environments, which helps with the delivery of exceptional services.

Situation

GFiber is rapidly expanding its fiber network into new markets, with a strong focus on ensuring they offer market-leading speeds from day one. Upon entering a new market, a critical goal for GFiber is to drive meaningful advancements in speed and service quality for users in the area.

GFiber needed a reliable way to confirm whether their efforts were delivering significantly faster download and upload speeds, better latency, and an enhanced quality of service—not just to exceed customer expectations, but to elevate the overall market standard.

Read the full case study here.

Ookla retains ownership of this article including all of the intellectual property rights, data, content graphs and analysis. This article may not be quoted, reproduced, distributed or published for any commercial purpose without prior consent. Members of the press and others using the findings in this article for non-commercial purposes are welcome to publicly share and link to report information with attribution to Ookla.

| August 28, 2024

Paris - Do Major Sporting Events Leave a Network Legacy?

With the 2024 Summer Olympics in Paris having concluded on Sunday 11th August, and the handover to Los Angeles 2028 complete, we look back at how mobile networks performed during the Games, and examine the legacy of other major sporting events. Our data shows a strong increase in upload performance across both 4G and 5G networks in Paris in time for the event. However data from past events shows that this is a common trend, and that not all major sporting events leave a network legacy, with many deployments focussed on adding temporary capacity which is then removed post-event. The African Cup of Nations in Cote D’Ivoire, which took place in January and February 2024, is one exception, with 4G-LTE performance in the capital city of Abidjan increasing in time for the event and being sustained for the six month period afterwards. With so much infrastructure investment targeted at these events, often in congested areas of large cities, operators and organizers should do more to ensure they leave a lasting impact on the network user experience.

Driving network improvements to ensure sufficient capacity for major events

Major sporting events place considerable strain on public mobile networks, necessitating careful planning to anticipate demand. In the case of the Paris Olympics, organizers deployed additional cell sites and backhaul (both permanent and temporary), and added fiber. They also deployed a dedicated private wireless 5G network. Orange, the official connectivity partner of the Paris Olympics, opened up its 5G network to existing 4G consumer and business customers across France, from June to September. In addition to allowing existing 4G users to try 5G, this also freed up capacity on Orange’s 4G network, allowing it to better support 4G roaming users. The mobile operator also implemented an innovative push-to-talk (PTT) service over 4G to allow those organizing the Games to communicate more securely and effectively. For many large events like this, the host city or nation will embark upon significant upgrades to transport links and communication networks, and organizing committees such as the IOC and FIFA are increasingly keen that the events leave a legacy for residents and future visitors.

Network performance, based on consumer-initiated Speedtest samples, showed an increase in median 5G download performance in Paris during the weeks leading up to the opening ceremony on 26th July, as well as sustained performance across the duration of the event. What’s more interesting is the trend in median 5G upload speeds, which ramped up in early July to reach a weekly high of 27.07 Mbps in the week of the opening ceremony, but declined thereafter, down to 23.30 Mbps during the final week. Since the games concluded, 5G performance has picked up again, as the crowds who attended have subsided and the demand on the network abates.

Paris, Summer Olympics 2024 – Weekly Performance Before & During the Games
Speedtest Intelligence® | May – August 2024


This stronger proportional uplift in upload performance over download highlights the desire of network operators to adequately serve the anticipated spike in demand from users to upload and stream video content. Despite this, upload performance over 5G remained approximately 1/10th that of download performance, while Orange’s private wireless 5G network, geared to serve the upload of high-definition content from the Games to the International Broadcasting Centre, was configured to have 80% of its throughput dedicated to the uplink. 4G performance followed a similar pattern, showing stable median download speeds and a ramping up of upload performance.

Assessing the network legacy of past events

While we wait to evaluate the network legacy of these Games for Parisians, we examined previous sporting events, to assess whether the network infrastructure deployed had a more permanent or transitory impact on users. We looked at network performance six months prior to, during, and six months following the events.

5G Performance – Select Major Sporting Events
Speedtest Intelligence® | 2020-2024

5G uplink performance is clearly prioritized for these major events, which makes sense given the increased demand from visitors to upload and stream live content. With the exception of Tokyo, the other three major events saw a statistically significant improvement in median 5G upload speeds. The World Cup in Qatar led the way with a 34.8% improvement, followed closely by Paris with a 29.5% increase. That said, the improvements appear only temporary, with median upload speeds falling in the six months after each event. The uplift is more muted for median 5G download performance, with an increase recorded for both the Winter Olympics in Beijing and the FIFA World Cup in Qatar, while differences in 5G download speeds at the Summer Olympics in Paris and in Tokyo were too close to call. 

4G-LTE Performance – Select Major Sporting Events
Speedtest Intelligence® | 2016 – 2024

4G performance leading up to these major events paints a similar picture to 5G, with more of a focus on improvements to uplink capacity, however there is evidence of more sustained performance post-event. While there was no statistically significant increase in 4G download performance in time for the Summer Olympics in Paris, upload performance ramped up by 9.7%. We also recorded increased upload performance for the Summer Olympics in Rio de Janeiro, the Winter Olympics in Beijing, and for the African Cup of Nations in Cote D’Ivoire. The latter two of these recorded increases in both 4G download and upload performance in time for the events, and in Abidjan this performance uplift was sustained for the six months following the event.

We’ll continue to examine network performance at major events globally. We’re keen to see how the network build advances for LA28, especially given the big focus on major transport initiatives, including “Twenty-Eight by ’28”, which is really placing infrastructure development at the heart of the games.

Ookla retains ownership of this article including all of the intellectual property rights, data, content graphs and analysis. This article may not be quoted, reproduced, distributed or published for any commercial purpose without prior consent. Members of the press and others using the findings in this article for non-commercial purposes are welcome to publicly share and link to report information with attribution to Ookla.

| June 24, 2024

5G in the U.S. – Additional Mid-band Spectrum Driving Performance Gains

5G performance in the United States continues to improve as more mid-band spectrum becomes available. In March, T-Mobile gained access to additional 2.5 GHz spectrum it won at auction 108 in 2022, and we’re already beginning to see the impact of this, adding extra capacity to its 5G network and boosting performance in rural U.S. locations in particular. In just one month, T-Mobile’s median download performance across the U.S. increased by 29.64 Mbps. Its recent agreement to acquire the bulk of US Cellular’s wireless operations and a portion of its spectrum holdings will help it further reinforce its competitive lead. Verizon and AT&T have both benefited from the early vacation of C-band spectrum by satellite providers, the licenses for which were acquired through Auction 107 in February 2021. AT&T acquired additional 3.45 GHz licenses, former U.S. Department of Defense spectrum, made available through Auction 110 which concluded in January 2022. All three major carriers have since been upgrading their sites to support their new spectrum frequencies. This update reviews the latest Speedtest Intelligence® data to highlight the impact of deployments in new spectrum bands for U.S. 5G users.

Key takeaways

  • Recent trends highlight the importance of additional mid-band spectrum for 5G. Speedtest Intelligence data shows a clear correlation between the release of additional mid-band spectrum, 5G performance, and consumer sentiment for 5G networks, with all three national wireless providers benefitting over the past 6 months. This sends a clear message to the FCC and other regulators, of the benefits of allocating additional spectrum for cellular use, as advocated for by industry bodies such as the CTIA, CCA and GSMA.
  • T-Mobile intent on holding its lead. While C-band spectrum allowed Verizon in particular to play catch-up during Q4 2023, T-Mobile has continued to build on its performance advantage and innovate, moving to a 5G Standalone (SA) architecture, testing six carrier aggregation, while also benefiting from deploying in additional mid-band spectrum starting in March. T-Mobile recorded a median 5G download speed of 287.14 Mbps as of March 2024, an increase of 29.64 Mbps in a single month, which helped it extend its lead over Verizon, which recorded 224.67 Mbps, and AT&T with 145.36 Mbps. Additional spectral capacity will also help fuel further growth of 5G Fixed-Wireless Access (FWA) services, as wireless operators have had to be selective in signing up new fixed customers in order to manage capacity.
  • Additional mid-band spectrum helping close the gap on regional disparities within the U.S. While the U.S. ranks highly on 5G performance, 5G Service, and 5G Availability metrics versus other leading 5G markets globally, there have remained wide disparities in 5G performance between U.S. states, and between urban and rural locations. Recent mid-band spectrum deployments are starting to shift the needle for a number of states and rural communities.
  • 5G upload and latency performance need more attention. To date, capacity gains from additional spectrum are being directed almost universally to boost 5G download performance, in part because 5G-NR TDD radios are being used in both 2.5 GHz and 3.5 GHz bands. While latency remains relatively static, we do see a consistent improvement from T-Mobile, a trend which will be important if the carrier is to differentiate itself on latency-critical applications in the future.

T-Mobile continues to maintain its national lead on 5G performance

Speedtest Intelligence data for the U.S., covering the last three years, clearly shows how instrumental additional mid-band spectrum has been for all major US carriers. Four points in time stand out very clearly when we look at median download speeds across the market:

  • T-Mobile’s deployment of 5G in both 600 MHz and 2.5 GHz spectrum during 2021 (acquired through the merger with Sprint), giving it a significant early advantage, as AT&T and Verizon focussed more heavily on mmWave spectrum.
  • Verizon performance picked up in January 2022, after it began C-band deployments, which had been delayed due to concerns of interference at airports from the FAA. 
  • The early vacation of the remaining C-band spectrum by incumbent satellite operators in August 2023, giving AT&T and Verizon full access to the spectrum frequencies they acquired at auction in 2021.
  • T-Mobile’s recent deployment following the release of additional 2.5 GHz spectrum as part of Auction 108, beginning in March 2024.

Chart fo U.S. 5G Median Download Speeds | January 2021 - May 2024

T-Mobile had capitalized on its early advantage, building out 5G in 600 MHz spectrum to cover 200 million Points of Presence (PoPs) as of 2020, following that up with wide deployment in its mid-band 2.5 GHz spectrum holdings. Despite performance boosts for AT&T and Verizon from additional C-band spectrum in Q4 2023, T-Mobile still led the pack with a median 5G download speed of 275.50 Mbps as of May 2024, 23% faster than next placed Verizon. Its lead had narrowed since August, with Verizon’s C-band spectrum helping it increase median 5G performance from 133.56 Mbps in June to 215.57 Mbps in December. AT&T also saw performance pick up in the second half of 2023, and at the turn of the year, these trends pointed towards a much more competitive 5G market during 2024, while also driving increased capacity for wireless provider’s 5G FWA services.

T-Mobile has continued to innovate in order to drive performance gains across its 5G network. In addition to deploying a 5G Standalone architecture, it is pushing the envelope on carrier aggregation, most recently completing a test with Ericsson and Qualcomm of six carrier aggregation, stitching together two channels of each of its 2.5 GHz, PCS, and AWS spectrum to achieve download speeds in excess of 3.6 Gbps. Furthermore, having finally gained access to additional 2.5 GHz spectrum it won during auction 108 in 2022, but had not been cleared to use, T-Mobile has rapidly been enabling the new spectrum across its footprint. This has allowed it to extend its lead in the market, recording a median 5G download speed of 287.14 Mbps in March 2024. As cellular providers ramp up their home broadband offerings via 5G fixed wireless access (FWA), as we recently highlighted, they will need to balance fixed net additions carefully in order to ensure cellular performance does not suffer, and will require additional high capacity spectrum over time to meet demand.

Driving improved quality of experience and consumer sentiment

The uplift in 5G performance is driving improved consumer sentiment, as measured by net promoter score (NPS). NPS is a key performance indicator of customer experience, categorizing users into Detractors (score 0-6), Passives (score 7-8), and Promoters (score 9-10), with the NPS representing the percentage of Promoters minus the percent of Detractors, displayed in the range from -100 to 100. Reviewing Speedtest Intelligence data shows that U.S. cellular providers returned either flat or declines in 5G NPS over the period March to August 2023. From September onwards, we see a strong uplift in 5G NPS in particular for Verizon and AT&T following their C-band deployments. T-Mobile on the other hand, has seen a sizable increase in 5G NPS in March, corresponding to its deployment in additional mid-band spectrum.

Chart of 5G Net Promoter Scores, U.S. Wireless Providers

Key to this growth in 5G NPS for all three cellular providers, is the impact that increases in 5G performance are impacting the quality of experience for end users for key use cases such as video streaming and mobile gaming. Both measures, as highlighted by Ookla’s 5G Game Score™ and 5G Video Score™ metrics have seen strong increases over the course of the past year.

5G Video & Gaming Quality of Experience
Speedtest Intelligence® | Q1 2023 – Q1 2024

Positioning the U.S. strongly internationally

Performance gains from all national cellular providers have enabled the U.S. to climb the ranks when compared to its peers internationally. Over the course of just one year, it has moved from 20th place on Ookla’s Speedtest Global Index, to reach 11th as of February 2024. This has been driven by increased availability of mid-band spectrum for 5G use, as advocated for by the CTIA, which recently released a report claiming that the U.S. could benefit from an additional $200 billion in economic growth over the next 10 years through allocating additional mid-band spectrum for 5G.

U.S. providers are also continuing to expand the reach of 5G networks across the market. 5G Service, the share of known operator locations where 5G was present (of total locations with cellular service) climbed from 68.4% in Q3 2023 to 76.7% in Q1 2024. Deployment of 5G in low band spectrum is also critical to ensuring high 5G Availability – the share of 5G users that spend a majority of their time connected to 5G networks. The U.S. still tracks as one of the leading markets globally for 5G Availability, despite its comparatively large landmass, although that metric remained level quarter-on-quarter.

5G Service and 5G Availability – U.S. vs Other Leading 5G Markets
Speedtest Intelligence® | Q1 2024

Closing disparities in 5G performance between U.S. states & rural locations 

While national median speeds continue to advance, there remain some significant disparities in 5G performance at an individual state level. The Midwestern States fare best, with Illinois, Kansas, North Dakota, and Minnesota all within the top-5 performing states nationally, with median 5G download speeds above 225 Mbps during Q4 2023. At the other end of the scale are U.S. states with the highest shares of rural populations, including Vermont, Maine, Mississippi, and West Virginia, which had median download speeds below 100 Mbps. 

5G Median Download Speed by U.S. State (Mbps)
Speedtest Intelligence® | Q4 2023

Differing allocations of spectrum, channel bandwidths, device capabilities, and carrier aggregation options all impact the observed performance of each service provider across the locations they serve. While each network operator has its own 5G deployment strategy, the deployment of mid-band spectrum for capacity in urban locations, complemented with sub-1 GHz spectrum to enable wider and better 5G coverage, is the common approach. While performance gaps will remain as a result of these deployment strategies, recent mid-band spectrum deployments, including in C-band and 2.5 GHz, are beginning to help close the performance gap for some states. 

We examined T-Mobile’s recent performance, comparing data between February and March, as it deploys 5G in its additional 2.5 GHz spectrum. The results show performance has increased across a wide range of U.S. states, with its median 5G performance increasing by more than 10 Mbps within 35 States and the District of Columbia. Among the ten states with the lowest median 5G download speed (based on data for all providers), T-Mobile showed the most significant performance uplifts in West Virginia (+79.73 Mbps), Wyoming (+66.61 Mbps), and New Hampshire (+48.50 Mbps).

T-Mobile’s 2.5 GHz Dividend – Uplift in 5G Median Download Speeds (Top 15 Improving States)
Speedtest Intelligence® | March vs February 2024

Speedtest Intelligence data also illustrates the gap between rural and urban U.S. locations, which has widened over the last three years as mid-band deployments have tended to focus on more urban locations. That is beginning to change, with both T-Mobile and Verizon keen to highlight the impact of their recent spectrum deployments on rural 5G performance. While AT&T only saw a minor increase in median 5G download speeds in rural locations, both T-Mobile and Verizon have targeted significant increases in performance through mid-band spectrum deployments.

Mid-band spectrum driving improvements in urban & rural 5G performance
Speedtest Intelligence® | Q1 2021 – Q1 2024

All eyes on download throughput – upload & latency require attention

Additional spectrum has fueled surges in download performance thanks to the deployment of 5G in mid-band spectrum, but upload and latency metrics have not improved to the same degree. All three cellular providers maintained relatively static median upload speeds across the two year period we examined (Q1 2022 to Q1 2024). 5G latency performance was a mixed picture, with T-Mobile the only provider to consistently improve, reducing its latency from 55 ms in Q1 2022 to 46 ms in Q1 2024. Both Verizon and AT&T saw latency grow over the same period.

5G Median Upload and Latency Performance, (by provider, U.S.)
Speedtest Intelligence® | Q1 2022 – Q1 2024

It’s very clear that U.S. cellular providers are prioritizing improvements in download performance. This will likely continue in 2024, as T-Mobile, AT&T, and Verizon each seek to gain the upper hand, using any 5G network advantages to capture a larger share of competitive churn. Over time however, we expect the relative importance of upload and latency performance to grow, as 5G download performance begins to exhibit diminishing marginal returns, and increasing importance is given to improving the experience of latency-sensitive use cases such as video calling, mobile gaming, and augmented reality.

2024 is set to drive renewed competitive pressure between all of the service providers in the U.S., with the continuing deployment of 5G in mid-band spectrum, T-Mobile’s acquisition of US Cellular’s assets, and made all the more interesting given the DISH wildcard. We’ll continue to monitor and report on 5G performance trends in the U.S., and their impact on Speedtest users. To learn more about Ookla Speedtest Intelligence, please get in touch.

Ookla retains ownership of this article including all of the intellectual property rights, data, content graphs and analysis. This article may not be quoted, reproduced, distributed or published for any commercial purpose without prior consent. Members of the press and others using the findings in this article for non-commercial purposes are welcome to publicly share and link to report information with attribution to Ookla.

| January 18, 2017

Which US Airport has the Fastest Internet?

You may have read our recent coverage of the airports and carriers with the fastest internet during the holidays. But the holidays are behind us and it’s time to get real about the year’s upcoming business trips and vacations to sunny spots. That has us asking, “Which airports have the fastest mobile and Wi-Fi speeds right now?”

We went bigger this time, examining the 20 US airports with the most passenger boardings. Once again we looked at Speedtest data for the four largest carriers: AT&T, Sprint, T-Mobile and Verizon as well the airport-sponsored Wi-Fi at each location. We chose to focus on data from the last three months of 2016 because, thankfully, the internet keeps getting faster (except for Wi-Fi at nine of these airports, more on that later). Wi-Fi gets upgraded and carriers are regularly rolling out new technology and capacity at US airports.

Enough methodology already, you want to know who won and how that affects your next wait at the gate.

The fastest connections

You’ve probably noticed that your internet experience varies a little when traveling, but you likely had no idea how much the airports you’ve chosen to fly through affect the mobile internet speeds you’ll achieve. So who’s winning the airport internet game?

Fastest airports (cellular)

If you’re connecting via cellular signal, the difference between the average download speed of 7.25 Mbps at LaGuardia and Detroit’s 45.79 Mbps is the difference between kinda sorta getting through the latest episode of Westworld on your phone and enjoying the full HD video experience on your tablet.

For context, mean mobile speeds in the US during the same period are 21.77 Mbps for download and 8.54 Mbps for upload.

Although San Francisco’s upload speeds are nearly three times as fast as those at JFK, upload speeds at these airports fell into a much narrower band that’s pretty close to the national average. So unless you’re trying to upload all of your vacation photos while waiting for that connecting flight, you’re probably going to have the bandwidth you need no matter where you’re departing from.

Fastest airports (Wi-Fi)

If you’re committed to using airport Wi-Fi, you’ll find an even bigger range of speeds for both download and upload depending on your location. From a dismal 2.71 Mbps average download speed over Atlanta’s Wi-Fi to Denver’s average of 61.74, you could be facing the difference between an audio-only experience and actually being able to distract your weary travel companions with an HD movie.

Interestingly, Wi-Fi uploads are faster than downloads at seven of the airports we surveyed. Atlanta’s uploads are also snail-paced, so you probably want to wait on uploading your Walking Dead Zombie Tour pics until the next leg of your trip, but if you’re in Dallas you’ll have the speed you need to video chat while uploading every photo and video you ever took. Ever.

Airport download speeds (cell vs. Wi-Fi)

You might think cell signals are a lot faster than Wi-Fi. Our data show that when it comes to airports, it’s impossible to guess which type of connection will be faster until you’ve actually arrived. Unless, of course, you have this handy chart:

In seven of the airports we looked at, Wi-Fi easily won the speed race, especially in Denver where Wi-Fi is more than three times faster than cellular service. In fact, Denver’s Wi-Fi is faster than cell or Wi-Fi at any of the other 19 busiest airports. Which is probably a good thing, considering Denver recently invested $2.5 million in their Wi-Fi network.

LaGuardia and Philadelphia’s public Wi-Fi networks were nearly three times faster than their average cell download speed, and in Miami and Seattle, Wi-Fi is nearly twice as fast as cell.

In airports like Charlotte Douglas, JFK and Newark, your internet download speeds are relatively similar on cell or on Wi-Fi.

On average, cellular downloads are the way to go at ten airports. In San Francisco and Orlando, cell was about seven times faster than Wi-Fi while McCarran in Las Vegas and Minneapolis-Saint Paul say cell downloads were about four times faster than airport Wi-Fi.

Fastest carriers

Frequent flyers who are also Verizon subscribers will be pleased to know that Verizon wins at nine out of 20 airports we surveyed for Q4 2016. AT&T takes eight and one airport is tied between Verizon and AT&T. Sprint and T-Mobile each check in at one.

Who has the fastest internet where you’re connecting

The map below breaks down the fastest carrier at each of the 20 busiest airports in the US. You’ll also find that carrier’s download and upload speed.

Though Verizon offers the fastest downloads at the most airports, the company doesn’t dominate any particular area of this map. Instead, Verizon and AT&T vie for fastest at top airports across the US except at those closest to the Great Lakes. In that area, Sprint takes fastest carrier title in Chicago and T-Mobile wins Detroit. In Miami, fastest carrier is really too close to call.

Just because a carrier is fastest in a given airport doesn’t mean that the speeds there are good. AT&T’s 8.69 Mbps at LaGuardia is particularly slow. At eight of the 20 airports we examined (LaGuardia, LAX, Charlotte Douglas, Miami, Phoenix, Newark, Philadelphia and JFK), the speeds offered by fastest carriers AT&T and Verizon are below the US average.

On the other end of the spectrum, T-Mobile’s average download speed at Detroit Metropolitan Airport is more than three times the national average while Verizon’s speed at San Francisco International Airport and Sprint’s showing at O’Hare are more than double that national average. And it’s hard to complain about the 30+ Mbps download speed offered by the fastest carriers at airports in Dallas, Atlanta, Minneapolis and Orlando.

Carriers are improving service

Just because a carrier didn’t win, doesn’t mean their speeds are slow or that they aren’t improving. Now you know who the fastest carriers are today, but who will be fastest a few months or a year from now? We took a look to see which carriers improved their download speed the most at each airport between Q3 and Q4 2016.

As expected, the news is mostly good. Speedtest data shows that in some cases, like O’Hare, Dallas and SeaTac all four carriers boosted their mobile download speed. We’re proud to boast that at SeaTac, our home airport, those percent increases were all in the double digits.

Verizon made an excellent showing with massive improvements at JFK and SeaTac. They were also the most improved carrier at five other airports. AT&T’s improvements at LAX are a bright spot in an otherwise slow airport. AT&T was also most improved at four other airports. T-Mobile demonstrated the biggest improvements at seven airports from Denver to Boston. And Sprint was the most improved carrier at Miami International.

We did see minor dips for individual carriers at some airports. We’d like to keep the emphasis on the winners this time, but we are keeping an eye out to see how those speeds evolve over time.

Wi-Fi gets better (mostly)

At 12 of the 20 busiest airports in the US, Wi-Fi download speed increased when comparing Q4 2016 to Q3 2016. Cheers to JFK for more than doubling their Wi-Fi download speed. Speeds in Denver and Philadelphia continued to improve between Q3 and Q4 of 2016. Because both airports have already invested significantly in their Wi-Fi, what’s good is only getting better. Seattle also gets a shout-out for a strong improvement on an already above average speed.

As needed as some of these improvements are, airports would do well to shoot for a benchmark speed rather than incremental increases. Orlando International, in particular, could benefit from a large investment in Wi-Fi, because although they show the second highest percentage increase, the resulting average download speed still is not at all serviceable for anything beyond basic calls and texts.

And then there are the airports where average Wi-Fi speeds decreased: Detroit Metropolitan, Charlotte Douglas, Logan in Boston, McCarran in Las Vegas, Phoenix Sky Harbor, LAX, Dallas Fort Worth and Chicago’s O’Hare. Whether their existing Wi-Fi systems are reaching their limits or something else went wrong, no one wants to see internet speeds decrease. If Idaho Falls Regional Airport offers 100 Mbps Wi-Fi (and our tests show on average, users were achieving speeds of over 200 Mbps) there’s a path to Wi-Fi success for every airport.

Worth mentioning is the fact that public Wi-Fi is not the only option. For example, Comcast is testing new Xfinity-on-the-Fly lounges in Philadelphia. While we did not include tests over this network in our ratings, they did show an impressive average download speed of 101.37 Mbps. Though we’re reporting on public Wi-Fi networks only, if your airport Wi-Fi isn’t cutting it, try looking for airline-specific networks in lounges.

What this means for you

Now that you know which airports have the fastest internet, it’ll be that much easier to book the most productive business trip or the most frustration-free vacation.

And if you have an extra second during your next layover, please download our app for iOS or Android then take a Speedtest. We’ll tell you how fast your connection is and use that data to create more content like this in the future.

Ookla retains ownership of this article including all of the intellectual property rights, data, content graphs and analysis. This article may not be quoted, reproduced, distributed or published for any commercial purpose without prior consent. Members of the press and others using the findings in this article for non-commercial purposes are welcome to publicly share and link to report information with attribution to Ookla.