| September 28, 2020

Monitoring Network Health and Improving Customer Care with Real-Time Network Performance Data (Webinar)

Speed and responsiveness are critical elements when identifying and resolving customer-impacting network performance issues. Unfortunately, it hasn’t always been easy for internet service providers (ISPs) and mobile network operators to connect internal monitoring system flags to individual customer problem reports. Even once that connection is made, most providers lack a simple way to proactively respond to known performance issues via customer care.

Fortunately, real-time insights into network performance can help providers proactively identify degradation, effectively communicate with customers via traditional customer care flows and social media, and strategically deploy engineers to the most deeply affected areas.

In the Ookla® webinar on October 8, we’ll share three real-world use cases where ISPs and mobile operators are using real-time feeds of Speedtest® data to improve their network operations centers (NOC) and customer care responses. Read on for three examples of how the world’s leading network providers are approaching real-time performance issues.


1. Monitor network performance in real-time to proactively identify customer issues

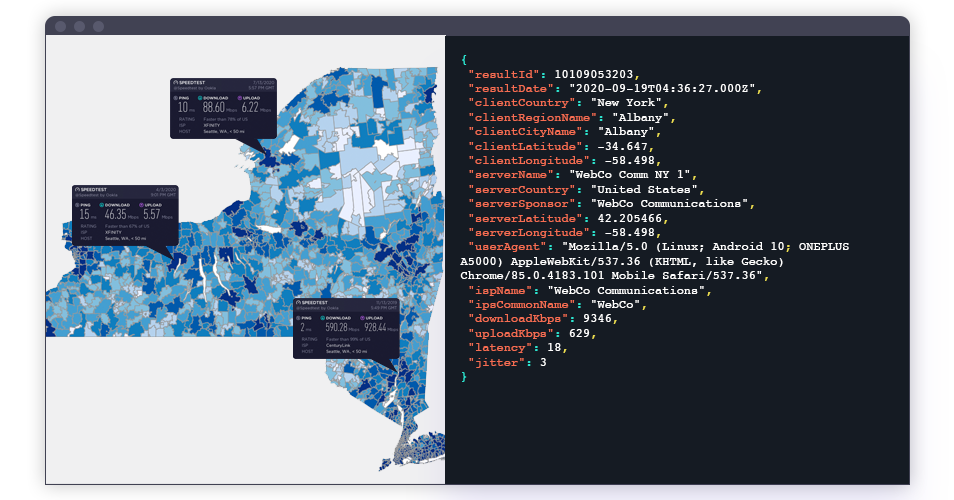
Data collected via Speedtest Intelligence™, Speedtest Custom™ or a Speedtest SDK™ can be ingested via real-time feeds. These feeds can either connect to Amazon Web Services solutions such as Simple Queue Services (SQS) or to a webhook API. This allows for tight integration of real-time network performance information directly into critical provider services, including customer care.

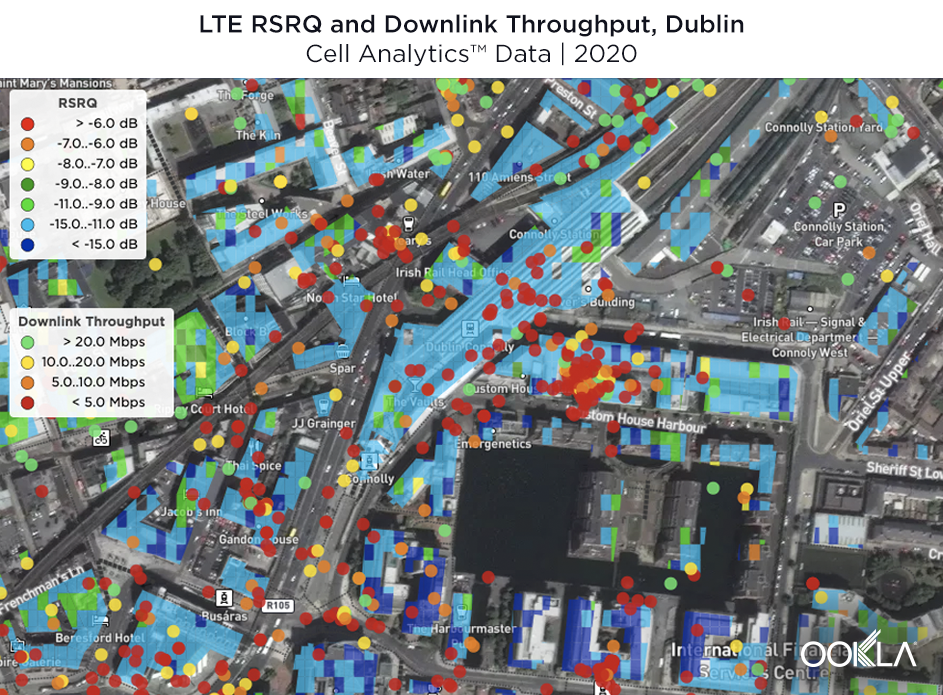
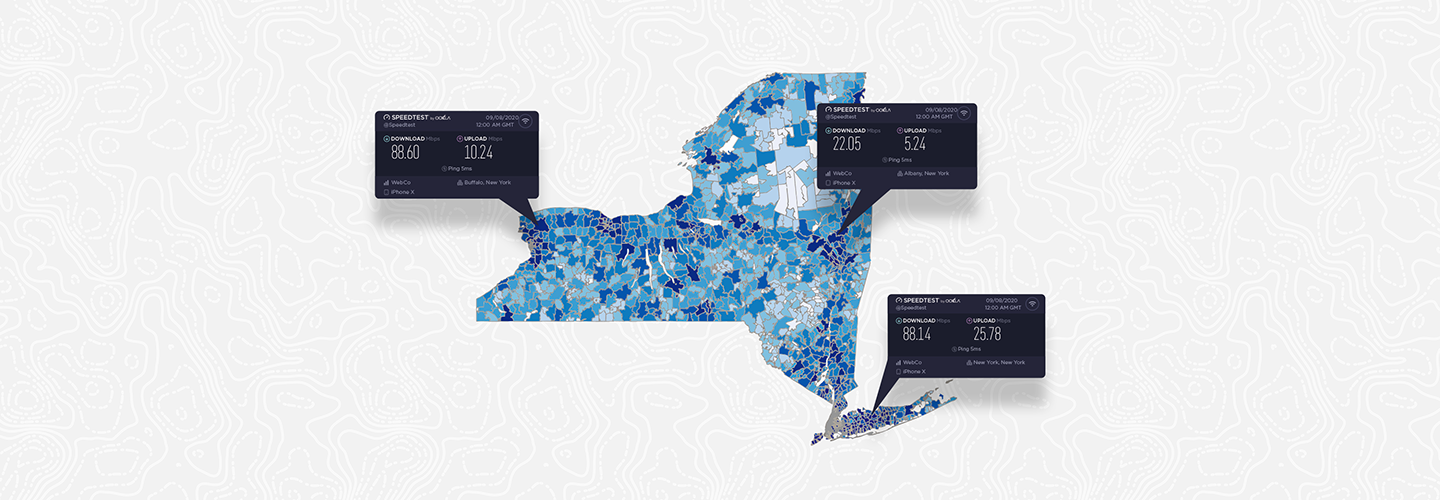
2. Create NOC dashboards to identify regions and specific locations experiencing performance degradation

Often, consumers report performance issues before internal monitoring tools can detect a trend. Speedtest data can be pulled from real-time feeds to identify individual outliers or arbitrary regions (e.g., a postal code, state or territory) for further investigation. This data can be correlated with network probe data in real-time to provide deeper insights into issues impacting regional performance.

Real-time-header-code

3. Integrate Speedtest data into customer care workflows to help troubleshoot connection issues in real-time

Customer speed tests are already an important component of most customer care workflows — whether taken via a network provider’s own system, Speedtest applications or an operator’s Speedtest SDK instance. While simply identifying whether an internet connection performs as provisioned is a critical first step in troubleshooting customer network issues, additional information is often necessary to truly understand the root cause of an issue. Speedtest real-time feeds deliver this information directly to customer care systems, helping teams understand how factors like connection type, technology, signal level and Wi-Fi band frequency impact an end user’s individual experience.

The webinar on Thursday, October 8 at 9 a.m. Pacific (12 p.m. Eastern) will show these solutions in action. Don’t miss it. A recording will be provided for registrants who can’t tune in to the live presentation. Register now.

Ookla retains ownership of this article including all of the intellectual property rights, data, content graphs and analysis. This article may not be quoted, reproduced, distributed or published for any commercial purpose without prior consent. Members of the press and others using the findings in this article for non-commercial purposes are welcome to publicly share and link to report information with attribution to Ookla.

| October 6, 2020

Announcing Ookla Open Datasets

Our mission at Ookla® is to help make the internet better, faster and more accessible for everyone. For over 14 years, Speedtest has helped consumers ensure they’re getting what they pay for from their internet service provider (ISP) and mobile network operator. In turn, providers and operators use Speedtest Intelligence® data to monitor competitors and optimize their own networks for reliability and performance. We also make our data available on a complimentary basis to policy makers, humanitarian organizations, academic research institutions, journalists and consumers. Today we are launching Ookla Open Datasets under the Ookla for GoodTM program to make this critical data accessible to others who are trying to improve the state of networks worldwide.

While the world’s evolving internet infrastructure has improved our access to entertainment in the form of video streaming and competitive gaming, the global COVID-19 pandemic has highlighted the importance of the internet’s role in providing essential services and opportunities. Those with high-speed internet access are able to work safely, have access to more remote job opportunities, attend remote classes and seek basic healthcare — all from the safety and comfort of home. Both rural and economically depressed urban communities face challenges due to a lack of connectivity and often require government and nonprofit grants to become adequately “served.” We hope that Ookla Open Datasets will give consumers, journalists, regulators, local governments and other organizations the tools they need to bridge this digital divide.

About the datasets

Every month, people use Speedtest hundreds of millions of times to check the speed of their internet connections. In order to create a manageable dataset out of this vast amount of network performance data, we’ve aggregated raw Speedtest performance results into tiles. Using Web Mercator projection, the de facto standard for web mapping applications, the size of these data tiles varies depending on latitude, but tile sizes can be calculated in square meters. The average download speed, upload speed, and latency for each tile are provided. Data is partitioned based on whether the test was taken over a mobile (cellular) connection or a fixed (including Wi-Fi) connection, based on one quarter’s worth of tests. Results are then updated quarterly.

The Global Fixed Broadband and Mobile Network Maps dataset is available via the Registry of Open Data on AWS in Apache Parquet and Shapefile formats. Data scientists, GIS analysts, internet enthusiasts, researchers and policymakers may use this data free of charge under the Creative Commons license for non-commercial use.

Today’s release includes fixed and mobile performance tiles for Q1, Q2 and Q3 2020. Technical documentation and tutorials are available here. Our team is already using this data to build exciting tools and visualizations to help identify areas in need. For example, the below map of underserved areas near Oklahoma City, Oklahoma shows policymakers granular, detailed information about where network speeds need improvement.

Ookla_Oklahoma-City_download-speed-over-fixed-broadband_1020-1
We look forward to seeing how you use Ookla’s open data to help make the internet better, faster and more accessible for everyone. Please tag us if you share your projects on social media using the hashtag #OoklaForGood so we can geek out with you.

Ookla retains ownership of this article including all of the intellectual property rights, data, content graphs and analysis. This article may not be quoted, reproduced, distributed or published for any commercial purpose without prior consent. Members of the press and others using the findings in this article for non-commercial purposes are welcome to publicly share and link to report information with attribution to Ookla.

| June 3, 2020

Efficiently Design and Optimize Your Network with Crowdsourced Data (Webinar)

Mobile network operators are currently faced with a double challenge. With much of the globe still under stay-at-home orders, consumers are increasingly reliant on the quality and availability of their networks — and worldwide, operators are facing both budget cutbacks and logistical limitations on traditional data collection methods like walk-testing and drive-testing. Now more than ever, network planners and engineers must prioritize their decisions to have the maximum impact on customer experience with the minimum associated cost.

In Ookla’s upcoming webinar, we’ll show three real-world use cases where European operators can make low-cost or no-cost changes to their existing networks — without drive testing. By identifying competitors’ cell site locations and finding areas of high density and usage where competitor networks perform better, operators can use the crowdsourced data in Cell Analytics™ to prioritize improvements to their networks.

Read on to discover three ways operators can make smarter design and optimization decisions, and don’t miss the webinar on Wednesday, June 17, 2020 at 7am PDT / 10am EDT / 4pm CEST.


1. Identify populated areas where competitor networks outperform yours

Powered by hundreds of millions of signal measurements collected daily by Speedtest®, Cell Analytics provides intelligence about wireless service quality, RF measurements, data usage, user density (both indoors and outdoors), cell site locations and much more. By looking at areas with the highest user density and data usage, you can identify areas where people need a strong connection — and see where competitors provide better wireless service.

webinar-screenshot_LTE_RSRQ_Barcelona

In the above example, we can see signal quality for a given operator both in and around one of Barcelona’s most popular locations, La Sagrada Familia cathedral. By looking at real-world measurements, you can discover the highest-priority places to invest in capacity expansion or relatively simple fixes like antenna downtilt or network parameter changes.

2. Identify competitor cell sites and monitor new cell site deployments

Without visibility into your competitors’ network performance, quality and availability, it can be difficult to benchmark your own network metrics. Crowdsourced data provides actionable intelligence to assess your network performance inside and outside of buildings and to compare your network to competitors’. Use the Cell Site Finder tool in Cell Analytics to discover the location of competitor cell sites, analyze your performance vs. competing networks and identify opportunities for potential collocation or new deployments.

webinar-screenshot_LTE_RSRP_London

In the above example, we have cross-referenced the location of various network operators’ cell sites with RSRP in two busy shopping locations near London’s Wembley Stadium. From this, we can see the location of all cell sites in the area and a precise view of the service they are delivering. By viewing the coverage of individual competitor sites, you can avoid costly errors that result from relying on RF prediction tools alone during new cell site design.

3. Identify ways to make low-cost improvements to your existing network

Once you’ve prioritized the areas where improvements are most needed, dig into our data to see why users might be experiencing poor network performance and low data quality. To troubleshoot the underlying issues, you can analyze serving cells and band usage in high resolution and then look at the relation between RF conditions and service indicators like throughput, latency and jitter.

webinar-screenshot_LTE_RSRQ_Dublin

By comparing one operator’s RSRQ with downlink throughput in Dublin’s busiest railway station, we can pinpoint the exact sites that need adjustment to increase the quality of service for this operator. This type of data shows you where a relatively easy fix like antenna azimuth or downtilt changes might help.

To see in-depth recommendations for the operators in the above scenarios, don’t miss the webinar on June 17. If you cannot make the presentation, you can register to receive a video recording after the live event. We look forward to showing you how to leverage real-world data to make better network decisions and answering any questions you may have. Register now.

Ookla retains ownership of this article including all of the intellectual property rights, data, content graphs and analysis. This article may not be quoted, reproduced, distributed or published for any commercial purpose without prior consent. Members of the press and others using the findings in this article for non-commercial purposes are welcome to publicly share and link to report information with attribution to Ookla.

| June 30, 2020

Introducing the Speedtest Web SDK

Our mission at Ookla® is to make the internet better, faster and more accessible for everyone. To that end, we continuously look for ways to help internet service providers and mobile network operators diagnose customer issues and make network improvements. Today, we’re excited to announce a new way for network providers to integrate Speedtest® directly into your websites and web-based customer care solutions. The Speedtest Web SDK™ helps you understand how network performance and quality of service impact the consumer experience, so you can provide better, more informed customer care.

The Speedtest brand is already trusted by hundreds of millions of consumers worldwide as a source for accurate, unbiased network testing. With the Speedtest Web SDK, network operators can now integrate this same robust, accurate testing experience into their web solutions, with complete control over the user interface.

Built on Speedtest’s industry-standard testing engine and methodology

Built in Javascript, this software development kit allows you to install Speedtest as the testing solution on your website. You can build the user interface to your exact specifications and configure individual test stages including download, upload and ping.

With the ability to test against your own servers, you can diagnose and troubleshoot individual customer problems, down to the last mile of a network connection. Optionally, the Speedtest Server Network™ can be accessed for testing your customers’ network performance.

Complete network diagnostics, with flexible data and reporting options

The Speedtest Web SDK provides results for download speed, upload speed and latency (ping and jitter). Data is available directly inside your application at the time of the test, ready to drive dynamic content and actionable insights to customers. The data can be delivered to your data warehouse either as a CSV extract or via a real-time JSON feed, which may be integrated into a customer experience management or CRM platform for customer care use.

The Ookla team offers support throughout the SDK implementation process, providing onboarding and assistance with test server implementation. Licensing the Speedtest SDK includes ongoing maintenance updates and technical support in addition to technical documentation, test methodology documentation and FAQs.

How providers use the Speedtest Web SDK

With the Speedtest SDK, you can collect rich data that can be used to help:

  • Predict and prevent customer churn
  • Plan and validate network improvements
  • Diagnose and troubleshoot individual customer problems
  • Prevent expensive service truck rolls
  • Ensure regulatory compliance

Whether improving an individual consumer’s call with customer care or analyzing trends in network performance, you can use Speedtest data to resolve issues impacting customer experience and save money on field support costs.

The Speedtest Web SDK makes it easy for network providers to offer a world-class network testing experience in your own solutions, backed by the Speedtest brand that consumers know and trust. Interested in other ways to provide Speedtest to your customers? We will be launching the Speedtest Mobile SDK™ later in 2020 so clients can integrate Speedtest into their mobile applications.

To learn more, inquire about the SDK today.

Ookla retains ownership of this article including all of the intellectual property rights, data, content graphs and analysis. This article may not be quoted, reproduced, distributed or published for any commercial purpose without prior consent. Members of the press and others using the findings in this article for non-commercial purposes are welcome to publicly share and link to report information with attribution to Ookla.

| August 31, 2020

SpatialBuzz Joins Ookla

Ookla® has acquired SpatialBuzz, an innovative provider of enterprise telecommunications solutions that empower operators with early detection capabilities for network issues combined with real-time opportunities to directly engage with customers and ensure their satisfaction.

SpatialBuzz and Ookla share the same core goal of improving the internet experience for all people. Together, we will explore new ways to help increase consumer transparency, improve the performance and quality of networks and ensure that our enterprise clients benefit even more from Ookla solutions.

Ookla will continue to support the full portfolio of SpatialBuzz solutions. We are thrilled to welcome the SpatialBuzz team to Ookla and look forward to a shared mission moving forward.

Ookla retains ownership of this article including all of the intellectual property rights, data, content graphs and analysis. This article may not be quoted, reproduced, distributed or published for any commercial purpose without prior consent. Members of the press and others using the findings in this article for non-commercial purposes are welcome to publicly share and link to report information with attribution to Ookla.

| October 29, 2019

Introducing Speedtest® CLI

At Ookla’s core, we are a team of passionate technology enthusiasts who constantly push to improve the speed of the internet across the globe. For thirteen years, Speedtest.net has provided the leading tools for people around the world to measure the speed and latency of their internet connections. From our Adobe Flash roots to our modern HTML5 and native applications, we have constantly focused on providing a high fidelity and rich experience for all internet users.

We have seen and have connected with many others who have the same goal — teams who have built brilliant ideas that leverage internet performance metrics to drive speed and reliability advancements across global networks.

Ookla’s goal is to support these teams by providing the best benchmarking toolsets to drive internet performance improvements across the world. Speedtest CLI is the next step in providing developers and engineers low level access to programmatically measure internet performance.

You can now run a Speedtest from your command line

We are proud to introduce our latest (and most visually minimal) application, Speedtest CLI. Speedtest CLI is a major departure from our existing applications — it is entirely text driven and does not have a traditional user interface. However, this minimalist interface is incredibly powerful — it provides the core of our Speedtest engines to software developers across the world.
speedtest-cli-Command_Line_Interface_1019L-1

This release marks the ability for any non-commercial individual to leverage over a decade of optimization and experience of network benchmarking within their own applications. Not only does Speedtest CLI provide best in class measurement techniques, but it also leverages our highly optimized C++ engine, custom Layer 7 protocols and the largest internet performance server network in the world to squeeze every bit per second out of a connection — even on embedded hardware. This is the same engine that powers our other native applications, and it is much more performant than existing solutions that rely on HTTP/S and traditional file transfer libraries.

For commercial entities, we offer Speedtest PoweredTM. Speedtest Powered further improves upon Speedtest CLI by providing deep network level customization, additional architectures, custom toolchain builds and enterprise support.

How you can use Speedtest CLI

We provide a number of different methods of working and communicating with Speedtest CLI. There is a basic user interface which provides the current stage and progress of the test for interactive use. However, the real power lies in the other output formats. We provide output in character delimited formats (CSV/TSV) and JSONL with a high sample rate — these can be consumed via the standard input of other applications to create live time progress meters and dynamic user interfaces.

Speedtest CLI can run on any platform

Speedtest is renowned for the ability to run on any platform, and Speedtest CLI is no exception. At launch, we will support Windows, MacOS, Linux and FreeBSD operating systems with statically compiled binaries. We are also excited to see what people will build within the IoT space on embedded devices — as a result, not only will we support the traditional i386 and AMD64 architectures, but we will also provide optimized builds for the ARM32 and ARM64 architectures on Linux.

Use cases for Speedtest CLI

One example of how Speedtest CLI can be used is a historical network monitoring tool. In a previous post, How I Maximized The Speed Of My Non-gigabit Internet Connection, Brennen Smith showcased an open source application which has tracked the historical performance of his internet connection with an internal build of Speedtest CLI. Now that this tool has been running for over a year, we can see that there have been multiple improvements on the ISP’s network. We can see that his upstream provider improved latency on November 2nd, and that there were multiple improvements on upload bandwidth since November 2018. Despite these improvements, one can also observe that there was degradation of the network from March 7th – 9th.
Ookla_Graphed-Speedtest-CLI-to-track-historical-performance_1019-1

These are critical key performance indicators to track; with Speedtest CLI, anyone can build world-class applications to monitor and track network performance around the globe.

Tell us what you’re building with Speedtest CLI

The team at Ookla is incredibly excited to see what the community builds around Speedtest CLI. Please share your achievements and any tools you build with Speedtest CLI by tagging us on GitHub, Facebook or Twitter. We’re looking forward to seeing how you drive innovation and improvements to create a better internet for everyone across the world.

For more information about Speedtest CLI and documentation, please visit the Speedtest CLI page.

Ookla retains ownership of this article including all of the intellectual property rights, data, content graphs and analysis. This article may not be quoted, reproduced, distributed or published for any commercial purpose without prior consent. Members of the press and others using the findings in this article for non-commercial purposes are welcome to publicly share and link to report information with attribution to Ookla.

| June 19, 2018

Mosaik is Joining Ookla

Ookla has acquired Mosaik, a pioneer in wireless network intelligence and mapping solutions. The combination of Ookla and Mosaik opens up exciting new data and visualization capabilities that enhance the product offerings to enterprise clients of both organizations and further strengthens Ookla’s position as the global leader in both fixed and mobile network analysis.

Ookla and Mosaik are highly complementary and share a commitment to providing the best network availability and performance insights to consumers and enterprises that rely on those networks to succeed.

Both teams will continue to focus on their existing offerings as they work together to provide vital industry research tools. In the near future, look forward to integrations between Ookla and Mosaik that advance market knowledge in an increasingly connected world. We’re excited to welcome Mosaik to the Ookla family.

Ookla retains ownership of this article including all of the intellectual property rights, data, content graphs and analysis. This article may not be quoted, reproduced, distributed or published for any commercial purpose without prior consent. Members of the press and others using the findings in this article for non-commercial purposes are welcome to publicly share and link to report information with attribution to Ookla.

| August 13, 2018

Downdetector is Now Part of Ookla

Ookla has acquired Downdetector, the leading source for real-time status and outage information for thousands of services and websites around the world. Downdetector’s commitment to providing open, transparent information about the state of online services echoes Ookla’s focus on illuminating the speed and performance of networks around the world for the benefit of those who use them.

As part of Ookla, Downdetector will continue to operate in full capacity as a resource for both consumers and enterprise businesses. We look forward to helping Downdetector in their mission to bring visibility to the availability and uptime of internet services.

Ookla retains ownership of this article including all of the intellectual property rights, data, content graphs and analysis. This article may not be quoted, reproduced, distributed or published for any commercial purpose without prior consent. Members of the press and others using the findings in this article for non-commercial purposes are welcome to publicly share and link to report information with attribution to Ookla.

| October 10, 2018

Ekahau is now part of Ookla

Ookla has acquired Ekahau, the market leader in enterprise Wi-Fi design, optimization and troubleshooting. Founded in 2000, Ekahau is universally trusted by IT professionals and Wi-Fi industry experts as the leading software and hardware technology for deploying the world’s highest performance and most robust Wi-Fi networks.

Whether a corporate office, hotel, hospital or university – if the Wi-Fi works well, it has likely been built using Ekahau’s Wi-Fi design solutions. Ekahau Site Survey is the ideal solution for designing and deploying Wi-Fi networks, while the Ekahau Sidekick is an all-in-one professional measurement device for fast and accurate Wi-Fi site surveys and spectrum analysis.

As part of Ookla, Ekahau will continue to operate as they always have and will enhance their products by leveraging the Speedtest platform. Ookla will also benefit from the expertise and technology that Ekahau brings to the measurement and optimization of Wi-Fi networks. We’re thrilled to welcome Ekahau to the Ookla family.

Ookla retains ownership of this article including all of the intellectual property rights, data, content graphs and analysis. This article may not be quoted, reproduced, distributed or published for any commercial purpose without prior consent. Members of the press and others using the findings in this article for non-commercial purposes are welcome to publicly share and link to report information with attribution to Ookla.

| March 19, 2019

Ookla Partners with FES to Power FESIQ Virtual Benchmarking Software

Ookla FES Logos

Ookla has partnered with FES, a leading provider of innovative software and services for the telecom industry, to power the FESIQ Virtual Benchmarking (VBM) software suite. Effective immediately, Ookla enterprise customers may leverage the FESIQ VBM analytics platform to view measured coverage in an unparalleled level of detail, including indoor and outdoor identification, all over the world.

This in-depth view into network coverage, performance and population density is a game changer for operators and infrastructure providers seeking to deliver dramatic improvements in network efficiency and performance, while simultaneously managing those costs. By rapidly assessing all networks and technologies down to the individual building level, FESIQ VBM cuts out the traditional expense and intense effort of measuring and mapping networks through methods like drive testing. Furthermore, a comprehensive view of competitive network coverage more fully informs capital and marketing spend.

FES assists a global clientele with the planning, implementation, optimization, and regulatory compliance of wireless networks. FES is a solutions pioneer in network design and performance, including live special event monitoring and rapid VoLTE improvement. The FESIQ software suite provides these insights via a blend of capacity and performance forecasting, crowdsourced measurement analytics, and network performance assurance functionality. Since inception, FESIQ has been used to plan and optimize tens of thousands of small cell, macro, and 5G cell sites.

To learn more or inquire about the benefits of FESIQ VBM powered by Ookla, visit Ookla.com/speedtest-intelligence.

Ookla retains ownership of this article including all of the intellectual property rights, data, content graphs and analysis. This article may not be quoted, reproduced, distributed or published for any commercial purpose without prior consent. Members of the press and others using the findings in this article for non-commercial purposes are welcome to publicly share and link to report information with attribution to Ookla.