| March 9, 2020

How the Speedtest Server Network Supports Millions of Tests While Providing the Most Accurate Results

Every day, over 10 million consumers press the “Go” button on Speedtest® to measure the performance and quality of their internet connection. Powering every one of these tests is a global network of high-performance servers, ready to test the maximum sustained throughput of the user’s connection (download and upload speeds) and to report back on key network health metrics, such as latency, jitter, packet loss and traceroute (the transit delays and path of packets across a network). These are the critical metrics that provide consumers with an accurate, reliable measure of their internet speed and the quality of their connectivity.

Today, the Speedtest Server Network™ includes more than 10,000 servers worldwide, representing over 7,000 unique host networks. This article explores how this distributed server network — along with the Ookla® Speedtest methodology — ensures the most accurate testing for consumers while delivering valuable insights on performance and quality back to network providers in order to build a faster internet for everyone.

The Speedtest Server Network

Ookla_Server_locations_0320

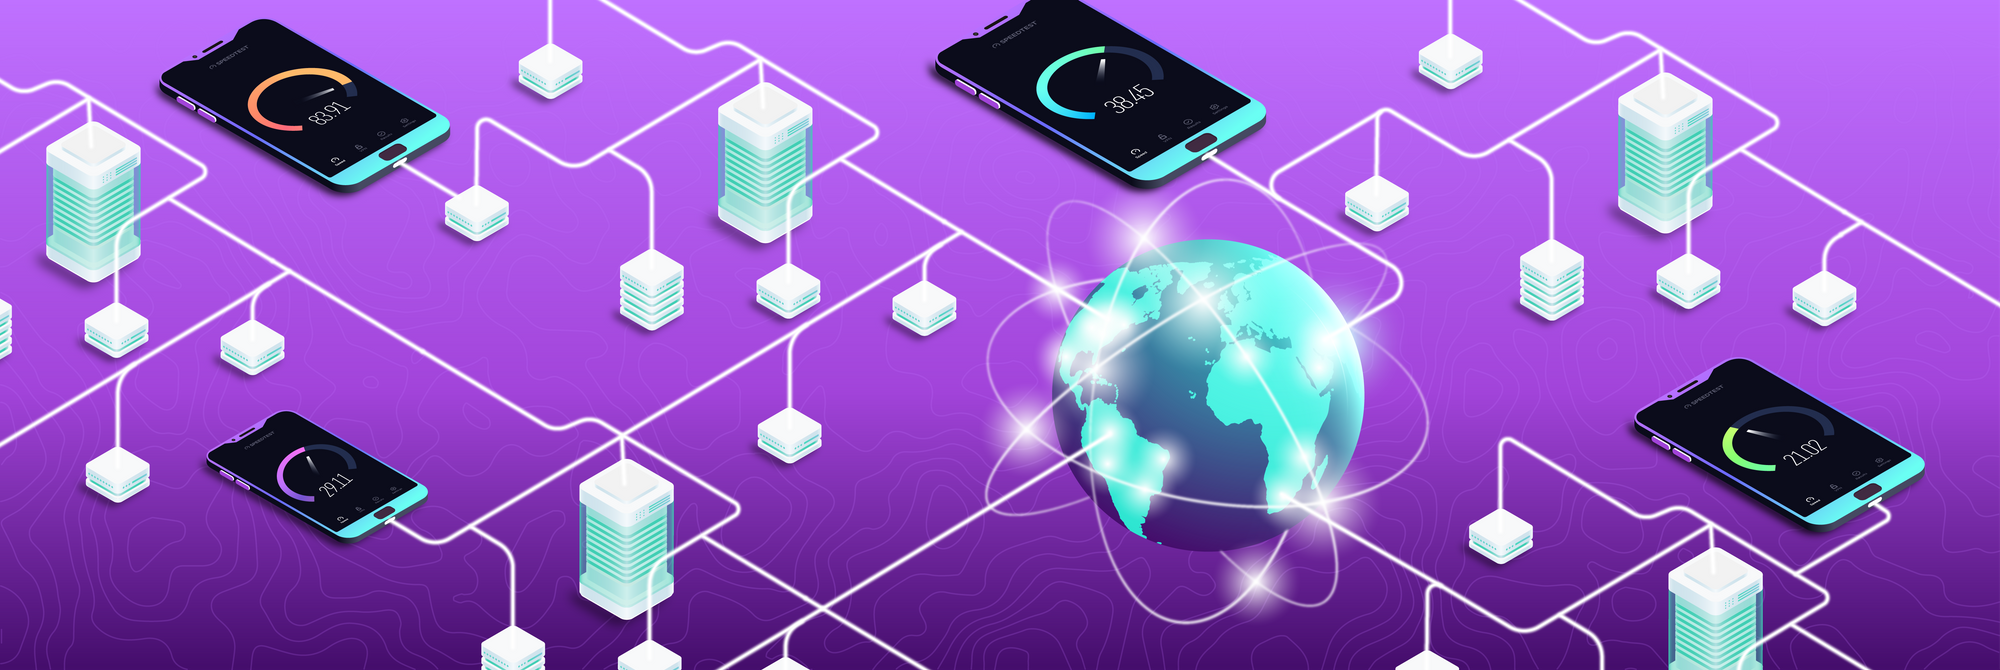
The accuracy and consistency of Speedtest is made possible through the global network of servers that host our server daemon, OoklaServer. This robust network and the proprietary protocol that we have implemented ensures that our users can fully evaluate the quality of service of their connection — wherever they are on the planet, and on all types of networks. Over the last 14 years, the Speedtest Server Network has grown to span over 190 countries and most major population centers around the globe.

OneProvider logo

The server hardware and connectivity are supplied by network providers who want insight into the performance and quality of their networks — including fixed broadband ISPs, mobile network operators, application and content service providers, hosting and colocation providers, and academic and other industry groups. To complement this extensive network of hosted servers, additional high capacity dedicated server infrastructure is provided at the hardware layer to Ookla by sponsor organizations such as OneProvider, a global provider of dedicated hosting, cloud hosting, and colocation services around the world.

With over 7,000 global host networks incorporating testing servers, Ookla ensures the objectivity of Speedtest measurements through OoklaServer, the core server software that communicates with our Speedtest client software. Read on to learn more about our methodology for accurately measuring a consumer’s quality of service down to the last mile, how OoklaServer works and how we dynamically monitor this distributed server network.

The foundation of a Speedtest server

As high-throughput fiber connectivity and 5G wireless technology bring gigabit speeds to end users around the globe, it’s critical that network testing solutions can keep up. In the past, individual consumers were unable to purchase internet connections speeds of 1 Gbps. Today, it is common to see users with 1 Gbps and even 10 Gbps connections to the home. Meanwhile, 5G mobile technology is bringing high-throughput connectivity to the pockets and dashboards of consumers in many markets. At Ookla, we’ve been working hard to stay ahead of the bandwidth curve by ensuring that Speedtest is capable of testing 10 Gbps and beyond.


To test speeds on the client-side, Speedtest fully saturates an internet connection by connecting to the Speedtest Server Network to measure the maximum throughput capacity of the connection. To ensure complete saturation, we have stringent criteria to ensure that the Speedtest Server Network is comprised of high-performance servers with high quality network transit and peering. In addition to a standard set of performance criteria for all servers, Ookla rigorously evaluates the network performance and uplink capacity of all servers in the Speedtest Server Network. Automated processes continuously monitor server performance to ensure the overall network is operating at peak performance.

In smaller markets where high-speed network infrastructure is not pervasive, Speedtest servers have a minimum requirement of 1 Gbps upstream and downstream network capacity. In developed markets such as major metro areas, servers must have a minimum upstream and downstream capacity of 10 Gbps. Many large network operators provide multiple servers with capacity of 40 Gbps or 100 Gbps.

Ookla’s constant innovation ensures measurement consistency and objectivity across networks

Because we manage the end-to-end testing ecosystem, Ookla maintains consistent testing standards and vendor-neutral objectivity when delivering results to consumers and network operators alike. More than just measuring the time to transfer data, our software delivers a holistic evaluation of network health, focusing on quality of service (QoS) metrics. Furthermore, because OoklaServer is co-located on networks close to the consumer, all over the world, Speedtest minimizes upstream bottlenecks in the testing process that can add latency variation and skew performance metrics.

OoklaServer serves up our own proprietary TCP-based protocol that partners with Speedtest clients across a wide range of consumer platforms. Key features of the Speedtest protocol:

  • Dynamic connection scaling that adapts the number of concurrent connections to any connection type.
  • Stable stop early test termination to avoid unnecessary bandwidth usage once an accurate measurement has been obtained.
  • Server-side upload measurement to measure upload performance and quality from the receiving end of a data transfer. This notably improves accuracy of measurement on connection types suffering from high connection latency, or those impacted by client-side buffering.

Because this software is maintained and regularly updated by Ookla, it’s also fully extendable to support new features and optimizations as the connectivity landscape evolves. For example, we’ll be moving beyond a one-to-one client-to-server relationship later this year by introducing a standard feature to Speedtest that measures data streams from multiple servers simultaneously to ensure accuracy even in the most extreme cases of high-bandwidth testing.

Ookla provides a holistic measure of network health

At Ookla, our mission is to help build a better, faster and more available internet. There is an old saying that you can’t improve what you don’t measure, and we achieve this mission by providing accurate, objective measurements to consumers and network operators. With our globally distributed server network, users on all types of networks can fully evaluate the performance and quality of their connection. With a wide variety of networks represented, users can test both on-net to a server on the network they’re subscribed to or off-net to a server on a network outside of their operator’s network.

When you press the “GO” button on a Speedtest application, we automatically select a nearby server to focus on this aspect of connectivity. Depending on the server responses, users will test to the best possible server, regardless if it is on-net or off-net. These are the results that make up the data that drives our enterprise data, including provider rankings and Speedtest Awards.

Testing to an on-net server is the best representation of the “last mile” of a user’s network connection. The most common use case we see involves an end user evaluating their “last mile” connection — that is, the service provided to them by their ISP or mobile carrier. By testing to an on-net server, Speedtest isolates the last mile connection and rules out any bottlenecks upstream of the ISP.

Testing to an off-net server represents performance of services outside an operator’s network (such as applications like video conferencing, gaming platforms and streaming services). While Speedtest focuses on last mile QoS for consumer connectivity, many users find it important to evaluate end-to-end performance to the services they care about. By comparing multiple Speedtest results both on- and off-network, consumers gain context about the internal health of an ISP’s network along with their external peering and transit performance.

Join the Speedtest Server Network

The robust Speedtest Server Network forms the foundation that allows Speedtest to provide the most accurate and reliable measurement of internet performance, trusted by users around the globe. Providing a host server(s) on the Speedtest network ensures that your services are accurately measured by the millions of consumers who use Speedtest every day. This builds trust with your users and provides valuable data driven insights into the performance your users are seeing.

Learn more about partnering with Ookla to host a server as part of this essential service.

Ookla retains ownership of this article including all of the intellectual property rights, data, content graphs and analysis. This article may not be quoted, reproduced, distributed or published for any commercial purpose without prior consent. Members of the press and others using the findings in this article for non-commercial purposes are welcome to publicly share and link to report information with attribution to Ookla.

| June 10, 2020

The State of Mobile and Fixed Broadband Performance in Oman

The Sultanate of Oman has seen significant increases in their internet speeds and mobile network performance at the country level since Q1 2019. Its 11 governorates, however, vary greatly when examining different aspects of internet performance. This article will explore Oman’s mobile and fixed broadband speeds for Q1 2019 and Q1 2020 as well as providing details on 4G Availability and 5G deployments.

Oman saw a significant increase in fixed broadband speeds

As of April 2020, the Speedtest Global Index ranks Oman 84th in the world for fixed broadband and 45th for mobile performance. This represents a five-spot improvement in their fixed broadband ranking since March 2020, while their mobile ranking dropped by seven spots.
ookla_oman_mobile_fixed_speeds_chart_0602-2

Data from Speedtest Intelligence® reveals a strong year-over-year increase in performance on fixed broadband when comparing Oman’s internet speeds from Q1 2019 to Q1 2020. The mean download speed on fixed broadband during Q1 2020 was 32.85 Mbps, a 58.9% increase over Q1 2019. The fastest provider on fixed broadband was Awasr, with a mean Speed ScoreTM of 39.96, followed by Ooredoo at 16.43 and Omatel at 14.74.

On mobile, Oman showed an increase of 11.0% in mean download speed from 34.71 Mbps in Q1 2019 to 38.52 Mbps in Q1 2020. The fastest provider in this category was Omantel with a Speed Score of 38.26 on modern chipsets at the country level during Q1 2020. Ooredoo was second at 32.28.

In another recent report analyzing internet performance during the global pandemic, we found that Oman recently experienced a 23.0% increase in mean download speed on fixed broadband when comparing the weeks of June 1, 2020 and March 2, 2020. On mobile, the country showed a 18.0% decrease in mean download speeds during the same period.

Musandam was fastest on fixed broadband in Q1 2020

Looking at the governorate level, we found that internet performance varied widely in Q1 2020 on fixed broadband and only somewhat on mobile. All governorates experienced a significant increase in fixed broadband speeds and a smaller increase in mobile speeds when comparing Q1 2019 to Q1 2020.
ookla_oman_fixed-speeds_0620-2

The fastest governorate on fixed broadband was Musandam with a mean download speed of 69.53 Mbps during Q1 2020, a 155.1% increase over Q1 2019 and an 111.7% improvement compared to the country’s average during the same period. With the exception of the governorates of Muscat and Al Buraymi, the majority of governorates had slower mean download speeds on fixed broadband than the country’s average of 32.85 Mbps during Q1 2020. The three governorates with the slowest mean download speeds over fixed broadband were Ash Sharqiyah South, Ash Sharqiyah North and Al Batinah North with 10.05 Mbps, 12.19 Mbps and 13.01 Mbps, respectively. Ash Sharqiyah South’s mean download speed on fixed broadband was 85.5% slower than that of Musandam.

Dhofar had fastest speeds on mobile during Q1 2020

ookla_oman_mobile-speeds_0620-2

Analyzing mean download speeds in Oman’s governorates, we saw a smaller difference in nominal speeds between the fastest and slowest governorates on mobile than we saw on fixed broadband.

Oman’s fastest governorate for mobile download speed in Q1 2020 was Dhofar with a mean of 44.84 Mbps, a 32.7% increase over Q1 2019. Dhofar was also 16.4% faster than Oman’s national average of 38.52 Mbps on mobile and 67.5% faster than last-place Al Wusta Governorate during Q1 2020.

4G Availability varied in each governorate from Q1 2019 to Q1 2020

ookla_oman_4G-availability_0620-2

Unlike fixed broadband and mobile performance, 4G Availability did not uniformly increase in all Omani governorates when comparing Q1 2019 to Q1 2020. Muscat Governorate had the highest 4G Availability with 86.5% of tested locations showing access to 4G during Q1 2020, higher than the country’s average of 81.2%. Al Wusta had the lowest 4G Availability at 67.2% during this period.

Most of the governorates saw a decrease in their 4G Availability between Q1 2019 and Q1 2020. Musandam, Al Buraymi, Ash Sharqiyah North, Ad Dhahirah and Al Wusta were the only governorates that experienced increases in 4G Availability in Q1 2020 when compared to Q1 2019.

5G is concentrated in North Oman

On the Ookla 5G MapTM, we see 5G deployments from both Omantel and Ooredoo concentrated in the north end of the country, close to the Gulf of Oman. We also see multiple deployments in cities like Muscat, Barka and Sohar.
ookla_oman_5G-map_0620-01

Speedtest® is uniquely able to measure the full throughput of a 5G connection because our test dynamically scales the number of connections between the testing client and server to fully saturate the network connection. During Q1 2020, we saw that the fastest 10% of users experienced speeds up to 765.37 Mbps over 5G in Oman during Q1 2020.

We will continue to follow Oman’s internet speeds, mobile performance and 5G deployments. Ready to explore fixed broadband and mobile network providers’ performance in Oman or any other market? Contact our team to learn more about Speedtest Intelligence.

Ookla retains ownership of this article including all of the intellectual property rights, data, content graphs and analysis. This article may not be quoted, reproduced, distributed or published for any commercial purpose without prior consent. Members of the press and others using the findings in this article for non-commercial purposes are welcome to publicly share and link to report information with attribution to Ookla.

| April 7, 2021

What to Do When Your Customers Report an Outage on Downdetector [Webinar]

Time is critical when your customers think your service is down. Diagnosing the issue can be especially challenging if your internal monitoring tools are showing green but users are flooding customer care and social media with problem reports. Network operations centers (NOC), systems engineering and DevOps teams are often pressed to provide answers to questions like “What happened?” and “When will the issue be resolved?” and “If all of our systems look good, why are customers reporting problems with our service?” Downdetector® can help.

Use Downdetector to diagnose the root cause when your customers are experiencing issues — especially when the root cause is a third-party system your business relies on. Downdetector Enterprise aggregates consumer-submitted problem reports and other key indicators from across the web to help your business continuity teams quickly diagnose and resolve potential problems — while also providing data to customer care and marketing teams so they can swiftly communicate known issues to impacted customers.

The upcoming Ookla® webinar on April 27 will show you how to leverage user-submitted data via Downdetector Enterprise to quickly diagnose the problem and rapidly respond when customers are reporting problems.


Read on to discover eight actions you can quickly take using Downdetector Enterprise to diagnose problems and decrease your mean time to resolution (MTTR) when customers think you’re going down.

1. Receive immediate alerts when customers are impacted

As soon as a sufficient number of Downdetector users submit a problem report with your service or any service you monitor in Downdetector Enterprise, you immediately get an alert. Set specific thresholds within Downdetector Enterprise for when you would like to receive alerts to ensure the issue meets your criteria. For example, we see some Downdector users using 80 problem reports as their threshold, meaning they only receive an alert if over 80 problem reports come in.

downdetector_enterprise_rss_0421_light

Alerts can be customized in the Downdetector Enterprise Dashboard and are available via email, push notifications from the Downdetector mobile app, RSS feed or via the Downdetector API — all of which can easily be integrated with Slack or any other internal monitoring or communication tools.

2. Determine how many users the incident is impacting

The moment you receive an alert that customers are reporting a potential service disruption, you can begin investigating the size and duration of the incident.

downdetector_enterprise_reports-over-time_0421

This graph shows a real-time view of problem reports in the last 24 hours for your service. This view allows you to see when problem reports started escalating as well as the number of reports for each 15-minute interval.

3. See which problems customers are reporting

The Downdetector Enterprise Dashboard helps you quickly get to the root cause of an incident. Problem indicators in Downdetector show the specific features where users are reporting difficulties.

downdetector_enterprise_top-indicators_0421

The Top Indicators page on Downdetector Enterprise shows the number of problem indicators broken down by the feature causing problems for customers. The available problem indicators customers can select from for a given company or service differs across industries. For example, problem indicators for an online gaming company might include online gaming, log-in, website or other relevant features.

4. Monitor external services that impact your business

NOC and DevOps teams can usually diagnose issues within their own service environments — but when issues are caused by an external service, internal monitoring tools may not be able to provide early alerting. Sometimes when customers report an issue with their favorite online service, they’re really experiencing an issue with their ISP or mobile network operator. Alternatively, problems may be caused by a content delivery network (CDN), cloud hosting provider or other systems that impact your service delivery.

downdetector_enterprise_reports-by_0421

The above view shows Reports by Provider, which displays a breakdown of which communications service providers customers are using to access your service. If a significant number of users experiencing problems are coming from a single service provider, it may indicate either an issue with that provider’s service or a network peering issue.

Downdetector Enterprise empowers Customer Care and Marketing teams to help customers resolve issues related to a given ISP or mobile network. By monitoring major communications service providers in your key markets, you can track when they go down and adjust your communications to better serve your customers. In some cases we’ve seen companies simply advise customers to switch from their cellular network to Wi-Fi to fix the problem caused by a mobile operator’s service issue.

5. See locations where users are experiencing issues

The Report Heatmap in Downdetector Enterprise shows the locations where users are experiencing issues.

downdetector_enterprise_report-heatmap_0421a

Easily zoom in to see the individual locations where problem reports were submitted. This view can help you diagnose whether the issue is limited to a specific location or if it impacts users worldwide.

6. Compare your incident to those of competitors or similar companies in your market

Downtime is expensive. And in certain industries, downtime can drive customers to your competitors’ websites or services.

downdetector_enterprise_compare_0421

Above is a comparison of two service providers over time. Use this view to compare and contrast your reported outages during a specific time period against up to four other companies. If you see a correlation between spikes in problem reports, you can infer that you weren’t alone in customers believing you were down. If you see overlaps in outages across a variety of companies, it may indicate an issue with a commonly used external service such as a CDN, cloud hosting provider or telecommunications provider.

7. Access your company’s historical incident reports

To input custom data ranges and look at historical data, navigate to the upper right hand corner of the dashboard and select “Last 24 hours.” This will open a dropdown where you can enter in custom dates and times. This can be helpful when conducting internal research to start identifying any patterns in your outage.

downdetector_enterprise_reports-over-time-historical_0421

If you’ve determined that the root cause is internal, analyzing historical outage information can spotlight patterns or surface potential issues related to seasonality or other external factors. This feature can also be helpful to pull data for reporting after customers have reported an incident.

8. Understand the conversations your customers are having about the incident

Downdetector provides a direct view into customer sentiment surrounding a perceived outage in real-time.

downdetector_enterprise_comments_0421

Downdetector Enterprise monitors tweets about potential service disruptions and comments on your company’s Downdetector page to detect trends. The aggregated word cloud feature allows you to quickly see common themes in these posts.

The webinar on Tuesday, April 27 at 7 a.m. PDT (10 p.m. EDT / 2 p.m. GMT) will show you how to rapidly respond when users report problems on Downdetector. Don’t miss it. A recording will be provided for registrants who can’t tune in to the live presentation.


Ookla retains ownership of this article including all of the intellectual property rights, data, content graphs and analysis. This article may not be quoted, reproduced, distributed or published for any commercial purpose without prior consent. Members of the press and others using the findings in this article for non-commercial purposes are welcome to publicly share and link to report information with attribution to Ookla.

| October 7, 2021

Improving Customer Experience During a Network Outage: A Tale of Two Operators


Network outages are inevitable. According to a study done by Heavy Reading, mobile network operators experience five outages per year on average — and according to consumer-reported information from Downdetector®, some operators experience many more service issues. During an outage, it’s critical that operators provide their customers with a clear path to a satisfying resolution. As we saw Monday, when Facebook’s outage impacted the perceived availability of many network operators around the world, it’s especially important to be able to manage the customer experience when an OTT service provider goes down.

Since most consumers don’t want to sit on hold with a busy call center — or simply can’t make the call if the outage has impacted their voice services — it’s crucial to provide digital support. Without a clear path to resolve their issues, customers will often turn to external platforms, such as Downdetector and Twitter, to voice their frustrations. When customers turn to external platforms, operators may find themselves trending for the wrong reasons.

Consumers respond best to timely, contextual communication around problems with their mobile network. Do you have the tools to proactively communicate network status, known issues and impending improvements to your subscribers? In this article we will take a closer look at two leading mobile network operators who have very different paths for digital customer engagement during an outage. When major outages occurred for each network earlier this year, they faced vastly different customer responses, as measured by Downdetector.

Using consumer-reported outage information for early alerting

According to data from Downdetector, the world’s most popular platform for user-reported service status information, Operator A experienced elevated problem reports on March 10, 2021.

downdetector_a_problem-reports_0921

downdetector_a_top-indicators_0921

We can see that during this 24-hour period Operator A had a total of 3,021 problem reports. In the report counts chart we can see that there were only 27 customer tweets related to Operator A’s incident.

Compare this with an outage experienced by Operator B on June 18, 2021.

downdetector_b_problem-reports_0921

We can see that Operator B received over 15,000 more problem reports than Operator A did during their March outage — despite having 10 million fewer customers. Operator B also had significantly more tweets detected in comparison to Operator A, most of which showed negative consumer sentiment surrounding the incident.

downdetector_b_tweets_0921-1

How did Operator A have significantly fewer problem reports on Downdetector during their outage, despite having millions more customers than Operator B — as well as more positive consumer sentiment surrounding the outage? The likely answer comes down to Operator A’s digital customer experience. Operator A provides a clear path for customers to check their network status and report their problems — without dialing in to the call center.

By leveraging Ookla Spatialbuzz™, Operator A empowered their customers with self-serve tools to check their network status, report issues and opt in to network updates. Spatialbuzz is a customer-driven network improvement platform that helps mobile operators to deliver the best customer experience possible — and use customer network data to make improvements in the areas with the most impacted customers.

By providing customers with these tools, Operator A was able to reduce the number of customers turning to external platforms to voice their frustrations. On the other hand, Operator B’s customers had no easy way to provide feedback or receive communication based on network conditions — leading to a spike in dissatisfied customers filing problem reports on Downdetector and complaining on social media platforms.

The power of Spatialbuzz and Downdetector

With Downdetector and Spatialbuzz, network operations center (NOC) and service operations center (SOC) teams can get information about critical incidents as soon as customers report an issue. This information can help them prioritize network issues and decrease mean time to resolution (MTTR).

downdetector_a_dashboard_0921

Downdetector Enterprise™ provides NOC teams with immediate alerts when customers are impacted and they can use the Downdetector Enterprise Dashboard to view the scale, duration and problem indicators of the incident. Downdetector also helps diagnose external issues with information about over-the-top (OTT) services such as Facebook, WhatsApp, SnapChat and others. For example, NOC teams can quickly see if customers are experiencing a problem with their own network or if an OTT service is experiencing issues. The Downdetector Communicate feature allows operators to place a banner message on their Downdetector company page to inform consumers of any known issues with their network or an OTT service.

Spatialbuzz provides operators with a single source of truth that connects incidents to customer experience. Spatialbuzz directly integrates with an operator’s website, mobile app, customer care and other applications. By combining real-time customer engagement tools with real-world device measurements, Spatialbuzz gives operators the intelligence they need to prioritize network issues using consumer-initiated data — and to increase customer satisfaction by closing the loop on service issues.

ookla_spatialbuzz_network-status-checker_0921-1
Above you can see just how easy it is for a customer to check their network status and report issues with their service on an internal platform. After reporting the issue, customers can opt in to receive updates about the issue they’re experiencing. If there’s already a known issue, customers will immediately receive contextual communication about it.

On the back end, Spatialbuzz makes it easy for NOC, SOC and engineering teams to quickly prioritize network issues based on customer impact. Below, you can see an example of the analytics provided by Spatialbuzz. From this view, network engineers can quickly prioritize network improvements in areas with widespread customer dissatisfaction, then provide transparent communication about network status, known issues and improvements to customers.

ookla_spatialbuzz_analysis_0921-1

While Operator A and Operator B both faced outages this year, Operator A used Spatialbuzz to provide a meaningful customer engagement during their outage. Using Spatialbuzz led to significantly less negative customer perception on Downdetector and Twitter. Outages are inevitable. Learn how Spatialbuzz and Downdetector can help you detect and resolve them while proactively communicating with customers and providing a clear path to resolution through digital engagement.

Ookla retains ownership of this article including all of the intellectual property rights, data, content graphs and analysis. This article may not be quoted, reproduced, distributed or published for any commercial purpose without prior consent. Members of the press and others using the findings in this article for non-commercial purposes are welcome to publicly share and link to report information with attribution to Ookla.

| June 23, 2021

Creating a Better Customer Experience: How Ookla Helps Leading Mobile Network Operators Successfully Engage Customers


Winning and sustaining a customer’s business is a top priority for every mobile network operator. You could have the fastest network available in your market or the widest coverage, but still lose customers to competitors that provide better digital engagement or a more seamless customer experience. We know your team works day and night to make sure your network is operating, optimized and providing an experience that meets your customers’ expectations. Your team looks for coverage gaps where it makes sense to expand LTE or add 5G services. Your team constantly benchmarks your network against competitors to make sure you provide the best performance in key locations.

But despite all of your hard work, customer satisfaction with many telecommunications companies remains notoriously low and customer satisfaction doesn’t always align with network performance, as shown in the chart below. Customers often don’t feel like their problems are being addressed, they aren’t receiving transparent communications from their providers or they can’t even log problems due to service outages. Over time, these factors can add up to a lot of lost revenue, sunk costs and time and resources spent on issues and improvements that may not even increase customer satisfaction.

ookla_mobile-ranking_chart_0621

For the past 15 years, Ookla® has provided you with the tools to improve your network, including Speedtest Intelligence®, Cell Analytics™ and Downdetector®. Now, with the addition of our innovative SpatialBuzz solution, we can help you engage directly with your customers to identify, prioritize and diagnose customer dissatisfaction areas in real time for speedy resolution. Most importantly, SpatialBuzz allows you to close the customer feedback loop with meaningful, timely communications so that customers can see how hard you are working to improve their network experience.

Ookla is excited to offer you tools to improve your network performance and create a better experience for your customers. Click here to learn how top-rated mobile network operators are utilizing SpatialBuzz or inquire directly about any of our products.

Ookla products help you improve your network

Speedtest Intelligence is the leading source of information for networks worldwide

intelligence-screenshot

With over 200 data points on billions of consumer-initiated tests and coverage scans, ISPs, mobile operators, governments and regulatory bodies trust Speedtest Intelligence as an official source of record for the state of worldwide markets. Speedtest Intelligence offers up-to-date insights into global fixed broadband and mobile networks based on over 10 million consumer-initiated tests taken every day with Speedtest® and hundreds of millions of daily network coverage scans.

You may have used Speedtest Intelligence to benchmark your network against competitors, investigate your overall performance or pinpoint geographic trouble spots. With the addition of Consumer Sentiment data, you can now better understand the relationship between network performance and customer satisfaction.

Consumer Sentiment data in Speedtest Intelligence helps you better understand your customers’ experience on your network

You know that customer satisfaction plays a major role in retention, but custom research can be expensive. Consumer Sentiment data allows you to gauge customers’ overall satisfaction using the Speedtest Intelligence Portal. We aggregate one-question surveys presented at the end of a Speedtest experience, these responses are aggregated, analyzed and transformed into valuable insights.

Cell Analytics provides unparalleled intelligence about your network

ookla_cell_analytics

While benchmarking your overall network and customer experience is essential, knowing when and where exactly to invest more resources into your network is mission critical as you expand and improve your network. Cell Analytics provides unrivaled intelligence about wireless service quality, RF measurements, data usage, user density (both indoors and outdoors), cell site locations and much more, packaged in an easy-to-use interface. Cell Analytics uses the granularity of Speedtest network testing and gives you the performance, coverage and signal measurements you need to improve your network.

Unlike data collected by traditional methods such as drive testing and walk testing, Cell Analytics data is collected in real-world measurements where consumers are actually connected to networks — on streets, inside vehicles, at home, at work and other locations — with high location accuracy and 3D modeling. Combined with data on cell site locations, tools to prioritize optimization and deployment efforts, and competitor comparisons, Cell Analytics provides a comprehensive platform for mobile network operators to understand their networks and identify the areas that need improvement.

Downdetector Enterprise™ is the leading network outage monitoring tool

DD-dashboard
Network outages can be costly and time consuming to fix. Hundreds of millions of users worldwide use Downdetector to report issues with their mobile network operators, ISPs, communication apps and other online services. Downdetector Enterprise uses this consumer-reported information to provide early alerting on service issues — often before internal monitoring tools detect a problem is even happening. With customizable alerts for your NOC and SOC teams, Downdetector makes sure you get information about critical incidents as soon as customers start to report an issue. Geolocation information provides insights into exactly where customers are experiencing network problems, and problem indicators let you know which aspects of your service (e.g., voice calls, text messaging, mobile billing app) are causing issues.

SpatialBuzz is the next frontier of customer engagement

ookla_spatialbuzz-1_0621-2
Ookla has provided you with the tools to benchmark your network and customer satisfaction with Speedtest Intelligence, map and optimize your network with Cell Analytics and quickly identify network issues with Downdector. Now, we also offer a tool that marries the best of our offerings and directly connects you to your customers to deepen their network experience through more transparent, frictionless customer communication via existing web and mobile apps, AND provides the real-world data you need to prioritize network improvements by utilizing real-time customer experience data.

SpatialBuzz gives you the tools to engage directly with your customers, prioritize issues with your network using consumer-initiated data and increase your customer satisfaction by closing the loop on issues they encounter. SpatialBuzz is a one-stop solution that helps you deliver the best customer experience possible, even during outages or service issues.

spatialbuzz-1

Think of your network like this: You wouldn’t invest millions opening a world-class restaurant with the best chefs making the best foods and not staff it with waiters to make sure diners have an incredible experience or correct issues with the food, right? Unfortunately, many network providers have overlooked meaningful customer engagement on their digital transformation journeys. SpatialBuzz gives customers a better channel to communicate back to your network team, which allows you to provide world-class service. Customers want to check their network, find out about improvements, report problems with minimum fuss and see you working for them. To love you, they have to love the network. That’s where SpatialBuzz comes in.

spatialbuzz-2

SpatialBuzz aligns Digital, Customer Care, Service Operations and Network Teams to deliver an excellent customer experience. SpatialBuzz also empowers customers to report issues and check network coverage and status — seamlessly integrated into existing iOS, Android or web apps. It connects agents with coverage maps and data about network statuses, and SpatialBuzz can even automate network messages about known problems in geospatial locations. SpatiaBuzz also helps network and operations teams prioritize issues by customer impact; data shows that 2-3% of network faults create 80% of significant customer dissatisfaction. SpatialBuzz lets you proactively respond to these customers, seamlessly engages them and their issues and prioritizes your network response which saves time and money you might otherwise be spending elsewhere.

ookla_spatialbuzz-2_0621

Companies that have deployed SpatialBuzz have experienced, on average:

  • 40% reductions in customer calls
  • 15% faster call resolution
  • 80% lift in digital engagement
  • 1-9 hours earlier problem detection
  • Millions of dollars in cost savings
  • Improved customer loyalty with timely, proactive and transparent communications
  • Better problem prioritization
  • Bridged organizational gaps between customer care and network engineering teams

SpatialBuzz is the next frontier in creating a better network experience for your customers. When customers feel like they are being heard, seeing problems being fixed and are part of the closing the loop on issues, they will be more satisfied with your network offerings and they will help drive your company’s sustained revenue. SpatialBuzz is here to help you bolster your bottom line, so please don’t hesitate to reach out today and learn more.

Leading network operators are the ones that successfully engage their customers about their network

Ookla can provide you with all the tools you need to improve your network, pinpoint issues and increase customer satisfaction. We’re thrilled to offer you a suite of tools that holistically improves your network — and we’re thrilled to help you close the network–customer experience gap with SpatialBuzz.

If you’re interested in learning more about SpatialBuzz or any of Ookla’s enterprise offerings, reach out to us and inquire more about what we can do to help you improve your network.

Ookla retains ownership of this article including all of the intellectual property rights, data, content graphs and analysis. This article may not be quoted, reproduced, distributed or published for any commercial purpose without prior consent. Members of the press and others using the findings in this article for non-commercial purposes are welcome to publicly share and link to report information with attribution to Ookla.

| May 17, 2021

World Telecom Day Is a Reminder that a Better, Faster and More Accessible Internet Is Possible


For the past year and counting, the COVID-19 pandemic has ravaged communities across the world and exposed how important access to reliable, fast internet has become. As people quarantined and started working and educating children from home, internet service providers across the globe rushed to meet unprecedented demands and have (mostly) risen to the challenge.

I’m honored that Ookla® has been able to collaborate with providers, regulators and researchers to help create a better, faster and more accessible internet for everyone. These partnerships are a significant part of what makes my job so exciting. That’s why for World Telecom Day 2021 I want to take a moment to highlight a few of these collaborations and how they are doing their part to accelerate digital transformation during these trying times.

Global internet providers rose to meet the global demand for internet at the start of the COVID-19 pandemic

Last year, Ookla joined the World Bank’s Development Data Partnership platform as part of our Ookla for Good initiative. This partnership has been illuminating — in a study of internet performance across 18 African countries, the World Bank found that internet usage increased during times of “stay at home orders,” public and private sectors collaborated to increase access to the internet, and internet speed decreased modestly at the start of COVID-19 shutdowns, but recovered over time.

Similarly, Ookla partnered with Fundació to analyze internet performance in Catalonia, the Balearic Islands and the Autonomous Community of Valencia during the COVID-19 pandemic. Fundació found (much like the World Bank) internet speeds slowed during the first few weeks of the COVID-19 lockdowns but gradually began to increase in the months after.

Organizations are working to increase access to internet, which is still out of reach for many Americans

As more people stay at home to work, go to school, connect with loved ones and live their lives, internet access is more important than ever. But this past year has shown the painful cracks of the current state of the internet in America. Equitable access has become a universal issue, from America’s biggest cities to its rural areas where the digital divide has been proven to be wider than ever before.

Ookla’s partnerships with the Center for Data and Computing (CDAC) at the University of Chicago and Kids First Chicago have been especially important in the effort to more accurately measure broadband performance and access within urban communities. CDAC postdoctoral researcher Jamie Saxon has already utilized our Ookla Open Datasets to create interactive maps to show the urban internet divide across several major U.S. cities.

Internet access is also a huge issue in most of America’s rural communities, and Ookla has been honored to team up with House Majority Whip James E. Clyburn to map the best broadband in South Carolina, as well as which rural areas need better internet access. We’re excited to see our data being used to help shape public policy and we look forward to teaming up on further collaborations with local, state, tribal and federal governments in the future.

ITU Study Group 12 is setting international standards for telecommunications network performance

Ookla isn’t just helping improve today’s internet, we’re making sure the future of the internet is fast and accessible. James Carroll, Director of Strategic Initiatives, is representing Ookla in International Telecommunications Union’s (ITU) Study Group 12 to create international standards for performance, quality of service and quality of experience for the internet. Among many other ITU achievements, we recently worked with leading network providers, fellow vendors and regulators to craft standards for how crowdsourced network performance data can best be used for innovative policymaking to ultimately improve consumer experiences with fixed and mobile networks.

Internet speeds will keep getting faster and Ookla will continue providing world class testing and resources

It’s almost unbelievable that when we started Ookla over 15 years ago the typical fixed broadband connection in the U.S. averaged a median download speed of only 4 Mbps — 45.7 times slower than today (182.69 Mbps). I’m extremely proud of how Ookla has helped to make a better, faster and more accessible internet for all. Just imagine what we can do together over the next 15 years. It’s going to take a lot of hard work and transformational thinking, but we’re ready for the challenge. I’m excited by the partnerships and opportunities to come – and look forward to creating even more positive change through better connectivity for people around the world.

Ookla retains ownership of this article including all of the intellectual property rights, data, content graphs and analysis. This article may not be quoted, reproduced, distributed or published for any commercial purpose without prior consent. Members of the press and others using the findings in this article for non-commercial purposes are welcome to publicly share and link to report information with attribution to Ookla.

| September 19, 2016

We Flew a Speedtest Banner Over a Football Game to See if Stadium Internet is Getting Faster…

…and it is

Anyone who has attended a football game in a packed stadium can attest to the fact that the internet there is slow. Not just moves a little sluggishly slow, but tweets won’t publish and mobile internet browsing is non-existent slow. This happens in part because when large groups of people try to access the internet from the same location at once, mobile networks get overcrowded and that causes speeds to decline.

Slow internet makes for a frustrating fan experience for those who want to check out the starting wide receiver’s stats, share their most recent selfie you would ever take one) or check in with friends watching the game at home. It also makes it harder for teams to interact with fans throughout the game. All in all, it’s a crummy experience for everyone.

As football fans and people who think a lot about internet speeds, the Speedtest team started wondering how fast stadium internet actually is and about the influencing factors. So we decided to dig deeper into the topic by taking a closer look at the stadium in our own backyard — CenturyLink Field, home of the Seattle Seahawks.

The Experiment

Over the years, we’ve noticed that people frequently test their internet at crowded events like football games. Having seen this in our data, and knowing that poor speeds in crowded places are a common complaint about mobile networks, we decided to run a little experiment.

On August 25th, we hired a pilot to fly a 30×100 foot banner over CenturyLink Field for the Seattle Seahawks home preseason game against the Dallas Cowboys. The banner read “Take a Speedtest” to encourage tailgaters and game attendees to test their internet connection around and in the stadium using our Speedtest app.

stadium fireworks

After the game, we tallied up the Speedtest results from inside the stadium and the immediately surrounding area (e.g. stadium parking lots) and started analyzing.

What We Learned

We collected results from all four major carriers — AT&T, Sprint, T-Mobile and Verizon Wireless — at the game. While Sprint walked away with the highest average download and upload speeds (29.95 Mbps and 10.19 Mbps respectively), the number of tests taken using Sprint did not reach a statistically significant number. This low test number makes it hard to say whether Sprint’s network truly was the fastest at this particular game, or just an outlier.

Verizon Wireless achieved the fastest average download and upload speeds (20.19 Mbps and 9.55 Mbps respectively) at the game with a significant number of tests. T-Mobile and AT&T were next with lower upload speeds and the highest latencies overall, meaning fans on those carriers likely had an even harder time sharing and receiving information.

We looked at 12 other CenturyLink events over the previous months to expand our test pool, including several concerts and Seattle Sounders games. Again, all four major carriers were represented in the data. Across all 12 events, Sprint maintained the highest average download speed at 23.03 Mbps. Interestingly, Sprint also was the carrier with the most tests taken on their network during the 12 event period. This difference is likely because Sprint is a COPA America events sponsor around the US and runs a fan booth at CenturyLink Field where employees and customers are encouraged to take a Speedtest. Despite Sprint’s larger test volume, Verizon claimed highest average upload speed with 10.47 Mbps.

CenturyLink is an ISP themselves and their namesake stadium now provides free CenturyLink Wi-Fi to game attendees. Additionally, Verizon customers get exclusive access to Verizon’s free in-field Wi-Fi. In looking at Wi-Fi tests taken before and during the game, most were conducted over CenturyLink’s network. The network’s wireless performance was 5.14 Mbps download and 10.21 Mbps upload at the game. Looking again at the 12 events at CenturyLink Field, the Wi-Fi averaged 5.17 Mbps download and 9.68 Mbps upload. The top recorded download speed on CenturyLink’s Wi-Fi across all events was 17.54 Mbps.

The highest average download speeds took place outside CenturyLink Field. So if you want to download that Vuvuzela app, your best bet is to do it before you enter the stadium or somewhere else beforehand. More interested in uploading that picture of garlic fries to Instagram? Surprisingly, stay in your seat! Upload speeds tended to be higher within the stadium stands than outside.

The internet in stadiums is getting faster. We looked at four notable US football stadiums — the Seattle Seahawks’ CenturyLink Stadium, the San Francisco 49ers’ Levi’s Stadium, the Dallas Cowboys’ AT&T Stadium, and the Carolina Panthers’ Bank of America Stadium — and saw that speeds are improving across the board.

Stadiums are getting faster for a couple reasons. First, they’re investing more heavily in technology infrastructure to enhance the in-stadium experience and engagement opportunities for fans. Take San Francisco’s Levi’s Stadium, which was built with 70 miles of Wi-Fi cabling (400 miles total) and 1 Wi-Fi access point for every 100 seats in the bowl for a total of 1,200 access points in the stadium. These infrastructure developments make it easier for fans to access mobile internet at the game from any carrier.

Mobile carriers are also investing in their networks around the stadiums. It wasn’t too long ago that carriers rolled up en masse to the stadium on game day with mobile antenna trucks to help enable mobile internet for their customers. Now, carriers are investing in embedded infrastructure at stadiums and sports arenas.

Verizon is fast at work getting Houston’s NRG Stadium ready to host the 2017 Super Bowl, citing the importance after fans at Super Bowl 50 used nearly 7 terabytes of data. On the college circuit, AT&T installed a Distributed Antenna System (DAS) at Oregon State University’s Reser Stadium to help fans get online. Carriers still have their ups and downs, but continued network investments such as these keep pushing general mobile internet speed trends in a positive direction.

This faster internet benefits everyone by increasing accessibility to existing content and communication mediums as well as opening up new avenues for connection. For instance, faster internet at Levi’s Stadium has led to a smartphone and tablet stadium app that provides digital content like instant replays and directions to bathrooms with the shortest lines. Stadium vendors can also sell concessions via the app and then deliver the items directly to a fan’s seat, helping merchants sell items at the game and decreasing the amount of time fans have to wait in line. As internet speeds continue to improve, it only stands to reason that more solutions to streamline experiences for fans and open up new opportunities for businesses will emerge.

#CrowdSpeed

Next time you’re at a game, concert, festival, or other event share your Speedtest results to social media with #CrowdSpeed. With your help, we are one step closer to better understanding — and improving — internet performance everywhere.

Ookla retains ownership of this article including all of the intellectual property rights, data, content graphs and analysis. This article may not be quoted, reproduced, distributed or published for any commercial purpose without prior consent. Members of the press and others using the findings in this article for non-commercial purposes are welcome to publicly share and link to report information with attribution to Ookla.

| February 10, 2022

How Leading Operators Prepare for High-Profile Stadium Events Like Sunday’s Big Game

Football fans are excited to cheer on their team at the Big Game in Los Angeles this weekend. They will also undoubtedly stream and share the experience with friends, family, and coworkers from their mobile devices. Operators are ready, having invested heavily to make the mobile experience as seamless as possible. Competitive insights from Ookla® Wind® help ensure their network is ready to show off their latest 5G spectrum, and deliver blazing fast speeds to the crowd. While we can’t share the results of game day live walk tests and real-time network benchmarking, we have a glimpse into what goes into optimizing for an event of this scale.

Wind has a long history of benchmarking the most challenging large stadium events

Network operators spend weeks and even months preparing for large stadium events because an outage, dead zone, or network congestion could become a high-profile publicity disaster. That’s why for the past nine years, the Wind team has helped network operators prepare and optimize their networks with multi-week preparatory engagements, including benchmark and optimization venue testing, live day-of RF command center support, and real-time analysis dashboards to make sure everything goes just right and any unforeseen problems are caught early and fixed.

Wind data previews what fans can expect from mobile networks on Sunday

The Wind team has already walk-tested inside and outside SoFi Stadium in Los Angeles multiple times with our handset-based Android Wind app starting weeks ahead of the big game to benchmark operator performance. We can’t reveal which operator has the best setup, but we can share anonymized data to show how operators perform in various locations through the upper concourse, between the 400-level and 500-level sections, for 4G LTE and 5G RSRP by provider, overall signal strength (RSRP) and signal quality (RSRQ) by provider over time, download and upload throughputs over time, as well as more technical 4G LTE and 5G data for carrier aggregation and modulation data.

The GIF above shows 4G LTE signal strength (RSRP) for operators during our walk test with red showing a weak RSRP signal strength and green and blue showing stronger RSRP signals. As you can see, the anonymized data for Operator A shows strong 4G LTE signals throughout the stadium, with strong signals in the north and south of the of the stadium and four areas of red, weak RSRP signals abutting the VIP boxes on both the east and west sides of the stadium. Operator B has a similar map, though Operator B has narrow bands of strong signal and weak signal overlapping on the south side of the stadium. Operator C had strong signals in the north and east of the stadium, but lower 4G LTE signal strength in the southwest corner with few areas having RSRP signals over -80 dBm.

Strong 5G RSRP signal was harder to find in SoFi stadium during our walk test. Operator A had pervasive weaker signals throughout, though only a few areas of very low RSRP strength in the north and south of the maps. Operator B had concentrated areas of stronger 5G RSRP signal strength near the north and south wind tunnel openings of SoFi’s sleek stadium design, though much weaker signals in the east and west of the map, and some veritable 5G dead zones near for VIP ticket holders to the west. Operator C had a concentrated strong area in the south of the map opposite YouTube Theater, though overall had weaker signals.

When viewing the walk test results over time, the overall average data shows similar signal strength (RSRP) between providers, though Operator A averaged a slightly higher signal strength (RSRP) over 4G LTE and 5G than the other operators.

Signal quality (RSRQ) showed more parity between operators on both 4G LTE and 5G as you can see above.

In addition to RF KPIs, the Wind walk test uses Speedtest Powered™ to measure where download and upload speeds peak and slow down throughout the stadium over time, both before and during the game. The above chart shows each provider’s download and upload speeds over the course of the walk test before the game, with each provider achieving a maximum download speed of over 1.70 Gbps, and average download speeds clocking in at 322 Mbps for Operator C, 706 Mbps for Operator B, and a blazing fast 914 Mbps for Operator C. Operator C also achieved maximum download speeds over 2.70 Gbps and upload speeds over 200 Mbps — much faster than its competitors.

The Wind walk test performed during the game showed what congestion can do to a network and why consistent monitoring is so important. The above chart shows every operator’s average download and upload speeds roughly halved during our in-game walk test compared to the pre-game walk test. Operator C achieved an average download speed of 76 Mbps, Operator B at 282 Mbps, and Operator A still had the fastest average download speed at 579 Mbps.

Wind goes beyond basic signal RSRP and RSRQ data

Wind expands beyond basic signal strength (RSRP) and signal quality (RSRQ) RF data as well. For example, we can see the amount of time above that carrier aggregation is utilized on each network and how many component carriers were aggregated. Additionally, we can see the utilization of various modulation types, with higher modulation schemes like QAM256 delivering more bits per unit of spectrum. Carrier aggregation with a large number of carriers and high modulation schemes can dramatically boost data speeds. 

These charts indicate how modulation scheme varies with signal strength (RSRP) and signal quality (RSRQ). The darker the shaded colors, the more data points were collected. Since the darker shaded band is concentrated towards QPSK for 4G LTE, it is apparent that QPSK seems to be the most commonly used modulation scheme across all three operators. One would expect more prevalence of higher order modulations, which contributes to higher throughput, when the signal strength and quality get better (right side of the X-axis).

The Wind team provides real-time insights and support

Traditionally, walk and drive testing can take 24-48 hours to process data, but Wind delivers instant results to help RF engineers make adjustments in real time to make everyone’s game day as great as possible. In a few days, Wind engineers will be part of network command centers with our team providing live, dynamic benchmarking reports using our Wind cloud-based analytics Live-Stream Report™ dashboard throughout the game. Our live competitive analyses will help operator RF engineers optimize their network by looking at real-time RF KPIs and Speedtest Powered data, and allow operators to see how other networks are performing during our live walk test. 

Wind Live-Stream Report™ at SoFi Stadium

Ookla® Wind® | January 30, 2022

The video above shows a short clip of the live Wind walk test from the semi-final game in Los Angeles on January 30, with green showing strong RSRP signal strength and red showing weaker RSRP on the map, and the refreshing blue and purple ribbon on the top left of Wind’s Android live edge reporting representing 4G LTE and 5G signal data, respectively. As you can see, the test shows moderate to low RSRP for this particular operator, with a jump in time around 10 seconds. At around 15 seconds, the video switches to the Speedtest Powered throughput data to show download and upload speeds on the network in real time. 

We’re as excited as anyone for Sunday’s big game. We’re even more excited to know that folks on networks that have prepared using Wind will be able to share their experience with everyone at home. If you’re interested in using Wind to prepare for a large, in-person event, please reach out.

Ookla retains ownership of this article including all of the intellectual property rights, data, content graphs and analysis. This article may not be quoted, reproduced, distributed or published for any commercial purpose without prior consent. Members of the press and others using the findings in this article for non-commercial purposes are welcome to publicly share and link to report information with attribution to Ookla.

| October 15, 2021

How Banks and Financial Services Companies can Detect Outages Faster [Webinar]

The shift from in-person to online banking has been under way for years, but the pandemic has cemented digital banking as the new normal for most consumers. As a result, it’s critical to effectively communicate and resolve issues when customers experience a disruption in your service. Diagnosing the issue and detecting problems with external services can be challenging for technical operations and IT management teams — especially when internal monitoring tools don’t detect any problems. That’s where Downdetector® comes in.

Over 25 million consumers report problems each month with online banking, financial services companies, internet service providers and other websites and services. Downdetector can alert you when customers are reporting issues with your services — often long before internal monitoring tools send out the alarm. By monitoring your company, external services like content delivery networks (CDNs) and web hosting platforms, internal productivity tools and your customers’ sentiment surrounding emergent problems, your team can troubleshoot issues faster, decrease mean time to recovery (MTTR) and provide your customers with better, more contextual support.

The upcoming Downdetector webinar on Oct. 28 will show you how some of the world’s leading banks and financial service providers are using Downdetector Enterprise to detect and resolve issues faster, as well as manage the customer experience during an issue.

Read on to discover three ways Downdetector Enterprise can help banks and financial service providers detect issues faster and improve the customer experience during an incident.


Conduct competitive benchmarking and monitor external services your company relies on

After an incident occurs, business intelligence and incident management teams are often pressed to answer the questions: “Did our competitors experience similar problems?” and “Was the issue a problem with our services or an external service our company relies on, such as a downstream payment processor?”

Downdetector Enterprise makes it easy for teams to answer these questions with competitive intelligence and analysis of the services your company relies on.

downdetector_enterprise_compare_1021

Teams can get visibility into competitors’ problem reports on Downdetector, which offers quick insight into whether or not competitors are facing similar issues. If internal monitoring tools aren’t indicating that there’s an issue, this view can also help you diagnose if an external service, such as a CDN, is experiencing similar patterns in elevated problem reports, you can infer that it might be an issue with the CDN impacting customers.

Access real-time and historical data to validate internal monitoring

Banks and financial service companies often look to Downdetector’s real-time and historical data to validate whether findings in internal monitoring tools have impacted customer experience — or fill in the gaps when internal monitoring tools don’t detect a known problem.

For example, during the Facebook outage Oct. 4, 2021, a Fortune 500 bank turned to Downdetector Enterprise when problem reports escalated — but their internal monitoring systems hadn’t detected any problems. They were able to use data from Downdetector Enterprise to see that Facebook was experiencing issues. From there, they were able to determine that problem reports weren’t due to an internal problem, and then communicate to their customer base that issues were likely related to Facebook’s outage.

downdetector_enterprise_reports-over-time-historical_1021

However, if the incident is determined to be internal, business intelligence teams can use Downdetector Enterprise to analyze historical outage information to spot any patterns. Historical data can also be used for reporting and compliance purposes, such as communication with a regulatory body after customers have reported an incident. The Downdetector API makes it easy to integrate and surface this data directly in your existing tools.

Directly communicate with customers who report an issue on Downdetector

Companies that don’t provide timely, contextual communication during an incident are likely to see dissatisfied customers flooding social media and customer support channels looking for answers. Downdetector allows companies to provide direct communication to customers reporting issues with specific aspects of your service, such as mobile banking or payments.

downdetector_enterprise_communicate_1021

This additional communication channel is available even if your website or other services go down — and typically helps lower call center and digital support ticket volume.

Ready to see how leading U.S. and European banks have improved their incident management and customer experience using customer-reported data? Join the upcoming webinar; all registrants will receive a link to the recorded presentation.


Ookla retains ownership of this article including all of the intellectual property rights, data, content graphs and analysis. This article may not be quoted, reproduced, distributed or published for any commercial purpose without prior consent. Members of the press and others using the findings in this article for non-commercial purposes are welcome to publicly share and link to report information with attribution to Ookla.

| December 15, 2020

Treat Yourself to a Hack Day: Make a Physical Speedtest Gauge


Sure you love taking a Speedtest®, but have you ever seen the results manifest in a 3D statue that lives on your desk? Now’s your chance. This article contains everything you need to construct and program an ethernet-enabled physical Speedtest Gauge. All you’ll need to build it is access to a 3D printer, some affordable and easy-to-find parts, and a basic working knowledge of both electronics and command line interface (CLI) tools. Then you can proudly display your Speedtest gauge on your desk or gift it to a friend who also loves to nerd out over networks. Either way, you’ll have the most fun setup for measuring network throughput in town.

Components you’ll need

The total cost of all the components below is around $65, and the project will take about two or three hours to complete, not counting the time to 3D print the enclosure.

This project requires the following components to work:

  • A soldering iron. A basic one should do fine.
  • Jumper wires to connect the various components together.
  • A stepper motor. This project used this model but feel free to upgrade to a better one. The limitation of this one is that the max speed is slow and so the gauge needle is not very quick.
  • Programmable LED lights. This project uses three neopixel ring lights. Note that you will need three of these to form the full gauge. You can also find cheaper versions of these rings elsewhere.
  • Physical buttons. A good candidate for buttons are these mini push buttons.
  • A Raspberry Pi. This drives the LED lights as well as the motor and runs the actual test.
  • A good power source for the Raspberry Pi. Optional if you buy the raspberry pi linked here which comes with a power source.
  • The 3D-printed housing. The housing and needle are where you finally get to put everything together. The STL printable files can be found on this GitHub project.
  • The free Speedtest CLITM. The latest version of the official Speedtest CLI is used to actually run the network performance test.
  • Unbuffer. This is needed to parse the Speedtest CLI output. You can install it by running apt-get install expect.

How to assemble your Speedtest gauge

Step 1: Print out the housing using a 3D printer. The instructions can be found in this GitHub project.

Step 2: Attach the stepper motor to the center of the 3D-printed housing. Then attach the stepper motor driver to the motor, attach the +5V and GND on the controller to the appropriate Raspberry Pi GPIO pin.

Step 3: Attach the needle to the tip of the stepper motor. You can snap them together with some glue.

Step 4: Connect the controller to the Raspberry Pi with the following GPIO mappings:

IN1 to GPIO17
IN2 to GPIO22
IN3 to GPIO23
IN4 to GPIO24

Step 5: Solder the neopixel rings per this guide on Adafruit. Note that we will be using three segments only. After that, connect the +5V and GND on the neopixel lights to the +5V and GND on the Raspberry Pi. Then connect the data line to GPIO18 on the Raspberry Pi.

Step 6: Inset the neopixel ring into the gauge indent. You can use sticky tape or soft glue to hold it in place.

Step 7: Insert the button in the button hold in the bottom left corner of the front housing. Solder two wires to the connections at the back of the button and attach one lead to GPIO1 (3.3v) on the Raspberry Pi and the other to GPIO10.

Step 8: Use the extra space in the back where the Raspberry Pi ports are accessible to pass through the power cable and plug it into the Raspberry Pi.

Use the software to run Speedtest

The software you’ll need to power your new Speedtest gauge is available on this GitHub repository and can be downloaded for non-commercial use. The main sections control the LED lights, the stepper motor and run the CLI test. You can pull this code on the Raspberry Pi and set it to run on startup. Make sure you set the SD Card to read-only mode to prevent data corruption due to reboots.

The following components control the gauge:

  • speedtest.py. This runs the Speedtest CLI app and parses and returns the speed measurements as well as the current stage
  • gauge.py. This class takes in the current speed and calculates and moves the needle to the angle represented by the speed. It also lights up the LED based on the position of the needle.
  • button.py. This simple wrapper handles events from the button, which runs the test.
  • run.py. The root file listens to the button events and coordinates between the Speedtest and gauge movement.

To set up the gauge, load the repo on the device and run the code below. Note that sudo is required to access the GPIO ports on the Raspberry Pi.

sudo python3 run.py

Note that you can use the src/speedtest_bootup.service (change the script location) to always start the software on reboot.

There you have it! Your very own Speedtest gauge. Share your pictures with us on Twitter or Facebook using the hashtag #SpeedtestGauge.

prototype

Ookla retains ownership of this article including all of the intellectual property rights, data, content graphs and analysis. This article may not be quoted, reproduced, distributed or published for any commercial purpose without prior consent. Members of the press and others using the findings in this article for non-commercial purposes are welcome to publicly share and link to report information with attribution to Ookla.