| April 27, 2022

Four Ways Regulators Can Leverage Mobile Network Data to Improve Connectivity [Webinar]

As regulators focus on improving network coverage, performance, and availability for their countries, they need a real-world view into consumers’ connectivity to understand where constituents lack adequate network speeds and coverage — as well how operators use new networks and spectrum allocations. Without these insights, regulators may not have the information they need to help improve connectivity in underserved areas. But how do regulators ensure they have an accurate view into connectivity gaps?

While mobile network operators (MNOs) supply regulatory bodies with their own performance and coverage maps, this information is often outdated by the time regulators receive it. Furthermore, information provided by the MNOs is often only predicted coverage and doesn’t provide a granular view into real-world network conditions experienced by consumers in a market. For accurate insights on network coverage and performance, validated third-party data can give regulators the information they need to bring better connectivity to their countries.

In the upcoming webinar, you’ll hear four ways regulatory bodies from around the world leverage Ookla® data to inform policy decisions and improve local connectivity.

Keep reading to find out how telecommunications regulators put these insights into action, and sign up for the webinar on Wednesday, May 11, at 6 a.m. PDT (1 p.m. GMT), for a more in-depth discussion.

Target areas for improving mobile connectivity

Identifying areas with little or no coverage and slow data speeds is the first step to improving networks and increasing availability. With these insights, regulators can introduce policies that encourage mobile operators to invest in expansion efforts, leading to stronger economic growth, better access to education, improved public safety, and more job opportunities.

Drawn from hundreds of millions of daily coverage scans and over 15 million consumer-initiated tests per day, the crowdsourced data in Cell Analytics™ shows an accurate picture of mobile network performance, availability, data usage, user density, and many more metrics — for virtually every operator in the world.

Above, we see Vodafone’s service availability and data speeds west of Sydney, Australia, with the red areas marking no service, showing areas where regulators can encourage operators to improve coverage.

Monitor new network and technology deployments

As operators roll out new 5G service and greenfield networks, regulators need to monitor these deployments to ensure they meet the necessary requirements. This is especially true for recently licensed spectrum. Operators typically must use new spectrum in a required timeframe or return it to the government for reallocation. Ookla data can help regulatory bodies monitor new network deployments, alongside spectrum information, network performance, and coverage metrics for the newly allocated spectrum.

Cell Analytics captures the LTE RSRP for DITO in Manila, Philippines, over the last two years, showing their buildout starting from small isolated pockets of coverage to strong signal across the metropolitan area.

Track spectrum utilization and data usage hotspots to prepare for 5G

In addition to tracking if operators use the acquired spectrum by the required deadline, regulators can monitor how operators use their spectrum. This gives regulators insights into whether operators are optimally balancing their spectrum among the different technologies to maximize the user experience and capacity.

In this example, Cell Analytics tracks mobile data usage in Singapore to identify areas of high data use (red areas in this map).
Cell Analytics displays spectrum utilization to help regulators monitor the ways each operator manages their spectrum. In this view, we see the band most often utilized by Singtel’s LTE users in Singapore. This can be compared to the data usage map to verify that users in high demand areas receive service on higher frequency bands that have more capacity. Additionally, regulators can check that operators are balancing spectrum appropriately across the various technologies from 2G to 5G.

Identify signals covering beyond national borders

Regulators want to keep signals from neighboring countries out of their territory. Not only does service leaking in from another country take away revenue from local operators, but it also interferes with the performance of the local networks. With visibility into signal crossing over national boundaries, regulators can proactively and diplomatically address the issue with their neighboring counterparts.

With crowdsourced data, Cell Analytics shows where signals from Austria cross into Bratislava, Slovakia. Slovakian regulators can share this data with Austrian regulators and request that they order the operator to contain the signal within the national boundary.

For a more detailed look at how regulators put this data into practice, join us for the webinar on May 11 at 6 a.m. PST. Even if you can’t attend at this time, you will receive a video recording after the live event. We look forward to sharing how regulators are making better connectivity a reality and answering your questions.

Ookla retains ownership of this article including all of the intellectual property rights, data, content graphs and analysis. This article may not be quoted, reproduced, distributed or published for any commercial purpose without prior consent. Members of the press and others using the findings in this article for non-commercial purposes are welcome to publicly share and link to report information with attribution to Ookla.

| August 28, 2018

The Network Efficiencies that make Telenor the World’s Fastest Carrier

Speedtest data recently revealed that Norwegian carrier Telenor was the world’s fastest carrier during Q2 2018 with a mean download speed of 72.05 Mbps on modern (LTE-capable) devices. Because Telenor is an enterprise client of ours, we had the unique opportunity to sit down with their network team to learn what goes into building a world-class LTE network.

Layering frequencies to improve capacity and coverage

Telenor always builds cell sites with multiple frequencies in order to provide the right mix of coverage and capacity that delivers the best possible user experience. To that end, Telenor’s LTE has been deployed across three frequency bands: 800 MHz provides the foundation for coverage, 1800 MHz acts as the mid-band layer and 2600 MHz is used as a capacity layer. In addition to layering the disparate frequency bands by the way of Carrier Aggregation, Telenor has implemented the complete Gigabit LTE feature set on selected sites, including the 256QAM and 4×4 MIMO which ensures the highest possible network efficiencies.

Telenor Norway takes pride in being one of the operators with the largest share of voice traffic over LTE in the world, and is aggressively working towards allocating all available frequency bands to LTE. This includes plans to sunset the 3G layer in 2019-2020 to allow Telenor to repurpose the 900 MHz and 2100 MHz spectrum bands for LTE, which will deliver even faster speeds to users. The company will continue offering 2G until 2025, mainly for machine-to-machine and legacy voice services.

Incentivizing customers to use modern devices

Perhaps Telenor’s secret sauce is their very close relationship with smartphone manufacturers. This allows them to make the most out of pre-launch field tests to ensure that their customers are getting equipment that meets Telenor’s standards.

Telenor is also assertive with marketing incentives designed to upgrade customers to modern devices. This is because the newest flagship phones are faster and more efficient in their use of network resources as a result of being equipped with the most advanced LTE modems, RF front-end and four LTE antennas. This completes Telenor’s network ecosystem filled with efficiencies, ensuring the best possible user experience, and the highest return of investment.

Covering a complex geography

Telenor currently has 99.4% of Norwegians covered with LTE, encompassing 81% of land mass, including remote rural areas. They extend service to Norway’s famous fjords by leveraging the existing cell sites built during the 2G days and continuing to add new ones.

What’s next for Telenor

Telenor is currently conducting 5G trials in preparation for commercial launch in 2020. Potential use cases for their 5G include: fixed wireless, enhanced mobile broadband and prioritization for mission critical services like healthcare, emergency services and supporting Norway’s large fish farming industry. While 5G is expected to make a big splash when it’s launched, Telenor believes that the LTE technology will continue as the main network pillar for several years to come.

Ookla retains ownership of this article including all of the intellectual property rights, data, content graphs and analysis. This article may not be quoted, reproduced, distributed or published for any commercial purpose without prior consent. Members of the press and others using the findings in this article for non-commercial purposes are welcome to publicly share and link to report information with attribution to Ookla.

| April 18, 2022

Speedtest Global Index Market Analyses Now Available for 43 Countries

Speedtest Global Index™ Market Analyses from Ookla® identify key data about internet performance in countries across the world. This quarter we’ve provided updated analyses for 44 markets that include details on fastest mobile and fixed broadband providers, performance of most popular devices and chipsets and internet speeds in cities. Click a country on the list below to see highlights or scroll through the article to learn what Speedtest Intelligence® revealed in all 43 markets:

Africa and the Middle East

Côte d’Ivoire | Jordan | Kenya | Libya | Nigeria
South Africa | Tanzania | Turkey

Asia and Oceania

China | Hong Kong (SAR) | New Zealand | Philippines | Singapore
Taiwan | Thailand | Vietnam

Europe

Austria | Belgium | Czechia | Denmark | Estonia
Finland| France | Germany | Hungary | Latvia
Lithuania | Luxembourg | Malta | Moldova | Poland
Slovakia | Spain

North and South America

Argentina | Brazil | Canada | Chile | Colombia
Ecuador | Guatemala | Mexico | Peru | United States


Africa and the Middle East

Côte d’Ivoire

  • Speedtest Intelligence revealed mobile provider MTN had the fastest median download speed (15.71 Mbps) and Consistency Score (71.1%) in Côte d’Ivoire during Q1 2022.
  • There was no statistical winner for fastest fixed broadband provider in Côte d’Ivoire during Q1 2022, though Orange had a median download speed of 33.65 Mbps and CANALBOX had a median download speed of 33.35 Mbps.

Jordan

  • Speedtest Intelligence found Umniah was the fastest mobile operator in Jordan during Q1 2022, earning a median download speed of 30.42 Mbps.
  • Fixed broadband provider Orange held the fastest median download speed in Jordan at 78.08 Mbps during Q1 2022.

Kenya

  • Mobile operator Safaricom had the fastest median mobile download speed at 20.49 Mbps in Kenya during Q1 2022.
  • For fixed broadband, Faiba had the fastest median download speed (24.64 Mbps) and Consistency Score (49.8%) in Kenya during Q1 2022.

Libya

  • Speedtest Intelligence reveals that mobile operator Libyana had the fastest median mobile download speed in Libya at 12.54 Mbps during Q1 2022.
  • Among top fixed broadband providers, AWAL Telecom had the fastest median download speed in Libya at 20.02 Mbps during Q1 2022.

Nigeria

  • Fixed broadband provider ipNX had the fastest median download speed (21.34 Mbps) and highest Consistency Score (45.9%) in Nigeria during Q1 2022.
  • There was no statistical winner for fastest top mobile operator in Nigeria during Q1 2022, though Airtel and MTN led the way at 22.42 Mbps and 21.71 Mbps, respectively.

South Africa

  • Speedtest Intelligence shows Cool Ideas had the fastest fixed broadband median download speed (46.05 Mbps) and highest Consistency Score (73.2%) in South Africa during Q1 2022.
  • MTN had the fastest median 5G download speed in South Africa at 213.37 Mbps during Q1 2022, much faster than Vodacom (132.11 Mbps).
  • The Samsung Galaxy S22 Ultra dominated for fastest popular device in South Africa during Q1 2022 and achieved a median download speed of 105.21 Mbps. The Apple iPhone 13 Pro Max followed at 82.23 Mbps.

Tanzania

  • Among top mobile operators in Tanzania, Halotel had the fastest median download speed (17.84 Mbps) and highest Consistency Score (80.1%) during Q1 2022.
  • Mwanza had the fastest median mobile download speed among Tanzania’s most populous cities at 13.76 Mbps during Q1 2022.

Turkey

  • Speedtest Intelligence reveals mobile provider Turkcell had the fastest median download speed and highest Consistency Score in Turkey at 53.77 Mbps and 92.7%, respectively, during Q1 2022.
  • For fixed broadband in Turkey, TurkNet had the highest median download speed (47.43 Mbps) and Consistency Score (76.8%) during Q1 2022.


Asia and Oceania

China

  • According to Speedtest Intelligence, China Telecom was the fastest fixed broadband provider in China with a median download speed of 146.70 Mbps during Q1 2022.
  • During Q1 2022, China Mobile achieved the fastest median 5G download speed at 300.96 Mbps, ahead of China Telecom (296.97 Mbps) and China Unicom (280.62 Mbps).
  • Among top device manufacturers, Huawei had the fastest median download speed in China at 108.94 Mbps during Q1 2022.

Hong Kong (SAR)

  • China Mobile Hong Kong was the fastest mobile operator in Hong Kong, achieving a median download speed of 66.11 Mbps during Q1 2022.
  • China Mobile Hong Kong also showed the fastest 5G download speed, achieving a median speed of 172.19 Mbps during Q1 2022. Mobile provider 3 followed at 155.81 Mbps.

New Zealand

  • Vodafone was the fastest mobile operator in New Zealand during Q1 2022, earning a median download speed of 59.65 Mbps.
  • 2degrees blazed ahead with the fastest median 5G download speed in New Zealand at 479.71 Mbps during Q1 2022, beating out Vodafone (342.45 Mbps) and Spark (307.21 Mbps).
  • For fixed broadband, MyRepublic achieved the fastest median download speed in New Zealand at 217.66 Mbps during Q1 2022.

Philippines

  • During Q1 2022, Smart had the fastest median download speed (24.07 Mbps) among top mobile operators in the Philippines.
  • Smart also had the fastest median 5G download speed in the Philippines during Q1 2022 at 200.43 Mbps.
  • Caloocan took the top spot for fastest median mobile download speed among the Philippines’ most populous cities at 25.71 Mbps during Q1 2022.

Singapore

  • Speedtest Intelligence shows Singtel was the fastest top mobile operator in Singapore with a median download speed of 93.00 Mbps during Q1 2022.
  • Singtel blazed ahead of the competition for fastest median 5G download speed in Singapore at 360.31 Mbps during Q1 2022 — a strong rise over its median 5G download speed of 289.01 Mbps during Q4 2021.

Taiwan

  • During Q1 2022, Chunghwa Telecom had the fastest median 5G download speed in Taiwan at 415.45 Mbps. FarEasTone followed at 310.83 Mbps.
  • The Qualcomm Snapdragon 8 Gen 1 had the fastest median download speed among popular chipsets in Taiwan at 162.51 Mbps during Q1 2022.

Thailand

  • Speedtest Intelligence revealed that AIS had the fastest median download speed on mobile in Thailand at 43.52 Mbps during Q1 2022, beating out TrueMove H and dtac.
  • AIS also had the fastest median 5G download speed in Thailand during Q1 2022 at 261.19 Mbps, followed by TrueMove H and dtac.

Vietnam

  • Vinaphone was Vietnam’s fastest mobile operator during Q1 2022, reaching a median mobile download speed of 42.43 Mbps, just faster than Viettel (40.61 Mbps).
  • Apple’s iPhone 13 Pro had the fastest median download speed among popular devices in Vietnam at 70.91 Mbps during Q1 2022.


Europe

Austria

  • Magenta took the top spot as Austria’s fastest fixed broadband provider with a median download speed of 154.44 Mbps during Q1 2022. LIWEST was the closest competitor (88.75 Mbps).
  • A1 was the fastest mobile provider in Austria during Q1 2022, achieving a median download speed of 69.80 Mbps. Operator 3 followed at 53.73 Mbps.

Belgium

  • Telenet decisively claimed its spot as Belgium’s fastest fixed broadband provider during Q1 2022, earning a median download speed of 129.18 Mbps. VOO followed at 109.76 Mbps.
  • Among mobile operators, Telenet/BASE had the fastest median download speed at 66.92 Mbps.

Czechia

  • Speedtest Intelligence reveals T-Mobile was Czechia’s fastest mobile provider during Q1 2022, recording a median download speed of 55.63 Mbps.
  • Vodafone was Czechia’s fastest fixed broadband provider during Q1 2022, achieving a median download speed of 89.23 Mbps.

Denmark

  • Fastspeed was Denmark’s fastest fixed broadband provider during Q1 2022, achieving a median download speed of 284.28 Mbps. Hiper followed at 239.43 Mbps.
  • YouSee was Denmark’s fastest mobile operator, earning a median download speed of 115.87 Mbps during Q1 2022.

Estonia

  • According to Speedtest Intelligence, Elisa was the fastest fixed broadband provider in Estonia during Q1 2022, achieving a median download speed of 74.48 Mbps.
  • Telia had the fastest mobile median download speed in Estonia at 73.20 Mbps during Q1 2022.

Finland

  • According to Speedtest Intelligence, DNA took the top spot as Finland’s fastest mobile operator in Q1 2022, earning a median download speed of 70.76 Mbps. DNA also edged out Telia for the highest Consistency Score 93.1% to 91.7%.
  • In addition, DNA had the fastest 5G download speed in Finland, achieving a median download speed of 297.70 Mbps. Telia (259.68 Mbps) and Elisa (230.35 Mbps) followed.
  • Competition was tight for Finland’s fastest fixed broadband provider during Q1 2022. DNA (87.87 Mbps) raced past Elisa (86.54 Mbps) and Telia (86.13 Mbps) to take the top spot.

France

  • Orange earned the top spot as France’s fastest and most consistent mobile operator with a median mobile download speed of 81.03 Mbps and a Consistency Score of 89.8% during Q1 2022.
  • During Q1 2022, Orange dominated the competition as France’s fastest 5G provider by achieving a median 5G download speed of 366.42 Mbps. SFR followed at 247.32 Mbps.

Germany

  • According to Speedtest Intelligence, Vodafone was Germany’s fastest fixed broadband provider during Q1 2022, earning a median download speed of 108.67 Mbps.
  • Telekom achieved the fastest median mobile download speed (79.34 Mbps) and Consistency Score (90.9%) among German mobile operators during Q1 2022.
  • Telekom took the top spot for the fastest median 5G download speed in Germany at 193.09 Mbps during Q1 2022.

Hungary

  • Vodafone was Hungary’s fastest fixed broadband provider with a median download speed of 159.59 Mbps during Q1 2022. Vodafone also had the highest Consistency Score at 87.9% during Q1 2022.
  • Yettel was Hungary’s fastest mobile operator during Q1 2022, earning a median download speed of 50.62 Mbps.

Latvia

  • According to Speedtest Intelligence, Balticom had the fastest median fixed broadband download speed in Latvia at 188.27 Mbps and highest Consistency Score (91.9%) during Q1 2022.
  • LMT had the fastest median mobile download speed in Latvia at 50.70 Mbps during Q1 2022.

Lithuania

  • Telia had the fastest median mobile download speed in Lithuania at 77.77 Mbps during Q1 2022. Tele2 followed at 41.75 Mbps, then BITE (29.81 Mbps).
  • Speedtest Intelligence reveals that Cgates had the fastest median fixed broadband speed in Lithuania at 99.50 Mbps during Q1 2022, edging out Penki (93.52 Mbps) and Telia (86.84 Mbps).

Luxembourg

  • Eltrona took the top spot as Luxembourg’s fastest fixed broadband provider during Q1 2022 by achieving a median download speed of 119.65 Mbps.
  • POST was the fastest mobile operator in Luxembourg, achieving a median download speed of 122.74 Mbps in Q1 2022.

Malta

  • Melita took the top spot as Malta’s fastest and most consistent fixed broadband provider during Q1 2022, earning a median download speed of 117.68 Mbps and Consistency Score of 85.2%.

Moldova

  • According to Speedtest Intelligence, Orange dominated as Moldova’s fastest fixed broadband provider, achieving a median download speed of 203.54 Mbps during Q1 2022.
  • Tiraspol showed the fastest median mobile download speed among Moldova’s most populous cities at 35.62 Mbps during Q1 2022.

Poland

  • Speedtest Intelligence revealed that UPC was the fastest fixed broadband provider in Poland, achieving a median download speed of 195.74 Mbps during Q1 2022.
  • Mobile operator Plus had the fastest median 5G download speed in Poland at 167.37 Mbps during Q1 2022, a slight gain over Q4 2021.

Slovakia

  • Orange took the top spot as Slovakia’s fastest mobile operator with a median download speed of 53.30 Mbps, edging out Telekom’s 45.90 Mbps during Q1 2022.
  • Orange also dominated as the fastest 5G operator in Slovakia with a median 5G download speed at 299.09 Mbps during Q1 2022. 4ka followed at 177.76 Mbps.
  • UPC took the top spot as Slovakia’s fastest and most consistent fixed broadband provider with a median download speed of 146.65 Mbps and a Consistency Score of 87.5% during Q1 2022.

Spain

  • Movistar provided the fastest and most consistent mobile experience among Spanish mobile operators during Q1 2022 with a median download speed of 52.44 Mbps and Consistency Score of 89.4%.
  • Vodafone was Spain’s fastest 5G provider by a wide margin, achieving a median download speed of 192.40 Mbps during Q1 2022.


North and South America

Argentina

  • Speedtest Intelligence revealed Personal was Argentina’s fastest mobile operator with a median download speed of 25.57 Mbps during Q1 2022.
  • There was a tight race for the fastest median mobile download speed in Argentina’s most populous cities with no statistical winner during Q1 2022. However, Buenos Aires (25.26 Mbps) and La Plata (25.18 Mbps) led the way.

Brazil

  • Speedtest Intelligence reveals Claro was the fastest and most consistent mobile operator in Brazil during Q1 2022, achieving a median download speed of 33.53 Mbps and Consistency Score of 84.6%.
  • Claro achieved the fastest median 5G download speed in Brazil at 72.35 Mbps during Q1 2022. TIM (62.80 Mbps) and Vivo (62.38 Mbps) followed.

Canada

  • Shaw was Canada’s fastest fixed broadband provider, earning a median download speed of 213.47 Mbps during Q1 2022.
  • TELUS took the top spot as the fastest mobile operator in Canada, achieving a median download speed of 94.48 Mbps during Q1 2022.
  • Competition for the fastest 5G in Canada was tight during Q1 2022 with TELUS edging out Bell 162.47 Mbps to 155.71 Mbps, respectively.

Chile

  • According to Speedtest Intelligence, Entel was the fastest mobile operator in Chile with a median download speed of 23.13 Mbps during Q1 2022.
  • Temuco had the fastest median mobile download speed in Chile at 24.86 Mbps during Q1 2022.

Colombia

  • Cali had the fastest median mobile download speed among Colombia’s most populous cities at 15.32 Mbps during Q1 2022.
  • Among major device manufacturers in Colombia, Apple devices had the fastest median download speed at 17.20 Mbps during Q1 2022.

Ecuador

  • According to Speedtest Intelligence, Netlife was Ecuador’s fastest and most consistent fixed broadband provider during Q1 2022, achieving a median download speed of 45.53 Mbps and Consistency Score of 75.5%.
  • CNT was the fastest and most consistent mobile operator in Ecuador during Q1 2022, with a median download speed of 33.11 Mbps and Consistency Score of 87.4%.

Guatemala

  • According to Speedtest Intelligence, Claro was the fastest and most consistent mobile operator in Guatemala during Q1 2022, achieving a median download speed of 21.40 Mbps and Consistency Score of 80.5%.
  • Tigo was the fastest and most consistent fixed broadband provider in Guatemala with a median download speed of 26.56 Mbps and Consistency Score of 58.3% during Q1 2022.

Mexico

  • Speedtest Intelligence reveals Telcel was Mexico’s fastest mobile operator during Q1 2022, leading the market with a median download speed of 40.25 Mbps.
  • Totalplay was the fastest and most consistent fixed broadband provider in Mexico, achieving a median download speed of 49.33 Mbps and Consistency Score of 74.3% during Q1 2022.

Peru

  • According to Speedtest Intelligence, Winet Telecom was Peru’s fastest fixed broadband provider by a wide margin, achieving a median download speed of 102.83 Mbps during Q1 2022.
  • Claro was the fastest mobile operator in Peru during Q1 2022, earning a median download speed of 19.55 Mbps.

United States

  • Speedtest Intelligence reveals Verizon was the fastest fixed broadband provider in the United States during Q1 2022, edging out XFINITY with a median download speed of 184.36 Mbps to XFINITY’s 179.12 Mbps.
  • T-Mobile took the top spot as the fastest and most consistent mobile operator in the U.S. during Q1 2022, achieving a median download speed of 117.83 Mbps and a Consistency Score of 88.3% — both increases over Q4 2021.
  • Looking at tests taken only on 5G, T-Mobile achieved the fastest median 5G download speed at 191.12 Mbps during Q1 2022. Verizon also had a notable increase in 5G download speed during Q1 2022 over Q4 2021 , which was helped by turning on new C-Band spectrum in January.
  • The Samsung Galaxy S22 Ultra was the fastest popular device in the U.S. at 116.33 Mbps during Q1 2022.

Read the full market analyses and follow monthly ranking updates on the Speedtest Global Index.

Editor’s note: This article was updated on May 11, 2022.

Ookla retains ownership of this article including all of the intellectual property rights, data, content graphs and analysis. This article may not be quoted, reproduced, distributed or published for any commercial purpose without prior consent. Members of the press and others using the findings in this article for non-commercial purposes are welcome to publicly share and link to report information with attribution to Ookla.

| November 5, 2020

Unable to Connect — The Most Significant Online Service Outages in Q3 2020

“Is it down?” frustrated users asked themselves during the multiple online service outages in Q3 2020. The fourth installment of our online service outage tracking series used Downdetector® data from Q3 2020 and focused on the following online service categories: cloud services, collaboration platforms, financial services, gaming, internet service providers and social media.

Cloud services

Cloudflare (July 17, 2020): 14,198 reports at peak

Downdetector_Cloudflare_Outage_1020

On July 17, a major disruption in Cloudflare’s service broke the internet, taking multiple online services down with it. Users rushed to Downdetector to log issues with multiple services that rely on Cloudflare for content delivery, including 4chan, DoorDash and Zendesk. At the peak of the outage, there were 14,198 reports of issues with the service in the U.S.

Azure (September 28, 2020): 2,846 reports at peak

Azure, Microsoft’s cloud service, was affected by September 28’s Microsoft-wide outage (see next category). Users from Germany, India, Japan and the U.S. stated they had issues with the cloud service. That day, there were 2,846 reports of issues at the peak of the outage in the U.S.

Collaboration platforms

Office 365 (September 28,2020): 20,437 reports at peak

Downdetector_Office365_Outage_1020

Microsoft’s suite of online collaboration services including Outlook, Sharepoint, OneDrive and Skype went down on September 28 (along with Azure, see above). Logs of issues with the services started coming into Downdetector at 3 p.m Pacific. Most users stated being unable to log in or connect to the server. At the peak, there were 20,437 reported issues in the U.S. Users from Japan and India also logged problems with the service that day.

Zoom (August 24, 2020): 17,874 reports at peak

On August 24, users were upset to find that they were unable to connect with their coworkers, friends and family through Zoom. Most users stated problems with logging in and joining a conference. There were 17,874 reports of issues in the U.S. at the peak of the outage. Users in the U.K. and Canada also had issues with the video conferencing service that day.

Google Drive (September 24, 2020): 14,715 reports at peak

Users in the U.S., Philippines and Indonesia were unable to collaborate on projects, upload files or access their documents stored in Google Drive on September 24. At the peak of the outage in the U.S., there were 14,715 reported issues. Users of Google products YouTube and Gmail also logged issues in Brazil, Germany, India, Japan, Mexico and the U.K.

Slack (September 29, 2020): 1,396 reports at peak

Slack received 1,396 logs of issues at the peak of the outage reports on September 29. Users in the U.S. had problems with sending messages, videos and images to their peers — and some were unable to connect to the platform at all.

Financial services

TD Ameritrade (August 18, 2020): 7,814 reports at peak

Downdetector_TD-Ameritrade_Outage_1020

The online stock investment tool reportedly went down on August 18. Users were unable to log into their account or buy and sell stocks. At the peak of the outage, there were 7,814 reports of issues in the U.S. There were two other notable outages that month — August 17 with 5,816 reports at peak and August 31 with 6,893 reports at peak.

Gaming

Steam (August 5, 2020): 69,255 reports at peak

Downdetector_Steam_Outage_1020

Users from Brazil, Germany, Japan, the U.K and the U.S. submitted issues with Steam on August 5. Most users stated problems when trying to log into the platform and play with other users. At the peak of the outage in the U.S, there were 69,255 reports of issues with the gaming platform.

Fall Guys (September 2, 2020): 2,890 reports at peak

The Fall Guys status page on Downdetector showed there were problems with the popular online game on September 2. Users in Brazil, the U.K. and the U.S. were struggling to play the game online. That day, 97% of reports stated problems with the server connection.

Internet service providers

Spectrum (July 29, 2020): 56,318 reports at peak

Downdetector_Spectrum_Outage_1020

Spectrum users from the both coasts of the United States flooded Downdetector with logs of issues with the service when they started experiencing problems with their internet connections. Complaints with the service started surging at around 5 p.m. Pacific and lasted for about an hour. At the peak of the outage there were 56,318 reports of issues.

CenturyLink (August 30, 2020): 11,543 reports at peak

CenturyLink customers on the East Coast of the U.S. had problems with their internet service on August 30 starting around 2 a.m. Pacific and ending around 8 a.m. Pacific. There were 11,543 reports of issues at the peak of the outage.

Social Media

WhatsApp (July 14, 2020): 148,573 reports at peak

Downdetector_WhatsApp_Outage_1020-1

A multi-country outage affected WhatsApp on July 14. Users from all over the world stated problems with sending and receiving messages on the Facebook-owned app. The country with the most issues submitted was Germany with 148,573 reports of issues at the peak of the outage. Users in Brazil, India, the Netherlands, Mexico, Spain and the U.K. were also affected by the outage.

Facebook (September 17, 2020): 30,918 reports at peak

Facebook users from multiple countries experienced problems with the social media platform on September 17. More than half of the logs were labeled as “total blackout” — users were unable to access the platform or any of its features. There were 30,918 reports of issues at the peak of the outage in the U.S. Users in Italy, Poland and the U.K. also had problems with Facebook that day.

Want to know when an online service is down? Keep up with outages by visiting Downdetector.

Ookla retains ownership of this article including all of the intellectual property rights, data, content graphs and analysis. This article may not be quoted, reproduced, distributed or published for any commercial purpose without prior consent. Members of the press and others using the findings in this article for non-commercial purposes are welcome to publicly share and link to report information with attribution to Ookla.

| March 25, 2020

How to Use Downdetector to Report and Understand the Scale of an Outage

We’ve all been there — refreshing a page, closing and re-opening a program, checking our internet connection hoping the online service we’re using isn’t down. Before checking Twitter for a “#down” to see if it’s just you, know that you can turn to Downdetector® for a reliable and up-to-date assessment of web and online service outages. Downdetector tracks outages based on consumer feedback and can save you precious time when trying to verify a site’s status.

If you’ve ever typed “Is [service] down?” into a search engine, you may be familiar with Downdetector’s status page. This article will walk you through the features of a Downdetector status page so you can quickly and easily find what you need during an outage.

Headline info: Is the site or service down and how broken is it?

Detail-Page-TopAt the top of the status page, you’ll find the logo of the service and its status. There are three colors Downdetector uses to classify the status of an online service or site: blue for “No problems,” yellow for “Some problems” and red for “Problems.” Some companies’ status pages will even have a message from the service itself acknowledging that there is a problem and ensuring their customers that they are working on resolving the issue.

If you are currently experiencing problems with an online service, we encourage you to click or tap on the “I have problems with [service]” at the top of the page under the status. A window will pop up and ask you to specify what is not working. In most cases, there will be pre-selected options for you to choose from (website, logging in, etc). You also have the option of typing out the problem if it is not listed.

Under the first section, there is a graph that shows the number of outage reports in the last 24 hours for that service. If you hover over the graph, you can see how many reports were submitted at a specific time. You’ll also see if there was a peak in outage reports in the last 24 hours.

The geography of an outage

dd-outage-map

The status page also includes a link to a live outage map. When you click on the “Live Outage Map” button, you will be redirected to a map that shows where in the world problems with that service have been reported. The map will be specific to the service and will only show the areas where the service is available. This feature is useful if you’d like to find out if the outage is just where you live or if the service is down across the globe.

Find out what exactly is going wrong

reported-problems-1
Next is the “Most reported problems” section. This section helps you understand if other users are having the same problem or if there are multiple issues with the service during the outage. It’s based on consumer feedback from the window at the top of the page that asked you what problem you were experiencing.

Is it down often?

resolved-issues-1
To find out when was the last time an outage was reported, navigate to the “Resolved issues” section. The three latest outages will be listed by date. Clicking each date will take you to the status overview of the service of that day. Click “Check past issues” to see a list of reported outages from the last year.

Rate their service

rating-box-1
Next to the status of the service at the top of the page on the right sidebar, you can rate the service from 1 to 5 stars. This is also where you can find links to the online service’s official social media, status page and their website, if available.

It’s not just you! Find a community on Downdetector

Comments-1

Downdetector offers a space toward the bottom of each status page where you can interact with other users reporting outages. This Disqus comment forum is a good place to research the finer details of an outage or share your frustrations with others who are also struggling with the service. If you are using an ad-blocker, you might have to turn it off to see the comments and participate in the discussion.

For the Twitterati

dd-reports-tweets-3
We feature two important sections for those of you used to getting your information from Twitter. On the right hand side of the page, you can see the service’s official Twitter stream, if available, in case they have tweeted an ETA of when the service will be back up. And at the bottom of the status page, you’ll see a feed of tweets from users that tag the service reporting an outage.

Track outages globally

Downdetector tracks outages of online services and sites from over 45 countries. Depending on your location, Downdetector’s homepage will feature sites and online services that are available in your country. For example, Vodafone if you’re in Germany and Telmex if you’re in Mexico.

On a status page, you may change your preferred country or check the status of a service in a different country by navigating to the “Check the status of [service] in other countries” on the right side bar and click on the flag of the country you’re looking for. Once you click on one of the flags, the language of the site will change according to the country you selected.

status-box
If your browser is having problems and you can’t navigate to Downdetector.com, you can always check our Twitter account or our Facebook page for reported outages.

Outages can be disruptive and frustrating. Downdetector offers reliable data based on user reports and gives users an opportunity to connect with others experiencing the same problem to share information. Bookmark Downdetector to stay on top of outages as they’re happening.

We are always adding more services to Downdetector so you know when outages happen. Is there a site or service you’d like us to track? Send us an email at info@downdetector.com.

Ookla retains ownership of this article including all of the intellectual property rights, data, content graphs and analysis. This article may not be quoted, reproduced, distributed or published for any commercial purpose without prior consent. Members of the press and others using the findings in this article for non-commercial purposes are welcome to publicly share and link to report information with attribution to Ookla.

| September 18, 2023

New Speedtest Data Shows Starlink Performance is Mixed — But That’s a Good Thing

Satellite providers are playing no small part in the rapid expansion of global connectivity. Some experts predict there will be 58,000 satellites orbiting the earth by 2030 — a nearly 725% increase from 2023. Ookla® is back with our ongoing satellite internet series with compelling, fresh data for satellite providers in Africa, Europe, and Oceania during Q2 2023, including SpaceX’s Starlink, Viasat, and Skylogic.

This analysis includes Starlink Net Promoter Score (NPS) data for France, Germany, Italy, New Zealand, and the United Kingdom, year-over-year data for satellite providers in Europe and Oceania from Q2 2022 to Q2 2023, and new Q2 2023 data from Starlink in Africa.

Starlink users across different continents continue to love the service

Using Speedtest Intelligence®, we examined NPS ratings data for Starlink users against an aggregate of all fixed broadband providers combined. 

NPS is based on Speedtest® user responses after being asked how likely they are to recommend their provider to friends or family on a 0 to 10 scale. NPS ratings are categorized into Detractors (score 0-6), Passives (score 7-8), and Promoters (score 9-10), and is calculated as (% Promoters – % Detractors) x 100. Any NPS score above 0 indicates that a provider’s audience is more loyal than not.

Chart of NPS Performance in Select Countries

As you can see from the above image, Starlink users in France, Germany, Italy, New Zealand, and the U.K. had an NPS score much higher than the aggregate score for all fixed broadband providers combined during Q2 2023. France had the highest NPS among the aggregate of fixed broadband providers for the countries we surveyed at -15.98 and fixed broadband providers had a much faster median download speed at 165.37 Mbps to Starlink’s 107.56 Mbps. In New Zealand there was a similar story with the aggregate of fixed broadband providers having a -20.40 NPS to Starlink’s 48.83, while having a faster median download speed 147.86 Mbps to 113.78 Mbps during Q2 2023.

Germany, which had the lowest NPS rating of aggregate of fixed broadband providers in Europe at -30.10, also had the smallest difference in NPS with Starlink scoring 38.19. Interestingly, the aggregate of fixed broadband providers and Starlink both had similar median download speeds at 83.16 Mbps and 82.56 Mbps, respectively, during Q2 2023.

Of note, Starlink had much higher NPS ratings and median download speeds than the aggregate of all fixed providers combined in Italy and the U.K., respectively, during Q2 2023. Starlink’s NPS was 50.20 to -25.61 for the aggregate of all fixed broadband providers in Italy during Q2 2023, while the median download speeds were 100.68 Mbps to 63.99 Mbps. In the U.K., Starlink’s NPS was 47.18 to -26.88 for the aggregate of all fixed broadband providers combined, with the median download speeds a little closer, 100.11 Mbps to 77.38 Mbps, respectively. 

In our last report, we found a wide NPS gap between U.S. rural Starlink users — who often have fewer options for fixed broadband access — and the corresponding aggregate of fixed broadband providers. Given that all five of these countries have rural or remote regions that are underserved or not served by traditional broadband offerings, it may be no surprise that Starlink users who reside in those areas may feel positive about having access to fast broadband internet. 

Starlink speeds over 100 Mbps in 14 European countries during Q2 2023, speeds stabilizing across Europe

Key takeaways:

  • Starlink results were the fastest among satellite providers we surveyed.
  • Starlink quarter-to-quarter speeds improved or remained about the same (between 5% and -5%) in 23 countries, while decreasing in 4 countries.
  • Among the 27 European countries we surveyed, Starlink had median download speeds greater than 100 Mbps in 14 countries, greater than 90 Mbps in 20 countries, and greater than 80 in 24 countries, with only three countries failing to reach 70 Mbps.
  • Skylogic, while delivering speeds slower than Starlink, showed stabilized broadband speeds over the past year for those seeking a Starlink alternative.

Over the past year, we’ve seen huge developments in the global satellite market, Europe notwithstanding, with Amazon’s Project Kuiper moving forward, the EU creating its own satellite constellation, and OneWeb and Eutelsat merging. While Starlink continues to lead for performance among satellite providers we surveyed, Starlink has experienced some major hurdles over the past year as users flock to the service and speeds have subsequently dipped — but of note those concerns seem to have started allaying in most of Europe during Q2 2023.

At first glance, year-over-year median download speeds for Starlink are about the same (-5% to 5%) or better (greater than 5%) from Q2 2022 to Q2 2023 in 15 countries and slower (decreasing more than 5%) in 8 countries. But among the 27 countries we surveyed during Q2 2023, Starlink had speeds faster than the aggregate of all fixed broadband providers combined in 11 countries (Austria, Belgium, Bulgaria, Croatia, Czechia, Estonia, Greece, Ireland, Italy, Latvia, and the U.K.) Those speeds were most notably faster in Croatia and Greece for Starlink at 94.41 Mbps to 45.24 Mbps and 108.97 to 44.09 Mbps, respectively, during Q2 2023. Speeds were about the same in four countries (Finland, Slovenia, Germany, and Lithuania), and speeds were slower than the aggregate of fixed broadband providers in 12 countries, most notably in Poland, Spain, Romania, Denmark, and France which saw between 50% and 105% faster aggregate fixed broadband speeds than Starlink.

Quarterly download speeds stabilizing or improving

Looking at results from Q1 2023 to Q2 2023, median download speeds for Starlink remained about the same (between 5% and -5%) in 23 countries, while decreasing in four countries. That’s a big deal, especially given Starlink had median download speeds greater than 100 Mbps in 14 countries, and greater than 90 Mbps in 20 countries, and greater than 80 in 24 countries — with only three countries failing to reach 70 Mbps.

While trailing Starlink speeds, Skylogic recorded median download speeds in Italy at 29.21 Mbps during Q2 2023, a roughly 27% statistical increase year-over-year from 22.28 Mbps during Q2 2022. Notably, Skylogic recorded a median download speed of 68.44 Mbps in Italy during Q1 2023. Among the various countries we recorded Skylogic data for during the past year, the range of median download speeds varied between 19.53 Mbps and 68.44 Mbps, with most speeds between 28 and 50 Mbps, all fast enough to stream 4K video online. Viasat, had relatively similar download speeds in Germany and Italy at 17.22 Mbps and 17.45 Mbps, respectively, during Q2 2023. 

Top 10 fastest Starlink download speeds in European countries

Chart of Top 10 Fastest Starlink Median Download Speeds in Europe

Starlink in Switzerland had one of the fastest median download speed among countries with Starlink during Q2 2023 at 122.47 Mbps, followed by Denmark (117.38 Mbps), Austria (111.91 Mbps), Belgium (111.20 Mbps), Hungary (108.97 Mbps), France (107.56 Mbps), Ireland (104.42 Mbps), Estonia (102.38 Mbps), Portugal (101.75 Mbps), and Latvia (100.94 Mbps). Sweden, Italy, Bulgaria, and the U.K. all followed but had speeds greater than 100 Mbps.

Upload speeds for Starlink are down year over year, but quarterly speeds almost all improved or were about the same

Upload speeds for Starlink mostly decreased notably year over year, with only the U.K. showing an improved median upload speed in Q2 2023 out of 27 countries surveyed. However, looking quarter to quarter, Q2 2023 upload speeds for Starlink stayed about the same or improved in 25 out of 27 countries, with only Greece and Ireland showing declines. For upload speeds, Starlink all 27 countries we surveyed had upload speeds between 10 Mbps and 15 Mbps except Portugal (17.70 Mbps), Hungary (16.91 Mbps), Croatia (16.12 Mbps), Bulgaria (15.93 Mbps), Romania (15.82 Mbps), Spain (15.79 Mbps), and Poland (9.11 Mbps). Starlink in Greece was the only instance of a satellite provider in Europe having an upload speed greater than the aggregate of all fixed providers combined, 12.97 Mbps for Starlink to 7.85 Mbps for the aggregate of fixed broadband providers combined. Skylogic showed upload speeds lower than 4 Mbps in both Austria and Italy during Q2 2023. Viasat had upload speeds of 3.51 Mbps in Germany and 4.69 Mbps in Italy during Q2 2023. 

Multi-server latency is stabilizing for Starlink users across Europe

As an low-earth orbiting (LEO) satellite internet provider, Starlink has a leg up on some satellite competitors who rely on further away geosynchronous-earth orbit (GEO) and medium-earth orbit (MEO) satellite constellations. However, once again, all the aggregates of all fixed broadband providers in Europe had much lower multi-server latencies than Starlink, Viasat (which had latencies over 600 ms) and Skylogic (which had latencies over 700 ms). That being said, Starlink still saw multi-server latencies under 60 ms in the U.K. (51.26 ms), Spain (53.37 ms), Portugal (55.84 ms), and Belgium (59.34 ms). Starlink saw most countries’ multi-server latencies between 60 and 90 ms.

Starlink speeds stabilize in Oceania

Oceania, the second least densely populated continent in the world to Antarctica, has rural and remote populations that benefit from (and even rely on) satellite internet connections. Luckily for rural and remote Starlink users, they’ve probably seen a good amount of stability over the past year with Q2 2023 median download speeds in New Zealand at 113.78 Mbps (105.99 Mbps in Q2 2022) and Australia at 104.92 Mbps (102.76 Mbps in Q2 2022). Tonga, which is very remote, saw download speeds drop from 45.25 Mbps in Q2 2022 to 37.95 Mbps in Q2 2023. 

Upload speeds also showed some stability with Australia going from 10.45 Mbps in Q2 2022 to 11.33 Mbps during Q2 2023 and New Zealand going from 12.31 Mbps to 14.62 during the same time period. Tonga saw a notable drop in speeds year over year from 19.26 Mbps in Q2 2022 to 6.66 Mbps Q2 2023. 

Multi-server latency, which usually will be higher for satellite internet options, showed promising results for Starlink in Oceania during Q2 2023. Multi-server latency dropped noticeably in New Zealand year over year, going from 89.38 ms in Q2 2022 to 46.42 ms in Q2 2023. Australia saw a more modest drop with multi-server latency going from 63.04 ms to 59.78 ms from Q2 2022 to Q2 2023. Tonga saw an increase in multi-server latency from 125.24 ms to 137.16 ms during the same time period.

Starlink in Africa is off to a promising start

Chart of Satellite Performance in Africa, Q2 2023

Starlink, which first launched on the African continent in Nigeria this past January, is showing intriguing early results. Speedtest Intelligence showed that Starlink in Nigeria had a faster median download speeds than all aggregate fixed broadband providers combined at 63.69 Mbps to 15.60 Mbps during Q2 2023. Upload speeds were more similar during the same time period with Starlink at 13.72 Mbps and the aggregate of all fixed broadband providers combined at 10.60 Mbps. Starlink did have a marginally higher multi-server latency at 55.88 ms to 50.26 ms during Q2 2023.

In Rwanda, median download speeds were a little closer with Starlink recording a median download speed at 63.10 Mbps in Q2 2023 compared to the aggregate of all fixed broadband providers combined at 34.55 Mbps. Starlink trailed behind for median upload speed at 6.88 Mbps to 10.05 Mbps for fixed broadband providers during Q2 2023. Multi-server latency for Starlink was much higher at 320.45 ms to 29.04 ms for fixed broadband providers during the same time period.

The 2023 space revolution is off to a huge start

Here are some major updates about what’s next for various different satellite competitors:

After delays, Amazon’s Project Kuiper aim to launch prototype satellites this fall

Facing a series of rocket-related delays, Amazon recently announced it could send its first two Project Kuiper prototypes into orbit in late September. That news follows a recently announced $120 million 100,000-square-foot satellite processing facility at NASA’s Kennedy Space Center in Florida. Planning on offering internet service in 2025, Amazon is slated to have half of its 3,236 LEO satellite constellation in space by 2026.

China’s grand ambitions to provide internet connectivity to over 362 million people

According to the Wall Street Journal, over 362 million people in China don’t have access to the internet — which is about 1 in every 4 people in China, a large portion of which live in rural or remote communities. In order to overcome that connectivity gap, China is looking to the sky to create its own satellite constellation with potentially over 12,000 satellites. China’s biggest gap seems to be with recreating the success of SpaceX’s reusable rockets — however, initial tests are far underway and a host of reusable rockets are slated for test launches in 2024. 

SpaceX’s Starlink service offerings are about to rapidly expand

While Starlink continues to lead among satellite providers in most areas of the world, their expansion is only starting. Looking at the Starlink availability map, Starlink has an incredibly busy rest of 2023 and 2024 in Africa, Asia, and South America — and they’re marking their intent to expand into most of the world. That comes as Starlink marked launching over 5,000 satellites into space at the end of August. With some wiley entrepreneurs already renting out their Starlink “Dishy McFlatfaces” to vacationers and campers for $25-30 dollars a day, satellite connectivity is truly becoming a full-time gig.

Viasat’s bad luck might affect entire industry

Viasat launched the first of its three long-awaited Viasat-3 arrays — but then their first satellite suffered an antenna anomaly, which prevented a large reflector to deploy that affects whether or not the satellite can operate as intended. While Viasat is rushing to solve the issue, this could ultimately trigger a $420 million insure claim for the loss of the $700 million satellite. With such a high-value loss, this could send ripples through the satellite industry, causing insurance premiums to skyrocket for companies looking to mitigate potential losses through insurance. All of this comes on the heels of acquiring Inmarsat in May for $7.3 billion to expand its satellite arrays and spectrum holdings. We’ll be watching to see whether or not Viasat can find a solution. 

Eutelsat and OneWeb merger imminent, big moves abound

The Eutelsat and OneWeb merger should make competitors take notice — combining satellite networks, expanding enterprise offerings, and competing in emerging markets has big revenue potential — with OneWeb having an already established LEO network of 630 satellites and Eutelsat offering 36 GEO satellites. Of note, OneWeb recently inked a deal with Telstra in Australia to provide satellite backhaul for locations “where satellite backhaul is a preferred or only viable option.” OneWeb is also partnering with the European Space Agency to develop a next-gen 5G beam-hopping satellite, which could quickly increase connectivity for people traveling or for disaster areas that need emergency connectivity. Shareholders are set to vote on approving the merger on Sept. 28.

European Union greenlights multi-orbit constellation

With grand ambitions to launch a multi-orbit, €6 billion constellation in 2024, the European Union is partnering with a consortium of industry players including Airbus, SES, Eutelsat, Hispasat, and Thales to develop the EU’s IRIS² project. The EU still expects to have the first of its satellites go live by the end of 2024 and have a fully operational constellation by 2027.

HughesNet aiming to launch Jupiter 3 array in Q2 2023

HughesNet successfully launched its Jupiter 3 array on July 29, which aims to provide U.S. and Latin America consumers with higher broadband download speeds. While the actual satellite will take some time to reach its geosynchronous orbit and deploy, this satellite adds 500 Gbps of Ka-band capacity for HughesNet, which could see consumers reaching download speeds between 50 Mbps and 100 Mbps. We’ll be eagerly awaiting Speedtest® results from HughesNet’s Jupiter 3 array.

Ookla will continue monitoring new satellite internet developments

2023 continues to be an important year for satellite internet providers. Satellite connectivity is something we’ll be watching closely and we’ll continue our series next quarter with Q3 2023 data from select continents including North America. In the meantime, be sure to download the Speedtest app for Windows and Mac computers or for iOS or Android for devices and see how your satellite internet stacks up to our results.

Ookla retains ownership of this article including all of the intellectual property rights, data, content graphs and analysis. This article may not be quoted, reproduced, distributed or published for any commercial purpose without prior consent. Members of the press and others using the findings in this article for non-commercial purposes are welcome to publicly share and link to report information with attribution to Ookla.

| February 17, 2021

ICYMI: Ookla Data and Research from January 2021


Highlights from the Speedtest Global IndexTM

Global-Index-Tweet-Image-January-2021-2
These are the top stories from January 2021:

  • Spain climbed five ranks and reached ninth place on fixed broadband. This is the first time the country has reached the top ten.
  • On mobile, the United Arab Emirates is in first place for the fifth time in 13 months.
  • Greece climbed to 29th place, most likely due to an expanding 5G market.
  • Denmark reached fifth place for fixed broadband for the first time in the last year.

Articles worth a second look

Introducing Video Testing from Speedtest

Video streaming is a crucial part of the internet experience. Now you can directly measure your video’s quality using Speedtest for iOS.

Emerging 5G Market Keeps Canada in the Global Top 10 for Mobile Speeds

Canada’s 5G market may be less than a year old, but its expansion has provided provinces and cities across the country with speeds that far exceed those over 4G.

Advances in 5G Boosts Mobile Speeds in Taiwan

This comprehensive report on Taiwan’s mobile speeds shows the impact 5G has had on the market — and how speeds vary by operator and across the country.

Illustrating the Worldwide Growth of 5G (Poster Download)

This poster illustrates the impact of 5G on network performance worldwide using data from Speedtest Intelligence®. Download the free poster to see the full picture of the industry’s achievements.

New Year, Great Data: The Best Ookla Open Data Projects We’ve Seen So Far

Read more about the most exciting open data projects from Ookla For GoodTM that really show what this data can do.

“There’s a Problem With Your Connection” — The Most Significant Outages of Q4 2020

Did you experience an online service outage during Q4 2020? Find out what online service outages made headlines during the last three months of 2020.
Upcoming webinars

Upcoming webinars

Using Crowdsourced Data for Competitive Network Intelligence in Latin America

In the upcoming Ookla® webinar, offered in both Portuguese and Spanish, we share how mobile operators in Latin America can monitor and benchmark their competitors’ performance and also prioritize network optimization in the areas most important to their customers.

pr-cta1
Wednesday, February 24 at 11 a.m. BRT

es-cta1
Thursday, February 25 at 9 a.m. CST (10 a.m. EST/PET/COT)

Ookla retains ownership of this article including all of the intellectual property rights, data, content graphs and analysis. This article may not be quoted, reproduced, distributed or published for any commercial purpose without prior consent. Members of the press and others using the findings in this article for non-commercial purposes are welcome to publicly share and link to report information with attribution to Ookla.

| May 25, 2021

ICYMI: Ookla Data and Research from April 2021

Highlights from the Speedtest Global Index™

Global-Index-Tweet-Image-April-2021

These are the top stories from April 2021:

  • Greece is up 11 places to 17th on mobile, their highest rank to date.
  • Increased 5G coverage in the United Kingdom was likely a factor in moving up 11 places on mobile to 21st place in April, a record high for the country.
  • South Korea blazed forward 10 spots to second place for fixed broadband.
  • Japan rose four spots to 20th for fixed broadband, the country’s highest rank since July 2020.

Other items worth a second look

Starlink: Bridging the Digital Divide or Shooting for the Stars

starlink-q2-2021
Elon Musk’s Starlink could be a game changer for many rural communities, but is it delivering high speeds? Read more to learn about how Starlink is shooting to be an internet superstar.

World Telecom Day Is a Reminder that a Better, Faster and More Accessible Internet Is Possible

world-telecom-day
Details on how Ookla® collaborates with providers, regulators and researchers to help create a better, faster and more accessible internet for everyone.

Choose Your National Park Adventure: The Best Places to Work Remotely or Digitally Disconnect

national-parks
Find out which national parks in Canada and the U.S. have the fastest mobile speeds, best 4G Availability and access to 5G.

How Ookla Ensures Accurate, Reliable Data: A Guide to Our Metrics and Methodology (Updated for 2021)

methodology-2021
Learn about the metrics Ookla uses to describe mobile and fixed broadband network performance and mobile coverage and how Ookla aggregates data.

5G Speeds in Australia are Almost Twice the Global Average

australia-5g-2021
The race for Australia’s fastest 5G provider is competitive. Learn why Australia’s 5G networks are some of the fastest in the world.

How Etisalat Went from Regional Leader to the World’s Fastest Mobile Network Operator in 2020 (Case Study)

etisalat-2021
Learn how Etisalat used Ookla Speedtest data to become the world’s fastest mobile network operator.

Prevalent and Fast Wi-Fi in Thailand Drives Improvements in Internet Speeds

thailand-wifi
Discover new details about the influence of Wi-Fi in Thailand including provider- and province-level data on speeds and improvement.

Cryptocurrency Volatility Causes Coinbase and Other Trading Platforms to Struggle with Outages

crypto-crash
Find out what the Coinbase outage on May 19 looked like based on data from Downdetector®.

Ookla 5G Map

5g-map
Over the past month, we saw 20,097 new 5G deployments across 106 countries. Click here to see the Ookla 5G Map in your area..

Ookla retains ownership of this article including all of the intellectual property rights, data, content graphs and analysis. This article may not be quoted, reproduced, distributed or published for any commercial purpose without prior consent. Members of the press and others using the findings in this article for non-commercial purposes are welcome to publicly share and link to report information with attribution to Ookla.

| January 17, 2024

Enhancing Disaster Recovery and Network Resilience: Insights and Best Practices

Ookla® recently hosted a webinar titled “Disaster Recovery: Restoring Connectivity and Ensuring Network Resiliency, a discussion on network preparedness in the face of disasters.” The discussion focused on how networks can prepare for disasters. A panel of industry experts from the GSMA, OECD, and The World Bank shared examples of real-world disaster recovery efforts. Below, we have summarized the key takeaways from the discussion.

Impact of Disasters on Networks

Pooja Rana from Ookla provided an example of how networks were affected during a disaster and how operators can facilitate a faster recovery. Specifically, she shared insight into the Maui wildfire that began in the city of Lahaina, located in Maui County, Hawaii, on August 8th, 2023. More information can be found here.

Graphic of threat scenarios that are abundant and increasing - Natural Disaster, Technological & Industrial Disasters, Human Made Disasters, Humanitarian Crises, Health Emergencies, Climate Change

Natural disasters can strike anywhere and are just one example of the potential threats affecting society. Other threats include technological and industrial disasters, human-made ones, humanitarian crises, health emergencies, and climate change. In areas like Maui, where the impact of climate change is particularly felt, additional natural disasters can significantly affect critical mobile networks, making disaster relief planning and management especially challenging. Crowdsourced data, such as that provided by Ookla, can be invaluable in disaster management, helping communities to move towards proactive prevention and preparedness rather than reactive responses. This data can also aid in disaster risk management and increase the effectiveness of relief efforts. 

Network Resilience Prioritization

Inmaculada Cava-Ferreruela from the OECD (Organisation for Economic Co-operation and Development) discussed the topic of network resilience from the perspective of policymaking. Network resilience is high on the agenda of OECD countries. This is because communications networks underpin our digital economies and societies. Therefore, when these networks become unstable or fail, the consequences for businesses, citizens, and governments can be severe, depending on the extent of the disruption. While implementing these measures is the responsibility of network operators, the critical nature of communications services in our economies and societies leads governments to intervene to ensure that networks are resilient enough. In this context, the OECD is preparing a new report to help policymakers assess network resilience and develop policies and practices that promote its improvement. Following the OECD’s evidence-based policy-making approach, the report will bring together information on the definition of network resilience and its metrics, its implementation, including technical and organizational measures, and insights into policy initiatives to improve it.

Role of mobile in humanitarian response

Bryce Hartley from the GSMA discussed the role of the Humanitarian Connectivity Charter (HCC) in engaging the mobile industry for humanitarian responses, particularly in rapid-onset disasters. The three key principles of the HCC are coordination, scale, and partnerships. 

  • Coordination: The focus is on coordinating efforts across all phases of disaster management—preparedness, response, and recovery. The aim is to create awareness among stakeholders, including multilateral, governments, and private sector players, about available resources and needs to avoid duplication of efforts and leveraging resources collaboratively. Bryce provided an example of coordinating efforts in response to earthquakes in Turkey and Syria, where critical supplies were efficiently provided to restore mobile networks.
  • Scale: The emphasis is on deploying mobile technology to scale disaster resilience efforts. Standardizing response processes ensures a more predictable and effective response for responders and affected populations. The idea is to streamline efforts and create a more robust and scalable system. 
  • Partnerships: The goal is to foster collaboration to achieve programmatic initiatives. Working together is seen as essential for successful outcomes. An example is the collaboration with the Digicel Group and the Civil Protection Agency of Haiti to develop a mobile-enabled early warning system.

Critical role of Internet connectivity

Sahiti Sarva from the Data Lab at the World Bank emphasized the role of internet connectivity and data associated with it in measuring the impact of and recovery from disasters. Internet infrastructure is critical in enabling citizens to access economic opportunities and relief during disasters. The loss of the internet has significant cascading impacts on access to aid and inhibits economic activity that uses the Internet (such as activity on social media). Therefore, international development organizations such as the World Bank have started using it in their analysis to observe economic recovery from disasters. For the Türkiye earthquake impact analysis, the Data Lab team used Meta Business Activity Trends and Ookla Speedtest connectivity data to observe economic recovery trends. In this case, the availability of the internet informs the Business Activity of Facebook, making the two indicators valuable when insights are combined. 

The Data Lab created a “Data Good,” comprising reproducible methods, code documentation, and insights to inform analyses like economic recovery from disasters. Unlike traditional reports or data analyses that provide single-use visualizations, data goods are designed for reuse in future projects. If new data sets become available, they can easily be added to the analysis to generate updated insights. This is particularly useful in disaster projects where new data comes in daily, and the situation on the ground changes fast. For instance, in the case of Turkey and Syria, the Data Lab was able to update their insights every week, thanks to weekly data made available from their partners like Ookla.

Data visualization for effective disaster response 

The Disaster Connectivity Maps (DCM) initiative involves collaboration between the GSMA, UN agencies (ITU and WFP), and Ookla. DCM is a tool used to identify communication gaps during disasters, aiding first responders in preparing and adapting their communication strategies. Insights from time series data help organizations learn from past crises, adapt for future preparedness, and incorporate lessons for more effective response efforts.

We asked the panel audience about the role of mobile in disaster resilience, and the word cloud answer highlighted the key roles of coordination, communication, emergency services, and backup plans.

During the discussion, the participants stressed that collaboration, preparedness, and data utilization are crucial to enhance disaster relief efforts and ensure network resilience. Policymakers, industry experts, and international organizations play vital roles in developing evidence-based policies to address the complexities of disasters. Ookla is committed to working with the broader mobile ecosystem to ensure that these objectives are achieved.

List of how Ookla data helps with understanding and preparing for disasters using Cell Analytics, Speedtest Intelligence, and Downdetector Enterprise.

Additional resources:

See the full webinar recording here.

Ookla retains ownership of this article including all of the intellectual property rights, data, content graphs and analysis. This article may not be quoted, reproduced, distributed or published for any commercial purpose without prior consent. Members of the press and others using the findings in this article for non-commercial purposes are welcome to publicly share and link to report information with attribution to Ookla.

| January 15, 2024

Fixed Internet Speeds are Improving in North Africa, and Fiber Could Boost Them Even Further

Français

Since 2020, fixed broadband speeds in North Africa have improved substantially. However, there is still potential for further enhancement and adoption. This article explores the performance drivers of fixed wired internet performance (excluding fixed wireless access (FWA)) in Algeria, Egypt, Morocco, and Tunisia between Q3 2020 and Q3 2023 and discusses the market prospects.

Key takeaways

  • Egypt leads North Africa in the Ookla Speedtest Global Index™ for fixed broadband in Q3 2023. Egypt widened its lead in North Africa, achieving a median download speed of 56.61 Mbps and an upload speed of 25.07 Mbps. Meanwhile, Algeria saw a significant improvement in median fixed broadband download speed, with a 4.5-fold increase to 11.34 Mbps between Q3 2020 and Q3 2023. Morocco’s upload speed has also significantly improved, rising more than 22-fold to 19.09 Mbps during that period.
  • North African countries adopted different DSL migration strategies. Egypt upgraded most of its ADSL to VDSL and concentrated FTTH/B in greenfield areas. On the other hand, Algeria focused on replacing copper lines with FTTH/B, while Morocco and Tunisia deployed VDSL in tandem with FTTH/B rollout.
  • Fiber upgrades and revised broadband packages help to boost speed. The deployment and adoption of FTTH/B do not necessarily lead to increased broadband speed. ISPs should consider increasing headline speeds of entry-level packages and offering discounts on higher-speed tiers to incentivize customers to upgrade.

Egypt tops North Africa in download and upload speeds for fixed broadband

In our June 2021 report on internet speed in North Africa, Egypt ranked first in North Africa for fixed broadband, followed by Morocco, Algeria, and Tunisia. All countries, except Tunisia, saw more than a 25% improvement in median broadband speeds from Q2 2020 to Q1 2021, with Algeria more than doubling its median broadband download speed.

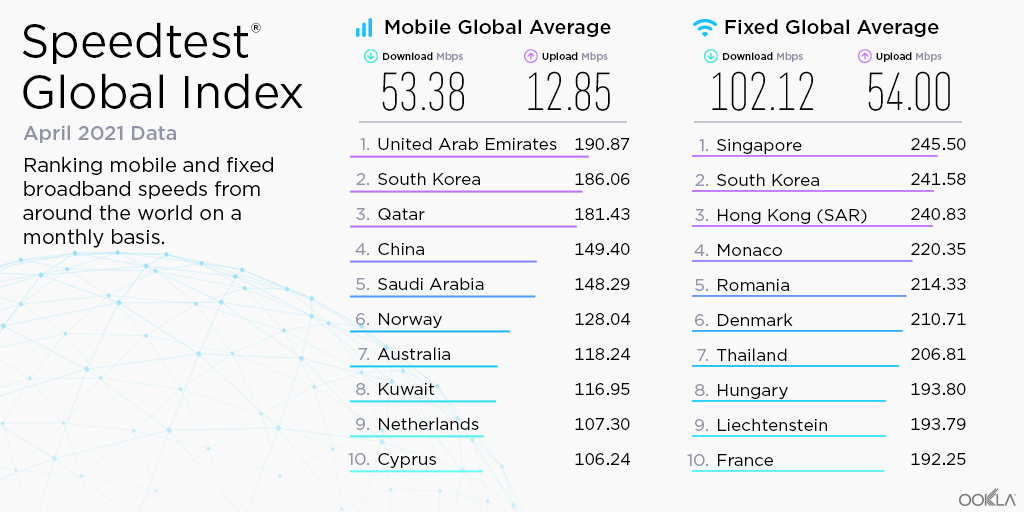
This upward trend continued through Q3 2023, with most North African countries improving their median download and upload speeds over fixed broadband. This has resulted in a boost in their ranking in the Ookla Speedtest Global Index. Notably, Egypt extended its lead within North Africa, achieving a median download speed of 56.61 Mbps and a median upload speed of 25.07 Mbps.

Algeria showed a substantial improvement in median fixed broadband download speed between Q3 2020 and Q3 2023, increasing 4.5-fold to 11.34 Mbps. Other countries, except Tunisia, saw their median fixed broadband download speeds more than double over the same period.

Median Download Speed for Wired Fixed Broadband, Select African Countries
Speedtest Intelligence, Q3 2020 and Q3 2023

Morocco saw a significant rise in median upload speed, with a more than 22-fold increase to 19.09 Mbps in Q3 2023. Despite this, it still lags behind South Africa, the African leader, which boasts more than double the upload speed at 38.53 Mbps. The other North African countries saw more modest improvements in upload speeds, ranging from a 1.5-fold increase in Algeria to a 2.5-fold increase in Tunisia.

Median Upload Speed for Wired Fixed Broadband, Select African Countries
Speedtest Intelligence, Q3 2020 and Q3 2023

DSL and wireless access are the most common technologies used for fixed broadband services in North Africa

Digital Subscriber Line (DSL) is the leading technology for fixed broadband services in North Africa, as they use existing phone lines for internet connectivity. The two main types of DSL are Asymmetric Digital Subscriber Line (ADSL) with speeds of up to 24 Mbps and Very high-speed Digital Subscriber Line (VDSL) offering speeds of up to  52 Mbps for VDSL1 and 200 Mbps for VDSL2. The latter can be further enhanced with G.Fast technology.

VDSL employs fiber that terminates at a nearby cabinet, a configuration often referred to as Fiber-to-the-Cabinet (FTTC). The ‘last mile’ connection to users’ premises then uses existing copper lines. FTTC typically serves as a transitional step towards Fiber-to-the-Home/Building (FTTH/B), where the fiber extends directly to the user’s location premises.

In countries like Algeria and Tunisia, mobile broadband and FWA services that use 3G and 4G technologies account for almost 30% of all fixed broadband connections. However, these cellular connections are less prevalent in Morocco and Egypt. 4G offers download speeds comparable to ADSL and VDSL1 but falls short of VDSL2 and FTTH/B.

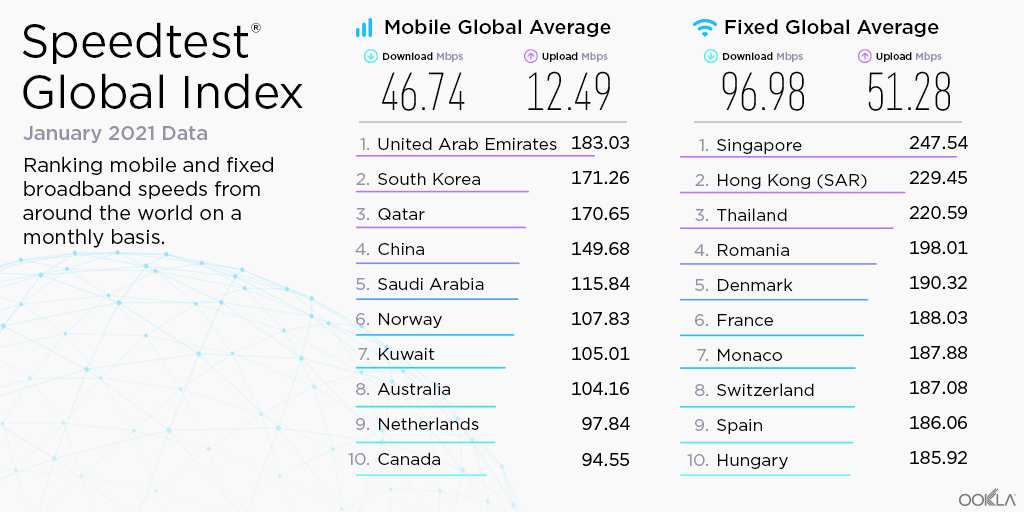
North Africa lags behind the Gulf region in fiber coverage, adoption, and internet speed. Ambitious fiber development plans placed Bahrain, Kuwait, Oman, Qatar, Saudi Arabia, and the U.A.E. high on the global speed leaderboard. For example, in Q3 2023, the U.A.E. ranked fourth on the Speedtest Global Index™ with a median download speed of 231.98 Mbps. Kuwait ranked twenty-second, and Qatar twenty-third. Other Gulf countries trailed the U.A.E. but were ahead of all markets in North Africa.

Fixed internet speeds are still relatively low in North Africa despite significant improvements in FTTH/B access

The slow pace of fiber deployment compared to the Gulf countries can be attributed to factors such as limited public funding, restrictive telecom regulations, scant private investments, as well as geographical and urbanization challenges. Most North African countries also have a larger land mass, more varied geology, and a lower level of urbanization, making fiber deployment more complex and costly.

The market’s competitive landscape is also a factor, with incumbents controlling over 80% of fixed internet subscriptions. Even in Tunisia, which boasts more alternative ISPs, Tunisie Telecom holds the majority of DSL and fiber subscriptions. By contrast, alternative network providers play a key role in accelerating fiber adoption in Europe. Furthermore, North Africans have a lower income than Gulf residents, and most cannot afford high-speed broadband services because of their high costs.

Market challenges delayed fiber deployment and limited service adoption and innovation. However, local ISPs have made significant progress since 2020 in upgrading the fixed infrastructure and making their services more affordable. Egypt has primarily upgraded its ADSL to VDSL and focused FTTH/B deployments in greenfield areas. Algeria concentrated on replacing copper lines with FTTH/B while Morocco and Tunisia deployed VDSL while also progressing with FTTH/B rollout.

As of June 2023, Algeria has the highest number of FTTH/B connections in North Africa, totaling 800,000. Morocco follows closely with 730,000 connections and boasts the largest fiber share of the wired broadband market (see chart below). Egypt has the highest number of VDSL connections in the region, and an estimated few hundred thousand active FTTH/B customers as of September 2023. Tunisia is in fourth position with 55,000 FTTH/B connections and 176,000 VDSL connections.

In the following sections, we provide an overview of the fixed broadband market in Algeria, Egypt, Morocco, and Tunisia. We highlight the status of fiber rollout, and its impact on network performance, and discuss ISPs’ future deployment plans.

FTTH/B Connections, Algeria, Morocco and Tunisia
Telecoms Regulators, ISPs | 2019-Q2 2023

FTTH/B Connections and Share of Fixed Wired Connections, Algeria, Morocco and Tunisia
Telecoms Regulators, ISPs | 2019-Q2 2023

Significant progress achieved in fiber coverage in Algeria but room to drive adoption and boost speed

As of March 2023, Algeria boasted over 3.4 million fixed wired connections, according to the Autorité de Régulation de la Poste et des Communications Electroniques (ARPCE). The state-owned Algerie Telecom (AT) is the sole provider of wired broadband services. With an additional 1.5 million 4G FWA connections, Algeria is among Africa’s largest fixed broadband markets.

AT prioritized the replacement of copper lines with fiber in major cities while maintaining its ADSL services. It also used 4G FWA technology to service areas where wired infrastructure is unavailable or costly to deploy. AT was late to the game but it rapidly expanded FTTH/B services since their introduction in 2018. It also increased maximum speeds on fiber from 100 Mbps to 300 Mbps for consumers in 2023. AT introduced regular promotions, such as free speed doubling for new customers. It has also reduced tariffs every year since 2020, with a 100 Mbps fiber line costing $22/month in 2023. These actions contributed to the surge in the number of fiber subscribers by nearly 14-fold between 2020 and November 2023, reaching the 1 million milestone, making Algeria one of the largest FTTH/B markets in Africa.

Fixed Broadband Connections by Technology, Algeria
ARPCE | 2019-Q1 2023

The migration from ADSL to FTTH has undoubtedly improved the quality of service for consumers. However, it has yet to boost the speed that most households experience. While the download speed of the fastest 10% samples increased from 8.01 Mbps in Q3 2020 to 45.71 Mbps in Q3 2023, the median download speed only reached 11.34 Mbps during that period, according to Ookla Speedtest Intelligence® data.

According to the ARPCE, more than 85% of connections had a download speed of 10 Mbps in March 2023. To improve the country’s median download speed, AT should increase the speed of its entry-level fiber package from the current 10-15 Mbps. It should also work towards lowering the price of its higher-speed packages. The government proposed to exempt fixed broadband services from VAT in 2024, which should help make it more affordable for customers to upgrade to higher-speed packages.

AT has set ambitious goals to expand its fiber coverage substantially. The number of households passed by fiber (i.e. premises that can connect to the fiber network) is expected to increase from 3.5 million in 2022 to 6 million by 2024 (out of an estimated 7.4 million households). This is part of the government’s broader strategy to provide two-thirds of households with fixed broadband service by 2024, potentially adding 2 million new subscribers to the market.

Rapid network performance improvement in Egypt thanks to the incumbent’s ambitious FTTC strategy

With nearly 11 million subscribers at the end of 2022, Egypt is North Africa’s biggest fixed broadband telecoms market. State-owned Telecom Egypt (TE) dominates the sector, controlling over 80.1% of the market with over 8.7 million fixed broadband subscribers.

Other operators such as Vodafone, Orange, and Etisalat by e&, offer broadband services through wholesale access to TE’s network. This allows them to provide comparable broadband speeds. Notably, the combined market share of these alternative ISPs has been on an upward trend year-on-year since 2019.

TE’s strategic focus has been to develop its core and transmission networks, upgrade ADSL to VDSL, and expand fiber to the street cabinets. As of September 2023, TE connected 95% of households to the next-generation FTTC network (up from 85% in 2019).

The introduction of VDSL services in Egypt in 2018 marked a significant shift in broadband speeds, raising the maximum from 16 Mbps to 100 Mbps. TE took this opportunity to increase the speed of its entry-level plan from 5 Mbps to 30 Mbps, with a modest price increase of 9%. Infrastructure upgrades also positively impacted alternative ISPs that boosted their broadband packages’ speeds.

These improvements in VDSL coverage, speeds, and affordability significantly accelerated the adoption of broadband services. The number of fixed broadband subscribers surged by 55% from the end of 2019 to June 2023. Raising the minimum broadband speed to 30 Mbps led to a substantial increase in the country’s median download speed to 56.61 Mbps in Q3 2023, up from 25.07 Mbps in Q3 2020, according to Ookla Speedtest Intelligence. Given that TE currently offers speeds of up to 150 Mbps, there’s ample opportunity to enhance download speeds further.

Fixed Broadband Connections by ISP, Egypt
Telecom Egypt | 2019-Q2 2023

TE launched FTTH/B services in 2009, making Egypt among the early adopters of fiber in the region. It prioritized FTTH/B deployments in greenfield areas such as new developments, gated communities, and residential compounds. TE aims to eventually migrate existing VDSL customers to FTTH/B.

The government allocated a $360 million budget in 2021 to extend Fiber-To-The-Home (FTTH) to a million households to improve fiber accessibility. The development of ‘New Cairo,’ a new mega-city located 35 km east of the Capital, is also expected to spur demand for fiber services.

The competitive fiber market in Morocco drove broadband adoption and speed improvements

Maroc Telecom (MT) dominates the fixed broadband market in Morocco. The operator’s control over the copper infrastructure has spurred other ISPs, inwi and Orange, to develop their own fiber infrastructure and lease capacity from local utility and transport companies.

The fixed wired broadband market has been expanding rapidly in Morocco, increasing from just over 1.6 million in 2019 to over 2.2 million connections in June 2023 (out of around 8 million households). This growth is mainly due to a shift from DSL to FTTH/B since 2020, as observed in the chart below.

Fixed Broadband Connections by Technology, Morocco
ANRT | 2019-Q2 2023

Consumers have been leaning toward faster and more reliable services, with demand for DSL connections falling since 2020 and FWA adoption decreasing since 2022. MT launched fiber in 2014 as a premium service with speeds of 100 Mbps and 200 Mbps. In 2022, MT accelerated the deployment of its FTTH/B network and increased network capacity by 40% year-on-year in June 2023, helping to expand its fiber customer base by 43%.

inwi and Orange introduced their fiber services in 2018, offering a broader range of speeds starting from 20 Mbps and lower price points than MT at the high end. These services are available in big cities like Casablanca, Rabat, and Fez. They accounted collectively for 52.69% of the fiber market in June 2023 which shows that the segment is quite competitive in Morocco.

This has resulted in a boost to user-end speeds. As of Q3 2023, the median download speed of fixed internet services had increased to 21.68 Mbps, up from 9.07 Mbps in Q3 2020, according to Ookla Speedtest Intelligence data. There has been a marked shift to higher-speed broadband packages, as evidenced by the fact that 17.3% of fixed broadband subscribers had speeds of at least 20 Mbps in June 2023, a dramatic increase from only 0.6% in 2019 who had a minimum speed of 16 Mbps, according to the Agence Nationale de Réglementation des Télécommunications (ANRT)

As only around one-third of wired broadband subscribers in Morocco use FTTH/B, there is still an ample opportunity to migrate more DSL customers to fiber and encourage existing fiber users to upgrade to higher-speed packages. This is especially relevant for inwi and Orange as they offer more affordable fiber packages starting at 20 Mbps, compared to MT’s 100 Mbps fiber package which costs around $50/month.

Looking ahead, the Moroccan government has ambitious plans to connect more households to high-speed broadband services under the “Maroc Digital 2030” program. The government aims to connect 5 million households with fiber by 2026, potentially making Morocco one of the largest FTTH/B markets in Africa.

Limited infrastructure sharing and investments in Tunisia constrained speed improvement

Tunisia has the lowest fixed download speeds in North Africa at 8.61 Mbps in Q3 2023, according to Ookla Speedtest Intelligence. This is despite having eight ISPs – compared to one in Algeria, three in Morocco, and five in Egypt. The poor network performance is due to the limited coverage of high-speed broadband services and their unaffordability for many households. For example, a 50 Mbps VDSL line costs more than $26/month. Furthermore, it was not until 2022 that the ISPs lifted the speed of basic DSL packages from 4 Mbps to 10 Mbps

The wired broadband sector has consistently grown, reaching over 1.2 million subscribers by June 2023. This represents a 50% increase from 2019 levels. Interestingly, this growth rate outpaced that of the 4G fixed wireless access segment, which only saw a 27.4% increase, reaching just over 470,000 connections during the same period. On the other hand, fiber service remains a niche offering due to its limited coverage and high cost. Fiber share of the fixed wired broadband market saw a minor increase, rising from 3.0% in 2019 to a modest 4.5% in June 2023.

Fixed Broadband Connections by Technology, Tunisia
INT | 2019-Q2 2023

Tunisie Telecom (TT), a state-owned entity, holds the majority stake in the fixed broadband sector. TT controls the national copper infrastructure, operates the nationwide fiber-optic backbone, and competes both directly and indirectly in the retail market via its subsidiary, Topnet. Ownership of TT is divided between the Tunisian state (at 65%) and Emirates International Telecommunications (EIT, at 35%).

TT maintains a strong position within this sector, controlling 72.9% of all fiber connections in Tunisia by June 2023. This figure includes direct customers (39.1%) and those provided through Topnet (33.8%). Fiber services, which were launched in 2012, are only available in Greater Tunis and Sfax. Additionally, TT dominates the VDSL market with a substantial 92.4% market share, mostly through Topnet.

Regulatory pressure from the telecom authority INT (Instance Nationale des Telecommunications) has urged TT to reduce its network access charges and expedite line activation to help other ISPs. Despite these efforts, various challenges persist, prompting operators such as Ooredoo and Orange to supplement their wired offerings with mobile broadband services based on 3G and 4G, in addition to TD-LTE-based FWA.

Ooredoo, which introduced fiber services in 2013, saw its share of the fiber market rise to 16.8% by June 2023. Its fiber network covers Greater Tunis and Sfax. Orange, however, lacks consumer fiber offerings. Other ISPs, including Bee, GlobalNet, and HexaByte, use a mix of ADSL, VDSL, and FTTH/B by accessing TT’s infrastructure.

In the short term, TT plans to upgrade most DSL ports to VDSL and promote higher-speed packages. This strategy aims to increase the average fixed speed from 10 Mbps in 2022 to 50 Mbps in 2024. Over the medium term, TT aims to expand its FTTH coverage and capacity from 100,000 connections in 2022 to 500,000 by 2025. These initiatives are expected to enhance fiber service accessibility and improve the country’s median download and upload speeds.

Furthermore, the INT initiated a consultation in August 2023 to set the conditions required to share facilities to avoid infrastructure duplication and ensure efficient fiber investments. The proposal is to have all ISPs and infrastructure operators provide shared access to their telecom facilities after 12 months of commercial operations. This initiative should help expand fiber coverage, reduce access costs, and support the development of 5G.

Fiber can further unlock the connectivity potential in North Africa

As discussed above, North African ISPs have adopted various strategies to roll out fiber and promote its take-up. They have made considerable strides in enhancing fiber accessibility and fixed broadband speed since 2020. However, a significant gap remains when compared to more advanced markets in the Middle East and Africa.

To bridge this gap, it is essential to facilitate fiber investment through public-private partnerships, promote infrastructure sharing, encourage competition, provide robust regulatory frameworks, and increase international bandwidth. Such initiatives will make high-speed broadband services more affordable and accessible, which is integral to advancing national digital transformation and boosting economic growth.

Ookla has been working with ISPs, such as Bahrain Network (BNET) and telecoms regulators, to support their national broadband plans, track improvements to fiber connectivity and coverage, and promote their networks to consumers. If you are interested in Ookla’s solutions and services for network intelligence and management, get in touch.


La Vitesse de l’Internet Fixe s’Améliore en Afrique du Nord, et la Fibre Pourrait l’Augmenter Encore d’Avantage

English

Depuis 2020, les débits du haut débit fixe en Afrique du Nord se sont considérablement améliorés. Cependant, il existe encore un potentiel d’amélioration et d’adoption. Cet article s’intéresse aux facteurs de performance de l’Internet fixe filaire (hors accès fixe sans fil (FWA)) en Algérie, en Égypte, au Maroc et en Tunisie, entre le troisième trimestre 2020 et le troisième trimestre 2023 et discute des perspectives du marché.

À retenir

  • L’Égypte est en tête de l’Afrique du Nord dans le Speedtest Global Index™ pour le haut débit fixe au troisième trimestre 2023. L’Égypte a élargi son avance en Afrique du Nord, atteignant une valeur médiane du débit descendant de 56,61 Mbps et celle du débit ascendant de 25,07 Mbps. Parallèlement, l’Algérie a connu une amélioration significative du débit descendant sur le fixe, avec une multiplication par 4,5 pour atteindre 11,34 Mbps entre le troisième trimestre 2020 et le troisième trimestre 2023. Le débit ascendant au Maroc s’est également considérablement amélioré, multiplié par plus de 22 pour atteindre 19,09 Mbps au cours de cette période.
  • Les pays d’Afrique du Nord ont adopté différentes stratégies de migration DSL. L’Égypte a mis à niveau la plupart de son ADSL vers le VDSL et a concentré le FTTH/B pour le déploiement .dans de nouvelles zones. D’autre part, l’Algérie s’est concentrée sur le remplacement des lignes de cuivre par du FTTH/B, tandis que le Maroc et la Tunisie ont déployé le VDSL parallèlement au déploiement du FTTH/B.
  • Les mises à niveau de la fibre optique et les forfaits haut débit révisés contribuent à augmenter la vitesse. Le déploiement du FTTH/B et son adoption ne conduisent pas nécessairement à une augmentation de la vitesse de haut débit. Les FAI devraient envisager d’augmenter les vitesses de pointe des forfaits d’entrée de gamme et d’offrir des réductions sur les niveaux de vitesse plus élevés pour inciter les clients à améliorer leur forfait.

L’Égypte est en tête de l’Afrique du Nord en termes de débit descendant et ascendant pour le haut débit fixe

Dans notre rapport de juin 2021 sur le débit Internet en Afrique du Nord, l’Égypte se classe au premier rang en Afrique du Nord pour le haut débit fixe, suivie du Maroc, de l’Algérie et de la Tunisie. Tous les pays, à l’exception de la Tunisie, ont connu une amélioration de plus de 25 % des valeurs médianes du débit descendant entre le deuxième trimestre 2020 et le premier trimestre 2021, l’Algérie ayant plus que doublé sa valeur médiane du débit descendant.

Cette tendance à la hausse s’est poursuivie jusqu’au troisième trimestre 2023, la plupart des pays d’Afrique du Nord améliorant leurs valeurs médianes médianes du débit descendant et ascendant sur le haut débit fixe. Cela a permis d’améliorer leur classement dans l’Ookla Speedtest Global Index™. L’Égypte a notamment accru son avance en Afrique du Nord, atteignant une valeur médiane du débit descendant de 56,61 Mbps et une valeur médiane du débit ascendant de 25,07 Mbps.

L’Algérie a enregistré une amélioration substantielle de la valeur médiane du débit descendant sur le fixe entre le troisième trimestre 2020 et le troisième trimestre 2023, augmentant de 4,5 fois à 11,34 Mbps. D’autres pays, à l’exception de la Tunisie, ont vu leurs valeurs médianes du débit descendant sur le fixe plus que doubler au cours de la même période.

Valeur Médiane du Débit Descendant sur le Fixe Filaire dans Certains Pays Africains
Speedtest Intelligence, T3 2020 and T3 2023

Le Maroc a connu une augmentation significative de la valeur médiane du débit ascendant, avec une multiplication par plus de 22 pour atteindre 19,09 Mbps au troisième trimestre 2023. Malgré cela, il reste à la traîne de l’Afrique du Sud, le leader africain, qui affiche plus du double du débit ascendant, à 38,53 Mbps. Les autres pays d’Afrique du Nord ont connu des améliorations plus modestes du débit ascendant, allant d’une multiplication par 1,5 en Algérie à une multiplication par 2,5 en Tunisie.

Valeur Médiane du Débit Ascendant sur le Fixe Filaire dans Certains Pays Africains
Speedtest Intelligence, T3 2020 et T3 2023

L’accès DSL et sans fil sont les technologies les plus couramment utilisées pour les services de haut débit fixe en Afrique du Nord.

La ligne d’abonné numérique (DSL) est la principale technologie pour les services fixes à haut débit en Afrique du Nord, exploitant les lignes téléphoniques existantes pour la connectivité Internet. Les deux principaux types de DSL sont la ligne d’abonné numérique asymétrique (ADSL) avec des vitesses allant jusqu’à 24 Mbps et la ligne d’abonné numérique à très haut débit (VDSL) offrant des vitesses allant jusqu’à 52 Mbps pour le VDSL1 et 200 Mbps pour le VDSL2. Cette dernière peut être encore améliorée grâce à la technologie G.Fast.

Le VDSL utilise une fibre optique qui se termine à une armoire à proximité, une configuration souvent appelée Fiber-to-the-Cabinet (FTTC). La connexion du « dernier mile » vers les locaux des utilisateurs utilise ensuite les lignes de cuivre existantes. Le FTTC sert généralement d’étape de transition vers la fibre jusqu’au domicile/bâtiment (FTTH/B), où la fibre s’étend directement jusqu’aux locaux de l’utilisateur.

En Algérie et la Tunisie, les services haut débit mobile et FWA qui utilisent les technologies 3G et 4G représentent près de 30 % de toutes les connexions haut débit fixes. Toutefois, ces connexions cellulaires sont moins répandues au Maroc et en Égypte. La 4G offre des débits descendants comparables à l’ADSL et au VDSL1 mais inférieures au VDSL2 et au FTTH/B.

L’Afrique du Nord est à la traîne par rapport à la région du Golfe en termes de couverture, d’adoption et de vitesse Internet de la fibre optique. Des plans ambitieux de développement de la fibre optique ont placé le Bahreïn, le Koweït, Oman, le Qatar, l’Arabie saoudite et les Émirats arabes unis en tête du classement mondial de vitesse. Par exemple, au troisième trimestre 2023, les Émirats arabes unis, classés quatrièmes dans le Speedtest Global Index™ avec une valeur médiane du débit descendant de 231,98 Mbps. Le Koweït s’est classé vingt-deuxième et le Qatar vingt-troisième. Les autres pays du Golfe sont à la traîne des Émirats arabes unis, mais étaient en avance sur tous les marchés d’Afrique du Nord.

Les débits Internet fixes restent relativement faibles en Afrique du Nord malgré des améliorations significatives de l’accès FTTH/B

La lenteur du déploiement de la fibre optique par rapport aux pays du Golfe peut être attribuée à des facteurs tels qu’un financement public limité, des réglementations restrictives en matière de télécommunications, des investissements privés limités, ainsi que des défis géographiques et d’urbanisation. La plupart des pays d’Afrique du Nord ont également une plus grande superficie terrestre, une géologie plus variée et un niveau d’urbanisation plus faible, ce qui rend le déploiement de la fibre optique plus complexe et plus coûteux.

Le paysage concurrentiel du marché joue également un rôle, les opérateurs historiques contrôlant plus de 80 % des abonnements Internet fixes. Même en Tunisie, qui compte davantage de FAI alternatifs, Tunisie Télécom détient la majorité des abonnements DSL et fibre. En revanche, les fournisseurs de réseaux alternatifs jouent un rôle clé dans l’accélération de l’adoption de la fibre optique en Europe. En outre, les Nord-Africains ont un revenu inférieur à celui des résidents du Golfe, et la plupart ne peuvent pas se permettre les services à haut débit en raison de leurs coûts élevés.

Les défis du marché ont retardé le déploiement de la fibre et limité l’adoption et l’innovation des services. Cependant, les FAI locaux ont réalisé des progrès significatifs depuis 2020 en modernisant l’infrastructure fixe et en rendant leurs services plus abordables. L’Égypte a principalement mis à niveau son ADSL vers le VDSL et concentré les déploiements FTTH/B dans les zones en friche. Pendant ce temps, l’Algérie s’est concentrée sur le remplacement des lignes de cuivre par du FTTH/B. Le Maroc et la Tunisie ont déployé le VDSL tout en progressant dans le déploiement du FTTH/B.

En juin 2023, l’Algérie possède le plus grand nombre de connexions FTTH/B en Afrique du Nord, soit 800 000. Le Maroc suit de près avec 730 000 connexions et possède la plus grande part de fibre sur le marché du haut débit filaire (voir graphique ci-dessous). L’Égypte possède le plus grand nombre de connexions VDSL de la région et comptait quelques centaines de milliers de clients FTTH/B actifs en septembre 2023. La Tunisie occupe la quatrième position avec 55 000 connexions FTTH/B et 176 000 connexions VDSL.

Dans les sections suivantes, nous donnons un aperçu du marché du haut débit fixe en Algérie, en Égypte, au Maroc et en Tunisie. Nous mettons en évidence l’état du déploiement de la fibre optique et son impact sur les performances du réseau, et discutons des futurs plans de déploiement des FAI.

Connexions FTTH/B, Algérie, Maroc et Tunisie
Autorités de régulation des télécommunications, FAI | 2019-T2 2023

Connexions FTTH/B et part des connexions filaires fixes, Algérie, Maroc et Tunisie
Autorités de Régulation des Télécommunications, FAI | 2019-T2 2023

Des progrès significatifs réalisés dans la couverture de la fibre optique en Algérie, mais il reste encore de la marge pour stimuler l’adoption et augmenter la vitesse

En mars 2023, l’Algérie comptait plus de 3,4 millions de connexions filaires fixes, selon l’ Autorité de Régulation de la Poste et des Communications Electroniques (ARPCE). La société publique Algérie Télécom (AT) est l’unique fournisseur de services haut débit filaires. Avec 1,5 million de connexions 4G FWA supplémentaires, l’Algérie figure parmi les plus grands marchés du haut débit fixe d’Afrique.

AT a privilégié le remplacement des lignes de cuivre par de la fibre dans les grandes villes tout en conservant ses services ADSL. Il a également utilisé la technologie 4G FWA pour desservir les zones où l’infrastructure filaire n’est pas disponible ou est coûteuse à déployer. AT a tardé à adopter la technologie, mais a rapidement étendu ses services FTTH/B depuis leur introduction en 2018. Il a également augmenté les vitesses maximales sur la fibre de 100 Mbps à 300 Mbps pour les consommateurs en 2023. AT a introduit des promotions régulières, telles que le doublement de la vitesse gratuit pour les nouveaux clients. Il a également réduit ses tarifs chaque année depuis 2020, avec une ligne fibre 100 Mbps coûtant 22 dollars/mois en 2023. Ces actions ont contribué à multiplier par près de 14 le nombre d’abonnés fibre entre 2020 et novembre 2023, pour atteindre le jalon important d’un million, faisant de l’Algérie l’un des plus grands marchés FTTH/B en Afrique.

Connexions à Haut Débit Fixe par Technologie, Algérie
ARPCE | 2019-T1 2023

La migration de l’ADSL vers le FTTH a sans aucun doute amélioré la qualité de service pour les consommateurs. Cependant, il lui reste encore à augmenter la vitesse que connaissent la plupart des ménages. Alors que le débit descendant des 10 % d’échantillons les plus rapides est passée de 8,01 Mbps au troisième trimestre 2020 à 45,71 Mbps au troisième trimestre 2023, la valeur médiane n’a atteint que 11,34 Mbps au cours de cette période, selon les données d’Ookla Speedtest Intelligence®.

Selon l’ARPCE, plus de 85 % des connexions avaient un débit descendant de 10 Mbps en mars 2023. Pour améliorer le débit descendant du pays, AT devrait augmenter le débit descendant de son forfait fibre d’entrée de gamme, qui est entre 10 et 15 Mbps. Il devrait également s’efforcer de réduire le prix de ses forfaits à vitesse plus élevée. Le gouvernement a proposé d’exonérer de TVA les services à haut débit fixe en 2024, ce qui devrait permettre aux clients de passer à un forfait à vitesse plus élevée plus abordable.

AT s’est fixé des objectifs ambitieux pour étendre considérablement sa couverture fibre. Le nombre de foyers desservis par la fibre (c’est-à-dire de locaux pouvant se connecter au réseau fibre) devrait passer de 3,5 millions en 2022 à 6 millions d’ici 2024 (sur un nombre estimé de 7,4 millions de foyers). Cela fait partie de la stratégie plus large du gouvernement visant à fournir un service haut débit fixe à deux tiers des foyers d’ici 2024, ce qui pourrait ajouter 2 millions de nouveaux abonnés au marché.

Amélioration rapide des performances du réseau en Égypte grâce à la stratégie ambitieuse FTTC de l’opérateur historique

Avec près de 11 millions d’abonnés fin 2022, l’Égypte est le premier marché de télécommunications à haut débit fixe d’Afrique du Nord. La société d’État Telecom Egypt (TE) domine le secteur, contrôlant plus de 80,1 % du marché avec plus de 8,7 millions d’abonnés au haut débit fixe.

D’autres opérateurs tels que Vodafone, Orange et Etisalat by e&, offrent des services haut débit via un accès de gros au réseau de TE. Cela leur permet de fournir des vitesses haut débit comparables. Il convient de noter que la part de marché combinée de ces FAI alternatifs suit une tendance à la hausse d’année en année depuis 2019.

L’objectif stratégique de TE a été de développer ses réseaux centraux et de transmission, de mettre à niveau l’ADSL vers le VDSL et d’étendre la fibre jusqu’aux armoires de rue. En septembre 2023, TE a connecté 95 % des foyers au réseau FTTC de nouvelle génération (contre 85 % en 2019).

L’introduction des services VDSL en Égypte en 2018 a marqué un changement significatif dans les vitesses du haut débit, augmentant le maximum de 16 Mbps à 100 Mbps. TE a aussi augmenté la vitesse de son forfait d’entrée de gamme de 5 Mbps à 30 Mbps, avec une modeste augmentation de prix de 9%. Les mises à niveau des infrastructures ont également eu un impact positif sur les FAI alternatifs, qui ont augmenté les vitesses de leurs forfaits haut débit.

Ces améliorations de la couverture VDSL, des vitesses et du prix abordable ont considérablement accéléré l’adoption des services haut débit. Le nombre d’abonnés au haut débit fixe a bondi de 55% entre fin 2019 et juin 2023. L’augmentation de la vitesse minimale du haut débit à 30 Mbps a entraîné une augmentation substantielle de la valeur médiane du débit descendant du pays, à 56,61 Mbps au troisième trimestre 2023, contre 25,07 Mbps au troisième trimestre 2020, selon Ookla Speedtest Intelligence. Étant donné que TE offre actuellement des vitesses allant jusqu’à 150 Mbps, il existe de nombreuses possibilités d’améliorer encore le débit descendant.

Connexions à Haut Débit Fixe par FAI, Egypte
Telecom Egypt | 2019-T2 2023

TE a lancé les services FTTH/B en 2009, faisant de l’Égypte l’un des premiers utilisateurs de la fibre optique dans la région. Il a donné la priorité aux déploiements FTTH/B dans des zones vierges telles que les nouveaux développements et les complexes résidentiels. TE vise à terme à migrer les clients VDSL existants vers FTTH/B.

Le gouvernement a alloué un budget de 360 millions de dollars en 2021 pour étendre la fibre jusqu’au domicile (FTTH) à un million de foyers afin d’améliorer l’accessibilité à la fibre. Le développement du “Nouveau Caire”, une nouvelle mégapole située à 35 km à l’est de la capitale, devrait également stimuler la demande de services de fibre optique.

Le marché concurrentiel de la fibre optique au Maroc a favorisé l’adoption du haut débit et l’amélioration de la vitesse

Maroc Telecom (MT) domine le marché du haut débit fixe au Maroc. Le contrôle de l’opérateur sur l’infrastructure cuivre a incité d’autres FAI, inwi et Orange, à développer leur propre infrastructure fibre, et louer de la capacité auprès des sociétés de services publics et de transport locales.

Le marché du haut débit fixe filaire connaît une croissance rapide au Maroc, passant d’un peu plus de 1,6 million en 2019 à plus de 2,2 millions de connexions en juin 2023 (sur environ 8 millions de foyers). Cette croissance est principalement due au passage du DSL au FTTH/B depuis 2020, comme on l’observe dans le graphique ci-dessous.

Connexions à Haut Débit Fixe par Technologie, Maroc
ANRT | 2019-T2 2023

Les consommateurs se tournent vers des services plus rapides et plus fiables, avec une demande de connexions DSL en baisse depuis 2020 et une adoption FWA en baisse depuis 2022. MT a lancé la fibre en 2014, offrant un service premium à 100 Mbps et 200 Mbps. En 2022, MT a accéléré le déploiement de son réseau FTTH/B et a augmenté la capacité de son réseau de 40 % sur un an en juin 2023, contribuant ainsi à élargir sa base de clients fibre de 43 %.

inwi et Orange ont lancé leurs services fibre en 2018, offrant une gamme de vitesses plus large à partir de 20 Mbps et des prix inférieurs à ceux de MT pour le haut de gamme. Ces services sont disponibles dans les grandes villes comme Casablanca, Rabat et Fès. Ils représentaient collectivement 52,69 % du marché de la fibre en juin 2023, ce qui montre que le segment est assez compétitif au Maroc.

Cela a entraîné une augmentation des vitesses côté utilisateur. Au troisième trimestre 2023, la valeur médiane du débit descendant des services Internet fixes était passée à 21,68 Mbps, contre 9,07 Mbps au troisième trimestre 2020, selon les données d’Ookla Speedtest Intelligence. Il y a eu une évolution marquée vers les forfaits haut débit fixe de vitesse supérieure, comme en témoigne le fait qu’en juin 2023, 17,3 % des abonnés au haut débit fixe disposaient d’une vitesse d’au moins 20 Mbps, soit une augmentation spectaculaire par rapport à seulement 0,6 % en 2019 qui avaient des vitesses d’au moins 16 Mbps, selon l’Agence Nationale de Réglementation des Télécommunications (ANRT)

Étant donné qu’environ un tiers seulement des abonnés au haut débit filaire au Maroc utilisent le FTTH/B, il existe encore de nombreuses opportunités de migrer davantage de clients DSL vers la fibre et d’encourager les utilisateurs existants de la fibre à passer à des forfaits à plus haut débit. Ceci est particulièrement pertinent pour inwi et Orange, car ils proposent des forfaits fibre plus abordables à partir de 20 Mbps, par rapport au forfait fibre 100 Mbps de MT qui coûte environ 50 $/mois.

Pour l’avenir, le gouvernement marocain a des projets ambitieux pour connecter davantage de foyers aux services à haut débit dans le cadre du programme “Maroc Digital 2030”. Le gouvernement vise à connecter 5 millions de foyers à la fibre optique d’ici 2026, faisant potentiellement du Maroc l’un des plus grands marchés FTTH/B d’Afrique.

Le partage limité des infrastructures et des investissements en Tunisie ont restreint l’amélioration du débit descendant

La Tunisie offre les plus bas débits descendants sur le fixe en Afrique du Nord, soit 8,61 Mbps au troisième trimestre 2023, selon Ookla Speedtest Intelligence. Et ce, malgré le nombre de huit FAI, contre un en Algérie, trois au Maroc et cinq en Égypte. La faible performance du réseau est due à la couverture limitée des services de haut débit à grande vitesse et à leur coût inabordable pour de nombreux foyers. Par exemple, une ligne VDSL à 50 Mbps coûte plus de 26 $/mois. De plus, il a fallu attendre 2022 pour que les FAI augmentent le débit des forfaits DSL de base de 4 Mbps à 10 Mbps.

Le secteur du haut débit filaire n’a cessé de croître, atteignant plus de 1,2 million d’abonnés en juin 2023. Cela représente une augmentation de 50 % par rapport aux niveaux de 2019. Il est intéressant de noter que ce taux de croissance a dépassé celui du segment de l’accès fixe sans fil 4G, qui n’a connu qu’une augmentation de 27,4 %, atteignant un peu plus de 470 000 connexions au cours de la même période. En revanche, le service fibre reste une offre de niche en raison de sa couverture limitée et de son coût élevé. La part de la fibre sur le marché du haut débit filaire fixe a connu une légère augmentation, passant de 3,0 % en 2019 à un modeste 4,5 % en juin 2023.

Connexions à Haut Débit Fixe par Technologie, Tunisie
INT | 2019-T2 2023

Tunisie Telecom (TT), une entité publique, détient la majorité des parts dans le secteur du haut débit fixe. TT contrôle l’infrastructure nationale de cuivre, exploite le réseau dorsal de fibre optique à l’échelle nationale et est en concurrence directe et indirecte sur le marché de détail via sa filiale Topnet. La propriété de TT est répartie entre l’État tunisien (à 65 %) et Emirates International Telecommunications (EIT, à 35 %).

TT maintient une position forte dans ce secteur, contrôlant 72,9 % de toutes les connexions fibre en Tunisie en juin 2023. Ce chiffre comprend les clients directs (39,1 %) et ceux fournis via Topnet (33,8 %). Les services fibre, lancés en 2012, ne sont disponibles que dans le Grand Tunis et à Sfax. De plus, TT domine le marché VDSL avec une part de marché substantielle de 92,4 %, principalement via Topnet.

La pression réglementaire exercée par l’autorité des télécommunications INT (Instance Nationale des Télécommunicationss) a exhorté TT à réduire ses frais d’accès au réseau et accélérer l’activation de la ligne pour aider les autres fournisseurs d’accès Internet (FAI). Malgré ces efforts, divers défis persistent, incitant les opérateurs tels que Ooredoo et Orange à compléter leurs offres filaires avec des services de haut débit mobile basés sur la 3G et la 4G, en plus du FWA basé sur TD-LTE.

Ooredoo, qui a introduit les services fibre en 2013, a vu sa part de marché fibre s’élever à 16,8 % en juin 2023. Son réseau fibre couvre le Grand Tunis et Sfax. Orange manque cependant d’offres fibre grand public. D’autres FAI, notamment Bee, GlobalNet et HexaByte, utilisent un mélange d’ADSL, de VDSL et de FTTH/B en accédant à l’infrastructure de TT.

À court terme, TT prévoit de mettre à niveau la plupart des ports DSL vers le VDSL et de promouvoir des forfaits à plus haut débit. Cette stratégie vise à augmenter le débit fixe moyen de 10 Mbps en 2022 à 50 Mbps en 2024. À moyen terme, TT vise à étendre sa couverture et sa capacité FTTH de 100 000 connexions en 2022 à 500 000 d’ici 2025. Ces initiatives devraient améliorer l’accessibilité du service de fibre optique et améliorer les valeurs médianes des débits descendants et ascendants du pays.

En outre, l’INT a lancé une consultation en août 2023 pour définir les conditions requises pour partager les installations afin d’éviter la duplication des infrastructures et garantir des investissements efficaces dans la fibre. La proposition est que tous les FAI et opérateurs d’infrastructures fournissent un accès partagé à leurs installations de télécommunications après 12 mois d’opérations commerciales. Cette initiative devrait permettre d’étendre la couverture fibre, de réduire les coûts d’accès et de soutenir le développement de la 5G.

La fibre peut libérer davantage le potentiel de connectivité en Afrique du Nord

Comme indiqué ci-dessus, les FAI nord-africains ont adopté diverses stratégies pour déployer la fibre optique et promouvoir son adoption. Ils ont fait des progrès considérables dans l’amélioration de l’accessibilité à la fibre optique et de la vitesse du haut débit fixe depuis 2020. Cependant, un écart important demeure par rapport aux marchés plus avancés du Moyen-Orient et d’Afrique.

Pour combler cet écart, il est essentiel de faciliter les investissements dans la fibre optique par le biais de partenariats public-privé, de promouvoir le partage des infrastructures, d’accroître la concurrence, de fournir des cadres réglementaires solides et d’étendre la bande passante internationale. De telles initiatives rendront les services à haut débit plus abordables et accessibles, ce qui fait partie intégrante de la progression de la transformation numérique nationale et de la stimulation de la croissance économique.

Ookla a travaillé avec des FAI, tels que Bahrain Network (BNET) et les régulateurs de télécoms, pour soutenir leurs plans nationaux de haut débit, suivre les améliorations de la connectivité et de la couverture fibre et promouvoir leur réseaux auprès des consommateurs. Si vous êtes intéressé par les solutions et services d’Ookla en matière d’intelligence et de gestion des réseaux, contactez-nous.
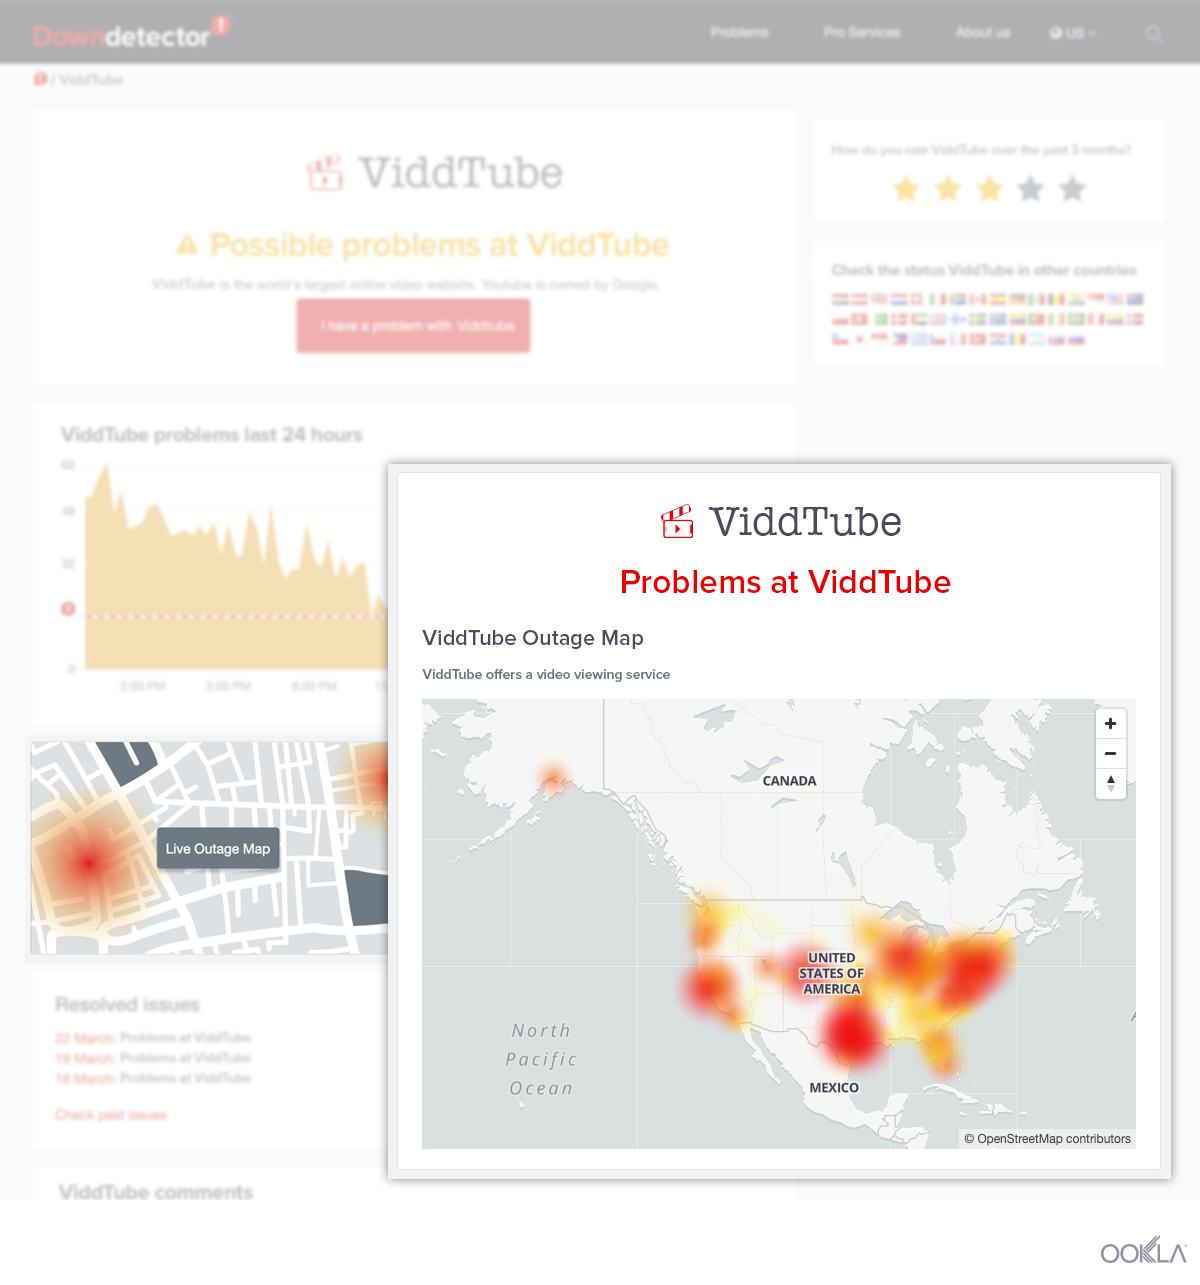
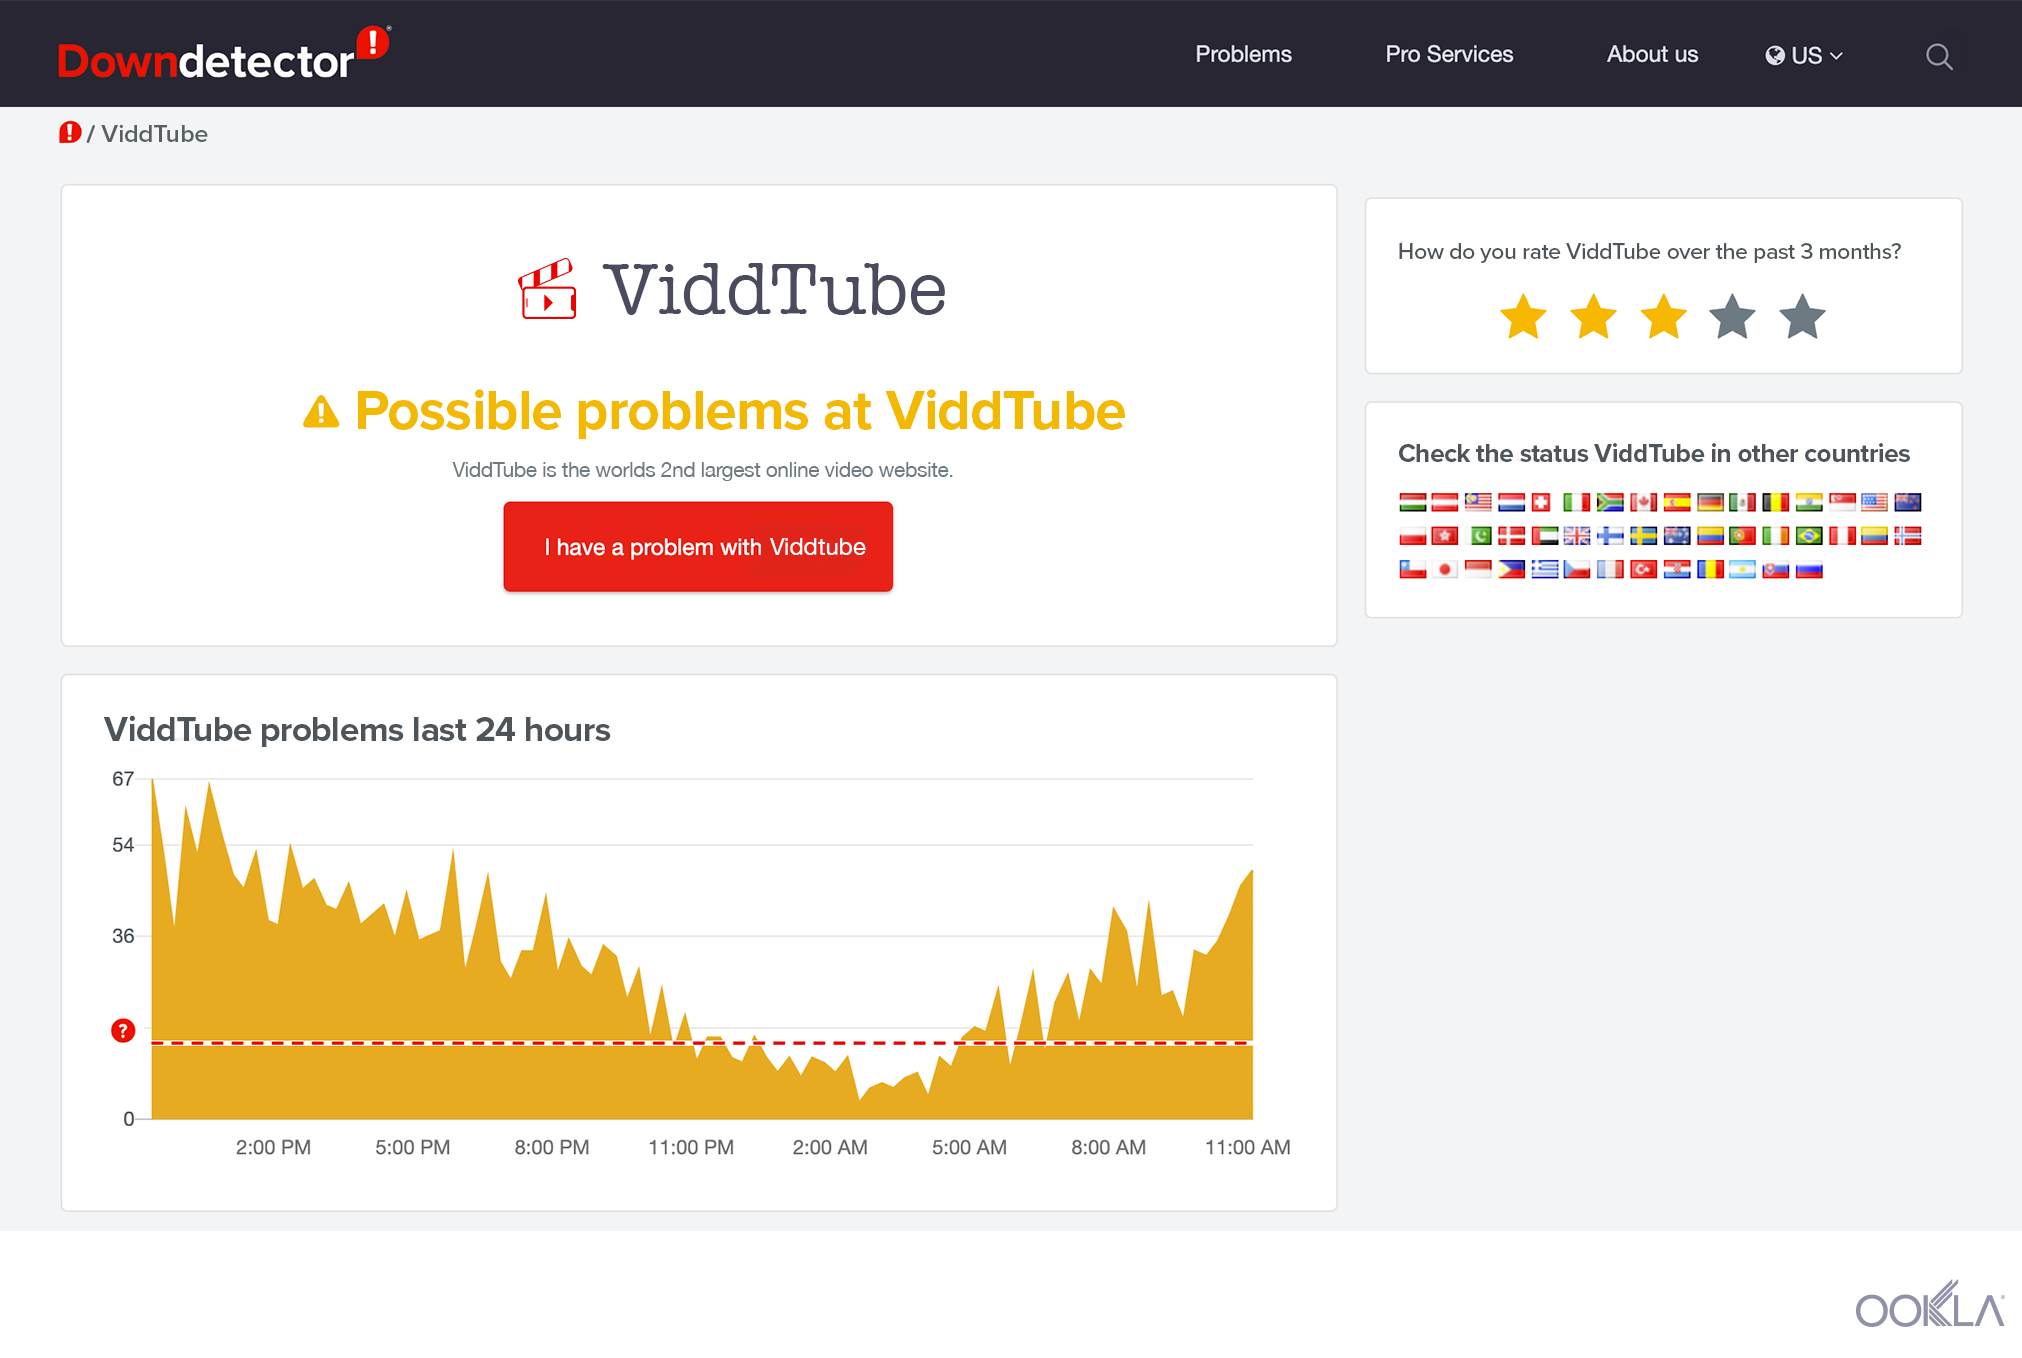
Ookla retains ownership of this article including all of the intellectual property rights, data, content graphs and analysis. This article may not be quoted, reproduced, distributed or published for any commercial purpose without prior consent. Members of the press and others using the findings in this article for non-commercial purposes are welcome to publicly share and link to report information with attribution to Ookla.