| September 12, 2017

The Inside Story on U.K. Internet Speeds

You may have read in Speedtest Global Index that the United Kingdom has the 41st fastest mobile download speed and the 25th fastest fixed broadband speed in the world for the month of August. This is true, but the U.K.’s complex geography makes the story much more nuanced than that. This month we’ve gone beyond the country-level statistics available in the Speedtest Global Index to give you a peek at the deeper story.

Mobile speeds are relatively even

Average mobile speeds across the four countries of the U.K. didn’t actually vary that much during the month of August 2017. Downloads in England are 2.5% faster than the UK as a whole. In Scotland, they are 10.5% slower than the UK average, 6.9% slower in Northern Ireland and 4.8% slower in Wales. But even in Scotland, the download speed is decent. Mobile upload speeds don’t fluctuate, either from England’s 1.7% faster than U.K. average to Wales 8.7% slower than U.K. average.

Mobile Speeds United Kingdom

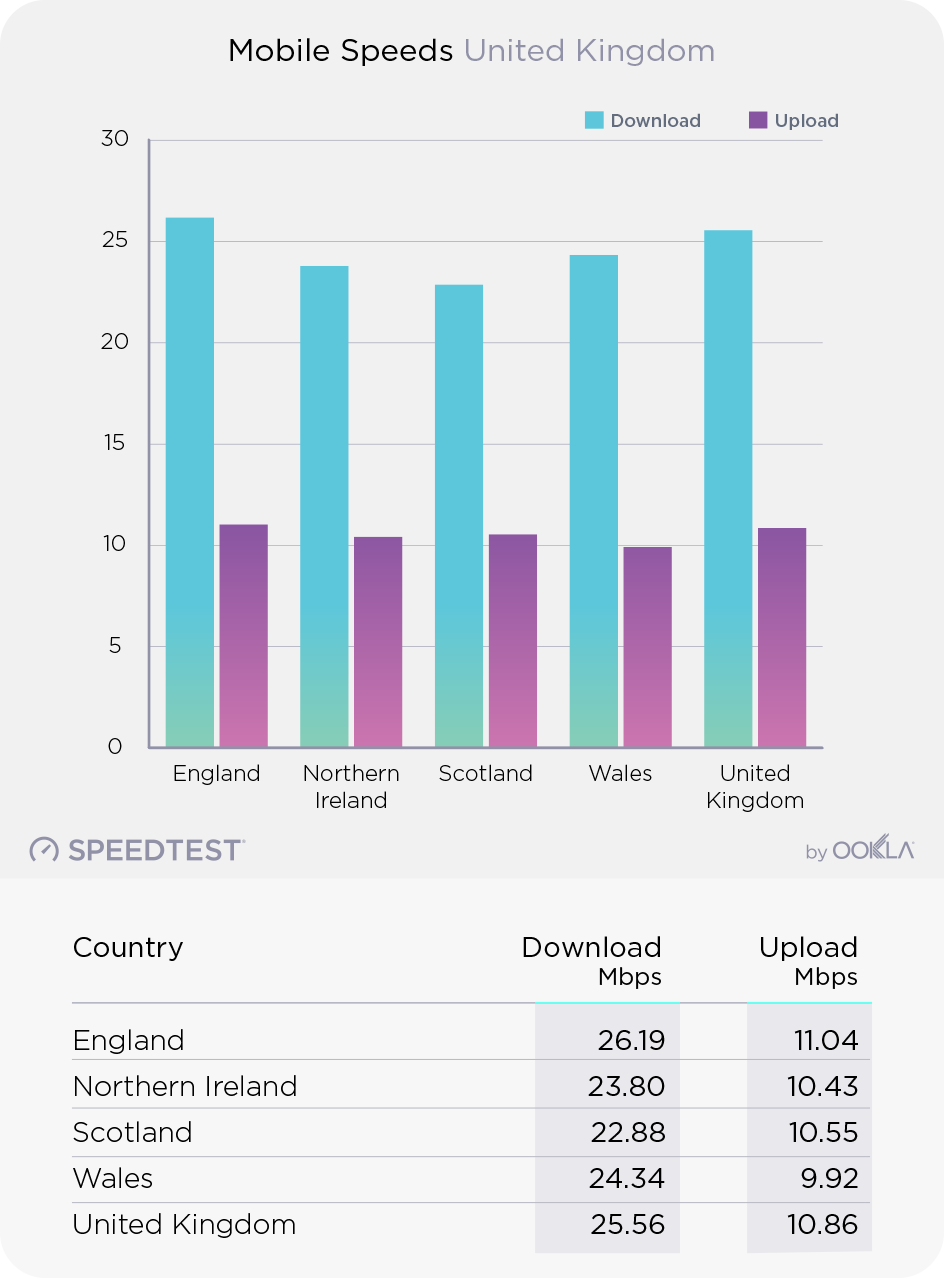
This does not mean that all mobile internet users in the U.K. connect at these speeds, even on a country-level. In June, Ofcom published a report saying that 56% of rural users in the U.K. were satisfied with their mobile service, compared with 72% of urban users.

Fixed broadband speeds vary… a lot

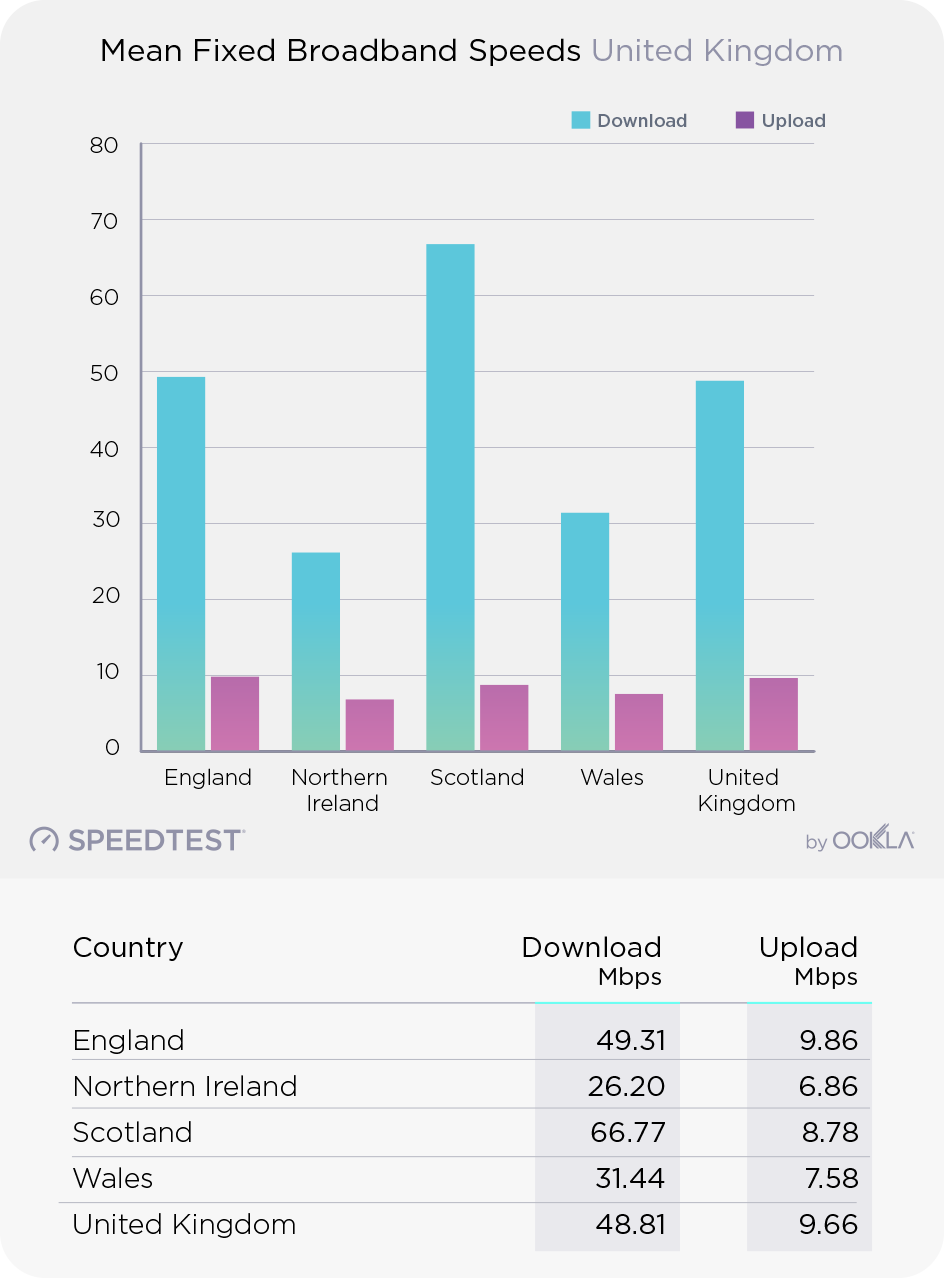
England’s mean download and upload speeds over fixed broadband are on par with those in the U.K. as a whole, but that’s where the story of relatively comparable internet speeds across the U.K. breaks down.

Scotland’s fixed broadband speed is a whopping 36.8% faster than the U.K. average. Download speeds in Wales and Northern Ireland, on the other hand, are 35.6% and 46.3% slower than the U.K. average. Northern Ireland’s average is slower than Ofcom’s 30 Mbps superfast designation and Wales’s average is not much better. Upload speeds in these two areas are 21.5% and 29.0% slower, respectively, than the U.K. average.

Fixed Mean Speeds United Kingdom

About those slow areas…

The government of Wales has been working on project Superfast Cymru to bring “access to high speed broadband to the majority of homes and businesses in Wales that cannot get it through the private sector’s own commercial programmes.” And the BBC reported in March 2017 that “Speeds of 24Mbps plus are now available in about nine out of every 10 homes and businesses in Wales.”

Northern Ireland has undertaken a similar endeavor with the Superfast Rollout Project and in December 2016, Ofcom’s Northern Ireland director wrote that superfast broadband was available to eight in 10 homes in Northern Ireland.

But these projects have been rolling out for awhile, and while nearly 650,000 Welsh premises newly had access courtesy of Superfast Cymru, download speeds in Wales only increased 12.8% over the last year. The Northern Ireland Broadband Improvement Project has been under way since February 2014 and the past year saw an increase of only 15.2% in download speeds. These compare with increases of 33.3% in England and 63.5% in Scotland during the same period.

So why are internet speeds still so different?

Subscription rates

Access does not mean that people are subscribing to higher tier plans. For example, the House of Commons library reported that seven out of ten of the slowest council wards in the U.K. were in Wales. This is borne out when we look at median speeds rather than mean speeds:

MedianFixed Speeds United Kingdom
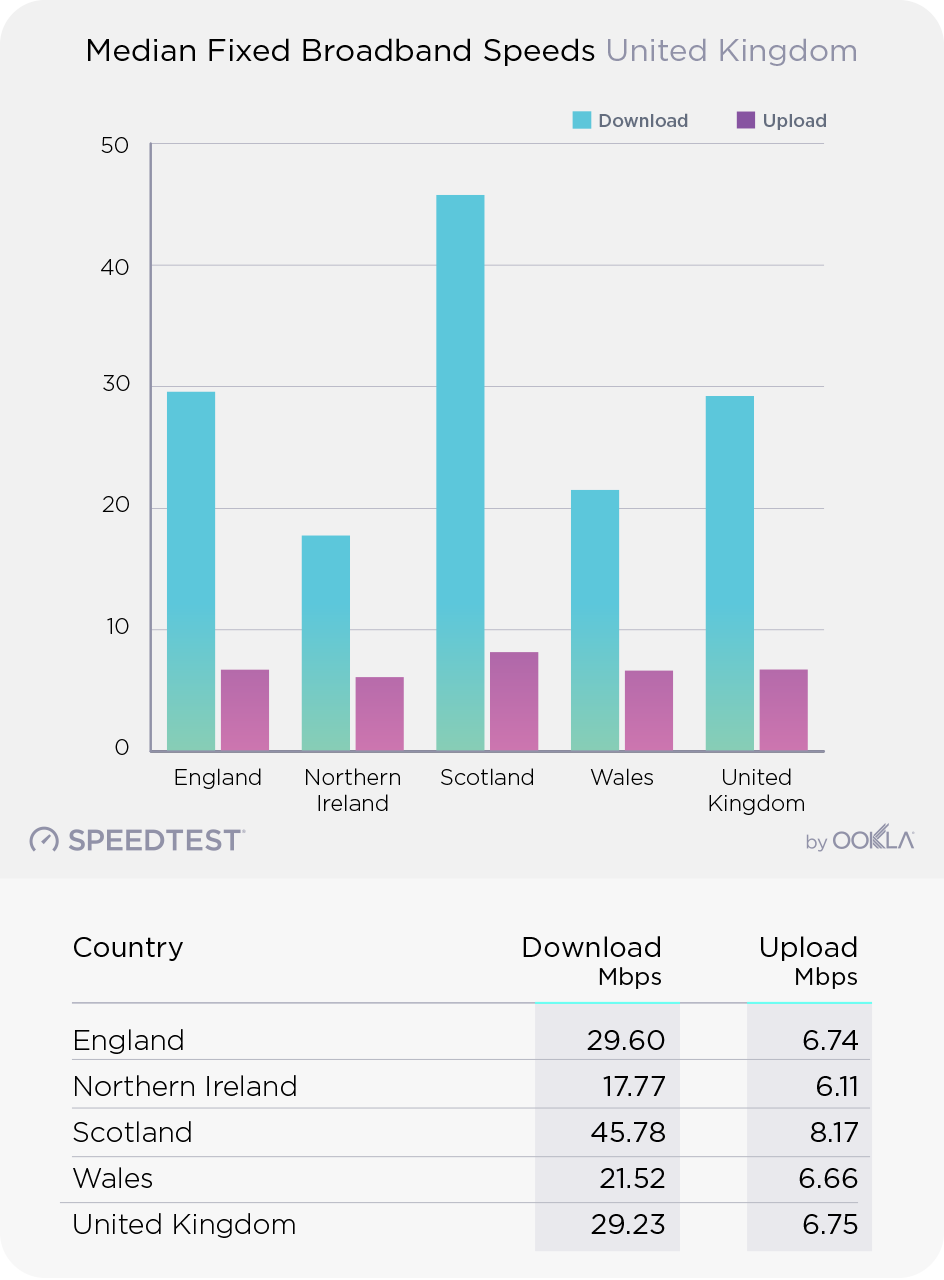
Because the median speeds are the most frequently occurring speeds, these numbers more accurately reflect what people are subscribing to, not what they could achieve in a given location.

Rural population

Extending fiber to rural areas can be expensive and not all providers are willing to invest in areas with smaller populations where the rate of return is likely to be lower.

Looking at rural population statistics from across the U.K., this could be one reason why service is slower in Northern Ireland and Wales. In Northern Ireland, 33.2% of people lived in areas with a population of 3,000 or less. Compare that with Scotland’s 18% or England where 17.6% of people lived in areas of 10,000 or less. In Wales that number is closer to 32%. Urban vs. rural designations in Wales are a bit more tricky, but the Government of Wales considers a combination of areas designated as “less sparse rural” and three subsets of “sparsest” areas to be rural; that combination of areas houses 20.5% of the Welsh population.

These numbers don’t necessarily mean that higher percentages of rural population leads to slower fixed broadband speeds, but there is a correlation.

Whatever the cause of the wide difference in fixed broadband speeds across countries of the U.K., it’s clear that Wales and Northern Ireland still have a lot of catching up to do, particularly if they want to take full advantage of the digital economy.

Ookla retains ownership of this article including all of the intellectual property rights, data, content graphs and analysis. This article may not be quoted, reproduced, distributed or published for any commercial purpose without prior consent. Members of the press and others using the findings in this article for non-commercial purposes are welcome to publicly share and link to report information with attribution to Ookla.

| February 19, 2019

Email confirmation required...

Thanks for subscribing, check your email to confirm your subscription.

Ookla retains ownership of this article including all of the intellectual property rights, data, content graphs and analysis. This article may not be quoted, reproduced, distributed or published for any commercial purpose without prior consent. Members of the press and others using the findings in this article for non-commercial purposes are welcome to publicly share and link to report information with attribution to Ookla.

| September 19, 2017

Exploring the Internet in Antarctica

In our coverage of the fastest airports on each continent we left one out — Antarctica. Because, as much as we’d love to, we do not have a ton of data from Antarctica to tell you which airfield has the fastest Wi-Fi. But being off the beaten path is kind of the point of visiting Antarctica, isn’t it?

We’re actually delighted to be able to share any data from Antarctica with you at all. Normally we’d sift through data and aggregate it before it’s analyzed to make sure you’re getting a really reliable look at average speeds. Given that there’s nothing average about Antarctica, though, we’re sharing raw Speedtest data from July 2017 for tests taken on mobile Wi-Fi and cellular networks.

Mobile Wi-Fi

During that time we saw three tests over Wi-Fi at field stations (that also have air strips):

July 2017 Speedtest Results
Antarctica Field Stations
Location Download (Mbps) Upload (Mbps) Ping (ms) ISP
Base Presidente Eduardo Frei Montalva 1.32 0.67 598 Movistar
Showa Station 0.57 2.67 1313 ROIS
General Bernardo O’Higgins Base 1.03 0.07 739 Claro

These research stations are spread far and wide with one each on the Antarctic Peninsula, East Ongul Island, and King George Island.

Based on those tests, we’d say that there definitely is internet available on Antarctica, but in most cases the speeds are glacially slow. Which is what we’d expect from a continent served entirely by satellites. According to an AMA with a Utilities Mechanic at McMurdo Station, “The internet is fast enough to browse reddit, but they restrict the bandwidth to social media websites and youtube, because EVERYONE is trying to use these all the time and the science teams have higher priority access. Online gaming would only be possible in the really early hours of the morning, and even then the ping would be incredibly high.” His Speedtest result from January 2016 showed a download speed of 1.79 Mbps and an upload of 0.82 Mbps with a ping of 1969 ms.

Cellular tests

We also saw one test over cellular networks in July that occurred near Terleckijtoppen Peak and somewhat close to Tor Field Station. This was by far the fastest test result we saw in all of Antarctica during the time period we studied:

July 2017 Speedtest Results
Near Terleckijtoppen Peak, Antarctica
Latitude Longitude Download (Mbps) Upload (Mbps) Ping (ms) ISP
-71.822 10.3419 25.94 27.74 26 DNA

There is 4G on Antarctica. Argentina’s Movistar launched a 4G network at Marambio Base in January. We haven’t seen any tests over it yet, but we’d like to. If you’re living, working or traveling in a remote location on the planet (or off!) please take a Speedtest and share your results with us using the hashtag “#FarFlungSpeeds”.

This article was updated on September 19 to remove results we later determined to be geographically invalid.

Ookla retains ownership of this article including all of the intellectual property rights, data, content graphs and analysis. This article may not be quoted, reproduced, distributed or published for any commercial purpose without prior consent. Members of the press and others using the findings in this article for non-commercial purposes are welcome to publicly share and link to report information with attribution to Ookla.

| August 13, 2018

Downdetector is Now Part of Ookla

Ookla has acquired Downdetector, the leading source for real-time status and outage information for thousands of services and websites around the world. Downdetector’s commitment to providing open, transparent information about the state of online services echoes Ookla’s focus on illuminating the speed and performance of networks around the world for the benefit of those who use them.

As part of Ookla, Downdetector will continue to operate in full capacity as a resource for both consumers and enterprise businesses. We look forward to helping Downdetector in their mission to bring visibility to the availability and uptime of internet services.

Ookla retains ownership of this article including all of the intellectual property rights, data, content graphs and analysis. This article may not be quoted, reproduced, distributed or published for any commercial purpose without prior consent. Members of the press and others using the findings in this article for non-commercial purposes are welcome to publicly share and link to report information with attribution to Ookla.

| August 14, 2018

Could Your Mobile Network Handle Millions of New Users Overnight? Preparing for the Hajj

On August 20, millions of people will arrive in Mecca, Saudi Arabia to complete the Hajj, a ritual pilgrimage required of all able Muslims once during a lifetime. Though we don’t expect internet speed will be anyone’s top concern during this sacred period, we were curious how well the local network handles all that extra traffic.

To get a better idea of what this year’s pilgrims might experience, we’ve used Speedtest data to look at download speeds in Mecca before and during last year’s Hajj. We’ve also analyzed roaming speeds from the first half of 2018 for visitors from countries that represent four of the largest groups of pilgrims to understand how roaming agreements might affect performance.

How Mecca’s mobile network performs during the Hajj

Arriving pilgrims more than double the population of Mecca, an influx that could cripple a mobile network. Instead, our data shows a 12.1% decline in mobile download speed in Mecca during the 2017 Hajj, far less of an impact than we’d expect. Not only does the Saudi government invest heavily in ensuring a positive experience during the Hajj, it’s been said that Mecca spends the entire year preparing. From this small decline in speeds, we’d say that whatever mobile networks and the Saudi government are doing to shore up their mobile networks is working.

How the Hajj Affects Download Speeds
Saudi Arabia | 2017 | Measured in Mbps
Location Before the Hajj
(August 1-August 29)
During the Hajj
(August 30-September 3)
Mecca 11.46 10.07
Saudi Arabia 10.85 11.57

Comparatively, speeds in Saudi Arabia actually increased 6.6% during the Hajj.

Mobile speeds in Saudi Arabia have increased dramatically in the past year, with July 2018 showing an average download speed of 29.59 Mbps in Mecca. Even if this speed dips slightly during the Hajj, pilgrims should, on average, enjoy strong mobile speeds.

How roaming affects these speeds

But travelers don’t experience average speeds. In fact, a visitor’s roaming speeds can vary widely based on their home carrier’s individual agreement with carriers in the country they’re visiting as well as what type of mobile plan an individual has signed up for. To better understand how that affects visitors to Saudi Arabia, we looked at Speedtest results for roaming tests taken by people from Egypt, India, Indonesia and the United States during the first half of 2018.


In all cases, download speeds declined (as you might expect). Visitors from India saw the smallest decrease (22.4%). Indonesian travelers experienced download speeds 43.5% slower than those they’d see at home. Egyptians experienced a 46.6% decrease and Americans a painful 88.4%.

What about Mina and Arafat?

We looked at Speedtest results for areas around Mecca during the first half of 2018 to find out if pilgrims will have coverage during the farther-reaching portions of the Hajj.

Speedtest Results - Mecca, Saudi Arabia

We were glad to see there is some connectivity along the route to Mina and Arafat, should travelers need it.

While the Saudi mobile network appears to be up to the massive challenge of serving millions of pilgrims, roaming speeds can leave something to be desired. It might be worth talking to your carrier about the roaming speeds you can expect before you get on that plane.

Our hope is that this information may be valuable to those who need it during their travels and better illuminate network conditions for those preparing for the Hajj.

Ookla retains ownership of this article including all of the intellectual property rights, data, content graphs and analysis. This article may not be quoted, reproduced, distributed or published for any commercial purpose without prior consent. Members of the press and others using the findings in this article for non-commercial purposes are welcome to publicly share and link to report information with attribution to Ookla.

| September 26, 2018

These Small Countries are Leading Broadband Speeds

One of our missions at Ookla® is to improve internet speeds around the world by giving people direct access to the speed of their connection via our flagship product Speedtest®. We’re very proud of having inspired Telenor to boost mobile speeds in Norway, fueling the debate over Australia’s National Broadband Network and providing the independent data that has impacted technology policy in Scotland, to name a few.

Besides articles here on Speedtest Insights, one of the primary ways we publicly share this data is through the Speedtest Global Index. But some places that don’t qualify for the Global Index — either because they aren’t UN Member States or Permanent Observers or they don’t meet the monthly unique user counts (670 results for mobile and 3,333 for fixed broadband) — still have fantastic internet speed stories to tell…

Except where noted, all of the following stories are based on Speedtest Intelligence™ data from Q1-Q2 2018.

Rapid rises in Andorra’s fixed broadband speeds

Two years ago, fixed broadband speeds in the Principality of Andorra were unremarkable and the country’s mean download speed lagged about 5 Mbps behind neighboring France and Spain. Then Andorra Telecom completed a renovation of its fiber optic network and download speeds shot up. They’ve since slowed a little, something that often happens as customers pile onto faster connections, but Andorra’s mean download speed of 89.39 Mbps in August 2018 beats Spain’s by 17.5% and France’s by 26.8%.

“Fixed Broadband Download Speeds” Subtitle: Andorra, France and Spain”

Jersey’s fixed broadband skyrockets practically overnight

Fixed broadband speeds on the island of Jersey (the largest of the Channel Islands, situated in the English Channel) were on a steady upward trend, seeing a 106% increase between Q1-Q2 2016 and Q1-Q2 2018.

“Fixed Broadband Download Speeds” Subtitle: Jersey”

However, between June and August 2018 the download speed jumped a further 56.6% to reach a mean of 155.41 Mbps.

“Fixed Broadband Download Speeds” Subtitle: Jersey”

This jump coincides with a full-fiber rollout across the island.

Monaco makes a long-term bet on fixed broadband

Monaco’s world-class fixed broadband speeds date to 2016 when Monaco Telecom made gigabit-level service available to all residences through Fiber-to-the-Home (FTTH). By Q1-Q2 2018 the mean download speed over fixed broadband in Monaco was 130.05 Mbps.

“Fixed Broadband Download Speeds” Subtitle: Monaco”

These smaller countries do have an advantage when it comes to things like fewer miles of fiber optic cable needed to actually serve every home. Still, there are lessons larger nations can learn from the successes of Andorra, Jersey and Monaco. One such area is future-proofing network upgrades by fully deploying the best available technology, which ensures that Internet Service Providers don’t have to manage a patchwork of cable types or dig up all the roads again in the near term.

It’s also important to note that these rapid broadband speeds make Andorra, Jersey and Monaco that much more attractive to a growing (and increasingly global) tech sector.

Is your company leading the way to faster internet speeds at a national level? Learn more about the network insights available from Speedtest Intelligence.

Editor’s note: This article was updated on October 1, 2018 to correct a scale issue on one of the charts.

Ookla retains ownership of this article including all of the intellectual property rights, data, content graphs and analysis. This article may not be quoted, reproduced, distributed or published for any commercial purpose without prior consent. Members of the press and others using the findings in this article for non-commercial purposes are welcome to publicly share and link to report information with attribution to Ookla.

| October 8, 2018

Just How Much Does Roaming Affect Mobile Performance in Southeast Europe?

This week the Wholesale Agreements and Solutions Group (WAS) will be meeting in Rovinj, Croatia as part of a GSMA working group to discuss the big deals that will affect worldwide roaming speeds over the next year. That made us curious — what kinds of roaming speeds might these telecom execs experience while they’re deciding our roaming fate?

We looked into Speedtest Intelligence® data from over 2.7 million consumer-initiated tests in Southeast Europe during Q1-Q2 2018 on devices using LTE networks to see how median speeds and latency were affected as mobile users roamed around the region. Roaming speeds include Android results only.

Though we expected to see a general decline in speeds and increase in latency (the time it takes for data to travel from your phone to the nearest server and back) while roaming, we were surprised by how much a person’s home country affected their mobile roaming experience.

Albania, Bosnia and Herzegovina, Macedonia and Montenegro are excluded from this analysis due to insufficient sample size during the examined time period. Data for Serbia includes the disputed region of Kosovo.

There’s no correlation between local download speed and decrease in roaming speed

Median Local vs. Roaming Download Speeds
Southeast Europe
Q1-Q2 2018 | 4G LTE
Country Local Download (Mbps) Roaming Download (Mbps) % Difference
Bulgaria 37.97 18.21 -52.0%
Croatia 34.50 31.67 -8.2%
Greece 33.61 27.87 -17.1%
Romania 28.47 20.89 -26.6%
Serbia 34.19 30.32 -11.3%
Slovenia 26.26 28.26 7.6%
Turkey 29.93 21.75 -27.3%

Slovenians are the only Southeast Europeans who see better mobile speeds while traveling than they do at home. Considering Slovenia’s local mobile download speed is the lowest on this list, we can presume that residents are encountering better infrastructure abroad and seeing better speeds as a result.

That does not that mean that countries with the fastest local download speeds see the largest declines in speed when roaming. For example, Bulgaria shows the fastest median mobile download speed in Southeast Europe and sees the largest declines in download speed when roaming. But Croatia, which has the second fastest mobile download speed in Southeast Europe, shows the second smallest decline in download speed when roaming.

On the other hand, Romania, which ranks sixth on our list for median local download speed shows the third largest decline when roaming. While Turkey, which ranks fifth in the region for local download speed, shows the second largest decline when roaming.

In fact, roaming speed is affected by in-country infrastructure and also by how operators prioritize out of country traffic. These decisions are made between each individual operator in each individual country, often at meetings like those in Rovinj this week where operators negotiate who has access to what networks and how much that access should cost them. This is why some operators offer extensive roaming packages and why those often come at a cost.

Roaming dramatically increases latency

Latency is measured in milliseconds, and a mobile user usually won’t notice a lag between taking an action on their phone and seeing an expected result when latency is low. Even in Croatia, the country with the highest local latency on our list, latency is very close to what the rest of the countries experience.

Median Local vs. Roaming Latency
Southeast Europe
Q1-Q2 2018 | 4G LTE
Country Local Latency (ms) Roaming Latency (ms) % Difference
Bulgaria 23 135 487.0%
Croatia 26 84 223.1%
Greece 23 144 526.1%
Romania 24 118 391.7%
Serbia 19 31 63.2%
Slovenia 19 67 252.6%
Turkey 24 130 441.7%

However, latency can skyrocket when roaming as some operators route a user’s traffic back through their home country, which leads to a much different user experience. This is definitely what we found in our analysis of Southeast Europe. As we saw with download speed, the percentage change between local and roaming latency was not correlated to local latency.

For example, Slovenia and Serbia show the same median local latencies (19 ms), but Slovenia shows a large increase in latency while Serbia’s increase is the smallest on our list.

This is because latency, like roaming speed, is a lot more complex than simply what infrastructure consumers are on. There’s also the matter of network agreements… the very deals that telecom execs are hammering out right now in Rovinj.

Are you at WAS? Stop by booth 23. We’d love to share a sneak peek of our roaming data with you. We have the insights and data for use in decisioning, sales, negotiation and quality steering related to wholesale and roaming solutions.

Ookla retains ownership of this article including all of the intellectual property rights, data, content graphs and analysis. This article may not be quoted, reproduced, distributed or published for any commercial purpose without prior consent. Members of the press and others using the findings in this article for non-commercial purposes are welcome to publicly share and link to report information with attribution to Ookla.

| March 19, 2019

Ookla Partners with FES to Power FESIQ Virtual Benchmarking Software

Ookla FES Logos

Ookla has partnered with FES, a leading provider of innovative software and services for the telecom industry, to power the FESIQ Virtual Benchmarking (VBM) software suite. Effective immediately, Ookla enterprise customers may leverage the FESIQ VBM analytics platform to view measured coverage in an unparalleled level of detail, including indoor and outdoor identification, all over the world.

This in-depth view into network coverage, performance and population density is a game changer for operators and infrastructure providers seeking to deliver dramatic improvements in network efficiency and performance, while simultaneously managing those costs. By rapidly assessing all networks and technologies down to the individual building level, FESIQ VBM cuts out the traditional expense and intense effort of measuring and mapping networks through methods like drive testing. Furthermore, a comprehensive view of competitive network coverage more fully informs capital and marketing spend.

FES assists a global clientele with the planning, implementation, optimization, and regulatory compliance of wireless networks. FES is a solutions pioneer in network design and performance, including live special event monitoring and rapid VoLTE improvement. The FESIQ software suite provides these insights via a blend of capacity and performance forecasting, crowdsourced measurement analytics, and network performance assurance functionality. Since inception, FESIQ has been used to plan and optimize tens of thousands of small cell, macro, and 5G cell sites.

To learn more or inquire about the benefits of FESIQ VBM powered by Ookla, visit Ookla.com/speedtest-intelligence.

Ookla retains ownership of this article including all of the intellectual property rights, data, content graphs and analysis. This article may not be quoted, reproduced, distributed or published for any commercial purpose without prior consent. Members of the press and others using the findings in this article for non-commercial purposes are welcome to publicly share and link to report information with attribution to Ookla.

| October 10, 2018

Ekahau is now part of Ookla

Ookla has acquired Ekahau, the market leader in enterprise Wi-Fi design, optimization and troubleshooting. Founded in 2000, Ekahau is universally trusted by IT professionals and Wi-Fi industry experts as the leading software and hardware technology for deploying the world’s highest performance and most robust Wi-Fi networks.

Whether a corporate office, hotel, hospital or university – if the Wi-Fi works well, it has likely been built using Ekahau’s Wi-Fi design solutions. Ekahau Site Survey is the ideal solution for designing and deploying Wi-Fi networks, while the Ekahau Sidekick is an all-in-one professional measurement device for fast and accurate Wi-Fi site surveys and spectrum analysis.

As part of Ookla, Ekahau will continue to operate as they always have and will enhance their products by leveraging the Speedtest platform. Ookla will also benefit from the expertise and technology that Ekahau brings to the measurement and optimization of Wi-Fi networks. We’re thrilled to welcome Ekahau to the Ookla family.

Ookla retains ownership of this article including all of the intellectual property rights, data, content graphs and analysis. This article may not be quoted, reproduced, distributed or published for any commercial purpose without prior consent. Members of the press and others using the findings in this article for non-commercial purposes are welcome to publicly share and link to report information with attribution to Ookla.

| April 2, 2019

How 100+ Million Additional Users Affects a Network: Mobile Speeds and 4G Usage During the Kumbh Mela

Millions of Hindus gather in one of four locations in India on a twelve year cycle to participate in the Kumbh Mela, the largest religious gathering in the world. Though the focus of the festival is a series of ritual baths in sacred waters, pilgrims and tourists use their mobile phones to help them navigate and to find friends and family in the immense crowds.

This year the Ardh Kumbh Mela in Prayagraj drew over 100 million visitors, and India’s largest mobile carriers have rolled out various mobile programs to help pilgrims. We were curious to analyze how well mobile networks held up. We’ve examined mobile speeds and 4G usage in and around Prayagraj from January 14-March 4, 2019.

How the top four operators performed at the Kumbh Mela

As mentioned above, India’s largest mobile operators put significant preparation into serving the massive influx of pilgrims during the Kumbh Mela. Airtel deployed Massive MIMO to expand network capacity, Jio launched an app that included real-time info on events and a family locator, and Vodafone-Idea offered an RFID tag to help locate children.

Mobile Speeds at the Kumbh Mela
Prayagraj, India | January 14-March 4, 2019
Connection Type Mean Download (Mbps) Mean Upload (Mbps) Mean Latency (ms)
Airtel 15.83 4.67 52
Jio 8.04 4.79 104
Vodafone 7.61 3.03 68
Idea 5.16 3.93 77

Airtel’s emphasis on increasing capacity paid off in speed with their mean download speed in the vicinity of the Kumbh Mela coming in 96.9% faster than that of second-place Jio. Vodafone was third and Idea a distant fourth.

Speeds decrease when traveling between states

Mobile operators in India use different MCC/MNC codes in different parts of the country, which allows us to differentiate speeds for customers who are “roaming” between telecom circles. In most cases these telecom circles correspond to states and union territories, but some represent only portions of a state or combinations of multiple states.

We compared speeds experienced during the time of the Kumbh Mela for customers from eastern Uttar Pradesh with those visiting this area from elsewhere in the country. We omitted data for the Kerala and North East (which comprises most of the North Eastern states) telecom circles for reasons of sample size.

India_Kumbh-Mela_Mobile_Speeds_map-2

Customers visiting from seven telecom circles (Rajasthan, Madya Pradesh, Karnataka, Delhi, UP West, Punjab and Andhra Pradesh) showed faster mean download speeds in eastern Uttar Pradesh than local customers. The Rajasthan telecom circle showed the fastest mean download speed when “roaming” in UP East at 9.10 Mbps, 9.6% faster than the local UP East download speed.

Customers visiting in UP East from 12 telecom circles (Himachal Pradesh, Kolkata, Haryana, Maharashtra and Goa, Assam, Jammu and Kashmir, Gujarat, Tamil Nadu, West Bengal, Odisha, Bihar and Mumbai) saw slower mean download speeds than local UP East customers. The Himachal Pradesh telecom circle showed the slowest mean download speed when “roaming” in UP East at 6.15 Mbps, 25.9% slower than the local UP East download speed.

Even when “roaming” across states, people remain on 4G

We also compared the percentage of time customers spent on 4G in their home telecom circles with the time spent on 4G when they were “roaming” in UP East during the Kumbh Mela. Time spent on 4G includes on- and off-network connections. We excluded the Assam, Jammu and Kashmir, Kerala, North East, and Himachal Pradesh telecom circles for insufficient data.

Time Spent on 4G in Home Telecom Circle and While Roaming Domestically
India | January 14-March 4, 2019
Telecom Circle Time on 4G at Home Time on 4G in UP East Difference
West Bengal 81.8% 92.2% 12.7%
Odisha 92.9% 96.8% 4.2%
UP West 85.9% 89.2% 3.9%
Bihar 90.6% 92.8% 2.4%
Delhi 84.3% 86.2% 2.3%
Kolkata 89.0% 89.7% 0.7%
Haryana 90.2% 90.5% 0.4%
UP East 90.0% 90.0% 0.0%
Rajasthan 89.7% 89.3% -0.4%
Andhra Pradesh 88.0% 87.5% -0.6%
Tamil Nadu 88.7% 87.8% -0.9%
Maharashtra and Goa 82.6% 81.2% -1.7%
Punjab 89.9% 87.4% -2.8%
Gujarat 87.7% 85.3% -2.8%
Mumbai 88.0% 83.8% -4.7%
Madhya Pradesh 89.8% 84.1% -6.4%
Karnataka 91.0% 84.9% -6.7%

The percentage of time consumers spent on 4G was remarkably similar in their home telecom circles and when “roaming” in UP East. The outliers were customers from West Bengal (who were connected to 4G 12.7% more frequently in UP East than when they were at home) and those from Madhya Pradesh and Karnataka (who were connected to 4G 6.4% and 6.7% less frequently, respectively, than they were at home).

Managing an influx of 100 million or more additional people is an amazing feat for a mobile network and India’s top four mobile operators held up relatively well. Customers from some parts of the country even saw a faster download speed than the locals. 4G usage also held up relatively well no matter which part of the country Indian pilgrims were visiting from.

Ookla retains ownership of this article including all of the intellectual property rights, data, content graphs and analysis. This article may not be quoted, reproduced, distributed or published for any commercial purpose without prior consent. Members of the press and others using the findings in this article for non-commercial purposes are welcome to publicly share and link to report information with attribution to Ookla.