| October 14, 2019

Exploring Recent Trends in the Latin American Telecom Market


Leer en español | Leia em Português

The Latin American telecommunications market continues to be fascinating to watch as fixed broadband speeds increase and mobile operators ready their networks for 5G. In anticipation of Futurecom, we analyzed internet speeds and 4G Availability for Q2-Q3 2019 in Latin America’s major markets to see who’s leading the charge to the future.

Mobile and fixed speeds are increasing at the country level

LatAm-Mobile-Fixed-Speeds-in-Largest-Markets

Fixed broadband speeds are on the rise in Latin America’s largest markets. Colombia’s mean download speed increased 30.6% during Q2-Q3 2019 while Mexico’s increased 15.6%. Chile had the fastest mean download speed over fixed broadband by far and showed a 26.7% increase in speed during the period. Brazil was the second fastest throughout the period. Peru, Mexico and Argentina were closely vying for third, but in the end Peru won out. Colombia had the slowest download speed over fixed broadband.

Mobile speeds were much more competitive in Latin America’s largest markets. Increases in mean download speeds were not nearly as impressive as they were with fixed broadband, though. Mexico saw the greatest increase during Q2-Q3 2019 at 12.0%. Argentina’s mobile download speed increased 11.0%, followed by Brazil (7.9%), Chile (5.1%) and Colombia (4.6%). Peru’s mean download speed over mobile decreased 2.2% during the period. Mexico had the fastest mobile speed, followed by Peru, Brazil, Argentina, Chile and, finally, Colombia.

4G Availability varies widely by country

LatAm-4G-Availability-Q2-Q3

We looked at the percentage of surveyed locations where devices could access 4G LTE service in Latin America’s major markets during Q2-Q3 2019 and found that Peru was on top with 77.8% 4G Availability during the period. Chile came in second with 75.5% and Argentina third at 71.4%. Brazil had the lowest 4G Availability at 47.3% and Colombia had the second lowest at 50.6%.

City speeds vary by technology

Ookla_Internet-Speeds-in-Latin-America-Largetst-Cities_1019_EN
Fixed broadband speeds have increased dramatically in Latin America’s largest cities since we last examined them and these speeds have shifted the rankings significantly. Santiago, Chile had the fastest download speed over fixed broadband in Q2-Q3 2019, beating second-place Brasília, Brazil by 66.6%. São Paulo, Brazil came in a close third. Bogotá, Colombia had the slowest download speed over fixed broadband of the cities on our list. Lima, Peru was the second slowest city and Mexico City, Mexico third slowest.

Because of the political situation in Venezuela, we did not include Caracas in our analysis.

Mobile rankings have changed significantly since we last considered speeds in Latin America’s largest cities. Salvador, Brazil had the fastest mobile download speed on our list during this period. Brasília, Brazil was a close second and Mexico City, Mexico third fastest. Bogotá, Colombia also had the slowest mobile download speed on our list. Santiago, Chile was the second slowest city for mobile and Fortaleza, Brazil the third slowest.

Ookla will be at Futurecom! If you’d like to connect to learn more about the Latin American telecom market and how our data can help you, contact us.

Análisis de las tendencias recientes en el mercado de las telecomunicaciones de América Latina

El mercado de las telecomunicaciones de América Latina continúa siendo fascinante de analizar a medida que las velocidades de la banda ancha fija aumentan y los operadores de telefonía móvil preparan sus redes para la tecnología 5G. Mientras esperamos Futurecom, examinamos las velocidades de Internet y la disponibilidad de 4G en el segundo y tercer trimestre de 2019 en los principales mercados de América Latina para ver quién está a la vanguardia del cambio de cara al futuro.

Las velocidades fijas y móviles están aumentando en cada país

LatAm-Mobile-Fixed-Speeds-in-Largest-Markets_ES

Las velocidades de la banda ancha fija están en aumento en los mercados más importantes de América Latina. La velocidad media de descarga de Colombia aumentó un 30,6 % durante el segundo y tercer trimestre de 2019, mientras que la de México se incrementó en un 15,6 %. Chile tuvo la velocidad media de descarga por banda ancha más rápida por lejos y demostró un aumento del 26,7 % en la velocidad durante el período. Brasil fue el segundo más rápido en todo el período. Perú, México y Argentina le siguieron de cerca compitiendo por el tercer puesto, pero al final, ganó Perú. Colombia tuvo la velocidad de descarga por banda ancha fija más lenta.

Las velocidades móviles fueron mucho más competitivas en los mercados más importantes de América Latina. Sin embargo, los aumentos en las velocidades medias de descarga no fueron tan impresionantes como lo fueron los de la banda ancha fija. México tuvo el mayor aumento durante el segundo y tercer trimestre de 2019 con un 12 %. La velocidad de descarga móvil de Argentina aumentó un 11 %, seguida por Brasil (7,9 %), Chile (5,1 %) y Colombia (4,6 %). La velocidad media de descarga móvil de Perú disminuyó un 2,2 % durante el período. México tuvo la velocidad móvil más rápida, seguido por Perú, Brasil, Argentina, Chile y, por último, Colombia.

La disponibilidad de 4G varía ampliamente por país

LatAm-4G-Availability-Q2-Q3_ES

Examinamos el porcentaje de lugares encuestados en donde los dispositivos pudieran acceder al servicio 4G LTE en los principales mercados de América Latina durante el segundo y tercer trimestre de 2019 y concluimos que Perú quedó en la cima con un 77,8 % de disponibilidad de 4G durante el período. Chile quedó segundo con el 75,5 % y Argentina quedó en el tercer lugar con el 71,4 %. Brasil tuvo la menor disponibilidad de 4G con el 47,3 % y Colombia tuvo el segundo nivel más bajo, con el 50,6 %.

Las velocidades de las ciudades varían según la tecnología

Ookla_Internet-Speeds-in-Latin-America-Largetst-Cities_1019_ES

Las velocidades de la banda ancha fija han aumentado drásticamente en las ciudades más importantes de América Latina desde la última vez que las analizamos y estas velocidades han cambiado las clasificaciones de manera significativa. Santiago, Chile, tuvo la mayor velocidad de descarga en banda ancha fija en el segundo y tercer trimestre de 2019, y venció a Brasilia, Brasil, que se quedó con el segundo lugar por el 66.6%. San Pablo, Brasil, quedó en tercer lugar, cerca. Bogotá, Colombia tuvo la velocidad de descarga por banda ancha fija más lenta de las ciudades en nuestra lista. Lima, Perú, fue la segunda ciudad más lenta, y la Ciudad de México, México, la tercera.

Debido a la situación política de Venezuela, no incluimos a Caracas en nuestro análisis.

Las clasificaciones móviles ha cambiado de manera significativa desde la última vez que analizamos las velocidades en las ciudades más importantes de América Latina. Salvador, Brasil, tuvo la velocidad de descarga móvil más rápida en nuestra lista durante este período. Brasilia, Brasil, quedó en segundo lugar por poco, y la Ciudad de México, México, fue la tercera más rápida. Bogotá, Colombia, también tuvo la velocidad de descarga móvil más lenta en nuestra lista. Santiago, Chile, fue la segunda ciudad más lenta en velocidad móvil, y Fortaleza, Brasil, la tercera más lenta.

Ookla estará en Futurecom. Si desean ponerse en contacto para obtener más información sobre el mercado de las telecomunicaciones en América Latina y cómo nuestros datos pueden ayudarlos, comuníquense con nosotros.

Tendências recentes no mercado de telecomunicações da América Latina

O mercado de telecomunicações da América Latina continua fascinante graças ao aumento das velocidades de banda larga e a preparação das redes de operadoras de celular para o 5G. Nas vésperas da Futurecom, analisamos as velocidades da internet e a disponibilidade de redes 4G entre o segundo e o terceiro trimestres de 2019 nos principais mercados da América Latina, para ver quem está liderando essa empreitada em direção ao futuro.

As velocidades de redes fixas e móveis dos países estão aumentando

LatAm-Mobile-Fixed-Speeds-in-Largest-Markets_PT

A velocidade da banda larga está aumentando nos maiores mercados da América Latina. A velocidade média de download da Colômbia aumentou 30,6% entre o segundo e o terceiro trimestres de 2019, enquanto no México ela aumentou 15,6%. O Chile teve, de longe, a maior velocidade média de download em banda larga fixa, com um aumento de 26,7% na velocidade durante o período. O Brasil foi o segundo mais rápido durante o período. Peru, México e Argentina disputaram acirradamente o terceiro lugar, mas o Peru acabou vencendo. A Colômbia teve a menor velocidade de download em banda larga fixa.

Houve um aumento na concorrência no setor de velocidades móveis nos maiores mercados da América Latina. No entanto, o aumento na velocidade média de download não foi tão impressionante quanto na banda larga fixa. O México teve o maior aumento entre o segundo e o terceiro trimestres de 2019, com 12%. A velocidade de download móvel da Argentina aumentou 11%, seguida pelo Brasil (7,9%), Chile (5,1%) e Colômbia (4,6%). A velocidade média de download do Peru em rede móvel diminuiu 2,2% durante o período. O México teve a maior velocidade móvel, seguido de Peru, Brasil, Argentina, Chile e, por fim, Colômbia.

Disponibilidade do 4G varia muito conforme o país

LatAm-4G-Availability-Q2-Q3_PT

Analisamos a porcentagem de dispositivos com acesso ao serviço 4G LTE nos maiores mercados da América Latina entre o segundo e o terceiro trimestres de 2019 e descobrimos que o Peru teve a maior disponibilidade do 4G no período, com 77,8%. O Chile ficou em segundo, com 75,5%, enquanto a Argentina ficou em terceiro com 71,4%. O Brasil teve a menor disponibilidade do 4G, com 47,3%, enquanto a Colômbia teve a segunda menor, com 50,6%.

Velocidades no meio urbano variam de acordo com a tecnologia

Ookla_Internet-Speeds-in-Latin-America-Largetst-Cities_1019_PT

A velocidade de banda larga fixa aumentou dramaticamente nas maiores cidades da América Latina desde a nossa última análise, o que alterou os rankings de maneira significativa. Santiago, no Chile, teve a maior velocidade de download em banda larga fixa entre o segundo e terceiro trimestres de 2019, acima do segundo lugar, Brasília, com 66,6%. São Paulo ficou em terceiro lugar, com uma porcentagem próxima. Bogotá, na Colômbia, teve a menor velocidade de download em banda larga fixa nas cidades da lista. Lima, no Peru, teve a segunda menor velocidade, com a Cidade do México, no México, em terceiro.

Devido à situação política da Venezuela, Caracas não foi incluída na análise.

Os rankings de rede móvel mudaram significativamente desde nossa última análise da velocidade nas maiores cidades da América Latina. Salvador teve a maior velocidade de download em rede móvel durante o período. Brasília ficou em segundo lugar por pouco, enquanto a Cidade do México, no México, ficou em terceiro. Bogotá, na Colômbia, também teve a menor velocidade de download em rede móvel na nossa lista. Santiago, no Chile, teve a segunda menor velocidade para redes móveis, seguida por Fortaleza, que teve a terceira menor velocidade.

A Ookla estará na Futurecom! Entre em contato conosco para saber mais sobre o mercado de telecomunicações da América Latina e como nossos dados podem ajudá-lo.

Ookla retains ownership of this article including all of the intellectual property rights, data, content graphs and analysis. This article may not be quoted, reproduced, distributed or published for any commercial purpose without prior consent. Members of the press and others using the findings in this article for non-commercial purposes are welcome to publicly share and link to report information with attribution to Ookla.

| May 22, 2019

Measuring the Success of Government Broadband Efforts in Saudi Arabia, Australia and Ireland

At Ookla, we well know that as internet speeds are getting faster, end users’ speed expectations are rising and the volume of data consumed by those users is growing exponentially. Ensuring that the rollout of digital services is fair and balanced to populations regardless of location poses a regulatory and commercial dilemma. So far, providing internet services, and in particular high-speed broadband, in rural areas has proven difficult in numerous countries.

Fixed broadband infrastructure is complex and expensive enough that governments in some countries have helped by creating regulatory environments which encourage (and in some cases subsidize) internet providers rolling out high-speed internet. Here at Ookla we are often lucky enough to be in the front seat viewing how different countries and regulators approach this tricky subject. We’ve evaluated the outcomes of government-involved fiber rollouts in Saudi Arabia and Australia using Speedtest data. Based on lessons learned in both, we make predictions about the likely successes and pain points in the coming effort in Ireland.

Incentivizing world-class speeds in Saudi Arabia

Since 2018 Ookla has been providing the Ministry of Communications and Information Technology (MCIT) in the Kingdom of Saudi Arabia with data to benchmark national internet speeds as part of a project to drive those speeds up. The Saudi Arabian Vision 2030 project is designed to transform the Kingdom of Saudi Arabia across all facets of commercial life and propel the economy forward. One of the key strategies is to ensure that the telecommunications and internet infrastructure is not just adequate but is one of the best in the world.

Unlike in other markets where governments engage in long and costly procurement processes to eventually choose a partner for infrastructural projects, the Saudi government has set about working directly with the incumbent operators to try and improve all underlying technologies. This includes setting ambitious speed and technology targets to be met by operators. Should the operators meet these targets, they can unlock financial incentives and grants.

This strategy has connected 1,000,000 homes to fiber-to-the-home (FTTH) services and resulted in a gigantic improvement in both fixed internet and mobile internet speeds in Saudi Arabia. Using data from Speedtest IntelligenceTM, we’ve seen Saudi Arabia’s mean download speed over fixed broadband increase 97.2% between January 2017 and December 2018. The country’s ranking on the Speedtest Global Index® also improved significantly, showing that Saudi Arabia’s fixed broadband speed was rising at a faster rate than several other countries during that time period.

Saudi-mean-speed-line-graphs-1

The histograms below show how widespread those improvements are. Whereas 29.0% of fixed broadband samples in Saudi Arabia during Q1 2018 showed mean download speeds of 5 Mbps or less, in Q1 2019 that number was down to 18.3%. We can also see that mean download speeds over 50 Mbps make up an increasing percentage of results. Each sample represents the cumulative test results for each unique device/user per location, per calendar day.

Ookla_Improvement_Mobile_Performance_Saudi_Arabia

What we see in the Kingdom of Saudi Arabia is what can be achieved when a regulator, government and operators all follow a direct course of action. In the context of global plans of this nature, the rate of improvement in Saudi Arabia is quicker than what we see in other markets.

Constructing a National Broadband Network in Australia

Australia took a much different approach than Saudi Arabia to try and solve a similar problem. In 2009, the NBN Co, an Australia Government Business Enterprise, set out to bridge the digital divide by supplying Australian residents fast and affordable broadband access regardless of their location. The intent was to construct an open-access broadband network under a wholesale approach where consumers purchase plans through any Internet Service Provider (ISP) utilizing the NBN network. A decade later, nearly 75% of Australian homes and businesses have access to this service and the expected completion date is currently slated for 2020.

According to Speedtest Intelligence, the average broadband download speed in Australia has seen a steady rise over the past year and a 60.1% increase from January 2017 to December 2018. However, more aggressive competition and speed increases by other countries have left Australia with a declining rank on the Speedtest Global Index.

Aus-mean-speed-line-graphs-1

Looking at the distribution of speeds, Australians saw a decline in the percentage of samples achieving download speeds of 25 Mbps or slower between Q1 2018 and Q1 2019. Whereas 66.0% of fixed broadband samples had a mean download speed of 25 Mbps or slower in Q1 2018, that number fell 24.8% to 49.6% in Q1 2019. Correspondingly, there was an increase in results in the 25-50 Mbps range during the same period, rising 62.0% from 20.5% of samples to 33.2%. Looking at samples at the highest end of the scale in Australia, the percentage of samples achieving speeds of 50 Mbps or more increased 26.7% from 13.5% of samples to 17.1%.

Ookla_Improvement_Mobile_Performance_Australia

Many Australian consumers are unhappy with the quality and type of service they are receiving on the NBN network. One major struggle is due to the Multi-Technology Mix (MTM) approach used by NBN Co from the beginning. Over the past ten years, the network has adapted three separate approaches at different times in different locations: fiber-to-the-premises (FTTP), fiber-to-the-node (FTTN) and fiber-to-the-curb (FTTC), each having vastly different capabilities. As such, quality of service for consumers depends significantly on location. Maintenance costs will also be an issue in years to come because of the mix of technologies and the continued use of degrading copper wires.

Leading up to the Australian federal elections held on May 18th, the Labor party proposed a solution to these current NBN complications through an economic review of the project and plans to upgrade technologies. The party pressed the need for improvement to FTTN households and a financially responsible future for the NBN. Because of the contentious nature of the NBN, many speculated that Labor might win the election. Surprisingly, the Liberal party won out. It remains to be seen what this says for the NBN going forward. The Liberal party has emphasized a shift away from FTTP to a multi-technology approach to connect more homes more quickly and for less money, but FTTC and FTTN offer slower internet speeds than FTTP and could result in further expense to maintain copper wiring down the line.

As of March 2019, only three states and territories are likely to achieve the intended speed capabilities (50 Mbps) once the project completes in 2020: New South Wales, Victoria and the Northern Territory. Other regions in Australia do not expect to see more than 85% of premises reaching the 50 Mbps range which causes consumers continued doubt whether they will strike the lottery in terms of broadband speed.

Ireland’s newest effort to improve rural speeds

As large countries with a predominantly urban populace but rural communities that need internet access, Saudi Arabia and Australia have a lot in common with Ireland. In fact, Ireland has been through numerous iterations of national broadband schemes over the past 15 years. Despite Ireland’s small size it has a large broadband divide, with over 540,000 homes unable to access a reasonable fixed line broadband service. Many use mobile or wireless alternatives outside of urban areas. These alternatives often mean lower speeds at increased prices.

Ireland-mean-speed-line-graphs-1

Although an 80.1% increase in mean download speed over fixed broadband from January 2017 to December 2018 and an improving Irish rank on the Speedtest Global Index look healthy for a country of its size, the large number of homes that have no credible access makes the average an incomplete way to look at Ireland’s issues. In Q1 2018, 75.3% of samples in Ireland were receiving speeds of 50 Mbps or slower. In Q1 2019, that number had only decreased 5.8% to 70.9% of samples. The percentage of samples with mean download speeds between 50 and 100 Mbps increased 10.8% from 14.8% to 16.4%. Samples above 100 Mbps increased 28.3% from 9.9% in Q1 2018 to 12.7% in Q1 2019.

Ookla_Improvement_Mobile_Performance_Ireland

Recently the Irish state appointed a preferred bidder after a procurement process to subsidize a fiber network to 540,000 homes. This project is to be rolled out over the next 7 years. Oddly the process saw all but one of the prospective bidders pull out before its conclusion, which raised numerous questions as to the viability of the underlying plan. The current estimated cost to the Irish taxpayer is €2.1 billion. However, unlike in the Saudi Arabian and Australian markets, the resulting network will be owned and controlled not by the state or one of the current consumer telecoms firms but by the preferred bidder. Regardless, it is planned that the network will operate as an underlying wholesale network, similar to NBN in Australia.

The timing of the announcement of the preferred bidder, the probable costs and the ownership structure (weeks in advance of local and European elections) has led to speculation that there was a political motive to the announcement and that Ireland is still some time away from solving its internet black spots.

Speedtest Intelligence is a resource for many governments as they work to improve access and speeds for their citizens. Learn more about our global performance metrics.

Ookla retains ownership of this article including all of the intellectual property rights, data, content graphs and analysis. This article may not be quoted, reproduced, distributed or published for any commercial purpose without prior consent. Members of the press and others using the findings in this article for non-commercial purposes are welcome to publicly share and link to report information with attribution to Ookla.

| July 19, 2017

Ranking the Busiest Airports in South America by Internet Speed

Whether you’ve been closely following our fastest airports on every continent series or you’re simply headed to the southern hemisphere for a little winter in your summer, you must be dying to know which airports have the fastest free Wi-Fi and where you should use cellular service instead. Without further ado, Speedtest data from March through May 2017 reveals which of the busiest airports in South America is also the fastest.

Fastest airport Wi-Fi

São Paulo/Congonhas Airport has the fastest download speed over free airport Wi-Fi of all the airports we looked at in South America. And their upload speed is even faster. Compared with Brazil’s country-wide download speed over mobile Wi-Fi of 13.79 Mbps, travelers using the Wi-Fi at Congonhas should be able to enjoy the best that the internet offers while waiting for connecting flights.


Average download speeds over free Wi-Fi at the rest of the busiest airports in South America are similar to those in much of Europe or Africa. And that’s not a good thing. Some of the download speeds, like those at second-place Jorge Chávez International Airport in Lima and Bogotȧ’s El Dorado International, are serviceable. But those at airports in Belo Horizonte, Brazil; Brasília, Brazil; Buenos Aires, Argentina and Caracas, Venezuela are likely to leave you daydreaming about faster service while you wait for your pages to load.

This is less surprising in Venezuela where the average download speed over Wi-Fi is 3.18 Mbps than it is in Colombia (9.05 Mbps) or Argentina (10.86 Mbps) during the same time period analyzed. Lima’s airport download speed is slightly faster than the Peruvian average of 10.68 Mbps while the Wi-Fi download speed at Chile’s busiest airport falls far behind that of the country as a whole (26.23 Mbps).

On the other hand, the Wi-Fi upload speed at Bogotȧ’s airport is remarkably fast.

Fastest airport cell

With just over a 10 Mbps difference between fastest and slowest, cellular download speeds at the busiest airports in South America fell into a much narrower band than those on any other continent we’ve surveyed so far. Upload speeds are even more similar to one another with less than 6 Mbps separating the fastest airport from the slowest.


Tancredo Neves/Confins International Airport in Belo Horizonte had the fastest cellular download speed of any of the airports we looked at in South America. The download speed there is nearly twice as fast as the 13.70 Mbps average for Brazil as a whole during the same period. Jorge Chávez International Airport in Lima had the fastest upload speed.

Comodoro Arturo Merino Benítez International Airport in Santiago, Chile took second place for both download and upload speeds over cellular. The download speed at the airport is 22% faster than Chile’s average cellular download speed of 16.23 Mbps.

The cellular download speed at Simón Bolívar International Airport in Caracas is 75% faster than Venezuela’s country average of 8.89 Mbps. Meanwhile, the airports we surveyed in Lima, Peru and Bogotȧ, Colombia both have slower download speeds than their country averages. The average cellular speed for Peru as a whole was 16.97 Mbps. In Colombia it was 14.76 Mbps.

Only at Jorge Newbery Airfield in Buenos Aires, Argentina was the cellular download speed almost exactly the same as the country’s average of 12.06 Mbps.

Wi-Fi or cell?

Unless you’re traveling through São Paulo/Congonhas Airport, cellular service is a much better choice than Wi-Fi at South America’s busiest airports. In many cases, cellular download speeds are several times faster than those over Wi-Fi.


Regional trends

Brazil

Brazil has decent cellular speeds, but their Wi-Fi speeds are all over the map. Avoid the Wi-Fi in Belo Horizonte or Brasília. While at São Paulo/Congonhas Airport the Wi-Fi is your best bet as the speeds are the fastest we saw at any airport in South America on either cell or Wi-Fi.

Andean States

Cellular download speeds at airports in Colombia, Peru and Venezuela are perfectly workable. In each of the airports we looked at in this region, cellular downloads are significantly faster than Wi-Fi. Especially in Venezuela where the Wi-Fi download speed is as awful as you might expect in a politically unstable country.

Southern Cone

Airport internet in the two Southern Cone countries we examined differed widely. Although neither Chile nor Argentina had fast free Wi-Fi in their major airports, downloads over free airport Wi-Fi were especially slow in Buenos Aires. And cellular downloads in Chile’s busiest airport were 62% faster than those at Jorge Newbery Airfield in Argentina.

Ookla retains ownership of this article including all of the intellectual property rights, data, content graphs and analysis. This article may not be quoted, reproduced, distributed or published for any commercial purpose without prior consent. Members of the press and others using the findings in this article for non-commercial purposes are welcome to publicly share and link to report information with attribution to Ookla.

| May 30, 2019

Mobile Speeds, 4G Availability and Coverage in Latin America’s Largest Markets

Leer en español | Leia em Português

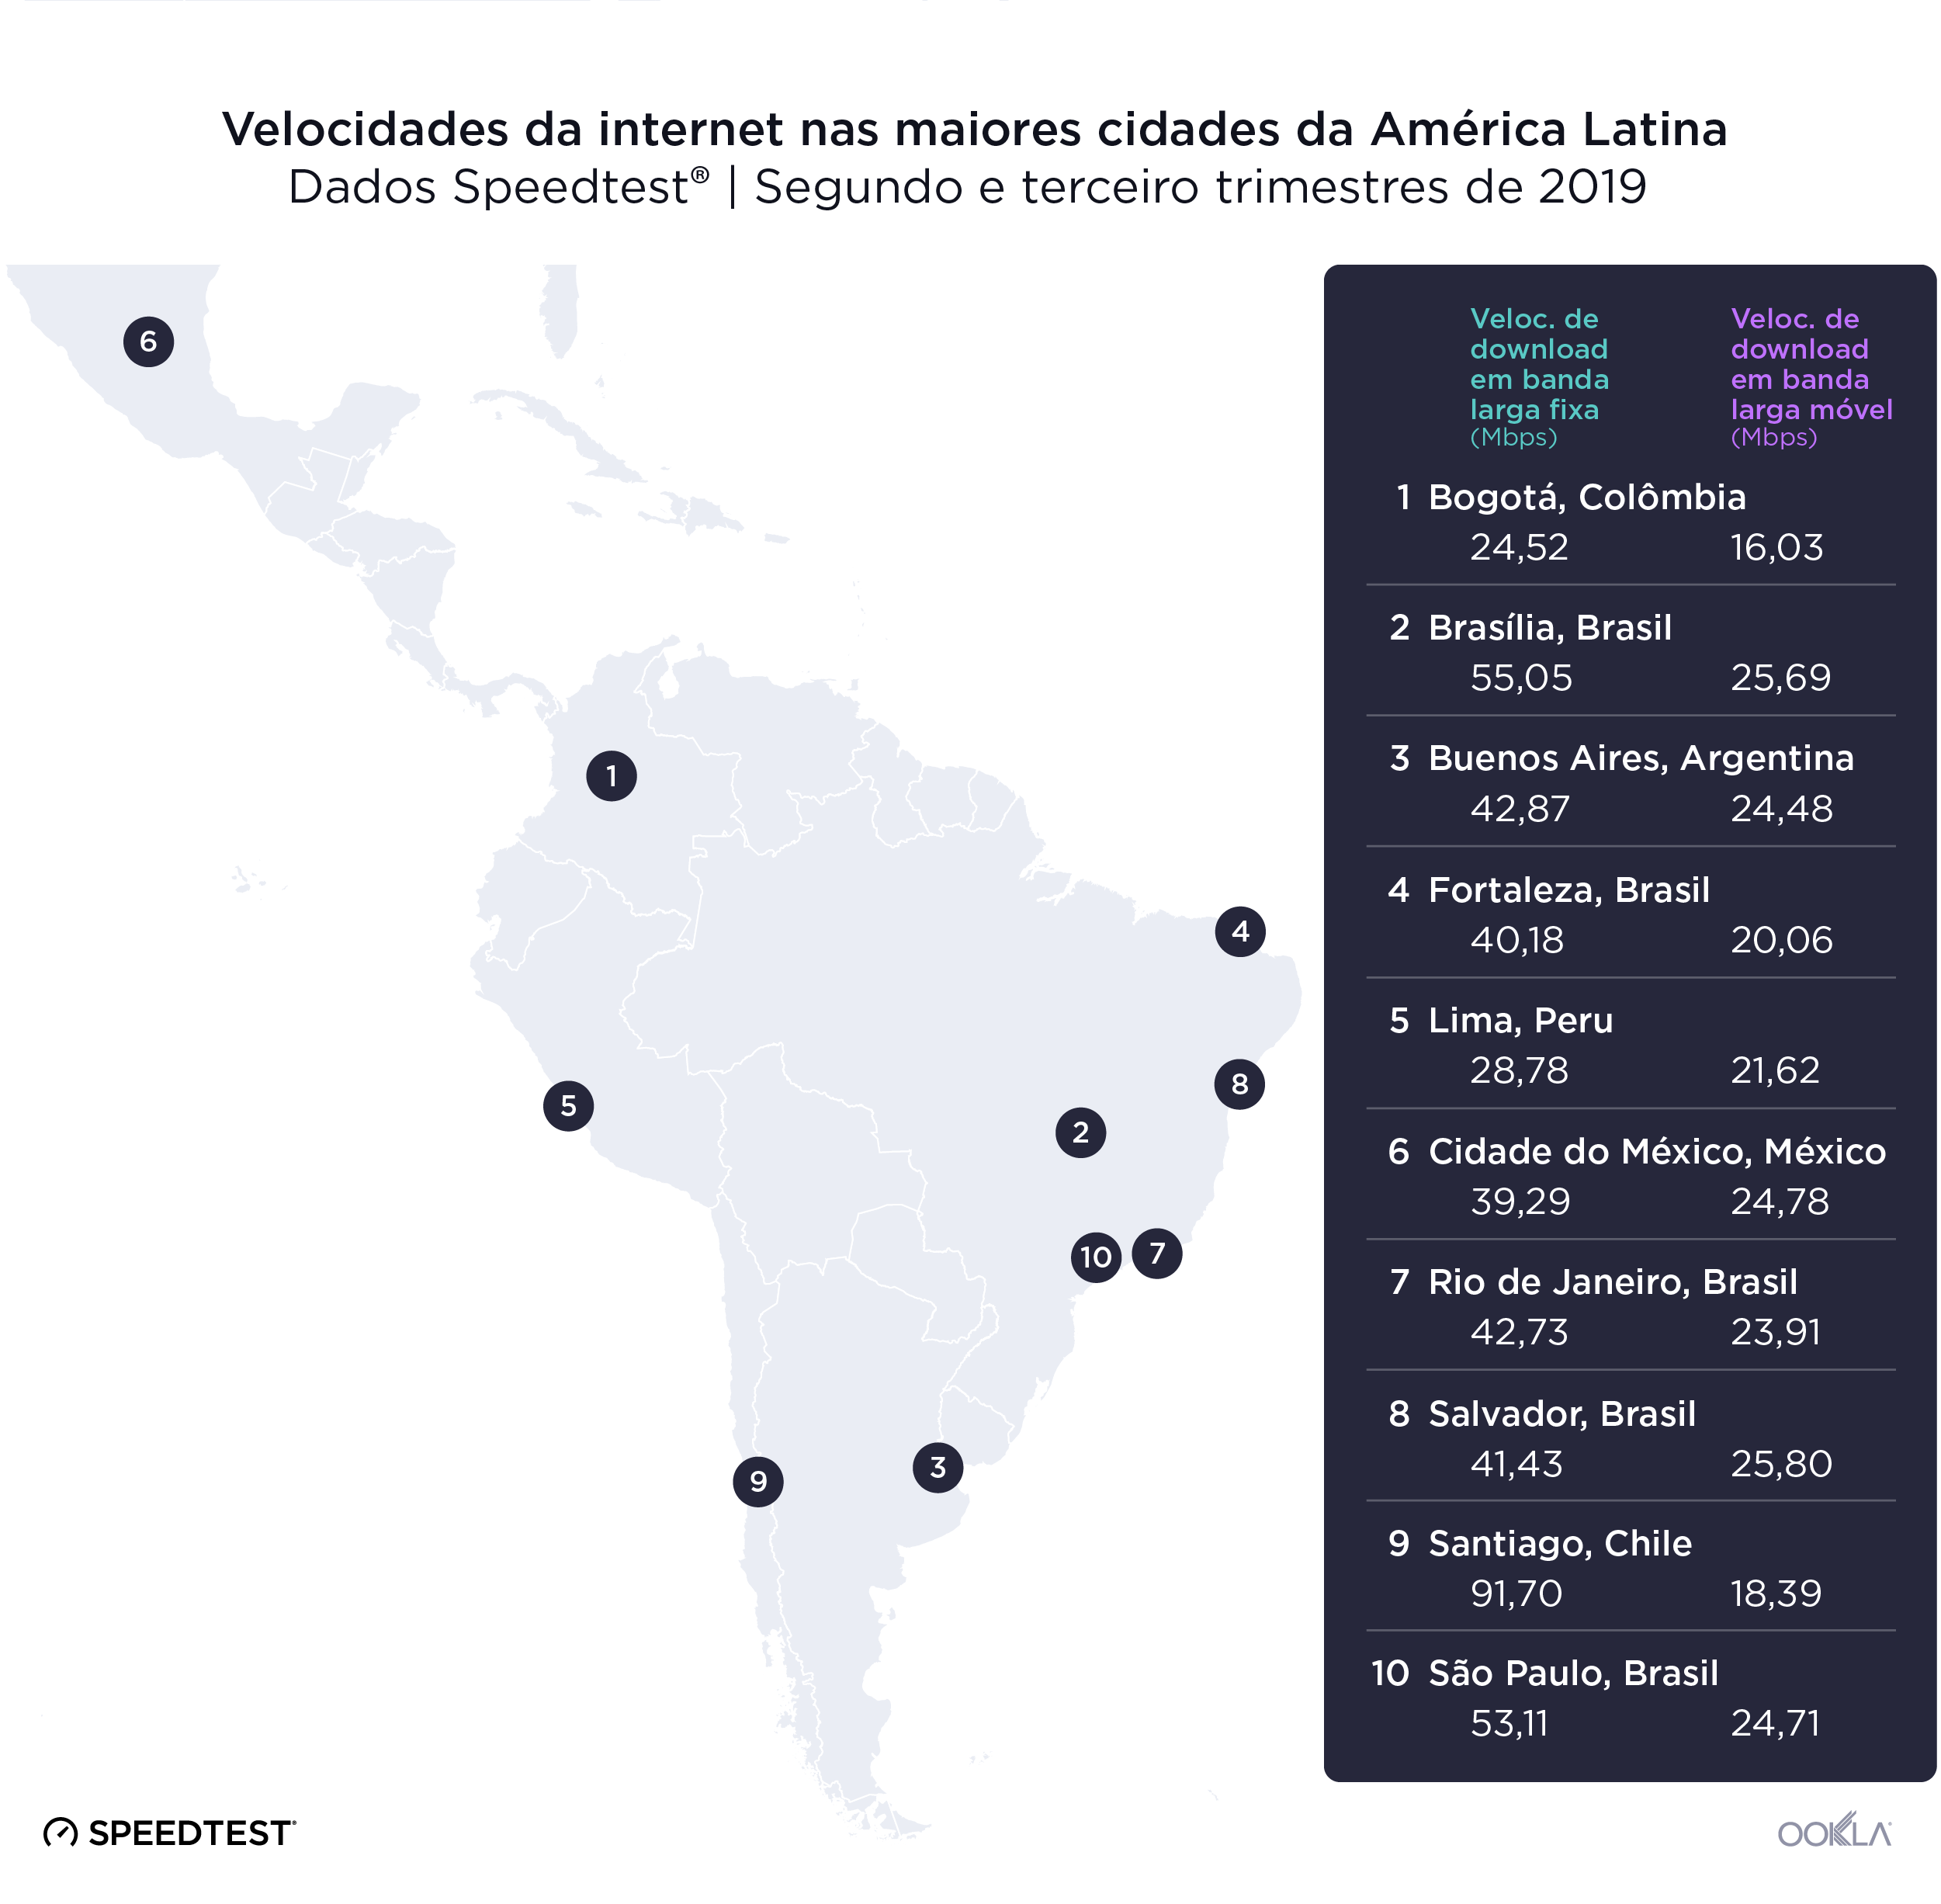
Major markets in Latin America, in most cases, saw double-digit percent increases in mean mobile download speeds during the past year. While the only 5G deployments we’ve yet seen in Latin America are in Uruguay and Brazil, operators across the continent are working to expand 4G LTE and prepare for future technologies. Using data from Speedtest Intelligence we’ve examined mobile download speeds to see which countries are fastest and which are quickly improving. We’ve also analyzed which countries offer the best access to 4G and which operators are leading the way in speeds and coverage. For further context, we’ve included a look at speeds and 4G Availability in Central America.

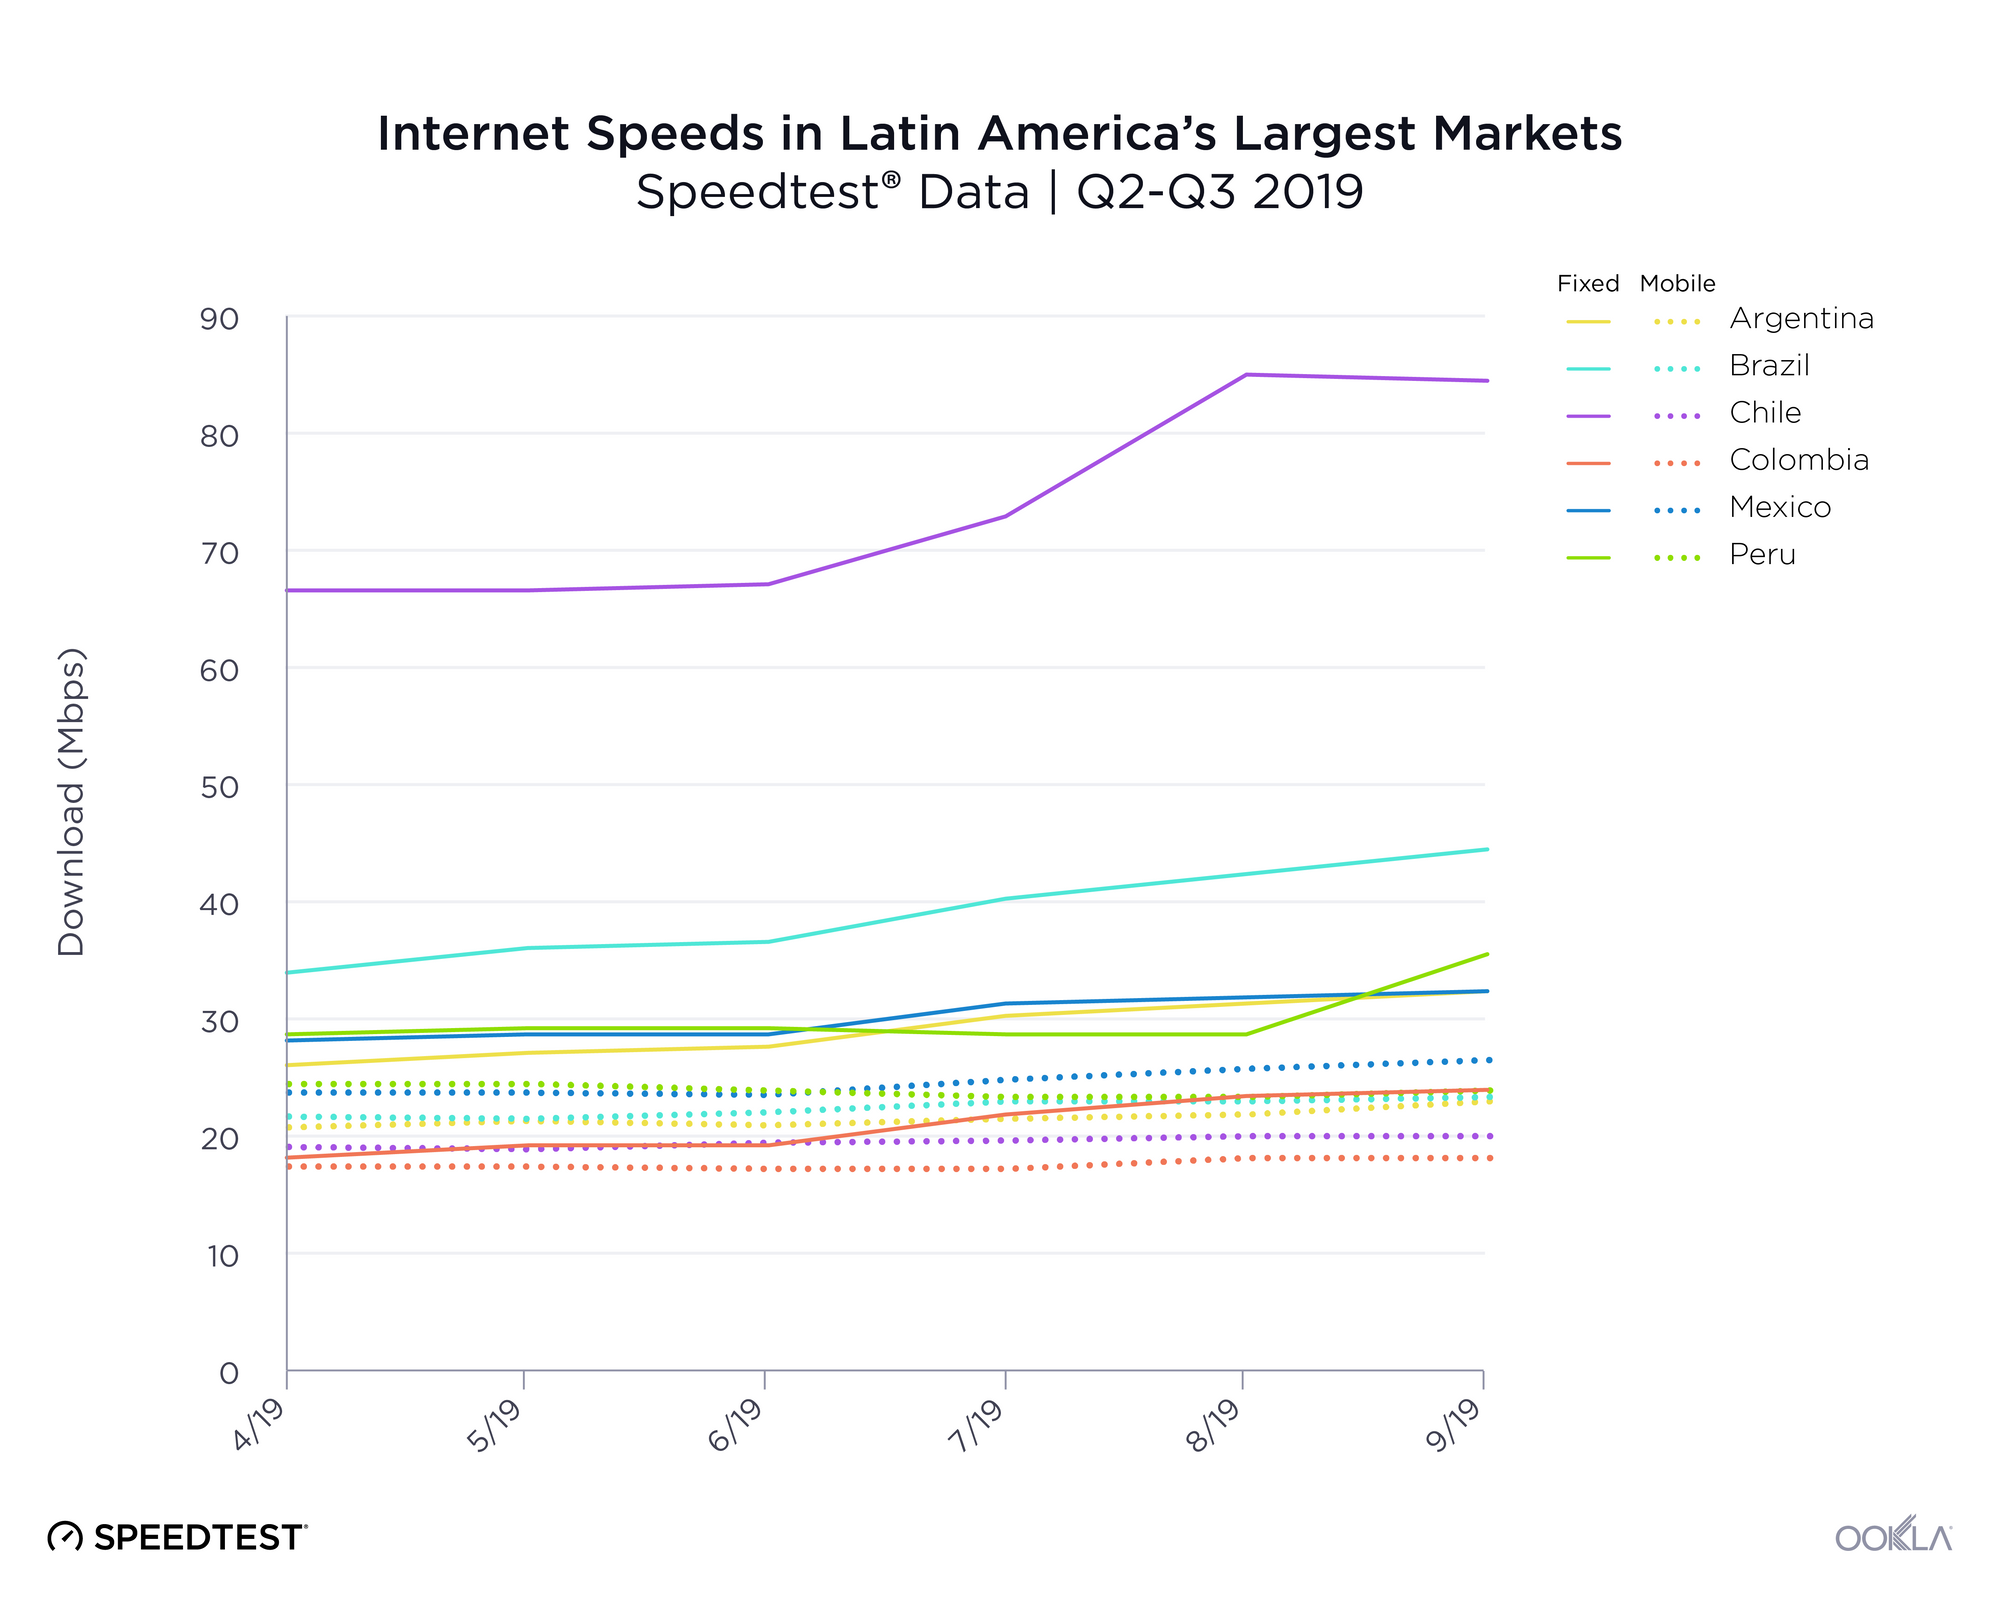
Mobile speeds improved in most of Latin America’s major markets

As we saw last year, Peru had the fastest mean download speed of the group during Q1 2019, and the third largest year-over-year increase. Argentina showed the largest percentage increase and came in fourth during Q1 2019. Mexico is the exception with a second-place download speed but a 4% decline in mobile speed since last year.

Mobile Speeds in Latin America’s Largest Markets
Q1 2019 | Speedtest Data
Country Mean Download (Mbps) % Change YOY
Peru 23.07 15.4%
Mexico 22.02 -4.0%
Brazil 21.30 25.7%
Argentina 19.78 37.5%
Chile 18.47 13.6%
Colombia 17.36 10.3%

Fastest mobile operators

We also looked at the fastest mobile operator in each country during Q1 2019 using Speed ScoreTM (a weighted trimean that combines download and upload speeds) for top providers (operators with 3% or larger market share) on modern devices.

Claro, the Mexican-owned telecommunications company, achieved the highest Speed Score in Peru, Chile and Brazil. In Peru this was due to the combination of 700 MHz LTE and 300 Mbps LTE-A service. In Chile, Claro is mainly using the 700 MHz and 2600 MHz spectrum. Claro uses 700 MHz in Brazil to augment the existing 1800 MHz and 2600 MHz networks, and additional capacity is available in places like Rio de Janeiro where Claro has deployed a 1 Gbps capable License Assisted Access (LAA) network in select locations.

Fastest Operators in Latin America’s Largest Markets
Q1 2019 | Speedtest Data
Country Mobile Operator Speed ScoreTM
Argentina Personal 23.16
Brazil Claro 29.48
Chile Claro 23.53
Colombia TigoUNE 17.78
Mexico Telcel 26.20
Peru Claro 28.43

Personal delivered the fastest speeds in Argentina via 700 MHz, 1700 MHz and 2600 MHz plus carrier aggregation. Personal now provides service in over 1,350 towns and cities, having added 390 new locations in 2018. TigoUNE in Colombia launched LTE-Advanced speeds of up to 230 Mbps in parts of Bogota and Medellín. Mexico’s fastest operator, Telcel, has quietly started deploying gigabit class LTE to 76 cities throughout Mexico.

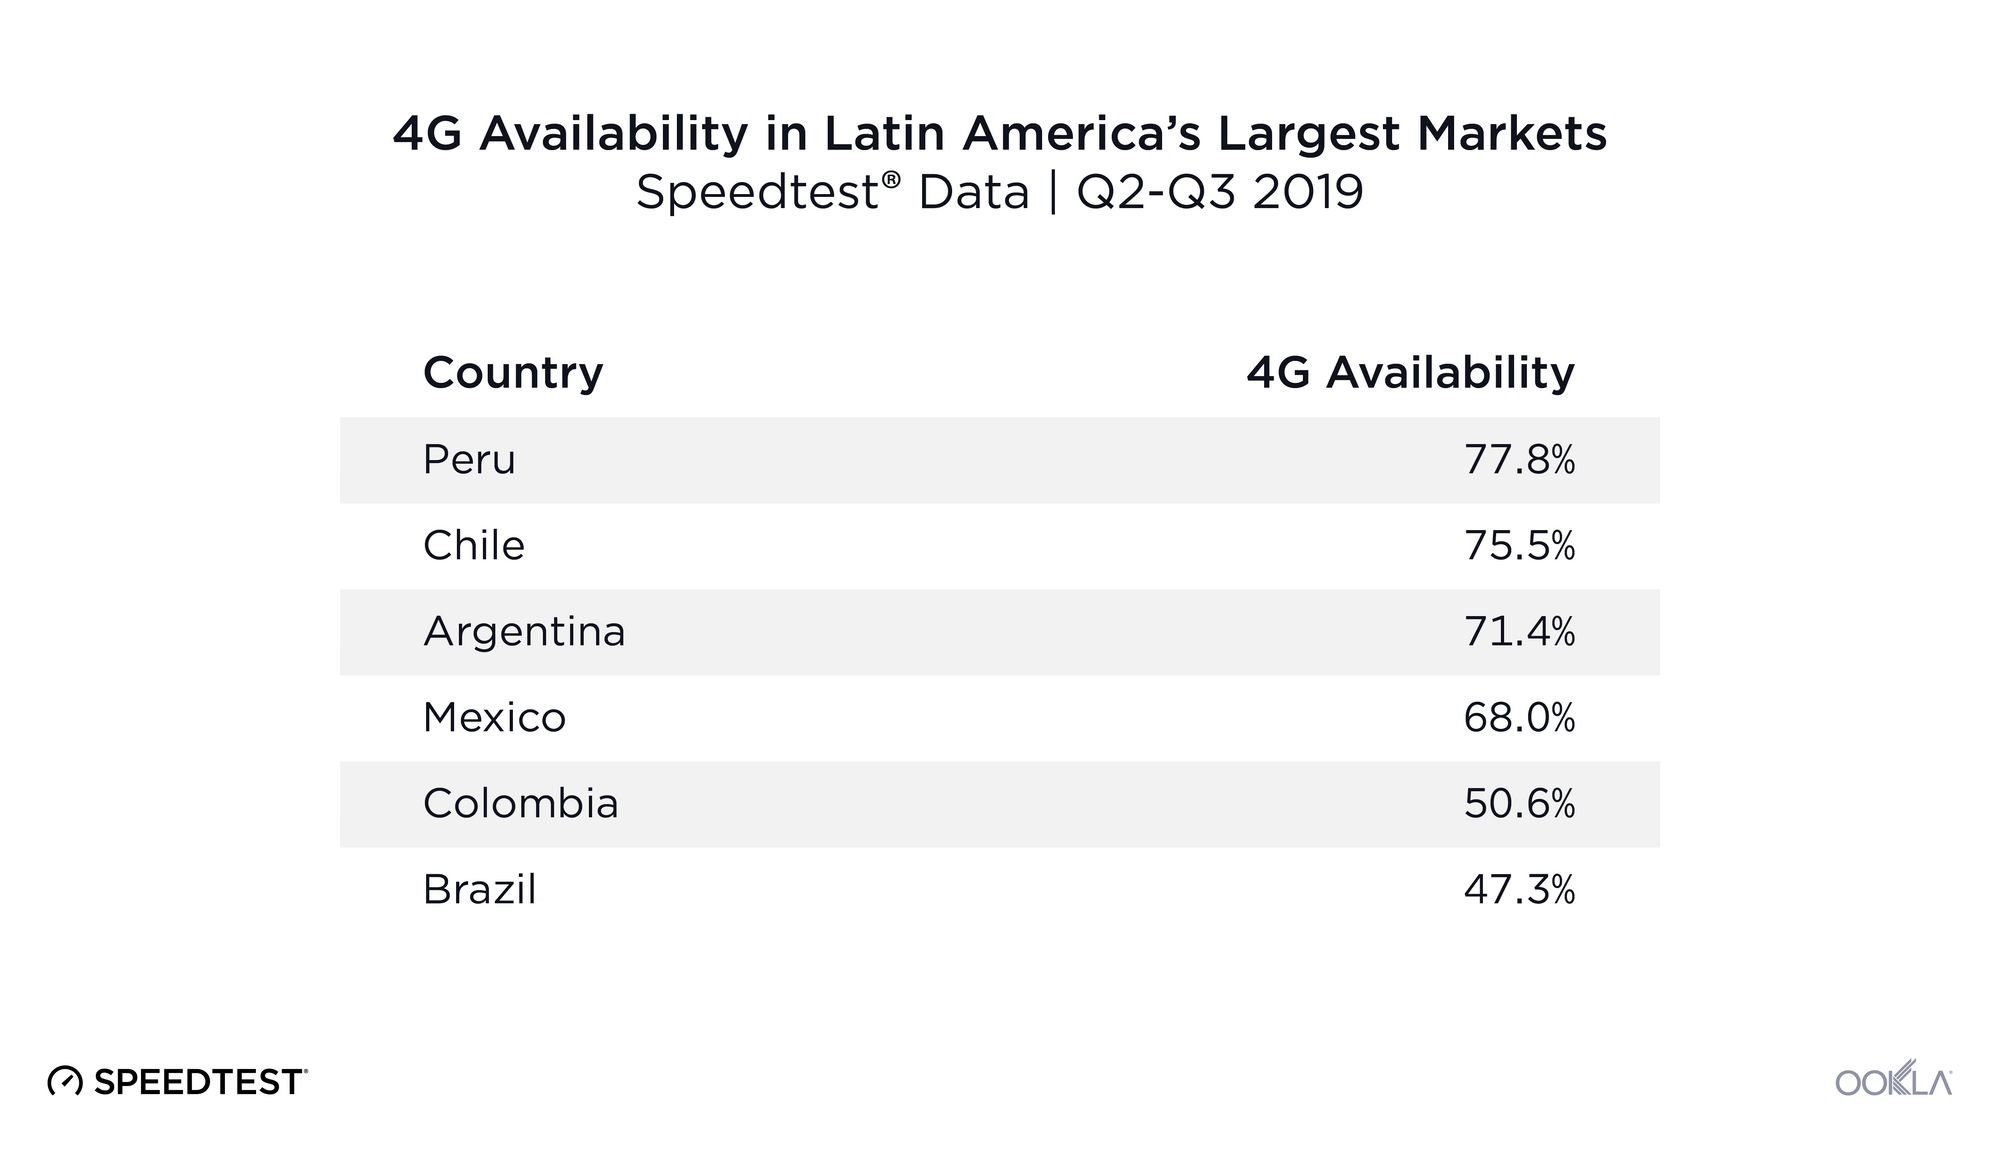
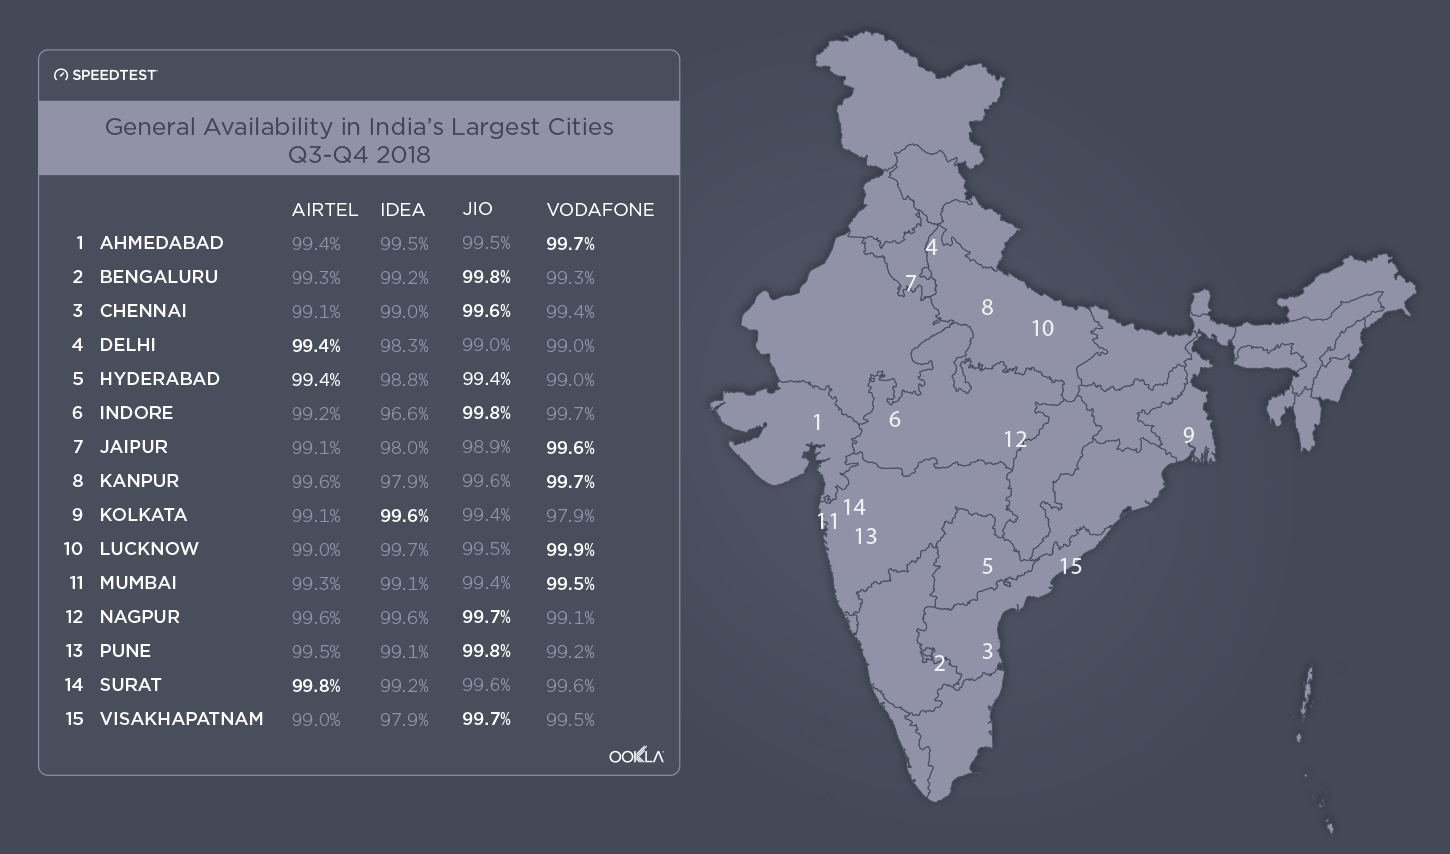
Cellular service is widely available while 4G Availability varies

Speedtest data shows that mobile users in Latin America’s largest markets were able to find service in 96% or more of surveyed locations. Chile showed the best General Availability at 99.7%. Colombia was second and Peru third. Brazil came in last for General Availability with 96.9%.

4G Availability in Latin America’s Largest Markets
Q1 2019 | Speedtest Data
Country General Availability 4G Availability
Chile 99.7% 78.9%
Colombia 99.3% 59.3%
Peru 99.2% 87.4%
Argentina 98.7% 76.9%
Mexico 98.3% 76.7%
Brazil 96.9% 54.9%

On the other hand, a mobile user’s ability to consistently access 4G is highly dependent on which country they live in. Customers in Peru have the best chance of connecting to LTE with a 4G Availability of 87.4%. Chile, Argentina and Mexico all show 4G Availability in the mid- to upper-70s. Brazil showed the worst 4G Availability in Latin America’s largest markets with mobile users accessing LTE a majority of the time in only 54.9% of surveyed locations.

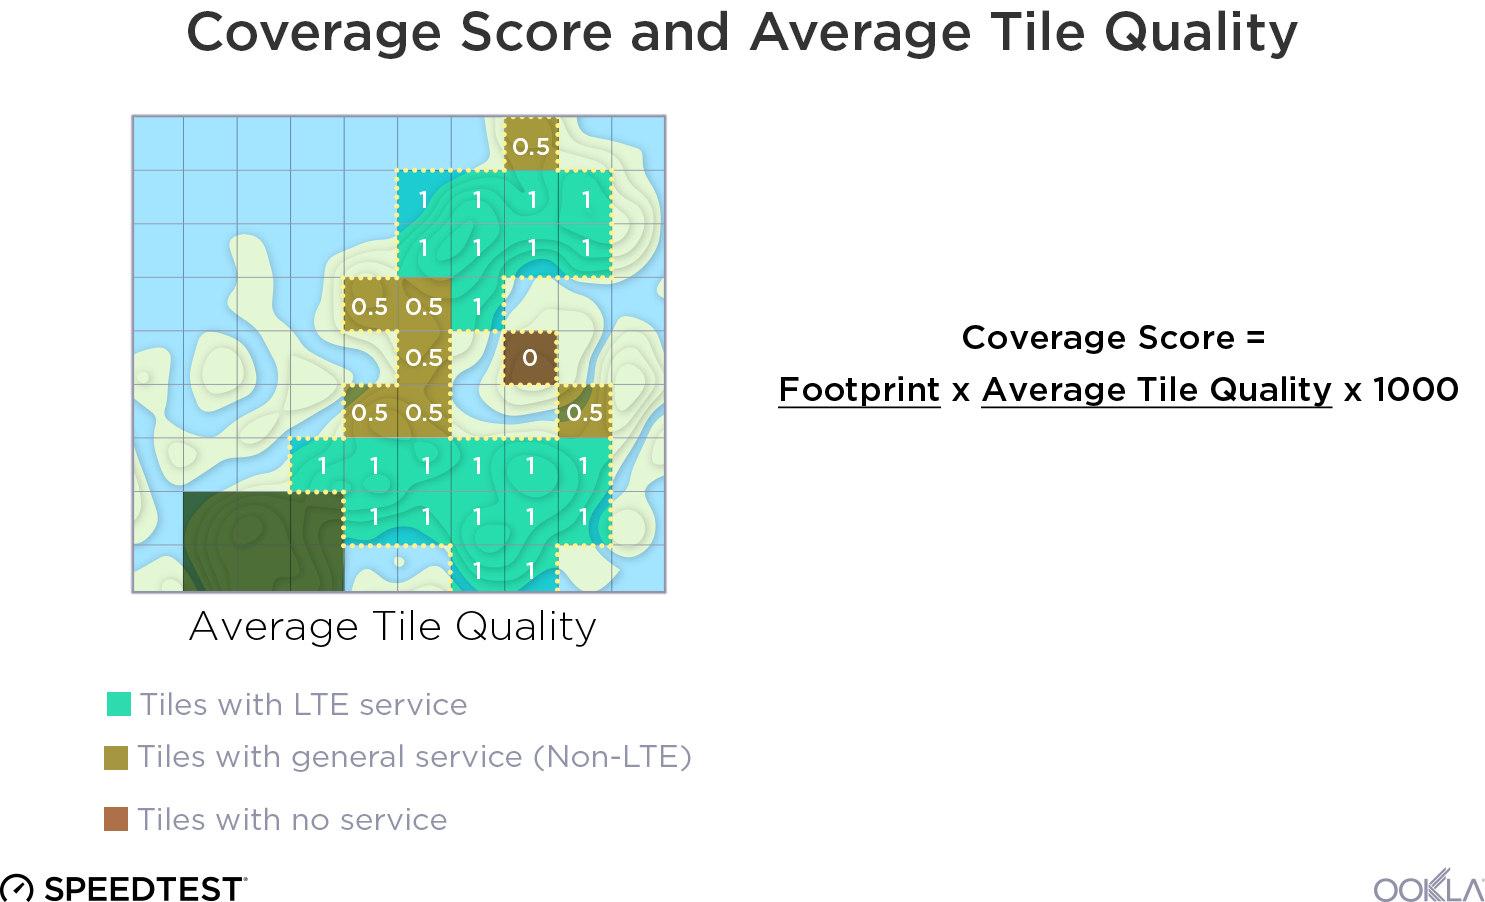
Mobile operators with the best coverage

Coverage can be as important as speeds, especially in countries with large rural areas and/or difficult terrains. To better understand who offers the best coverage in a country, Ookla aggregates a score for coverage based on where each operator offers service and the average quality of service in those areas. The higher an operator’s Coverage ScoreTM for a given area, the more locations in that overall area where the operator has high quality service.

We looked at which of the top providers showed the best coverage in each country and found that Telcel, a subsidiary of América Móvil, in had the highest Coverage Score in Mexico during Q1 2019. Another América Móvil subsidiary, Claro had the best coverage in both Colombia and Argentina. Telefónica subsidiary Movistar topped the list in Peru and Chile and Vivo, also a subsidiary of Telefónica, had the best coverage in Brazil. Coverage Score is not comparable across countries due to differing geographies.

Operators with Best Coverage in Latin America’s Largest Markets
Q1 2019 | Speedtest Data
Country Mobile Operator Coverage ScoreTM
Argentina Claro 570
Brazil Vivo 547
Chile Movistar 690
Colombia Claro 638
Mexico Telcel 816
Peru Movistar 697

How Central American mobile speeds and availability compare

Smaller markets in Latin America also show interesting dynamics. While some parts of Central America have struggled with poverty, political unrest and corruption, others have not. What’s interesting is that mobile speeds and 4G Availability aren’t always hindered by these conditions in the ways that we might expect.

Mobile Speeds and Availability in Central America
Q1 2019 | Speedtest Data
Country Mean Download (Mbps) General Availability 4G Availability
Belize 23.30 99.4% 67.5%
Costa Rica 19.22 99.5% 45.7%
El Salvador 8.79 99.9% 34.9%
Guatemala 16.75 99.9% 65.9%
Honduras 21.29 99.5% 51.4%
Nicaragua 20.13 99.8% 45.8%
Panama 9.74 99.8% 74.4%

The good news is good. Belize showed the fastest mean download speeds over mobile in Central America in Q1 2019, faster even than those in Peru. Mobile download speeds in Honduras, Nicaragua and Costa Rica were also particularly strong and would place them in the mid- to upper-range if we combined Central America with the list of largest markets. General Availability is above 99% in all Central American countries and Panama showed the best 4G Availability at 74.4%.

The bad news is not great. While mean mobile download speeds in Panama and El Salvador are fast enough to stream HD video, they are much slower than in Latin America’s largest markets and place these countries in line with speeds experienced in Haiti. El Salvador also showed the lowest 4G Availability in Central America at 34.9%. 4G Availability in Nicaragua and Costa Rica was also relatively low at 45.8% and 45.7%, respectively.

We’ll continue watching these markets to see how improving speeds change rankings and how network enhancements affect 4G Availability. If you are interested in detailed views of these metrics and more, learn more about Speedtest Intelligence.


Velocidades, disponibilidad de 4G y cobertura de la telefonía móvil en los mercados más importantes de América Latina

En la mayoría de los casos, los principales mercados de América Latina experimentaron aumentos de dos dígitos en las velocidades medias de descarga móvil durante el año pasado. Mientras que la única implementación de 5G que se ha visto en América Latina se realizó en Uruguay, los operadores de todo el continente están trabajando para expandir el 4G LTE y prepararse para las tecnologías futuras. Con datos de Speedtest Intelligence, examinamos las velocidades de descarga móvil para ver en qué países son más rápidas y en cuáles están mejorando rápidamente. También analizamos qué países ofrecen el mejor acceso al 4G y qué operadores son los líderes en velocidad y cobertura. Para ofrecer un mayor contexto, incluimos un breve análisis de la disponibilidad de 4G en América Central.

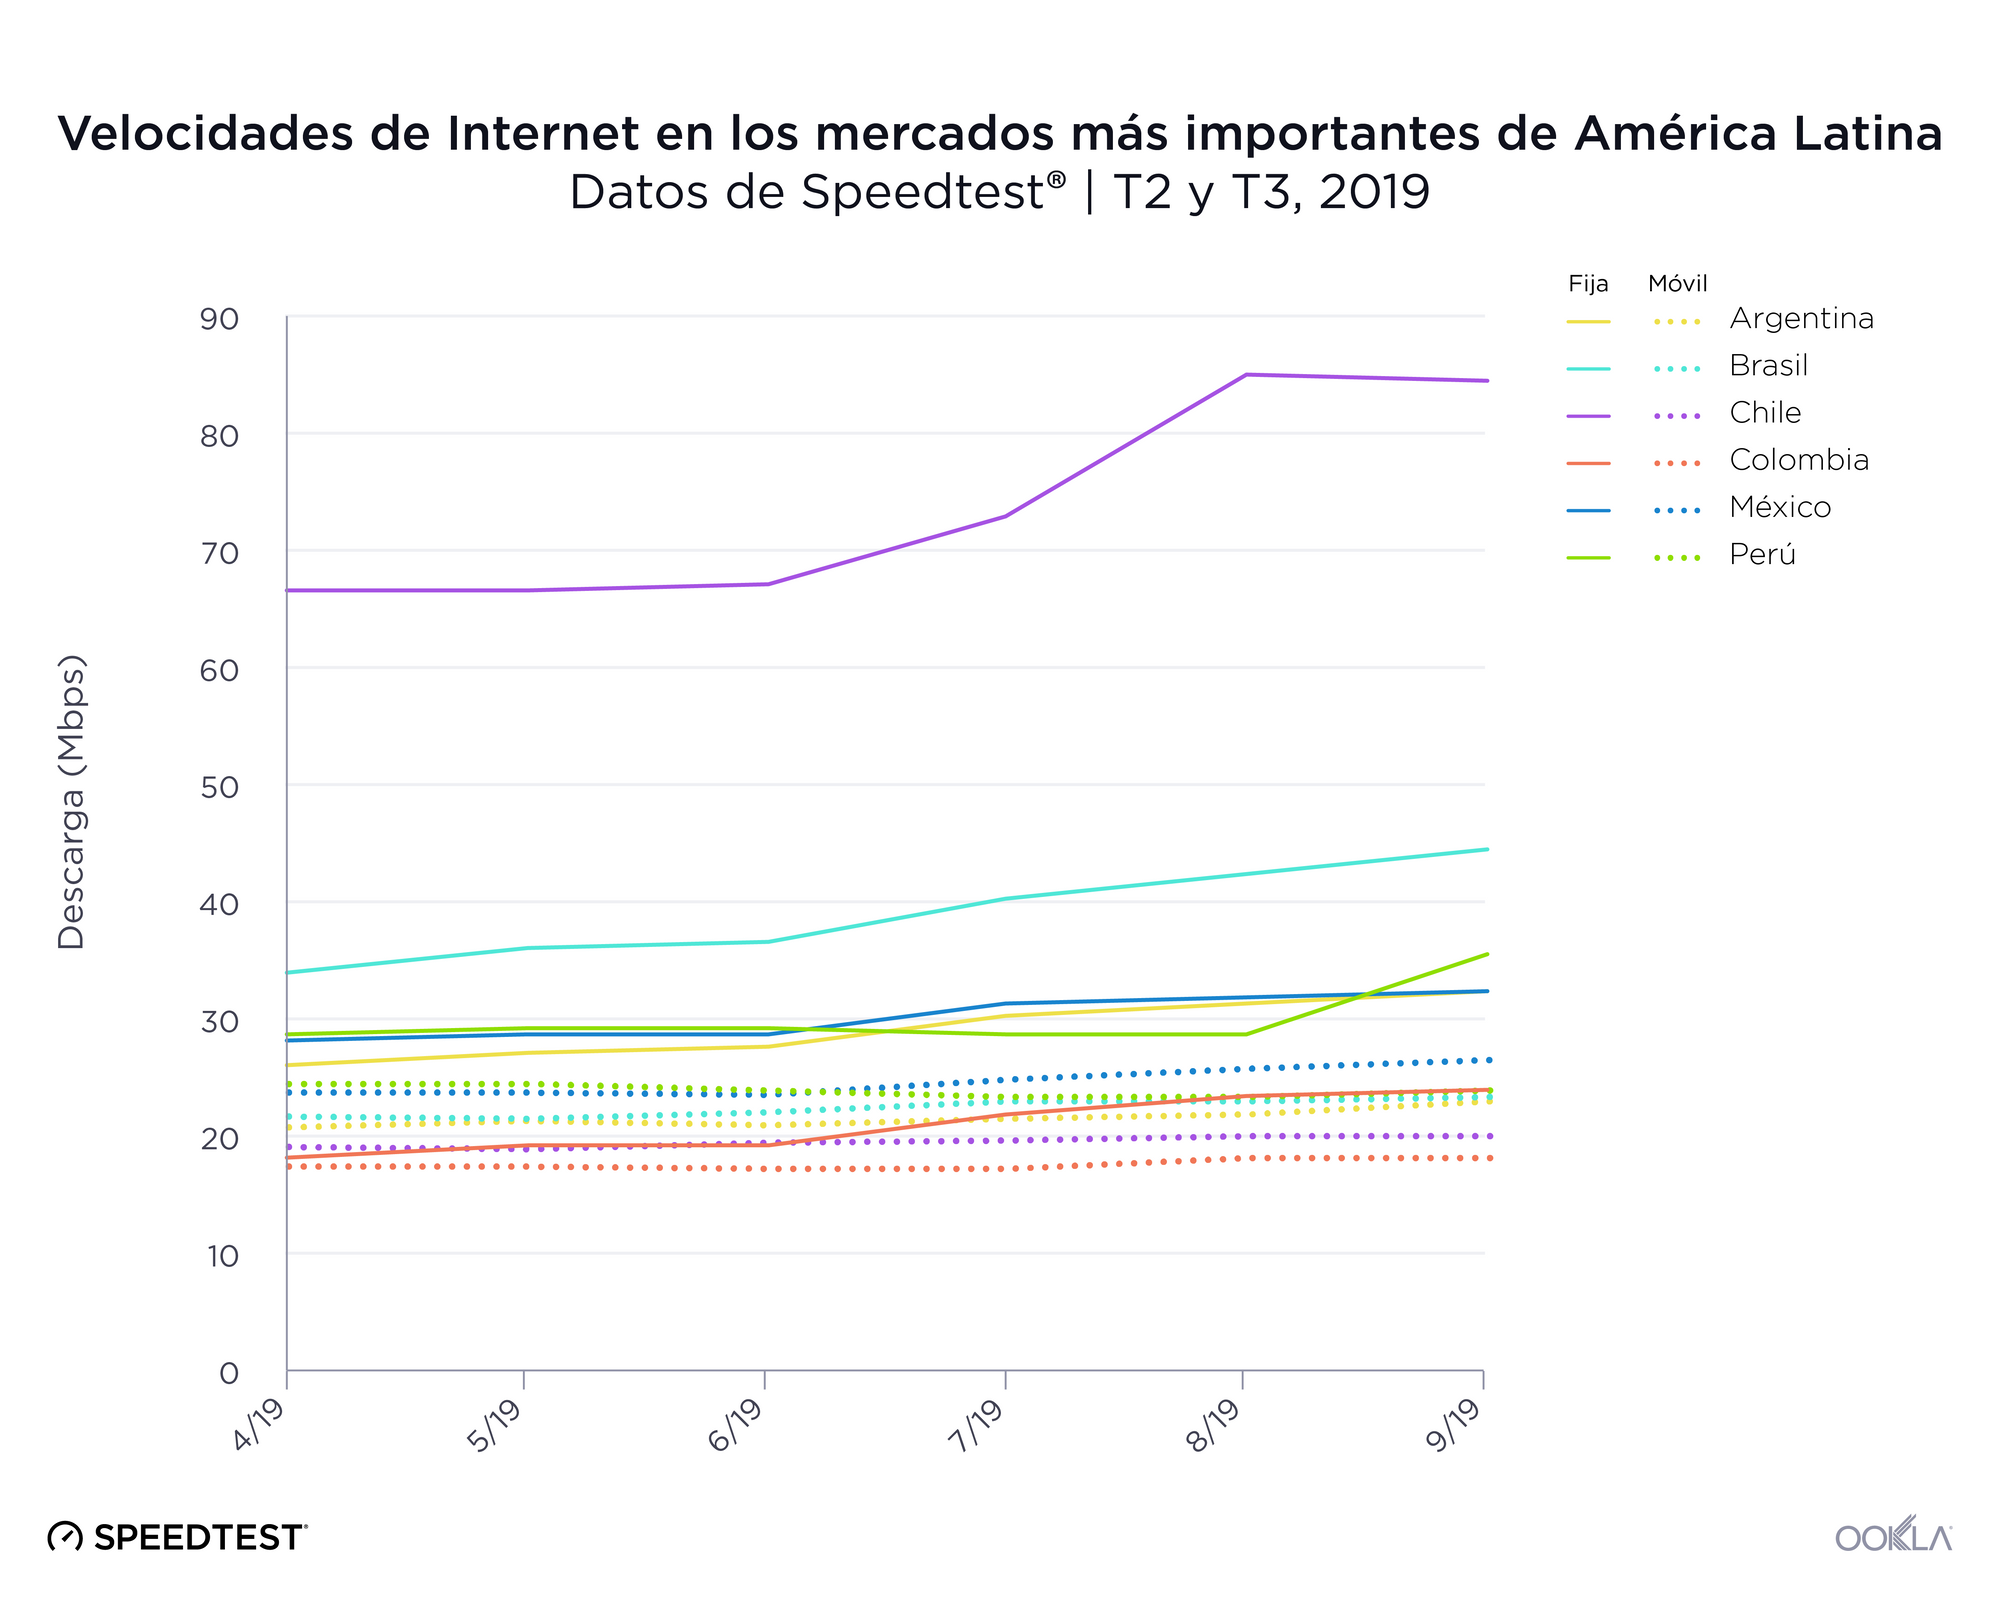
Las velocidades móviles mejoraron en la mayoría de los principales mercados de América Latina

Como observamos el año pasado, Perú tuvo la velocidad media de descarga más rápida del grupo durante el primer trimestre de 2019 y el tercer mayor aumento interanual. Argentina mostró el mayor aumento porcentual y quedó cuarta durante el primer trimestre de 2019. México es la excepción, con el segundo lugar en velocidad de descarga, pero una disminución del 4 % en la velocidad móvil respecto del año pasado.

Velocidades móviles en los mercados más importantes de América Latina
Primer trimestre de 2019 | Datos de Speedtest
País Descarga media (Mbps) Porcentaje de cambio interanual
Perú 23,07 15,4%
México 22,02 -4,0%
Brasil 21,30 25,7%
Argentina 19,78 37,5%
Chile 18,47 13,6%
Colombia 17,36 10,3%

Operadores de telefonía móvil más rápidos

También analizamos el operador de telefonía móvil más rápido en cada país durante el primer trimestre de 2019 con Speed ScoreTM (un trimeano ponderado que combina las velocidades de carga y descarga) entre los principales proveedores (operadores con una cuota de mercado del 3 % o superior) en dispositivos modernos.

Claro, la compañía de telecomunicaciones mexicana, logró el mayor Speed Score en Perú, Chile y Brasil. En Perú, esto se debió a la combinación de los servicios LTE de 700 MHz y LTE-A de 300 Mbps. En Chile, Claro utiliza principalmente el espectro de 700 MHz y 2600 MHz. Claro emplea 700 MHz en Brasil para aumentar las redes existentes de 1800 MHz y 2600 MHz, y ofrece capacidad adicional disponible en lugares como Río de Janeiro, donde ha implementado una red de acceso asistido por licencia (LAA, License Assisted Access) con capacidad de 1 Gbps en lugares seleccionados.

Operadores de telefonía móvil más rápidos en los mercados más importantes de América Latina
Primer trimestre de 2019 | Datos de Speedtest
País Operador de telefonía móvil Speed ScoreTM
Argentina Personal 23,16
Brasil Claro 29,48
Chile Claro 23,53
Colombia TigoUNE 17,78
México Telcel 26,20
Perú Claro 28,43

Personal ofreció las velocidades más rápidas en Argentina con 700 MHz, 1700 MHz y 2600 MHz más Carrier Aggregation. Personal ya brinda sus servicios en más de 1350 pueblos y ciudades, después de sumar 390 nuevas localidades en 2018. En Colombia, TigoUNE lanzó velocidades de LTE-Advanced de hasta 230 Mbps en áreas de Bogotá y Medellín. El operador más rápido de México, Telcel, ha comenzado a implementar LTE de clase Gigabit en 76 ciudades de todo México.

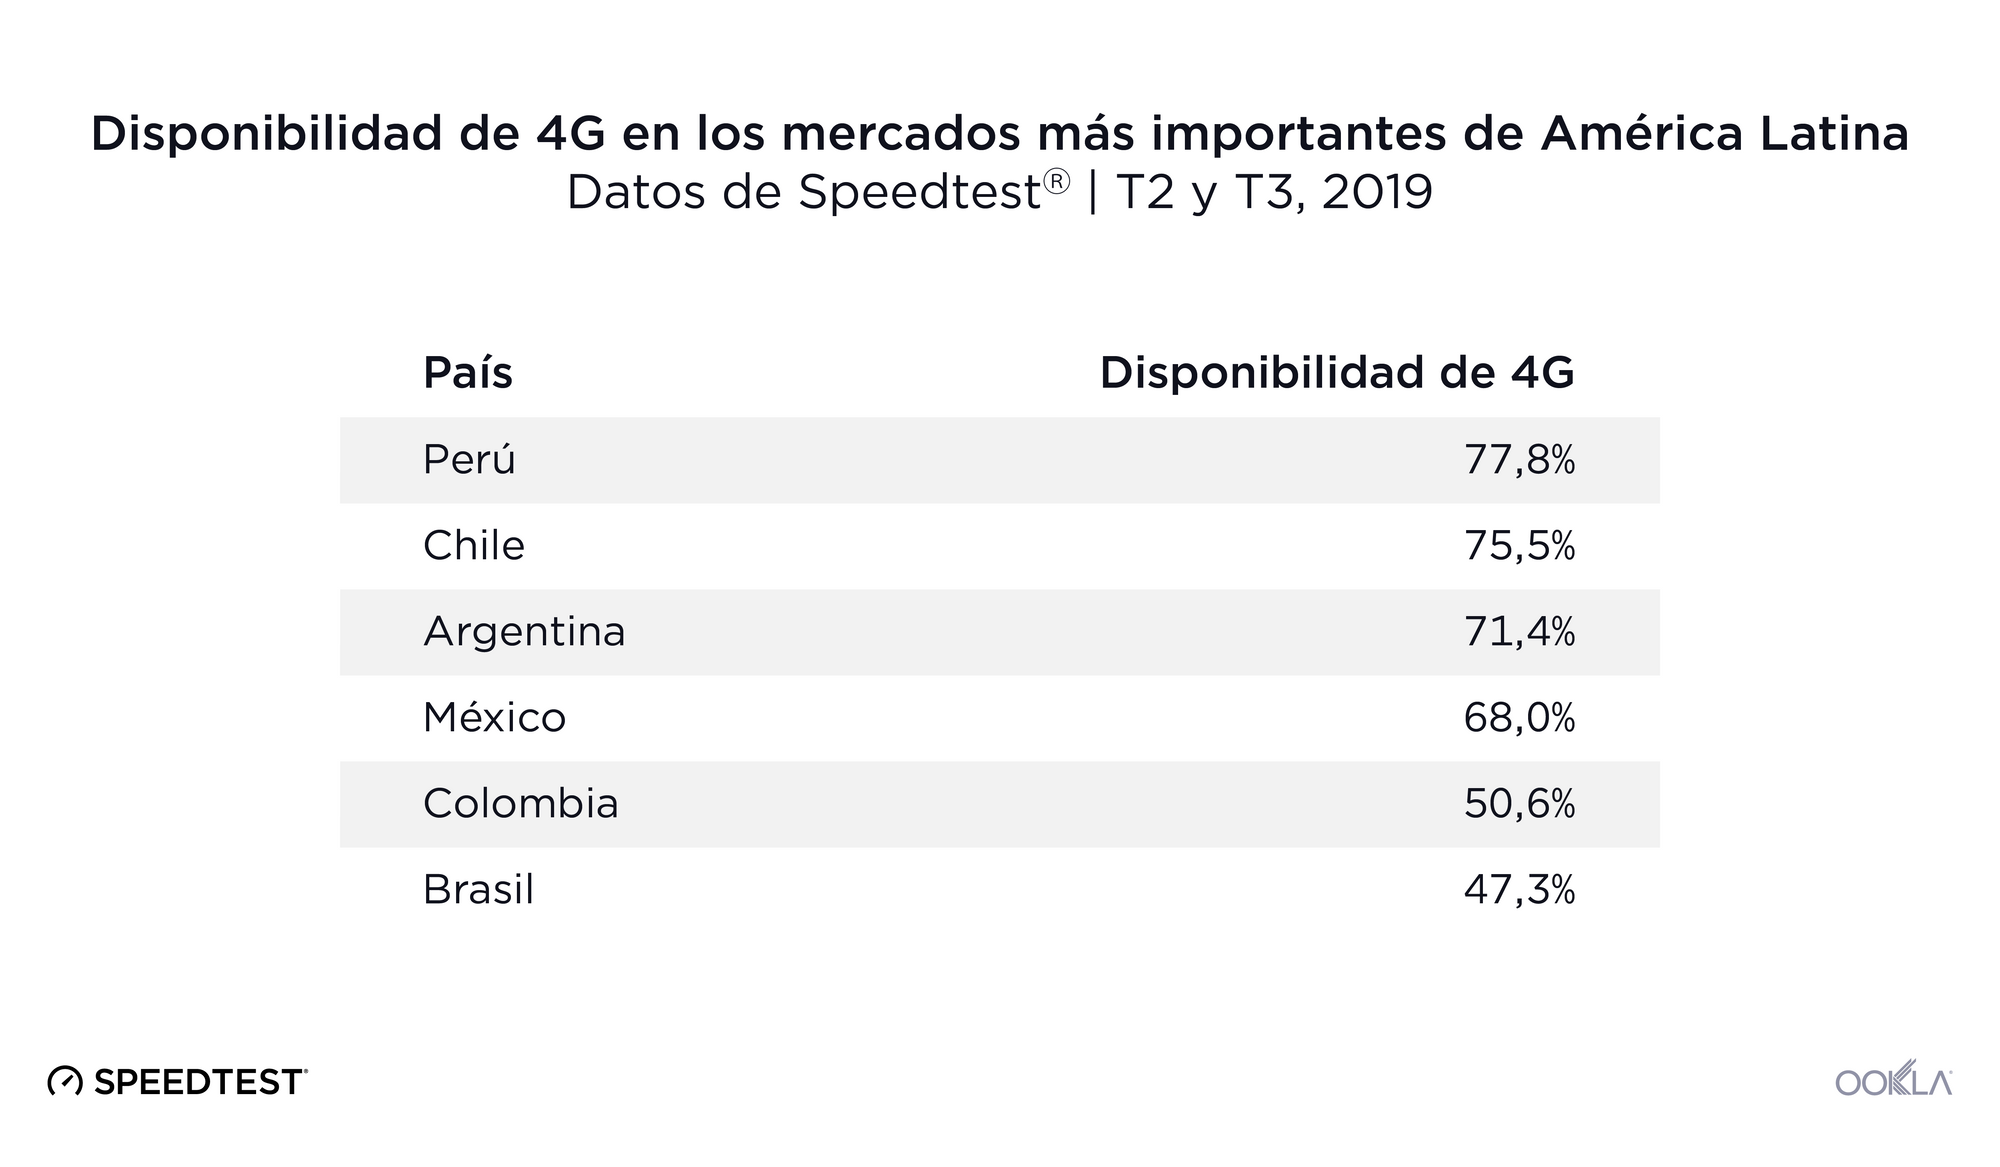
El servicio celular está ampliamente disponible, pero la disponibilidad de 4G varía

Según los datos de Speedtest, los usuarios de telefonía móvil en los mercados más importantes de América Latina pudieron encontrar servicio en el 96 % o más de los lugares encuestados. Chile mostró la mejor disponibilidad general, con el 99,7 %. Colombia ocupó el segundo lugar y Perú, el tercero. Brasil quedó último en disponibilidad general, con el 96,9 %.

Disponibilidad de 4G en los mercados más importantes de América Latina
Primer trimestre de 2019 | Datos de Speedtest
País Disponibilidad general Disponibilidad de 4G
Chile 99,7% 78,9%
Colombia 99,3% 59,3%
Perú 99,2% 87,4%
Argentina 98,7% 76,9%
México 98,3% 76,7%
Brasil 96,9% 54,9%

Por otro lado, la capacidad de un usuario móvil de obtener un acceso constante a 4G depende ampliamente del país en el que vive. Los clientes en Perú tienen la mayor probabilidad de conectarse a LTE con una disponibilidad de 4G del 87,4 %. Chile, Argentina y México muestran una disponibilidad de 4G de entre el 75 y el 79 %. Brasil tuvo la peor disponibilidad de 4G entre los mercados más importantes de América Latina, ya que los usuarios de telefonía móvil obtuvieron acceso a LTE la mayor parte del tiempo en solo el 54,9 % de los lugares encuestados.

Operadores de telefonía móvil con la mejor cobertura

La cobertura puede ser tan importante como las velocidades, especialmente en países con grandes zonas rurales o terrenos difíciles. Para ayudar a comprender mejor quién ofrece la mejor cobertura en cada país, Ookla calcula una puntuación por cobertura basada en dónde brinda servicio cada operador y la calidad promedio del servicio en esas áreas. Cuanto mayor es la puntuación de Coverage ScoreTM de un operador para un área determinada, más son las ubicaciones de esa área general en las que el operador presta un servicio de alta calidad.

Analizamos cuál de los principales operadores brindó la mejor cobertura en cada país y concluimos que Telcel, una subsidiaria de América Móvil, obtuvo la mayor puntuación de Coverage Score en México durante el primer trimestre de 2019. Otra subsidiaria de América Móvil, Claro, tuvo la mejor cobertura tanto en Colombia como en Argentina. Una subsidiaria de Telefónica, Movistar, encabezó la lista en Perú y Chile, y Vivo, también subsidiaria de Telefónica, tuvo la mejor cobertura en Brasil. Debido a las diferentes geografías, las puntuaciones de Coverage Score no son comparables entre diferentes países.

Operador con mejor cobertura en los mercados más importantes de América Latina
Primer trimestre de 2019 | Datos de Speedtest
País Operador de telefonía móvil Coverage ScoreTM
Argentina Claro 570
Brasil Vivo 547
Chile Movistar 690
Colombia Claro 638
México Telcel 816
Perú Movistar 697

Comparación con las velocidades y la disponibilidad de la telefonía móvil en América Central

Los mercados más pequeños de América Latina también muestran dinámicas interesantes. Si bien en algunas partes de América Central ha habido dificultades relacionadas con la pobreza, la inestabilidad política y la corrupción, en otras no ha sido así. Resulta interesante destacar que las velocidades móviles y la disponibilidad de 4G no siempre se ven afectadas por estas condiciones de la manera que se podría esperar.

Velocidades y disponibilidad móviles en América Central
Primer trimestre de 2019 | Datos de Speedtest
País Descarga media (Mbps) Disponibilidad general Disponibilidad de 4G
Belice 23,30 99,4% 67,5%
Costa Rica 19,22 99,5% 45,7%
El Salvador 8,79 99,9% 34,9%
Guatemala 16,75 99,9% 65,9%
Honduras 21,29 99,5% 51,4%
Nicaragua 20,13 99,8% 45,8%
Panamá 9,74 99,8% 74,4%

Las buenas noticias son buenas. Belice exhibió las velocidades medias de descarga más rápidas de la telefonía móvil en América Central en el primer trimestre de 2019, superando incluso a las de Perú. Las velocidades de descarga móvil en Honduras, Nicaragua y Costa Rica también fueron especialmente potentes y colocarían a estos países en el rango medio a superior si combináramos América Central con la lista de los mercados más importantes. La disponibilidad general supera el 99 % en todos los países centroamericanos, y Panamá exhibió la mejor disponibilidad de 4G, con el 74,4 %.

Las malas noticias no son alentadoras. Si bien las velocidades medias de descarga móvil en Panamá y El Salvador son lo suficientemente rápidas como para transmitir videos en HD, son mucho más lentas que en los mercados más importantes de América Latina y colocan a estos países en línea con las velocidades experimentadas en Haití. El Salvador también exhibió la menor disponibilidad de 4G en América Central, con el 34,9 %. La disponibilidad de 4G en Nicaragua y Costa Rica también fue baja en términos relativos, con el 45,8 % y el 45,7 %, respectivamente.

Continuaremos atentos a estos mercados para ver cómo la mejora de las velocidades cambia las clasificaciones y de qué manera las mejoras en la red afectan la disponibilidad de 4G. Si desea obtener un análisis detallado de estas métricas y datos adicionales, consulte más información sobre Speedtest Intelligence.


Velocidades móveis, disponibilidade 4G e cobertura nos maiores mercados da América Latina

Os principais mercados da América Latina, na maioria dos casos, registraram aumentos de dois dígitos nas velocidades médias de download de dispositivos móveis durante o ano passado. Embora as únicas implantaçãoes 5G vistas na América Latina tenham sido realizadas no Uruguai e no Brasil, operadoras de todo o continente estão trabalhando para expandir o 4G LTE e se preparar para as próximas tecnologias. Usando dados do Speedtest Intelligence, examinamos as velocidades de download de dispositivos móveis para ver quais países são mais rápidos e quais estão melhorando rapidamente. Analisamos também quais países oferecem o melhor acesso ao 4G e quais operadoras lideram em termos de velocidade e cobertura. Por conta de um contexto mais abrangente, incluímos as velocidades e a disponibilidade do 4G na América Central.

As velocidades de dispositivos móveis melhoraram na maioria dos principais mercados da América Latina

Como vimos no ano passado, o Peru teve a velocidade média de download mais rápida do grupo durante o primeiro trimestre de 2019, e o terceiro maior aumento em relação ao ano anterior. A Argentina apresentou o maior aumento percentual e ficou em quarto lugar no primeiro trimestre de 2019. O México é a exceção, com o segundo lugar em velocidade de download, mas uma queda de 4% na velocidade de dispositivos móveis desde o ano passado.

Velocidades móveis nos maiores mercados da América Latina
1º trimestre de 2019 | Dados do Speedtest
País Download médio (Mbps) % de alteração de ano a ano
Peru 23,07 15,4%
México 22,02 -4,0%
Brasil 21,30 25,7%
Argentina 19,78 37,5%
Chile 18,47 13,6%
Colômbia 17,36 10,3%

Operadoras móveis mais rápidas

Também analisamos a operadora móvel mais rápida em cada país durante o primeiro trimestre de 2019 usando o Speed ScoreTM (um ajuste ponderado que combina velocidades de download e upload) para os principais provedores (operadoras com participação de mercado de 3% ou mais) em dispositivos modernos.

A Claro, empresa de telecomunicações mexicana, alcançou o maior Speed Score no Peru, no Chile e no Brasil. No Peru, isso se deveu àcombinação do serviço LTE de 700 MHz e LTE-A de 300 Mbps. No Chile, a Claro utiliza principalmente o espectro de 700 MHz e 2600 MHz. A Claro usa 700 MHz no Brasil para aumentar as redes existentes de 1800 MHz e 2600 MHz, e há mais capacidade disponível em lugares como o Rio de Janeiro, onde a Claro implantou uma rede de Acesso Licenciado e Assistido (LAA) com capacidade de 1 Gbps em locais selecionados.

Operadoras mais rápidas nos maiores mercados da América Latina
1º trimestre de 2019 | Dados do Speedtest
País Operadora móvel Speed ScoreTM
Argentina Personal 23,16
Brasil Claro 29,48
Chile Claro 23,53
Colômbia TigoUNE 17,78
México Telcel 26,20
Peru Claro 28,43

A Personal forneceu as velocidades mais rápidas na Argentina com 700 MHz, 1700 MHz e 2600 MHz, além da agregação de operadoras. A Personal presta serviços em mais de 1.350 cidades, com 390 novos locais em 2018. A TigoUNE, na Colômbia, lançou velocidades LTE-Advanced de até 230 Mbps em partes de Bogotá e Medellín. A operadora mais rápida do México, a Telcel, começou sem alarde a implantar o LTE de classe gigabit em 76 cidades em todo o México.

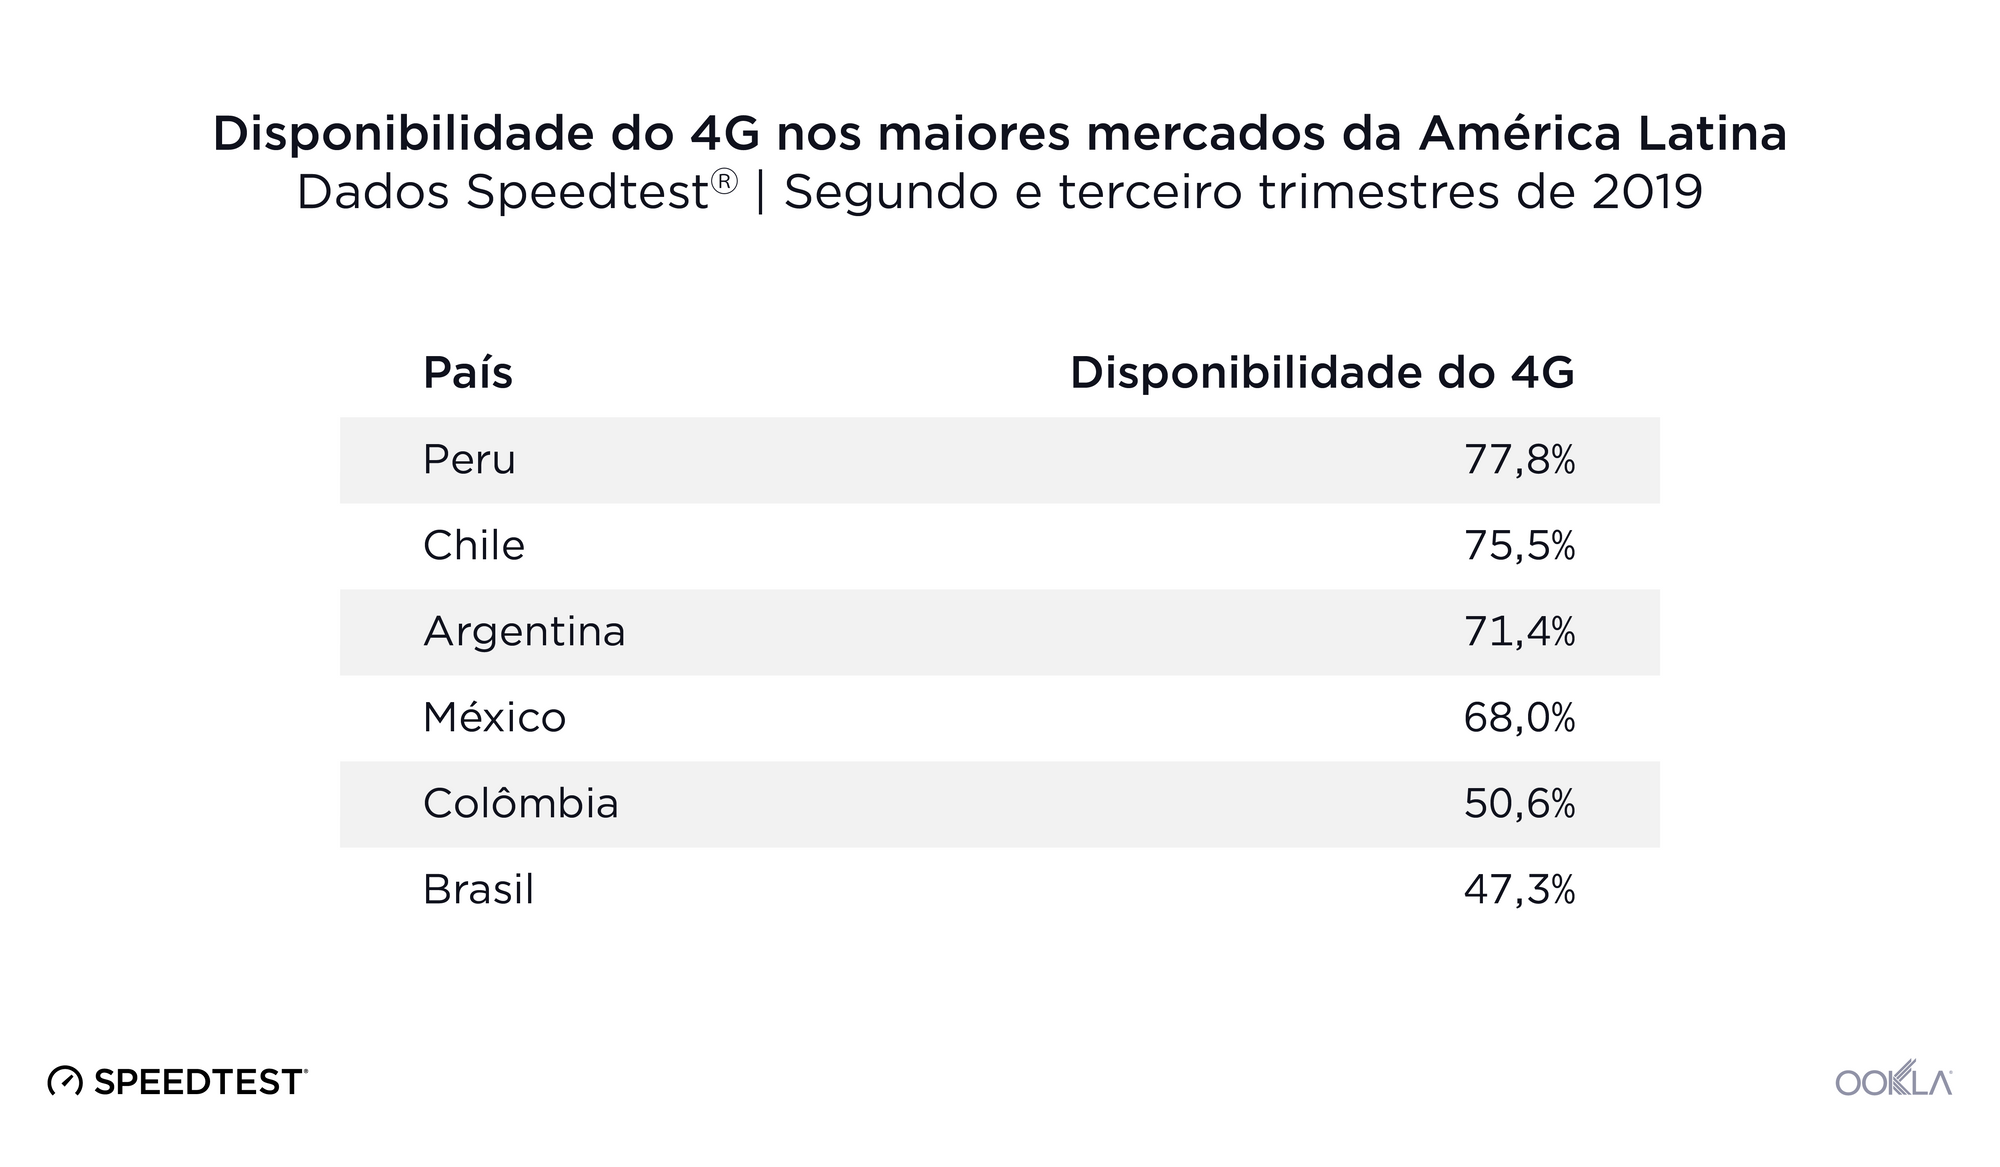
O serviço de celulares está amplamente disponível, enquanto a disponibilidade do 4G varia

Os dados do Speedtest mostram que os usuários de dispositivos móveis nos maiores mercados da América Latina conseguiram encontrar serviços em 96% ou mais dos locais pesquisados. O Chile apresentou a melhor disponibilidade geral, com 99,7%. A Colômbia ficou em segundo e o Peru em terceiro. O Brasil ficou em último lugar, com disponibilidade geral de 96,9%.

Disponibilidade do 4G nos maiores mercados da América Latina
1º trimestre de 2019 | Dados do Speedtest
País Disponibilidade geral Disponibilidade do 4G
Chile 99,7% 78,9%
Colômbia 99,3% 59,3%
Peru 99,2% 87,4%
Argentina 98,7% 76,9%
México 98,3% 76,7%
Brasil 96,9% 54,9%

Por outro lado, a capacidade de um usuário de dispositivos móveis de acessar de modo consistente o 4G depende muito do país em que ele mora. Os clientes do Peru têm a melhor chance de se conectar ao LTE, com uma disponibilidade de 87,4% para o 4G. A disponibilidade do 4G no Chile, na Argentina e no México ultrapassa os 70%. O Brasil tem a pior disponibilidade do 4G entre os maiores mercados da América Latina, com usuários móveis acessando o LTE na maior parte do tempo em apenas 54,9% dos locais pesquisados.

Operadoras móveis com a melhor cobertura

A cobertura pode ser tão importante quanto a velocidade, especialmente em países com grandes áreas rurais e/ou terrenos de difícil acesso. Para entender melhor quem oferece a melhor cobertura em um país, a Ookla agrega uma pontuação para cobertura com base no local em que cada operadora oferece serviço e na qualidade média do serviço nessas áreas. Quanto maior o Coverage ScoreTM de um operador para uma determinada área, mais locais nessa área geral o operador terá um serviço de alta qualidade.

Analisamos quais dos principais provedores apresentaram a melhor cobertura em cada país e descobrimos que a Telcel, uma subsidiária da América Móvil, teve o maior Coverage Score no México durante o primeiro trimestre de 2019. Outra subsidiária da América Móvil, a Claro, teve a melhor cobertura na Colômbia e na Argentina. A Movistar, subsidiária da Telefónica, liderou a lista no Peru e no Chile, e a Vivo, também subsidiária da Telefónica, teve a melhor cobertura no Brasil. O Coverage Score não é comparável entre países por causa das diferenças entre as regiões geográficas.

Operadora com melhor cobertura nos maiores mercados da América Latina
1º trimestre de 2019 | Dados do Speedtest
País Operadora móvel Coverage ScoreTM
Argentina Claro 570
Brasil Vivo 547
Chile Movistar 690
Colômbia Claro 638
México Telcel 816
Peru Movistar 697

Como as velocidades e a disponibilidade dos dispositivos móveis da América Central se saem na comparação

Os mercados menores na América Latina também apresentam dinâmicas interessantes. Enquanto algumas partes da América Central lutam contra a pobreza, a agitação política e a corrupção, outras não têm esses problemas. O interessante é que a disponibilidade do 4G e as velocidades dos dispositivos móveis nem sempre são prejudicadas por essas condições da maneira que poderíamos esperar.

Velocidades móveis e disponibilidade na América Central
1º trimestre de 2019 | Dados do Speedtest
País Download médio (Mbps) Disponibilidade geral Disponibilidade do 4G
Belize 23,30 99,4% 67,5%
Costa Rica 19,22 99,5% 45,7%
El Salvador 8,79 99,9% 34,9%
Guatemala 16,75 99,9% 65,9%
Honduras 21,29 99,5% 51,4%
Nicarágua 20,13 99,8% 45,8%
Panamá 9,74 99,8% 74,4%

A boa notícia é boa. Belize mostrou a mais rápida média de velocidade de download em dispositivos móveis da América Central no primeiro trimestre de 2019, mais rápida até do que no Peru. As velocidades de download em dispositivos móveis em Honduras, na Nicarágua e na Costa Rica também foram bem sólidas e colocariam esses países em uma faixa de média a alta se combinássemos a América Central com a lista dos maiores mercados. A disponibilidade geral está acima de 99% em todos os países da América Central, e o Panamá mostrou a melhor disponibilidade do 4G, com 74,4%.

A má notícia não é nada boa. Embora as velocidades médias de download em dispositivos móveis no Panamá e em El Salvador sejam rápidas o suficiente para transmitir vídeo em alta definição, elas são muito mais lentas do que nos maiores mercados da América Latina e colocam esses países alinhados com as velocidades experimentadas no Haiti. El Salvador também apresentou a menor disponibilidade de 4G da América Central, com 34,9%. A disponibilidade do 4G na Nicarágua e na Costa Rica também foi relativamente baixa, com 45,8% e 45,7%, respectivamente.

Continuaremos prestando atenção a esses mercados para ver como a melhoria da velocidade muda a classificação e como os aprimoramentos da rede afetam a disponibilidade do 4G. Se você estiver interessado em visualizações detalhadas dessas métricas e muito mais, saiba mais sobre o Speedtest Intelligence.

Ookla retains ownership of this article including all of the intellectual property rights, data, content graphs and analysis. This article may not be quoted, reproduced, distributed or published for any commercial purpose without prior consent. Members of the press and others using the findings in this article for non-commercial purposes are welcome to publicly share and link to report information with attribution to Ookla.

| January 23, 2019

Canadian ISP Doubles Speeds, Canada Jumps 9 Places in World Ranking

How would you like it if your Internet Service Provider (ISP) decided to double your speeds overnight? On December 3, 2018, Canadian ISP Shaw did just that. And the results were so impactful that Canada jumped nine places in the Speedtest Global Index, from 16th fastest country in the world in November 2018 to 7th in December 2018 as Canada’s average download speed over fixed broadband increased from 91.05 to 108.75 Mbps.

The upgrade also helped Shaw rise from third to second place ISP in Canada based on Speed ScoreTM, a measure that combines download and upload speeds at a variety of performance tiers.

Fastest ISPs in Canada
Based on Speed Score for ISPs with 3% or more of Speedtest results

ISP November 2018 December 2018
Rogers 147.96 146.08
Shaw 82.78 136.71
Bell Canada 100.36 103.33
TELUS 66.59 69.59
Vidéotron 56.44 59.30
Cogeco 51.59 51.30
Teksavvy 29.59 30.97

Shaw’s Speed Score increased 65.1% between November 2018 and December 2018. Bell Canada’s increased 3.0%, TELUS 4.5%, Vidéotron’s 5.1% and Teksavvy’s 4.7%. Rogers’ Speed Score decreased slightly, as did that of Cogeco. All ISPs have improved since our report on Q1-Q2 2018 performance and Rogers remains the fastest provider in Canada.

Only some Canadian cities see the speed boost

The Shaw effect becomes very evident when we compare fixed broadband speeds in Canada’s largest cities. Cities where Shaw is a major player saw large increases in speeds; the rest did not. The exception was Québec City whose speed increase was actually a recovery toward a previous high seen in April 2018.

Change in Fixed Broadband Download Speed (Mbps)
Canada’s Largest Cities

City November 2018 December 2018 Change in Speed Fastest ISP
London, Ontario 130.93 121.18 -7.4% Rogers
Halifax, Nova Scotia 122.88 123.17 0.2% Bell Canada
Toronto, Ontario 117.36 123.14 4.9% Rogers
Ottawa, Ontario 115.36 113.35 -1.7% Rogers
Calgary, Alberta 92.26 143.66 55.7% Shaw
Edmonton, Alberta 91.72 136.06 48.3% Shaw
Vancouver, British Columbia 86.47 121.90 41.0% Shaw
Québec City, Québec 84.78 104.31 23.0% Bell Canada
Winnipeg, Manitoba 75.26 138.20 83.6% Shaw
Montreal, Québec 59.06 65.36 10.7% Bell Canada

In Vancouver, Shaw’s December speed increase was significant enough to unseat Novus, the fastest ISP in that city for the rest of 2018. The fastest ISP remained unchanged in all other cities on the list.

This highlights the radical impact ISPs can have on a country’s overall speed. And it’s not just happening in Canada; Deutsche Telekom expanded 250 Mbps service to an additional 2.3 million customers in Germany. We’ll be watching to see how this and improvements by other ISPs impact country-level speeds across the world.

Ookla retains ownership of this article including all of the intellectual property rights, data, content graphs and analysis. This article may not be quoted, reproduced, distributed or published for any commercial purpose without prior consent. Members of the press and others using the findings in this article for non-commercial purposes are welcome to publicly share and link to report information with attribution to Ookla.

| June 19, 2019

5G Drives South Korea to the Top of World Ranking for Mobile Speeds

한국어로 읽기

As of May 2019, South Korea ranks first in the world for mobile download speed according to the Speedtest Global IndexTM. Norway previously held the number one spot, but with a mean download speed of 76.74 Mbps in May 2019, South Korea was 13.0% faster. While Norway has moved to second place, Telenor Norway maintains Ookla’s award for Fastest Network. South Korea’s May 2019 download speed is also a 79.7% increase over that in May 2018, when the country ranked 14th in the world. The Speedtest Global Index compares country-level averages of results from all providers on a monthly basis using data generated by consumer-initiated tests taken with Speedtest®.

SK-global-index-graphic-4

5G adoption in South Korea is rapid

South Korean mobile operators launched 5G services on April 3, 2019. Since then over 1 million subscribers have signed up for 5G. As of today, the Ookla 5G MapTM is showing that 73 cities in South Korea have 5G available at some level. Follow @Ookla5GMap to track deployments as they are identified.

5G dramatically boosts speeds

According to data from Speedtest Intelligence® SK Telecom has the fastest mean download speed on 5G capable devices in South Korea during May 2019 at 165.37 Mbps. LG U+ was second at 159.42 Mbps and KT was third at 130.01 Mbps. This represents a dramatic increase compared to Speedtest data from March, before 5G was commercially available in South Korea, when SK Telecom showed a mean download speed of 68.93 Mbps, LG U+ was at 48.05 Mbps and KT was 45.65 Mbps.

Speedtest Intelligence is your key to seeing how 5G is shaping mobile speeds in South Korea and around the world. Learn more here.


대한민국을 모바일 속도 전 세계 1위로 올려놓은 5G

Speedtest Global IndexTM에 따르면, 2019년 5월에 대한민국이 모바일 다운로드 속도에서 세계 1위를 차지했습니다. 평균 다운로드 속도 76.74Mbps는 이전 1위였던 노르웨이를 무려 13%나 앞서는 수치입니다. 노르웨이가 2위로 내려앉았지만 Telenor Norway는 Ookla 가장 빠른 네트워크 어워드를 사수했습니다. 대한민국의 2019년 5월 다운로드 속도는 세계 14위를 기록했던 전년도 5월보다 79.7% 성장한 수치이기도 합니다. Speedtest Global Index는 소비자가 Speedtest®를 사용하여 시작한 테스트에서 얻은 데이터를 사용하여 모든 통신사의 국가별 평균 결과를 월 단위로 비교합니다.

SK-global-index-graphic-KR-1

대한민국의 놀라운 5G 보급 속도

대한민국의 모바일 통신사에서 5G 서비스를 출시한 2019년 4월 3일 이래로 1백만 명이 넘는 이용자가 5G 서비스에 가입했습니다. Ookla 5G MapTM을 통해 오늘 날짜로 대한민국의 73개 도시에 5G망이 어느 정도 수준으로 보급되어 있는지 확인할 수 있습니다. @Ookla5GMap을 팔로우하여 5G 보급 현황을 추적하십시오.

획기적으로 빨라진 속도를 제공하는 5G

Speedtest Intelligence®의 데이터에 따르면, 2019년 5월 대한민국에서 5G 호환 장치 기준 최고 평균 다운로드 속도는 SK텔레콤의 165.37Mbps입니다. 2위는 159.42Mbps의 LG U+, 3위는 130.01Mbps의 KT가 차지했습니다. 이는 5G가 대한민국에 보급되기 전인 3월 Speedtest 데이터와 비교했을 때 놀라울 정도로 크게 상승한 수치입니다. 당시 측정한 SK텔레콤의 평균 다운로드 속도는 68.93Mbps, LG U+는 48.05Mbps, KT는 45.65Mbps였습니다.

Speedtest Intelligence를 통해 5G가 대한민국과 전 세계의 모바일 속도에 어떠한 변화를 가져오고 있는지 확인할 수 있습니다. 여기에서 자세히 알아보십시오.

Ookla retains ownership of this article including all of the intellectual property rights, data, content graphs and analysis. This article may not be quoted, reproduced, distributed or published for any commercial purpose without prior consent. Members of the press and others using the findings in this article for non-commercial purposes are welcome to publicly share and link to report information with attribution to Ookla.

| August 10, 2017

How Norway Came to Have the Fastest Mobile Internet in the World

Thirteen months ago Norway did not have the fastest mobile internet speeds in the world. In fact, with an average download speed of 31.09 Mbps, the country ranked only 11th globally for mobile speeds in August 2016. By September 2016, however, the country’s average download speed had jumped 41% to 43.73 Mbps which ranked Norway #1 in the world for mobile download speed. This has continued to increase over the last year to 52.59 Mbps in July 2017 and Norway has maintained that first place ranking with a significant lead.

That’s an impressive 69% year-over-year gain for download speeds, and it begs the question: what caused the increase?

Telenor leads the way

On September 4, 2016, Telenor removed a cap on mobile speeds. According to Telenor’s Head of Mobile, Bjørn Ivar Moen, Telenor originally had rate limits on some plans to allow customers to choose from a range of subscription options.

Ultimately, though, Moen says “We knew we had the best and fastest mobile network in Norway and felt it was wrong not to give this advantage to our customers. We also felt comfortable that the network would handle max speed to all our customers due to the job done on capacity and coverage in the network all over Norway.”

The graph below shows that Norway’s sudden climb to #1 on the Speedtest Global Index is directly related to that jump in Telenor’s mobile speeds.

Norway and Telenor

And customers are happy. According to Moen, customers reported that the ability “to use the network with real 4G+ speed and coverage was really felt as a difference in their daily use.” Moen also said Telenor has seen no negative effects from uncapping these speeds.

What about other mobile carriers?

Being the fastest country in the world requires more than just one fast carrier. Though Telenor has offered the fastest mobile speeds in Norway ever since, second place Telia also increased their speeds significantly in 2016. Looking at download speeds on all devices, Telia’s mobile speed increased 42% from 33.34 Mbps in October 2016 to 47.24 Mbps in December 2016.

Telenor & Telia

The fast mobile speeds that Telenor and Telia are achieving are especially impressive considering the mountains and fjords of Norway, geographical challenges that carriers in other countries don’t necessarily have to face.

Broader benefits of fast speeds

The work these two carriers did to put Norway in first place in the world for mobile speeds for the last year benefits not just their customers but the country as a whole.

Having the fastest mobile speeds in the world creates a favorable climate for new digital solutions in all areas of society — from health care and transportation to entertainment services. We can’t wait to see what innovations develop as a result and how other carriers and markets follow suit.

Are there other stories like this?

Yes! There are many interesting stories like this happening behind the scenes all the time in the telecom market. Our new site, Speedtest Global Index, can help pinpoint increases and drops in internet speeds that signal market shifts on a country level. Check it out today.

Ookla retains ownership of this article including all of the intellectual property rights, data, content graphs and analysis. This article may not be quoted, reproduced, distributed or published for any commercial purpose without prior consent. Members of the press and others using the findings in this article for non-commercial purposes are welcome to publicly share and link to report information with attribution to Ookla.

| June 19, 2018

Mosaik is Joining Ookla

Ookla has acquired Mosaik, a pioneer in wireless network intelligence and mapping solutions. The combination of Ookla and Mosaik opens up exciting new data and visualization capabilities that enhance the product offerings to enterprise clients of both organizations and further strengthens Ookla’s position as the global leader in both fixed and mobile network analysis.

Ookla and Mosaik are highly complementary and share a commitment to providing the best network availability and performance insights to consumers and enterprises that rely on those networks to succeed.

Both teams will continue to focus on their existing offerings as they work together to provide vital industry research tools. In the near future, look forward to integrations between Ookla and Mosaik that advance market knowledge in an increasingly connected world. We’re excited to welcome Mosaik to the Ookla family.

Ookla retains ownership of this article including all of the intellectual property rights, data, content graphs and analysis. This article may not be quoted, reproduced, distributed or published for any commercial purpose without prior consent. Members of the press and others using the findings in this article for non-commercial purposes are welcome to publicly share and link to report information with attribution to Ookla.

| February 11, 2019

Analyzing India’s 4G Availability: Including a Look at the 15 Largest Cities

It’s a good time to be a mobile customer in India with Airtel expanding its LTE service in major cities using the 900 MHz band and Jio making continuous progress on its mission to provide 4G coverage to all Indians. All this good news made us want to check in to see what cellular availability in India currently looks like.

We analyzed General Availability and 4G Availability using coverage data from 250,138,853 samples on 595,034 enabled devices during Q3-Q4 2018. General Availability is the percentage of an operator’s known locations where a device has access to any kind of service (including roaming). 4G Availability is then the percentage of an operator’s known locations where a device has access to LTE service (including roaming). We compared these results across Indian mobile operators to see which provides the best availability.    

Cellular service is widely available across India

General Availability statistics are good for all of India’s major mobile operators. In a country where there are only 1.33 fixed broadband subscriptions per 100 people, access to mobile internet is critical. Jio’s General Availability was best, with users finding service in 99.3% of locations. Airtel was second at 99.1%, followed closely by Vodafone (99.0%) and Idea (98.9%).

Percentage of Locations With Cellular Service
India | Q3-Q4 2018
Operator General Availability (%)
Jio 99.3
Airtel 99.1
Vodafone 99.0
Idea 98.9

As you can see from the map below, most areas in India are covered by at least one of the country’s four largest mobile operators.

All-Carrer-Map-Animate-1

Coverage data relies on the presence of a user in a location, so it’s normal to see the majority of results that show coverage (seen in blue) coming from the most populated areas. When a sample is taken and a user does not have cellular coverage (seen in red), that data is transmitted later. Areas that show no dot are places where no coverage data was collected. These gaps often correspond with national parks or other remote areas that people visit less frequently.

Jio showed the densest pattern of coverage samples for General Availability across India, with only a few areas where coverage data showed no service.

Airtel’s pattern of coverage samples showed only slightly less areas with coverage. Airtel had only slightly more “no service” areas, particularly in Maharashtra, Uttar Pradesh and Himachal Pradesh.

Idea and Vodafone had a similar density of coverage samples showing coverage, but were strong in different parts of the country. Idea showed more density in Andhra Pradesh and Madhya Pradesh, while Vodafone was stronger in Tamil Nadu and West Bengal. Neither showed a large number of “no service” areas.

4G availability in India depends on your mobile operator

LTE connections, while widely available in much of India, depend heavily on which mobile operator a consumer has chosen. At a country-level, Jio shows an impressive 98.8% 4G Availability. That means that a Jio customer has access to LTE service at 98.8% of surveyed locations. Airtel is second at 90.0%, followed by Vodafone (84.6%) and Idea (82.8%).

Percentage of Locations with LTE Service
India | Q3-Q4 2018
Operator 4G Availability (%)
Jio 98.8
Airtel 90.0
Vodafone 84.6
Idea 82.8

Coverage data from the four largest mobile operators reveals that LTE is not available in all the areas that general cell service is in India. This is especially true in the center of the country, in Sikkim and in the Andaman Islands.

LTE-Carrer-Map-Animate-2

Except for a few red spots at the edges of Uttarakhand, Rajasthan, Sikkim and the Andaman Islands, Jio’s 4G Availability map is nearly identical to their General Availability map.

Airtel’s 4G Availability map is still very dense, but shows gaps in LTE coverage in many areas of the country including portions of Maharashtra, Madhya Pradesh and Karnataka.

As we saw with overall scores, the 4G Availability map for Vodafone reveals that the operator’s LTE coverage is not as robust as their overall coverage. We saw major gaps in Vodafone’s LTE in Karnataka in particular and smaller gaps in northeastern India in general (with the exception of the most populated areas of West Bengal).

Idea’s 4G Availability map shows gaps in LTE service across the country, especially in less densely populated areas.

4G Availability does not equal fast speeds

Until 5G is rolled out, LTE is the fastest connection type available to consumers. India shows us, however, that 4G Availability does not automatically equate to fastest service. To compare which of India’s largest mobile operators is fastest, we’ve used Speed ScoreTM, a combined measure of download and upload speed that incorporates several tiers of performance.

Comparing Speeds for India’s Largest Mobile Operators
Q3-Q4 2018
Operator Speed Score (all cell) Speed Score (4G LTE)
Airtel 10.34 11.23
Vodafone 8.19 9.13
Jio 7.11 7.11
Idea 6.20 7.02

Airtel was the fastest mobile operator in India during Q3-Q4 2018, regardless of whether a customer was on LTE or not. The ranking of the other operators does not change based on LTE use with Vodafone taking second fastest, Jio third and Idea fourth.

As the above table shows, Jio’s commitment to LTE remained unwavering as demonstrated by the fact that the operator’s Speed Score did not change when looking at all technologies or on LTE alone. We cannot say why Jio’s speeds were slower than those of Airtel and Vodafone, but it’s likely a combination of network congestion and users accessing the Jio network with slower phones.

We’ll be interested to see how these numbers improve in the near term as operators continue to build out their networks.

How general and LTE availability look in India’s largest cities

Country-wide averages can hide a lot of information. To get a clearer picture of the customer experience across the country, we looked at General and 4G Availability as well as operator speeds in the 15 largest cities in India.

General Availability is strong

india-general-avail-map-1

General Availability was good (in the 98-99% range) for India’s largest mobile operators in most of India’s 15 largest cities. Airtel showed General Availability of 99% or higher in all 15. Jio’s lowest score (in Jaipur) was still high at 98.9%. Vodafone’s only score below 99% was in Kolkata (97.9%). Idea, on the other hand, showed General Availability scores below 99% in six cities: Hyderabad (98.8%), Delhi (98.3%), Jaipur (98.0%), Kolkata (97.9%), Visakhapatnam (97.9%) and Indore (96.6%).

While these scores are all good, consistent mobile service is important to quality of life. If a consumer is living in one of the small sections of these cities that are not well served by their mobile operator it could mean they don’t have access to internet at home, school or where they do business.

4G Availability is all over the map

India’s largest mobile operators were not nearly as consistent with their 4G Availability in India’s largest cities during Q3-Q4 2018 as they were with General Availability. The exception was Jio, which still only showed one city (Jaipur) that was barely below 99%. This is no surprise given Jio’s 98.8% country-wide 4G Availability.

india-4g-avail-map-2

Airtel’s 4G Availability ranged from 92.9% in Visakhapatnam to 97.5% in Bengaluru. Vodafone’s 4G Availability ranged from 74.9% in Hyderabad to 98.0% in Ahmedabad, with two cities in the 70-79.9% band and one in the 80-89.9% band. Idea had the widest spread in 4G Availability — from 38.8% in Delhi to 96.2% in Bengaluru. This includes one city in the 60-69.9% band and three in the 80-89.9% band.

Taking a weighted average of the 4G Availability scores based on number of samples, Kanpur showed the best 4G Availability in India during Q3-Q4 2018 at 98.2%. Bengaluru and Lucknow tied for second and third at 97.6%. Delhi was at the bottom of the list with 93.0%, Kolkata second to last at 95.4% and Pune third to last at 95.9%.

The availability of LTE in India’s largest cities contrasts with our analysis of fixed broadband speeds from last year, which found Chennai, Bengaluru and Hyderabad on top. In that analysis, Delhi ranked fifth, Kanpur fourth to last and Lucknow in the middle.

How a combined Vodafone-Idea could change the map

Vodafone and Idea merged in 2018, but the brands continue to operate independently. If that were to change, we’d expect to see better General Availability for all customers as the two brands’ coverage areas are complementary. 4G Availability would also improve, but not immediately to the level of that of Jio or Airtel because many gaps would remain. In the long run, though, combining operations could allow the two brands to reallocate resources and invest in better LTE coverage, particularly in Karnataka.

Interested in learning more about General Availability and 4G Availability? Schedule a demo at  Mobile World Congress or come see us in Hall 2 at Stand 2I25.

Ookla retains ownership of this article including all of the intellectual property rights, data, content graphs and analysis. This article may not be quoted, reproduced, distributed or published for any commercial purpose without prior consent. Members of the press and others using the findings in this article for non-commercial purposes are welcome to publicly share and link to report information with attribution to Ookla.

| June 20, 2019

The Guide to Speedtest Metrics

Editor’s note: A new, updated version of this article is here.

At Ookla we are always researching new and better metrics to describe internet performance and coverage. Today we’re offering an in-depth look at the definitions of our current metrics and how they can help you better understand your network. We’ll also discuss how this affects our upcoming U.S. Mobile Market Report.

Here are some quick links if you want to skip ahead:

Internet performance metrics for mobile and fixed broadband

Speed Score

Speed is an important measure of an internet connection. We created Speed Score to fully account for the range of speeds a provider offers in a single metric. This makes it easier to compare mobile operators and ISPs on several measures of speed using one metric.

Speed Score incorporates a measure of each provider’s download and upload speed to rank network speed performance (90% of the final Speed Score is attributed to download speed and the remaining 10% to upload speed because online experiences are typically more affected by download speed). Speed Score uses a modified trimean to take speeds from the 10th percentile, 50th percentile (also known as the median), and 90th percentile, and combine them in a weighted average using a 1:2:1 ratio, respectively. We place the most emphasis on the median speeds as those represent what most network providers’ customers will experience on a day-to-day basis.

Competitive Geography

Not all providers serve the same geographic area. Some focus their efforts more in urban areas, where economies of scale make fast speeds easier and cheaper to provide. Others also serve vast rural areas, where it’s more difficult and expensive to provide fast speeds. We’re introducing a new Competitive Geography filter to ensure a balanced comparison of national wireless operators by eliminating geographic outliers. We will be using Competitive Geography for the first time in the 2019 Speedtest U.S. Mobile Market Report by Ookla.

To meet the definition of “competitive” in the U.S., a zip code must contain samples from at least three top national competitors (those who have at least 3% of market share at a national level), but no competitor can have more than 2/3 of the samples in that zip code. Operators are considered present in a zip code if they have at least 3% of the samples in the area and show samples on multiple devices. Limiting any operator from having more than 2/3 of samples ensures actual competition in a zip code rather than including areas where one competitor dominates the market.

competitive-geography-map-6

Acceptable Speed Ratio

While we think fast speeds are paramount, ensuring a minimum acceptable experience is also a worthy measure of a network’s quality. The Acceptable Speed Ratio (ASR) measures what percent of each provider’s download data samples are HD-capable (equaling or exceeding 5 Mbps) on mobile or 4K-capable (equaling or exceeding 25 Mbps) on fixed broadband. The higher a provider’s ASR, the more likely a subscriber will consistently enjoy acceptable internet speeds.

Mean (or average)

We use “mean” and “average” interchangeably unless specifically stated otherwise.

Coverage metrics for mobile broadband

Fast speeds only matter if you actually have coverage. Ookla collects hundreds of millions of coverage scans daily from Android Speedtest users from around the world. An operator’s geographic coverage is determined using a sample of scans received from devices on that operator’s network in each 100 m2 area. Because coverage is a spatially-focused metric, only scans with precise and legitimate location information are included as we build samples that normalize data by user, operator, location and timeframe.

Coverage and availability metrics require that scans have been received from multiple devices in each area represented. For more information on our sampling and aggregation methodologies, read this article.

Coverage Score

We created Coverage Score to account for both the quality and coverage of service for mobile operators. Coverage Score multiplies the proportion of locations in which an operator was seen with service (its footprint) against the average tile quality score (based on availability metrics) among all locations in which that operator is present. Coverage Score has a range of 0 to 1000 to avoid any potential for confusion that the Coverage Score represents a percentage of an area or population with coverage.

tile-quality-map-1

Coverage Score is not comparable across different countries because it is strongly tailored to the unique geography of each market.

Availability

Whether or not service is available is closely tied to coverage. We divide our data on availability into three separate views: General Availability, 4G Availability, and On-Network Availability. These metrics indicate how likely a user, on average, is to have service available in the places they go. They are individually defined as:

  • General Availability

    The percentage of an operator’s known locations where a device has access to any kind of service (including roaming).
  • 4G Availability

    The percentage of an operator’s known locations where a device has access to 4G LTE service (including roaming).
  • On-Network Availability

    The percentage of an operator’s known locations where a device has access to service from that operator.

Time Spent

While it might be easy to assume that a user connects to a 4G signal 100% of the time, actual experience varies. We use Time Spent to give mobile operators insight into the percent of time that an average user spends on a given cellular technology both on and off of their subscriber (SIM) network. For example, we could see that users in one area are using 74% 4G, 6% Roaming 4G and 20% 3G. This can help pinpoint gaps in LTE coverage, among other things.

mean-time-spent-1

Time Spent uses coverage scans to construct daily timelines for each device. Then, daily per-device durations on subscriber network, active network and cellular technology are calculated for a given area of interest. Next, the percent time spent on cellular technology per-device based on the area and time period of interest are determined. Finally, average percent time over devices for a subscriber network are aggregated to give the final metrics seen in Speedtest Intelligence.

Operational definitions

Now that you have a full understanding of the metrics we use to discuss internet performance, consistency and coverage, we want to make sure that you also understand a few key phrases we often use in our articles and reports.

Top providers

Top providers are all operators and ISPs with 3% or more of total test samples in the market for the period. We use this designation when analyzing providers to ensure that the providers we designate as fastest, most consistent or having the best coverage are also providers that most consumers in the area actually have access to.

Modern devices

Modern devices are the most common devices capable of connecting to the most modern cellular network type broadly available in each country. In most cases this is LTE, but we define modern devices on a market-by-market basis. We use modern devices when calculating Speed Score for operators so that they aren’t negatively impacted if they happen to have a subscriber base that’s more likely to use older technology.

Footprint

Footprint is the fraction of locations within a given market, across all operators in that market, where a device has access to service. We use Footprint in calculating in Coverage Score. Operators with a relatively small footprint will have a lower Coverage Score than competitors with equal availability and a larger footprint. We require that an operator’s footprint in their market is at least 30% before we will calculate a Coverage Score, however, to indicate that the operator is generally available to the public.

We hope this quick reference guide will give you deeper insight into the metrics we present on Speedtest InsightsTM. We also have further information on 5G and a glossary that contains some general terms used when discussing internet performance across the industry. For specific information about what our data has to say about your market, learn more about Speedtest Intelligence.

Ookla retains ownership of this article including all of the intellectual property rights, data, content graphs and analysis. This article may not be quoted, reproduced, distributed or published for any commercial purpose without prior consent. Members of the press and others using the findings in this article for non-commercial purposes are welcome to publicly share and link to report information with attribution to Ookla.