| May 28, 2025

Benchmarking Mobile Performance Across Mexican Cities

This city-level mobile performance benchmark, comparing ten of the largest Mexican cities with a selection of other major cities across Latin America, highlights the challenges facing the Mexican mobile market, with city-level performance lagging, and at risk of falling further behind regional peers.

Key Takeaways

  • 5G continues to underwhelm within Mexican cities. A lack of 5G momentum and a concentrated mobile market structure have negatively weighed on the Mexican mobile user experience. Mexican cities lag their more advanced Latin American counterparts across key metrics like median download speed, with the fastest Mexican city, Monterrey, recording 55.17 Mbps in Q1 2025, a far cry from the 250.71 Mbps recorded in Rio de Janeiro.
  • Year-on-year data indicates the market’s digital competitiveness is eroding. The trajectory for most Mexican cities appears to be one of marginal performance gains, which indicates other regional peers are likely to continue to leapfrog Mexico as attractive inward investment destinations, particularly in cases where mobile digital infrastructure forms a key enterprise requirement.
  • Mexico City and its satellite cities underperform within Mexico. There is wide variation in mobile network performance outcomes between Mexican cities. Mexico City, and surrounding satellite cities including Ciudad Nezahualcóyotl, Ecatepec de Morelos, as well as Puebla, all perform relatively poorly compared to their peers, with median speeds of approximately 30 Mbps and lower. This is compounded for users experiencing the worst 10% of network performance, where recorded speeds were 3 Mbps and lower.
  • Poor performance drags down web load times. User experienced web page load times exceeded a median of 2.4 seconds in three of the ten Mexican cities included in this analysis, well behind regional leader Buenos Aires, which clocked just 1.44 seconds. The varied outcomes across web page and video streaming performance highlight the challenges operators in the market face in ensuring consistent performance.

Mexican cities lag behind leading Latin American counterparts

Ookla’s Speedtest data recently played a key role in a World Bank study that exposed significant disparities in internet access across Brazilian cities. The research found that wealthier neighborhoods consistently experienced superior internet speeds, particularly on fixed networks. While mobile users across Brazil’s cities have benefited from 5G rollout, with the market placing 6th globally in the Speedtest Global Index based on median download speeds as of April 2025, Mexico, the second largest market by population in Latin America, languishes in 78th place. In this article, we benchmark mobile network performance outcomes across the ten largest Mexican cities, comparing them to a selection of other Latin American cities.

A majority of the population across Latin America resides in urban locations, which comprise 81.8% of the total population across Latin America and the Caribbean, according to World Bank data for 2023. Mexico marginally lags this regional average, at 81.6%, ahead of the EU at 75.7%, but behind other key competitors such as Argentina, Brazil, Chile, Colombia, and Uruguay.

Mexican cities ranked in the middle of the pack compared to regional rivals on median download speed, lagging far behind leading cities in Brazil, Uruguay and Argentina. The leading Mexican city, Monterrey, recorded a median of 55.17 Mbps in Q1 2025, compared to 250.71 Mbps in Rio de Janeiro. There was a wide variety of outcomes across Mexican cities, ranging from Monterrey’s high, to a low of 26.11 Mbps in Ecatepec. This is reinforced by performance for those users experiencing the lowest 10% of samples (the 10th percentile), with Mexico City and its satellite cities – Ecatepec, Ciudad Nezahualcoyotl, as well as Puebla seeing outcomes for these users of 3 Mbps and lower, and with only users in Santa Cruz de la Sierra in Bolivia faring worse.

It’s clear that users across Latin American cities value mobile network performance, as evidenced by the clear relationship between Q1 2025 download speeds and Net Promoter Score (NPS) data for Q1 2025. Among Mexican cities, this placed Monterrey first, with an NPS of +19.5, followed by Tijuana and Zapopan, and Guadalajara.

Latin American City Benchmark – Mobile Performance
Speedtest Intelligence, Q1 2025

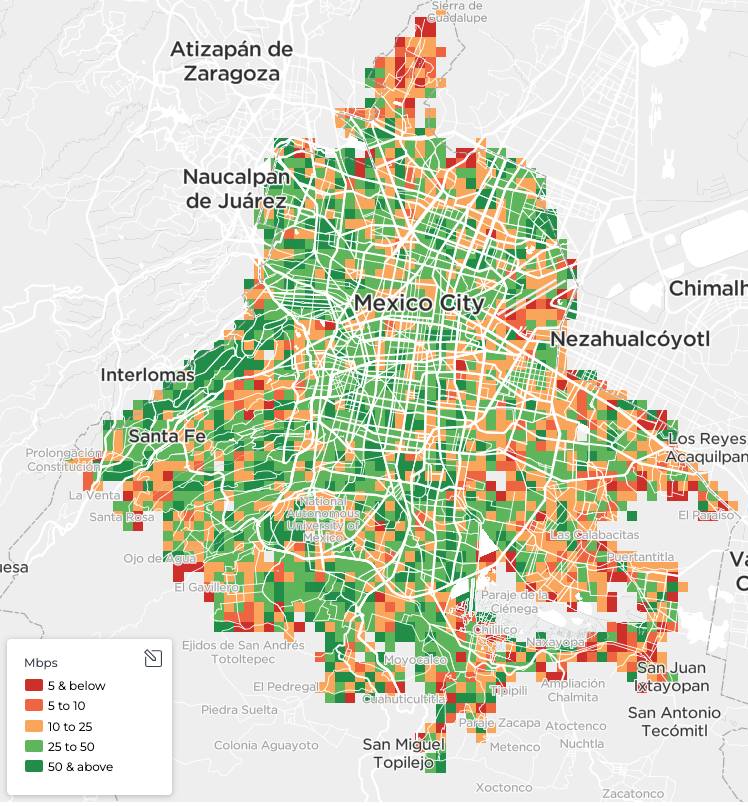
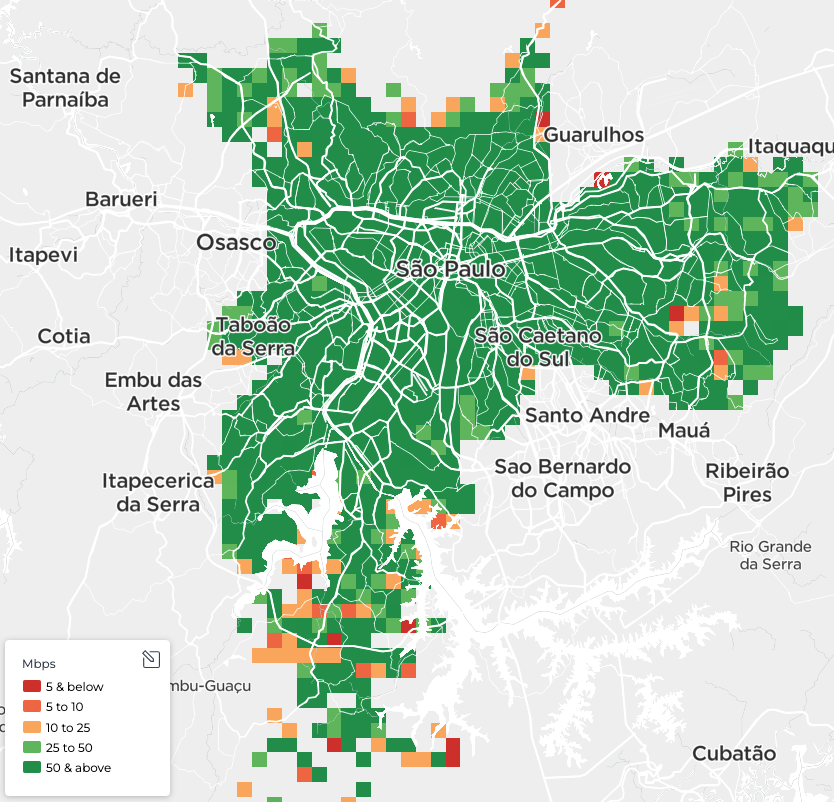
Maps are the best way to clearly illustrate performance differences within cities. Our recent study with Dublin City Council, which aimed to pinpoint areas of poor performance across that city, highlighted how crucial it is for urban leaders to understand the spread of mobile internet outcomes throughout their jurisdictions. This understanding allows them to combine this data with other information, such as the locations of city-owned infrastructure, as they seek to drive improvement.

Comparing Mexico City to São Paulo visually demonstrates these performance differences. In São Paulo, based on Speedtest data for Q4 2024 – Q1 2025, a majority of locations have median download speeds exceeding 50 Mbps (colored dark green). Conversely, a significant portion of locations within Mexico City display median download speeds of 25 Mbps or less, as evidenced by the prevalence of orange and red tiles, especially along its eastern border with the State of Mexico.

Variation in mobile user experience highlights the impact of performance disparities

Key quality of experience (QoE) metrics such as web page load time, video start time, and the share of full HD samples, again show mixed outcomes for Mexican users across the nation’s cities. 

The Mexican cities of Puebla, Zapopan, and Guadalajara had the worst web page load times, alongside Panama City, with median load times exceeding 2.4 seconds. In contrast, Mexico City and its satellite cities performed much better, recording median page load times of 1.75 seconds or less.

Regarding video streaming, only Guatemala City achieved a majority of users recording a fast video start time (where over 50% of samples played in under 2 seconds). Notably, five of the ten Mexican cities in this study recorded 40% or lower for this metric.

Latin American City Benchmark – QoE Performance
Speedtest Intelligence, Q1 2025

5G is yet to deliver on its potential for Mexican cities

Mexican cities underperform based on mobile network speeds compared to other major cities in Latin America, especially given their relatively high adoption of 5G. As of Q4 2024, Mexico ranks third in Latin America for the share of 5G connections per market (9.4%), according to GSMA Intelligence, trailing only Chile (18.6%) and Brazil (25.7%).

However, our data reveals significant disparities in 5G Service within Mexican cities. 5G Service refers to the percentage of locations where an operator provides service and 5G users can access the network. This variation suggests an uneven 5G rollout across the country. Specifically, Mexican cities with the lowest median download speeds consistently show lower 5G Service percentages. For example, Ecatepec recorded only 4.5% 5G Service, while Mexico City stood at 18.5%. In contrast, leading cities like Monterrey achieved nearly 40% 5G Service, highlighting the stark differences in network coverage across the market.

Latin American City Benchmark – 5G Service in Mexican Cities
Speedtest Intelligence, Q1 2025

Mexican cities are disproportionately represented within the benchmark group of cities, among those with the smallest year-on-year improvements in median download speeds, comparing Q1 2024 to Q1 2025. Out of 24 cities included in our study, only Monterrey and Tijuana ranked in the top ten for the largest improvements. In contrast, six Mexican cities appeared in the bottom ten for performance gains.

Latin American City Benchmark – Annual Improvement in Median Download Speed
Speedtest Intelligence, Q1 2024 vs Q1 2025

Mexican cities face significant challenges in driving improved mobile network outcomes, despite 5G launching in the market in early 2022. High spectrum licence fees, which have led to a lack of operator interest, and even the handing back of allocated spectrum, highlight one of the key issues facing the development of 5G in the market. This continues to manifest through strong regional disparities in mobile performance between Mexican cities, in 5G Service across the market, and in the fact that Telcel continues to maintain a market share in excess of 50%. Couple this with the disbanding of the independent telecoms regulator, the IFT, by the government late last year, and it’s clear Mexico faces significant challenges in fostering the development of its mobile networks.

Ookla is attending the GSMA’s M360 Latin America, in Mexico City from 28-29th May. If you’re attending and would like to connect, please reach out to us.

Ookla retains ownership of this article including all of the intellectual property rights, data, content graphs and analysis. This article may not be quoted, reproduced, distributed or published for any commercial purpose without prior consent. Members of the press and others using the findings in this article for non-commercial purposes are welcome to publicly share and link to report information with attribution to Ookla.

| January 13, 2025

Wireless networks demonstrate resiliency during California wildfire disaster

Operators were able to minimize downtime

As wildfires become more prevalent, wireless operators are becoming more adept at handling these types of natural disasters by quickly deploying cell sites on wheels (COWs) and other assets to try to maintain connectivity and minimize the downtime to the networks. In addition, operators are focusing their efforts on maintaining connectivity for first responders and emergency workers.   

The recent devastating wildfires that were first detected in the Los Angeles area on January 6 —including the Palisades, Eaton, Kenneth and Hurst fires — have not resulted in widespread wireless network outages. In fact, analysis of Speedtest Intelligence ® data reveals that users experienced a performance decline on January 8 but by January 9 the network performance was back on the upswing and by January 12 the networks were operating at nearly the same level they were prior to January 6. 

In the chart above, the consistency percentage measures what percentage of a provider’s samples equals or exceeds both a download and upload threshold of 5/1.

This minimal impact to the wireless networks was also noted by Federal Communications Commission Chairwoman Jessica Rosenworcel: “While communications impacts are minimal so far, the FCC will continue to monitor how these sets of wildfires are affecting residents’ ability to receive the information they need to stay safe. Should conditions change, the agency stands ready to support in any way it can, including any requests to deploy FCC staff to help with any communications network recovery.”

Power outages

One of the biggest obstacles wireless operators had to deal with has been the loss of power to their cell sites. Reports of Southern California Edison’s power outages started to flood into Downdetector around 3 pm. PST on January 7 and peaked after noon PST on January 8 with more than 400 user reports per 15-minute intervals.

Drones and satellites 

Verizon revealed on January 10 that its engineers were deploying portable generators to cell sites in its network that were impacted by the commercial power loss. In addition, it said that in areas where fiber was burned it had deployed temporary satellite assets to provide added connectivity. 

The operator also said that it was using a fleet of more than 550 mobile assets, including drones and nearly 300 satellite-based assets to help provide connectivity where its traditional infrastructure was compromised. 

T-Mobile also is working to refuel portable generators to keep its cell sites online and the operator also said it was working with SpaceX’s Starlink to temporarily provide its direct-to-cell satellite service which will allow users in impacted areas to receive wireless emergency alerts and send texts. 

AT&T, meanwhile, said it has deployed its FirstNet Response Operations Group to help support firefighters and other first responders on the front lines with connectivity. 

Ookla will continue to monitor the network performance during the California wildfires and will provide updates if we detect any changes. 

Ookla retains ownership of this article including all of the intellectual property rights, data, content graphs and analysis. This article may not be quoted, reproduced, distributed or published for any commercial purpose without prior consent. Members of the press and others using the findings in this article for non-commercial purposes are welcome to publicly share and link to report information with attribution to Ookla.

| December 22, 2024

Ringing in the New Year - How do 5G Networks Cope Under Stress?

5G Networks Support NYE Festivities Across Major Cities

Major events present a unique challenge for mobile networks, particularly sporting events where users congregate in concentrated numbers, and where sharing of video to social media, and to friends and family is a key use case. Ringing in the New Year is another case in point – for many years network operators published statistics on the number of voice calls made, messages sent, and the amount of data traffic their networks handled. While the rise of over-the-top (OTT) communications platforms such as WhatsApp have put a damper on these press releases, there remains a sizeable impact on operators’ networks. For example, Belgian operator Proximus noted a 95% increase in mobile data traffic on New Year’s Eve in 2023 compared to 2022. The trend isn’t uniform across markets, with Australia’s Telstra consistently seeing lower data usage on New Year’s Eve, with its customers using 30% less data than average, according to a news source. What is clear is that the New Year presents network operators with the challenge of serving sufficient bandwidth to customers attending major New Year celebrations, allowing them to share the moment, but also to support the mass wishing of “Happy New Year” across a variety of channels.

We reviewed Speedtest Intelligence data for New Year’s Eve 2023/24, to analyse how 5G networks coped with the surge in demand and change in traffic patterns at New Year, across a selection of major cities featuring some of the largest New Year celebrations around the globe. We focused in on median performance alongside the 10th percentile, in order to evaluate the spread of performance from the median user to those experiencing more challenging network conditions which would impact their experience at New Year.

Worst 10% of Speedtest samples reveal network challenges

We zeroed in on 5G upload performance first. Network operators universally allocate more spectral capacity to the downlink, as most mobile use cases lean more heavily on downloading data to the end-user device. However, the usage profile at the New Year is different, with video sharing, video streaming and calling, as well as uploading content to social media, more prevalent. These are all activities that are supported by uplink from the device.

Our data shows a significant gap between upload performance for the median user, and those in the lower 10th percentile – those experiencing the worst 10% of performance samples. Half the cities in our analysis recorded 10th percentile upload performance of less than 1 Mbps, with speeds ranging from 0.30 Mbps in Berlin, to 6.09 Mbps in Dubai. These sub-par speeds make it nearly impossible to upload photos or videos.

User Experience – Assessing the Worst 10% of Performance Samples on New Year's Eve
Speedtest data, New Year's Eve 23/24, 8pm – 1am

It was a similar picture for New Year revellers based on download speeds and latency. Despite more capacity being allocated to the downlink, performance for the lowest 10% of samples tumbled significantly compared to the median experience, with cities in APAC (Bangkok, Hong Kong, Sydney and Tokyo) in particular suffering, recording 10th percentile 5G download speeds of less than 10 Mbps. Latency was more of a mixed story across cities. At one end of the scale, Tokyo recorded a variance in latency between the median and 90th percentile (the worst 10% of latency samples) of just 19 ms, while Sydney saw a much wider gap of almost 200 ms. At 200 ms of latency users are likely to experience frustratingly slow loading times, unresponsive applications, and poor video quality.

Our data also showed the degree to which New Year usage pulled down 5G performance for the worst 10% of samples. New York, and cities in Europe saw less of an impact at New Year’s Eve compared to their global counterparts. Berlin, London, New York and Paris saw 5G download speeds for 10th percentile drop by between 1.13 Mbps and 6.88 Mbps. In contrast, Bangkok, Hong Kong and Sydney saw performance drop by between 15.13 Mbps and 21.44 Mbps. Dubai and Rio de Janeiro recorded the largest variance, however with faster 5G speeds they still outpaced the remaining markets by a significant margin. Upload performance for the worst 10% of samples followed a similar trend to download, however latency performance was more varied. Berlin, Dubai, New York, Rio de Janeiro and Tokyo saw very little difference between New Year Eve latency performance and the Q4 2023 average. However, Paris, Hong Kong and London saw an increase in latency for the worst 10% off samples of between 22 ms and 36 ms, while Bangkok and Sydney fared worst, with an increase of 61 ms and 171 ms respectively.

Impact of New Year's Eve Traffic on Users With the Worst 10% of Samples
Speedtest data, Q4 2023 vs New Year's Eve 23/24, 8pm – 1am

Addressing network pain points

Addressing network pain points for users affected by poor performance in dense urban areas is a challenging task. For major events like the recent Paris Olympics, which we reported on earlier this year, network operators will typically deploy temporary network assets such as cells on wheels (CoWs) to add extra network capacity, which can then be removed once the event concludes. Network operators can also look to build private networks, to provide dedicated capacity to support the operations of the event, including routing traffic for broadcasting purposes. However, city authorities also have an important role to play here, as highlighted in our recent whitepaper with Dublin City Council and the City Telecoms Association. Having a holistic view of network performance and its evolution across a city, as well as international benchmarks, provides city authorities with the data and insights to engage more constructively with network operators and regulators, and help introduce more effective policies to deliver meaningful change for end-users. We’ll continue to benchmark and report on city and state performance, based on Speedtest Intelligence data. For more information, please contact us.

Ookla retains ownership of this article including all of the intellectual property rights, data, content graphs and analysis. This article may not be quoted, reproduced, distributed or published for any commercial purpose without prior consent. Members of the press and others using the findings in this article for non-commercial purposes are welcome to publicly share and link to report information with attribution to Ookla.