| February 15, 2023

Are 5G Networks Meeting Consumers’ Expectations?

Key messages

  • In-market 5G performance varies widely. Reviewing the top 10% and worst 10% of Ookla® Speedtest Intelligence® samples reveals significant variance in the consumer experience on today’s 5G networks, with 5G speeds peaking at over 1 Gbps for the top 10% of users in the U.A.E on average, but falling to below 20 Mbps for the lower 10% in Norway, the U.S., Japan, Germany, and Spain.
  • Median 5G performance is declining in many early launch 5G markets. While understandable as 5G adoption grows and users in more remote locations access 5G, declining median download speeds also point to investment and deployment challenges in some markets. At the same time, many of these markets are facing economic headwinds, placing more emphasis than ever on cost control. As a result, operators must carefully balance network investment priorities.
  • 5G Net Promoter Scores (NPS) significantly higher than 4G LTE in most markets, but waning. With the exception of Sweden and Qatar, all the early launch 5G markets in our analysis saw 5G NPS fall year-over-year. Operators’ 5G NPS still trade at a premium compared to 4G, and while performance is just one part of the equation, operators should take care to build on the positive sentiment that 5G has brought to date.

Despite impressive headline speeds, 5G performance varies a lot

Median 5G performance allows us to gauge the midpoint of user experience on 5G networks, however it doesn’t paint the full picture. While headline 5G speeds impress, Speedtest Intelligence data lays bare the ups and downs of 5G performance for consumers, even in early launch, advanced 5G markets. We recently looked at 5G network performance over high frequency (mmW) bands, painting a view of the true potential of 5G networks. However, if we look at performance on today’s 5G networks, looking beyond the median at the range of performance between users in the top 10% and those in the lower 10%, Speedtest Intelligence data reveals huge variance in the performance users experience.

Chart of psread of 5g performance, top 10% of samples versus median and lower 10%

The U.A.E. was the fastest 5G market in our analysis, based on median download performance of 545.53 Mbps in December 2022, followed by South Korea and Qatar. However, the top 10% of users in the U.A.E. recorded speeds of at least 1,266.49 Mbps on average, while the lowest 10% of users experienced speeds of 127.52 Mbps or slower on average. At the other end of the scale, Spain recorded a median 5G speed of 94.14 Mbps, but also demonstrated wide variance between the top 10% of samples at 537.95 Mbps or faster and the lowest 10% with 10.67 Mbps or less.

Based on many of the marketing messages around 5G, consumers are led to expect a big bang change in performance. However, with 5G operating over a greater range of spectrum bands than previous generations, including high frequency spectrum which has relatively poorer propagation, it’s understandable that 5G performance will vary more than previous generations of mobile network technology.

5G markets set to face performance challenges during 2023

While globally 5G speeds have remained stable, for many of the markets in our analysis, median 5G download speeds have fallen over the past year. The U.S. was the main outlier, recording the strongest uplift in 5G performance as T-Mobile continued to drive home its performance advantage in the market, while Verizon’s performance improved early in 2022 through its deployment of 5G in C-band spectrum. This trend is likely to continue in 2023 in the U.S., as more C-band spectrum is made available. However, the picture remains concerning for a number of other 5G markets, particularly those where median 5G speeds are at the lower end of the spectrum.

Chart of Year-over-Year change in median 5G download performance

In some markets, 5G was initially priced at a premium to 4G, with operators focused on driving incremental returns on the new network technology. However, operators have been increasingly opening up 5G access by removing incremental costs for consumers and adding prepaid plans too. As 5G adoption scales, it places more strain on the new networks. The challenge for many of these markets is that network performance is likely to degrade further unless network densification picks up. 

For network operators, this investment imperative is occuring amidst macroeconomic headwinds, which are driving up operating costs and putting pressure on consumer and enterprise spend. In addition, there remain challenges in deploying additional 5G cell sites in dense urban areas where demand is strongest, while in some markets EMF limits and other regulations can limit the deployment of high-capacity 5G sites.

Degrading 5G performance impacts consumer sentiment

Net Promoter Score (NPS) from Speedtest Intelligence paints a largely positive picture of current 5G networks. NPS is a key performance indicator of customer experience, categorizing users into Detractors (score 0-6), Passives (score 7-8), and Promoters (score 9-10), with the NPS representing the percentage of Promoters minus the percent of Detractors, displayed in the range from -100 to 100. Across the markets we analyzed, 5G users on average rated their network operator with NPS scores that were universally higher than those for 4G LTE users. However, consumer sentiment for users on 5G networks is beginning to shift, with NPS scores falling, coinciding with lower median 5G performance in many of the markets we analyzed.

Chart of 5G uplift in Net Promoter Scores vs. 4G LTE

Declining performance levels will be a factor driving NPS down for some 5G users. It’s also important to remember that as 5G scales in many of these early launch markets, the profile of 5G users is also changing from predominantly urban-based users, to more of a mix of urban, suburban, and rural users, which brings additional coverage and performance challenges for network operators. We plan to examine the relationship between 5G performance and spectrum in an up-coming content piece. Please get in touch if you’d like to learn more about Speedtest Intelligence data.

Ookla retains ownership of this article including all of the intellectual property rights, data, content graphs and analysis. This article may not be quoted, reproduced, distributed or published for any commercial purpose without prior consent. Members of the press and others using the findings in this article for non-commercial purposes are welcome to publicly share and link to report information with attribution to Ookla.

| December 20, 2021

Growing and Slowing: The State of 5G Worldwide in 2021


5G continues to offer new and exciting ways of rethinking everything from streaming video to performing remote surgery. However, not everyone shares equally in these possibilities as many countries do not have access to 5G and even those that do, do not experience the same level of performance from their 5G connections. We examined Speedtest Intelligence® data from Q3 2021 Speedtest® results to see how 5G speeds have changed, where download speeds are the fastest at the country and capital level, where 5G deployments have increased and what worldwide 5G Availability looked like in Q3 2021. We also looked at countries that don’t yet have 5G to understand where consumers are seeing improvements in 4G access.

5G slowed down at the global level

Median-Speeds-Worldwide_1221-01

It’s common to see new mobile access technologies slow down as adoption scales, particularly early on in the tech cycle. Over the past year from Q3 2020 to Q3 2021, the median global 5G download speed fell to 166.13 Mbps, down from 206.22 Mbps in Q3 2020. Median upload speed over 5G also slowed to 21.08 Mbps (from 29.52 Mbps) during the same period.

More users are logging on to existing 5G networks, and we’re also at the stage in the evolution of 5G where countries that have historically had slower speeds are starting to offer 5G. In addition, the widespread use of dynamic spectrum sharing that has been used to boost early 5G coverage weighs on 5G download speeds. While the dip in speeds looks like a letdown, it’s more of a compromise to enable broader access. With additional spectrum and further deployments slated for 2022, we anticipate speeds will begin to pick up again.

South Korea had the fastest 5G in the world

ookla_5g-download_performance_countries_1221-01-1

South Korea had the fastest median download speed over 5G during Q3 2021, leading a top 10 list that included Norway, United Arab Emirates, Saudi Arabia, Qatar, Kuwait, Sweden, China, Taiwan and New Zealand. Sweden, China, Taiwan and New Zealand were new to the top 10 in 2021 while South Africa (whose 5G was brand new last year), Spain and Hungary fell out of the top 10.

5G expanded to 13 additional countries

ookla_5G-map_1221-01

According to the Ookla® 5G Map, there were 5G deployments in 112 countries as of November 30, 2021. That’s up from 99 countries on the same date a year ago. The total number of deployments increased dramatically during the same time period with 85,602 deployments on November 30, 2021 compared to 17,428 on November 30, 2020, highlighting the degree to which 5G networks scaled during the year. Note that there are often multiple deployments in a given city.

Seoul and Oslo lead world capitals for 5G

ookla_5g-download_performance_capitals_1221-01

Speedtest Intelligence data from Q3 2021 shows a wide range of median 5G speeds among global capitals. Seoul, South Korea and Oslo, Norway were in the lead with 530.83 Mbps and 513.08 Mbps, respectively; Abu Dhabi, United Arab Emirates; Riyadh, Saudi Arabia and Doha Qatar followed. Brasilia, Brazil had the slowest median download speed over 5G on our list, followed by Warsaw, Poland; Cape Town, South Africa and Rome, Italy. Stockholm, Sweden and Oslo, Norway had some of the the fastest median upload speeds over 5G at 56.26 Mbps and 49.95 Mbps, respectively, while Cape Town had the slowest at 14.53 Mbps.

The U.S. had the highest 5G Availability

The presence of 5G is only one indicator in a market, because even in markets where 5G has launched, coverage and adoption can be pretty low. We analyzed 5G Availability to see what percent of users on 5G-capable devices spent the majority of their time on 5G, both roaming and on-network during Q3 2021.

ookla_5g-availability_countries_1221-01

The United States had the highest 5G Availability at 49.2%, followed by the Netherlands (45.1%), South Korea (43.8%), Kuwait (35.5%) and Qatar (34.8%). Brazil had the lowest 5G Availability on our list at 0.8%, followed by Sweden (1.5%), South Africa (2.7%), New Zealand (2.9%) and Hungary (3.6%).

Not all 5G networks are created equal

Ookla Speedtest Intelligence data shows a growing disparity in the performance of 5G networks worldwide, even among the pioneer markets who were among the first to launch the new technology. We see leading markets such as South Korea, Norway, the UAE and China pulling well ahead of key European markets, the U.S. and Japan on 5G download speeds, creating what increasingly looks like two tiers of 5G markets.

ookla_5g-download_performance_1221-01

Part of the reason for this divergence is access to key 5G spectrum bands, with Verizon and AT&T in the U.S. for example, soon to deploy their C-band spectrum holdings for 5G use. However, what really seems to separate these markets is the level of 5G network densification. The number of people per 5G base station ranges from 319 in South Korea and 1,531 in China, to 4,224 in the EU and 6,590 in the US, according to the European 5G Observatory’s International Scoreboard during October 2021.

Despite the noise around 6G, 5G still has a long way to run

Median 5G mobile download speeds across these markets are respectable relative to the International Telecommunication Union’s (ITU) IMT-2020 target of 100 Mbps for user experienced download data rates. However, 5G Speedtest® results in each market demonstrate significant variability, with the bottom 10th percentile only recording speeds in excess of the IMT-2020 target in South Korea and Norway, and falling significantly short in many other markets, with Spain, Italy and the U.S. below 20 Mbps.

The story gets worse for upload speeds, where no market’s median speed broke the IMT-2020 recommended 50 Mbps, and where the bottom 10th percentile lay in single digits across the board. Operators are clearly prioritizing download speeds over upload, which makes sense given the asymmetric nature of demand, with most consumer applications requiring higher download speeds. However, as operators increasingly look to target the enterprise market with 5G connectivity and consumer demand for services such as video calling and mobile gaming continues to rise, operators will need to boost upload speeds.

ookla_5g-upload_performance_1221-01-1

Demand for mobile internet bandwidth continues to grow, up 43% year-on-year in Q3 2021 according to Ericsson’s latest mobility report. Looking ahead to 2022, operators will need to increase the capacity of their 5G networks to tackle this growing demand while driving network speeds to new heights. We’ve seen the impact the deployment of new spectrum can have on congested networks during 2021, with Reliance Jio witnessing a bump in 4G LTE performance and consumer sentiment following its acquisition of additional spectrum in India.

Where 5G still fails to reach

Speedtest Intelligence showed 70 countries in the world where more than 20% of samples were from 2G and 3G connections (combined) during Q3 2021 and met our statistical threshold to be included. These are mostly countries where 5G is still aspirational for a majority of the population. As excited as we are about the expansion of 5G, we do not want to see these countries left behind. Not only are 2G and 3G decades old, they are only sufficient for basic voice and texting, social media and navigation apps. To deliver rich media experiences or video calling, users need access to 4G or higher. Having so many consumers on 2G and 3G also prevents mobile operators from refarming that spectrum to make 4G and 5G networks more efficient.

Countries That Still Rely Heavily on 2G and 3G Connections
Speedtest IntelligenceⓇ | Q3 2021
Country 2G & 3G Samples
Central African Republic 89.9%
Palestine 84.7%
Yemen 72.4%
Turkmenistan 71.8%
Micronesia 56.3%
Madagascar 55.0%
Belarus 53.2%
Rwanda 51.7%
Kiribati 48.4%
Equatorial Guinea 47.6%
Afghanistan 44.4%
South Sudan 43.4%
Guyana 42.3%
Guinea 37.0%
Angola 36.8%
Cape Verde 35.9%
Tajikistan 35.6%
Zimbabwe 34.7%
Benin 34.4%
Togo 33.8%
Ghana 33.0%
Sierra Leone 31.7%
Antigua and Barbuda 30.2%
Vanuatu 30.1%
Lesotho 30.0%
Syria 29.6%
Moldova 29.4%
Saint Kitts and Nevis 28.9%
Mozambique 28.8%
Sudan 28.4%
Palau 28.3%
Grenada 28.1%
Tanzania 27.6%
Uganda 27.5%
Niger 27.5%
Gabon 27.5%
Haiti 27.4%
Suriname 27.4%
Tonga 27.3%
Liberia 27.0%
Namibia 26.7%
Swaziland 26.5%
The Gambia 26.3%
Saint Vincent and the Grenadines 26.3%
Dominica 26.3%
Somalia 26.1%
Cook Islands 26.0%
Zambia 25.9%
Barbados 25.7%
Armenia 25.5%
Algeria 25.4%
Papua New Guinea 25.2%
Jamaica 24.5%
Venezuela 24.2%
Ethiopia 24.1%
Uzbekistan 24.0%
El Salvador 23.5%
Honduras 23.1%
Nigeria 23.0%
Solomon Islands 22.8%
Caribbean Netherlands 22.7%
Botswana 22.3%
Anguilla 21.7%
Mauritania 20.6%
Saint Lucia 20.5%
Bosnia and Herzegovina 20.3%
Burundi 20.3%
Ecuador 20.2%
Ukraine 20.1%
Trinidad and Tobago 20.0%

We were pleased to see the following countries come off the list from last year, having dropped below the 20% threshold: Azerbaijan, Bangladesh, Belize, Burkina Faso, Cameroon, Costa Rica, Côte d’Ivoire, DR Congo, Iraq, Kenya, Laos, Libya, Maldives, Mali, Mauritius, Mongolia, Nicaragua, Paraguay and Tunisia. While countries like Palestine, Suriname, Ethiopia, Haiti and Antigua and Barbuda are still on this list, they have improved the percentage of their samples on these outmoded technologies when compared to last year (dropping 10-15 points, respectively), 2G and 3G samples in Belarus increased 6.7 points when comparing Q3 2021 to Q3 2020.

We’re excited to see how performance levels will normalize as 5G expands to more and more countries and access improves. Keep track of how well your country is performing on Ookla’s Speedtest Global Index.

Ookla retains ownership of this article including all of the intellectual property rights, data, content graphs and analysis. This article may not be quoted, reproduced, distributed or published for any commercial purpose without prior consent. Members of the press and others using the findings in this article for non-commercial purposes are welcome to publicly share and link to report information with attribution to Ookla.

| December 18, 2022

Stable and Expanding: The State of Worldwide 5G in 2022


5G is no longer a new technology, however, consumers in many countries are still waiting to see the full benefits of 5G (or even to connect to 5G at all). We examined Speedtest Intelligence® data from Q3 2022 Speedtest® results to see how 5G performance has changed since last year, where download speeds are the fastest at the country level, and how satellite technologies are offering additional options to connect. We also looked at countries that don’t yet have 5G to understand where consumers are seeing improvements in 4G LTE access.

5G speeds were stable at the global level

Graphic of 5G median speed performance worldwide.

In 2021, we discussed how an expansion of 5G access led to a decline in overall speed at the global level. This year showed a stabilization in overall speed, even as 5G access broadened, with a median global 5G download speed of 168.27 Mbps in Q3 2022 as compared to 166.13 Mbps in Q3 2021. Median upload speed over 5G slowed slightly to 18.71 Mbps (from 21.08 Mbps) during the same period. According to the Ookla® 5G Map™, there were 127,509 5G deployments in 128 countries as of November 30, 2022, compared to 85,602 in 112 countries the year prior.

South Korea and the United Arab Emirates led countries for 5G speeds

Chart of fastest countries for median 5G download speed

South Korea and the U.A.E. had the fastest median download speed over 5G at 516.15 Mbps and 511.70 Mbps, respectively, during Q3 2022, leading a top 10 list that included Bulgaria, Qatar, Saudi Arabia, Singapore, Kuwait, New Zealand, Bahrain, and Brazil. Bulgaria, Singapore, Bahrain, and Brazil were new to the top 10 in 2022, while Norway, Sweden, China, and Taiwan fell out of the top 10.

Satellite became more accessible but performance slowed

2022 saw a proliferation of fast, low-earth orbit (LEO) satellite internet from Starlink across the world. Q1 2022 saw Starlink speeds increase year over year in Canada and the U.S., with Starlink in Mexico having the fastest satellite internet in North America, Starlink in Lithuania the fastest in Europe, Starlink in Chile the fastest in South America, and Starlink in Australia the fastest in Oceania.

Q2 2022 saw Starlink speeds decrease in Canada, France, Germany, New Zealand, the U.K., and the U.S. from Q1 2022 as Starlink crossed the 400,000 user threshold across the world. Starlink in Puerto Rico debuted as the fastest satellite provider in North America. Starlink outperformed fixed broadband averages in 16 European countries. Starlink in Brazil had the fastest satellite speeds in South America. And Starlink in New Zealand was the fastest satellite provider in Oceania.

During Q3 2022, Starlink performance dipped once again from Q2 2022 in Canada and the U.S., while remaining about the same in Chile. Starlink in Puerto Rico and the U.S. Virgin Islands had the fastest satellite speeds in North America, while Starlink in Brazil again was the fastest satellite provider in South America.

With Viasat, HughesNet, and Project Kuiper set to launch huge LEO constellations in 2023, consumers around the world are poised to have more fast satellite internet options, particularly as the European Commission makes its own play for a constellation and Eutelsat and OneWeb potentially merging.

5G Availability points to on-going challenges

5G Availability measures the proportion of Speedtest users with 5G-capable handsets, who spend a majority of time connected to 5G networks. It’s therefore a function of 5G coverage and adoption. We see wide disparity in 5G Availability among markets worldwide, with for example the U.S. recording 54.3% in Q3 2022, well ahead of markets such as Sweden and the U.A.E., with 8.6% and 8.3% respectively.

Chart of 5G availability in select markets, based on users with 5G-capable handsets

Critical levers for mobile operators to increase 5G Availability include:

  • Increasing 5G coverage by deploying additional base stations
  • Obtaining access to, or refarming, sub-GHz spectrum, to help broaden 5G coverage, as sub-GHz spectrum has superior propagation properties than that of higher frequency spectrum bands.
  • Encouraging 5G adoption among users with 5G-capable handsets.

Speedtest Intelligence points to 5G adoption challenges in some markets, with 5G Availability dropping in Bulgaria, South Korea, the Netherlands, and the U.A.E. As more users acquire 5G-capable devices, operators need to balance their pricing models to ensure users have sufficient incentives to purchase a 5G tariff.

Chart of percentage change in 5G availability in select markets, based on users with 5G-capable handsets

Where 5G continues to fail to reach

Speedtest Intelligence showed 29 countries in the world where more than 20% of samples were from 2G and 3G connections (combined) during Q3 2022 and met our statistical threshold to be included (down from 70 in Q3 2021). These are mostly countries where 5G is still aspirational for a majority of the population, which is being left behind technologically, having to rely on decades-old technologies that are only sufficient for basic voice and texting, social media, and navigation apps. We’re glad to see so many countries fall off this list, but having so many consumers on 2G and 3G also prevents mobile operators from making 4G and 5G networks more efficient. If operators and regulators are able to work to upgrade their users to 4G and higher, everyone will benefit.

Countries That Still Rely Heavily on 2G and 3G Connections
Speedtest IntelligenceⓇ | Q3 2021
Country 2G & 3G Samples
Central African Republic 76.2%
Turkmenistan 58.5%
Kiribati 51.6%
Micronesia 47.4%
Rwanda 41.1%
Belarus 39.7%
Equatorial Guinea 37.7%
Afghanistan 36.7%
Palestine 33.5%
Madagascar 27.5%
Sudan 27.4%
Lesotho 26.5%
South Sudan 26.3%
Benin 26.0%
Guinea 25.5%
Cape Verde 24.3%
Tonga 24.3%
Syria 23.4%
The Gambia 23.4%
Ghana 23.3%
Palau 22.9%
Niger 22.8%
Tajikistan 22.7%
Mozambique 22.4%
Guyana 21.8%
Togo 21.8%
Congo 21.1%
Moldova 20.8%
Saint Kitts and Nevis 20.0%

We were pleased to see the following countries come off the list from last year, having dropped below the 20% threshold: Algeria, Angola, Anguilla, Antigua and Barbuda, Armenia, Barbados, Bosnia and Herzegovina, Botswana, Burundi, Caribbean Netherlands, Cook Islands, Dominica, Ecuador, El Salvador, Ethiopia, Gabon, Grenada, Haiti, Honduras, Jamaica, Liberia, Mauritania, Namibia, Nigeria, Papua New Guinea, Saint Lucia, Saint Vincent and the Grenadines, Sierra Leone, Solomon Islands, Somalia, Suriname, Swaziland, Tanzania, Trinidad and Tobago, Uganda, Ukraine, Uzbekistan, Vanuatu, Venezuela, Yemen, Zambia, and Zimbabwe. While countries like Belarus, Cape Verde, Central African Republic, Guinea, Guyana, Madagascar, Palestine, Rwanda, South Sudan, Tajikistan, Togo, and Turkmenistan are still on this list, they have improved the percentage of their samples on these outmoded technologies when compared to last year by at least 10 points. Palestine improved by more than 50 points. 2G and 3G samples in Kiribati increased 3.2 points when comparing Q3 2022 to Q3 2021.

We’re glad to see performance levels normalize as 5G expands to more and more countries and access improves and we are optimistic that 2023 will bring further improvements. Keep track of how well your country is performing on Ookla’s Speedtest Global Index™ or track performance in thousands of cities worldwide with the Speedtest Performance Directory™.

Ookla retains ownership of this article including all of the intellectual property rights, data, content graphs and analysis. This article may not be quoted, reproduced, distributed or published for any commercial purpose without prior consent. Members of the press and others using the findings in this article for non-commercial purposes are welcome to publicly share and link to report information with attribution to Ookla.

| May 17, 2023

ISPs Need to Do More to Improve Wi-Fi Performance in the Home

Key messages

  • Wi-Fi woes continue. Ookla® Speedtest Intelligence® data shows Wi-Fi performance continues to lag behind ethernet performance within home networks in many advanced fixed broadband markets, with Wi-Fi speeds typically ranging from between 30-40% of ethernet speeds during Q1 2023.
  • Developed Asian and North American markets lead the charge to Wi-Fi 6/6E. Wi-Fi 4 and 5 remain the dominant Wi-Fi access technologies globally, accounting for a combined 89% of Speedtest® samples during Q1 2023. However, a number of advanced fixed broadband markets are rapidly migrating to Wi-Fi 6 and 6E, with China, Hong Kong (SAR), Singapore, Canada, and the U.S. leading the charge.
  • Growing Wi-Fi 6/6E adoption helps narrow the gap in Wi-Fi performance. In markets such as Canada, France, Germany, Singapore, Sweden, and the U.S., where the transition to fiber is more advanced, and where ISPs are actively driving adoption of Wi-Fi 6/6E routers, we see Wi-Fi performance closing the gap to ethernet. However, more needs to be done in other markets, where migration to more advanced fixed access networks is exposing the limitations of the installed base of Wi-Fi routers.
  • Router vendors pushing the envelope with Wi-Fi 7 capable launches. ASUS leads the market for Wi-Fi 6/6E routers among Speedtest samples, and both ASUS and other leading router vendors have been quick to launch Wi-Fi 7 capable routers. Despite this, Wi-Fi 6 and 6E remain the growing component of their installed bases. ASUS leads the market according to Speedtest Intelligence with 39% of its routers we sampled supporting Wi-Fi 6/6E during Q1 2023, well ahead of second placed NETGEAR with 26%.
  • Smartphone device support indicates Wi-Fi 6/6E should remain the immediate focus for ISPs. With the two largest smartphone vendors globally, Samsung and Apple, currently shunning Wi-Fi 7, ISPs waiting to see if they can leapfrog Wi-Fi 6E to Wi-Fi 7 should stay their hands. The fact that China still needs to allocate the 6 GHz spectrum band — key for Wi-Fi 6E and 7 — for unlicensed use is also significant, and appears to have weighed on the Wi-Fi 6E adoption among China’s leading Android smartphone manufacturers.

Wi-Fi performance continues to lag ethernet within the home

ISPs in advanced fixed broadband markets are increasingly looking to offer more advanced Wi-Fi routers and solutions such as mesh networks, which are designed to improve Wi-Fi coverage and performance. However, Speedtest Intelligence data shows that more needs to be done to improve Wi-Fi performance, which typically ranged from between 30-40% of ethernet speeds. Median Wi-Fi performance as measured by Speedtest will tend to lag behind median ethernet performance, depending on distance of the end-user device from the router, including any obstacles and signal interference the Wi-Fi signal needs to traverse to reach the device.

Chart of Ratio of Wi-Fi to Ethernet Performance

Our analysis of Speedtest Intelligence data reveals that driving greater adoption of more advanced Wi-Fi routers can help ISPs narrow the gap between Wi-Fi and ethernet performance, with ISPs in Canada, France, Germany, Singapore, Sweden, and the U.S. already successfully doing so over the past year.

Chart of Closing the Gap on Wi-Fi Performance

Despite this, the results are not always positive, with the gap between Wi-Fi and ethernet performance widening, in particular in the U.K. and Taiwan. Where markets are rapidly migrating from more legacy fixed broadband technology to advanced cable and fiber connections, Wi-Fi performance can lag relative to ethernet, indicating a need to accelerate the adoption of more advanced Wi-Fi technologies.

Older generations of Wi-Fi 4 and Wi-Fi 5 remain dominant globally

While much of the focus of the device ecosystem is on spurring adoption of the latest Wi-Fi standards, there is a long way to go before even Wi-Fi 6 becomes a dominant standard globally. Based on Speedtest Intelligence data, the proportion of Wi-Fi tests by generation (a good proxy for adoption) shows that Wi-Fi 4 and Wi-Fi 5 remain the dominant router technology, with Wi-Fi 6 representing just under 10% as of February 2023, and Wi-Fi 7 showing very few samples. The share of samples from Wi-Fi 4 routers has fallen by 6 ppts year-over-year, while Wi-Fi 5’s share of samples has marginally increased.

Chart of Share of wi-Fi Samples by Generation

Asian and North American ISPs lead the charge to Wi-Fi 6 and beyond

ISPs are the main driver behind the adoption of new Wi-Fi standards, as highlighted by a 2022 study by Parks Associates, which found that 52% of U.S. consumers acquired their router from their ISP. Rolling out more advanced routers to their customer bases enables them to take advantage of the increased performance of newer generations of Wi-Fi technology, and helps to ensure ISPs deliver faster speeds, particularly over fiber access networks.

Adoption of Wi-Fi 6 varies by market, even among the most developed fixed broadband markets globally. ISPs in a number of advanced fixed markets have already begun offering Wi-Fi 6E routers to their customer bases, with ISPs in North America in particular moving in this direction, including Bell Canada, Rogers, Telus, Verizon, XFINITY, Charter, and Frontier, as well as leading ISPs in advanced Asian and European markets.

Markets in Asia led the way on Wi-Fi 6 adoption, with China and Hong Kong both recording 42% adoption, followed by Singapore with 37%. Outside of Asia, North America showed the next highest level of adoption, with the U.S. and Canada recording 32% and 30%, respectively. European fixed markets lagged behind, with adoption ranging from 13% in the U.K., to 24% in Sweden. For markets such as Chile, which placed towards the top of the Ookla Speedtest Global Index™ for median fixed broadband speeds, a relatively low-level of Wi-Fi 6 adoption (8% in Q4 2022) signals further opportunity for ISPs in the market to boost performance.

Chart of Adoption of Wi-Fi Generations by Market

The fastest growing markets, in terms of increasing share of Wi-Fi 6 of Speedtest samples year-over-year in Q1 2023, were Canada and Malaysia (+15 ppts), Singapore (+14 ppts), and Hong Kong (+12 ppts). While there was considerable variance between ISPs within each market, leading ISPs such as SmarTone (Hong Kong), DiGi (Malaysia), and ViewQwest (Singapore), are prompting a competitive response so that even ISPs with lower levels of Wi-Fi 6 adoption are prioritizing the technology and seeing adoption grow steadily.

CountryISPWi-Fi 6 %, Q1 2023
Hong Kong (SAR)SmarTone62.4%
CanadaBell pure fibre57.3%
SingaporeViewQwest53.7%
SingaporeMyRepublic50.3%
MalaysiaDigi50.2%
MalaysiaMaxis49.0%
Hong Kong (SAR)NETVIGATOR44.2%
CanadaRogers43.4%
SingaporeM141.7%
SingaporeSingTel41.4%
CanadaTelus PureFibre41.0%
Hong Kong (SAR)HKBN41.0%
CanadaShaw39.0%
SingaporeStarHub35.6%
Hong Kong (SAR)HGC30.0%
MalaysiaTIME28.8%
MalaysiaTM21.5%

In addition to providing newer routers, ISPs are increasingly positioned to help consumers solve Wi-Fi performance issues in the home, such as offering mesh Wi-Fi solutions. For some ISPs, this has even taken precedence over offering newer Wi-Fi 6E routers, as they look to improved coverage within the home as a faster route to improving Wi-Fi performance. 

In the U.K., BT has prioritized whole-home coverage over Wi-Fi 6E with its BT Complete Wi-Fi (mesh) offer, despite the U.K. regulator Ofcom having released the lower portion of the 6 GHz band for unlicensed use in 2020. In Canada, Telus, while having recently released a Wi-Fi 6E router for its broadband users, also offers its WiFi Plus package, which includes professional installation and “wall-to-wall coverage” throughout the home. Rogers also offers guaranteed Wi-Fi coverage throughout the home, as well as Wi-Fi 6E routers. Plume offers a subscription-based service, HomePass, across a number of markets, which allows users to add additional access points to help eradicate not-spots or poor Wi-Fi signal within the home and also offers solutions for ISPs looking to improve their Wi-Fi offerings. In Hong Kong, China Mobile Hong Kong (CMHK) was the first ISP in the market to offer a fiber-to-the-room service, while it and other ISPs such as NETVIGATOR offer consumers the option to subscribe to multiple channels over fiber with separate IP addresses, allowing them to divide their activities across channels and thereby help avoid congestion.

To capture the full performance benefits of Wi-Fi 6E and Wi-Fi 7, countries must allocate 6 GHz spectrum for unlicensed use, therefore allowing Wi-Fi devices to access this higher frequency, higher capacity spectrum, and utilize wider channels. At present, according to the Wi-Fi Alliance, allocation of the lower portion of the 6 GHz spectrum band (5,925 MHz to 6,425 MHz) is common among developed economies, with some notable exceptions in some developed markets in Asia and Asia Pacific, in particular China, while allocation of the full 6 GHz band is more limited, available across North America and some Latin American markets, as well as Saudi Arabia and South Korea.

Wi-Fi 7 on the horizon as router vendors continue to push the envelope on performance

Wi-Fi performance continues to scale, and with Wi-Fi 7 routers and smartphones having launched in the second half of 2022, that trend is set to continue. In addition to higher throughput, successive Wi-Fi generations also support lower latency, helping to better support higher quality video streaming, cloud gaming, and future use cases linked to concepts such as the Metaverse and other uses of extended reality (XR).

The major silicon vendors, Broadcom, Qualcomm, and Mediatek, were quick to update their solutions to support the emerging Wi-Fi 7 standard, and hardware vendors have followed suit. Chinese vendor H3C was the first to launch with its H3C Magic BE18000 Wi-Fi 7 router in July 2022, and it has since been followed by other major vendors including tp-link, ASUS, and more recently NETGEAR. However, the prices of early Wi-Fi 7 routers that take advantage of Wi-Fi 7’s range of enhanced performance capabilities will be a barrier to entry for many, with tp-link’s flagship Archer BE900 currently retailing at a cost of $699.99. 

Speedtest Intelligence data shows minimal Wi-Fi 7 adoption as of March 2023, however we are likely to see the same vendors drive Wi-Fi 7 adoption that are currently leading on Wi-Fi 6. Based on global Speedtest Intelligence samples, we see ASUS leading the market in Wi-Fi 6 penetration, with 39% of samples recorded using Wi-Fi 6 compatible routers. NETGEAR and Belkin followed, but for the remaining major router vendors, Wi-Fi 6 penetration currently stands at close to 10% or below. Wi-Fi 6E remains a small but growing subset of Wi-Fi 6 certified devices, currently standing at 7.7% of products based on the latest Wi-Fi Alliance data. Of these, a majority are either routers or smartphones, with an almost even split between the two.

Chart of Wi-Fi 6 Router Market Share view by Brand (Global)

Smartphone support indicates ISPs should focus on Wi-Fi 6E for now

With Samsung releasing its Galaxy S23 range in February 2023 without Wi-Fi 7 support, and Apple’s latest iPhone 14 smartphones limited to Wi-Fi 6, it’s clear that, for now, ISPs should prioritize the rollout of Wi-Fi 6/6E among their customer bases rather than consider leapfrogging to Wi-Fi 7. The Xiaomi Mi13 Pro was the first Wi-Fi 7 capable smartphone to hit the market, launching in December 2022, although it was limited to Wi-Fi 6E initially, requiring a software update to enable Wi-Fi 7. The availability of Wi-Fi 7 supporting Android smartphones will grow through 2023, enabled by SoCs from leading vendor Qualcomm with its flagship Snapdragon 8 Gen 2, and MediaTek with its Dimensity 9200. Apple, on the other hand, lags on the latest Wi-Fi standard support, with the iPhone 14 series featuring Wi-Fi 6, and with its fall 2023 models rumored to be adding Wi-Fi 6E to their feature list.

Chart of Android Smartphone Vendor Installed Base, by Wi-Fi Standard, Global

Samsung, as the leading Android smartphone vendor globally, has the largest installed base of smartphones supporting Wi-Fi 6 and Wi-Fi 6E, and has stolen a march on its main rivals Xiaomi, OPPO, and Vivo. While the major Chinese smartphone vendors have launched Wi-Fi 7 compatible devices, the lack of assignment of 6 GHz spectrum for unlicensed use in China does appear to have held them back relative to brands such as Samsung and ASUS.

The outlook for Wi-Fi in the home

It’s clear from the gap between Wi-Fi and ethernet performance that ISPs need to do more to improve the customer experience for Wi-Fi users within the home. Part of the solution lies in rolling out more advanced generations of Wi-Fi technology, given Wi-Fi 4 and 5 remain the dominant technologies deployed globally. However, evidence linking increased adoption of Wi-Fi 6 to overall Wi-Fi closing the gap to ethernet performance is mixed, and validates the approach of ISPs looking to also offer mesh networking Wi-Fi solutions. Contact us to find out more about how Ookla Research can help you monitor the performance of your networks, and stay ahead of the competition.

Ookla retains ownership of this article including all of the intellectual property rights, data, content graphs and analysis. This article may not be quoted, reproduced, distributed or published for any commercial purpose without prior consent. Members of the press and others using the findings in this article for non-commercial purposes are welcome to publicly share and link to report information with attribution to Ookla.

| December 2, 2024

Too Big to Fail? The Largest Outages in 2024 According to Downdetector

Our reliance on technology is so total that for many it feels like the world is ending when a popular site or service on the internet is inaccessible, and 2024 saw many outages that reminded us how much one such interruption can disrupt the daily lives of millions. We analyzed Downdetector® data from Q1-Q3 2024 to see where that pain of disconnection was felt most acutely. Read on to revisit the largest outages of 2024 at a global level and sorted by region.

Note that while some companies experienced more than one large outage during this time period, we’ve listed only the largest incident per company in each chart.

The world’s biggest outages this year

Chart of World's Largest Outage i, Downdetector, Q1-Q3 2024

Users of social media sites, internet providers, and gaming sites and services suffered the most disruptions this year according to Downdetector data on the world’s biggest outages. Facebook had the largest outage on our list. On March 5, over 11.1 million people across the world reported issues with the popular social media site.

The second largest global outage may be the most memorable. While CrowdStrike is not a service most people think of, we saw nearly 5 million reports to services that rely on it (or rely on Microsoft which relies on Crowdstrike), including emergency services, airlines, and ride sharing apps when a routine software update went bad on July 19.

AT&T suffered the third largest outage in the world, according to Downdetector data, when an equipment configuration error caused customers across the entire United States to lose network access for over 12 hours.

Biggest outages in each region

Asia Pacific region hit by global outages

Chart of Largest Outage in Asia-Pacific Region, Downdetector, Q1-Q3 2024

The March 5 Facebook outage also topped the list of outages in the Asia-Pacific region, instigating over 908k user reports to Downdetector and taking Instagram down with it as the second largest outage. The third largest outage happened on June 26 when over 168k Microsoft 365 users in the Asia-Pacific region reported service disruptions on the service. Japan was especially hard hit with over 139k user reports from that country alone.

People in the Asia-Pacific region were also affected by local outages, with over 76k users reporting issues with Japanese payment system PayPay in May, and 65k users in India reported issues with Jio during a September service disruption.

Europe struggles with social media sites

Chart of Largest Outage in Europe, Downdetector, Q1-Q3 2024

Social media sites were the main source of disconnection in Europe according to data from Downdetector. Over 3.4 million European users reported issues with Facebook during the March 5 outage, making that the largest outage in Europe during Q1-Q3 2024. WhatsApp users suffered the second largest outage in Europe with over 1.1 million people reporting issues during an outage in early April.

Two German companies also showed up on our list of largest outages in Europe with over 218k reports of issues with 1&1 and over 209k reports of issues with Deutsche Telekom when the two companies experienced service disruptions almost a week apart in late May.

Latin America feels pain from global social outages

Chart of Largest Outage in Latin America, Downdetector, Q1-Q3 2024

Latin America’s top three outages mirrored those in Europe with social media sites causing the most pain for users according to data from Downdetector. The March 5 Facebook outage was felt profoundly with almost 850k user reports on Downdetector in Latin America for issues related to Facebook and over 260k related to Instagram. WhatsApp had the second largest outage in the region with almost 420k user reports during the two hours the service was down on April 3.

Bait, a Mexican Mobile Virtual Network Operator (MVNO) owned by Walmart, suffered an outage on April 2 where almost 99k users reported issues to Downdetector. And on September 24, over 74k users reported issues with Brazilian fintech bank Nubank.

Middle East and Africa experience mix of local and global outages

Chart of Largest Outage in the Middle East and Africa, Downdetector, Q1-Q3 2024

Outage patterns in the Middle East and Africa differed from those in other regions with users reporting about as many issues with local sites and services as global ones. The two largest outages, Microsoft 365 on March 14 and Facebook on March 5, were part of global events.

The third largest outage in the region was with South African telecommunications provider Telkom. Almost 55k users across Africa reported issues to Downdetector when Telkom experienced an outage on May 13. MTN, Vodacom, and du are other telecom providers that made our list of top outages in the Middle East and Africa during Q1-Q3 2024.

United States and Canada

Chart of Largest Outage in U.S. and Canada, Downdetector, Q1-Q3 2024

As we saw with much of the rest of the world, Facebook topped the list of outages in the U.S. according to Downdetector with over 5.8 million users reporting issues with the service during its outage on March 5. The Crowdstrike and AT&T outages also hit the U.S. hard with almost 5 million and over 3.4 million user reports, respectively. Gaming sites and services and telecom providers filled out the rest of the list in the U.S.

Downdetector is your source for information about service disruptions, monitoring real-time performance for thousands of popular web services globally. Find Downdetector on the web or in the free Speedtest app for Android or iOS. We’ve recently introduced push notifications so you can learn about outages as soon as they happen. Businesses looking for early alerting on service issues may be interested in Downdetector ExplorerTM.

Ookla retains ownership of this article including all of the intellectual property rights, data, content graphs and analysis. This article may not be quoted, reproduced, distributed or published for any commercial purpose without prior consent. Members of the press and others using the findings in this article for non-commercial purposes are welcome to publicly share and link to report information with attribution to Ookla.

| February 22, 2023

Starlink Resurgence? Speeds Increase in Europe and Oceania

Ookla® is back with exciting, fresh data from Q3 and Q4 2022 for SpaceX’s Starlink and Sky Logic in Europe and Oceania, as well as new Starlink markets we haven’t yet featured in our ongoing series on satellite internet. With the FCC greenlighting Amazon’s Project Kuiper and many other exciting satellite developments launching this year, we’re certain all eyes will be on the sky in 2023 as new orbital connectivity options become available for consumers.

This analysis includes Starlink results from six new countries, and data for Starlink and Sky Logic in Europe and Starlink in Oceania. We also examine how Starlink’s internet performance has changed over the past year in Australia, Austria, Belgium, Croatia, France, Germany, Ireland, Italy, the Netherlands, New Zealand, Poland, Portugal, and the United Kingdom.

Starlink is mostly speeding up again from Q3 to Q4 2022, but is still slower than a year ago

As Starlink rides the wave of becoming an increasingly popular connectivity option for consumers, we’ve seen the service speed up and then slow down year-over-year in most markets. However, Q4 2022 data shows many countries are experiencing a modest rise in median download speeds when compared to Q3 2022. That’s encouraging for consumers, especially as Starlink hit over 1 million users in Q4 2022, and could be a sign that Starlink seems to be maturing its constellation’s capacity. That’s particularly intriguing as Starlink launches more next-gen satellites, which were first deployed at the tail end of Q4 2022 and will most likely show up in Q1 2023 results.

In Europe, all the countries we evaluated for year-over-year median download speeds were slower for Q4 2022 than Q4 2021 when there were fewer users on each network. Most countries showed between 10-20% slower speeds in Q4 2022 than what users experienced in Q4 2021, including Ireland (at least 11% slower), Austria (at least 13%), Portugal (at least 14%), Italy (at least 15%), Germany (at least 16%), and the U.K. (at least 19%). Users in France saw very similar speeds year over year, with just a 4% decrease from Q4 2021 to Q4 2022, while users in Poland saw a large decrease (at least 56% slower), and users in the Netherlands (at least 21%) and Belgium (at least 28%) saw substantial decrease during the same period.

In Oceania, Starlink year-over-year results were mixed, with Starlink’s download speed in Australia 24% slower in Q4 2022 than during Q4 2021, while in New Zealand it was 4% faster in Q4 2022 than Q4 2021.

Starlink in Denmark and Switzerland had the fastest satellite internet in Europe during Q4 2022

Speedtest Intelligence® reveals there was no fastest satellite provider in Europe during Q4 2022, though Starlink in Denmark (147.52 Mbps) and Switzerland (136.03 Mbps) led the pack for fastest median download speed. In all, Starlink download speeds were faster than 100 Mbps in 10 out of 15 European countries during Q4 2022 — a rise from just five out 15 in Q3 2022. 

Starlink outperformed fixed broadband providers over download speed in eight countries, including: Austria (105.67 Mbps), Belgium (104.84 Mbps), Croatia (102.99 Mbps), Czechia (64.67 Mbps), Germany (94.37 Mbps), Ireland (103.39 Mbps), Italy (101.06 Mbps), and the U.K. (96.79 Mbps). Fixed broadband providers were faster than satellite providers analyzed in Denmark, France, Netherlands, and Poland. Results were too close to call in Sweden with fixed providers at 106.73 Mbps and Starlink at 101.83 Mbps, as well as Portugal with Starlink at 108.02 Mbps and fixed broadband at 117.97 Mbps. Skylogic was too close to call between the median fixed broadband speed in Italy at 55.50 Mbps to 59.40 Mbps, and had download speeds faster than 40 Mbps in France (44.46 Mbps) and Sweden (48.09 Mbps).

For upload speeds, every country’s combined fixed broadband providers had faster median upload speeds than every satellite provider, though Starlink in Portugal had the fastest upload speed among satellite providers at 20.86 Mbps. All Starlink upload speeds ranged between 10-20 Mbps except Poland (9.79 Mbps) and Denmark (8.04 Mbps). 

Multi-server latency for all satellite providers was higher than fixed broadband providers in every European country in Q4 2022, which ranged from 12.34 ms in Sweden to 23.46 ms in Italy. However, Starlink had a median multiserver latencies of less than 60 ms in the U.K. (53.24 ms), Portugal (56.81 ms), and the Netherlands (58.85 ms). Most latencies were between 60-75 ms, with Poland having the highest latency at 86.46 ms — still low enough to have a good quality of experience and be able to video chat.

Starlink in New Zealand was the fastest satellite provider in Oceania

During Q4 2022, Starlink in New Zealand had the fastest median download speed among satellite providers in Oceania at 124.72 Mbps, followed by Starlink in Australia (106.43 Mbps), and Starlink in Tonga (35.15 Mbps). However, New Zealand fixed broadband outperformed Starlink, while Starlink in Australia outperformed fixed broadband providers. In Tonga, speeds were too close to call. 

Speedtest Intelligence shows Starlink falling behind fixed broadband providers for median upload speeds in New Zealand (16.89 Mbps) and Australia (11.38 Mbps), while Tonga was again too close to call.

Multi-server latency was higher over Starlink than fixed broadband in all three countries we surveyed in Oceania during Q4 2022. However, Starlink’s median latency was under 50 ms in New Zealand (48.11 ms), which is a very exciting development for consumers, especially with latency becoming an increasingly important metric. Starlink latency in Australia was higher at 65.52 ms, while Tonga followed at 88.81 ms.

New Q4 2022 Starlink countries show very promising results

Speedtest Intelligence shows the six new countries where we found new Starlink data are off to a roaring start in Q4 2022, which include Bulgaria, Finland, Jamaica, Japan, Latvia, and Malta. Starlink had faster median download speeds than the country’s respective fixed broadband providers combined in two countries: Bulgaria (110.76 Mbps versus 65.69 Mbps), and Jamaica (87.43 Mbps vs. 48.34 Mbps), while results were too close to call in the remaining four markets. However, Starlink showed promising 100+ Mbps speeds in Japan (156.94 Mbps), Finland (102.70 Mbps), and Malta (101.36 Mbps). 

Median upload speeds for Starlink lagged behind fixed broadband providers in all markets, though Malta was too close to call (20.40 Mbps for Starlink and 20.25 Mbps for fixed broadband). Starlink upload speeds ranged from about 14 Mbps to 20 Mbps in every market.

Consumers and enterprises stand to benefit from satellite developments in 2023

Starlink dominated headlines in 2022 — and for good reason. They’ve gained over 1 million users worldwide, will be available in connected vehicles, planes, RVs, and ships, partnered with T-Mobile to bring Starlink to mobile devices, and launched their second-gen satellites at the end of 2022. But that could very seriously change in 2023 with multiple competitors deploying major offensives in the satellite market. We’ll say it again: there is a new space race for connectivity being waged, and we’re just at the tip of what’s to come.

Here are some major updates about what’s next for various different satellite competitors:

Amazon’s Project Kuiper approved by the FCC

The biggest news concerning satellite connectivity is the FCC approving Amazon’s Project Kuiper constellation, which will include 3,236 satellites in an LEO array. On two fronts, this poses two potential challenges for Starlink: on one hand, Amazon has the global reach, scale, and consumer base that being one of the largest companies in the world provides. On the other, Blue Origin is a direct competitor of SpaceX, and won’t have to rely on the service or other vendors to launch their array into space. Amazon is in a good position to compete and Project Kuiper could become a major player if their prototypes, which will be launched in early 2023, reach speeds anywhere close to competing with broadband internet. 

Viasat set to launch Viasat-3 arrays around April 8, 2023

Long-term incumbent satellite internet provider, Viasat, has a big year ahead after years of planning and providing connectivity to remote locations around the world. Viasat is finally set to launch its Viasat-3 array, which aims to provide 1 Terabit per second (Tbps) of network capacity on each satellite, allowing its users to experience 100+ Mbps connections; that’s a huge improvement for the mainly GEO provider. While consumers likely won’t see these results until Q4 2023, we’re very excited to see how Viasat improves its network.

Eutelsat’s merger with OneWeb approved by Eutelsat board, second-gen array being planned

One of the biggest mergers in recent years among satellite providers has jumped a major hurdle and was approved by the Eutelsat board. While the combined entities still have to be approved by shareholders and regulators, this merger could expand both companies’ market share, particularly in India, which has fast become an important satellite market. Furthermore, OneWeb is already planning a second-gen satellite, which they’re aiming to launch in 2025.

European Commission forges ahead on Constellation Iris

The European Union has been working to create its own satellite constellation since 2020, and during November 2022, agreed to a plan to commit €2.4 billion for a third satellite array named Iris, in addition to Galileo and Copernicus. The project, which includes GEO, MEO, and LEO arrays, will help support EU connectivity priorities including the economy, environment, security, and defense, and is hoping to launch in 2024, and be fully operational by 2027.

HughesNet aiming to launch Jupiter 3 array in H1 2023

Incumbent satellite internet provider HughesNet is planning to launch its new Jupiter 3 array in the first half of 2023, which will help expand its network capacity, “doubling the size of the Hughes JUPITER fleet over North and South America.” While the Jupiter 3 array will still be a GEO constellation, the added network capacity will alleviate congested networks and give consumers more bandwidth to use the internet.

Ookla will continue monitoring new satellite internet developments

As 2023 continues to shape up as a pivotal year for satellite internet providers, we’ll be watching the sky to make sure providers are providing the connectivity consumers need. We’ll continue our series next quarter with Q4 2022 and Q1 2023 data from North and South America and any new countries where Starlink launches, and be back with Europe and Oceania data in Q3 2023. In the meantime, be sure to download the Speedtest® app for Windows and Mac computers or for iOS or Android for devices and see how your satellite internet stacks up to our findings.

Ookla retains ownership of this article including all of the intellectual property rights, data, content graphs and analysis. This article may not be quoted, reproduced, distributed or published for any commercial purpose without prior consent. Members of the press and others using the findings in this article for non-commercial purposes are welcome to publicly share and link to report information with attribution to Ookla.

| July 29, 2024

Faster Speeds and the Promise of New Use Cases is Driving 5G SA Adoption

The deployment of 5G networks is progressing as demand for faster and more reliable connectivity continues to grow. The standalone (SA) deployment model marks a significant milestone in the evolution of 5G, aiming to offer lower latency, increased bandwidth, and improved reliability compared to earlier network configurations. In this article, we use Ookla Speedtest Intelligence® data to track 5G SA deployments since Q2 2023, 5G SA service adoption, and examine its impact on network performance. We also highlight key regions and countries that made notable advancements in 5G SA infrastructure.

Key Takeaways:

  • India, the U.S., and Southeast Asia are at the forefront of 5G SA adoption. T-Mobile and SK Telekom were among the first to launch 5G SA in 2020, while Chinese operators and Jio in India lead in terms of active 5G SA users. Europe somewhat lags, with operators still hesitant due to the relatively low ROI on existing 5G investments and unclear business cases for 5G SA. However, Europe has the highest number of operators planning to launch it.
  • The U.A.E. and South Korea lead the world in 5G SA performance. 5G SA download speeds reached 879.89 Mbps and 729.89 Mbps, respectively. Their 5G SA upload speeds were also impressive, at 70.93 Mbps and 77.65 Mbps, respectively. This performance is a result of significant advancements made by local operators in deploying 5G SA and testing advanced features such as network slicing and mobile edge computing (MEC).
  • The change in speed of 5G SA varied widely between countries over a year. Speedtest Intelligence data shows that 5G SA performance declined in many countries between Q2 2023 and Q2 2024, primarily driven by increased user base and network traffic. Conversely, markets such as Canada and the U.S. improved their performance thanks to access to additional spectrum.

5G SA deployments are expected to increase this year as adoption gains momentum and ecosystem matures

Most existing 5G deployments use the non-standalone (NSA) model which uses the 4G core network. This model is faster to roll out, requires less investment, and maximizes existing network assets. Unlike 5G NSA, 5G SA uses a dedicated 5G core network, unlocking the full capabilities of 5G with better speed, latency, support for large numbers of devices, and more agile service creation. It also enables new features such as network slicing where an operator can dedicate a network segment to specific customers or use cases. Furthermore, the core network functions provided by a cloud-native architecture enable more scalability and automation than physical or virtualized architectures. However, this comes with higher infrastructure complexity, investment as well as staff training costs.  Many operators use NSA as a stepping stone towards SA, with a few exceptions, such as DISH in the U.S. and Jio in India, which adopted SA from the outset. Other scenarios for deploying 5G SA include an overlay for a public 5G NSA network or as a private network for enterprise use cases. 

The Global Mobile Suppliers Association (GSA) identified 130 operators that had invested in public 5G SA networks as of the end of June 2024. 5G SA represented more than 37% of the 614 operators known to have invested in 5G either through trials or deployments. The GSA reported 1,535 commercially available devices, including handsets and fixed wireless access (FWA) customer premises equipment (CPEs), that support 5G SA, demonstrating the growing maturity of the device ecosystem. 

However, only 11 new 5G SA deployments in nine countries were recorded (out of 46 new 5G networks launched in 32 countries) in 2023, according to Analysys Mason, showing a slowdown in deployments. We expect the pace of 5G SA launches to accelerate in 2024 and beyond supported by the growing device ecosystem and commercial appetite for new 5G use cases. 

To identify where 5G SA access has been activated and the network expanded between Q2 2023 and Q2 2024, we used Speedtest Intelligence® data to identify devices that connect to 5G SA. The maps below confirm that the number of 5G SA samples increased year-on-year and that coverage has expanded beyond urban centers. However, mobile subscribers in most of Africa, Europe, Central Asia, and Latin America have yet to experience 5G SA.

In the following sections, we examine the year-on-year changes in 5G SA performance across different regions and identify which countries are leading in the Developed Asia Pacific, the Americas, Emerging Asia Pacific, and Europe.

The developed Asia-Pacific (DVAP) region is at the forefront of 5G SA launches

Operators in this region boast 5G SA networks, with launches happening as early as 2020. Strong government support, operators’ technology leadership, and a high consumer appetite for high-speed internet services drove this rapid adoption.

South Korea is considered a pioneer in the adoption and deployment of 5G technology, with SK Telecom deploying one of the first 5G SA services in H1 2020, and supporting advanced features such as network slicing and mobile edge computing (MEC). Speedtest Intelligence data shows that the country led the region in download and upload speeds in Q2 2024. South Korea has one of the highest median speeds among the countries analyzed at 729.89 Mbps (download) and 77.65 Mbps (upload). The other top-performing country is the U.A.E with a median download speed of 879.89 Mbps and a median upload speed of 70.93 Mbps. 

All three service providers in Singapore commercialized 5G SA services, covering more than 95% of the country. Users experienced excellent download speed with a median value of 481.96 Mbps. However, Singapore lagged in upload speed with a median value of 32.09 Mbps.

Macau and Japan are second and third in the region with median download speeds of 404.22 Mbps and 272.73 Mbps, respectively. Mainland China followed with a median speed of 236.95 Mbps. Policies and initiatives such as network-sharing agreements and government subsidies supported 5G growth.

In Australia, TPG Telecom launched its 5G SA network in November 2021, following Telstra’s announcement in May 2020. However, the country lagged behind its regional peers with median download speeds and upload speeds of 146.68 Mbps and 17.69 Mbps, respectively.

The performance of most reviewed DVAP countries remained largely stable or slightly declined between Q2 2023 and Q2 2024. The only two exceptions are South Korea and Australia where performance improved by 12% and 18%, respectively. The most substantial declines were observed in upload speeds, while South Korea stood out with a 17% boost in performance.

5G Standalone Network Performance, Select Countries in Developed Asia Pacific
Source: Speedtest Intelligence® | Q2 2023 – Q2 2024
5G Standalone Network Performance, Select Countries in Developed Asia Pacific

T-Mobile and DISH Push 5G SA Coverage in the U.S.

In the U.S., T-Mobile launched its 5G Standalone (SA) network over 600 MHz spectrum in August 2020, becoming one of the first operators in the world to do so. This was followed by a faster service over 2.5 GHz mid-band spectrum in November 2022 which helped the operator to maintain its national lead in 5G performance. On the other hand, Verizon extensively tested 5G SA in 2023 but so far has been slow to deploy a nationwide SA network. DISH, another notable 5G SA operator, pioneered a cloud-native Open RAN-based 5G SA network in June 2023 and expanded coverage to 73% of the population by the end of that year. In Canada, Rogers Wireless launched the first 5G SA at the beginning of 2021, a year after introducing 5G NSA. 

In Brazil, the median download and upload speeds reached 474.65 Mbps and 32.36 Mbps in Q2 2024, respectively, exceeding those in Canada and the U.S. The main operators in Brazil, Claro, Telefonica (Vivo), and TIM have launched 5G SA over the 3.5 GHz band, making the service available to a large proportion of the population.

While download and upload speed improved in Canada and the U.S. between Q2 2023 and Q2 2024, according to Speedtest Intelligence, it declined in Brazil. The deployment of C-band has likely helped to increase download speed in both Canada and the U.S.

5G Standalone Network Performance, Select Countries in the Americas
Source: Speedtest Intelligence® | Q2 2023 – Q2 2024
5G Standalone Network Performance, Select Countries in the Americas

India leads in the Emerging Asian Pacific (EMAP) region with fast expansion to 5G SA network

India is at the forefront of the Emerging Asian Pacific region’s rapid 5G Standalone (SA) network expansion. However, according to Ookla’s Speedtest data for Q2 2024, the Philippines surpasses both India and Thailand with a median 5G SA download speed of 375.40 Mbps. Globe, the first mobile operator to introduce 5G Non-Standalone (NSA) in the Philippines, expanded its 5G outdoor coverage to 97.44% of the capital by the end of H1 2023. The company also launched 5G SA private networks in 2023, along with network slicing.

India follows closely behind the Philippines, with a median download speed of just under 300 Mbps. Jio has been a leader in enhancing 5G SA coverage since its launch in October 2022, while Bharti Airtel initially opted for NSA, with plans to transition to full 5G SA. 

Jio’s rapid coverage expansion and high throughput are supported by its access to mid-band (3.5 GHz) and low-band (700 MHz) frequencies. Additionally, all new 5G handsets released in India are SA-compatible, boosting the adoption of 5G SA services, and more than 90% of them support carrier aggregation and Voice over New Radio (VoNR). 

Thailand lags behind in median download speed for Q2 2024 but outperforms India and the Philippines in upload speed. It was among the first countries in the region to introduce 5G services, with operators quickly expanding coverage to reach over 80% of the population. AIS, the leading operator in Thailand, launched 5G NSA services in February 2020 using 700 MHz, 2.6 GHz, and 26 GHz bandwidths, followed by 5G SA in July 2020. The operator enabled VoNR in 2021. 

Unlike the DVAP region, countries in EMAP have experienced a more substantial decline in 5G SA network performance compared to Q2 2023. The rapid coverage expansion and adoption have likely increased the load on 5G SA infrastructure, putting pressure on the operators to scale up network capacity in the future to at least maintain a similar performance level.

5G Standalone Network Performance, Select Countries in Emerging Asia Pacific
Source: Speedtest Intelligence® | Q2 2023 – Q2 2024
5G Standalone Network Performance, Select Countries in Emerging Asia Pacific

Europe is home to the highest number of operators looking to deploy 5G SA

A growing number of European operators are offering or planning to offer 5G SA, driven by a maturing device ecosystem. However, many remain hesitant due to cost and the need to demonstrate clear business cases for 5G SA. GSMA Intelligence reports that Europe has the highest number of planned 5G SA launches, with 45 operators planning to deploy it as of Q1 2024.

Elisa in Finland was one of the first operators in the region to launch 5G SA in November 2021. Other notable examples of SA implementations include Vodafone in Germany (April 2021) and the UK (June 2023), Bouygues Telecom (2022) in France, Three in Austria, Wind Tre in Italy (both in 2022), Orange and Telefónica in Spain, and TDC Denmark in 2023. 

The recent 5G SA launch in Spain may explain why that country saw such high speeds, with Speedtest Intelligence reporting download and upload speeds of 614.91 Mbps and 56.93 Mbps, respectively, in Q2 2023. However, Spain experienced a significant drop in performance in 2024, with speeds falling to 427.64 Mbps (download) and 30.55 Mbps (upload). Despite this decline, Spain continued to outperform the UK and Germany.

5G Standalone Network Performance, Select Countries in Europe
Source: Speedtest Intelligence® | Q2 2023 – Q2 2024
5G Standalone Network Performance, Select Countries in Europe

While 5G SA deployments appear to have slowed in 2023 compared to previous years, we expect momentum to increase from 2024 due to rising enterprise demand for private networks and interest in network slicing, as well as consumer demand for immersive gaming and VR applications.  The ecosystem’s maturity and the availability of more network equipment and devices supporting 5G SA will also stimulate the market. According to the GSA, 21% of operators worldwide investing in 5G have included 5G SA in their plans.

Interestingly, the growing popularity and adoption of 5G SA have impacted its performance, with many markets seeing some degradation compared to 2023, according to Speedtest Intelligence.  Nonetheless, 5G SA still offers a markedly faster download speed than 5G NSA. Beyond speed, 5G SA promises new capabilities, such as network slicing, that have started to emerge in the most advanced markets but will take time to become a reality for most consumers and enterprises worldwide.

We will continue to track the deployments of 5G SA and monitor their impact on network global performance. For more information about Speedtest Intelligence data and insights, please contact us.

Ookla retains ownership of this article including all of the intellectual property rights, data, content graphs and analysis. This article may not be quoted, reproduced, distributed or published for any commercial purpose without prior consent. Members of the press and others using the findings in this article for non-commercial purposes are welcome to publicly share and link to report information with attribution to Ookla.

| March 16, 2022

Starlink Hits 100+ Mbps Download Speed in 15 Countries During Q4 2021

Fast satellite internet has become increasingly available to more and more people across the globe. It’s already a huge boon to rural communities that might otherwise be too remote for fixed broadband service. Starlink, Viasat, HughesNet, and other satellite providers are all placing big bets on low-earth orbital (LEO) satellite constellations, and Starlink is even introducing a new premium service with speeds expected to be around 150-500 Mbps. It’s a gamble, as Starlink recently learned after losing about 40 satellites to a geomagnetic storm, but it’s a gamble worth making. The European Commission is even planning a multibillion Euro investment to connect the continent to satellite internet. 

We’ve analyzed fresh satellite internet performance data from Q4 2021 including results from seven additional countries to update our ongoing series.

United States: Starlink was the fastest satellite provider during Q4 2021 and speeds increased over Q3 2021

Satellite Internet Performance vs Fixed in USA

U.S. consumers saw mixed satellite performance when comparing Q3 2021 to Q4 2021, while the United States government has been trying to increase satellite internet competition. Starlink’s median download speed increased from 87.25 Mbps during Q3 2021 to 104.97 Mbps in Q4 2021 — an important benchmark that inches Starlink closer to reaching the Rural Digital Opportunity Fund’s (RDOF) baseline of download speeds greater than 100 Mbps. Viasat overtook HughesNet to follow Starlink distantly at 21.81 Mbps (comparable to the 18.75 Mbps we saw in Q3 2021) and HughesNet followed at 20.92 Mbps (19.30 Mbps in Q3 2021). SES, new to our list this quarter, trailed far behind at 2.19 Mbps. For comparison, the median download speed for all fixed broadband providers rose moderately in the U.S. during Q4 2021 from 119.84 Mbps in Q3 2021 to 131.30 Mbps in Q4 2021.

Starlink saw a slight decrease in median upload speed from 13.54 Mbps during Q3 2021 to 12.04 Mbps in Q4 2021, still short of the median upload speed for all fixed broadband, which rose to 19.49 Mbps in Q4 2021 from 18.03 Mbps in Q3 2021. Viasat followed at 2.88 Mbps (2.96 Mbps in Q3 2021), then HughesNet at 2.54 Mbps (2.13 Mbps in Q3 2021), and SES at 1.19 Mbps.

As we’ve seen over the past year, Starlink, which uses only low earth orbit (LEO) satellites, was once again the only satellite internet provider with a median latency anywhere close to fixed broadband in Q4 2021 (40 ms and 14 ms, respectively). SES, Viasat, and HughesNet, which all utilize higher geosynchronous earth orbit (GEO) satellites for now, had much higher median latencies at 613 ms, 627 ms, and 725 ms, respectively.

Starlink performance continues to vary widely at the county level

Median Download Speed for Starlink in Selected US Counties

During Q4 2021, we saw about a 130 Mbps range in performance between the U.S. county with the fastest median download speed over Starlink (Miami Dade County in Florida at 191.08 Mbps) and the county with the slowest median download speed (Columbia County in Oregon at 64.95 Mbps). Even the lower-end speeds were well above the FCC’s baseline performance tier for broadband internet of at least a 25 Mbps download speed.

Satellite internet performance elsewhere in the world

We examined satellite internet performance in countries with an established market share to see how well their speeds compare to local fixed broadband. We’re excited to add analyses on satellite performance in Austria, Ireland, Italy, Mexico, Netherlands, Poland, and Portugal this quarter. We’ve also added Starlink to the list of providers in Chile. With Starlink continuing to launch in additional countries, we’re looking forward to seeing how Starlink performs during Q1 2021.

Australia: Starlink nearly triples fixed broadband download average

Starlink performed well in Australia during Q4 2021 with a median download speed of 141.55 Mbps. The median download speed for all fixed broadband providers was 51.35 Mbps. Starlink’s 14.84 Mbps median upload speed fell behind fixed broadband providers’ 18.01 Mbps. Starlink is a clear alternative to traditional fixed broadband for speeds, however Starlink can’t yet compete for latency, with Starlink showing a median latency of 43 ms vs. 10 ms for all fixed broadband combined.

Austria: Starlink download speed outpaces fixed broadband by more than double

New to our list this quarter, Austrian consumers had fast speeds over Starlink during Q4 2021, achieving faster median download speeds than that of all fixed broadband providers combined at 131.84 Mbps vs. 50.33 Mbps on fixed broadband. Starlink also had a faster median upload speed at 19.91 Mbps vs. 14.34 Mbps on fixed broadband. Starlink trailed fixed broadband on median latency during Q4 2021, 52 ms vs. 13 ms.

Satellite Internet Performance vs Fixed Broadband in Austria

Belgium: Starlink much faster than fixed broadband

Starlink’s median download speed of 155.15 Mbps during Q4 2021 was much faster than the country’s median download for all fixed broadband of 76.94 Mbps. That’s also a large increase from Starlink’s median download speed of 127.46 Mbps in Q3 2021. For median upload speed, Starlink was only slightly slower at 15.15 Mbps than the median fixed broadband upload speed of 18.05 Mbps. However, Starlink’s 45 ms latency was higher than the country’s median latency of 13 ms. Starlink was the only satellite internet provider with adequate samples to analyze in Belgium during Q4 2021. For rural Belgians, Starlink is a strong option.

Satellite Internet Performance vs Fixed Broadband in Belgium

Brazil: Viasat fell further behind as national fixed broadband sped up

Viasat’s median download speed in Brazil dipped slightly from 66.32 Mbps during Q3 2021 to 62.80 Mbps during Q4 2021. This fell further away from the national median for fixed broadband, which sped up to 83.03 Mbps during Q4 2021 (71.50 Mbps in Q3 2021). Viasat’s median upload speed (1.07 Mbps) was much slower than that on fixed broadband (40.76 Mbps), and Viasat’s latency was much higher (610 ms vs 6 ms). With Starlink slated to enter the Brazilian market soon, we’ll be watching these numbers closely to see if additional competition spurs the market.

Satellite Internet Performance vs Fixed Broadband in Brazil

Canada: Starlink performance reaches milestone during Q4 2021

In our last article, Starlink’s median download speed decreased to slower than fixed broadband in Canada during Q3 2021 (84.55 Mbps vs. 90.67 Mbps). But in Q4 2021, Starlink’s median download speed leapt ahead, achieving 106.64 Mbps while median download speed for fixed broadband increased to 96.39 Mbps. Starlink’s median upload speed was slower than fixed broadband (12.82 Mbps vs. 21.66 Mbps) and latency on Starlink was still much higher (55 ms vs. 11 ms). Starlink should be considered a viable option compared to fixed broadband in Canada, especially for rural consumers or those without access to fast fixed broadband options like fiber.

Satellite Internet Performance vs Fixed Broadband in Canada

Starlink faster than overall fixed broadband in nearly every province

Median Download Speed for Starlink in Canadian Provinces

Starlink showed enough samples to analyze performance in all 10 provinces in Canada during Q4 2021 — all of which showed substantial increases in Starlink’s download speed during Q4 2021 compared to Q3 2021. Starlink’s median download speed was faster than the median download for all fixed broadband in seven provinces during Q4 2021: Manitoba (101.66 Mbps vs. 83.06 Mbps), Newfoundland and Labrador (195.30 Mbps vs. 131.58 Mbps), Nova Scotia (143.52 Mbps vs. 121.57 Mbps), Ontario (106.24 Mbps vs. 95.06 Mbps), Prince Edward Island (139.11 Mbps vs. 75.95 Mbps), Quebec (123.50 Mbps vs. 84.50 Mbps), and Saskatchewan (116.24 Mbps vs. 68.43 Mbps).

Download speeds were comparable between Starlink and overall fixed broadband in New Brunswick (130.67 Mbps vs. 132.65 Mbps), and overall fixed broadband was faster than Starlink in Alberta (107.32 Mbps vs. 96.56 Mbps) and British Columbia (130.97 Mbps vs. 94.74 Mbps) — with the latter two provinces having better access to fiber-to-the-home (FTTH).

Chile: Starlink debuts fast speeds, but still much slower than scorching fast fixed broadband

Chilean fixed broadband providers have continued to achieve some of the fastest speeds in the world, recording the fastest speed on the Speedtest Global Index during February 2022, and we were interested to see how Starlink would compete. Starlink reached 118.95 Mbps in Chile during Q4 2021, which was faster than HughesNet (15.30 Mbps) but much slower than Chile’s median download speed for all fixed broadband providers (168.92 Mbps). 

Median upload speeds also showed a wide gap in Chile between satellite and fixed broadband during Q4 2021 (23.46 Mbps for Starlink and 3.42 Mbps for HughesNet vs. 89.76 Mbps on fixed broadband). Fixed broadband was also much faster for latency: 7 ms for fixed broadband vs. 38 ms for Starlink and 615 ms for HughesNet.

Satellite Internet Performance vs Fixed Broadband in Chile

Colombia: HughesNet decreased over download and upload speeds

HughesNet’s median download speed decreased in Q4 2021 to 11.75 Mbps from 12.12 Mbps during Q3 2021, while Colombia’s fixed broadband increased to 54.60 Mbps (46.08 Mbps in Q3 2021). Median upload speed was also slower for HughesNet than fixed broadband (2.88 Mbps vs. 11.86 Mbps), and latency was much higher on HughesNet (717 ms vs. 14 ms).

Satellite Internet Performance vs Fixed Broadband in Colombia

France: Starlink download speed increased, still faster than fixed broadband

Starlink users in France saw a median download speed of 121.21 Mbps in Q4 2021 (up from 102.15 Mbps in Q3 2021). Starlink’s download speed easily beat the country-wide median for fixed broadband of 90.88 Mbps (up from 75.47 Mbps in Q3 2021). Starlink’s upload speed during Q4 2021 was slower than the fixed broadband median (17.20 Mbps vs. 69.49 Mbps), and Starlink’s latency was higher (51 ms vs. 12 ms). Satellite provider SES, on this list for the first time, trailed behind both Starlink and fixed broadband with a 14.88 Mbps download speed, 1.83 Mbps upload speed, and 649 ms latency. Starlink remains an good option for rural French consumers.

Satellite Internet Performance vs Fixed Broadband in France

Germany: Starlink blazes ahead of fixed broadband download speed

Starlink’s median download speed in Germany of 115.58 Mbps was much faster than the fixed broadband median of 65.86 Mbps during Q4 2021 (and Starlink’s Q3 2021 download speed of 95.40 Mbps). Starlink was slightly slower for upload speed than overall fixed broadband (15.17 Mbps vs. 22.40 Mbps) and Starlink showed a higher latency (47 ms) than fixed broadband (14 ms).

Satellite Internet Performance vs Fixed Broadband in Germany

Ireland: Starlink download debuts nearly double that of fixed broadband

Starlink’s debut on our list is noteworthy in Ireland, where it achieved a download speed almost double that of Ireland’s combined fixed broadband average during Q4 2021 (123.51 Mbps vs. 65.89 Mbps). Median upload speeds were almost level, with Starlink recording a median upload speed at 24.35 Mbps vs. 22.63 Mbps for fixed broadband. Starlink lagged for latency at 45 ms vs. 11 ms for fixed broadband. Starlink is a great option for those who are looking for fast speeds in Ireland and can’t get access to fixed broadband.

Satellite Internet Performance vs Fixed Broadband in Ireland

Italy: Starlink dominates against fixed broadband

Starlink enters our list in Italy with a decisive statement during Q4 2021: It achieved a median download speed of 124.39 Mbps, a huge leap ahead of Italy’s fixed broadband average of 49.56 Mbps. Upload speeds were comparable between the two, with Starlink recording a median of 18.90 Mbps to 18.29 on fixed broadband. Starlink had a higher latency at 52 ms vs. 14 ms on fixed broadband. Starlink is an attractive option for fast internet in Italy.

Satellite Internet Performance vs Fixed Broadband in Italy

Mexico: Starlink impresses during Q4 2021 debut

Starlink, which only became commercially available in Mexico during November 2021, made a significant splash during its brief Q4 2021 debut, achieving a median download speed of 141.94 Mbps. That was significantly faster than Viasat (16.34 Mbps), HughesNet (10.63 Mbps), and all fixed broadband providers combined (36.56 Mbps). 

Starlink also outpaced fixed broadband for fastest upload speed (22.32 Mbps vs. 9.53 Mbps). HughesNet and Viasat followed at 3.10 Mbps and 2.06 Mbps, respectively. Starlink was the only satellite provider that came close to fixed broadband median latency, 64 ms to 11 ms. Viasat and HughesNet were distantly behind at 676 ms and 763 ms, respectively. With Starlink making such an impressive entrance into Mexico, we’ll be interested to see if the performance holds up in the coming months.

Satellite Internet Performance vs Fixed Broadband in Mexico

Netherlands: Starlink faster for median download, lagging on upload and latency

The Netherlands, which is new to this list, has some of the fastest median mobile and fixed broadband speeds in the world according to the Speedtest Global Index. We were eager to see how Starlink would perform against this competition. During Q4 2021, Starlink achieved a median download speed of 138.40 Mbps compared to 95.55 Mbps over fixed broadband. Starlink lagged noticeably behind for upload speed at 15.60 Mbps vs. 30.87 Mbps on fixed broadband. Starlink also had a higher latency at 45 ms vs. 11 ms on fixed broadband.

Satellite Internet Performance vs Fixed Broadband in Netherlands

New Zealand: Starlink slowed slightly, still faster than fixed broadband download

Starlink’s Q4 2021 median download speed (116.44 Mbps, down slightly from 120.10 Mbps Mbps in Q3 2021, likely due to increased adoption) was faster than New Zealand’s median fixed broadband download speed (98.61 in Q4 2021, up from 84.98 Mbps in Q3 2021). Starlink was much slower than New Zealand’s median fixed broadband upload speed for Q4 2021 (13.79 Mbps vs. 59.26 Mbps, which was a huge increase from 23.62 Mbps on fixed broadband during Q3 2021). Starlink’s median latency during Q4 2021 was comparable to Q3 2021 (79 ms vs. 81 ms) which was still much slower than New Zealand’s median for all fixed broadband of 6 ms during Q4 2021.

Satellite Internet Performance vs Fixed Broadband in New Zealand

Poland: Starlink a fast option for Poles

Starlink launched in Poland during September 2021 and is already recording fast speeds. The median download speed for Starlink was much faster than fixed broadband at 129.29 Mbps to 83.88 Mbps during Q4 2021. Upload speed was roughly comparable, with Starlink recording a slightly slower median upload speed of 24.17 Mbps and fixed broadband ahead at 28.60 Mbps. Starlink’s latency was higher at 58 ms to 10 ms on fixed broadband. That’s still acceptable for online gaming, but higher than what’s considered optimal.

Satellite Internet Performance vs Fixed Broadband in Poland

Portugal: Starlink far ahead on download speed in debut, fixed broadband much faster on upload

Another newcomer to this list this quarter, Portugal was a place where Starlink dominated with a much faster median download speed than fixed broadband at 140.35 Mbps to 94.62 Mbps, respectively, during Q4 2021. Upload speed was a different story, with fixed broadband notching a median upload speed of 65.52 Mbps to Starlink’s 30.16 Mbps. Starlink also had a much higher latency than fixed broadband at 44 ms to 7 ms. Starlink remains a good option if you don’t have access to good fixed broadband in Portugal. 

Satellite Internet Performance vs Fixed Broadband in Portugal

United Kingdom: Starlink still nearly twice as fast as fixed broadband median

Starlink showed a faster median download speed in the U.K. (121.94 Mbps in Q4 2021, up from 111.66 Mbps in Q3 2021) than the country’s median for fixed broadband (57.66 Mbps in Q4 2021, up from 53.16 Mbps in Q3 2021). Starlink’s median upload speed (13.96 Mbps) was comparable to the median upload for all fixed broadband in the U.K. (16.84 Mbps), and the latency was relatively fast given the distance traveled (36 ms for Starlink vs. 15 ms for all fixed broadband) — enough to be able to reliably play online multiplayer games. Satellite provider SES trailed far behind during Q4 2021 with a 3.79 Mbps median download speed, 3.74 Mbps median upload, and 636 ms median latency.

Satellite Internet Performance vs Fixed Broadband in United Kingdom

Competition among satellite providers is rapidly increasing and we’ll continue watching closely

We look forward to updating this data again next quarter with new locations as satellite internet continues to become a more viable option for many. If you’re using satellite internet, take a Speedtest® to help us provide an accurate picture of real-world performance.

Editor’s note: The section on Australia was amended on March 24 to remove performance details for Viasat which was determined not to be a consumer offering at this time.

Ookla retains ownership of this article including all of the intellectual property rights, data, content graphs and analysis. This article may not be quoted, reproduced, distributed or published for any commercial purpose without prior consent. Members of the press and others using the findings in this article for non-commercial purposes are welcome to publicly share and link to report information with attribution to Ookla.

| August 4, 2021

How Starlink’s Satellite Internet Stacks Up Against HughesNet and Viasat around the Globe

The satellite internet race is heating up, with more competitors serving more areas than even a quarter ago. We’re back with a broader look at internet network performance for satellite providers across the globe based on Q2 2021 data from Speedtest Intelligence.

Starlink speeds beat competitors in the U.S., can’t top fixed broadband

Given that satellite internet is often the only solution for folks with little to no fixed broadband access, the Speedtest® results we saw coming from HughesNet, Starlink and Viasat during Q2 2021 were encouraging. However, Starlink was the only satellite internet provider in the United States with fixed-broadband-like latency figures, and median download speeds fast enough to handle most of the needs of modern online life at 97.23 Mbps during Q2 2021 (up from 65.72 Mbps in Q1 2021). HughesNet was a distant second at 19.73 Mbps (15.07 Mbps in Q1 2021) and Viasat third at 18.13 Mbps (17.67 Mbps in Q1 2021). None of these are as fast as the 115.22 Mbps median download speed for all fixed broadband providers in the U.S. during Q2 2021, but it beats digging twenty miles (or more) of trench to hook up to local infrastructure.

ookla_satellite_internet_comparison_us_0821

Starlink’s median upload speed of 13.89 Mbps (up from 13.77 Mbps in Q1 2021) was much closer to that on fixed broadband (17.18 Mbps in Q2 2021, 15.99 Mbps in Q1 2021). Viasat had the second fastest upload speed among satellite providers at 3.38 Mbps (3.48 in Q1 2021). HughesNet was third (2.43 Mbps in Q1 and Q2 2021).

Critically, Starlink was the only satellite internet provider with a median latency that was anywhere near that seen on fixed broadband in Q2 2021 (45 ms and 14 ms, respectively). A low latency connection is more responsive, making it essential for many common applications such as voice and video calling, gaming and live streaming of content. Starlink is able to achieve these lower latency numbers through the use of their low earth orbit (LEO) satellite constellation. At altitudes between 550-1200 km, these satellites are physically closer to the earth’s surface than traditional satellite providers. Therefore it takes less time for the signal to relay back to a downlink station on earth, ensuring a much more responsive connectivity experience for the user. Viasat and HughesNet both utilize considerably higher “geosynchronous” orbits of around 35,000 km for their satellites. This allows them to serve much wider swaths of the Earth’s surface with fewer satellites, but with a dramatic increase in latency in our data of 630 ms and 724 ms respectively.

Satellite internet speeds in the U.S. are increasing, mostly

Consumers are used to incremental increases in fixed broadband performance as that’s a developed technology with a stable market share. Satellite internet is newer and speeds fluctuate as technologies improve and as more users are added to sometimes crowded networks. Data from Speedtest Intelligence during Q1-Q2 2021 shows some of these struggles as median download speeds for both Starlink and HughesNet dipped in February and then rose again through the period only to dip again in June. This could be related to seasonal weather patterns. Viasat’s median download speed rose slightly from January through April and then started to decline slightly in May and June. We’ll continue watching the performance of these companies over time to see if they reach the steady climb that fixed broadband enjoys.

ookla_satellite_internet_monthly_comparison_us_0821

Starlink performance varies at the county level, but not widely

We saw sufficient samples during Q2 2021 to analyze Starlink performance in 458 counties in the U.S. While there was about a 100 Mbps range in performance between the county with the fastest median download speed (Morgan County, Alabama at 168.30 Mbps) and the county with the slowest median download speed (Madison County, Indiana at 64.51 Mbps), even the lower-end speeds are well above the FCC’s Baseline performance tier of at least a 25 Mbps download speed. We also saw many more counties qualify for analysis during Q2 2021 than we saw in Q1 2021.

ookla_united_states_download_speeds_starlink_map_0821

Satellite internet performance elsewhere in the world

The ambition and potential of satellite internet providers is of course to increase internet access across the globe. To that end, we examined satellite internet performance in countries with an established market share.

Brazil: Viasat download speed is comparable to fixed broadband, upload is not

Viasat’s 60.30 Mbps median download speed during Q2 2021 in Brazil was very close to the national average for fixed broadband of 61.38 Mbps. Viasat’s median upload speed (1.05 Mbps) was much slower, however, than that on fixed broadband (28.75 Mbps), and Viasat’s latency was much higher (613 ms vs 7 ms).

ookla_satellite_internet_comparison_br_0821

Canada: Starlink beats fixed broadband download speeds

Our previous article showed that Starlink’s median download speed was slower than fixed broadband in three provinces and faster in two. Data from Q2 2021 shows that Starlink’s median download speed exceeded that of fixed broadband in Canada (86.92 Mbps vs. 84.24 Mbps), making Starlink a reasonable alternative to fixed broadband in Canada. Starlink’s median upload speed was slower than fixed broadband (13.63 Mbps vs. 17.76 Mbps). Latency on Starlink was much higher (55 ms vs. 12 ms), but many customers in remote areas would gladly accept a latency in that range in exchange for having access to internet service.

ookla_satellite_internet_comparison_ca_0821

Starlink performance varies at the province level, but not widely

Starlink showed enough samples to analyze performance in 8 provinces in Canada during Q2 2021. Starlink’s Q2 2021 median download speed was faster than fixed broadband in five provinces (Manitoba, New Brunswick, Nova Scotia, Quebec and Saskatchewan), though samples in Nova Scotia were few enough and showed enough variability that there is room for interpretation. Download speeds were comparable between Starlink and overall fixed broadband in two provinces (Alberta and Ontario) and fixed broadband was faster in British Columbia.

ookla_canada_download_speeds_starlink_map_0821

Chile: HughesNet shows comparable speeds here and in the U.S.

At 15.43 Mbps, the median download speed for HughesNet in Chile during Q2 2021 was not fast, especially compared with the country’s fixed broadband average of 111.94 Mbps. Median upload speeds also showed a wide gap (3.23 Mbps for HughesNet to 39.48 Mbps on fixed broadband), and HughesNet’s latency was very high (678 ms vs. 8 ms).

ookla_satellite_internet_comparison_cl_0821

Colombia: HughesNet is slowest

The slowest performance we saw for HughesNet was in Colombia, where fixed broadband speeds are also slower than in other countries surveyed. HughesNet showed a median download speed of 9.28 Mbps during Q2 2021, compared with Colombia’s 35.90 Mbps for fixed broadband overall. Median upload speed was also slower using the satellite internet provider (3.03 Mbps) than fixed broadband (8.56 Mbps), and latency was much higher on satellite (799 ms vs. 17 ms).

ookla_satellite_internet_comparison_co_0821

France: Where the fastest Starlink download speeds are

Satellite internet users in France saw the fastest median download speeds from Starlink of all countries we surveyed during Q2 2021. At 139.39 Mbps, Starlink’s download speed easily beat the country-wide average for fixed broadband of 70.81 Mbps. Starlink’s upload speed was slower than the fixed broadband average, but still respectable (29.35 Mbps vs. 52.56 Mbps), and Starlink’s latency was higher (53 ms vs. 13 ms).

ookla_satellite_internet_comparison_fr_0821

Germany: Starlink far surpasses local fixed broadband

Consumers looking for fast internet in Germany have a great option in Starlink. Starlink’s median download and upload speeds were much faster than the country averages for fixed broadband in Q2 2021. The only drawback is Starlink’s 37 ms latency, compared to the 15 ms average for fixed broadband.

ookla_satellite_internet_comparison_de_0821

Mexico: Viasat and HughesNet are comparable, though slower than fixed broadband

Mexico has options when it comes to satellite internet, and the faster of the two options appears to be Viasat, for now. With a median download speed of 13.95 Mbps in Mexico during Q2 2021, Viasat was faster than HughesNet (11.92 Mbps) but slower than the country’s average for fixed broadband (29.99 Mbps). Median upload speed told a similar story, though HughesNet was slightly faster than Viasat (3.25 Mbps vs. 2.01 Mbps). While Viasat’s latency was high (672 ms vs 13 ms for fixed broadband), it was lower than HughesNet’s (714 ms).

ookla_satellite_internet_comparison_mx_0821

New Zealand: Starlink is faster than fixed broadband

Data from Speedtest Intelligence shows that Starlink’s median download speed was much faster than New Zealand’s average fixed broadband download speed during Q2 2021 (127.02 Mbps vs. 78.85 Mbps), and the upload speeds were nearly identical (23.61 Mbps vs. 23.51 Mbps). Starlink did have a much higher latency (101 ms vs. 7 ms). Starlink is relatively new in the country and does not have a large market share yet; we’ll be interested to see how their speeds hold up under heavier use.

ookla_satellite_internet_comparison_nz_0821

United Kingdom: Starlink beats fixed broadband providers

Starlink showed a much faster median download speed in the U.K. during Q2 2021 (108.30 Mbps) than the country’s average for fixed broadband (50.14 Mbps). Starlink’s upload speed was also slightly faster (15.64 Mbps vs. 14.76 Mbps), and the latency was pretty good, given the distance traveled (37 ms vs. 15 ms). This brings Starlink closer to contender status for consumers across the U.K., not just those stranded in internet-free zones in Northern Scotland, once the service interruptions are under control. It also shows that because satellite internet is not constrained by the infrastructure of a given country, there is the potential to radically outperform fixed broadband.

ookla_satellite_internet_comparison_uk_0821

This data is changing rapidly as satellite internet providers launch new service locations and improve their technology. We’ll be excited to see if Starlink is still the satellite provider to beat next quarter and in what other countries satellite internet provides a viable alternative to fixed broadband.

Ookla retains ownership of this article including all of the intellectual property rights, data, content graphs and analysis. This article may not be quoted, reproduced, distributed or published for any commercial purpose without prior consent. Members of the press and others using the findings in this article for non-commercial purposes are welcome to publicly share and link to report information with attribution to Ookla.

| September 18, 2023

New Speedtest Data Shows Starlink Performance is Mixed — But That’s a Good Thing

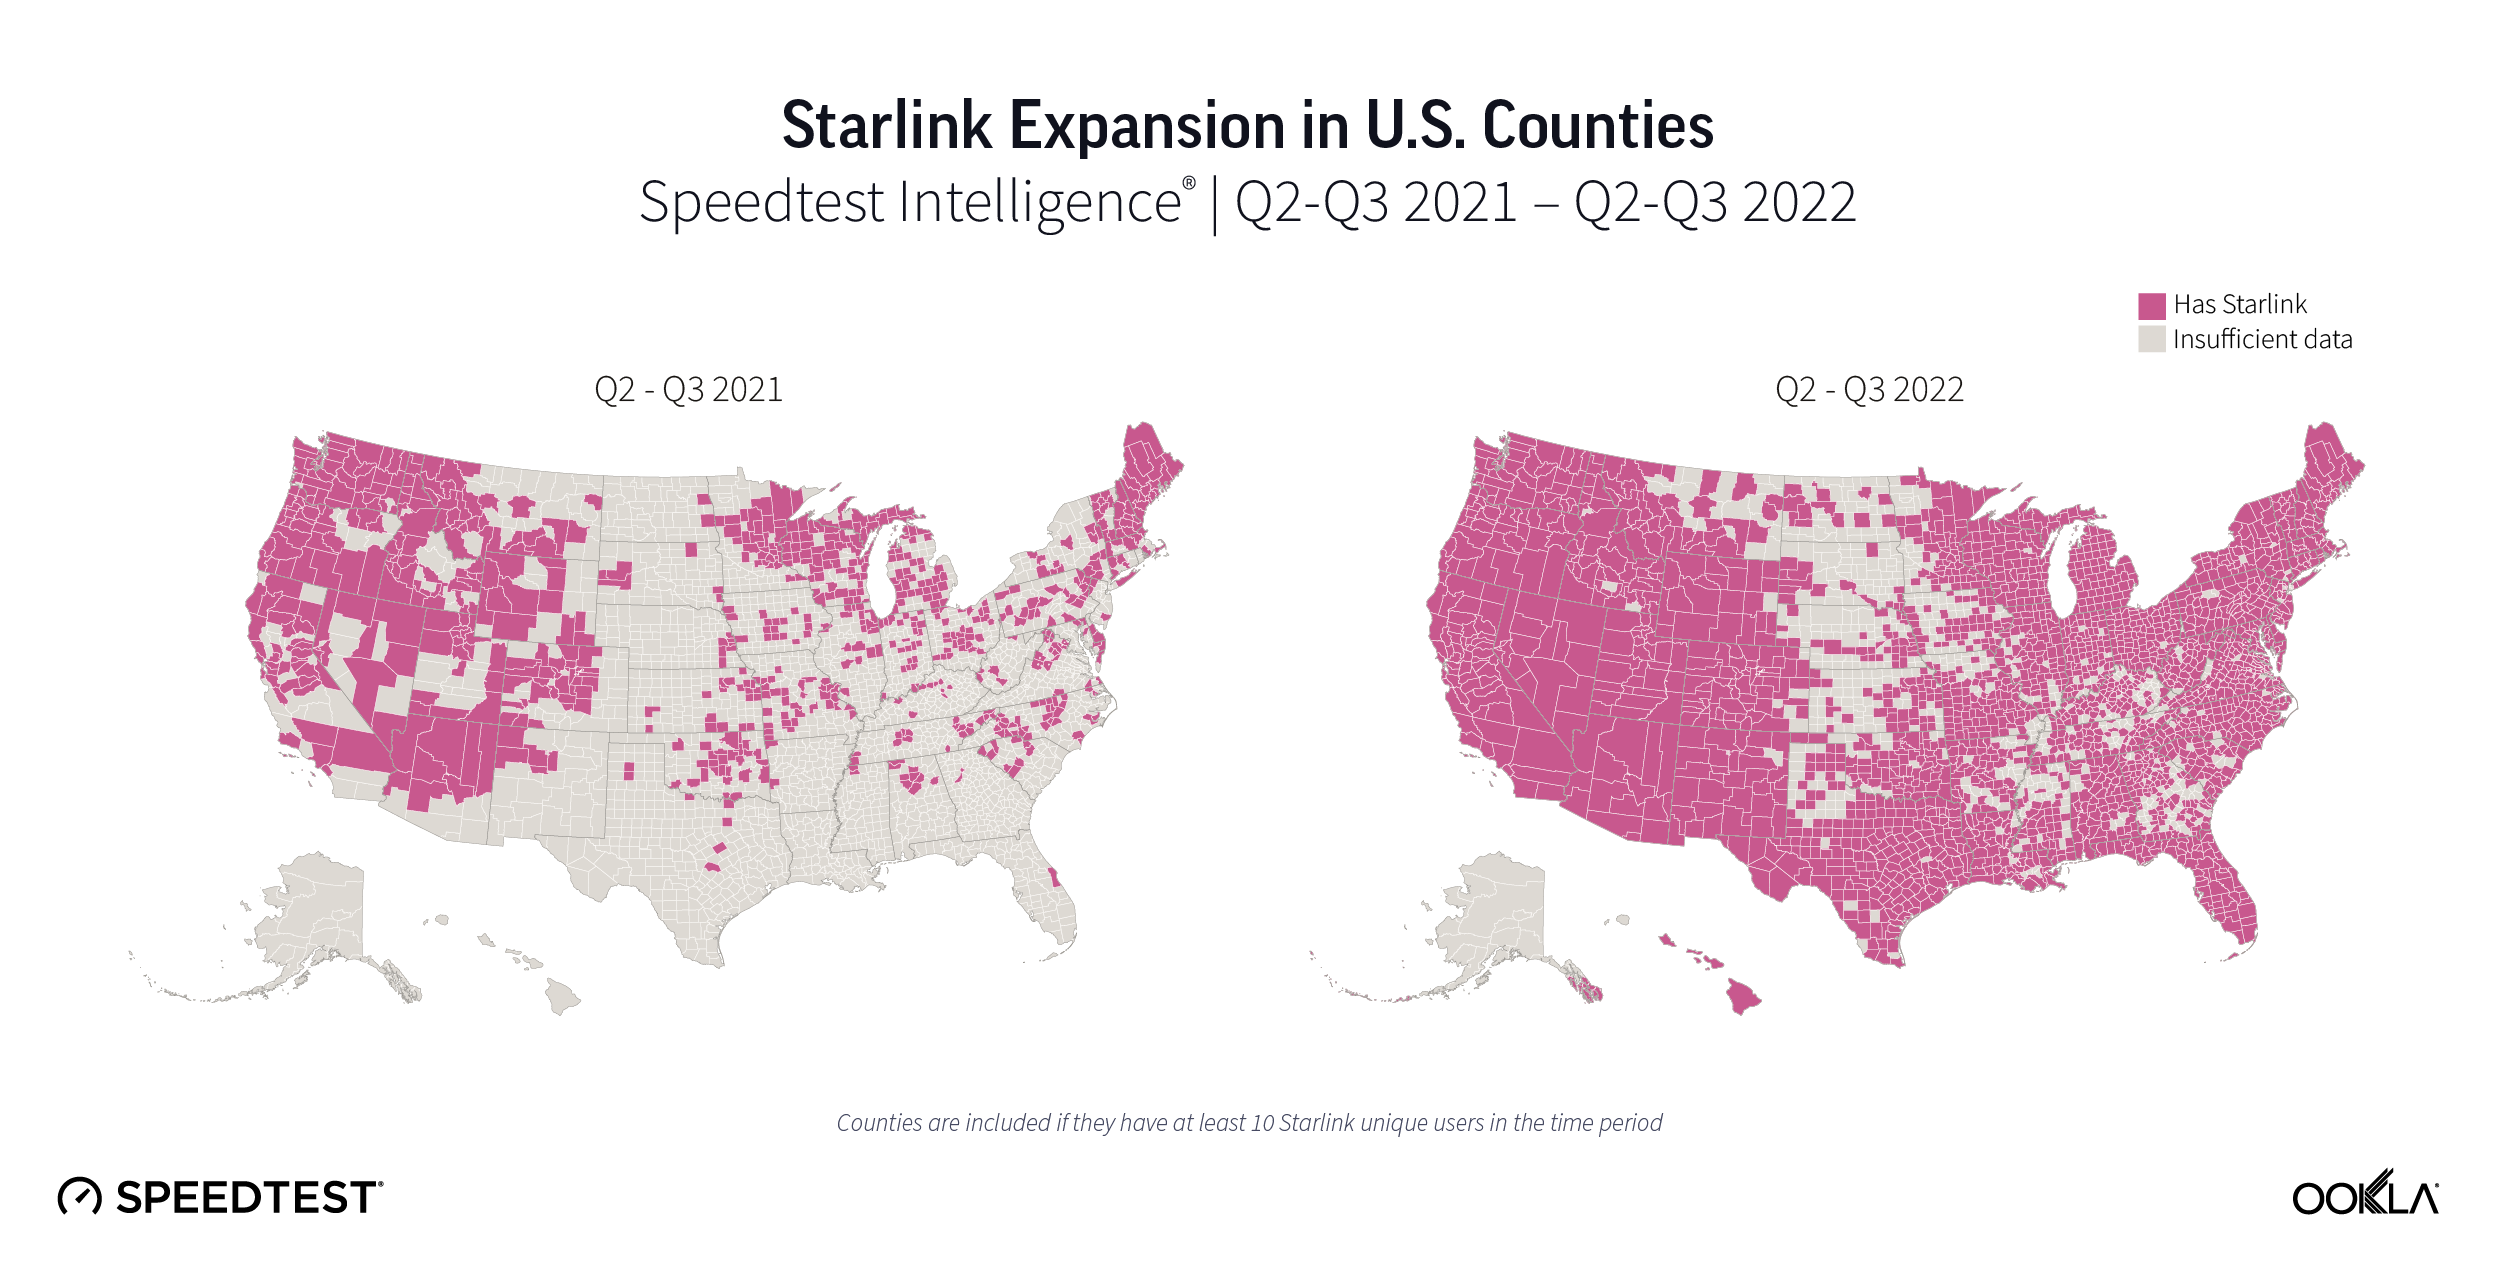
Satellite providers are playing no small part in the rapid expansion of global connectivity. Some experts predict there will be 58,000 satellites orbiting the earth by 2030 — a nearly 725% increase from 2023. Ookla® is back with our ongoing satellite internet series with compelling, fresh data for satellite providers in Africa, Europe, and Oceania during Q2 2023, including SpaceX’s Starlink, Viasat, and Skylogic.

This analysis includes Starlink Net Promoter Score (NPS) data for France, Germany, Italy, New Zealand, and the United Kingdom, year-over-year data for satellite providers in Europe and Oceania from Q2 2022 to Q2 2023, and new Q2 2023 data from Starlink in Africa.

Starlink users across different continents continue to love the service

Using Speedtest Intelligence®, we examined NPS ratings data for Starlink users against an aggregate of all fixed broadband providers combined. 

NPS is based on Speedtest® user responses after being asked how likely they are to recommend their provider to friends or family on a 0 to 10 scale. NPS ratings are categorized into Detractors (score 0-6), Passives (score 7-8), and Promoters (score 9-10), and is calculated as (% Promoters – % Detractors) x 100. Any NPS score above 0 indicates that a provider’s audience is more loyal than not.

Chart of NPS Performance in Select Countries

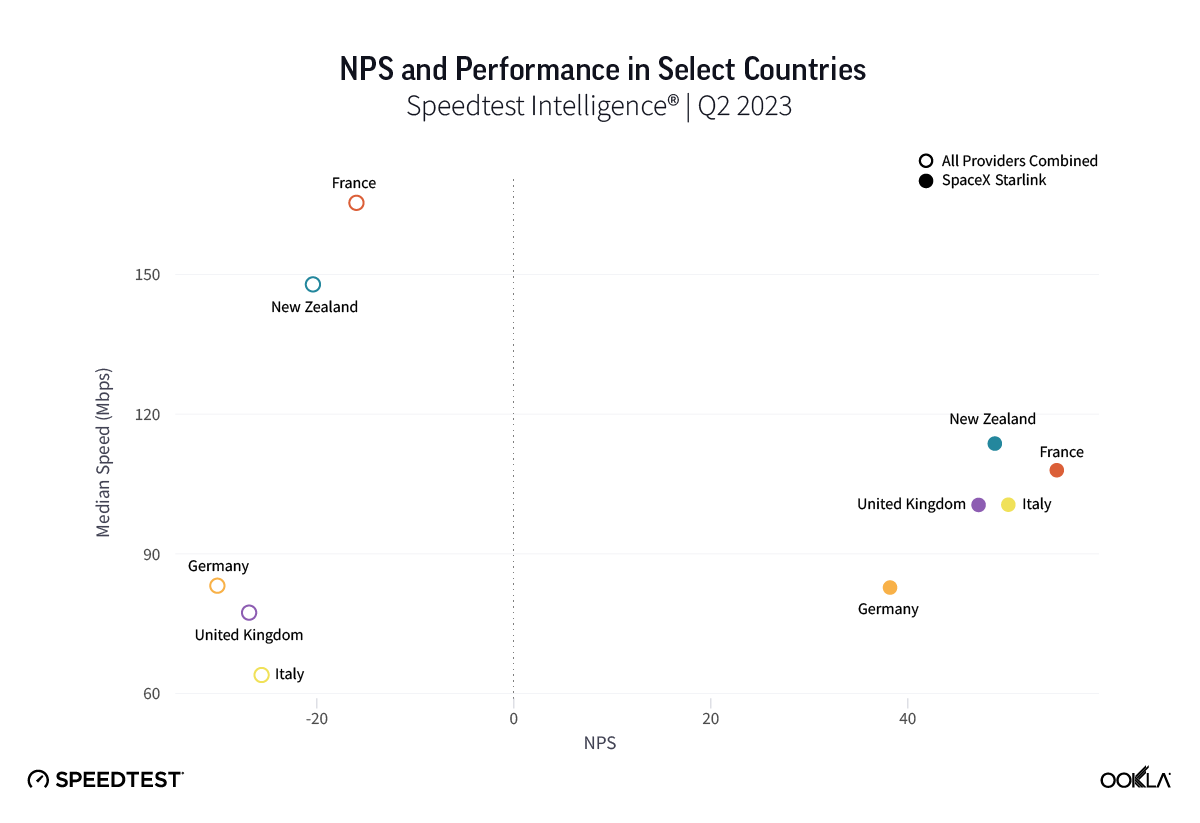
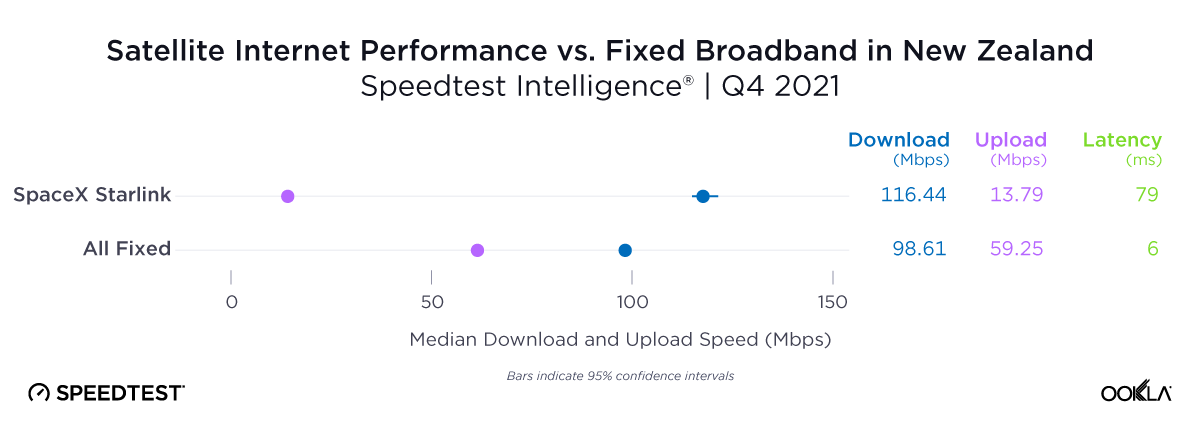
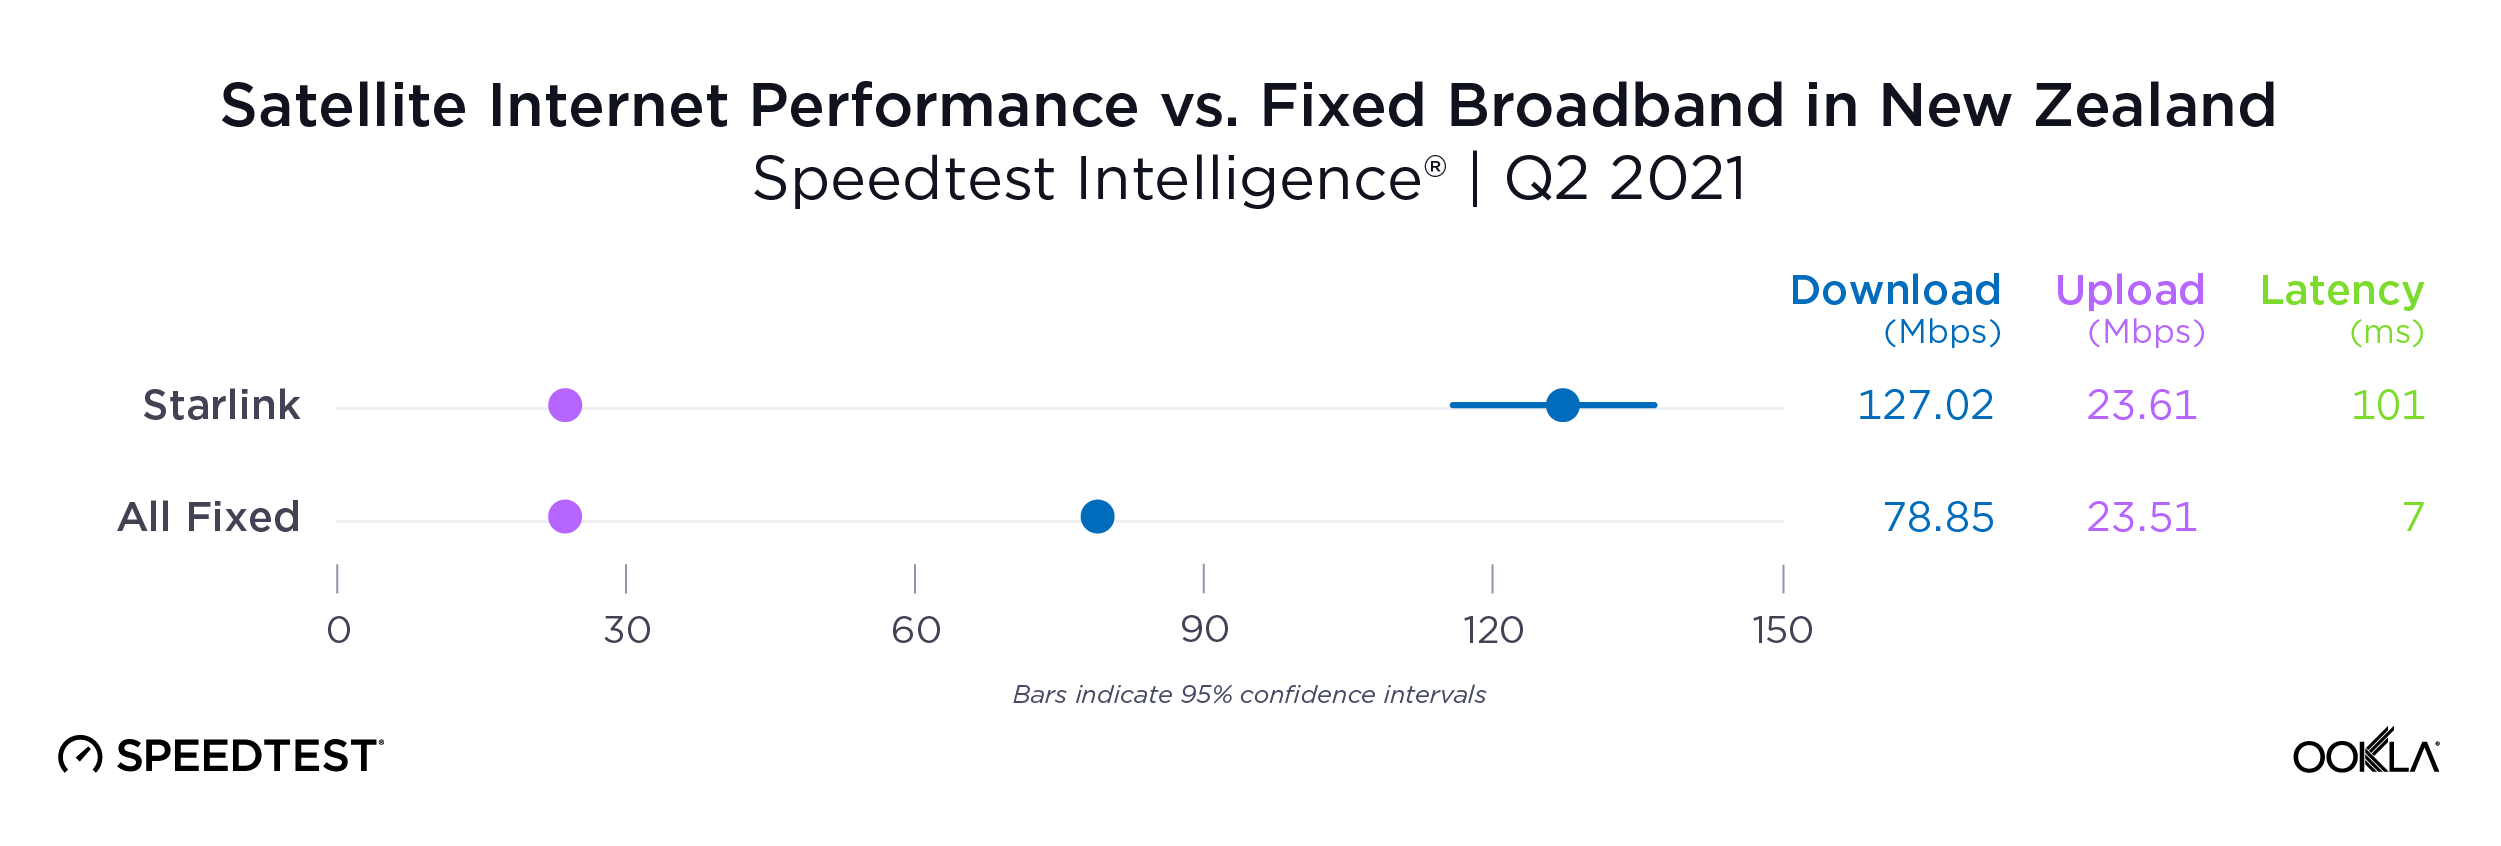
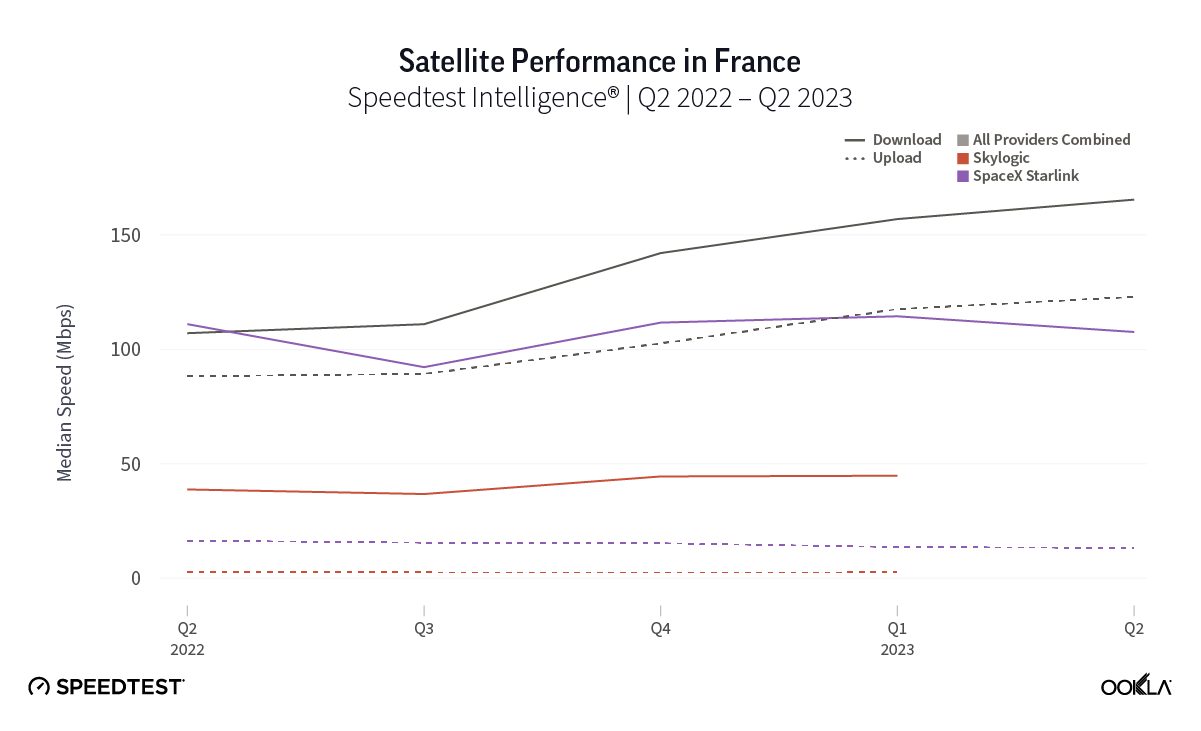
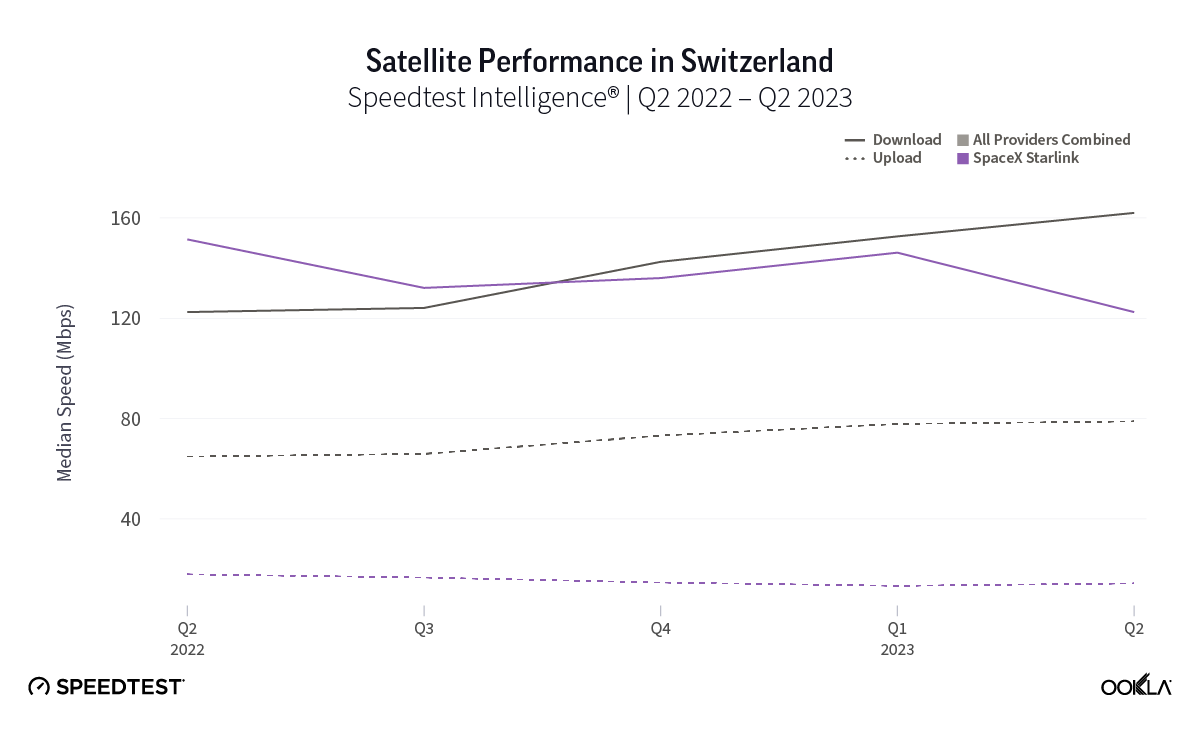
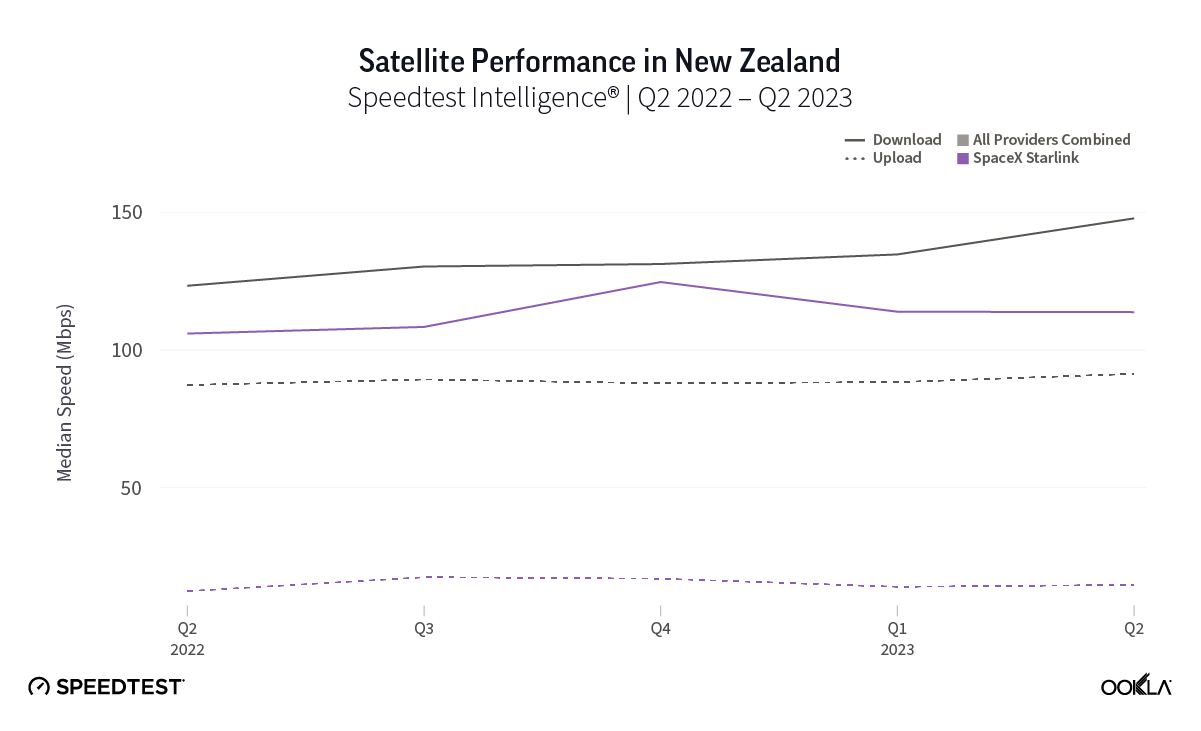
As you can see from the above image, Starlink users in France, Germany, Italy, New Zealand, and the U.K. had an NPS score much higher than the aggregate score for all fixed broadband providers combined during Q2 2023. France had the highest NPS among the aggregate of fixed broadband providers for the countries we surveyed at -15.98 and fixed broadband providers had a much faster median download speed at 165.37 Mbps to Starlink’s 107.56 Mbps. In New Zealand there was a similar story with the aggregate of fixed broadband providers having a -20.40 NPS to Starlink’s 48.83, while having a faster median download speed 147.86 Mbps to 113.78 Mbps during Q2 2023.

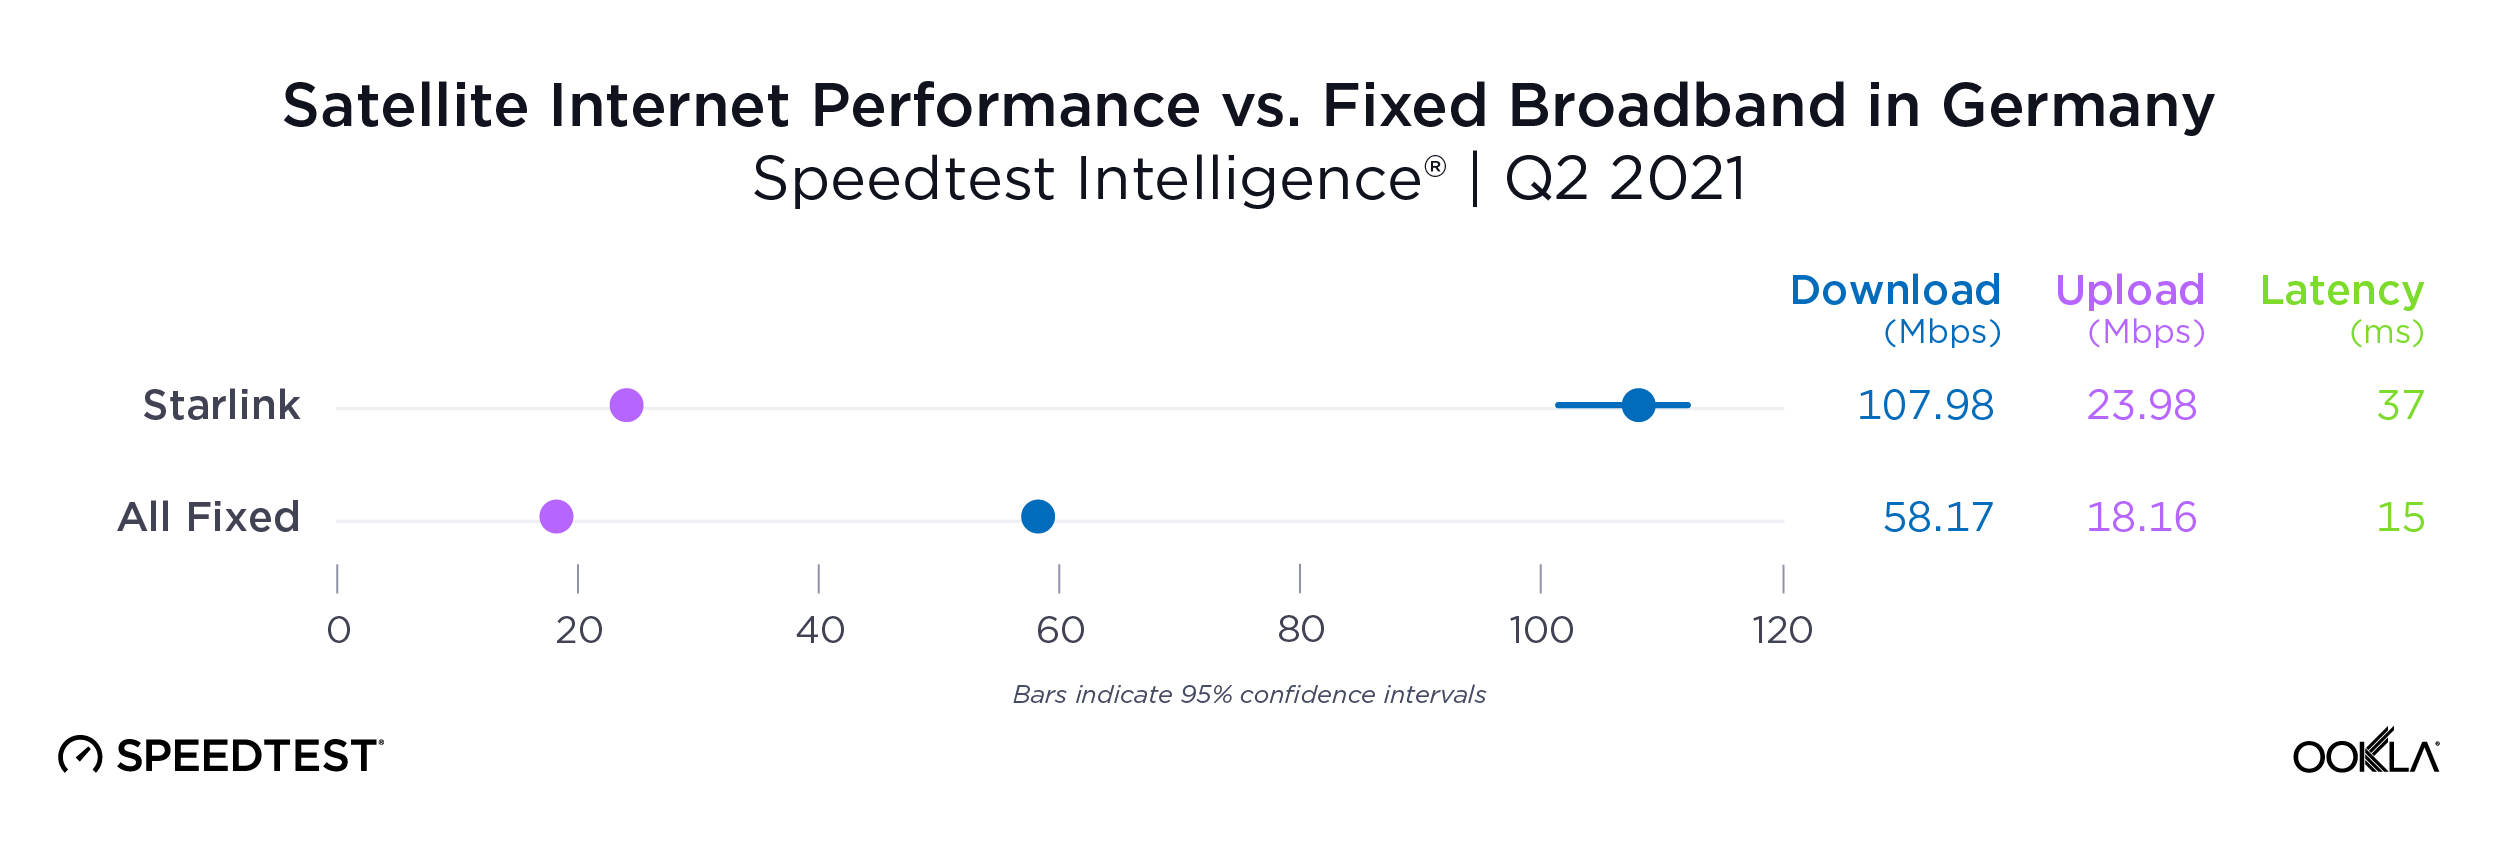
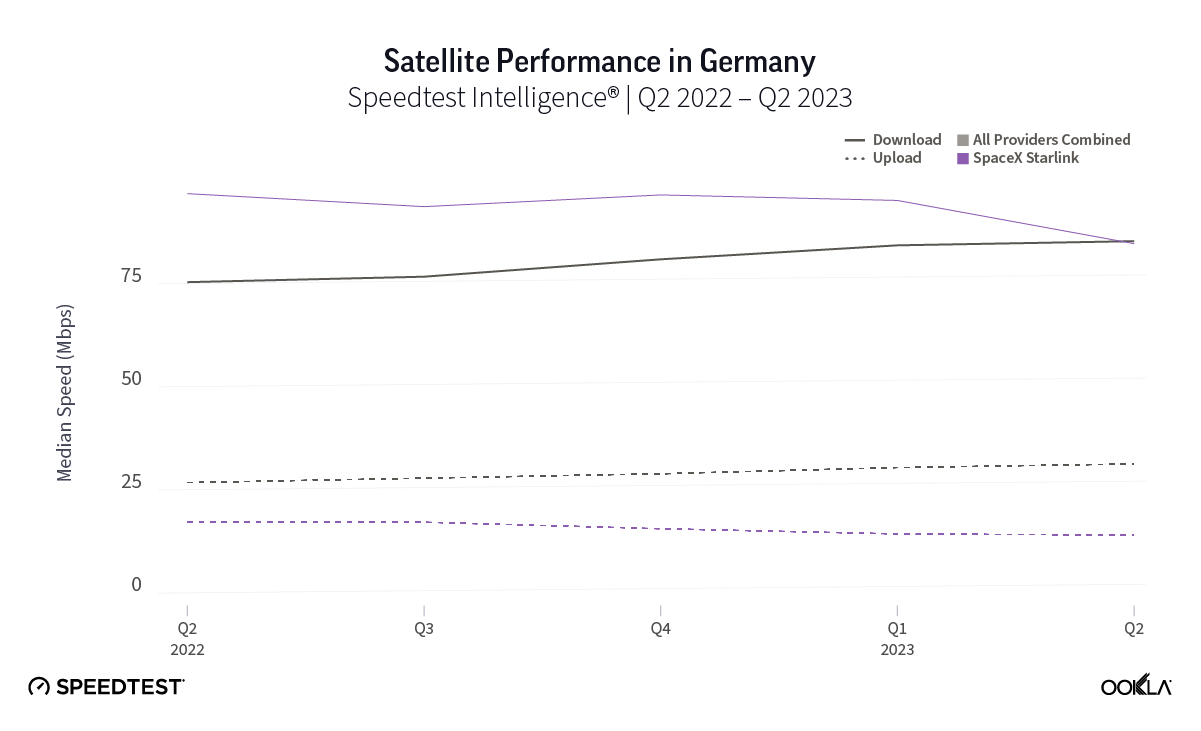
Germany, which had the lowest NPS rating of aggregate of fixed broadband providers in Europe at -30.10, also had the smallest difference in NPS with Starlink scoring 38.19. Interestingly, the aggregate of fixed broadband providers and Starlink both had similar median download speeds at 83.16 Mbps and 82.56 Mbps, respectively, during Q2 2023.

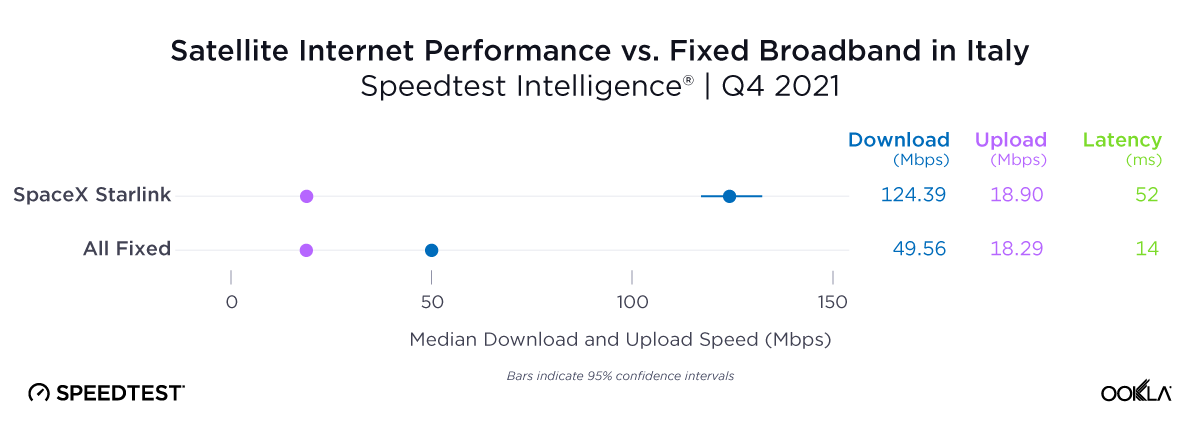
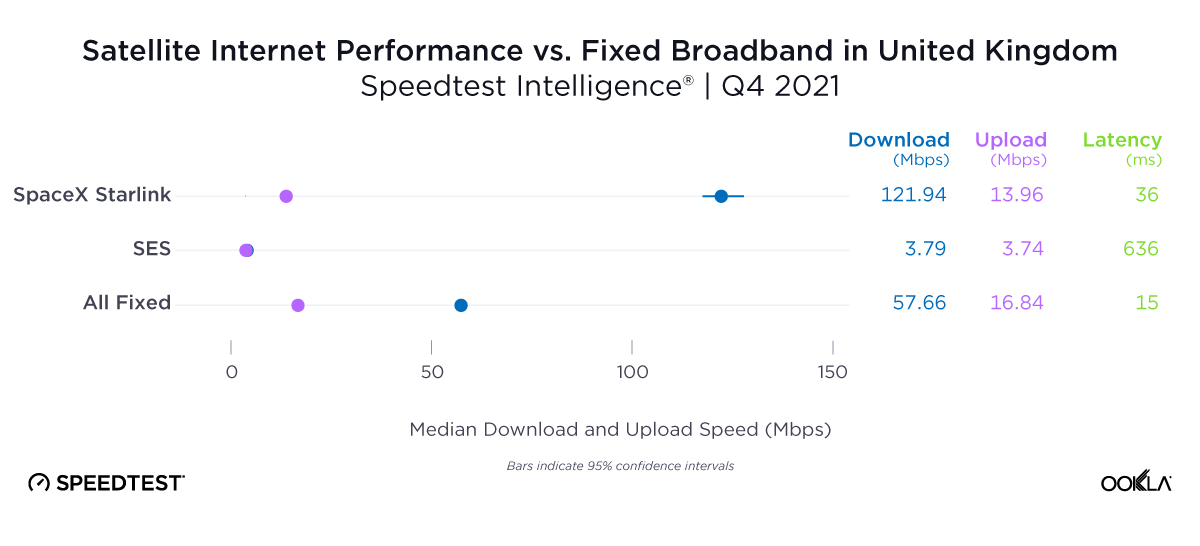
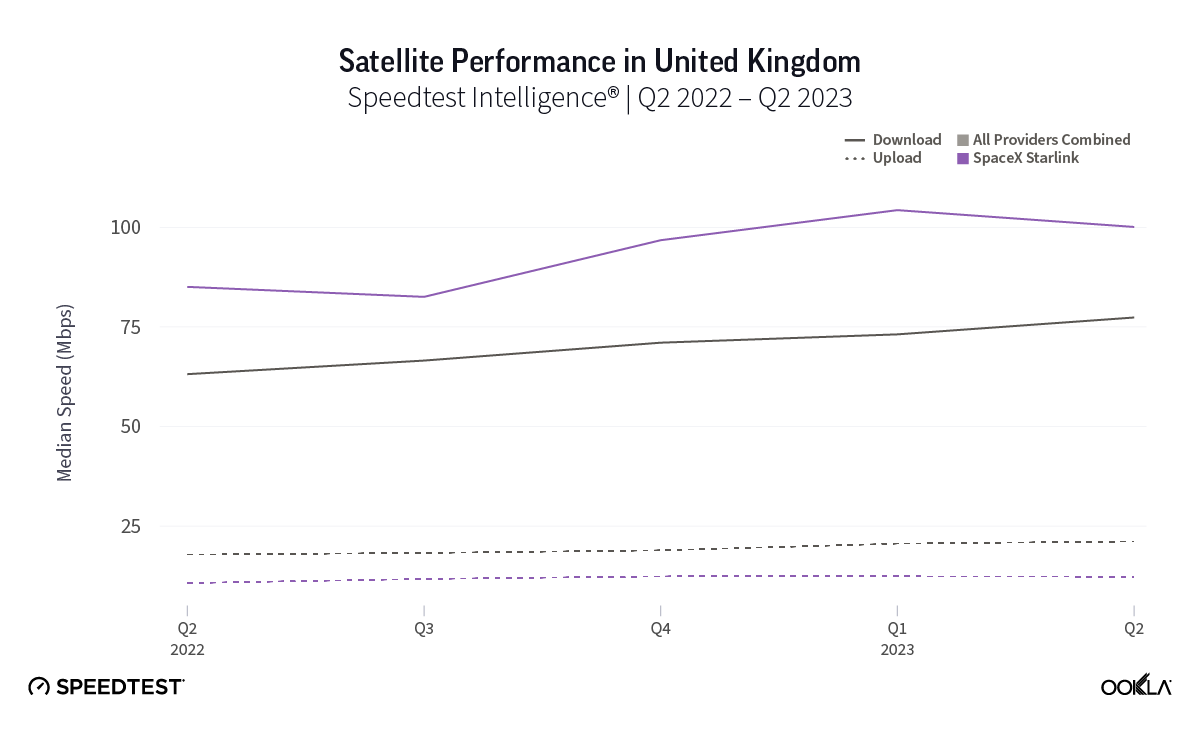
Of note, Starlink had much higher NPS ratings and median download speeds than the aggregate of all fixed providers combined in Italy and the U.K., respectively, during Q2 2023. Starlink’s NPS was 50.20 to -25.61 for the aggregate of all fixed broadband providers in Italy during Q2 2023, while the median download speeds were 100.68 Mbps to 63.99 Mbps. In the U.K., Starlink’s NPS was 47.18 to -26.88 for the aggregate of all fixed broadband providers combined, with the median download speeds a little closer, 100.11 Mbps to 77.38 Mbps, respectively. 

In our last report, we found a wide NPS gap between U.S. rural Starlink users — who often have fewer options for fixed broadband access — and the corresponding aggregate of fixed broadband providers. Given that all five of these countries have rural or remote regions that are underserved or not served by traditional broadband offerings, it may be no surprise that Starlink users who reside in those areas may feel positive about having access to fast broadband internet. 

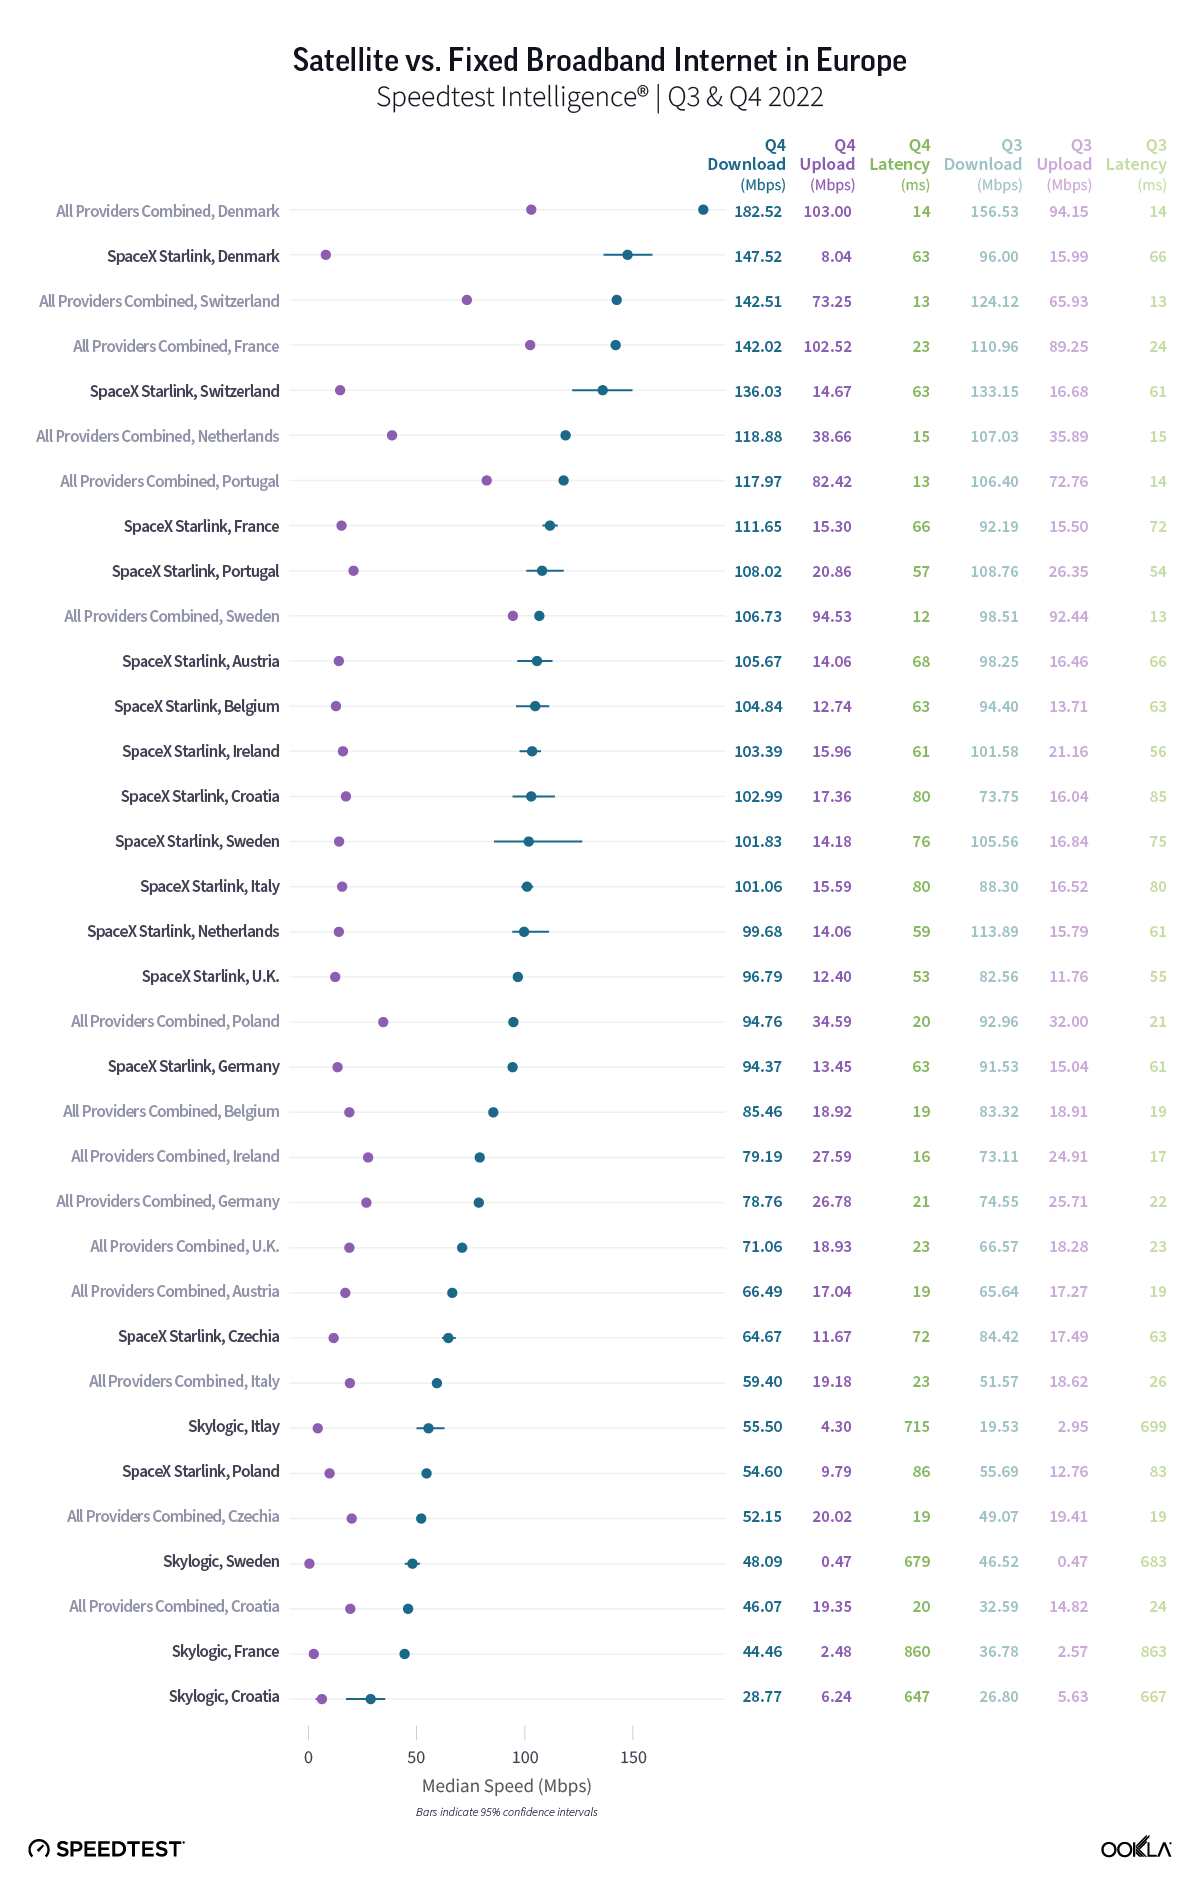
Starlink speeds over 100 Mbps in 14 European countries during Q2 2023, speeds stabilizing across Europe

Key takeaways:

  • Starlink results were the fastest among satellite providers we surveyed.
  • Starlink quarter-to-quarter speeds improved or remained about the same (between 5% and -5%) in 23 countries, while decreasing in 4 countries.
  • Among the 27 European countries we surveyed, Starlink had median download speeds greater than 100 Mbps in 14 countries, greater than 90 Mbps in 20 countries, and greater than 80 in 24 countries, with only three countries failing to reach 70 Mbps.
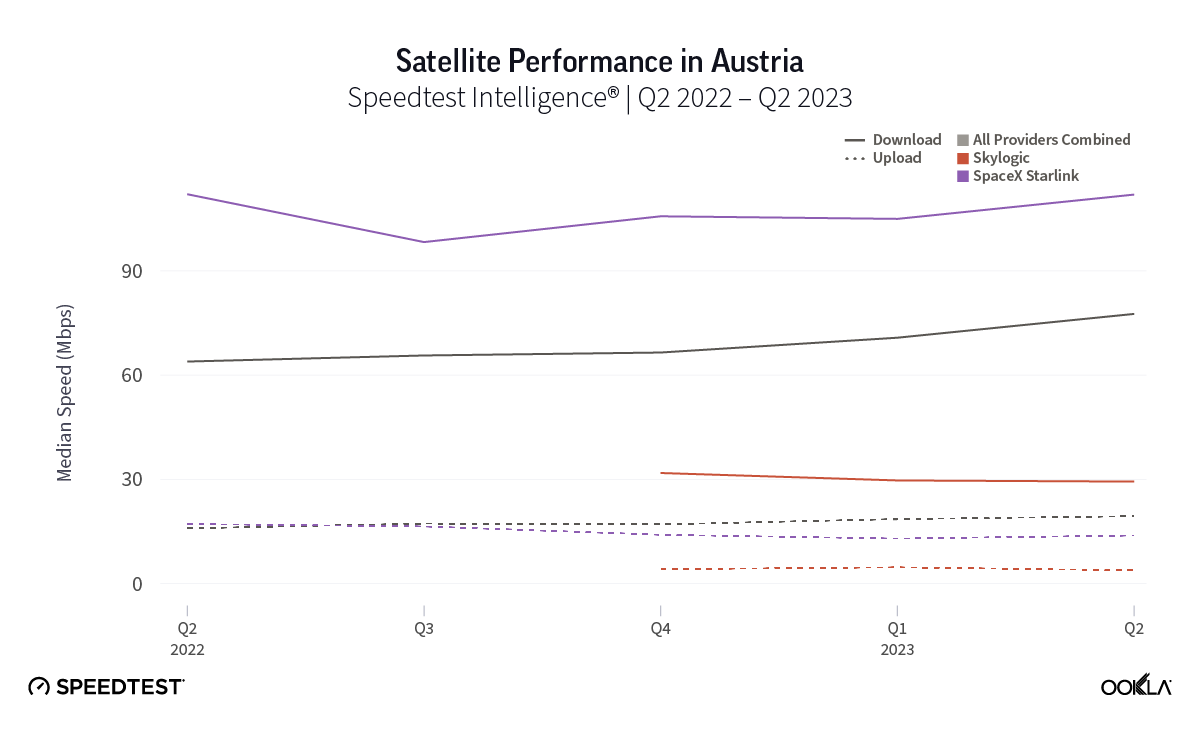
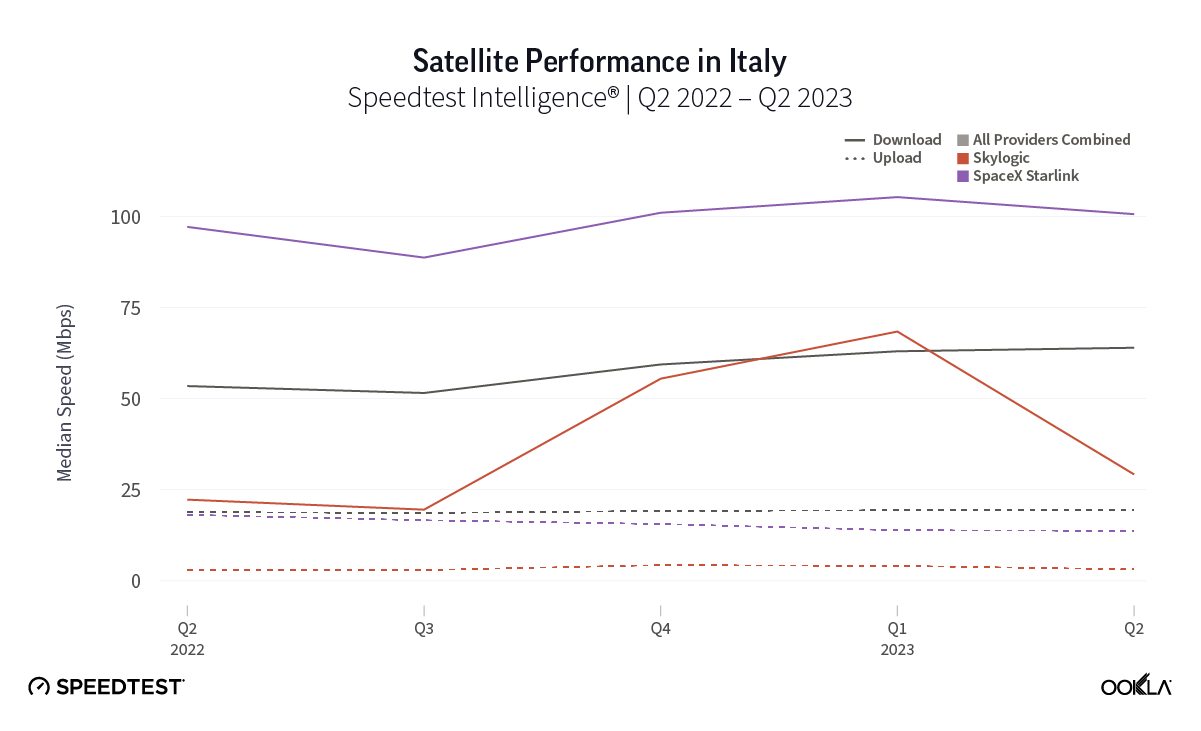
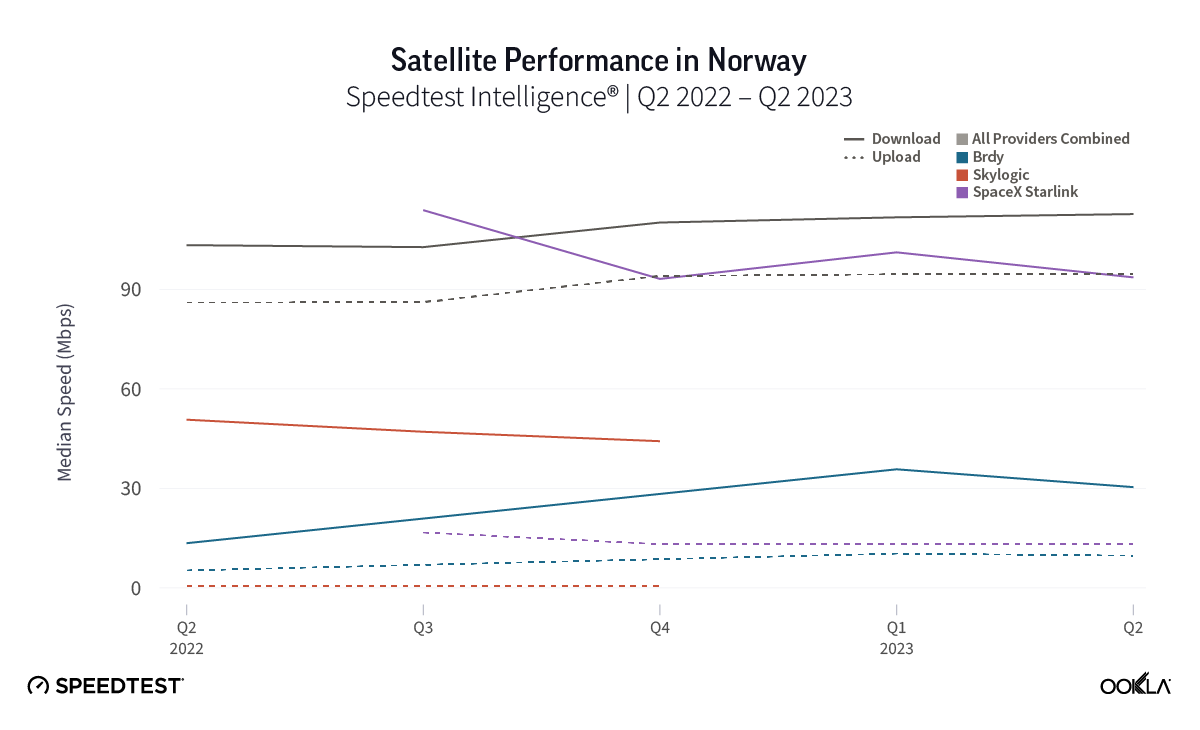
  • Skylogic, while delivering speeds slower than Starlink, showed stabilized broadband speeds over the past year for those seeking a Starlink alternative.

Over the past year, we’ve seen huge developments in the global satellite market, Europe notwithstanding, with Amazon’s Project Kuiper moving forward, the EU creating its own satellite constellation, and OneWeb and Eutelsat merging. While Starlink continues to lead for performance among satellite providers we surveyed, Starlink has experienced some major hurdles over the past year as users flock to the service and speeds have subsequently dipped — but of note those concerns seem to have started allaying in most of Europe during Q2 2023.

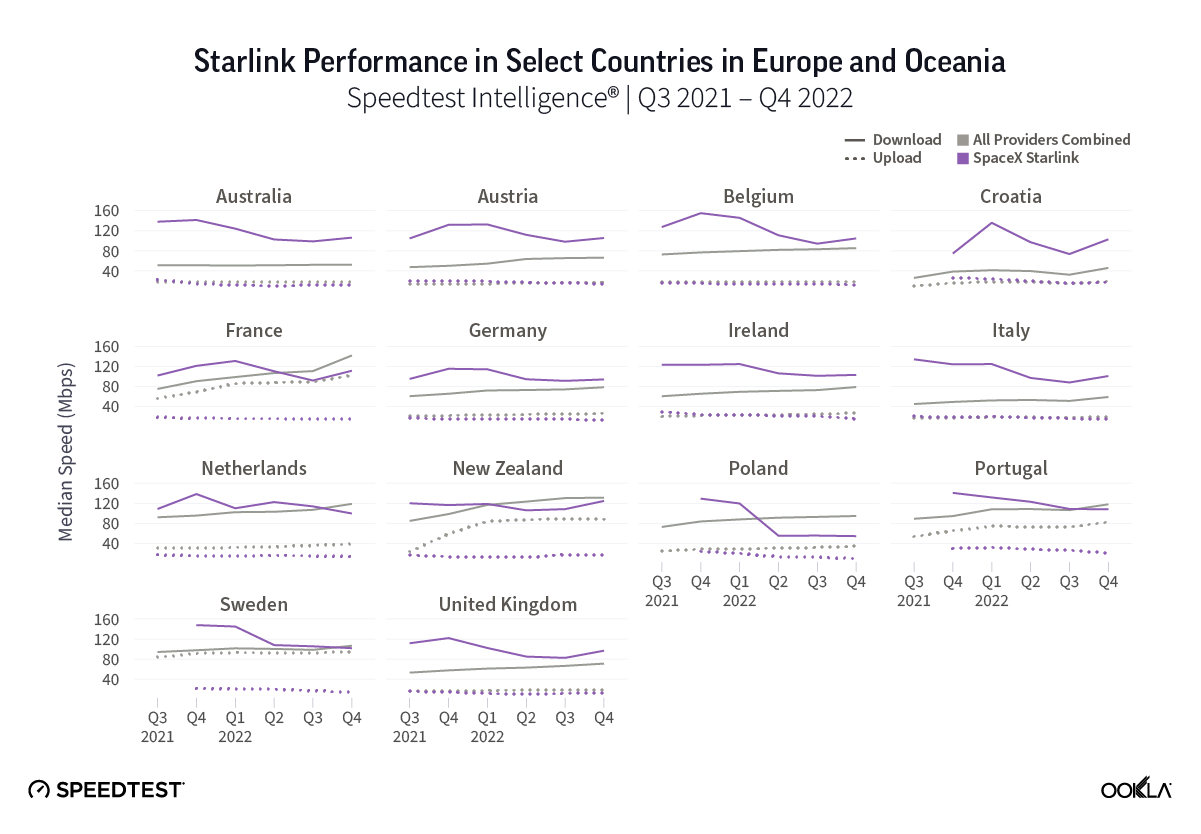
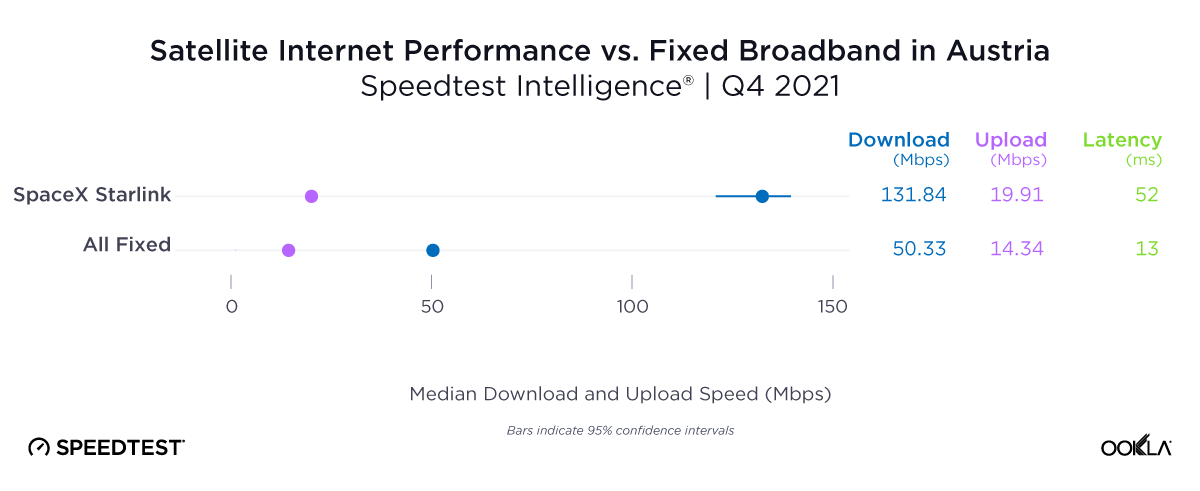
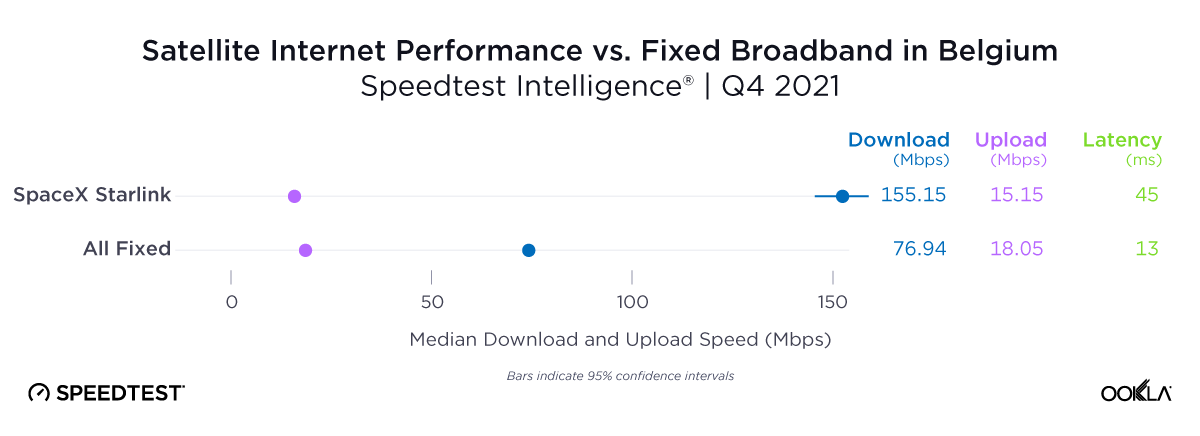
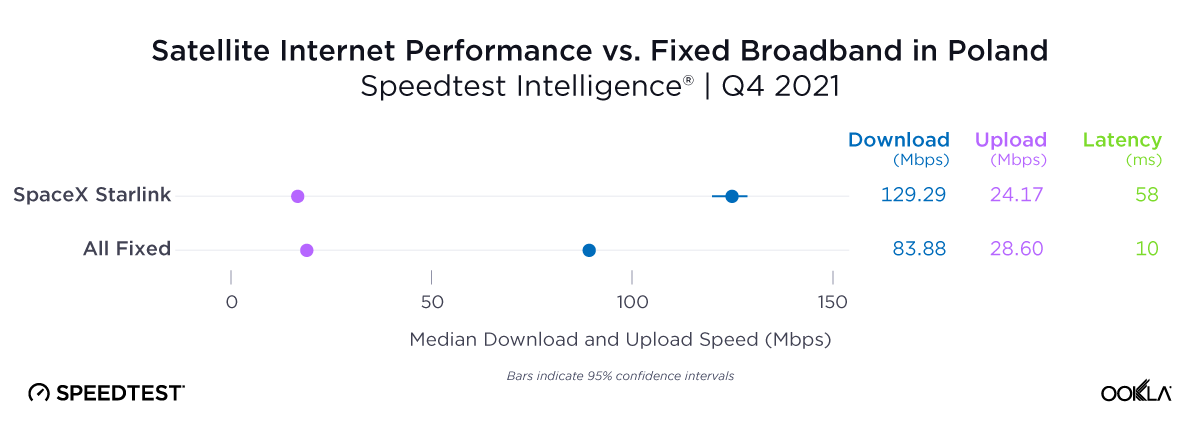
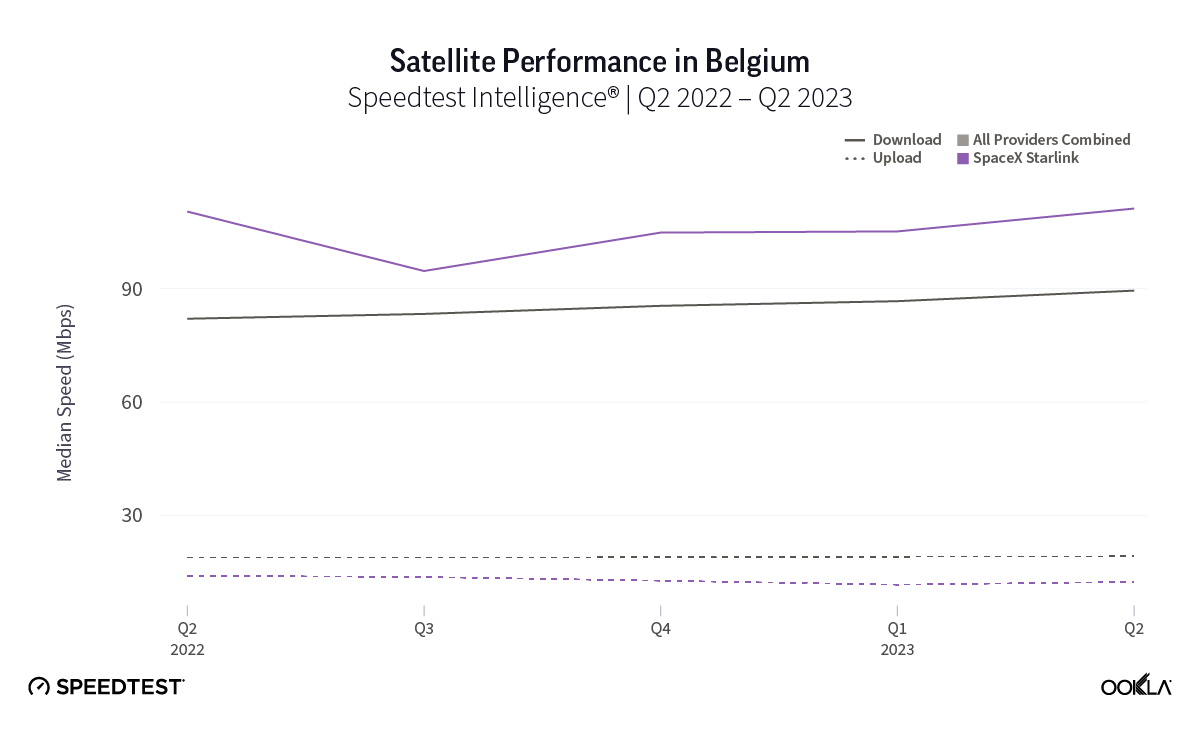
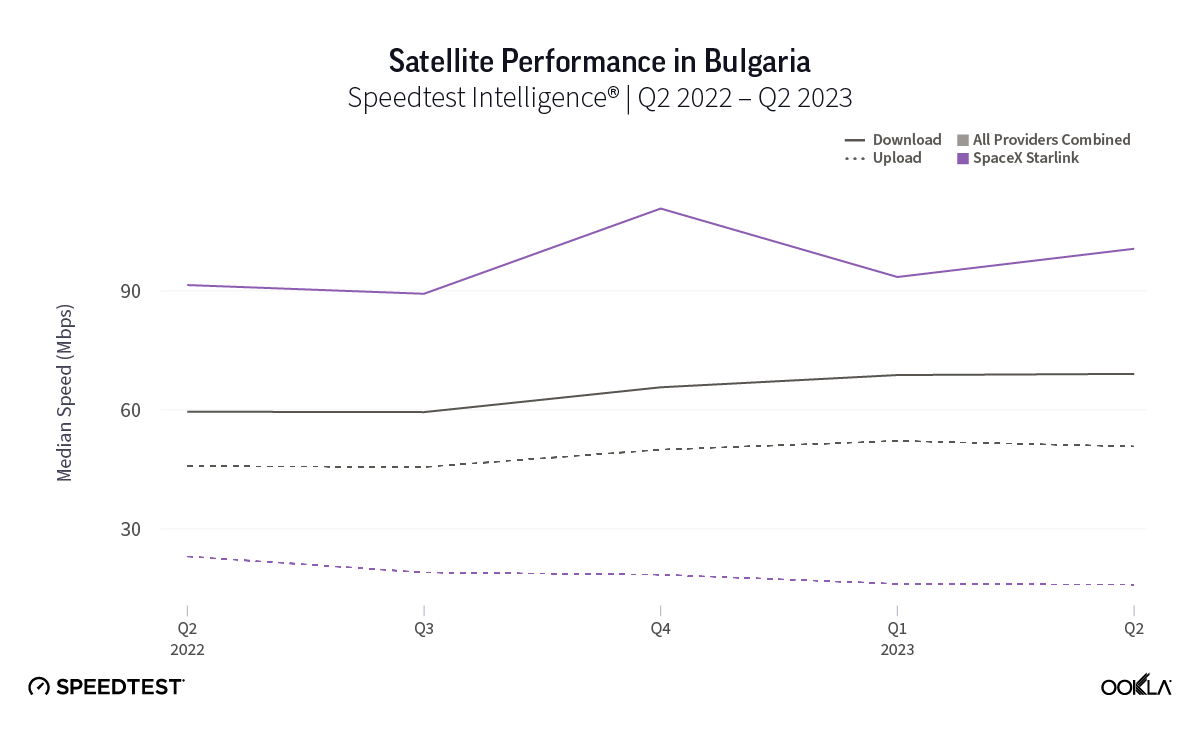
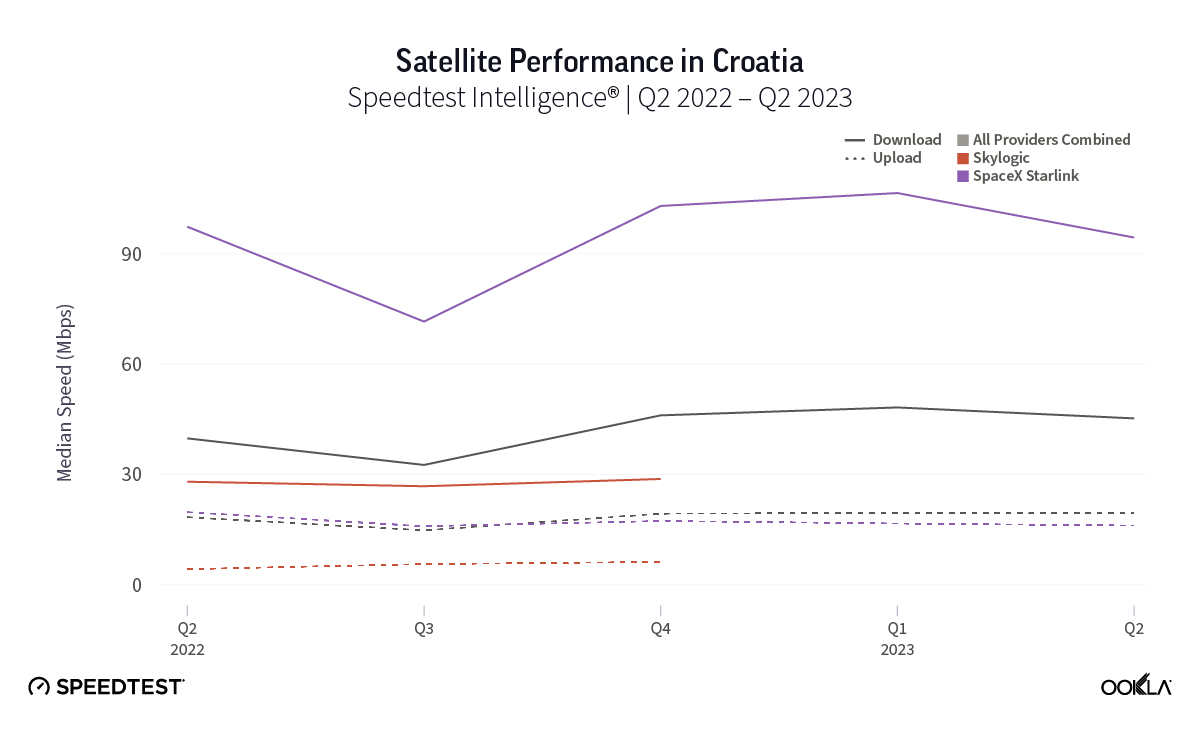
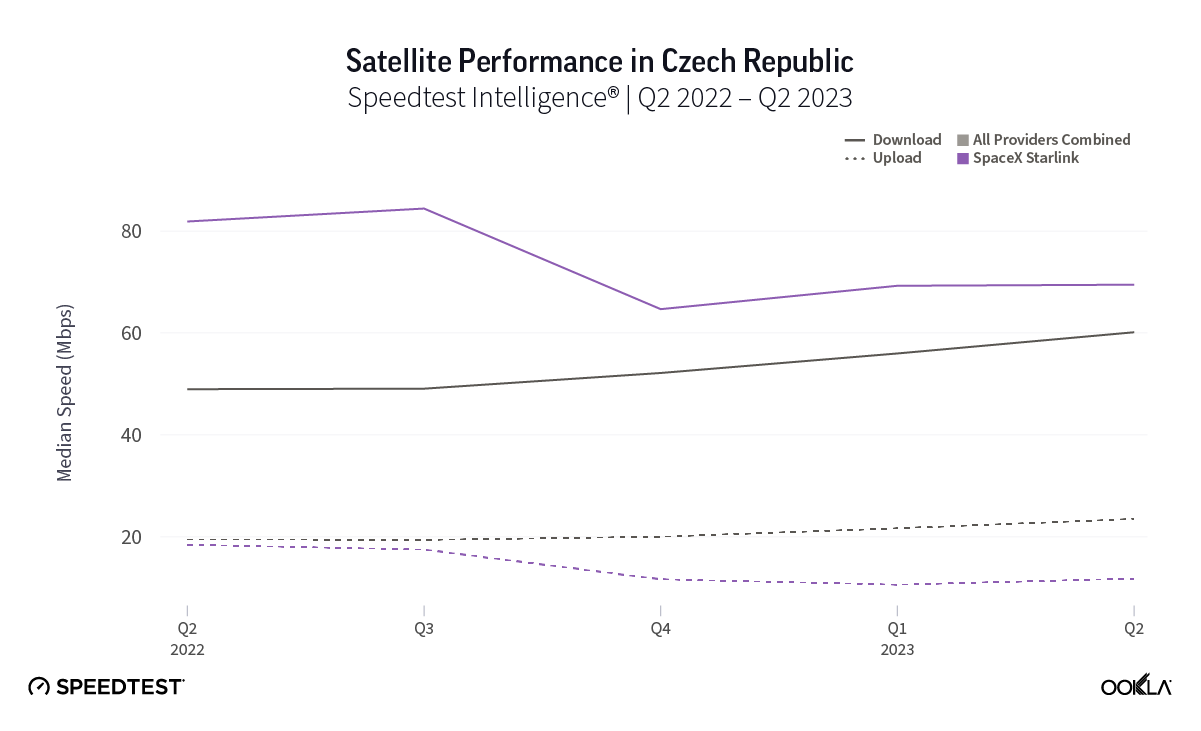
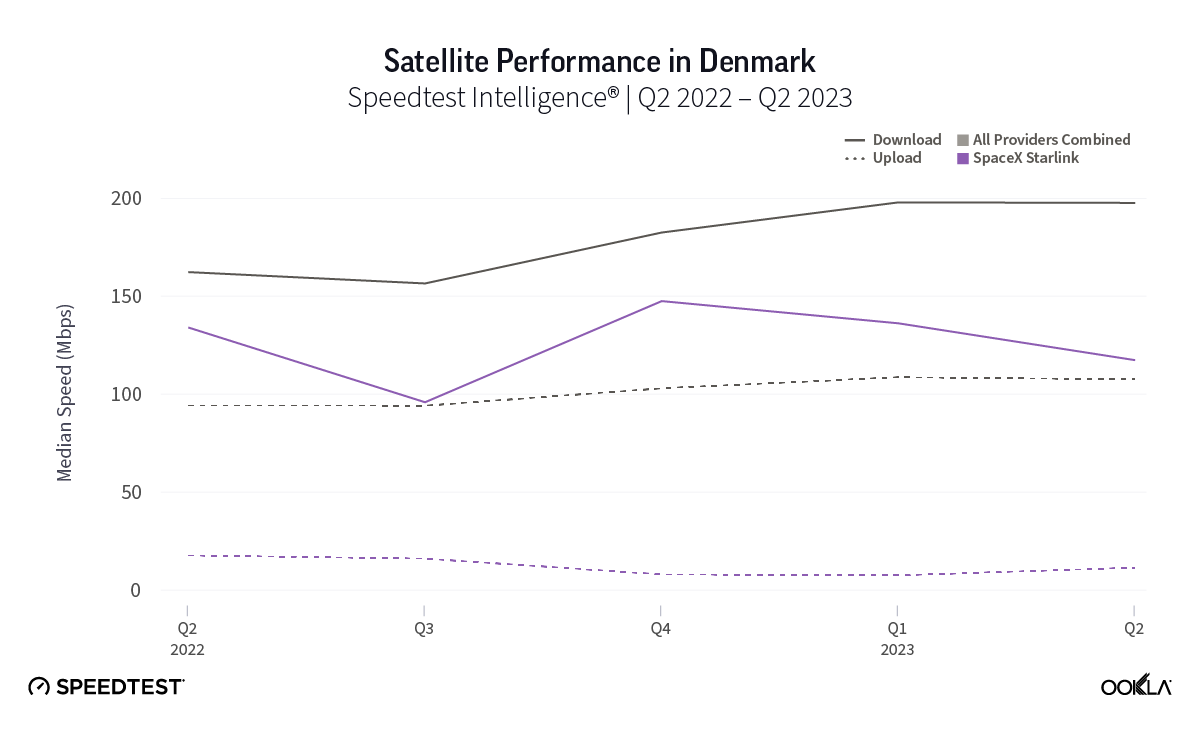
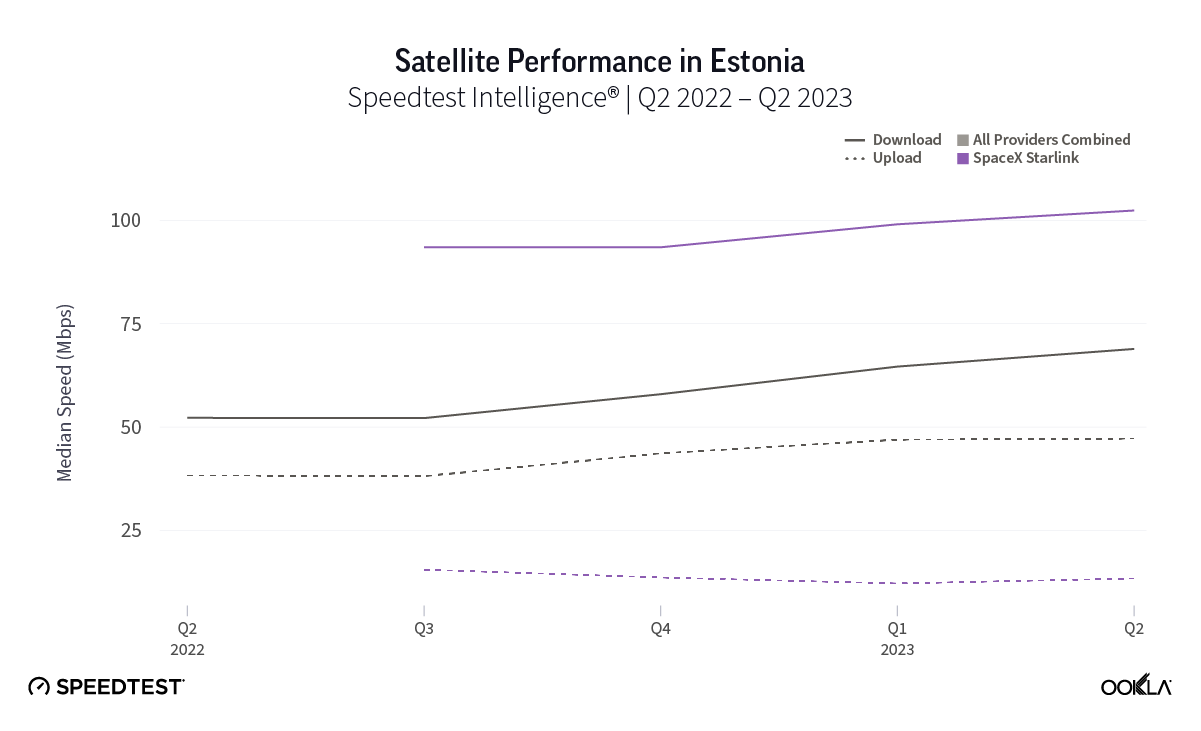
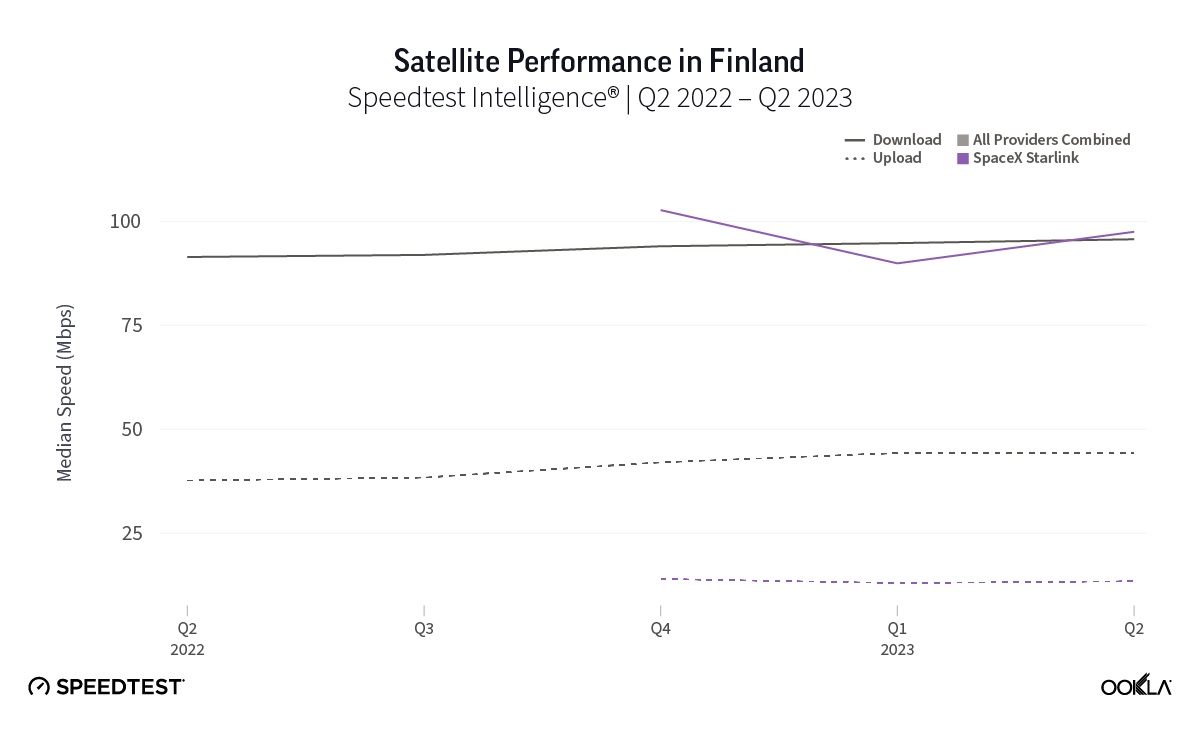
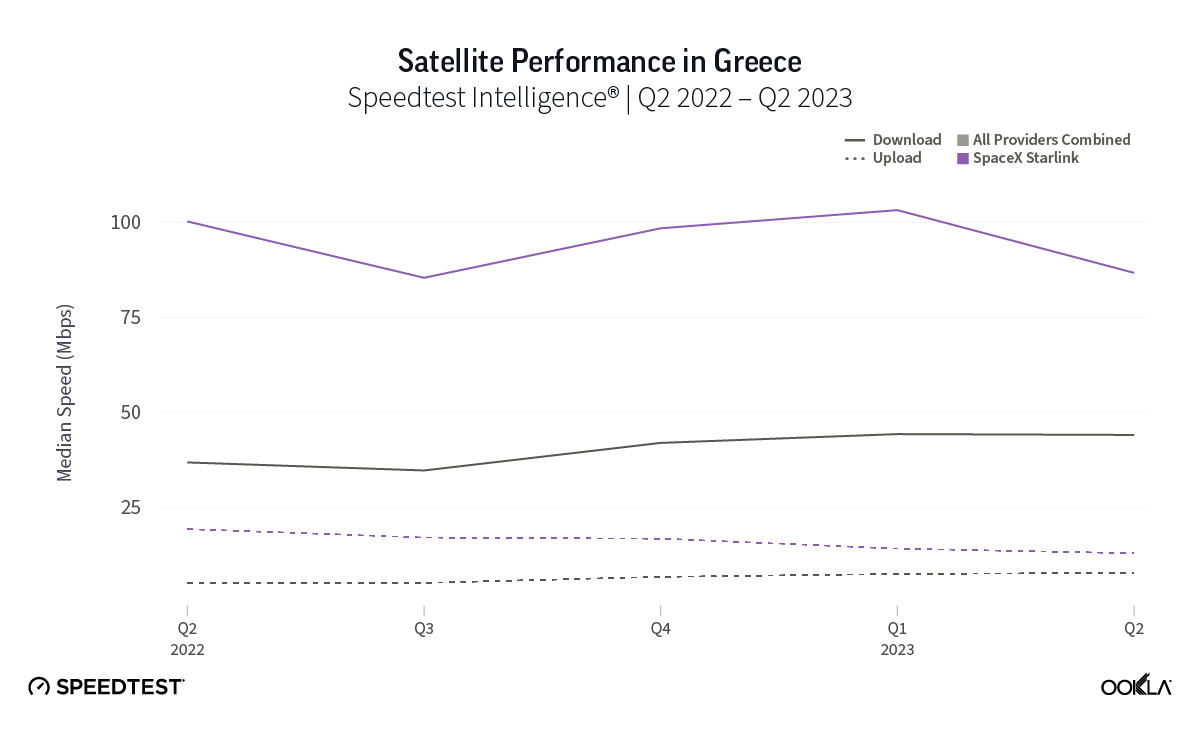
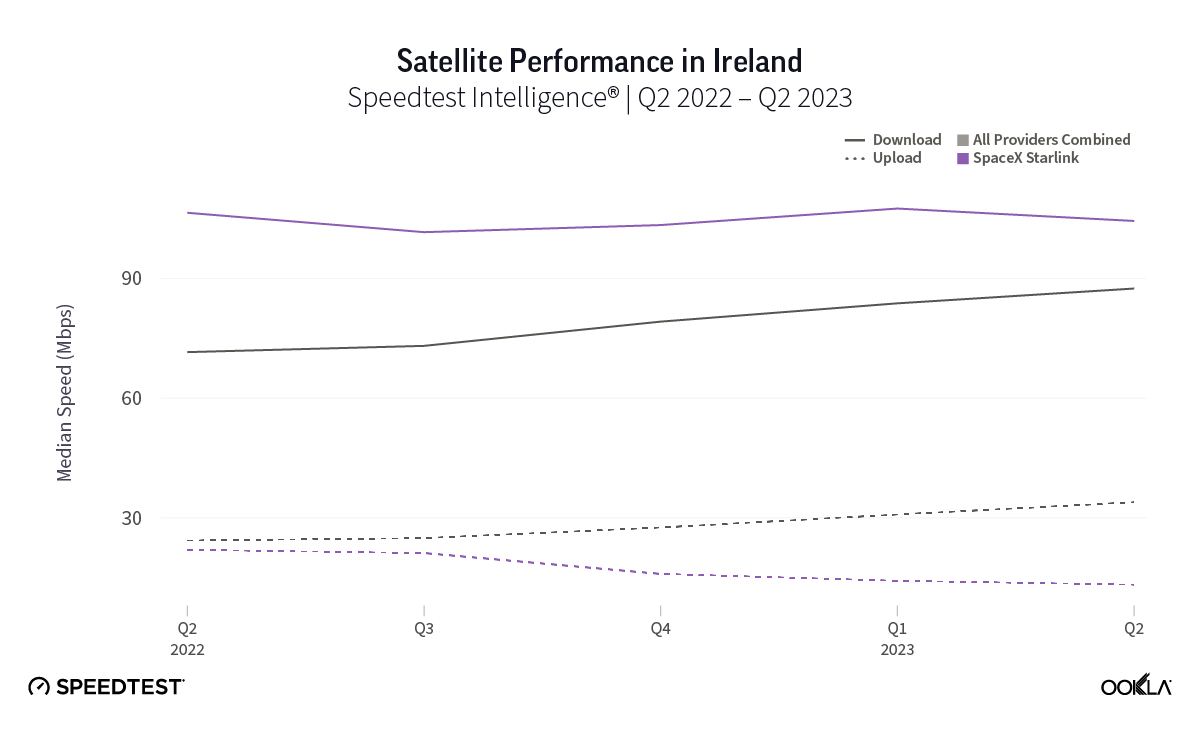
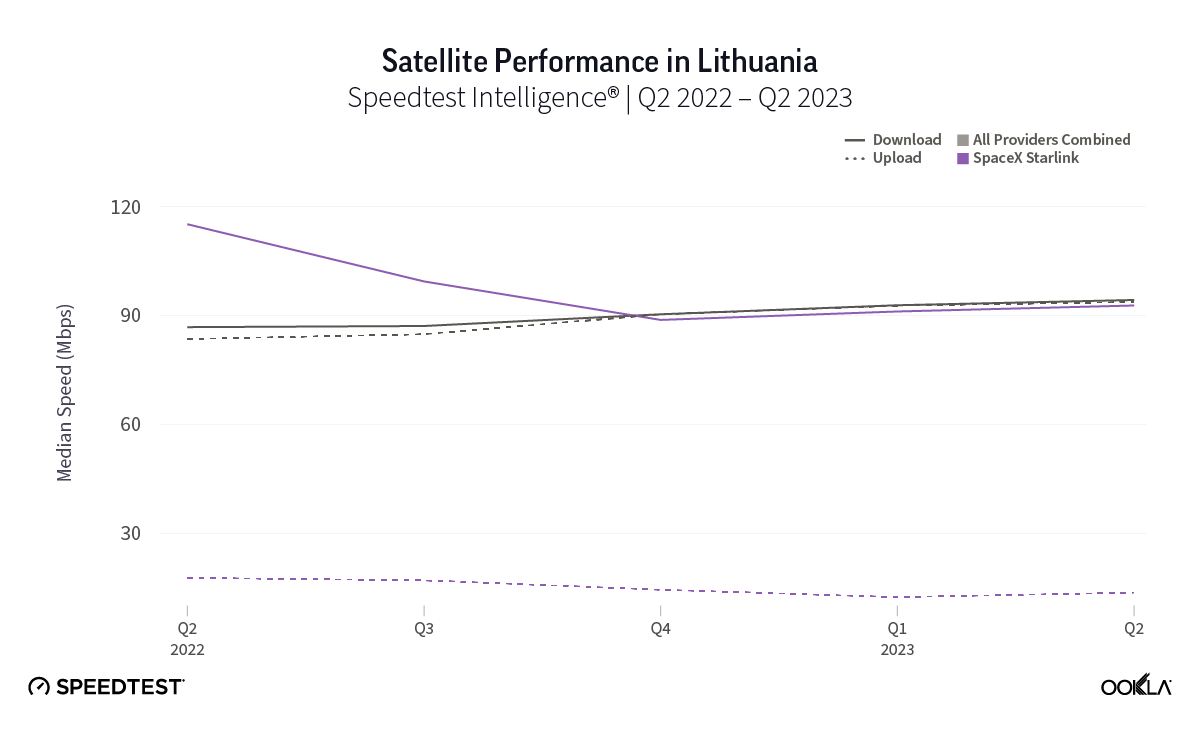
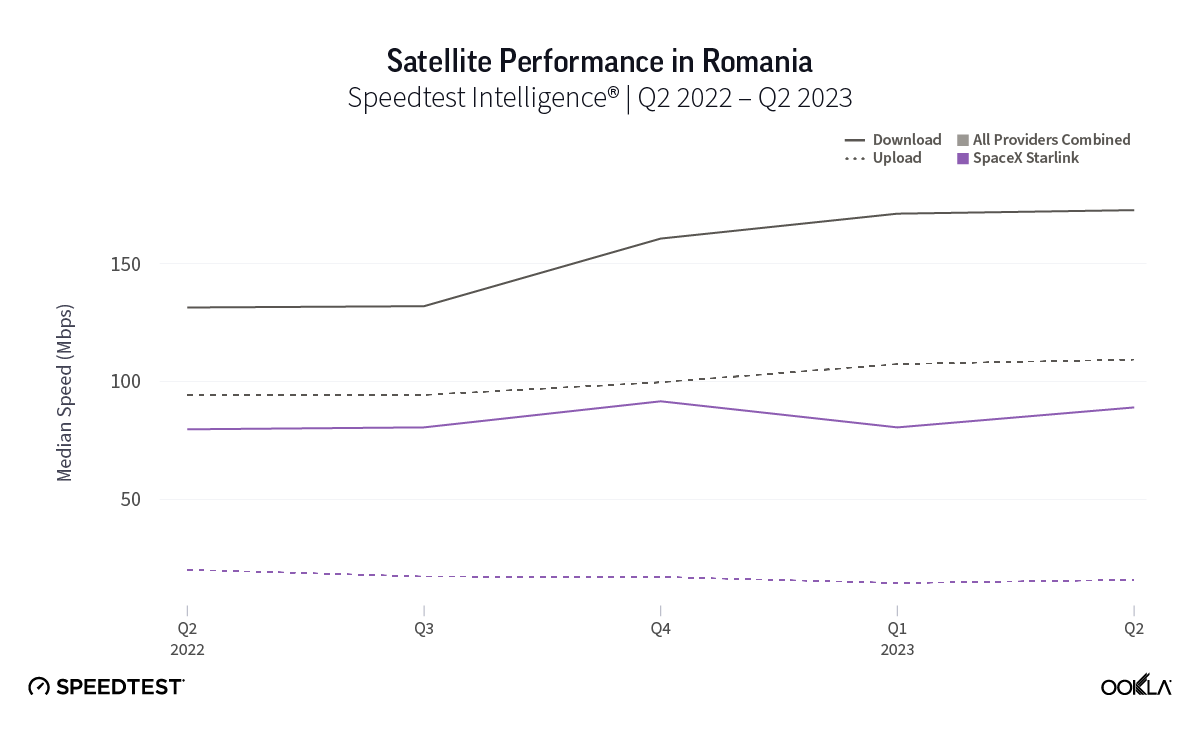
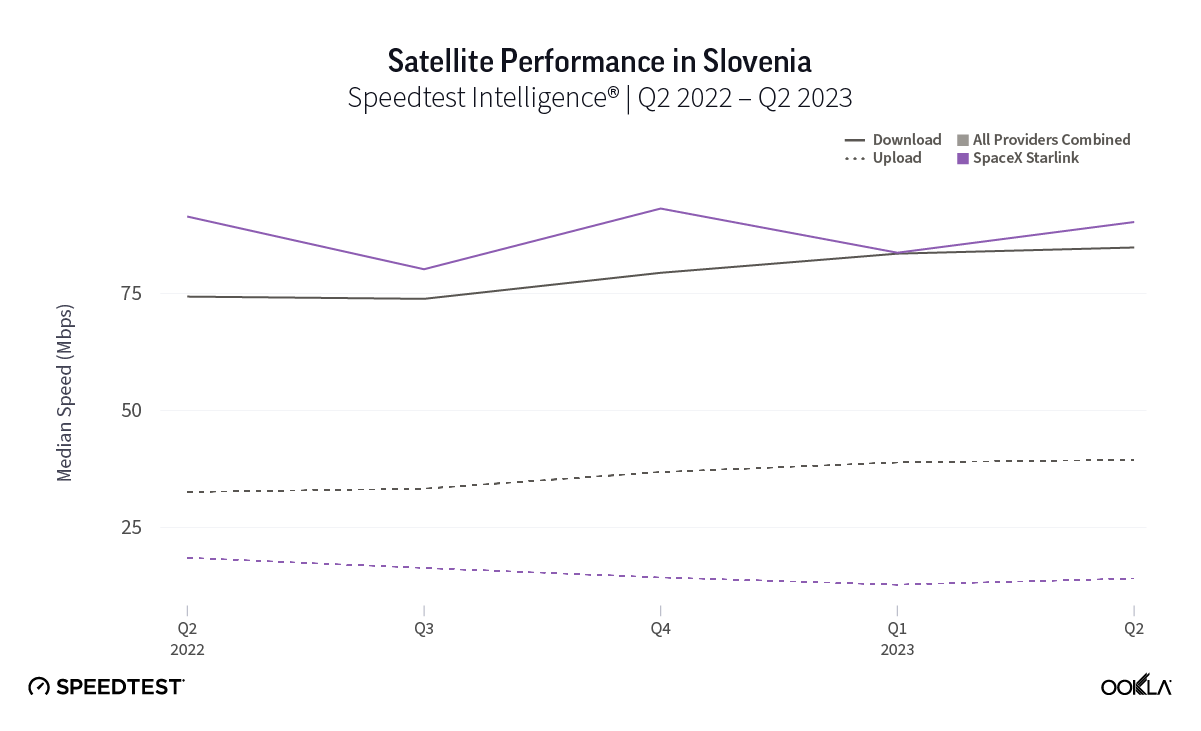
At first glance, year-over-year median download speeds for Starlink are about the same (-5% to 5%) or better (greater than 5%) from Q2 2022 to Q2 2023 in 15 countries and slower (decreasing more than 5%) in 8 countries. But among the 27 countries we surveyed during Q2 2023, Starlink had speeds faster than the aggregate of all fixed broadband providers combined in 11 countries (Austria, Belgium, Bulgaria, Croatia, Czechia, Estonia, Greece, Ireland, Italy, Latvia, and the U.K.) Those speeds were most notably faster in Croatia and Greece for Starlink at 94.41 Mbps to 45.24 Mbps and 108.97 to 44.09 Mbps, respectively, during Q2 2023. Speeds were about the same in four countries (Finland, Slovenia, Germany, and Lithuania), and speeds were slower than the aggregate of fixed broadband providers in 12 countries, most notably in Poland, Spain, Romania, Denmark, and France which saw between 50% and 105% faster aggregate fixed broadband speeds than Starlink.

Quarterly download speeds stabilizing or improving

Looking at results from Q1 2023 to Q2 2023, median download speeds for Starlink remained about the same (between 5% and -5%) in 23 countries, while decreasing in four countries. That’s a big deal, especially given Starlink had median download speeds greater than 100 Mbps in 14 countries, and greater than 90 Mbps in 20 countries, and greater than 80 in 24 countries — with only three countries failing to reach 70 Mbps.

While trailing Starlink speeds, Skylogic recorded median download speeds in Italy at 29.21 Mbps during Q2 2023, a roughly 27% statistical increase year-over-year from 22.28 Mbps during Q2 2022. Notably, Skylogic recorded a median download speed of 68.44 Mbps in Italy during Q1 2023. Among the various countries we recorded Skylogic data for during the past year, the range of median download speeds varied between 19.53 Mbps and 68.44 Mbps, with most speeds between 28 and 50 Mbps, all fast enough to stream 4K video online. Viasat, had relatively similar download speeds in Germany and Italy at 17.22 Mbps and 17.45 Mbps, respectively, during Q2 2023. 

Top 10 fastest Starlink download speeds in European countries

Chart of Top 10 Fastest Starlink Median Download Speeds in Europe

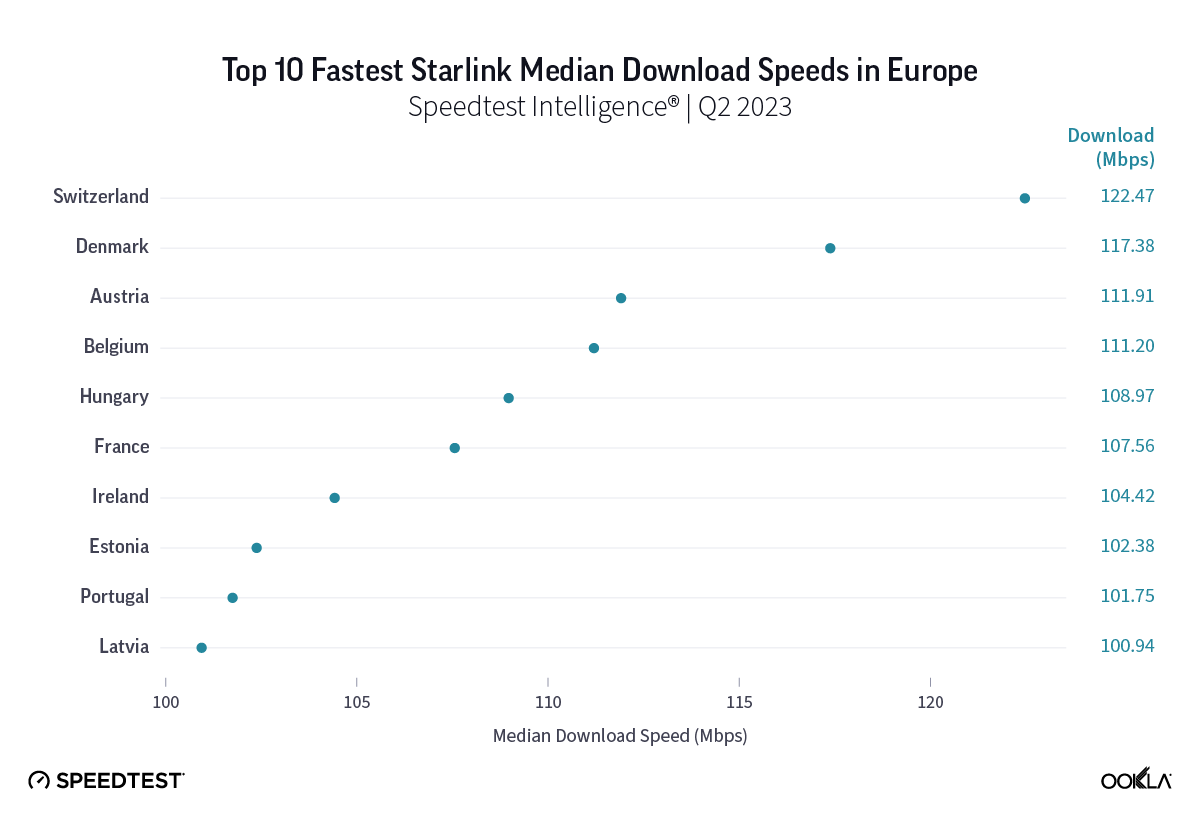
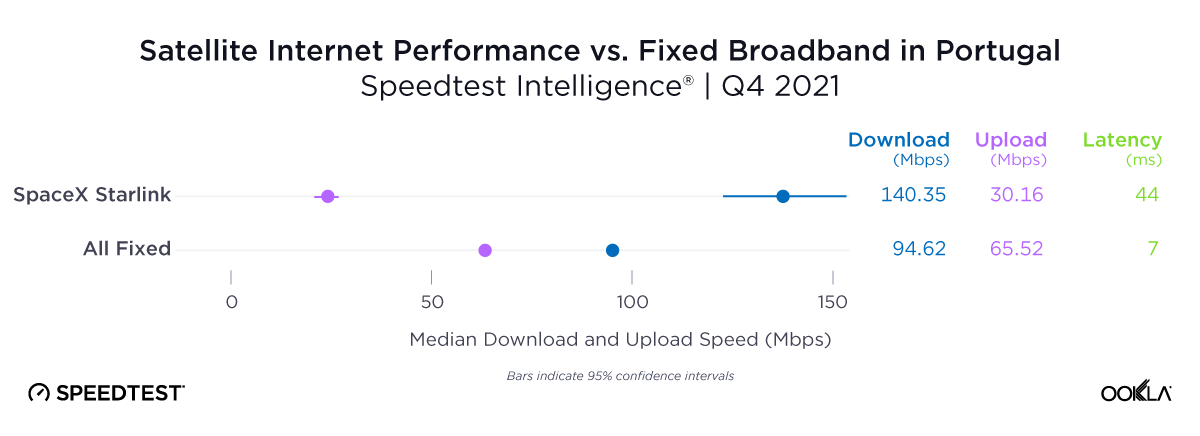
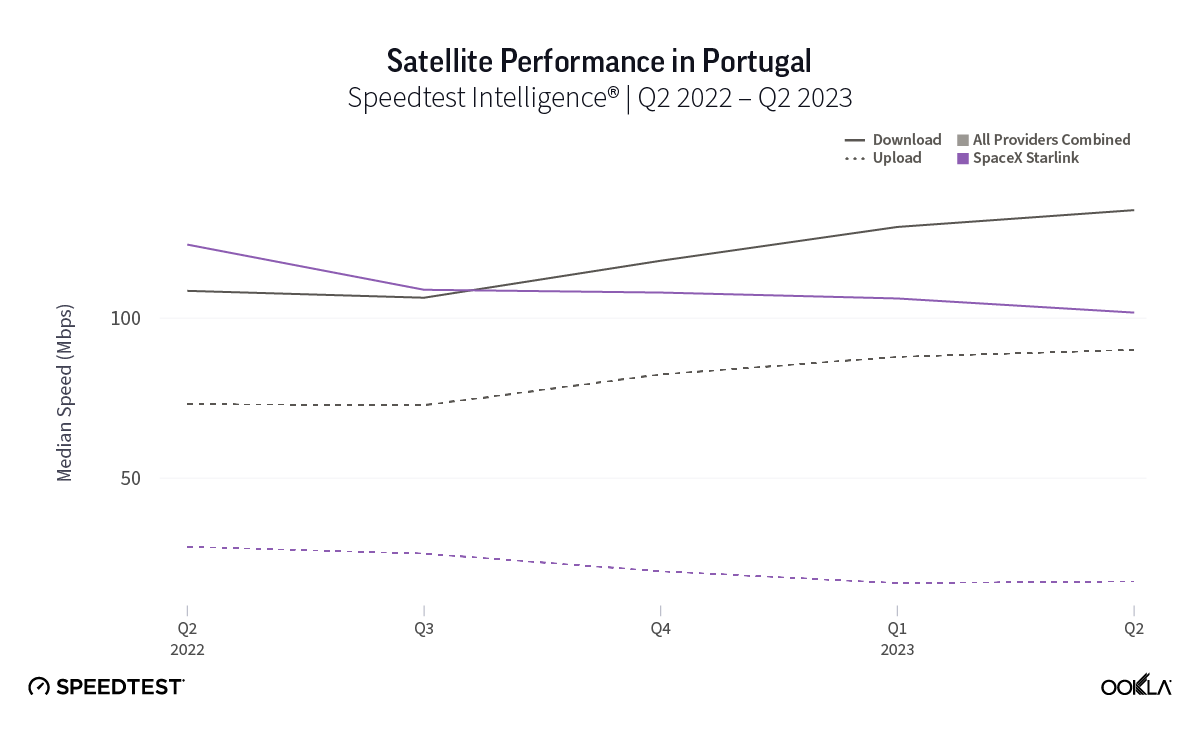
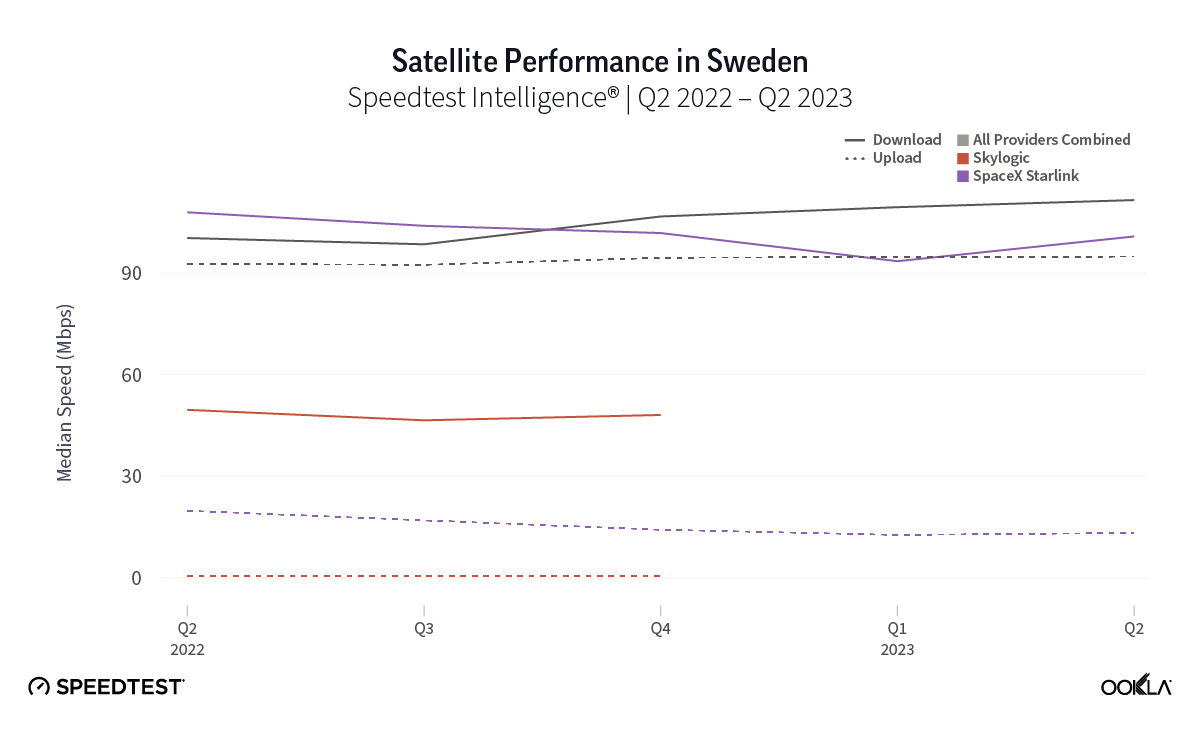
Starlink in Switzerland had one of the fastest median download speed among countries with Starlink during Q2 2023 at 122.47 Mbps, followed by Denmark (117.38 Mbps), Austria (111.91 Mbps), Belgium (111.20 Mbps), Hungary (108.97 Mbps), France (107.56 Mbps), Ireland (104.42 Mbps), Estonia (102.38 Mbps), Portugal (101.75 Mbps), and Latvia (100.94 Mbps). Sweden, Italy, Bulgaria, and the U.K. all followed but had speeds greater than 100 Mbps.

Upload speeds for Starlink are down year over year, but quarterly speeds almost all improved or were about the same

Upload speeds for Starlink mostly decreased notably year over year, with only the U.K. showing an improved median upload speed in Q2 2023 out of 27 countries surveyed. However, looking quarter to quarter, Q2 2023 upload speeds for Starlink stayed about the same or improved in 25 out of 27 countries, with only Greece and Ireland showing declines. For upload speeds, Starlink all 27 countries we surveyed had upload speeds between 10 Mbps and 15 Mbps except Portugal (17.70 Mbps), Hungary (16.91 Mbps), Croatia (16.12 Mbps), Bulgaria (15.93 Mbps), Romania (15.82 Mbps), Spain (15.79 Mbps), and Poland (9.11 Mbps). Starlink in Greece was the only instance of a satellite provider in Europe having an upload speed greater than the aggregate of all fixed providers combined, 12.97 Mbps for Starlink to 7.85 Mbps for the aggregate of fixed broadband providers combined. Skylogic showed upload speeds lower than 4 Mbps in both Austria and Italy during Q2 2023. Viasat had upload speeds of 3.51 Mbps in Germany and 4.69 Mbps in Italy during Q2 2023. 

Multi-server latency is stabilizing for Starlink users across Europe

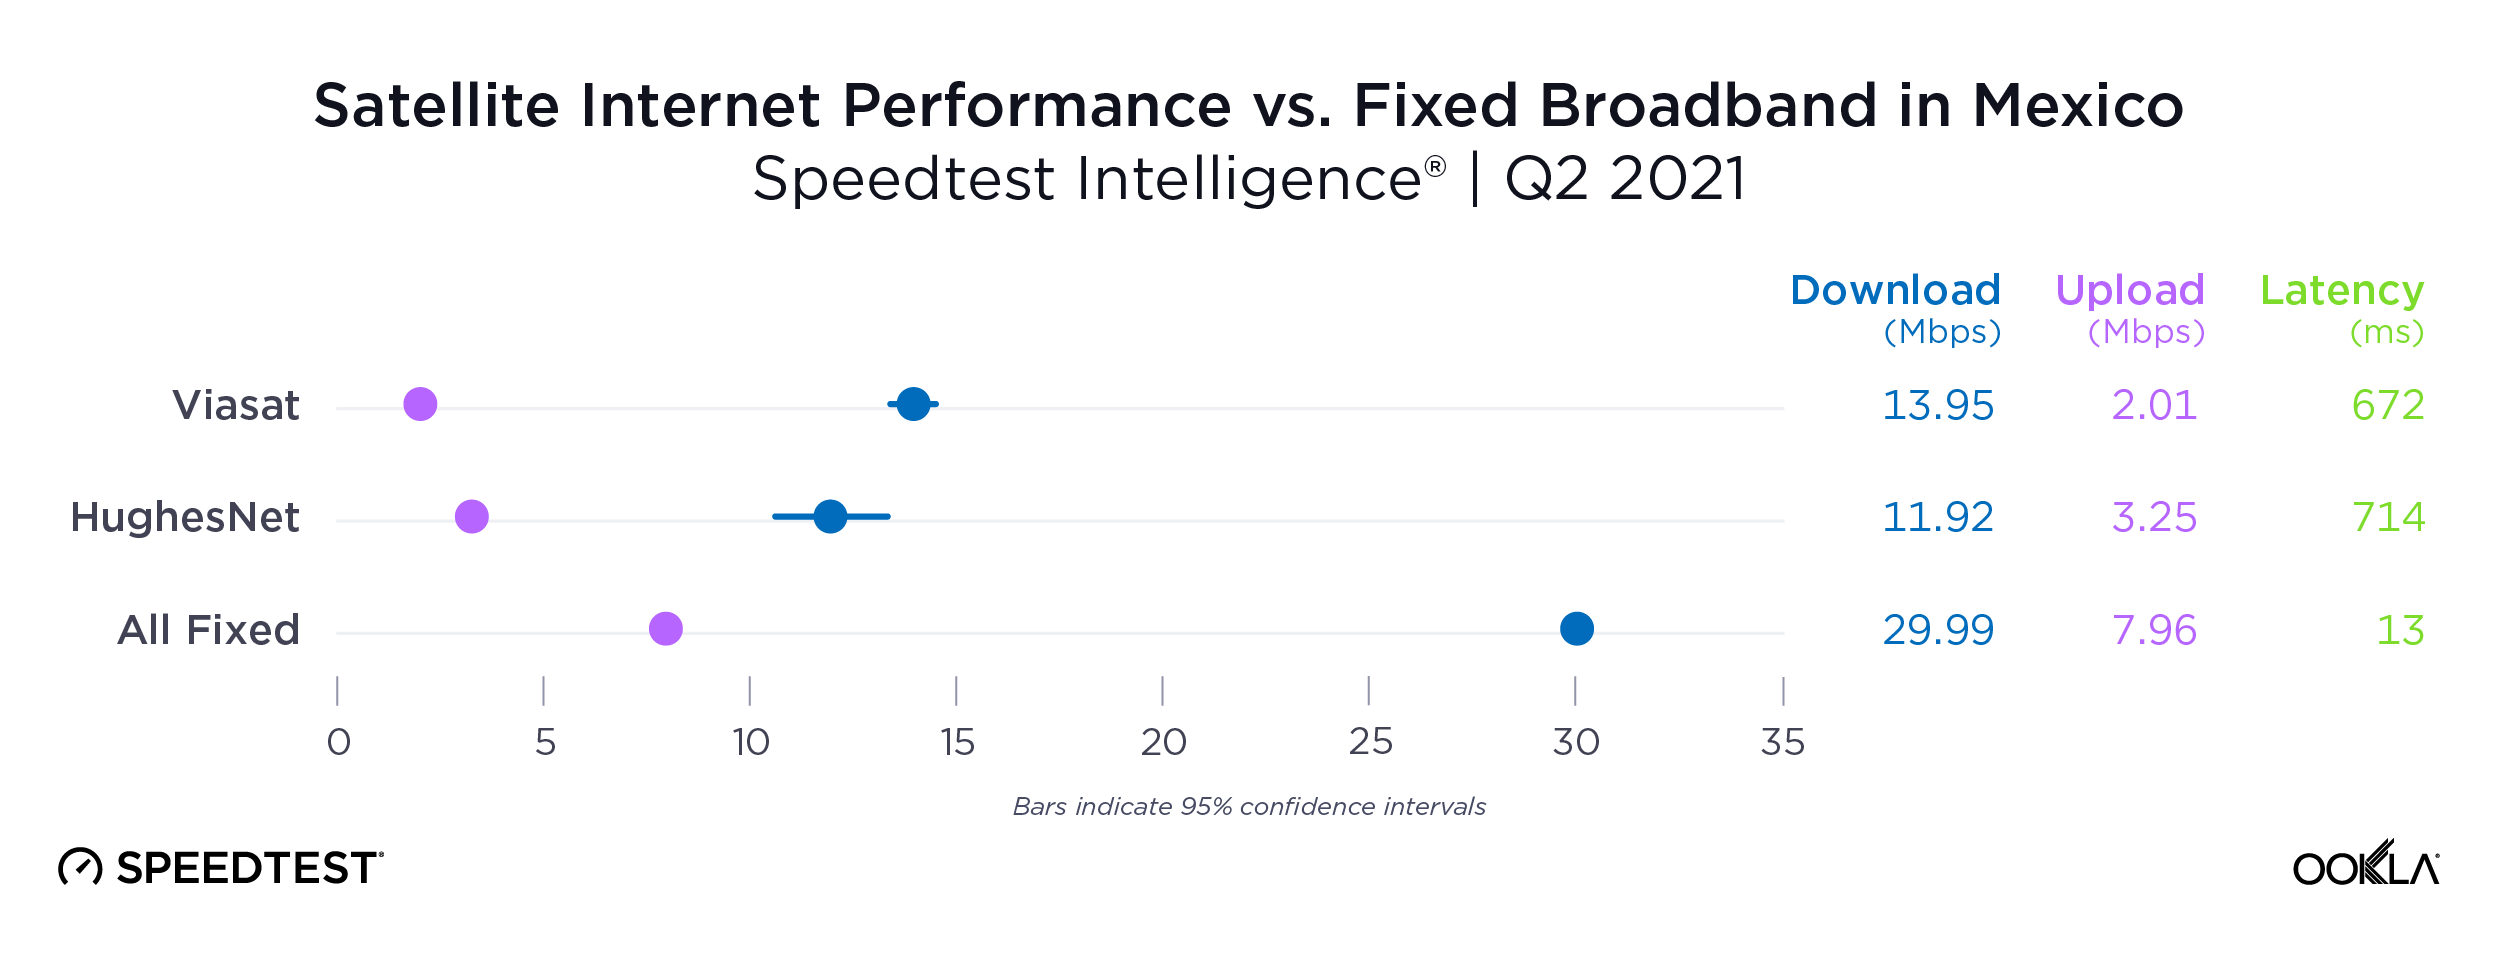
As an low-earth orbiting (LEO) satellite internet provider, Starlink has a leg up on some satellite competitors who rely on further away geosynchronous-earth orbit (GEO) and medium-earth orbit (MEO) satellite constellations. However, once again, all the aggregates of all fixed broadband providers in Europe had much lower multi-server latencies than Starlink, Viasat (which had latencies over 600 ms) and Skylogic (which had latencies over 700 ms). That being said, Starlink still saw multi-server latencies under 60 ms in the U.K. (51.26 ms), Spain (53.37 ms), Portugal (55.84 ms), and Belgium (59.34 ms). Starlink saw most countries’ multi-server latencies between 60 and 90 ms.

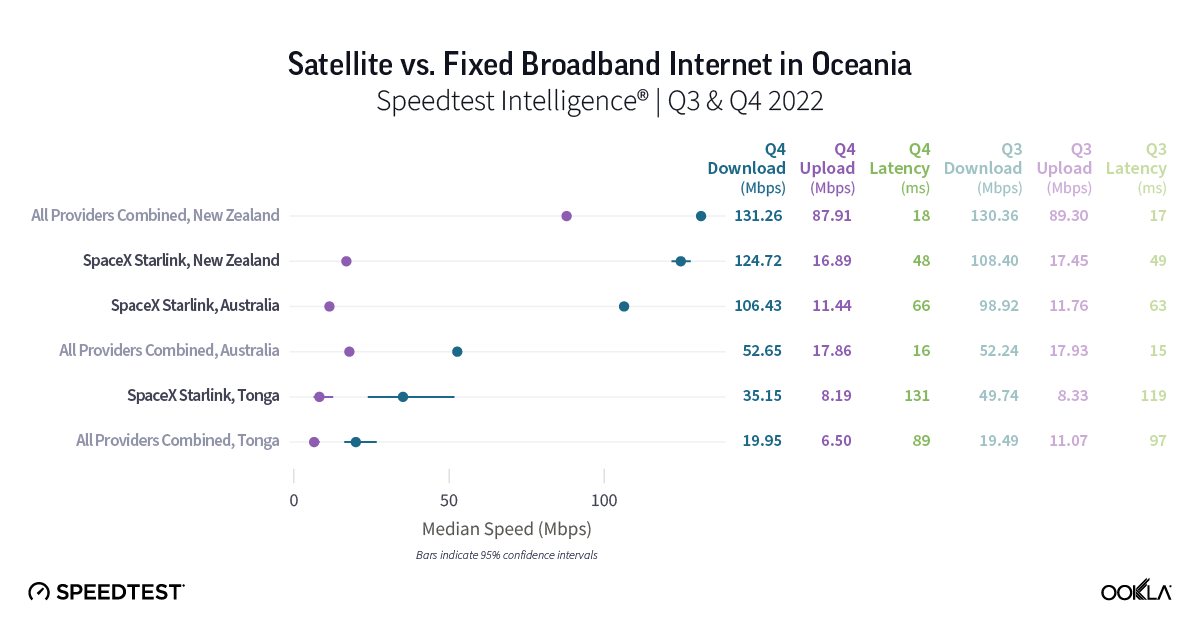
Starlink speeds stabilize in Oceania

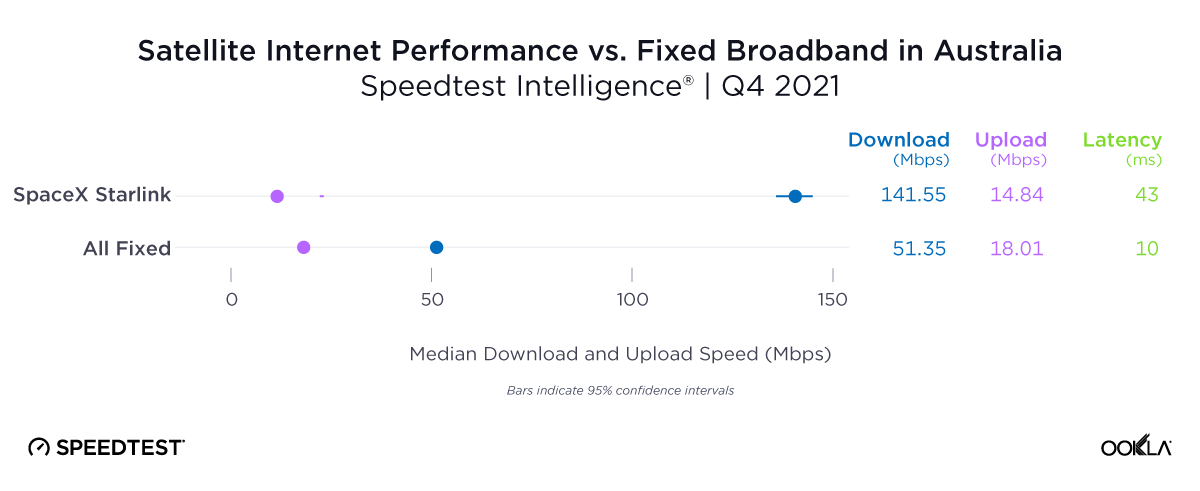
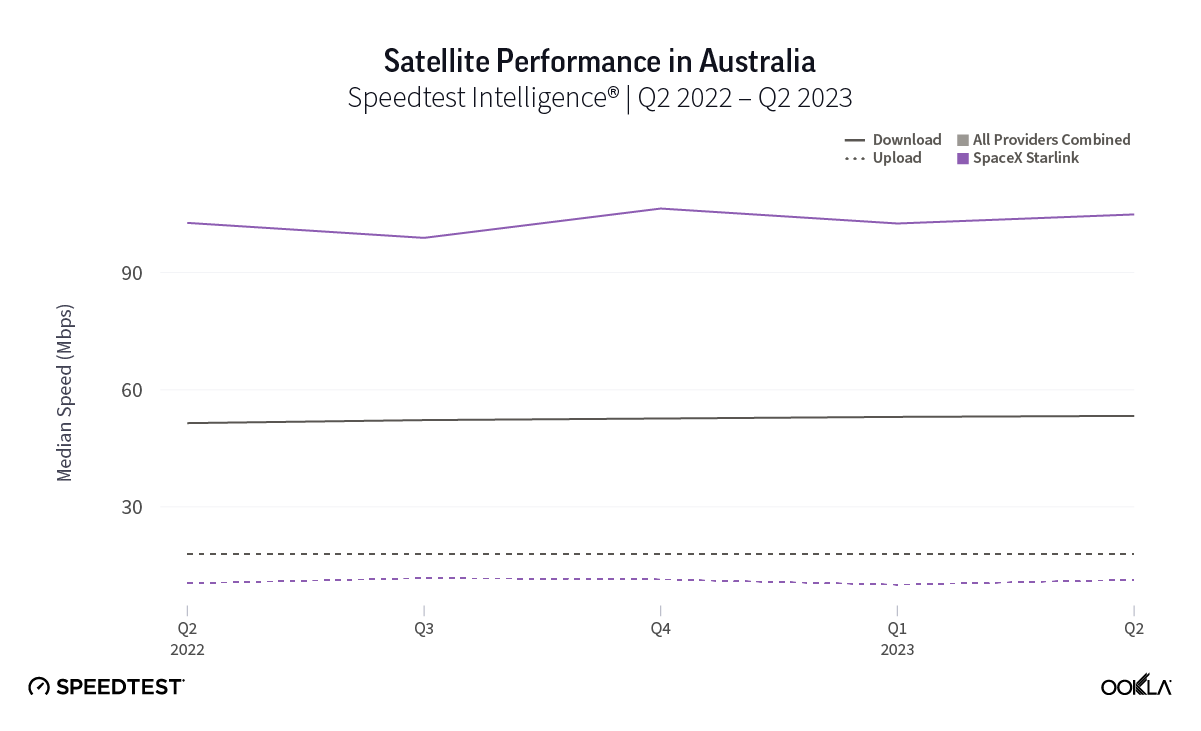
Oceania, the second least densely populated continent in the world to Antarctica, has rural and remote populations that benefit from (and even rely on) satellite internet connections. Luckily for rural and remote Starlink users, they’ve probably seen a good amount of stability over the past year with Q2 2023 median download speeds in New Zealand at 113.78 Mbps (105.99 Mbps in Q2 2022) and Australia at 104.92 Mbps (102.76 Mbps in Q2 2022). Tonga, which is very remote, saw download speeds drop from 45.25 Mbps in Q2 2022 to 37.95 Mbps in Q2 2023. 

Upload speeds also showed some stability with Australia going from 10.45 Mbps in Q2 2022 to 11.33 Mbps during Q2 2023 and New Zealand going from 12.31 Mbps to 14.62 during the same time period. Tonga saw a notable drop in speeds year over year from 19.26 Mbps in Q2 2022 to 6.66 Mbps Q2 2023. 

Multi-server latency, which usually will be higher for satellite internet options, showed promising results for Starlink in Oceania during Q2 2023. Multi-server latency dropped noticeably in New Zealand year over year, going from 89.38 ms in Q2 2022 to 46.42 ms in Q2 2023. Australia saw a more modest drop with multi-server latency going from 63.04 ms to 59.78 ms from Q2 2022 to Q2 2023. Tonga saw an increase in multi-server latency from 125.24 ms to 137.16 ms during the same time period.

Starlink in Africa is off to a promising start

Chart of Satellite Performance in Africa, Q2 2023

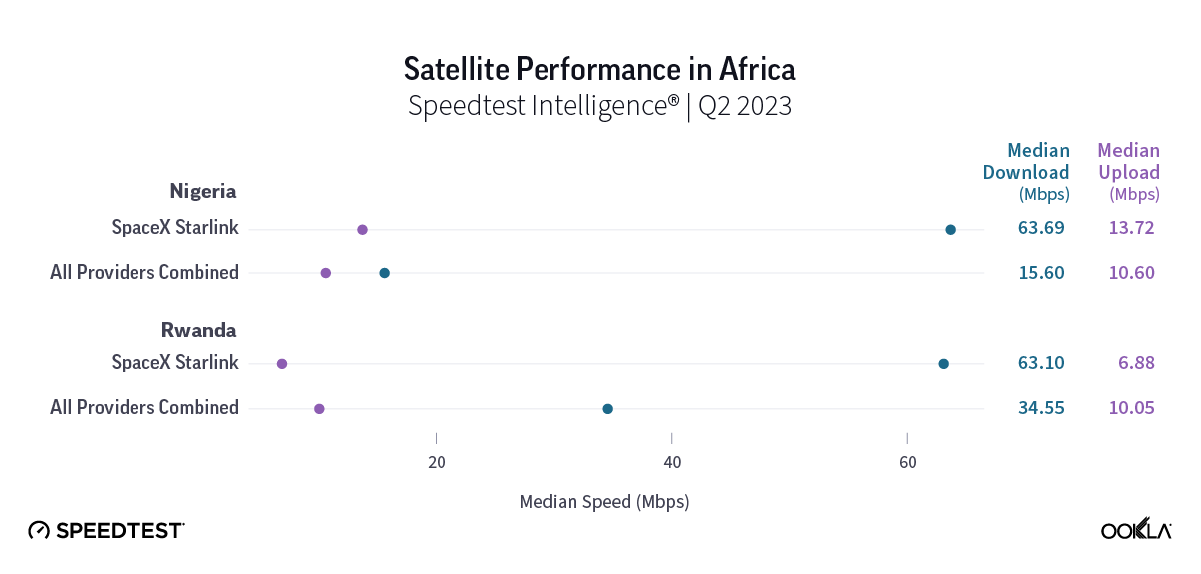
Starlink, which first launched on the African continent in Nigeria this past January, is showing intriguing early results. Speedtest Intelligence showed that Starlink in Nigeria had a faster median download speeds than all aggregate fixed broadband providers combined at 63.69 Mbps to 15.60 Mbps during Q2 2023. Upload speeds were more similar during the same time period with Starlink at 13.72 Mbps and the aggregate of all fixed broadband providers combined at 10.60 Mbps. Starlink did have a marginally higher multi-server latency at 55.88 ms to 50.26 ms during Q2 2023.

In Rwanda, median download speeds were a little closer with Starlink recording a median download speed at 63.10 Mbps in Q2 2023 compared to the aggregate of all fixed broadband providers combined at 34.55 Mbps. Starlink trailed behind for median upload speed at 6.88 Mbps to 10.05 Mbps for fixed broadband providers during Q2 2023. Multi-server latency for Starlink was much higher at 320.45 ms to 29.04 ms for fixed broadband providers during the same time period.

The 2023 space revolution is off to a huge start

Here are some major updates about what’s next for various different satellite competitors:

After delays, Amazon’s Project Kuiper aim to launch prototype satellites this fall

Facing a series of rocket-related delays, Amazon recently announced it could send its first two Project Kuiper prototypes into orbit in late September. That news follows a recently announced $120 million 100,000-square-foot satellite processing facility at NASA’s Kennedy Space Center in Florida. Planning on offering internet service in 2025, Amazon is slated to have half of its 3,236 LEO satellite constellation in space by 2026.

China’s grand ambitions to provide internet connectivity to over 362 million people

According to the Wall Street Journal, over 362 million people in China don’t have access to the internet — which is about 1 in every 4 people in China, a large portion of which live in rural or remote communities. In order to overcome that connectivity gap, China is looking to the sky to create its own satellite constellation with potentially over 12,000 satellites. China’s biggest gap seems to be with recreating the success of SpaceX’s reusable rockets — however, initial tests are far underway and a host of reusable rockets are slated for test launches in 2024. 

SpaceX’s Starlink service offerings are about to rapidly expand

While Starlink continues to lead among satellite providers in most areas of the world, their expansion is only starting. Looking at the Starlink availability map, Starlink has an incredibly busy rest of 2023 and 2024 in Africa, Asia, and South America — and they’re marking their intent to expand into most of the world. That comes as Starlink marked launching over 5,000 satellites into space at the end of August. With some wiley entrepreneurs already renting out their Starlink “Dishy McFlatfaces” to vacationers and campers for $25-30 dollars a day, satellite connectivity is truly becoming a full-time gig.

Viasat’s bad luck might affect entire industry

Viasat launched the first of its three long-awaited Viasat-3 arrays — but then their first satellite suffered an antenna anomaly, which prevented a large reflector to deploy that affects whether or not the satellite can operate as intended. While Viasat is rushing to solve the issue, this could ultimately trigger a $420 million insure claim for the loss of the $700 million satellite. With such a high-value loss, this could send ripples through the satellite industry, causing insurance premiums to skyrocket for companies looking to mitigate potential losses through insurance. All of this comes on the heels of acquiring Inmarsat in May for $7.3 billion to expand its satellite arrays and spectrum holdings. We’ll be watching to see whether or not Viasat can find a solution. 

Eutelsat and OneWeb merger imminent, big moves abound

The Eutelsat and OneWeb merger should make competitors take notice — combining satellite networks, expanding enterprise offerings, and competing in emerging markets has big revenue potential — with OneWeb having an already established LEO network of 630 satellites and Eutelsat offering 36 GEO satellites. Of note, OneWeb recently inked a deal with Telstra in Australia to provide satellite backhaul for locations “where satellite backhaul is a preferred or only viable option.” OneWeb is also partnering with the European Space Agency to develop a next-gen 5G beam-hopping satellite, which could quickly increase connectivity for people traveling or for disaster areas that need emergency connectivity. Shareholders are set to vote on approving the merger on Sept. 28.

European Union greenlights multi-orbit constellation

With grand ambitions to launch a multi-orbit, €6 billion constellation in 2024, the European Union is partnering with a consortium of industry players including Airbus, SES, Eutelsat, Hispasat, and Thales to develop the EU’s IRIS² project. The EU still expects to have the first of its satellites go live by the end of 2024 and have a fully operational constellation by 2027.

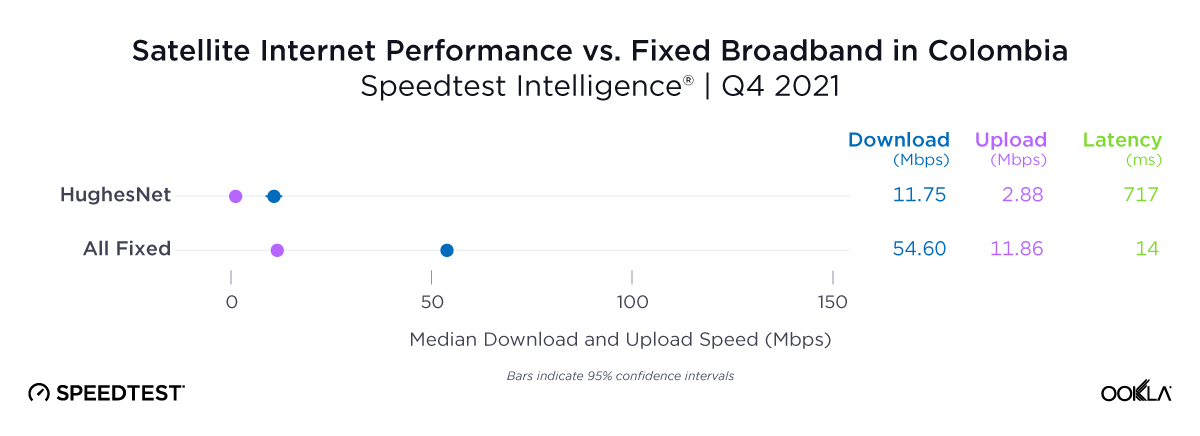
HughesNet aiming to launch Jupiter 3 array in Q2 2023

HughesNet successfully launched its Jupiter 3 array on July 29, which aims to provide U.S. and Latin America consumers with higher broadband download speeds. While the actual satellite will take some time to reach its geosynchronous orbit and deploy, this satellite adds 500 Gbps of Ka-band capacity for HughesNet, which could see consumers reaching download speeds between 50 Mbps and 100 Mbps. We’ll be eagerly awaiting Speedtest® results from HughesNet’s Jupiter 3 array.

Ookla will continue monitoring new satellite internet developments

2023 continues to be an important year for satellite internet providers. Satellite connectivity is something we’ll be watching closely and we’ll continue our series next quarter with Q3 2023 data from select continents including North America. In the meantime, be sure to download the Speedtest app for Windows and Mac computers or for iOS or Android for devices and see how your satellite internet stacks up to our results.

Ookla retains ownership of this article including all of the intellectual property rights, data, content graphs and analysis. This article may not be quoted, reproduced, distributed or published for any commercial purpose without prior consent. Members of the press and others using the findings in this article for non-commercial purposes are welcome to publicly share and link to report information with attribution to Ookla.