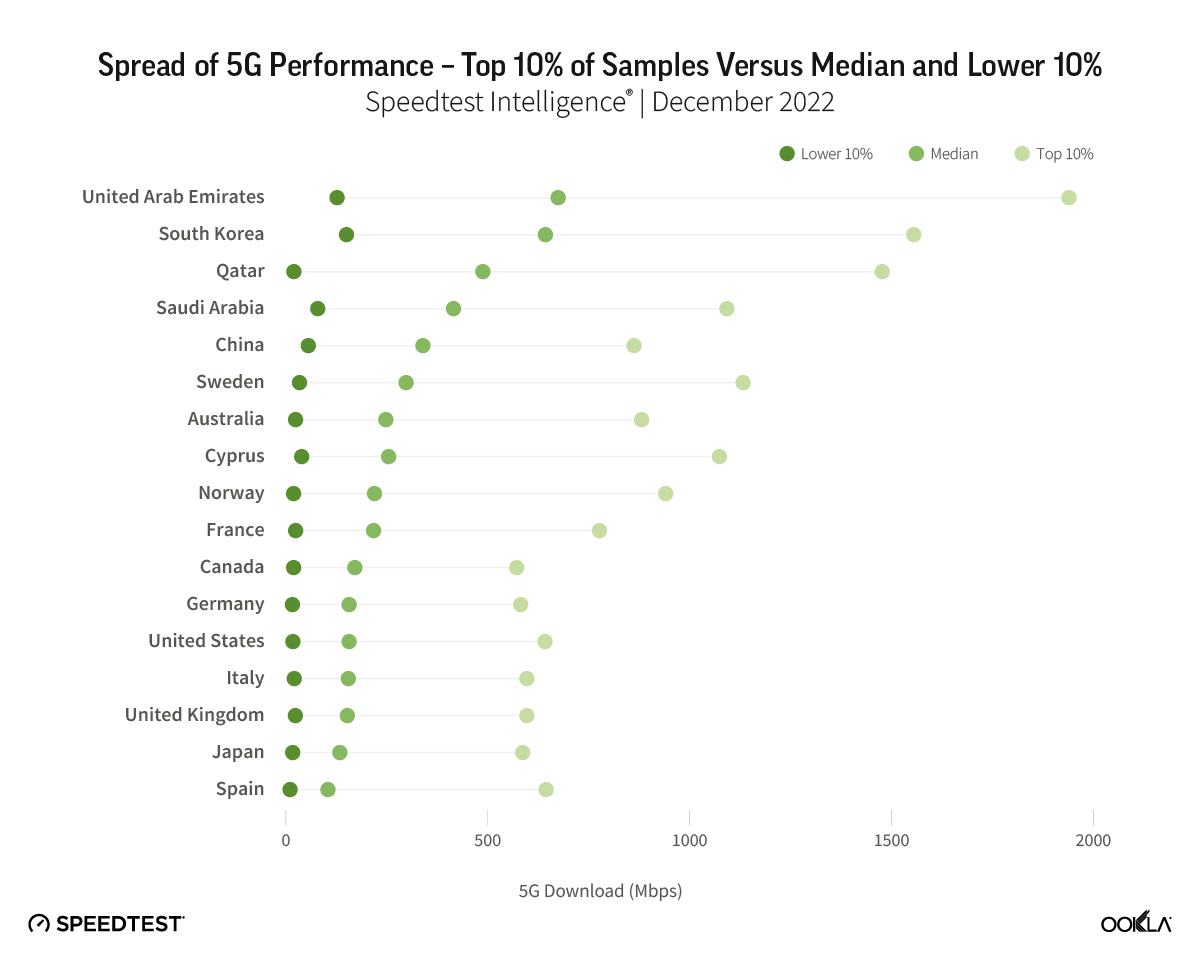
In-market 5G performance varies widely. Reviewing the top 10% and worst 10% of Ookla® Speedtest Intelligence® samples reveals significant variance in the consumer experience on today’s 5G networks, with 5G speeds peaking at over 1 Gbps for the top 10% of users in the U.A.E on average, but falling to below 20 Mbps for the lower 10% in Norway, the U.S., Japan, Germany, and Spain.
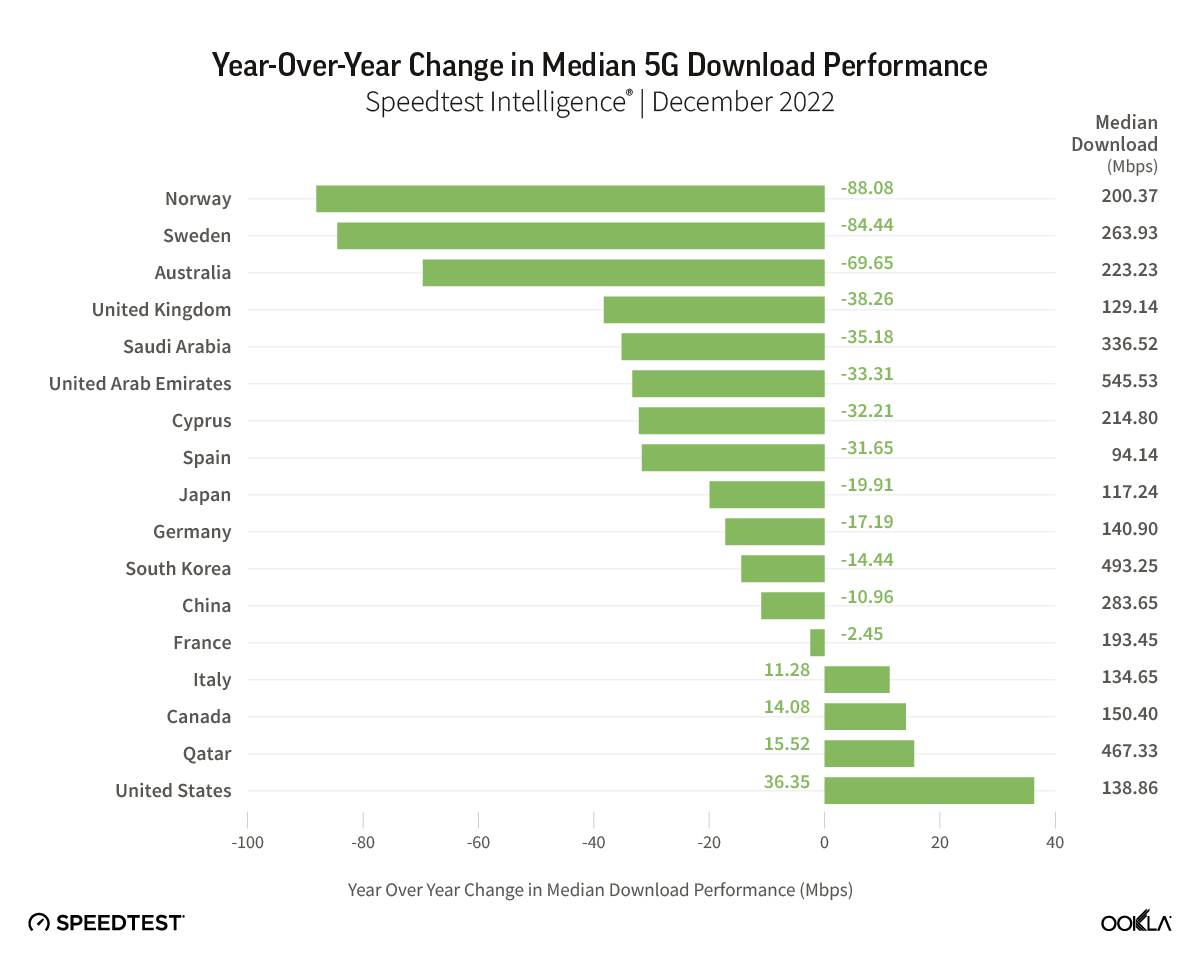
Median 5G performance is declining in many early launch 5G markets. While understandable as 5G adoption grows and users in more remote locations access 5G, declining median download speeds also point to investment and deployment challenges in some markets. At the same time, many of these markets are facing economic headwinds, placing more emphasis than ever on cost control. As a result, operators must carefully balance network investment priorities.
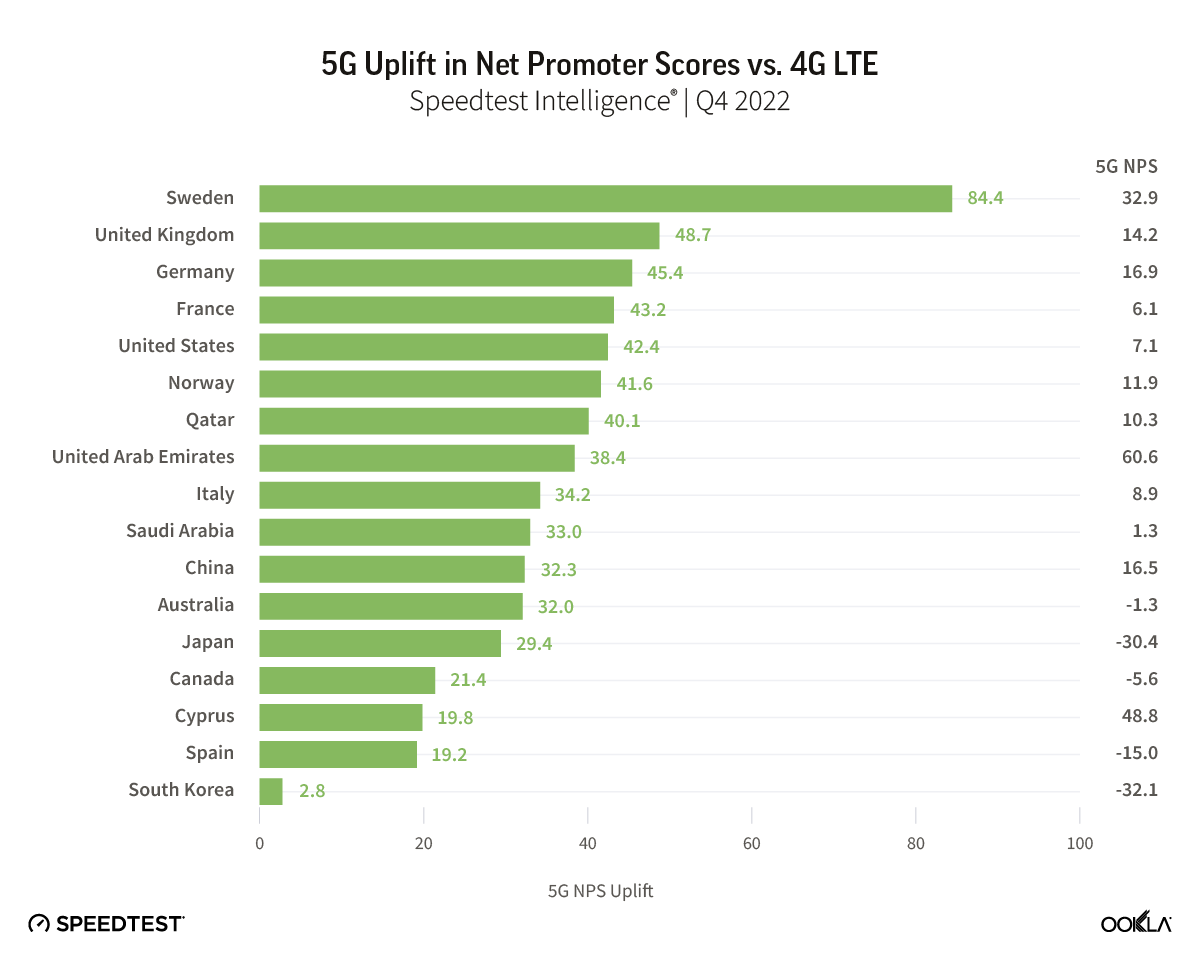
5G Net Promoter Scores (NPS) significantly higher than 4G LTE in most markets, but waning. With the exception of Sweden and Qatar, all the early launch 5G markets in our analysis saw 5G NPS fall year-over-year. Operators’ 5G NPS still trade at a premium compared to 4G, and while performance is just one part of the equation, operators should take care to build on the positive sentiment that 5G has brought to date.
Despite impressive headline speeds, 5G performance varies a lot
Median 5G performance allows us to gauge the midpoint of user experience on 5G networks, however it doesn’t paint the full picture. While headline 5G speeds impress, Speedtest Intelligence data lays bare the ups and downs of 5G performance for consumers, even in early launch, advanced 5G markets. We recently looked at 5G network performance over high frequency (mmW) bands, painting a view of the true potential of 5G networks. However, if we look at performance on today’s 5G networks, looking beyond the median at the range of performance between users in the top 10% and those in the lower 10%, Speedtest Intelligence data reveals huge variance in the performance users experience.
The U.A.E. was the fastest 5G market in our analysis, based on median download performance of 545.53 Mbps in December 2022, followed by South Korea and Qatar. However, the top 10% of users in the U.A.E. recorded speeds of at least 1,266.49 Mbps on average, while the lowest 10% of users experienced speeds of 127.52 Mbps or slower on average. At the other end of the scale, Spain recorded a median 5G speed of 94.14 Mbps, but also demonstrated wide variance between the top 10% of samples at 537.95 Mbps or faster and the lowest 10% with 10.67 Mbps or less.
Based on many of the marketing messages around 5G, consumers are led to expect a big bang change in performance. However, with 5G operating over a greater range of spectrum bands than previous generations, including high frequency spectrum which has relatively poorer propagation, it’s understandable that 5G performance will vary more than previous generations of mobile network technology.
5G markets set to face performance challenges during 2023
While globally 5G speeds have remained stable, for many of the markets in our analysis, median 5G download speeds have fallen over the past year. The U.S. was the main outlier, recording the strongest uplift in 5G performance as T-Mobile continued to drive home its performance advantage in the market, while Verizon’s performance improved early in 2022 through its deployment of 5G in C-band spectrum. This trend is likely to continue in 2023 in the U.S., as more C-band spectrum is made available. However, the picture remains concerning for a number of other 5G markets, particularly those where median 5G speeds are at the lower end of the spectrum.
In some markets, 5G was initially priced at a premium to 4G, with operators focused on driving incremental returns on the new network technology. However, operators have been increasingly opening up 5G access by removing incremental costs for consumers and adding prepaid plans too. As 5G adoption scales, it places more strain on the new networks. The challenge for many of these markets is that network performance is likely to degrade further unless network densification picks up.
For network operators, this investment imperative is occuring amidst macroeconomic headwinds, which are driving up operating costs and putting pressure on consumer and enterprise spend. In addition, there remain challenges in deploying additional 5G cell sites in dense urban areas where demand is strongest, while in some markets EMF limits and other regulations can limit the deployment of high-capacity 5G sites.
Net Promoter Score (NPS) from Speedtest Intelligence paints a largely positive picture of current 5G networks. NPS is a key performance indicator of customer experience, categorizing users into Detractors (score 0-6), Passives (score 7-8), and Promoters (score 9-10), with the NPS representing the percentage of Promoters minus the percent of Detractors, displayed in the range from -100 to 100. Across the markets we analyzed, 5G users on average rated their network operator with NPS scores that were universally higher than those for 4G LTE users. However, consumer sentiment for users on 5G networks is beginning to shift, with NPS scores falling, coinciding with lower median 5G performance in many of the markets we analyzed.
Declining performance levels will be a factor driving NPS down for some 5G users. It’s also important to remember that as 5G scales in many of these early launch markets, the profile of 5G users is also changing from predominantly urban-based users, to more of a mix of urban, suburban, and rural users, which brings additional coverage and performance challenges for network operators. We plan to examine the relationship between 5G performance and spectrum in an up-coming content piece. Please get in touch if you’d like to learn more about Speedtest Intelligence data.
Ookla retains ownership of this article including all of the intellectual property rights, data, content graphs and analysis. This article may not be quoted, reproduced, distributed or published for any commercial purpose without prior consent. Members of the press and others using the findings in this article for non-commercial purposes are welcome to publicly share and link to report information with attribution to Ookla.
5G continues to offer new and exciting ways of rethinking everything from streaming video to performing remote surgery. However, not everyone shares equally in these possibilities as many countries do not have access to 5G and even those that do, do not experience the same level of performance from their 5G connections. We examined Speedtest Intelligence® data from Q3 2021 Speedtest® results to see how 5G speeds have changed, where download speeds are the fastest at the country and capital level, where 5G deployments have increased and what worldwide 5G Availability looked like in Q3 2021. We also looked at countries that don’t yet have 5G to understand where consumers are seeing improvements in 4G access.
5G slowed down at the global level
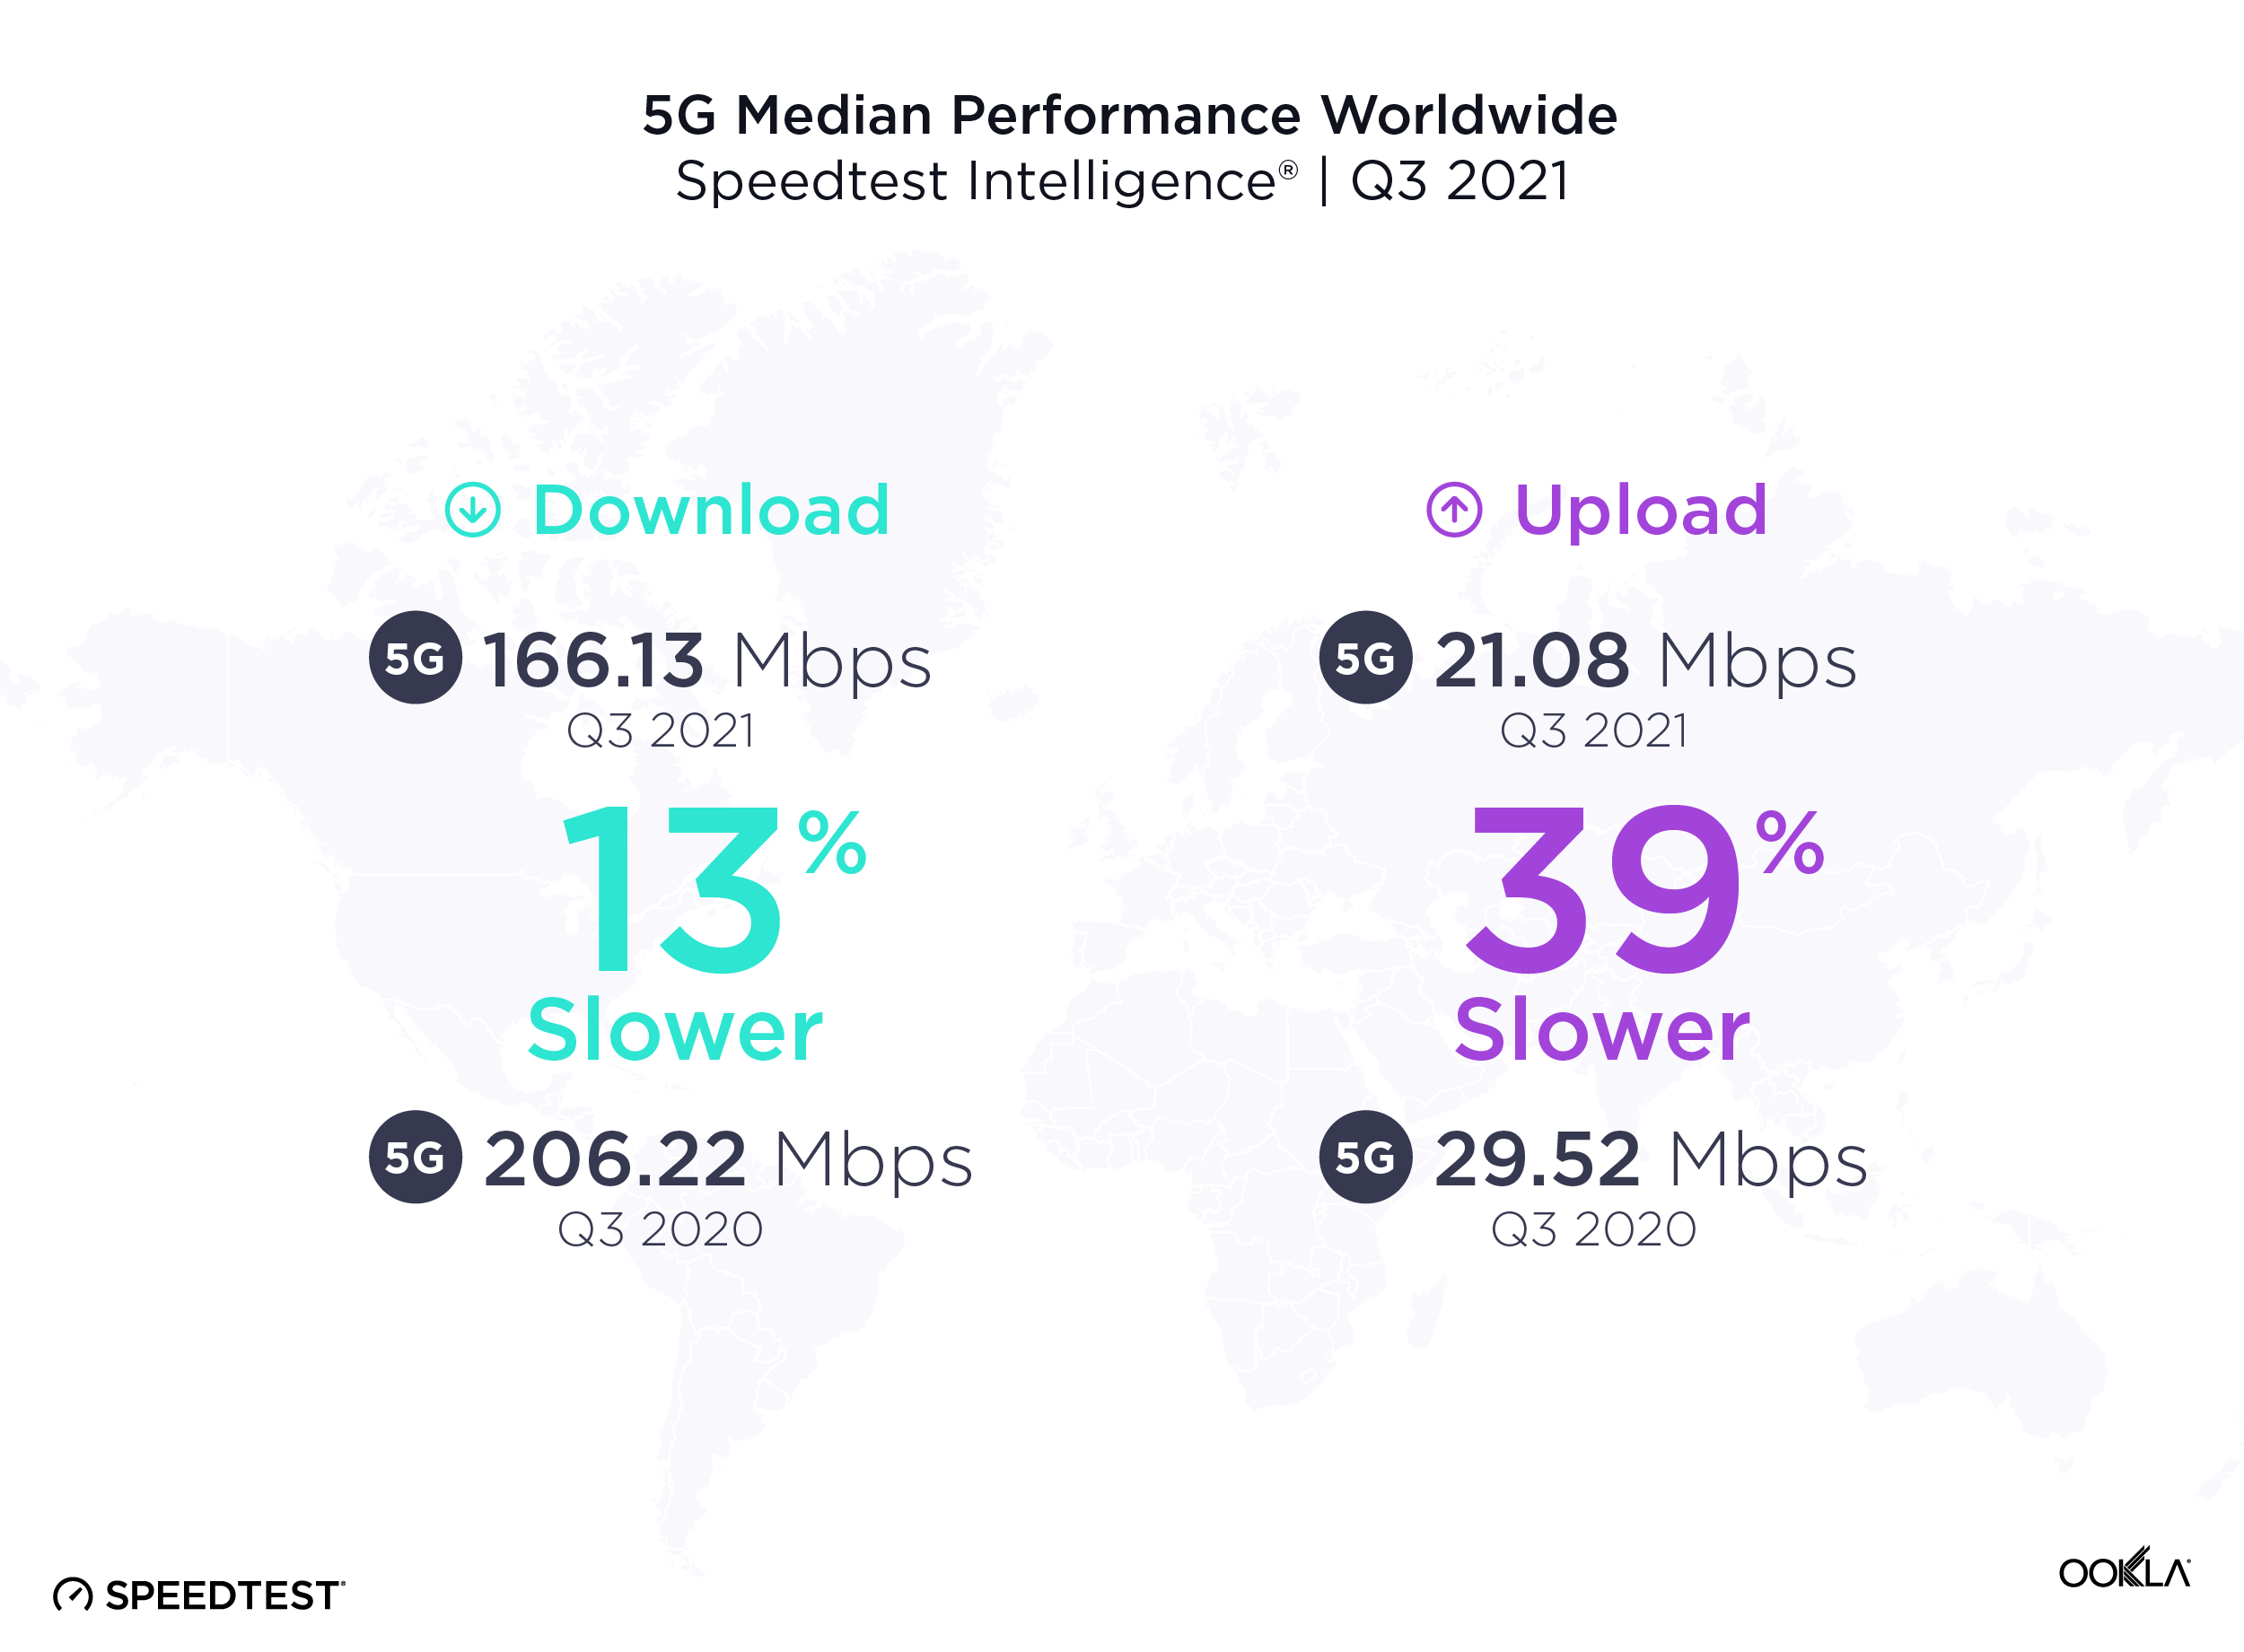
It’s common to see new mobile access technologies slow down as adoption scales, particularly early on in the tech cycle. Over the past year from Q3 2020 to Q3 2021, the median global 5G download speed fell to 166.13 Mbps, down from 206.22 Mbps in Q3 2020. Median upload speed over 5G also slowed to 21.08 Mbps (from 29.52 Mbps) during the same period.
More users are logging on to existing 5G networks, and we’re also at the stage in the evolution of 5G where countries that have historically had slower speeds are starting to offer 5G. In addition, the widespread use of dynamic spectrum sharing that has been used to boost early 5G coverage weighs on 5G download speeds. While the dip in speeds looks like a letdown, it’s more of a compromise to enable broader access. With additional spectrum and further deployments slated for 2022, we anticipate speeds will begin to pick up again.
South Korea had the fastest 5G in the world
South Korea had the fastest median download speed over 5G during Q3 2021, leading a top 10 list that included Norway, United Arab Emirates, Saudi Arabia, Qatar, Kuwait, Sweden, China, Taiwan and New Zealand. Sweden, China, Taiwan and New Zealand were new to the top 10 in 2021 while South Africa (whose 5G was brand new last year), Spain and Hungary fell out of the top 10.
5G expanded to 13 additional countries
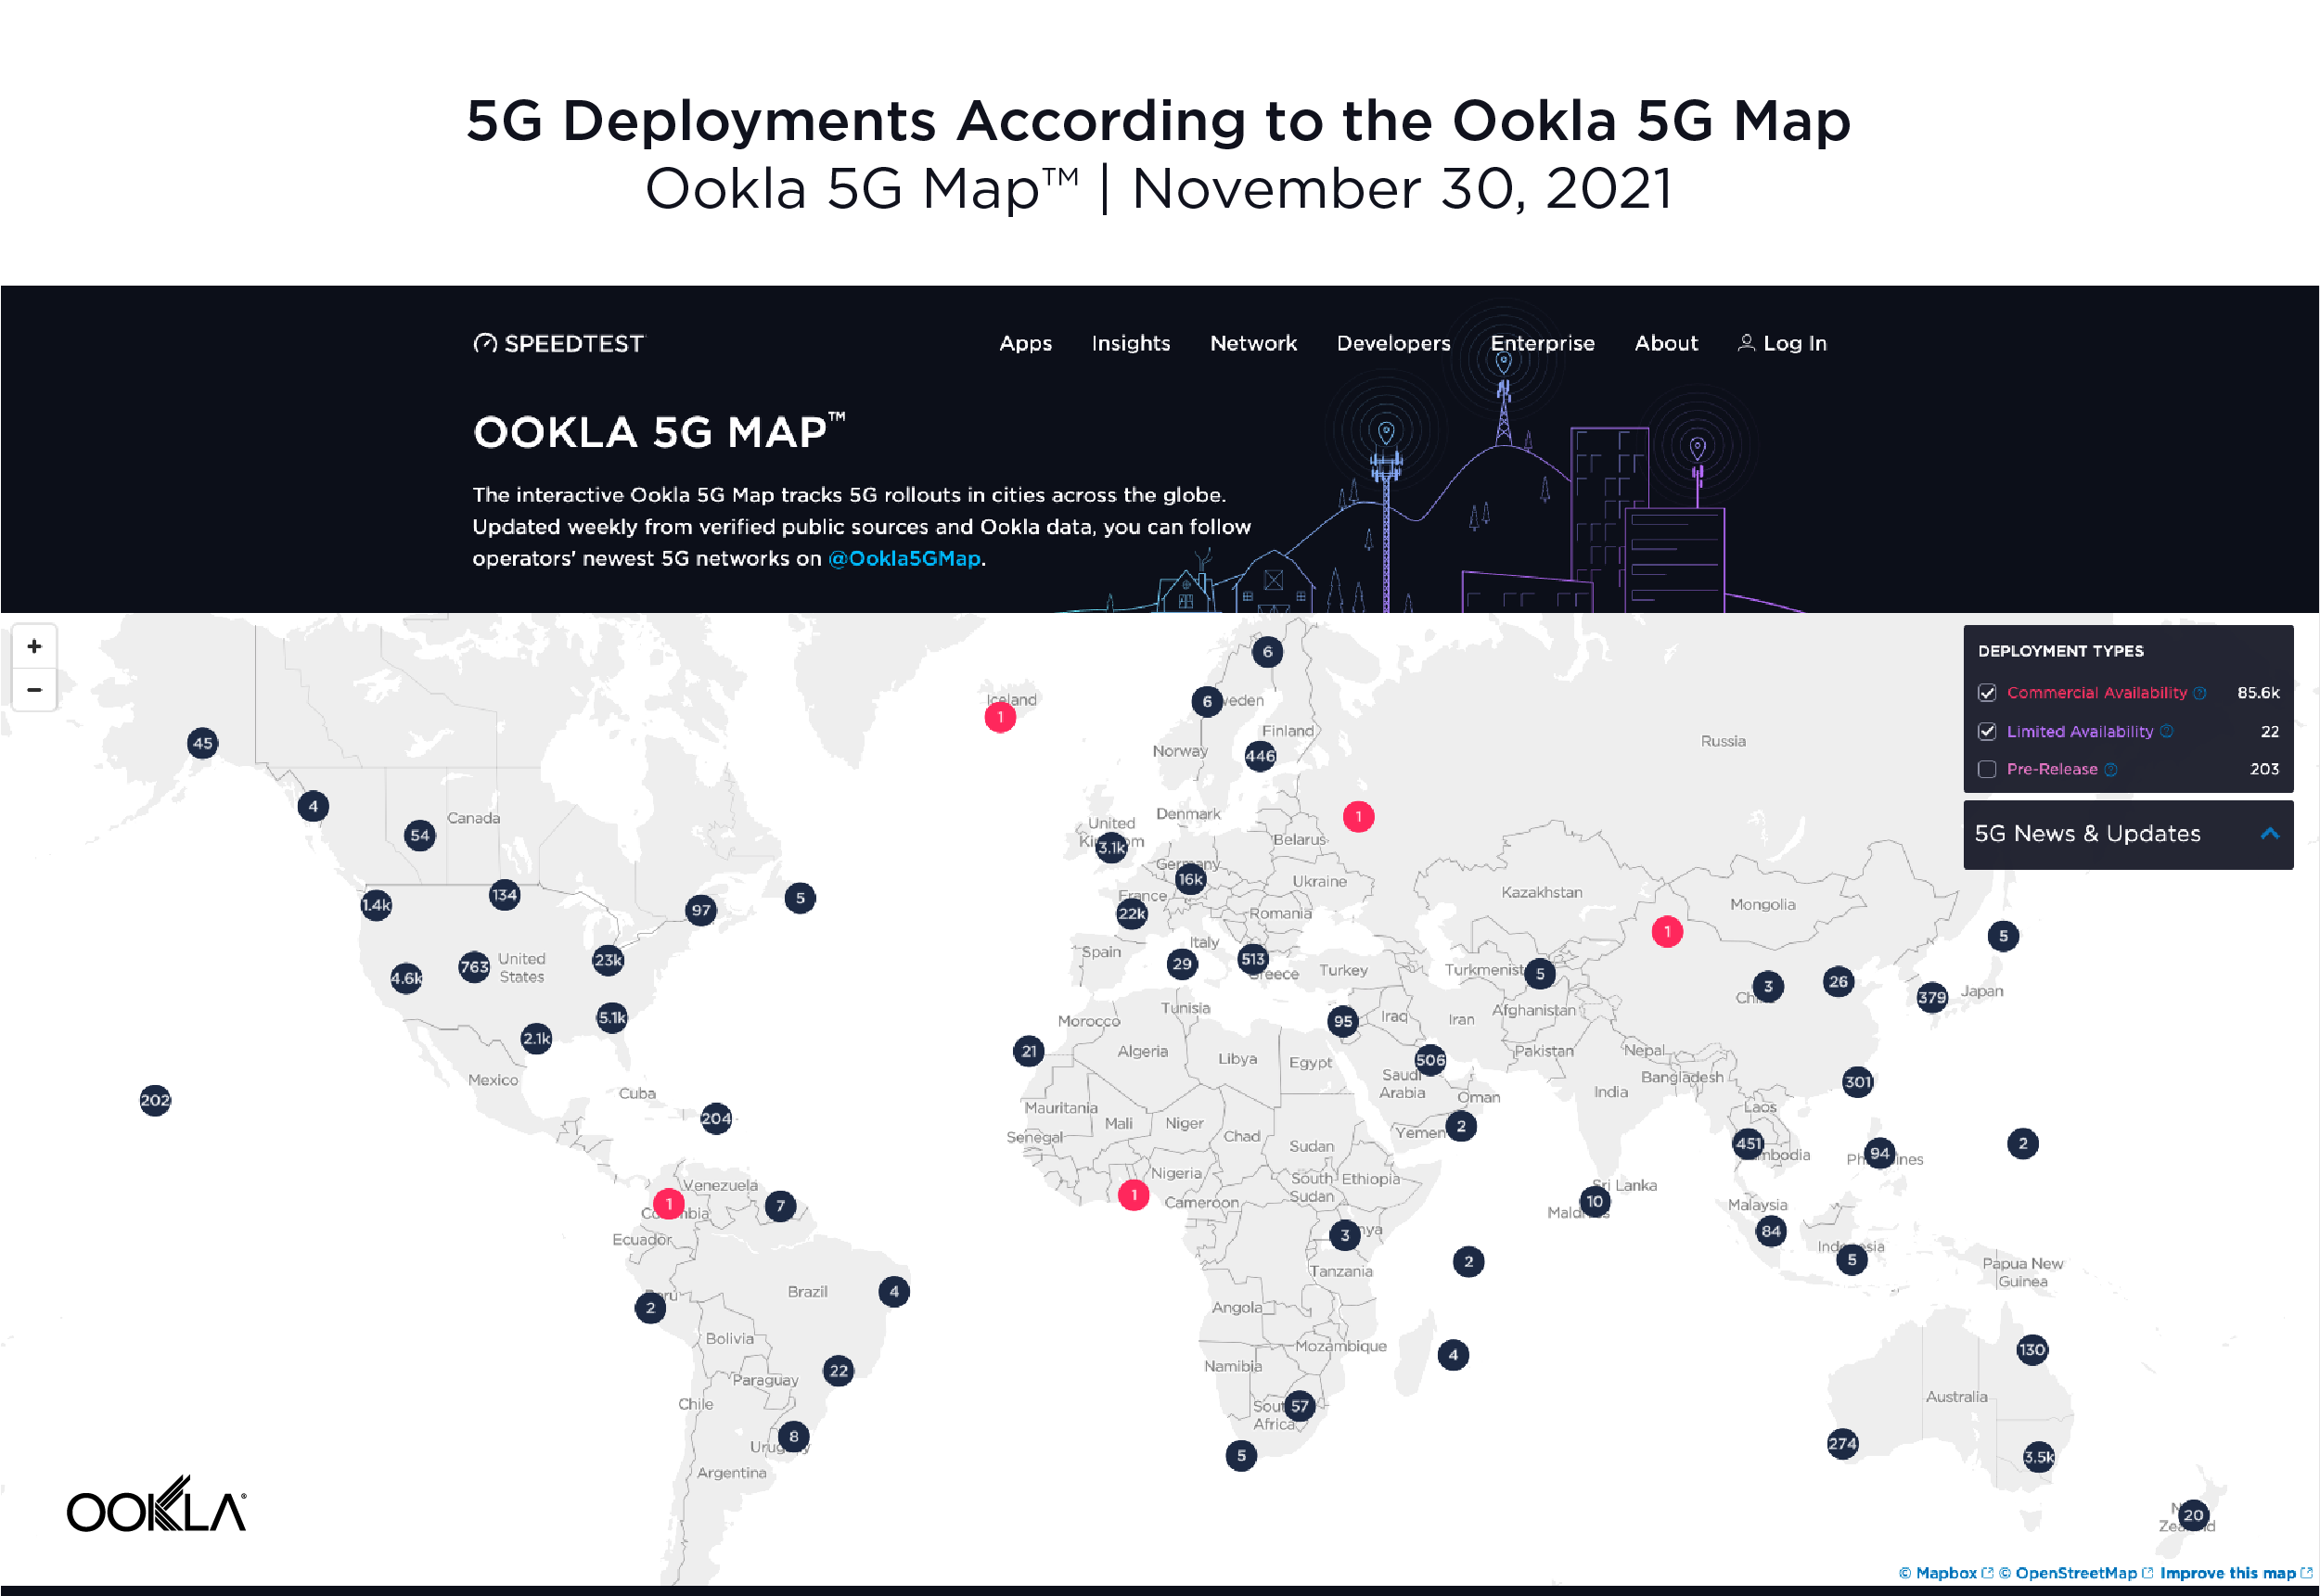
According to the Ookla® 5G Map™, there were 5G deployments in 112 countries as of November 30, 2021. That’s up from 99 countries on the same date a year ago. The total number of deployments increased dramatically during the same time period with 85,602 deployments on November 30, 2021 compared to 17,428 on November 30, 2020, highlighting the degree to which 5G networks scaled during the year. Note that there are often multiple deployments in a given city.
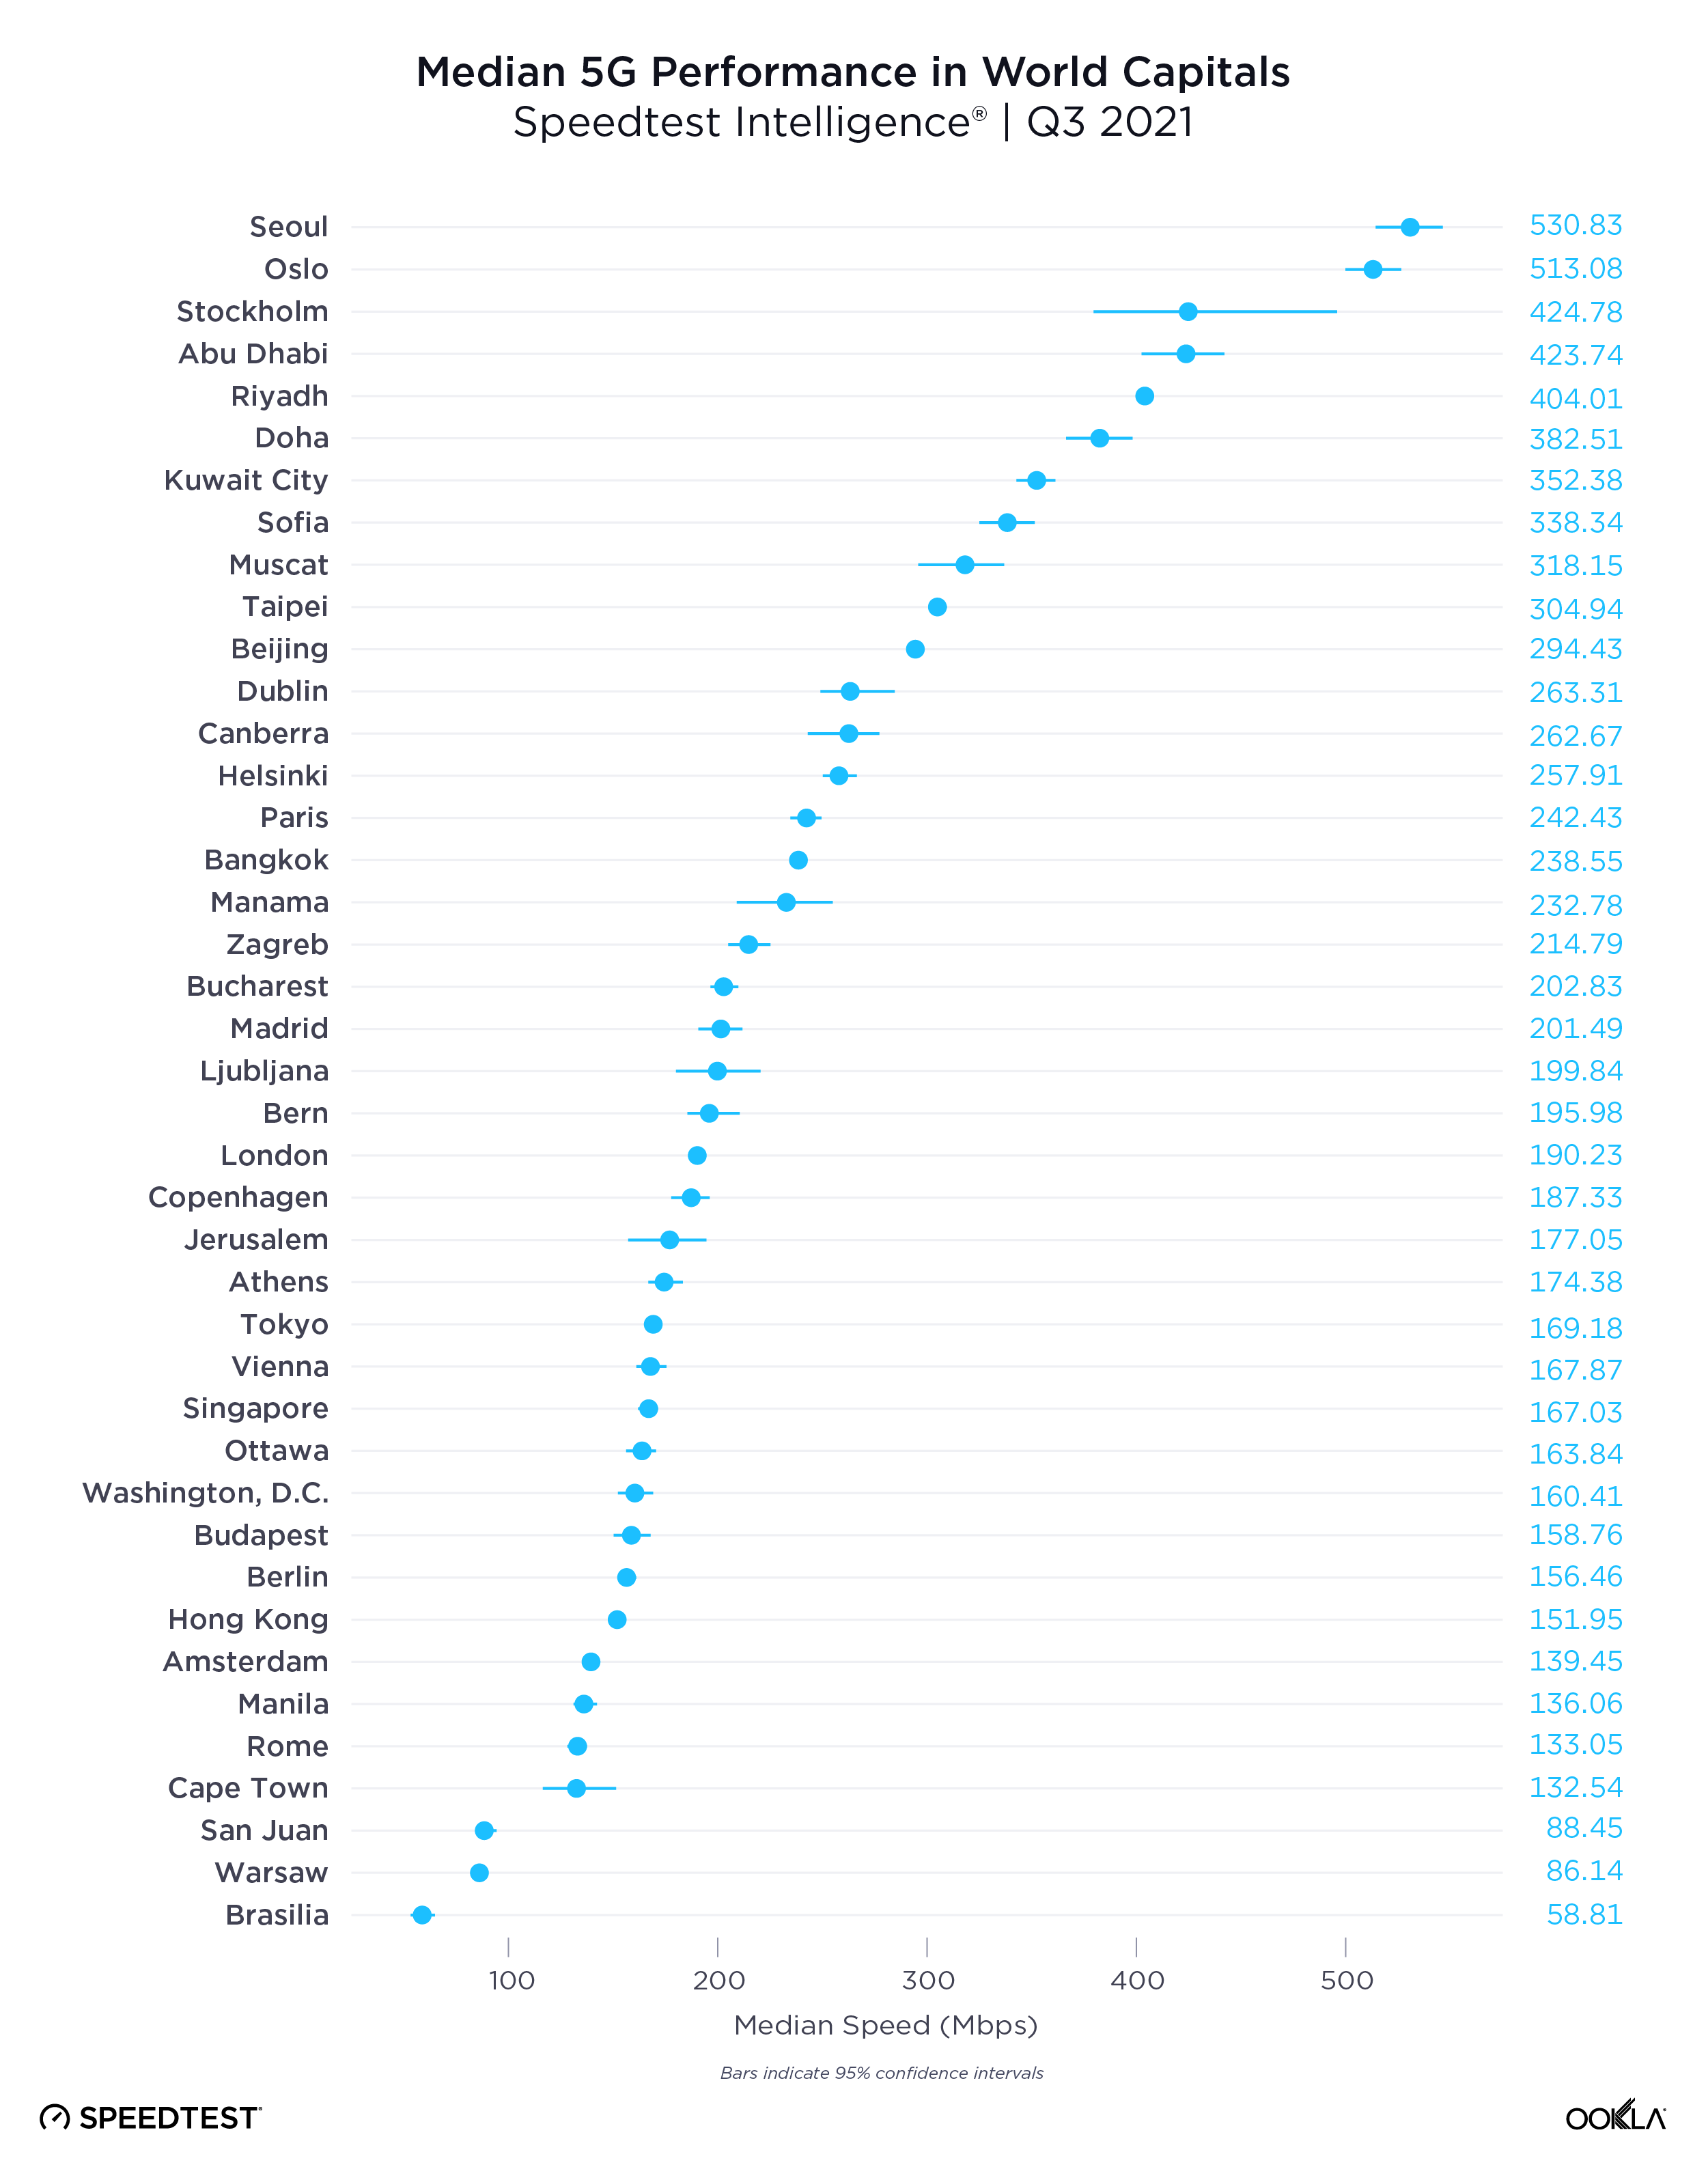
Seoul and Oslo lead world capitals for 5G
Speedtest Intelligence data from Q3 2021 shows a wide range of median 5G speeds among global capitals. Seoul, South Korea and Oslo, Norway were in the lead with 530.83 Mbps and 513.08 Mbps, respectively; Abu Dhabi, United Arab Emirates; Riyadh, Saudi Arabia and Doha Qatar followed. Brasilia, Brazil had the slowest median download speed over 5G on our list, followed by Warsaw, Poland; Cape Town, South Africa and Rome, Italy. Stockholm, Sweden and Oslo, Norway had some of the the fastest median upload speeds over 5G at 56.26 Mbps and 49.95 Mbps, respectively, while Cape Town had the slowest at 14.53 Mbps.
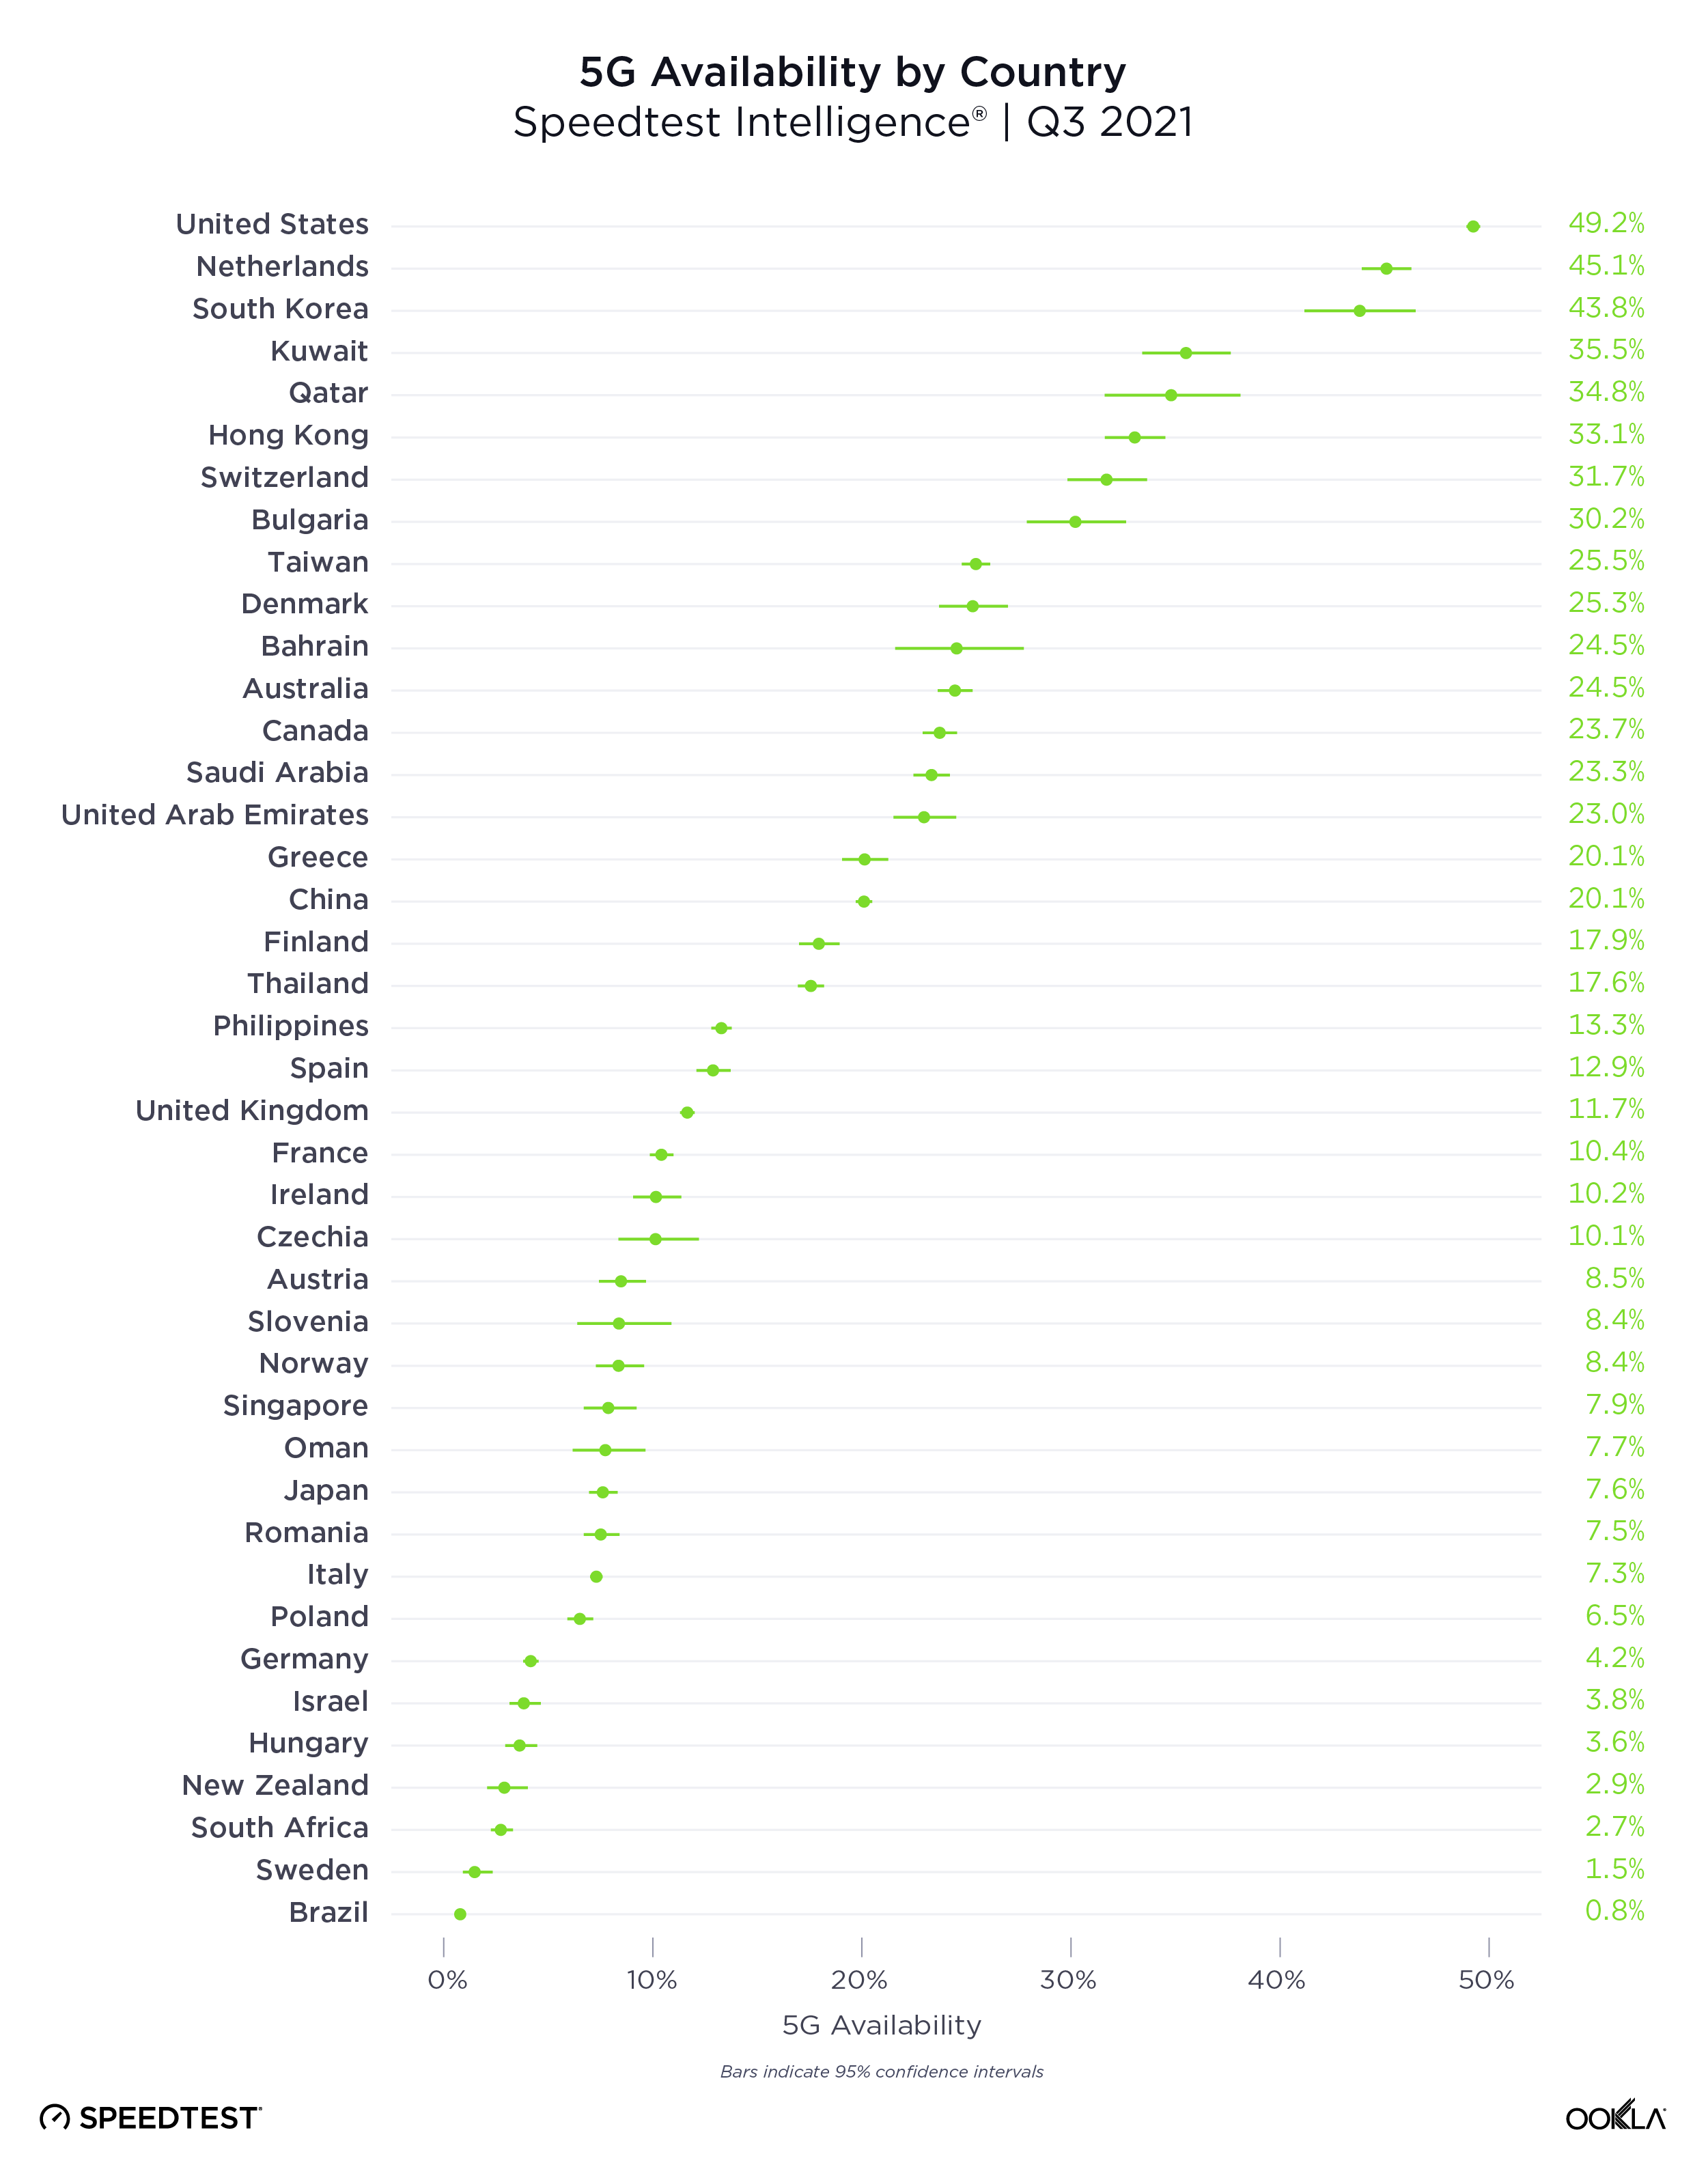
The U.S. had the highest 5G Availability
The presence of 5G is only one indicator in a market, because even in markets where 5G has launched, coverage and adoption can be pretty low. We analyzed 5G Availability to see what percent of users on 5G-capable devices spent the majority of their time on 5G, both roaming and on-network during Q3 2021.
The United States had the highest 5G Availability at 49.2%, followed by the Netherlands (45.1%), South Korea (43.8%), Kuwait (35.5%) and Qatar (34.8%). Brazil had the lowest 5G Availability on our list at 0.8%, followed by Sweden (1.5%), South Africa (2.7%), New Zealand (2.9%) and Hungary (3.6%).
Not all 5G networks are created equal
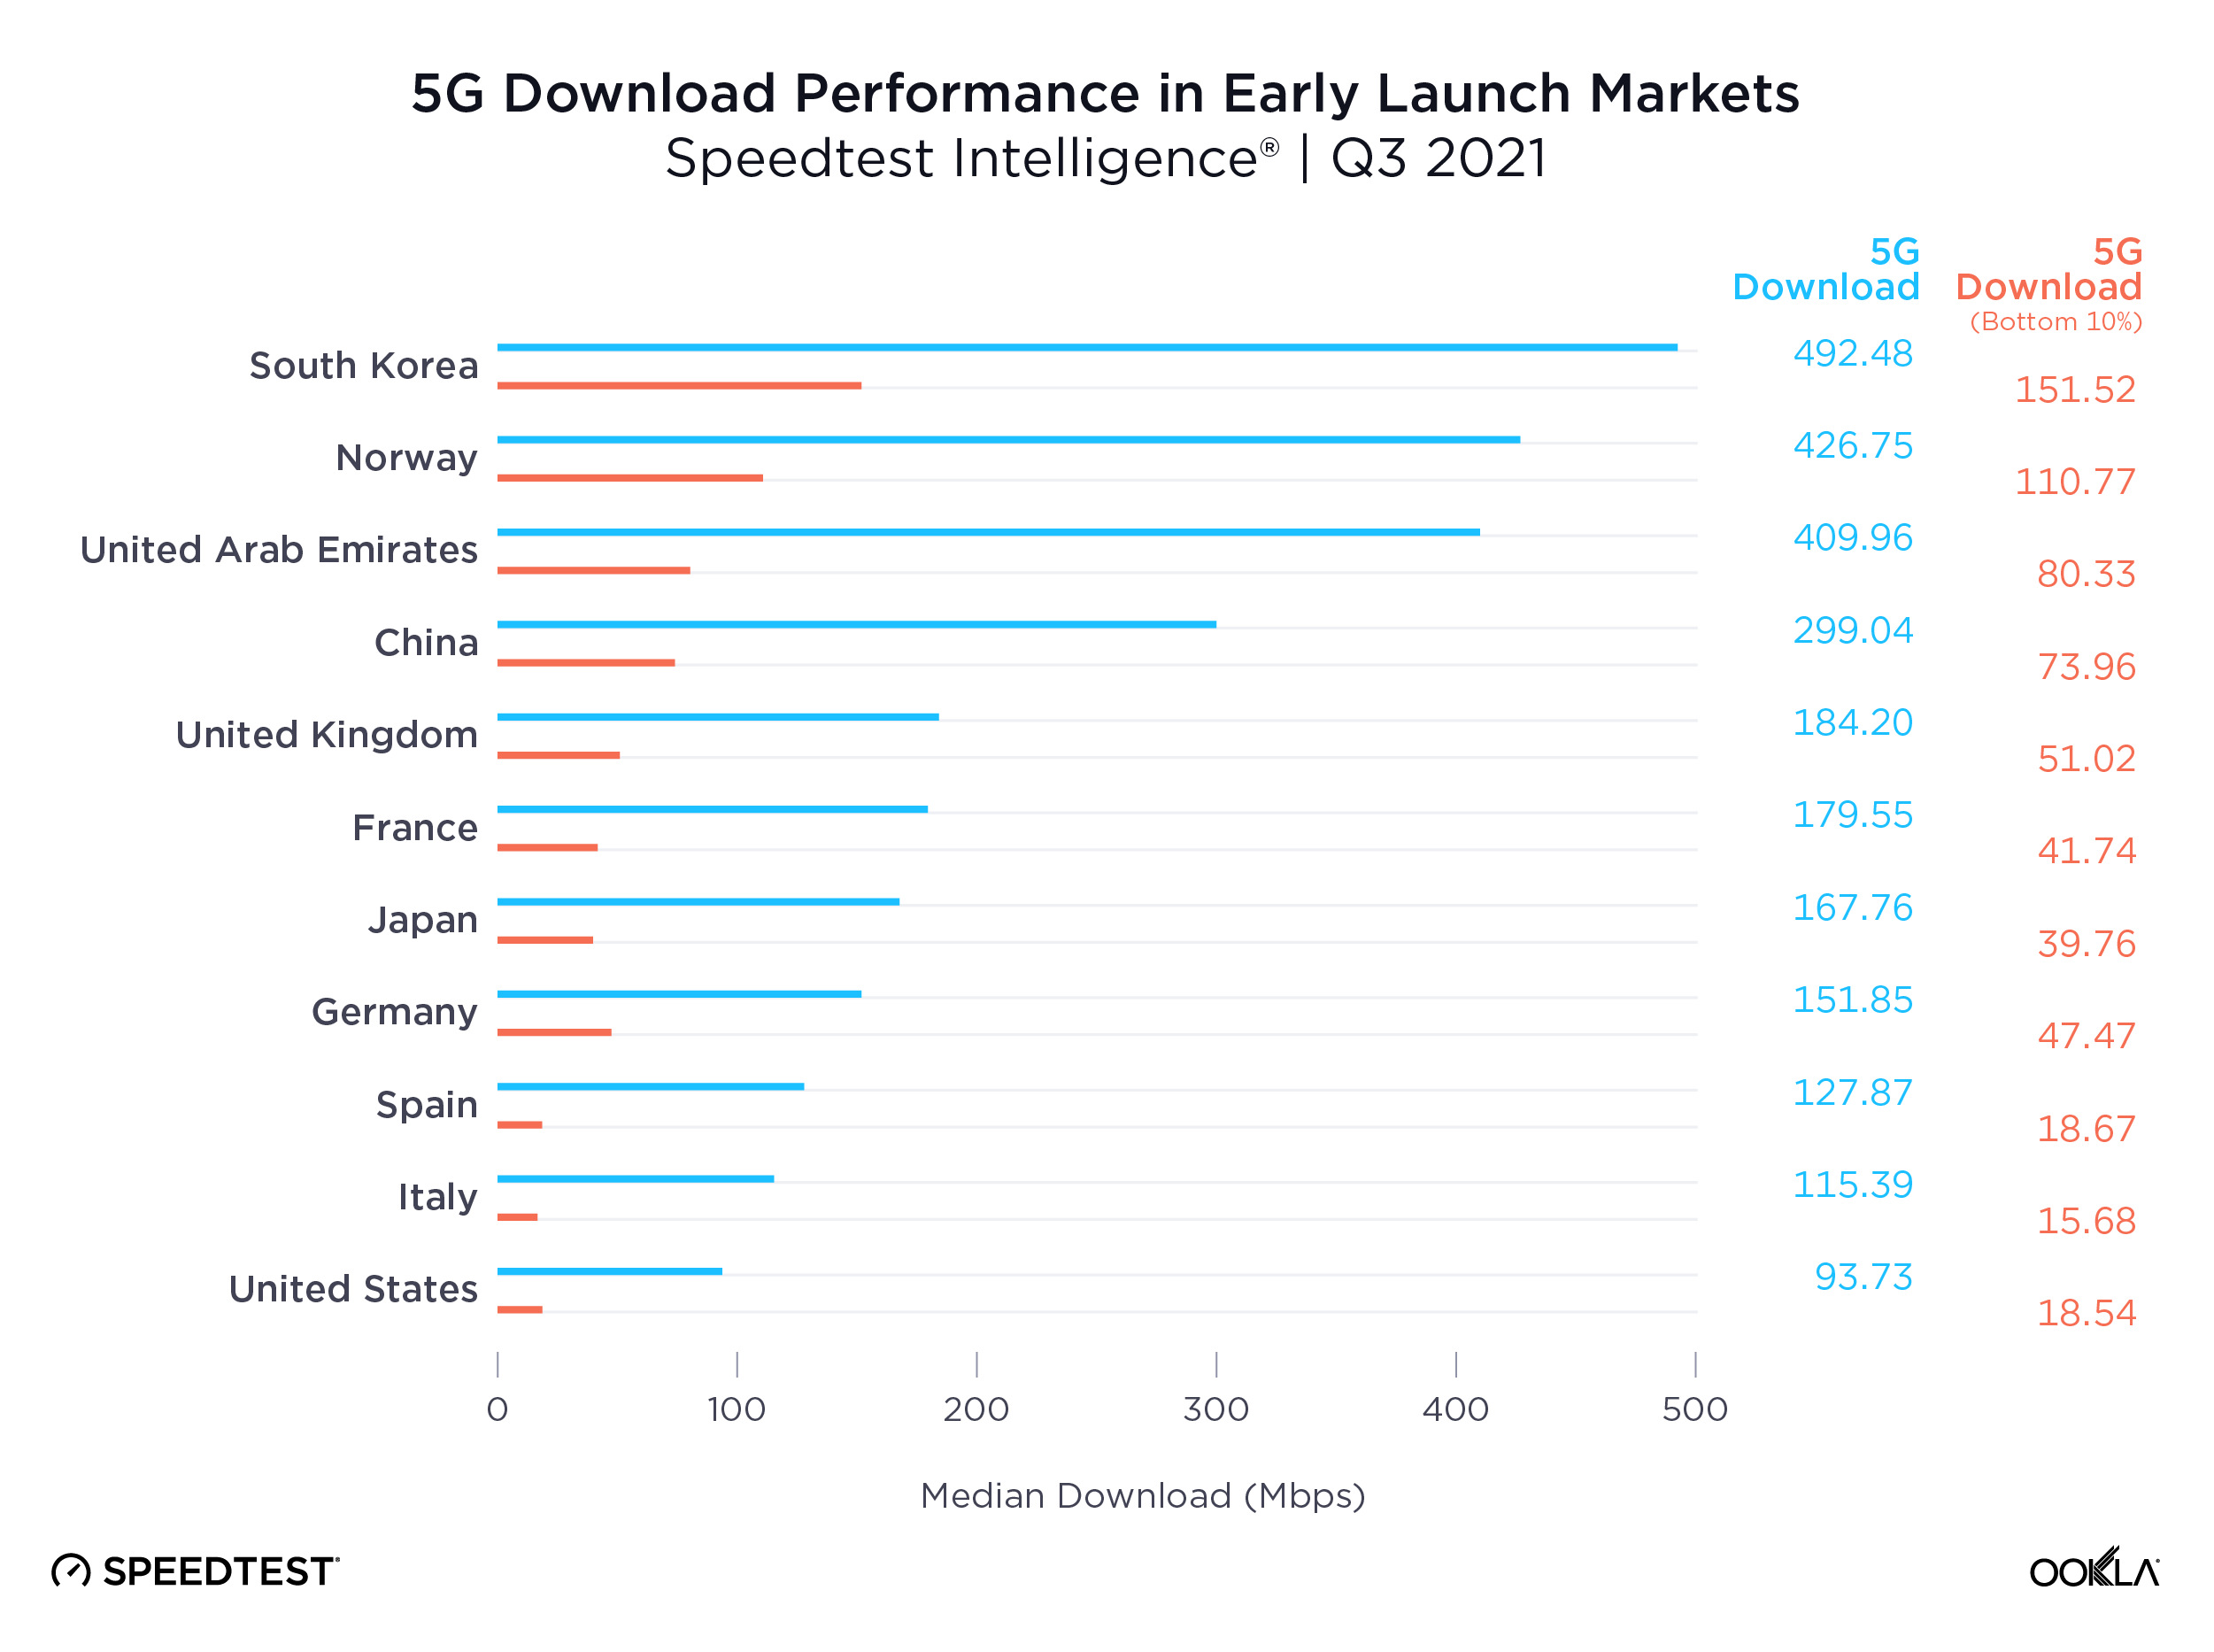
Ookla Speedtest Intelligence data shows a growing disparity in the performance of 5G networks worldwide, even among the pioneer markets who were among the first to launch the new technology. We see leading markets such as South Korea, Norway, the UAE and China pulling well ahead of key European markets, the U.S. and Japan on 5G download speeds, creating what increasingly looks like two tiers of 5G markets.
Part of the reason for this divergence is access to key 5G spectrum bands, with Verizon and AT&T in the U.S. for example, soon to deploy their C-band spectrum holdings for 5G use. However, what really seems to separate these markets is the level of 5G network densification. The number of people per 5G base station ranges from 319 in South Korea and 1,531 in China, to 4,224 in the EU and 6,590 in the US, according to the European 5G Observatory’s International Scoreboard during October 2021.
Despite the noise around 6G, 5G still has a long way to run
Median 5G mobile download speeds across these markets are respectable relative to the International Telecommunication Union’s (ITU) IMT-2020 target of 100 Mbps for user experienced download data rates. However, 5G Speedtest® results in each market demonstrate significant variability, with the bottom 10th percentile only recording speeds in excess of the IMT-2020 target in South Korea and Norway, and falling significantly short in many other markets, with Spain, Italy and the U.S. below 20 Mbps.
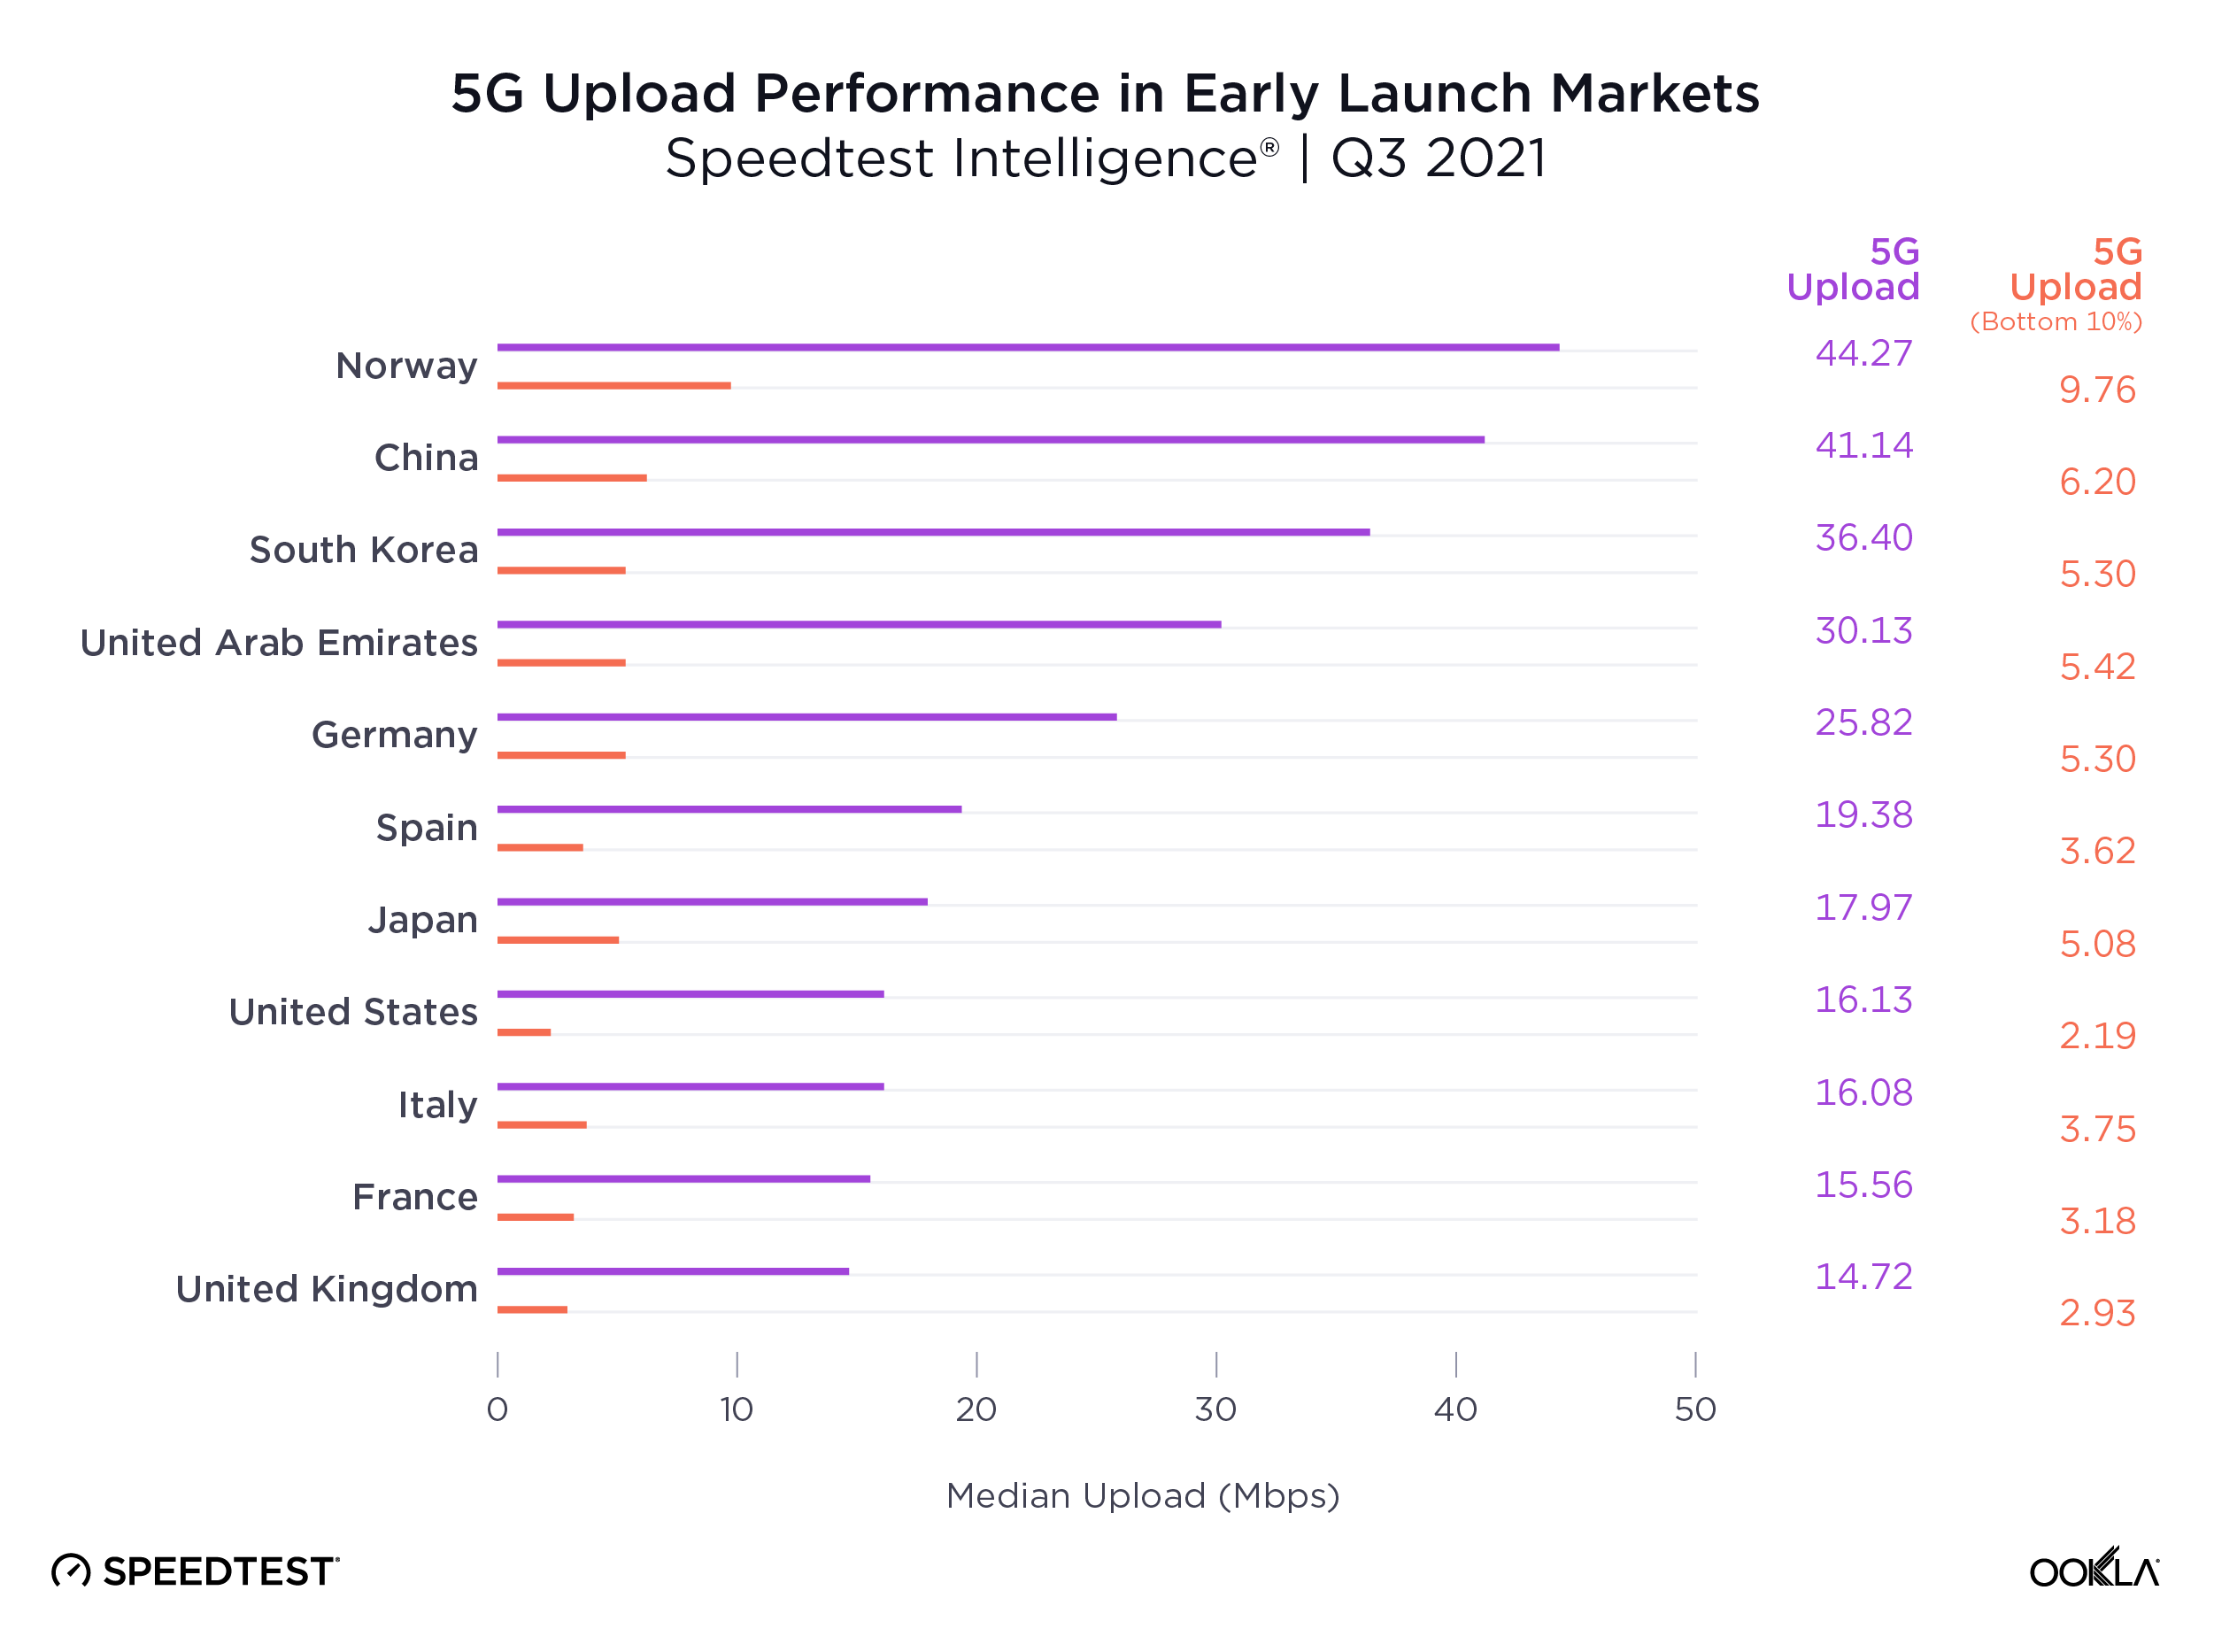
The story gets worse for upload speeds, where no market’s median speed broke the IMT-2020 recommended 50 Mbps, and where the bottom 10th percentile lay in single digits across the board. Operators are clearly prioritizing download speeds over upload, which makes sense given the asymmetric nature of demand, with most consumer applications requiring higher download speeds. However, as operators increasingly look to target the enterprise market with 5G connectivity and consumer demand for services such as video calling and mobile gaming continues to rise, operators will need to boost upload speeds.
Demand for mobile internet bandwidth continues to grow, up 43% year-on-year in Q3 2021 according to Ericsson’s latest mobility report. Looking ahead to 2022, operators will need to increase the capacity of their 5G networks to tackle this growing demand while driving network speeds to new heights. We’ve seen the impact the deployment of new spectrum can have on congested networks during 2021, with Reliance Jio witnessing a bump in 4G LTE performance and consumer sentiment following its acquisition of additional spectrum in India.
Where 5G still fails to reach
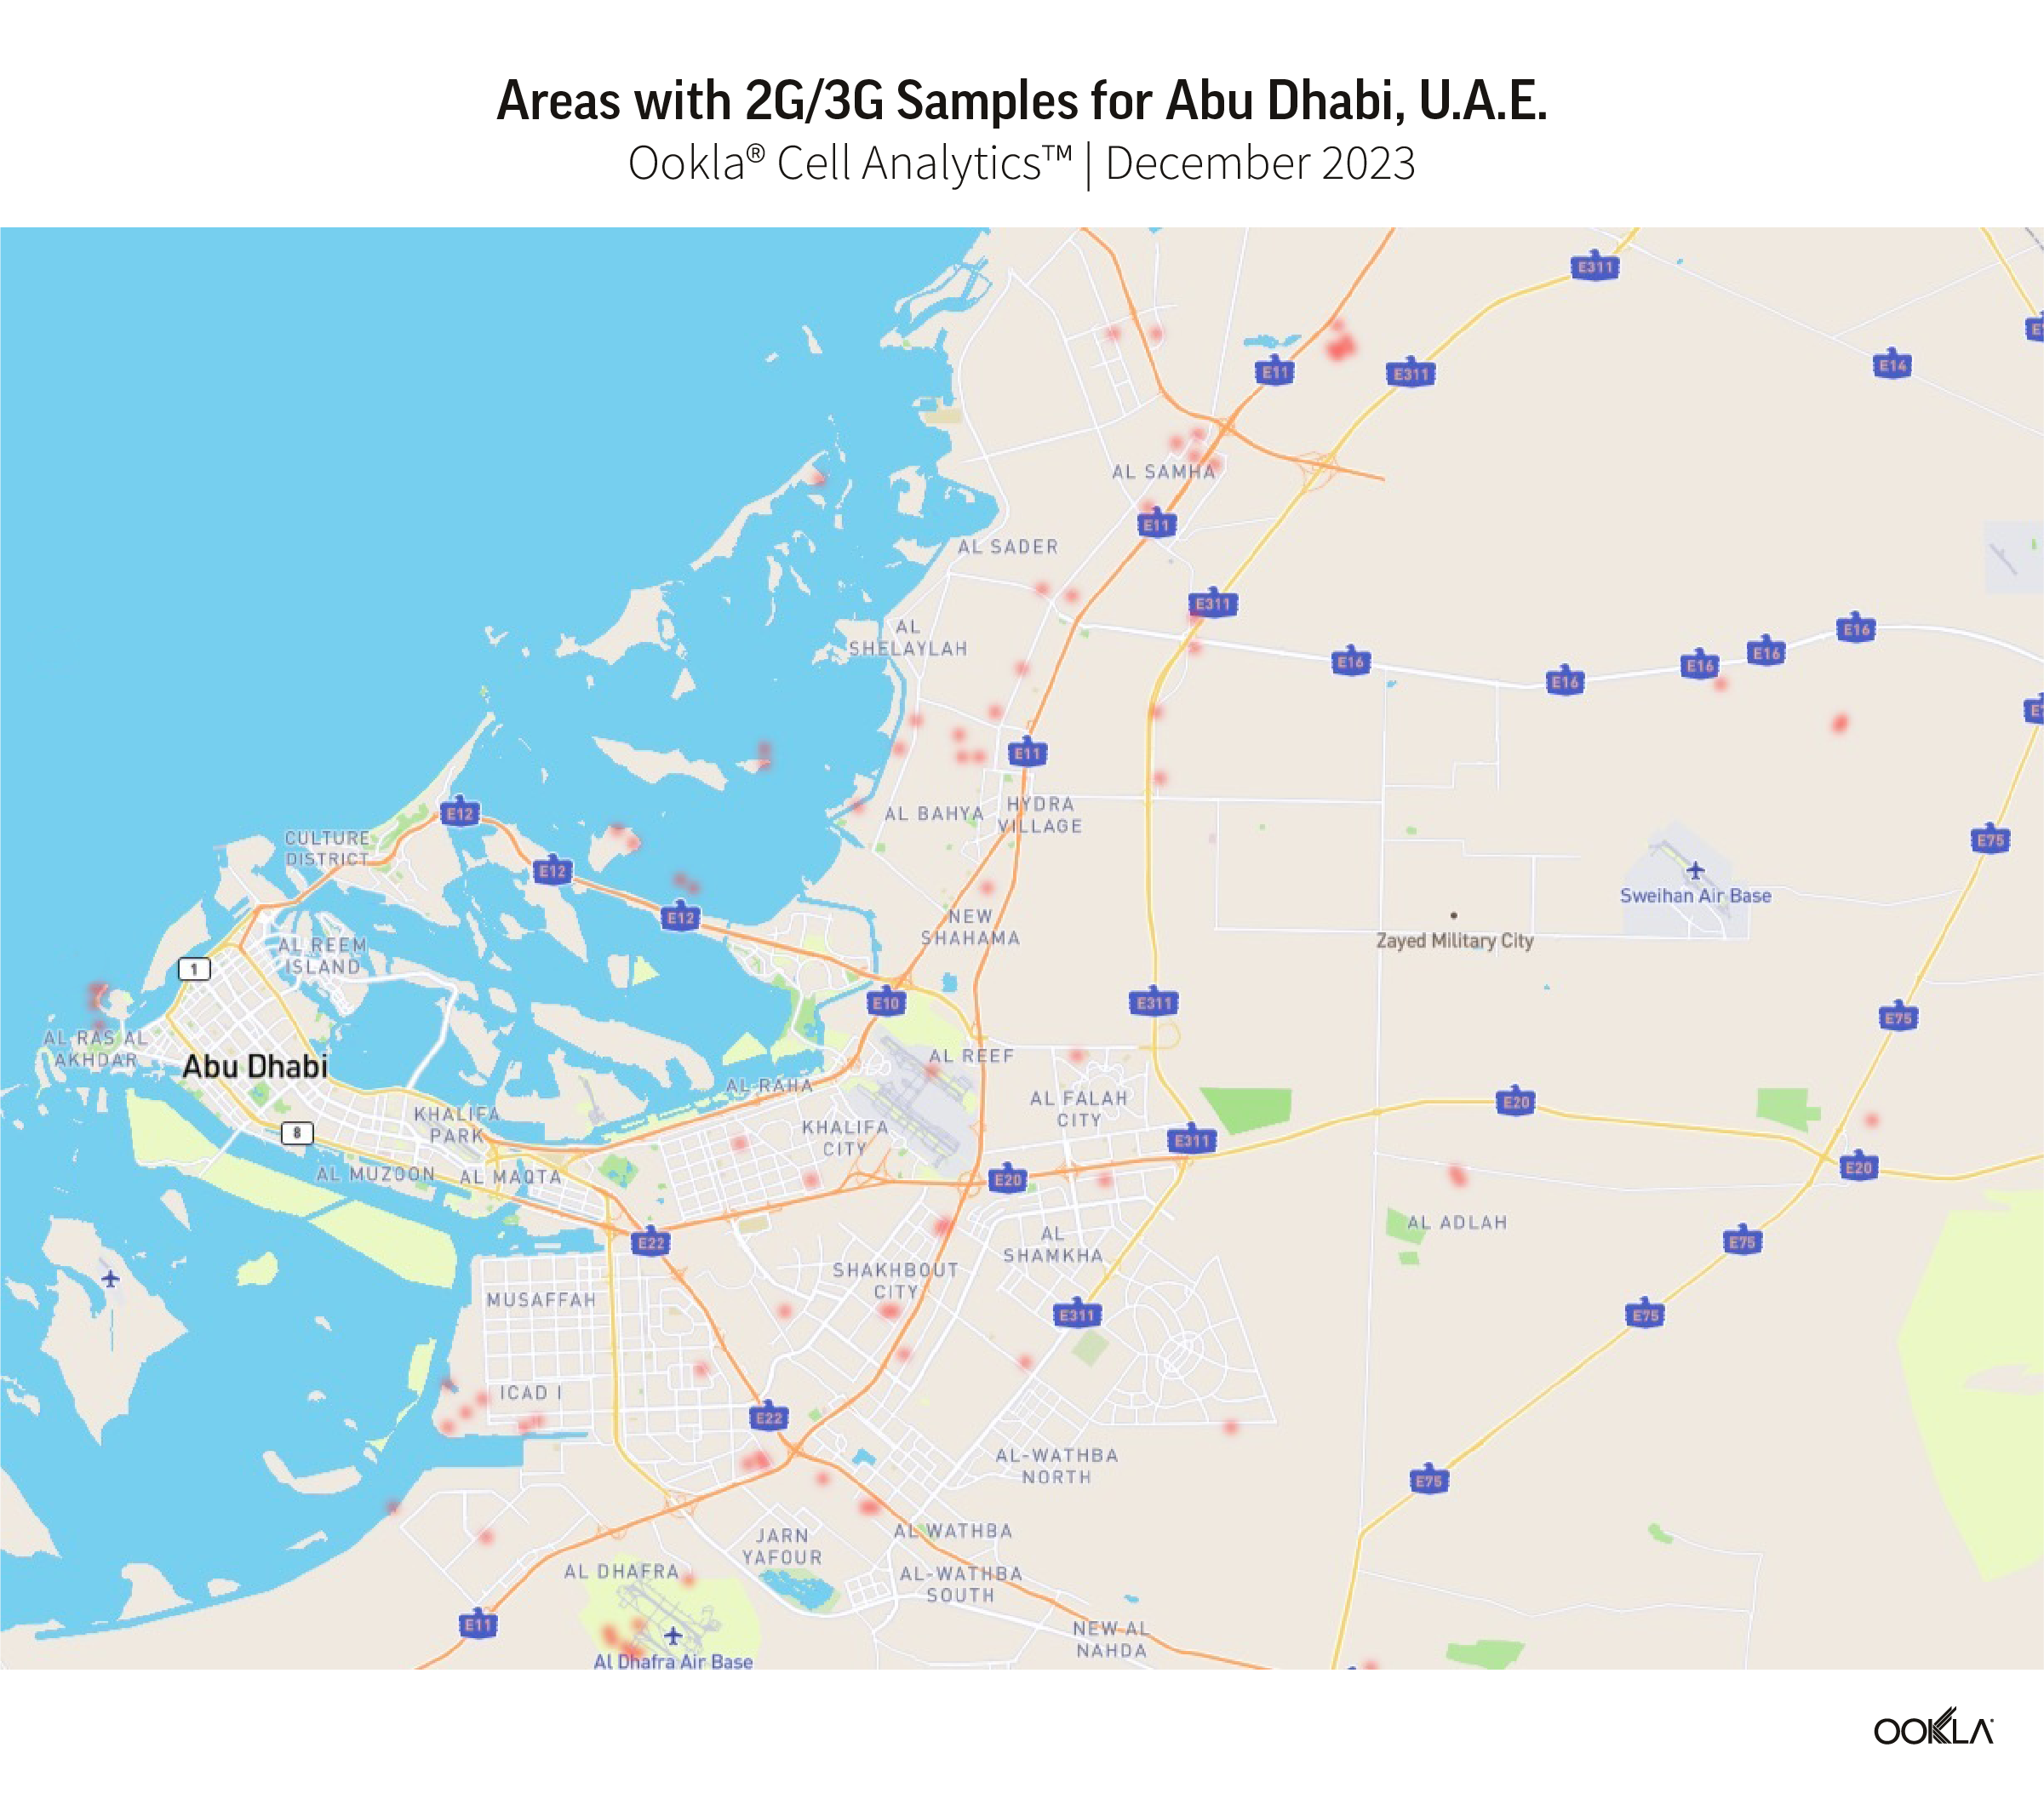
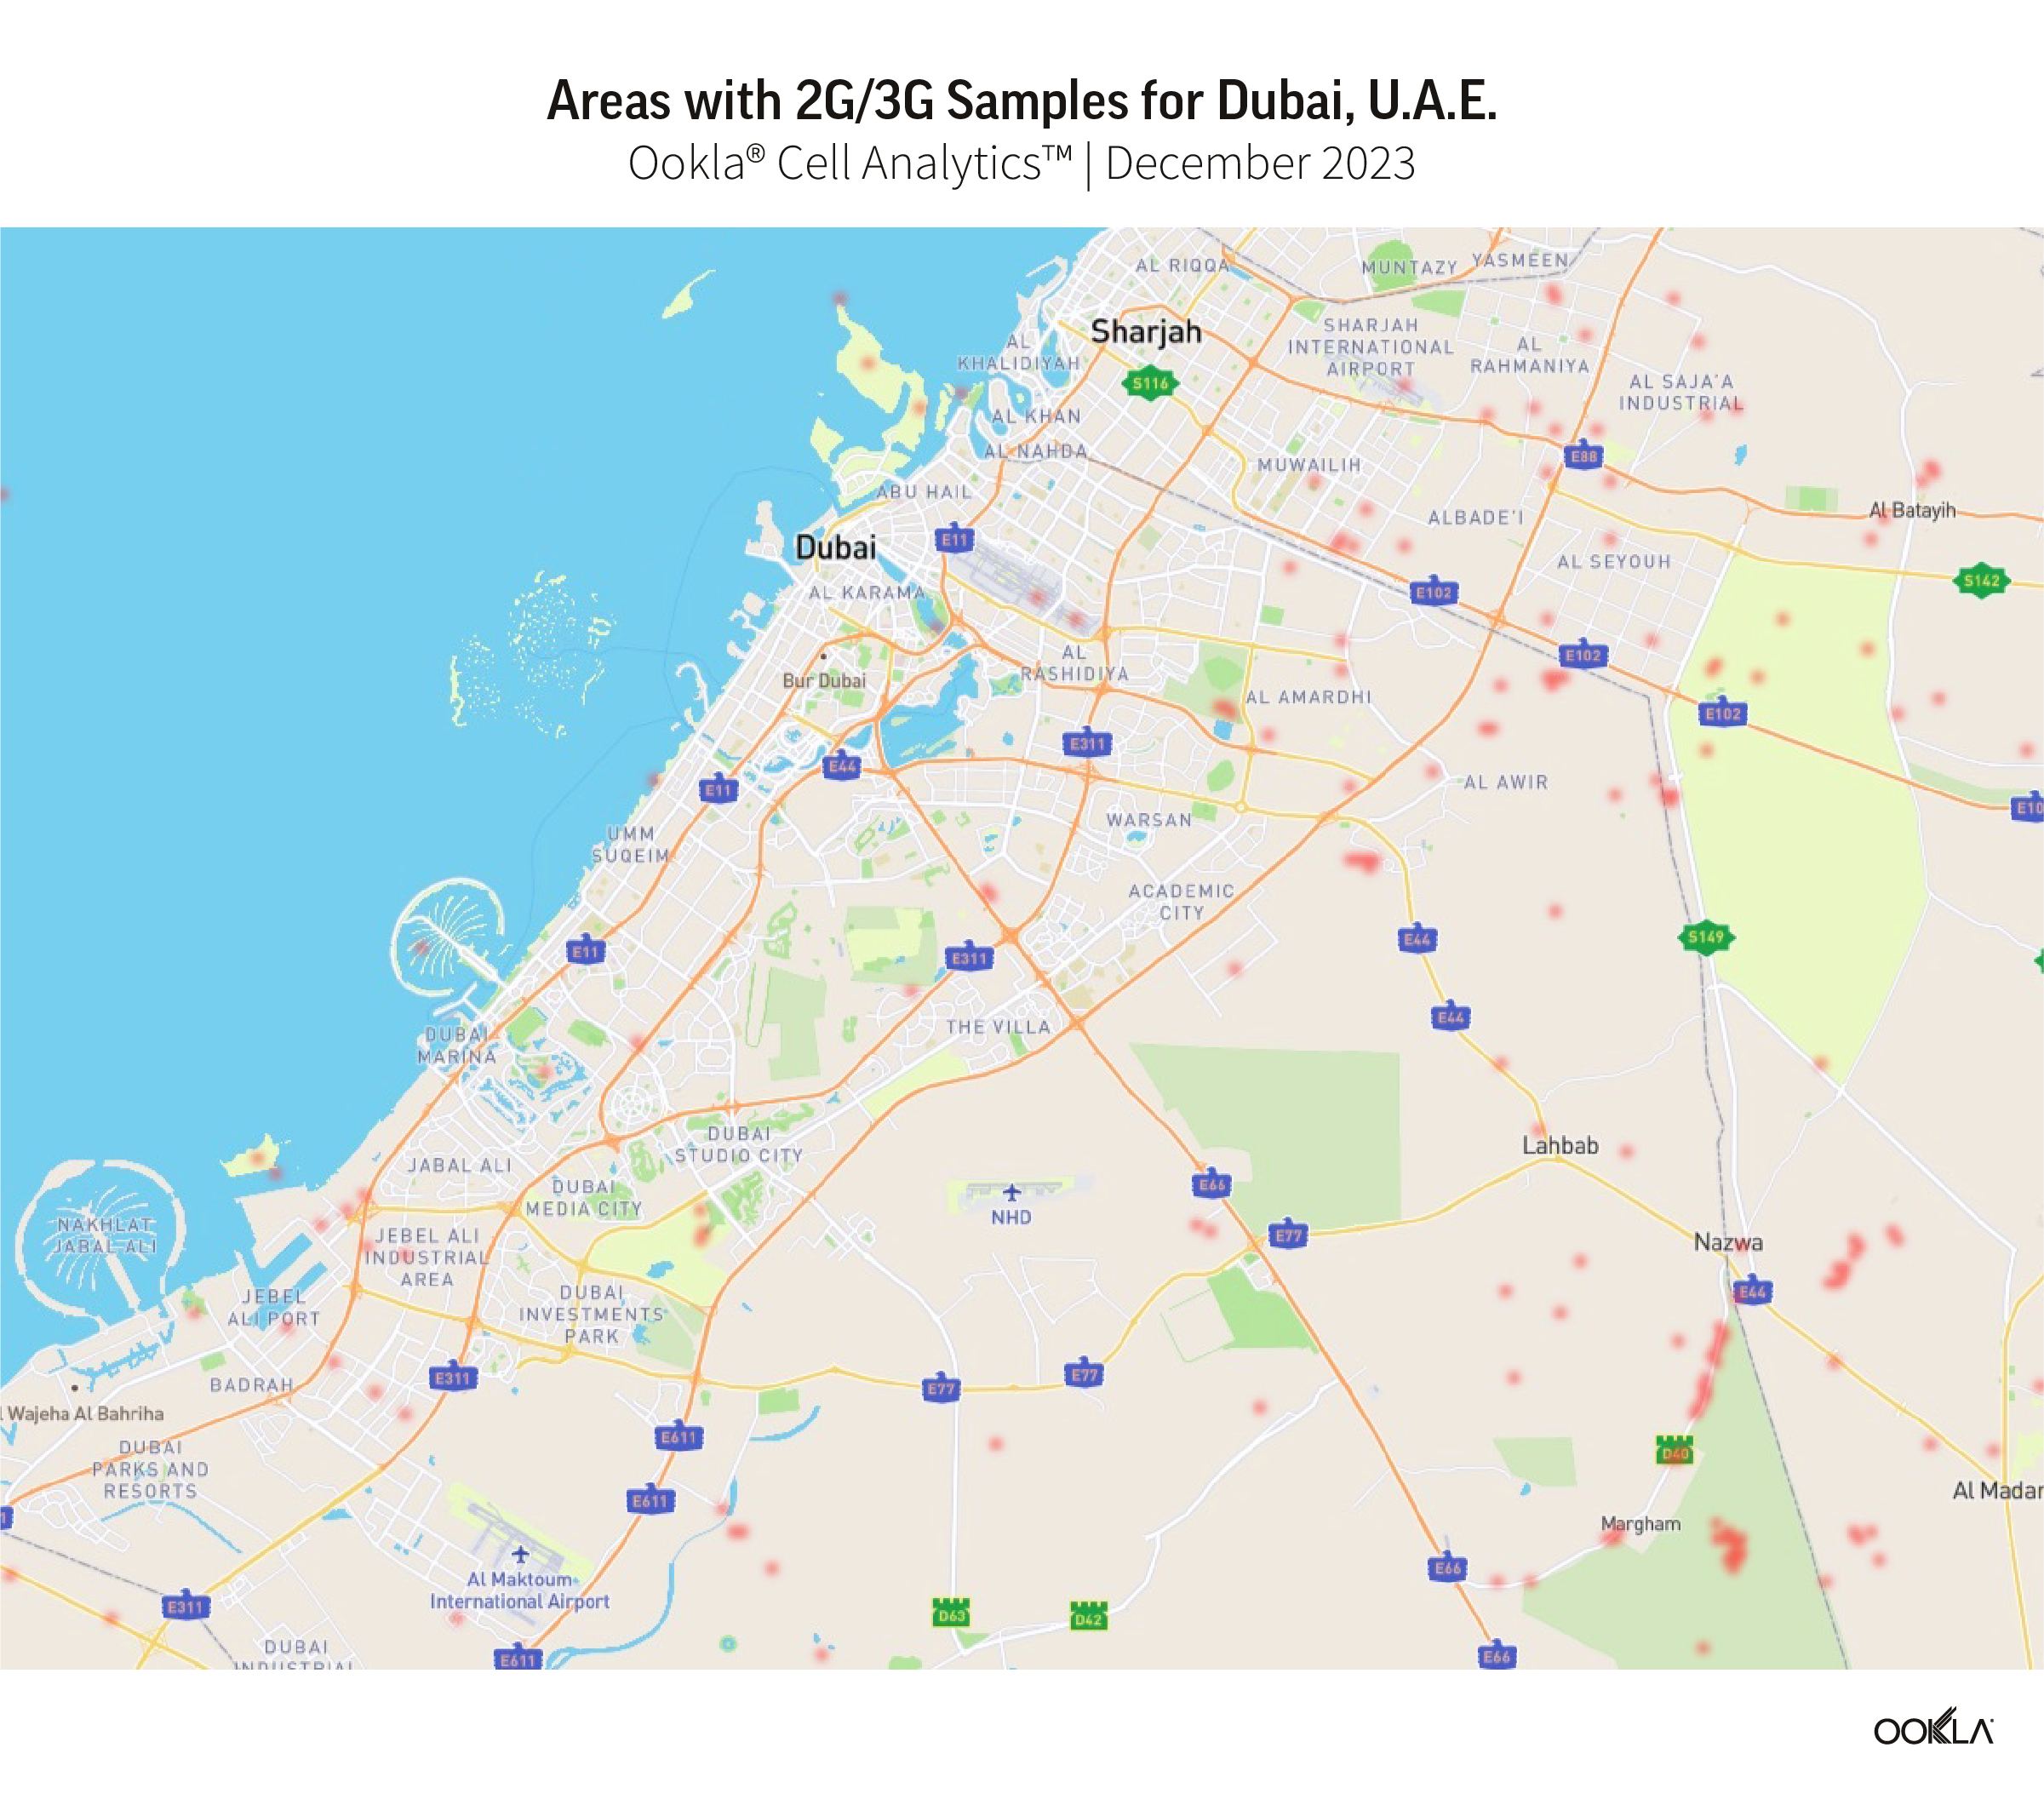
Speedtest Intelligence showed 70 countries in the world where more than 20% of samples were from 2G and 3G connections (combined) during Q3 2021 and met our statistical threshold to be included. These are mostly countries where 5G is still aspirational for a majority of the population. As excited as we are about the expansion of 5G, we do not want to see these countries left behind. Not only are 2G and 3G decades old, they are only sufficient for basic voice and texting, social media and navigation apps. To deliver rich media experiences or video calling, users need access to 4G or higher. Having so many consumers on 2G and 3G also prevents mobile operators from refarming that spectrum to make 4G and 5G networks more efficient.
Countries That Still Rely Heavily on 2G and 3G Connections
Speedtest IntelligenceⓇ | Q3 2021
Country
2G & 3G Samples
Central African Republic
89.9%
Palestine
84.7%
Yemen
72.4%
Turkmenistan
71.8%
Micronesia
56.3%
Madagascar
55.0%
Belarus
53.2%
Rwanda
51.7%
Kiribati
48.4%
Equatorial Guinea
47.6%
Afghanistan
44.4%
South Sudan
43.4%
Guyana
42.3%
Guinea
37.0%
Angola
36.8%
Cape Verde
35.9%
Tajikistan
35.6%
Zimbabwe
34.7%
Benin
34.4%
Togo
33.8%
Ghana
33.0%
Sierra Leone
31.7%
Antigua and Barbuda
30.2%
Vanuatu
30.1%
Lesotho
30.0%
Syria
29.6%
Moldova
29.4%
Saint Kitts and Nevis
28.9%
Mozambique
28.8%
Sudan
28.4%
Palau
28.3%
Grenada
28.1%
Tanzania
27.6%
Uganda
27.5%
Niger
27.5%
Gabon
27.5%
Haiti
27.4%
Suriname
27.4%
Tonga
27.3%
Liberia
27.0%
Namibia
26.7%
Swaziland
26.5%
The Gambia
26.3%
Saint Vincent and the Grenadines
26.3%
Dominica
26.3%
Somalia
26.1%
Cook Islands
26.0%
Zambia
25.9%
Barbados
25.7%
Armenia
25.5%
Algeria
25.4%
Papua New Guinea
25.2%
Jamaica
24.5%
Venezuela
24.2%
Ethiopia
24.1%
Uzbekistan
24.0%
El Salvador
23.5%
Honduras
23.1%
Nigeria
23.0%
Solomon Islands
22.8%
Caribbean Netherlands
22.7%
Botswana
22.3%
Anguilla
21.7%
Mauritania
20.6%
Saint Lucia
20.5%
Bosnia and Herzegovina
20.3%
Burundi
20.3%
Ecuador
20.2%
Ukraine
20.1%
Trinidad and Tobago
20.0%
We were pleased to see the following countries come off the list from last year, having dropped below the 20% threshold: Azerbaijan, Bangladesh, Belize, Burkina Faso, Cameroon, Costa Rica, Côte d’Ivoire, DR Congo, Iraq, Kenya, Laos, Libya, Maldives, Mali, Mauritius, Mongolia, Nicaragua, Paraguay and Tunisia. While countries like Palestine, Suriname, Ethiopia, Haiti and Antigua and Barbuda are still on this list, they have improved the percentage of their samples on these outmoded technologies when compared to last year (dropping 10-15 points, respectively), 2G and 3G samples in Belarus increased 6.7 points when comparing Q3 2021 to Q3 2020.
We’re excited to see how performance levels will normalize as 5G expands to more and more countries and access improves. Keep track of how well your country is performing on Ookla’s Speedtest Global Index™.
Ookla retains ownership of this article including all of the intellectual property rights, data, content graphs and analysis. This article may not be quoted, reproduced, distributed or published for any commercial purpose without prior consent. Members of the press and others using the findings in this article for non-commercial purposes are welcome to publicly share and link to report information with attribution to Ookla.
The Gulf region and Turkey have experienced a surge in air passenger traffic. The growth is expected to remain robust in key hubs such as Dubai, Doha, and Istanbul. As airports prepare to accommodate this influx of travelers, reliable and high-performance cellular networks have become increasingly important in shaping the overall passenger experience. This article benchmarks the network performance of the busiest airports in the Gulf region and Turkey, in terms of download and upload speeds, as well as latency, based on Speedtest Intelligence® data. It also provides recommendations on where travelers may get the best online experience.
Key Takeaways:
Zayed International Airport (AUH) achieves top-tier mobile download speeds of over 450 Mbps. Istanbul Airport (IST) excels in upload speed at 58.40 Mbps, making it particularly suitable for travelers who need to share content efficiently. On the other end, King Abdulaziz International Airport (JED) in Jeddah consistently underperforms across all metrics, with the highest latency and lowest upload speed.
Istanbul Airport significantly leads in 5G performance thanks to a dedicated 5G indoor network: IST achieved the highest download and upload speeds at 861.98 Mbps and 101.96 Mbps, respectively. Gulf-based airports showed a high contrast in median 5G download speeds, with those in Qatar and the UAE offering the fastest speeds at over 500 Mbps.
Most airports provided a median download speed of at least 200 Mbps, enabling an excellent online experience for passengers
While Turkey has long been a magnet for tourists, the Gulf region has emerged as one of the world’s premier travel hubs, attracting hundreds of millions of passengers annually. As a result, airport operators in the region face a pressing need to deliver seamless web browsing, lag-free online gaming, and high-quality streaming experiences to enhance the overall passenger experience and set a new standard for airport facilities. We used Speedtest Intelligence to analyze cellular network performance in the busiest airports in the Gulf region and Turkey.
Total Passengers In Selected Busiest Airports In The Gulf Region And Turkey
Wikipedia | 2024
Total Passengers In Selected Busiest Airports In The Gulf Region And Turkey
Download speed is the most important metric for content consumption and online experience. Zayed International Airport (AUH) had a median download speed of 453.18 Mbps. It was closely followed by Hamad International Airport (DOH), with a speed of 426.43 Mbps. King Khalid International Airport (RUH) and Istanbul International Airport (IST) also delivered excellent download speed performances at 329.04 Mbps and 314.84 Mbps, respectively.
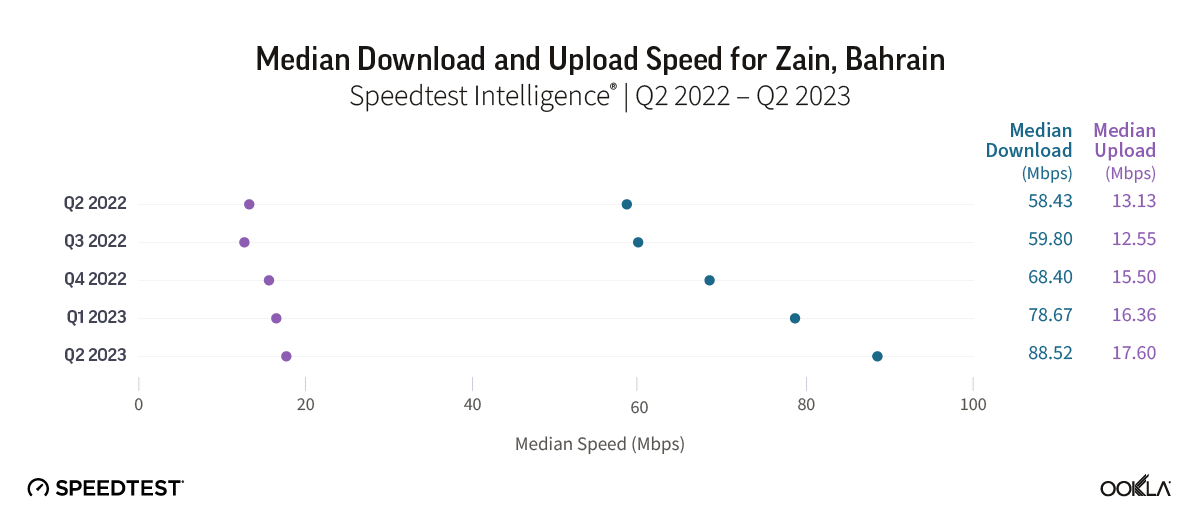
In contrast, Sabiha Gökçen Airport (SAW) and Muscat International Airport (MCT) delivered sub-100Mbps speeds of 78.67 Mbps and 95.95 Mbps, respectively. Airports based in Dubai and Kuwait fall into the mid-range, with download speeds of around 250 Mbps.
Upload speed is important as it determines how efficiently users can upload documents, photos, and videos. IST stands out with a median upload speed of 58.40 Mbps, surpassing all other airports. RUH in Riyadh, DOH in Doha, and SAW in Istanbul follow with upload speeds of 32.83 Mbps, 30.10 Mbps, and 29.10 Mbps, respectively. King Abdul Aziz International Airport (JED) in Jeddah falls short, delivering the lowest upload speed of just 16.11 Mbps, while DXB pulls slightly ahead with 18.99 Mbps.
Latency measures the delay in transferring data and affects real-time services such as video calls, online gaming, and media streaming. Most airports offer a sub-40 ms latency, which ensures acceptable responsiveness for users. IST and Kuwait International Airport (KWT) have somewhat better conditions, with a delay of under 32 ms. JED stood out again as a poor performer with a latency of 89.98 ms, suggesting a significant impact on real-time applications such as gaming and video conferencing.
All Technologies Network Performance, Select Airports in the Gulf and Turkey
Speedtest Intelligence® | 2024
All Technologies Network Performance, Select Airports in the Gulf and Turkey
Istanbul Airport significantly leads the region in 5G performance thanks to a dedicated 5G indoor network
As 5G adoption increases, consumers and businesses expect the same level of coverage and performance wherever they go. Yet, the characteristics of ‘outdoor’ 5G, which typically operates in mid-band frequencies of 1.8 GHz to 3.5 GHz, pose a challenge for indoor coverage, as these frequencies struggle to penetrate walls and windows, particularly those built of glass and steel. Furthermore, telecom operators have prioritized outdoor coverage because it requires less CAPEX and OPEX per subscriber than indoor coverage and has a better return on investment. In addition, the traffic patterns in the airport are highly variable, which means that the network must be capable of accommodating different connectivity levels.
The introduction of 5G in Turkey lags significantly behind as 700 MHz, 3.5 GHz, and 26 GHz frequencies will be auctioned in 2025, with commercial launch expected in 2026. However, Istanbul International Airport (IST) deployed a dedicated indoor 5G network that serves only users within the airport’s premises. This deployment gives it performance advantages compared to public 5G networks. Speedtest Intelligence data shows that IST secured the top spot for 5G median download and upload speeds at 861.98 Mbps and 101.96 Mbps, respectively.
Airports in Abu Dhabi (AUH) and Doha (DOH) also have high 5G download speeds, at 678.11 Mbps and 657.56 Mbps, respectively. All other Gulf-based airports provided a median download speed of at least 107 Mbps, enabling users to stream multiple 4K videos over 5G.
Gulf airports lagged significantly behind IST in upload speeds, with four locations’ speeds ranging from around 30 Mbps to 45 Mbps. The other four Gulf-based airports underperformed, with MCT and JED at the bottom of the list with a median upload speed of 15.09 Mbps and 17.84 Mbps, respectively, despite deployingsolutions to improve indoor network coverage and capacity.
Most airports offer a relatively low 5G latency, around 30 ms to 36 ms, suggesting good service responsiveness. The only exception is JED, with a median latency of 86.59 ms, likely degrading the customer experience of real-time services such as video streaming.
5G Network Performance, Select Airports in the Gulf and Turkey
Speedtest Intelligence® | 2024
5G Network Performance, Select Airports in the Gulf and Turkey
As the results show, airports in the Gulf region and Turkey generally have excellent mobile network performance inside and around these facilities. These achievements were realized thanks to the deployment of 5G and investment in solutions to improve indoor coverage and capacity.
The tourism boom in Turkey and the Gulf region is set to continue and will drive infrastructure investment and economic growth
According to GlobalData, the number of international arrivals into the GCC (Gulf Cooperation Council) reached 73.64 million travelers in 2023. The U.A.E. leads the GCC in terms of tourist numbers with 28.2 million visitors in the city during H1 2024, while Saudi Arabia received 27.4 million visitors (including pilgrims) with the ambition to grow to 150 million by 2030. The tourism sector in Qatar is also a promising destination, with 3 million visitors in 2023, benefiting from the successful hosting of the World Cup in 2022. Oman welcomed 3.4 million tourists in 2023 and plans to attract 11.7 million by 2040.
These countries have invested heavily in infrastructure, including transport, to address the growing influx of tourists and translate into economic growth. They have also built new airports and upgraded existing ones to cater to the rise in air passenger traffic, which is expected to surge to 449 million in 2024, more than double its 2019 level.
The new Istanbul airport was inaugurated in 2018 to make Turkey’s capital one of the world’s largest financial and economic centers. It had an initial capacity of 90 million passengers annually, making it a major gateway for international visitors and contributing to the country’s economy. According to the Ministry of Culture and Tourism, the number of tourist arrivals in the country increased by 7% to 47.3 million during the first 10 months of 2024 compared to the same period the previous year. It plans to expand its capacity to 120 million passengers in 2025.
As the Gulf region and Turkey continue to experience a surge in air passenger traffic, it is essential to meet their expectations for fast and reliable connectivity to enhance their overall experience and gain a competitive edge over other airports. By doing so, they can unlock new growth opportunities, improve customer loyalty, and strengthen their position as major global travel hubs.We will continue to monitor network performance in key locations where people spend their time and how it impacts their online experience. If you are interested in Speedtest Intelligence, please contact us.
Ookla retains ownership of this article including all of the intellectual property rights, data, content graphs and analysis. This article may not be quoted, reproduced, distributed or published for any commercial purpose without prior consent. Members of the press and others using the findings in this article for non-commercial purposes are welcome to publicly share and link to report information with attribution to Ookla.
5G is no longer a new technology, however, consumers in many countries are still waiting to see the full benefits of 5G (or even to connect to 5G at all). We examined Speedtest Intelligence® data from Q3 2022 Speedtest® results to see how 5G performance has changed since last year, where download speeds are the fastest at the country level, and how satellite technologies are offering additional options to connect. We also looked at countries that don’t yet have 5G to understand where consumers are seeing improvements in 4G LTE access.
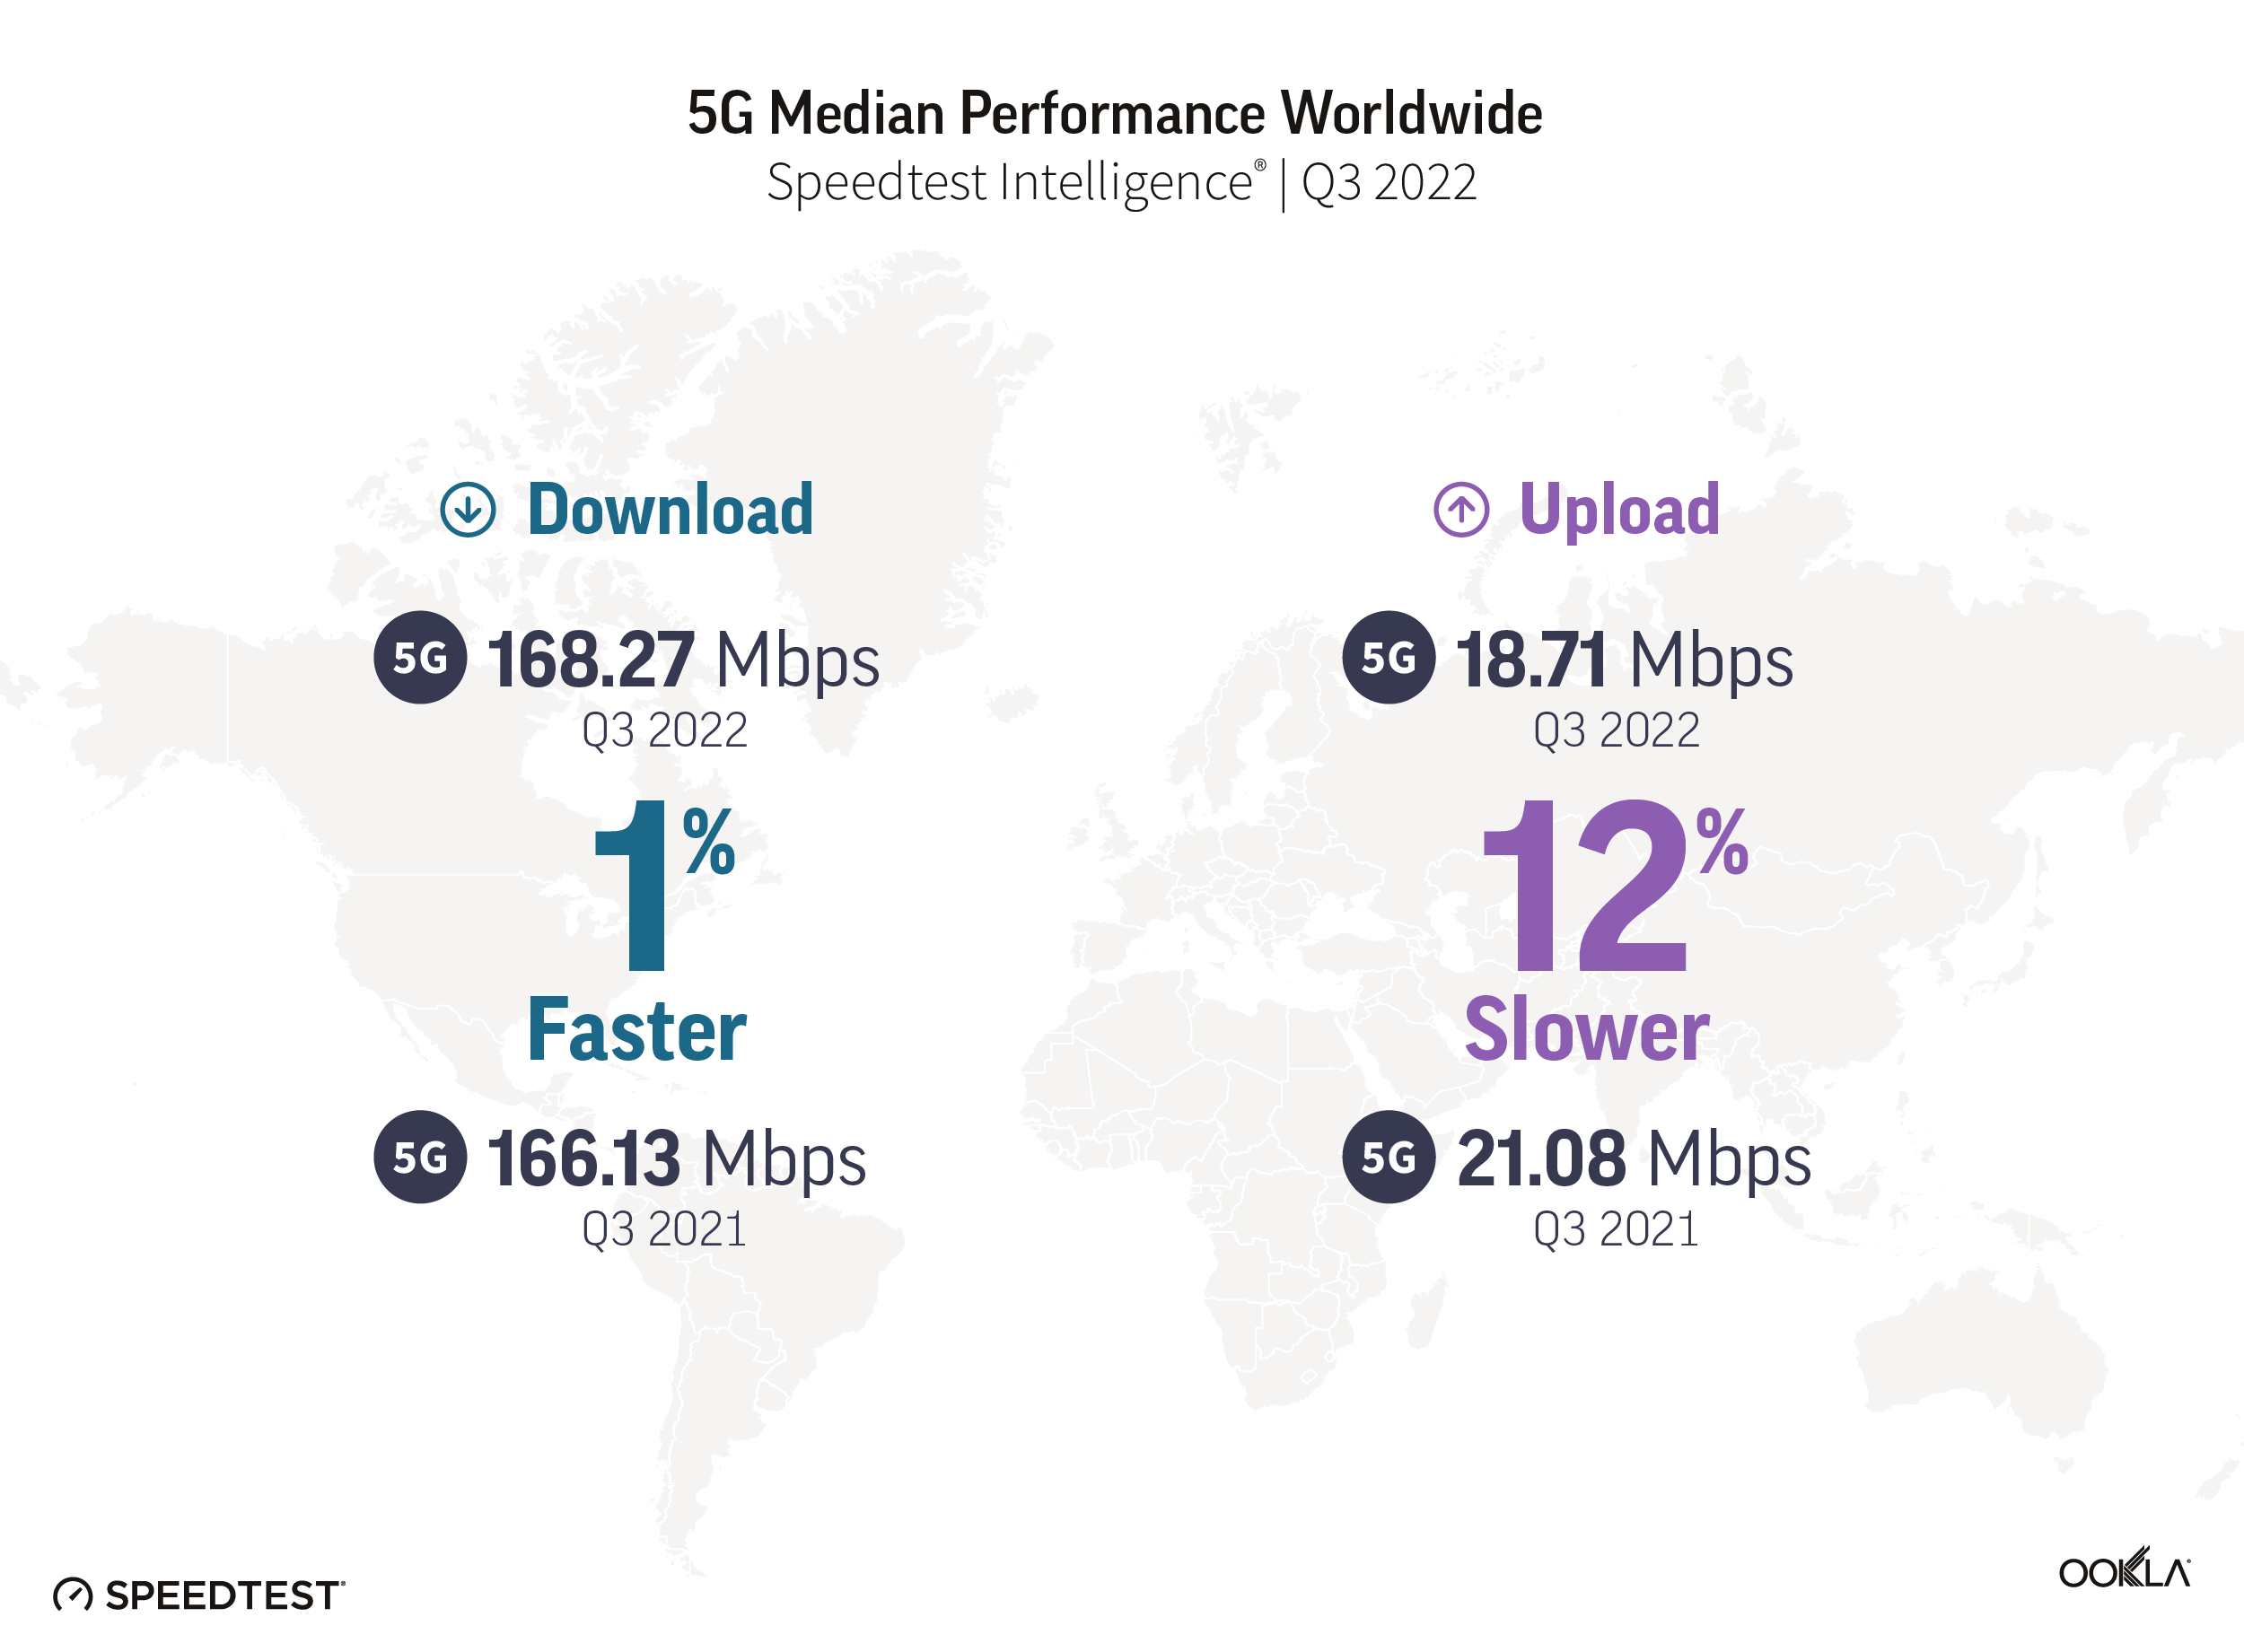
5G speeds were stable at the global level
In 2021, we discussed how an expansion of 5G access led to a decline in overall speed at the global level. This year showed a stabilization in overall speed, even as 5G access broadened, with a median global 5G download speed of 168.27 Mbps in Q3 2022 as compared to 166.13 Mbps in Q3 2021. Median upload speed over 5G slowed slightly to 18.71 Mbps (from 21.08 Mbps) during the same period. According to the Ookla® 5G Map™, there were 127,509 5G deployments in 128 countries as of November 30, 2022, compared to 85,602 in 112 countries the year prior.
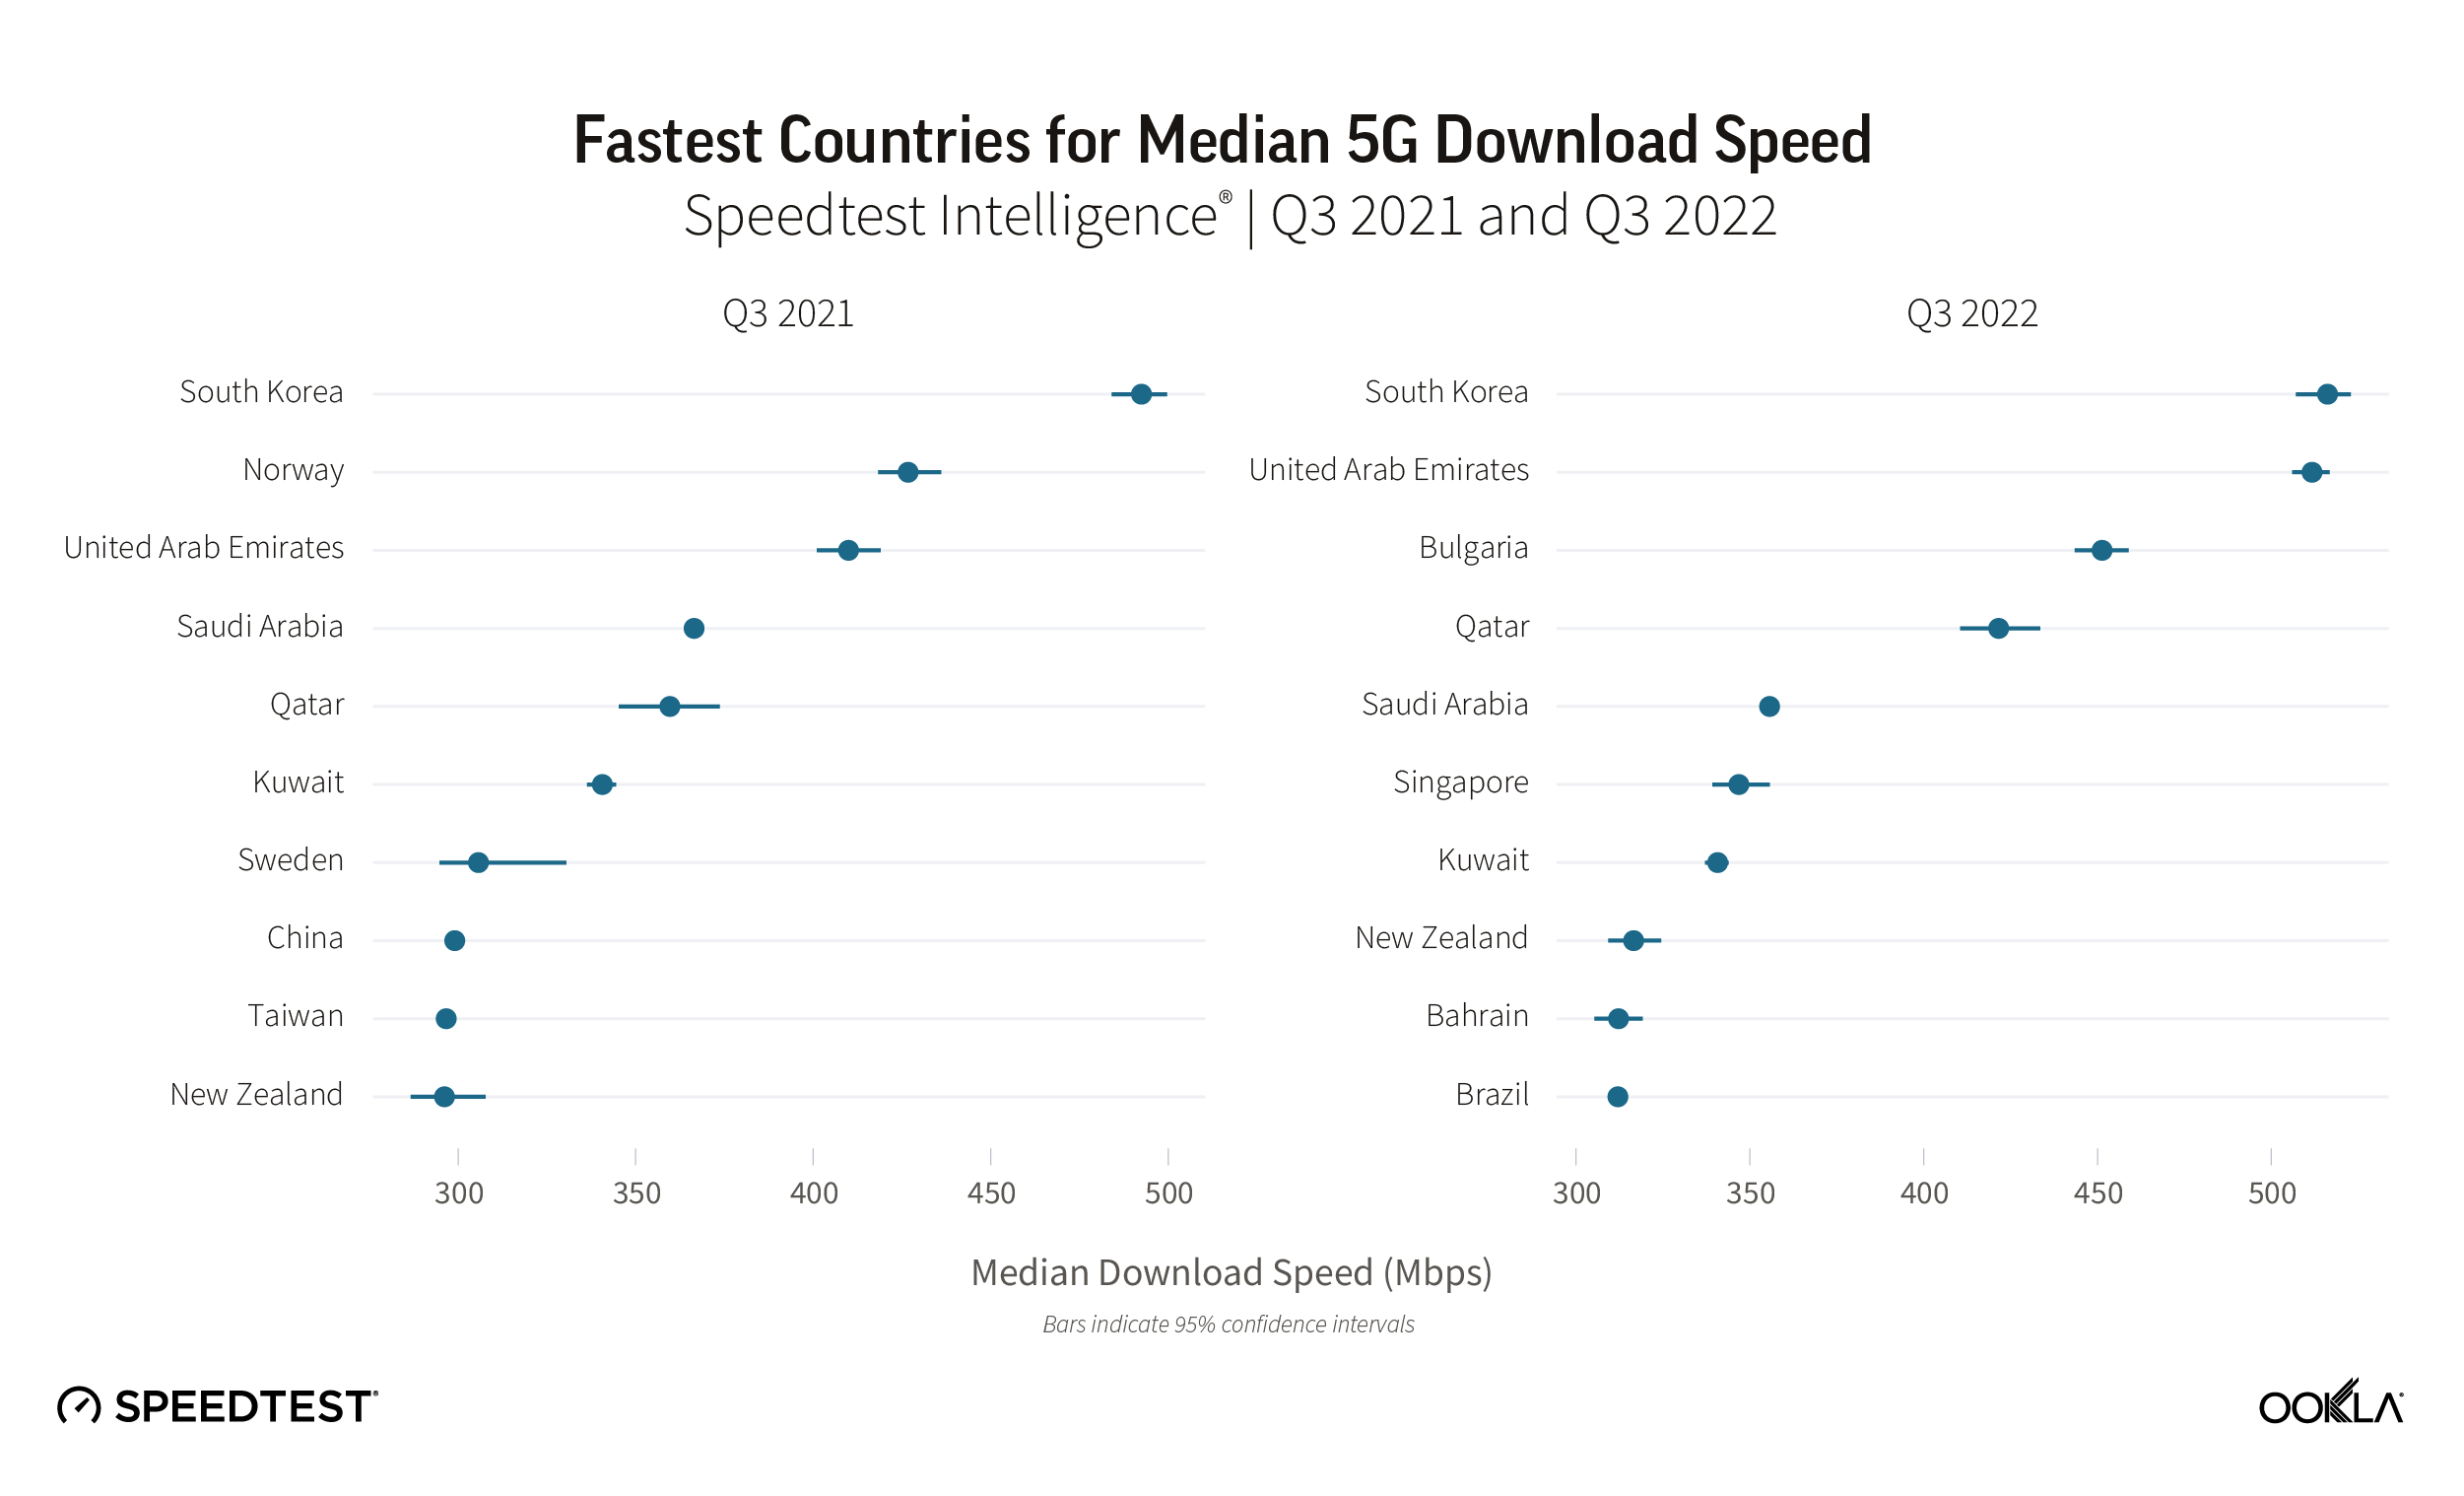
South Korea and the United Arab Emirates led countries for 5G speeds
South Korea and the U.A.E. had the fastest median download speed over 5G at 516.15 Mbps and 511.70 Mbps, respectively, during Q3 2022, leading a top 10 list that included Bulgaria, Qatar, Saudi Arabia, Singapore, Kuwait, New Zealand, Bahrain, and Brazil. Bulgaria, Singapore, Bahrain, and Brazil were new to the top 10 in 2022, while Norway, Sweden, China, and Taiwan fell out of the top 10.
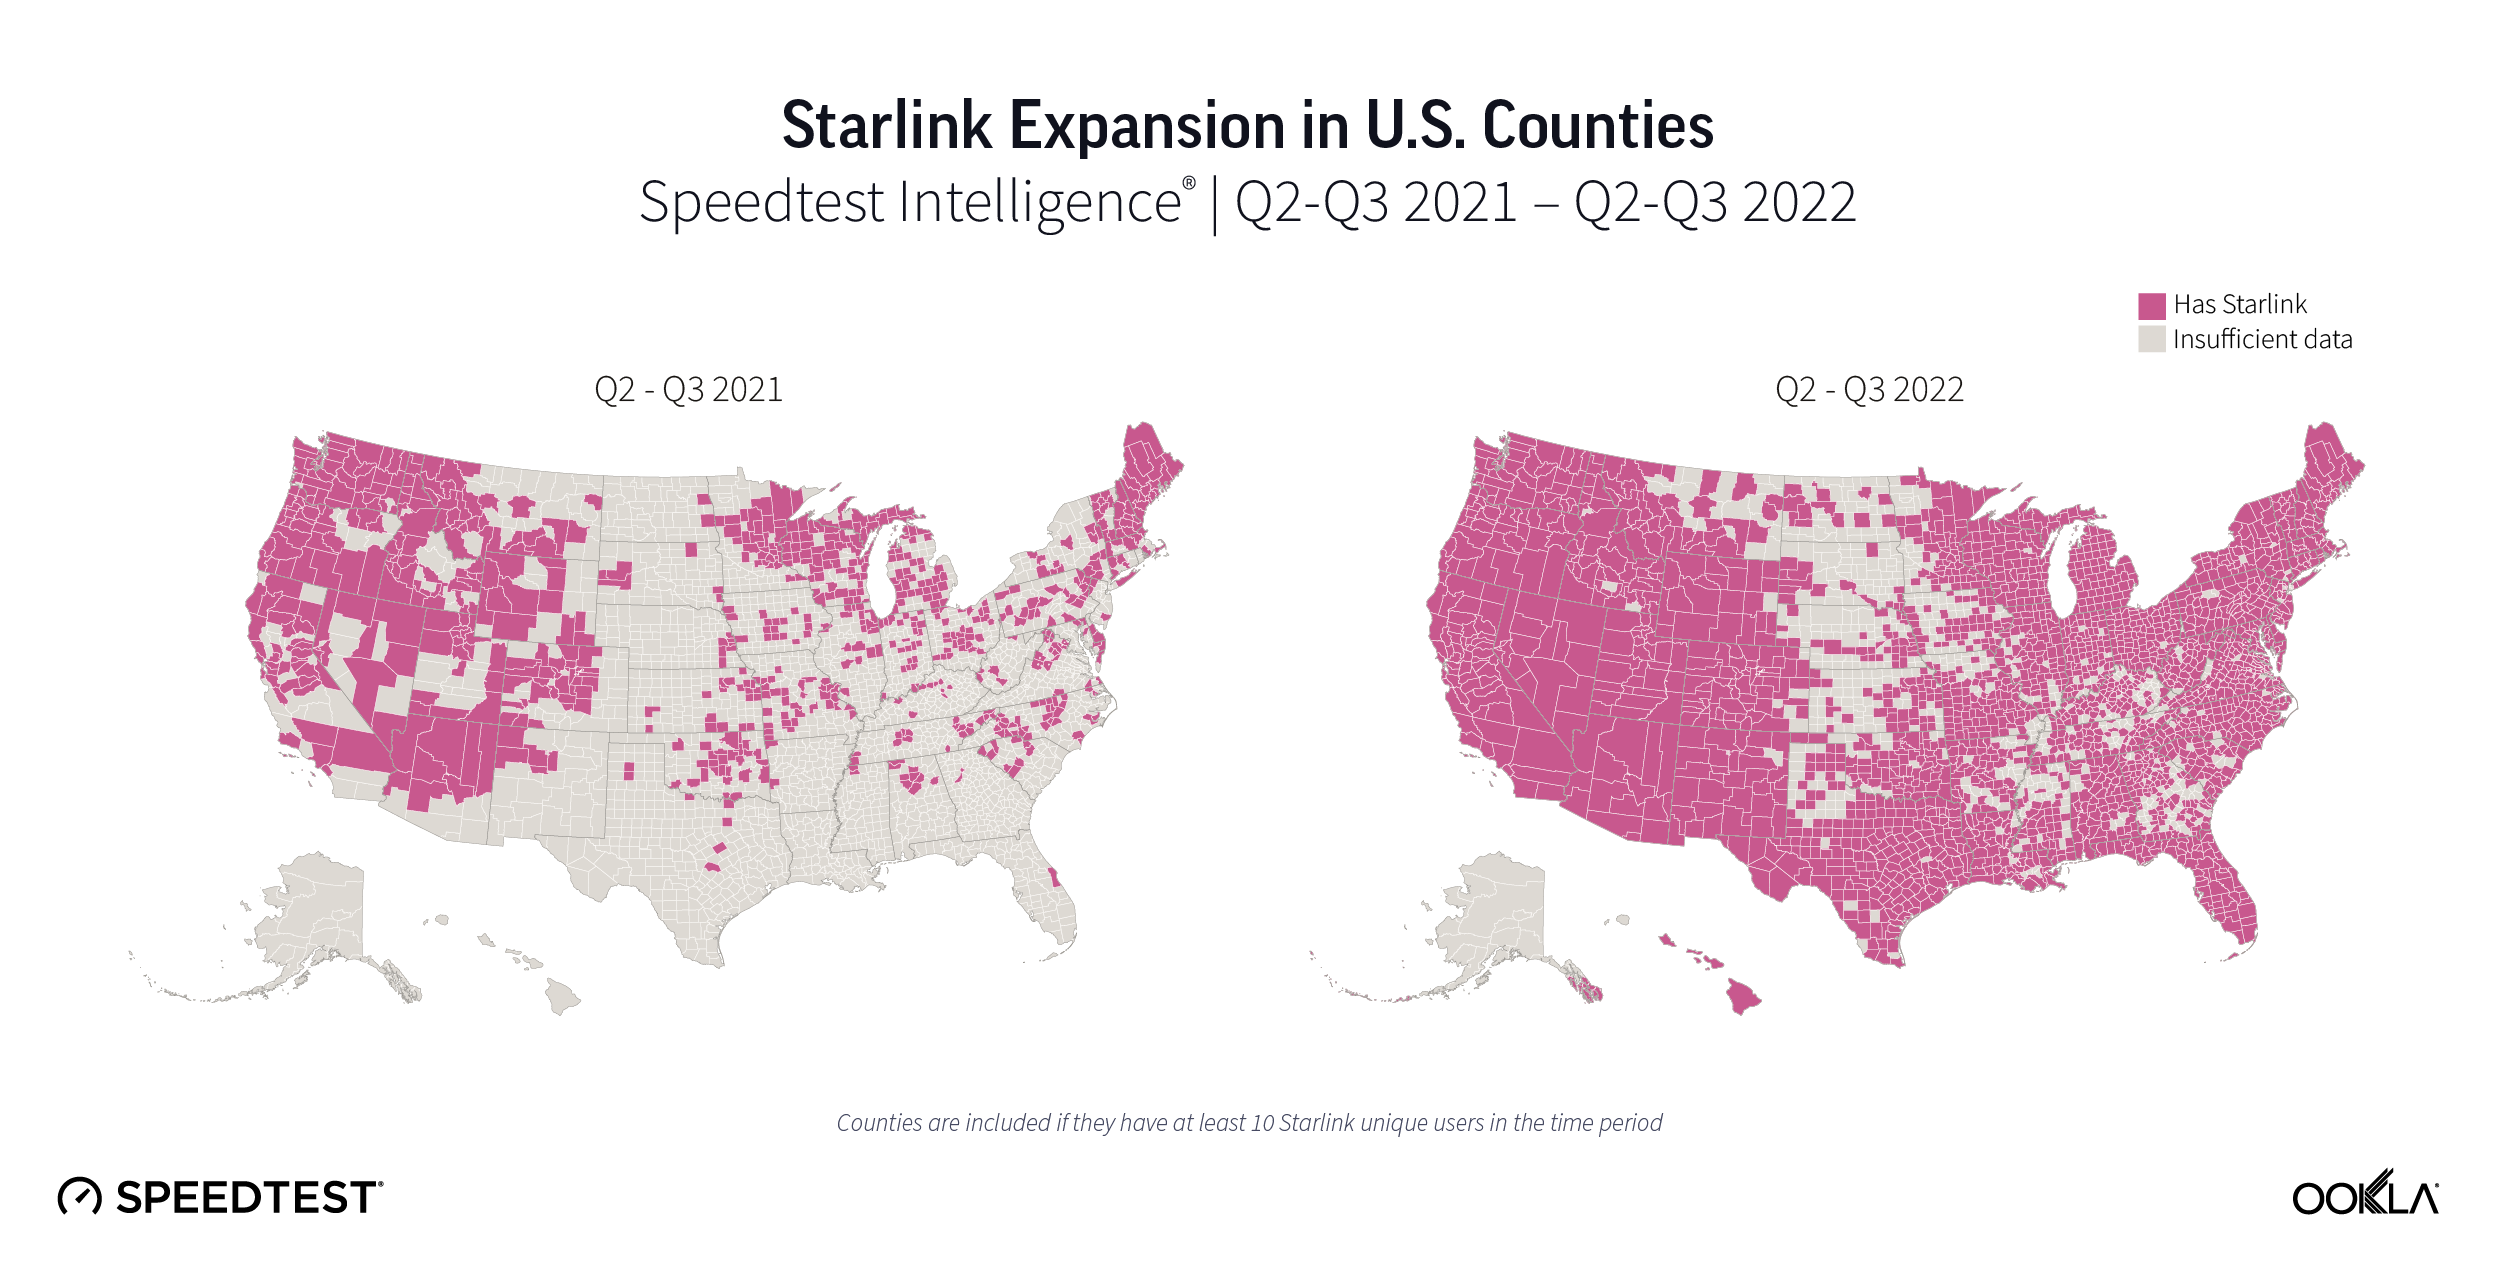
Satellite became more accessible but performance slowed
2022 saw a proliferation of fast, low-earth orbit (LEO) satellite internet from Starlink across the world. Q1 2022 saw Starlink speeds increase year over year in Canada and the U.S., with Starlink in Mexico having the fastest satellite internet in North America, Starlink in Lithuania the fastest in Europe, Starlink in Chile the fastest in South America, and Starlink in Australia the fastest in Oceania.
Q2 2022 saw Starlink speeds decrease in Canada, France, Germany, New Zealand, the U.K., and the U.S. from Q1 2022 as Starlink crossed the 400,000 user threshold across the world. Starlink in Puerto Rico debuted as the fastest satellite provider in North America. Starlink outperformed fixed broadband averages in 16 European countries. Starlink in Brazil had the fastest satellite speeds in South America. And Starlink in New Zealand was the fastest satellite provider in Oceania.
During Q3 2022, Starlink performance dipped once again from Q2 2022 in Canada and the U.S., while remaining about the same in Chile. Starlink in Puerto Rico and the U.S. Virgin Islands had the fastest satellite speeds in North America, while Starlink in Brazil again was the fastest satellite provider in South America.
With Viasat, HughesNet, and Project Kuiper set to launch huge LEO constellations in 2023, consumers around the world are poised to have more fast satellite internet options, particularly as the European Commission makes its own play for a constellation and Eutelsat and OneWeb potentially merging.
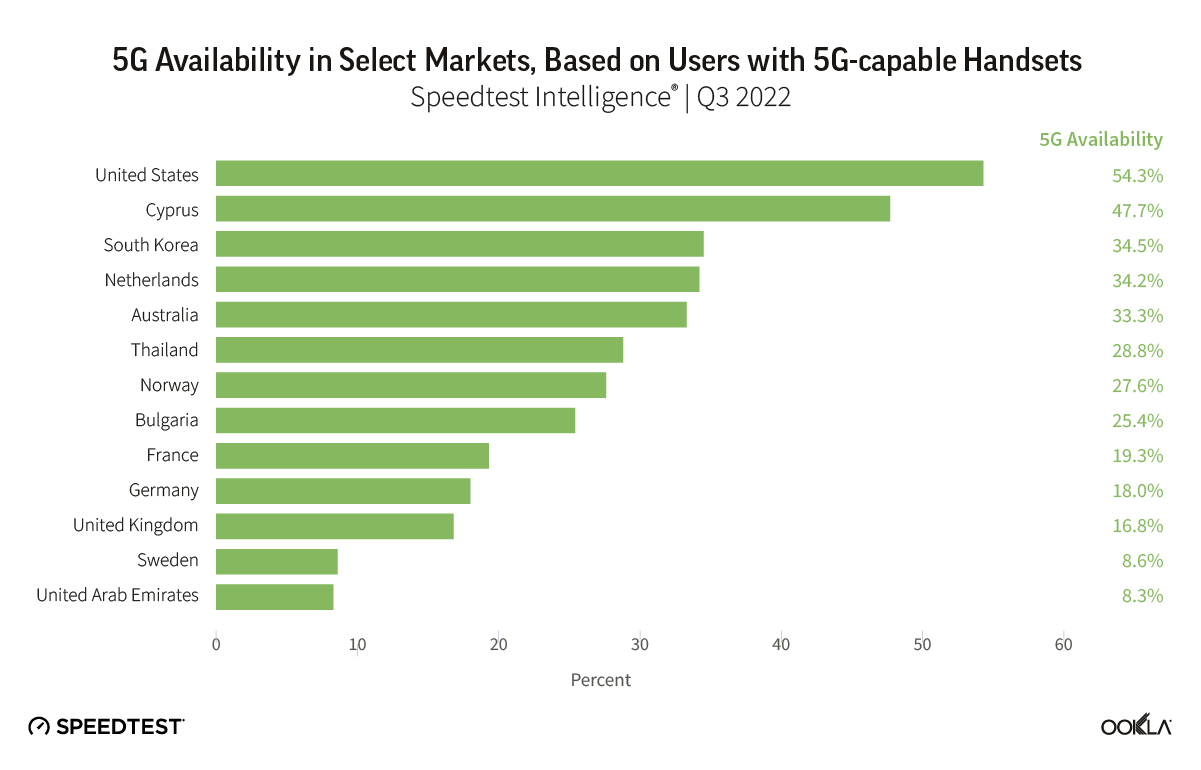
5G Availability points to on-going challenges
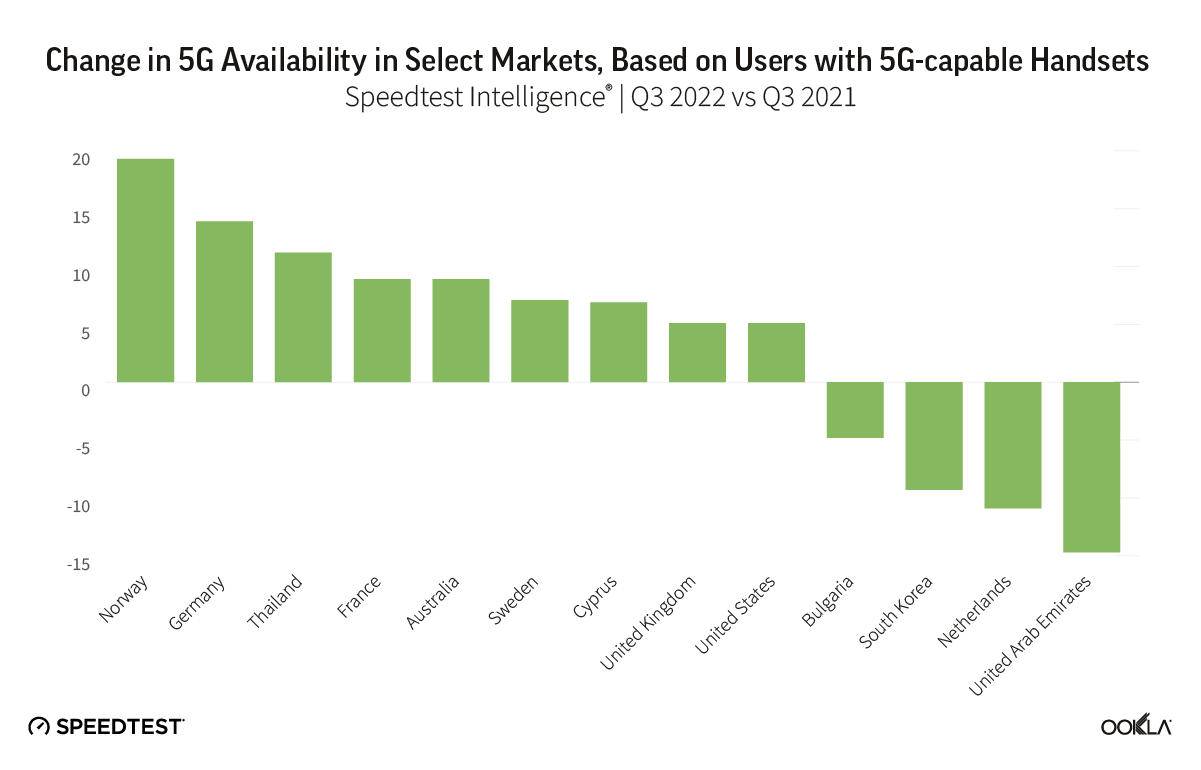
5G Availability measures the proportion of Speedtest users with 5G-capable handsets, who spend a majority of time connected to 5G networks. It’s therefore a function of 5G coverage and adoption. We see wide disparity in 5G Availability among markets worldwide, with for example the U.S. recording 54.3% in Q3 2022, well ahead of markets such as Sweden and the U.A.E., with 8.6% and 8.3% respectively.
Critical levers for mobile operators to increase 5G Availability include:
Increasing 5G coverage by deploying additional base stations
Obtaining access to, or refarming, sub-GHz spectrum, to help broaden 5G coverage, as sub-GHz spectrum has superior propagation properties than that of higher frequency spectrum bands.
Encouraging 5G adoption among users with 5G-capable handsets.
Speedtest Intelligence points to 5G adoption challenges in some markets, with 5G Availability dropping in Bulgaria, South Korea, the Netherlands, and the U.A.E. As more users acquire 5G-capable devices, operators need to balance their pricing models to ensure users have sufficient incentives to purchase a 5G tariff.
Where 5G continues to fail to reach
Speedtest Intelligence showed 29 countries in the world where more than 20% of samples were from 2G and 3G connections (combined) during Q3 2022 and met our statistical threshold to be included (down from 70 in Q3 2021). These are mostly countries where 5G is still aspirational for a majority of the population, which is being left behind technologically, having to rely on decades-old technologies that are only sufficient for basic voice and texting, social media, and navigation apps. We’re glad to see so many countries fall off this list, but having so many consumers on 2G and 3G also prevents mobile operators from making 4G and 5G networks more efficient. If operators and regulators are able to work to upgrade their users to 4G and higher, everyone will benefit.
Countries That Still Rely Heavily on 2G and 3G Connections
Speedtest IntelligenceⓇ | Q3 2021
Country
2G & 3G Samples
Central African Republic
76.2%
Turkmenistan
58.5%
Kiribati
51.6%
Micronesia
47.4%
Rwanda
41.1%
Belarus
39.7%
Equatorial Guinea
37.7%
Afghanistan
36.7%
Palestine
33.5%
Madagascar
27.5%
Sudan
27.4%
Lesotho
26.5%
South Sudan
26.3%
Benin
26.0%
Guinea
25.5%
Cape Verde
24.3%
Tonga
24.3%
Syria
23.4%
The Gambia
23.4%
Ghana
23.3%
Palau
22.9%
Niger
22.8%
Tajikistan
22.7%
Mozambique
22.4%
Guyana
21.8%
Togo
21.8%
Congo
21.1%
Moldova
20.8%
Saint Kitts and Nevis
20.0%
We were pleased to see the following countries come off the list from last year, having dropped below the 20% threshold: Algeria, Angola, Anguilla, Antigua and Barbuda, Armenia, Barbados, Bosnia and Herzegovina, Botswana, Burundi, Caribbean Netherlands, Cook Islands, Dominica, Ecuador, El Salvador, Ethiopia, Gabon, Grenada, Haiti, Honduras, Jamaica, Liberia, Mauritania, Namibia, Nigeria, Papua New Guinea, Saint Lucia, Saint Vincent and the Grenadines, Sierra Leone, Solomon Islands, Somalia, Suriname, Swaziland, Tanzania, Trinidad and Tobago, Uganda, Ukraine, Uzbekistan, Vanuatu, Venezuela, Yemen, Zambia, and Zimbabwe. While countries like Belarus, Cape Verde, Central African Republic, Guinea, Guyana, Madagascar, Palestine, Rwanda, South Sudan, Tajikistan, Togo, and Turkmenistan are still on this list, they have improved the percentage of their samples on these outmoded technologies when compared to last year by at least 10 points. Palestine improved by more than 50 points. 2G and 3G samples in Kiribati increased 3.2 points when comparing Q3 2022 to Q3 2021.
We’re glad to see performance levels normalize as 5G expands to more and more countries and access improves and we are optimistic that 2023 will bring further improvements. Keep track of how well your country is performing on Ookla’s Speedtest Global Index™ or track performance in thousands of cities worldwide with the Speedtest Performance Directory™.
Ookla retains ownership of this article including all of the intellectual property rights, data, content graphs and analysis. This article may not be quoted, reproduced, distributed or published for any commercial purpose without prior consent. Members of the press and others using the findings in this article for non-commercial purposes are welcome to publicly share and link to report information with attribution to Ookla.
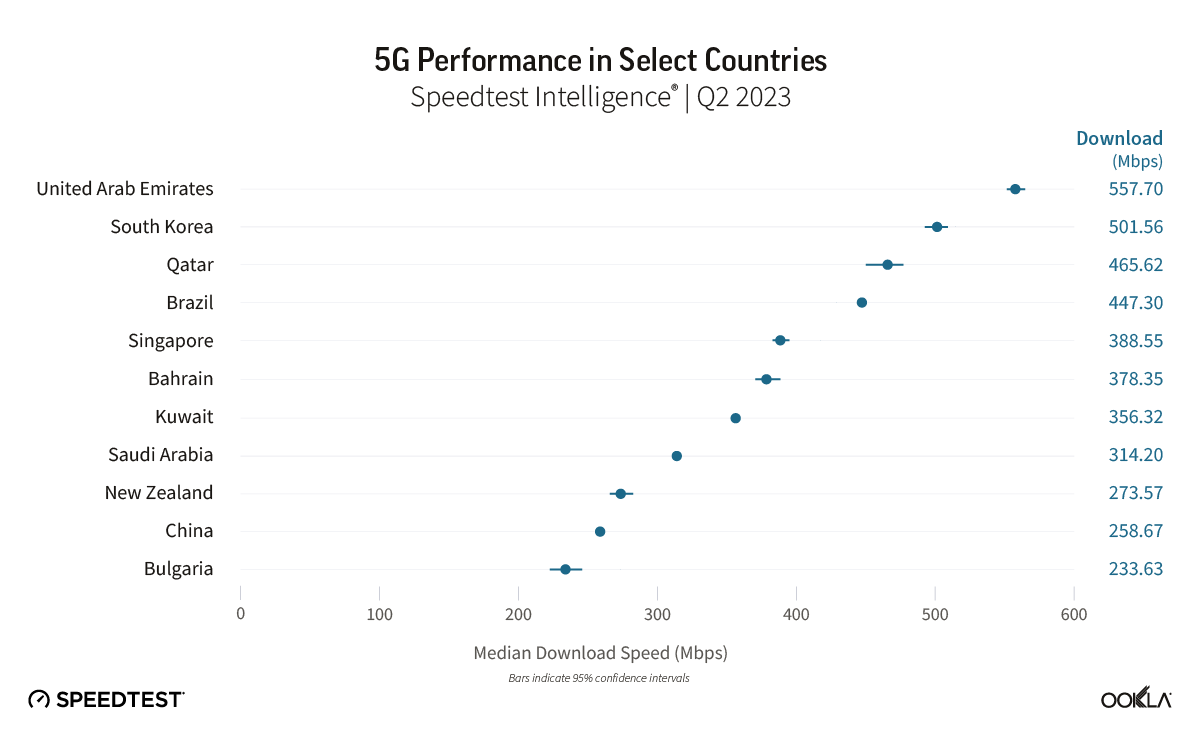
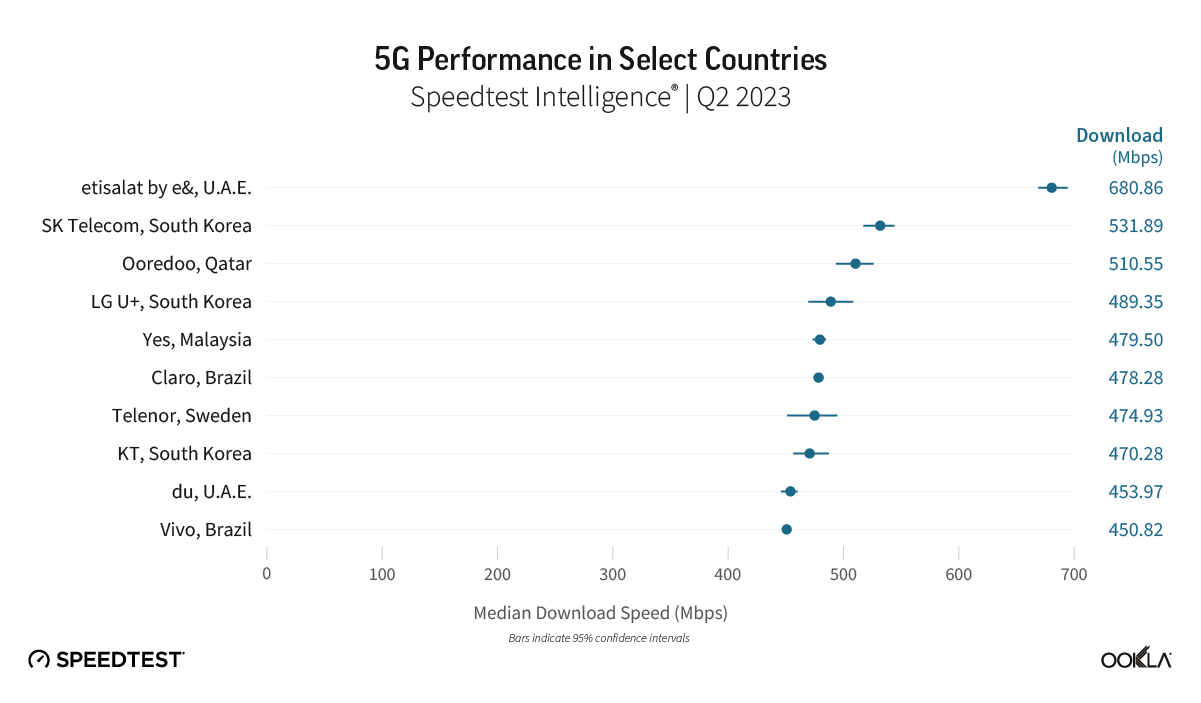
Top-performing global 5G market and network operator. The U.A.E. was the fastest 5G market globally in Q2 2023 according to OoklaⓇSpeedtest IntelligenceⓇ data, with growing competition between the nation’s two network operators helping to drive overall performance in the market to reach a median download speed of 557.63 Mbps. etisalat by e& was the fastest 5G operator globally with a median download speed of 680.73 Mbps.
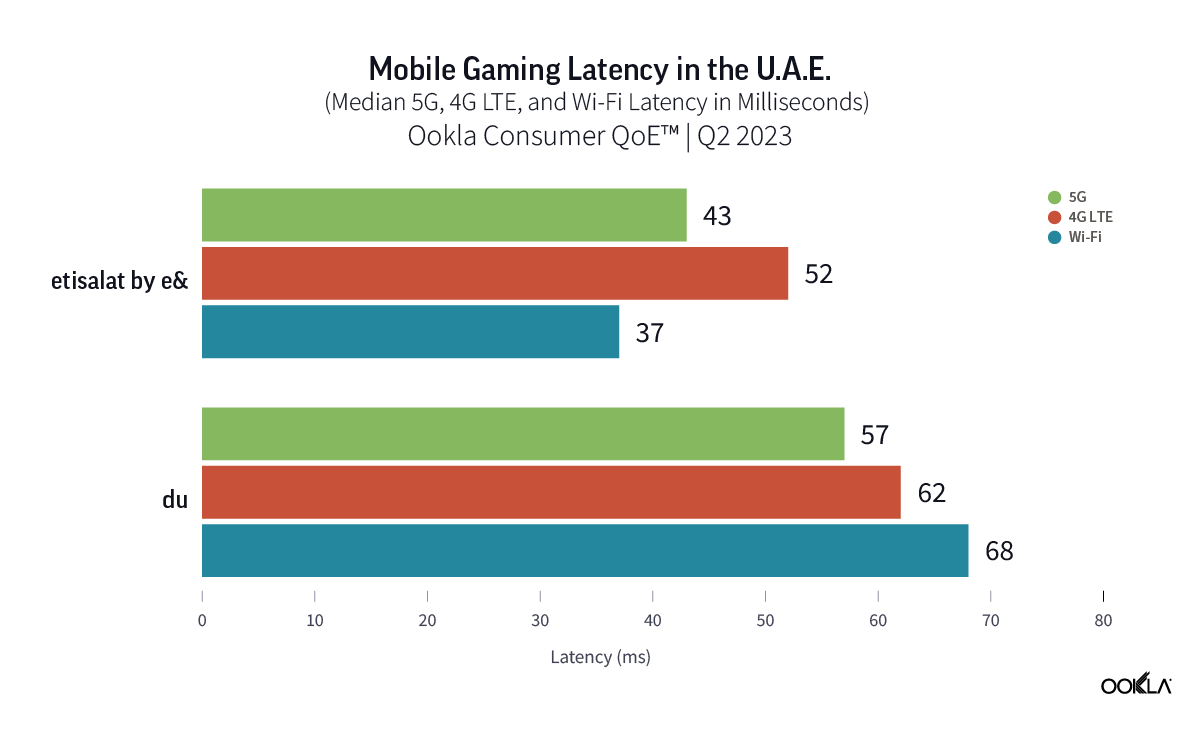
5G networks trump 4G-LTE for mobile gaming and video streaming experiences. Users accessing both etisalat by e&’s and du’s 5G networks experienced median gaming latency of 43 ms and 57 ms respectively, lower than those recorded across 4G LTE. 5G users also experienced improved video start times and experienced less buffering when streaming video compared to those on either 4G LTE or Wi-Fi.
Improved network experience driving industry leading Net Promoter Scores (NPS). With 5G driving improved experiences across use cases such as mobile gaming and video streaming, and with the U.A.E. ranking first in terms of median 5G performance, it’s no surprise that NPS in the market are leading the industry. Indeed, 5G users in the market are more likely to recommend the nation’s networks when compared to 4G, with etisalat by e& leading the market with a score of 64.7 in Q2 2023, and du following with 46.7.
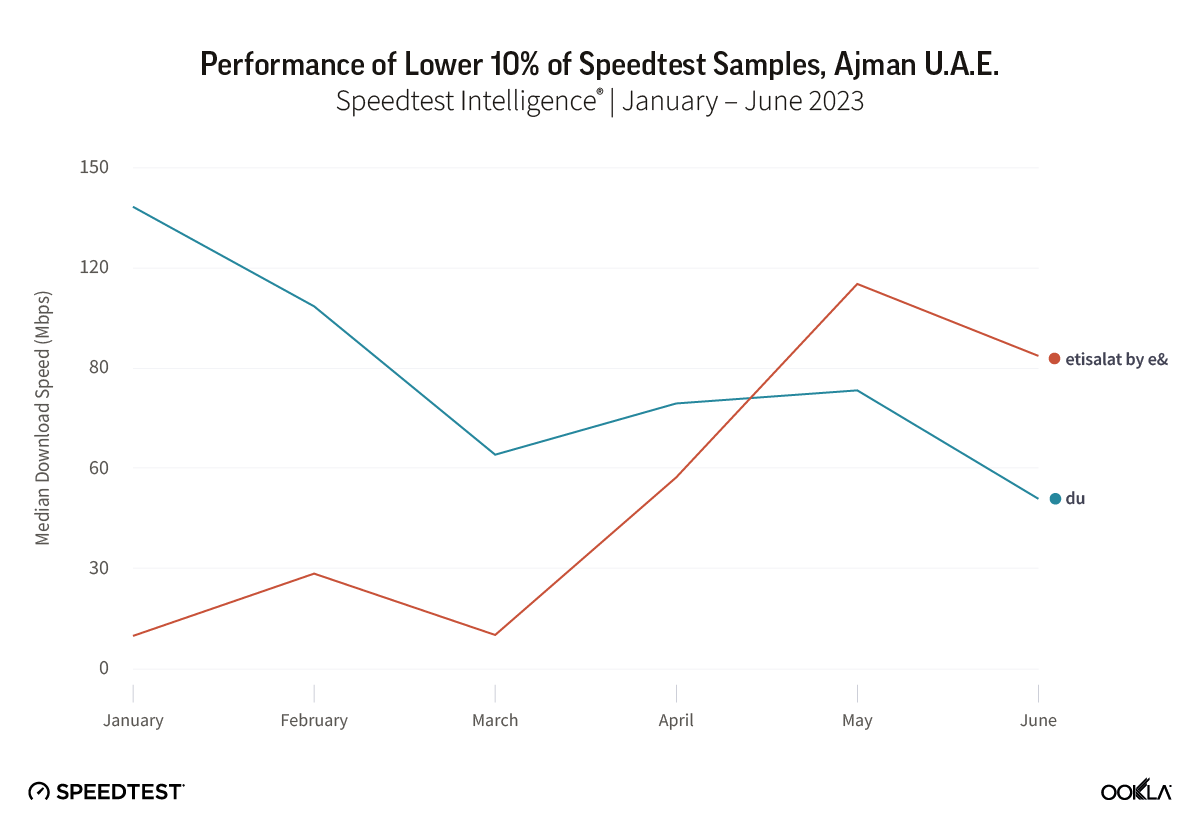
Lower 10% of Speedtest samples point to room for improvement. du led the market for 5G Consistency – the proportion of Speedtest samples that met a minimum performance threshold of 25 Mbps download and 5 Mbps upload during Q2 2023. Reviewing 5G performance of the lower 10% of samples at a city-level highlights where etisalat by e& has been targeting improvements, while du’s has seen its performance erode quarter-on-quarter.
Return to economic growth driving mobile market competition
etisalat by e& and du both launched commercially available 5G services across the U.A.E. in Q2 2019, following the allocation of spectrum for 5G use by U.A.E. regulator, the TDRA (Telecommunications and Digital Government Regulatory Authority). Since then, both operators have rolled out 5G networks aggressively, achieving near universal 5G population coverage as of 2022. Both operators have had to contend with a challenging macroeconomic environment brought on by the COVID-19 pandemic, which led to declining mobile revenues, constrained prepaid spending, and reduced roaming and device revenues.
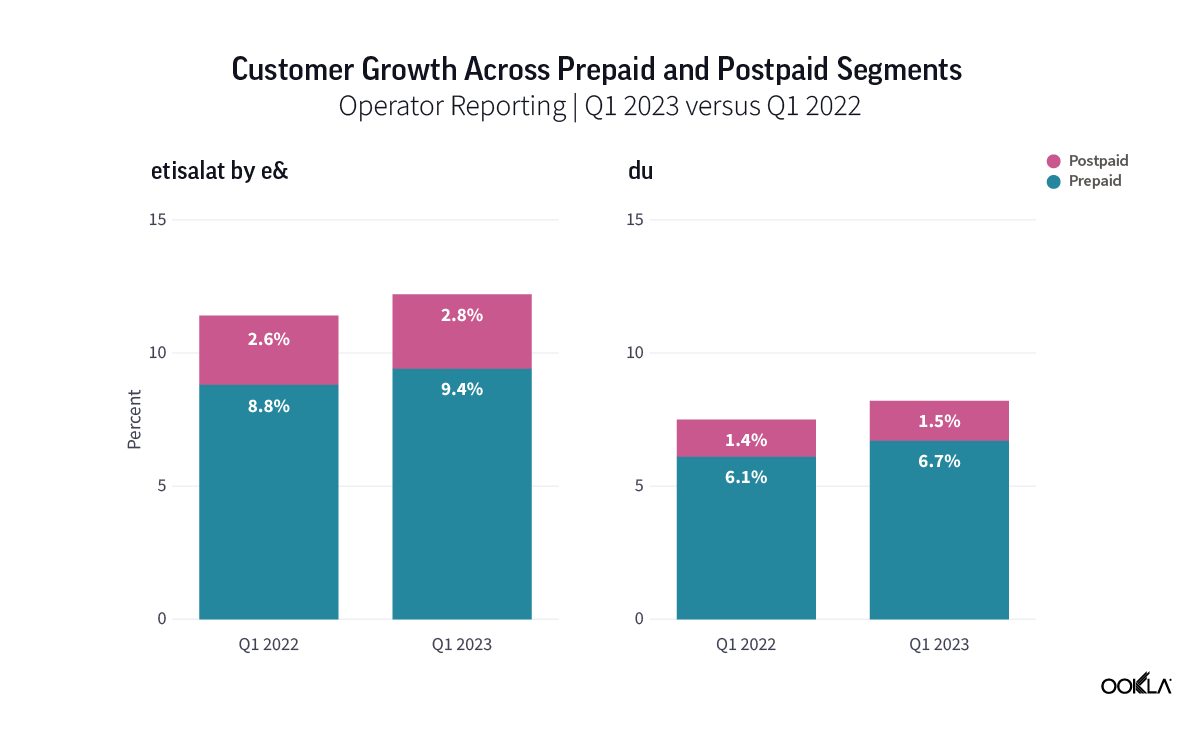
However, 2022 saw growth return to the market with etisalat by e&’s U.A.E. mobile revenues increasing by 6.0% to reach 11,406 million AED, while du’s mobile revenues grew by 8.4% to reach 5,748 AED million. The outlook for the U.A.E. economy going forward is very positive, with the IMF predicting GDP growth of 3.5% in 2023, following a strong rebound in 2022 of 7.4% as COVID-19 restrictions were lifted, international visitors returned to the country and rising oil prices helped bolster economic growth. For the nation’s mobile network operators, this return to growth is driving increased competition as both operators seek to demonstrate network leadership, convert prepaid users to postpaid, while also focusing on driving enhanced customer experiences and offering new digital services.
Both mobile network operators are prioritizing the growth of their postpaid customer bases. For example, subscribers of either operator can choose plans that allow them to pick and choose additional services with a strong focus on entertainment options, such as video streaming services, live sports, and mobile gaming, among others.
U.A.E. leads on 5G performance globally
The U.A.E. was the fastest 5G market globally in Q2 2023, according to Ookla Speedtest Intelligence data, recording a median download speed of 557.63 Mbps, with South Korea placing second at 501.56 Mbps.
etisalat by e& places first in global 5G performance stakes
etisalat by e& was the fastest operator within the U.A.E. and globally on 5G, recording a median download speed of 680.73 Mbps during Q2 2023, ahead of du’s 453.93 Mbps. The same was true for 4G LTE, with etisalat by e& recording a median download speed of 83.35 Mbps, ahead of du’s 64.96 Mbps. 5G performance between the two mobile operators remained similar throughout 2022, peaking in time to support Dubai EXPO 2020. Both operators increased speeds through Q4 2022 and Q1 2023, helping drive overall 5G performance in the U.A.E. to reach 557.63 Mbps, but du’s performance declined in Q2 2023, with etisalat by e& extending its 5G performance lead to 226.80 Mbps.
Among a selection of the top-performing 5G networks globally by median download speed, etisalat by e& ranked first in Q2 2023. Du’s 5G performance also ranked it among the world’s fastest, which reflect the strong position of the GCC States, and leading markets in Asia Pacific, in terms of 5G performance.
Recent news indicates that both operators will continue to drive investment toward further performance gains, while also looking to offer new use cases over their 5G networks. At MWC Barcelona 2023, etisalat by e& announced the commercial launch of its 5G Standalone (SA) network in the U.A.E., which will initially be dedicated to fixed-wireless access (FWA) customers. At the same time, du announced an agreement with Huawei to collaborate on 5G-Advanced technology and use cases.
etisalat by e& leading on 5G download performance across U.A.E. cities
Speedtest Intelligence data showed that etisalat by e& was the leading operator across all major cities in the U.A.E. for both median 5G download performance and multi-server latency in Q2 2023. It also led on median 5G upload speed in Abu Dhabi, Dubai and Sharjah, however there was no statistically significant difference between it and du in Al Ain and Ajman.
Lower 10% of Speedtest samples point to need for further improvement
Median 5G performance allows us to gauge the midpoint of user experience on 5G networks, however it doesn’t always tell the full story, as 5G performance can vary widely, depending on factors such as the spectrum used, network congestion, and the distance and any obstacles between the user device and the cell site. Ookla tracks network Consistency, which for 5G networks records the proportion of samples which meet or exceed 25 Mbps download speed (the recommended speed for streaming in 4K) and 3 Mbps upload speed.
du and etisalat by e& both performed strongly on 5G Consistency, with scores of 92.1% and 90.9% respectively. Drilling down into the city-level data, and looking at performance for the lowest 10% of samples, reveals some potential improvement points for both operators. For the city of Ajman, etisalat by e& has recorded a significant improvement in the lower 10th percentile of 5G samples, increasing from 9.76 Mbps in January to 93.67 Mbps in June. However despite the increase, its performance in Ajman remains below that recorded in other U.A.E. cities. du on the other hand has returned more stable 5G performance among the lower 10% of samples in the city over the past six months, but is seeing performance decline, from 138.33 Mbps in January to 50.85 Mbps in June.
5G delivering improved mobile gaming and video streaming experiences
With both operators keen to grow their customer bases and prioritizing migration toward higher value postpaid subscribers, translating 5G performance gains into discernible improvements for the end-user experience is vital.
Consumers in the U.A.E. spent on average 4.7 hours per day playing mobile games during 2021, the most of all MENA markets, according to data.ai’s State of MENA 2022. Usage continues to grow, fueled by a young and tech-savvy population with high disposable income. 5G offers the potential for lower latency than previous generations of mobile technology, which alongside higher throughput, enables improved experiences for both consumer and enterprise use cases that rely on a high level of network responsiveness. This is particularly true for online gaming and cloud streaming of games. For example, network response times are critical for Call of Duty Mobile (which etisalat by e& has bundled with some of its postpaid plans.)
According to Ookla Consumer QoE™ data, etisalat by e& recorded lower median latency across both its mobile and fixed networks when compared to du during Q2 2023. 5G latency for both operators was lower than for 4G LTE, with etisalat by e& achieving a 5G latency of 43 ms, and du 57 ms. Wi-Fi performance differed between the operators, with etisalat by e&’s Wi-Fi recording the lowest latency across all access types, while du’s Wi-Fi latency lagged behind its mobile network latency performance.
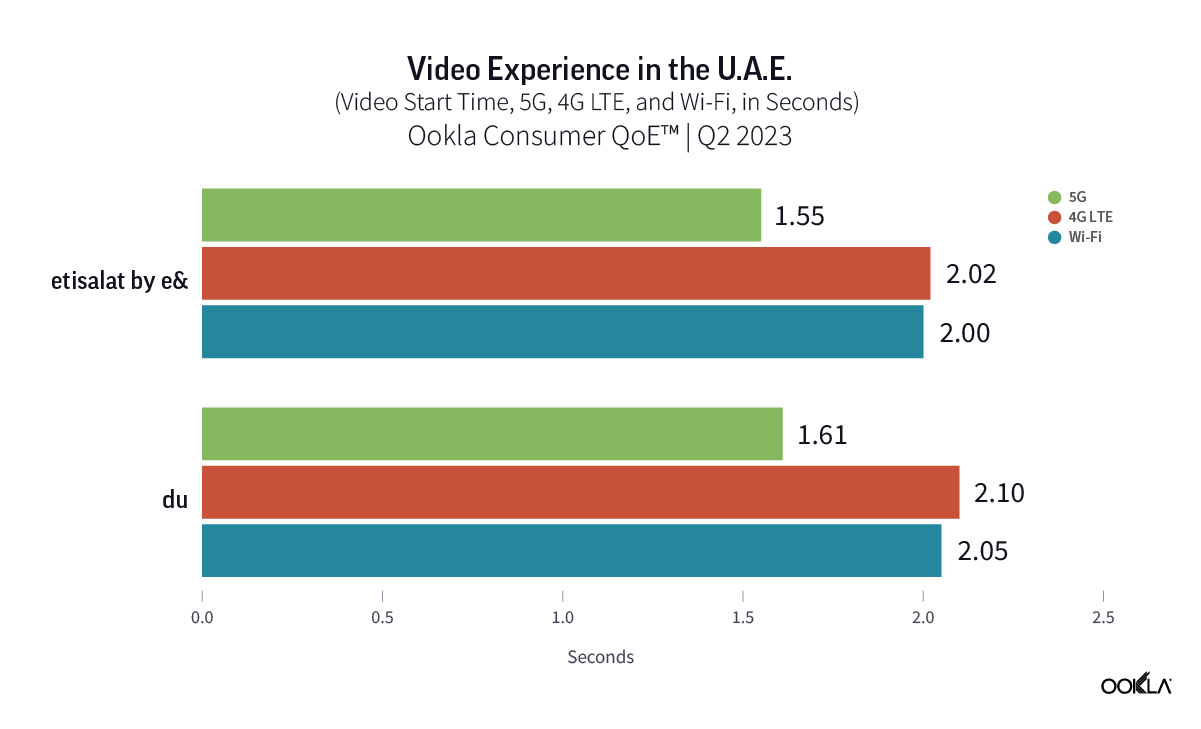
Video content is a primary focus for both network operators in the U.A.E. and a common route for operators globally to add value to consumer mobile subscriptions. We examined Ookla Consumer QoE data, looking at two key video streaming metrics as measures of the consumer experience delivered: video start time and video rebuffering ratio.
Video start time measures the time between when a user clicks play, or the video auto-starts, and when the first frame of a video is rendered. Based on Ookla’s Consumer QoE data for Q2 2023, our results showed that 5G networks offered a faster video start time for both network operators compared to their 4G LTE or Wi-Fi networks, of almost half a second.
Video rebuffering ratio compares the time users have experienced buffering during a video to the total playtime of the video, excluding the initial video start time. Rebuffering occurs when the video stalls during playback and the user must wait for the video to resume. It is a major source of poor quality of experience, and if rebuffering is severe enough, it can lead to audience abandonment and can also serve as an indication of poor overall network performance. In good news, Ookla’s Consumer QoE data for Q2 2023 showed a substantial reduction in median video rebuffering ratios for both network operators, with rebuffering reduced to nearly 0% on 5G for both networks.
5G driving an uplift in industry-leading NPS scores for both operators
With the fastest median 5G download performance globally, it’s no surprise that NPS for 5G users within the U.A.E. are leading the industry. NPS is a key performance indicator of customer experience, categorizing users into Detractors (score 0-6), Passives (score 7-8), and Promoters (score 9-10), with the NPS representing the percentage of Promoters minus the percent of Detractors, displayed in the range from -100 to 100.
Ookla’s Speedtest Intelligence data showed that du’s 5G service recorded the largest difference in NPS when comparing users on its 4G LTE network to those on 5G during Q2 2023, with an uplift of 61.0 basis points to reach 46.7. etisalat by e& recorded the higher NPS scores on its 5G network, of 64.7, while its 4G LTE NPS score of 40.4 was equally impressive.
Both operators in the U.A.E. are in prime position to capitalize on their 5G network investment to date, which is already helping drive improved consumer experiences on their networks. They are also poised to take advantage of the deployment of 5G Standalone networks in the market, offering further performance gains, but also opening up opportunities to target services for key enterprise verticals that among other things often demand highly reliability, as well as low latency communications.
Ookla retains ownership of this article including all of the intellectual property rights, data, content graphs and analysis. This article may not be quoted, reproduced, distributed or published for any commercial purpose without prior consent. Members of the press and others using the findings in this article for non-commercial purposes are welcome to publicly share and link to report information with attribution to Ookla.
Several Middle Eastern countries, including Bahrain, Jordan, Qatar, and the U.A.E., have emerged as leaders in fiber deployment and adoption. The introduction of gigabit packages and the increase in entry-level speeds have significantly boosted their ranking in the Speedtest Global Index® for fixed broadband. This article examines the factors driving performance in these countries, the initiatives of ISPs to enhance indoor performance, and key enablers for wider gigabit internet adoption in the region.
Key Takeaways:
According to Ookla’s Speedtest Intelligence®, the U.A.E. leads the Middle East in fixed broadband performance in Q1 2024. The U.A.E. achieved a median download speed of 270.91 Mbps and an upload speed of 124.37 Mbps. Meanwhile, Bahrain and Qatar saw significant improvements in download and upload speeds, while the median download speed in Jordan rose rapidly from a small base, surpassing Saudi Arabia by Q1 2024.
ISPs are addressing indoor performance bottlenecks with more modern consumer premise equipment (CPE). In-premise connectivity is crucial to guarantee maximum throughput on-premise. That is why ISPs started bundling Wi-Fi 6 compatible CPEs and deploying fiber-to-the-room (FTTR) for ubiquitous gigabit wireless access indoors.
Affordability is a barrier to wider gigabit adoption in the Middle East. While geography, level of competition, and government policies all impact fiber deployment, affordability is key to unlocking faster speeds in the region. Making gigabit plans more accessible can help operators boost fiber subscribers and aspiring countries to move up the Speedtest Global Index.
The U.A.E. tops the Middle East in Speedtest Global Index for fixed broadband
The analysis focuses on countries in the Middle East that are leading in fiber coverage, adoption, and speed enhancements, namely Bahrain, Jordan, Qatar, Saudi Arabia, and the U.A.E. These achievements were thanks to significant progress by local ISPs in extending fiber coverage, encouraging migration to higher-speed plans, and making services more affordable. Government support has been vital in accelerating fiber roll-outs to keep pace with the demand for data services and to ensure universal access to high-speed internet as part of national broadband development strategies.
As a result, these countries continue to improve their Speedtest Global Index rankings. For example, the U.A.E rose from 18th in June 2020 to the second position in March 2024. Jordan jumped from 64th to 33rd while Bahrain jumped up 32 places to 63rd in the Index over the same period. Qatar’s position fluctuated between 29 and 45, with steady improvements since 2021. Saudi Arabia’s speed increase rate has been more modest than in other markets, causing a drop in the global ranking by 11 places to 46th in March 2024. The country is the largest in the group, which makes fiber coverage more limited outside the big cities, while there is a relatively large base of legacy copper connections.
Speedtest Global Index™ Rankings for Fixed Broadband, Select Countries in the Middle East
Speedtest Intelligence® | June 2020-March 2024
Speedtest Global Index Rankings for Fixed Broadband, Select Countries in the Middle East
Fixed broadband performance improved as faster entry-level fiber plans and gigabit packages were introduced
According to Speedtest Intelligence, the U.A.E. leads the Gulf region in median download speeds at 270.91 Mbps in Q1 2024, more than double the Q3 2022 figure. This represents the largest speed improvement among the reviewed countries. The turning point came in Q4 2022 when ISPs lifted the minimum broadband package speed from 250 Mbps to 500 Mbps and offered aggressive discounts to encourage upselling to faster fiber packages. The median upload speed also saw notable improvement, reaching 124.37 Mbps in March 2024.
Median Download Speeds for Fixed Broadband, Select Countries in the Middle East
Speedtest Intelligence® | Q1 2022-Q1 2024
Median Download Speeds for Fixed Broadband, Select Countries in the Middle East
Bahrain and Qatar also experienced significant and rapid rises in median download speeds, reaching 83.09 Mbps and 135.34 Mbps, respectively. The ISPs in the two countries saw significant improvements in upload speeds too. Users in Qatar saw the biggest jump in median upload speed, tripling from Q1 2022 to Q1 2024 to 115.74 Mbps. In Bahrain, the median upload speed increased by over 2.7x but remained the lowest of the group at 20.70 Mbps.
In Bahrain, the telecoms regulator mandated ISPs to double the speed of entry-level fiber packages in April 2023 while maintaining the same wholesale prices. This immediately impacted the market, with median broadband download speeds jumping from 48.14 Mbps in Q1 2023 to 70.17 Mbps in Q2 2023 (over 40%).
Qatar was the first country in the GCC to offer 10 Gbps consumer broadband packages. However, Ooredoo and Vodafone maintained a relatively low download speed on entry-level tariffs at 100 Mbps. This changed in June 2023, when they raised the minimum speed to 1 Gbps while offering discounts on more expensive fiber packages. These initiatives resulted in a step change in download speeds, increasing by 41% in Q1 2024 compared to Q2 2023.
Jordan began ramping up its fiber infrastructure in 2013-2014, with strong take-up since 2019 driven by increased competition, extended coverage outside the capital, and rising demand due to the COVID-19 pandemic. The launch of Fibertech, a fiber wholesale company, in 2019 significantly boosted service competition and led to more accessible and affordable fiber services for consumers. Fibertech, set up as a joint venture between ISP Umniah and Jordan Electricity Company, covered 1.2 Million households by July 2023 and planned to reach 1.4 million premises, 70% of Jordan’s households, by the end of that year.
Fiber overtook fixed wireless access (FWA) and ADSL connections in Q2 2021 and represented 56% of fixed broadband connections by the end of 2022. Fiber maintained its upward trajectory, capturing 64% of the market in 3Q 2023 with 513,744 active connections according to the last reported data from the Telecommunication Regulatory Commission (TRC)). Local ISPs have also been increasing the speed of entry-level plans and offering gigabit packages. For example, Orange Jordan introduced 2 Gbps and 10 Gbps plans in May 2023. This accelerated fiber take-up boosted the median speeds for both download and upload, reaching 130.41 Mbps and 108.08 Mbps, respectively, in Q1 2024. Notably, Jordan doubled its median upload speed in two years, narrowing the gap with its median download speed.
In Saudi Arabia, stc led the way by increasing the minimum download speed from 100 Mbps to 300 Mbps in the summer of 2022. Mobily followed suit in 2023 by doubling the speed of its entry-level package and introducing a 1 Gbps broadband plan during Q2 2023. Zain initially reserved higher download speeds (ranging from 200 Mbps to 500 Mbps) for customers on 2-year contracts, while those on 12-month contracts received speeds between 100 Mbps and 300 Mbps. However, in 2023, Zain merged its plans into a standard 18-month contract starting at 200 Mbps, with 1 Gbps at the high end. These initiatives began to impact the market in Q2 2023, when the median download speed surpassed 90 Mbps for the first time, reaching 108.95 Mbps by Q1 2024. Upload speeds also saw significant growth, rising to 53.75 Mbps during this period.
Speedtest Intelligence’s Enrichment API allows us to track the adoption and performance of individual fixed broadband technologies and assess their impact on the Saudi market. For example, the fiber share of stc Speedtest samples has been growing – fiber represented 75.4% of Speedtest samples in March 2024, up from 69.9% in Q4 2023. This increased fiber adoption contributed to raising overall fixed broadband performance across download, upload, and latency metrics and widened the performance gap with legacy DSL lines. This result also highlights the potential for further improvement if most samples (and by extension, customers) switch to fiber.
DSL and Fiber Performance, Saudi Arabia
Speedtest Intelligence® | Q4 2022 – Q1 2024
DSL and Fiber Performance, Saudi Arabia
Improving indoor coverage is key to ensuring maximum fiber performance delivery to customers
ISPs in the analyzed countries have rapidly expanded their fiber footprint and migrated customers to faster broadband services, helping to increase the median download speed. However, the last few meters indoors, closer to the end-users, can be a potential bottleneck to achieving maximum throughput. To address this, local ISPs have taken steps such as:
Offering upgraded CPEs that support Wi-Fi 6. The choice of Wi-Fi standards and spectrum bands directly influences indoor connectivity quality, throughput, and network coverage. Our recent analysis found that over one-third of test samples in the Gulf region reported using Wi-Fi 4 to connect to the fixed CPE. More ISPs are now offering Wi-Fi 6 compatible CPEs and including additional mesh Wi-Fi nodes at no extra costs to improve indoor coverage and speed.
Deploying fiber-to-the-room (FTTR). This relatively new technology involves deploying and extending fiber connectivity to each room, usually through transparent cables, to provide ubiquitous gigabit wireless access. ISPs started deploying this technology in East Asia to differentiate their broadband offering and it is now being adopted by ISPs in the Middle East, including Jordan (Umniah and Zain), Qatar (Ooredoo), Saudi Arabia (Salam, stc), and the U.A.E. (Etisalat by e&).
Making gigabit internet more accessible will unlock faster speeds and drive wider adoption
Countries with small landmasses and populations, and high urbanization, such as Singapore, the U.A.E., Hong Kong (SAR), Iceland, and Monaco, top the Global Speedtest Index. While such geographical and demographic characteristics give an advantage to smaller nations as they facilitate the deployment of fiber infrastructure, other factors including market competition, government support, and service affordability are key to driving mass adoption.
Many of the top 10 markets in the Global Speedtest Index have multiple ISPs competing which drives investments in better technology and continuous upgrades to attract customers. A competitive landscape benefits consumers because it helps to keep prices relatively low. It also accelerates increases in median speeds as ISPs tend to offer free speed upgrades to existing customers. For example, in Hong Kong (which had 28 licensed ISPs as of March 2024) and Singapore, gigabit broadband speeds have been available to residential customers since the early 2010s, and ISPs have eliminated sub-1 Gbps plans. As a result, 85% of residential homes in Singapore and 68.0% in Hong Kong have at least 1 Gbps services. Chile, Latin America’s leader in fixed line performance and fourth in the Speedtest Global Index in Q1 2024, has six ISPs with more than 5% market share, all of which are heavily focused on migrating customers to fiber.
Governments in these leading countries have also prioritized strong digital infrastructure development with significant investment in infrastructure. For example, China has pursued a state-coordinated infrastructure deployment program to promote economic development. In France, the government’s “France Très Haut Débit” initiative aimed to provide fiber optic access to all citizens by 2025 through public-private partnerships. The Singaporean government invested S$1 billion to build the infrastructure of its National Broadband Network (NBN) which supported speeds of up to 10 Gbps and reached more than 95% premises in 2013. In February 2023, it announced an additional investment of up to S$100 million to upgrade the NBN to enable more than half a million households to benefit from speeds of up to 10Gbps by 2028.
While the broadband infrastructure in some countries from the Middle East is gigabit internet-ready, the disparity in income and the high price of these packages hinder the adoption rate of high-speed broadband services. For example, a 1 Gbps fiber line in Hong Kong or Singapore could cost as little as $30 per month, and a plan with a similar speed starts at $100 per month in Qatar, $150 in the U.A.E., $250 in Saudi Arabia, and $345 in Bahrain. This highlights the need to make gigabit plans more affordable if the operators want to boost fiber subscribers and countries aspire to move up the Speedtest Global Index.
As demand for high-speed internet continues to grow, we expect increased adoption of 10 Gbps speeds to support more demanding applications and improve the user experience. Work is underway in some developed markets to build higher-capacity broadband networks to enable new cases and make the infrastructure future-ready. For example, In March 2024, Hong Kong Telecom announced the availability of 50 Gbps lines for residential and business customers. This trend is slowly emerging in the Middle East – Etisalat by E& in the U.A.E and Ooredoo in Qatar announced early experiments with 50G PON technology. We anticipate continued innovation and competition in the region, driving further advancements that will ultimately benefit end-users by delivering faster and more affordable gigabit connectivity options.
For more information about Speedtest Intelligence data and insights, please contact us.
Ookla retains ownership of this article including all of the intellectual property rights, data, content graphs and analysis. This article may not be quoted, reproduced, distributed or published for any commercial purpose without prior consent. Members of the press and others using the findings in this article for non-commercial purposes are welcome to publicly share and link to report information with attribution to Ookla.
Consumers around the world eagerly awaited Samsung’s release of the latest line of its flagship Galaxy S series of smartphones on February 1, 2024. Was the wait worth it? In this article, we analyze how the Samsung Galaxy S24 family measures up against its predecessors in terms of 5G speed and latency during its first several weeks on the market (February 1 – March 24, 2024).
With new chipsets and technologies alongside plenty of other cool new features in Galaxy S24 devices, we examined early results from Speedtest® users in 15 select countries around the world to see whether the Galaxy S24 lineup — comprising the S24, S24+, and S24 Ultra models — outpaced Samsung’s earlier S22 and S23 families for 5G performance. Additionally, we’ve compared the 5G speeds and latency of Apple’s iPhone 15 family — including the iPhone 15, 15 Pro, and 15 Pro Max — against Samsung’s offerings.
It’s important to note that device performance metrics can vary significantly from one country to another. Factors such as government and mobile operator investments in 5G infrastructure, spectrum allocations, and the extent of 5G network deployment all contribute to these variations.
Key takeaways:
The Samsung Galaxy S24 family showed a statistically significant lead for median 5G download speeds in seven out of 15 countries in this study. On the other hand, the Apple iPhone 15 family posted the fastest 5G speeds in only one country. It’s worth noting, however, that speed differences between Galaxy S24 devices and iPhone 15’s were relatively minor in some of the countries analyzed (see the charts below for details).
The S24 family recorded the lowest median 5G multi-server latency in 10 of 15 countries, whereas iPhone 15 devices offered the highest median 5G latency in 10 markets.
Samsung Galaxy S22 models unsurprisingly offered the slowest median 5G download speeds in eight countries, while the Galaxy S23 family was slowest in four countries.
Devices in the Galaxy S24 family experienced the fastest median 5G upload speed in 13 of the 15 countries examined for this analysis. However, upload speeds were much slower than 5G download speeds, ranging from 11.83 Mbps to Mbps to 66.52 Mbps, with median 5G upload speeds of 50 Mbps or better found in only three countries (South Korea, Qatar, and the U.A.E.).
To learn more about what speeds mean in real-world terms, check out our article looking at how much speed users need for a variety of daily mobile activities.
Everyone wants to know if the newest technology is worth the upgrade when they’re investing in an expensive new smartphone. Each device within the Galaxy S24 family has various upgrades (including new AI features), but when it comes to features that impact speed and latency performance, here’s a look at the chipsets and modems for each line of smarthpones in our study:
Samsung Galaxy S24 Ultra models use Qualcomm’s Snapdragon 8 Gen 3 chipset globally, while the S24 and S24+ use it only in Canada, China, Hong Kong, Taiwan, and the United States. The Samsung Exynos 2400 is used elsewhere for the S24 & S24+.
The Galaxy S23 series uses Qualcomm’s Snapdragon 8 Gen 2 worldwide, while Samsung S22 models use an Exynos 2200 chipset in Europe and the Snapdragon 8 Gen 1 elsewhere.
Galaxy S24 devices utilize the Snapdragon X75 5G modem, S23 models have a Qualcomm Snapdragon X70 modem, while S22 models have a Qualcomm Snapdragon X65 modem.
Apple iPhone 15 models use Apple’s A16 Bionic chipset, while iPhone 15 Pro and Pro Max models use the A 17 Pro chip. All devices in the Apple iPhone 15 family utilize Qualcomm’s Snapdragon X70 5G modem.
Do you own one of these devices? See how your speeds compare by taking a quick Speedtest. And to learn more about mobile and fixed broadband performance in cities and regions across the world, visit the Speedtest Performance Directory™, where you’ll find ISP recommendations, insights on mobile and fixed broadband performance, and more.
Digging into the Data: Where does the Samsung Galaxy S24 Family Lead its S22, S23, and iPhone 15 Counterparts Around the Globe?
Early findings from Speedtest Intelligence® reveal that the latest Galaxy S24 family outperformed its predecessors — especially S22 models — in terms of 5G speed across several of the countries we analyzed. While differences in speed between devices were minimal in some countries, S24 models showed significant speed advantages over previous generation Samsung devices in markets like Qatar, the United Arab Emirates, and others.
Does that mean users in those locations should upgrade immediately? Not necessarily. The decision to upgrade depends on various factors, from price to features to performance and more. However, if speed is your primary concern, the Galaxy S24 series is a compelling option, especially for consumers currently utilizing devices from the Galaxy S22 lineup, which is now over two years old.
Read on to see our complete analysis of all 15 countries in this study or select a region below to dig into more localized results.
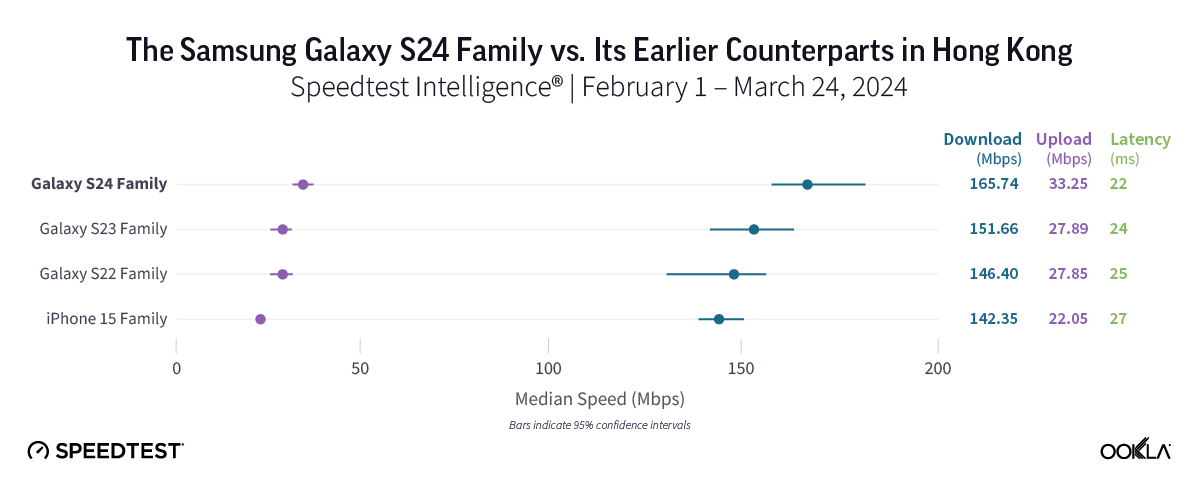
Consumers in Hong Kong who want new features might want to upgrade
Speedtest Intelligence data revealed strong performance for all device families in Hong Kong, with the new Galaxy S24 family performing particularly well, boasting a median 5G download speed of 165.74 Mbps and the lowest median 5G multi-server latency in the market at 21.74 ms. However, the S24’s median 5G download speed was statistically comparable to that of its older Samsung and iPhone 15 peers, making the choice to upgrade currently more about new features than about performance.
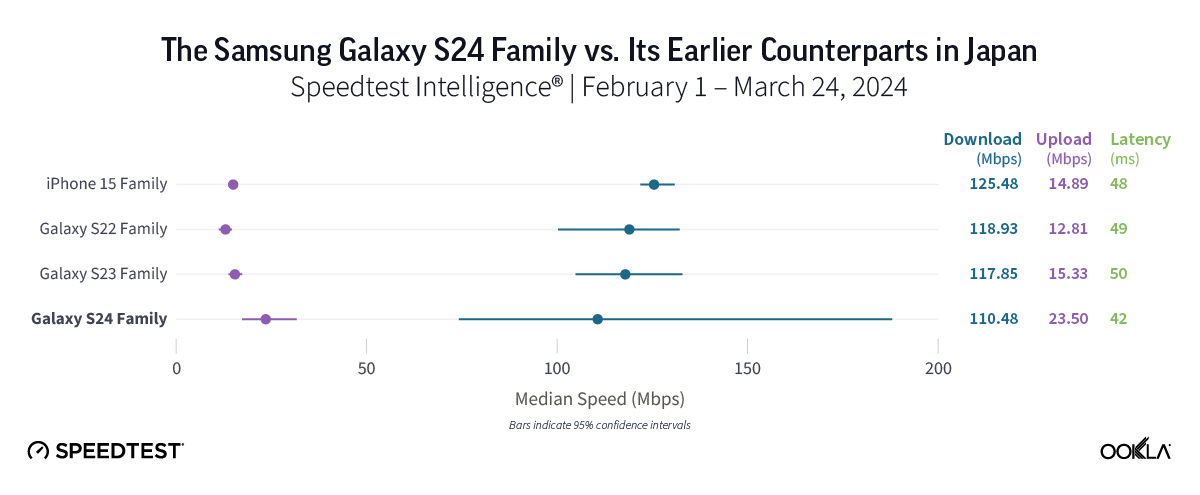
Bottom line: With strong — and similar — 5G download speeds across all device families in Japan, upgrading to a new Galaxy device isn’t a must just yet, unless you want to enjoy the S24 family’s new features.
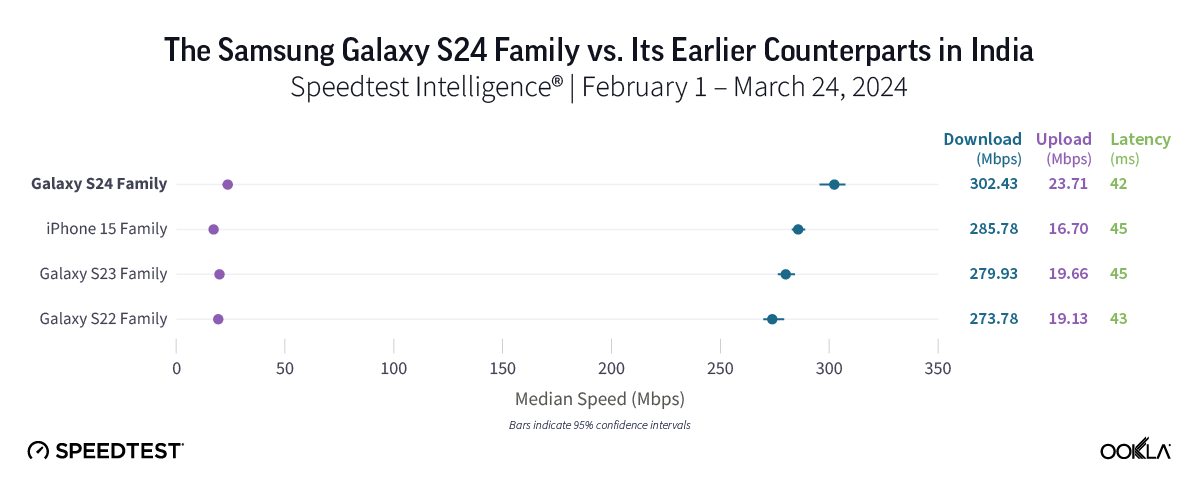
5G speeds were fast across the board in India, where the Samsung Galaxy 24 family held a slight edge
In the early days following the release of the Galaxy S24 series in India, the latest Samsung models led for both 5G download speeds and 5G multi-server latency. While 5G speeds impressed across all device families in India — all notched speeds of at least 273.78 Mbps — Galaxy S24 models posted the top median 5G download speed at 302.43 Mbps and the lowest median 5G multi-server latency at 41.56 ms. On the other hand, Galaxy S22 devices showed the slowest — but still impressive — speeds in India at 273.78 Mbps, while the Samsung Galaxy S23 was just a tick behind at 279.93 Mbps. The iPhone 15 family, meanwhile, clocked in with a median 5G download speed of 285.78 Mbps.
Bottom line: Consumers in India currently using S22 devices might want to upgrade to an S24 model, given the nearly 30 Mbps speed advantage the new devices provided in this study. However, with excellent 5G speeds across all device families and similar speeds for devices in the S22, S23, and iPhone 15 families, users might not feel a huge difference in their 5G experience from one device to another.
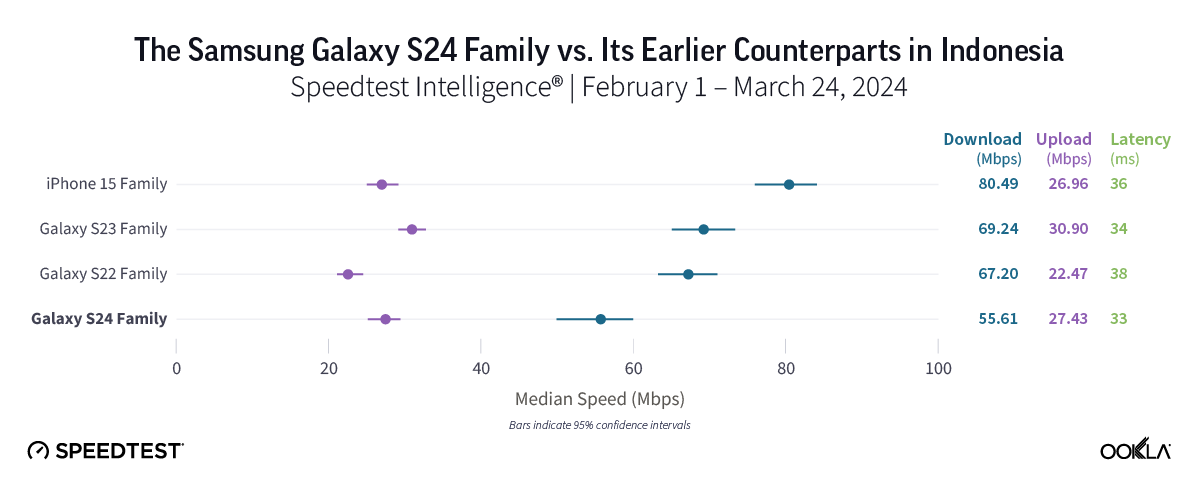
Samsung Galaxy enthusiasts in Indonesia needn’t rush to upgrade to an S24 device — yet
In contrast with what our results showed in most countries, the iPhone 15 family emerged as the leader in Indonesia with a median 5G download speed of 80.49 Mbps. All three Samsung Galaxy families trailed with speeds ranging from 55.61 Mbps for the S24 family to 69.24 Mbps for S23 models. While the iPhone 15 family’s 5G speed was nearly 25 Mbps faster than that of S24 devices, it’s worth noting that the difference among all three Samsung Galaxy models was only about 14 Mbps, and our results revealed no statistical difference in median 5G download speeds between the S22 and S23 families.
Bottom line: Despite the iPhone 15 providing the top speeds in the market, the Galaxy S24 could hold greater long-term potential for consumers in Indonesia, especially when compared to older Samsung models. Equipped with a newer processor and modem, the S24 could see quicker speeds over time as Indonesia’s 5G networks evolve. In the meantime, users shouldn’t experience notable disparities in speed or latency among all three Samsung device families analyzed.
No clear advantage to upgrading to a new Galaxy S24 in Japan
People in Japan who upgraded to a Galaxy S24 device likely haven’t seen a performance boost just yet. While all four device families performed similarly well in Japan, there was no statistical difference in the median 5G download speeds offered by all three Galaxy families, with speeds ranging from 110.48 Mbps to 118.93 Mbps across all three Galaxy devices. The iPhone 15 lineup also had a strong speed at 125.48 Mbps.
Bottom line: With generally similar median 5G download speeds across all device families in Japan, users who are considering upgrading to a new Galaxy smartphone might want to wait. While we anticipate the S24’s speeds to surpass those of its predecessors over time, 5G speeds in the market were quite close across all three Galaxy device families in the early days of the S24’s release.
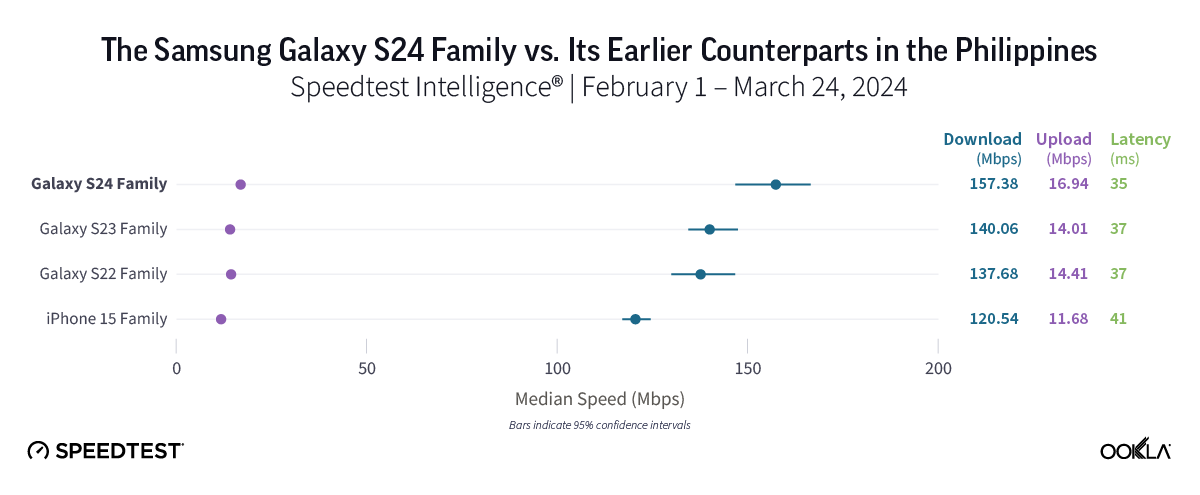
For users in the Philippines who want the fastest 5G, Galaxy S22 users may want to upgrade.
Samsung Galaxy S24 users in the Philippines might have noticed a modest improvement to their 5G speeds compared to those on older S23 and S22 models since they upgraded, as the Galaxy S24 family’s median 5G download speed of 157.38 Mbps was about 20 Mbps faster than that of Galaxy S22’s (137.68 Mbps) and a little over 15 Mbps faster than the Galaxy S23 family (140.06 Mbps). Meanwhile, the iPhone 15 family’s median 5G download speed of 120.04 Mbps trailed all three Samsung Galaxy families in the market.
Bottom line: For users in the Philippines seeking the fastest possible 5G experience, upgrading to an S24 device is worth considering. However, it’s worth noting that the differences in speed between devices wasn’t as stark as that in some other countries, and upgrading likely isn’t for everyone just yet.
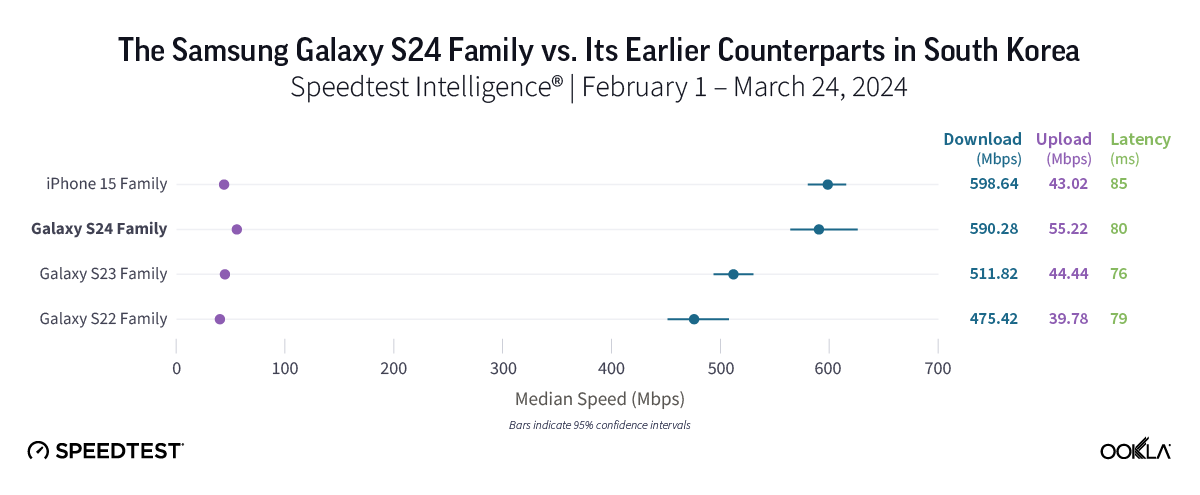
Samsung Galaxy S24 and iPhone 15 much faster on 5G in South Korea than S22 devices
In South Korea, home to the first widespread 5G launch in the world, our results reflected outstanding 5G speeds, with the iPhone 15 and Samsung Galaxy S24 families posting similar median 5G download speeds of 598.64 Mbps and 590.28 Mbps, respectively. The S22 family, meanwhile, offered the “slowest” 5G speeds in South Korea, posting an excellent median 5G download speed of 475.42 Mbps, while Galaxy S23 devices came in at 511.82 Mbps.
Bottom line: 5G users in South Korea can expect remarkable 5G speeds across the board, regardless of their device. However, Samsung Galaxy loyalists who currently use S22 models might want to consider moving to an S24 model, given that the S24 family was over 100 Mbps faster than Galaxy S22’s, while also offering the top median 5G upload speed in the market at 55.22 Mbps. For users who prioritize the fastest 5G experience, Galaxy S24’s and iPhone 15’s are both worth a look.
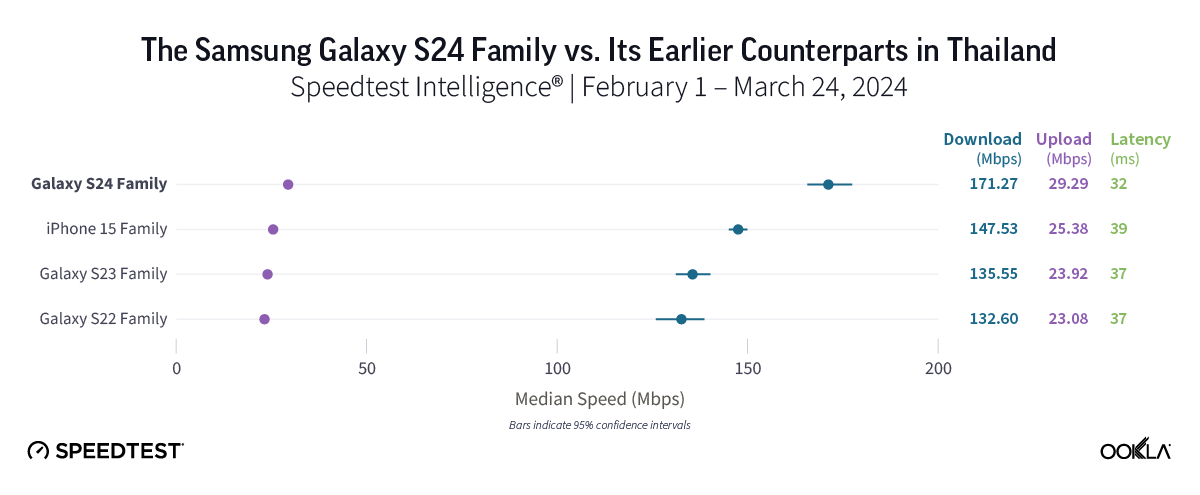
Samsung Galaxy S24 family provides top 5G download speeds in Thailand
In Thailand, Speedtest Intelligence showed that the Galaxy S24 family delivered the fastest median 5G download speed in the market at 171.27 Mbps. That speed marks a notable improvement of roughly 35 Mbps over the S22’s 132.60 Mbps and the S23’s 135.55 Mbps. The Galaxy S24 family also offered the lowest median 5G multi-server latency in Thailand at 32.46 ms. The iPhone 15 family provided the second-fastest median 5G download speed in the market at 147.53 Mbps.
Bottom line: If you’re thinking of upgrading from an S22 or S23 device, our findings suggest that the Galaxy S24 might be the right choice. With faster 5G speeds compared to previous generations, coupled with low latency, smartphones in the Galaxy S24 family should allow for quick content downloads and smooth connectivity overall.
Middle East and Africa
Excellent 5G speeds in Nigeria, but too soon to tell if you should upgrade for performance
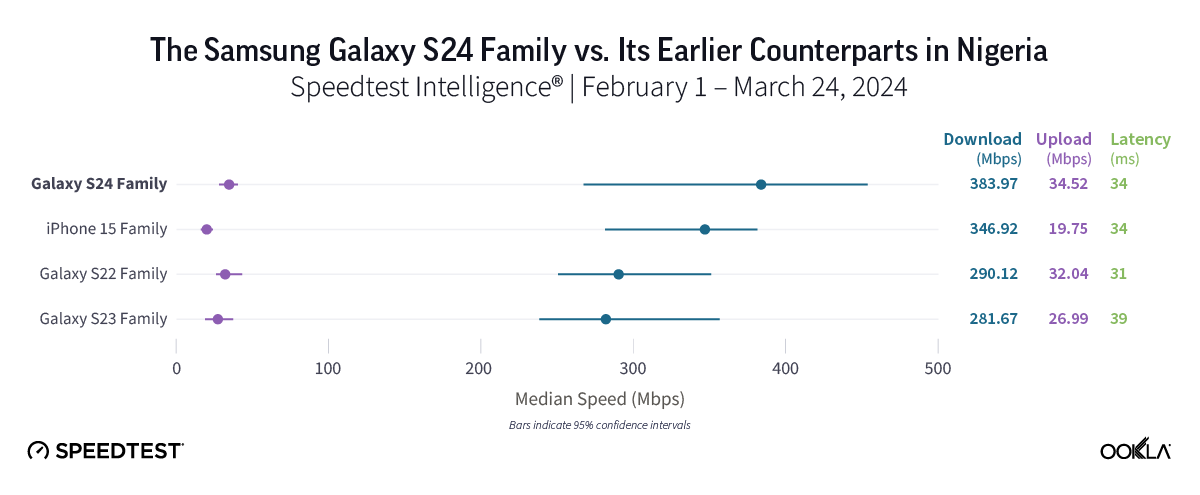
In Nigeria, 5G speeds were impressive overall, from the Galaxy S23 family’s median 5G download speed of 281.67 Mbps to the new Galaxy S24’s speed of 383.97 Mbps. However, in these early days of the S24 lineup’s release, we are still waiting to see how things stabilize in the market before we can make a firm recommendation on whether to upgrade.
Bottom line: For users who like to have the latest gear and/or want the new features offered by the S24 lineup, upgrading is certainly worth considering. But with fast 5G speeds in general, users on any of the device families we looked at should see a quick download experience in general.
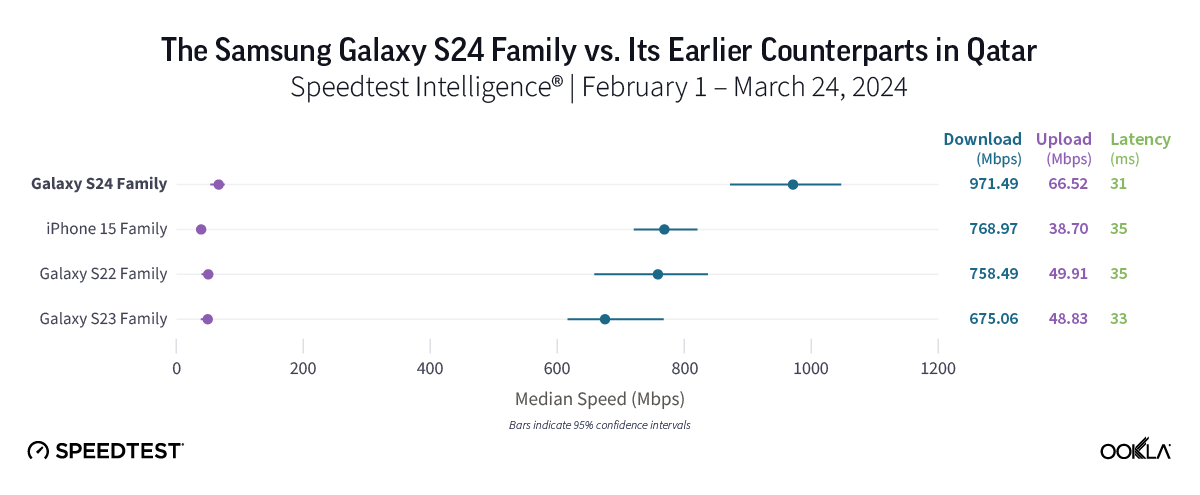
Samsung Galaxy S24 by far the fastest 5G in Qatar
Home to some of the fastest 5G speeds in the world, Qatar showcased impressive median 5G download speeds across all three device families analyzed. The Galaxy S24 family led the pack with a jaw-dropping median 5G download speed of 971.49 Mbps and the top median 5G upload speed in the market at 66.52 Mbps. The Galaxy S22 and S23 families trailed, albeit with great median 5G download speeds of 675.06 Mbps and 758.49 Mbps, respectively. The iPhone 15 family also had a strong showing in Qatar, posting a median 5G download speed of 788.97 Mbps.
Bottom line: Consumers in Qatar with older Galaxy S22 or S23 devices might want to make the switch, given that the S24 family’s remarkable median 5G download speed of nearly 1 Gbps was much faster than those of either the Galaxy S23 or especially S22 families.
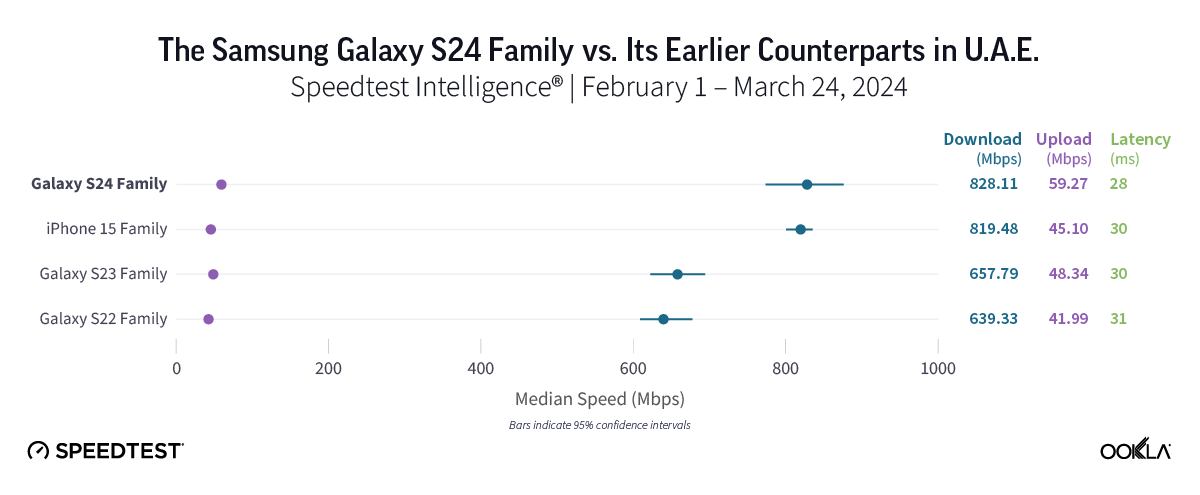
Galaxy S24 a good option for Samsung fans in the U.A.E.
In the U.A.E., which is home to outstanding 5G speeds in general, the Samsung Galaxy S24 and iPhone 15 families delivered the top median 5G download speeds in the market at 828.11 Mbps and 819.48 Mbps, respectively. When compared to its earlier generation Samsung predecessors, the S24 family held a commanding speed advantage, boasting speeds that were at least 170 Mbps higher than those of either the S22 (639.33 Mbps) or S23 (657.79 Mbps) families.
Bottom line: With median 5G download speeds ranging from 639.33 Mbps to 828.11 Mbps, consumers in the U.A.E. will likely enjoy fantastic speeds regardless of device model. However, for current S22 or S23 users hoping to boost their speeds, the Galaxy S24 family stands out as a good choice.
Europe
Galaxy 24 family clocked 5G speeds over 80 Mbps faster than those on S22 devices in France
In France, the Galaxy S24 family was the frontrunner, delivering the fastest median 5G download speed among all device families in the market at 292.15 Mbps. That marks a significant improvement of over 80 Mbps compared to the S22 family’s speed of 211.32 Mbps, along with a jump of more than 60 Mbps compared to the S23’s speed of 229.78 Mbps. Meanwhile, iPhone 15 users experienced the second-fastest median 5G download speed in the market at 257.15 Mbps, with 5G latency nearly identical to that of the S22 and S23 families.
Bottom line: For consumers currently using an S23 or especially an S22 model, upgrading to an S24 device is worth considering. Our results in France showed that the latest Samsung lineup delivered a superior 5G speed experience over older Galaxy models, especially those in the Galaxy S22 family.
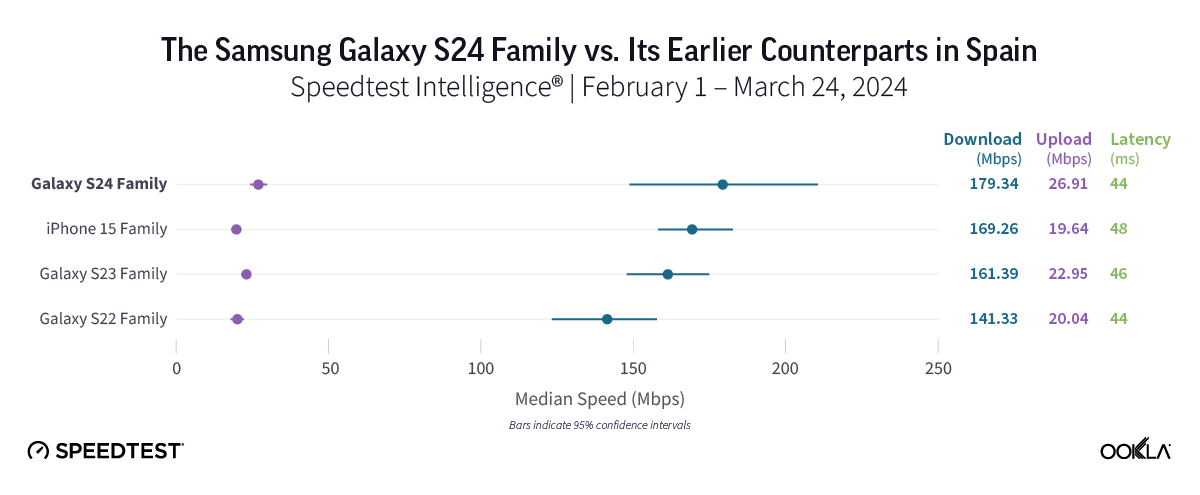
Galaxy S24’s a good choice over S22 models in Spain
All four device families in Spain provided good 5G speeds, ranging from the S22’s median 5G download speed of 141.33 Mbps to the S24 family’s speed of 179.34 Mbps. While speeds recorded on S24, S23, and iPhone 15 devices were statistically similar, the difference in speed between the S24 and S22 was much starker, with the S24 nearly 40 Mbps faster than the S22.
Bottom line: The decision to upgrade should be more straightforward for S22 users in Spain compared to those with S23 or iPhone 15 models, as the S24’s median 5G download speed of 179.34 Mbps was almost 40 Mbps faster than that of the S22 family.
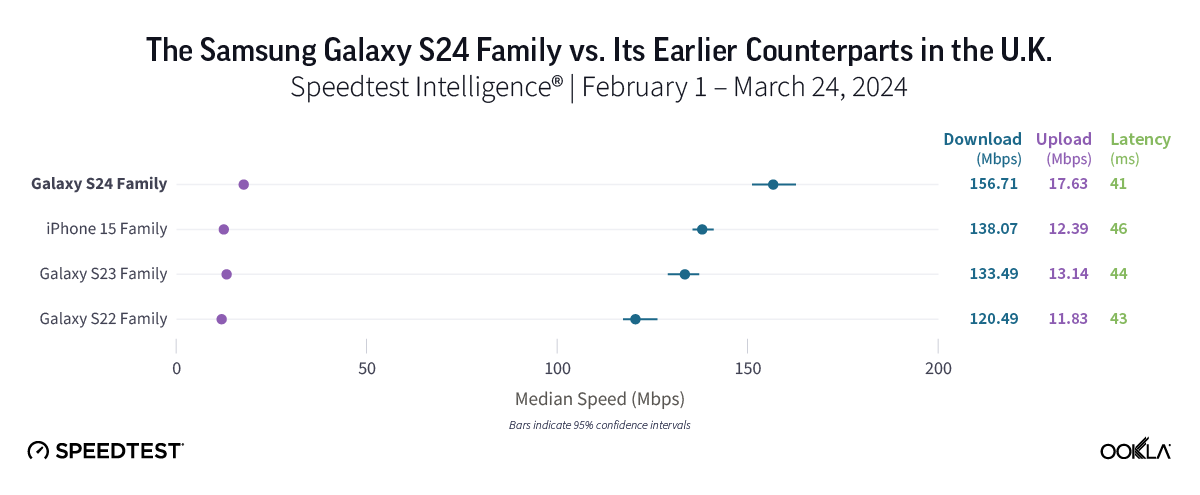
Samsung Galaxy S24 likely worth an upgrade from S22 in the U.K.
In the U.K., Samsung Galaxy S24 models were the fastest in the market, with the S24’s median 5G download speed of 156.71 Mbps offering a speed gain of nearly 40 Mbps compared to the Galaxy S22 family. Galaxy S24 models also posted faster speeds than both the Galaxy S23 and iPhone 15 families, but the difference was less stark than it was with the S22 family, with Galaxy S22 models clocking in at 120.49 Mbps, Galaxy S23’s at 133.49 Mbps, and iPhone 15’s at 138.07 Mbps.
Bottom line: U.K. consumers using either S22 or S23 models may want to look into upgrading to the S24 to enjoy faster speeds. That’s especially true for S22 users, given that the S24’s median 5G download speed was nearly 40 Mbps faster than that of S22 devices.
North America
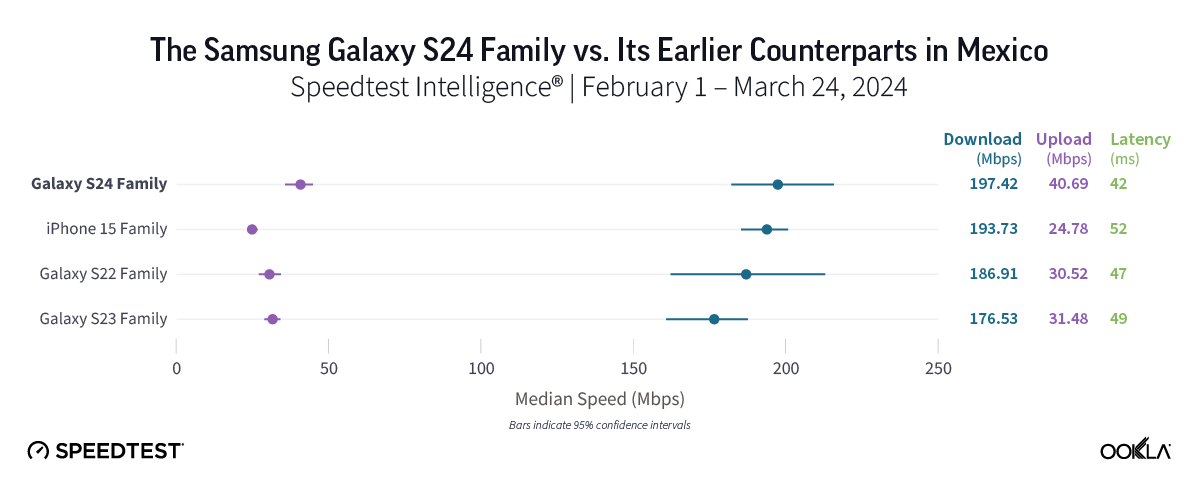
No major 5G speed boost for users in Mexico who upgraded to a Galaxy S24
5G speeds in Mexico were impressive, with all device families posting median 5G download speeds of 176.53 Mbps or better. While Speedtest users of the Galaxy S24 family experienced the fastest median 5G download speed in the market at 197.42 Mbps, that speed marked only a modest improvement compared to Galaxy S22 devices (186.51 Mbps) and iPhone 15 models (193.73 Mbps). The Galaxy S23 family showed the slowest 5G speed in the market at 176.53 Mbps, coming in about 20 Mbps slower than Galaxy S24 models
Bottom line: For users eager to embrace the new features offered by Galaxy S24 devices or move on from S23 devices, an upgrade might be worthwhile. However, with fast 5G speeds across all device families in Mexico and only about 20 Mbps separating all four device families in our study, users likely won’t see a major change in their 5G experience by upgrading.
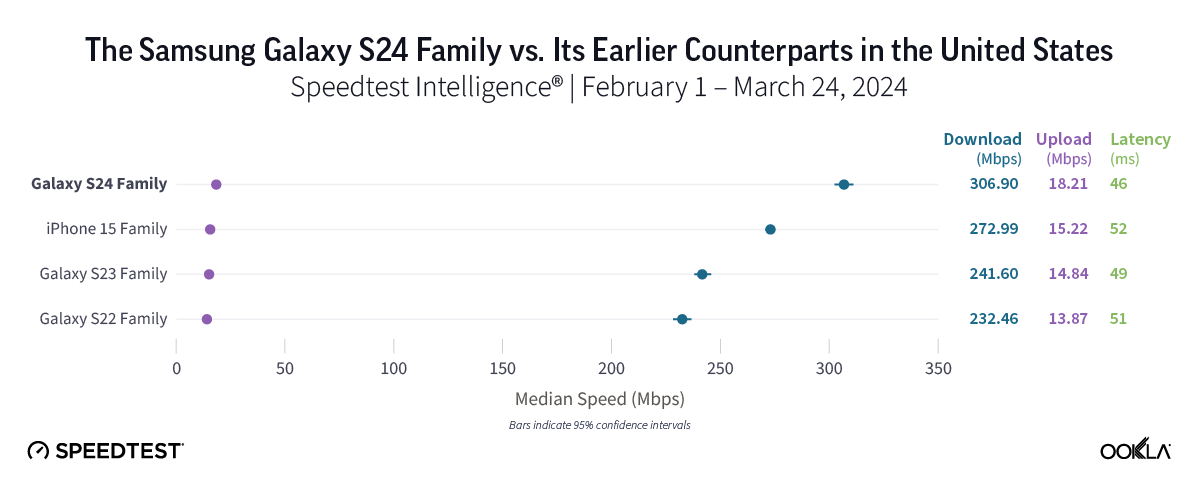
Galaxy S22 users in the U.S. could get faster 5G with the S24 family.
5G speeds in the U.S. had an impressive showing across the board, with median 5G download speeds of at least 232.46 Mbps across all device families. The Samsung Galaxy S24 family led the way with an excellent median 5G download speed of 306.90 Mbps and the lowest median 5G multi-server latency at 45.71 ms. Users of the Galaxy S24 family enjoyed speeds roughly 75 Mbps faster than those on S22 models (232.46 Mbps) and approximately 65 Mbps faster than those on S23 devices (241.60 Mbps). Meanwhile, the iPhone 15 family also offered a strong performance, with a median 5G download speed of 272.99 Mbps.
Bottom line: Users of older Samsung device models in the United States may want to switch to one of the newer models to capitalize on the faster 5G speeds offered by S24 devices, though speeds were strong for all device families in this study.
Ookla will continue monitoring how devices are performing
We’ll continue to check in on device performance as new models enter the market, so stay tuned for further insights into mobile and fixed broadband performance in countries around the world.
If you’ve recently made the switch to an S24 device, make sure you’re getting the speeds you need by downloading the iOS or Android Speedtest® app.
Ookla retains ownership of this article including all of the intellectual property rights, data, content graphs and analysis. This article may not be quoted, reproduced, distributed or published for any commercial purpose without prior consent. Members of the press and others using the findings in this article for non-commercial purposes are welcome to publicly share and link to report information with attribution to Ookla.
As 5G adoption increases, consumers and businesses expect the same level of coverage and performance wherever they go. Yet, the characteristics of 5G, which typically operates in mid-band frequencies of 1.8 GHz to 3.5 GHz, pose a challenge for indoor coverage, as these frequencies struggle to penetrate walls and windows depending on the materials used in construction. Therefore, operators need to invest in additional solutions to enhance indoor coverage and potentially offload onto in-building Wi-Fi systems.
In the Gulf region, where shopping malls are central to the economic and social lifestyle, bridging the indoor-outdoor coverage gap is ever more important. In this article, we use data from Cell Analytics™ to benchmark indoor 5G coverage provided by seven mobile operators across 28 malls in Qatar (Doha), Saudi Arabia (Jeddah and Riyadh), and the U.A.E. (Abu Dhabi and Dubai) based on crowdsourced measurements collected between December 2022 and November 2023.
Key takeaways
Good indoor coverage is vital for 5G more than for previous generations. Indoor 5G coverage is more crucial than ever since people spend 90% of their time indoors, and an increasing number of consumers and businesses depend on its availability and expect near gigabit speeds wherever they are.
Top U.A.E. malls have superior indoor 5G coverage compared to top malls in Qatar and Saudi Arabia. du leads the way in the U.A.E. (particularly in Abu Dhabi), while in Saudi Arabia, Mobily has the edge in terms of the number of malls where it has better indoor 5G coverage. In Qatar, Ooredoo comes first for indoor coverage and its lead over Vodafone is more evident than in the other two countries.
Efficient deployment of indoor network coverage solutions requires addressing non-technical challenges. Beyond cost and technical factors, operators must anticipate other issues when aiming to improve indoor coverage, such as site acquisition and permission and compliance, all of which can be facilitated through regulatory measures.
5G underscores the importance of indoor coverage more than previous generations of mobile technologies
Before 4G, mobile networks were designed primarily for outdoor voice coverage. That is why outdoor deployment took precedence over indoor coverage in previous generations of mobile networks since coverage maps were important marketing collateral to grow market shares. With 5G, consumers and businesses expect high-speed and consistent mobile connectivity everywhere. As they rely heavily on continuous 5G availability, operators are pressured to deliver a similar quality of experience indoors and outdoors. Delivering consistent high-speed data connectivity across both indoor and outdoor networks is far more challenging since the performance of a 5G network is limited by interference.
5G is also the main data growth driver of usage for the operators and most of the usage is likely to be generated indoors. According to Ericsson, we spend 90% of our time indoors, and up to 80% of our data is consumed indoors. Therefore, operators should strive to improve coverage and capacity indoors if they want to capitalize on data growth, reduce churn, and support new consumer and business use cases.
Indeed, 5G enables a wide range of applications because it supports high bandwidth, low latency, and high device density. As 5G adoption increases, there will be more use cases where an excellent indoor 5G experience will be essential to end users and commercially beneficial to the operators.
Technical and commercial reasons also explain why indoor 5G performance is typically inferior to outdoors. The mid-band frequencies (1.8 GHz to 3.5 GHz) used in 5G deployment do not effectively penetrate walls and windows. The increasing use of insulating materials and metal structures further hamper the propagation of radio waves. Furthermore, indoor network systems need to be designed to fit within the site-specific requirements for antenna placement, connectivity, and power distribution systems, minimize interference with careful coordination between adjacent sites, and connect more customers per square meter than outdoors which impacts network performance.
Commercially, operators have prioritized outdoor coverage because it requires less CAPEX and OPEX per subscriber compared to indoor coverage and has a better return on investment. Additionally, operators need to adapt their indoor network solution to suit different venues and building configurations, find other service providers to share deployment costs with, and convince venue owners to offset some of them.
Technical solutions exist to address the 5G coverage gap
Spectrum is arguably the most influential factor for 5G coverage and speed. High frequencies (shorter wavelengths) carry data faster but have a shorter range than lower frequencies, leading to lower coverage levels and inferior indoor quality of service.
Operators can opt for higher towers to cover a large area to compensate for the shorter range or adjust spectrum usage in specific areas to maximize coverage while not too negatively impacting performance.
Alternative technical solutions also exist to address indoor cellular coverage challenges (see table below). Most of these solutions were designed originally for 3G and 4G but were upgraded by increasing their power and the number of antennas to enable greater performance and improve spectral and energy efficiency. However, deploying some of these solutions can be complex and costly. For example, a DAS that supports MIMO costs multiple times a typical outdoor macro site. They may also lead to unnecessary duplication of infrastructure if operators do not share their assets.
Examples of solutions to improve indoor 5G coverage
Solution
Description
Limitations
Amplifiers
• Strengthen a weak external cellular signal by amplifying it inside the building
• Could cause interferences with signals from the macro cells
Small cells (microcells, picocells, and femtocells)
• Low-power antennas that provide localized coverage and add capacity in dense locations • Connected to the macro cell through backhaul
• More suitable for small indoor areas (e.g. a room or floor), not shopping malls • Not cost-effective to cover a large area
Distributed Antenna System (DAS)
• Set of antennas distributed around a venue to amplify the signal and provide consistent coverage and capacity throughout • DAS is connected to one or more base stations via cable
• Could be expensive and complex to deploy and upgrade due to the multiple radio heads and cable connections required
Private LTE/5G Networks
• Localized cellular networks deployed to offer customized indoor coverage and capacity solutions • Cater to specific indoor environments such as factories, warehouses, and corporate offices
• Acquiring dedicated spectrum is challenging and costly • Deployment complexity and cost can make it prohibitive for smaller organizations • Navigating regulatory frameworks can be challenging
Indoor 5G coverage is more vital in Gulf countries because shopping malls play an essential economic and social role
The Gulf region has been a global 5G pioneer. Most countries have attained nationwide 5G coverage by 2023. 5G penetration among mobile users has also skyrocketed since the beginning of 2022. It reached 28.11%, 22.48%, and 26.86% in Qatar, Saudi Arabia, and the U.A.E. in Q3 2023, according to GSMA Intelligence.
Indoor network coverage is arguably more critical in the Gulf region. The high temperatures and long summers mean that people spend most of their time indoors, especially in shopping centers. These malls are the heart of the economic, social, and cultural life in the region for residents and tourists alike.
Aided by retail-friendly policies, such as low taxes and late opening times, malls experienced a boom in footfall and retail transactions. Despite the rapid rise in online shopping, especially after COVID-19 lockdowns, brick-and-mortar remains a pillar of national economies and accounts for the largest share of all retail transactions. The retail segment has also room to grow further as the retail gross leasable area (GLA) per capita across major GCC cities remains below that of developed markets like the U.S.A., despite being higher than other markets in the Middle East and North Africa.
5G connectivity inside the malls is not just crucial for consumers but also businesses. Stores can use the network to connect video cameras, point-of-sale (PoS) devices, and signage systems. Good indoor connectivity also enables shops to offer a hybrid retail experience, combining physical and digital sales channels. For example, customers can order items online for in-store pick-up. Indeed, nearly 60% of surveyed shoppers in the U.A.E. use their smartphones in-store to research products, compare prices, or look for offers. Excellent indoor 5G coverage also underpins future in-mall experiences that mix physical and digital interactions through technologies like AR/VR.
Operators and venue owners can also benefit from offering seamless connectivity in the malls. For example, operators can improve their brand image and prestige by associating themselves with iconic venues such as Dubai Mall in Dubai, Mall of Qatar in Doha, and Mall of Arabia in Jeddah. For landlords, exceptional indoor coverage and quality can serve as a key differentiator for the mall, potentially resulting in higher rental rates.
Operators can offload onto Wi-Fi as an alternative to extending 5G indoors, provided these systems are designed, optimized, and operated with equivalent quality of experience, using, for example, Ekahau®. While many malls in the region have Wi-Fi infrastructure, we believe that 5G complements rather than competes with Wi-Fi. Direct access to a 5G network offers more convenience for consumers and is intrinsically more secure than 4G or Wi-Fi.
The latest generations of Wi-Fi technology, including Wi-Fi 6 and Wi-Fi 7, are likely to play a more pivotal role in enhancing indoor coverage thanks to their improved performance, higher speeds, and increased capacity. Wi-Fi’s seamless integration with cellular coverage enables the offloading of cellular traffic in congested areas, maintains connectivity in deep indoor locations, and provides a robust and interconnected network experience for users.
Major differences in indoor 5G coverage quality between malls, operators, and countries in the Gulf region
In this analysis, we examine the variations in the strength of indoor 5G coverage across select shopping malls in Qatar, Saudi Arabia, and the U.A.E.. We use data from Cell Analytics based on crowdsourced measurements of consumers’ mobile devices worldwide. The tool captures RF measurement and data usage, both indoors and outdoors, enabling us to benchmark signal metrics and generate user density and competitive coverage difference maps.
We use the average Reference Signal Received Power (RSRP) as a measure of network coverage. RSRP represents the network signal strength received by a mobile phone. An RSRP value that exceeds -90 dBm indicates superior coverage. If the signal strength is between -90 dBm and -100 dBm then network coverage is considered good. Lower RSRP values signify lower download speeds and an increased probability of network disconnection.
In the sections below, we examine 5G RSRP measurements inside major malls in Qatar (Doha), Saudi Arabia (Jeddah and Riyadh), and the U.A.E. (Abu Dhabi and Dubai) from December 2022 to November 2023. For each location, we compare operators’ RSRP values to determine which ones offer superior 5G coverage. We included locations where we received sufficient samples to achieve a confidence level of 95%.
du commands a lead in indoor 5G coverage in more U.A.E. malls than Etisalat by e&
The U.A.E. emerged as the fastest 5G market globally in Q2 2023, according to Ookla® Speedtest Intelligence®. This achievement was facilitated by an almost nationwide 5G coverage of the population. Both operators, du and Etisalat by e&, have sought to continually enhance customer experience by improving network coverage and quality.
du reported 98.5% 5G coverage of the population in November 2023 and attributed much of its CAPEX to 5G deployment and specifically to enhancing indoor coverage. For example, it has installed small cell antennas in apartments and offices and expanded DAS in new mall locations. It also launched 5G Standalone (SA) and Voice over New Radio (VoNR) in 2023.
The chart below depicts indoor 5G RSRP values for du and Etisalat by e&, across 12 malls in Dubai and six others in Abu Dhabi. Both operators have the same number of malls in Dubai where they lead in indoor coverage. In Abu Dhabi, du consistently outperformed Etisalat by e& in terms of indoor coverage in all the malls we reviewed.
Overall, top U.A.E. malls have better indoor 5G coverage than those in Qatar and Saudi Arabia. The weighted average RSRP per mall is at least -86 dBm in 9 out of the 18 locations analyzed, suggesting excellent indoor coverage. However, in some locations, such as Ibn Battuta Mall, Mall of Emirates (for both operators), Wafi Mall and Yas Mall (for Etisalat by e&), and Dubai Mall (for du), the signal power is equal or less than -90 dBm.
du consistently outperforms Etisalat by e& in indoor 5G coverage across all the six malls in Abu Dhabi. For example, du is 10% better than Etisalat by e& in Khalidiya Mall and 8% better in Marina Mall.
The difference in signal power in Dubai locations is generally smaller, implying that consumers are unlikely to perceive a difference in 5G coverage while shopping there. For example, the RSRP gap between operators is inferior to 1.5 dBm in Deira City Mall, Festival City Mall, Ibn Battuta Mall, Mirdif City Centre, and Wafi Mall. This could be because both operators share the same indoor coverage infrastructure in these malls to avoid duplication and to reduce costs.
Mobily and Zain are the frontrunners for indoor 5G coverage in Saudi malls
The Saudi Communications, Space & Technology Commission (CST) reported that 5G coverage reached 97 governorates in March 2023 (out of 136 governorates), up from 84 a year earlier. This is a substantial jump from the 35 governorates it first reported in Q2 2020.
This improvement is partially driven by the ongoing release of suitable spectrum for 5G. Indeed, operators had access to low-band spectrum (700 MHz and 800 MHz) from 4G that they could reuse for 5G, and auctions for 2.3 GHz, 2.6 GHz, and 3.5 GHz bands were completed in 2019. The CST also plans to auction 600 MHz, 700 MHz, and 3800 MHz bands in Q1 2024.
Operators have steadily invested in 5G infrastructure. stc reported that it provides 5G coverage to over 90% of its mobile site locations in major cities. In October 2023, it announced significant network investments to extend its reach to over 75 cities and governorates.
The two charts below show indoor 5G RSRP values for Mobily, stc, and Zain across three malls in Riyadh and three others in Jeddah. Despite the large investments in 5G infrastructure and access to low-band spectrum, Cell Analytics reveals a weighted average RSRP of -95.5 dBm across the six surveyed malls, which is significantly lower than the weighted averages in Qatar and the U.A.E. at -85.3 dBm and -87.4 dBm, respectively.
Saudi Arabia is home to the five malls with the poorest indoor 5G coverage among the 28 malls analyzed in this article. The RSRP weighted averages ranged from -98.8 dBm in Al Salam Mall in Jeddah to -93.8 dBm in Riyadh Gallery Mall in Riyadh (the other lagging malls are Mall of Arabia and Red Sea Mall in Jeddah, and Al Nakheel Mall in Riyadh).
Mobily had better indoor 5G coverage than its competitors in three malls while Zain outperformed them in two of the malls. Mobily is quite ahead of its competitors in Mall of Arabia, one of the biggest malls in Saudi Arabia, with an RSRP of -92.8 dBm, a signal strength that is 6.5 dBm higher than Zain’s and 8.8 dBm stronger than stc’s.
Zain leads Mobily in two malls, Riyadh Gallery Mall and Red Sea Mall, by 2.4 dBm and 1.7 dBm, respectively. On the other hand, stc leads in 5G coverage inside Granada Center with an RSRP of -88.1 dBm, the highest signal power among the analyzed malls in Saudi Arabia. The RSRP difference between the three operators in the other malls varies between 3.3 dBm and 4.6 dBm, which suggests that operator choice can affect signal reception when shopping in these venues.
Ooredoo leads in 5G coverage inside the malls in Qatar
Likewise, Vodafone nearly doubled its radio network sites, upgraded the existing sites’ technologies, and increased 5G coverage, especially indoors. It reported that over 1188 TB of data were consumed across all stadiums during the World Cup. These initiatives helped to make Vodafone the world’s fastest mobile network operator in 2022. By June 2023, 85% of Vodafone’s 2250 radio network sites were 5G enabled.
The chart below shows indoor 5G RSRP values for Ooredoo and Vodafone across four malls in Doha. It reveals that Ooredoo delivered superior indoor coverage in all of them, except for Villaggio Mall, where Vodafone outperformed.
The difference in RSRP is highest in City Center Doha Mall where Ooredoo was ahead of Vodafone by 9.2 dBm. In the country’s largest shopping center, the Mall of Qatar, the difference in indoor signal strength between the two operators is sizable, standing at 4.4 dBm. However, since both operators offer excellent coverage simultaneously, with an RSRP of -81.4 and -85.8 for Ooredoo and Vodafone, respectively, consumers are unlikely to perceive a difference in coverage.
Operators need to consider non-technical aspects when deploying indoor solutions
Measures should be in place to encourage operators to make indoor network deployments more efficient. For instance, the Chinese government mandated that operators share the mid-band spectrum (3.3-3.4 GHz) for indoor coverage to promote co-development and cost-sharing. In Europe, mobile network operators (MNOs) share indoor networks deployed by neutral hosts, such as Cellnex, with a revenue model based on charging the venue or building owner for the network instead of the operator.
In the United States, the primary ownership model for DAS often involves a combination of ownership by neutral host operators, MNOs, and venue owners depending on agreements, partnerships, and specific needs of the venue or location. Neutral host operators often play a significant role in deploying shared DAS infrastructure, while venue owners, managers, or MNOs may also have ownership stakes or involvement in specific deployments to enhance indoor wireless coverage.
Beyond cost and technical considerations, operators need to carefully address other factors and practical challenges before and during the implementation of an indoor network coverage solution. These include site acquisition and permission, physical space and aesthetics, and regulatory compliance needs.
Regulators can have a proactive role in reducing bureaucratic hurdles and encouraging government-industry collaboration. For example, in South Korea, the regulator promotes the parallel development of indoor and outdoor 5G coverage across the country. Another example is the Telecom Regulatory Authority of India (TRAI) which recently requested industry views on the mechanism to rate digital connectivity in buildings. TRAI’s initiative illustrates the importance of devising standard guidelines, incentivizing investments in in-building infrastructure, and ultimately ensuring seamless and reliable indoor connectivity for consumers and businesses.
Ookla can support operators and venue owners in improving indoor cellular coverage
As consumers’ expectations for network speed and consistent connectivity rise with the advent of 5G, operators should prioritize addressing indoor coverage issues to improve customer experience, drive data usage, and outperform their competitors.
As more consumers and businesses rely on 5G, an excellent indoor 5G experience will become even more essential. It will also pave the way for innovations that blend in-store with digital experiences. The future of physical malls in the region hinges on their ability to adopt new technologies and use them to transform the consumer experience.
Ookla can assist operators in identifying buildings or indoor venues with coverage or capacity issues using crowdsourced and controlled test data and the execution of precise walk tests for diagnosis. Cell Analytics helps to identify specific indoor areas with low signal-to-interference-and-noise ratio (SINR) and signal quality (RSRQ), causing sluggish data speeds despite adequate coverage (RSRP).
Equipped with this knowledge, mobile network operators can promptly deploy personnel for on-site walk-tests using Wind™, Ookla’s handheld walk-and-drive controlled testing platform. Wind enables testers to simulate user behavior while meticulously capturing detailed RF data in the background and processing it in near-real time. This allows operators to implement corrective actions to boost network performance within any venue.
An alternative to deploying in-building 5G systems is to selectively offload usage to Wi-Fi provided these systems are designed, optimized, and operated to deliver an equivalent quality of experience – this can be done using Ekahau.
Ookla retains ownership of this article including all of the intellectual property rights, data, content graphs and analysis. This article may not be quoted, reproduced, distributed or published for any commercial purpose without prior consent. Members of the press and others using the findings in this article for non-commercial purposes are welcome to publicly share and link to report information with attribution to Ookla.
The deployment of 5G networks is progressing as demand for faster and more reliable connectivity continues to grow. The standalone (SA) deployment model marks a significant milestone in the evolution of 5G, aiming to offer lower latency, increased bandwidth, and improved reliability compared to earlier network configurations. In this article, we use Ookla Speedtest Intelligence® data to track 5G SA deployments since Q2 2023, 5G SA service adoption, and examine its impact on network performance. We also highlight key regions and countries that made notable advancements in 5G SA infrastructure.
Key Takeaways:
India, the U.S., and Southeast Asia are at the forefront of 5G SA adoption. T-Mobile and SK Telekom were among the first to launch 5G SA in 2020, while Chinese operators and Jio in India lead in terms of active 5G SA users. Europe somewhat lags, with operators still hesitant due to the relatively low ROI on existing 5G investments and unclear business cases for 5G SA. However, Europe has the highest number of operators planning to launch it.
The U.A.E. and South Korea lead the world in 5G SA performance. 5G SA download speeds reached 879.89 Mbps and 729.89 Mbps, respectively. Their 5G SA upload speeds were also impressive, at 70.93 Mbps and 77.65 Mbps, respectively. This performance is a result of significant advancements made by local operators in deploying 5G SA and testing advanced features such as network slicing and mobile edge computing (MEC).
The change in speed of 5G SA varied widely between countries over a year. Speedtest Intelligence data shows that 5G SA performance declined in many countries between Q2 2023 and Q2 2024, primarily driven by increased user base and network traffic. Conversely, markets such as Canada and the U.S. improved their performance thanks to access to additional spectrum.
5G SA deployments are expected to increase this year as adoption gains momentum and ecosystem matures
Most existing 5G deployments use the non-standalone (NSA) model which uses the 4G core network. This model is faster to roll out, requires less investment, and maximizes existing network assets. Unlike 5G NSA, 5G SA uses a dedicated 5G core network, unlocking the full capabilities of 5G with better speed, latency, support for large numbers of devices, and more agile service creation. It also enables new features such as network slicing where an operator can dedicate a network segment to specific customers or use cases. Furthermore, the core network functions provided by a cloud-native architecture enable more scalability and automation than physical or virtualized architectures. However, this comes with higher infrastructure complexity, investment as well as staff training costs. Many operators use NSA as a stepping stone towards SA, with a few exceptions, such as DISH in the U.S. and Jio in India, which adopted SA from the outset. Other scenarios for deploying 5G SA include an overlay for a public 5G NSA network or as a private network for enterprise use cases.
The Global Mobile Suppliers Association (GSA) identified 130 operators that had invested in public 5G SA networks as of the end of June 2024. 5G SA represented more than 37% of the 614 operators known to have invested in 5G either through trials or deployments. The GSA reported 1,535 commercially available devices, including handsets and fixed wireless access (FWA) customer premises equipment (CPEs), that support 5G SA, demonstrating the growing maturity of the device ecosystem.
However, only 11 new 5G SA deployments in nine countries were recorded (out of 46 new 5G networks launched in 32 countries) in 2023, according to Analysys Mason, showing a slowdown in deployments. We expect the pace of 5G SA launches to accelerate in 2024 and beyond supported by the growing device ecosystem and commercial appetite for new 5G use cases.
To identify where 5G SA access has been activated and the network expanded between Q2 2023 and Q2 2024, we used Speedtest Intelligence® data to identify devices that connect to 5G SA. The maps below confirm that the number of 5G SA samples increased year-on-year and that coverage has expanded beyond urban centers. However, mobile subscribers in most of Africa, Europe, Central Asia, and Latin America have yet to experience 5G SA.
In the following sections, we examine the year-on-year changes in 5G SA performance across different regions and identify which countries are leading in the Developed Asia Pacific, the Americas, Emerging Asia Pacific, and Europe.
The developed Asia-Pacific (DVAP) region is at the forefront of 5G SA launches
Operators in this region boast 5G SA networks, with launches happening as early as 2020. Strong government support, operators’ technology leadership, and a high consumer appetite for high-speed internet services drove this rapid adoption.
South Korea is considered a pioneer in the adoption and deployment of 5G technology, with SK Telecom deploying one of the first 5G SA services in H1 2020, and supporting advanced features such as network slicing and mobile edge computing (MEC). Speedtest Intelligence data shows that the country led the region in download and upload speeds in Q2 2024. South Korea has one of the highest median speeds among the countries analyzed at 729.89 Mbps (download) and 77.65 Mbps (upload). The other top-performing country is the U.A.E with a median download speed of 879.89 Mbps and a median upload speed of 70.93 Mbps.
All three service providers in Singapore commercialized 5G SA services, covering more than 95% of the country. Users experienced excellent download speed with a median value of 481.96 Mbps. However, Singapore lagged in upload speed with a median value of 32.09 Mbps.
Macau and Japan are second and third in the region with median download speeds of 404.22 Mbps and 272.73 Mbps, respectively. Mainland China followed with a median speed of 236.95 Mbps. Policies and initiatives such as network-sharing agreements and government subsidies supported 5G growth.
In Australia, TPG Telecom launched its 5G SA network in November 2021, following Telstra’s announcement in May 2020. However, the country lagged behind its regional peers with median download speeds and upload speeds of 146.68 Mbps and 17.69 Mbps, respectively.
The performance of most reviewed DVAP countries remained largely stable or slightly declined between Q2 2023 and Q2 2024. The only two exceptions are South Korea and Australia where performance improved by 12% and 18%, respectively. The most substantial declines were observed in upload speeds, while South Korea stood out with a 17% boost in performance.
5G Standalone Network Performance, Select Countries in Developed Asia Pacific
Source: Speedtest Intelligence® | Q2 2023 – Q2 2024
5G Standalone Network Performance, Select Countries in Developed Asia Pacific
T-Mobile and DISH Push 5G SA Coverage in the U.S.
In the U.S., T-Mobile launched its 5G Standalone (SA) network over 600 MHz spectrum in August 2020, becoming one of the first operators in the world to do so. This was followed by a faster service over 2.5 GHz mid-band spectrum in November 2022 which helped the operator to maintain its national lead in 5G performance. On the other hand, Verizon extensively tested 5G SA in 2023 but so far has been slow to deploy a nationwide SA network. DISH, another notable 5G SA operator, pioneered a cloud-native Open RAN-based 5G SA network in June 2023 and expanded coverage to 73% of the population by the end of that year. In Canada, Rogers Wireless launched the first 5G SA at the beginning of 2021, a year after introducing 5G NSA.
In Brazil, the median download and upload speeds reached 474.65 Mbps and 32.36 Mbps in Q2 2024, respectively, exceeding those in Canada and the U.S. The main operators in Brazil, Claro, Telefonica (Vivo), and TIM have launched 5G SA over the 3.5 GHz band, making the service available to a large proportion of the population.
While download and upload speed improved in Canada and the U.S. between Q2 2023 and Q2 2024, according to Speedtest Intelligence, it declined in Brazil. The deployment of C-band has likely helped to increase download speed in both Canada and the U.S.
5G Standalone Network Performance, Select Countries in the Americas
Source: Speedtest Intelligence® | Q2 2023 – Q2 2024
5G Standalone Network Performance, Select Countries in the Americas
India leads in the Emerging Asian Pacific (EMAP) region with fast expansion to 5G SA network
India is at the forefront of the Emerging Asian Pacific region’s rapid 5G Standalone (SA) network expansion. However, according to Ookla’s Speedtest data for Q2 2024, the Philippines surpasses both India and Thailand with a median 5G SA download speed of 375.40 Mbps. Globe, the first mobile operator to introduce 5G Non-Standalone (NSA) in the Philippines, expanded its 5G outdoor coverage to 97.44% of the capital by the end of H1 2023. The company also launched 5G SA private networks in 2023, along with network slicing.
India follows closely behind the Philippines, with a median download speed of just under 300 Mbps. Jio has been a leader in enhancing 5G SA coverage since its launch in October 2022, while Bharti Airtel initially opted for NSA, with plans to transition to full 5G SA.
Jio’s rapid coverage expansion and high throughput are supported by its access to mid-band (3.5 GHz) and low-band (700 MHz) frequencies. Additionally, all new 5G handsets released in India are SA-compatible, boosting the adoption of 5G SA services, and more than 90% of them support carrier aggregation and Voice over New Radio (VoNR).
Thailand lags behind in median download speed for Q2 2024 but outperforms India and the Philippines in upload speed. It was among the first countries in the region to introduce 5G services, with operators quickly expanding coverage to reach over 80% of the population. AIS, the leading operator in Thailand, launched 5G NSA services in February 2020 using 700 MHz, 2.6 GHz, and 26 GHz bandwidths, followed by 5G SA in July 2020. The operator enabled VoNR in 2021.
Unlike the DVAP region, countries in EMAP have experienced a more substantial decline in 5G SA network performance compared to Q2 2023. The rapid coverage expansion and adoption have likely increased the load on 5G SA infrastructure, putting pressure on the operators to scale up network capacity in the future to at least maintain a similar performance level.
5G Standalone Network Performance, Select Countries in Emerging Asia Pacific
Source: Speedtest Intelligence® | Q2 2023 – Q2 2024
5G Standalone Network Performance, Select Countries in Emerging Asia Pacific
Europe is home to the highest number of operators looking to deploy 5G SA
A growing number of European operators are offering or planning to offer 5G SA, driven by a maturing device ecosystem. However, many remain hesitant due to cost and the need to demonstrate clear business cases for 5G SA. GSMA Intelligence reports that Europe has the highest number of planned 5G SA launches, with 45 operators planning to deploy it as of Q1 2024.
Elisa in Finland was one of the first operators in the region to launch 5G SA in November 2021. Other notable examples of SA implementations include Vodafone in Germany (April 2021) and the UK (June 2023), Bouygues Telecom (2022) in France, Three in Austria, Wind Tre in Italy (both in 2022), Orange and Telefónica in Spain, and TDC Denmark in 2023.
The recent 5G SA launch in Spain may explain why that country saw such high speeds, with Speedtest Intelligence reporting download and upload speeds of 614.91 Mbps and 56.93 Mbps, respectively, in Q2 2023. However, Spain experienced a significant drop in performance in 2024, with speeds falling to 427.64 Mbps (download) and 30.55 Mbps (upload). Despite this decline, Spain continued to outperform the UK and Germany.
5G Standalone Network Performance, Select Countries in Europe
Source: Speedtest Intelligence® | Q2 2023 – Q2 2024
5G Standalone Network Performance, Select Countries in Europe
While 5G SA deployments appear to have slowed in 2023 compared to previous years, we expect momentum to increase from 2024 due to rising enterprise demand for private networks and interest in network slicing, as well as consumer demand for immersive gaming and VR applications. The ecosystem’s maturity and the availability of more network equipment and devices supporting 5G SA will also stimulate the market. According to the GSA, 21% of operators worldwide investing in 5G have included 5G SA in their plans.
Interestingly, the growing popularity and adoption of 5G SA have impacted its performance, with many markets seeing some degradation compared to 2023, according to Speedtest Intelligence. Nonetheless, 5G SA still offers a markedly faster download speed than 5G NSA. Beyond speed, 5G SA promises new capabilities, such as network slicing, that have started to emerge in the most advanced markets but will take time to become a reality for most consumers and enterprises worldwide.
We will continue to track the deployments of 5G SA and monitor their impact on network global performance. For more information about Speedtest Intelligence data and insights, please contact us.
Ookla retains ownership of this article including all of the intellectual property rights, data, content graphs and analysis. This article may not be quoted, reproduced, distributed or published for any commercial purpose without prior consent. Members of the press and others using the findings in this article for non-commercial purposes are welcome to publicly share and link to report information with attribution to Ookla.
Operators seek additional spectrum, a generally scarce and costly resource, to improve the coverage and capacity of 4G and 5G networks. This need led to the decommissioning of legacy technologies and the refarming (i.e. repurposing) of existing spectrum. In this article, we examine operators’ plans for sunsetting 2G and 3G networks in the Middle East and North Africa (MENA), focusing on developments in Oman, Saudi Arabia, and the U.A.E. We evaluate the impact of network shutdowns on performance and customer satisfaction for operators that completed the process and highlight key considerations for a successful network transition to mitigate commercial and brand risks.
Key Takeaways:
Sunsetting legacy networks contribute to improvements in performance and customer satisfaction. For example, Zain Bahrain, which decommissioned its 3G at the end of 2022, saw its median download speed increase from 58.43 Mbps in Q2 2022 to 88.52 Mbps in Q2 2023, while customer satisfaction ratings climbed steadily throughout 2023.
Gulf operators are generally on track to phase out their old networks by the end of 2024. Our data indicate that 3G share of samples in Oman dropped to 4.7% by the close of 2023 in anticipation of the scheduled shutdown of 3G services by Q3 2024. In Saudi Arabia, stc saw its 3G share of samples fall sharply in 2023, suggesting that the phase-out process is nearing completion. Meanwhile, 2G share of samples in the UAE dropped rapidly in 2023 as operators planned to turn off 2G by the end of the year.
A carefully managed, phased approach is crucial to minimize service disruption during the transition from 2G/3G to advanced networks. Retiring old technology can reduce operating and maintenance costs, optimize spectrum use, simplify network management, and accelerate service innovation. However, operators need to take into consideration existing deployments, potential revenue loss, traffic on older networks, and market readiness for 4G and 5G.
Network sunsetting – still an emerging trend in MENA
Operators across the globe are prioritizing the retirement of 2G and 3G networks to refarm spectrum for the more efficient 4G and 5G technologies. This shift aims to lower their operating costs and direct investments from maintaining outdated systems to deploying more efficient networks that support faster speeds and greater capacity.
The decision of which network to turn off first and the associated timeline varies depending on market conditions and operator readiness. In Asia, operators in China and Japan opted to decommission 2G networks while in Europe, operators typically retire (or plan to retire) 3G before 2G due to the latter’s widespread use in Internet of Things (IoT) applications in the utility and automotive industries. In the U.S.A., the three main operators, AT&T, T-Mobile, and Verizon completed their 3G sunsetting in 2022. However, that has not happened without hiccups. For example, carmakers including BMW, Ford, Porsche, and Volkswagen faced lawsuits because some of their car models’ connected services were rendered obsolete due to the 3G shutdown
The MENA region had fewer completed and planned legacy sunsets compared to Asia and Europe, with diverse strategies between and within markets. For example, in Bahrain, Batelco shut down its 2G network in November 2021, while competitors, stc and Zain, turned off their 3G networks in 2022. We expect network sunsets to peak by 2025 in the region as 4G becomes more prevalent, and 5G gathers momentum in the region. Some operators in Bahrain and Jordan, have either completed or made significant progress in their sunsetting efforts. Operators in Oman, Saudi Arabia, Tunisia, and the U.A.E. either initiated the process of sunsetting 2G or 3G or will do so within 1 to 2 years.
Network sunsetting can increase efficiency, reduce costs, and improve customer satisfaction
The phasing out of older technologies enables operators to greatly simplify network management since maintaining multiple radio technologies requires significant resources and personnel expertise. By streamlining their infrastructure, operators can reduce operational costs, direct resources towards optimizing 4G and 5G networks, and deploy innovative services based on newer technologies.
4G and 5G are also many times more spectral efficient than their predecessors. That means that modern networks can transmit much more data over the same spectrum than previous standards, and support more users per cell site. According to Coleago Consulting, while 2G and 3G can deliver 0.16 and 0.8 bits/Hz, respectively, 4G with a 2×2 MIMO antenna can deliver 1.9 bits/Hz, and the figure jumps to 4.8 bits per hertz for 5G with advanced 16×16 MIMO. This efficiency gain is important as the demand for high-speed and low-latency services grows in the MENA region. GSMA Intelligence expects mobile data traffic per smartphone will quadruple in Sub-Saharan Africa by 2028 to 19 GB per month, while the Middle East and North Africa will experience more than a threefold increase to 37 GB per month.
Refarming spectrum for 4G or 5G not only boosts capacity and expands service coverage but also saves operators from the expensive process of bidding for new spectrum. By freeing up the 900 MHz, 1800 MHz, and 2100 MHz bands, commonly used for 2G and 3G, operators can take advantage of their superior propagation characteristics to extend 4G/5G reach with fewer sites.
Furthermore, modern network equipment is more energy-efficient than older systems. This can help operators reduce their energy costs, lower OPEX, and progress towards sustainability goals. Case in point, Vodafone (UK) reported that sending 1 TB of data across 5G will use just 7% of the energy required for the same transfer over 3G. O2 Telefónica (UK) claimed a 90% reduction in power consumption per transmitted byte following the retirement of its 3G network in 2021.
The deployment of modern technologies also translates to greater throughput and potentially reduced costs for end-users. Ookla’s Speedtest Intelligence® data shows that operators that deactivated 2G or 3G networks improved their median download and upload speeds. For example, Zain Bahrain began 3G sunsetting in February 2022, refarmed the 2100 MHz spectrum, and gained access to 20 MHz bandwidth of contiguous spectrum. This move improved 4G capacity and spectral efficiency compared to using carrier aggregation. Switching off the 3G network at the end of 2022 (the first in the Middle East) combined with more 4G sites deployed resulted in increasing the operator’s median download speed from 58.43 Mbps in Q2 2022 to 88.52 Mbps in Q2 2023 while customer satisfaction ratings climbed steadily throughout 2023.
Operators should carefully plan the network sunsetting process to minimize service disruption
Careful planning is essential to minimize service disruption and negative impacts on finances and brand. Since this process should involve many stakeholders, including enterprise customers, and consumers, operators should expect 2 to 4 years to complete the switch-off.
Pulling the plug on 2G or 3G means disconnecting many consumers who use voice and SMS, potentially leading to massive churn and exacerbating the digital divide. The question becomes then whether these users can afford to acquire a feature phone or a smartphone and upgrade to 4G and 5G plans. The impact on inbound roamers, who might face connectivity issues or be unable to access emergency services, and the potential loss of roaming revenue are additional considerations.
Insights into the usage patterns of 2G and 3G services and the volume of inbound roamers lacking LTE roaming agreements with local operators are vital to assess the financial impact. Operators should gradually turn off their legacy networks based on traffic, prioritizing areas with minimum 2G/3G activity and excellent 4G/5G coverage. Regions with high 2G/3G presence should be last to transition.
We used Ookla’s Cell Analytics™ to identify geographical regions with a concentration of 2G and 3G users in three countries, Oman, Saudi Arabia, and the U.A.E., that plan to sunset either or both technologies. The red dots on the map pinpoint customers connected to 2G and 3G because they have SIM cards not provisioned for LTE (including roamers), lack 4G coverage, or use devices incompatible with 4G. The maps below provide a high-level view of the coverage and activity level of the legacy network in each city. We used background measurements captured in December 2023.
The analysis reveals that operators in Oman and the U.A.E. are ahead in migrating customers from 2G/3G and ensuring comprehensive 4G/5G coverage, even in rural areas and along highways. In contrast, Saudi Arabia still relies significantly on 2G and 3G networks for connectivity within city centers, suburban areas, rural regions, and along transport corridors. Given the vast geography of this market, the full transition to modern networks is likely to take longer than in Oman and the U.A.E.
Operators in MENA are at different stages of decommissioning their 2G and 3G networks
We used network “Availability” data from Speedtest Intelligence toget the percentage of users with a service-active device who spend the majority of their time connected to 2G and 3G (including while roaming) between January and December 2023 in Oman, Saudi Arabia, and the U.A.E.. This data serves as a proxy for the proportion of samples that accessed 2G or 3G networks out of all network measurements.
In Oman, 3G usage has been steadily decreasing. The percentage of 3G samples dropped from 7.9% in January 2023 to 4.7% in December of the same year. If this trend continues, operators should be well-positioned to turn off 3G around Q3 2024 as planned with little disruption to customer experience. Indeed, in 2023, Ooredoo initiated the process of ‘future-proofing’ IoT devices, such as home security systems and fitness trackers, that use 3G networks. The telecoms regulator TRA also plans a trial to gauge the challenges of a 3G shutdown, alongside mandating VoLTE enablement on all smartphones to facilitate a smooth transition.
In Saudi Arabia, despite initial plans to sunset 2G networks in 2022, a substantial segment of the market continues to use 2G SIMs according to our data, fluctuating around 1% throughout 2023. Mobily had the lowest proportion of 2G samples at 0.4% in December 2023, and Zain had the highest at 1.7%.
In 2020, stc planned to switch off its 3G network in 2022, later postponed to 2023. Speedtest Intelligence data revealed that 3G share of 4.3% at stc in January 2023 before falling sharply throughout the rest of 2023. This suggests that stc nearly completed or has already completed its 3G shutdown. Mobily and Zain have yet to announce their 3G decommissioning plans, with the technology representing 3.9% and 3.6% of total samples, respectively, at the end of 2023.
The U.A.E. telecoms regulator, TRA, initially set a deadline for the 2G shutdown by the end of 2022, which was later deferred to the end of 2023 to allow operators to coordinate with businesses that rely on 2G for equipment connectivity, such as vehicle-tracking devices and POS devices. Operators have been offering to upgrade or replace those devices to support LTE CAT-M1 (LTE-M), a category of 4G that is adapted for IoT. While Speedtest Intelligence data does not capture IoT connections, it shows that 2G share of samples has dwindled rapidly in 2023, representing around 0.2% of samples in December 2023.
Operators need to consider various aspects before phasing out legacy networks
The decision to sunset one network before another should be informed by market conditions including the number of customers that use legacy networks, the cost of maintaining their operations, and the reliance of enterprise services on these networks. In markets with high smartphone penetration, such as those in the Gulf region, the phasing of 2G and 3G effectively began years ago. In those markets, operators have stopped activating new 2G/3G SIMs. In less mature markets, operators need to check that there is a sufficiently large base of 4G or 5G-enabled handsets in the market before the transition.
Communication is critical regardless of how the market and customers are ready. Operators should engage with subscribers well ahead of planned shutdowns to facilitate a smooth migration and prevent connectivity disruptions. Some customers might not realize that their handsets are still connected to 2G/3G even with modern handsets. Most operators we analyzed started communicating about the shutdown of their legacy networks and addressing common concerns about the upcoming changes.
Operators can also facilitate and accelerate this process by making available a range of affordable feature phones and smartphones, for example, by partnering with handset manufacturers. They could also offer financing schemes to support their acquisition, particularly, for those who cannot afford outright purchases. Regulators can also restrict or prohibit the sale and distribution of basic and feature phones before the decommissioning of 2G and 3G networks.
Finally, voice services, a critical revenue stream for MENA operators, can be particularly affected by sunsetting. That is why operators need to carefully consider their options. They could switch off 3G and keep 2G as a fallback network for voice despite potential quality degradation. A better alternative would be to migrate customers to use 4G for voice with VoLTE. However, VoLTE adoption is generally slow, so operators need to raise awareness and encourage subscribers to enable the technology on their handsets.
The situation is more challenging considering international roaming. Visitors from countries where VoLTE is disabled may struggle to access voice services, even on VoLTE-compatible phones. Solutions exist to convert traditional circuit-switched voice calls to VoLTE to establish a connection between the home and host networks. However, they require testing to ensure network interoperability and device compatibility, as well as a review of roaming terms such as pricing. Alternatively, operators can sign national roaming agreements with their competitors that maintain an active legacy infrastructure to support 2G subscribers, like in Jordan.
Operators should work with other industry stakeholders on the network sunsetting process to avoid delays
Sunsetting legacy networks can bring many benefits to the operators, such as lowering operating and maintenance costs, optimizing spectrum usage, streamlining network management, and accelerating service innovation.
Another advantage of sunsetting older networks is the opportunity to repurpose low-frequency bands, which cuts down deployment costs and also enhances network coverage and capacity. This, in turn, can lead to more affordable services for end-users, contributing to the narrowing of coverage and data usage disparities.
However, the process of sunsetting legacy networks is complex and lengthy. That is why operators should plan the transition well ahead to prevent unnecessary delays and execute it properly to minimize the risk of losing customers and revenue and damaging brand reputation. This planning process should include discussions with various stakeholders, including other mobile network operators, consumers, enterprise customers, wholesaler partners, and regulators.
To find out how Ookla’s crowdsourced data and analytical tools can help you as you evaluate, implement, and track network sunsetting, contact us.
Ookla retains ownership of this article including all of the intellectual property rights, data, content graphs and analysis. This article may not be quoted, reproduced, distributed or published for any commercial purpose without prior consent. Members of the press and others using the findings in this article for non-commercial purposes are welcome to publicly share and link to report information with attribution to Ookla.