| April 12, 2018

What Would a Merger Between Sprint and T-Mobile Mean for Customers?

Editor’s note: Rumors of the merger of Sprint and T-Mobile were confirmed on April 29 through a video announcement featuring CEOs of both companies.

As was the case in October, rumors once again abound that a merger between Sprint and T-Mobile is coming. Though we cannot know if that is true, we are interested to explore what such a combination might mean for the online experiences of customers in the future.

Speeds

T-Mobile is the fastest of the big four carriers in the U.S. and Sprint is the slowest.

Existing Sprint customers would definitely benefit from T-Mobile’s recent infrastructure investments. Over the past six months, T-Mobile has been aggressively deploying LTE on their 600 MHz greenfield spectrum assets, which already cover more than 300,000 square miles, using 5G ready infrastructure equipment. These assets will be fully 5G operational once the vendors push over-the-air software upgrades, likely to happen sometime before the end of this year.

The 5 GHz License-Assisted Access (LAA) has already been deployed in a few urban areas, adding 60 MHz of downlink capacity to the existing network. This effectively provides up to 1 Gbps peak download speeds. T-Mobile spectrum assets also include 200 MHz of millimeter wave (mmWave) spectrum across 100 million people, which is readily available for 5G deployment mainly in urban areas where the network traffic is the highest. These mmWave spectrum assets alone could provide speeds of about 1 Gbps. The nature of the non-standalone (NSA) 5G, which we will be seeing next year, is to operate on top of the existing LTE network which significantly improves the overall user experience.

Perhaps the most interesting aspect of the merger, at least from the technological side, is the integration of Sprint’s 2.5 GHz 5G-ready spectrum into the existing T-Mobile core. This integration offers up to 100 MHz of greenfield 5G spectrum in addition to 60 MHz of already deployed LTE capacity. Unlike the 28 GHz and 39 GHz mmWave spectrum, 2.5 GHz is more suited for wider area coverage and will offer higher spectral efficiency by the way of Higher Order MIMO (4×4 MIMO) and Higher Order Modulation (256 QAM).

Some capacity-enabling technologies like Massive-MIMO and FD-MIMO (Full Dimension MIMO) are already being deployed by both operators, adding 32, 64, and even 128 antenna elements to the cell sites. This will not only support the upcoming 5G, but will have the immediate benefits in terms of speeds for users equipped with LTE terminals.

Mergers aren’t about taking the average of carriers’ speeds, though. They are about how networks improve when the assets of both companies are combined. In the case of a merger between Sprint and T-Mobile, spectrum holdings will play a huge role.

The difference spectrum makes

Spectrum is the range of radio frequencies used to transmit voice and data. Different carriers hold and operate on different parts of the spectrum. Sprint holds a massive 150 MHz of nationwide 2.5 GHz spectrum, which uniquely positions them to provide an outstanding consumer experience. To date, most of that spectrum has been underutilized due to lack of funding, changes in leadership and unorthodox deployment strategies. Only 20-60 MHz of Sprint’s 2.5 GHz spectrum has thus far been deployed for commercial use, with some additional spectrum used for wireless backhaul. Sprint also holds about 37 MHz of mid-band spectrum, which is then shared between the legacy 3G and LTE technologies, and about 12 MHz of low-band spectrum.

And while the high-band (2.5 GHz) spectrum is excellent for providing incremental capacity, due to its signal properties it can’t propagate very far or penetrate concrete structures very well. This is why Sprint subscribers often end up falling back to Sprint’s limited mid- or low-band LTE network layer, which can translate to slower speeds and increased load times. T-Mobile’s cell site density and excellent mid-band spectrum could come in very handy to radically improve Sprint customers’ experience in a post-merger world.

On the other hand, a tightly-spaced cellular grid is T-Mobile’s strong point. This grid is optimized for 70 MHz of T-Mobile’s mid-band spectrum and delivers wideband LTE experience using both the 2100 MHz Advanced Wireless Spectrum (AWS) and 1900 MHz Personal Communications Service (PCS) layers. Combining what’s already the fastest LTE network in the U.S. with the massive 2.5 GHz spectrum assets on a dense network grid could potentially deliver exceptional network performance. This is because fewer users are served by any individual cell which increases network resources, improving speeds and overall user experience.

Both Sprint and T-Mobile operate in the 1900 MHz PCS frequency band, and in many markets the carriers could combine the existing holdings into a wider contiguous spectrum allocation which will further improve user experience.

How spectrum integration might play out

The obvious benefits to the merger would be the synergies. Mostly network-driven, these would include decommissioning redundant Sprint macro sites and reducing the operating expenditure of the combined company. The remaining portion of Sprint’s cell sites would fortify the existing T-Mobile footprint, adding incremental network capacity. Timing is essential, though. Over the last six months, Sprint has commited to $6B in network investments and may have signed contracts with tower companies and backhaul suppliers. The execution of this investment is still in the early stage, but once it’s had an opportunity to ramp up some of the synergies will dissipate.

T-Mobile is well known for its network efficiencies. They run a lean LTE network with a strong focus on extracting the highest possible spectral efficiency out of the existing spectrum assets, and also spearhead efforts in commercializing the latest advanced LTE features.

T-Mobile’s previous experience with absorbing a CDMA operator (Metro PCS) could offer insight into how spectrum and resource sharing would be affected by a merger. In that case, T-Mobile successfully migrated the Metro PCS customer base onto its advanced network core in record time, repurposing the spectrum shortly after sunsetting the CDMA network. This type of approach offers additional cost efficiencies, as Sprint’s older CDMA infrastructure can be removed, and redundant cell sites decommissioned.

Another potentially positive outcome to a merger comes with the upcoming 5G standardization. T-Mobile could utilize Sprint’s rather limited low-band spectrum to provide a dedicated narrowband IoT channel.

Coverage

What about coverage? Maps of Speedtest results from the U.S. Market Report showed a larger footprint of results on T-Mobile.

The combined entity would potentially number over 130 million subscribers, which would be comparable in size to both Verizon and AT&T. Overlaying the Speedtest coverage maps, we see that although the strengths of both networks are in urban centers, there are some areas where we see Speedtest results on Sprint but not T-Mobile. This includes much of central West Virginia. Sprint also sees more tests in more rural parts of southwestern Oregon, southwestern Colorado (near Montrose), the Texas panhandle, eastern Nebraska, and much of Wisconsin.

T-Mobile shows results in the following areas where Sprint results are sparse: southwestern Montana, northern Nevada, southern Wyoming, northeastern Arizona, across North and South Dakota, northern Minnesota, throughout rural New Mexico and in the more suburban areas near the Alabama/Tennessee border.

Presumably, customers in areas that have only had access to one network would see the biggest benefit from a merger.

Good news or bad?

A combined Sprint and T-Mobile could make for one powerhouse of a carrier with the customer base and clout of Verizon and AT&T. Not only would Sprint’s 2.5 GHz spectrum portfolio be a major asset to the combined entity, a merger between the two would also expand their geographical footprint and improve the cell site density in many markets which will be the key for the upcoming high band 5G deployment.

That said, there are a lot of unknowns. These things take time and it could take years for consumers to benefit from the combined spectrum efficiencies. From an operational point of view, mergers of this size typically shed a lot of jobs. Reducing the number of major carriers in the U.S. from four to three will change the competitive landscape in a way that could increase prices. We also do not yet know how such a merger would impact speeds, but we’ll share data on that here when we do.

Editor’s note: An earlier version of this article appeared on this blog on September 27, 2017.

Ookla retains ownership of this article including all of the intellectual property rights, data, content graphs and analysis. This article may not be quoted, reproduced, distributed or published for any commercial purpose without prior consent. Members of the press and others using the findings in this article for non-commercial purposes are welcome to publicly share and link to report information with attribution to Ookla.

| April 29, 2019

Analyzing the Capabilities and Performance of the Samsung Galaxy S10 Series

The recent launch of the Samsung Galaxy S10, Galaxy S10+ and Galaxy S10e marks the world’s first commercially available multi-gigabit LTE smartphone, with a theoretical max download speed of 2 Gbps. We took a look at how the phone performed during its first month on the market in the U.S. and the technology that makes multi-gigabit download speeds possible.

Performance comparison of Galaxy S10 models

It’s been three years since the very first Samsung 4Rx antenna design (Galaxy S7 Edge). This year’s Samsung Galaxy S10 series allows for up to 20 concurrent spatial streams depending on the spectrum availability and network deployments. This shines the light on Qualcomm’s Snapdragon X24 LTE modem and Qualcomm’s RF Front-End (RFFE). Together they enable the aggregation of up to five mid- and high-frequency bands, each leveraging up to four spatial streams, providing an end-to-end, modem-to-antenna solution. The Samsung Galaxy S10 series is the first Cat 20 commercially available smartphone to use this technology.

Ookla’s data science team took a closer look at U.S. performance across Samsung Galaxy S10 models during their first month on the market:

Speedtest® Results Among Galaxy S10 Models
United States | March 8-April 8, 2019
Model Mean Download (Mbps) Mean Upload (Mbps)
Samsung Galaxy S10+ 51.26 10.87
Samsung Galaxy S10 49.54 12.08
Samsung Galaxy S10e 49.18 12.61

In analyzing more than 606,000 Speedtest results performed on over 213,000 unique devices during March 8-April 8, 2019, we saw that the Galaxy S10+ mean download speed reached 51.26 Mbps. The Galaxy S10 and S10e closely followed with mean download speeds at just over 49 Mbps.

Comparing S10+ to other flagship phones

Numerous OEMs have shipped devices equipped with Category 16 and 18 LTE modems capable of up to 1 Gbps and 1.2 Gbps download speeds in recent years. These devices utilize a combination of three or four channel Carrier Aggregation, higher modulation and higher order MIMO to improve data rates. However, quite a few of these devices were limited to only eight concurrent spatial streams (Cat 15) by the carrier profile software load, which capped the full potential of the chipset and thereby the network.

Galaxy S10 Series vs. Other Flagship Phones
Speedtest® Results
United States | March 8-April 8, 2019
Model Mean Download (Mbps) Mean Upload (Mbps)
Samsung Galaxy S10+ 51.26 10.87
Samsung Galaxy S10 49.54 12.08
Samsung Galaxy S10e 49.18 12.61
Samsung Galaxy Note9 43.32 10.97
Apple iPhone Xs Max 43.04 11.23
Samsung Galaxy S9+ 42.25 10.95
Apple iPhone Xs 41.92 10.37
Google Pixel 3 XL 41.27 12.48
Apple iPhone Xr 33.17 10.78

As the table above shows, the Galaxy S10+ showed double-digit improvements over the mean download speeds of last year’s top flagship devices, beating the Note9 by 18.3% and the iPhone XS Max by 19.1% during the same period. The increase in speeds means that each S10+ data session completes significantly faster, making the wireless networks considerably more efficient.

Samsung was one of the first OEMs to overcome the challenges of implementing four spatially separated antennas into the handheld form factor in 2016. The company is further improving the isolation and reducing the antenna correlation necessary for high performing MIMO with each year’s design. The “plus” size of the S10+ seems to aid this process.

Upload speeds did not see the same improvement across Galaxy S10 models when compared to last year’s flagship phones. The Galaxy S10e did have the fastest upload speed among models included in this analysis with a 12.3% improvement over the iPhone XS Max and 14.9% over the Note9 during the same period. However, the Galaxy S10+ achieved slower upload speeds than either 2018 phone.

The technology behind the Samsung Galaxy S10’s multi-gigabit speeds

The Galaxy S10 is powered by Samsung’s own Exynos 9820 System on a Chip (SoC) in most of the world or Qualcomm’s Snapdragon 855 SoC in the U.S. and China. Both variants have an integrated LTE modem while the Qualcomm’s variant is capable of processing 20 concurrent spatial streams and reaching peak download speeds of 2 Gbps. This involves complex circuitry between the antennas and the RF transceiver responsible for transmitting and receiving the RF signals over the air.

Carrier Aggregation

The Galaxy S10 supports a whopping 7-channel Carrier Aggregation (CA). CA allows operators with multiple (disparate) frequency bands to offer faster download speeds to users by aggregating (bonding) multiple frequency bands into a faster “pipe.” As a result, subscribers complete data queries quicker, returning their devices to idle state which allows the operators to reuse the network resources.

256 QAM or higher order modulation

Another LTE-Advanced technology used by the Galaxy S10 is 256 QAM. 256 QAM allows for the transmission of more bits per symbol (8-bits) as opposed to 64 QAM (6-bits). This provides a spectral efficiency gain of 33%. However, devices need to report a relatively clean channel state or high Signal to Interference plus Noise Ratio (SINR), back to the network in order for 256 QAM payload to be scheduled. This means 256 QAM is typically limited to devices served at the very center of the cell.

4X4 MIMO

The Galaxy S10 also supports up to 5 channels running in a 4×4 MIMO configuration for a total of 20 spatial streams. 4×4 MIMO requires twice as many antennas as 2×2 MIMO at both the cell site and the user device. This increase in antennas allows for a potential doubling of the number of independent spatial streams (rank), which then can double the user’s data rates. To achieve a higher rank, the antennas at the cell site and the device need to be uncorrelated to provide independent paths for up to 4 data streams at the same time. Similarly to 256 QAM, this speed-boosting technique also depends on favorable signal conditions (high SINR).

One of the main benefits of 4×4 MIMO system is the antenna diversity gain which can provide signal robustness in areas of poor coverage. Because one or two data streams can be broadcast over four antennas, retransmissions are minimized and data rates improve. In order to achieve acceptable antenna de-correlation and isolation in a spatially constrained form-factor, the integration of 4 antennas into the smartphone design is limited to frequency bands above 1600MHz. Reaching the target throughput and spectral efficiency in a 4×4 network isn’t only a function of the radio access network optimization, but often times is limited by the user equipment modem-to-antenna performance.

4x4-mimo

The level of complexity that went into the Samsung Galaxy S10’s LTE design would have been unimaginable just a few years ago. This means that operators can provide even faster speeds to end users and deliver data more efficiently while leveraging existing spectrum assets.

Configuration of the Galaxy S10 in the U.S.

While 5G is only slowly trickling out to U.S. markets, the Galaxy S10 already supports virtually every imaginable Carrier Aggregation combination. This allows the S10 to take advantage of the specific configurations of all the top providers’ networks to provide faster speeds for consumers.

  • AT&T users benefit from the inclusion of Band 14, the FirstNet spectrum, when using the Galaxy S10. In addition, multiple mid- and high-band component carriers can leverage up to 4 data streams at the same time.
  • Sprint users can expect to see the aggregation of FDD and TDD spectrum. It’s worth noting that the Galaxy S10 can aggregate up to five TDD channels, all running in 4×4 MIMO mode, which allows for faster speeds and more efficient spectral utilization.
  • The Galaxy S10 can take advantage of T-Mobile’s new support for the aggregation of Band 71 (600MHz) with multiple mid-band component carriers in a 4×4 MIMO configuration. The company will also be able to take advantage of License Assisted Access (LAA) which is heavily deployed in dense urban markets like New York City to increase download speeds.
  • On Verizon, the Galaxy S10 enables the use of the recently opened up Citizens Broadband Radio Service (CBRS) spectrum on Band 48. This phone also enables Verizon to combine LAA Band 46 with licensed spectrum to offer even faster speeds.

Improved speeds using Wi-Fi 6

The Samsung Galaxy S10 is also the world’s first smartphone to support the Wi-Fi 6 (802.11ax) standard. This standard promises to deliver faster speeds, better user experience in crowded environments, better management of shared spectrum resources, and better use of Multi-User MIMO. Broadcom delivered the BCM4375 chip which takes care of the Wi-Fi and bluetooth connectivity.

Faster speeds to come with the Galaxy S10 5G

The Samsung Galaxy S10 5G promises to deliver the multi-gigabit experience of 5G out of the box when connected to a capable network. This device is powered by two different 5G discrete modems depending on the geographical region. For the global market Samsung is using its own Exynos 5100 5G modem, while the U.S. market is getting the Qualcomm Snapdragon X50. The Snapdragon modem supports TDD frequency bands, including the 2.5GHz and the millimeter Wave bands in the 28GHz and 39GHz range that are used in the United States.

We at Ookla are as excited as anyone to watch as 5G networks commercially launch. When they do, we’ll be watching Speedtest results to see how the Samsung Galaxy S10 5G performs in the wild.

Ookla retains ownership of this article including all of the intellectual property rights, data, content graphs and analysis. This article may not be quoted, reproduced, distributed or published for any commercial purpose without prior consent. Members of the press and others using the findings in this article for non-commercial purposes are welcome to publicly share and link to report information with attribution to Ookla.

| August 6, 2019

T-Mobile’s Spectrum and Coverage in a Post-Sprint World

The U.S. Department of Justice (DOJ) officially cleared the merger between T-Mobile and Sprint, joining the FCC in support of the deal, and bringing the merger one step closer to closing. The DOJ’s settlement comes with stipulations, however, including divesting Sprint’s prepaid business and some spectrum holdings to DISH so that a viable fourth nationwide competitor can enter the market. Additionally, the settlement declares that both operators must deploy high-quality 5G networks for the benefit of American consumers. We’re taking a fresh look at what coverage and spectrum would look like in response to the DOJ’s proposed deal.

Capitalizing on spectrum synergies

According to the consent decree with the DOJ, T-Mobile will keep Sprint’s entire 2.5 GHz and PCS spectrum portfolio, which will be integrated when the deal is finalized. The new T-Mobile will build an LTE layer on a denser cell site grid using Sprint and T-Mobile PCS spectrum synergies in combination with T-Mobile’s 600 MHz, 700 MHz and AWS holdings. This will address the existing capacity demand and expedite the process of allocating most of the 2.5 GHz spectrum assets to 5G NR.

Ookla_Sprint-TMob_Spectrum_20190802

To boost capacity, 2.5 GHz 5G-capable radios will be overlaid on existing T-Mobile sites, and over time, the existing PCS radio equipment will be reconfigured to support additional PCS spectrum coming from Sprint. In many major markets, that spectrum is contiguous to existing T-Mobile assets and will allow for wider allocations and higher spectral efficiency.

Top-Largest-Markets_TMobile-Sprint-03

Looking closely at the PCS spectrum in top markets, the contiguity between Sprint and T-Mobile is staggering. In markets like Los Angeles, Chicago, Philadelphia, and Detroit, adding the Sprint G Block will allow the new T-Mobile to expand the existing PCS spectrum assets and deploy 20 MHz channels. In Miami and Atlanta, the contiguous PCS block is a whopping 30 MHz wide. In markets like Detroit and Dallas, T-Mobile will have two 20 MHz PCS channels. This will enable the new T-Mobile to offer significantly improved capacity while leveraging more spectrally efficient 20 MHz channels. All this additional capacity makes the PCS spectrum a strong candidate for the 5G network.

T-Mobile’s good-faith agreement with DISH will potentially allow T-Mobile to leverage additional unused 600 MHz spectrum licenses, and a similar reconfiguration could be applied to the existing 600 MHz radios — widening the existing 5 MHz and 10 MHz channels — should the leasing agreement with DISH come to fruition.

Ookla_TMob-Dish_600_Spectrum_20190731

Since DISH currently doesn’t have an existing network — and it will take them several years to build it — their 600 MHz spectrum licenses are sitting idle, and American consumers aren’t benefiting from that spectrum. T-Mobile and DISH have agreed to an arrangement through which T-Mobile will be able to lease that spectrum and put it to use on its network. The arrangement is mutually beneficial, providing DISH with a revenue stream that could help with their network buildout, and the new T-Mobile with additional spectrum to enhance and accelerate the network transition process.

Top-Largest-Markets_TMobile-Dish-01

In some of the top markets like New York City, Los Angeles, and Miami, DISH’s 600 MHz spectrum licenses are directly adjacent to T-Mobile’s licenses, creating larger, contiguous spectrum blocks and allowing for wider LTE or 5G channels. In markets like New York, T-Mobile currently runs LTE in the 600 MHz band using only a 5 MHz wide channel, while the other 5 MHz license is idle and likely to be used for 5G, once 5G-capable user devices in the 600 MHz band become commercially available. Adding DISH’s 20 MHz contiguous spectrum block will allow the new T-Mobile to leverage the widest defined LTE channels (20 MHz) and still have 10 MHz available for 5G deployment. This would offer the highest possible spectral efficiency on a frequency band with superior propagation characteristics to the mid- and high-band. In addition, new smartphone designs allowing four separate data streams on the low band have already hit the market, allowing carrier aggregation of two low-band frequencies, or 4×4 MIMO. But more on that later.

What the merger means for coverage

Ookla_Sprint-TMob_Coverage_20190731

An estimated 11,000 Sprint sites will be retained to improve capacity and/or coverage on the new network. These sites add additional capacity to metro areas and expand coverage to areas T-Mobile hasn’t previously served. The sites will receive support for T-Mobile’s frequency bands, which could include replacement of Sprint’s existing 2.5 GHz equipment. Because Sprint’s existing 2.5 GHz infrastructure has equipment from a variety of vendors, these may be replaced to ensure compatibility with T-Mobile’s single-vendor-per-market strategy.

Integrating tens of thousands of existing Sprint sites will also mean reducing the lengthy regulatory process and will be done on a market-to-market basis.

Merging the networks and migrating customers

The details of how T-Mobile and Sprint will merge their networks are much clearer now than when we last wrote about this potential merger. In order to expedite the migration of Sprint subscribers onto T-Mobile’s network, T-Mobile will bridge the two network cores together by routing the traffic to the T-Mobile anchor network. This will be accomplished through the use of Multi-Operator Core Network (MOCN).

T-Mobile used a similar approach several years ago when migrating MetroPCS CDMA subscribers to the T-Mobile network. The number of Sprint customers migrating to T-Mobile in major metropolitan areas like New York and Los Angeles would be very similar to the number of MetroPCS customers that migrated, according to T-Mobile.

Many customers will not require new devices. A large number of Sprint’s postpaid subscribers carry devices that support T-Mobile LTE frequency bands, including the common PCS band, and will only require an over-the-air software update to enable new features and services like Voice over LTE (VoLTE). This approach will offer immediate improvements in coverage and speed to Sprint subscribers, while freeing up Sprint’s PCS spectrum assets currently used for CDMA voice services.

What to expect from the new T-Mobile 5G network

5G is central to T-Mobile’s commitments to the FCC, including:

  • Covering 97% of the U.S. population with 5G in three years
  • Covering 99% of the U.S. population with 5G in six years
  • Offering in-home broadband nationwide, including in rural America

The spectrum portfolio and combined cell site grid will only improve the existing coverage and capacity, and the addition of Sprint’s 2.5 GHz and DISH’s 600 MHz spectrum assets will ease the transition of Sprint and DISH customers onto T-Mobile’s network. The new T-Mobile will hold around 160 MHz on average of 2.5 GHz mid-band spectrum in the top 100 markets, and potentially as much as 194 MHz. This will allow the new T-Mobile to deploy mobile 5G by layering low-band (600 MHz) and mid-band (2.5 GHz), which has the potential to provide the right balance of coverage and capacity. The excess capacity will be made available for in-home broadband, providing more options in underserved and rural areas. T-Mobile’s existing mmWave licenses will add additional capacity in dense urban areas.

To take advantage of the new T-Mobile’s spectrum and 5G network, smartphones must have the capability to aggregate both Sub-6 FDD and TDD (FR1) with mmWave (FR2), in addition to LTE. We expect to see 5G smartphones with chipsets capable of leveraging FDD low-band spectrum (FR1) become commercially available later this year, which will allow for 5G deployments in the 600 MHz band. This low frequency band can travel farther and penetrate through the walls better, which will allow T-Mobile to offer a nationwide 5G network. Existing 600 MHz LTE radios on T-Mobile’s cell sites are “5G Ready,” which means the network is only a software upgrade away from transmitting 5G throughout the existing 600 MHz footprint.

Also, the world’s first smartphone design supporting 4×4 MIMO and inter-band carrier aggregation on low bands has already entered the market, Sony Xperia 1 although the support for 600 MHz is lacking. We should expect similar designs supporting T-Mobile’s 600 MHz and 700 MHz bands in the future, which could potentially double user throughput, improving signal robustness and elevating the overall network efficiency and user experience.

Selecting Sprint “keep” sites

In conjunction with Speedtest IntelligenceTM data from Ookla®, T-Mobile developed an engineering model for forecasting both congestion and required capacity at the sector level. This model involves collecting KPIs within the radio network infrastructure and has been, according to T-Mobile, highly accurate.

This effort has led to 71% reduction in congestion, while traffic and customer growth have increased over the past several years. The model is also being used to analyze which T-Mobile and Sprint cell sites to keep to enhance the New T-Mobile cell site portfolio based on network coverage, traffic and spectrum available.

DISH, the new fourth competitor

Ookla_Dish_Spectrum_20190801

The DOJ’s response to the T-Mobile-Sprint merger also includes structural remedies to enable a viable fourth facilities-based nationwide operator, DISH, to enter the market. Over the past decade or so, DISH has acquired large amounts of mostly mid- and low-band spectrum that hasn’t been put to use. That includes the 600 MHz, 700 MHz, AWS and recently some millimeter Wave spectrum licenses.

The DOJ’s proposed structural remedies are meant to spur DISH to deploy unused spectrum assets, then enter the wireless business as a viable nationwide operator. Allowing DISH to acquire 800 MHz divested spectrum assets after three years — coupled with 20,000 (likely more) of Sprint’s redundant sites that already have the 800 MHz radio equipment and backhaul access available — should help DISH meet the agreed-upon buildout targets to have a facilities-based network by June 2023. Granted, these sites will stay running to support Sprint’s postpaid and divested prepaid legacy customers for at least three years, at which point DISH will have to make some investments for additional adjustments to the sites, such as gNodeB and radio equipment upgrades. After three years, if DISH elects not to purchase the divested 800 MHz nationwide spectrum licenses (penalties apply), T-Mobile will have the option to auction the 800 MHz spectrum at the same or higher cost, or keep it. In addition, DISH will be given access to several hundred retail locations the New T-Mobile plans to decommission.

Considering Sprint’s existing coverage, there is a high probability that these divested cell sites will be mainly concentrated in the metro areas. That said, DISH subscribers will be able to access the new T-Mobile’s nationwide network in areas not covered by DISH’s facilities-based network for a period of seven years, which should also provide plenty of time for DISH to expand its native network footprint.

Despite the upcoming legal challenges from 14 states, the consent decree from the DOJ is a key milestone in the potential merger between T-Mobile and Sprint. We’ll be watching its progress, using Mosaik research and solutions to monitor coverage and spectrum changes and Speedtest Intelligence to analyze performance.

Ookla retains ownership of this article including all of the intellectual property rights, data, content graphs and analysis. This article may not be quoted, reproduced, distributed or published for any commercial purpose without prior consent. Members of the press and others using the findings in this article for non-commercial purposes are welcome to publicly share and link to report information with attribution to Ookla.

| August 14, 2019

Qualcomm’s Snapdragon X50 in the Wild: Analyzing 5G Mobile Performance in U.S. Cities

Most consumers are unaware how vital a modem is to a smartphone’s performance. From HD and 4K video streaming to augmented reality and cloud computing on-the-go — a fast modem makes all the difference in day-to-day user experience. Today we’re taking a closer look at the real-world performance of the Qualcomm Snapdragon X50 modem to find out how much faster 5G is than LTE, what 5G speeds look like in specific cities and where 5G upload speeds are outpacing expectations.

The Snapdragon X50 in the Samsung Galaxy S10 5G and LG V50 ThinQ 5G

Previously, we explored how the Snapdragon X24 integrated LTE modem helps the Samsung Galaxy S10 top the charts for speed. The Snapdragon X50 modem allows users to take advantage of the increased speed and bandwidth of 5G, adding support for up to 800 MHz of bandwidth (eight carriers) on the downlink and uplink in the FR2 and 100 MHz in the FR1 TDD (time division duplex). In the Galaxy S10 5G, the modem is paired with three QTM052 modules containing 5G NR transceivers, all of the RF front-end components and a phased antenna array supporting the millimeter wave (mmWave) frequency range. The LG V50 ThinQ device manages to pack a similar configuration into an even smaller footprint.

Designing mmWave handsets poses a significant technological challenge and, to the best of our knowledge, only the original equipment manufacturers (OEMs) leveraging Qualcomm’s complete modem-to-antenna solution have successfully been able to bring their designs to market.

How much faster is 5G than LTE?

We examined Speedtest IntelligenceTM data from July 2019 to understand the performance delta between when users have a 5G NR connection and when they can only connect to baseline LTE. To keep a level playing field in the analysis, we only looked at results from the Samsung Galaxy S10 5G and the LG V50 ThinQ 5G, which both use the Snapdragon X50. Because AT&T had not yet launched 5G for consumers in July 2019 and T-Mobile started offering 5G in late June, we’ve only included results from Sprint and Verizon in cities where they have 5G available.

Comparing 5G and LTE Download Speeds in the U.S.
Speedtest Data | July 2019


Operator 5G (Mbps) LTE (Mbps) % Difference in 5G vs. LTE Maximum on 5G (Mbps)
Sprint 236.09 79.25 197.9% 724.33
Verizon Wireless 870.34 102.23 751.4% 2353.44

Sprint, being the only U.S. operator offering 5G service in the sub-6 GHz (2.5 GHz TDD) frequency range, has the potential to deliver enhanced 5G coverage and capacity with the addition of 40-60 MHz of bandwidth. Speedtest Intelligence shows that tests initiated on Sprint’s 5G connection deliver a nearly 3X improvement in download speeds over its speeds on LTE. The network performance could improve even further with an increased utilization of higher-order MIMO (5G and LTE), a higher contribution of the LTE layer during EN-DC (dual connectivity) and an improved backhaul.

Verizon Wireless’s network currently relies on mmWave in the 28 GHz band. The limited propagation of this frequency band makes it suitable for dense urban deployments, and vast swaths of spectrum (400 MHz) deliver breathtaking speeds on mobile devices. On average, Verizon’s customers with 5G-capable devices were seeing more than 8X improvement in download speeds in 5G covered areas, and we’ve noted Speedtest results with peak speeds in excess of 2 Gbps on the Verizon Wireless network.

Measuring 5G with Speedtest

It’s important to note that Speedtest is uniquely positioned to measure 5G and other gigabit-and-beyond speeds. Speedtest uses a client and server testing engine capable of measuring high-speed connections (up to 10 Gbps) that dynamically scales the number of connections to the server in order to saturate and accurately measure the client-side connection. This allows us to measure the full extent of real-world performance and overcome the effects of network bottlenecks such as TCP slow start. In addition, Ookla has partnered with operators and device manufacturers all over the world to implement accurate in-app 5G detection — even as Android Pie, which powers the current generation of 5G devices, does not natively identify 5G connection types. Through this approach, we’re able to properly configure the parameters of a Speedtest and measure 5G tests.

Other tests, which instead only download a very small file from a CDN or server, are insufficient to properly understand how a connection might perform when downloading a video or updating a mobile game over a 5G connection.

5G vs. LTE in major U.S. cities

Looking at Speedtest results in several major cities where mobile operators have launched 5G, we found that the performance gap between 5G and LTE is even more striking at the city level.

Comparing 5G and LTE Download Speeds in Select U.S. Cities
Speedtest Data | July 2019


City Operator 5G (Mbps) LTE (Mbps) % Difference in 5G vs. LTE Maximum on 5G (Mbps)
Atlanta Sprint 246.30 81.45 202.4% 605.91
Chicago Sprint 256.79 64.37 298.9% 724.33
Chicago Verizon Wireless 873.20 128.71 578.4% 2034.76
Dallas Sprint 292.17 114.41 155.4% 633.60
Denver Verizon Wireless 988.37 107.41 820.2% 2018.62
Houston Sprint 296.64 91.78 223.2% 653.50
Minneapolis Verizon Wireless 931.98 91.59 917.5% 1935.10
Providence Verizon Wireless 1138.82 101.32 1024.0% 1835.80

Verizon Wireless showed faster 5G Speedtest results, on average, than Sprint in cities like Chicago, where both operators offer 5G. This is because Verizon Wireless utilizes larger swaths of mmWave spectrum. The downside is that mmWave does not propagate as far, so while Sprint’s sub-6 GHz 5G deployments are slower than Verizon’s, Sprint is able to cover a wider area by mostly overlaying the existing LTE macro sites.

The S10 5G and the V50 ThinQ, both powered by the Snapdragon X50 modem, recorded a 4X improvement on Sprint’s 5G network in Chicago. While in Providence, Verizon’s 5G network is 11X faster than its baseline LTE. It’s remarkable how devices that fit in the palm of your hand are now capable of delivering speeds that exceed most residential fiber deployments.

Where we see 5G being used for uploads

Knowing that non-standalone (NSA) 5G deployments use an LTE anchor for signaling information as well as the user plane (EN-DC), upload speeds over 5G typically vary only slightly from baseline LTE speeds. But in Providence (Verizon) and Chicago (Sprint) we saw a significant delta on the uplink between 5G upload speeds and those on LTE. Both Sprint and Verizon use Samsung infrastructure equipment in these two markets, which may indicate that Samsung’s existing software solution could be slightly ahead of the competition.

Comparing 5G and LTE Upload Speeds in Select U.S. Cities
Speedtest Data | July 2019


City Operator 5G (Mbps) LTE (Mbps) % Difference in 5G vs. LTE Maximum on 5G (Mbps)
Chicago Sprint 20.25 8.03 152.3% 40.96
Providence Verizon Wireless 50.55 28.28 78.8% 133.84

We can’t say what download/upload ratio Sprint uses to supplement LTE uploads, but we tested Verizon’s 5G network in Providence first-hand several weeks ago and have some theories. We saw that utility poles carry Samsung 5G-only radios forming a tight 5G cell grid. We did not notice very many LTE macro sites within that particular area of coverage. Peak upload speeds were around 130 Mbps, and we’ve verified that LTE UL-CA (carrier aggregation) isn’t being used, which indicates that Verizon either supplements the existing LTE uplink with mmWave — or, more likely, uses mmWave entirely for user plane traffic on the uplink. The signaling exchange messages from the S10 5G reveal that it supports 100 MHz-wide channels on the uplink in the mmWave spectrum, with two-layer MIMO and 64 QAM — and to our knowledge Verizon could be the first network in the world leveraging mmWave in the uplink:

supportedSubcarrierSpacingUL kHz120,
supportedBandwidthUL fr2 : mhz100,
mimo-CB-PUSCH
maxNumberMIMO-LayersCB-PUSCH twoLayers,
maxNumberSRS-ResourcePerSet 1,
supportedModulationOrderUL qam64

The highly complex modem-to-antenna architecture supporting mmWave on the downlink requires lots of advanced processing for features like beamtracking and beamforming. Other than Qualcomm, most chipset manufacturers are still working on delivering their first-generation product. Qualcomm’s ability to make a commercially available product that can deliver a stable uplink using mmWave in the field while utilizing 2×2 MIMO is impressive.

What we expect from the Snapdragon X55 5G modem

The recently announced Samsung Galaxy Note 10+ 5G T-Mobile and AT&T variants will feature the 2nd generation of the Qualcomm Snapdragon X55 5G modem. When this device hits the market sometime in Q4 2019, it will be the very first smartphone with support for 5G frequency division duplex (FDD) spectrum allocations. It will also unlock T-Mobile’s 600 MHz 5G network layer which aims to enhance its existing 5G coverage this year and bring broad nationwide 5G coverage next year.

The Samsung Galaxy Note 10+ 5G will also support the use of Dynamic Spectrum Sharing (DSS), expected to be ready and deployed on the infrastructure side sometime in the first half of 2020. This 5G feature will enable operators without fallow FDD spectrum assets, like AT&T and Verizon, to offer 5G coverage concurrently with LTE using existing LTE spectrum assets. By simultaneously running both technologies on the same spectrum allocation and dynamically switching on the subframe level, operators will potentially eliminate the immediate need for spectrum refarming.

There are also some unknowns with the Samsung Galaxy Note 10+ 5G. While Qualcomm’s Snapdragon X55 5G modem itself supports the concurrent use of FR1 (sub-6 GHz) and FR2 (mmWave) bands, the device design seeded to the U.S. market only seems to support FR1, which is used by T-Mobile and AT&T. Considering that the Snapdragon X55 is a multi-mode solution, we should expect integration of this modem into the next-generation system on a chip (SoC) from Qualcomm. Once coupled with QTM525 modules, this should further increase efficiencies. The FR2 Verizon variant will use the first-generation Snapdragon X50 modem. It will also be interesting to see if Samsung will implement a four-branch antenna design for low frequency bands on the FR1 Note variant (T-Mobile/AT&T), which would enable the use of carrier aggregation across two low-frequency bands or the use of four spatial streams on the 600 MHz and 700 MHz bands.

With the advent of 5G, chip manufacturers must tackle increasingly complex issues and OEMs must start using chips that are capable of meeting the demands of today’s consumers. According to our data, the Snapdragon X50 is already facilitating lightning-fast speeds in 5G-ready cities in the U.S. We’re excited to see the next generations of chips from Qualcomm and other manufacturers — as well as the wave of even faster speeds they make possible. For more detailed analyses of device capabilities and network performance, contact Ookla about enterprise solutions.

Editor’s Note: This article was updated on August 14, 2019 to correct the date of launch of T-Mobile’s 5G service.

Ookla retains ownership of this article including all of the intellectual property rights, data, content graphs and analysis. This article may not be quoted, reproduced, distributed or published for any commercial purpose without prior consent. Members of the press and others using the findings in this article for non-commercial purposes are welcome to publicly share and link to report information with attribution to Ookla.

| May 12, 2020

How U.S. Mobile Operators are Putting Fresh Spectrum to Use for the Masses

As U.S. consumers shifted their lifestyles and mobile usage in response to the coronavirus, U.S. mobile operators were working to ensure that mobile networks were ready for a potential spike in demand. They struck multiple temporary spectrum deals with various license holders of unused spectrum, including a variety of spectrum assets held by DISH. Today we’re examining how these temporary spectrum allocations have performed at providing incremental capacity gain across many markets and operators.

Verizon expands FDD LTE

On March 18, the Federal Communications Commission granted Verizon’s request for Special Temporary Authority (STA) to leverage licenses held by DISH’s designated entities, SNR Wireless and Northstar Wireless. These licenses enabled Verizon to add as much as 10 MHz of FDD LTE in some markets to boost user experience. With this added spectrum, Verizon was able to consistently deliver mean LTE download speeds of around 36 Mbps during the first four months of 2020. That performance represents a 10.7% increase in download speeds over the same period last year.
verizon_lte_performance_q1_2019_2020

AT&T leverages AWS

DISH also agreed to provide a portion of its unused Advanced Wireless Services (AWS) spectrum licenses to AT&T for 60 days, free of charge. Both Verizon and AT&T have already put some of this spectrum to use in a limited number of markets, on some (not all) cell sites.

Over the first four months of 2020, AT&T recorded a major performance boost, with mean LTE download speeds showing as much as a 32.6% year-over-year improvement.
att_lte_performance_q1_2019_2020

This significant improvement can be attributed to many factors:

  • In some markets, AT&T serves customers across as many as nine different spectrum bands, which provides ample capacity and flexibility.
  • Newer devices are able to leverage five-channel Carrier Aggregation, allowing users to complete download tasks and return resources back to the network much more quickly, resulting in a more efficient redistribution of resources across the network.
  • The FirstNet network integration required a technician’s visit to cell sites, which AT&T used to upgrade its existing radio access equipment while deploying more efficient LTE features like 4×4 MIMO and 256QAM, as well as NR capable radios in the cellular band (850 MHz).
  • AT&T also performed additional “under the hood” core network improvements.

T-Mobile doubles down on 600 MHz

T-Mobile has been the most active operator by far in reallocating spectrum to prepare for possible demand increases. First on Friday, March 13, DISH pushed out a press release late in the afternoon announcing that it allowed T-Mobile to use its 600 MHz spectrum licenses nationwide for 60 days as a relief during the pandemic. In a blog post the following day, T-Mobile confirmed the use of DISH’s spectrum, in addition to that of other 600 MHz spectrum holders, including: Bluewater, Channel 51, Comcast, Grain Management affiliate NewLevel LLC, LB Holdings and Omega Wireless LLC.

The FCC acted swiftly and approved the 60-day temporary spectrum access to T-Mobile on Sunday, March 15. Because T-Mobile already operates the 600 MHz network nationwide, and radio equipment made by Ericsson and Nokia already support both LTE and NR technologies, T-Mobile was able to deploy the incoming spectrum almost immediately by remotely reconfiguring the equipment. By the morning of March 17, T-Mobile’s LTE bandwidth quadrupled, in some cases jumping from 5 MHz to 20 MHz of total spectrum. On March 19, T-Mobile announced a successful deployment of the additional 600 MHz spectrum.

Likely a result of the quick activation of the additional DISH spectrum, T-Mobile’s mean download speed over LTE recorded a 10.5% improvement when comparing April 2020 with April 2019.
tmobile_lte_performance_q1_2019_2020

As operators continue to adapt their network strategies to changing consumer behavior, it will be interesting to watch how spectrum is allocated to accommodate increased demand. We will continue to follow mobile performance in the U.S. to see if mobile operators can capitalize on these gains once the 60-day window is up. If you’re interested in how networks have been performing in your region, learn more about Speedtest Intelligence.

Ookla retains ownership of this article including all of the intellectual property rights, data, content graphs and analysis. This article may not be quoted, reproduced, distributed or published for any commercial purpose without prior consent. Members of the press and others using the findings in this article for non-commercial purposes are welcome to publicly share and link to report information with attribution to Ookla.

| May 28, 2020

How T-Mobile’s Merger with Sprint is Changing the Game for 5G

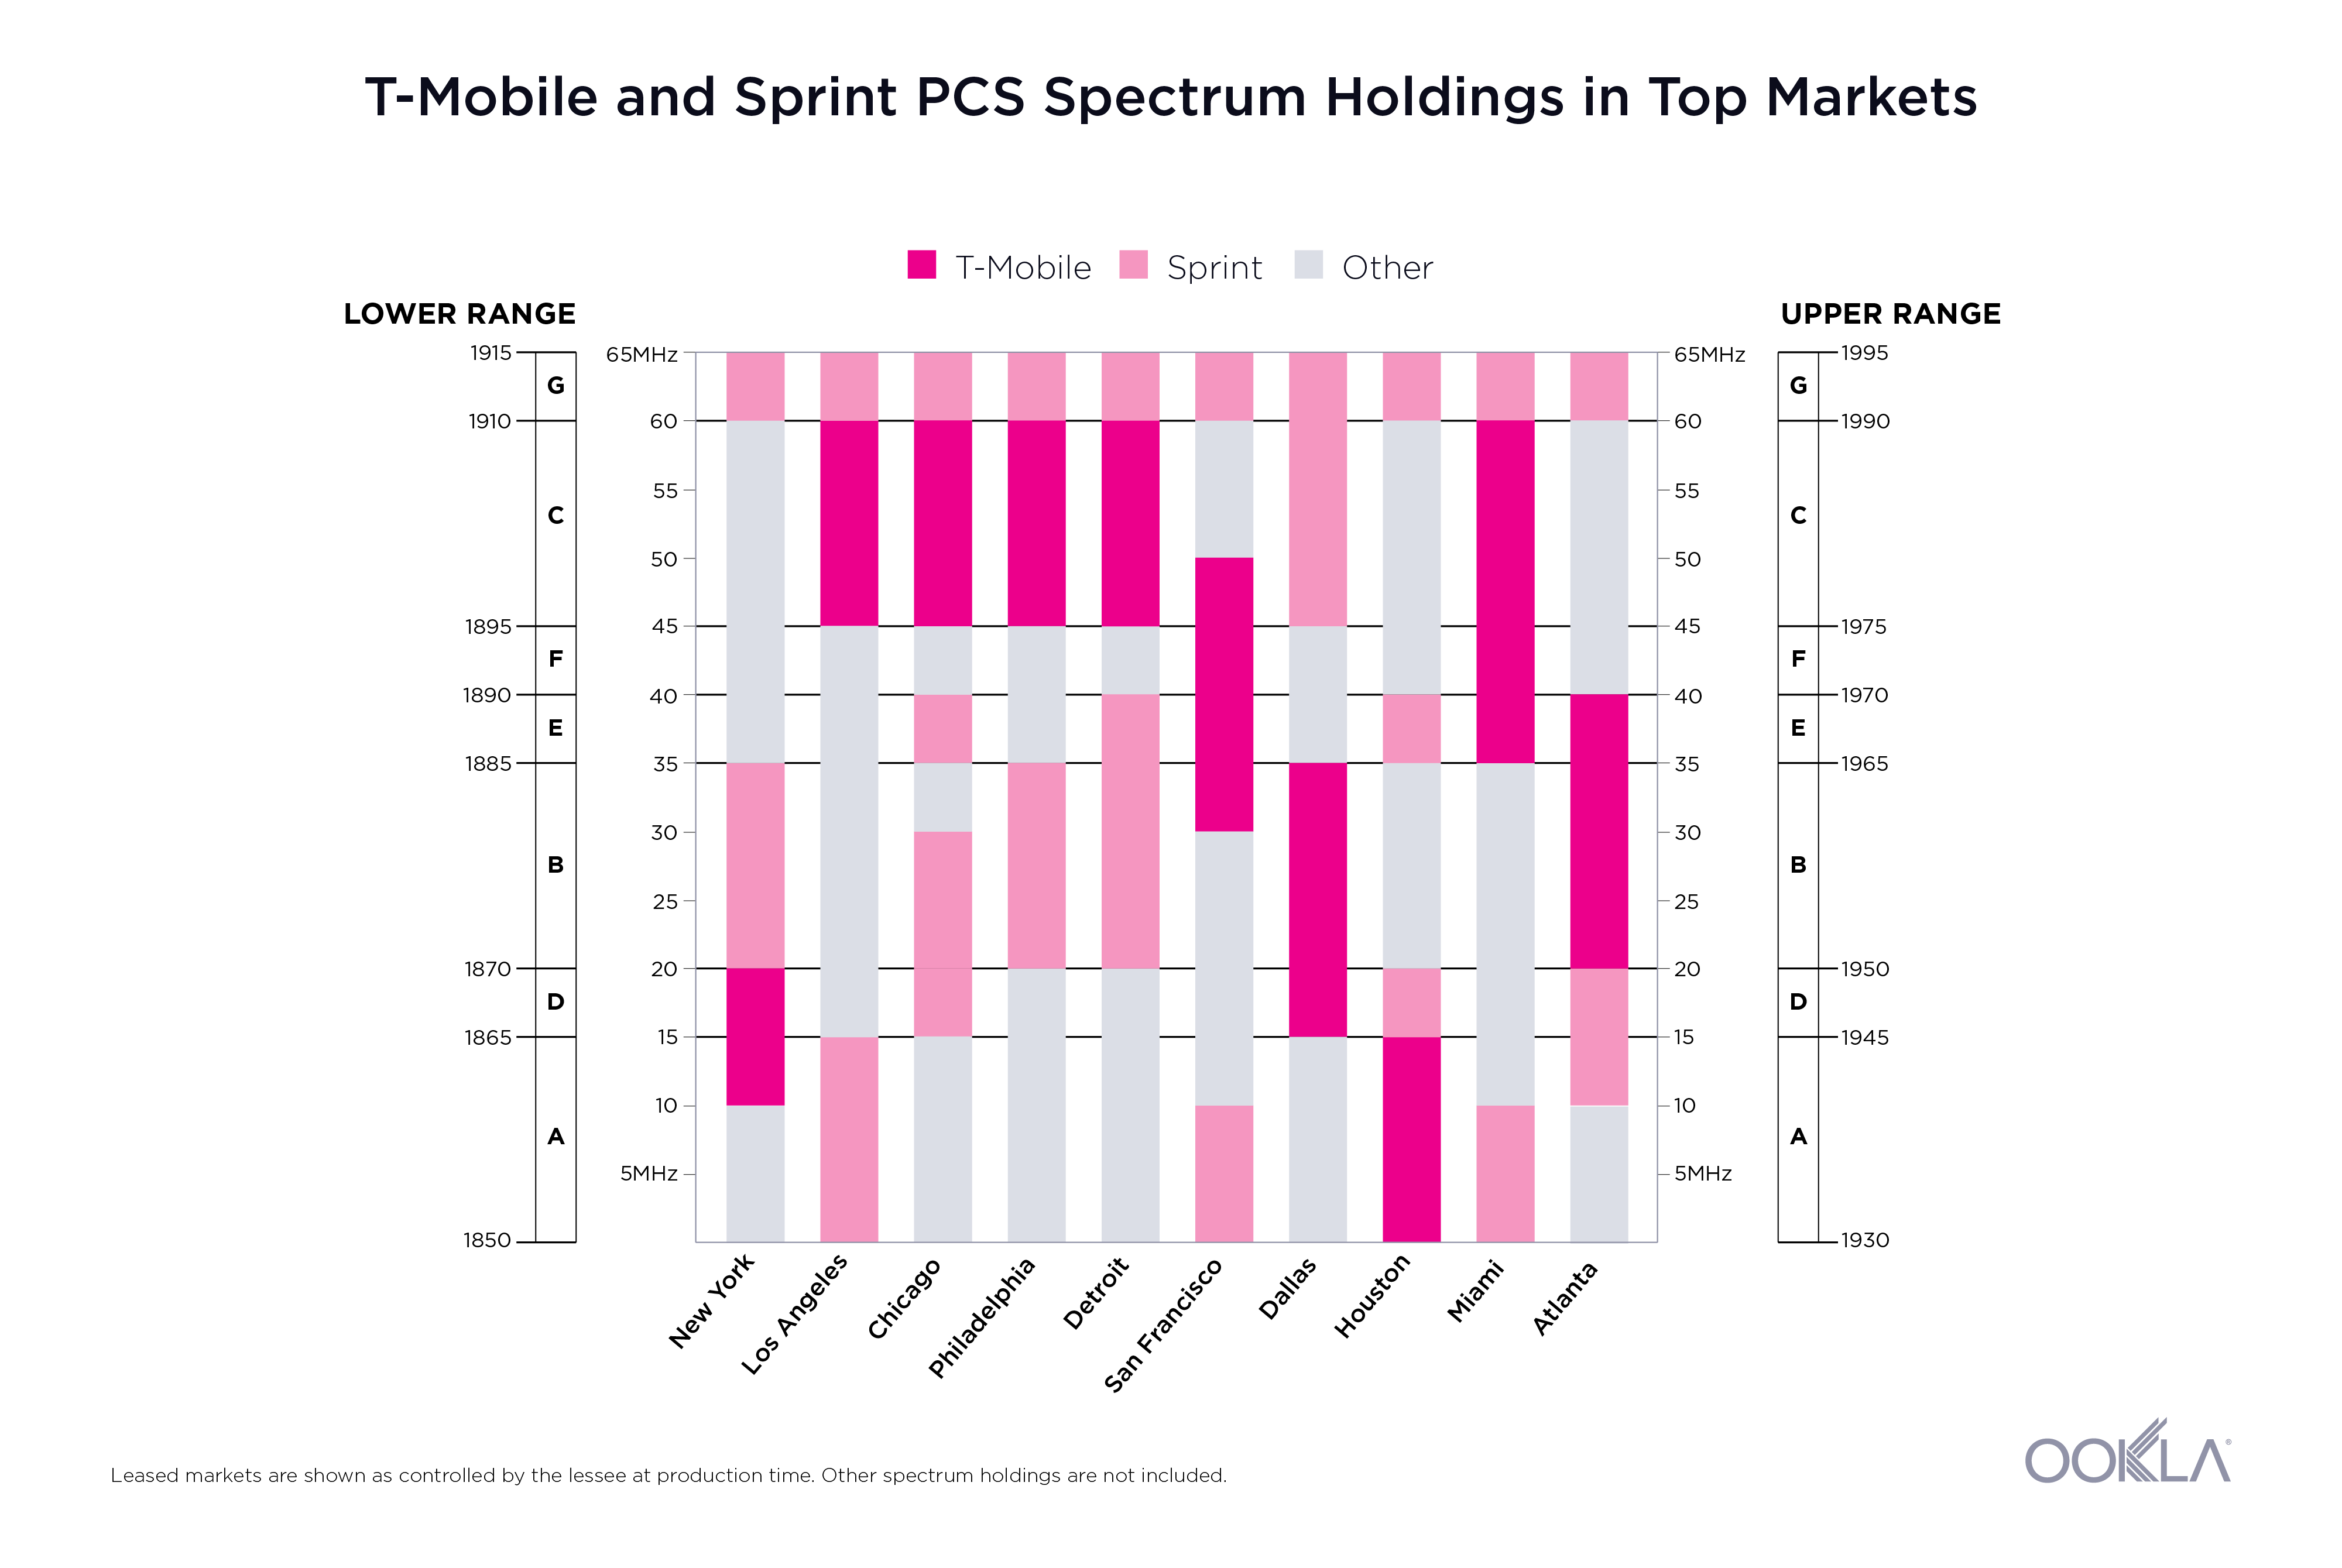
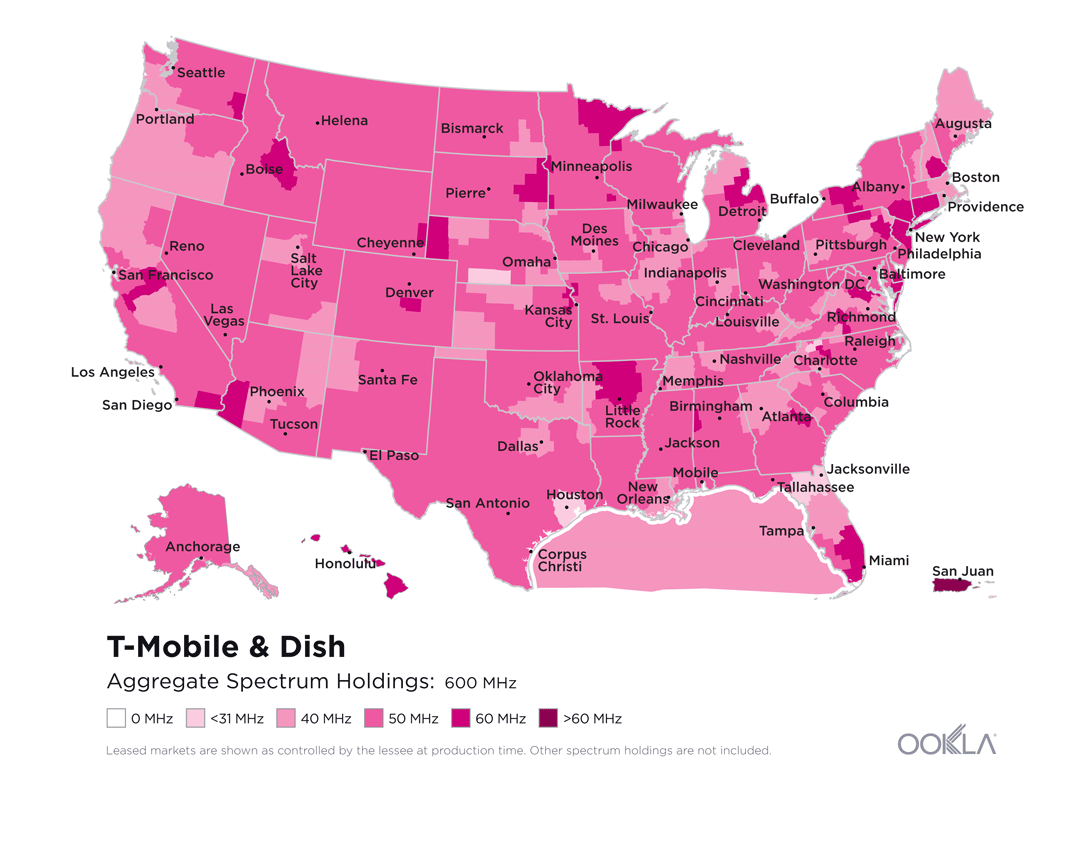
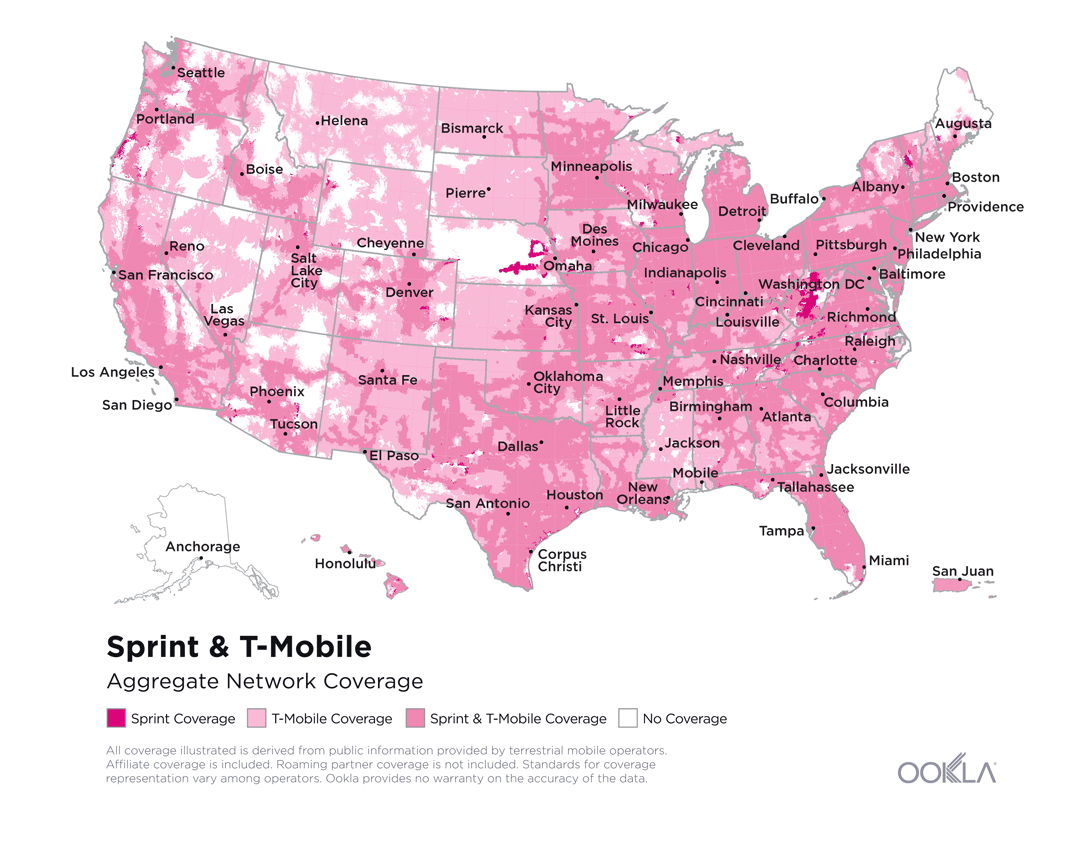
After almost two years and numerous legal battles, T-Mobile and Sprint are finally one. Equipped with a vast arsenal of spectrum assets, the new company aims to create an unparalleled 5G experience from urban areas to underserved rural communities across America. The biggest prize of this merger is 150 MHz of Sprint’s 2.5 GHz spectrum across top 100 markets. Combining Sprint and T-Mobile assets, T-Mobile now controls 319 MHz of sub-6GHz spectrum nationwide, and they have already started injecting some of this valuable capacity into the network and making it available to Americans.

The Philadelphia experiment

Because of the leasing and permitting work done in Philadelphia months ahead of the April 1, 2020 merger approval, T-Mobile was able to activate a number of 2.5 GHz (n41) sites on day one, followed by the official market launch on April 21. Massive MIMO radios were overlaid on T-Mobile’s existing cell sites, adding 60 MHz of spectrum in the 2.5 GHz band. Since Philadelphia wasn’t one of the nine markets where Sprint launched 5G, the fallow 2.5 GHz spectrum was readily available for use. T-Mobile had already covered Philadelphia with 5G in the 600 MHz band (n71), and the 2.5 GHz layer should provide a much-needed capacity boost. We can already see the increase in performance over the past four months.
t-mobile_5G_performance_philadelphia_0520-1

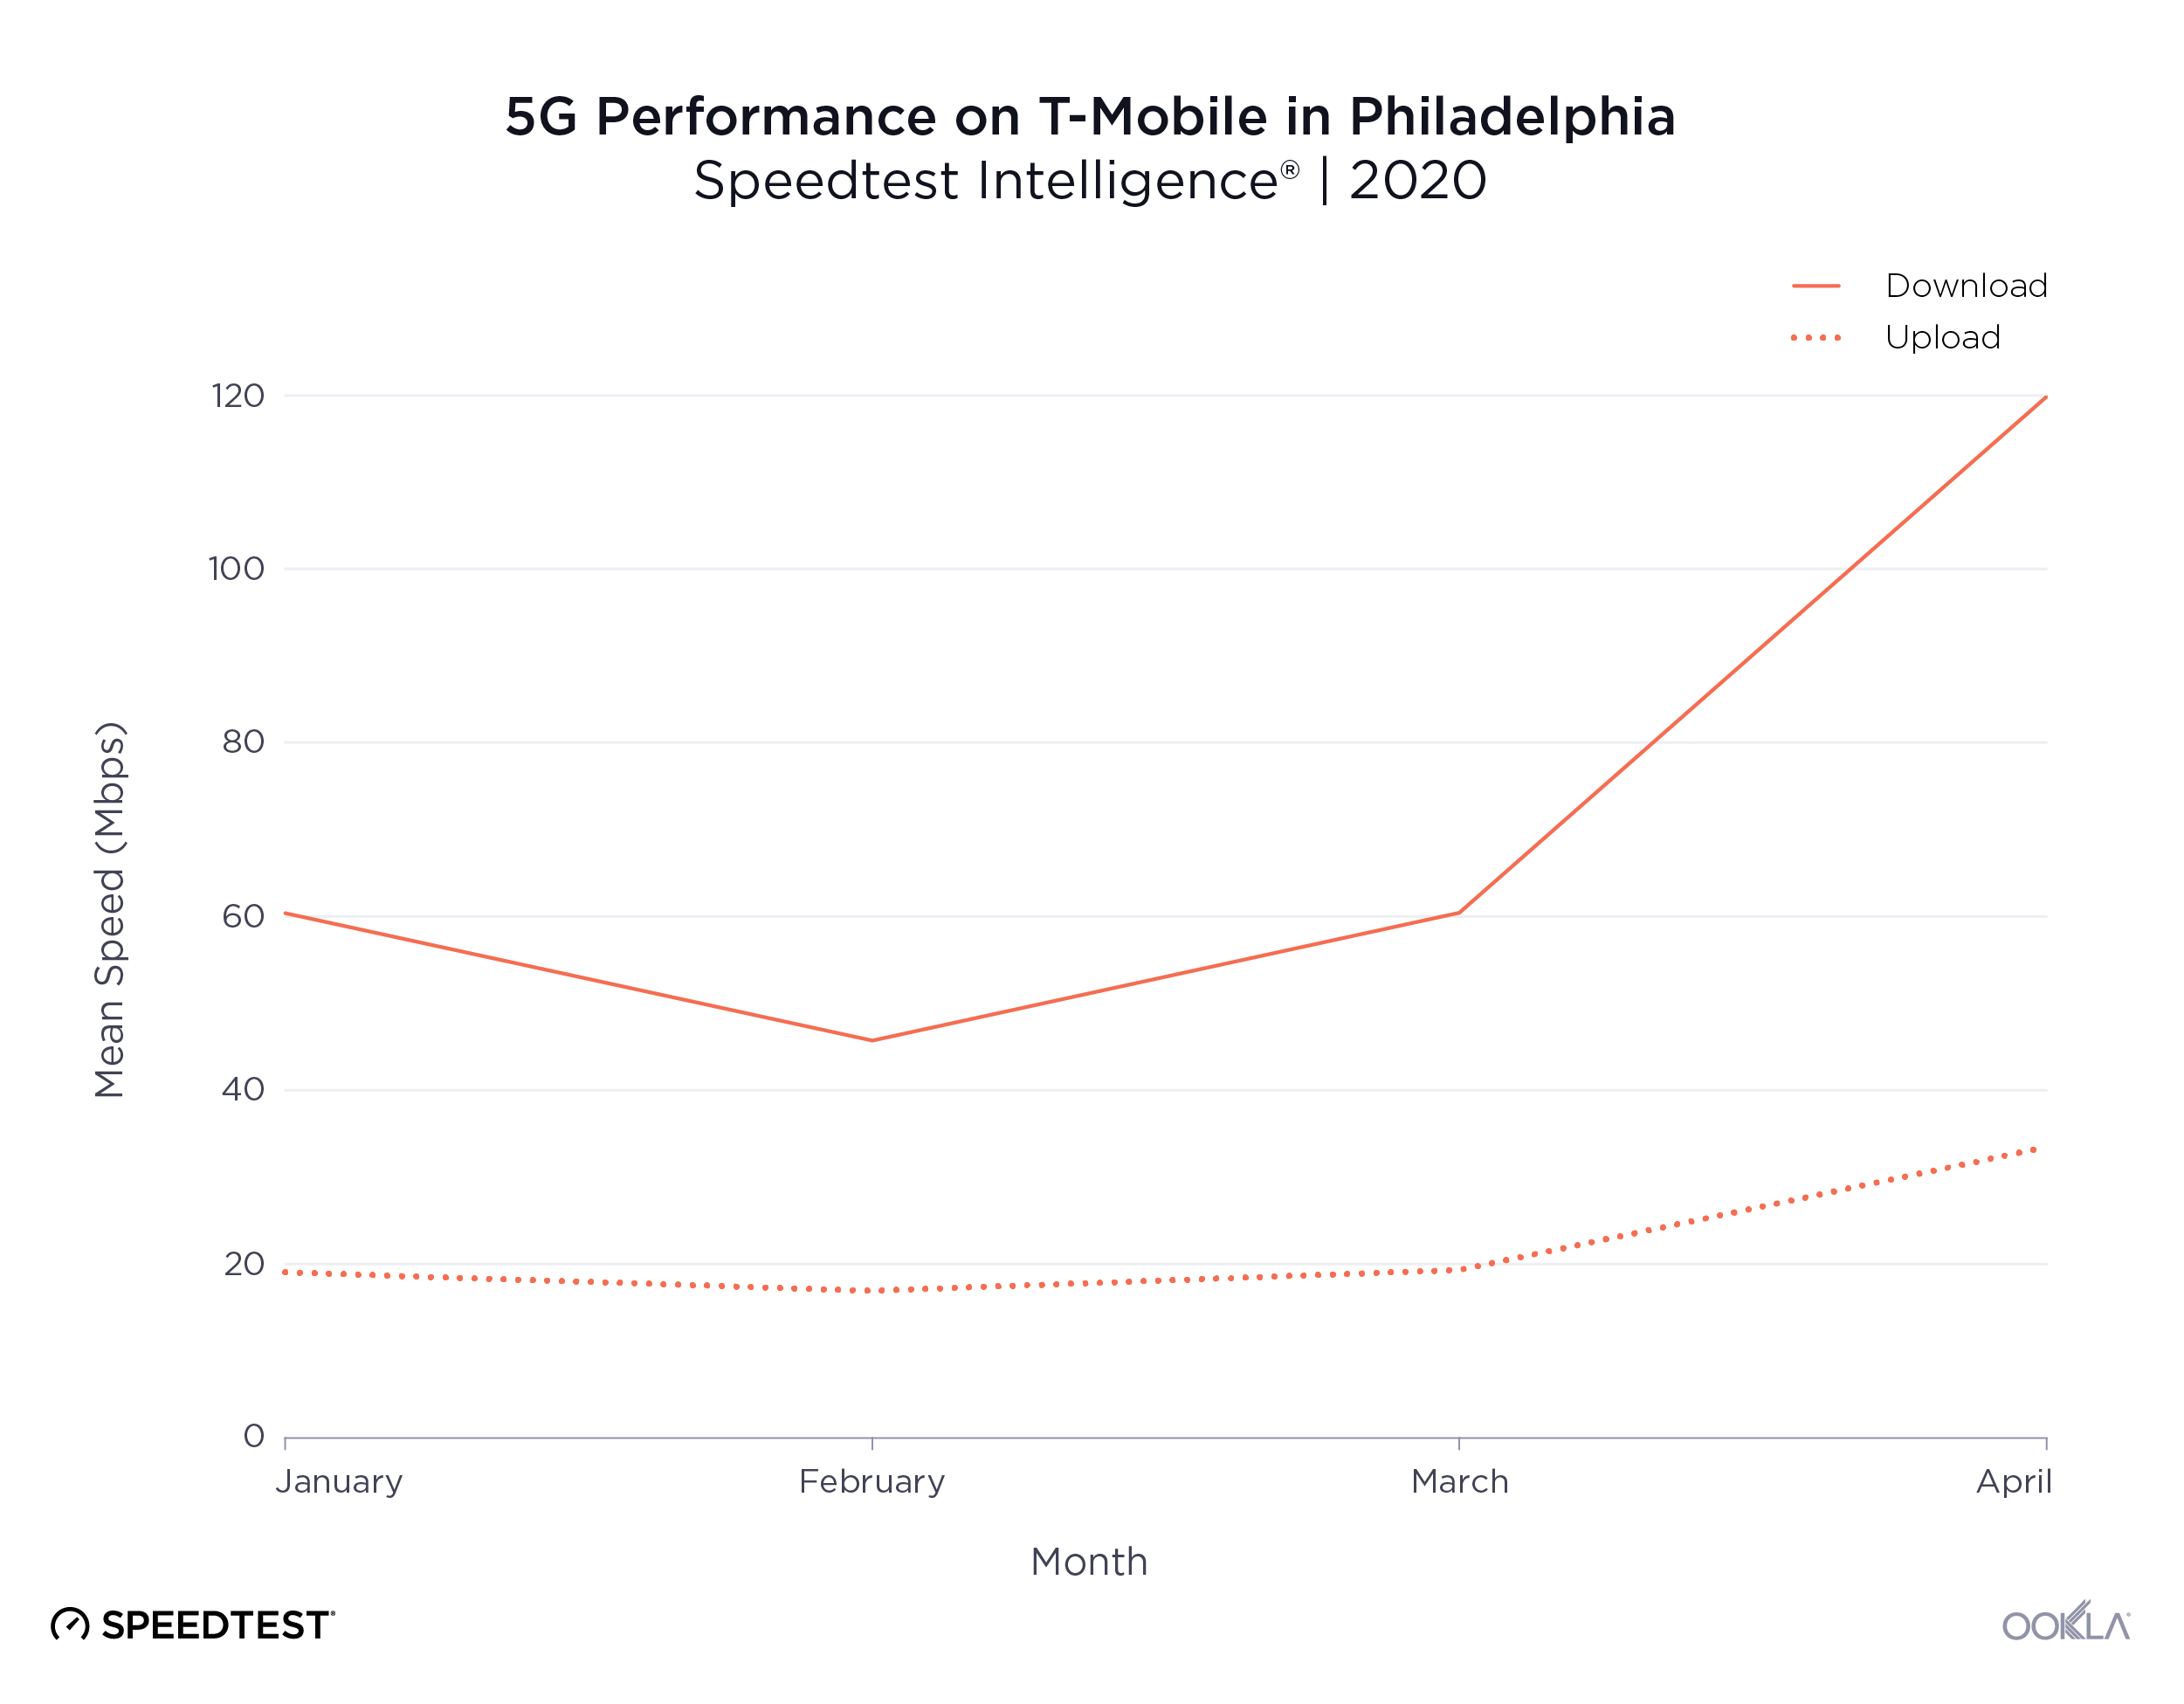
An analysis of all 5G tests taken on T-Mobile’s network in Philadelphia shows mean download speeds doubling during the month of April. A huge jump from 60.40 Mbps to 119.82 Mbps coincides with the rollout of 5G on the fresh mid-band spectrum. During the same month, we observed peak 5G download speeds exceeding 700 Mbps. Mean latency also fell from 30 ms to 21 ms over the period. Unlike the millimeter wave frequencies, which could offer greater speeds in a very small footprint, the 2.5 GHz band provides a good balance between coverage and capacity for mobile use.

T-Mobile’s layer cake in Manhattan

On May 5, T-Mobile launched its second mid-band 5G market in New York City. This launch marked the world’s first 5G network built on low, mid and high frequency bands. Paired with the multi-gigabit fiber backhaul, this 5G network is designed to deliver uncompromised performance. T-Mobile calls this the “Layer Cake 5G strategy.”
t-mobile_5G_performance_nyc_0520-1

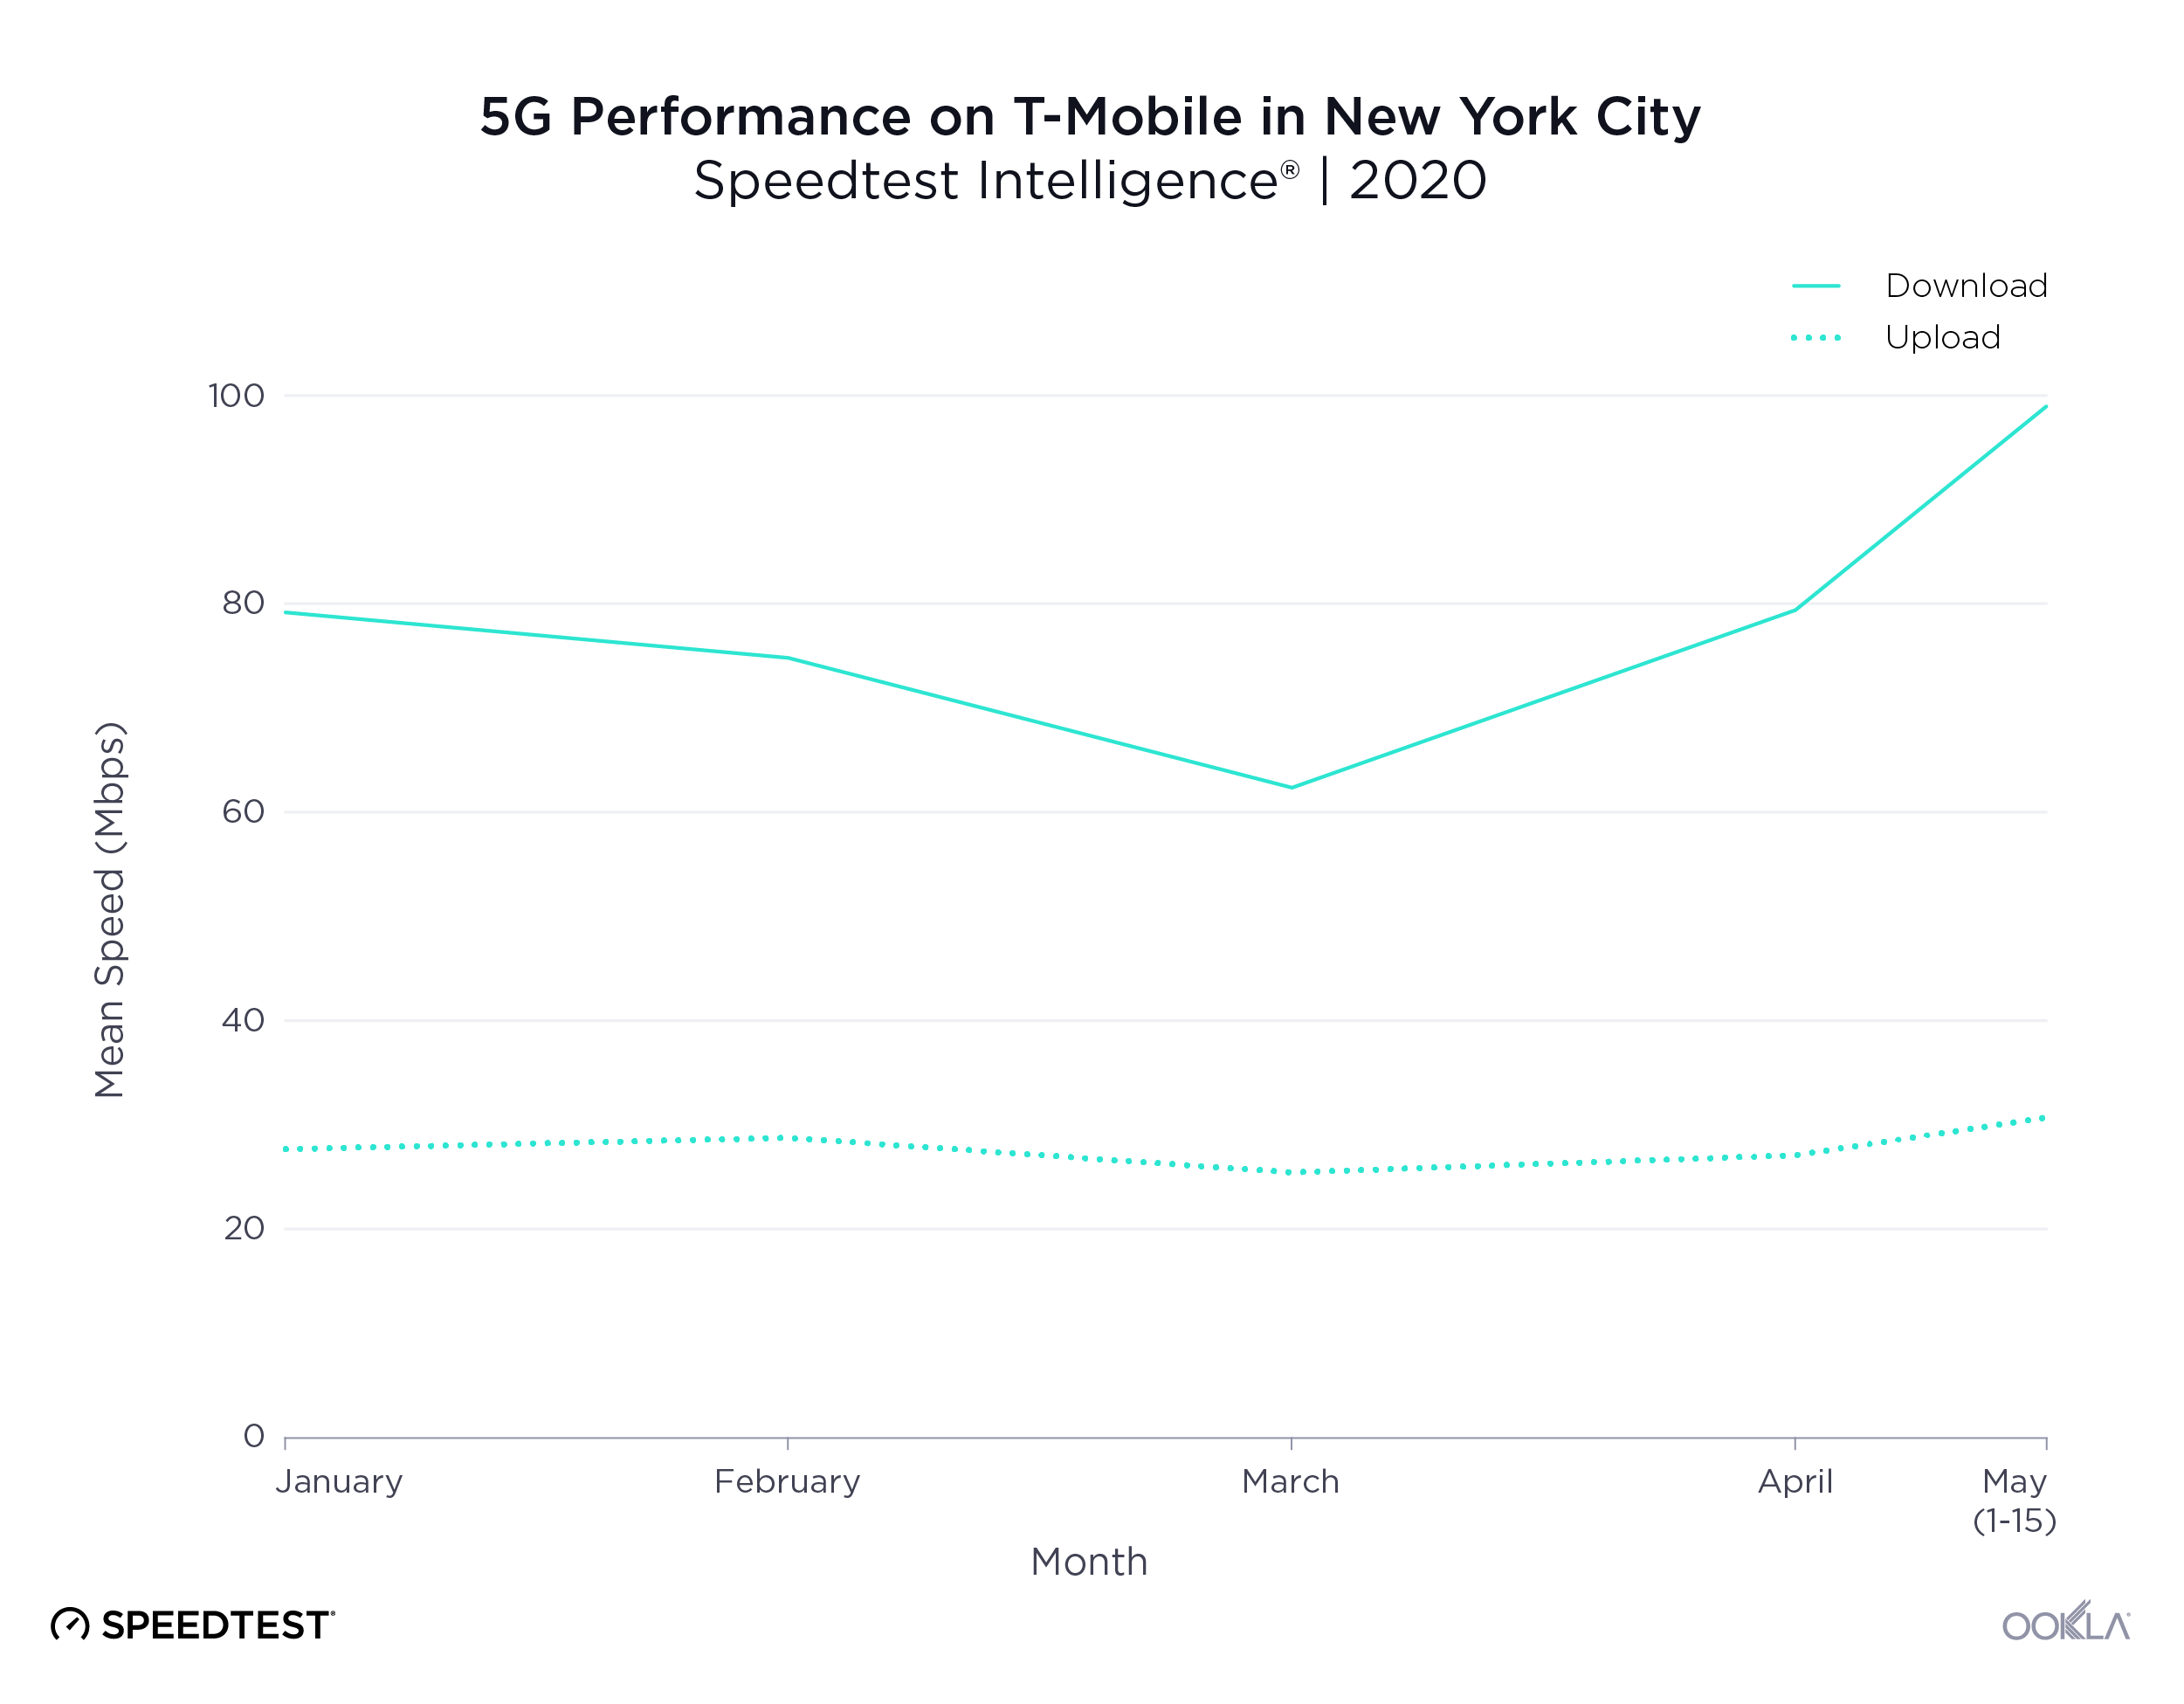
Mean download speeds of T-Mobile’s 5G network in New York City increased from 79.18 Mbps in January 2020 to 98.96 Mbps in May (as seen through the 15th of the month). This represents a 25.0% jump across all three 5G layers. Mean upload speeds have also improved 11.0% during the same period.
t-mobile_5G_performance_NYC_Philadelphia_0520-1

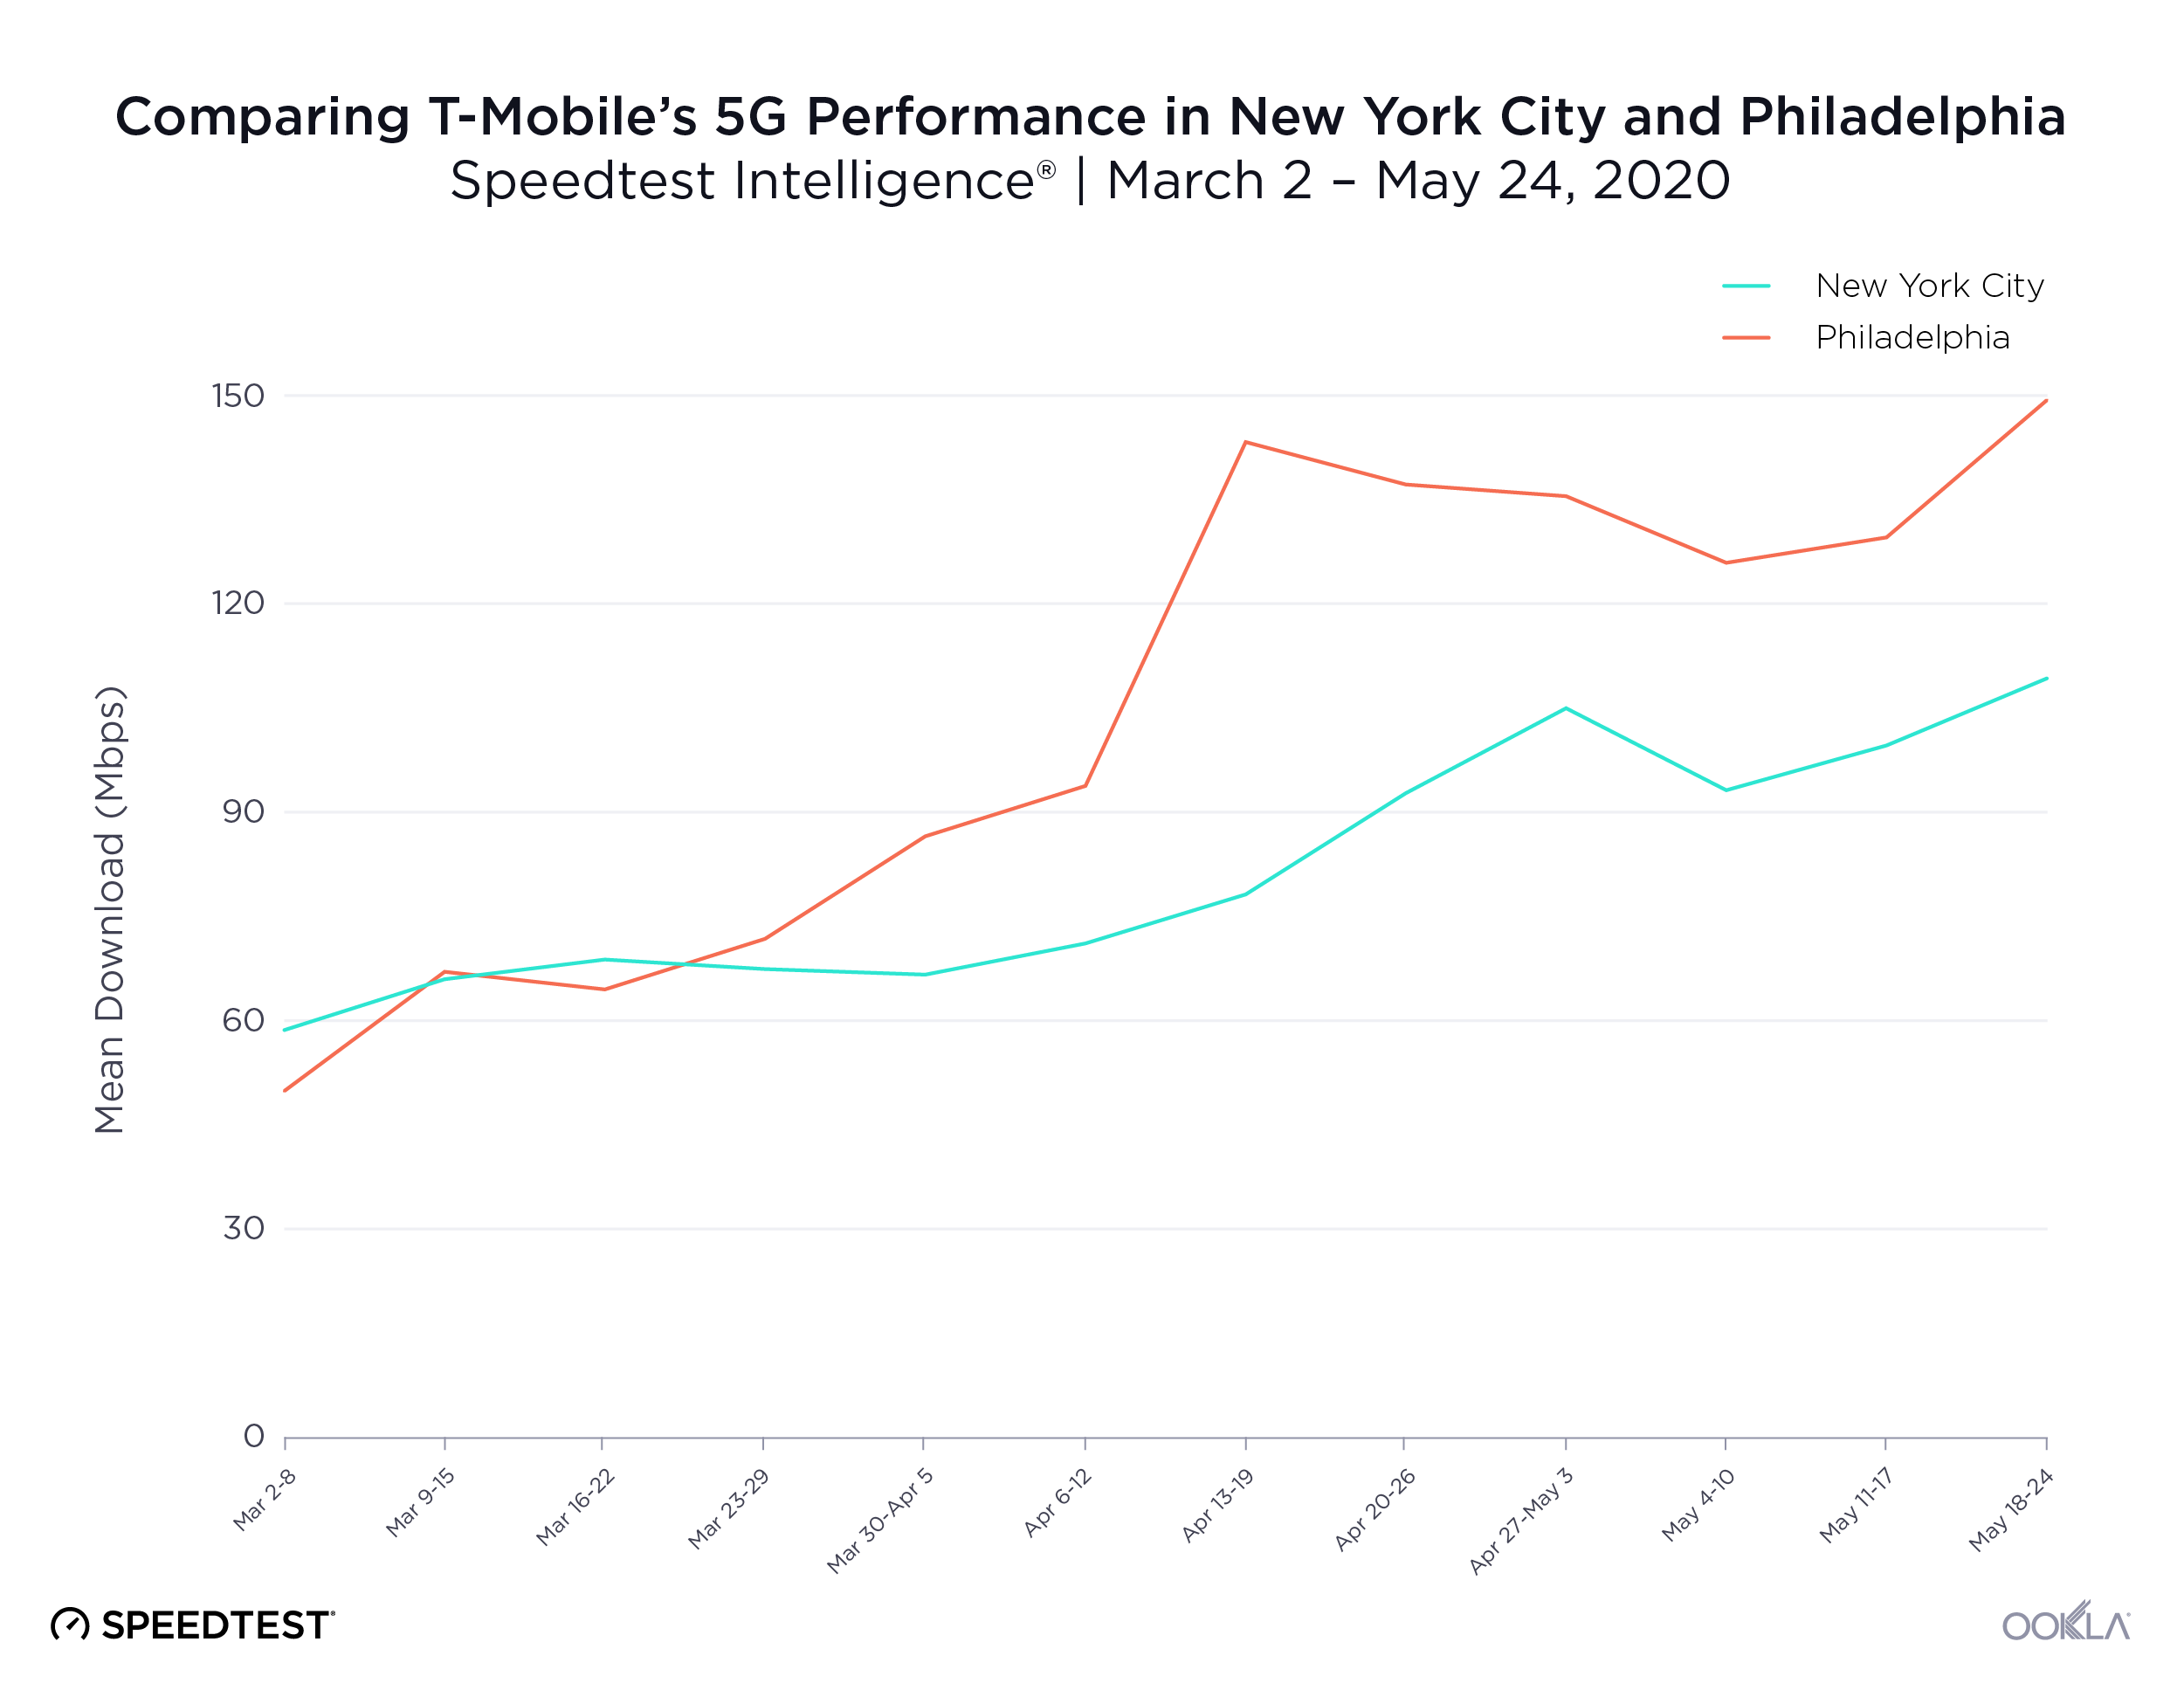
Analyzing week-over-week performance, Speedtest Intelligence® offers unique insights on the upward-trending download speeds on T-Mobile’s 5G across these two markets. A combination of additional 600 MHz spectrum explained in our previous article and the new 2.5 GHz 5G layer were likely the main drivers behind this improved performance.

Field testing the layers of 5G

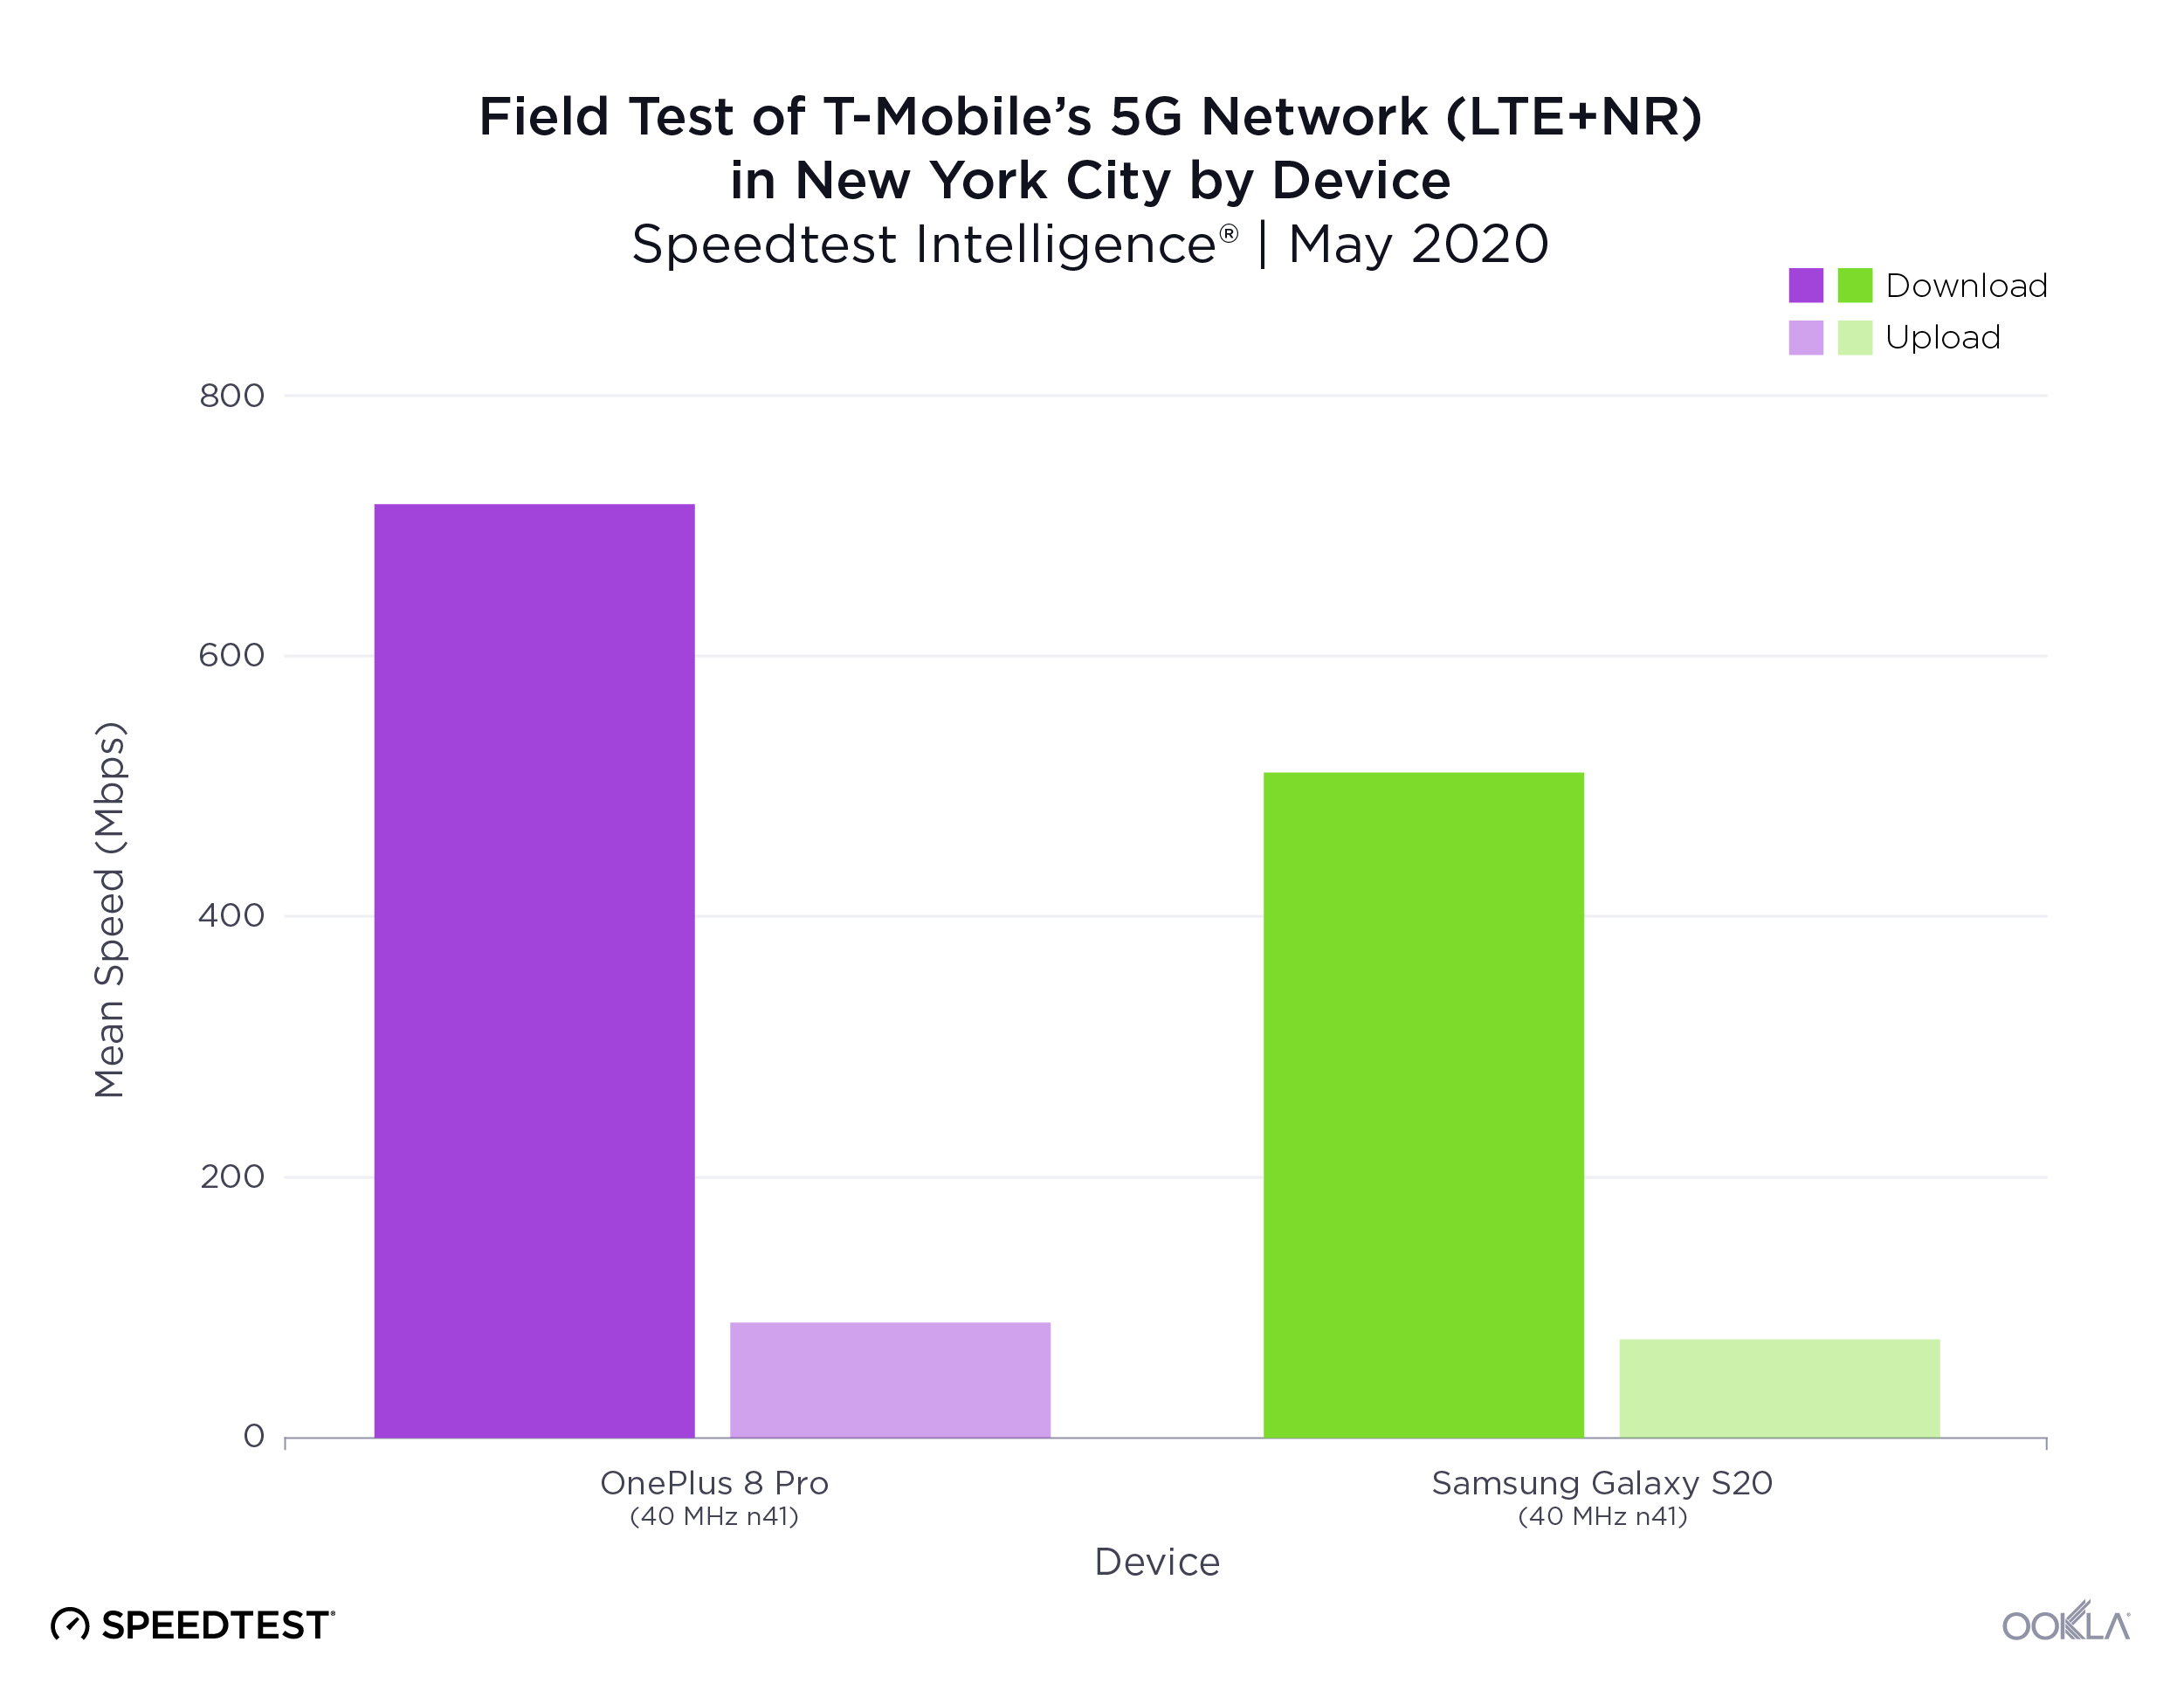
Users are typically not aware of the layers of technologies that they’re utilizing when they connect to a 5G network. To better understand the performance and capabilities of T-Mobile’s layer cake 5G network, I looked at the performance of each individual 5G layer separately. This process involved running over 300 tests on the ground in New York City between May 5 and 19 (while fully complying with the social distancing and health guidelines) and logging modem diagnostic messages. This allowed me to observe individual throughput contributions across three different 5G layers on two different devices, the Samsung Galaxy S20 Ultra 5G and the OnePlus 8 Pro. While both devices are powered by Qualcomm’s latest Snapdragon 865 5G Mobile Platform, only the Samsung Galaxy S20 Ultra 5G (and S20+ 5G) has the required mmWave hardware components to fully access the 5G spectrum layer cake. The open-market OnePlus 8 Pro could only access sub-6 GHz 5G.

According to T-Mobile’s published map of projected 2.5 GHz coverage, the newly launched mid-band 5G layer is mostly available in the eastern parts of Manhattan. That meant a quick ride to the areas east of Herald Square in Midtown as well as parts of East Village. Keep in mind that the walk tests were collected on a recently launched and lightly loaded mid-band 5G network. This report samples what this network is capable of and should not be considered predictive of future performance under normal use.

LAA boosts speeds

License Assisted Access (LAA) is LTE technology that leverages the unlicensed 5 GHz spectrum. While often overlooked, this technology has been deployed on T-Mobile sites in New York City since 2017, and adds ample downlink capacity (40-60MHz) using Ericsson’s micro Radio 2205, “assisted” by the anchor in the licensed LTE mid-band. This can significantly boost download speeds on capable devices, while at the same time offloading traffic from the licensed spectrum and improving the LTE experience for all users served by that cell.

In Manhattan, many low-build rooftop sites with Ericsson AIR 5121 mmWave radios originally received the LAA treatment and are excellent candidates to receive (or have already received) the 2.5 GHz 5G overlay. This means these NYC sites would gain 40-60 MHz of LAA downlink capacity in addition to the full three layer 5G deployed in the 600 MHz low-band, 2.5 GHz mid-band, the 28 GHz mmWave high-band spectrum and LTE. This would open up a variety of options in terms of network scheduling and capacity management.

What each NR layer contributes to download speeds

Based on personal field test data logged over the course of the last eight months, the observed peak download contribution of the NR physical layer (PHY) on Sprint’s (now decommissioned) 2.5 GHz 5G network using Nokia radio and 40 MHz bandwidth was 367 Mbps, achieved on Sprint’s 5G launch day in New York City, August 27, 2019.

T-Mobile’s new 2.5 GHz deployment — leveraging the same amount of spectrum, Ericsson AIR 6488 radio access, under similar network conditions — produced a peak downlink NR contribution in excess of 541 Mbps, an improvement in spectral efficiency of 47 percent. The downlink NR contribution measures the portion of the download speed arriving at the device only from the 5G layer, the remainder of the download speed comes from LTE.

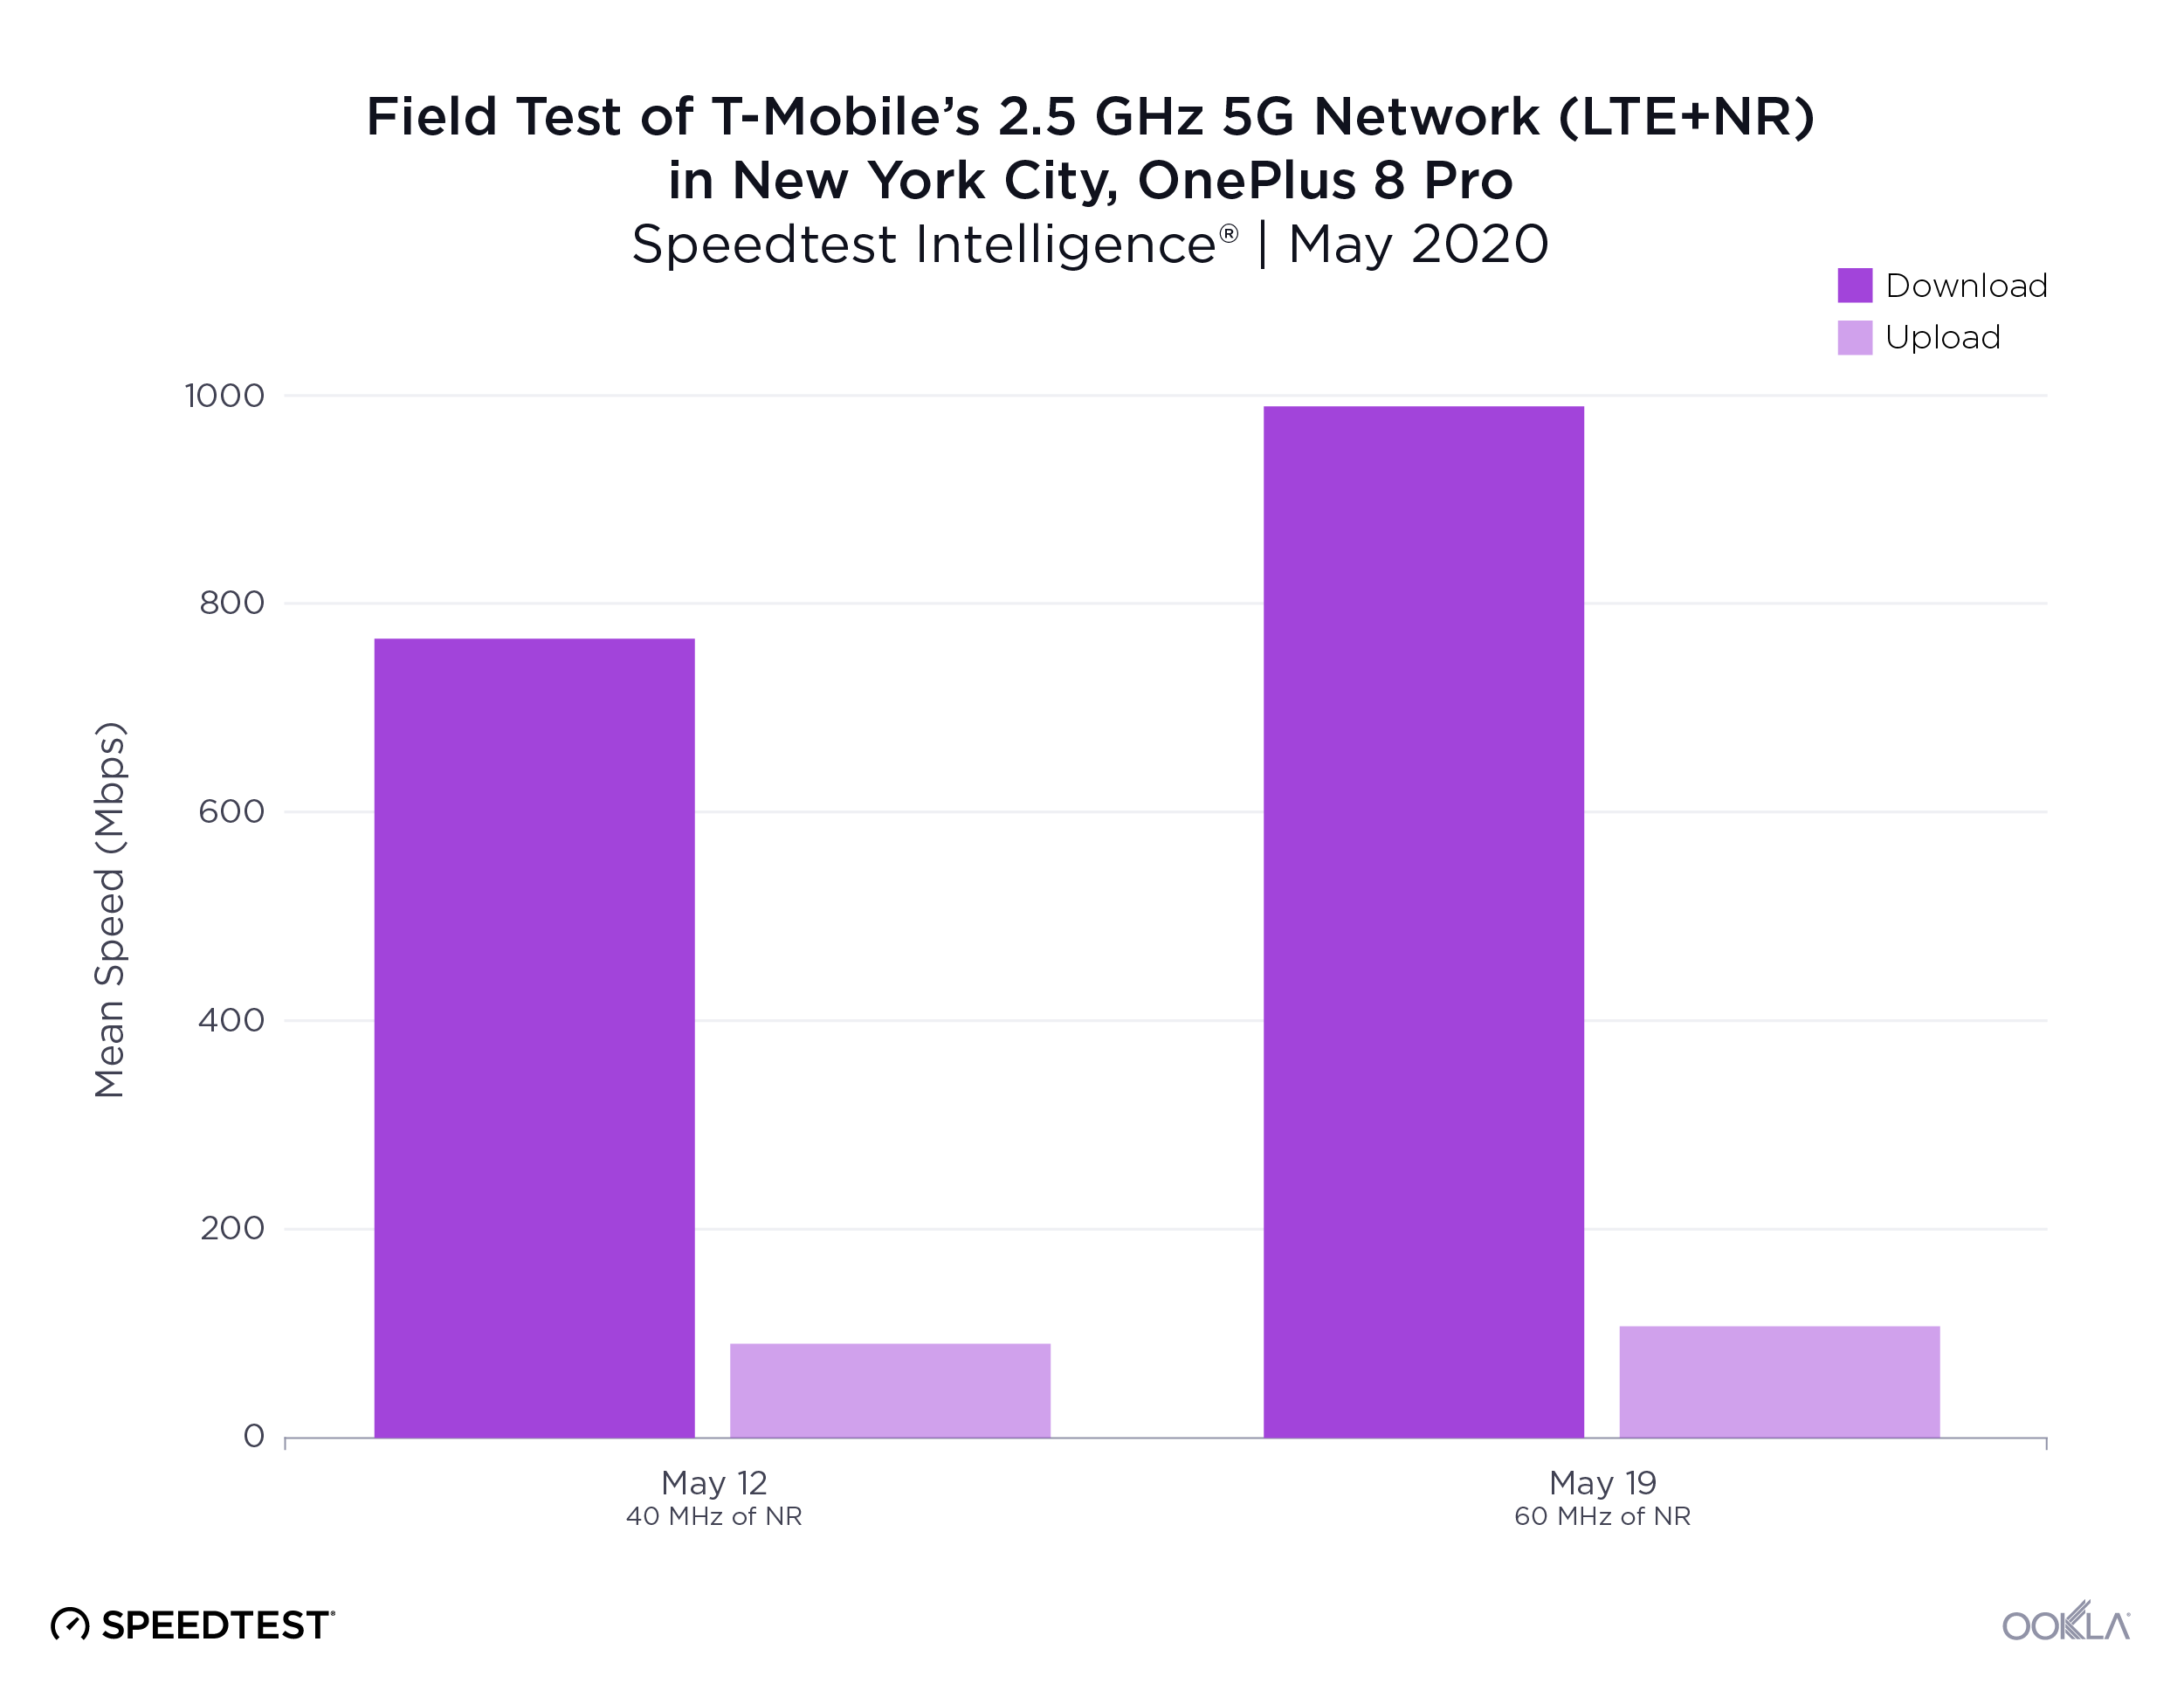
Furthermore, on May 19, the NR bandwidth on some sites was increased from 40 MHz to 60 MHz, and I’ve since observed a peak NR downlink contribution approaching 900 Mbps. The increased bandwidth was observed on three locations in the East Village, while the majority of 2.5 GHz sites are still at 40 MHz. We should stress again that these peak 5G speeds are meant to show the full potential of this new network deployment and have been achieved in good outdoor signal conditions, on a lightly loaded 5G network.

When taking into account the 3:1 TDD frame configuration (75% downlink 25% uplink), the effective peak downlink spectral efficiency of the 2.5 GHz NR layer looks like this:
peak-spectral-efficiency_0520-2

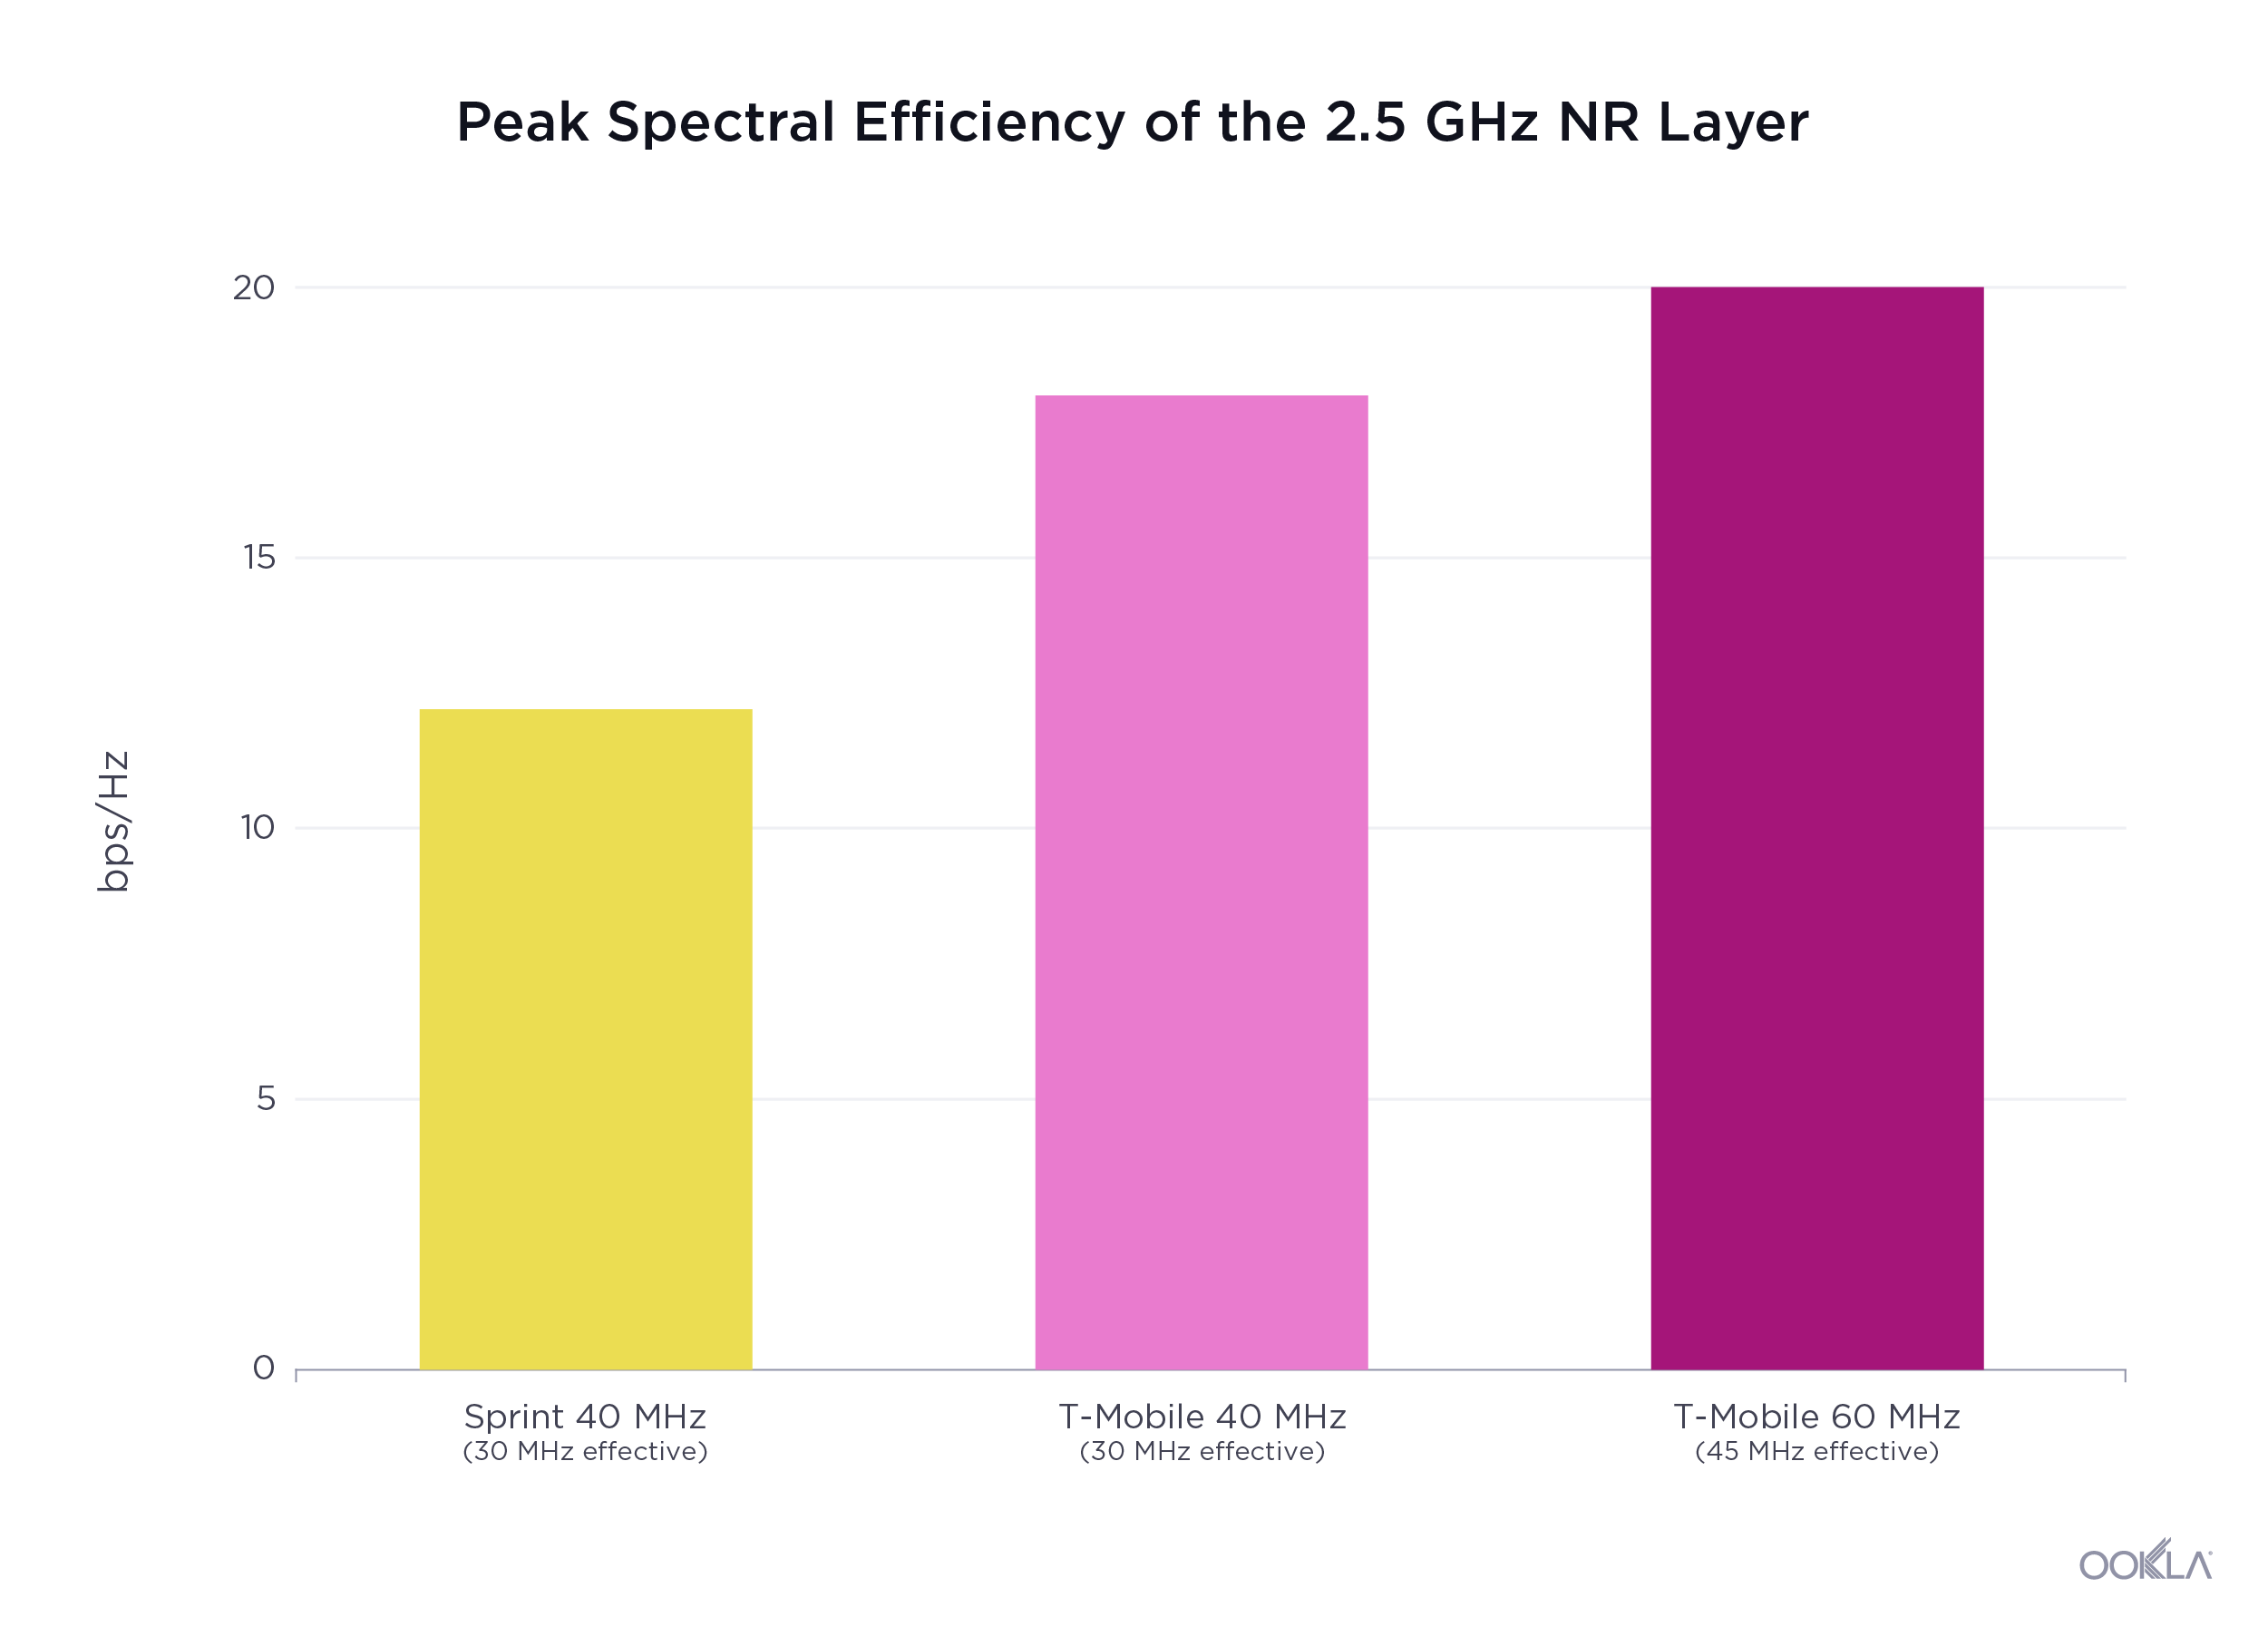
Lower spectral efficiency on Sprint’s legacy network could be attributed to the lower distribution of 256 QAM and MIMO (Rank 3, 4). Granted, there could have been a potential performance penalty associated with an earlier software load on Nokia’s massive MIMO radios running in split-mode. These radios were logically partitioned for both n41 and LTE B41 concurrent operation, while pushing carrier aggregation across three LTE CCs and using 100-120MHz of spectrum in total. In contrast, T-Mobile’s existing deployment consists of Ericsson AIR 6488 radios delivering only n41, while LTE mid-band anchor bands are delivered from separate radios (B2, B66).

40 MHz of n41 delivered NR upload speeds of 33 Mbps on T-Mobile vs. 23 Mbps on Sprint, a 43.5% increase. Tests from May 19 using 60 MHz wide NR channel produced consistent speeds of 50 Mbps arriving from the NR layer.

peak-upload-contributions_0520-2

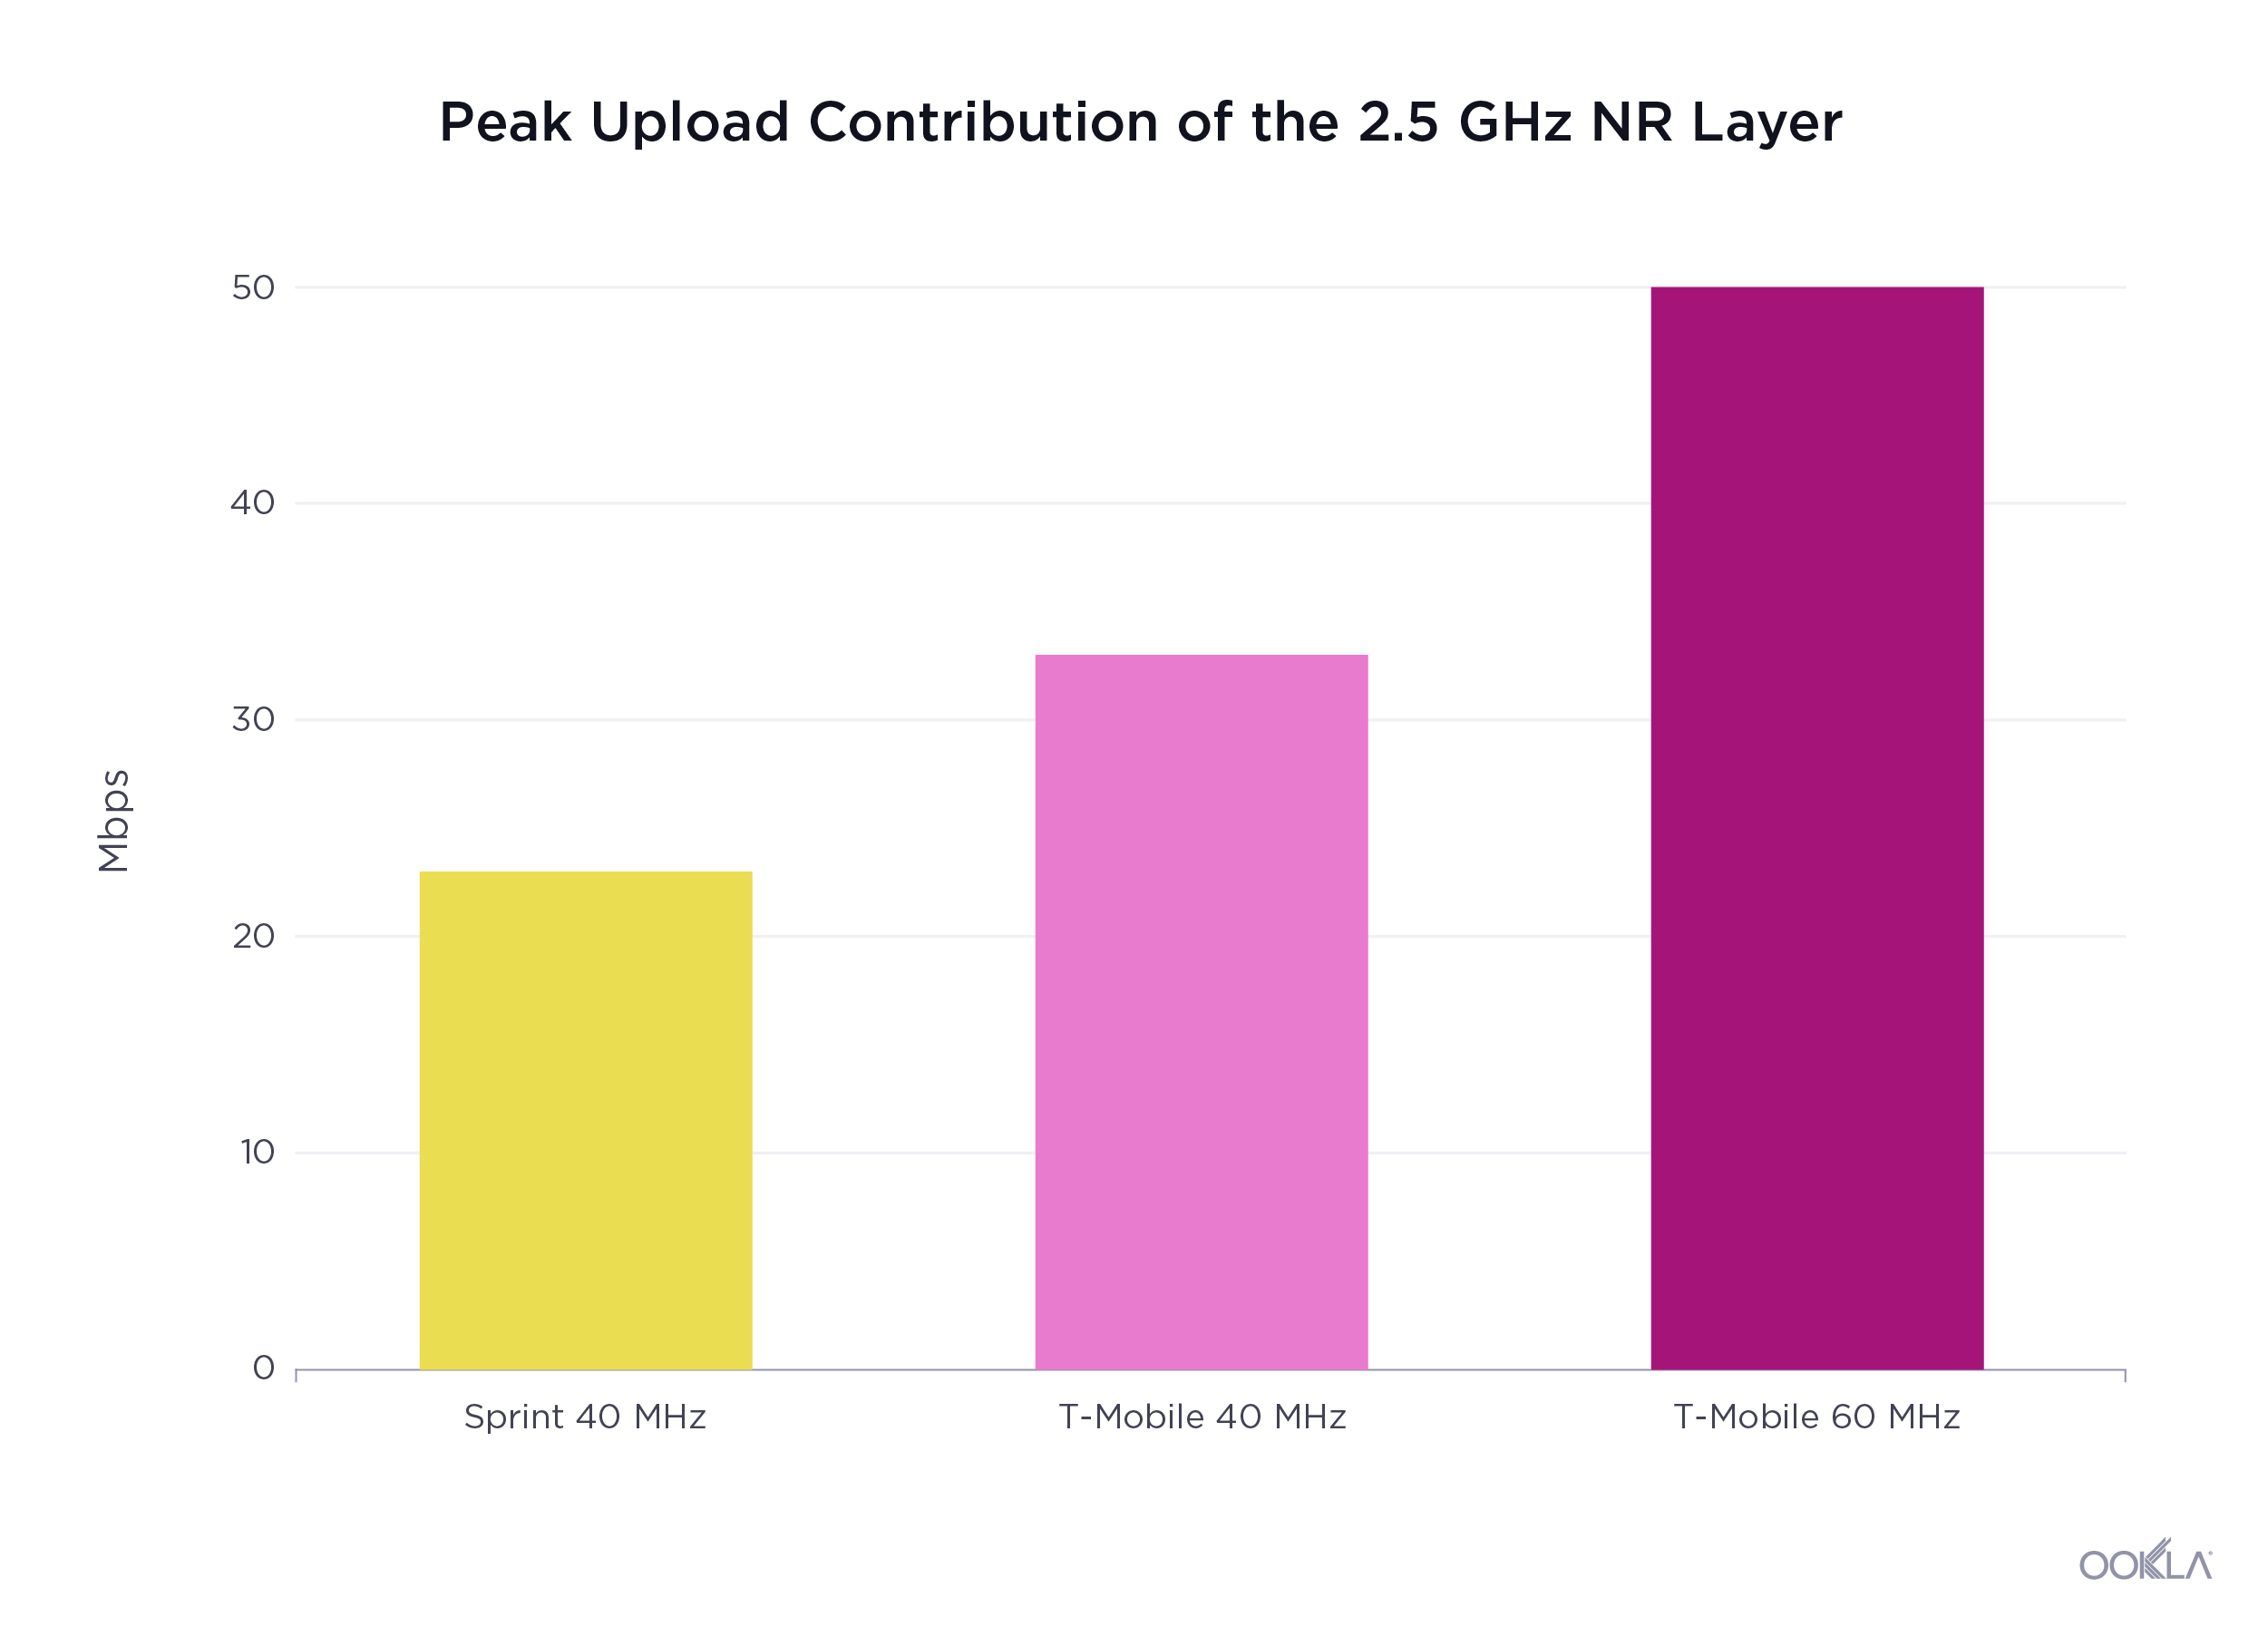
The benefits for both users and the operator are apparent as the aggregate (LTE B66 + NR n41) upload speeds achieved on capable user devices now well exceed 100 Mbps.

In addition to the new mid-band 5G (n41), T-Mobile’s low-band 5G (n71), which launched in early December, is providing the foundational layer for the future SA (Standalone) NR. The initial 5 MHz FDD deployment was, from my first-hand experience, capable of boosting the downlink performance at the capable user terminals with an additional 42 Mbps. As of the middle of March, that allocation was increased to 10 MHz, now delivering peak n71 speeds of roughly 100 Mbps. With wider NR channels comes an improved spectral efficiency.

Millimeter wave adds capacity

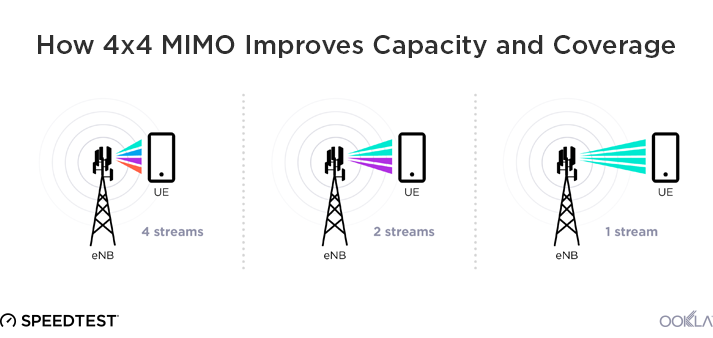
T-Mobile’s millimeter wave (mmWave) NR layer (n261) has been available in New York City since June 2019. Leveraging the existing macro grid, T-Mobile’s Manhattan mmWave overlay, in terms of cell site density, is one of the most impressive in the world. This layer leverages 100 MHz of spectrum (2×50 MHz) in the 28 GHz band (n261), adding peak n261 speeds of over 520 Mbps in addition to the LTE anchor bands. In comparison, T-Mobile’s mid-band 2.5 GHz NR layer is able to deliver similar capacity out of just 40 MHz of spectrum. This jump in spectral efficiency is attributed to the use of up to four data streams and 256 QAM modulation in the mid-band, something the current generation of mmWave chipsets can’t do.

During my testing, the Samsung Galaxy S20 Ultra 5G was able to switch between all three NR spectrum bands seamlessly and deliver consistent performance at hundreds of megabits per second. While 100 MHz of mmWave can deliver a speed boost of a few hundred megabits per second, the full potential of this spectrum can be unlocked by deploying much wider 400 MHz or 800 MHz blocks of mmWave spectrum, which can produce speeds of multiple gigabits per second, just on that layer alone. T-Mobile now controls 1,160 MHz of mmWave spectrum nationwide, including significant amounts of not-yet-deployed 24 GHz and 47 GHz licenses won in recent auctions.

Device limitations (and opportunities)

T-Mobile’s 5G network uses a mechanism called the EUTRA-NR Dual Connectivity (EN-DC) split bearer, which allows for combining of data traffic from LTE (master node) and 5G (secondary node) both on the downlink (sub-6 and mmWave) as well as on the uplink (sub-6). This improves user experience by enabling utilization of the maximum amount of data streams across two technologies supported by capable 5G devices. Both devices are capable of aggregating two mid-band LTE anchor bands (B2, B66) with sub-6 NR, but only the Samsung Galaxy S20 Ultra 5G has the ability to leverage up to four spatial streams on the two mid-band LTE bands and NR (n41) at the same time. The OnePlus 8 Pro supports EN-DC combinations with two streams per the mid-band LTE anchors paired with four streams on n41. This is likely related to the RF Front End design limitation on the OnePlus device.
field-test-t-mobile_5G_device_nyc_0520-1

In my field tests, both devices delivered excellent speeds, leveraging 40 MHz of 2.5 GHz 5G (n41) with two LTE mid-band component carriers (CC) on the downlink, while the OnePlus 8 Pro had an additional help coming from the LAA CCs. On the uplink, devices utilized dual connectivity combining one LTE CC with NR. The latency was also similar between devices, although I did observe latency as low as 7 ms.

What’s missing from the Galaxy S20 Ultra 5G — and what the OnePlus 8 Pro fully capitalizes on — is the ability to aggregate mid-band LTE with LAA and mid-band NR. As we’ve described, the existing Manhattan LAA cell sites in some areas conveniently located on every two to three city block corners are the obvious candidates for the 5G mid/high-band overlay, which is exactly what I observed on the streets of the East Village. The combination of 60 MHz of LAA, 30 MHz of mid-band LTE (B66+B2) and 60 MHz NR produced an outstanding user experience, delivering mean download speeds of 989 Mbps and mean upload speeds of 107 Mbps. During May 19 testing, I recorded peak speeds in excess of 1.2 Gbps with the NR contribution of 900 Mbps. This particular test utilized only a single LTE CC (B66), three LAA CCs and 60 MHz of NR.

field-test_Oneplus-8-pro-performance_0520-1

Considering that Samsung’s Galaxy S20 lineup uses state-of-the-art RF Front End components and is built to provide uncompromised user experience, we really hope to see LAA EN-DC support added via the future software updates for both sub-6 and mmWave, which would unlock the device’s full potential. The business case for operators is very appealing: the ability to free up the licensed LTE spectrum in densely populated areas while at the same time providing a significant boost in user experience, as shown in this report. It’s also worth noting that the branded Samsung Galaxy S20 lineup does support the use of higher order MIMO on both LTE mid-band and n41 concurrently, which could prove to be an advantage over the OnePlus device outside of the dense urban areas where LAA isn’t available.

How unique device features boost performance

While most smartphones today can’t aggregate multiple low-band component carriers across multiple low-band frequencies, T-Mobile’s branded devices powered by Qualcomm’s Snapdragon X55 5G Modem-RF System are capable of aggregating multiple low-band channels within the same frequency band (600 MHz). In other words, these smartphones (including the Samsung Galaxy S20 Ultra 5G, and the OnePlus 8 Pro) are able to leverage all of the deployed downlink 600 MHz capacity by way of EN-DC, which allows for concurrent use of LTE band 71 and n71, in addition to the use of mid-band LTE anchors (Band 2 and Band 66). These devices also support uplink carrier aggregation of the LTE anchor band and sub-6 NR.

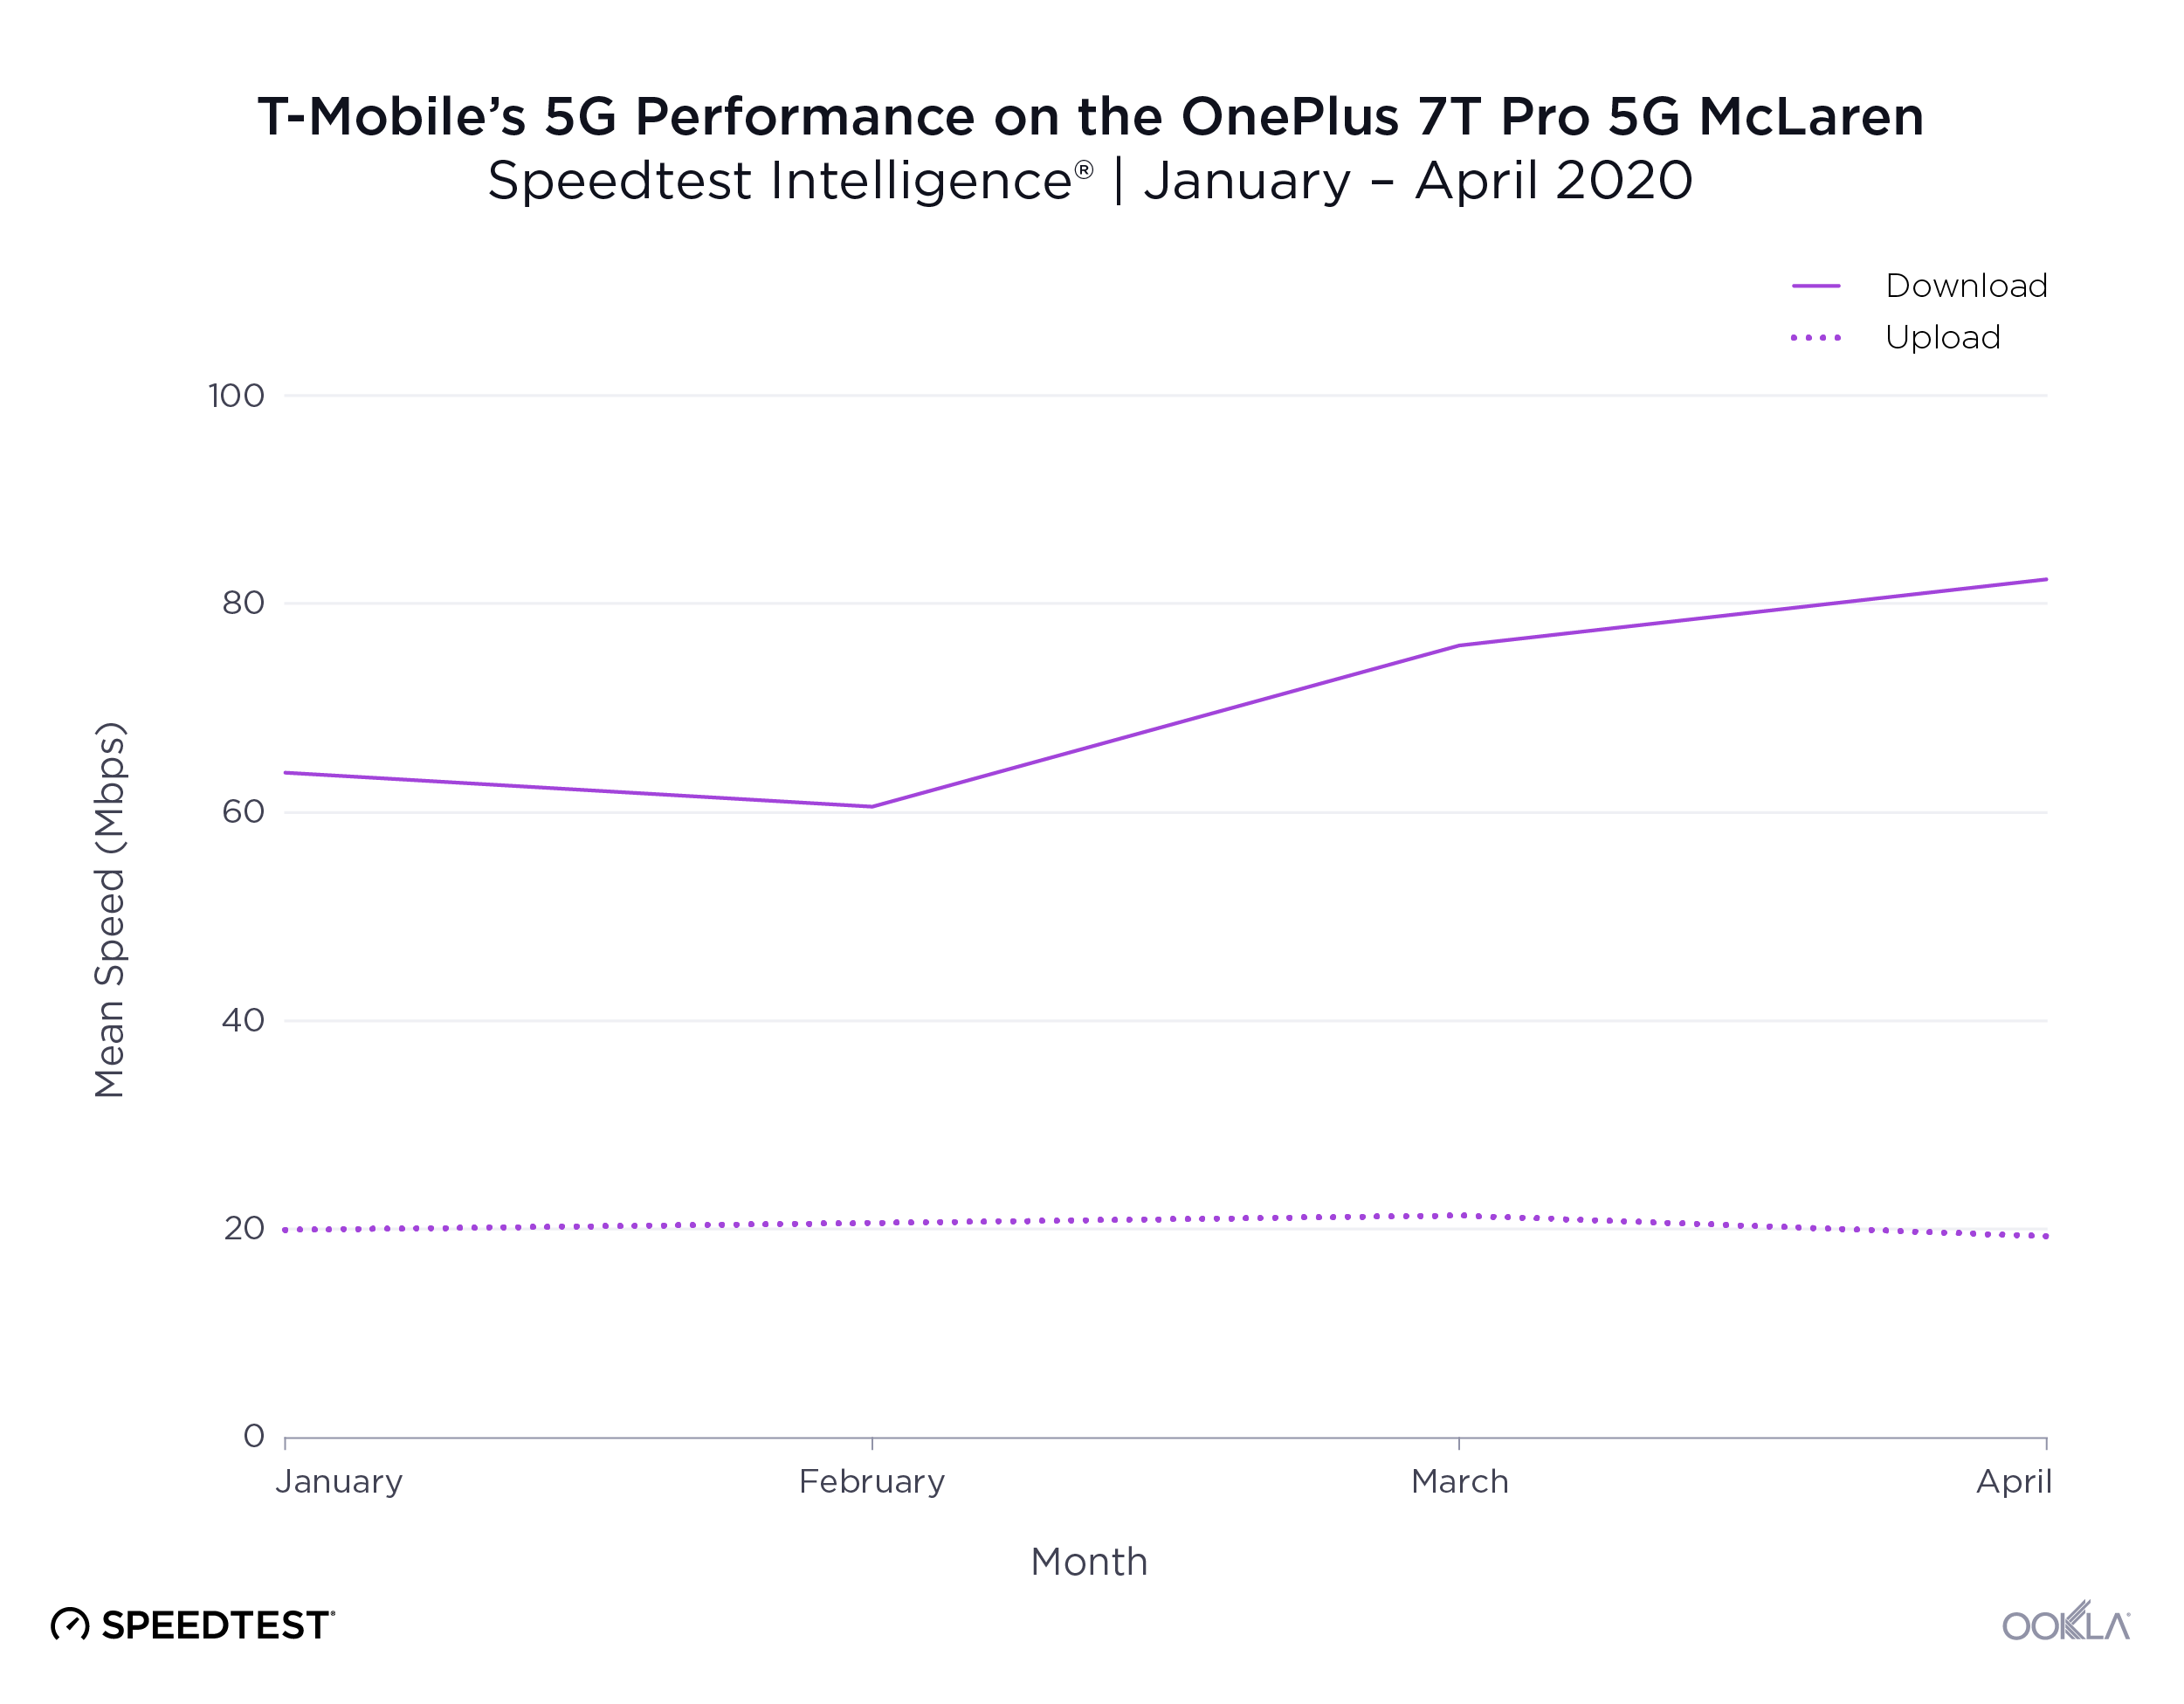
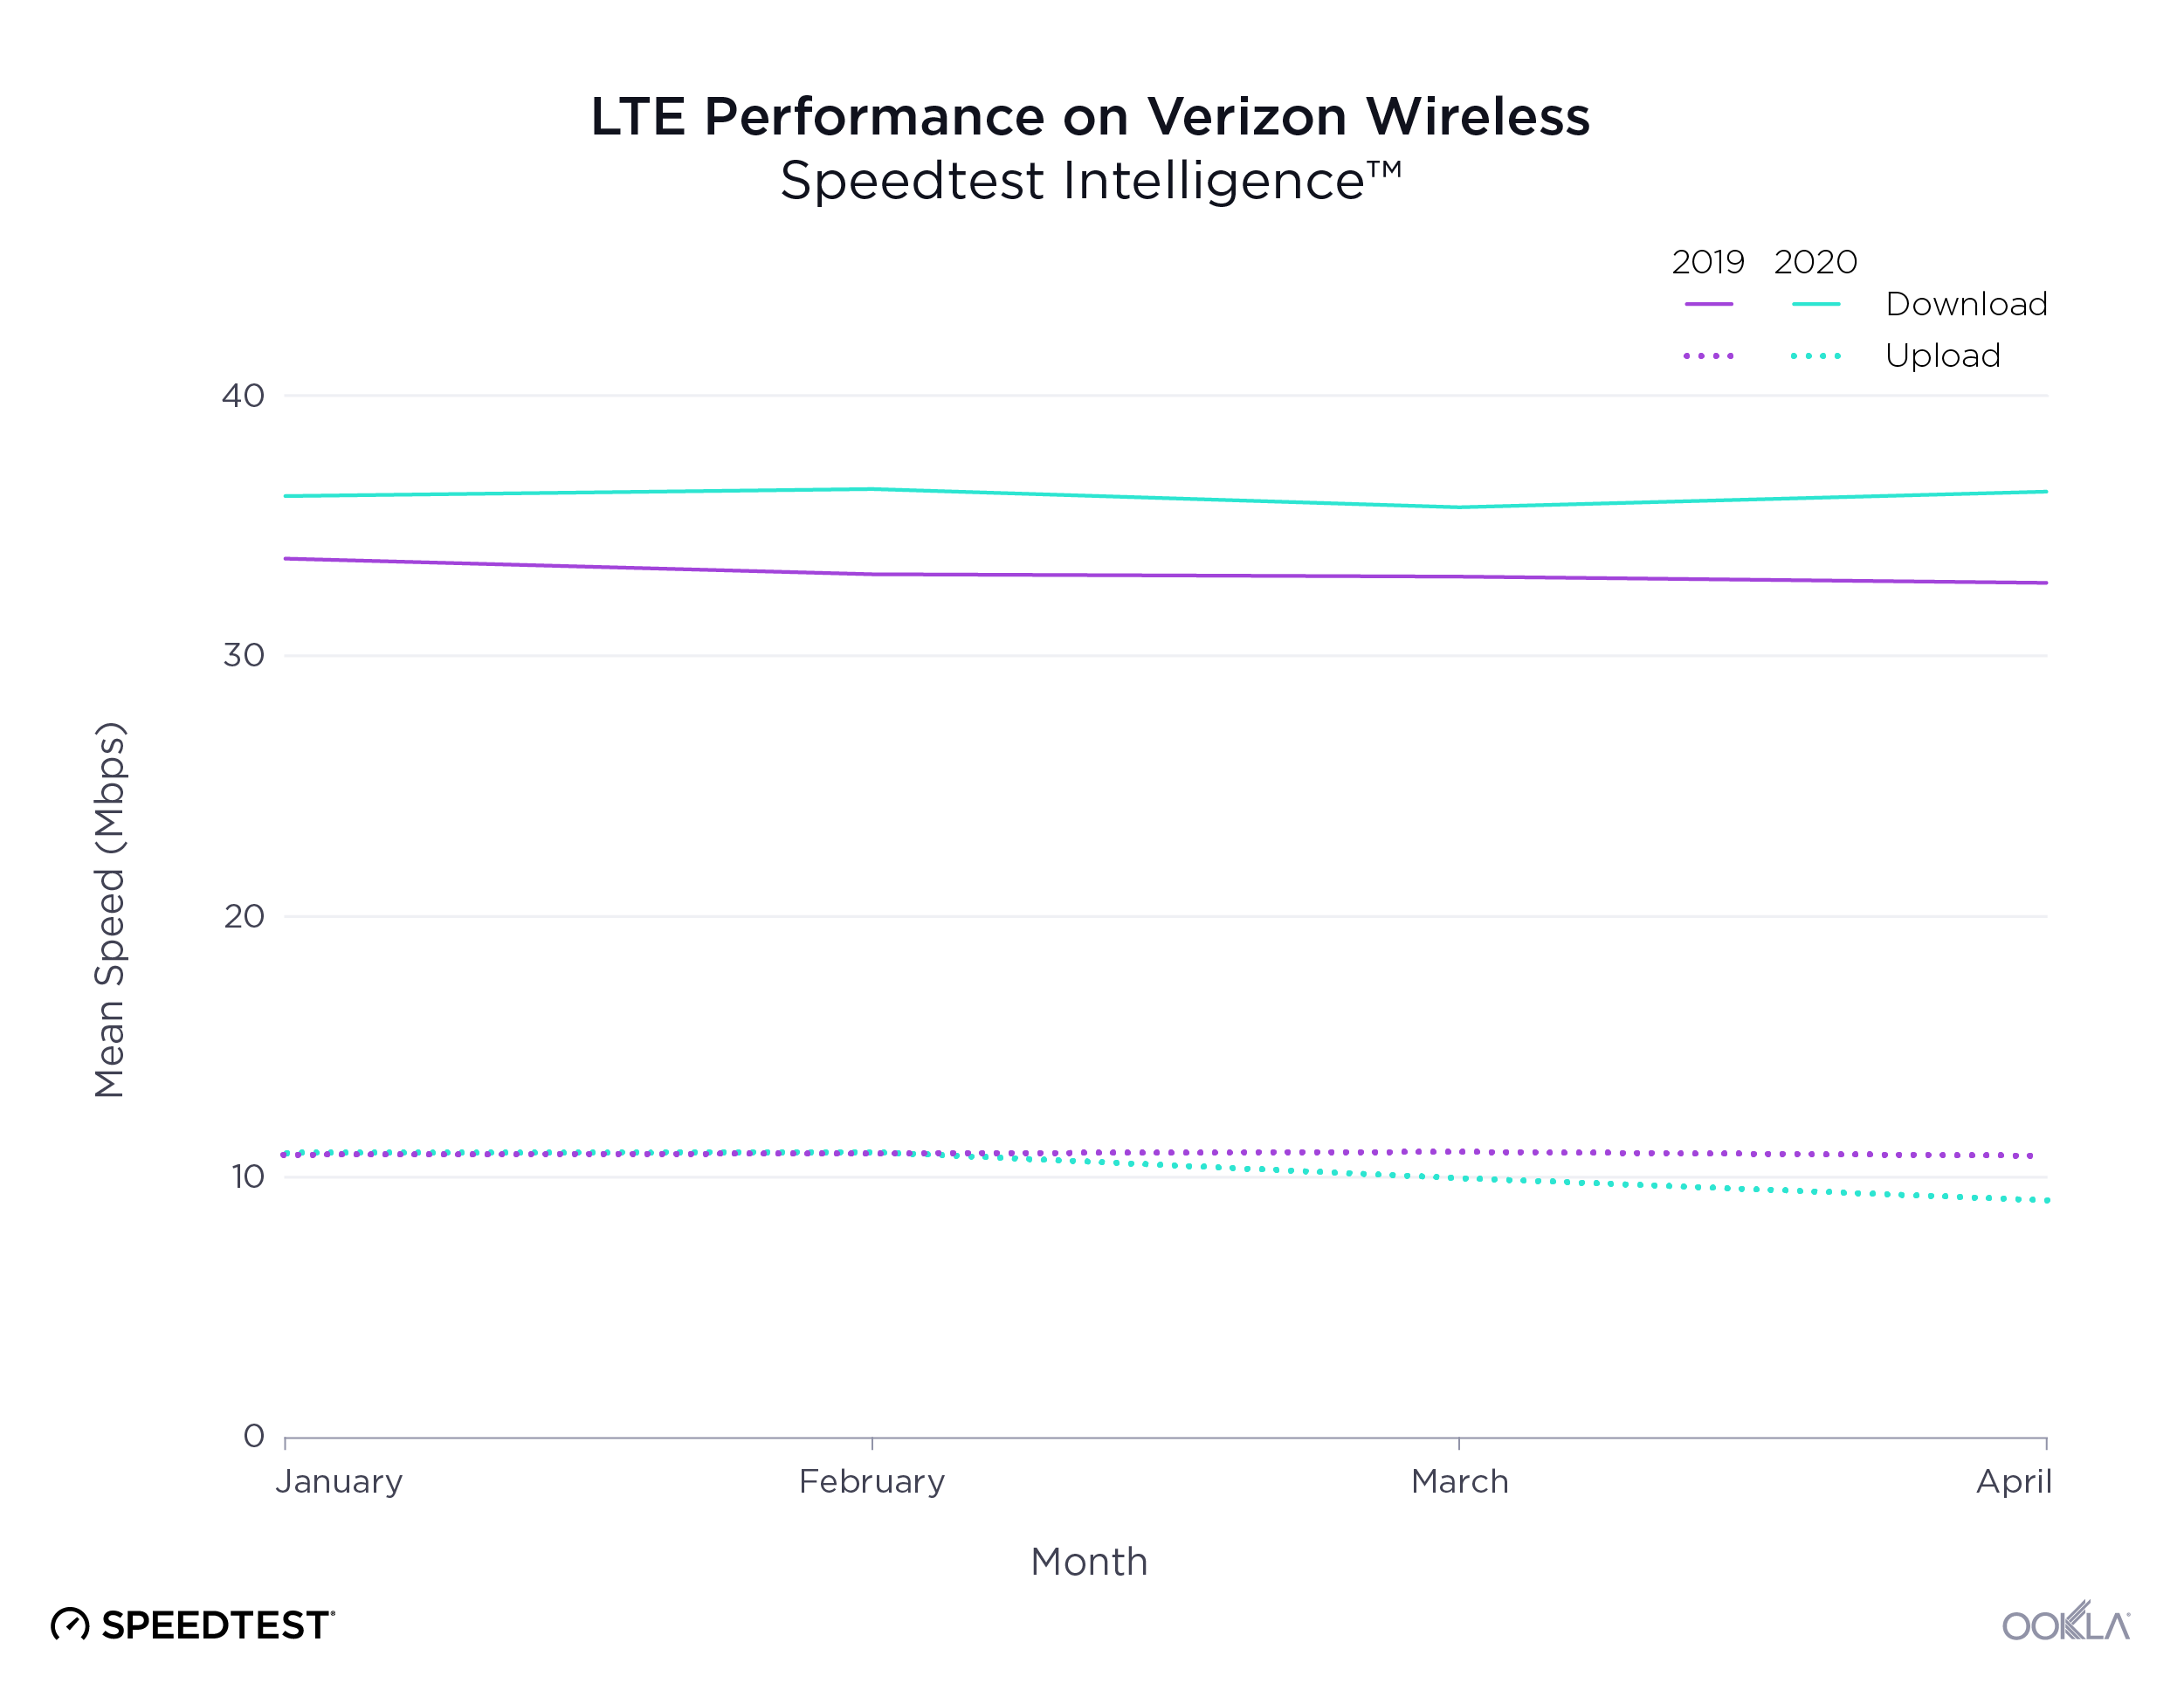
Because the OnePlus 7T Pro 5G McLaren Edition was the first device to receive this feature, we analyzed its performance in the U.S. as a whole during the first four months of 2020. The software update on February 13 resulted in an improvement of over 30% in mean download speeds from those seen in January 2020. The concurrent use of multiple 600 MHz channels produced mean download speeds of 82.35 Mbps and a latency of 32 ms in April.
t-mobile_5G_performance_oneplus_0520

What the future holds

In markets like New York City, Sprint’s legacy 2.5 GHz LTE network (for the most part) operates on a 60 MHz contiguous chunk of spectrum (3CC LTE carrier aggregation) adjacent to T-Mobile’s 40 MHz (in some parts 60 MHz) NR. In addition to this 100 MHz contiguous spectrum block, Sprint uses a separate 20 MHz slice for its small cells applications, for a total of 80 MHz of deployed 2.5 GHz LTE capacity. Repurposing 20 MHz (or more) of LTE channels and widening the 2.5 GHz NR capacity could easily provide a quick incremental capacity gain for T-Mobile, as already seen on some sites in Manhattan.

Furthermore, the existing Nokia 64T64R massive MIMO radios used on Sprint’s sites still operate in split-mode (32T32R for LTE, 32T32R for NR), but the NR logical partition is not in use. These could have the NR portion of antenna elements remapped for 64T64R LTE which should, in theory, further enhance the LTE coverage through the use of beamforming and deliver an improved LTE sector capacity for users with legacy Sprint LTE B41 devices. When we consider that over 80% of Sprint’s postpaid subscribers own smartphones capable of accessing the T-Mobile network, and 10 million unique Sprint subscribers already utilize T-Mobile’s LTE network on a weekly basis, the accelerated refarm of the 2.5 GHz spectrum makes even more sense.

While T-Mobile could easily add LTE B41 capability to its n41 sites, most (if not all) T-Mobile branded devices aren’t currently capable of aggregating LTE B41 channels with all of T-Mobile’s existing LTE spectrum bands. Therefore, adding LTE B41 wouldn’t provide any immediate capacity gain to T-Mobile’s user base. To achieve that capacity gain, Class II Permissive Change would have to be filed with the FCC for the entire portfolio of T-Mobile’s branded devices and then T-Mobile would have to perform a large-scale software update push, which could be a massive undertaking, and frankly isn’t necessary.

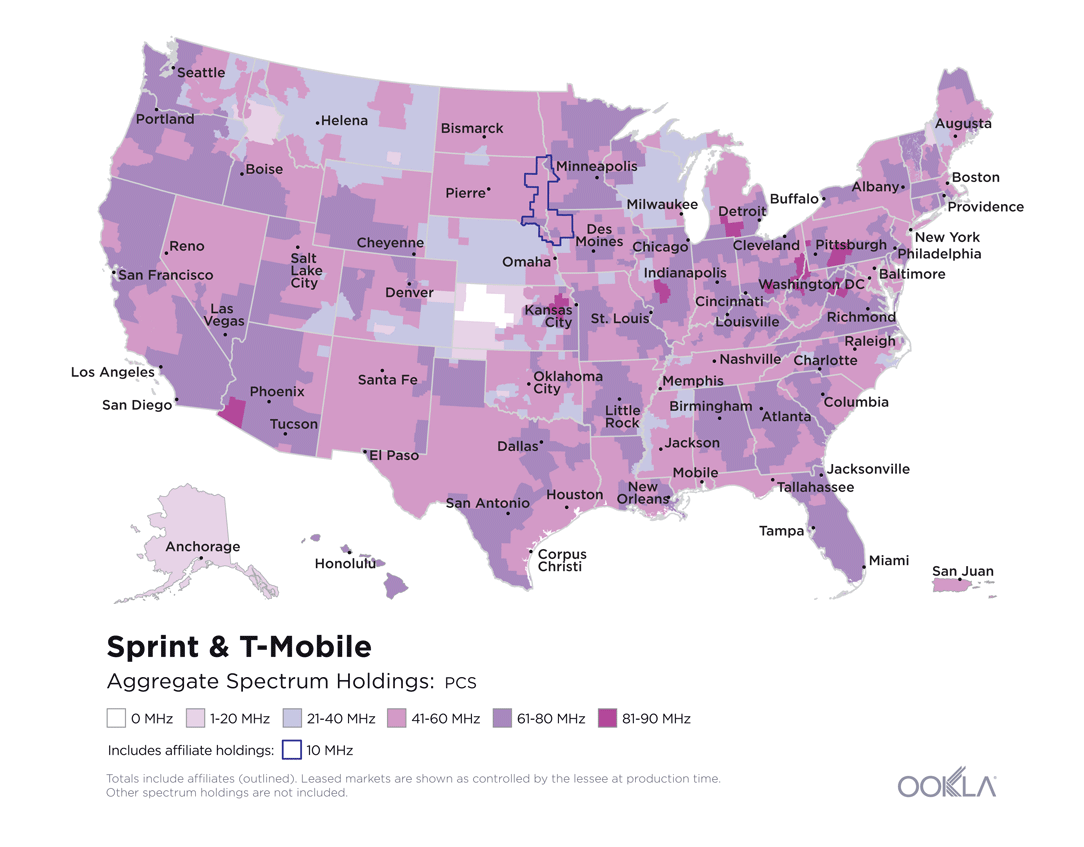
As we described back in August integrating a portion of Sprint’s PCS spectrum onto T-Mobile’s network and widening the existing PCS channels to 15 or 20 MHz could further improve user experience and overall network efficiency for the combined network. This could be highly beneficial in markets with a high uptake of Sprint customers where Sprint’s PCS spectrum holdings sit adjacent to T-Mobile’s. Alternatively, PCS spectrum swap with other operators could produce similar results.

Top-Largest-Markets_TMobile-Sprint-03

Over the past few years, Sprint has done a lot of work to densify its network using small cells and distributed antenna systems (DAS). These nodes provide added coverage and capacity, but often operate on their own separate 2.5 GHz frequency block, different from the blocks used on Sprint’s macro sites. Repurposing Sprint’s network of small cells and outdoor DAS (oDAS) and retrofitting for T-Mobile’s LTE/NR at some point in the future could provide additional capacity in urban and suburban areas.

Standalone 5G should improve performance and coverage

Finally, the launch of the Standalone (SA) 5G slated for later this year will offer many core benefits, such as reduced latency, improved speeds and network slicing, to name a few. With the introduction of VoNR (Voice over NR), SA 5G should provide an improved 5G coverage, especially for customers in rural America, as the need for mid-band LTE anchors would be removed.

The existing portfolio of branded devices powered by the 2nd generation Qualcomm Snapdragon X55 5G Modem-RF System has the support for Standalone 5G, but will require a software update. Recent announcements of SA 5G lab and field testing using a commercial OnePlus 8 device indicate that T-Mobile is inching closer to commercializing this service. The upcoming 3rd generation Qualcomm Snapdragon X60 Modem-RF System will fully set the stage for standalone 5G deployments around the world by enabling mmWave-sub6 aggregation, as well as sub-6 carrier aggregation across FDD and TDD bands. This means that the upcoming portfolio of T-Mobile’s 5G devices will be able to combine n71 with n41, n261 with n41, and so on. The Dynamic Spectrum Sharing (DSS) feature, which enables coexistence of LTE and 5G in the same frequency channel at the same time, will likely find its purpose in T-Mobile’s toolbox by enabling the use of n2 and n66 frequency bands.

Two weeks of testing T-Mobile’s 5G in New York City delivered an impressive user experience, and it was just an early taste of a 5G layer cake that could continue to improve. Low-band 5G provides the foundational layer of the cake, the mid-band filling is already thickening and the mmWave at the moment is the cherry on top, with the potential to become a much bigger layer. We’re excited to see how other operators can learn from this approach and improve 5G performance across the globe.

Ookla retains ownership of this article including all of the intellectual property rights, data, content graphs and analysis. This article may not be quoted, reproduced, distributed or published for any commercial purpose without prior consent. Members of the press and others using the findings in this article for non-commercial purposes are welcome to publicly share and link to report information with attribution to Ookla.

| January 22, 2020

What Went Down? The Most Significant Online Service Outages in Q4 2019

“Unable to connect” — three words that bring people together in frustration and annoyance around the world. In the last three months of 2019, outages affected users across the globe as they tried to access all kinds of different industries, from gaming to streaming services. Downdetector® data from Q4 2019 provides unique insight into outages including the dates, duration and location and number of reports submitted by users. We’ve divided the outages into five categories: Gaming, Mobile Operators, Social Media Sites, Streaming Services and Financial Institutions.

Gaming

Discord (December 7, 2019): 15,976 outage reports at peak

The largest gaming outage we saw during Q4 2019, Discord, was apparently “due to an issue with Google compute platform.” Starting on December 7, 2019, outage reports were still trickling into Downdetector on December 8. The highest volume of reports happened over 5.5 hours and with a peak of 15,976 reports in the United States.

Downdetector_Outage_Discord

Fortnite (October 13, 2019): 11,326 outage reports at peak

“The End”, an event where Fortnite was preparing for a big release, coincided with the largest Fortnite outage we saw during Q4 2019. On October 13, 2019, Fortnite users flooded to Downdetector to report an outage that started around 10:30 a.m. PST and lasted for six and a half hours. At the peak of the outage there were 11,326 reports, predominantly from users in the United States.

Mobile Operators

Vodafone Germany (October 23, 2019): 21,065 outage reports at peak

The multinational mobile service provider was down for about four hours for thousands of users on October 23, 2019. At the peak of the outage, 21,065 users, primarily in Germany, reported having problems with their service.

Downdetector_Outage_Vodafone-DE

Social Media Sites

Facebook (November 28, 2019): 12,726 outage reports at peak

Instagram (November 28, 2019): 21,682 outage reports at peak

The Facebook family of social media sites outage on November 28, 2019 was one of many social outages in Q4 2019. The outage lasted about five hours and affected users in the U.S., Germany, Italy and Spain. A combined 34,408 Facebook and Instagram users reported outages at the peak of the outage. Facebook’s Messenger app experienced a smaller outage on November 18, 2019 with 8,952 users reporting outages at the peak.

Downdetector_Outage_Facebook_Instagram

Snapchat (October 14, 2019): 18,252 outage reports at peak

This popular multimedia messaging app was down for five and a half hours on October 14, 2019, leaving users unable to chat, send or receive photos from their friends. At the peak of the outage, 18,252 users from the U.S. reported problems. The outage was so significant, the hashtag #SnapchatDown was trending on Twitter at the time of the outage.

Twitter (October 22, 2019): 15,952 outage reports at peak

Where do Twitter users go to complain when Twitter is down? Our data shows Twitter users in the east coast of the U.S. rushed to Downdetector to report problems with the social media platform on October 22, 2019. Even though the outage lasted only about a half an hour, 15,952 users reported that they were unable to tweet, retweet, like tweets or access their account at the peak of the outage. Problems were also reported in parts of Europe and Latin America.

Streaming Services

Hulu (December 19, 2019): 25,777 outage reports at peak

Hulu users reported problems with the streaming service on the morning of December 19, 2019. At the peak, 25,777 users in the United States were reporting that the streaming service was down. Seven hours after the outage began, most users had regained access to their accounts and were able to watch their favorite shows and movies. In contrast, Netflix, Hulu’s main competitor, had a small outage in Germany on November 13, 2019. At its peak, only 3,197 people were reported problems with the service.

Downdetector_Outage_Hulu

Disney+ (November 12, 2019): 8,441 outage reports at peak

After months of hyped advertising and special offers, Disney+ users were eager to begin streaming their favorite movies and shows on the new service on November 12, 2019. However, problems began early in the morning on launch day in the U.S. and continued throughout the day. At the peak of the outage, 8,441 users reported that they couldn’t access the platform through the app or stream any of the content Disney+ was offering.

Financial Institutions

ING (November 17,2019): 1,342 outage reports at peak

Banks take the security and uptimes of their websites very seriously, so we expect to see fewer outages and for the outages that do occur to be small and short. This held true when Dutch users of banking giant ING reported problems with that website on November 17, 2019. The outage lasted about an hour and a half and there were 1,342 reports at the peak. No other countries reported problems with the bank’s mobile banking that day.

Downdetector_Outage_ING

These were the most significant outages we saw in Q4 2019 among the more than 5,500 sites that Downdetector monitors across the internet. Do outages impact your customers’ experience with your services? To learn more about how data from Downdetector can help your network operations center and customer care team detect and resolve issues faster, contact us here.

Ookla retains ownership of this article including all of the intellectual property rights, data, content graphs and analysis. This article may not be quoted, reproduced, distributed or published for any commercial purpose without prior consent. Members of the press and others using the findings in this article for non-commercial purposes are welcome to publicly share and link to report information with attribution to Ookla.

| April 14, 2020

Can’t Connect? The Most Significant Online Service Outages in Q1 2020

“We’re experiencing problems at the moment” became an all-too-familiar phrase during the first three months of 2020. As we continue with our series of most significant outages across the globe, this article examines major web and online service outages from Q1 2020 using Downdetector® data. Outages came under increased scrutiny as COVID-19 spread and more people began working or studying from home, gaming, video conferencing and using more online services than ever before. However, we saw significant outages both before and after this time. The six categories of outages we’re highlighting here are: collaboration platforms, gaming, telecom operators, streaming services, social media and financial institutions.

Collaboration platforms

Google Drive (January 27, 2020): 24,558 outage reports at peak

1-Google-Drive-1
Users of Google’s popular file storage and synchronization service rushed to Downdetector when receiving the following error message: “Google Docs encountered an error. Please try reloading this page, or coming back to it in a few minutes.” on January 27. The outage reportedly lasted an hour and Downdetector received 24,558 reports during the peak fifteen minutes of the outage. Most reports originated from the US, but users also reported problems in Germany, Japan, Mexico, the Netherlands and the UK.

Zoom (March 20, 2020): 1,483 reports at peak

2-Zoom-1
Video conferencing software like Zoom has become an important tool to communicate. Amid an increase in volume, Zoom users, mostly in the U.S., reported an outage on March 20 that left people unable to access the service or make calls. The service also experienced a smaller outage on March 5 with 586 reports at the peak. Both outages lasted approximately two hours.

Microsoft Teams (March 16): Multiple outages

3-Teams
Microsoft Teams experienced a worldwide outage on March 16. The collaboration platform that streamlines communication in an organization was reportedly down for users in Germany, the Netherlands, Sweden and the U.S. The duration of the outage varied by country, but lasted more than six hours in most and recurred in the Netherlands for a period on March 17. Teams also experienced a significant outage over the span of five hours on February 2 when 9,386 users in the U.S. reported problems at the peak.

Gaming

Steam (multiple outages)

Steam-Bar-Outage-1
Steam suffered nine major outages during Q1 2020 (seven of which are pictured above), according to reports from users in Germany, the U.K. and the U.S. The largest outage took place on February 18 when the gaming platform was down for about three hours and 14,955 users reported issues at the peak of the outage. Steam users rushed to Downdetector again on March 17, which was Steam’s second largest outage with 11,585 reports at the peak of the outage. The two subsequent Tuesdays also proved problematic for Steam with 6,931 outages during the peak on March 24 and 4,440 outages during the March 31 peak.

Call of Duty (March 15): 7,761 outages at peak

4-Call-of-Duty
Users in the U.S. reported multiple Call of Duty outages during Q1 2020. The largest outage took place on March 15, with 7,761 reports at the peak of an outage that primarily affected the server connection of the gaming platform. Gamers were unable to play with friends for about four hours that day. On March 17, Call of Duty had a smaller outage with 3,549 reports at peak.

Fortnite (March 17): 3,998 reports at peak

5-Fortnite

On March 17, Fornite tweeted “We’re currently investigating issues with logins, matchmaking, the Item Shop, and other Fortnight services. We’ll provide an update when these are resolved,” after users reported having problems with the gaming platform. Users were unable to access Fornite for about four hours that day. Most of the reports came from France, Germany, Japan, the Netherlands, Spain, the U.K. and the U.S.

Telecom providers

Italy

TIM Italy (March 12): 2,667 reports at peak

6-TIM
Users throughout Italy flooded Downdetector with reports of problems with their mobile internet connections on March 12. The outage lasted close to an hour and showed 2,667 reports at the peak of the outage. TIM had a smaller outage the day before with 1,337 reports at the peak of the outage.

Vodafone Italy (February 14th): 1,733 reports at peak

7-Vodafone
Vodafone users in Italy reported having problems with their mobile service on February 14. The outage lasted four hours and peaked at 1,733 reports. Users also reported problems with their mobile internet connection.

United States

Comcast (January 23): 39,638 reports at peak

8-Comcast
The U.S. internet service provider experienced a major outage on January 23. The outage lasted for two hours with 39,638 reports at the peak of the outage. Weeks later, the service experienced a smaller outage on March 3 with 1,124 reports during the peak.

United Kingdom

Virgin Media (March 4-5): 4,348 reports at peak

9-Virgin-UK
Users in the U.K. reported their internet service was not working during Virgin Media’s outage starting on March 4 and continuing through March 5. The outage peaked on March 5 when 4,348 users reported issues.

Social Media

Twitter (February 7): 11,542 reports at peak

10-Twitter-1
The largest social media outage in Q1 2020 belonged to Twitter. On February 7, users in the Twitterverse were unable to tweet, retweet or like tweets for about two hours. Over 11,500 U.S. users reported problems during the peak of the outage. Users in Germany, Japan and the U.K. also reported problems with the platform.

Facebook (January 24-25): 3,718 reports at peak

11-Facebook
Facebook users reported problems with the site on Downdetector starting on January 24. Most users reported problems with their newsfeed or the inability to log in to the social media platform. At the peak of the outage, there were 3,718 reports from users in the U.S. Users in Germany and the U.K. also reported problems that day. Users were still experiencing issues through January 25.

Streaming Services

Streaming-bar-outages

Hulu (March 20): 4,017 reports at peak

People hoping to binge-watch their favorite shows while in quarantine were disappointed to find Hulu was down on March 20. Users complaints on Downdetector included not being able to log in or of the player not working properly. The outage lasted approximately two hours.

Disney+ (January 6): 1,710 reports at peak

Disney + experienced an outage at the beginning of Q1 2020 that reached 1,710 reports at the peak. For an hour, users in the U.S. reported they were unable to log in to the platform.

Netflix (March 25): 1,690 reports at peak

For two hours on March 25, thousands of Netflix users were unable to stream their favorite shows. At the peak of Nexflix’s biggest outage in Q1 2020, 1,690 users reported problems in the U.S.

Funimation (March 25): 1,191 reports at peak

Anime lovers in the US reported problems with Funimation towards the end of Q1 2020. Most users complained of not being able to log in to the service for about an hour that day. There were 1,191 reports at the peak of the outage.

Financial Services

Robinhood (multiple outages)

robinhood-barchart

Robinhood had multiple fumbles during Q1 2020, leaving users frustrated with the financial service. The most significant outage took place on March 2 with 14,429 reports at the peak of the outage. Robin Hood experienced additional outages on March 3 and March 9 with 3,538 and 3,119 reports during the respective peaks.

Is an outage disrupting your day? You’re not alone. Find out if there’s an outage and bond with other frustrated users on Downdetector and read about other significant outages here.

Editor’s note: This article was updated on April 14 to clarify the Steam section and related graphic.

Ookla retains ownership of this article including all of the intellectual property rights, data, content graphs and analysis. This article may not be quoted, reproduced, distributed or published for any commercial purpose without prior consent. Members of the press and others using the findings in this article for non-commercial purposes are welcome to publicly share and link to report information with attribution to Ookla.

| July 14, 2020

The Most Significant Online Service Outages in Q2 2020

“Try again later” was a phrase that frustrated users all over the world during the multiple online service outages in Q2 2020. This article is the third installment in our quarterly series tracking the most significant web and online service outages. Analyzing Downdetector® data from Q2 2020, we focused on user-reported service disruptions in five categories: social media, communications service providers, collaboration platforms, gaming and financial institutions.

Social media

Downdetector_Snapchat_Outage_0720-1

Snapchat (April 8, 2020): 93,671 reports at peak

Snapchat users began to report problems with the mobile app early on April 8. At the peak of outage reports, there were 93,671 reported issues in the U.S in one 15-minute period. User reports rolled in over a total period of approximately two hours. Users in the United Kingdom and the Netherlands also reported problems with Snapchat during the same time period.

TikTok (May 6, 2020): 49,701 reports at peak

Many U.S. and U.K. users of the popular video-based social media platform struggled to log into their accounts on May 6. Over 49,000 users in the U.S. reported problems logging in, viewing and uploading videos to TikTok that evening.

Tinder (June 12, 2020): 6,967 reports at peak

Users of the mobile dating app Tinder rushed to Downdetector when they encountered problems logging in, sending and receiving messages on the morning of June 12. Almost 7,000 users from the U.S. reported problems with the app, and issues were also reported in the U.K. and Germany.

Communications service providers

Downdetector_T-Mobile_Outage_0720-1

T-Mobile (June 15, 2020): 113,980 reports at peak

U.S. mobile operator T-Mobile suffered a major outage on June 15. Customers reported problems with their mobile phone service, mobile internet connection and their ability to text friends and family. Reports came in over a period of almost ten hours that evening, peaking with 113,980 reports in one 15-minute period. Other mobile network operators also received a significant volume of problem reports that day as their own customers were unable to reach T-Mobile customers, leading to perceived service issues.

U.K. Mobile Operators: Virgin Media (April 27), TalkTalk (May 29) and Vodafone (June 9)

U.K. telecom providers Virgin Media, TalkTalk and Vodafone each struggled with outages in Q2 2020. Virgin Media UK customers rushed to Downdetector on April 27 when they started having problems with their service. Users reported problems throughout the day over a period of about six hours. About 77% of Downdetector reports cited a problem with their cable internet service. The outage had multiple peaks during the day, with 40,397 reports during the highest peak.

TalkTalk users reported problems with their internet connection on May 29, with a peak of 31,942 user reports. According to Downdetector data, the majority of reports came from Manchester, London, Glasgow and Birmingham.

On June 9, Vodafone UK experienced a smaller, but not insignificant outage. During the outage, 94% of Downdetector problem reports cited issues with the mobile network service. At the peak of reported issues, 9,686 Downdetector users reported problems with the network.

Telcel (May 27, 2020): 5,091 reports at peak

Customers of Mexican operator Telcel reported problems with their network on May 27. Over 5,000 reports were recorded during the peak of problem reporting, 95% of which were about Telcel’s mobile network. Most reports came from Mexico City.

Collaboration platforms

Downdetector_Zoom_Outage_0720-1

Zoom (May 17, 2020): 7,523 reports at peak

Video conferences and virtual dates were interrupted on May 17 when Zoom experienced problems in multiple countries. Downdetector measured a peak of 7,523 user-reported issues in one 15-minute period in the U.S., but the outage was also felt in Europe. Most users reported problems with the video conferencing feature of the online service.

Slack (May 12, 2020): 4,163 reports at peak

The popular business communication provider Slack experienced a disruption in their service on May 12, with a peak of 4,163 user-reported issues in 15 minutes. Most users who reported problems on Downdetector were located in San Francisco, Los Angeles, San Jose, and Seattle. Most reports pointed to problems connecting to the online service.

Office 365 (June 14, 2020): 2,056 reports at peak

On June 14, Australian users of Microsoft’s subscription service Office 365 reported issues, with a peak of 2,056 over 15 minutes. Users were unable to log into any of the Office 365 apps and experienced problems connecting to the server. Users in New Zealand also reported issues that day.

Gaming

Downdetector_CallofDuty_Outage_0720-2

Call of Duty (April 12, 2020): 46,278 reports at peak

U.S. players of Call of Duty were unable to connect to the game’s servers on April 12. Users from Dallas, Chicago, Houston, Philadelphia and New York City flooded Downdetector with reports when they encountered problems with the game. At the peak of Downdetector reports, more than 46,000 users reported issues.

Financial institutions

Downdetector_BBVA_Outage_0720-1

BBVA Bancomer (June 10, 2020): 1,198 reports at peak

On June 10, customers of BBVA Bancomer in Mexico reported issues with their online banking service. More than 1,000 reports were recorded at the peak of reporting, with many users unable to log in or use the app over a period of approximately four hours The majority of reported issues came from Mexico City, Guadalajara and Monterrey.

Want to know when an online service is down? Keep up with outages by visiting Downdetector.

Ookla retains ownership of this article including all of the intellectual property rights, data, content graphs and analysis. This article may not be quoted, reproduced, distributed or published for any commercial purpose without prior consent. Members of the press and others using the findings in this article for non-commercial purposes are welcome to publicly share and link to report information with attribution to Ookla.

| November 18, 2020

ICYMI: Ookla Data and Research from October 2020

Highlights from the Speedtest Global IndexTM

Global-Index-Tweet-Image-Oct-2020
These are the top stories from October 2020:

  • Australia is back in the top 5 for mobile for the first time since November 2019.
  • Luxembourg had a substantial rank change on mobile, moving up 11 places. This is likely due to two thirds of Luxembourg’s top providers now providing 5G.
  • The U.S. has finally broken the top thirty on mobile for the first time, coming in at 27th. Again, this is likely due to new 5G developments.
  • With Andorra’s largest fixed broadband provider offering 300 Mbps and 700 Mbps service plans, the country has seen a steady increase in monthly performance since February of this year.
  • Cyprus has seen steady increases in fixed broadband speed over the last few months, with one of the country’s top providers now offering fixed broadband plans up to 300 Mbps. The country now ranks 68th.

Articles worth a second look

Rakuten is Leveraging O-RAN to Reimagine Mobile and it Could Change the Way We Use Our Phones Forever

Discover how O-RAN works and how Rakuten is using a fully virtual, cloud-native mobile network approach to disrupt mobile markets around the world.

Upgrades in Mobile Speeds in India Come with Expanded 4G Availability


Comparing India to neighboring countries for mobile internet speeds and 4G Availability, this market snapshot includes information about the country’s fastest operators.

Make Better Funding Decisions with Accurate Broadband Network Data: A Guide for Federal, State and Local Governments (White Paper)


Federal, state and local policymakers are tasked with spending on broadband development. Learn how inaccurate data on network performance negatively impacts these government funding efforts with this white paper, including a case study from New York.

How to Improve In-Building Network Performance and Coverage with Crowdsourced Data (White Paper)


Use this white paper to learn how to discover heavily populated buildings with poor network coverage or quality — then how to make low-cost improvements to indoor network performance and coverage.

“Unable to Connect” — The Most Significant Online Service Outages in Q3 2020


Discover which online services around the world suffered the most widely reported incidents in Q3 2020 based on data from Downdetector®.

How Downdetector Works


Learn how Downdetector spots outages, assesses the geography of issues and determines how many problem reports it takes to indicate an incident with a site or online service.

Ookla retains ownership of this article including all of the intellectual property rights, data, content graphs and analysis. This article may not be quoted, reproduced, distributed or published for any commercial purpose without prior consent. Members of the press and others using the findings in this article for non-commercial purposes are welcome to publicly share and link to report information with attribution to Ookla.