| October 1, 2024

How the 50 U.S. States Stack up in Broadband Speed Performance: 1H 2024

Check out the full report available now with the complete results for all 50 states.

Affordable, reliable, high-speed broadband is considered a necessity in the U.S. because it enables people to access online classes, secure health care assistance, register for basic government services, handle their banking needs and participate in many other essential services.  

It’s also critical to the economic viability of every state because it supports remote workers, enables businesses to operate more efficiently and attracts new enterprises to an area. 

But many states have struggled to make broadband service available to 100% of their residents primarily because service providers are focused on providing it to areas where it’s most profitable. Using Ookla’s Speedtest Intelligence® data, this report identifies the states that are currently delivering the minimum standard for fixed broadband speeds as established by the Federal Communications Commission (FCC) to the highest percentage of Speedtest users. It also singles out the states that need the most improvement when it comes to delivering the minimum standard for broadband to their residents. 

Key takeaways 

  • Connecticut, North Dakota, Delaware and six other states are the top performing states because they have the highest percentage of Speedtest users that meet the FCC’s minimum standard for fixed broadband speeds of 100 Mbps downstream and 20 Mbps upstream. While comparing small, densely populated states with larger, sparsely populated states may seem unfair, we thought it was important to note the current performance of each state so we can track their progress in future reports.  
  • New Mexico, Arizona and Minnesota saw the biggest improvement in the percentage of Speedtest users getting the FCC’s minimum standard for fixed broadband speeds (100 Mbps down/20 Mbps up) between the first half of 2023 and the first half of 2024.  
  • Washington, Alaska, Illinois and Oregon have the most prominent digital divide of all the 50 states. These four states have the biggest gap between the percentage of rural Speedtest users vs. the percentage of urban Speedtest users that get FCC’s minimum standard of broadband speeds of 100 Mbps downstream/20 Mbps upstream. 
  • Not surprisingly, less than 40% of the Speedtest users of Alaska, Montana and Wyoming (which are three of the least densely populated states in the U.S.), are receiving the minimum broadband speeds of 100 Mbps downstream/20 Mbps upstream.

Broadband in the spotlight

The COVID-19 pandemic put a spotlight on the importance of having broadband access and the role it played in allowing people to continue working and receiving access to healthcare as well as keeping students in school.  The American Rescue Plan Act of 2021 provided $3.2 billion to help low-income households in the U.S. pay for broadband access during the COVID-19 pandemic. 

This sudden focus on broadband accessibility, also prompted Congress to pass the Infrastructure Investment and Jobs Act of 2021 which set aside $42.5 billion for the Broadband, Equity, Access and Deployment (BEAD) program and provided funding for every state to expand its broadband services. The National Telecommunications and Information Administration (NTIA) runs the BEAD program and the funding is being used for planning, infrastructure, and adoption programs in all 50 states, Washington, DC and several U.S. territories. 

BEAD initially provided $100 million to every state with the remainder of the funding to be divided among the 50 states based upon their unserved and underserved populations. As of September 18, 2024, 44 eligible entities have been approved for both the Volume 1 and Volume 2 phases of BEAD. Volume 1 of the state’s proposal details the list of locations that are eligible for BEAD funding as well as a description of how certain entities can dispute the eligibility status of the various locations. Volume 2 includes each state’s description of how it plans to select ISPs and its overall broadband objectives. Once approved for both phases, states can then get access to the money that has been allocated for them.  

To help manage these federal funds every state and territory established a broadband office that is tasked with determining the extent of their broadband coverage problems and draft broadband strategies that will resolve the problem. 

The FCC in March 2024 decided to revise its current definition of broadband as 100 Mbps downstream and 20 Mbps upstream, which is a substantial upgrade from its previous benchmark of 25 Mbps download and 3 Mbps upload speed that was first established in 2015.

This is the first time in nearly a decade that the FCC raised the speed requirement. Although this new benchmark is being used throughout the U.S., many households still lack basic broadband services. 

Top performing states

Using Ookla’s Speedtest Intelligence® data collected in the first half of 2024 we were able to compare the median download and upload speeds in all 50 states and identify the states that currently doing the best job of delivering the FCC’s minimum standard for fixed broadband speeds (100 Mbps downstream/20 Mbps upstream) to the highest percentage of Speedtest users.  

At least 60% or more of the Speedtest users in Connecticut, North Dakota, Delaware, Maryland, New Hampshire, North Dakota, Rhode Island, Tennessee, Utah and Virginia are getting the FCC’s minimum standard for fixed broadband speeds of 100 Mbps downstream and 20 Mbps upstream.  In Connecticut, which is the top state, 65.8% of Speedtest users are receiving the minimum broadband standard. But at just 65.8% that indicates that there is much more work ahead for states. 

Interestingly, all nine of the states in this list have received final approval for both phases of BEAD funding. However, it’s unlikely that BEAD funding approval played any role in these nine states leading the rest of the country in delivering the minimum standard for broadband because BEAD funding isn’t expected to start impacting broadband deployment projects until 2025 at the earliest, with some states having to wait longer depending on their proposal status with NTIA.

Top performing U.S. states with over 60% of Speedtest users achieving broadband speeds

RankStatePercentage of Speedtest users achieving broadband speedsBEAD funding approval
1Connecticut65.8Yes
2North Dakota65.5Yes
3Maryland63.7Yes
4Delaware63.3Yes
5Rhode Island62.7Yes
6Tennessee62.2Yes
7Utah61.8Yes
8New Hampshire60.5Yes
9Virginia60.1Yes
Source: Ookla Speedtest data.
*Note NTIA approval of BEAD funding is changing rapidly. While BEAD funds haven’t likely played a role in broadband deployments yet, they will in the future.

Southwestern US sees big improvements in broadband 

New Mexico, Arizona and Minnesota saw the biggest improvement in the percentage of their residents getting the FCC’s minimum standard for fixed broadband speeds (100 Mbps down/20 Mbps up) between the first half of 2023 and the first half of 2024.  

New Mexico leads the rest of the states with its gains in broadband in the past year. Ookla data indicates that New Mexico saw a 50% increase in the percentage of its population with access to the FCC’s minimum broadband speeds of 100 Mbps/20 Mbps. Arizona also saw a 45% jump in the percent of  its population with access to the FCC’s minimum broadband speeds of 100 Mbps/20 Mbps. 

Arizona, and specifically, the city of Mesa, AZ, has been a hotbed of activity for fiber deployments. In 2022 Google Fiber decided to deploy fiber to Mesa, AZ after the city council approved plans to bring a data center to the area. In addition, AT&T also announced plans to bring its fiber service to Mesa in 2023. These new fiber entrants are competing with existing broadband providers Cox Communications and Lumen. 

U.S. states with largest year-on-year increase in Speedtest users achieving broadband speeds

RankStateIncrease in Speedtest users obtaining broadband speeds (1H 2023 vs 1H 2024)BEAD funding approval
1New Mexico50%Yes
2Arizona45%Yes
3Nevada37%Yes
4Minnesota38%No
5Colorado35%Yes
6Washington35%Yes
7Oregon32%Yes
8Wyoming32%Yes
9Maine30%Yes
10Utah29%Yes
Source: Ookla Speedtest data.
*Note NTIA approval of BEAD funding is changing rapidly. While BEAD funds haven’t likely played a role in broadband deployments yet, they will in the future.

Sparse population equals inferior broadband

Not surprisingly, the most sparsely populated states in the U.S. tend to also have the smallest percentage of their population receiving the FCC’s minimum broadband speeds. Building broadband networks in rural states is incredibly expensive, and in some areas the terrain can make it nearly impossible. For example, in Alaska, where the ground may be frozen for many months out of the year, it’s difficult to dig trenches to install fiber. 

Ookla’s Speedtest data collected in the first half of 2024 found that less than 40% of the residents of Alaska, Montana and Wyoming (which are three of the most sparsely populated states in the U.S.), receive the minimum broadband speeds of 100 Mbps downstream/20 Mbps upstream.

The digital divide is still evident in many states

A big part of the impetus behind the federal government’s BEAD program is to finally close the gap between those with and without access to broadband, or what is commonly referred to as the digital divide.

But there are still many states that have a prominent gap between the number of rural and urban residents that have access to the FCC’s minimum standard of broadband speeds of 100 Mbps downstream/20 Mbps upstream.

Using the Census Bureau’s urban-rural classification and Ookla data compiled in the 1H of 2024, Washington, Alaska, Illinois and Oregon have the biggest digital divide compared to the other 50 states. For example, while 61.1% of urban Speedtest users in Washington state receive broadband speeds of 100 Mbps/20 Mbps, only 28.7% of its rural Speedtest users receive those same speeds.  

Breaking Down the Digital Divide
Percentage of urban and rural Speedtest users in each state with access to broadband speeds of 100/20 Mbps.

Broadband speeds are improving but more work is needed

U.S. broadband networks offer faster and more reliable connectivity to more people today than they did just a few years ago, however there’s still a large percentage of the U.S. population without adequate access to broadband connectivity.  

Thanks to new funding such as the BEAD program, there are many efforts underway to improve modern broadband networks. We expect to see these advancements in 2025 as more states start to put their BEAD funding into action. 

We will provide semi-annual updates on the broadband speed performance of providers in the 50 states and also to track the improvements that states are making to bridge the digital divide. For more information about Speedtest Intelligence data and insights, please get in touch.

Ookla retains ownership of this article including all of the intellectual property rights, data, content graphs and analysis. This article may not be quoted, reproduced, distributed or published for any commercial purpose without prior consent. Members of the press and others using the findings in this article for non-commercial purposes are welcome to publicly share and link to report information with attribution to Ookla.
| January 13, 2025

Wireless networks demonstrate resiliency during California wildfire disaster

Operators were able to minimize downtime

As wildfires become more prevalent, wireless operators are becoming more adept at handling these types of natural disasters by quickly deploying cell sites on wheels (COWs) and other assets to try to maintain connectivity and minimize the downtime to the networks. In addition, operators are focusing their efforts on maintaining connectivity for first responders and emergency workers.   

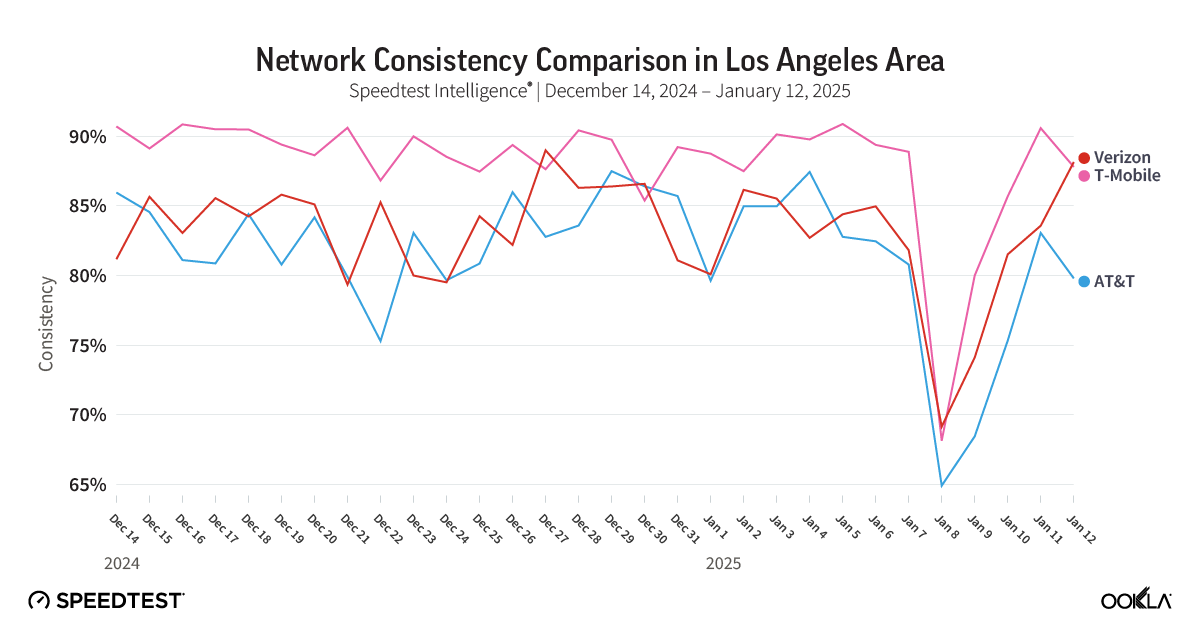
The recent devastating wildfires that were first detected in the Los Angeles area on January 6 —including the Palisades, Eaton, Kenneth and Hurst fires — have not resulted in widespread wireless network outages. In fact, analysis of Speedtest Intelligence ® data reveals that users experienced a performance decline on January 8 but by January 9 the network performance was back on the upswing and by January 12 the networks were operating at nearly the same level they were prior to January 6. 

In the chart above, the consistency percentage measures what percentage of a provider’s samples equals or exceeds both a download and upload threshold of 5/1.

This minimal impact to the wireless networks was also noted by Federal Communications Commission Chairwoman Jessica Rosenworcel: “While communications impacts are minimal so far, the FCC will continue to monitor how these sets of wildfires are affecting residents’ ability to receive the information they need to stay safe. Should conditions change, the agency stands ready to support in any way it can, including any requests to deploy FCC staff to help with any communications network recovery.”

Power outages

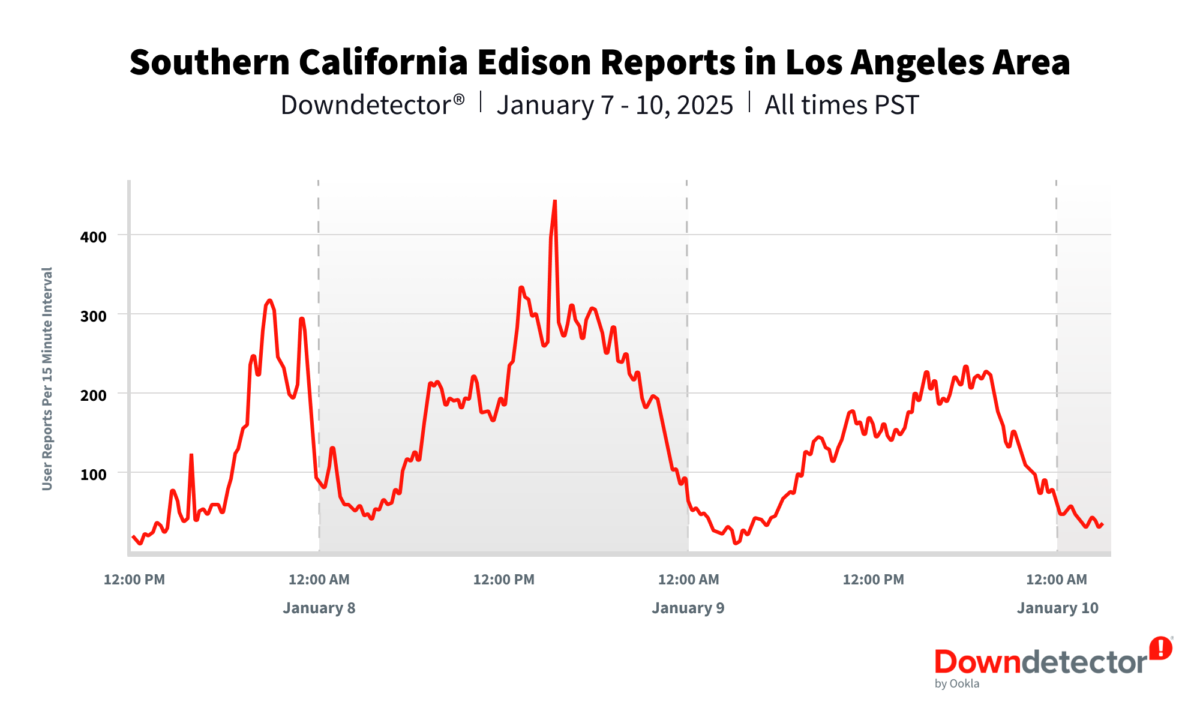
One of the biggest obstacles wireless operators had to deal with has been the loss of power to their cell sites. Reports of Southern California Edison’s power outages started to flood into Downdetector around 3 pm. PST on January 7 and peaked after noon PST on January 8 with more than 400 user reports per 15-minute intervals.

Drones and satellites 

Verizon revealed on January 10 that its engineers were deploying portable generators to cell sites in its network that were impacted by the commercial power loss. In addition, it said that in areas where fiber was burned it had deployed temporary satellite assets to provide added connectivity. 

The operator also said that it was using a fleet of more than 550 mobile assets, including drones and nearly 300 satellite-based assets to help provide connectivity where its traditional infrastructure was compromised. 

T-Mobile also is working to refuel portable generators to keep its cell sites online and the operator also said it was working with SpaceX’s Starlink to temporarily provide its direct-to-cell satellite service which will allow users in impacted areas to receive wireless emergency alerts and send texts. 

AT&T, meanwhile, said it has deployed its FirstNet Response Operations Group to help support firefighters and other first responders on the front lines with connectivity. 

Ookla will continue to monitor the network performance during the California wildfires and will provide updates if we detect any changes. 

Ookla retains ownership of this article including all of the intellectual property rights, data, content graphs and analysis. This article may not be quoted, reproduced, distributed or published for any commercial purpose without prior consent. Members of the press and others using the findings in this article for non-commercial purposes are welcome to publicly share and link to report information with attribution to Ookla.

| December 22, 2024

Ringing in the New Year - How do 5G Networks Cope Under Stress?

5G Networks Support NYE Festivities Across Major Cities

Major events present a unique challenge for mobile networks, particularly sporting events where users congregate in concentrated numbers, and where sharing of video to social media, and to friends and family is a key use case. Ringing in the New Year is another case in point – for many years network operators published statistics on the number of voice calls made, messages sent, and the amount of data traffic their networks handled. While the rise of over-the-top (OTT) communications platforms such as WhatsApp have put a damper on these press releases, there remains a sizeable impact on operators’ networks. For example, Belgian operator Proximus noted a 95% increase in mobile data traffic on New Year’s Eve in 2023 compared to 2022. The trend isn’t uniform across markets, with Australia’s Telstra consistently seeing lower data usage on New Year’s Eve, with its customers using 30% less data than average, according to a news source. What is clear is that the New Year presents network operators with the challenge of serving sufficient bandwidth to customers attending major New Year celebrations, allowing them to share the moment, but also to support the mass wishing of “Happy New Year” across a variety of channels.

We reviewed Speedtest Intelligence data for New Year’s Eve 2023/24, to analyse how 5G networks coped with the surge in demand and change in traffic patterns at New Year, across a selection of major cities featuring some of the largest New Year celebrations around the globe. We focused in on median performance alongside the 10th percentile, in order to evaluate the spread of performance from the median user to those experiencing more challenging network conditions which would impact their experience at New Year.

Worst 10% of Speedtest samples reveal network challenges

We zeroed in on 5G upload performance first. Network operators universally allocate more spectral capacity to the downlink, as most mobile use cases lean more heavily on downloading data to the end-user device. However, the usage profile at the New Year is different, with video sharing, video streaming and calling, as well as uploading content to social media, more prevalent. These are all activities that are supported by uplink from the device.

Our data shows a significant gap between upload performance for the median user, and those in the lower 10th percentile – those experiencing the worst 10% of performance samples. Half the cities in our analysis recorded 10th percentile upload performance of less than 1 Mbps, with speeds ranging from 0.30 Mbps in Berlin, to 6.09 Mbps in Dubai. These sub-par speeds make it nearly impossible to upload photos or videos.

User Experience – Assessing the Worst 10% of Performance Samples on New Year's Eve
Speedtest data, New Year's Eve 23/24, 8pm – 1am

It was a similar picture for New Year revellers based on download speeds and latency. Despite more capacity being allocated to the downlink, performance for the lowest 10% of samples tumbled significantly compared to the median experience, with cities in APAC (Bangkok, Hong Kong, Sydney and Tokyo) in particular suffering, recording 10th percentile 5G download speeds of less than 10 Mbps. Latency was more of a mixed story across cities. At one end of the scale, Tokyo recorded a variance in latency between the median and 90th percentile (the worst 10% of latency samples) of just 19 ms, while Sydney saw a much wider gap of almost 200 ms. At 200 ms of latency users are likely to experience frustratingly slow loading times, unresponsive applications, and poor video quality.

Our data also showed the degree to which New Year usage pulled down 5G performance for the worst 10% of samples. New York, and cities in Europe saw less of an impact at New Year’s Eve compared to their global counterparts. Berlin, London, New York and Paris saw 5G download speeds for 10th percentile drop by between 1.13 Mbps and 6.88 Mbps. In contrast, Bangkok, Hong Kong and Sydney saw performance drop by between 15.13 Mbps and 21.44 Mbps. Dubai and Rio de Janeiro recorded the largest variance, however with faster 5G speeds they still outpaced the remaining markets by a significant margin. Upload performance for the worst 10% of samples followed a similar trend to download, however latency performance was more varied. Berlin, Dubai, New York, Rio de Janeiro and Tokyo saw very little difference between New Year Eve latency performance and the Q4 2023 average. However, Paris, Hong Kong and London saw an increase in latency for the worst 10% off samples of between 22 ms and 36 ms, while Bangkok and Sydney fared worst, with an increase of 61 ms and 171 ms respectively.

Impact of New Year's Eve Traffic on Users With the Worst 10% of Samples
Speedtest data, Q4 2023 vs New Year's Eve 23/24, 8pm – 1am

Addressing network pain points

Addressing network pain points for users affected by poor performance in dense urban areas is a challenging task. For major events like the recent Paris Olympics, which we reported on earlier this year, network operators will typically deploy temporary network assets such as cells on wheels (CoWs) to add extra network capacity, which can then be removed once the event concludes. Network operators can also look to build private networks, to provide dedicated capacity to support the operations of the event, including routing traffic for broadcasting purposes. However, city authorities also have an important role to play here, as highlighted in our recent whitepaper with Dublin City Council and the City Telecoms Association. Having a holistic view of network performance and its evolution across a city, as well as international benchmarks, provides city authorities with the data and insights to engage more constructively with network operators and regulators, and help introduce more effective policies to deliver meaningful change for end-users. We’ll continue to benchmark and report on city and state performance, based on Speedtest Intelligence data. For more information, please contact us.

Ookla retains ownership of this article including all of the intellectual property rights, data, content graphs and analysis. This article may not be quoted, reproduced, distributed or published for any commercial purpose without prior consent. Members of the press and others using the findings in this article for non-commercial purposes are welcome to publicly share and link to report information with attribution to Ookla.
| November 4, 2024

Smartphone User Survey Reveals Habits and Frustrations

In a recent study conducted by Omdia and commissioned by Ookla, over 2,000 smartphone users across the U.S. and U.K. were surveyed to learn about consumer usage patterns, satisfaction levels, and pain points. The findings highlight user expectations in each country, from cost concerns to reliable connectivity to fast browsing speeds and more.

Read on for a look at some of the key findings from our study, or you can download our full white paper for a deeper dive into its findings, with in-depth analysis and the complete survey results.

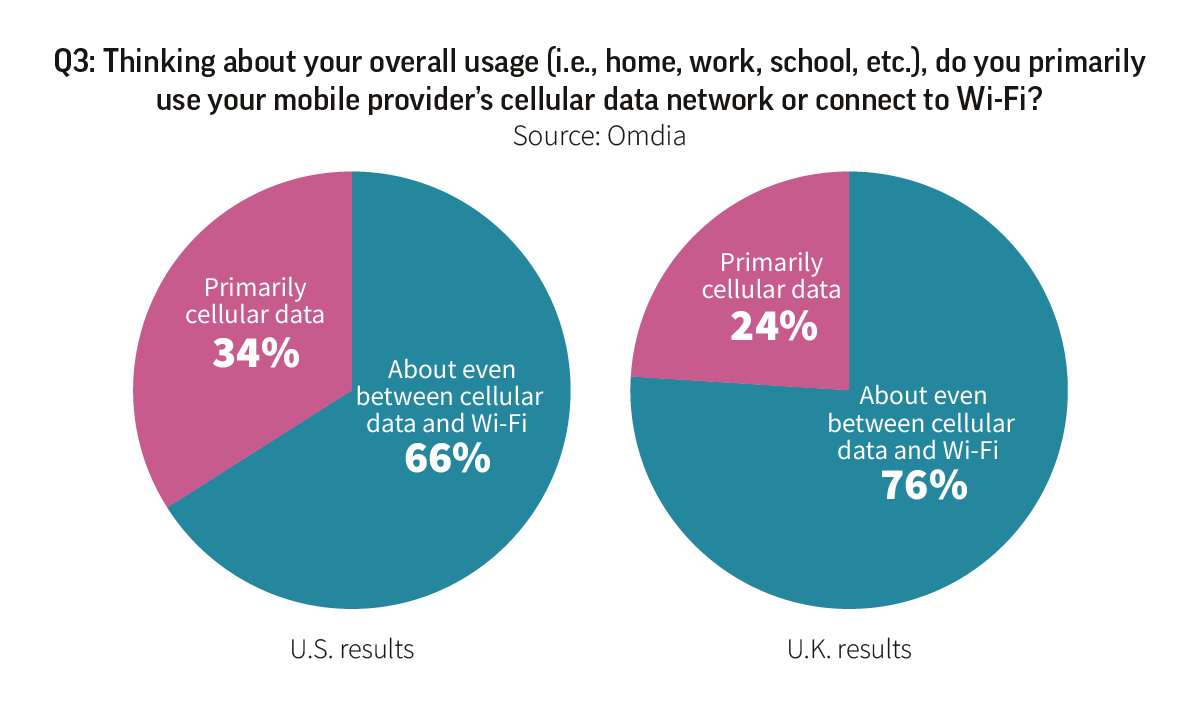
Wi-Fi remains crucial alongside widespread cellular data usage

In a survey focused primarily on smartphone users, the results showed that Wi-Fi continues to play a vital role for all users. This underscores the enduring importance of Wi-Fi in users’ connectivity strategies, even as 5G technology continues to gain traction.

Network outages: a critical issue for user satisfaction

While not the most frequently cited frustration, network outages emerge as a critical issue with far-reaching implications for user satisfaction and loyalty. The survey reveals that outages have a disproportionate impact on customer perceptions and behavior. Respondents strongly considered switching carriers as a result of network outages and emphasized the importance of timely communication from their providers to alleviate frustration and maintain trust.

In such a dynamic and complex connectivity ecosystem, tools like Speedtest® and Downdetector® play vital roles. By providing objective data on network performance and real-time information on service outages, these tools help address many of the key issues highlighted in our survey. For instance, Speedtest data can help providers pinpoint areas for improvement to enhance customer satisfaction and reduce churn, while Downdetector’s outage reporting can help service providers address user concerns about prompt updates during network issues.

Want to explore all of the findings from our latest smartphone survey? Download the white paper to see all of the survey questions, results, and in-depth analysis.

Ookla retains ownership of this article including all of the intellectual property rights, data, content graphs and analysis. This article may not be quoted, reproduced, distributed or published for any commercial purpose without prior consent. Members of the press and others using the findings in this article for non-commercial purposes are welcome to publicly share and link to report information with attribution to Ookla.
| October 1, 2024

How Google Fiber has Elevated Connectivity using Speedtest® Data [Case Study]

Fiber internet has transformed connectivity in the U.S. — enabling faster, more reliable internet access for users in urban, suburban, and rural areas. Google Fiber is a U.S. internet provider that uses fiber optic technology to deliver superior speeds to its expanding list of markets.

GFiber is dedicated to delivering the best internet service nationwide, aiming to provide all of its fiber customers – regardless of location – with ultra-fast speeds of up to 8 Gbps over state-of-the-art infrastructure that ensures consistent, high-performance connectivity across all markets. This applies to established markets as well as new areas where GFiber is expanding. GFiber utilizes Speedtest data to validate actual speeds its customers experience given their individual real world environments, which helps with the delivery of exceptional services.

Situation

GFiber is rapidly expanding its fiber network into new markets, with a strong focus on ensuring they offer market-leading speeds from day one. Upon entering a new market, a critical goal for GFiber is to drive meaningful advancements in speed and service quality for users in the area.

GFiber needed a reliable way to confirm whether their efforts were delivering significantly faster download and upload speeds, better latency, and an enhanced quality of service—not just to exceed customer expectations, but to elevate the overall market standard.

Read the full case study here.

Ookla retains ownership of this article including all of the intellectual property rights, data, content graphs and analysis. This article may not be quoted, reproduced, distributed or published for any commercial purpose without prior consent. Members of the press and others using the findings in this article for non-commercial purposes are welcome to publicly share and link to report information with attribution to Ookla.

| June 24, 2024

5G in the U.S. – Additional Mid-band Spectrum Driving Performance Gains

5G performance in the United States continues to improve as more mid-band spectrum becomes available. In March, T-Mobile gained access to additional 2.5 GHz spectrum it won at auction 108 in 2022, and we’re already beginning to see the impact of this, adding extra capacity to its 5G network and boosting performance in rural U.S. locations in particular. In just one month, T-Mobile’s median download performance across the U.S. increased by 29.64 Mbps. Its recent agreement to acquire the bulk of US Cellular’s wireless operations and a portion of its spectrum holdings will help it further reinforce its competitive lead. Verizon and AT&T have both benefited from the early vacation of C-band spectrum by satellite providers, the licenses for which were acquired through Auction 107 in February 2021. AT&T acquired additional 3.45 GHz licenses, former U.S. Department of Defense spectrum, made available through Auction 110 which concluded in January 2022. All three major carriers have since been upgrading their sites to support their new spectrum frequencies. This update reviews the latest Speedtest Intelligence® data to highlight the impact of deployments in new spectrum bands for U.S. 5G users.

Key takeaways

  • Recent trends highlight the importance of additional mid-band spectrum for 5G. Speedtest Intelligence data shows a clear correlation between the release of additional mid-band spectrum, 5G performance, and consumer sentiment for 5G networks, with all three national wireless providers benefitting over the past 6 months. This sends a clear message to the FCC and other regulators, of the benefits of allocating additional spectrum for cellular use, as advocated for by industry bodies such as the CTIA, CCA and GSMA.
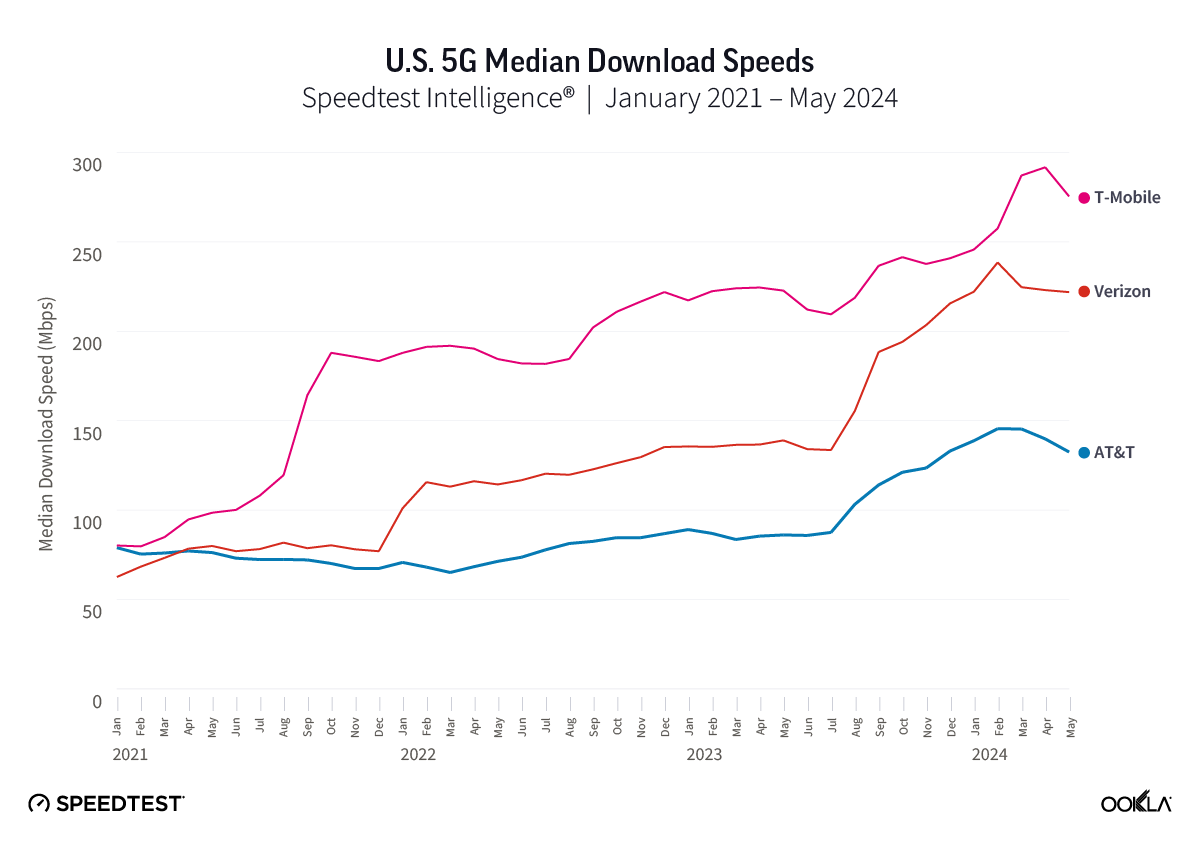
  • T-Mobile intent on holding its lead. While C-band spectrum allowed Verizon in particular to play catch-up during Q4 2023, T-Mobile has continued to build on its performance advantage and innovate, moving to a 5G Standalone (SA) architecture, testing six carrier aggregation, while also benefiting from deploying in additional mid-band spectrum starting in March. T-Mobile recorded a median 5G download speed of 287.14 Mbps as of March 2024, an increase of 29.64 Mbps in a single month, which helped it extend its lead over Verizon, which recorded 224.67 Mbps, and AT&T with 145.36 Mbps. Additional spectral capacity will also help fuel further growth of 5G Fixed-Wireless Access (FWA) services, as wireless operators have had to be selective in signing up new fixed customers in order to manage capacity.
  • Additional mid-band spectrum helping close the gap on regional disparities within the U.S. While the U.S. ranks highly on 5G performance, 5G Service, and 5G Availability metrics versus other leading 5G markets globally, there have remained wide disparities in 5G performance between U.S. states, and between urban and rural locations. Recent mid-band spectrum deployments are starting to shift the needle for a number of states and rural communities.
  • 5G upload and latency performance need more attention. To date, capacity gains from additional spectrum are being directed almost universally to boost 5G download performance, in part because 5G-NR TDD radios are being used in both 2.5 GHz and 3.5 GHz bands. While latency remains relatively static, we do see a consistent improvement from T-Mobile, a trend which will be important if the carrier is to differentiate itself on latency-critical applications in the future.

T-Mobile continues to maintain its national lead on 5G performance

Speedtest Intelligence data for the U.S., covering the last three years, clearly shows how instrumental additional mid-band spectrum has been for all major US carriers. Four points in time stand out very clearly when we look at median download speeds across the market:

  • T-Mobile’s deployment of 5G in both 600 MHz and 2.5 GHz spectrum during 2021 (acquired through the merger with Sprint), giving it a significant early advantage, as AT&T and Verizon focussed more heavily on mmWave spectrum.
  • Verizon performance picked up in January 2022, after it began C-band deployments, which had been delayed due to concerns of interference at airports from the FAA. 
  • The early vacation of the remaining C-band spectrum by incumbent satellite operators in August 2023, giving AT&T and Verizon full access to the spectrum frequencies they acquired at auction in 2021.
  • T-Mobile’s recent deployment following the release of additional 2.5 GHz spectrum as part of Auction 108, beginning in March 2024.

Chart fo U.S. 5G Median Download Speeds | January 2021 - May 2024

T-Mobile had capitalized on its early advantage, building out 5G in 600 MHz spectrum to cover 200 million Points of Presence (PoPs) as of 2020, following that up with wide deployment in its mid-band 2.5 GHz spectrum holdings. Despite performance boosts for AT&T and Verizon from additional C-band spectrum in Q4 2023, T-Mobile still led the pack with a median 5G download speed of 275.50 Mbps as of May 2024, 23% faster than next placed Verizon. Its lead had narrowed since August, with Verizon’s C-band spectrum helping it increase median 5G performance from 133.56 Mbps in June to 215.57 Mbps in December. AT&T also saw performance pick up in the second half of 2023, and at the turn of the year, these trends pointed towards a much more competitive 5G market during 2024, while also driving increased capacity for wireless provider’s 5G FWA services.

T-Mobile has continued to innovate in order to drive performance gains across its 5G network. In addition to deploying a 5G Standalone architecture, it is pushing the envelope on carrier aggregation, most recently completing a test with Ericsson and Qualcomm of six carrier aggregation, stitching together two channels of each of its 2.5 GHz, PCS, and AWS spectrum to achieve download speeds in excess of 3.6 Gbps. Furthermore, having finally gained access to additional 2.5 GHz spectrum it won during auction 108 in 2022, but had not been cleared to use, T-Mobile has rapidly been enabling the new spectrum across its footprint. This has allowed it to extend its lead in the market, recording a median 5G download speed of 287.14 Mbps in March 2024. As cellular providers ramp up their home broadband offerings via 5G fixed wireless access (FWA), as we recently highlighted, they will need to balance fixed net additions carefully in order to ensure cellular performance does not suffer, and will require additional high capacity spectrum over time to meet demand.

Driving improved quality of experience and consumer sentiment

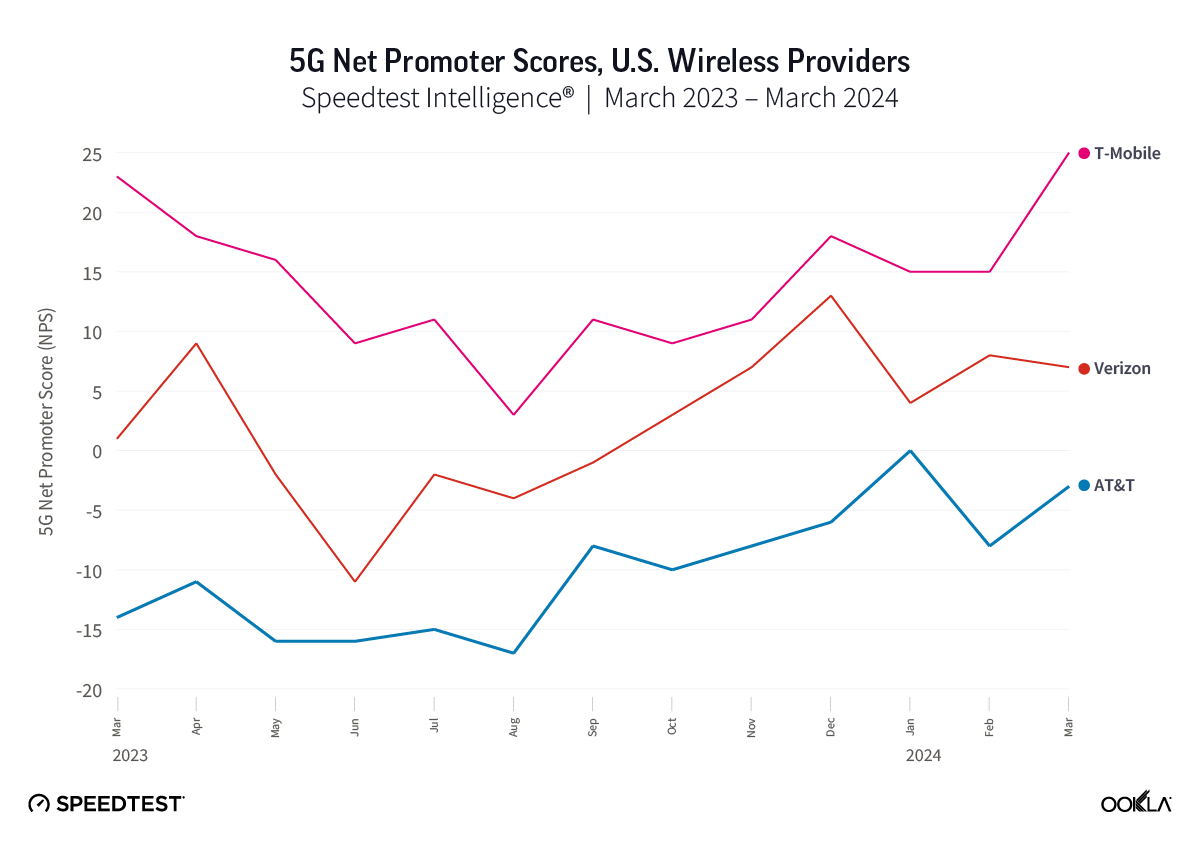
The uplift in 5G performance is driving improved consumer sentiment, as measured by net promoter score (NPS). NPS is a key performance indicator of customer experience, categorizing users into Detractors (score 0-6), Passives (score 7-8), and Promoters (score 9-10), with the NPS representing the percentage of Promoters minus the percent of Detractors, displayed in the range from -100 to 100. Reviewing Speedtest Intelligence data shows that U.S. cellular providers returned either flat or declines in 5G NPS over the period March to August 2023. From September onwards, we see a strong uplift in 5G NPS in particular for Verizon and AT&T following their C-band deployments. T-Mobile on the other hand, has seen a sizable increase in 5G NPS in March, corresponding to its deployment in additional mid-band spectrum.

Chart of 5G Net Promoter Scores, U.S. Wireless Providers

Key to this growth in 5G NPS for all three cellular providers, is the impact that increases in 5G performance are impacting the quality of experience for end users for key use cases such as video streaming and mobile gaming. Both measures, as highlighted by Ookla’s 5G Game Score™ and 5G Video Score™ metrics have seen strong increases over the course of the past year.

5G Video & Gaming Quality of Experience
Speedtest Intelligence® | Q1 2023 – Q1 2024

Positioning the U.S. strongly internationally

Performance gains from all national cellular providers have enabled the U.S. to climb the ranks when compared to its peers internationally. Over the course of just one year, it has moved from 20th place on Ookla’s Speedtest Global Index, to reach 11th as of February 2024. This has been driven by increased availability of mid-band spectrum for 5G use, as advocated for by the CTIA, which recently released a report claiming that the U.S. could benefit from an additional $200 billion in economic growth over the next 10 years through allocating additional mid-band spectrum for 5G.

U.S. providers are also continuing to expand the reach of 5G networks across the market. 5G Service, the share of known operator locations where 5G was present (of total locations with cellular service) climbed from 68.4% in Q3 2023 to 76.7% in Q1 2024. Deployment of 5G in low band spectrum is also critical to ensuring high 5G Availability – the share of 5G users that spend a majority of their time connected to 5G networks. The U.S. still tracks as one of the leading markets globally for 5G Availability, despite its comparatively large landmass, although that metric remained level quarter-on-quarter.

5G Service and 5G Availability – U.S. vs Other Leading 5G Markets
Speedtest Intelligence® | Q1 2024

Closing disparities in 5G performance between U.S. states & rural locations 

While national median speeds continue to advance, there remain some significant disparities in 5G performance at an individual state level. The Midwestern States fare best, with Illinois, Kansas, North Dakota, and Minnesota all within the top-5 performing states nationally, with median 5G download speeds above 225 Mbps during Q4 2023. At the other end of the scale are U.S. states with the highest shares of rural populations, including Vermont, Maine, Mississippi, and West Virginia, which had median download speeds below 100 Mbps. 

5G Median Download Speed by U.S. State (Mbps)
Speedtest Intelligence® | Q4 2023

Differing allocations of spectrum, channel bandwidths, device capabilities, and carrier aggregation options all impact the observed performance of each service provider across the locations they serve. While each network operator has its own 5G deployment strategy, the deployment of mid-band spectrum for capacity in urban locations, complemented with sub-1 GHz spectrum to enable wider and better 5G coverage, is the common approach. While performance gaps will remain as a result of these deployment strategies, recent mid-band spectrum deployments, including in C-band and 2.5 GHz, are beginning to help close the performance gap for some states. 

We examined T-Mobile’s recent performance, comparing data between February and March, as it deploys 5G in its additional 2.5 GHz spectrum. The results show performance has increased across a wide range of U.S. states, with its median 5G performance increasing by more than 10 Mbps within 35 States and the District of Columbia. Among the ten states with the lowest median 5G download speed (based on data for all providers), T-Mobile showed the most significant performance uplifts in West Virginia (+79.73 Mbps), Wyoming (+66.61 Mbps), and New Hampshire (+48.50 Mbps).

T-Mobile’s 2.5 GHz Dividend – Uplift in 5G Median Download Speeds (Top 15 Improving States)
Speedtest Intelligence® | March vs February 2024

Speedtest Intelligence data also illustrates the gap between rural and urban U.S. locations, which has widened over the last three years as mid-band deployments have tended to focus on more urban locations. That is beginning to change, with both T-Mobile and Verizon keen to highlight the impact of their recent spectrum deployments on rural 5G performance. While AT&T only saw a minor increase in median 5G download speeds in rural locations, both T-Mobile and Verizon have targeted significant increases in performance through mid-band spectrum deployments.

Mid-band spectrum driving improvements in urban & rural 5G performance
Speedtest Intelligence® | Q1 2021 – Q1 2024

All eyes on download throughput – upload & latency require attention

Additional spectrum has fueled surges in download performance thanks to the deployment of 5G in mid-band spectrum, but upload and latency metrics have not improved to the same degree. All three cellular providers maintained relatively static median upload speeds across the two year period we examined (Q1 2022 to Q1 2024). 5G latency performance was a mixed picture, with T-Mobile the only provider to consistently improve, reducing its latency from 55 ms in Q1 2022 to 46 ms in Q1 2024. Both Verizon and AT&T saw latency grow over the same period.

5G Median Upload and Latency Performance, (by provider, U.S.)
Speedtest Intelligence® | Q1 2022 – Q1 2024

It’s very clear that U.S. cellular providers are prioritizing improvements in download performance. This will likely continue in 2024, as T-Mobile, AT&T, and Verizon each seek to gain the upper hand, using any 5G network advantages to capture a larger share of competitive churn. Over time however, we expect the relative importance of upload and latency performance to grow, as 5G download performance begins to exhibit diminishing marginal returns, and increasing importance is given to improving the experience of latency-sensitive use cases such as video calling, mobile gaming, and augmented reality.

2024 is set to drive renewed competitive pressure between all of the service providers in the U.S., with the continuing deployment of 5G in mid-band spectrum, T-Mobile’s acquisition of US Cellular’s assets, and made all the more interesting given the DISH wildcard. We’ll continue to monitor and report on 5G performance trends in the U.S., and their impact on Speedtest users. To learn more about Ookla Speedtest Intelligence, please get in touch.

Ookla retains ownership of this article including all of the intellectual property rights, data, content graphs and analysis. This article may not be quoted, reproduced, distributed or published for any commercial purpose without prior consent. Members of the press and others using the findings in this article for non-commercial purposes are welcome to publicly share and link to report information with attribution to Ookla.

| June 24, 2024

How Much Faster is 5G Anyway? An Analysis of Page Load Speed

There’s nothing quite like picking up your phone for a little “me” time only to open up that first web page… and wait for it to load. Maybe the images aren’t there yet or the content jumps around while the ads load — it’s the worst. 5G is meant to help, so we dug into Speedtest® quality of experience data to see if this newer technology is living up to its promise. Read on for an analysis of page load speed (how many milliseconds it takes for a page to load) on three popular services in nine major countries around the world during Q1 2024.

Click the country below to go directly to that section or read on for the full article:

Brazil | Canada | France | India 

Mexico | Nigeria 

South Africa | Spain | United States

Page speed relies on low latency for the best internet experience

Page load speed is a critical measure of your web browsing experience. It measures how long it takes for a page to load, fully displaying the content on that page. This is directly impacted by latency, which is how quickly your device gets a response after you’ve sent out a request. A typical request on the internet requires two to five round trip communications between various entities over different latency sensitive protocols.

One of the promises of 5G is lower latency, which should lead to a faster (lower) page load speed on any page. The Speedtest Global IndexTM reported the global average for mobile latency as 27 milliseconds (0.027 seconds) with fixed broadband at 9 ms (0.009 s) in May 2024. As seen in the video below, it can take 7x longer to load a full webpage when latency is high, and “40% of users will abandon a site if it takes more than 3 seconds to load,” according to one source. Read more about the importance of latency to quality of experience.

5G lived up to the latency promise, showing a faster page load speed than 4G on all services in all countries we surveyed. However, the improvement was not the same in all places, with Canada topping the list of fastest page load speed over 5G on all the services we surveyed while South Africa had the slowest 5G page load speed on Google and YouTube of countries reviewed here. Read on for details.

5G loads 20-30% faster than 4G in Brazil

Chart of 5G vs. 4G Page Load Speed in Brazil

Speedtest data shows that 5G delivered a much lower page load speed than 4G on all three services in Brazil during Q1 2024. Google loaded 20% faster on 5G than 4G, YouTube was 25% faster, and Facebook was 30% faster on 5G.

Canada’s 5G page load speed among the fastest on all 3 services

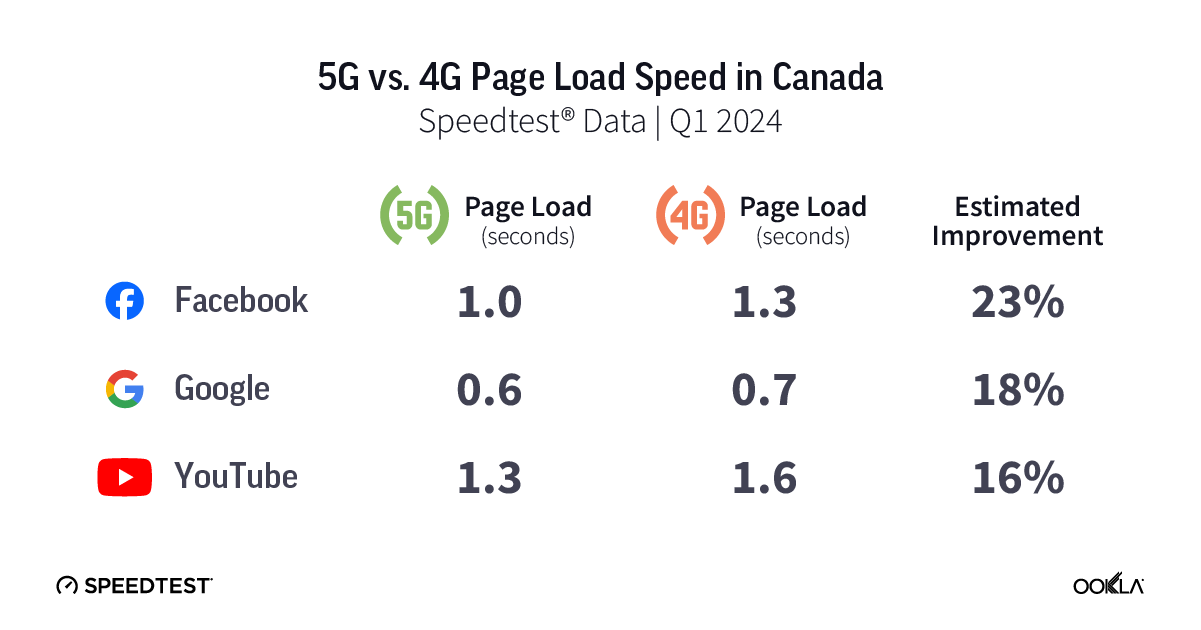
Chart of 5G vs. 4G Page Load Speed in Canada

As mentioned, Canada’s 5G page load speed was the fastest or among the fastest for all countries analyzed in this article, with Canada having the fastest page load speed on Facebook, Google, and YouTube. Our analysis demonstrated that 5G delivered a decently faster page load speed than 4G on all three services in Canada during Q1 2024. YouTube loaded 16% faster on 5G than 4G, Google was 18% faster, and Facebook was 23% faster on 5G.

French 5G loads 14-20% faster than 4G

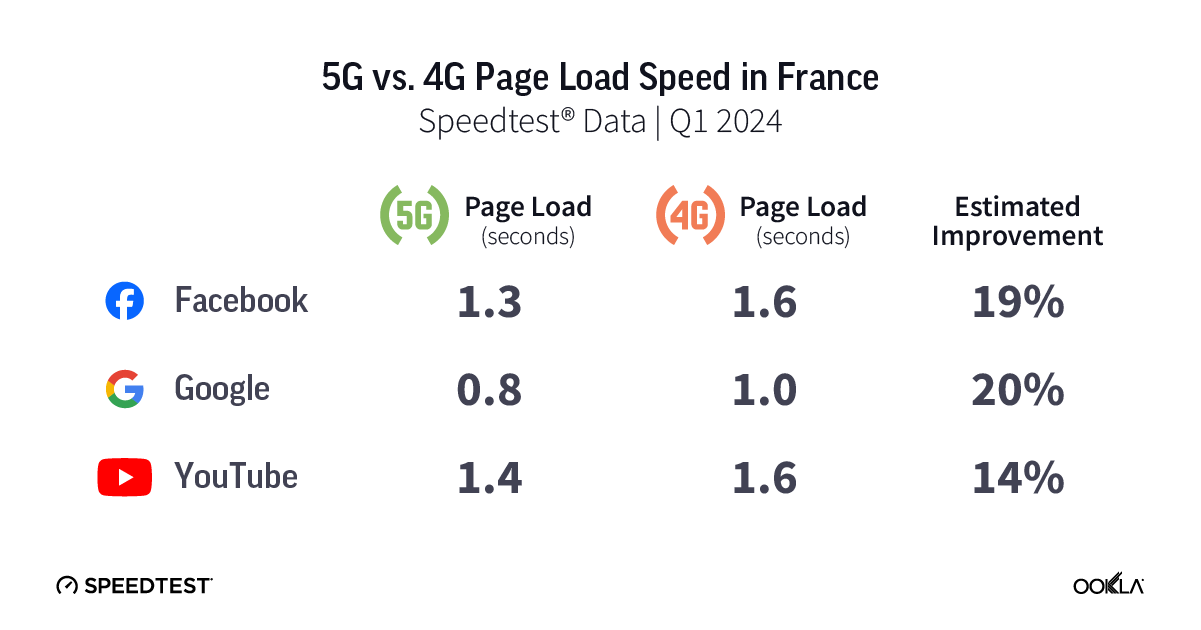
Chart of 5G vs. 4G Page Load Speed in France

Speedtest data shows 5G page load speed on all three services was decently faster than on 4G in France during Q1 2024. YouTube loaded 14% faster on 5G than 4G, Facebook was 19%, and Google was 20% faster on 5G.

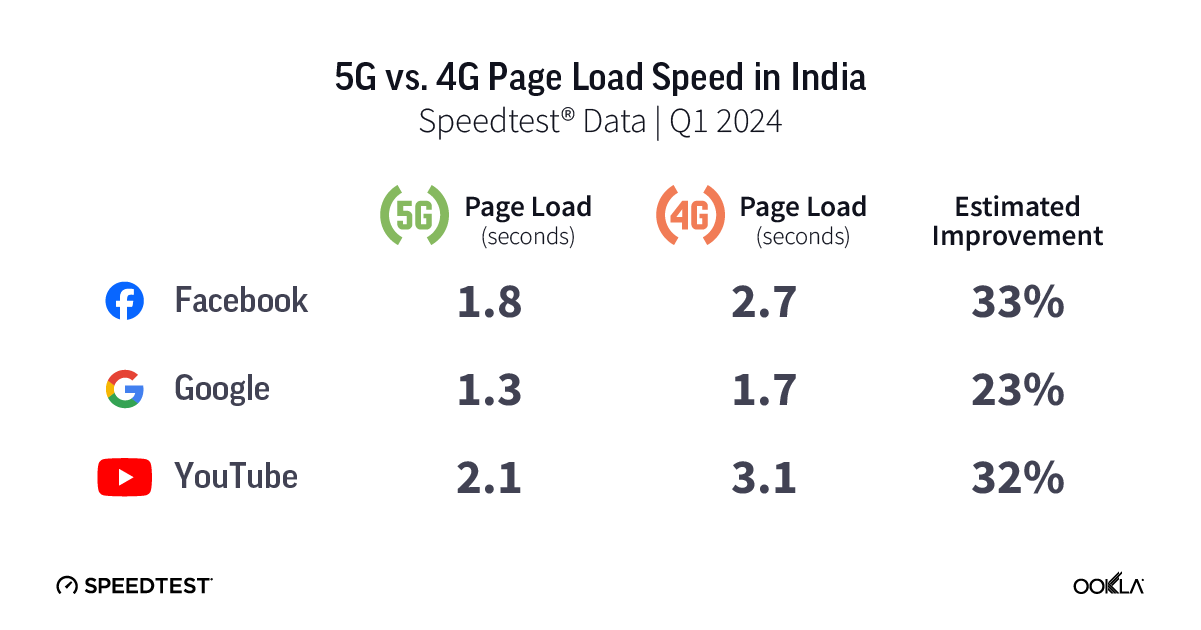
5G loads 23-33% faster than 4G in India

Chart of 5G vs. 4G Page Load Speed in India

Analysis of Speedtest data shows the page load speed on all three services was much lower on 5G than 4G in India during Q1 2024. Google loaded 23% faster on 5G than 4G, YouTube was 32% faster, and Facebook was 33% faster on 5G. India and Mexico had the slowest page load speeds for Facebook over 5G of any of the countries we looked at.

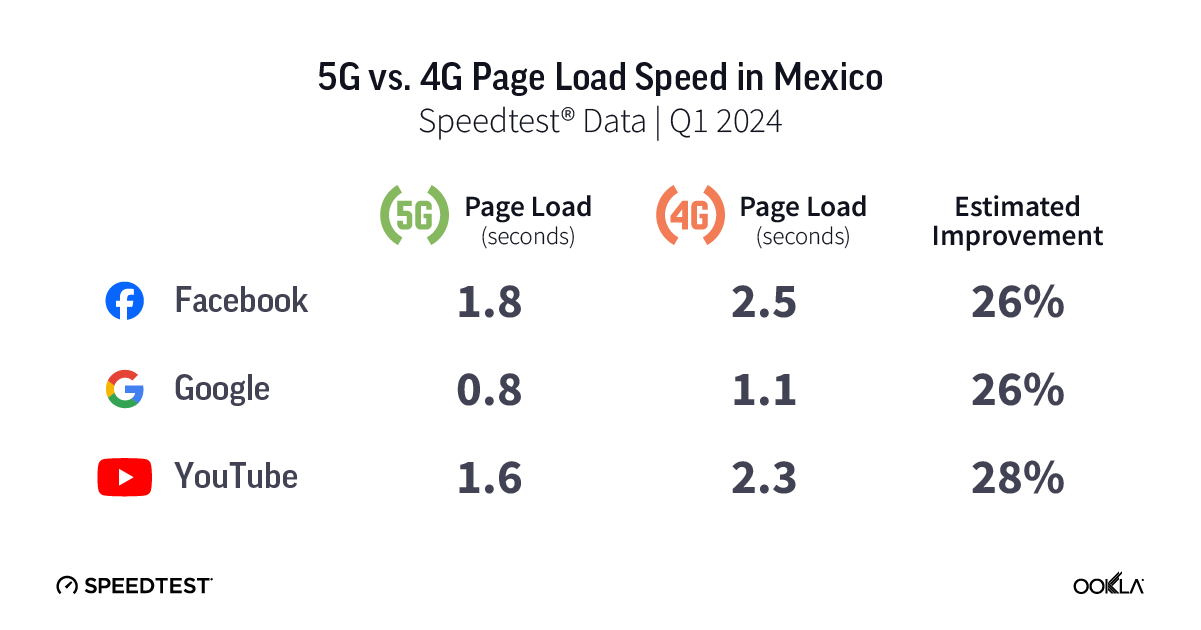
Mexican 5G loads 26-28% faster than 4G

Chart of 5G vs. 4G Page Load Speed in Mexico

Speedtest data shows 5G delivered a much lower page load speed than 4G on all three services in Mexico during Q1 2024. Google and Facebook loaded 26% faster on 5G than 4G and YouTube was 28% faster on 5G. Mexico and India had the slowest 5G page load speeds for Facebook among the countries examined.

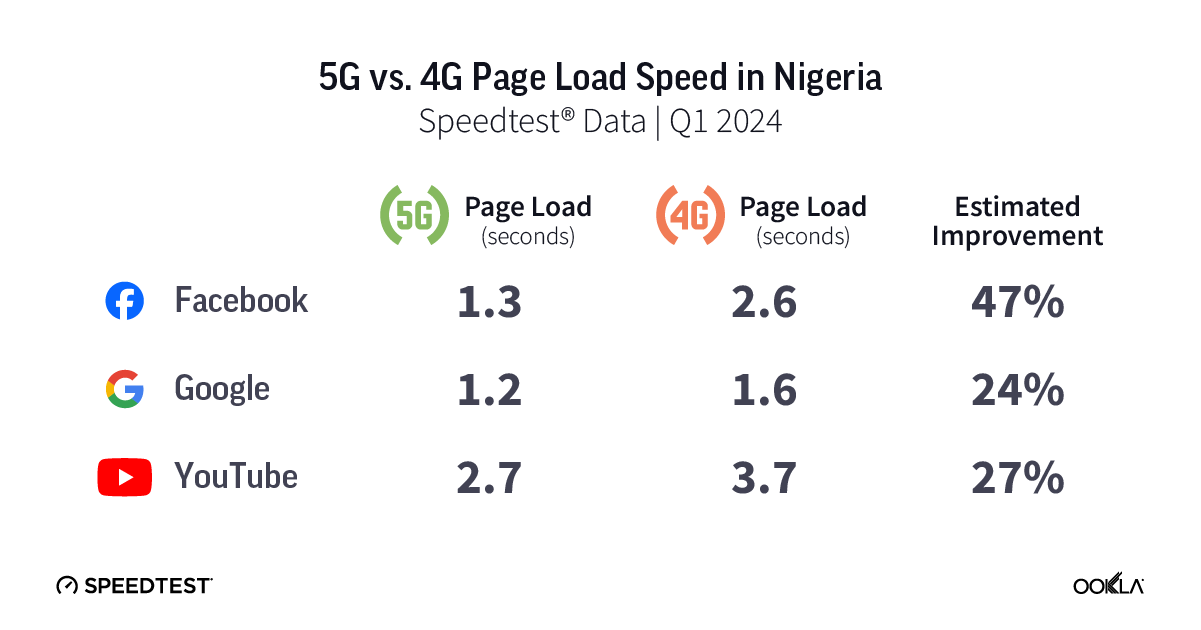
5G loads up to 47% faster than 4G in Nigeria

Chart of 5G vs. 4G Page Load Speed in Nigeria

Our analysis revealed 5G delivered a much lower page load speed than 4G on all three services in Nigeria during Q1 2024. Google loaded 24% faster on 5G than 4G, YouTube was 27% faster, and Facebook was a whopping 47% faster on 5G.

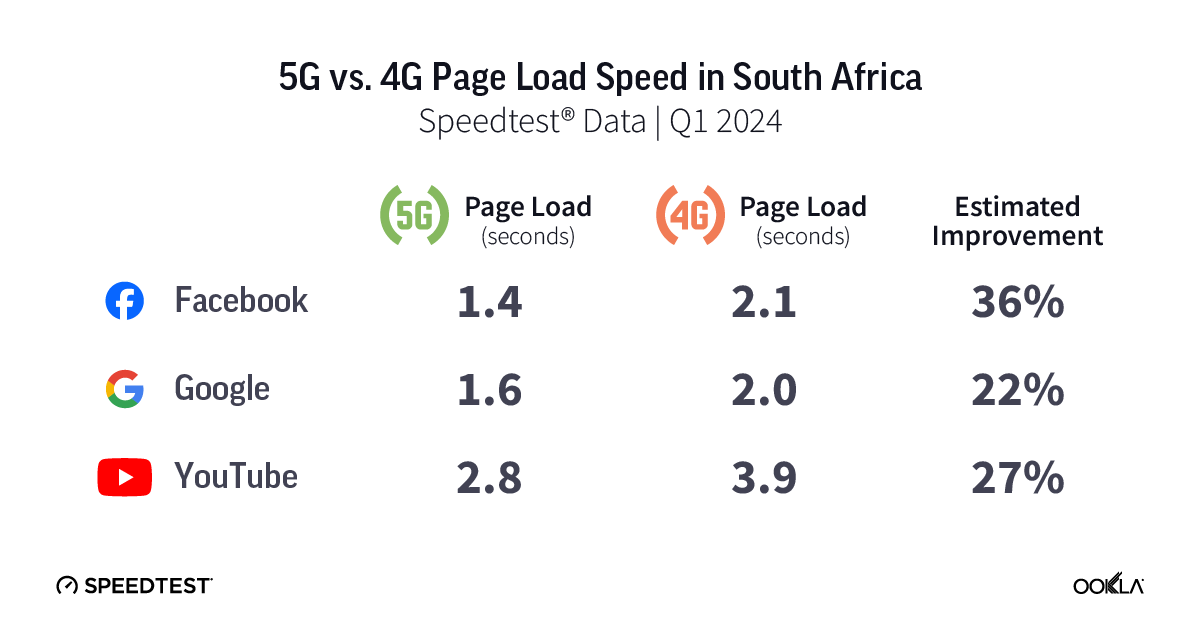
South Africans see 22-36% faster 5G page load over 4G, but slow Google and YouTube

Chart of 5G vs. 4G Page Load Speed in South Africa

Speedtest data shows 5G delivered a much lower page load speed than 4G on all three services in South Africa during Q1 2024. Google loaded 22% faster on 5G than 4G, YouTube was 27% faster, and Facebook was 36% faster on 5G. South Africa had the slowest 5G page load speed for both Google and YouTube of any of the countries analyzed.

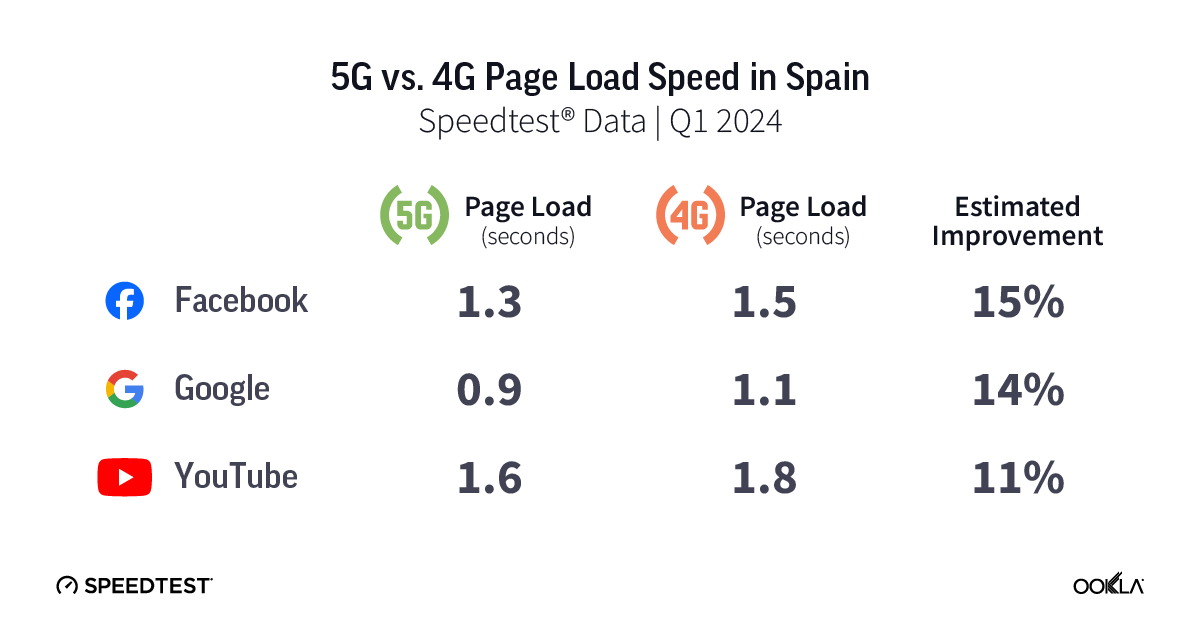
5G loads 11-15% faster than 4G in Spain

Chart of 5G vs. 4G Page Load Speed in Spain

5G page load speed in Spain was somewhat faster than 4G on all three services during Q1 2024. YouTube loaded 11% faster on 5G than 4G, Google was 14% faster than 4G, and Facebook was 15% faster on 5G.

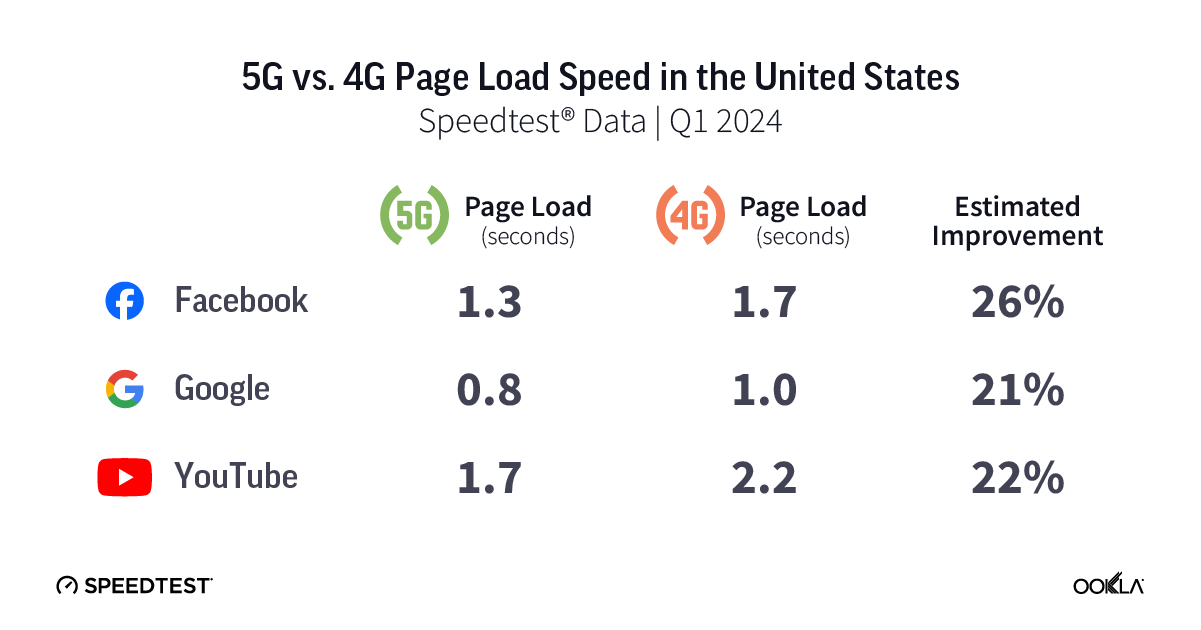
U.S. 5G loads 21-26% faster than 4G

Chart of 5G vs. 4G Page Load Speed in United States

Speedtest data from the U.S. shows 5G delivered a much lower page load speed than 4G on all three services during Q1 2024. Google loaded 21% faster on 5G than 4G, YouTube was 22% faster, and Facebook was 26% faster on 5G.

Your time is valuable. Our data shows that you can get some of that important time back if you have access to 5G and can afford to upgrade. To learn more about your network experience, download the Speedtest app for Android or iOS. Remember, too, that there’s a Downdetector® tab in the Speedtest apps to help you troubleshoot pages that aren’t loading at all.

Ookla retains ownership of this article including all of the intellectual property rights, data, content graphs and analysis. This article may not be quoted, reproduced, distributed or published for any commercial purpose without prior consent. Members of the press and others using the findings in this article for non-commercial purposes are welcome to publicly share and link to report information with attribution to Ookla.

| June 17, 2024

Your Guide to Airport Wi-Fi and Mobile Performance at 50+ Global Airports in 2024

Airports around the world have been packed with travelers this year, which puts extra stress on the Wi-Fi. With summer travel already well in swing in the northern hemisphere, we’re back with fresh data for our series on airport Wi-Fi performance to help you plan for connectivity at all your connections. You’ll find information about Wi-Fi on free networks provided by the individual airports as well as mobile speeds at some of the busiest airports in the world during Q1 2024. Read on for a look at internet performance at over 50 of the world’s busiest airports with data on download speed, upload speed, and latency.

Key takeaways

  • The seven fastest airports for downloads over Wi-Fi were in the United States: San Francisco International Airport, Newark Liberty International Airport, John F. Kennedy International Airport, Phoenix Sky Harbor International Airport, Seattle–Tacoma International Airport, Dallas Fort Worth International Airport, and Harry Reid International Airport.
  • Six U.S. airports had the fastest uploads over Wi-Fi: San Francisco International Airport, Phoenix Sky Harbor International Airport, Newark Liberty International Airport, Seattle–Tacoma International Airport, Dallas Fort Worth International Airport, and John F. Kennedy International Airport.
  • The fastest mobile download speeds on our list were at Hamad International Airport in Doha, Qatar, Shanghai Hongqiao International Airport in China, and Phoenix Sky Harbor International Airport in the U.S.
  • Eight of the 10 airports with the fastest mobile upload speeds were in China.

9 airports have 100+ Mbps Wi-Fi download speeds

Speedtest Intelligence® showed seven of the nine airports with median Wi-Fi download speeds over 100 Mbps were in the U.S.:

  • San Francisco International Airport (173.55 Mbps),
  • Newark Liberty International Airport (166.51 Mbps),
  • John F. Kennedy International Airport (151.59 Mbps),
  • Phoenix Sky Harbor International Airport (151.28 Mbps),
  • Seattle–Tacoma International Airport (137.31 Mbps),
  • Dallas Fort Worth International Airport (119.92 Mbps), and
  • Harry Reid International Airport (107.84 Mbps).

Charles de Gaulle Airport in Paris, France and China’s Hangzhou Xiaoshan International Airport rounded out the list with median download speeds of 107.13 Mbps and 101.01 Mbps, respectively. Hartsfield–Jackson Atlanta International Airport and Sea–Tac had the lowest median multi-server latency on Wi-Fi of any of the airports surveyed during Q1 2024.

Hover on the pins on the map below to see full details for download and upload speeds as well as latency at all the airports analyzed.

Fixed Broadband Internet Speeds Over Free Wi-Fi at Global Airports
Speedtest Intelligence® | Q1 2024
A map showing fixed broadband speeds in selected global airports.

At Ookla®, we’re dedicated to making sure the networks you depend on are always at their best. With Ekahau®, our Wi-Fi solution, we know firsthand just how challenging it can be to optimize Wi-Fi at airports, especially when you have up to 900 people waiting at each boarding gate during the busiest travel times. While the speeds achieved by these top airports are impressive, we saw two smaller U.S. airports with median Wi-Fi download speeds over 200 Mbps during our U.S.-only analysis of airport Wi-Fi in the fall.

Six airports on our list use multiple SSIDs for their Wi-Fi networks for different terminals or to take advantage of the coverage advantages of 2.4 GHz and the speed advantages of 5 GHz frequencies. We have included data for all the SSIDs with sufficient samples in the map and reported in the text on the best result when using multiple SSIDs results in dramatically different speeds.

Eighteen airports on our list had median Wi-Fi download speeds of less than 25 Mbps. Mexico City International Airport in Mexico had the lowest median Wi-Fi download speed at 5.11 Mbps, followed by:

  • Tan Son Nhat International Airport in Vietnam (7.07 Mbps),
  • Beijing Capital International Airport in China (9.45 Mbps),
  • Cairo International Airport in Egypt (10.62 Mbps), and
  • Tokyo Haneda Airport in Japan (11.37 Mbps).

You may struggle with everything from video chatting to streaming at any airport with a download speed below 25 Mbps. Latency is also a factor in performance so if your airport is one of the three with a median Wi-Fi latency over 60 ms, a mobile hotspot may be a better option for a stable connection.

Wi-Fi 6 has arrived

Our analysis shows at least 15 airports on our list were using the new Wi-Fi 6 standard in their Wi-Fi setup. Wi-Fi 6 uses Multi-User Multiple Input, Multiple Output (MU-MIMO) and Orthogonal Frequency Division Multiple Access (OFDMA) to increase performance and throughput, especially when serving multiple devices. This offers a real advantage at a large public location like an airport. In order to get maximum benefit from Wi-Fi 6, consumers would need to be using Wi-Fi 6-compatible devices. Speedtest data shows a fairly even split between airports that saw faster download speeds on Wi-Fi 6 and airports where Wi-Fi 6 results were comparable to those on other earlier Wi-Fi generations.

As you know, international travel can be complicated. Even if the airport offers free Wi-Fi, you may encounter other barriers to access. For example, a local number is required in Cairo to receive the access code to connect to the airport Wi-Fi. And while we’d love to include other large airports like Nigeria’s Murtala Muhammed International Airport in future Wi-Fi analyses, they currently do not offer free Wi-Fi so we have included mobile data below.

11 airports show mobile speeds over 200 Mbps

Speedtest® data shows mobile speeds massively outpaced Wi-Fi, with 14 airports showing faster median downloads over mobile than the fastest airport for Wi-Fi. Hamad International Airport in Qatar had the fastest median download speed over mobile on our list at 442.49 Mbps during Q1 2024, followed by:

  • Shanghai Hongqiao International Airport (341.19 Mbps),
  • Phoenix Sky Harbor International Airport (295.94 Mbps),
  • Shanghai Pudong International Airport (264.71 Mbps),
  • Chongqing Jiangbei International Airport (258.42 Mbps), and
  • Istanbul Airport (255.51 Mbps).

Mobile Network Speeds at Global Airports
Speedtest Intelligence® | Q1 2024

Fastest mobile speeds at airports in Africa and South America

Jomo Kenyatta International Airport in Kenya had the fastest mobile download speeds of the four African airports we analyzed at 88.12 Mbps during Q1 2024. São Paulo/Guarulhos International Airport in Brazil was the faster of the two Latin American airports analyzed with a median download speed of 55.44 Mbps.

Airports with slow mobile speeds

Mobile can’t fix everything, because six airports came in with a median mobile download speed below 25 Mbps. Mexico City International Airport was again at the bottom with 8.75 Mbps, followed by:

  • Josep Tarradellas Barcelona–El Prat Airport (15.21 Mbps),
  • Orlando International Airport (15.84 Mbps),
  • Adolfo Suárez Madrid–Barajas Airport (20.37 Mbps),
  • Chhatrapati Shivaji Maharaj International Airport (20.96 Mbps), and
  • Indira Gandhi International Airport (21.80 Mbps).

Latency on mobile was generally higher than that on Wi-Fi with 46 airports showing a Wi-Fi latency lower than the lowest latency on mobile, 27.51 ms at China’s Shanghai Hongqiao International Airport. As noted above, latency is an important factor in performance, so it might be worth investigating the airport Wi-Fi by running a Speedtest if your mobile performance seems to lag.

Airport Wi-Fi or mobile? Connecting on your next trip

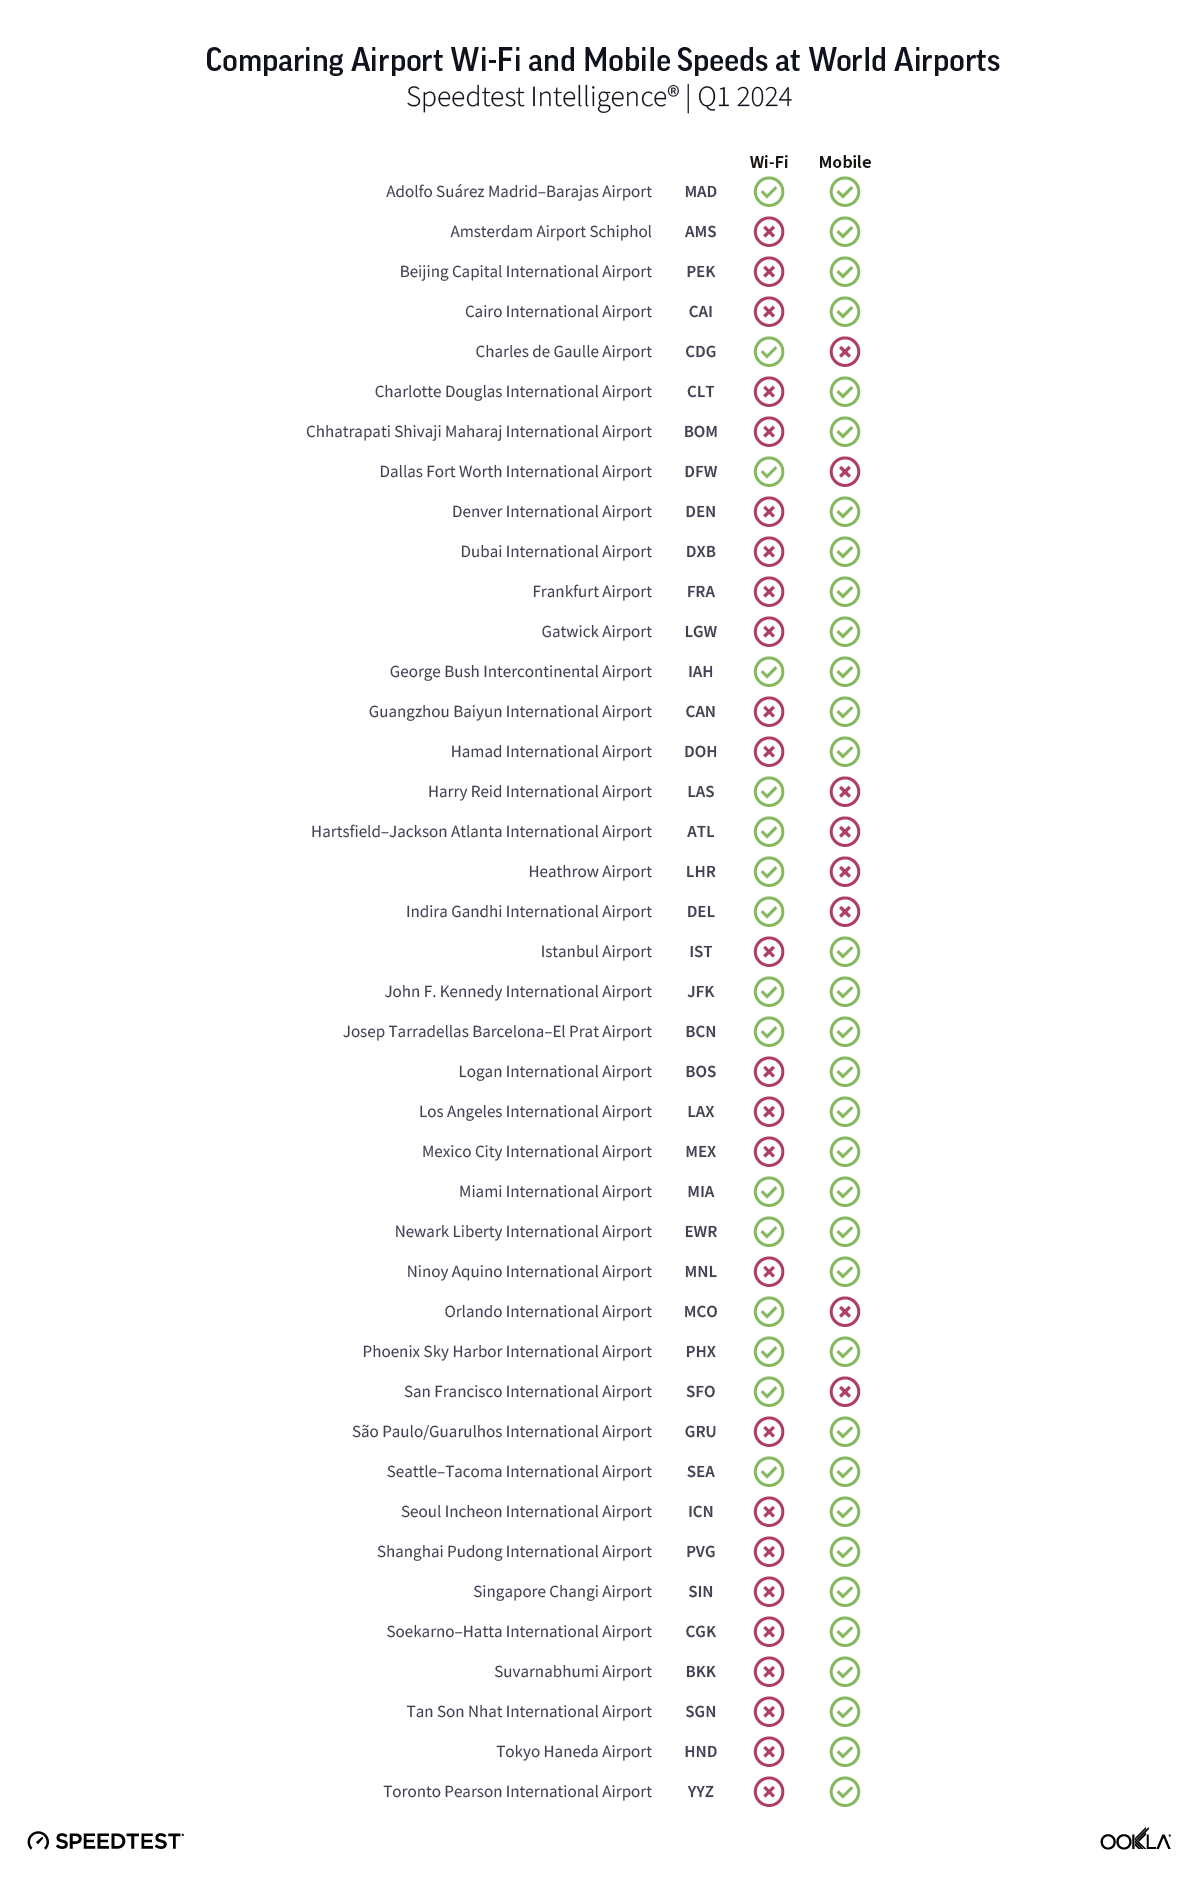
We created a quick guide to help you decide whether to try out the Wi-Fi or simply use the local mobile network if you have access. Use it to compare free airport Wi-Fi performance against mobile performance for the 52 airports we have both Wi-Fi and mobile data for during Q1 2024. Twenty-six airports had faster mobile internet than airport Wi-Fi. Eight airports had faster Wi-Fi than mobile, and seven airports showed only a slight distinction between Wi-Fi and mobile or download speeds over 100 Mbps on both, so we gave both the green check marks. We were able to include more airports in the mobile analysis because there were more mobile samples to analyze at those airports than there were samples over Wi-Fi.

Chart of Comparing Airport Wi-Fi and Mobile Speeds at World Airports

The averages reported here are based on real-world data, so your experience may differ, especially on a busy travel day. Take a Speedtest® at the airport to see how your performance compares. Cheers to safe travels and rapid connections wherever you’re flying.

Ookla retains ownership of this article including all of the intellectual property rights, data, content graphs and analysis. This article may not be quoted, reproduced, distributed or published for any commercial purpose without prior consent. Members of the press and others using the findings in this article for non-commercial purposes are welcome to publicly share and link to report information with attribution to Ookla.
| January 16, 2024

52 New Ookla Market Reports Available for Q4 2023

Ookla® Market Reports™ identify key data about internet performance in countries across the world. This quarter we’ve provided updated analyses for 52 markets using Speedtest Intelligence® and summarized the top takeaways below. Click through to the market report to see more details and charts about the countries you’re interested in, including the fastest fixed broadband providers and mobile operators, who had the most consistent service, as well as 5G and device performance in select countries during Q4 2023. Jump forward to a continent using these links:

Africa | Americas | Asia | Europe | Oceania

Africa

  • Côte d’Ivoire: Orange recorded the fastest median mobile and fixed download speeds during Q4 2023, at 30.13 Mbps and 65.90 Mbps, respectively. Moov Africa recorded the lowest mobile median multi-server latency at 83 ms, while CANALBOX recorded the lowest latency over fixed broadband at 70 ms. Of Côte d’Ivoire most populous cities, Abidjan had the fastest median fixed download speed of 58.88 Mbps.
  • Mozambique: Tmcel recorded the fastest mobile median download speed of 27.80 Mbps in Q4 2023, and also the highest mobile Consistency at 91.6%. Of Mozambique’s most populous cities, Maputo had the fastest median mobile and fixed download speeds at 26.33 Mbps and 14.65 Mbps, respectively. SpaceX’s Starlink recorded the fastest fixed broadband median download speed in Q4 2023 at 36.13 Mbps, along with the highest Consistency at 49.7%. Meanwhile, TVCABO recorded the lowest latency over fixed broadband at 16 ms.
  • Senegal: There was no winner of fastest median mobile performance in Senegal during Q4 2023, with Free and Orange both tied. Orange led the market for median fixed broadband download performance, with 21.46 Mbps in Q4 2023. Orange also had the lowest latency at 90 ms and highest Consistency of 45.4%. Of Senegal’s most populous cities, Dakar had the fastest median fixed download speed of 27.11 Mbps.

Americas

  • Argentina: Personal had the fastest median download speed over mobile at 36.59 Mbps, while also registering the lowest latency of 39 ms during Q4 2023. In the fixed broadband market, there was no statistically fastest network, with Movistar and Telecentro delivering median download speeds of 106.41 Mbps and 105.98 Mbps, respectively. Movistar recorded the lowest latency of 9 ms. Among Argentina’s most populous cities, Mendoza recorded the fastest mobile median download speed of 37.75 Mbps, while Buenos Aires recorded the fastest fixed download speed of 109.79 Mbps.
  • Belize: Digi had the fastest median mobile download and upload speeds of 17.50 Mbps and 9.28 Mbps, respectively during Q4 2023. Digi also recorded the highest Consistency of 80.3%, while smart! recorded the lowest median latency of 56 ms. There was no statistically fastest fixed network in the market based on download speed, however NEXGEN recorded the fastest median upload speed at 47.47 Mbps.
  • Canada: Bell was the fastest mobile operator in Canada with a median download speed of 121.33 Mbps in Q4 2023. Bell also had the fastest median 5G download speed at 194.23 Mbps. Rogers had the fastest median mobile upload speed of 15.10 Mbps, and the highest Consistency of 88.2%. Bell pure fibre was fastest for fixed broadband, recording a median download speed of 307.77 Mbps and a median upload speed of 264.97 Mbps. Bell pure fibre also recorded the highest Video Score, of 87.90. Of Canada’s most populous cities, St. John’s recorded the fastest median mobile download speed at 171.76 Mbps, while Fredericton recorded the fastest median fixed broadband download speed of 247.89 Mbps.
  • Colombia: Movistar was fastest for fixed broadband with a median download speed of 210.46 Mbps in Q4 2023. ETB had the lowest latency over fixed broadband at 7 ms. Of Colombia’s most populous cities, Cartagena recorded the fastest median fixed download speed of 146.74 Mbps.
  • Costa Rica: Claro had the fastest median download speed among mobile operators at 40.56 Mbps during Q4 2023. Liberty recorded the fastest median upload speed at 10.73 Mbps, the lowest mobile latency at 33 ms, and the highest Consistency at 78.6%. Metrocom was fastest for fixed broadband download and upload performance, at 225.94 Mbps and 179.66 Mbps, respectively. Metrocom also recorded the lowest latency, at 6 ms.
  • Dominican Republic: Claro had the fastest median download and upload speeds among mobile operators at 34.27 Mbps and 9.84 Mbps, respectively. Claro also recorded the highest Consistency, at 77.0%. Viva had the lowest mobile latency at 43 ms. SpaceX’s Starlink was fastest for fixed broadband download performance at 48.08 Mbps, while Claro recorded the fastest median upload speed at 25.38 Mbps, and the lowest latency at 41 ms. Altice recorded the highest fixed broadband Consistency, at 66.6%.
  • Ecuador: CNT recorded the fastest median mobile download speed during Q4 2023, at 26.22 Mbps, while Movistar recorded the lowest mobile multi-server latency at 41 ms. Netlife was fastest for fixed broadband, with a median download speed of 91.56 Mbps. Netlife also recorded the lowest latency over fixed broadband at 8 ms. Xtrim recorded the highest fixed broadband Consistency at 84.8%. Of Ecuador’s most populous cities, Santo Domingo recorded the fastest median mobile download speed of 31.58 Mbps, while Guayaquil recorded the fastest median fixed download speed of 88.59 Mbps.
  • El Salvador: Claro had the fastest median download speed among mobile operators in El Salvador, at 40.97 Mbps, along with the highest Consistency of 90.4%. Movistar registered the fastest median mobile upload speed of 13.35 Mbps and lowest latency at 73 ms. Cable Color recorded the fastest median fixed download speed at 55.57 Mbps, the top median upload speed at 57.04 Mbps, and the lowest median latency of 51 ms. Of El Salvador’s most populous cities, Santa Tecla showed the fastest median mobile and fixed download speeds during Q4 2023 at 39.27 Mbps and 54.98 Mbps respectively.
  • Guatemala: Claro was the fastest mobile operator in Guatemala during Q4 2023 with a median download speed of 41.63 Mbps and a median upload speed of 19.61 Mbps. Claro also had the highest Consistency at 87.9%, while also leading the market for 5G performance, with a median 5G download speed of 388.34 Mbps. Tigo recorded the lowest median mobile latency at 79 ms. SpaceX’s Starlink was fastest for median fixed download performance at 54.32 Mbps, while Cable Color was fastest for fixed upload performance at 33.45 Mbps. Cable Color also had the lowest median latency on fixed broadband at 27 ms. Claro recorded the highest fixed broadband Consistency at 73.1%. Of Guatemala’s most populous cities, Escuintla showed the fastest median mobile download speed during Q4 2023 at 44.16 Mbps, while Villa Nueva recorded the fastest median fixed download speed, at 60.83 Mbps.
  • Guyana: There was no winner of fastest median mobile performance in Guyana during Q4 2023, with ENet and Digicel posting median download speeds of 24.64 Mbps and 23.53 Mbps, respectively. ENet recorded the fastest median mobile upload speed at 18.49 Mbps and offered the lowest median latency at 143 ms. In the fixed broadband market, ENet recorded the fastest median download and upload speeds, of 70.20 Mbps and 52.25 Mbps, respectively, while also recording the lowest median latency of 130 ms. GTT recorded the highest fixed broadband Consistency during Q4 2023, at 69.2%.
  • Haiti: Digicel was the fastest mobile operator in Haiti with a median mobile download speed of 14.26 Mbps, a median upload speed of 10.52 Mbps, and Consistency of 67.2%. Natcom recorded the lowest mobile latency, of 62 ms. SpaceX Starlink had the fastest median fixed download speed at 41.73 Mbps. Natcom had the fastest median fixed upload speed at 31.89 Mbps, the lowest median fixed latency at 47 ms, and the highest fixed broadband Consistency of 64.0%.
  • Honduras: Claro recorded the fastest median mobile download and upload speeds during Q4 2023, of 53.06 Mbps and 16.22 Mbps, respectively, while also recording the highest Consistency at 87.2%. Tigo recorded the lowest median mobile latency at 93 ms. Claro had the fastest median fixed download speed at 47.26 Mbps during Q4 2023, and the highest fixed broadband Consistency at 80.2%. TEVISAT recorded the fastest median upload speed, of 22.36 Mbps, and the lowest median fixed latency at 20 ms. Of Honduras’ most populous cities, El Progreso recorded the fastest median mobile download speed during Q4 2023, of 41.69 Mbps, while Tegucigalpa showed the fastest median fixed download speed at 41.97 Mbps.
  • Jamaica: There was no winner of fastest median mobile download performance in Jamaica during Q4 2023, with Flow and Digicel tied. Digicel recorded the fastest median upload speed of 8.37 Mbps and highest Consistency of 81.9%. Flow had the lowest mobile median latency at 38 ms. SpaceX Starlink had the fastest median download speed over fixed broadband at 84.10 Mbps, and the highest fixed broadband Consistency at 77.8%. Digicel+ recorded the fastest median upload speed of 46.14 Mbps, while Flow recorded the lowest median fixed latency at 25 ms.
  • Mexico: Telcel had the fastest median download and upload speeds over mobile at 52.06 Mbps and 13.50 Mbps, respectively, and the operator also delivered the fastest median 5G download speed at 233.82 Mbps. Telcel also had the lowest mobile median latency at 62 ms and highest Consistency at 87.2%. Totalplay was fastest for fixed broadband with a median download speed of 88.87 Mbps and a median upload speed of 30.50 Mbps. Totalplay also had the lowest median fixed broadband latency at 28 ms and the highest Consistency at 84.0%. Among Mexico’s most populous cities, Monterrey recorded the fastest median mobile download speed of 38.36 Mbps, while Guadalajara recorded the fastest median fixed broadband speed of 80.32 Mbps.
  • Panama: MasMovil was the fastest mobile operator with median download and upload speeds of 27.24 Mbps and 15.18 Mbps, respectively, as well as the highest Consistency of 79.3%. Digicel recorded the lowest median mobile latency, at 34 ms. There was no winner of the fastest median fixed download performance, with both Tigo and MasMovil tied. MasMovil recorded the fastest median upload speed of 33.38 Mbps and the lowest median latency at 16ms. Among Panama’s most populous cities, David recorded the fastest median mobile download speed of 21.57 Mbps, while La Chorrera recorded the fastest median fixed broadband speed of 156.71 Mbps.
  • Peru: Claro was the fastest mobile operator in Peru with a median download speed of 23.30 Mbps during Q4 2023, and also had the highest mobile Consistency in the market with 80.6%.
  • Trinidad and Tobago: Digicel had the fastest median download speed over mobile at 33.29 Mbps and the highest Video Score in the market at 74.86. bmobile recorded the fastest median mobile upload speed of 12.17 Mbps, and the lowest median latency at 32 ms. Digicel+ had the fastest median fixed broadband download and upload speeds at 118.53 Mbps and 107.24 Mbps, respectively. Digicel+ also had the lowest median latency at 7 ms.
  • United States: T-Mobile was the fastest mobile operator with median download and upload speeds of 188.96 Mbps and 12.19 Mbps, respectively. T-Mobile also recorded the highest mobile Consistency at 87.3%, and the lowest median mobile latency of 50 ms. T-Mobile also led the market with the fastest median 5G download speed at 238.87 Mbps, as well as the lowest 5G latency of 48 ms. T-Mobile secured the highest Video Score across all technologies with 78.21, and for 5G, with a Video Score of 81.54. Cox led the market as the fastest fixed broadband provider with a median download speed of 261.27 Mbps, while AT&T Internet recorded the fastest median fixed upload speed of 195.64 Mbps, and Verizon had the lowest median latency over fixed broadband at 15 ms.
  • Uruguay: Antel was the fastest mobile operator in Uruguay during Q4 2023 with a median download speed of 117.79 Mbps, and recorded the lowest median latency of 44 ms.
  • Venezuela: Digitel was the fastest mobile operator with a median download speed of 14.37 Mbps and a median upload speed of 6.97 Mbps during Q4 2023. Digitel also recorded the highest Consistency in the market, with 68.0%, and the lowest median latency of 97 ms. Airtek Solutions had the fastest median fixed download and upload speeds of 94.76 Mbps and 94.89 Mbps, respectively. Airtek Solutions also recorded the highest fixed broadband Consistency of 86.0%, and the lowest median latency at 7 ms. Among Venezuela’s most populous cities, Maracaibo recorded the fastest median mobile and fixed download speeds of 17.17 Mbps and 82.35 Mbps, respectively.

Asia

  • Afghanistan: The fastest mobile operator in Afghanistan was Afghan Wireless with a median download speed of 6.68 Mbps in Q4 2023. The operator also had the lowest median latency at 77 ms and the highest Consistency of 51.0%.
  • Bangladesh: Banglalink was the fastest mobile operator in Bangladesh with a median download speed of 26.74 Mbps in Q4 2023. Banglalink also recorded the highest Consistency of 89.0% and the lowest median latency of 33 ms. DOT Internet was the fastest fixed broadband provider with a median download speed of 91.35 Mbps, while also recording the highest Consistency at 87.5% and the lowest median latency at 5 ms.
  • Bhutan: There was no statistical winner for fastest mobile download performance during Q4 2023 in Bhutan, with TashiCell and BT both tied with speeds of 31.52 Mbps and 28.15 Mbps, respectively. TashiCell recorded the lowest median mobile latency of 52 ms.
  • Brunei: There was no statistical winner for fastest mobile download performance during Q4 2023 in Brunei, with DST and Imagine both tied with speeds of 97.34 Mbps and 91.53 Mbps, respectively.
  • Cambodia: Cellcard recorded the fastest median mobile download speed at 33.74 Mbps during Q4 2023, while Metfone recorded the highest Consistency at 80.8% and the lowest median latency at 38 ms. MekongNet was the fastest fixed broadband provider, with a median fixed download speed of 48.29 Mbps. MekongNet also recorded the highest Consistency at 71.1%. OpenNet recorded the lowest median latency over fixed broadband, at 7ms.
  • China: China Broadnet was the fastest mobile operator in China during Q4 2023, with a median download speed of 248.77 Mbps, and median 5G download speed of 305.61 Mbps. China Mobile recorded the lowest median mobile latency, at 42 ms. There was no statistical winner for fastest fixed download performance, with China Unicom and China Mobile both tied with speeds of 246.93 Mbps and 245.59 Mbps, respectively. China Mobile recorded the highest fixed broadband Consistency, of 93.4%, while China Telecom recorded the lowest median fixed broadband latency at 22 ms. Among China’s most populous cities, Beijing recorded the fastest median mobile download speed of 232.41 Mbps, while Tianjin recorded the fastest median fixed download speed of 326.07 Mbps.
  • Georgia: Geocell recorded the fastest mobile download performance during Q4 2023 in Georgia, at 50.52 Mbps, and the lowest mobile latency at 37 ms. MagtiCom had the fastest median fixed download speed at 27.81 Mbps and the highest Consistency of 66.5%. Among Georgia’s most populous cities, Tbilisi recorded the fastest median mobile download speed of 36.17 Mbps, while Rustavi recorded the fastest median fixed download speed of 27.38 Mbps.
  • Hong Kong (SAR): China Mobile Hong Kong was the fastest mobile operator in Hong Kong (SAR) during Q4 2023, with a median download speed across all technologies of 98.94 Mbps, and a median download speed over 5G of 177.96 Mbps. csl recorded the fastest median mobile upload speed, at 16.89 Mbps.
  • Indonesia: Telkomsel was the fastest Indonesian mobile operator with a median download speed of 31.14 Mbps. Telkomsel also had the lowest median mobile latency at 45 ms.
  • Japan: Rakuten Mobile recorded the fastest mobile download and upload speeds during Q4 2023 in Japan, at 51.16 Mbps and 20.21 Mbps, respectively. Rakuten Mobile also recorded the highest Consistency in the market at 90.6%, while SoftBank recorded the lowest median latency at 43 ms. So-net had the fastest fixed download and upload speeds, at 296.29 Mbps and 219.53 Mbps, respectively, as well as the lowest median latency over fixed broadband at 9 ms. SpaceX Starlink recorded the highest fixed broadband Consistency in the market at 96.4%.
  • Kazakhstan: Tele2 recorded the highest mobile Consistency in Kazakhstan during Q4 2023 with 85.3% and the lowest median mobile latency at 39 ms.
  • Malaysia: TM was the fastest fixed broadband provider in Malaysia with a median download speed of 112.00 Mbps in Q4 2023. TIME recorded the lowest fixed broadband latency at 9 ms.
  • Pakistan: Jazz delivered the fastest median mobile download speed in Pakistan at 21.38 Mbps in Q4 2023. Zong recorded the highest mobile Consistency, at 83.2%, and the lowest median mobile latency of 45 ms. Transworld recorded the fastest median fixed broadband download speed at 22.08 Mbps and the highest Consistency at 46.1%, while Connect Communications recorded the lowest median fixed broadband latency at 12 ms.
  • Philippines: Smart delivered the fastest median mobile download speed in the Philippines at 37.64 Mbps in Q4 2023.
  • South Korea: SK Telecom recorded the fastest median mobile download speed at 192.67 Mbps, while also recording the highest Consistency in the market at 89.1%. LG U+ had the lowest median mobile latency in the market at 76 ms. In South Korea’s fixed broadband market, LG U+ delivered the fastest median download speed at 146.20 Mbps, and the lowest median latency of 57 ms.
  • Sri Lanka: There was no statistical winner for fastest mobile download performance during Q4 2023 in Sri Lanka, with Dialog and SLT-Mobitel both tied with speeds of 23.98 Mbps and 23.89 Mbps, respectively. Dialog delivered the lowest median mobile latency of 36 ms. SLT-Mobitel recorded the fastest fixed download speed of 37.46 Mbps, as well as the highest fixed broadband Consistency of 57.9% and the lowest fixed broadband latency at 13 ms.
  • Vietnam: Viettel was the fastest fixed provider in Vietnam during Q4 2023, with a median download speed of 107.40 Mbps. Viettel also recorded the highest fixed broadband Consistency at 94.8% and the lowest median fixed broadband latency of 4 ms.

Europe

  • Albania: Vodafone recorded the fastest median mobile download speed in Albania during Q4 2023, of 53.36 Mbps. One Albania recorded the highest mobile Consistency of 86.1%. Digicom was the fastest fixed broadband provider with a median download speed of 94.74 Mbps. Abissnet recorded the lowest fixed broadband latency, at 7 ms. Among Albania’s most populous cities, Vlorë recorded the fastest median mobile download speed of 75.34 Mbps, while Shkodër recorded the fastest median fixed download speed of 69.91 Mbps.
  • Belgium: Proximus recorded the fastest median mobile download speed in Belgium during Q4 2023, at 89.67 Mbps. Proximus also recorded the highest mobile Consistency in the market at 89.8%. There was no statistical winner for fastest fixed download performance, with Telenet and VOO both tied with speeds of 158.08 Mbps and 156.00 Mbps, respectively. VOO recorded the highest Consistency at 89.8%. Among Belgium’s most populous cities, Ghent recorded the fastest median mobile and fixed download speeds, of 168.89 Mbps and 90.14 Mbps, respectively.
  • Denmark: Telia was the fastest mobile operator in Denmark during Q4 2023, with a median download speed of 163.41 Mbps. Hiper was fastest for fixed broadband, with a median download speed of 277.56 Mbps.
  • Estonia: The fastest mobile operator in Estonia was Telia with a median download speed of 92.39 Mbps in Q4 2023. Elisa recorded the highest mobile Consistency of 91.9%. Elisa was the fastest fixed broadband provider, with a median download speed of 100.13 Mbps. Elisa also recorded the highest fixed broadband Consistency, of 86.3%. Infonet recorded the lowest median fixed broadband latency of 5 ms.
  • Finland: DNA had the fastest median mobile download speed at 113.57 Mbps in Q4 2023, and the highest Consistency of 95.4%. DNA also recorded the fastest median 5G download performance, at 247.54 Mbps. Telia recorded the lowest median mobile latency of 31 ms. Lounea was fastest for fixed broadband with a median download speed of 171.31 Mbps. Lounea also recorded the highest fixed broadband Consistency in the market at 91.5%, as well as the lowest median fixed broadband latency at 13 ms.
  • Germany: Telekom was the fastest mobile operator in Germany during Q4 2023, with a median download speed of 90.26 Mbps, as well as the top median download speed over 5G at 179.25 Mbps. Telekom also recorded the highest mobile Consistency in the market at 92.1% and the lowest median mobile latency of 38 ms. Deutsche Glasfaser recorded the fastest fixed broadband performance, with a median download speed at 201.43 Mbps. Deutsche Glasfaser also recorded the highest fixed broadband Consistency in the market at 90.5% and the lowest latency of 14 ms.
  • Latvia: There was no statistical winner for fastest mobile download performance in Latvia during Q4 2023, with BITĖ and LMT both tied with speeds of 81.56 Mbps and 81.11 Mbps, respectively. BITĖ recorded the highest mobile Consistency in the market of 91.3%, while LMT recorded the lowest mobile latency at 27 ms. Balticom was fastest for fixed broadband with a median download speed of 275.19 Mbps, while also leading with the highest fixed broadband Consistency of 93.7%, and the lowest median latency at 4 ms. Among Latvia’s most populous cities, Olaine recorded the fastest median mobile download speed, of 170.18 Mbps, while Salaspils recorded the fastest median fixed broadband download speed of 94.64 Mbps.
  • Lithuania: Telia was the fastest mobile operator in Lithuania during Q4 2023, with a median download speed of 116.58 Mbps in Q4 2023. Telia also recorded the highest Consistency in the market at 94.7%, and the lowest median mobile latency at 32 ms. Cgates was fastest for fixed broadband with a median download speed of 177.14 Mbps. Cgates also recorded the highest Consistency over fixed broadband in the market at 90.9%, while Penki recorded the lowest fixed broadband latency, at 4ms. Among Lithuania’s most populous cities, Panevėžys recorded the fastest median mobile download speed, of 106.34 Mbps, while Klaipėda recorded the fastest median fixed broadband download speed of 138.34 Mbps.
  • Poland: T-Mobile was the fastest mobile operator in Poland during Q4 2023, with a median download speed of 49.10 Mbps. T-Mobile also recorded the highest Consistency in the market at 88.4%. Plus recorded the fastest 5G performance in the market, with a median 5G download speed of 133.34 Mbps. Plus also recorded the lowest median mobile latency, at 43 ms. UPC was the fastest provider for fixed broadband with a median download speed of 232.36 Mbps, while Netia recorded the lowest fixed broadband latency, at 16 ms. Among Poland’s most populous cities, Łódź recorded the fastest median mobile download speed of  46.53 Mbps, while Wrocław recorded the fastest median fixed download speed of 172.86 Mbps.
  • Turkey: Turkcell was the fastest mobile operator in Turkey with a median download speed of 56.73 Mbps in Q4 2023, and Turkcell also recorded the highest Consistency of 91.3%. Türk Telekom had the lowest median mobile latency at 39 ms. TurkNet was fastest for fixed broadband, with a median download speed of 66.57 Mbps. TurkNet also recorded the lowest median fixed latency at 13 ms, and the highest Consistency at 81.5%. Among Turkey’s most populous cities, Istanbul recorded the fastest median download speeds across mobile and fixed, at 38.50 Mbps and 47.81 Mbps, respectively.

Oceania

  • New Zealand: There was no statistical winner for fastest mobile download performance during Q4 2023 in New Zealand, with One NZ and Spark both tied with speeds of 73.52 Mbps and 70.23 Mbps, respectively. 2degrees led the market with the highest Consistency of 91.0% and the lowest median mobile multi-server latency at 40 ms.

The Speedtest Global Index is your resource to understand how internet connectivity compares around the world and how it’s changing. Check back next month for updated data on country and city rankings, and look for updated Ookla Market Reports with 1H 2024 data in July.

Ookla retains ownership of this article including all of the intellectual property rights, data, content graphs and analysis. This article may not be quoted, reproduced, distributed or published for any commercial purpose without prior consent. Members of the press and others using the findings in this article for non-commercial purposes are welcome to publicly share and link to report information with attribution to Ookla.
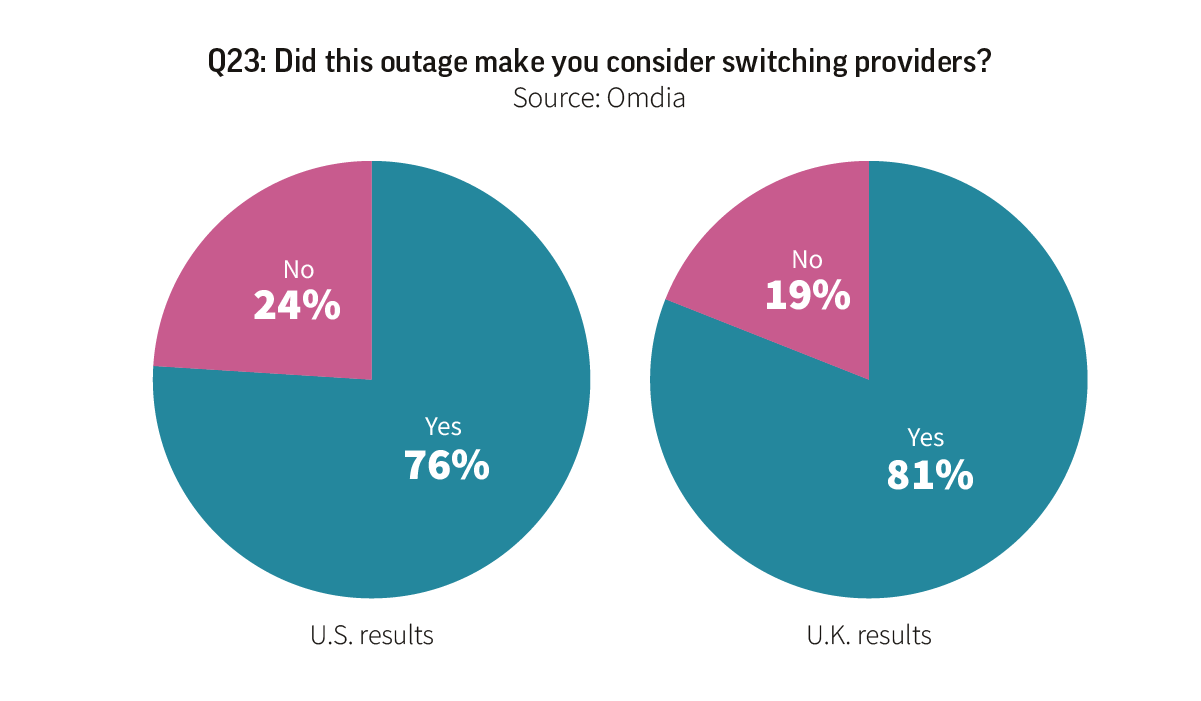
| March 19, 2024

Broadband Consumer Labels are Coming Soon, and Ookla’s Data Can Help ISPs Prepare

The internet has become a fundamental tool of daily life, serving as a key resource for consumers and businesses alike. As our reliance on connectivity continues to grow, it’s become critical for all internet users to have access to accurate and transparent information about their internet service providers (ISPs). This need for transparency has prompted the FCC to introduce its Broadband Consumer Label initiative, which will educate consumers with standardized, easy-to-understand information about the broadband services that ISPs across the United States are offering. 

Broadband Consumer Labels are similar in appearance to the nutrition labels affixed to nearly every product at the grocery store, with both types of labels providing consumers with key information–and transparency–about the products they’re buying. ISPs will soon be required to display their own version of “nutrition labels” at the point of sale, including in marketing materials and on provider websites. Broadband Consumer Labels, which must be machine-readable, are required to disclose several key service attributes, such as the typical download and upload speeds associated with a plan, the typical latency users can expect, as well as pricing and other information. Specifically, ISPs are required to display the following information on Broadband Consumer Labels: 

  • Plan name/tier
  • Monthly pricing information, including one-time charges, early termination fees, introductory discounts, and bundled services
  • Whether or not an ISP participates in the Affordable Connectivity Program (ACP), though this could change if the ACP program isn’t extended 
  • Performance metrics, including typical download and upload speed, as well as typical latency
  • Data cap information
  • Links to ISP policy information 
  • Customer support contact information
  • FCC reference ID (a unique identifier supplied by the FCC), as well as a link to the FCC’s consumer page

Providers with more than 100,000 subscribers are required to display Broadband Consumer Labels by April 10, 2024, while all other providers have until October 10, 2024. 

screenshot of navigating FCC broadband label requirements from webinar

For a more detailed breakdown of the risks, challenges, and importance of these labels, watch our webinar: Navigating FCC Broadband Label Requirements.

The benefit to consumers is clear: transparency

Broadband Consumer Labels will provide consumers with much-needed transparency into the level of service they can expect when choosing an ISP. By organizing performance and pricing details in a simple, repeatable format, users can be sure they’re getting what they pay for, and they can compare different providers and plans more easily. The benefits to providers, meanwhile, largely comes in the form of increased consumer trust, confidence, and ultimately, brand loyalty. The labels will also provide ISPs with a medium to promote their offerings to users across the country.

image of FCC broadband consumer label

Broadband Consumer Label risks & challenges

On the other hand, the introduction and continued maintenance of broadband labels marks a sea change for the telco industry at large. The more pricing tiers and technologies that exist across multiple markets, the more unique labels will need to be published. For example, one provider’s label in Seattle could be different from the same provider’s label in nearby Tacoma in terms of price, plan tiers, speeds, and more. It will be a behemoth effort for many ISPs to create and update labels, and internet providers will undoubtedly face challenges. Providers not only need to adhere to the FCC’s guidelines in relatively short order, but labels must also be updated every six months, as well any time an ISP modifies an existing plan or introduces a new one. 

Providers also face both regulatory and commercial risks with the new labels. Some of those risks and challenges include: 

Regulatory Risks:

  • Although the program begins in April, the rules are subject to change as the FCC is still requesting input from key stakeholders.
  • Latency is considered particularly important for people who use video conferencing, including those with disabilities.
  • The FCC has yet to define what “typical” means in the context of speeds and latency. 
  • Consumer advocacy groups believe many subscribers are not getting what they pay for.
  • Expect FCC enforcement mechanisms to be developed for situations in which the information displayed on labels doesn’t match with the real-world user experience. 

Commercial Risks

  • Competition will have broad visibility into performance claims for every plan a provider offers. 
  • Administrative overhead for ISPs driven by the number of price plans, markets, technologies, etc.
  • Existing subscriber misconceptions of service experienced compared to the actual service delivered.
  • Resellers must provide performance metrics even though they have limited control over quality of service (QoS) metrics.
  • Consumer advocacy groups and consumers pose a legal risk for providers if information on labels isn’t reflected in reality. 

How Ookla can help ISPs with the broadband label revolution 

With deadlines for providers right around the corner, it’s critical for ISPs to coordinate across IT, marketing, legal, and regulatory teams to determine the number of labels needed for various regions, price points, performance metrics, and more. Two label requirements that may prove particularly difficult for providers to manage are the typical speed and latency performance metrics in a given area. 

While the FCC hasn’t yet defined what “typical” means for performance metrics on broadband labels, providers could find it difficult to both determine and validate those metrics because the real-world speeds experienced by consumers often differ from a provider’s advertised speeds, and it can also be difficult to distinguish real-world performance between different technologies or tiers of service, such as fiber or cable. 

That’s where Ookla can help. Ookla receives over 11 million consumer-initiated Speedtests per day from all over the world, with over 50 billion total tests taken to date. Ookla’s detailed data and insights on speed, latency, and a host of other metrics can help Internet Service Providers substantiate typical speed or latency claims, ensuring their subscribers know what to expect and ultimately get what they pay for. 

Three Ookla solutions that should be particularly helpful in both the rollout and maintenance of broadband labels are Speedtest Embedded™, Speedtest Custom™, and the Ookla Enrichment API™. 

  • Speedtest Embedded allows Speedtest to be integrated as a testing solution on servers and desktops, as well as CPE devices. Ookla captures millions of these CPE tests every day on consumer gateways, Wi-Fi routers, and set-top boxes, providing ISPs with measurements directly from or very near to the service connection. 
  • Speedtest Custom provides users with accurate network performance testing backed by the same trusted testing engine as Speedtest, helping ISPs and their customers understand their connected experiences with performance metrics including download, upload, latency, and jitter.  
  • Ookla Enrichment API lets ISPs link a given test to a specific plan subscription, allowing providers to enrich test data with subscriber tiers/provisioned speeds, technology types, whether a test was conducted in a residential or commercial area, and more. Please reach out to learn more about the Ookla Enrichment API.

Conclusion 

As we navigate the quickly approaching deadlines of April and October 2024 for the implementation of Broadband Consumer Labels, the urgency for ISPs to adapt cannot be overstated. These labels should add a new level of transparency and trust within the telecommunications sector, offering consumers and businesses clear, standardized information about broadband services. 

However, the path to compliance won’t be easy. ISPs must navigate complex logistical and data management hurdles to produce and maintain these labels accurately. Each label must reflect specific service characteristics relevant to the geographic location it serves, which will require a granular level of detail and regular updates (every six months) to ensure accuracy. What’s more, regulatory uncertainties and the dynamic nature of broadband services can add layers of additional complexity to this endeavor. The FCC will likely offer some latitude on implementation during the first several months, but ISPs should prepare to contend with eventual enforcement of the rules. Perhaps more immediate is the potential for challenges from aggressive public interest groups and impassioned subscribers. 

Ookla is here to help! With an unmatched depth and breadth of connectivity data derived from millions of consumer-initiated Speedtests taken daily, Ookla’s solutions can help ISPs streamline the process of substantiating the claims made on these new broadband labels. With Speedtest Embedded, Speedtest Custom, and the Ookla Enrichment API, ISPs can access real-time insights into network performance, customer experience, and other critical metrics. 

These tools are instrumental in validating the typical speed and latency performance information required on broadband labels, ensuring that ISPs can meet FCC guidelines with confidence and precision. Contact us to learn more. 

Ookla retains ownership of this article including all of the intellectual property rights, data, content graphs and analysis. This article may not be quoted, reproduced, distributed or published for any commercial purpose without prior consent. Members of the press and others using the findings in this article for non-commercial purposes are welcome to publicly share and link to report information with attribution to Ookla.