| October 6, 2020

Announcing Ookla Open Datasets

Our mission at Ookla® is to help make the internet better, faster and more accessible for everyone. For over 14 years, Speedtest has helped consumers ensure they’re getting what they pay for from their internet service provider (ISP) and mobile network operator. In turn, providers and operators use Speedtest Intelligence® data to monitor competitors and optimize their own networks for reliability and performance. We also make our data available on a complimentary basis to policy makers, humanitarian organizations, academic research institutions, journalists and consumers. Today we are launching Ookla Open Datasets under the Ookla for GoodTM program to make this critical data accessible to others who are trying to improve the state of networks worldwide.

While the world’s evolving internet infrastructure has improved our access to entertainment in the form of video streaming and competitive gaming, the global COVID-19 pandemic has highlighted the importance of the internet’s role in providing essential services and opportunities. Those with high-speed internet access are able to work safely, have access to more remote job opportunities, attend remote classes and seek basic healthcare — all from the safety and comfort of home. Both rural and economically depressed urban communities face challenges due to a lack of connectivity and often require government and nonprofit grants to become adequately “served.” We hope that Ookla Open Datasets will give consumers, journalists, regulators, local governments and other organizations the tools they need to bridge this digital divide.

About the datasets

Every month, people use Speedtest hundreds of millions of times to check the speed of their internet connections. In order to create a manageable dataset out of this vast amount of network performance data, we’ve aggregated raw Speedtest performance results into tiles. Using Web Mercator projection, the de facto standard for web mapping applications, the size of these data tiles varies depending on latitude, but tile sizes can be calculated in square meters. The average download speed, upload speed, and latency for each tile are provided. Data is partitioned based on whether the test was taken over a mobile (cellular) connection or a fixed (including Wi-Fi) connection, based on one quarter’s worth of tests. Results are then updated quarterly.

The Global Fixed Broadband and Mobile Network Maps dataset is available via the Registry of Open Data on AWS in Apache Parquet and Shapefile formats. Data scientists, GIS analysts, internet enthusiasts, researchers and policymakers may use this data free of charge under the Creative Commons license for non-commercial use.

Today’s release includes fixed and mobile performance tiles for Q1, Q2 and Q3 2020. Technical documentation and tutorials are available here. Our team is already using this data to build exciting tools and visualizations to help identify areas in need. For example, the below map of underserved areas near Oklahoma City, Oklahoma shows policymakers granular, detailed information about where network speeds need improvement.

Ookla_Oklahoma-City_download-speed-over-fixed-broadband_1020-1
We look forward to seeing how you use Ookla’s open data to help make the internet better, faster and more accessible for everyone. Please tag us if you share your projects on social media using the hashtag #OoklaForGood so we can geek out with you.

Ookla retains ownership of this article including all of the intellectual property rights, data, content graphs and analysis. This article may not be quoted, reproduced, distributed or published for any commercial purpose without prior consent. Members of the press and others using the findings in this article for non-commercial purposes are welcome to publicly share and link to report information with attribution to Ookla.

| June 30, 2020

Introducing the Speedtest Web SDK

Our mission at Ookla® is to make the internet better, faster and more accessible for everyone. To that end, we continuously look for ways to help internet service providers and mobile network operators diagnose customer issues and make network improvements. Today, we’re excited to announce a new way for network providers to integrate Speedtest® directly into your websites and web-based customer care solutions. The Speedtest Web SDK™ helps you understand how network performance and quality of service impact the consumer experience, so you can provide better, more informed customer care.

The Speedtest brand is already trusted by hundreds of millions of consumers worldwide as a source for accurate, unbiased network testing. With the Speedtest Web SDK, network operators can now integrate this same robust, accurate testing experience into their web solutions, with complete control over the user interface.

Built on Speedtest’s industry-standard testing engine and methodology

Built in Javascript, this software development kit allows you to install Speedtest as the testing solution on your website. You can build the user interface to your exact specifications and configure individual test stages including download, upload and ping.

With the ability to test against your own servers, you can diagnose and troubleshoot individual customer problems, down to the last mile of a network connection. Optionally, the Speedtest Server Network™ can be accessed for testing your customers’ network performance.

Complete network diagnostics, with flexible data and reporting options

The Speedtest Web SDK provides results for download speed, upload speed and latency (ping and jitter). Data is available directly inside your application at the time of the test, ready to drive dynamic content and actionable insights to customers. The data can be delivered to your data warehouse either as a CSV extract or via a real-time JSON feed, which may be integrated into a customer experience management or CRM platform for customer care use.

The Ookla team offers support throughout the SDK implementation process, providing onboarding and assistance with test server implementation. Licensing the Speedtest SDK includes ongoing maintenance updates and technical support in addition to technical documentation, test methodology documentation and FAQs.

How providers use the Speedtest Web SDK

With the Speedtest SDK, you can collect rich data that can be used to help:

  • Predict and prevent customer churn
  • Plan and validate network improvements
  • Diagnose and troubleshoot individual customer problems
  • Prevent expensive service truck rolls
  • Ensure regulatory compliance

Whether improving an individual consumer’s call with customer care or analyzing trends in network performance, you can use Speedtest data to resolve issues impacting customer experience and save money on field support costs.

The Speedtest Web SDK makes it easy for network providers to offer a world-class network testing experience in your own solutions, backed by the Speedtest brand that consumers know and trust. Interested in other ways to provide Speedtest to your customers? We will be launching the Speedtest Mobile SDK™ later in 2020 so clients can integrate Speedtest into their mobile applications.

To learn more, inquire about the SDK today.

Ookla retains ownership of this article including all of the intellectual property rights, data, content graphs and analysis. This article may not be quoted, reproduced, distributed or published for any commercial purpose without prior consent. Members of the press and others using the findings in this article for non-commercial purposes are welcome to publicly share and link to report information with attribution to Ookla.

| November 2, 2020

How to Improve In-Building Network Performance and Coverage with Crowdsourced Data (White Paper)

With much of the world still sheltering in place, most mobile network operators have been tasked with supporting additional demand from customers who are increasingly reliant on their networks for access to work, education and entertainment. RAN engineering teams are tasked with increasing capacity and improving service — while working within budgets that may be much tighter than in previous years.

In this white paper, you’ll learn how to use crowdsourced network performance data from Cell Analytics™ to prioritize the network improvements that have the most impact on your customers. By looking at where users are connecting but receiving poor service, you can discover and prioritize the best places to improve performance and coverage, benchmark your network metrics against competitors and monitor their 5G rollouts. Download the full white paper here.

Prioritizing locations with high user density but poor performance

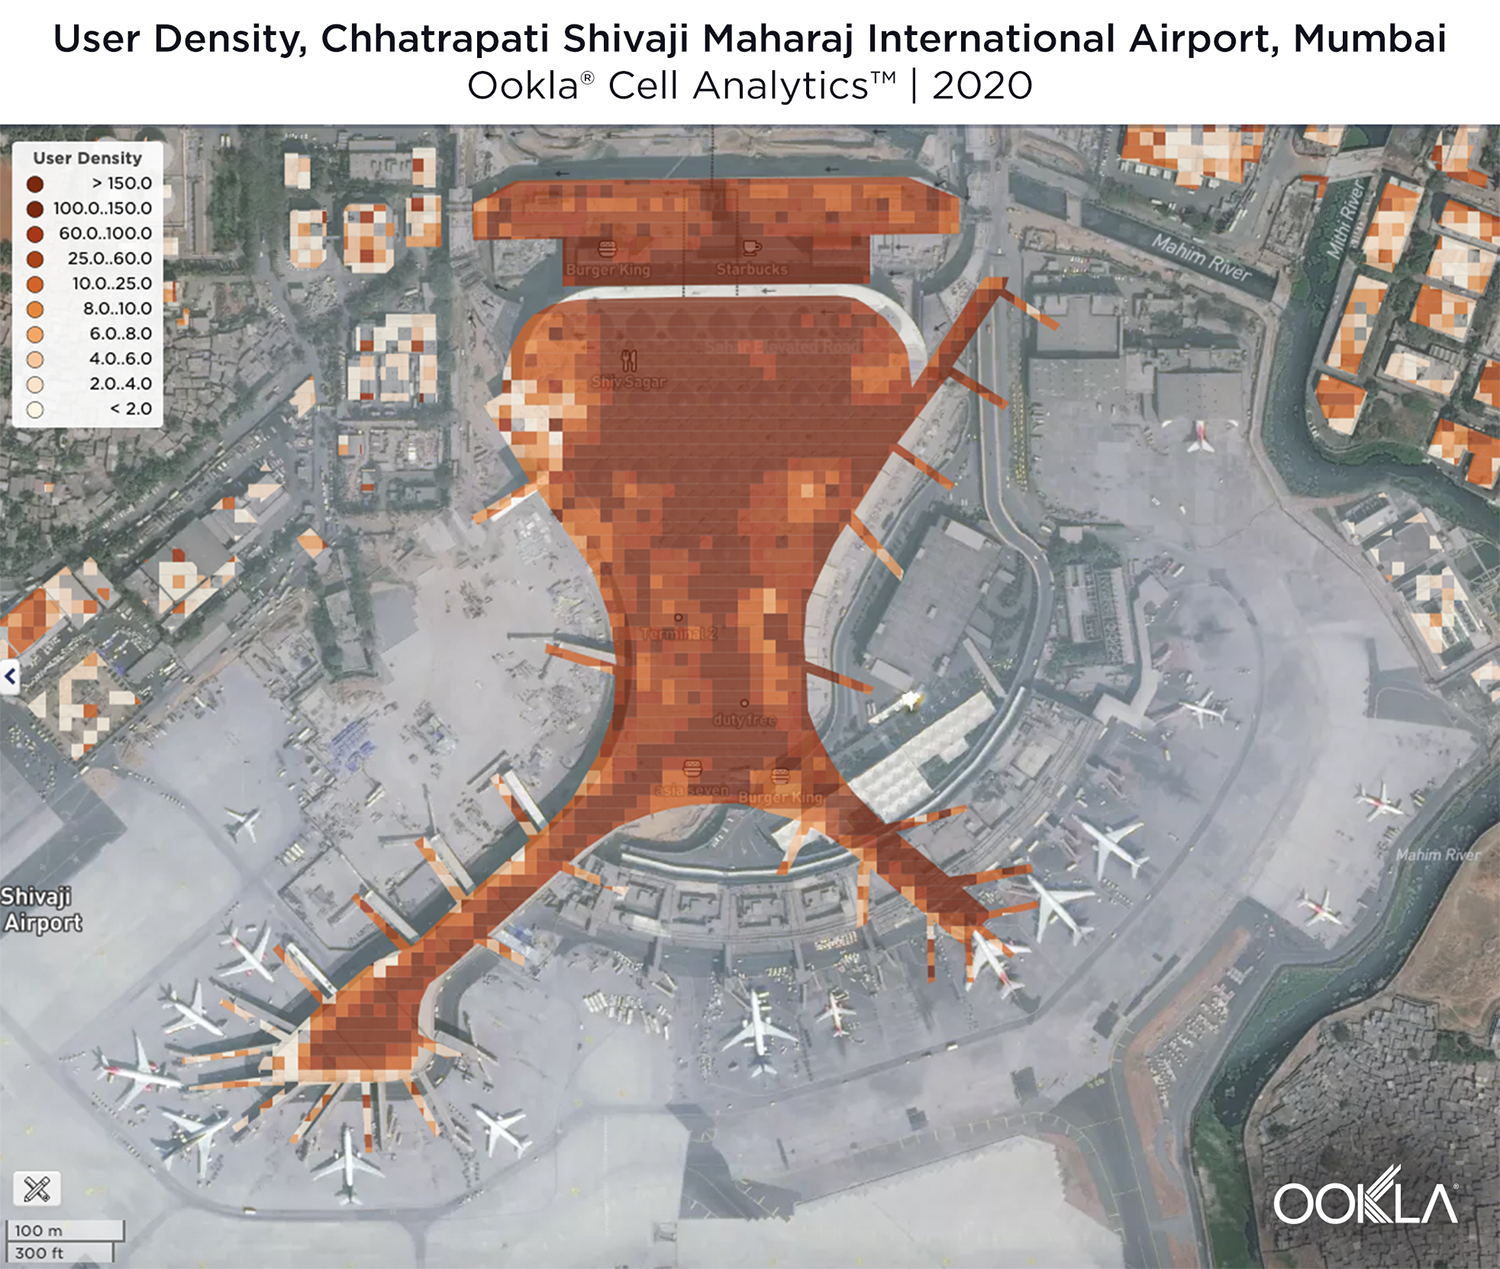
Poor wireless service in a popular location like a shopping center, office park or transit center can impact a wireless customer’s satisfaction and an operator’s reputation. Cell Analytics helps you identify hotspots with a high concentration of users where your customers are experiencing poor performance and coverage.

Cell-Analytics_User-Density_Mumbai-1

The above image shows very high user density in Mumbai’s airport. In the white paper, we show how to prioritize optimization by user density and mobile data usage, then drill down into metrics like RSRQ (signal quality) and LTE most frequent band, to discover which band is showing the most issues for a given operator. From there, we can look at the operator’s LTE most frequent cell to pinpoint the exact cell site causing the issues, and make specific recommendations to improve their customers’ network experience at the airport — without spending excessive additional funds.

Discover where competitors have better in-building performance and coverage to prioritize infrastructure investments

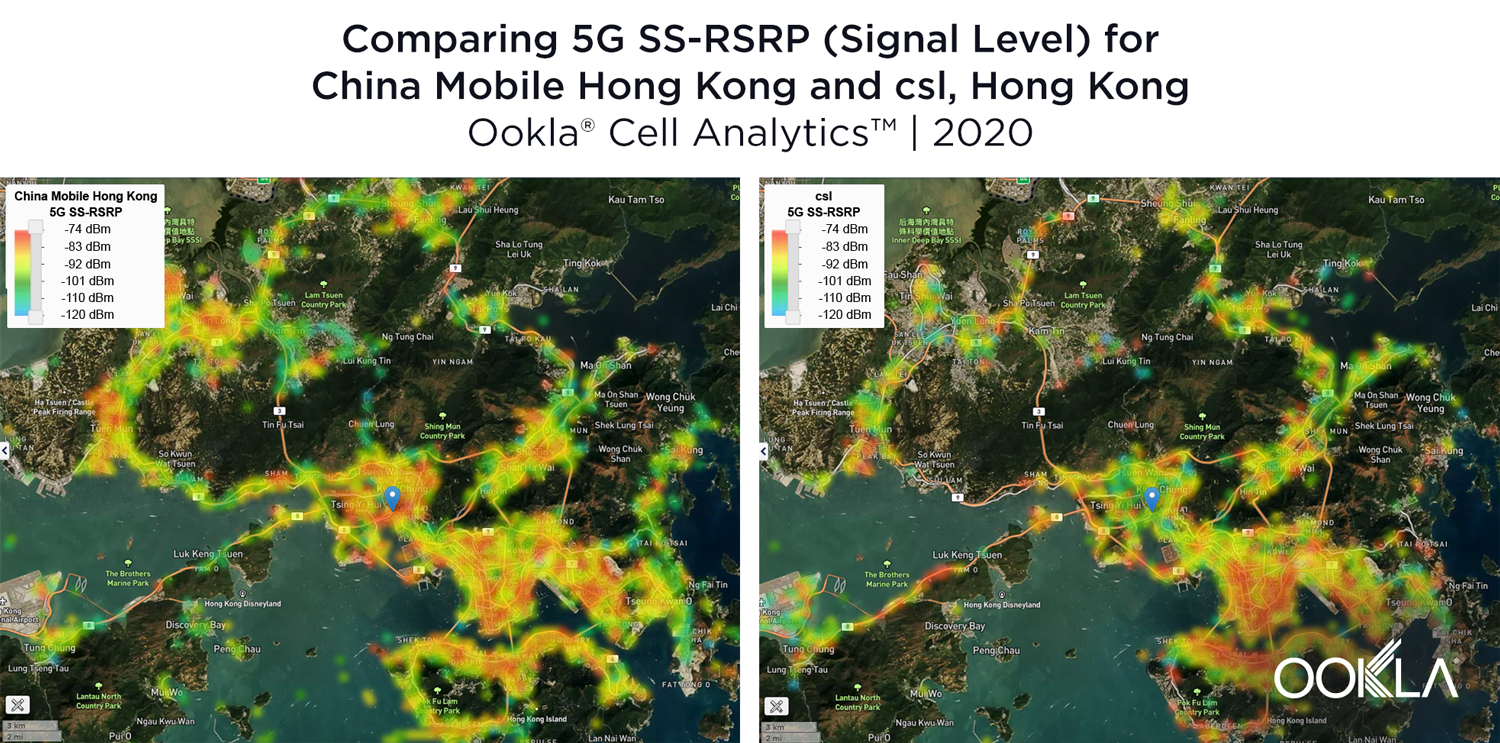
Knowing where your competitors outperform your network can help you prioritize your investments and improvements. Beyond analyzing an existing network to find areas of competitive weakness or strength, operators can also monitor the status of 5G rollouts.

Cell-Analytics_5G-SS-RSRP_Hong-Kong2

The above image compares 5G SS-RSRP (signal level) for two network operators in Hong Kong, showing variable coverage between providers. In the white paper we show how network operators can use this crowdsourced data to benchmark 5G network performance and coverage and to discover areas to prioritize for optimization.

Use 3D views to analyze performance in tall buildings, find problem cell sites and identify needed capacity expansion

Performance and quality of a network can vary dramatically in tall buildings. In densely populated cities with many tall buildings, detailed in-building analysis can show where performance is suffering by height, down to individual floor groups. A customer may have a variable experience on your network, depending on where they are located in a given building — which can make a critical difference in a populous office high-rise or on the ground floor of a hospital. Using the 3D “z-axis” view in Cell Analytics, you can see where optimization is needed to accommodate for variable performance in important buildings.

Cell-Analytics_3D-LTE-RSRP_Hong-Kong2

In the above image of Kwong Wah Hospital in Hong Kong, we can see that, while LTE signal level is sufficient for acceptable service within all levels of the building, RF quality gets progressively worse in the upper floors of the hospital. The white paper explores potential issues with nearby cells to help the operator find a solution that offers their customers good network quality, no matter where they are located within the hospital.

In this report, we walk through seven in-depth use cases where RAN engineering teams can use Cell Analytics data to prioritize engineering efforts and make no-cost or low-cost improvements to the network. The white paper also includes information on benchmarking 5G metrics and monitoring competitors’ new deployments.

Download the full whitepaper to learn how to use crowdsourced data to prioritize the network improvements that have the most impact on your customers.

Ookla retains ownership of this article including all of the intellectual property rights, data, content graphs and analysis. This article may not be quoted, reproduced, distributed or published for any commercial purpose without prior consent. Members of the press and others using the findings in this article for non-commercial purposes are welcome to publicly share and link to report information with attribution to Ookla.

| January 28, 2021

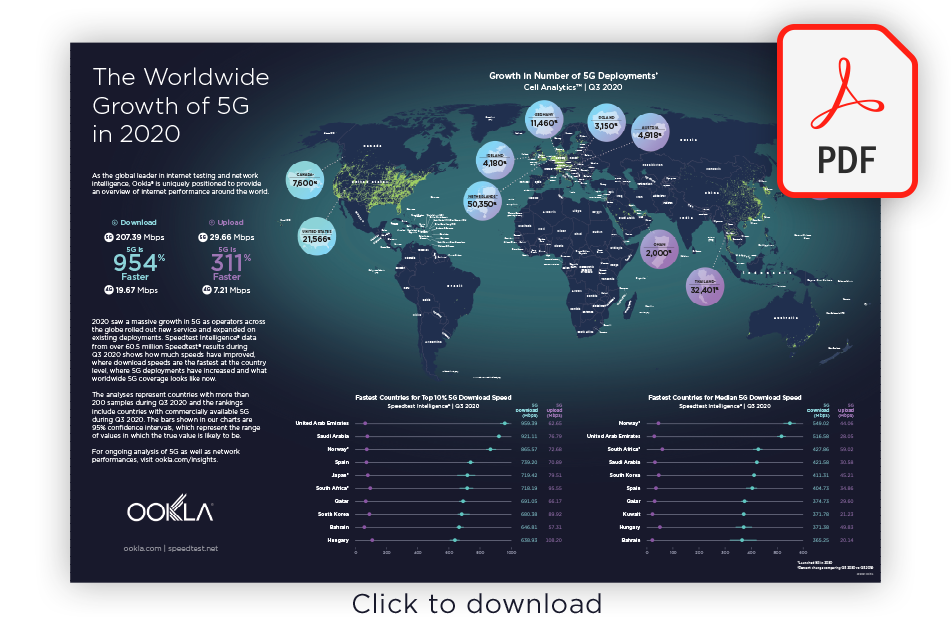
Illustrating the Worldwide Growth of 5G (Poster Download)


We’ve already written extensively about the massive increase in 5G in 2020. Still, the impact of 5G on network performance is easier to understand when you can see it illustrated at a global scale. We’ve used data from Speedtest Intelligence® to create a downloadable poster that celebrates the industry achievements of 2020.

pdf-download

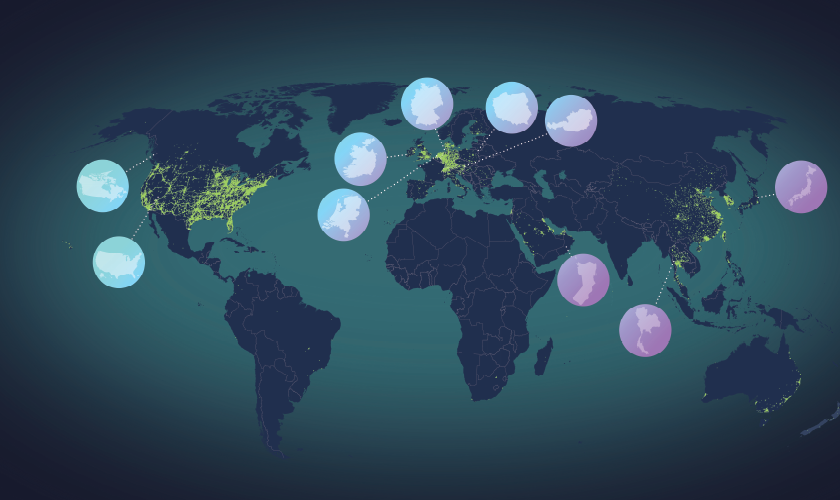
This poster maps 5G coverage, highlights the countries with the fastest 5G and illustrates the countries with the most 5G deployments, all as of Q3 2020. Download the Worldwide Growth of 5G poster from Ookla® here to see the full picture of 5G performance, coverage and deployments. It works as a desktop background or you can hang it on your wall.

Congratulations on a banner year in 5G, and cheers to even more improvements in 2021!

Ookla retains ownership of this article including all of the intellectual property rights, data, content graphs and analysis. This article may not be quoted, reproduced, distributed or published for any commercial purpose without prior consent. Members of the press and others using the findings in this article for non-commercial purposes are welcome to publicly share and link to report information with attribution to Ookla.

| February 2, 2021

Using Crowdsourced Data for Competitive Network Intelligence in Latin America [Webinar]

Leer en español / Ler em Português

Mobile network operators in most markets worldwide are competing for the loyalty of a finite number of customers — and the winner is usually the network with the best coverage and performance. Competitive network intelligence drawn from hundreds of millions of real-world network measurements can show operators where competitors’ networks are outpacing their own.

In the upcoming Ookla® webinar, offered in both Portuguese and Spanish, we share how mobile operators in Latin America can monitor and benchmark their competitors’ performance and also prioritize network optimization in the areas most important to their customers. Read on to learn how crowdsourced data from Cell AnalyticsTM can give you an unprecedented view into competitor networks — and don’t miss the webinar.

pr-cta1
Wednesday, February 24 at 11 a.m. BRT

es-cta1
Thursday, February 25 at 9 a.m. CST (10 a.m. EST/PET/COT)

Track competitor launches, including new cell site deployments, frequencies and technologies

Cell Analytics gives operators an unprecedented view into competitor networks, including their cell site locations, most used frequencies and in-depth metrics about network performance, quality and coverage (including 5G). Using this information, you can prioritize your own new deployments and network improvements in areas where competitors have invested, as well as areas with a high density of users on all networks.

Assess network quality after reconfiguring a site or changing RAN vendors

When you reconfigure a cell site, change RAN providers, refarm old spectrum for new network technologies or make any other updates to your network, it’s important to measure the outcomes of these changes. Cell Analytics data can help you assess and compare the quality of your network (or competitors’ networks) before and after any changes are made.

Prioritize network optimizations based on user density and network congestion

In areas with high user density, not all operators are equipped to handle the demand of heavily traveled locations such as airports, large sporting venues, popular office parks and transit centers. Cell Analytics can help you identify locations — including tall buildings — where your competitors have better coverage and prioritize improvements based on network congestion and user density.

The webinar will show real-life use cases where operators in Latin America can use crowdsourced data can help prioritize network improvements. Don’t miss it. A recording will be provided for registrants who can’t tune in to the live presentation.

Cadastre-se para o webinar em Português
Regístrese para ver el seminario web en español


Cómo usar datos de colaboración abierta para la inteligencia de redes competitivas en Latinoamérica [Seminario web]

Los operadores de redes móviles en la mayor parte de los mercados del mundo compiten por la lealtad de un número finito de clientes —y el ganador suele ser la red con la mejor cobertura y el mejor rendimiento—. La inteligencia de redes competitivas obtenida de cientos de millones de mediciones de redes reales puede demostrar a los operadores en qué zonas las redes de la competencia superan a las suyas.

En el próximo seminario web de Ookla, disponible tanto en español como en portugués, le contamos cómo los operadores móviles en Latinoamérica pueden monitorear y comparar el rendimiento de sus competidores mientras priorizan la optimización de las redes que se encuentran en las zonas más importantes para sus clientes. Siga leyendo para saber cómo los datos de colaboración abierta obtenidos a través de Cell Analytics pueden brindarle una visualización sin precedentes de las redes de la competencia. Además, no se pierda nuestro seminario web.

es-cta1
Jueves 25 de febrero a las 9 a. m. CST (10 a. m. EST/PET/COT)

Rastree los lanzamientos de la competencia, incluidas las nuevas implementaciones de instalaciones celulares, frecuencias y tecnologías

Cell Analytics ofrece a los operadores una visualización sin precedentes de las redes de la competencia, incluidas las ubicaciones de sus instalaciones celulares y las frecuencias más usadas, así como métricas detalladas sobre el rendimiento, la calidad y la cobertura de la red (incluyendo las redes 5G). Con esta información, puede priorizar sus propias implementaciones nuevas y mejoras de red en zonas en las que ha invertido la competencia, así como en zonas con una alta densidad de usuarios en todas las redes.

Evalúe la calidad de la red luego de reconfigurar una instalación o cambiar de proveedor de RAN

Al reconfigurar una instalación celular, cambiar de proveedor de RAN, volver a agrupar el espectro antiguo para nuevas tecnologías de red o realizar cualquier otra actualización en su red, es importante que mida los resultados de estos cambios. Los datos de Cell Analytics pueden ayudarlo a evaluar y comparar la calidad de su red (o las redes de la competencia) antes y después de realizar cualquier cambio.

Priorice las optimizaciones de red en función de la densidad de usuarios y la congestión de las redes

En zonas con alta densidad de usuarios, no todos los operadores están equipados para manejar la demanda de ubicaciones muy transitadas, como aeropuertos, grandes centros deportivos, edificios de oficinas y centros de tránsito. Cell Analytics puede ayudarlo a identificar ubicaciones, incluyendo edificios altos, en las que sus competidores tienen una mejor cobertura y a priorizar las mejoras en función de la congestión de las redes y la densidad de usuarios.

En el seminario web le mostraremos casos de uso reales en los que operadores de Latinoamérica puede usar datos de colaboración abierta para priorizar mejoras en la red. No se lo pierda. Se proporcionará una grabación para aquellos inscritos que no puedan asistir a la presentación en vivo.

Regístrese para ver el seminario web en español


Uso de dados de crowdsourcing para inteligência competitiva de redes na América Latina [Webinar]

As operadoras de redes móveis na maioria dos mercados em todo o mundo estão competindo pela lealdade de um número finito de clientes — e, geralmente, o vencedor é aquele que oferece a melhor cobertura e o melhor desempenho. A inteligência competitiva de redes obtida a partir de centenas de milhões de medições de redes reais pode mostrar aos operadores os pontos em que as redes de concorrentes apresentam um desempenho melhor que as suas.

No webinar da Ookla que será realizado em breve e disponibilizado em Português e Espanhol, nós explicaremos como as operadoras móveis na América Latina podem monitorar e se destacar em relação ao desempenho da concorrência, além de como priorizar a otimização de redes nas áreas mais importantes para seus clientes. Continue lendo para saber como os dados obtidos a partir de crowdsourcing do Cell Analytics podem oferecer a você uma visão sem precedentes sobre as redes de concorrentes — e não perca o webinar.

pr-cta1
Quarta-feira, 24 de fevereiro às 11:00 BRT

Identifique as expansões da concorrência, incluindo 5G, novas implementações de estações rádio base, novas frequências e tecnologias

O Cell Analytics oferece às operadoras uma visão sem precedentes em relação às redes dos concorrentes, incluindo a localização de suas estações rádio base, frequências mais utilizadas e métricas aprofundadas referentes ao desempenho, à qualidade e à cobertura de suas redes (incluindo 5G). Utilizando essas informações, você poderá priorizar suas expansôes e melhorias de rede em áreas onde os concorrentes tenham investido, bem como em áreas com uma alta densidade de usuários de todas as redes.

Analise a qualidade da rede após a reconfiguração de estações ou da troca de fornecedores de RAN

Ao reconfigurar uma estação rádio base, trocar de fornecedores RAN, substituir tecnologias de rede antigas por mais atuais ou realizar qualquer atualização em sua rede, é importante medir os resultados de tais mudanças. Os dados do Cell Analytics podem ajudar a analisar e comparar a qualidade de sua rede (ou da rede dos concorrentes) antes e depois da realização de quaisquer alterações.

Priorize otimizações de rede com base na densidade de usuários e congestionamentos de rede

Em áreas com alta densidade de usuários, nem todas as operadoras possuem as ferramentas necessárias para atender à demanda de locais com alto fluxo de pessoas, como aeroportos, instalações esportivas de grande porte, grandes parques comerciais e centros de trânsito. O Cell Analytics pode ajudar a identificar os locais — incluindo edifícios — em que seus concorrentes oferecem melhor cobertura, e priorizar as melhorias com base no congestionamento da rede e na densidade de usuários.

Este webinar apresentará casos reais em que as operadoras da América Latina podem utilizar dados obtidos através de crowdsourcing para ajudar a priorizar as melhorias na rede. Não perca! Uma gravação será fornecida aos cadastrados que não puderem assistir a apresentação ao vivo.

Cadastre-se para o webinar em Português

Ookla retains ownership of this article including all of the intellectual property rights, data, content graphs and analysis. This article may not be quoted, reproduced, distributed or published for any commercial purpose without prior consent. Members of the press and others using the findings in this article for non-commercial purposes are welcome to publicly share and link to report information with attribution to Ookla.
| August 31, 2020

SpatialBuzz Joins Ookla

Ookla® has acquired SpatialBuzz, an innovative provider of enterprise telecommunications solutions that empower operators with early detection capabilities for network issues combined with real-time opportunities to directly engage with customers and ensure their satisfaction.

SpatialBuzz and Ookla share the same core goal of improving the internet experience for all people. Together, we will explore new ways to help increase consumer transparency, improve the performance and quality of networks and ensure that our enterprise clients benefit even more from Ookla solutions.

Ookla will continue to support the full portfolio of SpatialBuzz solutions. We are thrilled to welcome the SpatialBuzz team to Ookla and look forward to a shared mission moving forward.

Ookla retains ownership of this article including all of the intellectual property rights, data, content graphs and analysis. This article may not be quoted, reproduced, distributed or published for any commercial purpose without prior consent. Members of the press and others using the findings in this article for non-commercial purposes are welcome to publicly share and link to report information with attribution to Ookla.

| December 3, 2020

Prioritizing Broadband Funding to Close the Digital Divide [Webinar]

Improving broadband access is a priority for legislators and policy makers, and the shift to working and learning from home has highlighted the deep digital divide across the United States — particularly in rural areas. Congress will likely allocate more dollars to ensure that every citizen has high-speed internet access in the coming year. Federal, state and local governments need accurate data on broadband availability and network performance in order to prioritize broadband development in underserved areas. With this information, government officials can ensure that they are maximizing their dollars and serving their constituents appropriately.

The upcoming Ookla® webinar on December 16 will share how network data from Ookla Speedtest® can give you deep insights into broadband availability and performance within your jurisdiction — and help you fund development efforts in the communities that need it most. Read on to learn more about prioritizing broadband funding.


Accurately determine where constituents can (or cannot) access adequate broadband

Policymakers have historically had to rely on fixed broadband deployment data from the FCC’s Form 477 to try to understand broadband access within their jurisdictions. This data is generally at least a year old by the time it reaches the hands of a policymaker — and in 2020, the government has delayed the latest update. It is crucial to look at the most robust, comprehensive and up-to-date data available on the networks to get a clear picture of broadband speeds and understand which communities aren’t being adequately served. Millions of users in the U.S. rely on Speedtest to test the performance of their networks — and the resulting data paints an accurate picture of where users can and cannot connect with internet that meets the FCC minimum thresholds of 25 Mbps download speed and 3 Mbps upload speed.

Use crowdsourced data on network speeds and availability to prioritize broadband funding

The webinar will show how Speedtest datasets can be filtered and analyzed to determine specific locations where constituents can’t access the speeds they need for remote learning and working from home. We will discuss why precise geolocation of network speed results is critical to understanding which communities need better broadband access — and how looking at ZIP codes alone may lead to underserved communities within those very ZIP codes.

Speedtest data can help policymakers eliminate costly data collection and analysis for areas that already have adequate service by pinpointing where internet service providers (ISPs) are actually delivering services that meet or exceed the current definition of broadband. Resources can instead be allocated to areas that show a clear need for broadband infrastructure investment.

The webinar on Wednesday, December 16 at 9 a.m. Pacific (12 p.m. Eastern) will show you how to analyze, filter and understand data from Speedtest to make informed spending decisions. Don’t miss it. A recording will be provided for registrants who can’t tune in to the live presentation. Register now.

Ookla retains ownership of this article including all of the intellectual property rights, data, content graphs and analysis. This article may not be quoted, reproduced, distributed or published for any commercial purpose without prior consent. Members of the press and others using the findings in this article for non-commercial purposes are welcome to publicly share and link to report information with attribution to Ookla.

| September 15, 2020

Introducing New 3D Views of Network Performance and Coverage in Cell Analytics

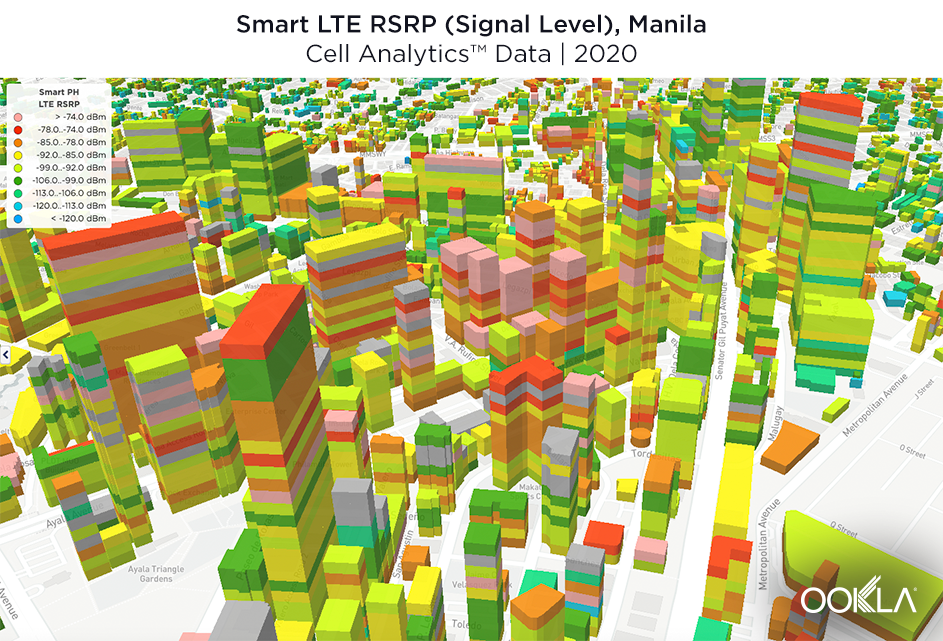
Tall buildings present a particular challenge when analyzing indoor mobile network performance and coverage, because those metrics can vary significantly by height. New 3D “z-axis” views in Cell Analytics™ from Ookla® allow mobile network operators to spot problems at specific elevations that a traditional two-dimensional view could miss.

Powered by hundreds of millions of daily performance, coverage and signal measurements from Speedtest®, Cell Analytics provides unparalleled intelligence about wireless service quality, RF measurements, data usage, indoor and outdoor user density, cell site locations and much more — surfaced in one intuitive platform. With the release of the new 3D views, operators can use this real-world data to pinpoint areas of poor mobile service, down to individual floor groups in buildings.

Network engineering and planning teams can see metrics like LTE RSRP, RSRQ, RSSNR and more, broken out vertically in 15-meter intervals. This article will explore three ways operators can use these powerful new views.

View conditions and user density by height in buildings

Cell Analytics provides data from locations that are not accessible by traditional data collection methods like drive testing and walk testing, such as private businesses and residences. The new 3D views show how any operator’s network performance, coverage and quality vary by floor groups within individual buildings, as well as user density by floor group across all operators. These views help to identify areas of high user concentration within buildings where you are also experiencing poor performance.

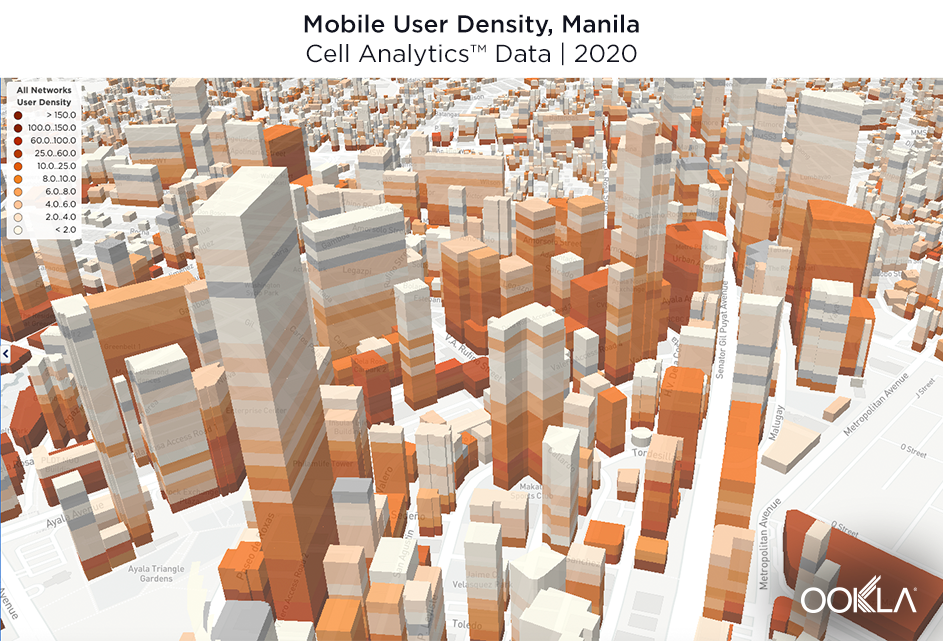
In the below example, we looked at the Smart network in Manila. By examining RF conditions in floor groups with high user counts, we can identify floor groups in individual buildings where the Smart network is providing marginal or poor coverage to a large number of users. Conversely, we can see where Smart has a competitive advantage: superior RF conditions and a large pool of potential new subscribers.

Cell_Analytics_Manila_RSRP

Cell_Analytics_Manila_User-Density

Identify which buildings are suffering poor quality on upper floors due to interference

Performance and quality of a network can vary dramatically within tall buildings. A customer may have a variable experience on your network, depending on where they are located in a given building, which can make a critical difference in a populous office high-rise or on the ground floor of a hospital. Detailed in-building analysis can show by height where performance is suffering, down to individual floor groups.

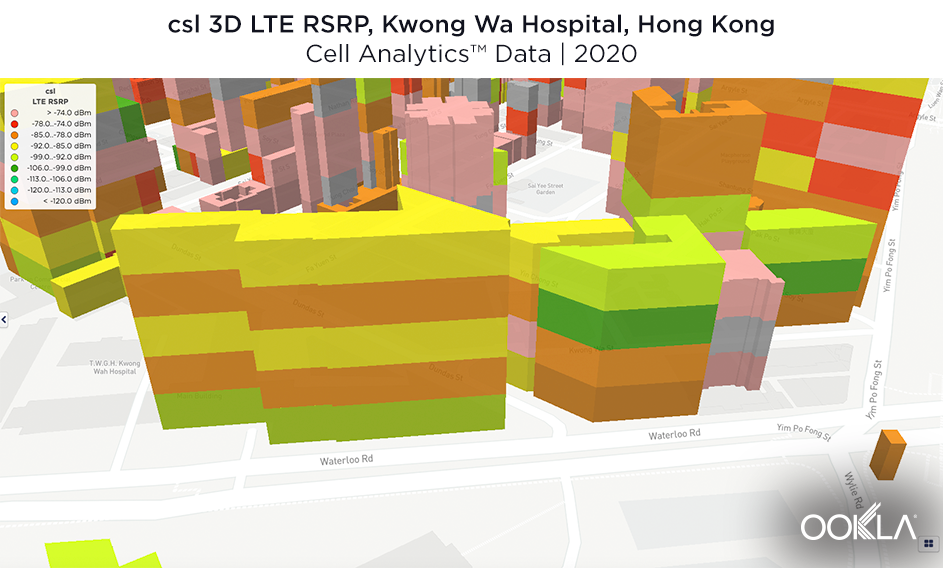
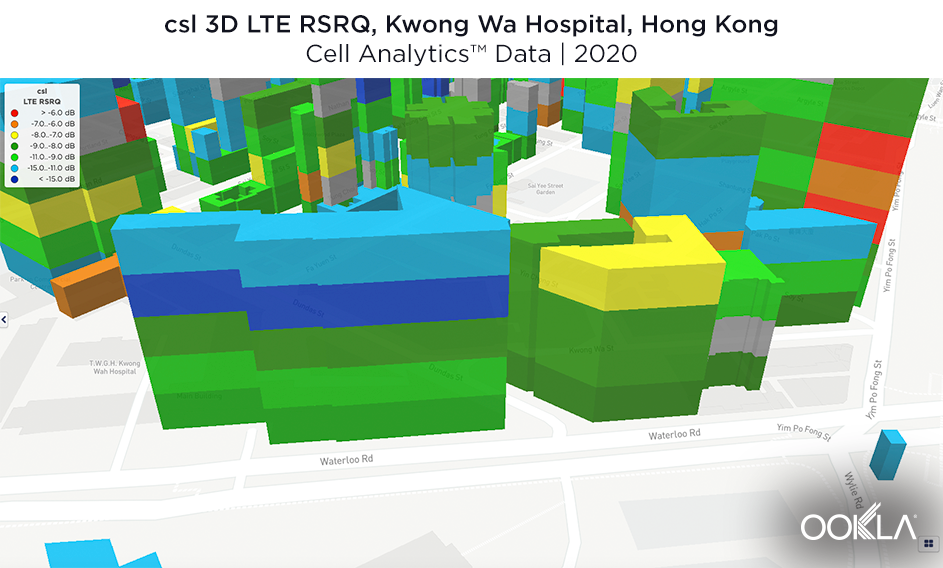
Using the 3D z-axis view in Cell Analytics, you can see where optimization is needed to accommodate for variable performance in important buildings. In the below example, we can see Kwong Wa Hospital in Hong Kong. This large, 1141-bed hospital has high user density and sees good coverage, but poor quality, on the csl network. We can also see that coverage increases with height in this building, while quality decreases. This behavior indicates interference within the building — and highlights an area where csl may want to build a new cell site or focus optimization efforts on the existing network.

Cell_Analytics_Hong-Kong_LTE-RSRP

Cell_Analytics_Hong-Kong_LTE-RSRQ_1

Identify buildings where your competitors have installed indoor systems

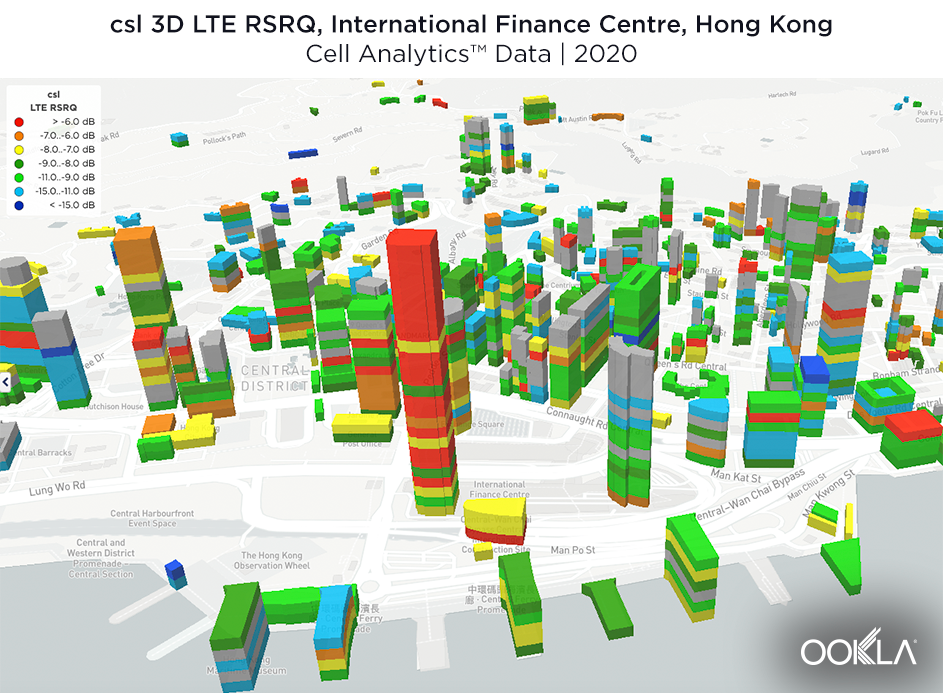
In addition to discovering areas of competitive strength and weakness, Cell Analytics z-axis views can help you discover where other operators have installed indoor systems, such as small cells or distributed antenna systems (DAS). By analyzing network performance and coverage data by floor group, you can determine the location of indoor cell sites, with high confidence.

If a tall building has excellent coverage and quality all the way through the uppermost floors, it is a likely indicator that the building contains indoor systems. Further confirmation can be provided by comparing the cell IDs serving users within and outside the building.

Cell_Analytics_Hong-Kong_LTE-RSRQ_2

The 3D views in Cell Analytics can be panned, tilted and rotated to get a full view of in-building performance and coverage. Never before has it been so easy to explore network metrics in the locations that are most important to your customers — at all elevations.

Ready to get unparalleled insights into your own and competitor networks? Request a demo of Cell Analytics today.

Ookla retains ownership of this article including all of the intellectual property rights, data, content graphs and analysis. This article may not be quoted, reproduced, distributed or published for any commercial purpose without prior consent. Members of the press and others using the findings in this article for non-commercial purposes are welcome to publicly share and link to report information with attribution to Ookla.

| February 19, 2020

Why Europe Needs a New Competition Paradigm for the 5G Era (co-published with GSMA Intelligence)

This article is being co-published with GSMA Intelligence. As the exclusive global network performance data provider to the intelligence unit of the mobile industry trade group GSMA, Ookla® supports their extensive efforts to provide data-driven insights and context on the state of the mobile industry around the world. Speedtest® data is leveraged by GSMA Intelligence analysts and experts on an ongoing basis, including within the recent "Mobile Market Structure and Performance in Europe" report.

The mobile market in Europe has come to the end of its main phase of investments in fourth generation (4G) mobile networks and operators are now turning their attention to 5G. Services have already been launched in Switzerland and the UK, and more markets expected to launch in 2020, for example Germany and France.

Despite these positive steps, industry analysts do not expect a rapid roll-out of 5G in Europe. On the contrary, most expect 5G deployments in European markets to lag behind countries such as the US, China, Korea and Japan. The reason is that delivering 5G services will require large additional investments, and these will be a lot harder to justify in European markets that have recently delivered lower profit margins than in other parts of the world.

With this largely subdued investment climate, what can be done so that Europe doesn’t lose out on the 5G opportunity? One thing that could change this is competition dynamics. More concentrated market structures (for example with less players) can deliver economies of scale, a more efficient utilization of assets (such as sites and spectrum), and also enable large investments in 5G networks. However, concentrated markets can also raise flags with regulatory and competition authorities that may be concerned about consumer prices being higher.

Understanding the relationship between market structure and the quality, innovation and prices that consumers can expect is therefore crucial. A strong debate exists about the competition dynamics that will deliver best value for consumers in the 5G era. As arguments can be made in both directions, it is important to look at data from the recent past to help draw some lessons that can inform decisions going forward.

This is precisely what GSMA Intelligence did. In a recent study, they evaluate how market structures impacted consumers during the 4G era in Europe. They looked at data covering the period from 2011 to 2018, for 29 European countries. They combined coverage and other publicly available data from operators with network-quality measurement data from Ookla®, a global leader in mobile and broadband network intelligence, testing applications and technology.

Overall, the 4G era was a positive and expansive one for European mobile consumers everywhere. Already by 2016, 90% of consumers were covered by 4G networks. Since then, operators have delivered greater speeds and lower latencies (signal delay), resulting in a far superior consumer experience today. Download speeds increased on average from 2 Mbps in 2011 to 37 Mbps in 2018. The average price per MB also dropped sharply as mobile data became cheaper and users consumed ever-increasing volumes of data, with average monthly data usage increasing more than twelve-fold.

But while all European consumers experienced improvements during the 4G era, the study shows that European mobile users in three-player markets benefited the most from higher quality and innovation.

By the end of 2018, three-player markets were outperforming four-player markets by 4.5 Mbps in download speeds, and over half of that difference (around 3.5 Mbps) can be attributed to the role of market structure in three-player markets. In particular, operators in more concentrated markets were able to utilize assets more efficiently (especially spectrum) and generate higher returns that allowed them to invest more in their networks. This is an important insight when considering the best ways to unlock the full potential of 5G networks, including advanced applications that require very low latencies, high speeds and plenty of network capacity.

Did this come at the expense of higher prices? On the basis of the pricing data that GSMA Intelligence was able to analyse, it did not. In addition to general improvements in performance, prices also decreased across Europe in the 4G era, indicating more efficiency and better value for consumers over time. Implicit unit prices (i.e. revenue per MB and revenue per user) decreased similarly in both three- and four-player markets.

In other words, during the 4G era, a European consumer in a three-player market experienced on average a better quality mobile broadband service while paying similar prices per MB of data to a consumer in a four-player market.

Does this therefore mean that more consolidation in European markets is the only solution to deliver the right investments for 5G? Not necessarily.
An option that is often touted as an alternative to full consolidation is increased network sharing. GSMA Intelligence’s analysis showed that in the 4G era, progressively deeper levels of network integration delivered improved performance, although they came short of full integration in terms of network quality. Network sharing could therefore also help promote faster deployments of high-performing 5G networks in Europe over the coming years.

Ultimately, every case and country needs to be considered on the basis of its own merits and situation. What works in one country does not necessarily work in another and operator incentives and consumer attitudes to products and services will differ from market to market.

But there is one key lesson from the 4G era that does apply to all countries equally: to support the delivery of high performing 5G networks, policymakers should fully consider all aspects of consumer welfare when assessing the relative advantages of more concentrated markets in merger control, antitrust policy and spectrum management.

Read the full report here.

Ookla retains ownership of this article including all of the intellectual property rights, data, content graphs and analysis. This article may not be quoted, reproduced, distributed or published for any commercial purpose without prior consent. Members of the press and others using the findings in this article for non-commercial purposes are welcome to publicly share and link to report information with attribution to Ookla.

| October 21, 2019

Exploring Recent Trends in the India Telecom Market

With the release of new fiber-to-the-home services and a strong push by providers to bring 4G to more parts of the country, we decided to check in and see how fixed broadband speed, mobile speed and 4G Availability have looked over the last two quarters in India.

Our analysis includes performance data from 21,096,823 consumer-initiated tests taken with Speedtest® and coverage data from over 2.5 billion coverage scans on 2,436,758 devices during Q2-Q3 2019.

For the first time ever we are also making available for download a detailed report on performance by operator including an in-depth look at peak time performance. Download the full report.

Mobile and fixed speeds are increasing at the country level

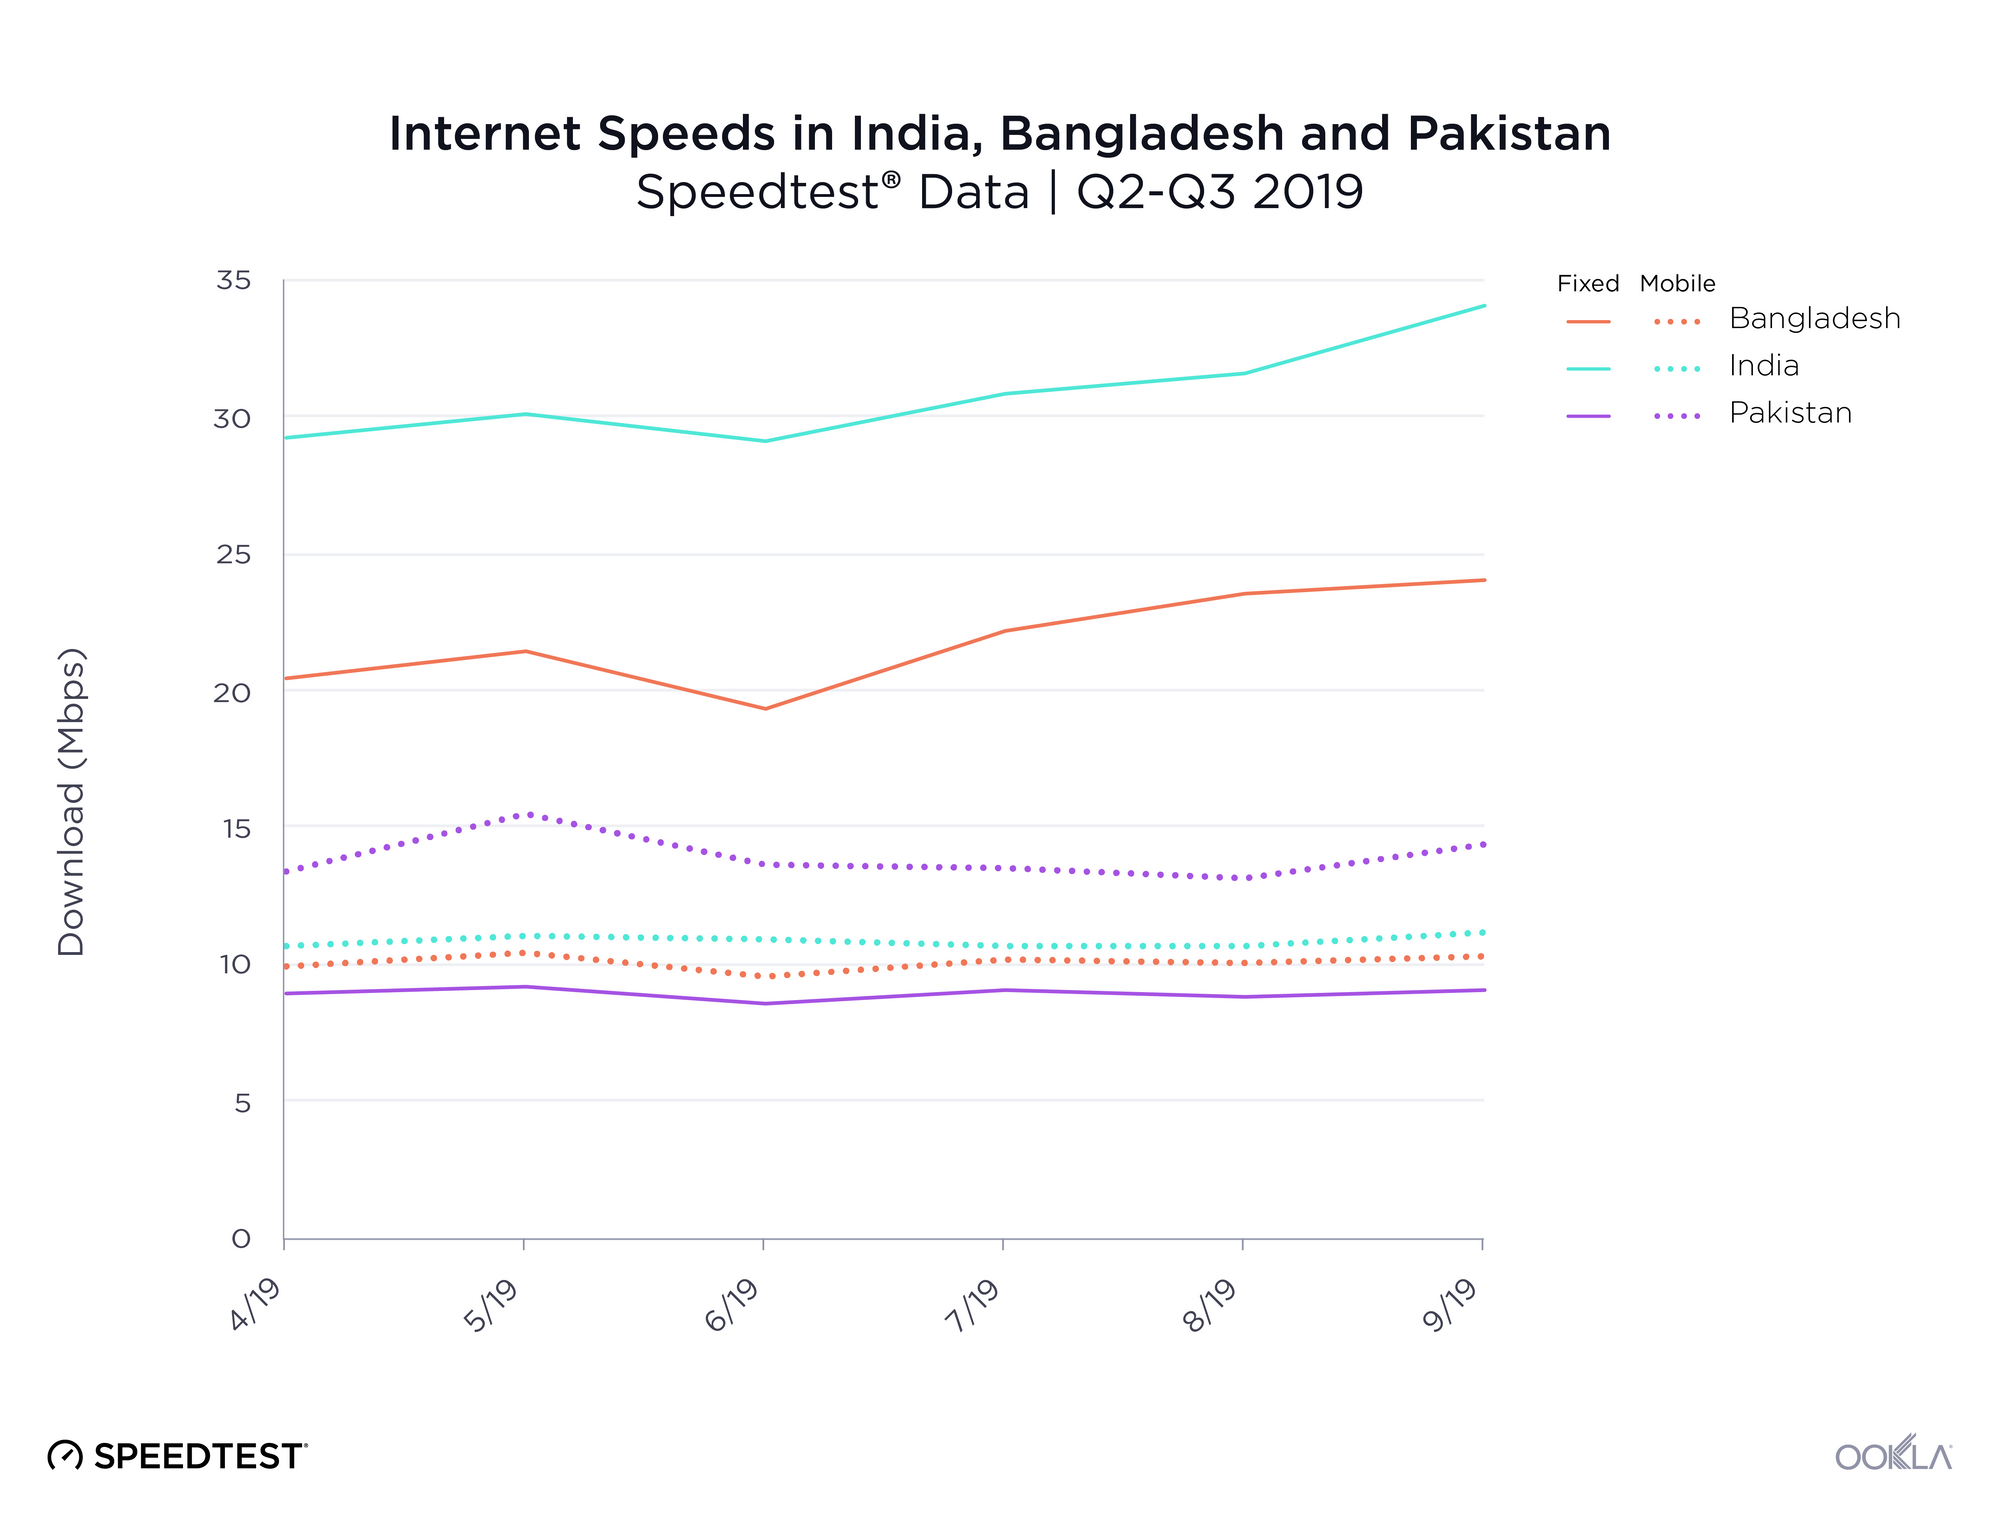
India-Mobile-Fixed-Speeds-in-Largest-Markets--1-
Mean fixed broadband download speeds in India rose 16.5% during Q2-Q3 2019 and topped 34.07 Mbps in September. Compared to Bangladesh, which saw a similar rate of improvement but lower speeds at 24.02 Mbps, and Pakistan, where speeds stayed relatively flat between 8.54 and 9.14 Mbps, India is the regional leader in mean download speed.

With Reliance Jio’s rollout of its new GigaFiber service in India in early September, we will likely continue to see country-wide speeds increase. (Download the full report to compare Jio’s monthly fixed download speeds before and after the launch of GigaFiber.)

However, mobile download speeds were relatively flat in India, fluctuating between 10.63 Mbps and 11.18 Mbps during Q2-Q3 2019. Regionally, India’s mobile performance is marginally faster than Bangladesh’s, which saw average speeds max out at 10.43 Mbps, and somewhat slower than Pakistan’s top speeds of 15.55 Mbps.

4G Availability continues to improve in India

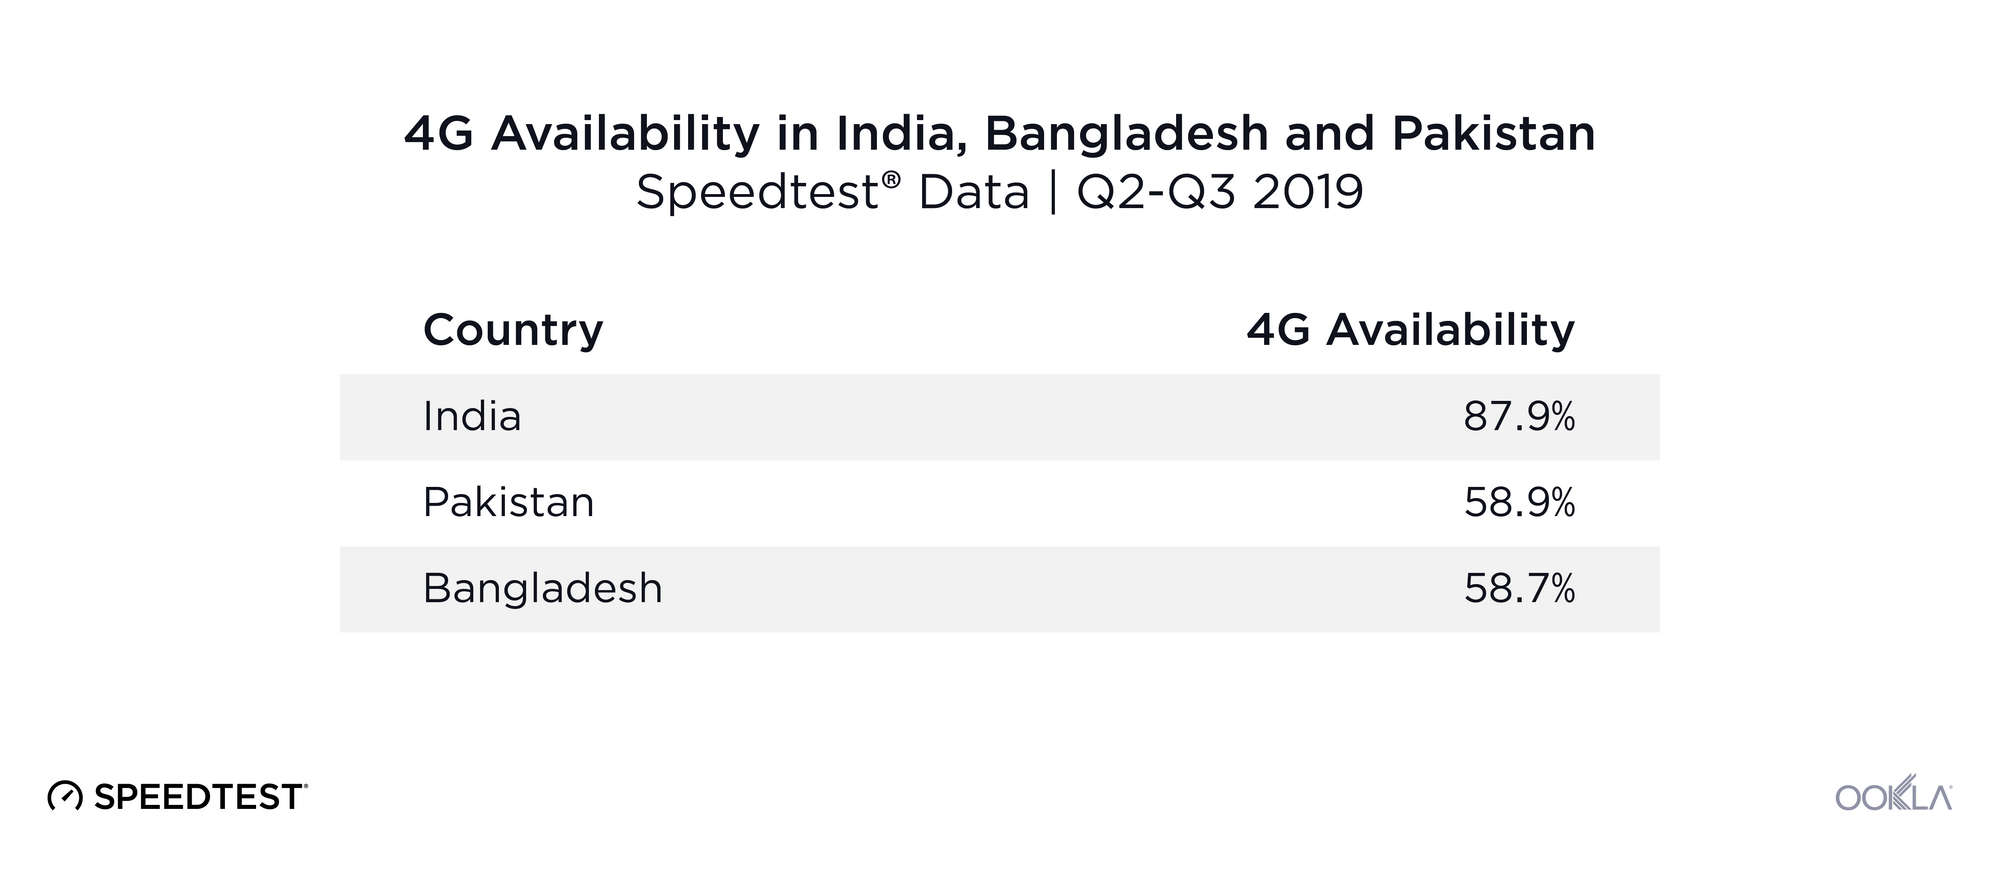
India’s mobile providers are still trying to provide consistent 4G coverage across the country. We compared coverage data for over 231,274,713 samples from Speedtest Android users across Indian mobile operators in Q2-Q3 2019 to benchmark India’s 4G Availability against other markets in the region.

India-4G-Availability-by-Country

4G Availability is the percentage of an operator’s known locations where a device has access to LTE service (including roaming). India’s 4G Availability was relatively high at 87.9% across providers during Q2-Q3 2019. That means that Speedtest users had access to LTE service at 87.9% of surveyed locations. For comparison, 4G Availability was 58.9% in Pakistan and 58.7% in Bangladesh during the same period.

Fixed broadband speeds show wide disparities between India’s largest cities

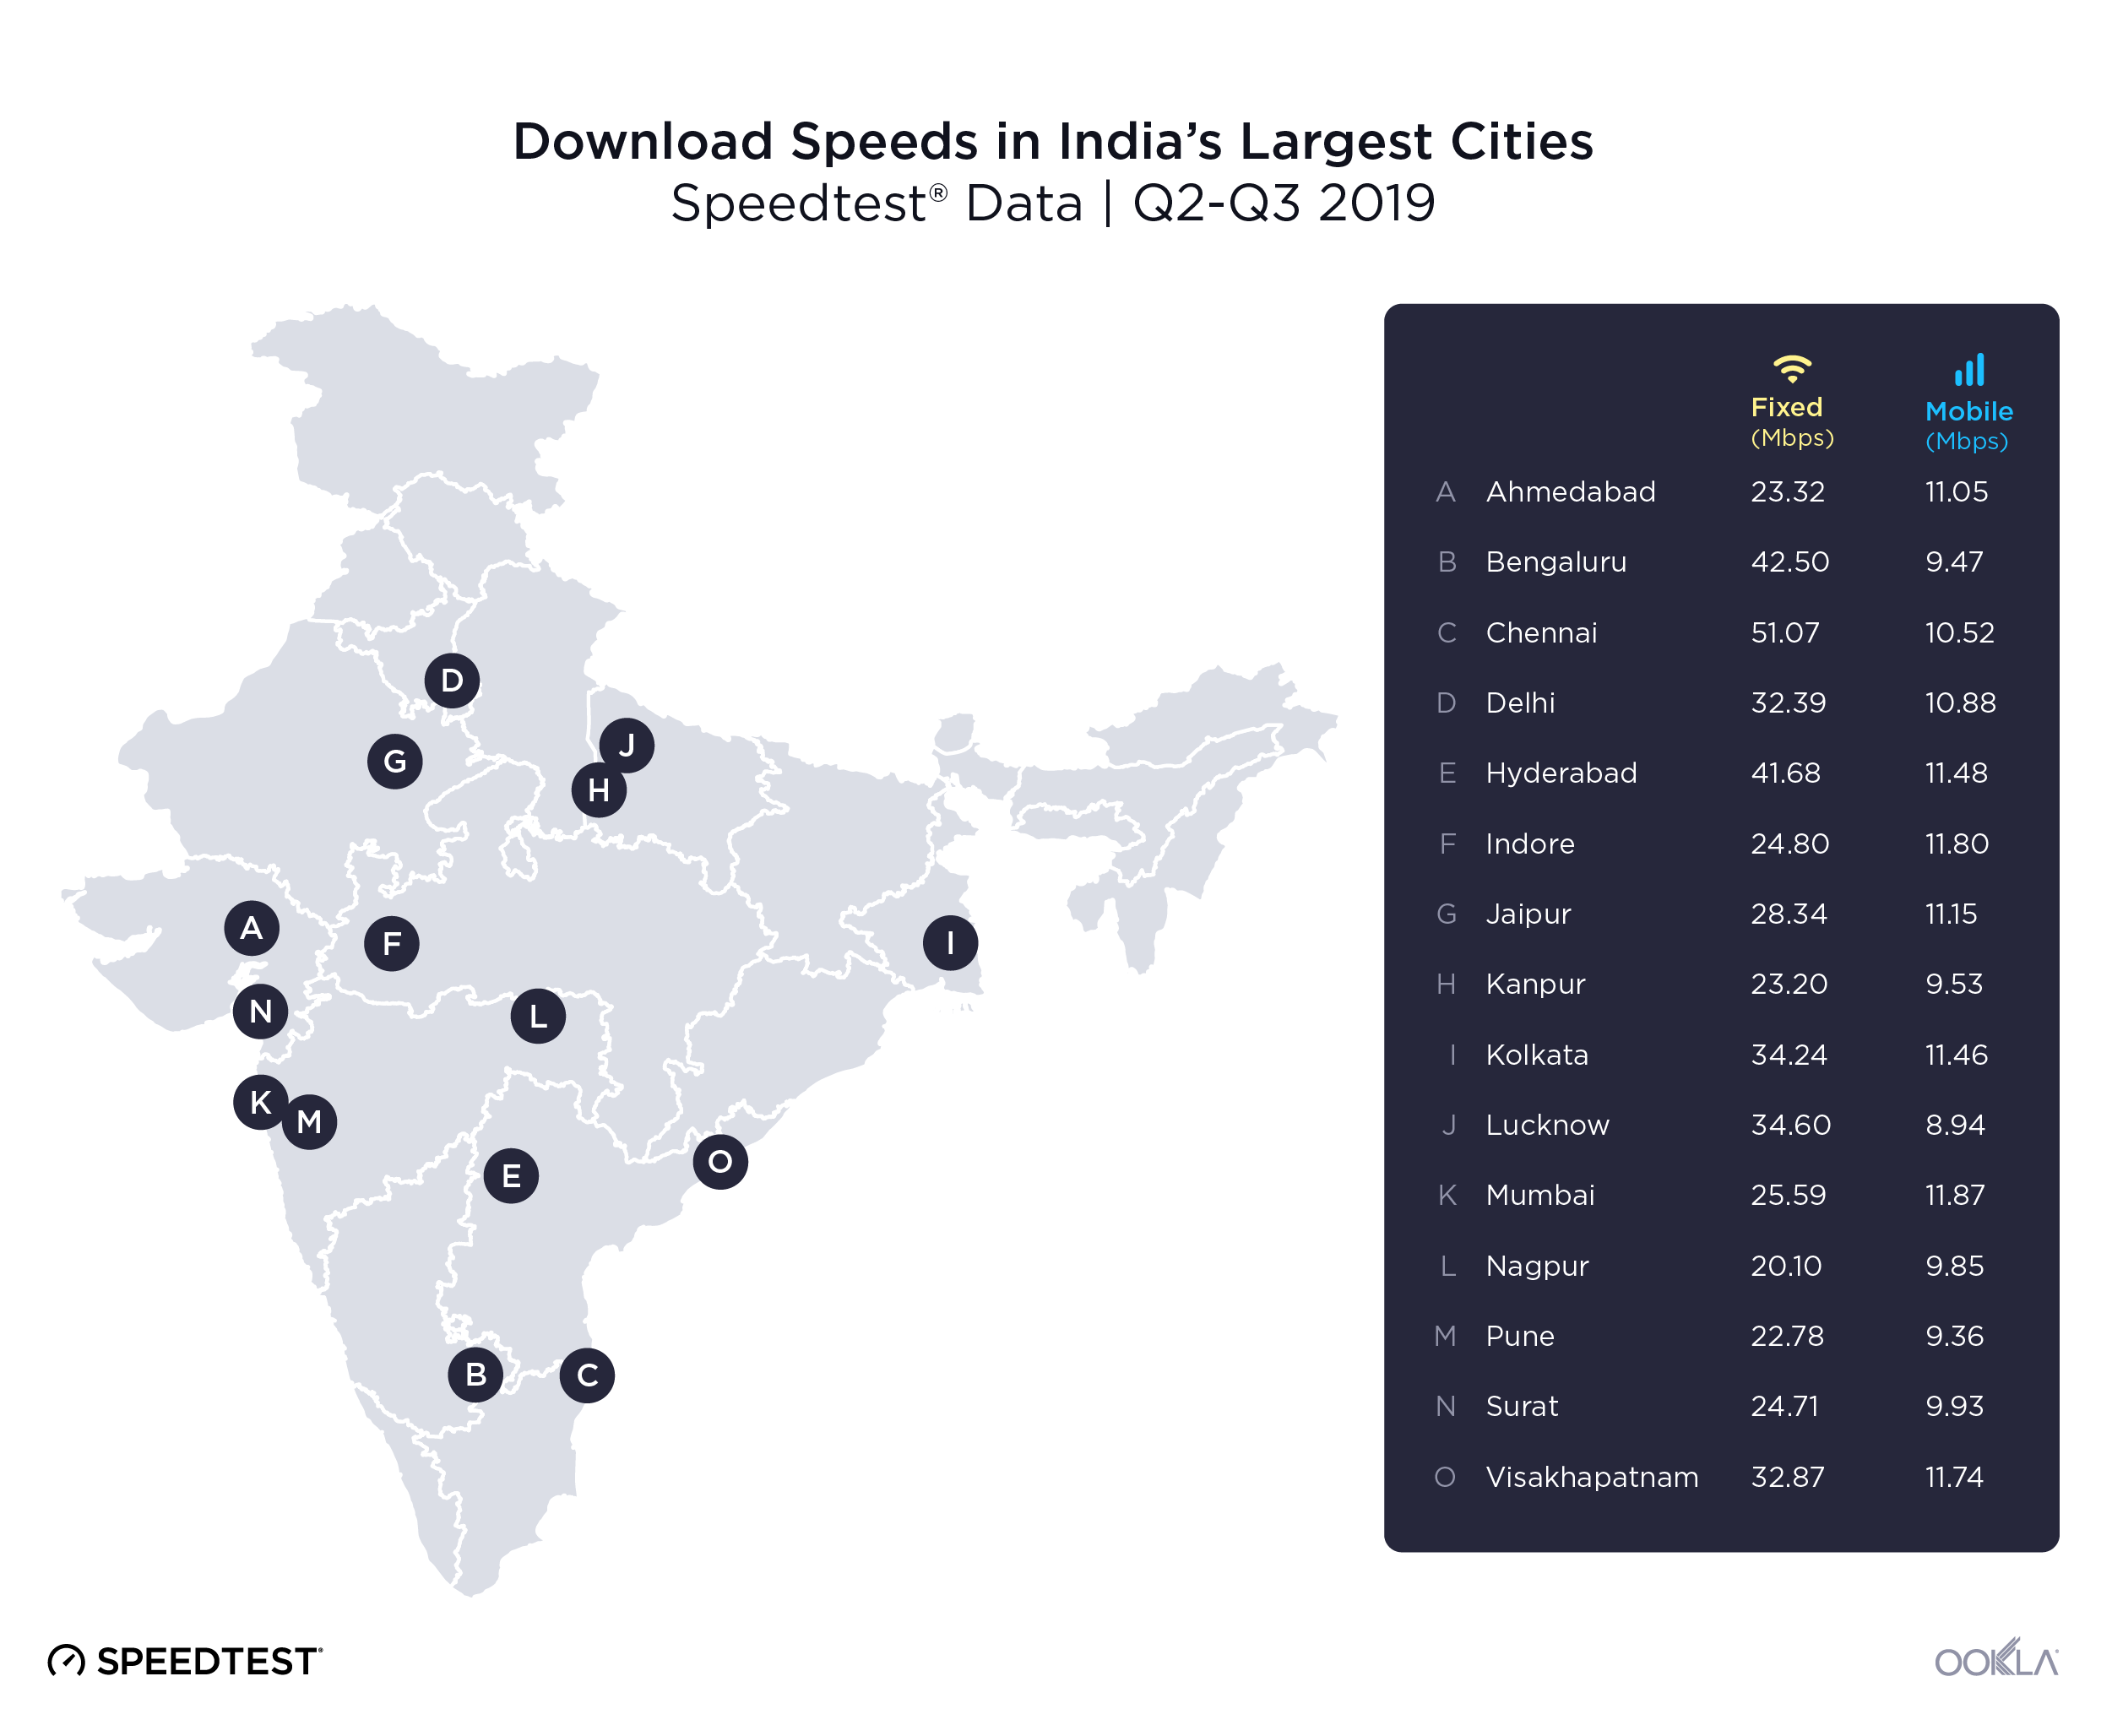
In a country as large as India, country-wide averages factor in many regional differences. To get a clearer picture of how consumers experience the internet across the country, we looked at fixed and mobile download speeds in the 15 largest cities in India during Q2-Q3 2019.

Ookla_Internet-Speeds-in-India---Largest-Cities-2

Chennai had by far the fastest mean download speed over fixed broadband (51.07 Mbps), followed by Bengaluru (42.50 Mbps) and Hyderabad (41.68 Mbps). The slowest download speeds on our list were measured in Nagpur (20.10 Mbps), followed by Pune (22.78 Mbps) and Kanpur (23.20 Mbps).

Mobile download speeds — which include all cellular technologies — showed somewhat less variation from city to city. Mumbai (11.87 Mbps), Indore (11.80 Mbps), Visakhapatnam (11.74 Mbps), Hyderabad (11.48) and Kolkata (11.46 Mbps) had the fastest mobile download speeds. The slowest mean download speed on our list was measured in Lucknow (8.94 Mbps).

Want to see which ISPs and mobile operators were fastest in each city, plus a breakdown of how operators perform at peak times of network congestion, based on signal metrics? Download the full report.

Ookla retains ownership of this article including all of the intellectual property rights, data, content graphs and analysis. This article may not be quoted, reproduced, distributed or published for any commercial purpose without prior consent. Members of the press and others using the findings in this article for non-commercial purposes are welcome to publicly share and link to report information with attribution to Ookla.