
| March 2, 2021

World Bank Uses Speedtest Data to Analyze Internet Performance in Africa


Early last year, Ookla® joined the World Bank’s Development Data Partnership platform as part of our Ookla for Good initiative. Working with such talented, data-driven people focused on the public good is exciting and we have been thrilled to see proposed ideas quickly develop into full research projects. Niccolò Comini, a Consultant in the Chief Economist’s Office of the Infrastructure Vice Presidency at the World Bank, recently published one such project, “The Effect of COVID-19 Lockdown Measures on Internet Speed: An Empirical Analysis of 18 Countries in Africa.”

Taking into consideration the digital divide challenges faced by so many, the report highlights the importance of reliable internet access for all — not only during COVID-19, but also moving forward in a world increasingly reliant on internet connectivity for learning and economic success. The supporting research leveraged fixed and mobile broadband data from Speedtest Intelligence® for a period of 12 weeks, across the peak of the pandemic and implementation of “shelter in place” policies.

Key findings

  • Increase in internet usage – The COVID-19 pandemic and related lockdown measures have increased the amount of internet traffic around the world. Countries in Africa reflect this global trend, reporting higher data traffic during the months in which “stay at home” orders were established. However, this increase in traffic was not temporary; countries continue to reflect a surge in traffic compared to the pre-lockdown weeks.
  • Public and private sector reaction – As a consequence of higher internet usage, public and private stakeholders have promoted a wide range of measures to facilitate access to the internet. For instance, some regulators have enabled temporary spectrum bands to meet the increase in demand while private operators have offered more affordable data plans.
  • Internet speed is slow – On average, the data recorded by Ookla Speedtest® reported low mobile and fixed internet speeds across the 18 African countries surveyed. Speed was below 10 Mbps, considered the lower bound for a good quality broadband service, even before the onset of the pandemic. In contrast to what might be expected in OECD countries, mobile internet generally provides faster service than fixed.
  • Effect of the lockdown on internet speed was modest and temporary – Findings from the sample of 18 African countries indicate a negative effect of the lockdown on mobile (-17%) and fixed internet speeds (-5%), particularly in the first week of lockdown. Some countries also experienced a decline before the stay at home orders, suggesting that some activities shifted to remote connectivity before the official lockdown mandates. However, networks across the continent reacted well.
  • Public and private sector partnerships and cooperation was and remains critical for ensuring network resilience – The findings of this study demonstrate the resiliency of digital infrastructure in Africa and also highlight and reflect the benefits of partnership between public and private stakeholders to manage traffic surges. The development community should encourage and leverage these partnerships to achieve the ambitious objective of universal access to the internet.

Read the full World Bank report.

We are glad to work with organizations like the World Bank to provide data that can help improve the state of internet performance around the world. Learn more about Ookla for Good.

Ookla retains ownership of this article including all of the intellectual property rights, data, content graphs and analysis. This article may not be quoted, reproduced, distributed or published for any commercial purpose without prior consent. Members of the press and others using the findings in this article for non-commercial purposes are welcome to publicly share and link to report information with attribution to Ookla.

| March 9, 2021

How to Benchmark and Market Your 5G Network [Webinar]

5G has dominated the news as mobile operators race to provide the fastest service in the most places. Every network provider wants to be the best in their market, however, conflicting 5G claims in news headlines and advertisements have begun to lead to headaches for operators.

The upcoming Ookla® webinar on March 24 will share how you can accurately position your 5G network using claims backed by the industry’s most trusted source for network data — while also building more trust with consumers.


Why legacy data collection methods like drive testing provide biased results for emerging technology

5G is an emerging technology with limited network coverage and limited device penetration. Using drive testing as a tool to back claims about how a customer might experience a 5G network connection is disingenuous, at best. At worst, it can drastically misrepresent the real-world 5G experience available in an area. Drive testing provides only a small sample of data and is often conducted in limited areas — missing places where users are most likely to connect. The artificial conditions created with drive testing don’t reflect real-world consumer experience and can lead to incorrect claims about network speeds.

How to validate a network claim based on test volume, 5G connection detection and throughput capacity

High test volume is critical to get an accurate picture of your 5G speeds. Generally speaking, the higher the test count the greater the statistical accuracy in the claims being made. In addition, not all 5G-capable devices can natively identify 5G when reporting the connection type to applications. Data providers who do not include robust in-app detection with strict filtering criteria are likely to misidentify the technology type of a connection, which in turn shows speeds that do not accurately reflect that network’s actual 5G service capability. In order to reflect the network’s real-world performance, the testing solution must be capable of measuring the full throughput of a user’s connection. Testing solutions that test to remote CDNs, test only in the background, or hide their tests in third-party applications are unable to accurately measure the full capacity of a connection.

The webinar on Wednesday, March 24 at 7 a.m. Pacific (10 p.m. Eastern / 3 p.m. GMT) will show you how to benchmark your network and promote your brand with validated marketing claims. Don’t miss it. A recording will be provided for registrants who can’t tune in to the live presentation.


Ookla retains ownership of this article including all of the intellectual property rights, data, content graphs and analysis. This article may not be quoted, reproduced, distributed or published for any commercial purpose without prior consent. Members of the press and others using the findings in this article for non-commercial purposes are welcome to publicly share and link to report information with attribution to Ookla.

| September 22, 2021

The Infrastructure Investment and Jobs Act Could Improve Internet Access for Those Who Need it Most


Investment in broadband infrastructure in the United States is long overdue. The past two years have revealed how critical the internet is to daily life for everyone, and yet far too many people don’t have adequate speeds and service, even in wealthier areas like Loudoun County, Virginia, near Washington, D.C. The bipartisan omnibus infrastructure bill is a once-in-a-generation opportunity to address the digital inequities plaguing our country by connecting millions of Americans with critical services that many of us take for granted.

Ookla strongly supports the passage of the Infrastructure Investment and Jobs Act. As we all look on to see if this bill will successfully pass the United States House of Representatives, we’ve taken a close look at what the bill could mean for internet connectivity in the U.S. and why this bill is essential to bridging the digital divide.

17% of counties do not have access to “adequate” internet speeds

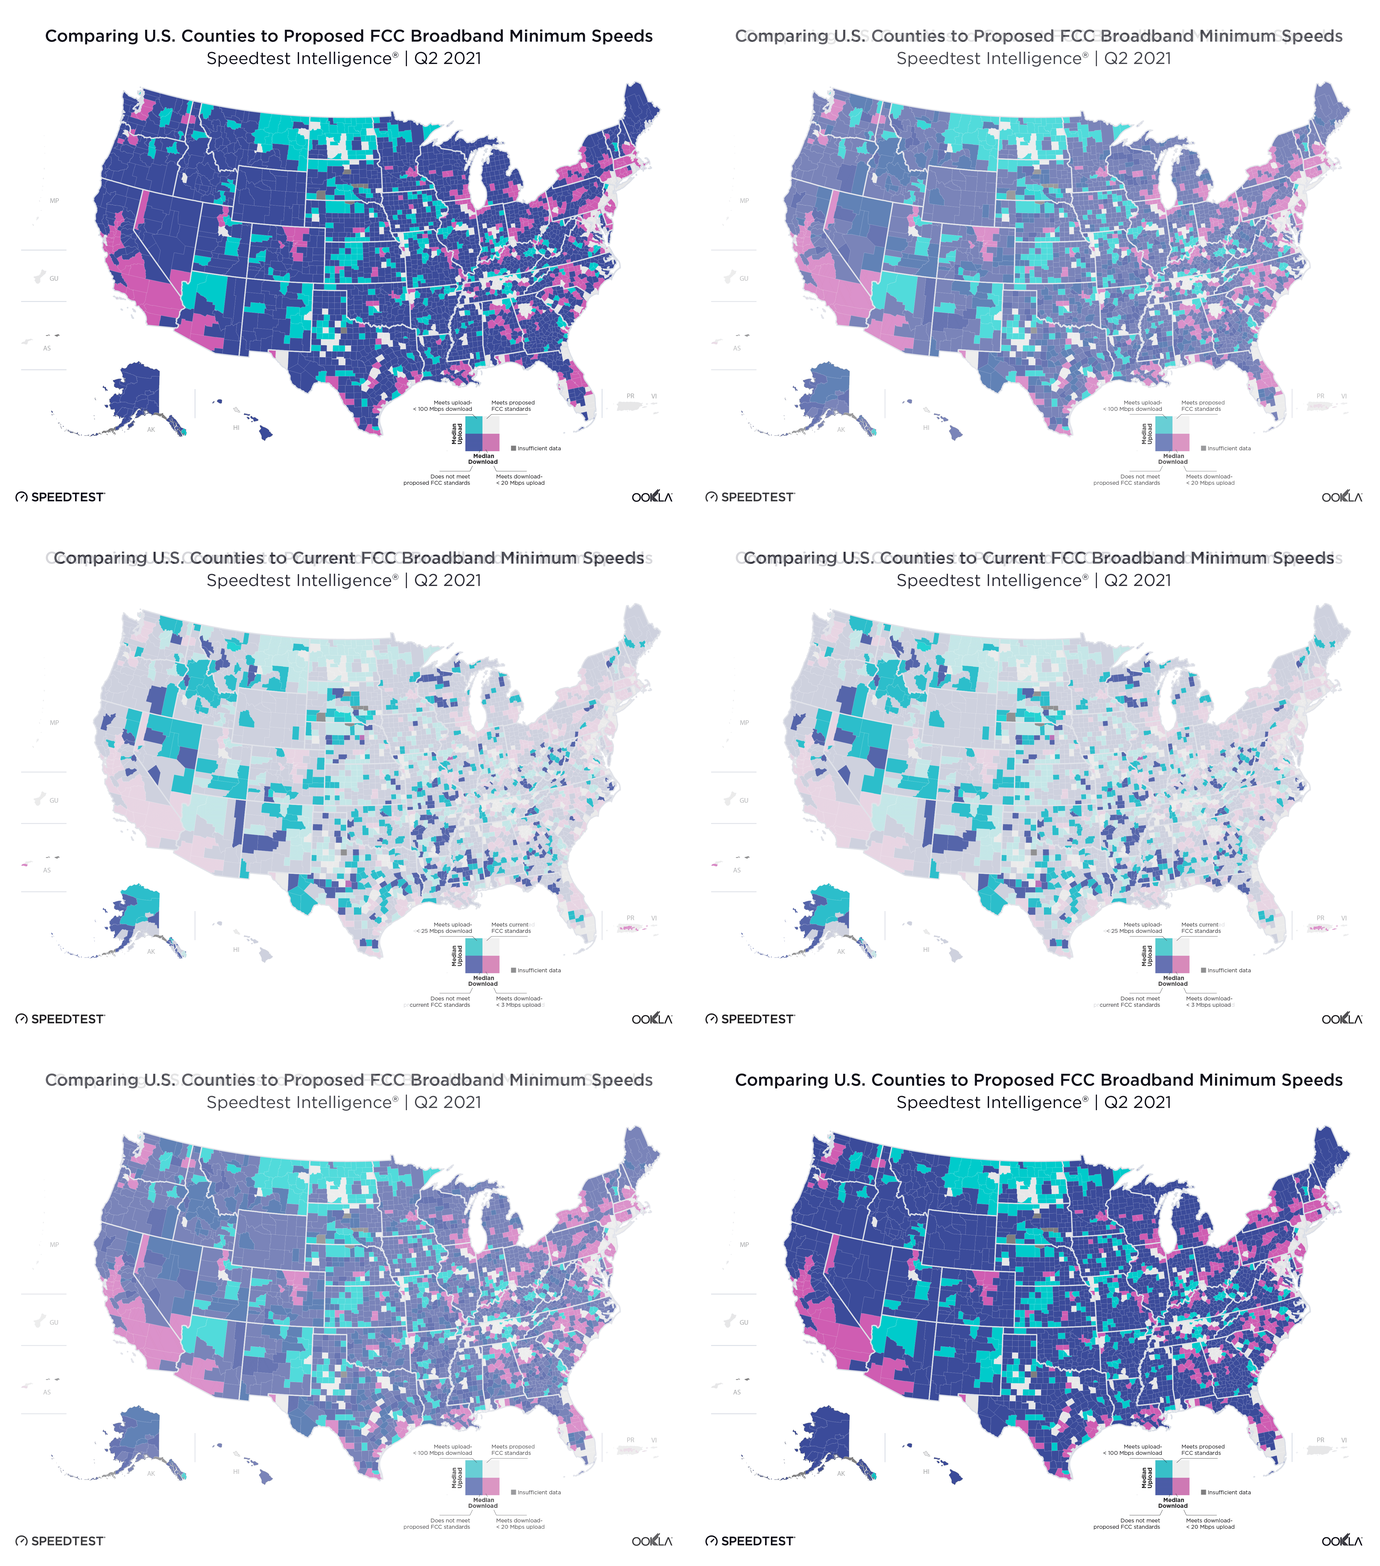
Data from Speedtest Intelligence® shows that 17% of counties with sufficient samples didn’t meet the minimum median speeds for the current FCC definition of broadband (25 Mbps download / 3 Mbps upload) in Q2 2021.

Worse, if you’ve ever tried to have a video call while someone was doing anything else online, you know that a download speed of 25 Mbps will likely result in massive lags for at least one of those users, if you can stay connected at all. That’s why the Senate bill will incentivize network expansion funding for networks offering speeds of 100 Mbps download and 20 Mbps upload or more. While these speeds are a far better benchmark for our modern and evolving lives, 92% of counties with sufficient samples did not meet this new proposed threshold in Q2 2021.

ookla_fcc_minimum_speeds_Counties_0921

The maps above show which counties do meet the current and proposed FCC minimums. While more than 80% of U.S. counties met the FCC’s current broadband minimum in Q2 2021, the counties that don’t are in the places that are already deeply economically disadvantaged — rural areas including Appalachia and the deep South.

The map for proposed speeds shows the less than 10% of counties that met the proposed 100 Mbps download / 20 Mbps upload speed in Q2 2021 were largely in urban areas. We saw other urban counties with high download speeds and some Midwest counties with high upload speeds stand out as having met half the requirement, but those places will need more investment to reach the proposed standard.

Of course, determining where best to direct broadband investment requires a much more granular approach, but examining data aggregated by county is a great way to compare connectivity across the entire country. Some counties shown as having adequate service will have pockets needing investment. For the purpose of this high-level view, should an entire county average throughput speeds below federal broadband definitions, it is assuredly in need of assistance.

What the Infrastructure Investment and Jobs Act does for broadband infrastructure and working to end digital disparity

Our careful review of the Infrastructure Investment and Jobs Act shows the provisions that could specifically put the U.S. on the path to being a global leader in internet connectivity:

  • Increase deployment. The bill currently allocates $42.45 billion for deploying improved internet infrastructure. Each state will receive a minimum of $100 million and U.S. territories split another $100 million. Up to 5% of funds may be used for planning and mapping. This would allow state and local governments to look closely at what areas are unserved or underserved by broadband in their jurisdictions and actually build the infrastructure to connect them.
  • Expand the Emergency Broadband Benefit (EBB). This program, originally funded at $6 billion, currently provides subsidies to low-income households to directly pay for broadband. The bill would devote $14.2 billion to funding $30/month subsidies for those who qualify. The program would be renamed the “Affordable Connectivity Program” and increases in funding would be allowed over time. This would continue to connect some of the most economically vulnerable families to the internet.
  • Fund the Digital Equity Grant Act. $2.75 billion is included to pay for the "State Digital Equity Capacity Grant" and the "Digital Equity Competitive Grant" programs which finance state and nonprofit programs to increase connectivity and improve digital equity.
  • Redefine broadband levels. The bill would formally recategorize “Unserved” locations as those having access to internet slower than 25 Mbps download / 3 Mbps upload. Locations where 80% of people or more lack access to 100 Mbps download / 20 Mbps upload would be labeled “Underserved.” This is critical in acknowledging the level at which most people in the U.S. need access to the internet today.
  • Increase funding to the Tribal Broadband Connectivity Fund. An additional $2 billion would go to building broadband infrastructure to and across tribal lands.
  • Increase funding to the Rural Utilities Service. This program to serve rural communities would receive an additional $2 billion for the Distance Learning, Telemedicine and Broadband Program.
  • Subsidize the Middle Mile Infrastructure Deployment Plan. The bill provides $1 billion for this vital infrastructure that connects individual internet users with the backbone of the internet. At a cost of tens of thousands of dollars per mile, this may not go far enough, but it is a start.
  • Finance Private Activity Bonds. $600 million is written into the bill to back private financing of broadband efforts.
  • Expand the definition of “anchor institutions.” Places like schools, libraries and healthcare facilities have long been considered locations people could go to in order to access broadband when they don’t have access at home. This bill expands that list to include: public safety entities, institution of higher education, public housing and community support organizations. This expanded list of anchor institutions increases the number of places community members can access broadband and the institutions are eligible for funding to provide that broadband.

Failing to invest in broadband infrastructure is failing the future of the U.S. economy

The COVID-19 pandemic revealed how critical adequate internet access is in a modern society as everything from routine medical visits to everyday education and millions of jobs went online. Some of that may shift back to in-person, but we can not and should not forget the disparities in internet access that were revealed during this time. The U.S. often holds itself out as an example for the world and the past year and a half have shown woeful cracks in broadband equity.

If the U.S. House of Representatives fails to pass this bill, they are abandoning millions of Americans to a future of falling behind. Poorly connected towns will fail because businesses that need broadband will go elsewhere. Poorly connected students will fall farther behind their classmates that have quality internet. Poorly connected workers will miss out on high-paying jobs. And poorly connected patients will put additional strain on our healthcare system without telehealth access. From connecting with teachers and co-workers in a video chat to streaming entertainment, access to adequate broadband makes participation in modern life possible.

The U.S. Congress must pass this bill. Whether you believe it is a moral imperative to address the digital inequities in our country as well as throw a lifeline to rural communities, or you simply view this as a strategic opportunity to maintain our position as a global leader, the time to act is now.

Ookla retains ownership of this article including all of the intellectual property rights, data, content graphs and analysis. This article may not be quoted, reproduced, distributed or published for any commercial purpose without prior consent. Members of the press and others using the findings in this article for non-commercial purposes are welcome to publicly share and link to report information with attribution to Ookla.

| October 4, 2021

Introducing Video Analytics in Speedtest Intelligence


With video content being the most dominant form of global network traffic, it’s important to understand your customers’ real-life experience with internet and mobile connectivity when they are consuming video content. To that end, we are excited to announce the launch of Video Analytics in Speedtest Intelligence®.

We launched video testing in the Speedtest® app for iOS and Android earlier this year. Since then, millions of video tests have been initiated by consumers to gain insights about the quality of their video streaming experience. Speedtest Intelligence now allows enterprises to surface key insights into the real-world consumer video experience on their network. With these insights, internet service providers and mobile network operators can monitor video performance and quality over time, benchmark against competitors, assess the impact of network build-outs on video performance, and much more.

Consumer video tests, enterprise video analytics

When a user presses the play button on the Speedtest video test, it initiates adaptive bitrate video playback which dynamically adjusts the buffering of various quality video renditions to provide the best playback experience possible based on the device and network capabilities. The purpose of this is to deliver the maximum quality video supported by the network and device, while minimizing undesired behaviors such as stall events and long preplay buffering times. Speedtest video testing uses adaptive bitrate streaming and prevalent streaming protocols, codecs, containers, and CDNs to make our test as short as possible while also enabling us to detect the stabilized bitrate and stalls in playback.

If the highest resolution of 4K is not achieved in the adaptive bitrate stage, then the test moves on to the fixed stage, during which a series of short videos are played at increasing resolutions until the test either fails to complete in a given period of time or else reaches a maximum resolution of 4K. When the test is complete, consumers get a snapshot of their results, including maximum resolution, load time, buffering percentage, and suggested devices to stream video at their current performance level.


Network operators and other enterprises can now gain insight from millions of consumer video tests to better understand how fixed and mobile subscribers experience industry-standard video KPIs. Metrics available in the Video Analytics dashboard include:

  • Average media bitrate for the adaptive bitrate stage
  • Distribution of primary resolution for the adaptive bitrate stage
  • Rebuffering ratio for the adaptive bitrate and fixed stages
  • Start failures for the adaptive bitrate and fixed stages
  • Start time for the adaptive bitrate and fixed stages
  • Overall distribution of highest successful resolution

chart-art

How ISPs and MNOs can use Video Analytics

With Video Analytics in Speedtest Intelligence, network operators can gain insights about their customers’ video streaming experience. Video Analytics data can help you:

  • Directly measure consumer video experience
  • Monitor consumer video performance & quality over time
  • Benchmark against competitors
  • Assess the impact of network optimization or build-out on video performance
  • Prioritize engineering efforts in areas with poor video experience
  • Prioritize marketing efforts in areas where competitors provide poor video experience
  • Identify areas with good video streaming experience for upsell of bundled OTT services
  • Correlate poor mobile video experience to specific cell sites and RF issues

Want to give your customers a world-class video streaming experience? Inquire about adding the Video Analytics dashboard to your Speedtest Intelligence subscription today.

Ookla retains ownership of this article including all of the intellectual property rights, data, content graphs and analysis. This article may not be quoted, reproduced, distributed or published for any commercial purpose without prior consent. Members of the press and others using the findings in this article for non-commercial purposes are welcome to publicly share and link to report information with attribution to Ookla.

| October 4, 2021

Massive Facebook, Instagram and WhatsApp Outage Happening Now


Facebook is currently experiencing a rarely seen global outage that is taking out Facebook, Instagram, WhatsApp and Facebook Messenger.

3:30 p.m. PDT — The outage appears to be resolved

As of 3:30 p.m. PDT, Facebook is back up and user reports to Downdetector are declining. This is how Luke Deryckx, CTO of Ookla®, summed up today’s events:

The global Facebook outage is now one of the largest ever tracked on Downdetector® in terms of the total number of reports (over 14 million as of 3:30 p.m. PDT) and duration; this is an extremely impactful event.

The combined popularity of Facebook, Instagram, WhatsApp and Facebook Messenger means that billions of users have been impacted by the services being entirely offline today. But the scope of the impact extends far beyond direct users of these services.

Many people may not realize the reach of Facebook’s services into other seemingly unrelated applications. Facebook operates one of the largest advertising networks in the world, used by countless websites and mobile applications. Facebook also provides a method to authenticate (log in) for users of many internet applications. Any service that relies on Facebook for any part of its infrastructure will have experienced problems today to a varying degree.

The cascading impact of an outage to a core service like this can be confusing for people experiencing problems with a service seemingly completely unrelated to Facebook. When Facebook goes down, it’s a bad day on the internet, and today is particularly stormy.

We make a point to highlight the most widespread outages on Downdetector with a banner at the top of the page to inform our users where the true source of the outage likely lies.

downdetector-banner-facebook-outage

1:00 p.m. PDT — A global view of the outage

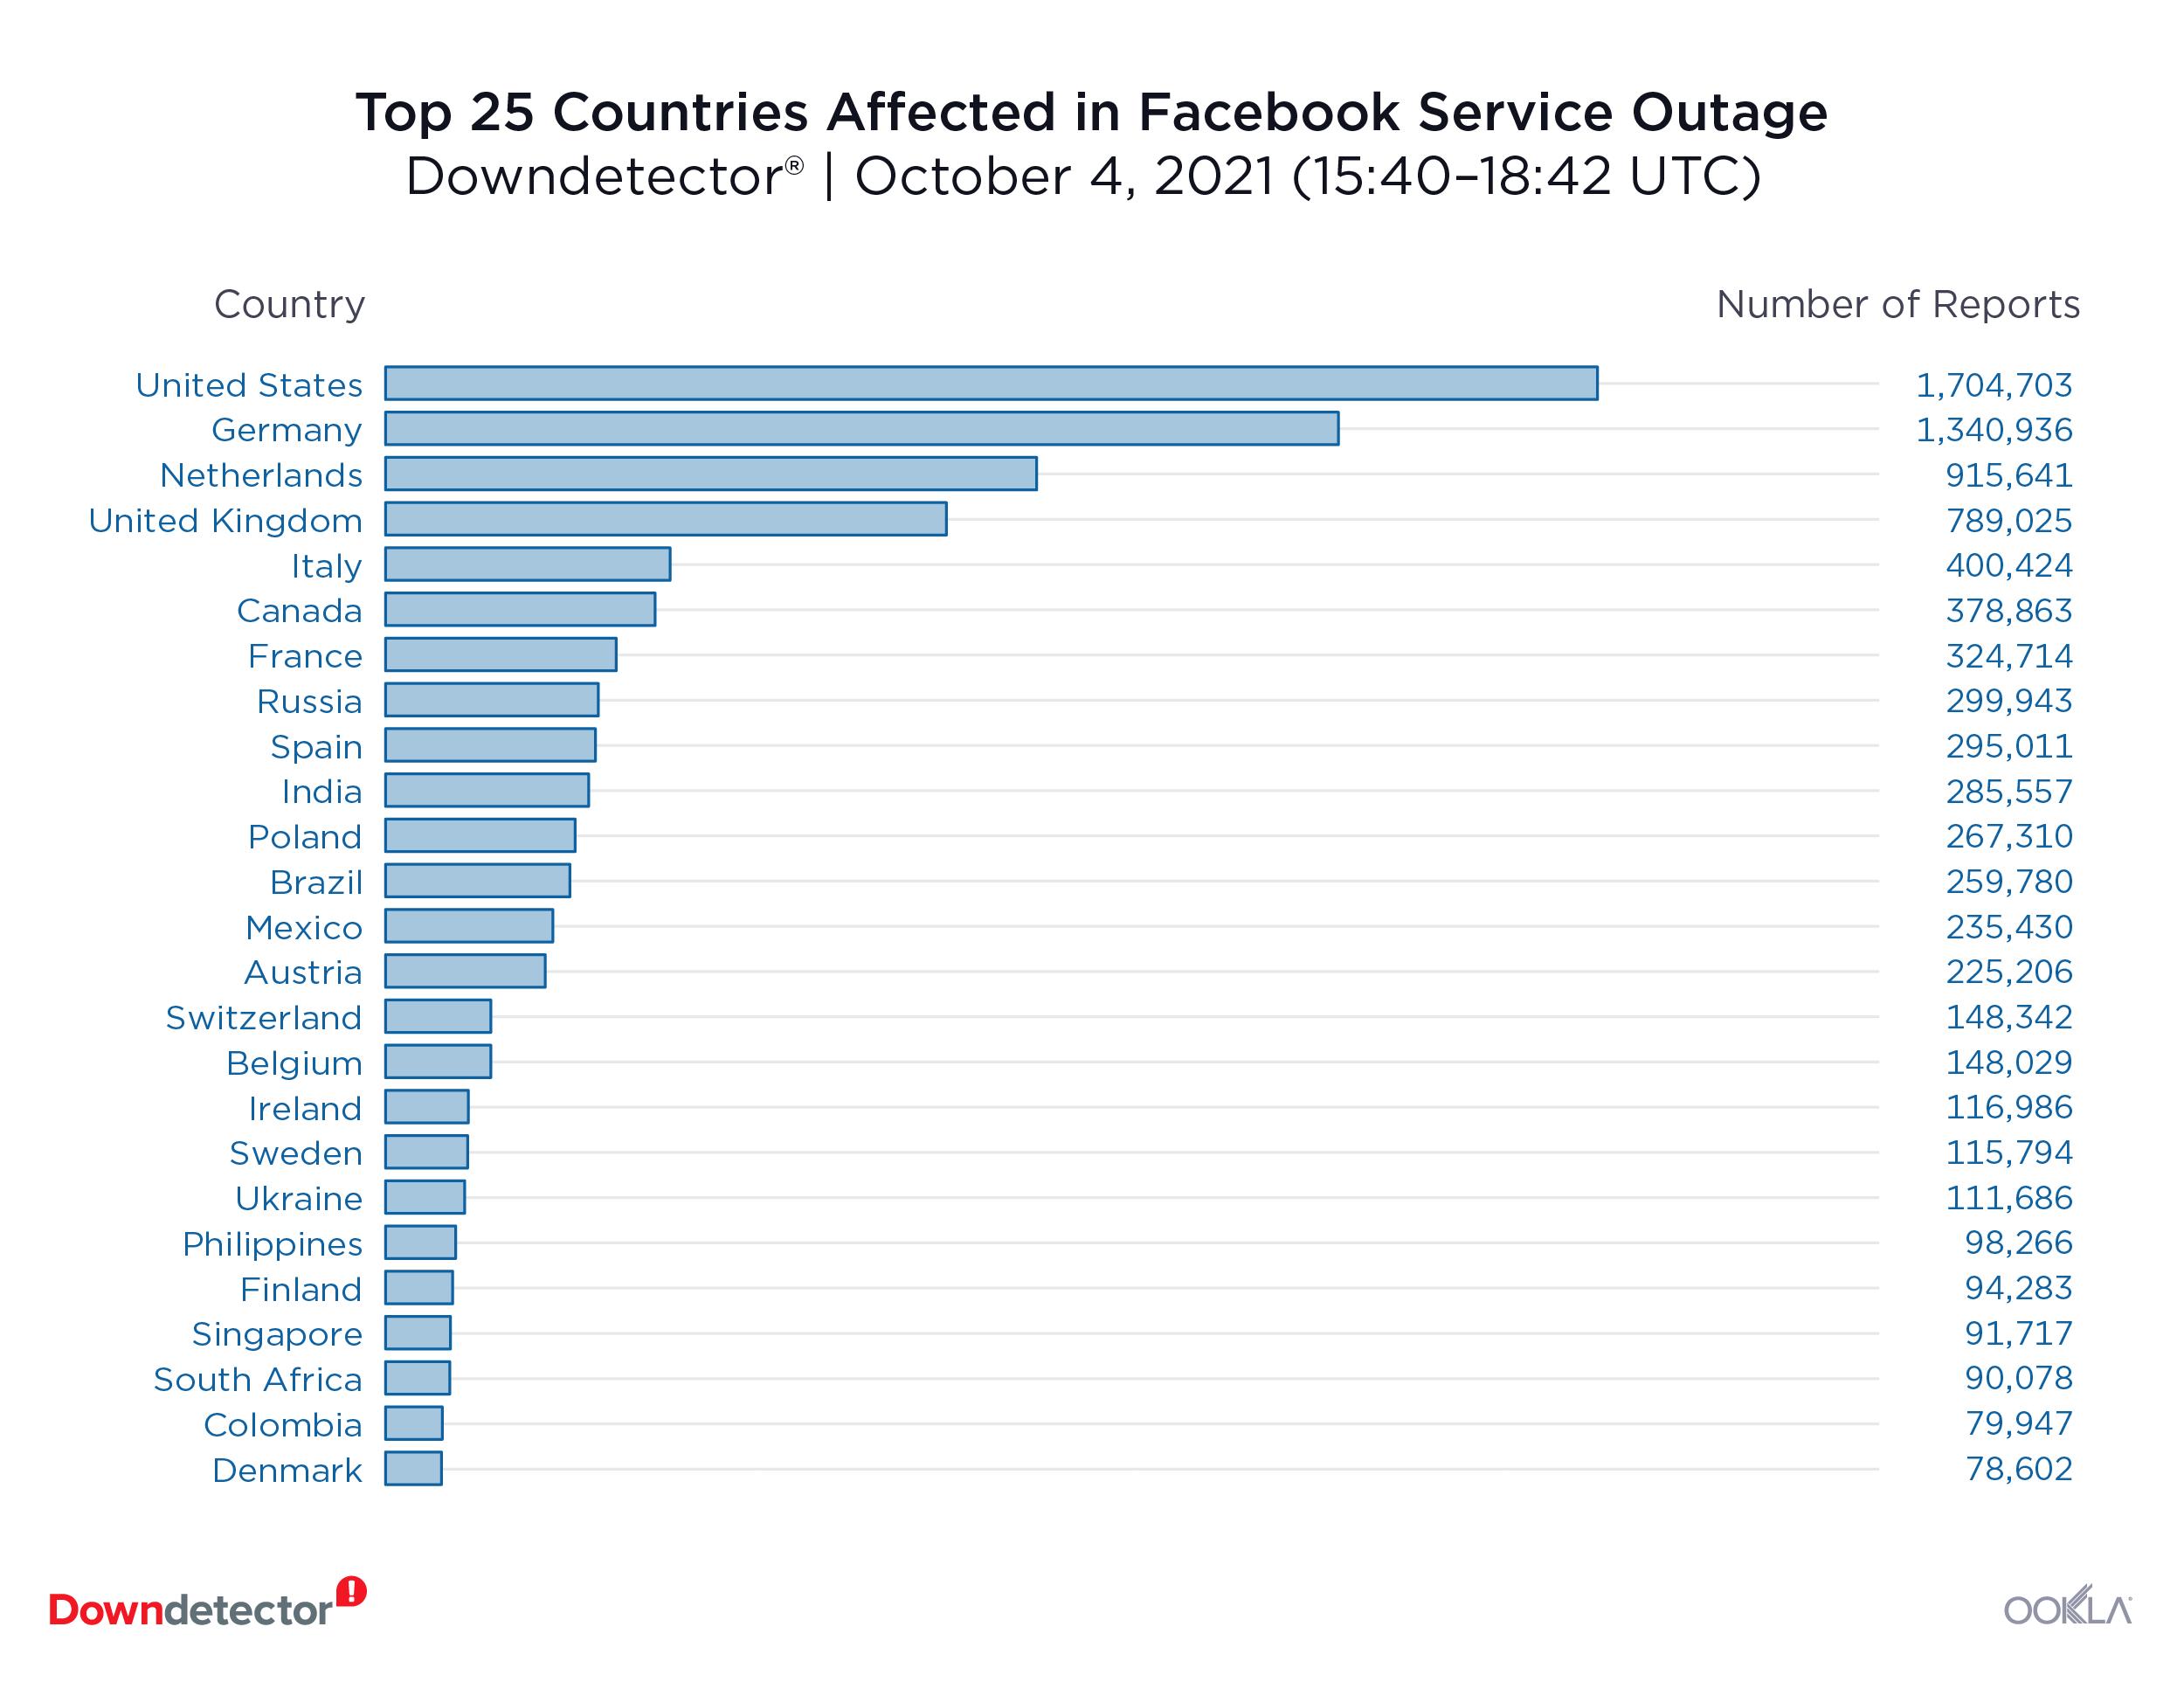
The Facebook outage continues and has become the largest outage we’ve ever seen on Downdetector with over 10.6 million problem reports from all over the globe. The U.S. had the most reports at over 1.7 million followed by Germany (1.3 million), the Netherlands (915,000), the United Kingdom (789,000) and Italy (400,000).

Downdetector_affected-countries_1021-01

We are also seeing an increase in reports across many other online sites and services as the Facebook outage causes cascading impacts. Expect a turbulent day on the internet.

10:00 a.m. PDT — Facebook outage extends across all the company’s apps

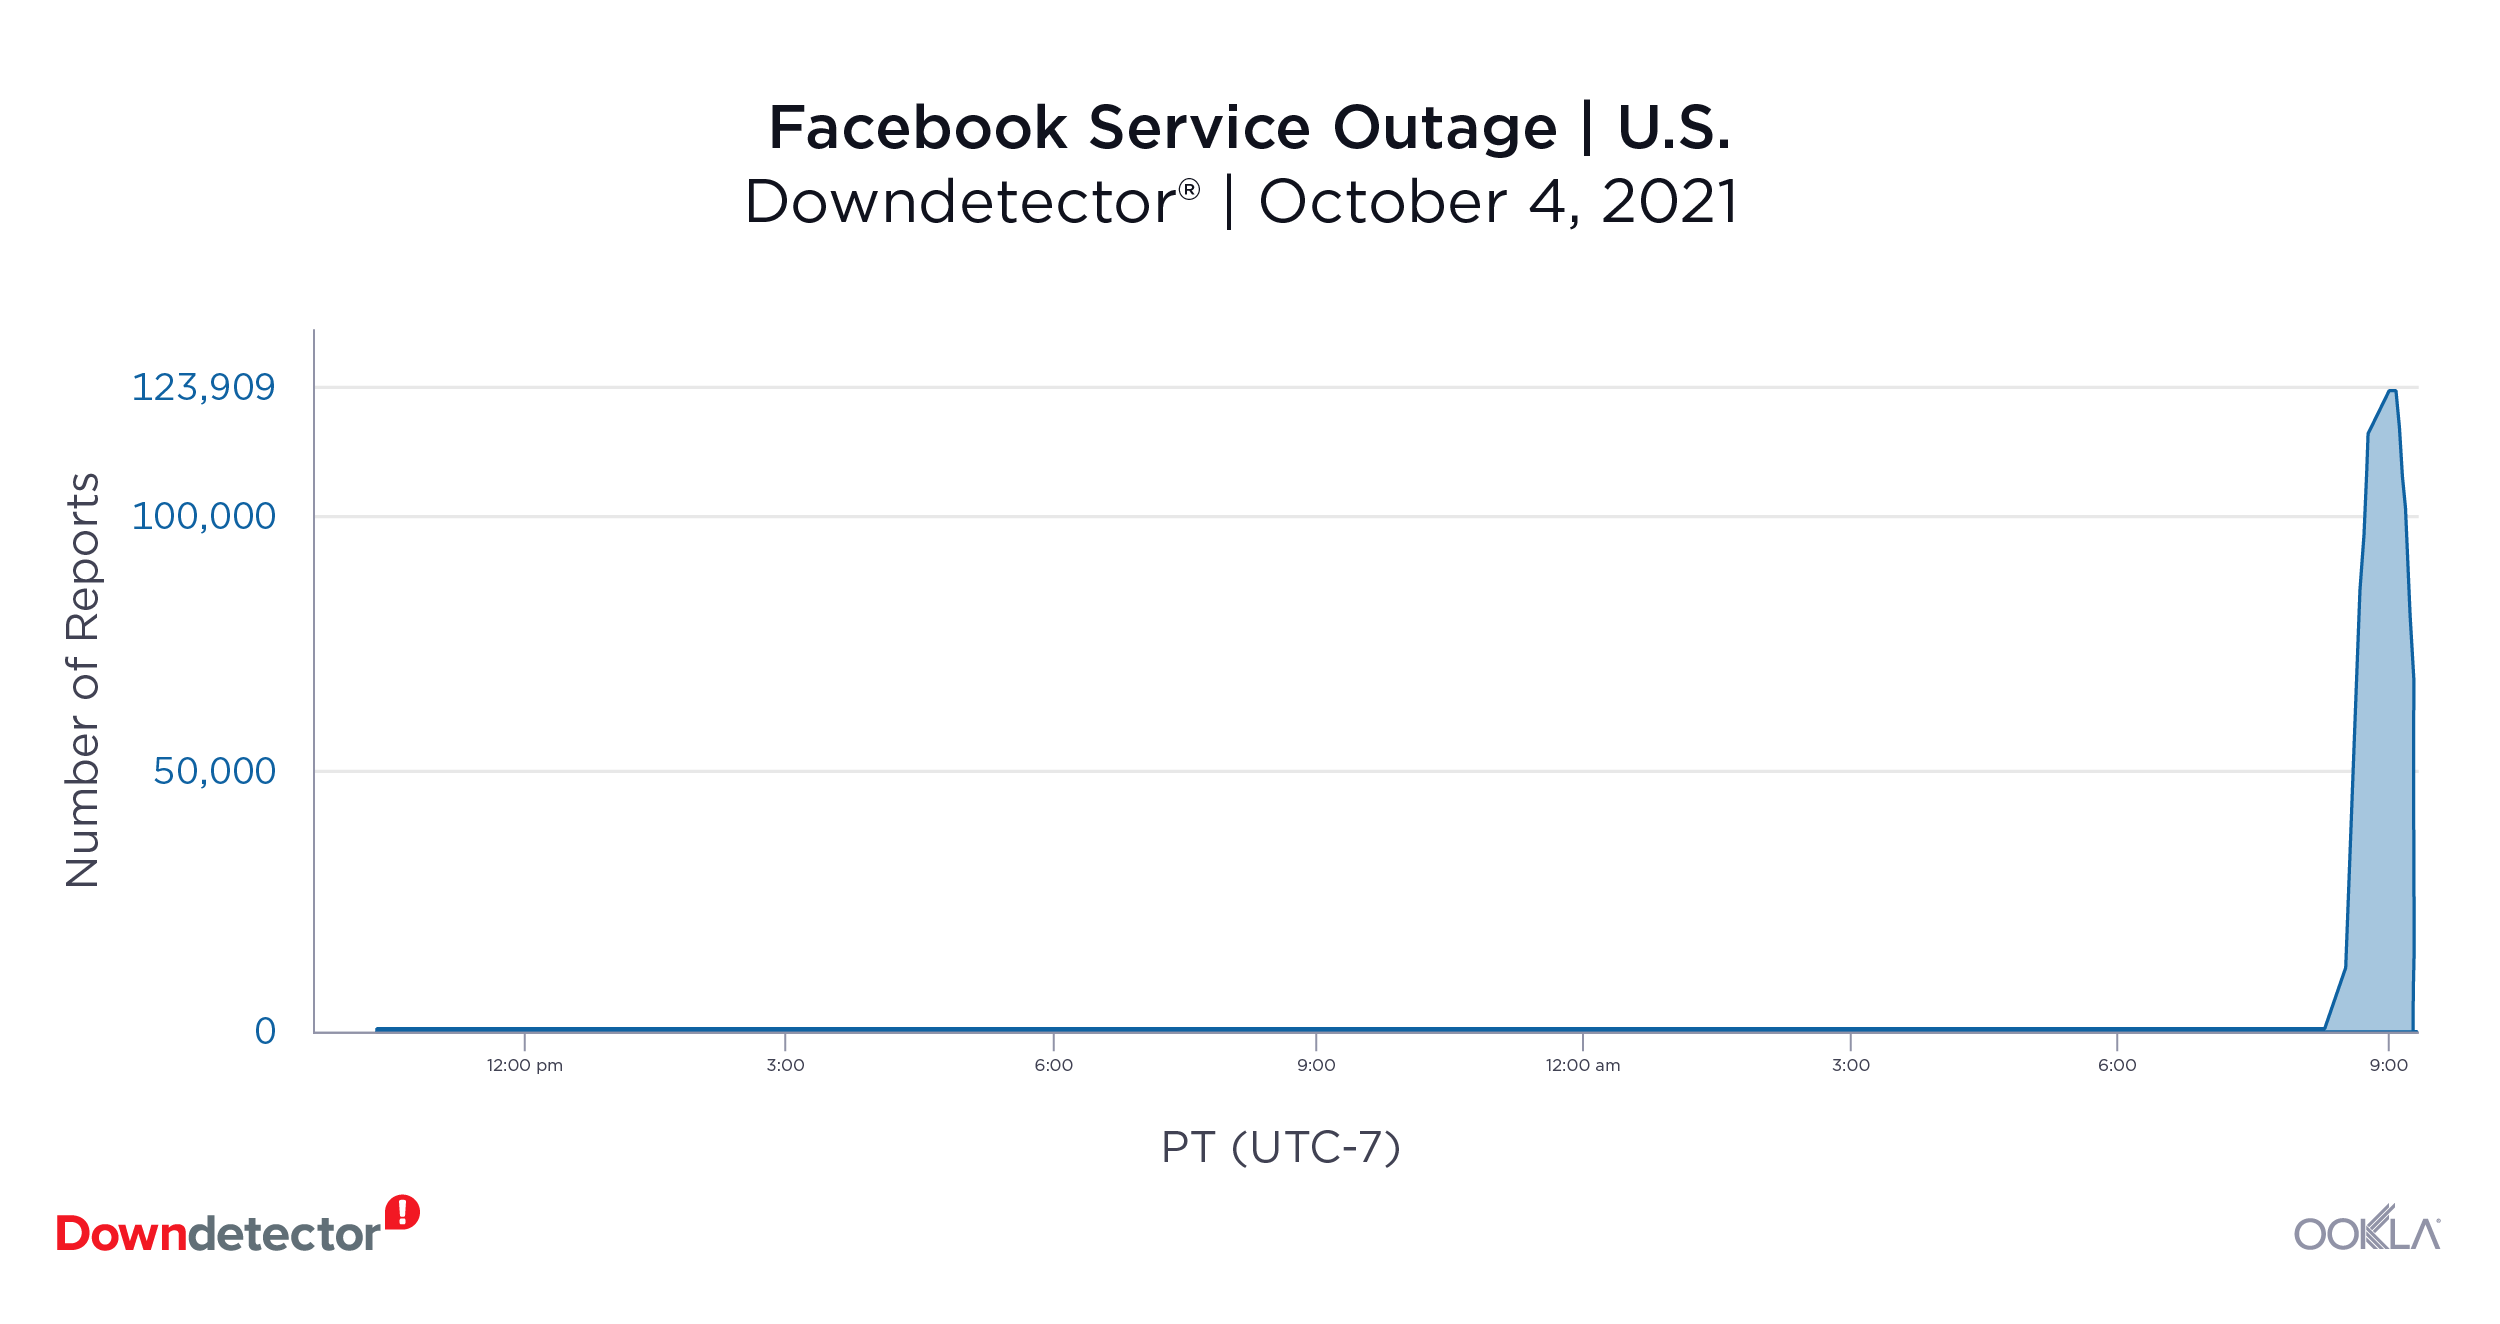
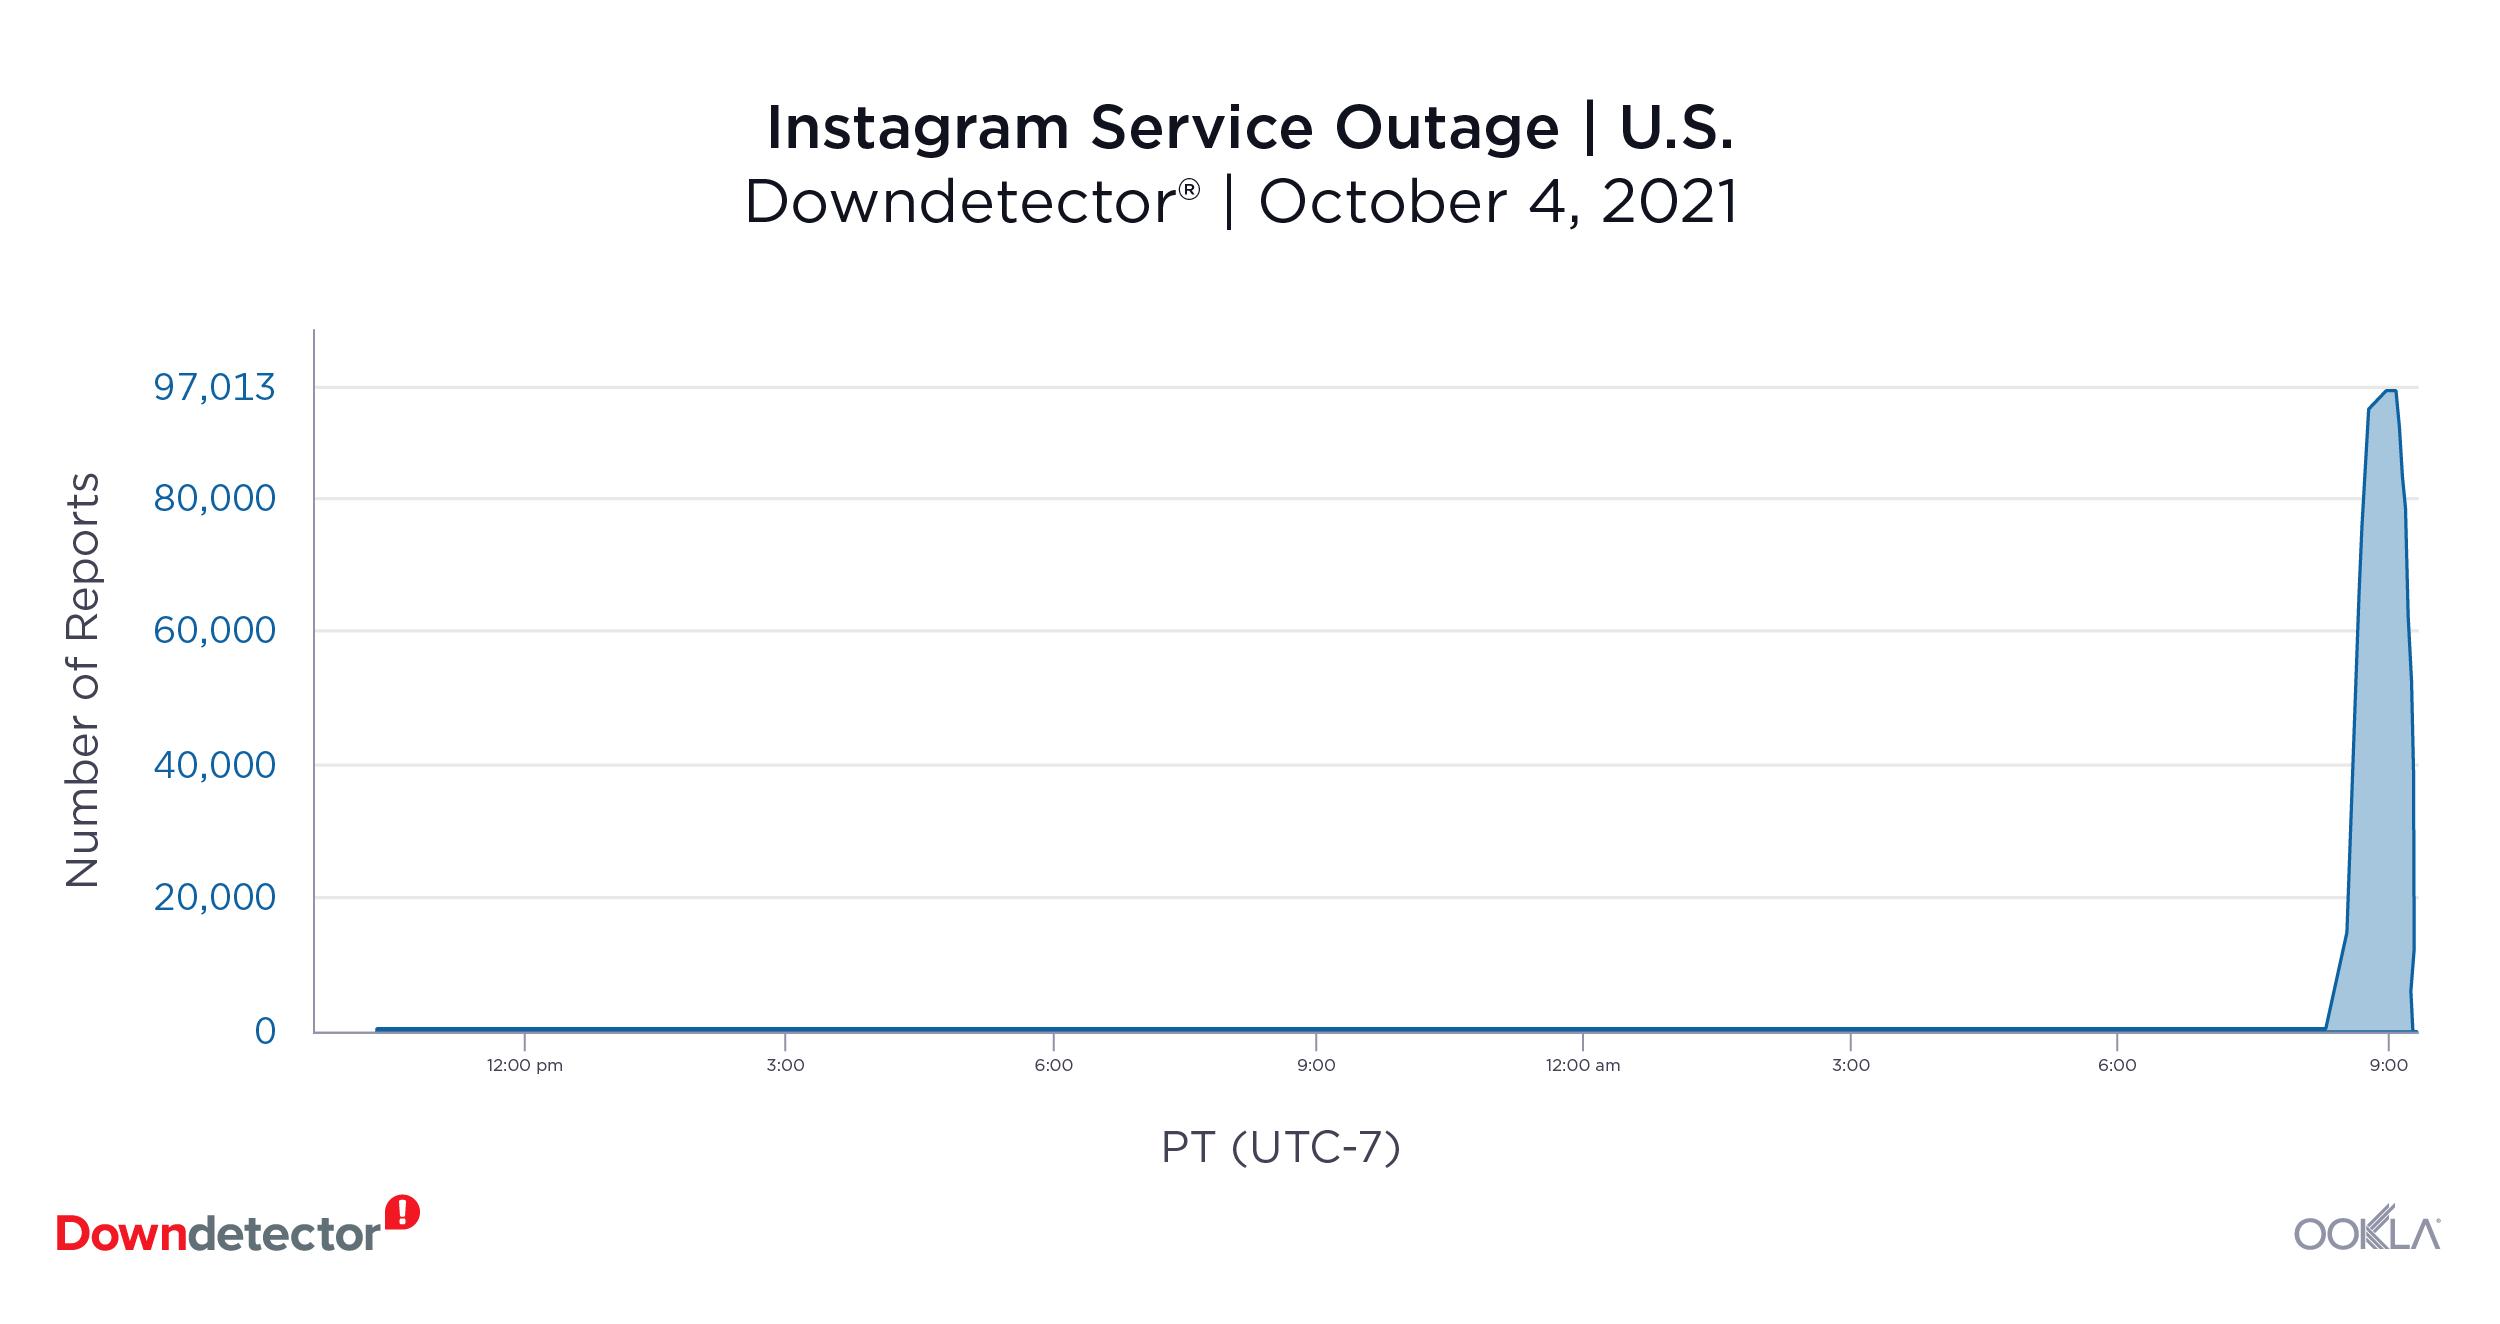
No word yet from Facebook on what caused the outage, but as of 9:30 a.m. PDT, we saw over 5.6 million reports about issues with the company’s services from around the world on Downdetector. The reports started rolling in around 8:15 a.m. PDT and are continuing.

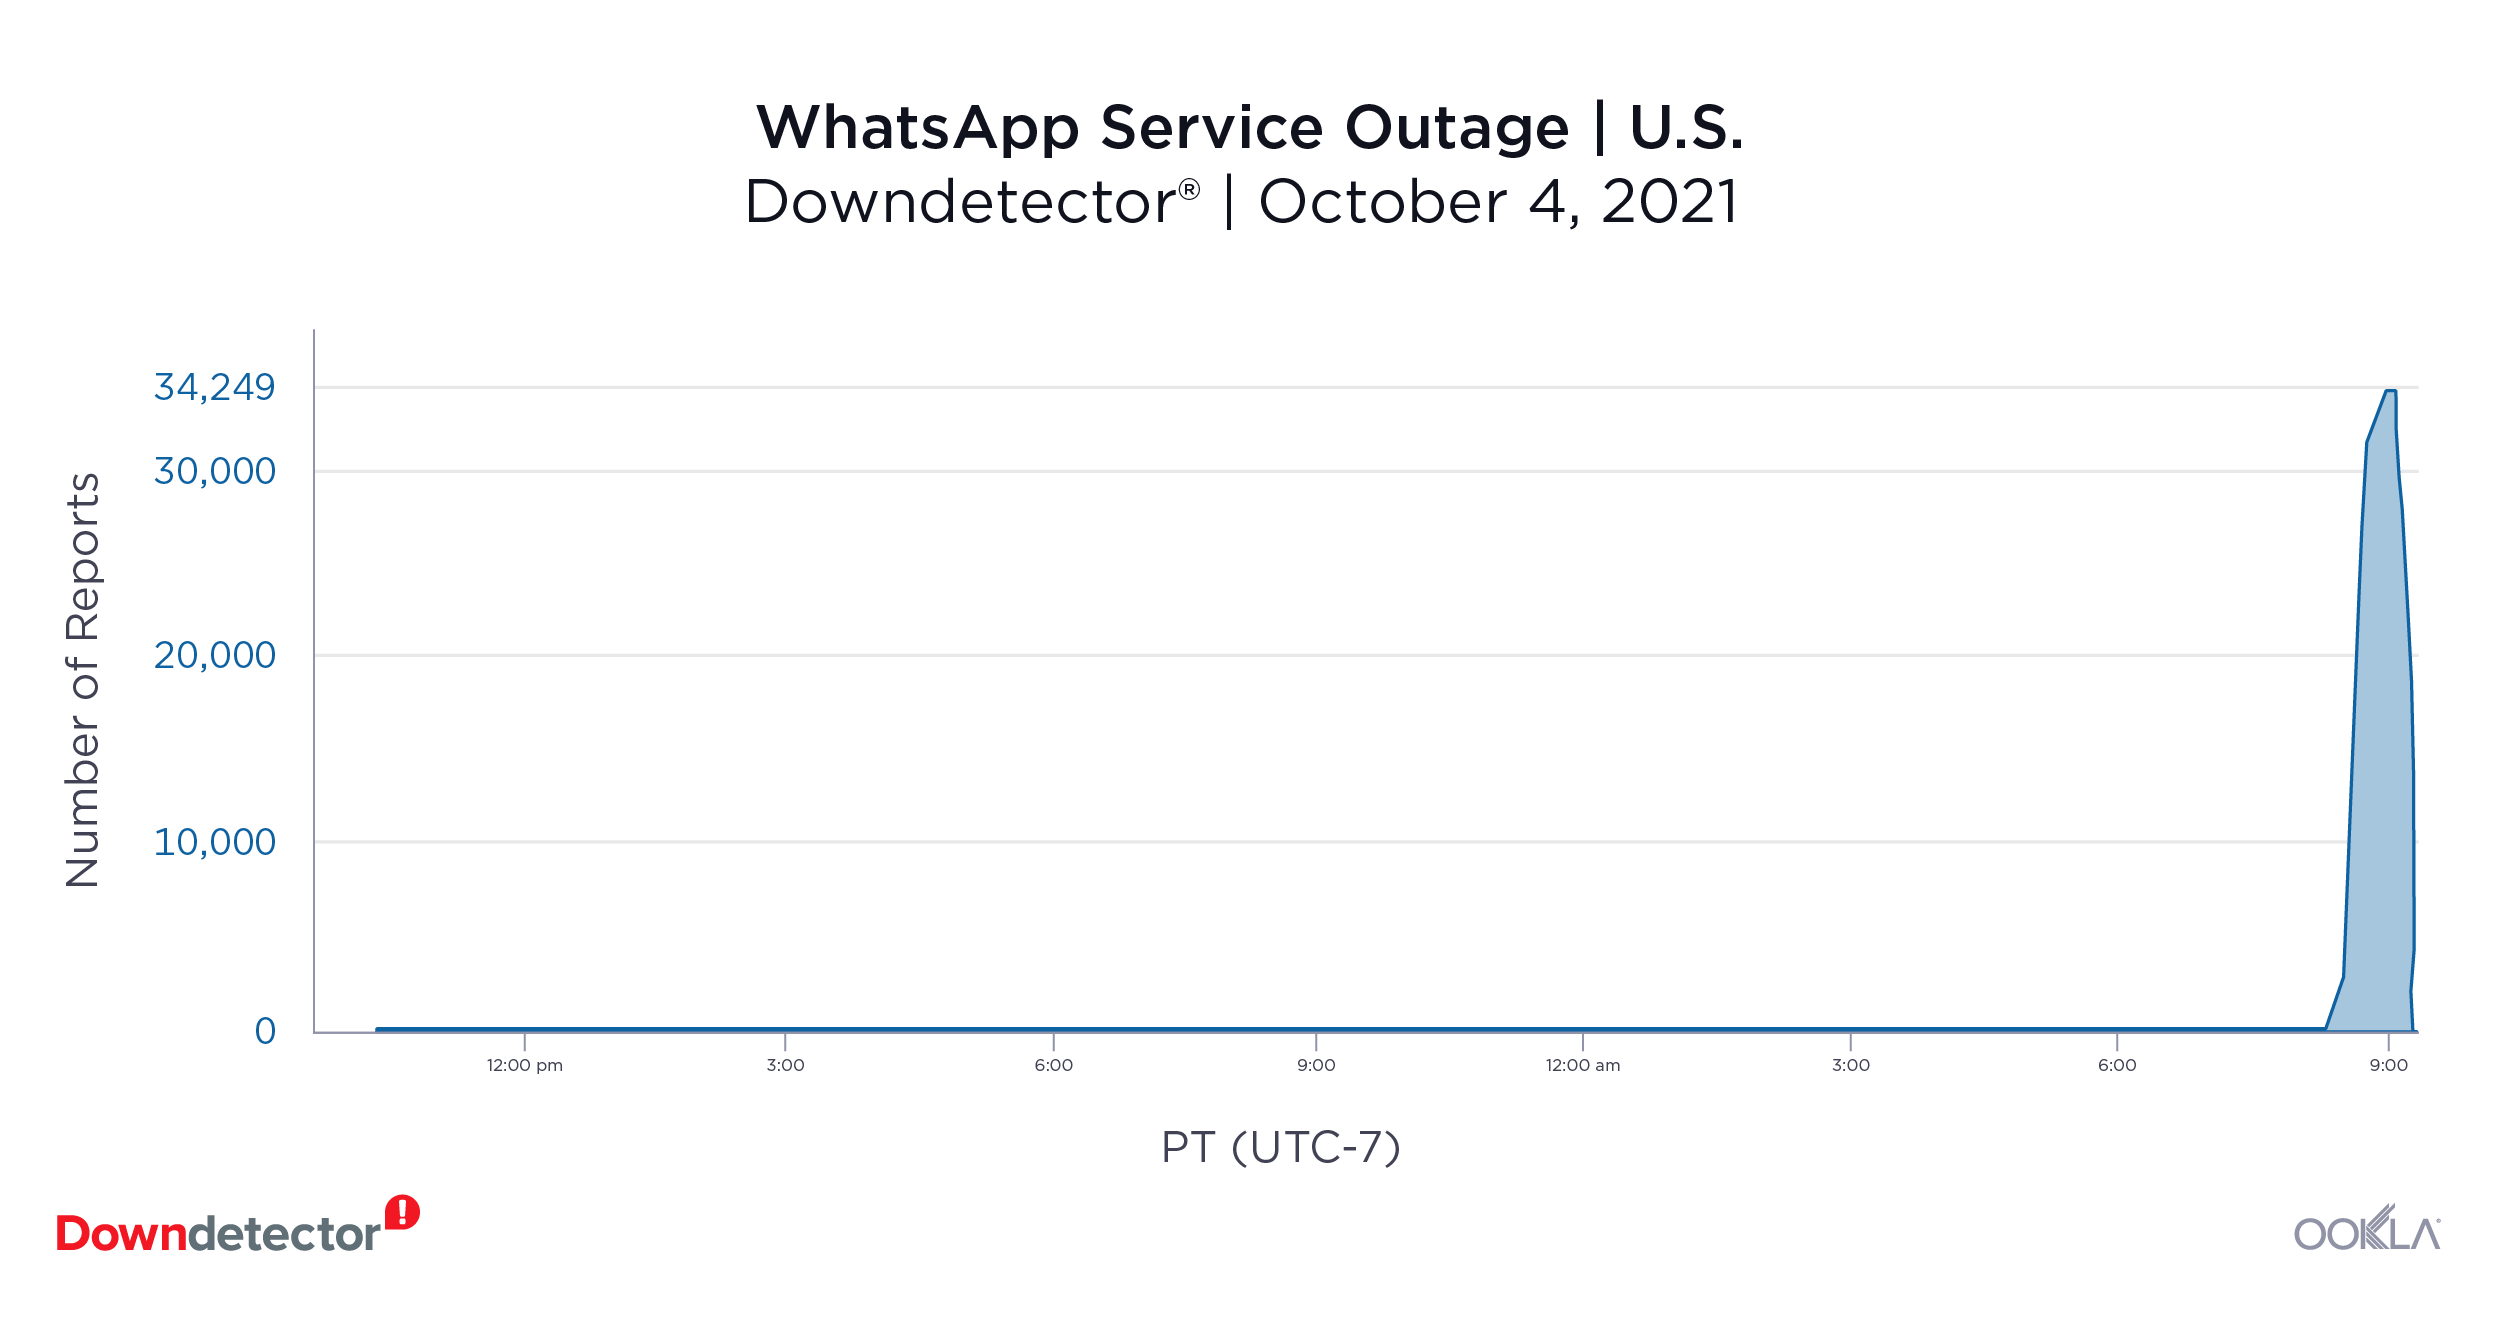
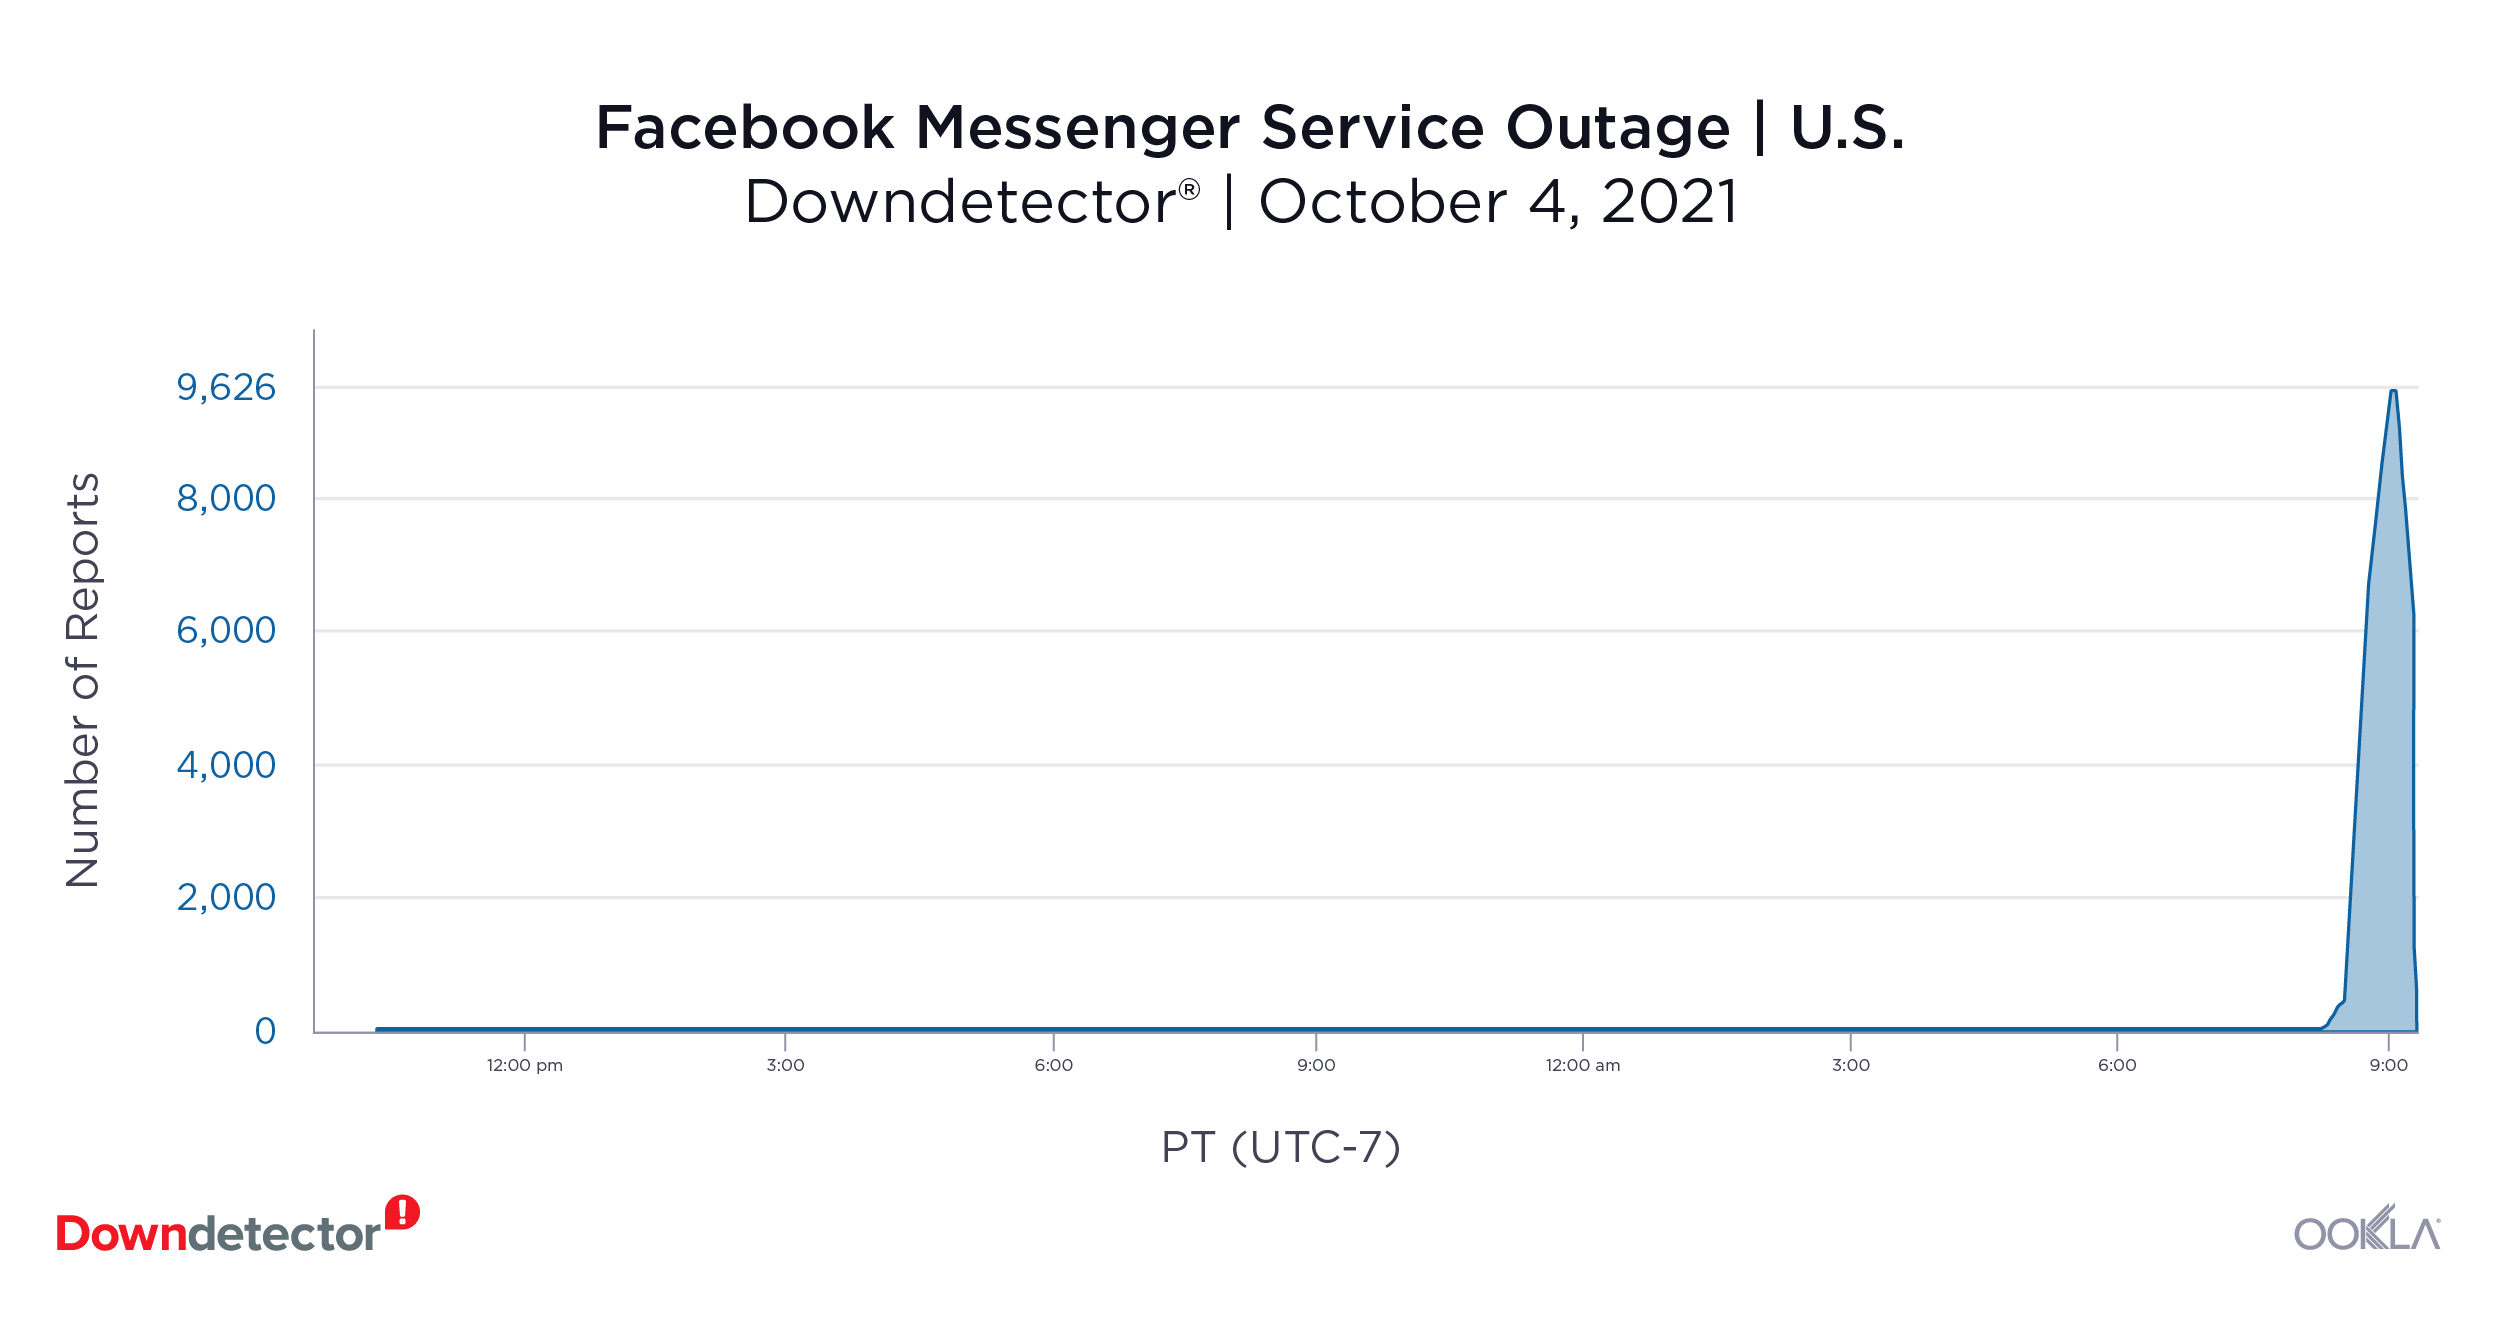
In the U.S. alone there were upwards of 123,000 problem reports for Facebook, 98,000 for Instagram, 34,000 for WhatsApp and 9,800 for Facebook Messenger. Most users are reporting troubles with the website and apps overall.

Downdetector_facebook_1021-01-1

Downdetector_instagram_1021-01-1

Downdetector_whatsapp_1021-01-1

Downdetector_facebook_messenger_1021-01-1

This outage is still very much ongoing. Turn to the Downdetector pages for Facebook, Instagram, WhatsApp and Facebook Messenger for up to the minute updates.

Editor’s note: This article changed form on October 4 to include a timetable of updates. The content itself was unchanged.

Ookla retains ownership of this article including all of the intellectual property rights, data, content graphs and analysis. This article may not be quoted, reproduced, distributed or published for any commercial purpose without prior consent. Members of the press and others using the findings in this article for non-commercial purposes are welcome to publicly share and link to report information with attribution to Ookla.

| June 3, 2020

Efficiently Design and Optimize Your Network with Crowdsourced Data (Webinar)

Mobile network operators are currently faced with a double challenge. With much of the globe still under stay-at-home orders, consumers are increasingly reliant on the quality and availability of their networks — and worldwide, operators are facing both budget cutbacks and logistical limitations on traditional data collection methods like walk-testing and drive-testing. Now more than ever, network planners and engineers must prioritize their decisions to have the maximum impact on customer experience with the minimum associated cost.

In Ookla’s upcoming webinar, we’ll show three real-world use cases where European operators can make low-cost or no-cost changes to their existing networks — without drive testing. By identifying competitors’ cell site locations and finding areas of high density and usage where competitor networks perform better, operators can use the crowdsourced data in Cell Analytics™ to prioritize improvements to their networks.

Read on to discover three ways operators can make smarter design and optimization decisions, and don’t miss the webinar on Wednesday, June 17, 2020 at 7am PDT / 10am EDT / 4pm CEST.


1. Identify populated areas where competitor networks outperform yours

Powered by hundreds of millions of signal measurements collected daily by Speedtest®, Cell Analytics provides intelligence about wireless service quality, RF measurements, data usage, user density (both indoors and outdoors), cell site locations and much more. By looking at areas with the highest user density and data usage, you can identify areas where people need a strong connection — and see where competitors provide better wireless service.

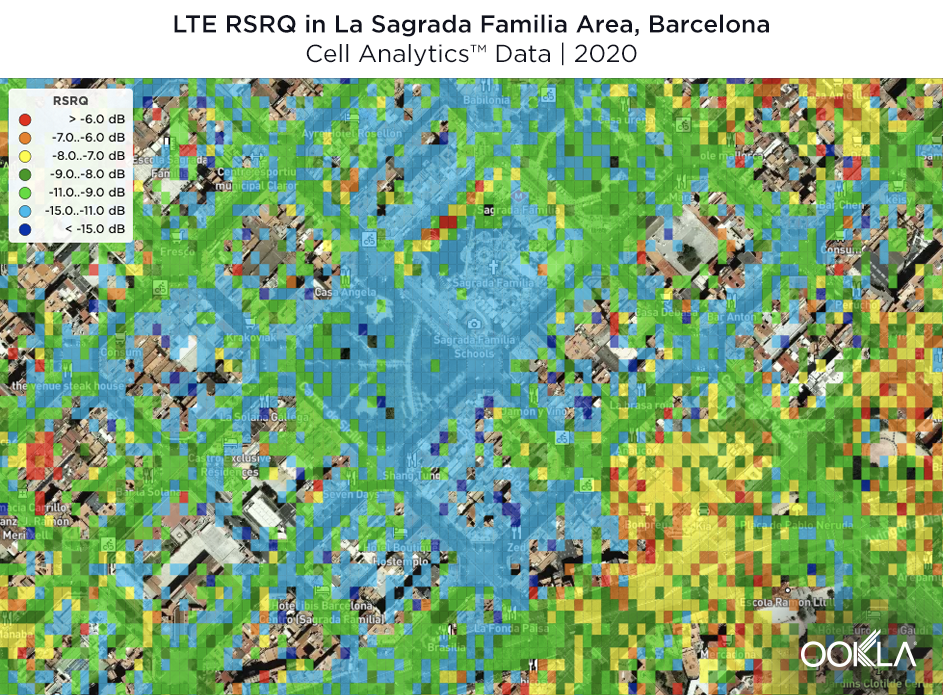
webinar-screenshot_LTE_RSRQ_Barcelona

In the above example, we can see signal quality for a given operator both in and around one of Barcelona’s most popular locations, La Sagrada Familia cathedral. By looking at real-world measurements, you can discover the highest-priority places to invest in capacity expansion or relatively simple fixes like antenna downtilt or network parameter changes.

2. Identify competitor cell sites and monitor new cell site deployments

Without visibility into your competitors’ network performance, quality and availability, it can be difficult to benchmark your own network metrics. Crowdsourced data provides actionable intelligence to assess your network performance inside and outside of buildings and to compare your network to competitors’. Use the Cell Site Finder tool in Cell Analytics to discover the location of competitor cell sites, analyze your performance vs. competing networks and identify opportunities for potential collocation or new deployments.

webinar-screenshot_LTE_RSRP_London

In the above example, we have cross-referenced the location of various network operators’ cell sites with RSRP in two busy shopping locations near London’s Wembley Stadium. From this, we can see the location of all cell sites in the area and a precise view of the service they are delivering. By viewing the coverage of individual competitor sites, you can avoid costly errors that result from relying on RF prediction tools alone during new cell site design.

3. Identify ways to make low-cost improvements to your existing network

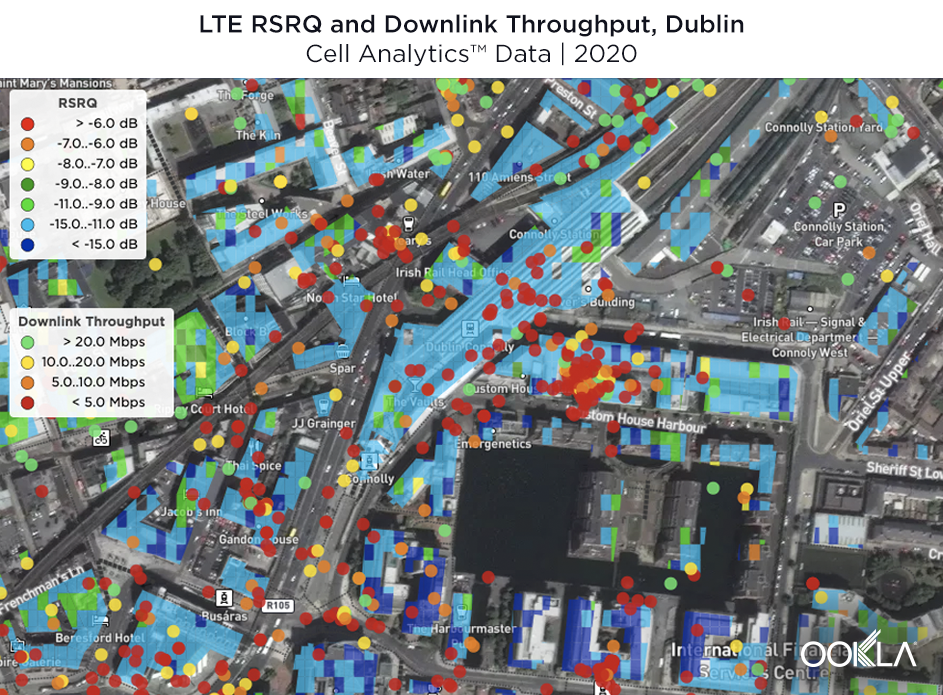
Once you’ve prioritized the areas where improvements are most needed, dig into our data to see why users might be experiencing poor network performance and low data quality. To troubleshoot the underlying issues, you can analyze serving cells and band usage in high resolution and then look at the relation between RF conditions and service indicators like throughput, latency and jitter.

webinar-screenshot_LTE_RSRQ_Dublin

By comparing one operator’s RSRQ with downlink throughput in Dublin’s busiest railway station, we can pinpoint the exact sites that need adjustment to increase the quality of service for this operator. This type of data shows you where a relatively easy fix like antenna azimuth or downtilt changes might help.

To see in-depth recommendations for the operators in the above scenarios, don’t miss the webinar on June 17. If you cannot make the presentation, you can register to receive a video recording after the live event. We look forward to showing you how to leverage real-world data to make better network decisions and answering any questions you may have. Register now.

Ookla retains ownership of this article including all of the intellectual property rights, data, content graphs and analysis. This article may not be quoted, reproduced, distributed or published for any commercial purpose without prior consent. Members of the press and others using the findings in this article for non-commercial purposes are welcome to publicly share and link to report information with attribution to Ookla.

| September 17, 2020

In Case You Missed It (ICYMI): Ookla Data and Analysis from August 2020

Welcome to this first edition of our monthly digest, where we’ll share highlights from the Speedtest Global IndexTM and links to recent articles of note.

Highlights from the Speedtest Global Index

Global-Index-Tweet-Image-Aug-2020

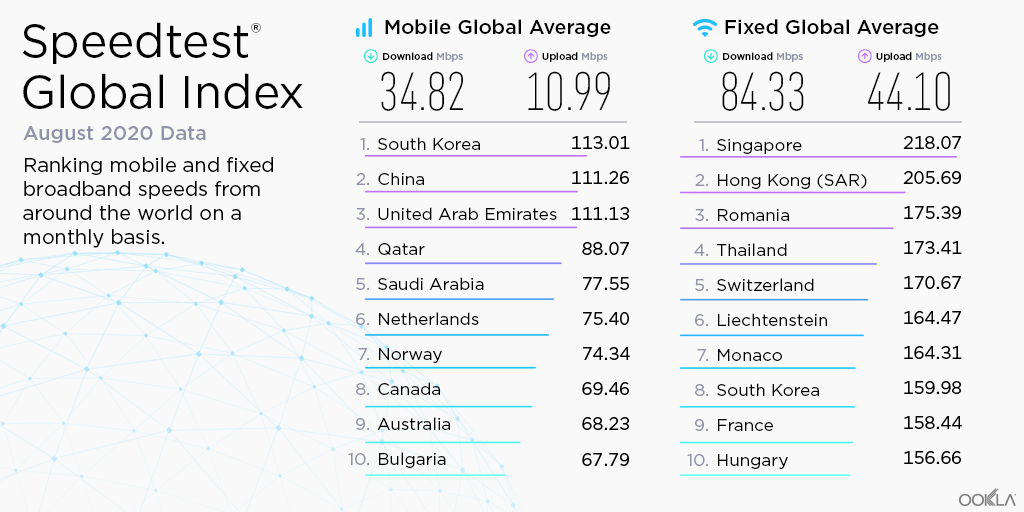
Every month the Speedtest Global Index tracks mobile and fixed broadband speeds across the world. These are the top stories from August 2020:

  • China moved up to second place on mobile for the first time
  • Denmark jumped 14 places on mobile, recovering from a July dip
  • Hungary was back in the top ten for fixed broadband for the first time since November 2019

Articles worth a second look

Introducing New 3D Views of Network Performance and Coverage in Cell Analytics

New 3D “z-axis” views in Cell Analytics allow mobile network operators to spot problems at specific elevations.

Exploring the Relationship Between Network Performance and NPS in Taiwan

Learn how customers’ ratings of mobile operators in Taiwan compare to the speeds they are receiving.

SpatialBuzz Joins Ookla

Ookla acquires SpatialBuzz.

How to Ensure Your Internet is Ready for Back to School

Tips for students, teachers, parents and administrators to troubleshoot internet connectivity for back to school.

Ookla retains ownership of this article including all of the intellectual property rights, data, content graphs and analysis. This article may not be quoted, reproduced, distributed or published for any commercial purpose without prior consent. Members of the press and others using the findings in this article for non-commercial purposes are welcome to publicly share and link to report information with attribution to Ookla.

| December 10, 2020

Massive Expansions and Huge Improvements in Speed: The Worldwide Growth of 5G in 2020

The rapid expansion of 5G in countries across the globe was a bright spot in a year that needed one. But just how great is the news? We examined Speedtest Intelligence® data from over 60.5 million Speedtest® results during Q3 2020 to see how much speeds have improved, where download speeds are the fastest at the country and capital level, where 5G deployments have increased and what worldwide 5G coverage looks like now. We also looked at countries where 5G doesn’t yet reach to understand where good news might be on the horizon.

We have only included countries with commercially available 5G on these lists in order to provide a more accurate view of the performance consumers can reasonably expect. While our data shows results for many countries where 5G is not yet commercially available, these tests are likely results from engineers testing their own networks. In addition, we’re only providing analysis for countries with more than 200 samples during Q3 2020. The bars shown in our charts are 95% confidence intervals, which represent the range of values in which the true value is likely to be. Countries marked in tables with an asterisk first launched 5G commercially in 2020.

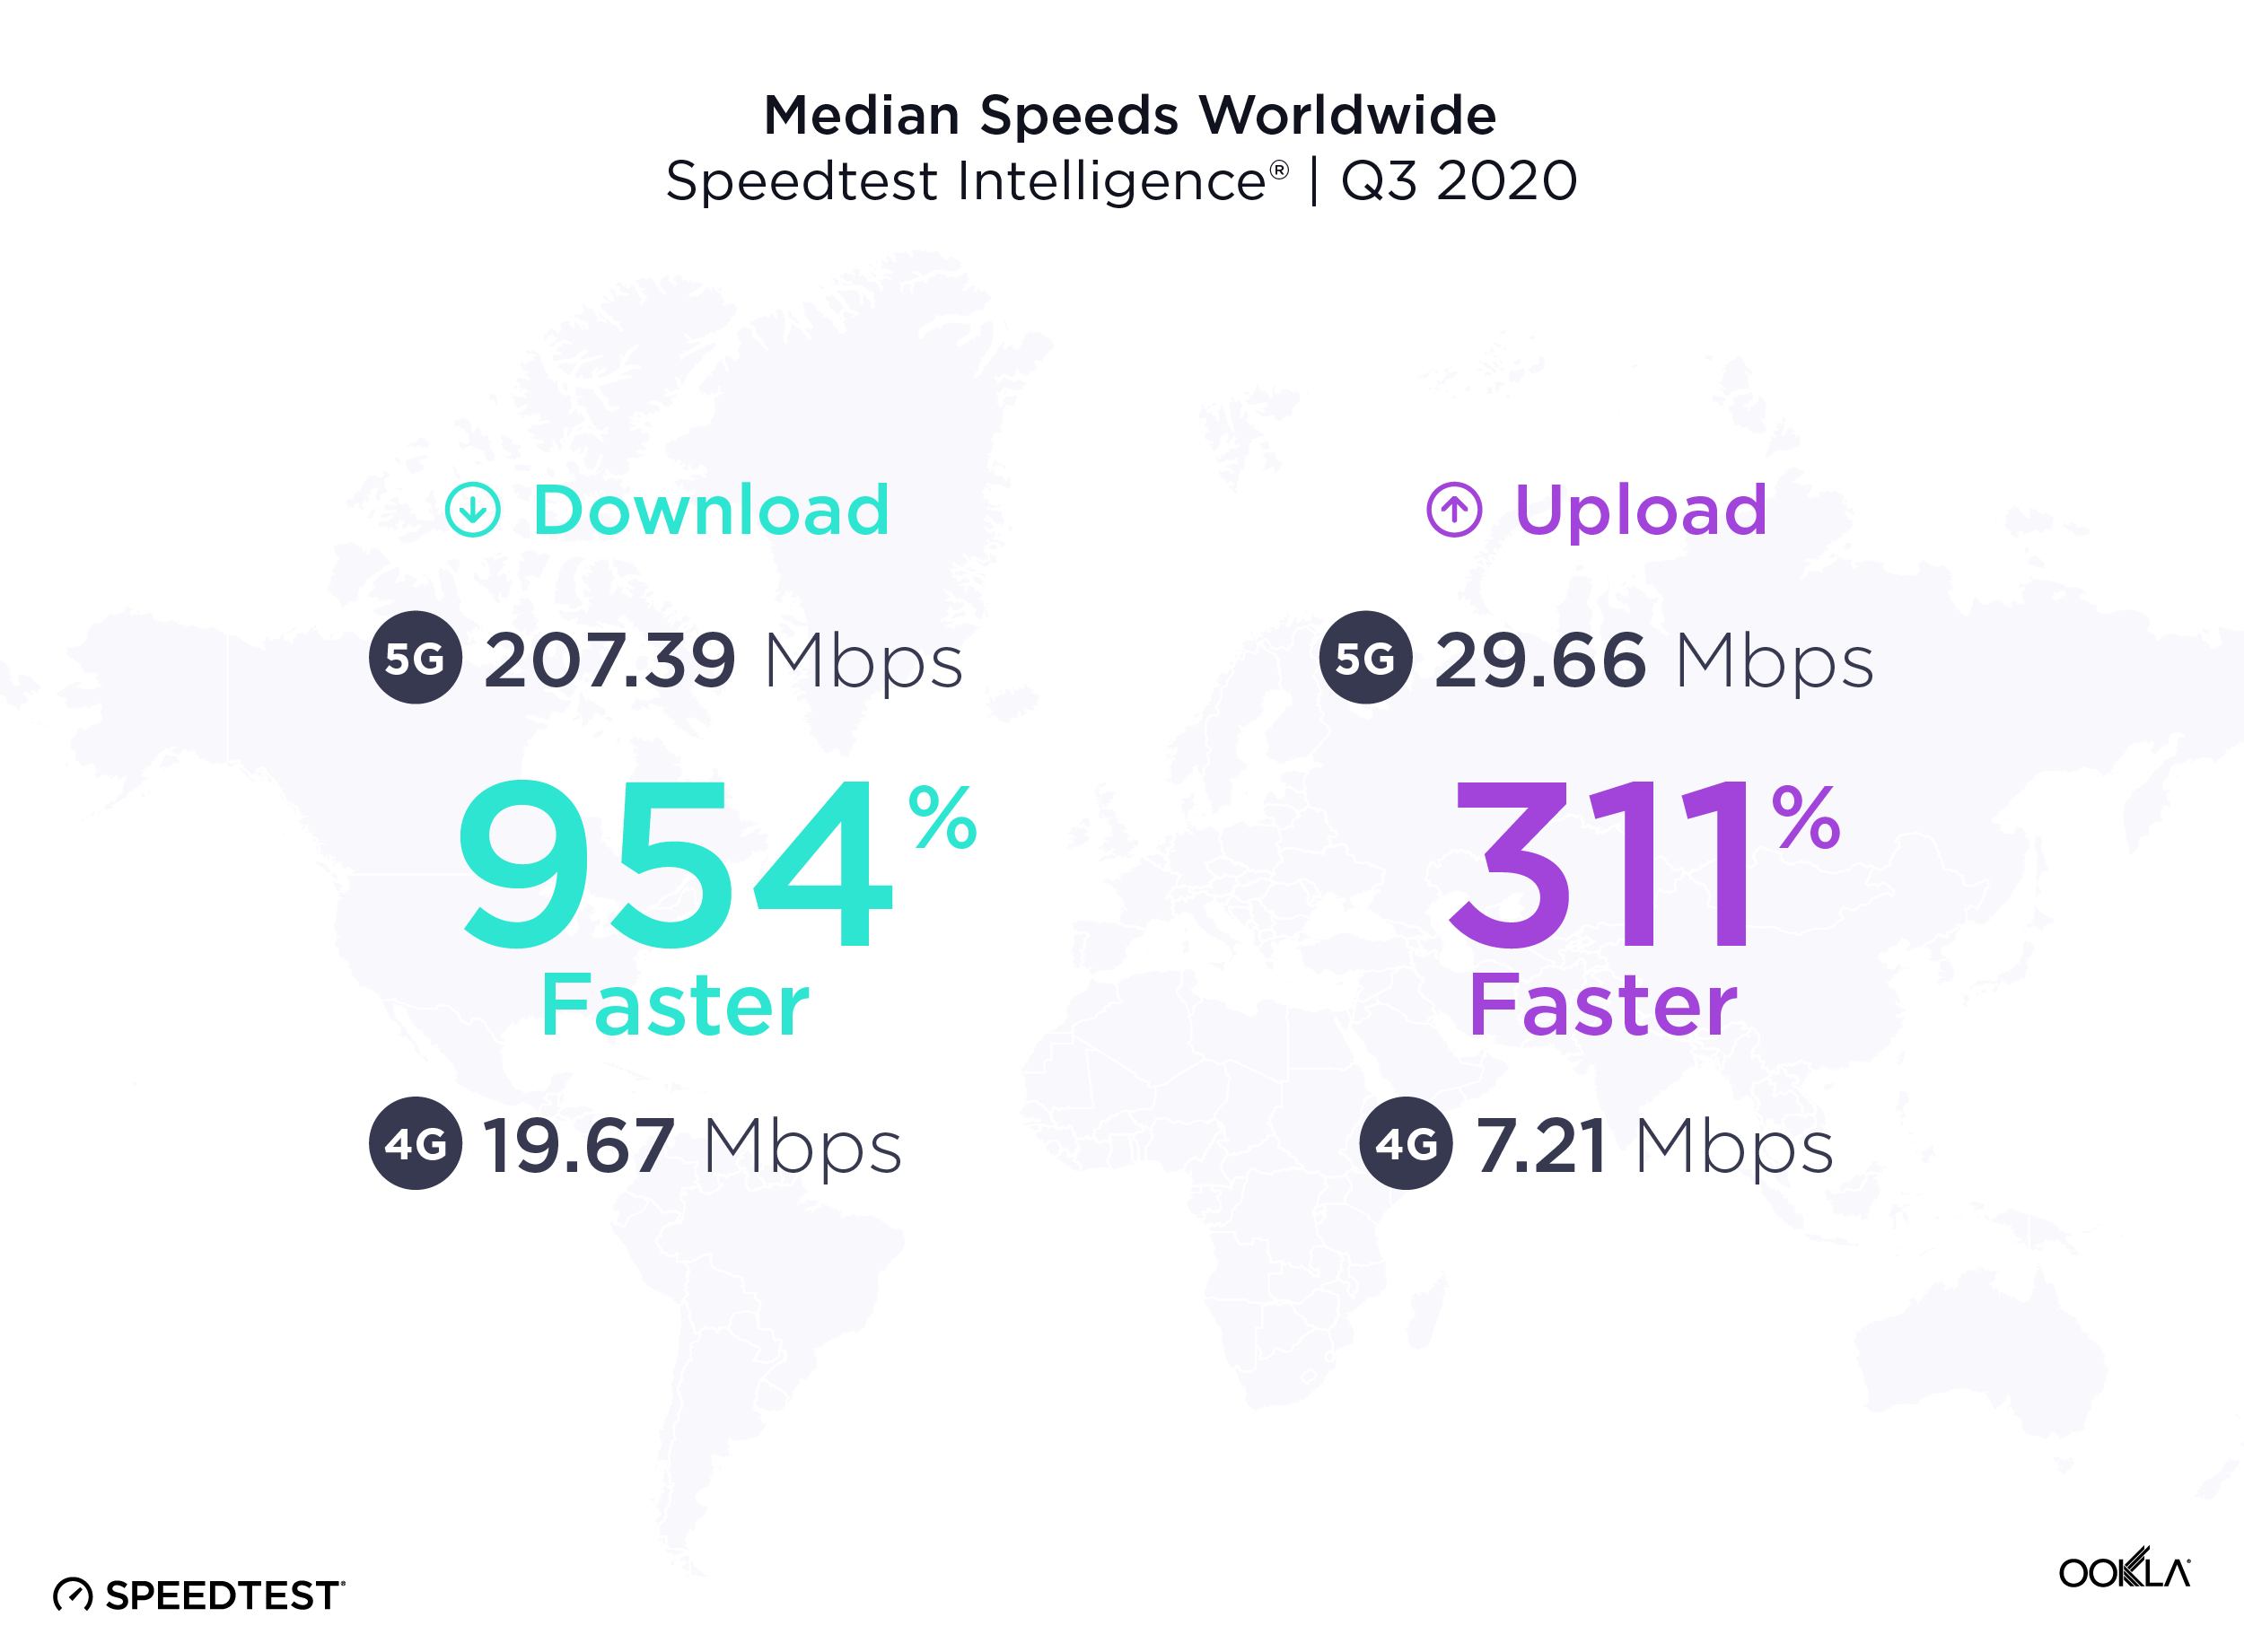
5G downloads were 954% faster than 4G at the global level

The worldwide median download speed over 5G was 954% faster than that over 4G during Q3 2020. Median upload speed over 5G was 311% faster than that over 4G. Consumers are eagerly adopting the new technology and many have wanted to measure the full throughput capacity of their network connection. In Q3 2020 alone, there were 4,324,788 Speedtest results over 5G.
Median-Speeds-Worldwide_1220-1

United Arab Emirates had the fastest 5G

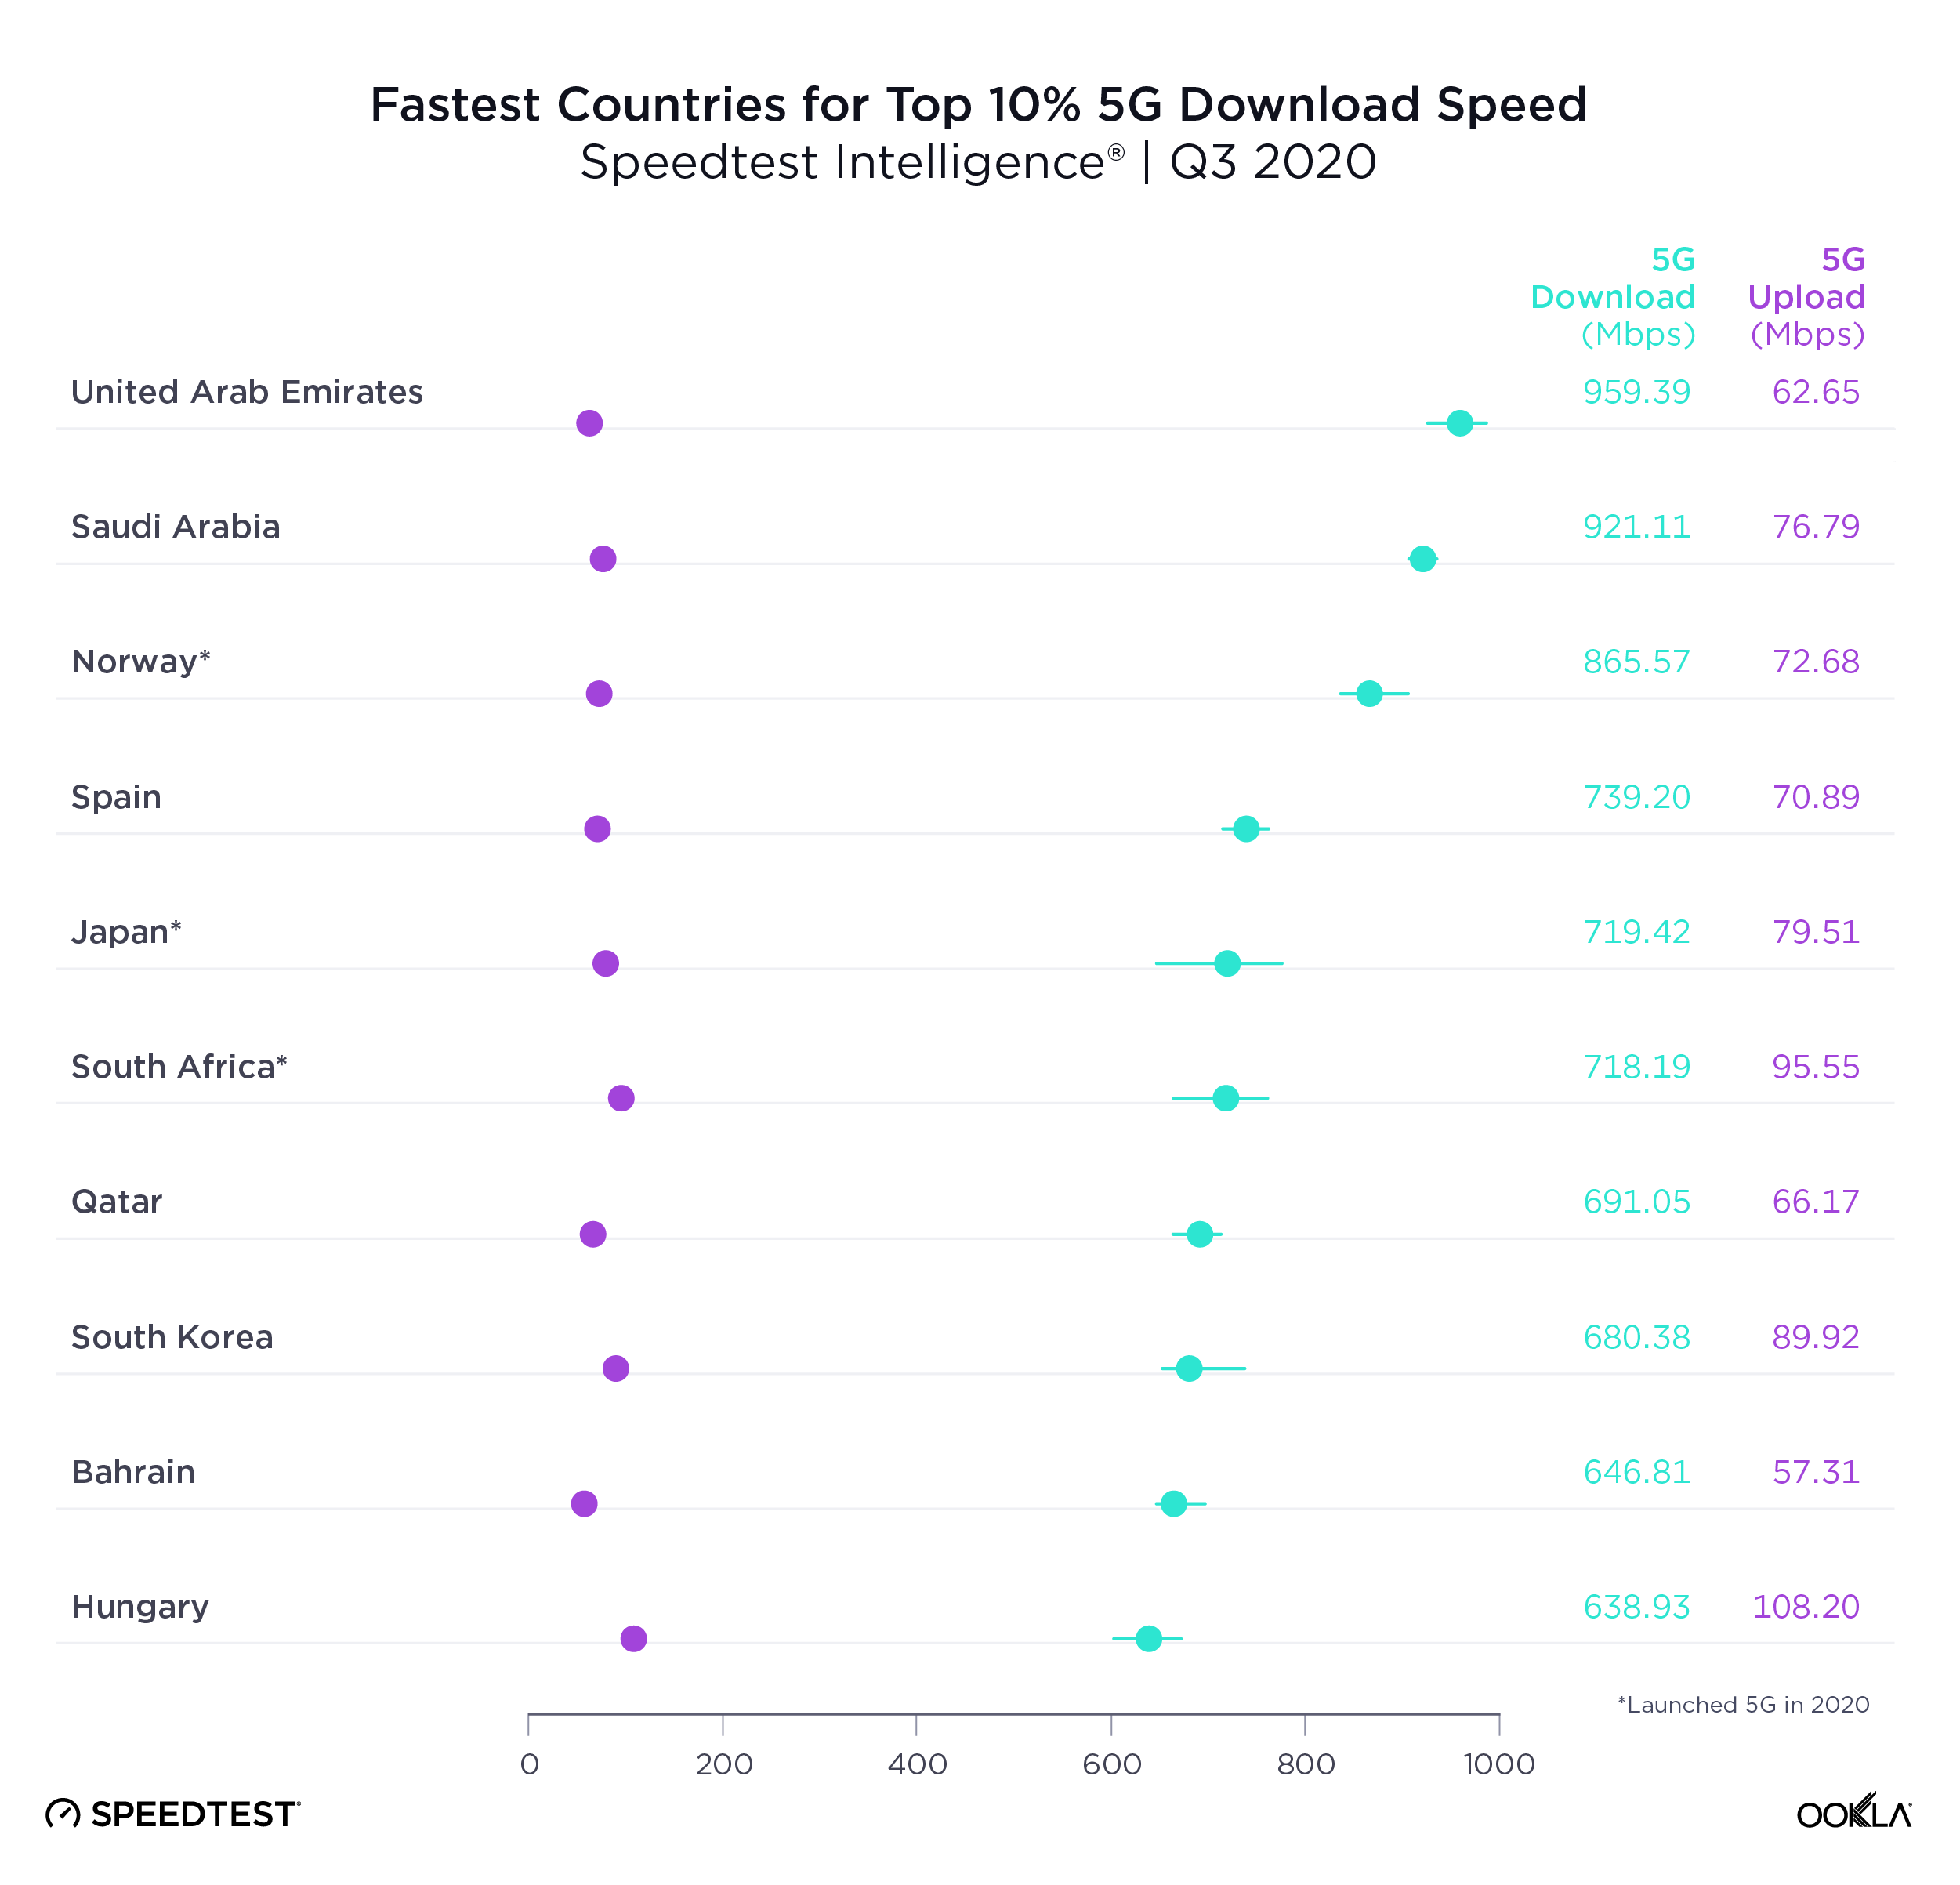
United Arab Emirates topped the list of countries with the fastest top 10% 5G download speed in Q3 2020. Top 10% (or 90th percentile) measures the speeds seen by the fastest 10% of users and is a way to gauge what each country’s networks are capable of. Saudi Arabia was second for top 10% 5G download speed, Norway third, Spain fourth and Japan fifth.
Fastest-Countries-Top-5G-Download-Speed_1220-2

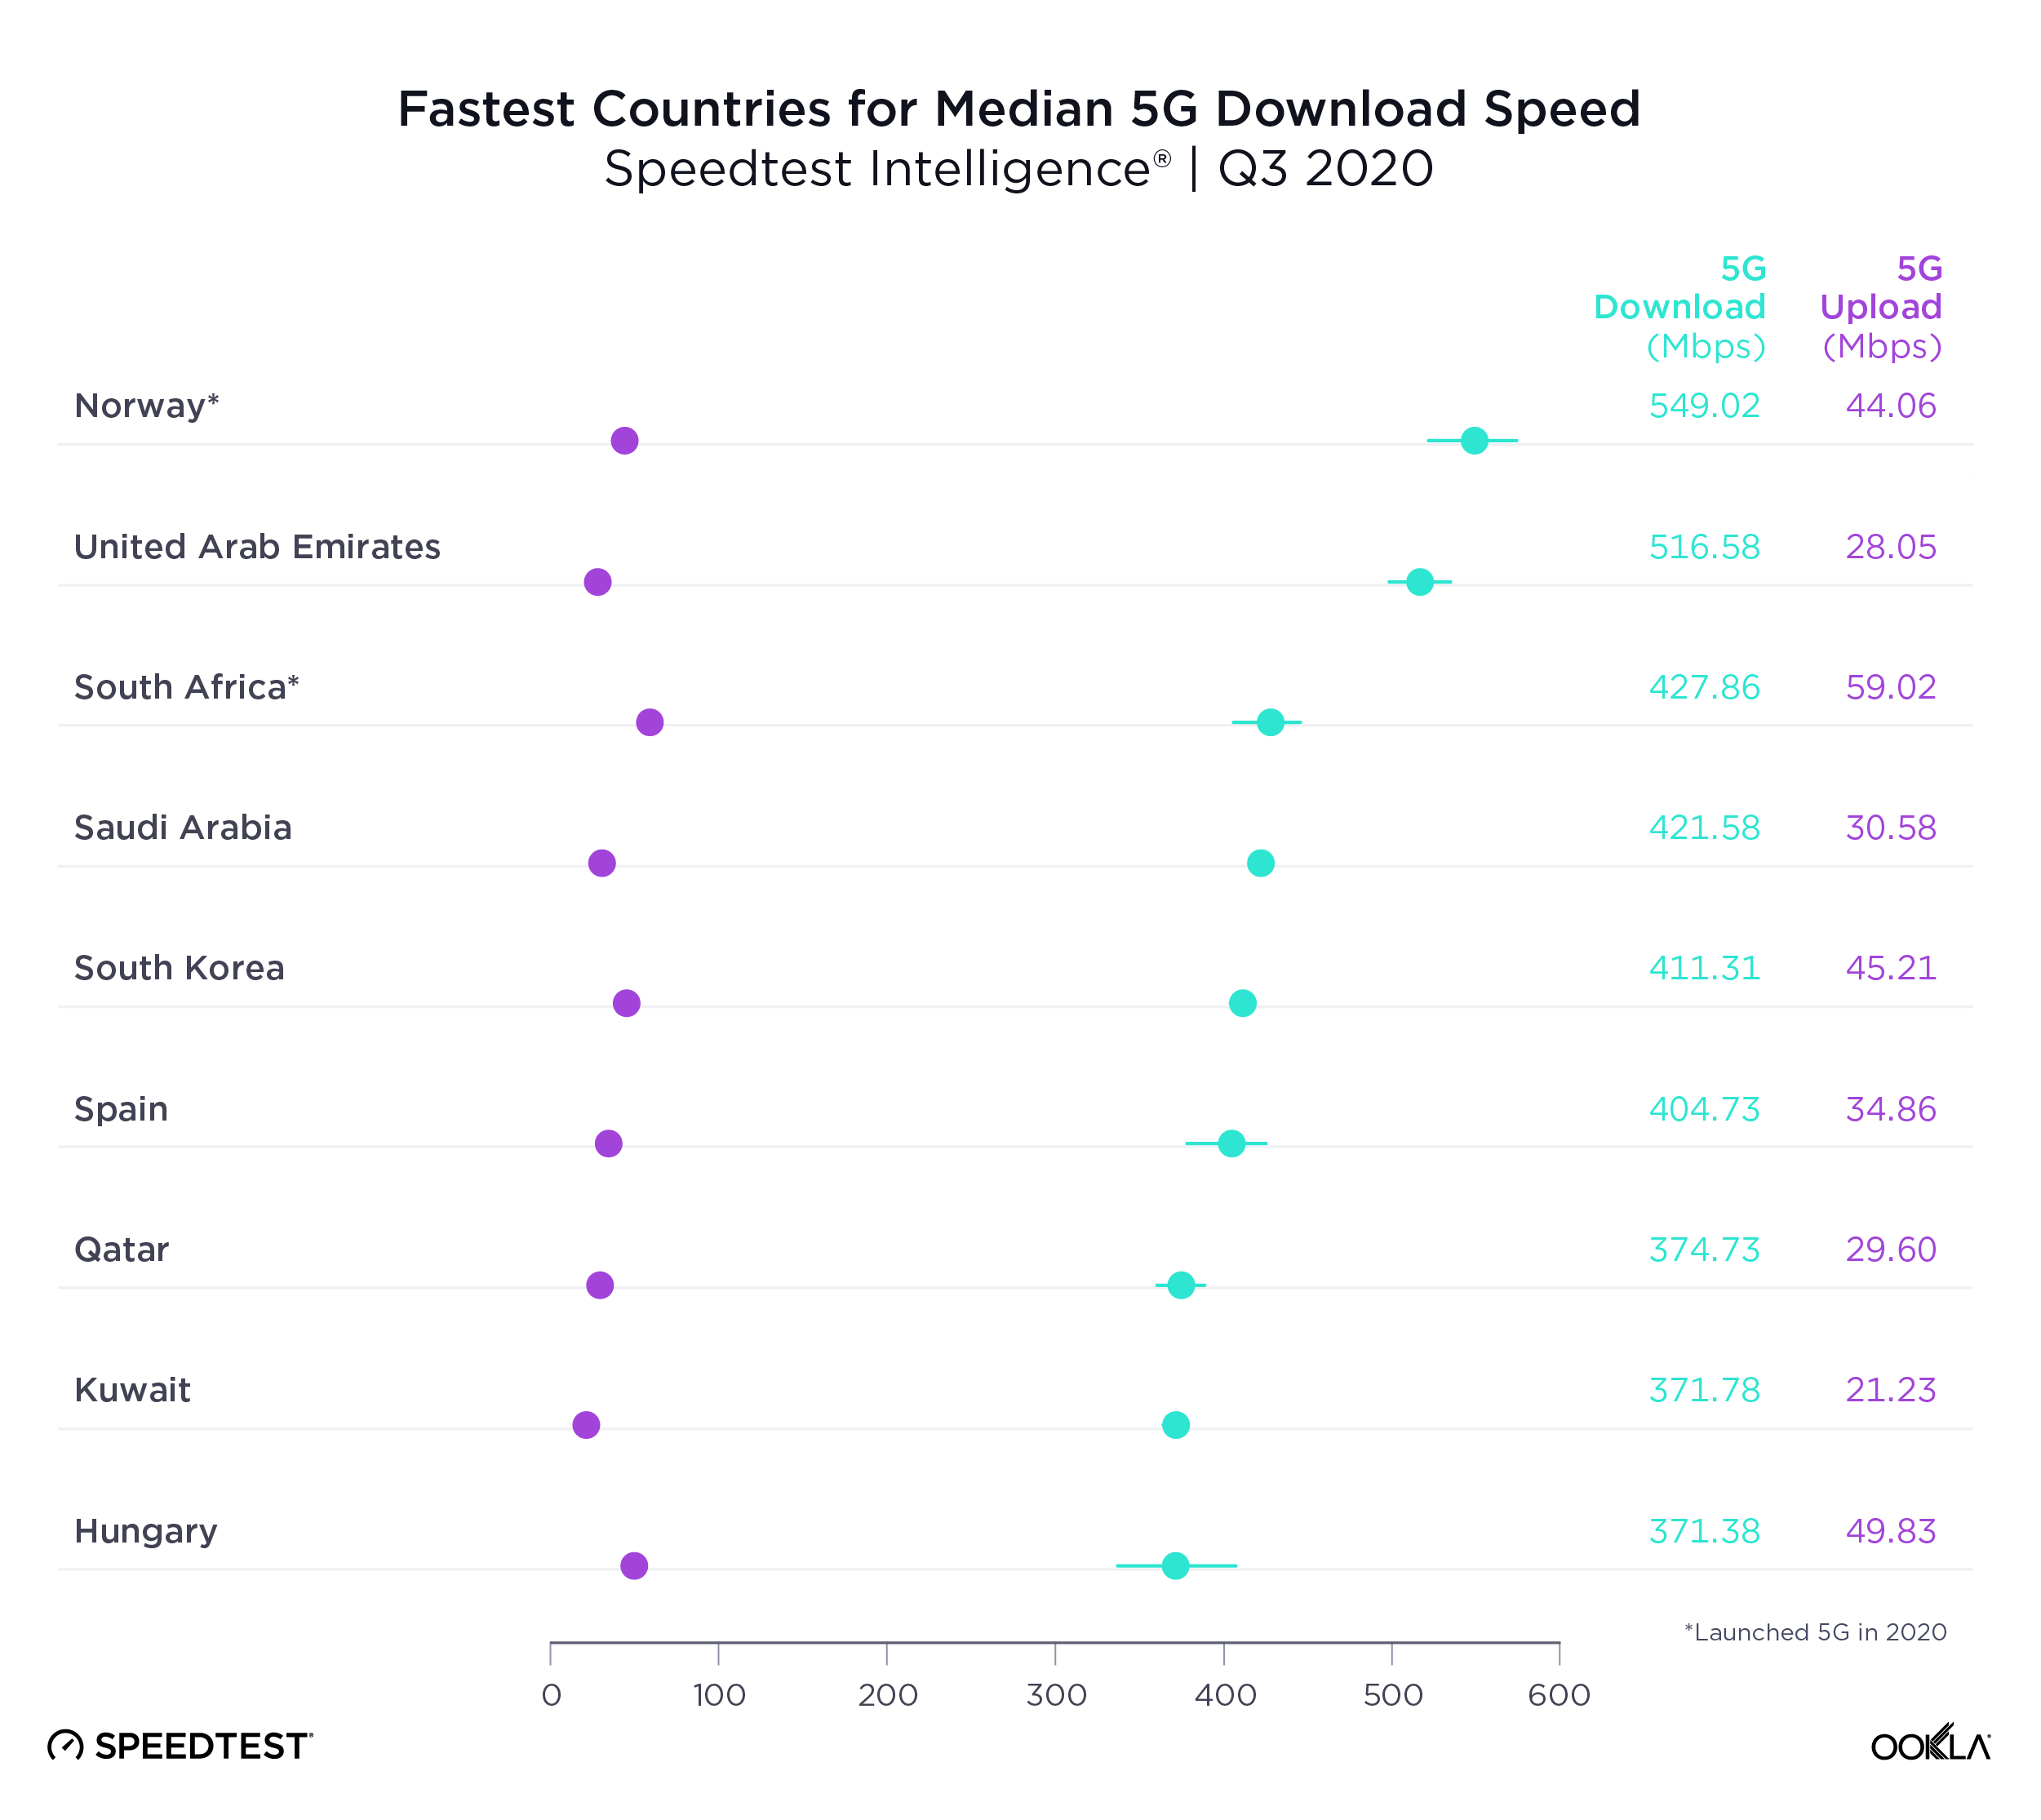
Another way to measure 5G performance is to look at median 5G download speed, which is a better predictor of the kind of performance most 5G customers can expect. Norway was the country with the fastest median download speed over 5G during Q3 2020. U.A.E. was second in this category, South Africa third, Saudi Arabia fourth and Spain fifth.
Fastest-Countries-Median-5G-Download-Speed_1220-2

It’s notable that Japan was on the list of 10 countries with the fastest top 10% 5G download speed but not on the list of 10 countries with the fastest median download speed over 5G. No matter how fast a country’s mobile infrastructure is, many other factors go into median 5G speeds, including device adoption and spectrum allocation.

Abu Dhabi tops list of 5G speeds in world capitals

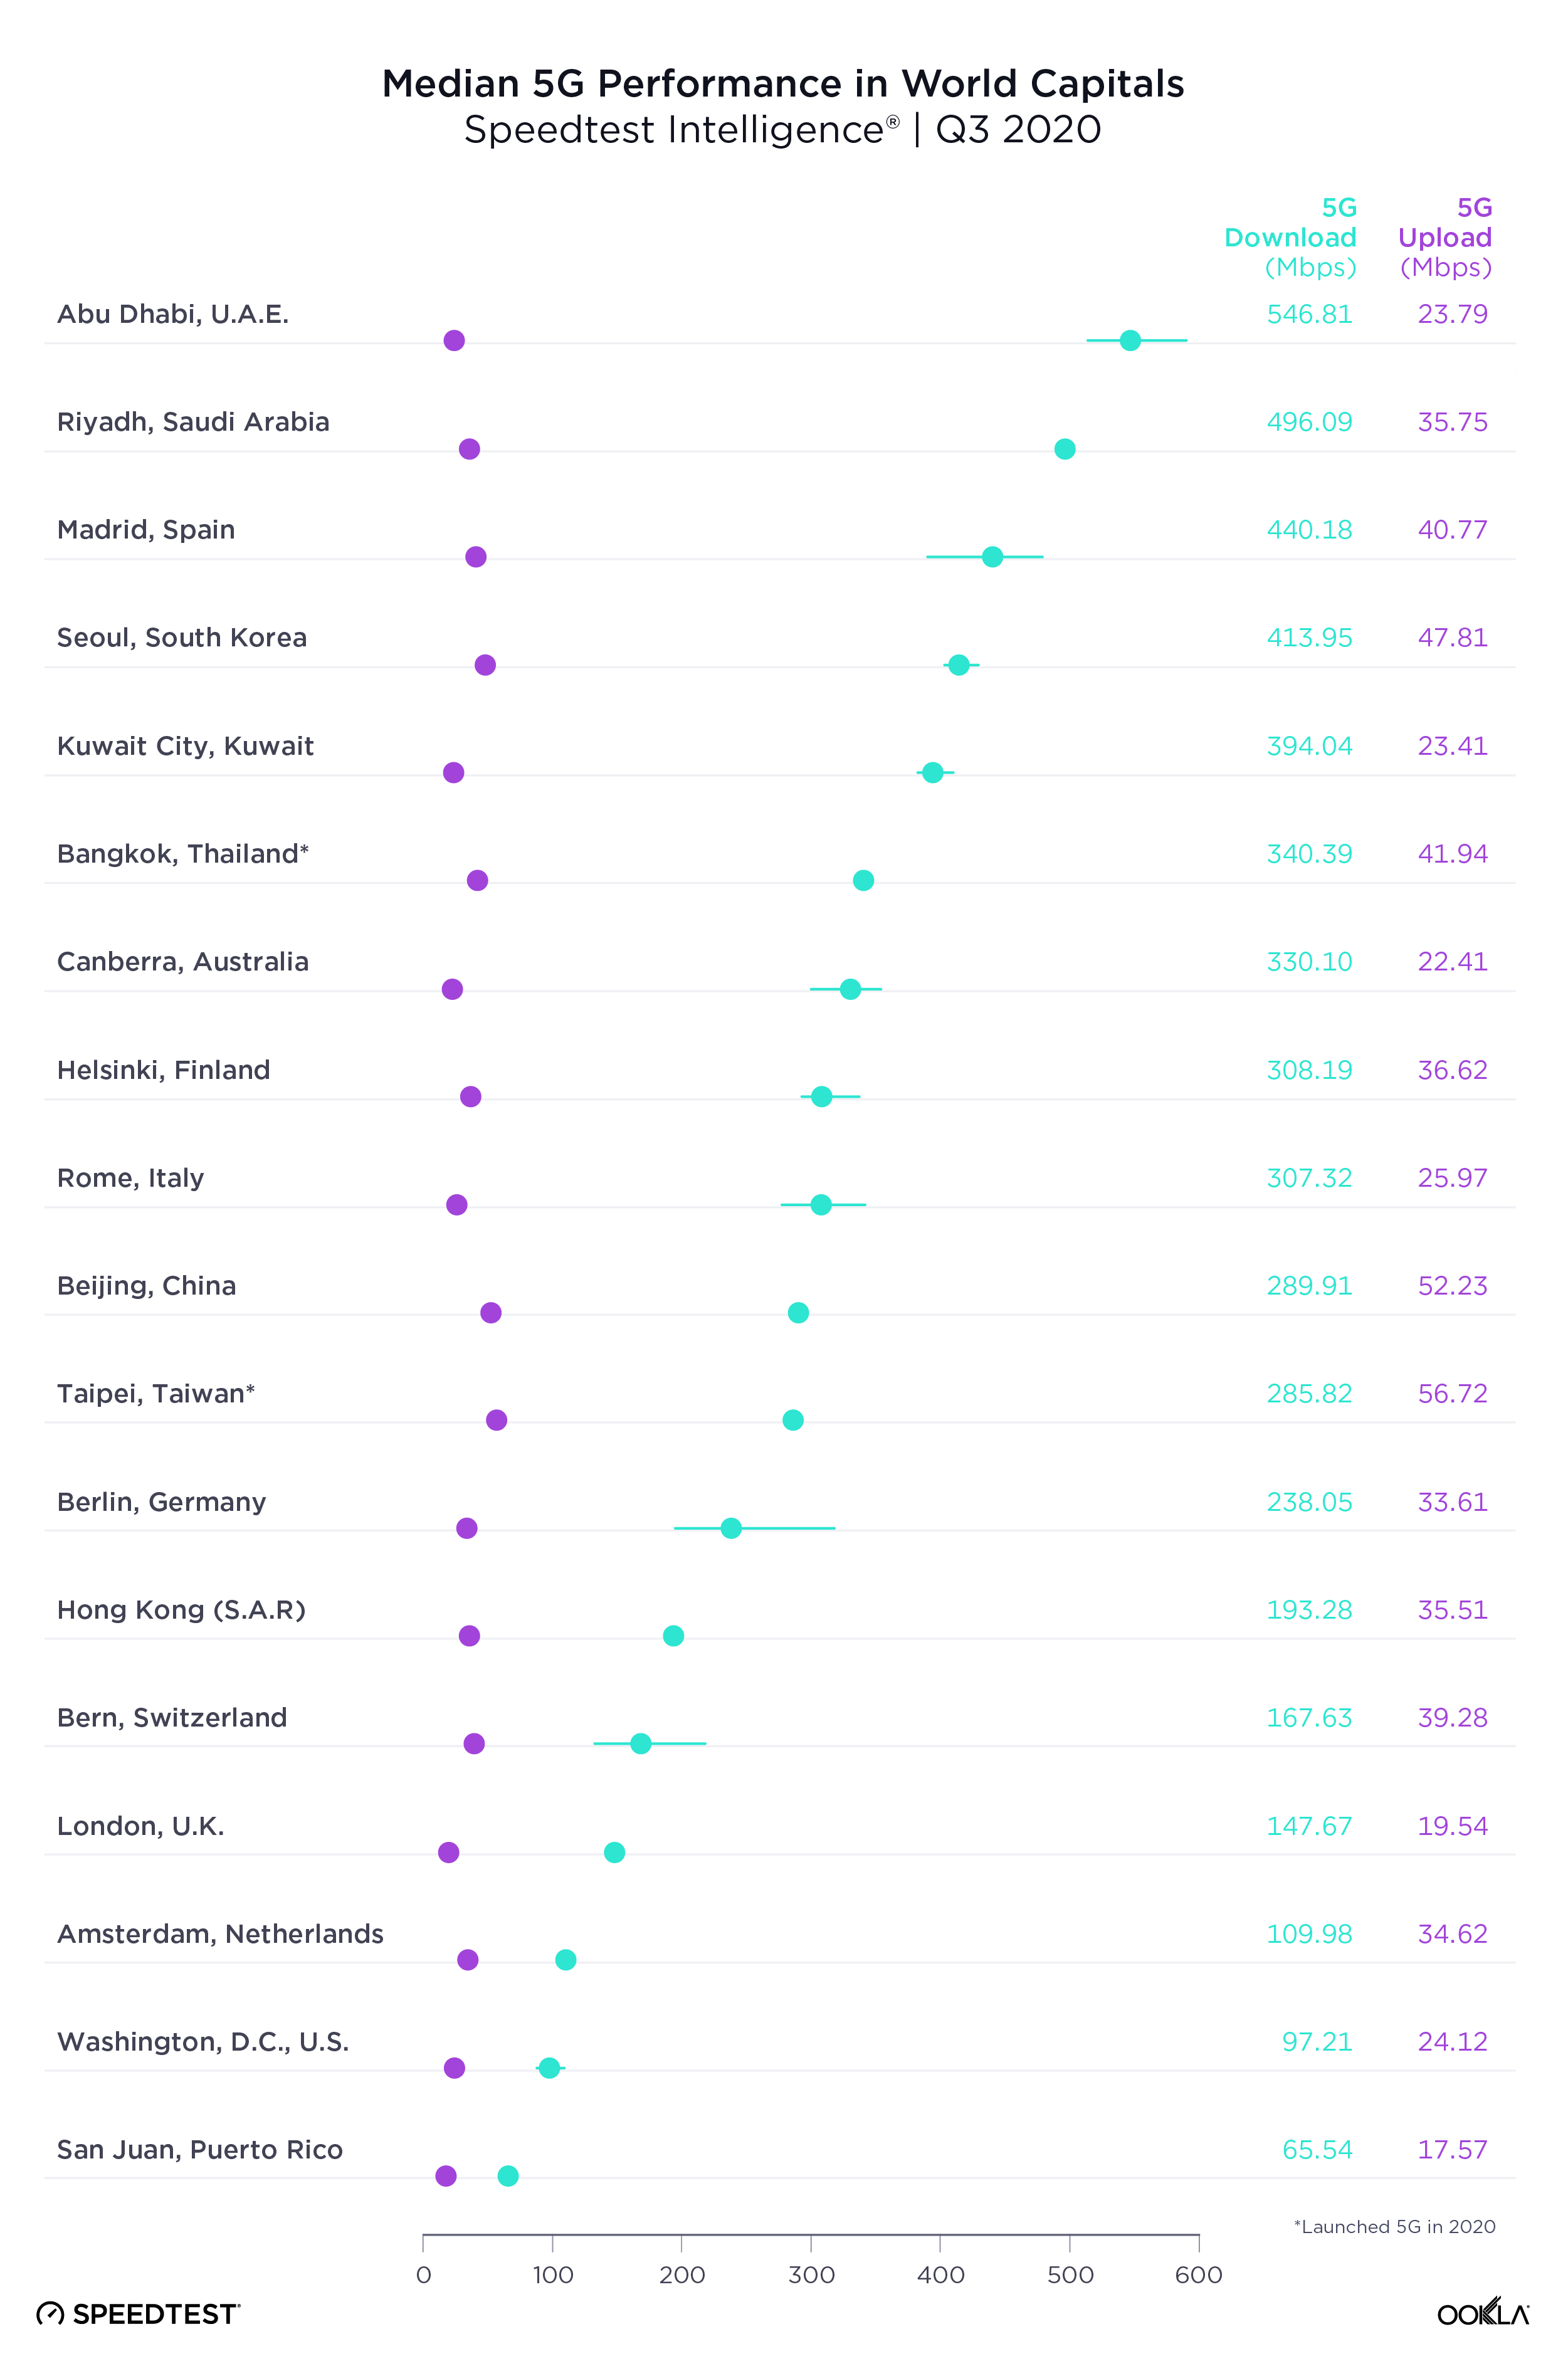
Our examination of 5G performance for 18 world capital cities with 5G during Q3 2020 found that Abu Dhabi had the fastest median download speed over 5G at 546.81 Mbps. Riyadh was second, Madrid third, Seoul fourth and Kuwait City fifth. As we saw at the country level, median upload speed was much lower than download speed.
Median-5G-Performance-Capitals_1220-2

How 5G performance and time spent compare within regions

We looked more closely at 5G performance across several intergovernmental organizations and trade blocs to get a better sense of how countries are performing in comparison to their neighbors and trade partners. We also calculated Time Spent on 5G, the proportion of time that users with 5G-capable devices spent on 5G, for each country.

Italy had the fastest 5G among G7 countries, U.S. the slowest

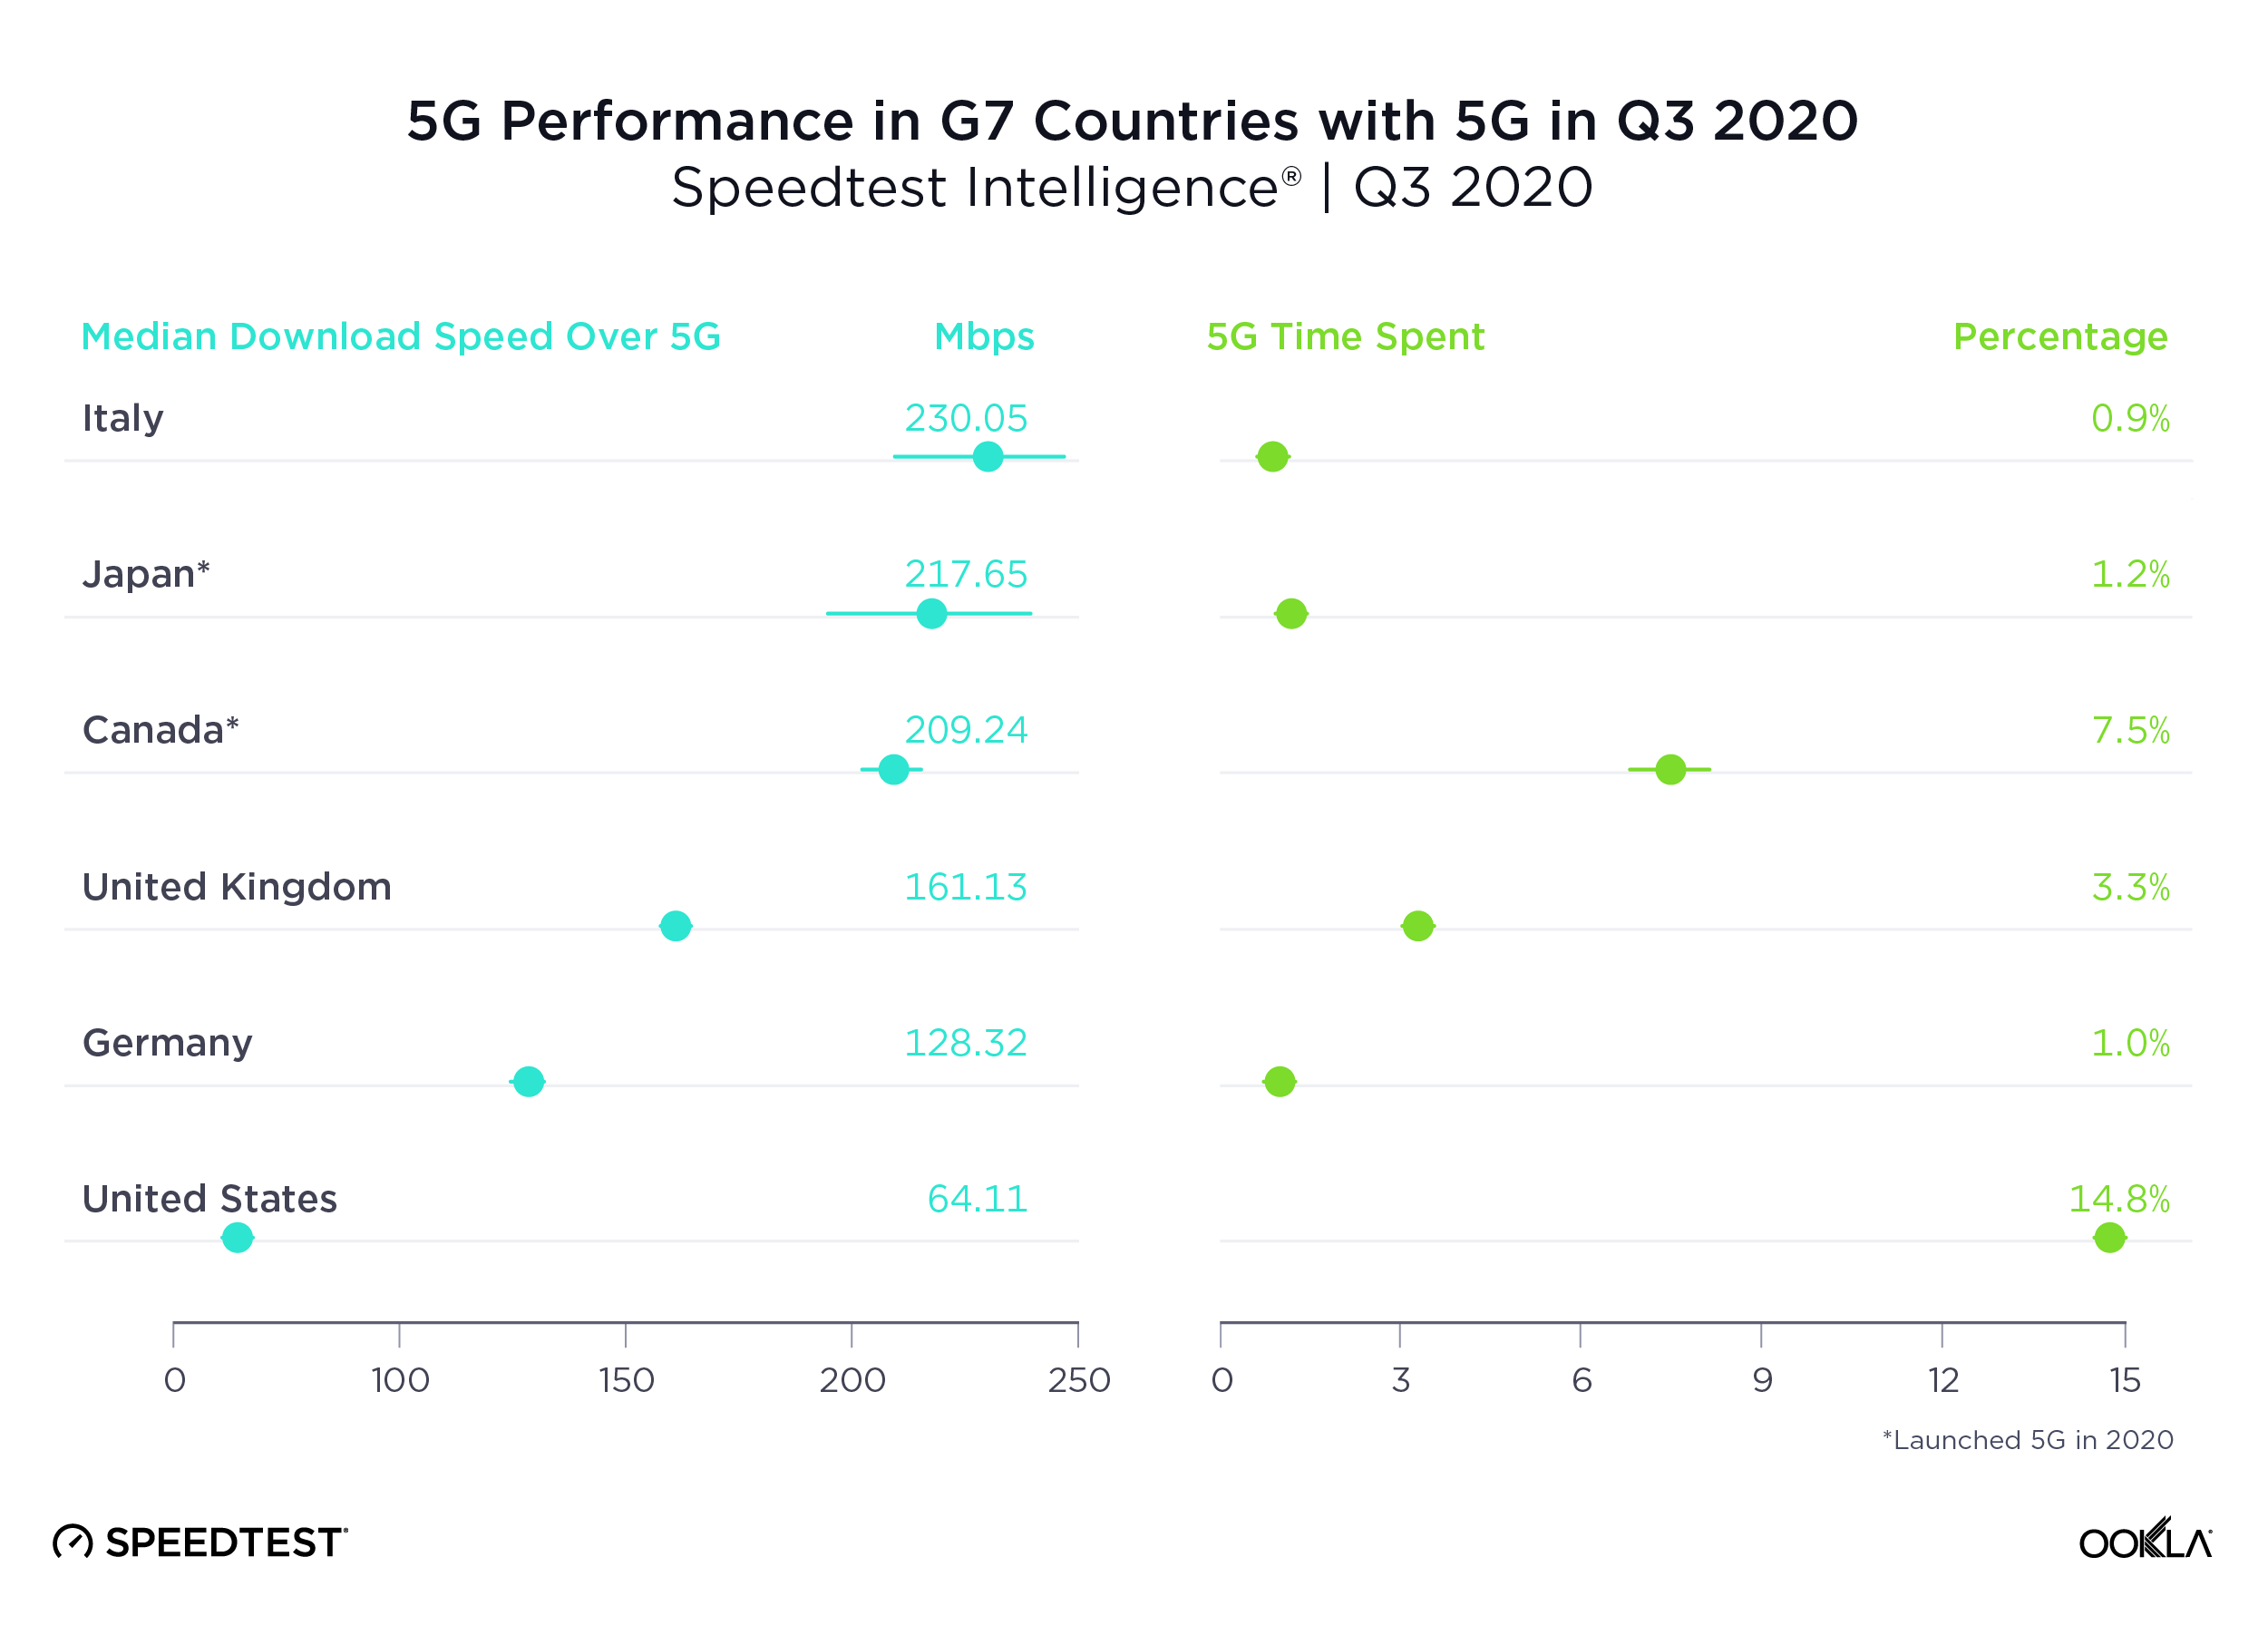
Italy had the fastest median download speed over 5G of all the G7 countries. Japan was second, Canada third, the U.K. fourth and Germany fifth. The U.S. had the highest Time Spent on 5G, followed by Canada. For a deeper analysis of 5G in the U.K., read our previous coverage. Because France launched commercially available 5G only within the last couple of weeks, we have not included it on this table.
5G-Performance-G7-Countries_1220

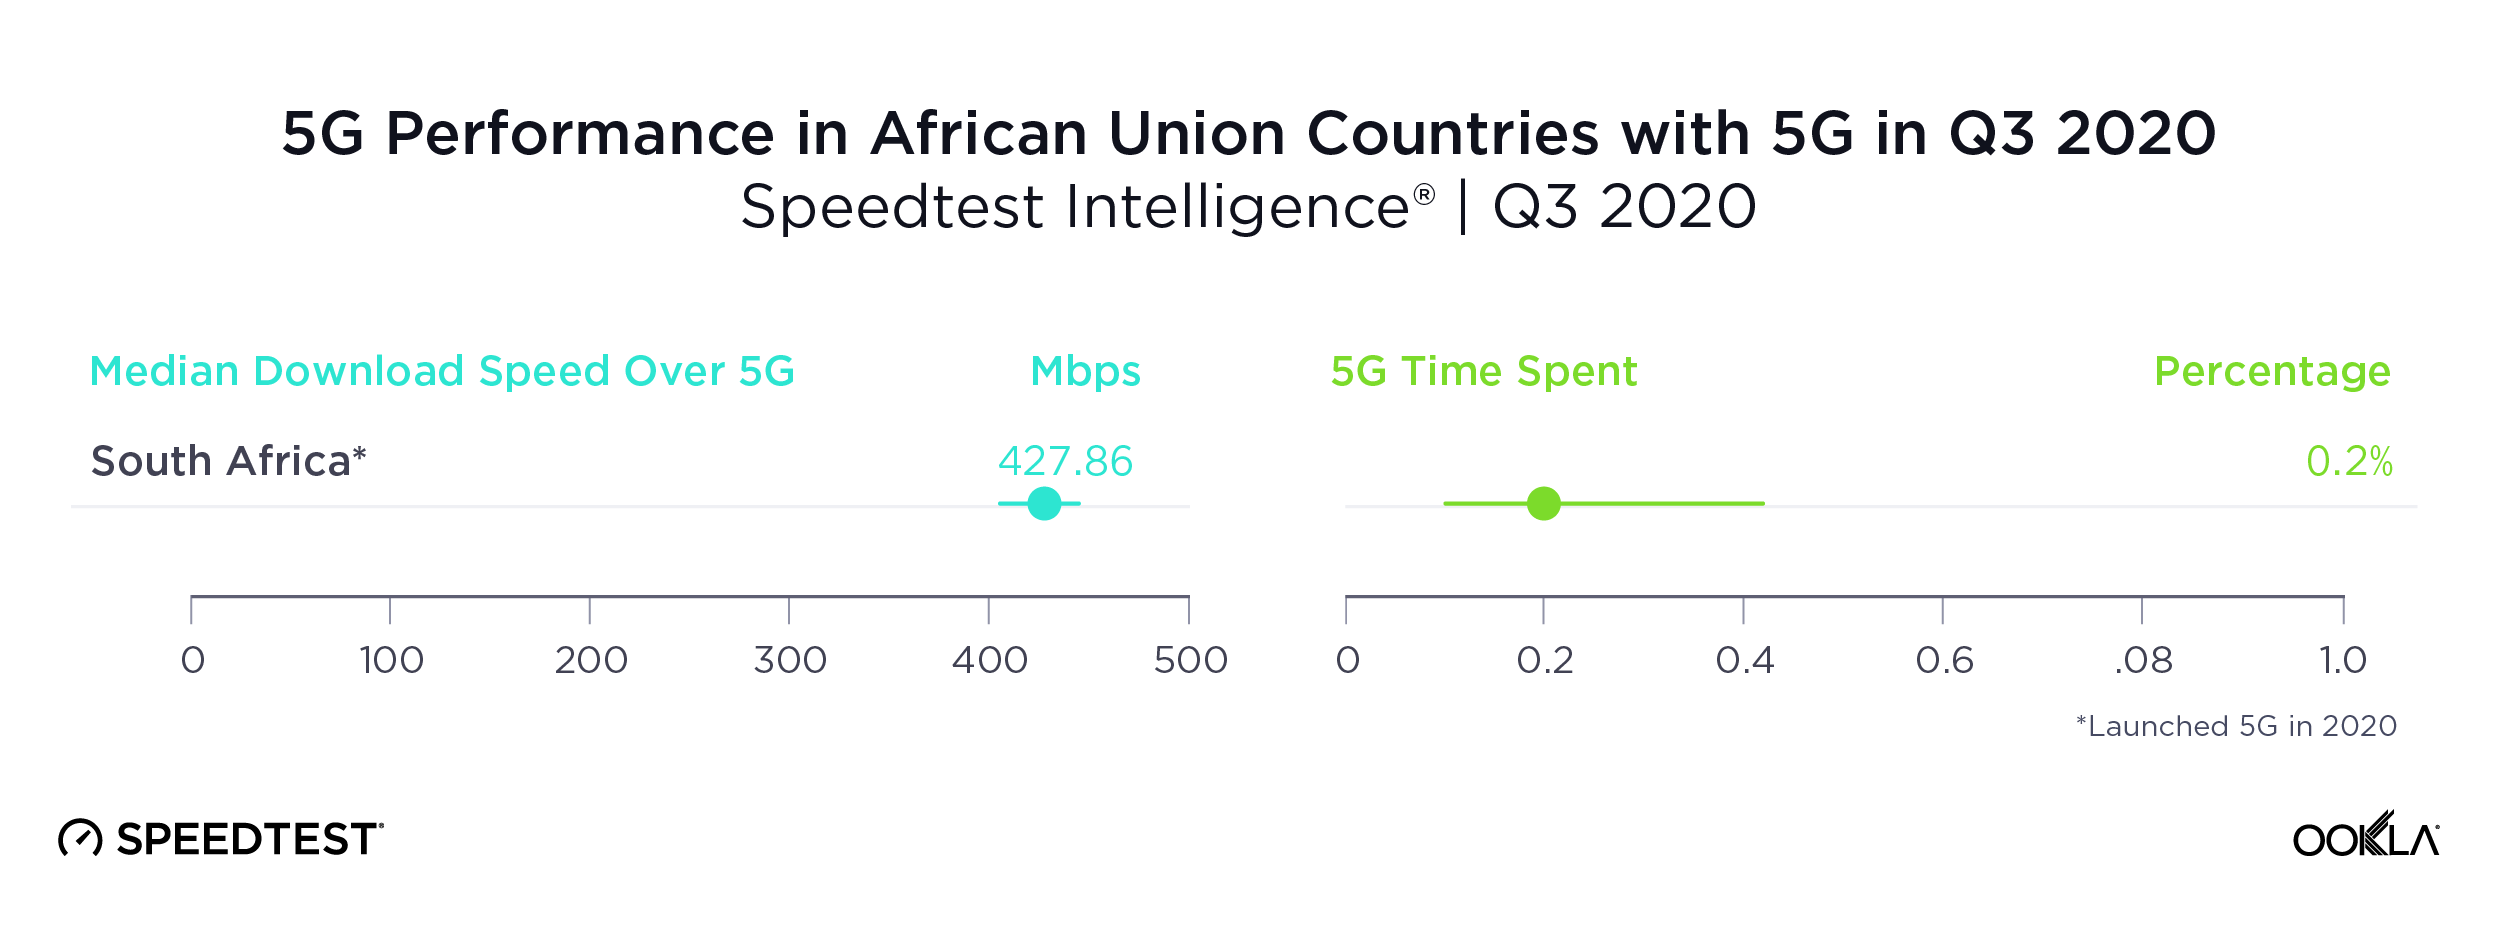
South Africa was the only country in the African Union with sufficient 5G to rate

As we saw above, South Africa’s impressive median download speed over 5G ranked the country third in the world during Q3 2020. South Africa was only one of two countries in the African Union to have commercially available 5G during Q3 2020. The other, Madagascar, did not have sufficient samples to properly analyze. Time Spent on 5G in South Africa was very low, an indication that 5G is not yet widely available there.
5G-Performance-Africa_1220

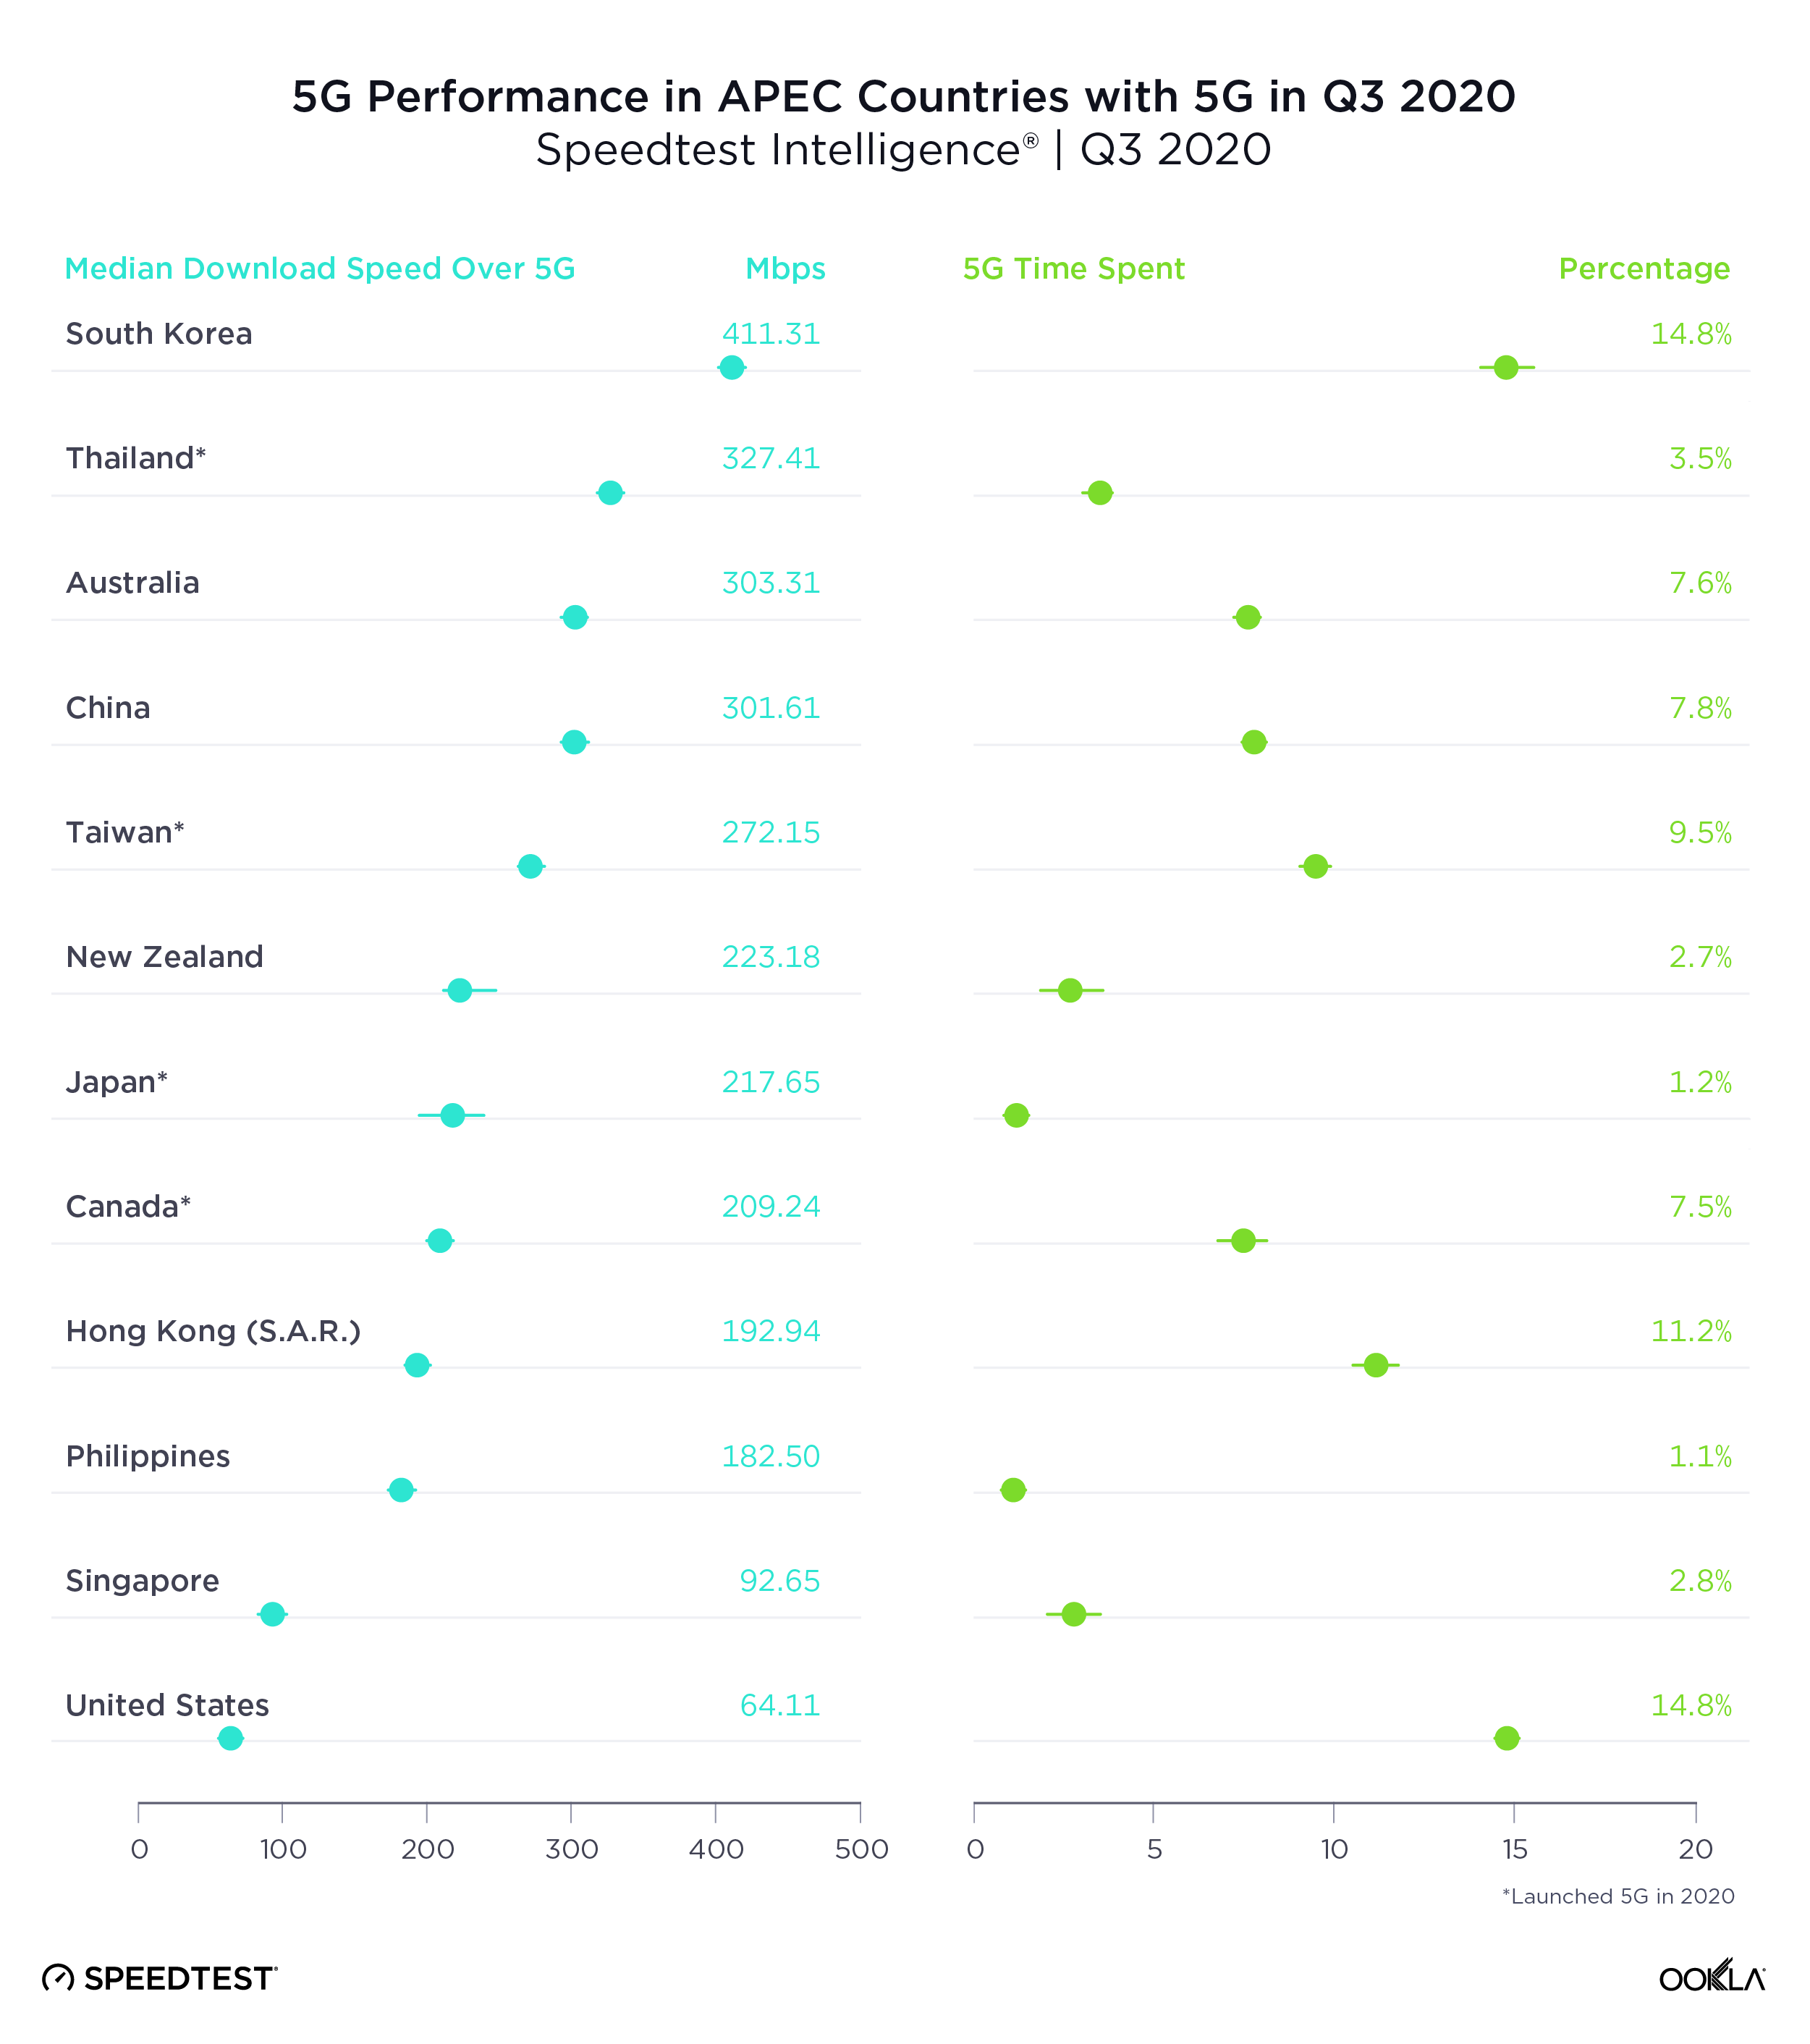
South Korea had the fastest 5G in APEC countries, U.S. the slowest

A median download speed over 5G of 411.11 Mbps put South Korea comfortably at the top of Asia-Pacific Economic Cooperation (APEC) countries with the fastest 5G during Q3 2020. Thailand was second, Australia third, China fourth and Taiwan fifth. 5G speeds represented the largest improvement over 4G in the Philippines where the median download speed over 4G during Q3 2020 (9.36 Mbps) was substantially lower than that of other countries on this list.

South Korea and the U.S. tied for highest Time Spent on 5G among APEC countries during Q3 2020, followed by Hong Kong and Taiwan.
5G-Performance-APEC_1220

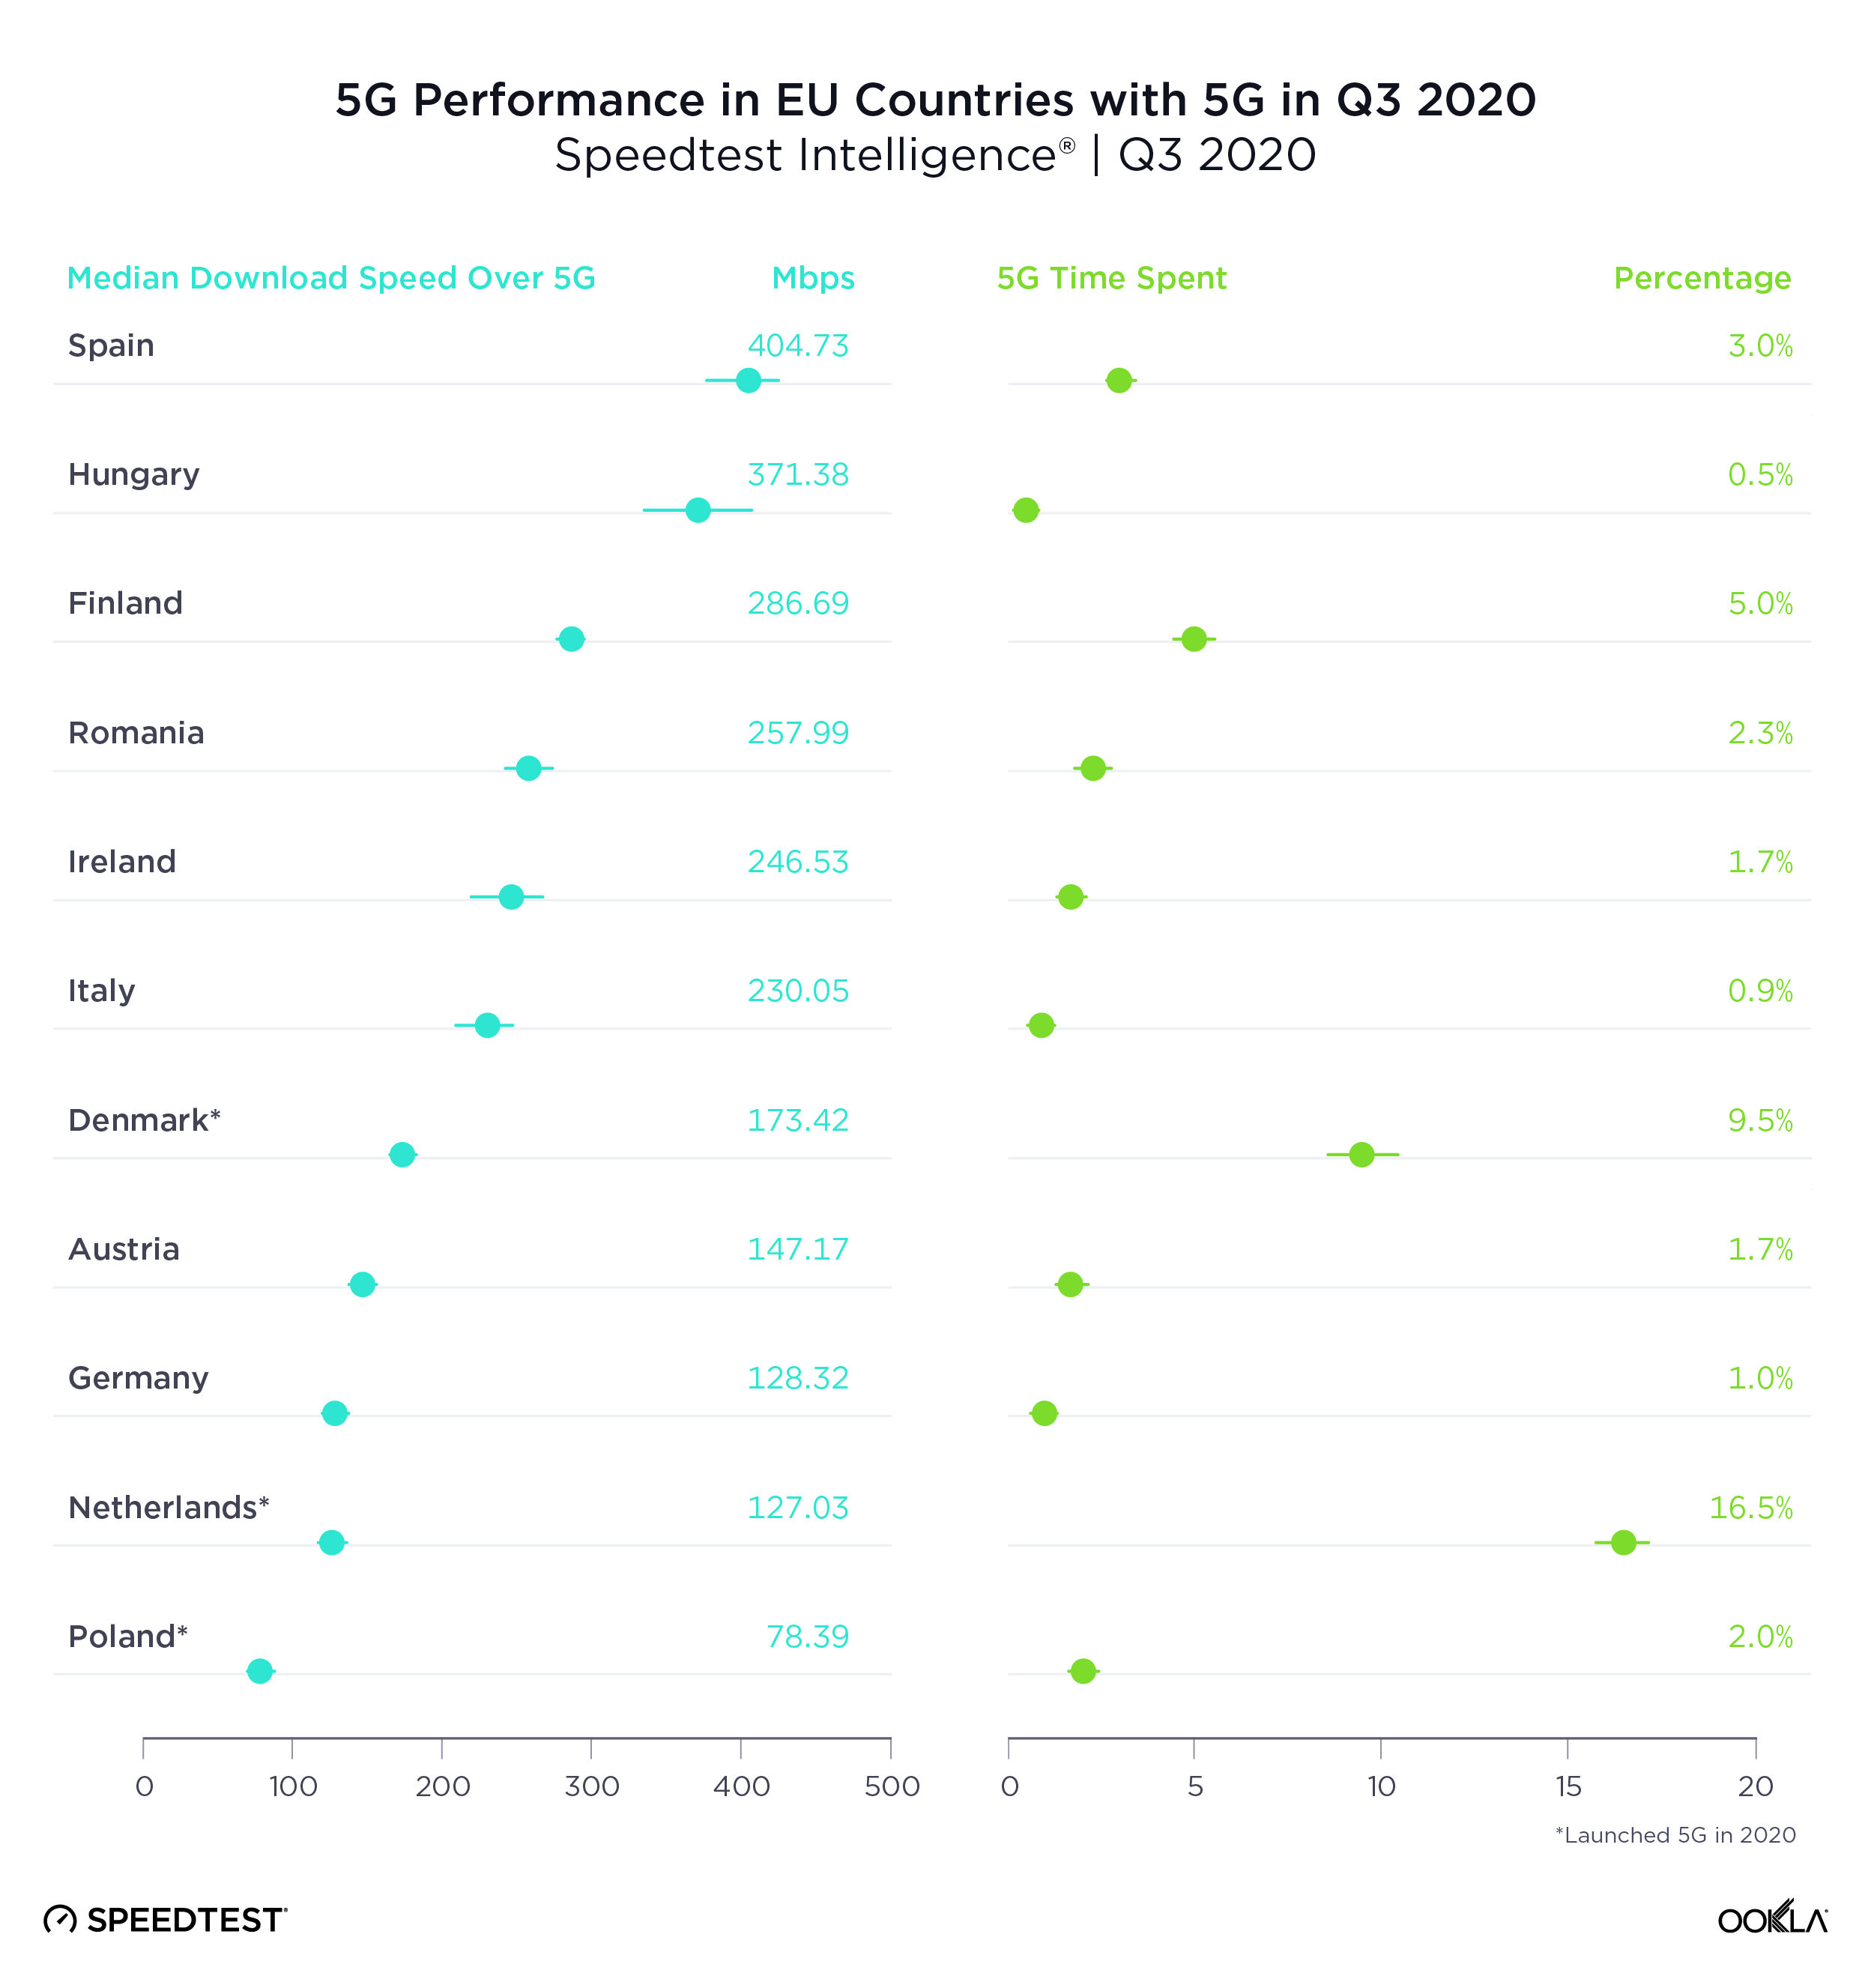
Spain had the fastest 5G in the E.U., Poland the slowest

Spain showed the fastest median download speed over 5G among the 11 European Union (E.U.) countries with sufficient 5G samples to rank during Q3 2020. Hungary was second, Finland third, Romania fourth and Ireland fifth. Spain’s median download speed over 5G also represented the largest gain over 4G among all of these countries, partially because Spain had the second slowest median download speed over 4G. France is not included on this list because 5G did not become commercially available in the country until after Q3 2020.

The Netherlands had the highest Time Spent on 5G among E.U. countries during Q3 2020, indicating that customers with 5G phones are able to spend far more time on 5G there than in other E.U. countries. Denmark was second for Time Spent on 5G among EU countries in Q3 2020 and Finland third.
5G-Performance-EU_1220

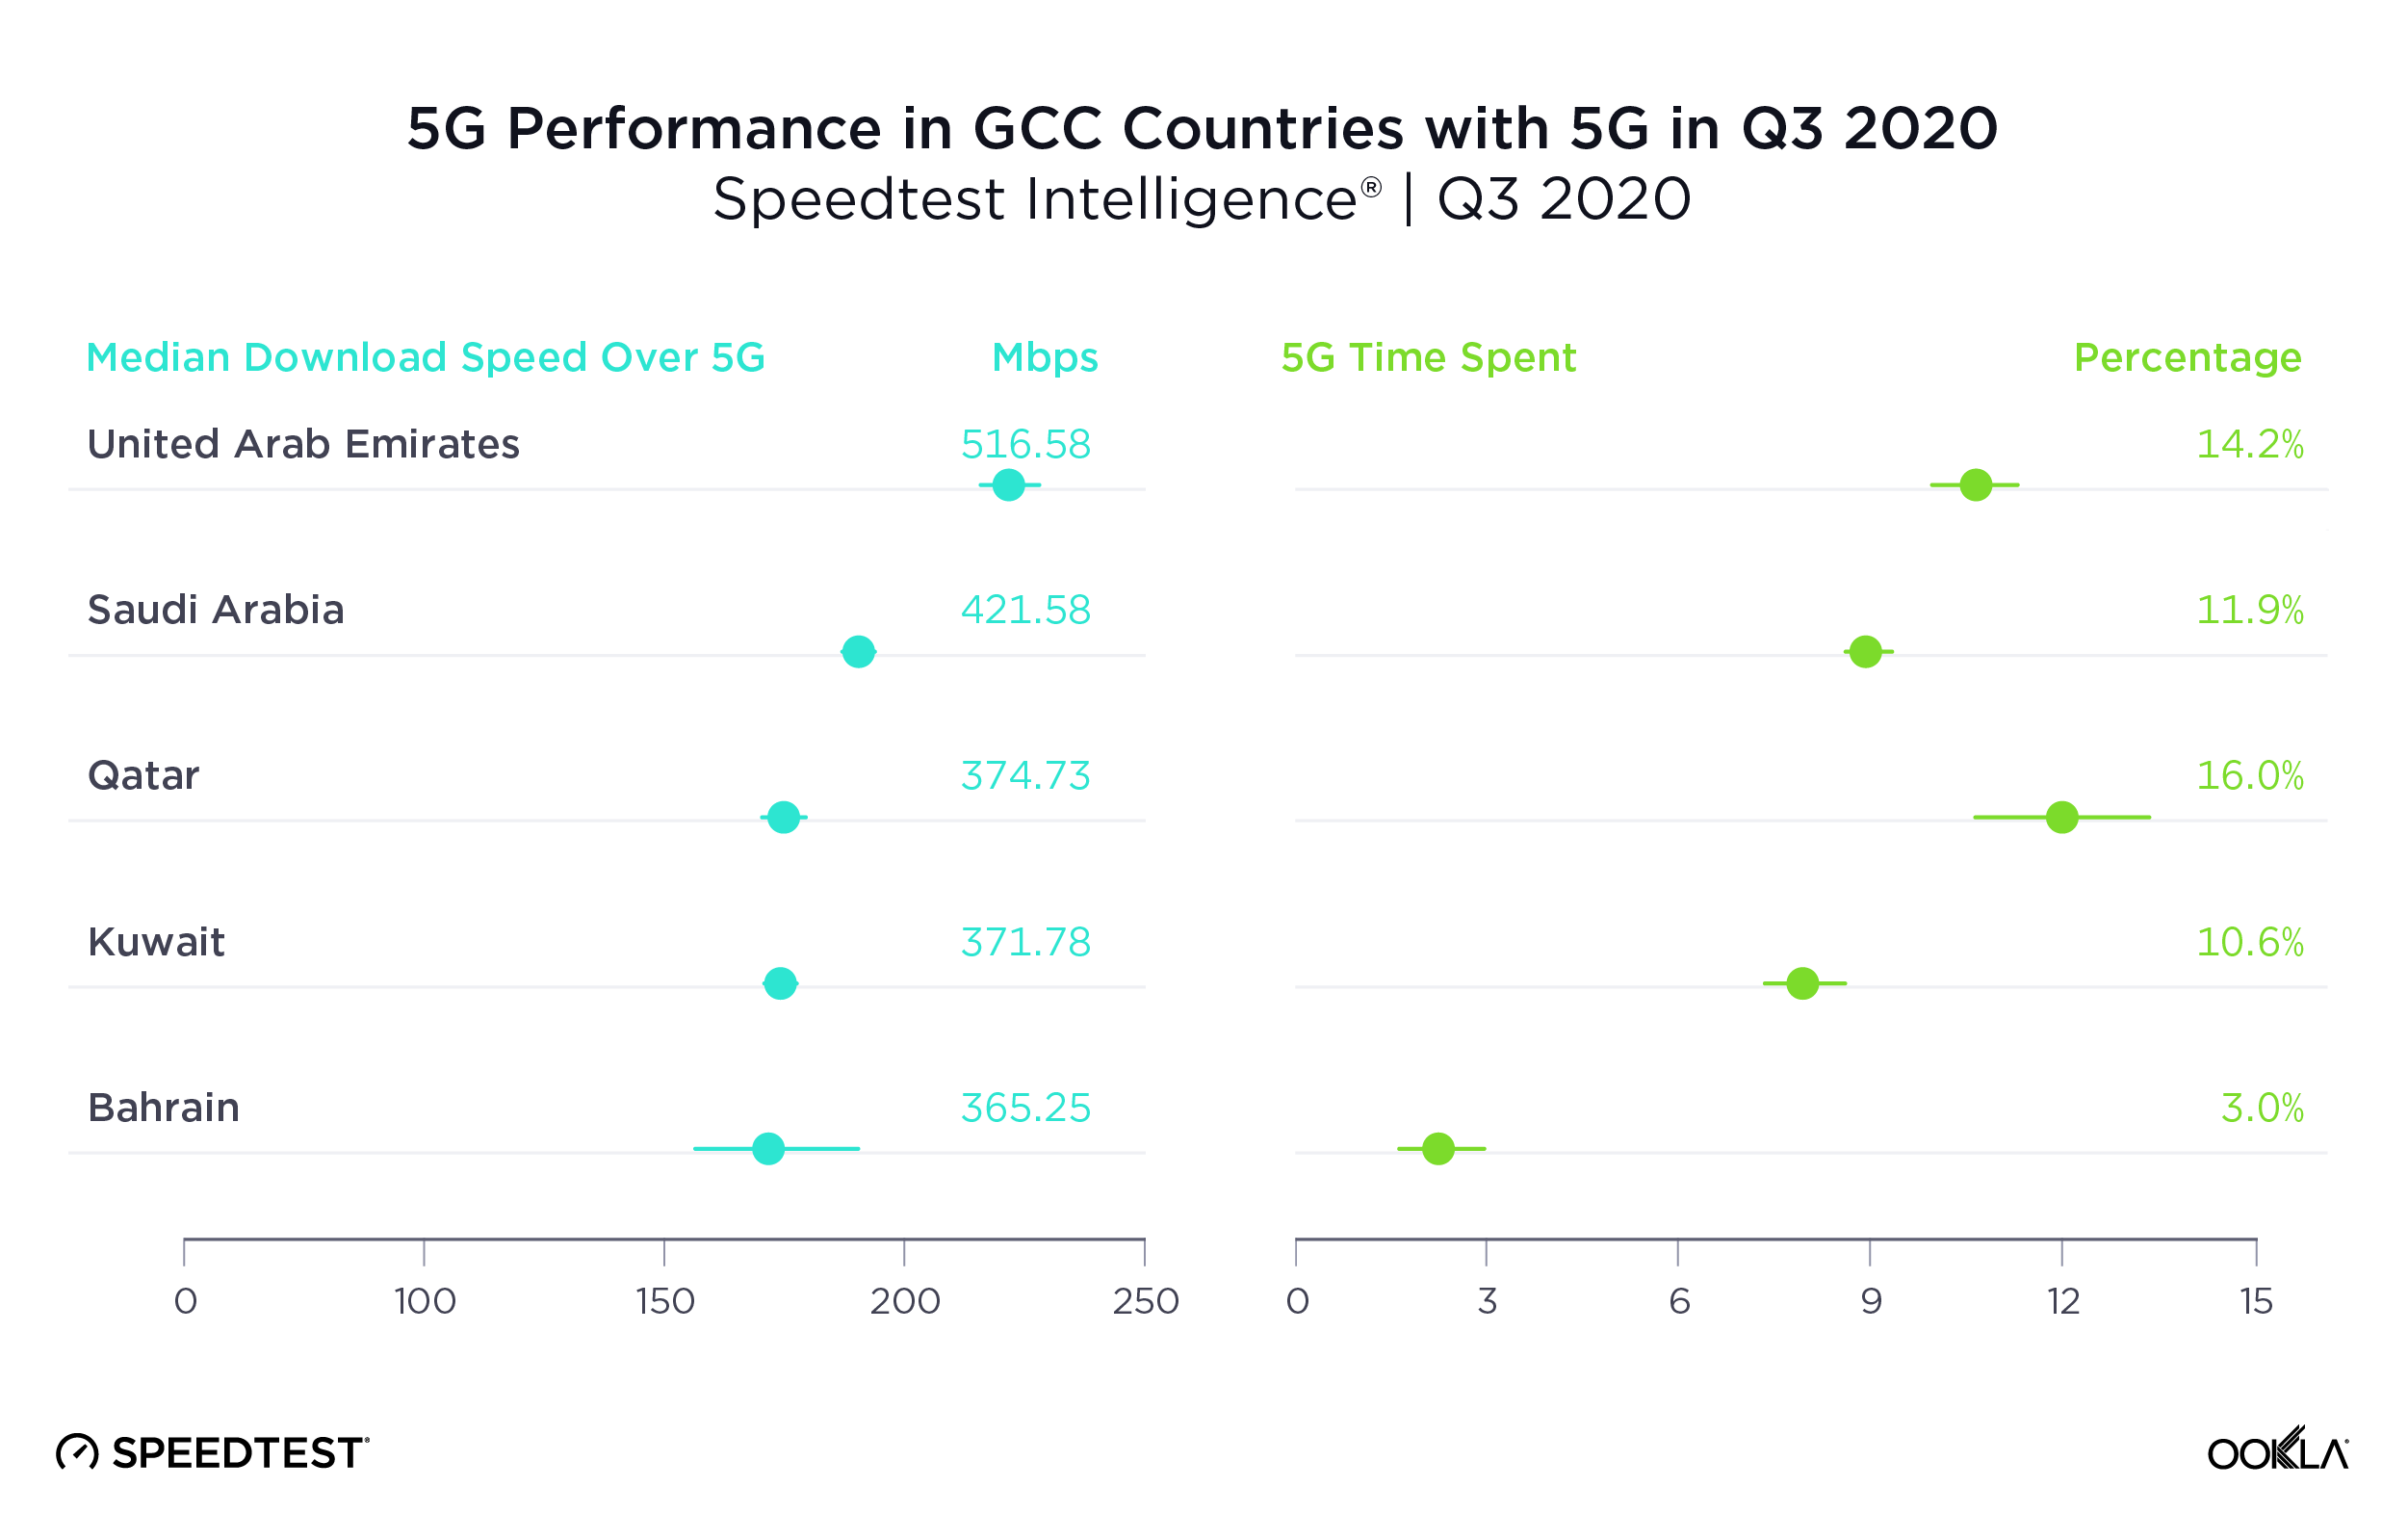
U.A.E had the fastest 5G in Gulf Cooperation Council Countries

With the second fastest median download speed over 5G in the world, U.A.E. was also the Gulf Cooperation Council (GCC) country with the fastest 5G during Q3 2020. Saudi Arabia was second and Qatar third. While Oman does have commercially available 5G, there were insufficient samples in the country during Q3 2020 to properly analyze performance.

5G represented the largest improvement over 4G in Kuwait and Bahrain, countries that had slower median download speeds over 4G than their neighbors.

Time Spent on 5G was relatively high in all the GCC countries on this list, except Bahrain, when compared to other countries in the world during Q3 2020. Qatar showed the highest Time Spent on 5G among GCC countries in Q3 2020 at 16.0%. U.A.E. was second and Saudi Arabia third.
5G-Performance-GCC_1220

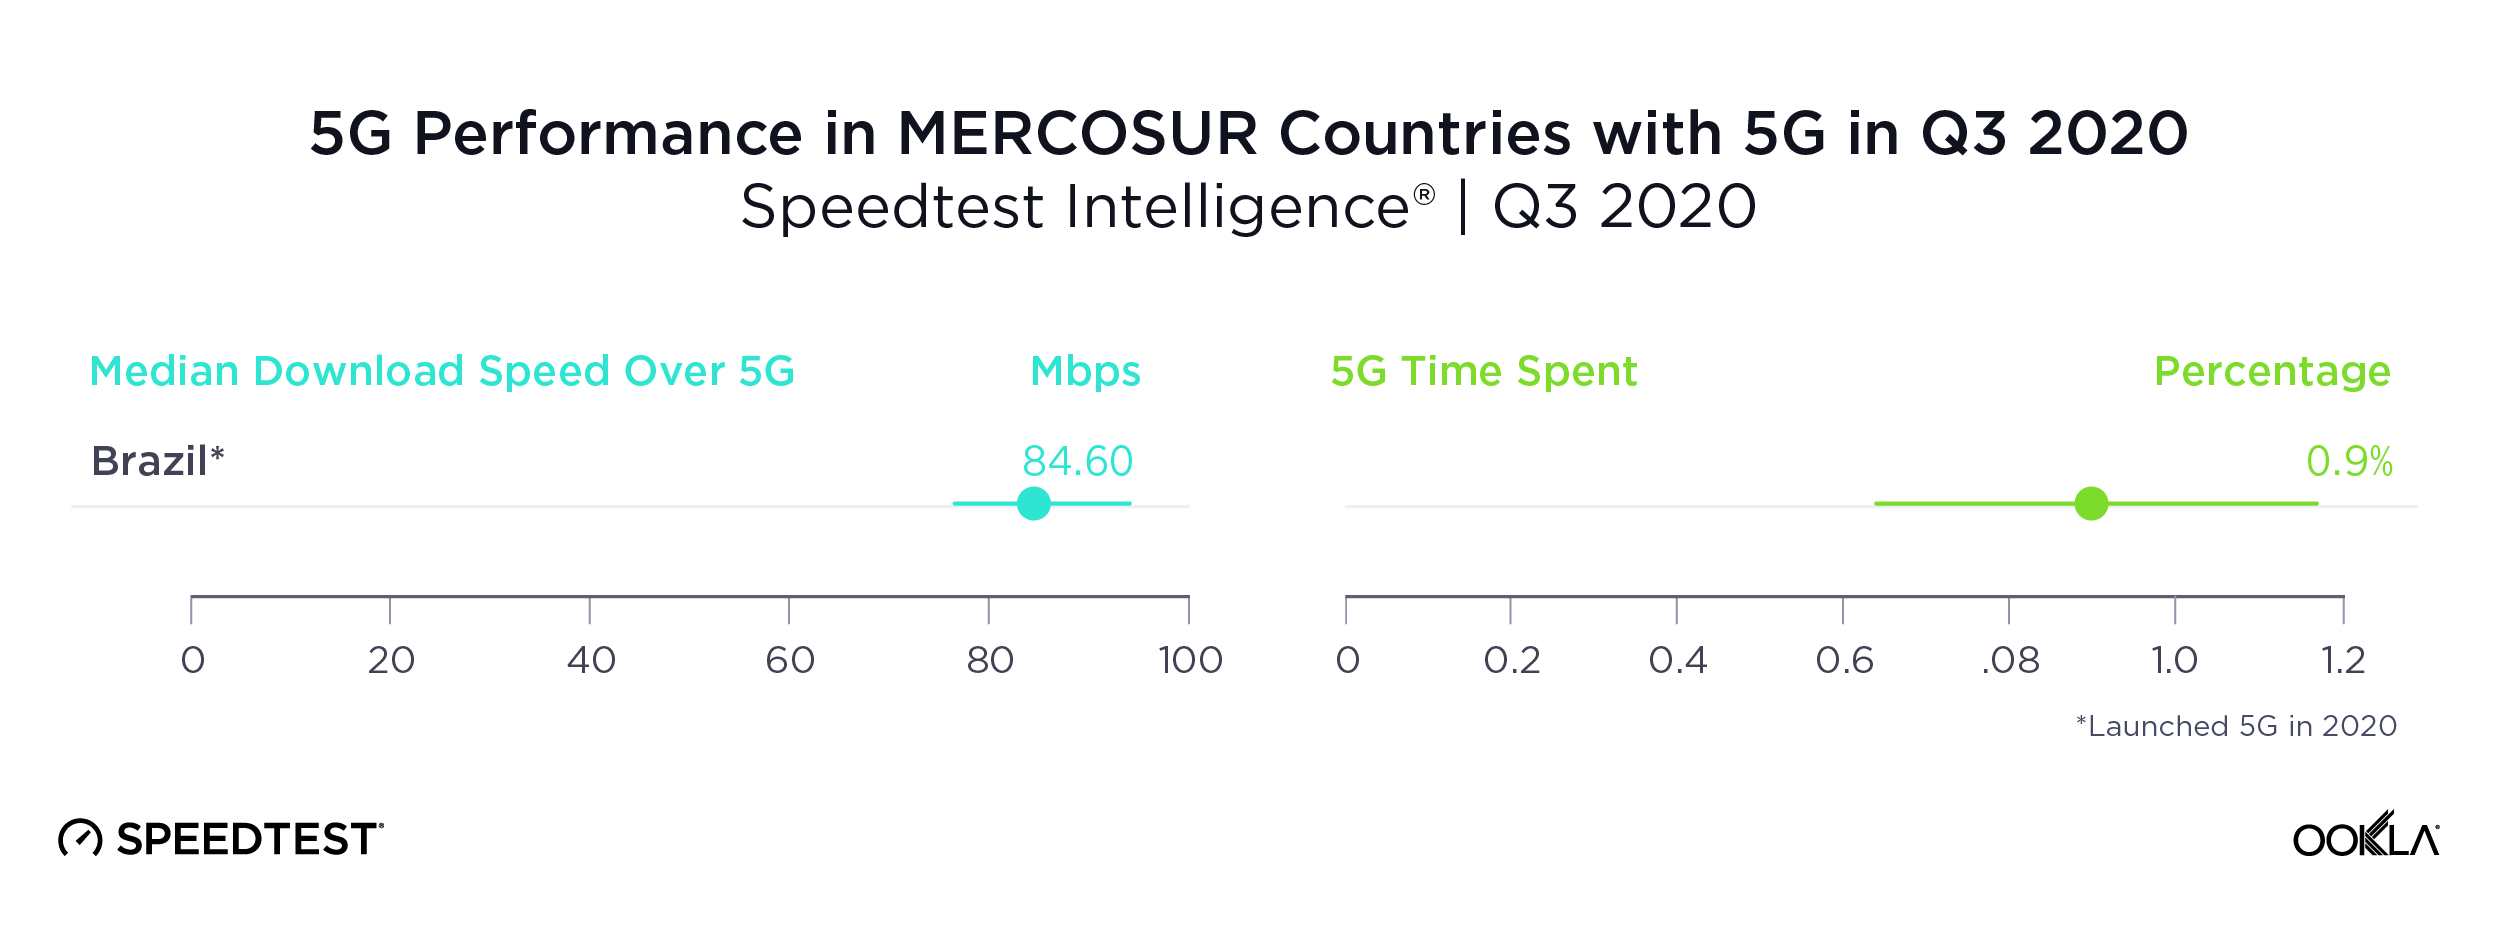
Brazil was the only MERCOSUR country with sufficient 5G to rate

Brazil’s median download speed over 5G of 84.60 Mbps during Q3 2020 may not seem fast for 5G, but it still puts Brazil well ahead of other countries in the Southern Common Market (MERCOSUR), most of which do not yet have 5G at all. We did see 5G results in Colombia, but there were insufficient samples to properly compare.

Time Spent on 5G in Brazil during Q3 2020 was not quite one percent, indicating that customers do not have much access to 5G yet.
5G-Performance-MERCOSUR_1220

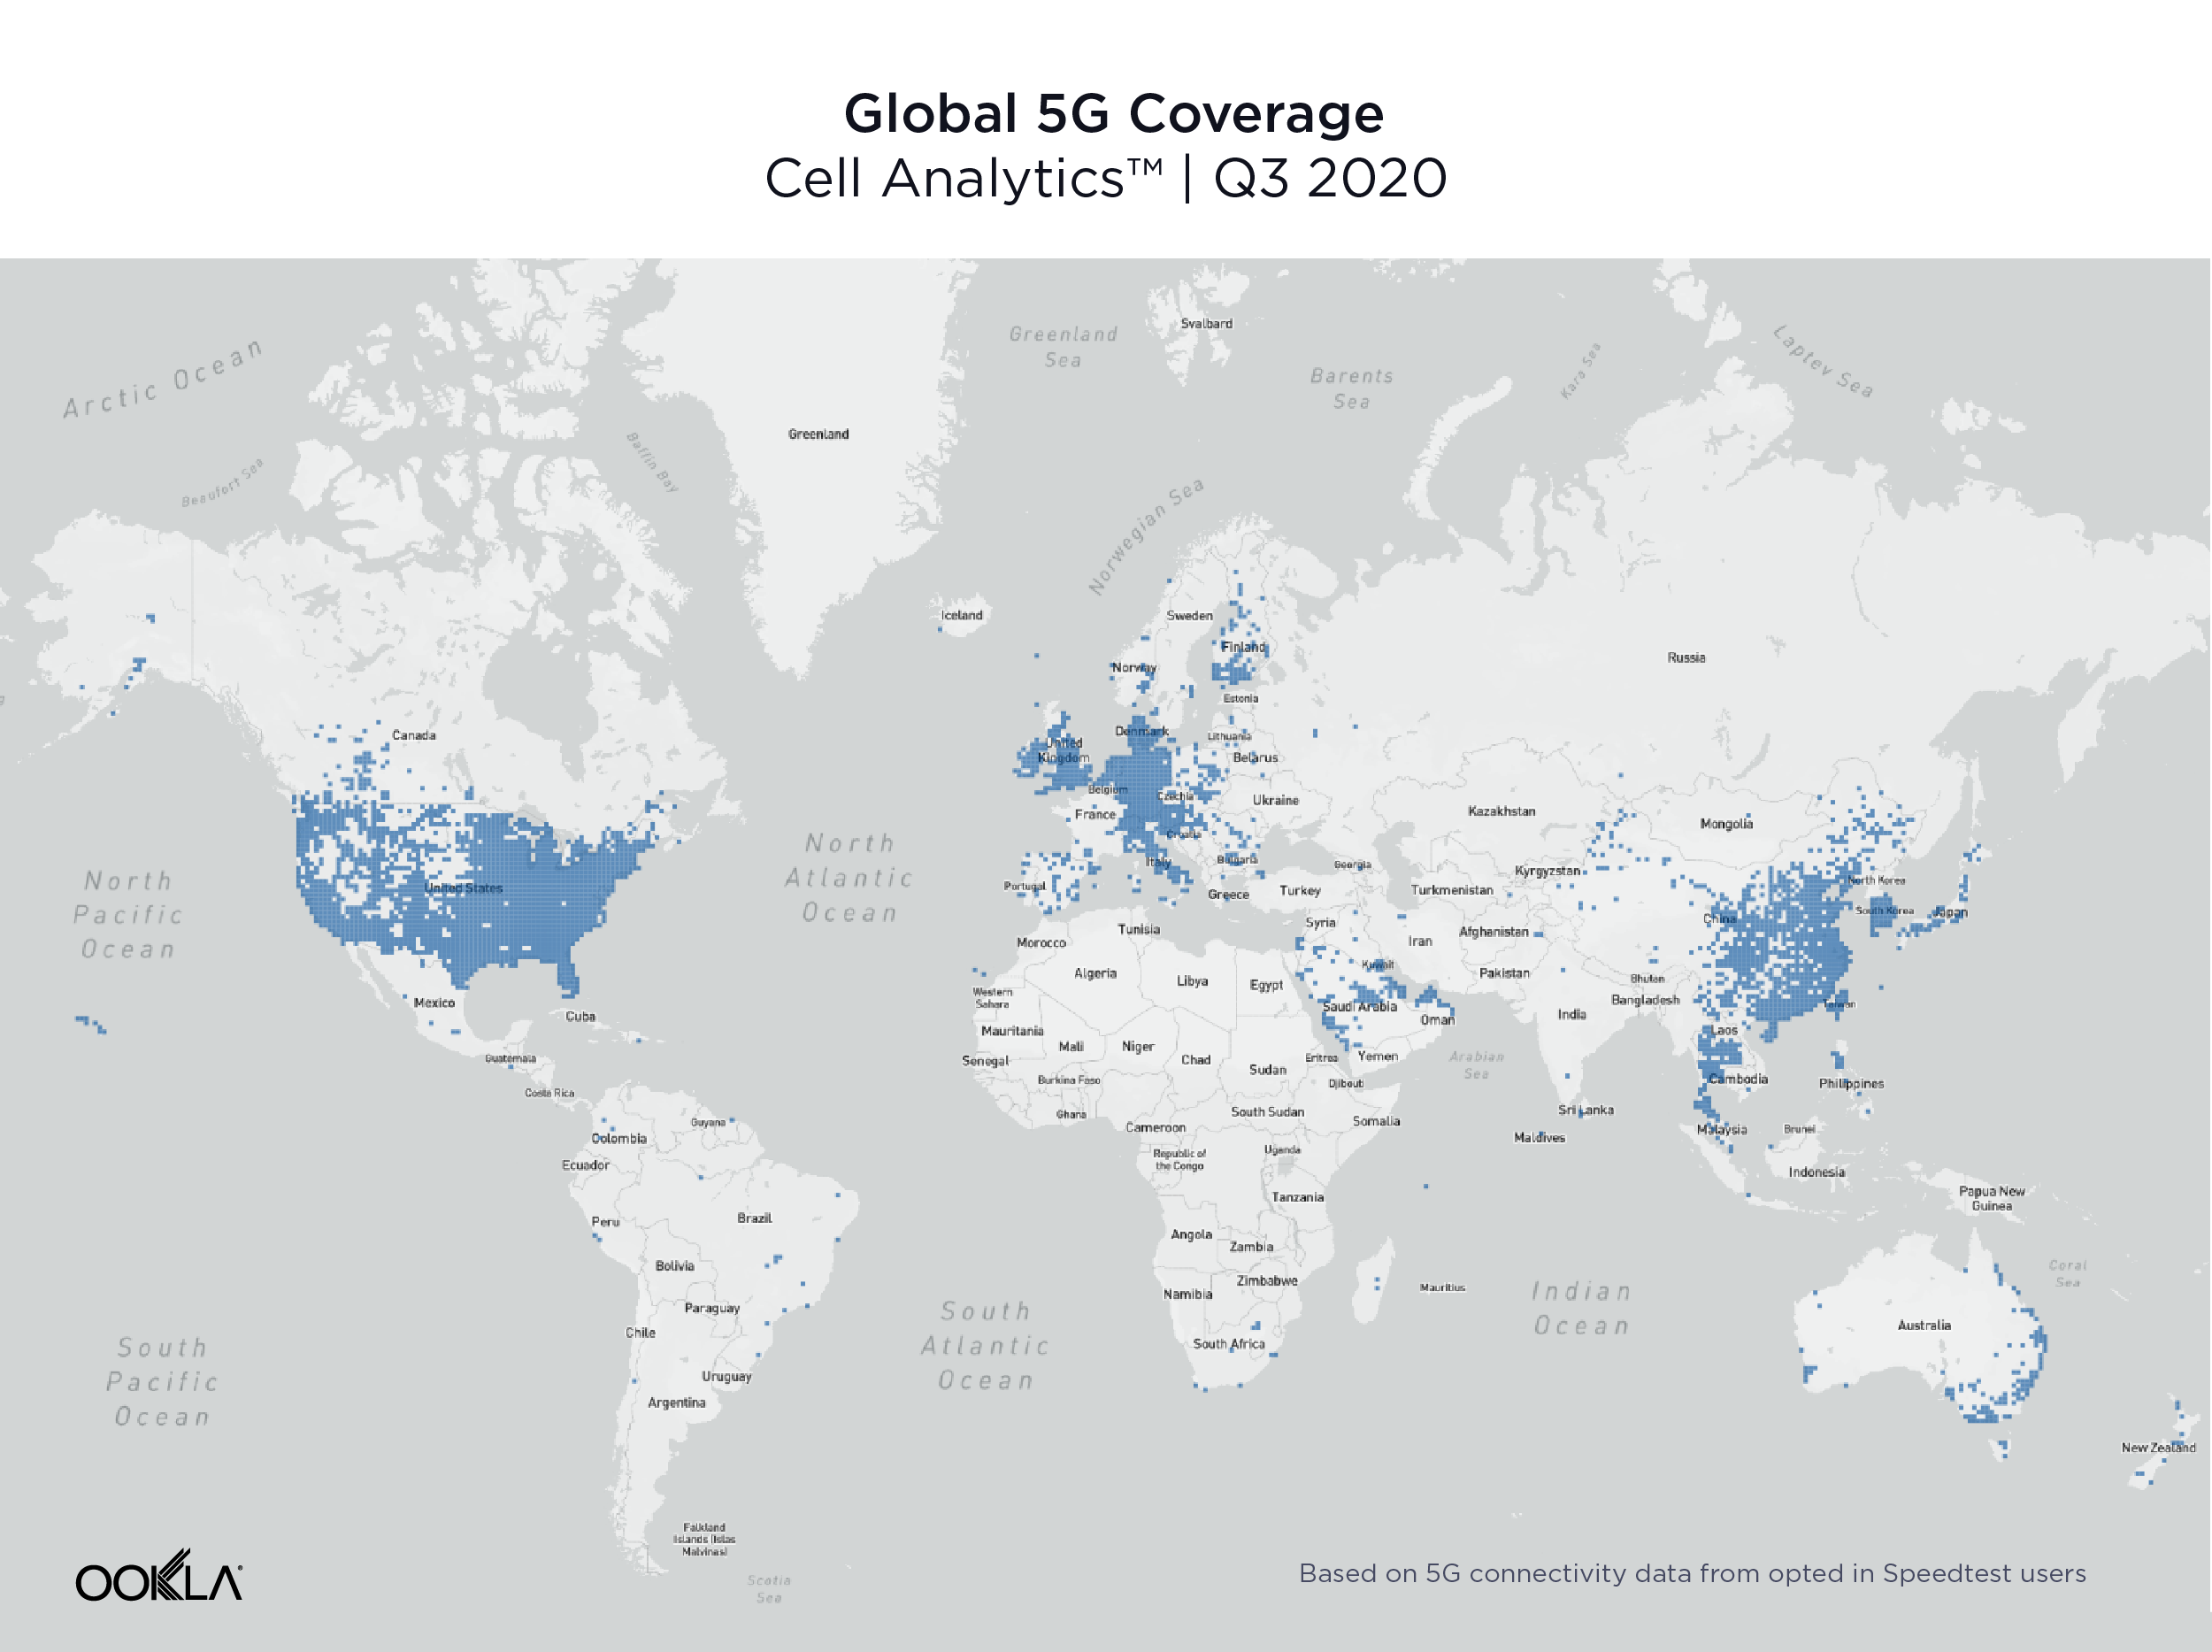
The U.S., Europe and Asia see widespread 5G coverage

Data from Cell Analytics™ shows a global view of 5G coverage in Q3 2020. This map, based on 5G connectivity data for opted-in Speedtest users, shows that 5G is spreading rapidly across the U.S., Europe, the Arabian Peninsula and Asia. In other regions, 5G is primarily available in larger cities, if at all.
Global-5G-Coverage_1220

99 countries worldwide had 5G, in 14,643 total cities

The number of countries with 5G deployments increased 62.3% between Q3 2019 and Q3 2020, with 99 countries having 5G deployments at the end of Q3 2020, according to the Ookla 5G Map™. There were 14,643 cities worldwide with 5G deployments at the end of Q3 2020, a 1,671% increase over Q3 2019. The total number of deployments worldwide was 17,046. The counts here and throughout this section include commercially available 5G as well as 5G networks with limited availability and those in pre-release.

Countries with the Most 5G Cities
Ookla 5G Map™ | Q3 2020
Country Numbers of Cities with 5G
United States 7,583
Germany 2,312
Austria 1,104
Netherlands* 1,009
Switzerland 554
Thailand* 325
Ireland 214
Puerto Rico 187
United Kingdom 169
Kuwait 97

The U.S. had the most cities with 5G deployments at the end of Q3 2020 with 7,583. Germany was second, Austria third, the Netherlands fourth and Switzerland fifth. A deployment is when a provider has some level of 5G presence in a city. A city can have multiple deployments when more than one provider is present.

Countries with the Largest Growth in Number of Deployments
Ookla 5G Map™ | Q3 2020
Country 5G Deployments as of Q3 2020 % Change Q3 2020 vs Q3 2019
Netherlands* 1,071 50,350%
Thailand* 451 32,401%
United States 7,808 21,566%
Germany 2,417 11,460%
Canada* 93 7,600%
Austria 1,173 4,918%
Ireland 236 4,180%
Poland 81 3,150%
Japan* 75 2,050%
Oman 50 2,000%

The Netherlands showed the largest percentage change in the number of 5G deployments between Q3 2019 and Q3 2020 with a 50,350% jump from two deployments in Q3 2019 to 1,071 in Q3 2020. Thailand saw the second largest percentage increase, the U.S. third, Germany fourth and Canada fifth.

Most early trials and commercial deployments of 5G spectrum allocations around the world have been centered around fallow swaths of the mid-band (3.3 GHz – 4.2 GHz) spectrum. With the recent commercialization of Dynamic Spectrum Sharing (DSS) across all major 5G infrastructure vendors, there is now increasing demand for 5G support on many existing 4G frequencies, ranging from 600 MHz to 2.5 GHz. In unique 5G markets like Japan, there is an additional need for the 4.5 GHz band as well as the millimeter wave (FR2).

In the United States, early deployments leveraged millimeter wave frequency bands in the 28 GHz and the 39 GHz, which delivered impressive speeds in a very constrained footprint. The rapid 5G deployment in the 600 MHz band has added a substantial nationwide 5G footprint — and with that, much wider 5G availability for many more Americans. With the recent merger between T-Mobile and Sprint, the deployment of 2.5 GHz spectrum has been significantly accelerated, which should improve both network efficiency and user experience on T-Mobile’s network. Additionally, next year’s availability of 5G Carrier Aggregation will allow T-Mobile to combine 600 MHz with 2.5 GHz to deliver improved 5G speeds on top of the existing nationwide footprint. In addition, DSS has recently been deployed by AT&T and Verizon, which allows operators to choose from existing low-band spectrum assets (850 MHz) and deliver both LTE and 5G at the same time. This feature alone doesn’t add a significant boost in perceived user experience, but will certainly improve the 5G footprint.

China showed the highest percentage of 5G test samples

Another way to measure 5G adoption is to look at the proportion of samples taken over 5G relative to the total number of samples on all technologies. Speedtest Intelligence is uniquely positioned to measure global growth in 5G because of the worldwide adoption of Speedtest apps. China had the highest percentage of 5G Speedtest results compared to other mobile technology types in Q3 2020 at 18.9%. South Korea was second, Hong Kong third, Puerto Rico fourth and Qatar fifth.

Countries with the Most 5G
Speedtest Intelligence® | Q3 2020
Country 5G Samples as a % of Total
China 18.9%
South Korea 15.8%
Hong Kong (S.A.R.)* 7.9%
Puerto Rico 6.7%
Qatar 5.7%
United States 5.5%
Netherlands* 4.9%
United Arab Emirates 4.6%
Kuwait 4.6%
Australia 4.2%

What 5G will look like in 2021

With recently announced device chipset advancements expected in 2021, including 5G Carrier Aggregation, operators will be able to combine two 5G frequency bands in the sub-6GHz (FR1) range, allowing not only faster speeds, but also greater coverage. More importantly, the ability to combine Frequency Division Duplexing (FDD) and Time Division Duplexing (TDD) FR1 channels will enable operators to leverage low-band frequencies (sub-1GHz) for uplink transmissions (user device to cell site), while combining the low-band with the mid-band (2.5 GHz, 3.5 GHz) on the downlink. This should significantly expand the availability of fast 5G download speeds across larger geographies.

Similarly, DSS — which is a stepping stone to standalone 5G and allows for the simultaneous delivery of 4G and 5G technology on the same spectrum slice — will enable operators to combine already-deployed FDD spectrum with dedicated mid-band spectrum for an enhanced standalone 5G experience. This will unlock the full potential of 5G networks, such as ultra low latency and network slicing, while delivering an improved mobile experience to users.

Where 5G fails to reach

During Q3 2020 Speedtest Intelligence showed 55 countries in the world (with more than 200 samples) where more than 20% of samples were from 2G and 3G connections (combined). These are countries where, in many cases, 5G is still aspirational. As excited as we are about the expansion of 5G, we do not want to see these countries left behind.

Countries That Still Rely Heavily on 2G and 3G Connections
Speedtest Intelligence® | Q3 2020
Country 2G & 3G Samples 4G Samples
Turkmenistan 74.9% 25.1%
Rwanda 52.3% 47.7%
Iraq 49.4% 50.6%
Belarus 46.5% 53.5%
Afghanistan 46.0% 54.0%
Antigua and Barbuda 40.2% 59.8%
Tajikistan 40.2% 59.8%
Suriname 39.7% 60.3%
Haiti 37.7% 62.3%
Syria 37.5% 62.5%
Ghana 36.0% 64.0%
Ethiopia 35.0% 65.0%
Mozambique 34.7% 65.3%
Benin 34.3% 65.7%
Angola 34.1% 65.9%
El Salvador 32.5% 67.5%
Moldova 31.8% 68.2%
Venezuela 30.3% 69.7%
Tanzania 30.0% 70.0%
Papua New Guinea 29.5% 70.5%
Jamaica 29.4% 70.6%
Sudan 29.2% 70.8%
Algeria 29.0% 71.0%
Namibia 28.5% 71.5%
Zimbabwe 28.5% 71.5%
Somalia 28.4% 71.6%
Nicaragua 28.1% 71.9%
Armenia 28.1% 71.9%
Bosnia and Herzegovina 28.1% 71.9%
Uzbekistan 27.8% 72.2%
Cameroon 27.5% 72.5%
Zambia 27.4% 72.6%
Uganda 26.6% 73.4%
Trinidad and Tobago 26.6% 73.4%
Honduras 26.5% 73.5%
Bangladesh 26.3% 73.7%
Burkina Faso 26.0% 74.0%
Ukraine 25.8% 74.2%
Nigeria 25.7% 74.3%
DR Congo 24.6% 75.4%
Costa Rica 24.3% 75.7%
Botswana 24.1% 75.9%
Libya 22.9% 77.1%
Azerbaijan 22.9% 77.1%
Ecuador 22.8% 77.2%
Mali 22.4% 77.6%
Mongolia 21.8% 78.2%
Maldives 21.6% 78.4%
Mauritius 21.3% 78.7%
Tunisia 21.0% 79.0%
Belize 20.7% 79.3%
Laos 20.5% 79.5%
Kenya 20.3% 79.7%
Paraguay 20.1% 79.9%
Côte d’Ivoire 20.0% 80.0%

In markets where 4G layers haven’t been deployed or substantially covered, end users fall back to the circuit-switched network (2G, 3G). These decades-old network technologies should be sufficient for basic voice and texting, social media, and navigation apps, but cannot deliver rich media experiences or video calling. Unfortunately, many countries on this list are places where consumers rely primarily on mobile phones for their internet connectivity.

5G is radically changing the speeds and capabilities of mobile networks around the world. If the current growth rate continues, it won’t be long before most nations have access to 5G. But there are nations and subsets of subscribers who may not see the benefits of 5G for years to come. We will continue reporting on 5G achievements across the globe and watching speeds in general on the Speedtest Global Index™.

Ookla retains ownership of this article including all of the intellectual property rights, data, content graphs and analysis. This article may not be quoted, reproduced, distributed or published for any commercial purpose without prior consent. Members of the press and others using the findings in this article for non-commercial purposes are welcome to publicly share and link to report information with attribution to Ookla.

| December 14, 2020

Exploring the Relationship Between Network Performance and NPS in Germany, Austria and Switzerland

Deutsche

While cultural ties bind the three countries in the DACH region (Germany, Austria and Switzerland), internet performance varies widely between them. Using data from Speedtest Intelligence®, we compared performance for mobile network operators (MNOs) and fixed broadband internet service providers (ISPs) across countries and at the provider level during Q3 2020. We also compared provider performance to Speedtest Consumer SentimentTM data on five-star ratings and Net Promoter Score (NPS) to understand how network performance impacts customer satisfaction.

Switzerland boasts the highest mobile and fixed broadband download speeds
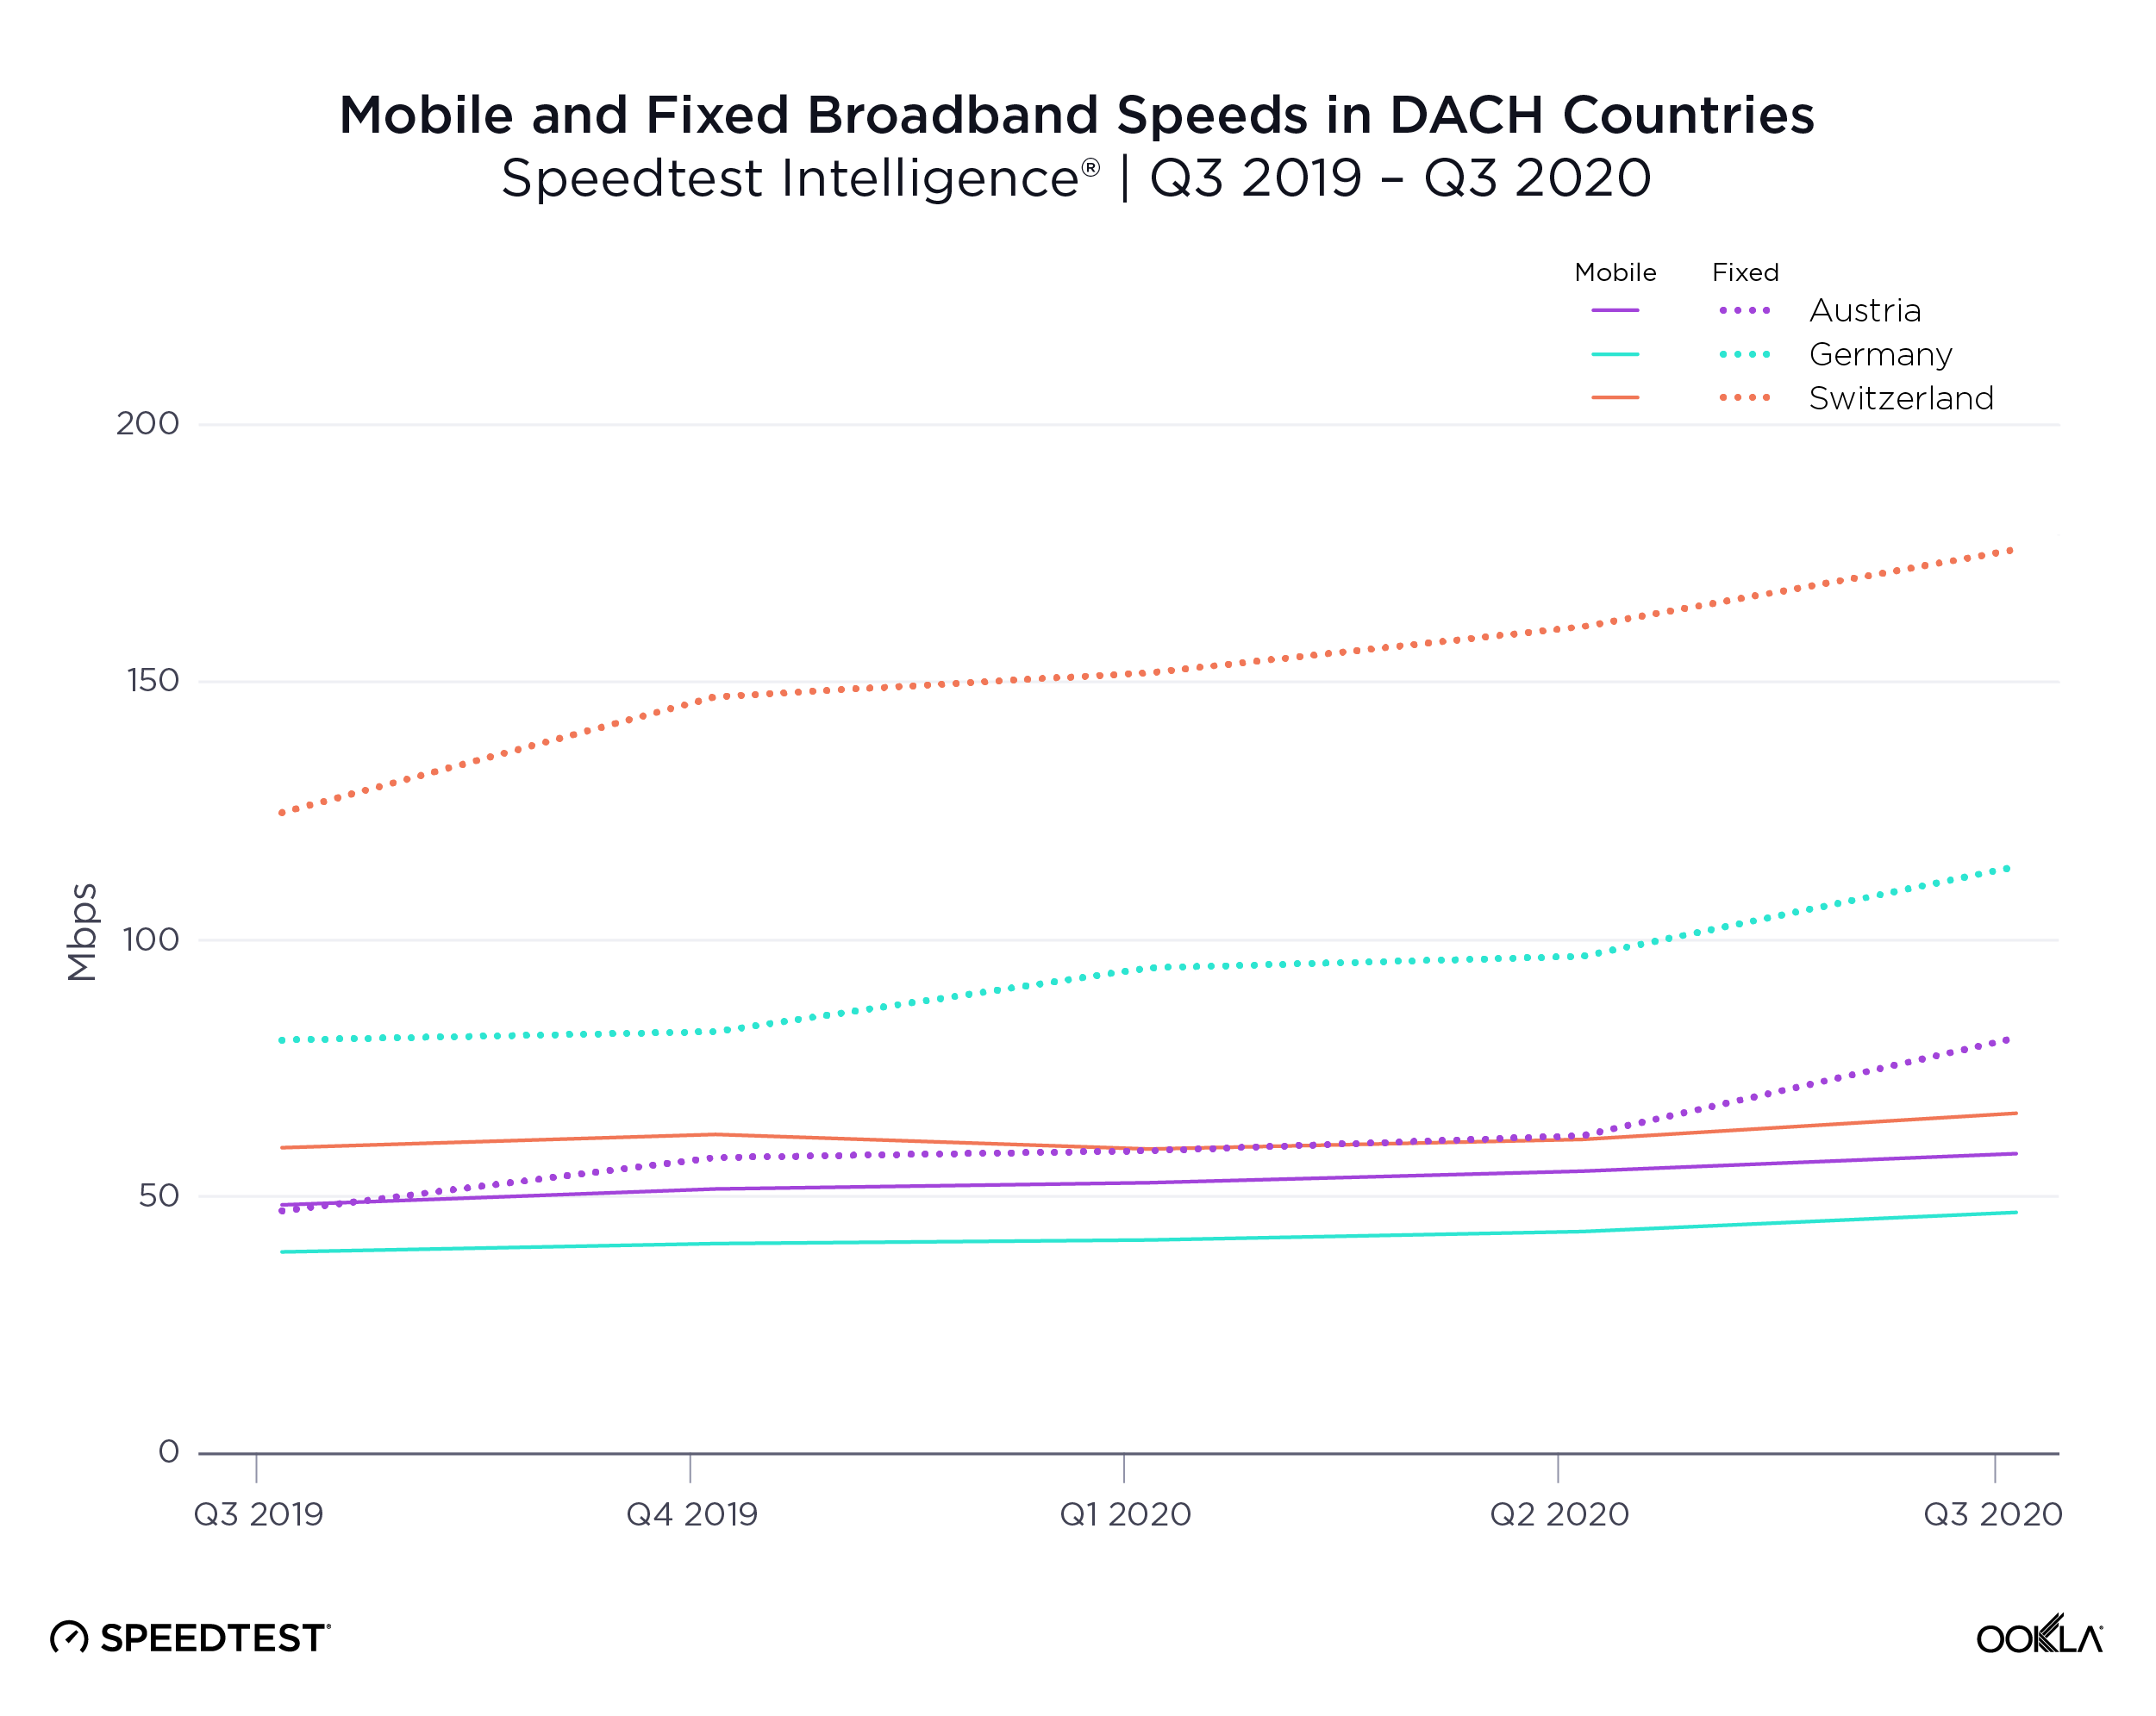
Speeds-Chart_Austria_Germany_Switzerland_1220_en-2

Switzerland outperformed Austria and Germany for mean mobile download speed with a mean download speed over mobile of 60.61 Mbps in Q3. Switzerland ranked 12th in the world on the Speedtest Global IndexTM as of September 2020. Austria, which had a mobile download speed of 52.76 Mbps in Q3 2020, ranked 20th in the world for mobile. Germany’s mobile download speed during Q3 2020 was 41.34 Mbps and the country ranked 35th. All three countries have invested heavily in 5G with Germany showing the largest number of cities with 5G deployments as of November 4, 2020, according to the Ookla 5G MapTM at 2,311. Switzerland had 554 and Austria 1,104. Interestingly, Switzerland actually saw a peak in mobile download speed during Q3 2020 after a decrease in Q1-Q2 2020.

On the fixed side, Switzerland fared even better with a mean download speed of 170.21 Mbps during Q3. Switzerland ranked 4th in the world for fixed broadband according to the Speedtest Global Index as of September 2020. Germany’s Q3 2020 download speed over fixed broadband was 108.57 Mbps and the country ranked 29th in the world. Austria had the lowest download speed over fixed broadband at 75.27 Mbps during Q3 2020 and ranked 50th for fixed broadband download speed. Switzerland was the only country of the three to show parity between download and upload speed over fixed broadband with a mean upload speed of 110.09 Mbps during Q3 2020. For comparison, Germany showed 25.84 Mbps and Austria was at 18.42 Mbps during the same period.

Fastest providers in Austria, Germany and Switzerland

We compared Q3 2020 internet performance for top providers in Austria, Germany and Switzerland using Speed ScoreTM. On mobile, these results consider only devices that use modern chipsets.

A1 (mobile) and Magenta (fixed broadband) are fastest in Austria

Internet Performance of Top Mobile Providers in Austria
Speedtest Intelligence® | Modern Chipsets in Q3 2020
Provider Speed Score
A1 61.55
3 43.55
Magenta Telekom 41.00

A1 had the fastest Speed Score among Austrian mobile operators at 61.55 during Q3 2020. Three showed the second fastest Speed Score, followed by Magenta Telekom.

Internet Performance of Top Fixed Providers in Austria
Speedtest Intelligence® | Q3 2020
Provider Speed Score
Magenta 81.21
3 26.39
A1 24.84

On the fixed broadband side at the national level, Magenta was the fastest provider in Austria during Q3 2020. Three was second, while A1 was third. While LIWEST, kabelplus and CableLink had higher Speed Scores than both 3 and A1, these regional providers are only available in select portions of the country.

Telekom (mobile) and Vodafone (fixed broadband) are fastest in Germany

Internet Performance of Top Mobile Providers in Germany
Speedtest Intelligence® | Modern Chipsets in Q3 2020
Provider Speed Score
Telekom 49.09
Vodafone 29.69
1&1 23.18
O2 22.65

Telekom was the fastest mobile operator in Germany during Q3 2020 with a Speed Score of 49.09, far above second-place Vodafone. 1&1 was third and O2 was fourth.

Internet Performance of Top Fixed Providers in Germany
Speedtest Intelligence® | Q3 2020
Provider Speed Score
Vodafone 103.57
Telekom 44.28
O2 38.38

Vodafone was the fastest fixed broadband provider in Germany during Q3 2020 with a Speed Score of 103.57. This was more than double that of second-place Telekom. O2 was third.

Switzerland’s fastest providers are Swisscom (mobile) and Salt (fixed broadband)

Internet Performance of Top Mobile Providers in Switzerland
Speedtest Intelligence® | Modern Chipsets in Q3 2020
Provider Speed Score
Swisscom 57.10
Sunrise 46.13
Salt 38.79

The fastest mobile operator in Switzerland during Q3 2020 was Swisscom with a Speed Score of 57.10. Sunrise was second and Salt third.

Internet Performance of Top Fixed Providers in Switzerland
Speedtest Intelligence® | Q3 2020
Provider Speed Score
Salt 290.89
UPC 150.45
Quickline 95.18
net+ 82.98
Sunrise 79.40
Swisscom 76.73

Salt was the fastest fixed broadband provider in Switzerland during Q3 2020 with a Speed Score of 290.89 — nearly twice as high as second-place UPC. Quickline was third, net+ was fourth, Sunrise fifth and Swisscom sixth.

We compared five-star ratings and NPS data to providers’ performance to understand how speeds impacted customer perceptions of German, Austrian and Swiss providers. Speedtest Consumer Sentiment data is gathered from single-question surveys presented to users at the end of a Speedtest®. This data set provides rich insights into customer satisfaction over time, as well as competitive benchmarking, by providing data on both Net Promoter Score (NPS) and customers’ overall satisfaction with their network providers.

Provider performance vs. ratings

Consumer Sentiment includes data on how users rate providers on a five-star scale. We compared ratings data from Austrian, German and Swiss providers in Q3 2020 with Speed Score to better understand the relationship between network performance and customers’ overall satisfaction with their network providers.

In Austria, A1 rated highest for mobile, kabelplus for fixed broadband

Internet Performance and Five-Star Ratings of Top Mobile Providers in Austria
Speedtest Intelligence® | Modern Chipsets in Q3 2020
Provider Speed Score Rating
A1 61.55 3.8
3 43.55 3.3
Magenta Telekom 41.00 3.4

Ratings aligned with performance in Austria during Q3 2020 with A1 coming first for ratings and Speed Score among Austrian mobile operators.

Internet Performance and Five-Star Ratings of Top Fixed Providers in Austria
Speedtest Intelligence® | Q3 2020
Provider Speed Score Rating
Magenta 81.21 3.2
3 26.39 3.0
A1 24.84 2.7

On fixed broadband, Magenta showed the highest rating among users in Austria during Q3 2020. Three was second and A1 was third for ratings on fixed broadband.

In Germany, Telekom highest rated for mobile, Telekom for fixed broadband

Internet Performance and Five-Star Ratings of Top Mobile Providers in Germany
Speedtest Intelligence® | Modern Chipsets in Q3 2020
Provider Speed Score Rating
Tekelom 49.09 3.9
Vodafone 29.69 3.1
1&1 23.18 3.0
O2 22.65 3.2

In Germany, the mobile operator with the highest rating, Telekom, was also the fastest provider during Q3 2020. The rest of the rankings did not follow the order of network performance, but the spread between rankings was relatively small.

Internet Performance and Five-Star Ratings of Top Fixed Providers in Germany
Speedtest Intelligence® | Q3 2020
Provider Speed Score Rating
Vodafone 103.57 2.9
Telekom 44.28 3.3
O2 38.38 3.1

On fixed broadband, the highest-rated provider in Germany during Q3 2020 was Telekom. Despite having a much higher Speed Score than competitors, Vodafone was rated lowest by consumers.

Swisscom rated highest for mobile in Switzerland, Salt for fixed broadband

Internet Performance and Five-Star Ratings of Top Mobile Providers in Switzerland
Speedtest Intelligence® | Modern Chipsets in Q3 2020

Provider Speed Score Rating
Swisscom 57.10 3.6
Sunrise 46.13 3.2
Salt 38.79 2.9

Swisscom was both the highest-rated mobile operator in Switzerland during Q3 2020 and the operator with the best Speed Score. The spread between highest- and lowest-rated mobile operators was very narrow at less than a star.

Internet Performance and Five-Star Ratings of Top Fixed Providers in Switzerland
Speedtest Intelligence® | Q3 2020
Provider Speed Score Rating
Salt 290.89 3.5
UPC 150.45 3.2
Quickline 95.18 3.5
net+ 82.98 3.5
Sunrise 79.40 3.4
Swisscom 76.73 3.5

On the fixed broadband side, Salt, net+, and Swisscom and Quickline tied for the highest rating in Switzerland during Q3 2020 despite a wide difference in Speed Score. The difference between the highest-rated provider and lowest-rated was again very small on fixed broadband.

Provider performance vs. NPS

Speedtest users are also asked how likely they are to recommend their provider to friends or family on a 0 to 10 scale. NPS ratings are categorized into Detractors (score 0-6), Passives (score 7-8), and Promoters (score 9-10). NPS is calculated as (% Promoters – % Detractors) x 100. Any NPS score above 0 indicates that a provider’s audience is more loyal than not. We compared the resulting Net Promoter Score (NPS) with Speed Score to see how performance relates to a user’s likelihood of recommending a provider.

A1 had highest NPS on mobile in Austria, kabelplus highest on fixed broadband

Internet Performance of Top Mobile Providers in Austria
Speedtest Intelligence® | Modern Chipsets in Q3 2020
Provider Speed Score NPS
A1 61.55 1.58
3 43.55 -39.67
Magenta Telekom 41.00 -20.18

A1 showed the highest NPS among mobile operators in Austria in Q3 2020, while Magenta Telekom and 3 showed negative NPS. This suggests that users were not to recommend these operators.

Internet Performance of Top Fixed Providers in Austria
Speedtest Intelligence® | Q3 2020
Provider Speed Score NPS
Magenta 81.21 -28.97
3 26.39 -36.00
A1 24.84 -51.63

Magenta had the highest NPS among fixed broadband providers in Austria in Q3 2020, followed by 3 and A1. No providers had positive NPS values.

Telekom had highest NPS on mobile and fixed broadband in Germany

Internet Performance of Top Mobile Providers in Germany
Speedtest Intelligence® | Modern Chipsets in Q3 2020
Provider Speed Score NPS
Tekelom 49.09 14.82
Vodafone 29.69 -37.74
1&1 23.18 -58.65
O2 22.65 -34.59

Not only did Telekom have the highest NPS on mobile in Germany during Q3 2020, it was also the only mobile operator with a positive NPS, indicating consumers were likely to recommend the operator. As we saw above, Telekom was also the fastest operator and the most highly rated.

Internet Performance of Top Fixed Providers in Germany
Speedtest Intelligence® | Q3 2020
Provider Speed Score NPS
Vodafone 103.57 -50.26
Telekom 44.28 -27.10
O2 38.38 -40.76

Telekom had the highest NPS among fixed broadband providers in Germany during Q3 2020. However, all fixed broadband providers showed negative NPS values.

Swisscom had highest NPS on mobile in Switzerland, Salt on fixed broadband

Internet Performance of Top Mobile Providers in Switzerland
Speedtest Intelligence® | Modern Chipsets in Q3 2020
Provider Speed Score NPS
Swisscom 57.10 -2.74
Sunrise 46.13 -24.66
Salt 38.79 -46.75

Along with having the highest Speed Score in Switzerland and earning the highest ratings from customers, Swisscom had the highest NPS on mobile in Switzerland during Q3 2020. That said, all Swiss mobile operators showed negative NPS values, suggesting that consumers were not likely to recommend these operators to friends or family.

Internet Performance of Top Fixed Providers in Switzerland
Speedtest Intelligence® | Q3 2020
Provider Speed Score NPS
Salt 290.89 -1.24
UPC 150.45 -23.70
Quickline 95.18 -18.29
net+ 82.98 -8.33
Sunrise 79.40 -10.93
Swisscom 76.73 -10.34

Salt, whose Speed Score was almost double that of its nearest competitor, had the highest NPS of any fixed broadband provider in Switzerland during Q3 2020. Among the other providers, speed rankings did not otherwise match the provider rankings for NPS in Switzerland, with second-fastest UPC showing the lowest NPS.

While the fastest speeds don’t always correlate to the highest ratings from customers, there is a clear relationship between the performance, quality and availability of networks and customer satisfaction. As more mobile operators in the DACH countries continue to deploy 5G — and high-speed fiber internet becomes more available in the region — it will be interesting to watch speeds continue to climb. We will continue to monitor both network metrics and Consumer Sentiment data for the region and to surface these insights so providers can understand how and where to improve their networks.


Untersuchung des Verhältnisses zwischen Netzwerkleistung und NPS in Deutschland, Österreich und der Schweiz

Die drei Länder der DACH-Region (Deutschland, Österreich und die Schweiz) sind zwar kulturell miteinander verbunden, aber die Leistungsfähigkeit des Internets ist sehr unterschiedlich. Mithilfe von Daten von Speedtest Intelligence® haben wir die Leistung von Mobilfunknetzbetreibern (MNOs) und Festnetz-Breitband-Internetdienstanbietern (ISPs) in verschiedenen Ländern und auf Anbieterebene im 3. Quartal 2020 verglichen. Wir haben auch die Leistung der Anbieter mit Speedtest Consumer Sentiment™-Daten zu Fünf-Sterne-Ratings und dem Net Promoter Score (NPS) verglichen, um zu verstehen, wie sich die Netzleistung auf die Kundenzufriedenheit auswirkt.

Die Schweiz verfügt über die höchsten Geschwindigkeiten beim Mobilfunk- und Festnetz-Breitband-Download
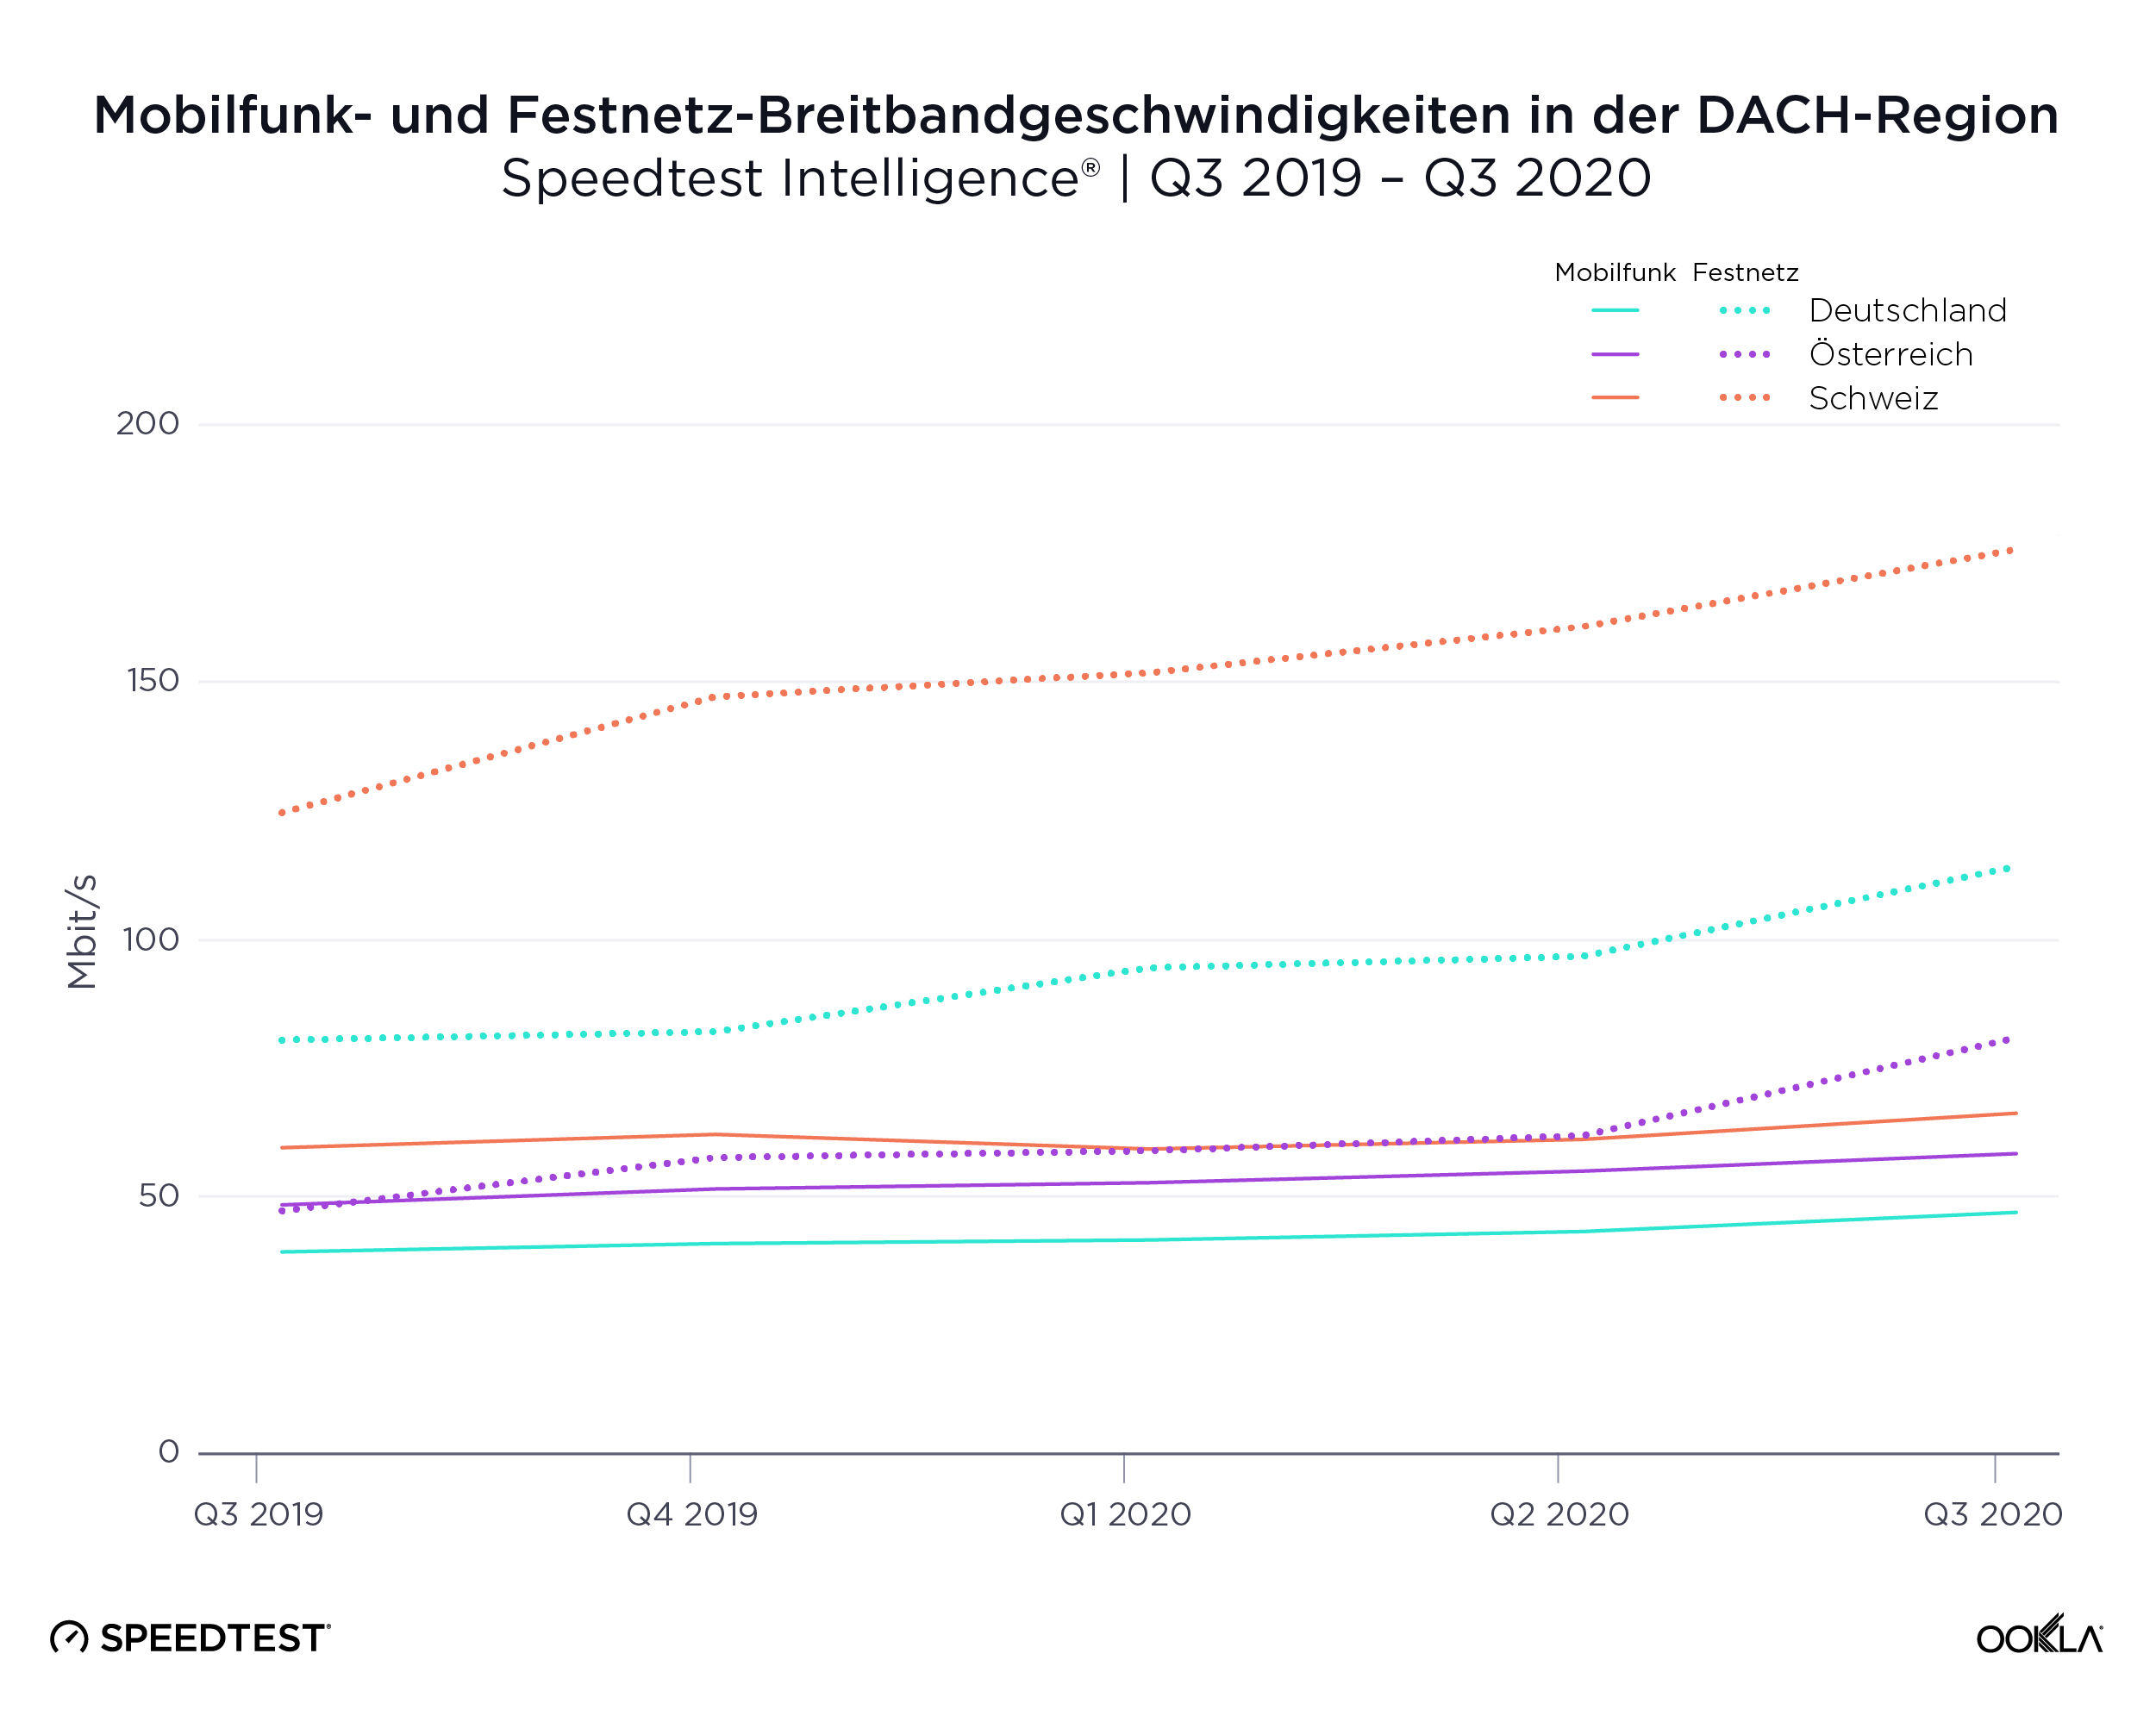
Speeds-Chart_Austria_Germany_Switzerland_1220_de-1

Die Schweiz übertraf Österreich und Deutschland in Bezug auf die durchschnittliche mobile Downloadgeschwindigkeit: Sie erreichte einen Durchschnittswert von 60,61 Mbit/s im dritten Quartal. Die Schweiz belegte im September 2020 weltweit Platz 12 im Speedtest Global IndexTM. Österreich schaffte es mit einer Downloadgeschwindigkeit von 52,76 Mbit/s im Mobilfunk im 3. Quartal 2020 weltweit auf Platz 20. Deutschland wies im 3. Quartal 2020 eine Mobilfunk-Downloadgeschwindigkeit von 41,34 Mbit/s auf und belegte Platz 35. Alle drei Länder haben in großem Umfang in 5G investiert, wobei Deutschland laut der Europäischen Kommission am 4. November 2020 die größte Anzahl von Städten mit 5G-Installationen aufwies. Laut der Ookla 5G MapTM belief sich die Zahl der Installationen auf 2.311. In der Schweiz waren es 554, in Österreich 1.104. Interessanterweise erlebte die Schweiz nach einem Rückgang im Q1-Q2 2020 in Q3 2020 sogar einen Höhepunkt der mobilen Downloadgeschwindigkeit.

Auf der Festnetzseite schnitt die Schweiz mit einer durchschnittlichen Downloadgeschwindigkeit von 170,21 Mbit/s im dritten Quartal noch besser ab. Laut dem Speedtest Global Index vom September 2020 belegte die Schweiz weltweit den 4. Platz im Bereich Festnetz-Breitband. Deutschlands Downloadgeschwindigkeit im 3. Quartal 2020 über Festnetz-Breitband betrug 108,57 Mbit/s und das Land belegte weltweit Platz 29. Österreich hatte im 3. Quartal 2020 mit 75,27 Mbit/s die niedrigste Downloadgeschwindigkeit über Festnetz-Breitband und belegte damit Platz 50. Die Schweiz war das einzige der drei Länder, das im 3. Quartal 2020 mit einer durchschnittlichen Upload-Geschwindigkeit von 110,09 Mbit/s einen gleichen Wert für die Download- und Upload-Geschwindigkeit über Festnetz-Breitband-Verbindungen aufwies. Zum Vergleich: Im selben Zeitraum beliefen sich die Werte in Deutschland auf 25,84 Mbit/s und in Österreich auf 18,42 Mbit/s.

Schnellste Anbieter in Österreich, Deutschland und der Schweiz

Wir verglichen die Internetleistung in Q3 2020 der Top-Anbieter in Österreich, Deutschland und der Schweiz mit Speed ScoreTM. Im Mobilfunkbereich werden hier nur Geräte berücksichtigt, die moderne Chipsätze verwenden.

A1 (Mobilfunk) und Magenta (Festnetz-Breitband) sind in Österreich am schnellsten

Internetleistung der Top-Mobilfunkanbieter in Österreich
Speedtest Intelligence® | Moderne Chipsätze in Q3 2020
Anbieter Speed Score
A1 61,55
3 43,55
Magenta Telekom 41,00

A1 hatte von allen Mobilfunkanbietern in Österreich in Q3 2020 mit 61,55 den schnellsten Speed Score. Three erreichte den zweitschnellsten Speed Score, gefolgt von Magenta Telekom.

Internetleistung der Top-Festnetz-Breitband-Anbieter in Österreich
Speedtest Intelligence® | Q3 2020
Anbieter Speed Score
Magenta 81,21
3 26,39
A1 24,84

Auf der Festnetz-Breitband-Seite auf nationaler Ebene war Magenta im 3. Quartal 2020 der schnellste Anbieter in Österreich. Three belegte den zweiten und A1 den dritten Platz. LIWEST, kabelplus und CableLink hatten zwar höhere Speed Scores als 3 und A1, aber diese regionalen Anbieter sind nur in Teilen Österreichs verfügbar.

Telekom (Mobilfunk) und Vodafone (Festnetz-Breitband) sind in Deutschland am schnellsten

Internetleistung der Top-Mobilfunkanbieter in Deutschland
Speedtest Intelligence® | Modern Chipsets in Q3 2020
Anbieter Speed Score
Telekom 49,09
Vodafone 29,69
1&1 23,18
O2 22,65

Telekom war in Q3 2020 der schnellste Mobilfunkanbieter in Deutschland und lag mit einem Speed Score von 49,09 weit vor dem Zweitplatzierten Vodafone. Platz 3 belegt 1&1 und O2 war auf dem vierten Platz.

Internetleistung der Top-Festnetz-Breitband-Anbieter in Deutschland
Speedtest Intelligence® | Q3 2020
Anbieter Speed Score
Vodafone 103,57
Telekom 44,28
O2 38,38

Vodafone war mit einem Speed Score von 103,57 der schnellste Festnetz-Breitband-Anbieter in Deutschland in Q3 2020. Der Speed Score war doppelt so hoch wie beim Zweitplatzierten, der Telekom. O2 belegte Platz 3.

Die schnellsten Anbieter in der Schweiz sind Swisscom (Mobilfunk) und Salt (Festnetz-Breitband)

Internetleistung der Top-Mobilfunkanbieter in der Schweiz
Speedtest Intelligence® | Modern Chipsets in Q3 2020
Anbieter Speed Score
Swisscom 57,10
Sunrise 46,13
Salt 38,79

Der schnellste Mobilfunkanbieter in der Schweiz in Q3 2020 war Swisscom mit einem Speed Score von 57,10. Sunrise war zweiter und Salt dritter.

Internetleistung der Top-Festnetz-Breitband-Anbieter in der Schweiz
Speedtest Intelligence® | Q3 2020
Anbieter Speed Score
Salt 290,89
UPC 150,45
Quickline 95,18
net+ 82,98
Sunrise 79,40
Swisscom 76,73

Salt war in Q3 2020 der schnellste Festnetz-Breitband-Anbieter in der Schweiz und erreichte einen Speed Score von 290,89, fast zweimal so viel wie der Zweitplatzierte UPC. Quickline belegte Platz 3, net+ Platz 4, Sunrise Platz 5 und Swisscom Platz 6.

Wir haben Fünf-Sterne-Ratings und NPS-Daten mit der Leistung der Anbieter verglichen, um zu verstehen, wie sich die Geschwindigkeit auf die Kundenwahrnehmung deutscher, österreichischer und schweizerischer Anbieter auswirkte. Speedtest Consumer Sentiment-Daten werden über Umfragen mit einer einzigen Frage gesammelt, die den Anwendern am Ende eines Speedtest® angezeigt werden. Dieser Datensatz bietet wertvolle Einblicke in die Kundenzufriedenheit im Laufe der Zeit sowie Wettbewerbsvergleiche, indem er Daten sowohl zum Net Promoter Score (NPS) als auch zur Gesamtzufriedenheit der Kunden mit ihren Netzbetreibern liefert.

Anbieterleistung vs. Bewertungen

Consumer Sentiment erfasst Daten darüber, wie Anwender Anbieter auf einer Skala von eins bis fünf bewerten. Wir haben Bewertungsdaten aus österreichischen, deutschen und schweizer Anbietern in Q3 2020 mit Speed Score verglichen, um die Beziehung zwischen Netzwerkleistung und der Zufriedenheit der Kunden insgesamt mit ihren Netzwerkanbietern zu analysieren.

In Österreich bekam A1 die besten Bewertungen für Mobilfunk und kabelplus schnitt am besten beim Festnetz-Breitband ab

Internetleistung und Fünf-Sterne-Bewertungen der Top-Mobilfunkanbieter in Österreich
Speedtest Intelligence® | Modern Chipsets in Q3 2020
Anbieter Speed Score Bewertung
A1 61,55 3,8
3 43,55 3,3
Magenta Telekom 41,00 3,4

Die Bewertungen deckten sich in Österreich im 3. Quartal 2020 mit der Leistung, wobei A1 bei den Bewertungen und beim Speed Score unter den österreichischen Mobilfunkbetreibern den ersten Platz belegt.

Internetleistung und Fünf-Sterne-Bewertungen der Top-Festnetz-Breitband-Anbieter in Österreich
Speedtest Intelligence® | Q3 2020
Anbieter Speed Score Bewertung
Magenta 81,21 3,2
3 26,39 3,0
A1 24,84 2,7

Im Festnetz-Breitband-Bereich erhielt Magenta die besten Anwenderbewertungen in Q3 2020. Three belegte bei den Bewertungen für Festnetz-Breitband den zweiten Platz und A1 den dritten.

In Deutschland schnitt die Telekom bei den Bewertungen für Mobilfunk und Festnetz-Breitband am besten ab

Internetleistung und Fünf-Sterne-Bewertungen der Top-Mobilfunkanbieter in Deutschland
Speedtest Intelligence® | Modern Chipsets in Q3 2020
Anbieter Speed Score Bewertung
Tekelom 49,09 3,9
Vodafone 29,69 3,1
1&1 23,18 3,0
O2 22,65 3,2

In Deutschland war der Mobilfunkbetreiber mit den besten Bewertungen, die Telekom, gleichzeitig auch der schnellste Anbieter in Q3 2020. Die weitere Platzverteilung entsprach nicht der Reihenfolge der Netzwerkleistung, aber die Spanne zwischen den Platzierungen war relativ gering.

Internetleistung und Fünf-Sterne-Bewertungen der Top-Festnetz-Breitband-Anbieter in Deutschland
Speedtest Intelligence® | Q3 2020
Anbieter Speed Score Bewertung
Vodafone 103,57 2,9
Telekom 44,28 3,3
O2 38,38 3,1

Im Bereich Festnetz-Breitband schnitt die Telekom in Deutschland bei den Bewertungen in Q3 2020 am besten ab. Obwohl der Speed Score von Vodafone deutlich höher war, als bei anderen Mitbewerbern, fielen die Bewertungen der Verbraucher hier am niedrigsten aus.

Swisscom erhielt die besten Bewertungen für den Mobilfunkbereich in der Schweiz und Salt schnitt am besten bei Festnetz-Breitband ab

Internetleistung und Fünf-Sterne-Bewertungen der Top-Mobilfunkanbieter in der Schweiz
Speedtest Intelligence® | Modern Chipsets in Q3 2020
Anbieter Speed Score Bewertung
Swisscom 57,10 3,6
Sunrise 46,13 3,2
Salt 38,79 2,9

Swiscom wurde in Q3 2020 als bester Mobilfunkbetreiber in der Schweiz bewertet und hatte auch den besten Speed Score. Die Differenz zwischen den am besten und am schlechtesten bewerteten Mobilfunkbetreibern war sehr knapp und betrug weniger als einen Stern.

Internetleistung und Fünf-Sterne-Bewertungen der Top-Festnetz-Breitband-Anbieter in der Schweiz
Speedtest Intelligence® | Q3 2020
Anbieter Speed Score Bewertung
Salt 290,89 3,5
UPC 150,45 3,2
Quickline 95,18 3,5
net+ 82,98 3,5
Sunrise 79,40 3,4
Swisscom 76,73 3,5

Im Bereich Festnetz-Breitband gab es bei den Bewertungen einen Gleichstand: Salt, net+, Swisscom und Quickline belegten in Q3 2020 alle den ersten Platz, obwohl es einen großen Unterschied beim Speed Score gab. Die Differenz zwischen dem am besten und dem am schlechtesten bewerteten Anbieter war auch hier im Bereich Festnetz-Breitband sehr gering.

Anbieterleistung vs. NPS

Die Anwender von Speedtest werden auch gefragt, wie wahrscheinlich sie ihren Anbieter ihren Freunden oder ihrer Familie weiterempfehlen würden (Skala von 0 bis 10). NPS-Bewertungen werden in Kritiker (Punktzahl 0-6), Passive (Punktzahl 7-8) und Befürworter (Punktzahl 9-10) eingeteilt. Der NPS wird berechnet aus (% Unterstützer – % Kritiker) x 100. Jeder NPS-Wert über 0 zeigt an, dass die Kunden eines Anbieters eher loyal sind. Wir haben den erzielten Net Promoter Score (NPS) mit dem Speed Score verglichen, um zu sehen, wie die Leistung mit der Wahrscheinlichkeit, dass ein Anwender, einen Anbieter weiterempfiehlt, zusammenhängt.

A1 erzielte den höchsten NPS im Bereich Mobilfunk in Österreich, kabelplus erhielt den besten Wert im Bereich Festnetz-Breitband

Internetleistung der Top-Mobilfunkanbieter in Österreich
Speedtest Intelligence® | Modern Chipsets in Q3 2020
Anbieter Speed Score NPS
A1 61,55 1,58
3 43,55 -39,67
Magenta Telekom 41,00 -20,18

A1 erzielte den höchsten NPS bei den Mobilfunkbetreibern in Österreich in Q3 2020, während Magenta Telekom und 3 negative NPS-Ergebnisse aufwiesen. Daraus lässt sich schließen, dass Anwender diese Betreiber nicht weiterempfehlen würden.

Internetleistung der Top-Festnetz-Breitband-Anbieter in Österreich
Speedtest Intelligence® | Q3 2020
Anbieter Speed Score NPS
Magenta 81,21 -28,97
3 26,39 -36,00
A1 24,84 -51,63

Magenta hatte unter den Festnetz-Breitband-Anbietern den höchsten NPS in Österreich in Q3 2020, gefolgt von 3 und A1. Keiner der Anbieter erzielte positive NPS-Werte.

Die Telekom erzielte den höchsten NPS im Bereich Mobilfunk und Festnetz-Breitband in Deutschland

Internetleistung der Top-Mobilfunkanbieter in Deutschland
Speedtest Intelligence® | Modern Chipsets in Q3 2020
Anbieter Speed Score NPS
Tekelom 49,09 14,82
Vodafone 29,69 -37,74
1&1 23,18 -58,65
O2 22,65 -34,59

Die Telekom erzielte nicht nur den höchsten NPS im Bereich Mobilfunk in Deutschland in Q3 2020, das Unternehmen war auch der einzige Mobilfunkbetreiber mit einem positiven NPS, was bedeutet, dass die Verbraucher den Betreiber wahrscheinlich weiterempfehlen würden. Wie wir bereits gesehen haben, war die Telekom auch der schnellste Anbieter und der am besten bewertete.

Internetleistung der Top-Festnetz-Breitband-Anbieter in Deutschland
Speedtest Intelligence® | Q3 2020
Anbieter Speed Score NPS
Vodafone 103,57 -50,26
Telekom 44,28 -27,10
O2 38,38 -40,76

Die Telekom verzeichnete den höchsten NPS unter den Anbietern von Festnetz-Breitband in Deutschland in Q3 2020. Alle Festnetz-Breitband-Anbieter erzielten jedoch negative NPS-Werte.

Swisscom holte den höchsten NPS im Mobilfunkbereich in der Schweiz ein, Salt im Festnetz-Breitband

Internetleistung der Top-Mobilfunkanbieter in der Schweiz
Speedtest Intelligence® | Modern Chipsets in Q3 2020
Anbieter Speed Score NPS
Swisscom 57,10 -2,74
Sunrise 46,13 -24,66
Salt 38,79 -46,75

Neben dem höchsten Speed Score in der Schweiz und den besten Bewertungen von Kunden erzielte Swisscom auch den höchsten NPS im Mobilfunkbereich in der Schweiz in Q3 2020. Dennoch wiesen alle schweizer Mobilfunkbetreiber negative NPS-Werte auf, was darauf hindeutet, dass die Verbraucher diese Betreiber wahrscheinlich nicht an Freunde oder Verwandte weiterempfehlen würden.

Internetleistung der Top-Festnetz-Breitband-Anbieter in der Schweiz
Speedtest Intelligence® | Q3 2020
Anbieter Speed Score NPS
Salt 290,89 -1,24
UPC 150,45 -23,70
Quickline 95,18 -18,29
net+ 82,98 -8,33
Sunrise 79,40 -10,93
Swisscom 76,73 -10,34

Salt, dessen Speed Score fast doppelt so hoch war wie der, des nächsten Mitbewerbers, hatte unter den Festnetz-Breitband-Anbietern in der Schweiz in Q3 2020 den höchsten NPS. Unter den anderen Anbietern entsprach die Geschwindigkeitsrangliste ansonsten nicht den NPS-Anbieterrankings in der Schweiz, wobei der zweitschnellste, UPC, den niedrigsten NPS aufweist.

Zwar entsprechen die schnellsten Geschwindigkeiten nicht immer den besten Kundenbewertungen, aber es besteht ein klarer Zusammenhang zwischen der Leistung, Qualität und Verfügbarkeit der Netze und der Kundenzufriedenheit. Da immer mehr Mobilfunkbetreiber in der DACH-Region zunehmend 5G bereitstellen – und das Hochgeschwindigkeits-Glasfaser-Internet in der Region immer besser verfügbar wird – ist es interessant zu beobachten, wie die Geschwindigkeiten weiter steigen. Wir werden weiterhin sowohl Netzwerkmetriken als auch die Verbraucherstimmung in der Region beobachten und diese Erkenntnisse aufbereiten, damit die Anbieter erkennen können, wie und wo Verbesserungsbedarf für ihre Netzwerke besteht.


Ookla retains ownership of this article including all of the intellectual property rights, data, content graphs and analysis. This article may not be quoted, reproduced, distributed or published for any commercial purpose without prior consent. Members of the press and others using the findings in this article for non-commercial purposes are welcome to publicly share and link to report information with attribution to Ookla.


| September 28, 2020

Monitoring Network Health and Improving Customer Care with Real-Time Network Performance Data (Webinar)

Speed and responsiveness are critical elements when identifying and resolving customer-impacting network performance issues. Unfortunately, it hasn’t always been easy for internet service providers (ISPs) and mobile network operators to connect internal monitoring system flags to individual customer problem reports. Even once that connection is made, most providers lack a simple way to proactively respond to known performance issues via customer care.

Fortunately, real-time insights into network performance can help providers proactively identify degradation, effectively communicate with customers via traditional customer care flows and social media, and strategically deploy engineers to the most deeply affected areas.

In the Ookla® webinar on October 8, we’ll share three real-world use cases where ISPs and mobile operators are using real-time feeds of Speedtest® data to improve their network operations centers (NOC) and customer care responses. Read on for three examples of how the world’s leading network providers are approaching real-time performance issues.


1. Monitor network performance in real-time to proactively identify customer issues

Data collected via Speedtest Intelligence™, Speedtest Custom™ or a Speedtest SDK™ can be ingested via real-time feeds. These feeds can either connect to Amazon Web Services solutions such as Simple Queue Services (SQS) or to a webhook API. This allows for tight integration of real-time network performance information directly into critical provider services, including customer care.

2. Create NOC dashboards to identify regions and specific locations experiencing performance degradation

Often, consumers report performance issues before internal monitoring tools can detect a trend. Speedtest data can be pulled from real-time feeds to identify individual outliers or arbitrary regions (e.g., a postal code, state or territory) for further investigation. This data can be correlated with network probe data in real-time to provide deeper insights into issues impacting regional performance.

Real-time-header-code

3. Integrate Speedtest data into customer care workflows to help troubleshoot connection issues in real-time

Customer speed tests are already an important component of most customer care workflows — whether taken via a network provider’s own system, Speedtest applications or an operator’s Speedtest SDK instance. While simply identifying whether an internet connection performs as provisioned is a critical first step in troubleshooting customer network issues, additional information is often necessary to truly understand the root cause of an issue. Speedtest real-time feeds deliver this information directly to customer care systems, helping teams understand how factors like connection type, technology, signal level and Wi-Fi band frequency impact an end user’s individual experience.

The webinar on Thursday, October 8 at 9 a.m. Pacific (12 p.m. Eastern) will show these solutions in action. Don’t miss it. A recording will be provided for registrants who can’t tune in to the live presentation. Register now.

Ookla retains ownership of this article including all of the intellectual property rights, data, content graphs and analysis. This article may not be quoted, reproduced, distributed or published for any commercial purpose without prior consent. Members of the press and others using the findings in this article for non-commercial purposes are welcome to publicly share and link to report information with attribution to Ookla.