A year on from our inaugural report, the global 5G SA narrative in 2026 has shifted from a coverage race to a capability contest. The GCC now delivers median download speeds five times those in Europe, while the U.S. has completed its Tier-1 SA launches. Europe is accelerating, but from a low base, and the gap with global leaders risks widening as 5G Advanced scales elsewhere.
The second edition of Ookla and Omdia’s flagship report on the global state of 5G Standalone confirms that the technology has moved beyond launch announcements into an execution-driven phase. By the close of 2025, the “coverage gap” between major economic blocs had narrowed, but a more consequential “capability gap” has emerged, reflecting divergent spectrum strategies, investment depth, and the extent to which operators have moved beyond baseline SA deployment toward end-to-end network optimization.
Globally, 5G SA availability based on Speedtest® sample share reached 17.6% in Q4 2025, up modestly from 16.2% a year earlier, indicating that roughly one in six 5G Speedtests worldwide now occurs on a standalone network. The headline global median SA download speed of 269.51 Mbps represents a 52% premium over non-standalone networks, though this figure masks significant regional variation driven by spectrum allocation depth, carrier aggregation maturity, and user-plane engineering.
For governments and regulators, the stakes of the SA transition have intensified. National competitiveness, digital sovereignty, and AI readiness have converged to reshape investment priorities across major markets. The European Commission’s Digital Networks Act, the U.S.’ supply chain diversification program, and China’s integration of 5G Advanced into its 15th Five-Year Plan all signal that 5G SA is now treated as foundational national infrastructure central to AI ambitions, and not merely a connectivity upgrade.
This year’s report significantly expands the scope of the analysis. For the first time, our research examines 5G SA’s impact on end-user battery life and voice performance (VoNR), quality of experience (QoE) metrics to cloud and gaming infrastructure, and the first wave of commercial monetization strategies spanning consumer network slicing, enterprise SLAs, and 5G Advanced segmentation. We also provide an assessment of the geopolitical context now shaping SA’s evolution, from Europe’s Digital Networks Act to the GCC’s sovereign AI infrastructure strategies.
Key Takeaways:
The GCC has established itself as the global 5G SA performance leader, with the UAE setting the speed benchmark
Led by e& and du’s aggressive 5G Advanced deployments, the Gulf Cooperation Council (GCC) delivered the world’s fastest 5G SA median download speeds in Q4 2025 at 1.13 Gbps, nearly five times that of Europe. The UAE alone reached a median of 1.24 Gbps on SA networks, a speed that would be considered exceptional even for full-fiber broadband in developed markets. The deployment of four-carrier aggregation and enhanced MIMO technology, coupled with the strategic allocation of premium mid-band spectrum to the SA network, demonstrates the performance ceiling that a fully realized 5G SA architecture can achieve.
South Korea followed at 767 Mbps, driven by wide 3.5 GHz channel bandwidth, with the U.S. at 404 Mbps following the completion of nationwide SA deployments by all three Tier-1 operators. Europe, at 205 Mbps, trails all developed regions, though the region’s SA networks still deliver a 45% download speed premium over NSA, confirming the performance value of the SA transition where material spectrum depth is allocated.
Europe’s 5G SA gap with global peers is narrowing, but the region still trails North America by 27 percentage points
Europe’s 5G SA sample share more than doubled from 1.1% to 2.8% between Q4 2024 and Q4 2025, driven by accelerated deployments in Austria (8.7%), Spain (8.3%), the United Kingdom (7.0%), and France (5.9%). These four markets now account for the vast majority of European SA connections. The United Kingdom and France registered the strongest year-on-year acceleration in Europe, each gaining 5.3 percentage points, reflecting the impact of investment-linked merger conditions and competition in the United Kingdom, as well as targeted R&D policy support in France.
U.S. Widens 5G SA Lead Over Europe & Gulf
Speedtest Intelligence® | Q1 2023 – Q4 2025
However, the region still trails North America by 27 percentage points and emerging Asia by 30. At the global level, the U.S. remains the largest accelerator in absolute terms over the last year, with SA sample share rising 8.2 percentage points to 31.6% year-on-year, driven by the sequential rollout of SA across all Tier-1 operators beyond T-Mobile. Firmware fragmentation, where handset OEMs gatekeep SA network access pending individual carrier certification, and tariff structures that fail to incentivize migration from NSA, remain the primary barriers to faster European adoption.
5G SA delivers measurable performance and quality of experience gains, but end-to-end optimization separates leaders from laggards
Globally, SA connections delivered a 52% download speed premium (mostly an artifact of rich spectrum allocation and lower network load) and improved median multi-server latency by over 6% compared to NSA. However, this year’s report finds that a standalone core migration alone does not guarantee a better end-user experience. Quality of experience analysis reveals a nuanced picture: SA improves video and cloud infrastructure latency in Europe versus NSA, but underperforms NSA for gaming latency within the same region. North America records the lowest absolute SA cloud and gaming latency, consistent with dense hyperscaler adjacency and mature interconnect ecosystems.
Among European markets, France (41 ms to cloud endpoints), Austria (48 ms), and Finland (50 ms) demonstrate what is achievable where backbone quality, peering density, and routing discipline are strong. These outcomes reflect an underappreciated end-to-end network stack optimization dividend, encompassing data-center proximity, fiber backhaul depth, and user-plane topology, rather than a pure “SA dividend” alone.
The report also presents early evidence of a tangible consumer benefit of SA: battery life. In the UK, devices on EE’s 5G SA network recorded median discharge times approximately 22% longer than those on NSA, with O2 showing an 11% advantage. These gains likely stem from features like SA’s unified control plane, which eliminates the dual-connectivity overhead of NSA configurations.
Core network investment is accelerating as monetization transitions from concept to selective execution
Omdia’s latest forecasts confirm the industry’s shift toward software-defined core capability as the primary driver of next-cycle investment. Global 5G core software spending is projected to grow at an 8.8% CAGR between 2025 and 2030, with EMEA leading at 16.7%, significantly outpacing North America (5.5%) and Asia & Oceania (4.2%). This reflects EMEA’s later position in the deployment cycle, as the region is entering its period of peak 5G core adoption, while North America’s core spending trajectory is expected to have peaked in 2025 following the commercial launches by AT&T and Verizon. By end of Q3 2025, 83 operators worldwide had deployed 5G core networks, with 5G core investment accounting for 63.6% of global core network function software spending.
5G Core Investment Accelerates Across Regions
Omdia | 2023-2030
On monetization, consumer strategies now span speed tiers (primarily Europe), network slicing (Singapore, France, and the U.S.), and 5G Advanced segmentation packages (China). Enterprise slicing presents the much larger long-term revenue opportunity, with T-Mobile’s SuperMobile representing the first nationwide commercial B2B slicing service in the U.S. Countries with coordinated regulatory frameworks, implementing clear coverage obligations, investment incentives, or infrastructure consolidation policies with deployment remedies, consistently outperform those with fragmented or reactive approaches, reinforcing the report’s finding that policy has emerged as a primary competitive differentiator in 5G SA outcomes globally.
Download the full report
For the comprehensive analysis of 5G SA and 5G Advanced deployment, performance, and monetization across global markets, including new research on battery life, voice performance, quality of experience, geopolitical context, and expanded policy case studies from the UK, France, Brazil, Japan, and the UAE, download the full report, 5G Standalone and 5G Advanced: A Global Reality Check on 5G SA and 5G Advanced in 2026.
Ookla retains ownership of this article including all of the intellectual property rights, data, content graphs and analysis. This article may not be quoted, reproduced, distributed or published for any commercial purpose without prior consent. Members of the press and others using the findings in this article for non-commercial purposes are welcome to publicly share and link to report information with attribution to Ookla.
Luke Kehoe leads Ookla’s research and thought leadership efforts in Europe.
An electronic engineering alumnus of University College Dublin, Luke has extensive experience collaborating with mobile operators, telecoms vendors, and government agencies in research and advisory roles across Europe. He has contributed to internationally recognised thought leadership publications in areas such as 5G, IoT, open RAN, and edge computing, working with prestigious organisations like the Telecom Infra Project and the World Economic Forum.
5G SA rollouts are accelerating globally, but device and tariff-side fragmentation continue to drag on real-world usage
Editor’s Note: The 5G SA map in this poster has been updated. The revised version uses Zoom Level 11 tile resolution, consistent with last year’s edition, to better capture full-year network patterns, particularly in highly urbanized markets like China.
The deployment of 5G Standalone networks is accelerating across a widening number of markets, driven by maturing device ecosystems, rising core network investment, and the growing commercial imperative to deliver the performance improvements that the SA architecture can enable. Despite this progress, the gap between operator-reported coverage of 5G SA networks and real-world usage of these networks continues to widen, held back by tariff inertia and device-side fragmentation in network access.
Regional disparities in commercialization progress persist, but the direction of travel is clear. Markets that were virtually absent from the 5G SA landscape a year ago are now registering meaningful deployment levels, and several advanced operators are pushing into the next evolutionary phase with early deployments of 5G Advanced capabilities built on the SA foundation, including new levels of spectrum depth through advanced carrier aggregation features.
Building on the success of last year’s inaugural edition, Ookla® has released an updated high-resolution downloadable poster based on Speedtest Intelligence® data, offering a unified view of the global reach of both 5G NSA and 5G SA networks through 2025. This visual accompanies a new flagship global study in collaboration with Omdia, comparing the competitiveness of leading regions and countries in 5G SA deployment, performance, and monetization.
Key Takeaways
Asia Pacific continues to lead in 5G SA reach, but new entrants are reshaping the global leaderboard
In 2025, six of the top ten countries by 5G SA reach were in Asia Pacific, with China (79.0% 5G SA sample share), India (49.2%), and Singapore (37.0%) maintaining dominant positions globally. China’s lead has been reinforced by multi-operator SA deployments across all major carriers, while India’s position reflects the deep nationwide low-band coverage strategy pushed by Reliance Jio on the 700 MHz band, supplemented by growing mid-band SA rollout. Singapore’s strong showing, meanwhile, reflects the favorable deployment conditions provided by a small landmass and very high urbanization.
The United States (27.6%) has continued its upward trajectory, propelled by T-Mobile’s maturing SA network and commercial launches by both AT&T and Verizon for the first time during the year, while Australia (15.4%) has similarly benefited from multi-operator SA deployments. Thailand (8.5%) and the Philippines (9.0%) round out the Asia Pacific contingent, reflecting growing SA ambitions in Southeast Asia. The UAE (8.0%) has entered the top ten for the first time, signaling a geographic diversification of SA adoption beyond advanced Asian markets. Austria (8.0%) and Spain (8.1%) remain the only European markets in the upper ranks, though the region’s broader trajectory has shifted meaningfully.
APAC Claims 6 of Top 10 Spots in Global 5G SA Reach
Speedtest Intelligence® | 2025
The U.S. sustains its 5G SA performance lead, while the UAE and South Korea demonstrate the ceiling for optimized networks
The United States now combines relatively high 5G SA reach with strong download speeds, a combination that is unusual globally. In Q4 2025, median download speeds on 5G SA in the U.S. reached 403.97 Mbps, building on the gains recorded in the prior year, and significantly ahead of large-scale Asian deployments such as China (212.40 Mbps) and India (222.11 Mbps).
T-Mobile’s “layer cake” spectrum strategy remains the foundation of U.S. 5G SA performance. By pairing broad 600 MHz coverage, initially launched as 5G NSA in 2019 before transitioning to SA in 2020, with dense mid-band deployment in the 2.5 GHz band, the operator has matured its SA network to the point where advanced features such as uplink carrier aggregation and Voice over NR (VoNR) are now widely deployed. Recent 5G SA launches by AT&T and Verizon have extended multi-operator coverage and added the U.S. to the small but burgeoning list of Western markets in which all operators now support nationwide 5G SA networks.
At the top of the global performance table, the UAE has emerged as the clear leader in absolute 5G SA download speeds, registering a median of 1.24 Gbps in Q4 2025. This result is driven by large, contiguous TDD mid-band deployments, intensive carrier aggregation, and site grid densification by Etisalat and du. South Korea sustains its position as a high-performance market at 766.92 Mbps, propelled by its exclusive use of the 3.5 GHz band for 5G, though it continues to trail regional peers in SA reach due to limited commercialization beyond KT. This marks a notable shift from the global leadership South Korea held at the start of the 5G cycle.
5G SA delivers performance uplift across key metrics, but real-world gains in QoE require more than just a core migration
Globally, 5G SA networks are delivering materially improved performance compared to the non-standalone architecture, and the performance gains have held even as SA deployments mature with higher traffic onboarding. In Q4 2025, median download speeds on 5G SA were more than 120% higher than on NSA networks in North America, 57% higher in advanced Asia and Oceania, and 45% higher in Europe. The regional variation reflects differences in spectrum depth, network maturity, and the degree to which operators have activated advanced SA features such as carrier aggregation, rather than any inherent advantage of SA in downlink performance.
Headline latency improvements, a touted beneficiary of the transition to the 5G core, continue to be significant. SA networks delivered median multi-server latency reductions of more than 27% in advanced Asia and Oceania, nearly 24% in North America, and 17% in Europe compared to NSA. However, it is important to note that a standalone core migration alone does not guarantee a better end-user experience in real-world applications. Our quality of experience (QoE) analysis reveals a nuanced picture. SA improves video and cloud infrastructure latency in Europe versus NSA, but underperforms NSA for gaming latency within the same region. North America records the lowest absolute SA cloud and gaming latency, consistent with dense hyperscaler adjacency and mature interconnect ecosystems.
Among European markets, France (41 ms to cloud endpoints), Austria (48 ms), and Finland (50 ms) demonstrate what is achievable where backbone quality, peering density, and routing discipline are strong. These outcomes reflect an underappreciated end-to-end network stack optimization dividend, encompassing data-center proximity, fiber backhaul depth, and user-plane topology, rather than a pure “SA dividend” alone.
The upload story has begun to diverge by region. North America’s SA networks deliver 54% higher upload speeds than NSA, reflecting the early implementation of advanced uplink capabilities. In Europe, however, the upload advantage is just 6%, highlighting the still nascent deployment of features such as higher-order MIMO and uplink carrier aggregation in the region beyond leading countries like the United Kingdom. Advanced Asia and Oceania sit in between at 21%, suggesting that the ecosystem for advanced SA uplink capabilities remains at an early stage in most global markets.
A detailed analysis of the state of 5G SA and 5G Advanced around the world is featured in Ookla’s flagship report, produced in collaboration with Omdia, on regional competitiveness in the technology.
Ookla will be at Mobile World Congress this year, located at Booth 2I28 in Hall 2. Please drop by to discuss the state of connectivity in your market, and how Ookla’s network insights can help deliver better connected experiences.
Ookla retains ownership of this article including all of the intellectual property rights, data, content graphs and analysis. This article may not be quoted, reproduced, distributed or published for any commercial purpose without prior consent. Members of the press and others using the findings in this article for non-commercial purposes are welcome to publicly share and link to report information with attribution to Ookla.
Luke Kehoe leads Ookla’s research and thought leadership efforts in Europe.
An electronic engineering alumnus of University College Dublin, Luke has extensive experience collaborating with mobile operators, telecoms vendors, and government agencies in research and advisory roles across Europe. He has contributed to internationally recognised thought leadership publications in areas such as 5G, IoT, open RAN, and edge computing, working with prestigious organisations like the Telecom Infra Project and the World Economic Forum.
Mobile network download speeds declined by more than 50%, while Starlink usage experienced a nearly 200% increase compared to pre-storm baselines
Less than a year after the April 2025 Iberian Peninsula blackout exposed deep vulnerabilities in Portugal’s telecom infrastructure, the country faced another severe test. Between late January and early February 2026, a rapid succession of powerful extratropical cyclones battered the country, knocking out power to over a million customers, disrupting mobile connectivity for hundreds of thousands, and triggering a dramatic spike in satellite broadband usage. Speedtest Intelligence® data captures the scale of network impact and the emerging role of low-earth orbit (LEO) satellite connectivity as a layer of redundancy when terrestrial networks falter.
Key Takeaways:
Median mobile download speeds in Portugal fell by as much as 52.4% from their pre-storm baseline, dropping from 107.3 Mbps to just 51.1 Mbps at their lowest point on February 8, as successive storms compounded network strain.
Mobile upload speeds declined by up to 46.6%, while latency increased by 15.6% and jitter by 27.1% during the worst of the disruption, reflecting significant network congestion and infrastructure stress.
Starlink user activity in Portugal surged by approximately 196% above pre-storm levels at its peak on February 12, with elevated adoption persisting well into late February even as mobile networks began to stabilize.
The data highlights a clear network substitution pattern, with Starlink activity climbing in near-lockstep with mobile speed declinesand fixed network disruptions, reinforcing the case for satellite as a meaningful resilience layer during prolonged terrestrial outages.
Portugal, like many European countries outside the Nordics, continues to lack any binding requirements for specific minimum backup power levels at mobile sites. Recent policy developments in Switzerland and in the EU’s Digital Networks Act (DNA) suggest resilience planning is moving from concept to practical action.
A devastating storm sequence
Storm Kristin made landfall in Portugal’s Leiria district on the night of January 28, 2026, bringing record-breaking winds of over 200 km/h in the Coimbra region and generating over 1,500 emergency incidents in a single night. The storm was the most destructive to hit the country in recent memory, surpassing wind speed records previously held by Hurricane Leslie. Initial disruption was severe, with Reuters reporting more than 3,000 weather-related incidents and electricity distributor E-REDES indicating that outage levels had earlier reached 855,000 customers before restoration work began to reduce that figure.
On the grid side, the damage split across transmission and distribution layers. REN reported 61 very high-voltage pylons knocked down during Storm Kristin and 774 km of very high-voltage lines out of operation, which it said was equivalent to about 7% of Portugal’s transmission grid. E-REDES separately reported more than 600 damaged medium-voltage poles and said that more than one million customers had been left without power at one stage of the event. This distinction is significant because it highlights how resilience bottlenecks emerge across multiple network tiers, not only at the local distribution level.
Telecom disruption was also prolonged. Paulo Fernandes (head of the Central Region Reconstruction Mission Structure) said the affected area started with 307,900 mobile and landline users without communications on 30 January, and that nearly 84,000 customers in the central region still lacked communications almost three weeks later. He also said around 40% of cases were linked to the restoration of electricity supply to mobile sites.
This power dependency aligns with local expert commentary. INESC TEC-linked analysis highlighted that many telecom outages were driven first by loss of electricity at network sites, with a share of the remainder linked to infrastructure faults such as fiber breaks. It was also reported that ANACOM had recommended activation of national roaming, which could help by allowing users to attach to alternative networks where available.
Mobile network performance degradation was severe and sustained, with recovery still ongoing
Analysis of Speedtest Intelligence data paints a detailed picture of how Portugal’s mobile networks responded to the storm sequence. To assess the impact, we established a pre-storm performance baseline using daily median values from January 3 through January 27, 2026, then measured deviations across three distinct phases of disruption.
Prior to the storms, Portugal’s mobile networks were delivering a median download speed of 107.3 Mbps and median upload speed of 15.7 Mbps, with a multi-server latency of 33.5 ms. These figures are consistent with a well-performing mobile market (ranking in the top 30 globally in the latest iteration of the Speedtest Global Index).
The onset of Storm Kristin on January 28 triggered an immediate and sharp decline. Median download speeds fell to 64.5 Mbps that day, a 39.9% drop from baseline, while upload speeds declined 37.4% to 9.8 Mbps. Latency spiked 15.6% to 39 ms and jitter surged 27.1% to 10 ms, indicating significant network congestion as damaged infrastructure concentrated traffic on surviving cells (likely compounded by the loss of fixed connectivity in homes driving more traffic onto the depleted mobile grid).
Rather than recovering, network performance continued to deteriorate in the days that followed as Storms Leonardo and Marta exacerbated the damage. During the sustained disruption phase from February 1 through 14, average median download speeds fell to 59.9 Mbps, a 44.1% decline from baseline. The single worst day came on February 8, during Storm Marta, when median download speeds bottomed out at just 51.1 Mbps, a 52.4% decline. Upload speeds during this phase averaged just 9.5 Mbps, down 39.1% from baseline.
Latency and jitter, often overlooked but critical indicators of quality of experience (QoE) in interactive applications like video conferencing, told a similar story. Median latency during the sustained phase rose to 37 ms, a 10.5% increase over baseline, while jitter averaged 9 ms, up 21.6%. Elevated jitter in particular can reflect the instability characteristic of a network under duress, where routing paths shift unpredictably as infrastructure comes on and offline.
By mid-to-late February, partial recovery was underway. Median download speeds during the February 15 through February 23 period rose to 69.8 Mbps, still 34.9% below baseline but representing meaningful improvement. Upload speeds recovered to 11.0 Mbps (down 29.7%), while latency moderated to 36 ms (up 8.3%). Notably, jitter remained stubbornly elevated at 9 ms (up 21.6%), suggesting that while raw throughput was improving, network stability had not yet fully normalized.
Starlink as a Resilience Layer
As mobile network performance declined, Speedtest data reveals a striking and sustained surge in Starlink usage across Portugal, providing one of the clearest real-world illustrations of satellite connectivity functioning as a resilience layer during prolonged terrestrial disruption.
In the weeks before Storm Kristin, Starlink activity in Portugal was relatively stable. From January 28 onward, however, user activity began climbing sharply. During the acute phase from January 28 through January 31, Starlink user activity averaged 49.4% above baseline, peaking at 61.3% above on January 31 as the scale of mobile network disruption became apparent. This initial surge likely reflects both existing Starlink subscribers increasing their usage in response to degraded mobile and fixed service and new users activating service for the first time.
The sustained disruption phase from February 1 through February 14 saw Starlink activity more than double, averaging 118.4% above baseline. The single highest day came on February 12, when user activity reached approximately 196% above pre-storm levels. This coincided with the period of deepest mobile network degradation (and, likely, fixed network unavailability either due to localized power loss or line faults), providing strong evidence of a network substitution dynamic where some users turned to satellite connectivity as their primary or sole means of internet access.
Perhaps most notably, Starlink user activity did not recede even as mobile networks began their partial recovery. During the February 15 through February 23 period, Starlink activity averaged 151.0% above baseline, substantially higher than even the acute storm phase. This pattern suggests that for many users, the storm experience catalyzed a longer-term shift in connectivity behavior, with satellite maintained as either a primary or backup connection even after terrestrial alternatives began stabilizing.
Portuguese authorities also actively deployed Starlink as an emergency communications tool. Starlink equipment was distributed to remote areas where traditional telecommunications had been knocked offline, helping to bridge the connectivity gap in the hardest-hit communities. This mirrors the pattern observed during the April 2025 Iberian blackout, when Starlink remained operational across the peninsula by routing through ground stations in Italy as Spanish facilities went dark.
It is worth noting that Starlink speeds did moderate as user load increased. Average download speeds during the sustained phase fell to 163.5 Mbps, a 21.7% decline from the pre-storm Starlink baseline of 208.8 Mbps. However, even at their most congested, Starlink speeds remained materially higher than the degraded mobile network’s performance during the same period, delivering nearly three times the median download speed that mobile users were experiencing.
The Regulatory Gap and the Road to Resilience
The storm sequence reinforces a core resilience lesson: in prolonged extreme-weather events, telecom continuity is heavily shaped by power autonomy at sites, restoration logistics, and transport network redundancy, not only by RAN capacity. In practice, the biggest outages often reflect cross-sector interdependence between electricity, fibre transport and mobile access infrastructure.
Indeed, domestically, the storms have reignited debate around the resilience of Portugal’s telecom infrastructure, particularly the adequacy of backup power provisions at mobile sites. The finding that 40% of failures stemmed from power loss at mobile sites, rather than direct storm damage, points to a structural vulnerability that is within regulatory reach to address.
Portugal currently lacks binding requirements for specific minimum backup power autonomy levels at mobile sites. This stands in contrast to Nordic markets such as Norway and Finland, where regulators require between two and six hours of backup power at critical sites, alongside routine stress testing and contingency planning obligations.
In Norway, Nkom’s forsterket ekom programme is a state-backed resilience scheme that hardens selected sites in priority municipalities. Designated mobile sites must have at least 72 hours of backup power, the main transmission path must also have 72 hours, and a separate reserve transmission path is required. Switzerland has also recently codified a phased minimum backup approach. In January 2026, the Federal Council adopted an FDV revision requiring mobile operators to install emergency power at key sites and antennas so mobile service can be maintained for at least four hours from 2031 (with emergency calls covered first, and other services phased in later).
Within the EU, meanwhile, Brussels’ Electronic Communications Code (EECC) permits member states to mandate such provisions but does not require them. The Commission’s DNA proposal, adopted on 21 January 2026, is framed around investment and simplification, but it also directly elevates resilience by introducing an EU-level Preparedness Plan to address rising risks from natural disasters and foreign interference, and by embedding security and resilience criteria into the pan-EU satellite mechanism.
The resilience policy implications arising from this are important. The DNA gives the EU a stronger coordination spine for preparedness, but it does not remove the need for national regulators to set concrete, site-level resilience expectations (including backup-power minimums) that reflect local grid conditions and risk exposure.
On the operator side, Vodafone’s Enhanced Power initiative, launched in November 2025 with Portugal as a first deployment region, targets 10,000-plus mobile infrastructure sites across Europe with backup power provisions ranging from four hours at critical access sites to 72 hours at core mobile data centers. The initiative incorporates AI-based systems to predict and conserve backup power duration. Separately, Portugal’s government has announced a €400 (US$ 471) million investment package for grid resilience, including a 750 MW battery storage expansion.
The experience of January and February 2026 reinforces what the Storm Éowyn analysis across the UK and Ireland also demonstrated: that the resilience of mobile networks in extreme weather is fundamentally a function of power autonomy at mobile sites. Where terrestrial infrastructure falls short, satellite connectivity is increasingly proving its value, not as a replacement for mobile networks, but as a complementary layer of redundancy that can sustain connectivity when ground-based systems falter.
Ookla retains ownership of this article including all of the intellectual property rights, data, content graphs and analysis. This article may not be quoted, reproduced, distributed or published for any commercial purpose without prior consent. Members of the press and others using the findings in this article for non-commercial purposes are welcome to publicly share and link to report information with attribution to Ookla.
Luke Kehoe leads Ookla’s research and thought leadership efforts in Europe.
An electronic engineering alumnus of University College Dublin, Luke has extensive experience collaborating with mobile operators, telecoms vendors, and government agencies in research and advisory roles across Europe. He has contributed to internationally recognised thought leadership publications in areas such as 5G, IoT, open RAN, and edge computing, working with prestigious organisations like the Telecom Infra Project and the World Economic Forum.
Spain continues to lead Europe in fiber rollout, but lagging mobile performance undermines country’s overall telecoms competitiveness
The dynamism of Spain’s telecoms market stood out among its European peers last year, with a flurry of mergers reshaping the market’s structure and strong investment in next-generation networks, supported by targeted government initiatives, improving outcomes for Spanish consumers. However, while increased fiber and 5G penetration have driven notable year-on-year improvements in overall network performance, Spain’s international competitiveness in telecoms remains highly imbalanced between its fixed and mobile infrastructure.
The country’s credentials as Europe’s preeminent fiber leader remain intact. In 2024, Spain ranked among the top three in the EU for fiber-to-the-premises (FTTP) coverage (95.2%) and the share of fixed broadband subscriptions providing download speeds above 100 Mbps (93.5%), according to the latest edition of the European Commission’s ‘State of the Digital Decade’ report. This continues to position the country significantly ahead of some of the bloc’s largest economies, most notably Germany, which still lags in FTTP coverage (28.8%) due to a slow shift away from cable networks.
Analysis of Speedtest Intelligence® data reveals that median fixed download speeds in Spain increased from 173.32 Mbps to 210.46 Mbps between 2023 and 2024. This trend of improvement was mirrored across other fixed network performance metrics, with upload speeds increasing in the same period from 129.62 Mbps to 155.53 Mbps. In Q3 2024, DIGI achieved a median fixed download speed of 321.21 Mbps in the Spanish market, followed by Jazztel (273.18 Mbps), Orange (262.78 Mbps), Yoigo (255.74 Mbps) and Movistar (180.30 Mbps).
Spain Leads Europe in Fiber Deployment and Adoption, Boasting the Highest Coverage Among the EU's Top 10 Economies
European Commission | DESI 2018 – 2024
Having achieved exceptionally high levels of FTTP penetration across urban, suburban and rural areas—placing Spain among the top three in the European Commission’s DESI 2024 Index for FTTP coverage in sparsely populated rural areas—the focus in Spain is shifting toward enhancing quality of experience (QoE) in core use cases such as gaming and video streaming. Despite boasting higher FTTP coverage and take-up rates, Spain ranks below countries like France in Ookla’s Speedtest Global Index™. This disparity highlights the influence of factors such as Wi-Fi technology—France has a higher penetration of Wi-Fi 6 and 7 in ISP-provided CPE—and tariff provisioned speeds, with a larger share of fiber customers in France subscribing to multi-gigabit plans, on fixed broadband performance.
DIGI’s strong fixed download speed performance in Spain, detailed in Ookla’s Speedtest Connectivity Report for 1H 2024, is underpinned by similar favourable factors. Notably, it was first to market in Spain with a 10 Gbps service, fully leveraging its XGS-PON fiber infrastructure. With highly competitive pricing—starting at just €20 per month for 1 Gbps and €25 per month for 10 Gbps, including Wi-Fi 6 CPE as standard—DIGI has quickly secured a significant share of multi-gigabit capable connections in the Spanish market.
Autonomous Communities in Northern Spain Lead in Fixed Download Speed Performance
Speedtest Intelligence® | 2024
In addition to highlighting the importance of modern CPE and higher tariff-provisioned speeds, DIGI’s business last year exemplified the accelerating consolidation trends in Spain’s highly overbuilt and fragmented fiber market. The acquisition of DIGI’s fiber infrastructure by a Macquarie-led consortium, which solidified wholesale specialist Onivia’s status as the largest of the ‘neutral’ FTTP networks in Spain, dovetailed with developments such as Telefónica’s BlueVia wholesale spin-off, the emergence of MásOrange and Zegona-controlled Vodafone’s ‘FiberCo’ tie-ups with both Telefónica and MásOrange.
As observed in other European markets with significant fiber overbuild, such as the alt-net model in the UK, consolidation is a slow and challenging process. However, Spanish operators continue to pursue it to enhance the economics of their fiber investments in highly overbuilt urban areas, unlocking scale and resources to capture future growth in rural areas where overlapping infrastructure is less common. This begins with small local operators—of which there are hundreds—being absorbed by ‘local consolidators’. These are then integrated into the infrastructure portfolios of regional consolidators, ultimately leading to acquisition by one of the largest traditional players.
Fiber Overbuild from Smaller Players like DIGI Drives Market Share Shift from Incumbents
Analysis of CNMC Market Data | 2022 – 2024
This gradual process of consolidation is reshaping the fiber business model in Spain, as traditional operators separate their infrastructure and service units to support the growth of wholesale offerings. The coming year will provide some insight into whether a consolidated third player can successfully compete and coexist alongside the vertically integrated Telefónica and MásOrange in the long-term.
MásOrange is vying for network leadership in Spain, founded on a significant spectrum advantage
The winds of consolidation have swept through the Spanish mobile market too, culminating last year in the European Commission’s approval of a 50:50 joint venture between MásMóvil and Orange. The merger has pole-vaulted the newly formed ‘MásOrange’ into a leading position in the market, both in subscription and spectrum share. To secure regulatory approval from Brussels, the merging entity committed to divesting 60 MHz of spectrum, including 20 MHz in the 3.5 GHz band, to facilitate the entry of DIGI as a fully-fledged independent mobile operator, effectively restoring the Spanish market to a four-player structure and ‘exerting a strong competitive constraint on the joint venture’.
In addition to diversifying its portfolio of brands through the merger—with Orange and Yoigo catering to the premium segment, Jazztel and MásMóvil focusing on value for money and regional brands like Euskaltel and Telecable serving local needs—MásOrange hopes its consolidated spectrum assets will enable it to achieve network leadership in the Spanish mobile market.
Movistar Revenues Stable YoY in Q3 2024 while Vodafone and MásOrange Face Declines
Analysis of CNMC Market Data | 2022 – 2024
The merged entity’s consolidated network will be primarily based on Orange’s infrastructure, complemented by MásMóvil’s existing site portfolio and the deployment of new greenfield sites. The integration of MásMóvil’s network, which relies entirely on mid- and high-band spectrum and has historically depended on a national roaming agreement with Orange, creates a natural synergy for the merged entity. It enables the integrated network to leverage MásMóvil’s capacity and density in urban areas alongside Orange’s extensive coverage and nationwide reach.
MásOrange is particularly focused on vying to unseat Movistar’s dominance in the premium segment, a position it has long upheld thanks to its emphasis on superior network quality. Movistar emerged as the fastest mobile operator in the Spanish market in Ookla’s Speedtest Connectivity Report for 1H 2024, delivering the highest median download speeds of 82.68 Mbps. This placed Movistar significantly ahead of Orange (56.42 Mbps) and Yoigo (36.73 Mbps).
The merged entity’s spectrum advantage is heavily weighted toward mid- and high-bands, which are typically utilised for 5G deployments in urban and suburban areas. According to data published by MásOrange, it holds 37% of all mid- and high-band assets in the Spanish market—compared to 28% and 26% for its closest competitor, Telefónica—giving it a unique opportunity to enhance 5G speed performance and gain a competitive edge.
Movistar has maintained its strong 5G speed performance with a 100 MHz allocation in the 3.5 GHz band, but this is now overshadowed by MasOrange’s expanded allocation of 170 MHz. Capital investment by the merged entity in upgrading the 5G RAN to support advanced carrier aggregation (CA) capabilities and the standalone (SA) architecture will enable it to fully realise the performance benefits of wider channel bandwidth through the extensive deployment of its 3.5 GHz spectrum across its consolidated mobile site grid.
Seville Leads in 5G Download Speed Among Spain's Largest Cities, but Operator Performance Varies Widely
Speedtest Intelligence® | Q3 2024
To establish network leadership in coverage, however, MásOrange will need to move beyond its spectrum advantage and focus on increasing the number of physical sites in rural areas within its integrated network. In Q3 2024, Vodafone and Movistar recorded 4G Availability of 95.1% and 93.4% respectively in the Spanish market, followed by Orange at 92.7% and Yoigo at 91.5%.
In parallel to MásOrange’s network consolidation journey, DIGI is building out its own infrastructure to gradually wean itself off dependence on a national roaming and RAN sharing agreement with Telefónica (which DIGI selected over MásOrange, despite both being options under the merger conditions), starting with urban and suburban areas. The European Commission designed the spectrum divestment remedies to position DIGI to replicate the competitive pressure previously exerted by MásMóvil. The goal is for DIGI to carry a similar share of its total mobile data traffic on its own network in the coming years, at least matching the 40-60% on-net share that MásMóvil achieved pre-merger.
Spain's Rural Provinces Trail in 5G Availability, Highlighting the Importance of Government Support through UNICO
Speedtest Intelligence® | Overall 5G Availability (%) in 2024
More broadly, it is hoped that the substantial long-term investment commitments from DIGI and MásOrange, driven by the consolidation activity, combined with government support through programmes such as Unico, will bolster Spain’s international competitiveness in mobile performance in the coming years. The country has significant catching up to do, ranking 57th in the Speedtest Global Index at the end of 2024 and trailing most of its European peers across a suite of network performance metrics, including download speed, consistency and coverage.
La consolidación cambia las telecomunicaciones españolas en 2025
España sigue a la cabeza en despliegue de fibra en Europa, pero el rezagado desempeño móvil reduce la competitividad del país
El dinamismo del mercado español de telecomunicaciones destacó el año pasado frente al de otros mercados europeos, por fusiones que modificaron la estructura del sector y una fuerte inversión en redes de próxima generación, respaldadas por iniciativas gubernamentales, que supusieron mejoras para los consumidores españoles. Si bien la mayor penetración de la fibra y el 5G han impulsado año tras año notables avances en el rendimiento general de la red, la competitividad internacional de España en telecomunicaciones sigue estando muy desequilibrada entre su infraestructura fija y móvil.
Las credenciales del país como líder europeo en fibra permanecen intactas. En 2024, según la última edición del informe ‘Estado de la Década Digital’ de la Comisión Europea, España se situó entre los tres primeros países de la UE en cobertura de fibra hasta las instalaciones (FTTP), con un 95,21%, y en porcentaje de suscripciones de banda ancha fija con velocidades de descarga superiores a 100 Mbps (93,54%). Esto posicionó al país significativamente por delante de algunas de las economías más grandes del bloque, en particular Alemania, todavía rezagada en cobertura FTTP (28,80%).
Según Speedtest Intelligence la velocidad mediana de descarga fija en España aumentó de 173,32 Mbps a 210,46 Mbps entre 2023 y 2024. Esta tendencia de mejora se reflejó en otras métricas de rendimiento de la red fija, con velocidades medianas de carga que se incrementaron de 129.62 Mbps a 155.53 Mbps en el mismo período. En el tercer trimestre de 2024, DIGI alcanzó una velocidad mediana de descarga fija de 321,21 Mbps, por delante de Jazztel (273,18 Mbps), Orange (262,78 Mbps), Yoigo (255,74 Mbps) y Movistar (180,30 Mbps).
España lidera Europa en despliegue y adopción de fibra, con la mayor cobertura entre las 10 principales economías de la UE
Comisión Europea | DESI 2018-2024
Habiendo alcanzado niveles excepcionalmente altos de penetración de FTTP en áreas urbanas, suburbanas y rurales (que posicionan a España entre los tres primeros del índice DESI 2024 de la Comisión Europea sobre cobertura FTTP en zonas rurales escasamente pobladas), España está cambiando el foco hacia la mejora de la calidad de la experiencia (QoE) para casos de uso como los vídeojuegos y el streaming. A pesar de contar con más cobertura y tasas de aceptación FTTP, España está por debajo de países como Francia en el Índice Global de Speedtest de Ookla.
Este desequilibrio pone de relieve la influencia en el rendimiento de la banda ancha fija de factores como la tecnología Wi-Fi (Francia tiene una mayor penetración de Wi-Fi 6 y 7 en los router proporcionados por los operadores) y las velocidades ofrecidas en la tarifa (con una mayor proporción de clientes de fibra suscritos a planes multi-gigabit en Francia).
El sólido rendimiento de la velocidad de descarga fija de DIGI en España, detallado en Informe de Conectividad de Speedtest, está respaldado por factores favorables similares. Fue el primero en comercializar en España un servicio de 10 Gbps, aprovechando al máximo su infraestructura de fibra XGS-PON. Con precios altamente competitivos (desde sólo 20€ al mes por 1 Gbps y 25€ por 10 Gbps y router Wi-Fi 6 incluido), DIGI se ha asegurado rápidamente una cuota importante de conexiones con capacidad multigigabit en el mercado español.
Las comunidades autónomas del norte de España, líderes en rendimiento de velocidad de descarga fija
Speedtest Intelligence® | 2024
Además de evidenciar la importancia de un router moderno y velocidades más altas, el negocio de DIGI ejemplificó el año pasado la acelerada tendencia de consolidación en el fragmentado y sobredimensionado mercado español de fibra. La adquisición de la infraestructura de fibra de DIGI por parte de un consorcio liderado por Macquarie, que consolidó el estatus de Onivia como la mayor red FTTP ‘neutra’ en España, coincidió con otros acontecimientos como la escisión de BlueVia de Telefónica, la aparición de MásOrange y las alianzas de ‘FibreCo’ de Vodafone con Telefónica y MásOrange.
Como se observa en otros mercados europeos con un importante despliegue de fibra (como Reino Unido), la consolidación es un proceso lento y desafiante. Sin embargo, los operadores españoles continúan persiguiéndola para mejorar la rentabilidad de sus inversiones en fibra en áreas urbanas altamente edificadas, liberando recursos para aprovechar el crecimiento futuro en áreas rurales donde la superposición de infraestructura es menos común. Esto comienza con la absorción de pequeños operadores locales (de los que hay cientos) por “consolidadores locales”. Luego, éstos se integran en las carteras de infraestructura de los consolidadores regionales, lo que en última instancia conduce a la adquisición por parte de uno de los actores tradicionales más grandes.
El despliegue de fibra por parte de actores más pequeños como DIGI impulsa el cambio en la cuota de mercado de los operadores tradicionales
Análisis de datos de CNMC | 2022-2024
Esta consolidación gradual está modificando el negocio de la fibra en España, mientras que los operadores tradicionales separan sus unidades de infraestructura y servicios para apoyar el crecimiento de la oferta mayorista. Este año se podrá saber si un tercer actor consolidado puede competir y coexistir con éxito a largo plazo con Telefónica y MásOrange.
MásOrange compite por el liderazgo de la red en España, apoyándose en una importante ventaja de espectro
La consolidación también ha afectado al mercado móvil español. A finales del año pasado, la Comisión Europea aprobó la creación de una empresa conjunta entre MásMóvil y Orange. La fusión ha llevado a la recién formada MásOrange a una posición de liderazgo, tanto en suscripción como en cuota de espectro. Para obtener la aprobación de Bruselas, la entidad se comprometió a vender 60 MHz de espectro, incluidos 20 MHz en la banda de 3,5 GHz, para facilitar la entrada de DIGI como un operador móvil independiente de pleno derecho, convirtiendo así el mercado español en una estructura de cuatro actores.
Además de diversificar su cartera de marcas a través de la fusión (con Orange y Yoigo en el segmento premium, Jazztel y MásMóvil centrándose en la relación calidad-precio y Euskaltel y Telecable atendiendo las necesidades locales), MásOrange espera que sus activos de espectro le permitan alcanzar el liderazgo en el mercado móvil español.
Los ingresos de Movistar se mantienen estables interanualmente en el 3T de 2024 mientras que Vodafone y MásOrange afrontan caídas
Análisis de datos de mercado de CNMC | 2022-2024
La red de la entidad se basará principalmente en la infraestructura de Orange, complementada con la cartera de sites existentes de MásMóvil y el despliegue de nuevos. La integración de la red de MásMóvil, que depende íntegramente del espectro de banda media y alta e históricamente ha dependido de un acuerdo de roaming nacional con Orange, crea una sinergia para la entidad: aprovechar la capacidad y densidad de MásMóvil en áreas urbanas junto con la amplia cobertura y alcance nacional de Orange.
MásOrange está centrado en desbancar a Movistar en el segmento premium, que ha liderado durante mucho tiempo gracias a su foco en la calidad superior de la red. Movistar emergió como el operador móvil más rápido del mercado español en el Informe de Conectividad Speedtest de Ookla para el primer semestre de 2024, al ofrecer la velocidad de descarga media más alta de 82,68 Mbps. Esto sitúa a Movistar muy por delante de Orange (56,42 Mbps) y Yoigo (36,73 Mbps).
La ventaja espectral de MásOrange se inclina hacia las bandas medias y altas, normalmente utilizadas para implementaciones 5G en áreas urbanas y suburbanas. De acuerdo con los datos publicados por la compañía, MásOrange cuenta con el 37% de todos los activos de banda media y alta de España (en comparación con el 28% y el 26% de su competidor más cercano, Telefónica), lo que le da una oportunidad única de mejorar el rendimiento de la velocidad 5G y adelantarse a sus competidores.
Movistar ha mantenido su liderazgo en velocidad 5G con una asignación de 100 MHz en la banda de 3,5 GHz, pero esto se ve ahora eclipsado por la asignación de MásOrange de 170 MHz. La inversión de ésta para actualizar la RAN 5G para que cuente con capacidades avanzadas de agregación de operadores y arquitectura independiente (SA), le permitirá aprovechar los beneficios de rendimiento de un ancho de banda mayor a través del amplio despliegue de su espectro de 3,5 GHz en toda su red móvil consolidada.
Sevilla lidera en velocidad de descarga 5G entre las principales ciudades de España, pero el rendimiento de los operadores varía ampliamente
Speedtest Intelligence® | Q3 2024
Sin embargo, para liderar en cobertura de red, MásOrange necesitará ir más allá de su ventaja de espectro y centrarse en incrementar el número de sites físicos en áreas rurales. En el tercer trimestre de 2024, Vodafone y Movistar registraron en el mercado español una disponibilidad 4G del 95,1% y 93,4% respectivamente, seguidas de Orange con un 92,7% y Yoigo con un 91,5%.
Paralelamente a la consolidación de la red de MásOrange, DIGI está construyendo su propia infraestructura para dejar de depender gradualmente de un acuerdo de roaming y del uso compartido de RAN con Telefónica, comenzando con zonas urbanas y suburbanas. La Comisión Europea diseñó los remedies de desinversión de espectro para que DIGI replique la presión competitiva ejercida anteriormente por MásMóvil. El objetivo es que DIGI transporte una proporción similar de su tráfico total de datos móviles en su propia red en los próximos años, al menos igualando la cuota on-net del 40-60% que MásMóvil lograba antes de la fusión.
Provincias rurales de España, a la zaga en disponibilidad de 5G, lo que destaca la importancia del apoyo gubernamental a través de UNICO.
Speedtest Intelligence® | Disponibilidad general 5G (%) en 2024
En términos generales, se espera que los compromisos de inversión a largo plazo de DIGI y MásOrange, impulsados por la consolidación, unidos al apoyo gubernamental con programas como Único, impulsen la competitividad internacional de España en rendimiento móvil en los próximos años. El país tiene mucho por hacer, ya que a finales de 2024 ocupa el puesto 57 en Índice Global de Speedtest, situándose por detrás de la mayoría de sus colegas europeos en rendimiento de red, incluidas velocidad de descarga, coherencia y cobertura.
Ookla retains ownership of this article including all of the intellectual property rights, data, content graphs and analysis. This article may not be quoted, reproduced, distributed or published for any commercial purpose without prior consent. Members of the press and others using the findings in this article for non-commercial purposes are welcome to publicly share and link to report information with attribution to Ookla.
Luke Kehoe leads Ookla’s research and thought leadership efforts in Europe.
An electronic engineering alumnus of University College Dublin, Luke has extensive experience collaborating with mobile operators, telecoms vendors, and government agencies in research and advisory roles across Europe. He has contributed to internationally recognised thought leadership publications in areas such as 5G, IoT, open RAN, and edge computing, working with prestigious organisations like the Telecom Infra Project and the World Economic Forum.
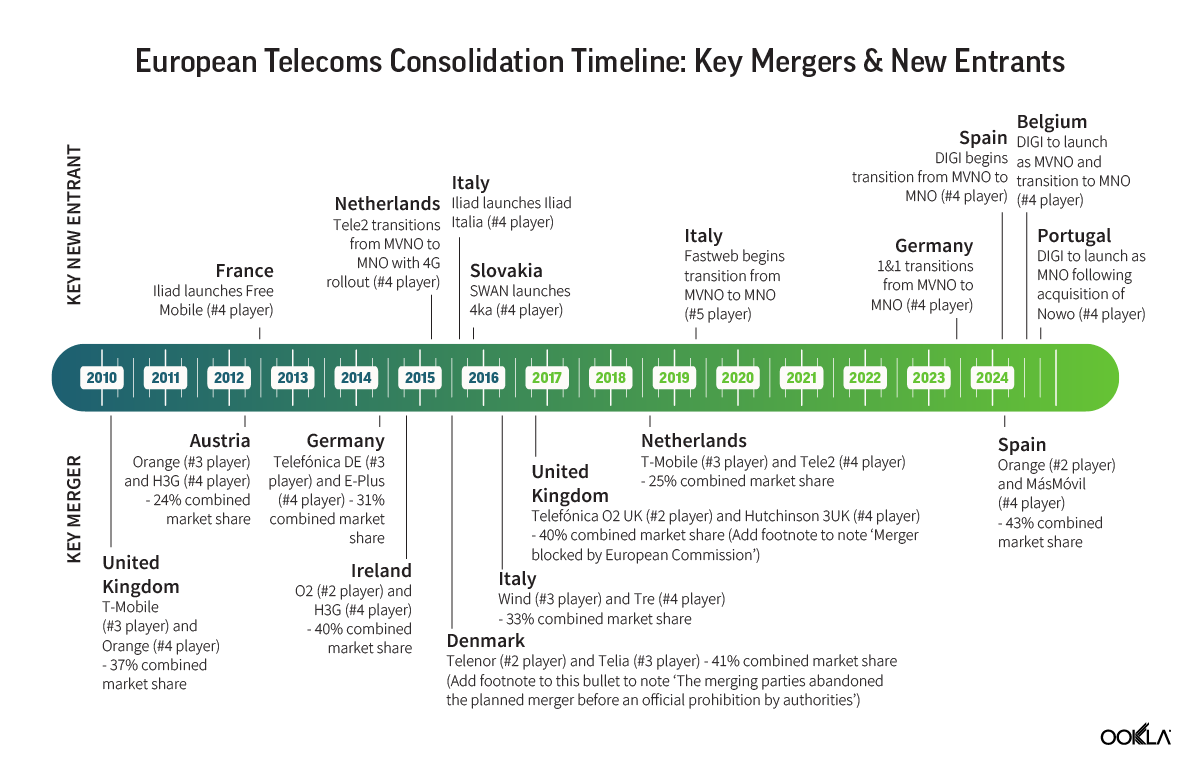
MarioDraghi has flirted with a radical restructuring of Europe’s telecoms market, seeking to cultivate pan-European scale and reinvigorate innovation and investment in telecoms. But is consolidation the answer?
Europe’s telecoms sector is at an inflection point. After a decade of stagnant revenues, lacklustre innovation and fierce competition, policymakers in Brussels are scrutinising the fundamental structure of the market. Earlier this year, a landmark report by Mario Draghi reignited discussions on consolidation, championing the creation of pan-European operators and calling for a decisive regulatory shift from proactive competition oversight (ex ante) to a reactive focus on enforcement after issues arise (ex post).
The proposed shift in policy comes as concerns over Europe’s telecoms sector’s ability to compete on a global stage reach a crescendo. A central tenet of the Draghi report is that the bloc’s fragmented telecoms market—a morass of dozens of small operators compared to just a handful in similarly sized regions elsewhere—has triggered a race to the bottom in pricing, eroding profitability and leaving Europe ill-equipped to compete with the more unified and dynamic markets of North America, the Middle East and Asia.
Mobile network quality is a key factor in the European telecoms competitiveness equation, shaping both consumer satisfaction and the bloc’s attractiveness for investment. Proponents of consolidation argue that fewer, larger operators could enhance network performance and better position the bloc to achieve the European Commission’s ambitious Digital Decade 2030 goals. The simple argument is that by cultivating market dynamics that prioritise service quality over price wars, consolidation would create stronger incentives for investment in capital-intensive mobile networks.
Critics, however, challenge this narrative that favours consolidation. Instead, they argue that network quality is not solely a function of market concentration or structure and emphasise that other factors such as pricing also play an important role in shaping Europe’s overall telecoms competitiveness. In contrast to Draghi’s position, they propose that similar outcomes could be achieved without reducing competition by deploying other policy tools, such as providing targeted funding for infrastructure rollouts or incentivising network sharing initiatives.
This white paper aims to provide independent, informed insights to support the ongoing policy discourse in Europe. It explores whether empirical evidence supports the arguments for and against consolidation in the bloc’s telecoms sector, analysing network quality, investment and pricing outcomes across the EU and a sample of other high-income countries to assess the impact of varying market structures (e.g., three or four players) and levels of market concentration.
Key takeaways
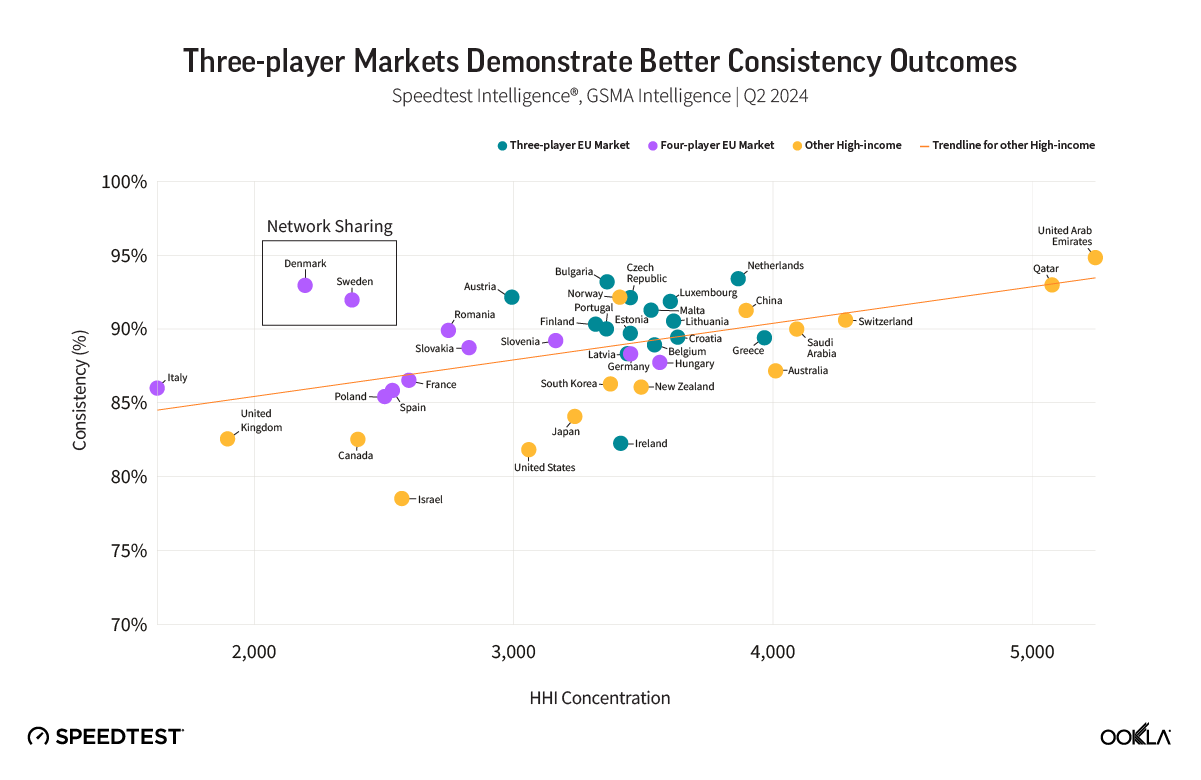
Three-player mobile markets in the EU and other high-income countries exhibit better network performance and consumer sentiment outcomes.
This trend is consistent across all technologies and at similar levels of market concentration. Among the top ten European countries ranked by median download speed in Q2-Q3 2024, seven are three-player markets. The other three — Denmark, Sweden, and France — are four-player markets where operators engage in network sharing, whether in spectrum, site infrastructure or multi-operator core networks. This suggests that the level of network sharing in these countries is more extensive than in most other four-player markets. Overall, the studied three-player markets in the EU delivered median download speeds that were 56% higher than those in four-player markets during Q2-Q3, according to Speedtest Intelligence® data.
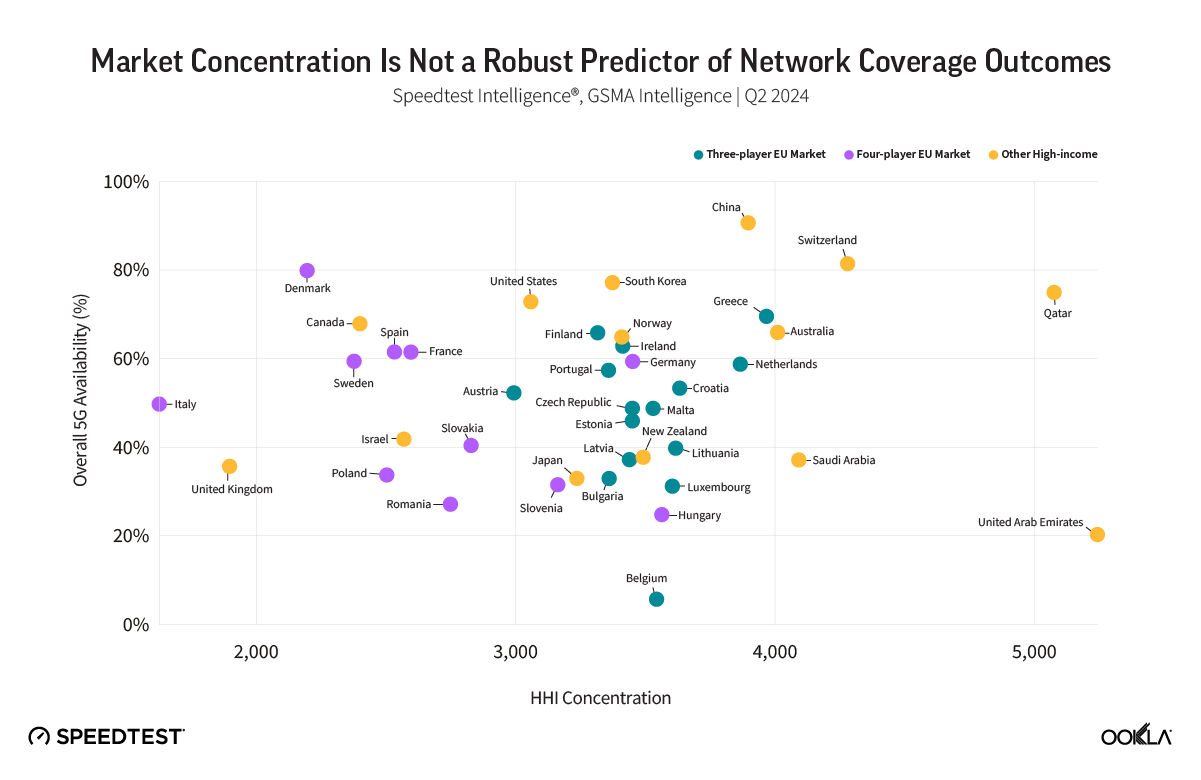
Market concentration is not a robust predictor of 5G coverage outcomes.
Socio-economic factors such as population distribution and economic development impart a greater impact on metrics relating to overall network reach, with wealthier, more urbanised countries enjoying investment conditions that are more conducive to the attainment of very high levels of service coverage and network availability. In four-player markets, however, disparities in overall 4G availability between the best- and worst-performing operators tend to be more pronounced than their three-player counterparts.
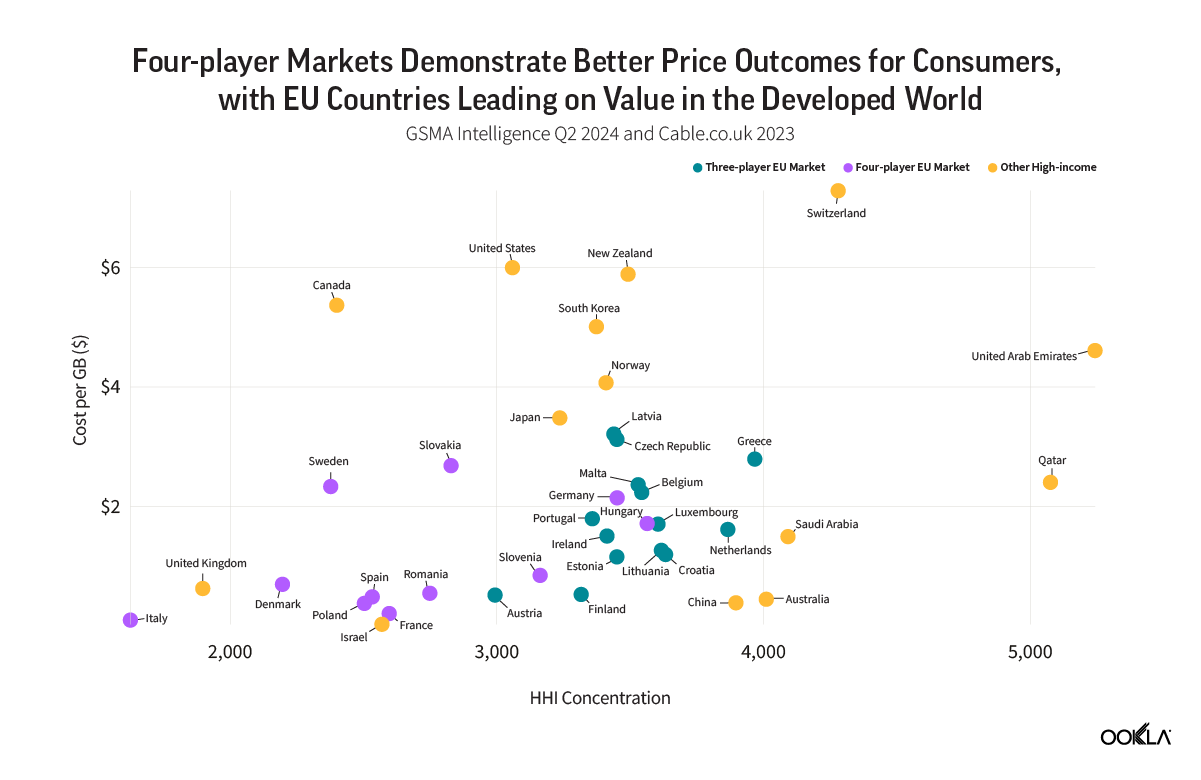
Intense price-based competition leads to markedly lower mobile data pricing outcomes in four-player markets over time.
The median consumer cost per gigabyte in highly concentrated markets — often seen in countries with the three-player structure — is nearly five times higher than in low-concentration markets. In four-player, lower-concentration markets, depressed ARPU and higher median capital intensity may result more from limited absolute revenues constraining reinvestment than from increased competition spurring greater investment. Conversely, in some highly concentrated non-EU high-income countries, greater market concentration is associated with lower capital intensity per operator, as larger players may face reduced incentives to invest.
There is no one-size-fits-all concentration profile that uniformly optimises network quality and consumer pricing outcomes in every country.
Exceptional outcomes in countries such as Denmark — a four-player market with low concentration but very high median download speed — and the Netherlands — a three-player market with high concentration and also high median download speed — suggest a targeted policy toolkit, rather than the blunt instrument of consolidation, is needed to achieve balanced outcomes across a bloc with highly diverse market contexts.
Ookla retains ownership of this article including all of the intellectual property rights, data, content graphs and analysis. This article may not be quoted, reproduced, distributed or published for any commercial purpose without prior consent. Members of the press and others using the findings in this article for non-commercial purposes are welcome to publicly share and link to report information with attribution to Ookla.
Luke Kehoe leads Ookla’s research and thought leadership efforts in Europe.
An electronic engineering alumnus of University College Dublin, Luke has extensive experience collaborating with mobile operators, telecoms vendors, and government agencies in research and advisory roles across Europe. He has contributed to internationally recognised thought leadership publications in areas such as 5G, IoT, open RAN, and edge computing, working with prestigious organisations like the Telecom Infra Project and the World Economic Forum.
Poland Races to Regain 5G Competitiveness in Europe with Mid-Band Rollout | Polska galopuje do odzyskania konkurencyjności 5G w Europie dzięki wdrożeniu średniego pasma częstotliwości
Poland’s operators are rapidly deploying mid-band 5G in an attempt to capture the growing premium market segment
Late to the game in staging a mid-band auction, Poland has lagged behind its European peers in 5G deployment in recent years. This delay has weighed on the country’s global competitiveness in mobile network performance and slowed its progress toward meeting the European Commission’s flagship 5G deployment targets, which require universal 5G coverage across every EU member state by the end of the decade. This article examines the state of Poland’s mobile market and its broader regional 5G competitiveness in the context of ongoing mid-band deployments. A follow-up report will assess the longer-term impact of the commercialization of the recently awarded low-band spectrum and ongoing network sunsets on network coverage and availability.
Key Takeaways:
Intensive capital spending on mid-band deployment drives substantial uplift in 5G performance across Polish operators from Q1 2024, pushing the country ahead of regional peers over the last year.Median 5G download speeds in Poland jumped by over 50% to 160.30 Mbps between Q1 2024 and Q1 2025, based on Speedtest Intelligence® data, propelling the country ahead of Czechia, Romania, and Slovakia for the first time in 5G performance. Despite this progress, Poland continues to trail its regional peers in 5G network Consistency, a measure of how reliably a mobile connection remains “fast enough” for normal use.
T-Mobile and Orange surpass Play and Plus in speed and select Quality of Experience (QoE) measures. Differences in how quickly and extensively Polish operators have deployed their mid-band spectrum assets have led to a diverging market profile since Q1 2024, with T-Mobile and Orange significantly extending their speed lead over their rivals. Between Q1 2024 and Q1 2025, median 5G download speeds rose by as much as 72% on Play (to 122.64 Mbps), 86% on T-Mobile (to 201.76 Mbps), and 90% on Orange (to 222.10 Mbps)—while declining by over 10% on Plus (to 116.76 Mbps).
Network investments have broadened 5G coverage in Poland, but significant regional disparities remain. Nationally, 5G availability rose from 28.5% in Q1 2024 to 43.1% in Q1 2025, driven by continued Dynamic Spectrum Sharing (DSS) rollouts and the activation of mid-band spectrum—placing the country ahead of regional peers Bulgaria, Romania, and Hungary in 5G availability. Nonetheless, by Q4 2024, a pronounced coverage gap persisted between the country’s best- and worst-served provinces, with 5G availability in the populous Masovian Voivodeship (47.2%) double that of the Lubusz Voivodeship (23.6%).
Over the last year, Polish operators have been locked in an intense four-way race to catch up with their regional peers in 5G deployment, driven by stringent coverage obligations imposed by the Polish telecoms regulator (UKE), a wave of funding support from Brussels, and a growing push to compete for a larger share of the country’s widening premium market segment, where network performance has emerged as a key competitive differentiator.
Poland’s mobile market is today awash with deployment activity, as operators ramp up capital spending to the highest levels in years to equip thousands of mobile sites with mid-band spectrum, accelerate the sunset of 3G networks, and lay the groundwork for launching 5G standalone (SA) in the coming years. This flurry of activity follows the completion of the 700/800 MHz auction at the end of March this year, where all Polish operators secured low-band 5G spectrum for the first time—paving the way for improved rural and deep in-building 5G coverage and rounding out the country’s 5G spectrum release plans.
While 5G capital spending has slowed across much of Europe, Poland sees different dynamics due to late spectrum auctions
Poland was notably late in releasing dedicated 5G spectrum in the ‘pioneer bands’ identified by the European Commission as critical to the timely commercialization and rollout of 5G across EU member states. The country’s mid-band (3.6 GHz) auction, initially planned for mid-2020, was repeatedly delayed—by more than three years—due to the pandemic and a protracted security legislation process.
These delays in spectrum availability have contributed to Poland’s divergence from much of the rest of Europe in both the economic and technical dimensions of the 5G rollout. Until recently, Polish mobile operators exhibited lower capital intensity (they invested less of their revenue) compared to peers in other European countries. Most of their spending went into upgrading 4G sites and preparing for the 3G shutdown, instead of building a new 5G mid-band capacity layer or expanding 5G coverage using low-band (700 MHz) spectrum.
Orange's Rising Mobile Capex Reflects 5G Network Expansion
Analysis of Orange Poland accounts | 2020 – 2024
Analysis of financial data published by Orange, Poland’s largest mobile operator by subscriber count, confirms that the era of lower capital intensity (relative to elsewhere in Europe) is over. The recent spectrum auctions have triggered a new cycle of investment, with Orange doubling its mobile network spending in the past three years. Play has also rapidly increased its investment, as its French parent Iliad reported injecting record amounts into Play’s mobile infrastructure last year.
Play's Contribution to Capex in the Iliad Group Surges as 5G Buildout Ramps Up
Analysis of Iliad Group accounts | 2020 – 2024
On the technical side, meanwhile, Poland’s spectrum delay meant that three of the country’s four operators were forced to rely heavily on Dynamic Spectrum Sharing (DSS)—a technology that allows 4G and 5G to operate on the same band and adjust ‘dynamically’ to demand—in an effort to deliver early 5G coverage in the 2100 MHz band while awaiting spectrum auctions. This strategy resulted in Poland’s initial 5G performance more closely resembling those typical of 4G networks, as DSS deployments are typically based on a 10 MHz carrier where part of the capacity is still reserved for 4G signals, making 5G speeds with DSS around 15–25 % lower than if the band were dedicated solely to 5G.
The limitations of using DSS to deliver a “5G experience” were exemplified by the speed advantage maintained by Plus earlier in the 5G rollout. Importantly, Plus was the only Polish operator that did not rely on DSS and instead dedicated a full 40 MHz carrier in the 2600 MHz (TDD) band to 5G before mid-band spectrum became available at the start of last year. Prior to the 3.5 GHz band coming online, when the other operators were still wholly dependent on DSS for 5G coverage, Plus’s median 5G download speed of 133.34 Mbps was as much as 77 % higher than T-Mobile’s, 81 % higher than Orange’s, and 92 % higher than Play’s.
Polish operators move from mid-band spectrum acquisition to mass commercial deployment in record time
The pent-up demand for mid-band spectrum in Poland was evident when mobile operators like Orange, T-Mobile, and Play launched commercial services just three months after acquiring mid-band spectrum, moving quickly from the auction in October 2023 to commercial launches by January 2024. T-Mobile reported that its mid-band 5G network already covered more than 25% of the Polish population by April 2024, with more than 2,100 sites active, while Orange announced it had reached 40% coverage by mid-June.
This rollout pace is exceptional by European standards and indicative of the increased pace of deployment possible later in the 5G technology cycle. It took Spain’s Telefónica (Movistar) about six months to reach its first 1,000 mid-band sites by comparison, and Germany’s operators needed around nine months to achieve the same milestone.
Plus's Spectrum Holdings in the 2600 MHz TDD Band Lend it a Decisive Capacity Lead
Each operator secured a contiguous 100 MHz block of spectrum in the 3.5 GHz band, which is widely regarded as optimal due to the large channel bandwidth this configuration affords. However, Plus has been notably slower to commercialise this allocation at scale. Plus’s earlier strategy of deploying 5G in the dedicated 2600 MHz band (rather than relying on DSS), alongside later using the 2100 MHz band as well, gave it more flexibility to delay a broad mid-band rollout as it previously enjoyed a significant 5G speed advantage over competitors while they were still heavily dependent on DSS deployments.
Mid-band deployment shifts 5G performance rankings among Polish operators
Mass deployment of a new capacity layer by the other three operators has since decisively altered performance dynamics in the Polish market and eroded Plus’s lead. In the space of one year between Q1 2024 and Q1 2025, Plus has moved from market leader in median 5G download speed to laggard, becoming the only Polish operator to see a year-on-year decline in 5G speed, down 10%, indicating the increasing limitations of its 2600 MHz strategy.
Orange and T-Mobile Pull Ahead in 5G Performance with Mid-Band Deployment
Speedtest Intelligence® | Q1 2023 – Q1 2025
By contrast, mid-band deployment has boosted performance across the rest of the market, with median 5G speeds rising by as much as 72% on Play, 86% on T-Mobile, and 90% on Orange between Q1 2024 and Q1 2025. While Orange led the Polish market in Q1 with a median 5G download speed of 222.11 Mbps, the operator’s lead has narrowed significantly as T-Mobile’s mid-band buildout has progressed, with T-Mobile now recording median 5G download speeds of 201.76 Mbps, well ahead of third- and fourth-placed Play (122.64 Mbps) and Plus (116.76 Mbps), respectively.
Plus's Lead in 5G Consistency Narrows as 2600 MHz Advantage Recedes with Mid-Band Deployment
Speedtest Intelligence® | Q1 2023 – Q1 2025
Despite losing its lead in median 5G download speed, Plus continues to lead at the 10th percentile (29.44 Mbps in Q1 2025), meaning subscribers in its lowest-performing areas still enjoy comparatively better speeds than those on rival networks. This advantage is likely linked to Plus’s lower dependence on DSS. However, T-Mobile (24.48 Mbps) and Orange (21.88 Mbps) are quickly closing the gap, with their 10th percentile 5G speeds now converging toward Plus. Plus’s 5G network consistency, measured as the proportion of Speedtest samples meeting a minimum download and upload threshold of 25/3 Mbps, has also declined over the past year, although it remains the market leader.
On upload performance, meanwhile, Play’s 5G network led the market in Q1 2025, recording median speeds of 19.33 Mbps, followed by Orange (18.99 Mbps), T-Mobile (17.32 Mbps), and Plus (14.96 Mbps). Unlike the substantial gains seen in download speeds, there is limited evidence so far that the mid-band rollout has materially improved upload performance, with median upload speeds about 6% lower in Q1 2025 compared to the same quarter last year. This discrepancy arises primarily because all four operators continue to deploy 5G in non-standalone (NSA) mode, requiring devices to transmit uplink traffic via existing 4G anchor bands. Consequently, the newly available 3.5 GHz spectrum enhances downlink capacity but leaves the congested 4G uplink path unchanged.
Play Develops Lead in 5G Upload Performance
Speedtest Intelligence® | Q1 2023 – Q1 2025
The operators’ investments in deploying a new 5G capacity layer have coincided with a broader RAN refresh effort, translating into improved quality of experience for users in key use cases such as video streaming and web browsing. Median web page load times on T-Mobile’s network, for instance, improved by around 4% between Q3 2024 and Q1 2025. Orange led in video metrics such as start time, resolution, and uninterrupted playback in the last quarter.
5G Drives QoE Improvements in Use Cases like Web Browsing
Speedtest Intelligence® | Q1 2025
Capital investment expands 5G coverage, but Poland’s rural-urban digital divide persists
While investments in DSS and the mid-band rollout have enabled Polish operators to make significant strides in 5G availability, which increased nationally from 28.5% in Q1 2024 to 43.1% in Q1 2025, regional coverage disparities continue to be a feature of the mobile network experience in Poland. Operators have prioritized 5G deployments in the richest and densest parts of Poland where fiber is heavily deployed, including the Masovian (Warsaw) and Pomeranian (Tri-City) provinces. In these provinces, 5G availability reached more than 40% by the end of last year and contributed to driving materially higher median download speeds than the national average.
5G Availability Remains Highly Varied Across Poland Outside of Urbanized Areas
Speedtest Intelligence® | 5G Availability (%) in Q4 2024
By contrast, border provinces along the south and west of the country continue to experience much lower levels of 5G availability. Lubusz had the lowest availability (23.6% at the end of last year), where there is lower population density and lower subscriber spending, which reduces operators’ commercial incentives for widespread 5G investment. This trend has driven the development of a notable speed gap between provinces, with mobile subscribers in Lubusz also experiencing the lowest median download speeds (59.97 Mbps) in Poland, almost 33% below the leading Masovian province.
Mobile Download Speeds Are Lower in Less Urbanized Areas of Poland
Speedtest Intelligence® | Median Download Speed (Mbps) in Q4 2024
Mid-band deployment improves Poland’s mobile competitiveness, but 5G consistency continues to trail regional peers
From a regional competitiveness lens, intensive mid-band deployments have been successful in breaking Poland’s cycle of mobile network underperformance, with median 5G download speeds rising by over 50% on average to 160.30 Mbps between Q1 2024 and Q1 2025. This has propelled the country ahead of Czechia, Romania, and Slovakia for the first time in terms of 5G download speed performance.
Despite Poland’s progress on its mid-band 5G rollout, the lingering effects of reliance on DSS and limited 5G spectrum diversity—up until the recent 700/800 MHz auction—mean that Poland continues to trail its regional peers in terms of 5G network consistency. In Q1 2025, 82% of Speedtest samples in Poland met the minimum 5G performance threshold for a consistent mobile experience, compared to 86% in Hungary, 89% in Romania, and 93% in Bulgaria.
Poland’s previous reliance on DSS, driven by limited 5G spectrum diversity, likely contributed to its slower average revenue per user (ARPU) growth compared to neighboring countries in recent years. Polish operators initially introduced tariffs with “5G at no extra cost” bolted onto existing 4G bundles, keeping prices flat to defend market share (and thereby maintaining depressed ARPU levels relative to regional peers). Combined with the external shock induced by markedly higher energy prices, stagnant ARPU levels created challenging operating conditions in the Polish market and weighed on operator profitability.
Intense Priced-Based Competition Precipitated Revenue Erosion in Poland During the First Half of the 5G Cycle
Analysis of GSMA Intelligence Data | % Change in Mobile ARPU (Q1 2020 vs Q1 2023)
In neighboring markets, by contrast, operators were able to leverage mid-band spectrum deployments as both technical and marketing levers, shifting their strategies from price competition toward service-based differentiation. This enabled them to more effectively upsell premium speed tiers or monetize specific use cases, such as fixed wireless access (FWA), which dedicated mid-band 5G deployments uniquely support.
T-Mobile and Play Outpaced Rivals in Subscription Share Growth in Recent Years
Analysis of UKE Market Data | 2019 – 2023
Similarly, the delayed timing of Poland’s mid-band 5G auction likely dampened supply-side factors key for driving growth in mobile data traffic. Between Q1 2020 and Q4 2024, traffic volumes in neighboring Bulgaria converged with that in Poland for the first time, increasing by 4.8x vs. Poland’s 2.6x. Meanwhile, Bulgarian operators capitalized early on mid-band spectrum availability to aggressively promote competitive FWA solutions (a major driver of mobile traffic in developed markets) and to introduce cheap unlimited data tariffs with fewer usage restrictions.
Poland Maintains Regional Lead in Mobile Data Volumes, but Bulgaria is Catching Up
Analysis of GSMA Intelligence data | 2020 – 2024
Polish operators have since sought to replicate Bulgaria’s success by debuting distinct marketing for their mid-band 5G deployments to differentiate the newer mid-band 5G rollouts from earlier DSS-based 5G networks in terms of performance and user experience. T-Mobile has leaned on ‘5G More’ branding, while Plus has used ‘5G Ultra’ to indicate the additional performance gains unlocked by their new 5G networks in locations where dedicated mid-band spectrum is deployed. This strategy has formed part of a broader shift in the market, with all operators moving away from a hyper-focus on price competition and toward ‘more for more’ pricing strategies, supporting improved profitability and renewed ARPU growth in the market with inflation-linked tariffs.
Poland Has Led Regional ARPU Growth Since Mid-Band 5G Deployments Started
Analysis of GSMA Intelligence Data | % Change in Mobile ARPU (Q1 2023 vs Q1 2025)
Low-band activation and network sunset progress set to reinforce mid-band 5G gains
With Poland’s telecom regulator, UKE, having set among Europe’s most ambitious coverage obligations for recent mid- and low-band spectrum auctions, operators are unlikely to delay commercial deployments in the newly acquired 700 and 800 MHz bands. These deployments are expected to start next month and will be crucial for establishing a national 5G coverage layer that, for the first time, extends deep indoors and into rural areas. This expanded coverage will also support wider rollout of voice over LTE (VoLTE) services, accelerating the 3G sunset and freeing up additional spectrum in the 900 MHz band.
We will revisit shortly to assess how Polish operators are progressing with deploying their new low-band spectrum and how effectively it is complementing the ongoing 3G sunset.
Polska galopuje do odzyskania konkurencyjności 5G w Europie dzięki wdrożeniu średniego pasma częstotliwości
Polscy operatorzy przyśpieszyli z wdrażaniem 5G w średnim paśmie, próbując przejąć rosnący segment rynku premium.
Polska, która spóźniła się z przeprowadzeniem aukcji na średnie pasmo, w ostatnich latach pozostawała w tyle za swoimi europejskimi rówieśnikami w zakresie wdrażania 5G. Opóźnienie to odbiło się na globalnej konkurencyjności kraju pod względem wydajności sieci mobilnych i spowolniło postępy w realizacji sztandarowych celów Komisji Europejskiej w zakresie wdrażania 5G, które wymagają powszechnego zasięgu 5G w każdym państwie członkowskim UE do końca dekady.
Niniejszy artykuł analizuje stan polskiego rynku telefonii komórkowej i jego szerszą regionalną konkurencyjność 5G w kontekście trwających wdrożeń średniego pasma. Kolejny raport oceni długoterminowy wpływ komercjalizacji niedawno przyznanego niskiego pasmana potrzeby pokryciowe 5G.
Kluczowe wnioski:
Intensywne wydatki kapitałowe na wdrożenie średniego pasma napędzają znaczny wzrost wydajności 5G u polskich operatorów od pierwszego kwartału 2024 r., pozycjonując kraj przed regionalnych konkurentów w ciągu ostatniego roku. Mediana prędkości pobierania 5G w Polsce wzrosła o ponad 50% do 160,30 Mb/s w okresie od I kwartału 2024 r. do I kwartału 2025 r., w oparciu o dane Speedtest Intelligence®, dzięki czemu Polska po raz pierwszy wyprzedziła Czechy, Rumunię i Słowację pod względem wydajności 5G. Pomimo tego postępu, Polska nadal pozostaje w tyle za swoimi regionalnymi rówieśnikami pod względem spójności sieci 5G, która jest miarą tego, jak niezawodnie zestawione połączenie mobilne pozostaje “wystarczająco szybkie” do normalnego użytkowania.
T-Mobile i Orange przewyższają Play i Plus pod względem prędkości i wybranych wskaźników jakości doświadczenia usług (QoE). Różnice w strategiach, jak szybko i szeroko polscy operatorzy wdrożyli swoje aktywa widma w średnim paśmie, doprowadziły do rozbieżnego profilu rynku od pierwszego kwartału 2024 r., przy czym T-Mobile i Orange znacznie zwiększyły swoją przewagę w zakresie prędkości nad rywalami. Pomiędzy I kwartałem 2024 r. a I kwartałem 2025 r. mediana prędkości pobierania 5G wzrosła aż o 72% w Play (do 122,64 Mb/s), 86% w T-Mobile (do 201,76 Mb/s) i 90% w Orange (do 222,10 Mb/s) – przy jednoczesnym spadku o ponad 10% w Plusie (do 116,76 Mb/s).
Inwestycje sieciowe zwiększyły zasięg 5G w Polsce, ale nadal utrzymują się znaczne różnice regionalne. W ujęciu krajowym dostępność sieci 5G wzrosła z 28,5% w I kwartale 2024 r. do 43,1% w I kwartale 2025 r., co wynikało z dalszego wdrażania dynamicznego współdzielenia widma (DSS) i aktywacji widma w średnim paśmie, dzięki czemu Polska wyprzedziła pod względem dostępności sieci 5G regionalne kraje takie jak Bułgaria, Rumunia i Węgry. Niemniej jednak do IV kwartału 2024 r. utrzymywała się wyraźna luka w zasięgu między najlepiej i najgorzej obsługiwanymi województwami w kraju, przy czym dostępność 5G w zaludnionym województwie mazowieckim (47,2%) była dwukrotnie wyższa niż w województwie lubuskim (23,6%).
Wyłączenia sieci 3G (ang. “3G sunset”) powodują gwałtowny spadek czasu spędzonego na 3G w 2024 r., ponieważ polscy operatorzy reorganizują widmo dla 4G (ang. “refarming”), ale ma to ogromny wpływ na dostępność usług w miejscach mniej zurbanizowanych.Podczas gdy T-Mobile pozostał jedynym polskim operatorem, który w pełni zakończył proces wygaszania sieci 3G do pierwszego kwartału 2025 r., zarówno Orange, jak i Play czynią obecnie znaczne postępy w zakresie refarmingu widma 3G 900 MHz i 2100 MHz na potrzeby 4G. Czas spędzony na 3G spadł poniżej 3% dla obu operatorów do końca 2024 roku. Natomiast abonenci Plusa nadal spędzali znacznie więcej czasu w sieci 3G – 13,41% na koniec 2024 roku.
W ciągu ostatniego roku polscy operatorzy byli jednak zamknięci w intensywnymwyścigu, aby dogonić swoich regionalnych kolegów we wdrażaniu 5G, napędzanym przez rygorystyczne obowiązki w zakresie zasięgu nałożone przez polskiego regulatora telekomunikacyjnego (UKE), falę wsparcia finansowego z Brukseli i rosnące dążenie do konkurowania o większy udział w poszerzającym się segmencie rynku premium w kraju, w którym wydajność sieci stała się kluczowym wyróżnikiem konkurencyjnym.
Polski rynek telefonii komórkowej jest dziś zdominowany aktywnością wdrożeniową, stąd operatorzy zwiększają wydatki kapitałowe do najwyższych poziomów od lat, aby wyposażyć tysiące stacji bazowych w widmo średniego pasma, przyspieszyć wyłączanie sieci 3G i położyć podwaliny pod uruchomienie samodzielnej sieci 5G (SA) w nadchodzących latach. Taką falę aktywności można zwłaszcza zauważyć po zakończeniu aukcji 700/800 MHz pod koniec marca tego roku, w której wszyscy polscy operatorzy po raz pierwszy zabezpieczyli widmo 5G w niskim paśmie – torując sobie drogę do poprawy zasięgu 5G na obszarach wiejskich i głęboko wewnątrz budynków (ang. “deep in-building”) w miastach oraz uzupełniając krajowe plany udostępniania widma 5G.
Podczas gdy wydatki kapitałowe na 5G spowolniły w dużej części Europy, Polska doświadcza inną dynamikę ze względu na późne aukcje na częstotliwości
Polska znacznie spóźniła się z udostępnieniem dedykowanych częstotliwości 5G w “pionierskich” pasmach zidentyfikowanych przez Komisję Europejską jako krytyczne dla terminowej komercjalizacji i wdrożenia 5G w państwach członkowskich UE. Krajowa aukcja częstotliwości pasma środkowego (3,6 GHz), początkowo planowana na połowę 2020 r., była wielokrotnie opóźniona – o ponad trzy lata – z powodu pandemii i przedłużającego się procesu legislacyjnego w zakresie bezpieczeństwa.
Te opóźnienia w dostępności częstotliwości przyczyniły się do tego, że Polska odbiega od reszty Europy zarówno w wymiarze ekonomicznym, jak i technicznym wdrażania 5G. Do niedawna polscy operatorzy komórkowi wykazywali niższą kapitałochłonność (inwestowali mniejszą część swoich przychodów) w porównaniu do innych europejskich operatorów. Większość ich wydatków przeznaczono na modernizację 4G i przygotowanie do wyłączenia 3G, zamiast budować nową warstwę pojemności 5G w średnim paśmie lub rozszerzać zasięg 5G przy użyciu niskich częstotliwości (700 MHz).
Rosnące nakłady Orange na sieć mobilną odzwierciedlają rozwój sieci 5G
Analiza rachunków Orange Polska | 2020–2024
Analiza danych finansowych opublikowanych przez Orange, największego operatora komórkowego w Polsce pod względem liczby abonentów, potwierdza, że era niższej kapitałochłonności (w porównaniu z innymi krajami w Europie) dobiegła końca. Niedawne aukcje częstotliwości wywołały nowy cykl inwestycyjny, a Orange podwoił wydatki na sieć mobilną w ciągu ostatnich trzech lat. Play również gwałtownie zwiększył swoje inwestycje, jego francuska spółka dominująca Iliad poinformowała w zeszłym roku o zainwestowaniu rekordowych kwot w infrastrukturę mobilną Play.
Udział Play w nakładach inwestycyjnych Grupy Iliad gwałtownie rośnie wraz z przyspieszeniem rozbudowy sieci 5G
Analiza rachunków Grupy Iliad | 2020–2024
Tymczasem od strony technicznej opóźnienie aukcji częstotliwości 5G w Polsce oznaczało, że trzech z czterech operatorów w kraju było zmuszonych w dużym stopniu polegać na dynamicznym współdzieleniu widma (ang. “Dynamic Spectrum Sharing” – DSS) – technologii, która pozwala 4G i 5G działać w tym samym paśmie i “dynamicznie” dostosowywać się do zapotrzebowania na pojemność danej technologii – w celu zapewnienia wczesnego zasięgu 5G w paśmie 2100 MHz w oczekiwaniu na aukcje częstotliwości. Strategia ta spowodowała, że początkowa wydajność 5G w Polsce bardziej przypominała typową dla sieci 4G, ponieważ wdrożenia DSS są zwykle oparte na nośnej 10 MHz, w której część pojemności jest nadal zarezerwowana dla sygnałów 4G, co powoduje, że prędkości 5G z DSS są o około 15-25% niższe niż gdyby pasmo było przeznaczone wyłącznie dla 5G.
Ograniczenia wykorzystania DSS do zapewnienia “doświadczenia 5G” zostały zilustrowane przewagą prędkości utrzymywaną przez Plusa na wcześniejszym etapie wdrażania 5G. Co ważne, Plus był jedynym polskim operatorem, który nie polegał na DSS i zamiast tego przeznaczył pełną nośną 40 MHz w paśmie 2600 MHz (TDD) na 5G, zanim na początku ubiegłego roku częstotliwości średniego pasma stały się dostępne. Przed uruchomieniem pasma 3,5 GHz, gdy pozostali operatorzy byli nadal w pełni zależni od DSS w zakresie zasięgu 5G, średnia prędkość pobierania 5G Plusa wynosząca 133,34 Mb/s była aż o 77% wyższa niż w T-Mobile, 81% wyższa niż w Orange i 92% wyższa niż w Play.
Intensywne wdrażanie średniego pasma podnosi regionalną konkurencyjność Polski w zakresie 5G i zmienia dynamikę operatorów
Polscy operatorzy w rekordowym czasie przechodzą od zakupu częstotliwości w średnim paśmie do masowego wdrożenia komercyjnego
Stłumiony popyt na częstotliwości średniego pasma w Polsce był widoczny, gdy operatorzy komórkowi, tacy jak Orange, T-Mobile i Play, uruchomili usługi komercyjne zaledwie trzy miesiące po nabyciu częstotliwości średniego pasma, szybko przechodząc od aukcji w październiku 2023 r. do komercyjnego uruchomienia do stycznia 2024 roku. T-Mobile poinformował, że jego średniopasmowa sieć 5G obejmowała już ponad 25% populacji Polski do kwietnia 2024 r., z ponad 2100 aktywnymi stacjami bazowymi, podczas gdy Orange ogłosił, że osiągnął 40% zasięgu do połowy czerwca.
To tempo wdrażania jest wyjątkowe jak na standardy europejskie i wskazuje na zwiększone tempo wdrażania możliwe w późniejszym okresie cyklu technologicznego 5G. Dla porównania, hiszpańska Telefónica (Movistar) potrzebowała około sześciu miesięcy, aby osiągnąć pierwsze 1000 stacji bazowych w średnim paśmie, a niemieccy operatorzy potrzebowali około dziewięciu miesięcy, aby osiągnąć ten sam kamień milowy.
Zasoby częstotliwości Plus w paśmie 2600 MHz TDD zapewniają mu zdecydowaną przewagę przepustowości
Każdy z operatorów zabezpieczył ciągły blok częstotliwości o szerokości 100 MHz w paśmie 3,5 GHz, który jest powszechnie wykorzystywany. Jednak Plus był znacznie wolniejszy w komercjalizacji tej alokacji na dużą skalę. Wcześniejsza strategia Plusa polegająca na wdrażaniu 5G w dedykowanym paśmie 2600 MHz (zamiast polegać na DSS), a później także na wykorzystaniu pasma 2100 MHz, dała mu większą elastyczność w opóźnianiu szerokiego wdrożenia średniego pasma, ponieważ wcześniej cieszył się znaczną przewagą prędkości 5G nad konkurentami, podczas gdy byli oni nadal silnie uzależnieni od wdrożeń DSS.
Wdrożenie średniego pasma zmienia rankingi wydajności 5G wśród polskich operatorów
Masowe wdrożenie nowej warstwy pojemności przez pozostałych trzech operatorów zdecydowanie zmieniło dynamikę wydajności 5G na polskim rynku i zmniejszyło przewagę Plusa. W ciągu jednego roku, między pierwszym kwartałem 2024 r. a pierwszym kwartałem 2025 r., Plus przesunął się z lidera rynku pod względem mediany prędkości pobierania 5G do jednego z wolniejszych, stając się jedynym polskim operatorem, który odnotował spadek prędkości 5G rok do roku, o 10%, co wskazuje na rosnące ograniczenia jego strategii 2600 MHz.
Orange i T-Mobile zyskują przewagę w wydajności 5G dzięki wdrożeniu pasma średniego
Speedtest Intelligence® | I kwartał 2023 – I kwartał 2025
Z kolei wdrożenie średniego pasma zwiększyło wydajność na pozostałej części rynku, a mediana prędkości 5G wzrosła aż o 72% w Play, 86% w T-Mobile i 90% w Orange między 1. kwartałem 2024 r. a 1. kwartałem 2025 r. Podczas gdy Orange był liderem polskiego rynku w pierwszym kwartale ze średnią prędkością pobierania 5G wynoszącą 222,11 Mb/s, przewaga operatora znacznie się zmniejszyła wraz z postępem budowy średniego pasma T-Mobile, przy czym T-Mobile odnotowuje obecnie medianę prędkości pobierania 5G na poziomie 201,76 Mb/s, znacznie wyprzedzając odpowiednio trzeciego i czwartego Play (122,64 Mb/s) i Plusa (116,76 Mb/s).
Przewaga Plusa w spójności 5G maleje, gdy przewaga pasma 2600 MHz ustępuje wraz z wdrożeniem pasma średniego
Speedtest Intelligence® | I kwartał 2023 – I kwartał 2025
Pomimo utraty pozycji lidera pod względem mediany prędkości pobierania 5G, Plus nadal prowadzi w 10. percentylu (29,44 Mb/s w 1. kwartale 2025 r.), co oznacza, że abonenci w obszarach o najniższych wynikach nadal cieszą się stosunkowo lepszymi prędkościami niż abonenci konkurencyjnych sieci. Przewaga ta jest prawdopodobnie związana z mniejszą zależnością Plusa od DSS. Jednak T-Mobile (24,48 Mb/s) i Orange (21,88 Mb/s) szybko zmniejszają lukę, a ich 10-procentowe prędkości 5G zbliżają się teraz do Plusa. Spójność sieci 5G Plusa, mierzona jako odsetek próbek Speedtest spełniających minimalny próg pobierania i wysyłania 25/3 Mbps, również spadła w ciągu ostatniego roku, chociaż pozostaje liderem rynku.
Tymczasem pod względem wydajności wysyłania, sieć 5G Play była liderem na rynku w pierwszym kwartale 2025 r., odnotowując medianę prędkości 19,33 Mb/s, a następnie Orange (18,99 Mb/s), T-Mobile (17,32 Mb/s) i Plus (14,96 Mb/s).
W przeciwieństwie do znacznych wzrostów prędkości pobierania, jak dotąd istnieją ograniczone dowody na to, że wdrożenie średniego pasma znacznie poprawiło wydajność wysyłania, przy czym mediana prędkości wysyłania była o około 6% niższa w pierwszym kwartale 2025 r. w porównaniu z tym samym kwartałem ubiegłego roku. Rozbieżność ta wynika przede wszystkim z faktu, że wszyscy czterej operatorzy nadal wdrażają 5G w trybie non-standalone (NSA), nadal wymagają od urządzeń technologii 4G do obsługi ruchu wysyłania i warstwy sygnałowej. W związku z tym nowo dostępne widmo 3,5 GHz zwiększa przepustowość łącza w dół, ale pozostawia zatłoczoną ścieżkę łącza 4G w górę bez zmian.
Play zyskuje przewagę w wydajności wysyłania danych w sieci 5G
Speedtest Intelligence® | I kwartał 2023 – I kwartał 2025
Inwestycje operatorów we wdrażanie nowej warstwy przepustowości 5G zbiegły się w czasie z szerszymi działaniami w zakresie modernizacji sieci RAN, przekładając się na lepszą jakość usług doświadczanych przez użytkowników w kluczowych zastosowaniach, takich jak wideo streaming i przeglądanie stron internetowych. Na przykład mediana czasu ładowania strony internetowej w sieci T-Mobile poprawiła się o około 4% między 3. kwartałem 2024 r. a 1. kwartałem 2025 r., co stawia ją w czołówce pod tym względem. Tymczasem Orange był liderem pod względem wskaźników wideo, takich jak czas rozpoczęcia, rozdzielczość i nieprzerwane odtwarzanie w ostatnim kwartale.
5G napędza poprawę jakości doświadczeń (QoE) w zastosowaniach takich jak przeglądanie stron internetowych
Speedtest Intelligence® | I kwartał 2025
Inwestycje kapitałowe zwiększają zasięg 5G, ale przepaść cyfrowa między wsią a miastem w Polsce utrzymuje się
Podczas gdy inwestycje w DSS i wdrożenie średniego pasma umożliwiły polskim operatorom poczynienie znaczących postępów w zakresie dostępności 5G, która wzrosła w skali kraju z 28,5% w I kwartale 2024 r. do 43,1% w I kwartale 2025 r., regionalne różnice w zasięgu nadal są cechą charakterystyczną sieci mobilnej w Polsce.
Operatorzy nadali priorytet wdrożeniom 5G w najbogatszych i najbardziej zaludnionych częściach Polski, gdzie światłowody są mocno rozwinięte, w tym w województwach mazowieckim (Warszawa) i pomorskim (Trójmiasto). W tych województwach dostępność 5G osiągnęła ponad 40% pod koniec ubiegłego roku i przyczyniła się do osiągnięcia znacznie wyższych średnich prędkości pobierania niż średnia krajowa.
Dostępność 5G pozostaje wysoce zróżnicowana w Polsce poza obszarami zurbanizowanymi
Speedtest Intelligence® | Dostępność 5G (%) w IV kw. 2024
Natomiast województwa przygraniczne na południu i zachodzie kraju nadal doświadczają znacznie niższych poziomów dostępności 5G. Województwo lubuskie miało najniższą dostępność (23,6% na koniec ubiegłego roku), gdzie występuje mniejsza gęstość zaludnienia i niższe wydatki abonentów, co zmniejsza zachęty komercyjne operatorów do powszechnych inwestycji w 5G. Tendencja ta doprowadziła do powstania znacznej luki prędkości między województwami, a abonenci mobilni w Lubuskiem również doświadczają najniższej mediany prędkości pobierania (59,97 Mb/s) w Polsce, prawie 33% poniżej wiodącego województwa mazowieckiego.
Prędkości pobierania w sieciach mobilnych są niższe na mniej zurbanizowanych obszarach Polski
Speedtest Intelligence® | Mediana prędkości pobierania (Mbps) w IV kw. 2024
Wdrożenie średniego pasma poprawia konkurencyjność mobilną Polski, ale spójność 5G nadal ustępuje regionalnym konkurentom
Z punktu widzenia konkurencyjności regionalnej, intensywne wdrożenia średniego pasma skutecznie przełamały cykl słabej wydajności sieci mobilnej w Polsce, a mediana prędkości pobierania 5G wzrosła średnio o ponad 50% do 160,30 Mb/s między 1. kwartałem 2024 r. a 1. kwartałem 2025 r. Dzięki temu Polska po raz pierwszy wyprzedziła Czechy, Rumunię i Słowację pod względem prędkości pobierania 5G.
Pomimo postępów Polski we wdrażaniu 5G w średnim paśmie, utrzymujące się skutki polegania na DSS i ograniczonej różnorodności widma 5G aż do niedawnej aukcji 700/800 MHz oznaczają, że Polska nadal pozostaje w tyle za swoimi regionalnymi rówieśnikami pod względem spójności sieci 5G. W pierwszym kwartale 2025 r. 82% próbek Speedtest w Polsce spełniło minimalny próg wydajności 5G dla spójnego doświadczenia mobilnego, w porównaniu do 86% na Węgrzech, 89% w Rumunii i 93% w Bułgarii.
Nowo pozyskana różnorodność częstotliwości 5G daje polskim operatorom potężne narzędzie do stymulowania wzrostu ARPU
Wcześniejsza zależność Polski od DSS, wynikająca z ograniczonej różnorodności widma 5G, prawdopodobnie przyczyniła się do wolniejszego wzrostu średniego przychodu na użytkownika (ARPU) w porównaniu z sąsiednimi krajami na przestrzeni ostatnich lat. Polscy operatorzy początkowo wprowadzili taryfy z “5G bez dodatkowych kosztów” dodane do istniejących pakietów 4G, utrzymując ceny na stałym poziomie w celu obrony udziału w rynku (a tym samym utrzymując obniżone poziomy ARPU w porównaniu do regionalnych konkurentów). W połączeniu z zewnętrznym szokiem makroekonomicznym wywołanym znacznie wyższymi cenami energii, stagnacja poziomów ARPU stworzyła trudne warunki operacyjne na polskim rynku i wpłynęła na rentowność operatorów.
Intensywna konkurencja cenowa spowodowała erozję przychodów w Polsce w pierwszej połowie cyklu 5G
Analiza danych GSMA Intelligence | Zmiana procentowa ARPU w usługach mobilnych (I kw. 2020 vs I kw. 2023)
Z kolei na sąsiednich rynkach operatorzy byli w stanie wykorzystać wdrożenie częstotliwości w średnim paśmie zarówno jako korzyści techniczne, jak i marketingowe, przenosząc swoje strategie z konkurencji cenowej na zróżnicowanie oparte na usługach. Pozwoliło im to skuteczniej sprzedawać wyższe poziomy prędkości lub zarabiać na konkretnych rozwiązaniach, takich jak stały dostęp bezprzewodowy (FWA), dla którego działania wdrożone 5G w średnim paśmie nadaje się idealnie.
T-Mobile i Play wyprzedziły konkurentów w tempie wzrostu udziału subskrypcji w ostatnich latach
Analiza danych rynkowych UKE | 2019–2023
Podobnie, opóźniony termin polskiej aukcji 5G dla średniego pasma prawdopodobnie osłabił czynniki po stronie podaży, będące kluczowymi dla napędzania wzrostu konsumpcji danych z sieci mobilnych. W okresie od I kwartału 2020 r. do IV kwartału 2024 r. wolumen ruchu w sąsiedniej Bułgarii po raz pierwszy zrównał się z wolumenem w Polsce, wzrastając 4,8-krotnie w porównaniu do 2,6-krotnego wzrostu w Polsce.
W międzyczasie bułgarscy operatorzy wcześnie wykorzystali dostępność widma w średnim paśmie, aby agresywnie promować konkurencyjne rozwiązania FWA (główny czynnik napędzający ruch mobilny na rynkach rozwiniętych) i wprowadzić tanie taryfy nieograniczonej transmisji danych z mniejszymi ograniczeniami użytkowania.
Polska utrzymuje regionalne prowadzenie w wolumenach danych mobilnych, ale Bułgaria szybko nadrabia
Analiza danych GSMA Intelligence | 2020–2024
Od tego czasu polscy operatorzy starali się powtórzyć sukces Bułgarii, wprowadzając odrębny marketing dla swoich wdrożeń 5G w średnim paśmie, aby odróżnić nowsze wdrożenia 5G w średnim paśmie od wcześniejszych. T-Mobile oparł się na marce “5G Bardziej”, podczas gdy Plus użył sloganu marketingowego “5G Ultra”, aby wskazać dodatkowy wzrost wydajności odblokowany przez ich nowe sieci 5G w lokalizacjach, w których wdrożono dedykowane częstotliwości średniego pasma. Strategia ta stała się częścią szerszej zmiany na rynku, w której wszyscy operatorzy odchodzą od hiper-koncentracji opierającej się na konkurencji cenowej w kierunku strategii cenowych “więcej za więcej”, wspierając poprawę rentowności i ponowny wzrost ARPU.
Polska przoduje w regionalnym wzroście ARPU od momentu rozpoczęcia wdrożeń średniego pasma 5G
Analiza danych GSMA Intelligence | Zmiana procentowa ARPU w usługach mobilnych (I kw. 2023 vs I kw. 2025)
Aktywacja niskiego pasma i postępy w budowie sieci mają na celu wzmocnienie zysków 5G w średnim paśmie
W związku z tym, że polski regulator telekomunikacyjny, UKE, ustanowił jeden z najbardziej ambitnych zobowiązań dotyczących zasięgu w Europie dla ostatnich aukcji częstotliwości średniego i niskiego pasma, operatorzy raczej nie opóźnią komercyjnych wdrożeń w nowo nabytych pasmach 700 i 800 MHz. Oczekuje się, że wdrożenia te rozpoczną się w przyszłym miesiącu i będą miały kluczowe znaczenie dla ustanowienia krajowej warstwy zasięgu 5G, która znacznie poprawi pokrycie ciężko dostępnych miejsc wewnątrz budynków w miastach i zdalnych obszarów wiejskich. Rozszerzony zasięg będzie również wspierał szersze wdrażanie usług głosowych przez LTE (VoLTE), przyspieszając schyłek 3G i uwalniając dodatkowe widmo w paśmie 900 MHz.
Wkrótce powrócimy do tego tematu, aby ocenić, jak polscy operatorzy radzą sobie z wdrażaniem nowych częstotliwości niskopasmowych i jak skutecznie uzupełniają trwający proces wygaszania 3G.
Ookla retains ownership of this article including all of the intellectual property rights, data, content graphs and analysis. This article may not be quoted, reproduced, distributed or published for any commercial purpose without prior consent. Members of the press and others using the findings in this article for non-commercial purposes are welcome to publicly share and link to report information with attribution to Ookla.
Luke Kehoe leads Ookla’s research and thought leadership efforts in Europe.
An electronic engineering alumnus of University College Dublin, Luke has extensive experience collaborating with mobile operators, telecoms vendors, and government agencies in research and advisory roles across Europe. He has contributed to internationally recognised thought leadership publications in areas such as 5G, IoT, open RAN, and edge computing, working with prestigious organisations like the Telecom Infra Project and the World Economic Forum.
Market-led fragmentation has left rail passengers with wildly uneven Wi-Fi experiences across different countries.
Europe and Asia’s rail networks, long heralded as a backbone of economic competitiveness, are now judged not only on punctuality and comfort but on the quality of the digital experience onboard. High-quality train Wi-Fi has shifted from nice-to-have to essential rail infrastructure. Commuters expect a home broadband-like experience for streaming, work calls and gaming while crossing the Swiss Alps or skirting Mount Fuji.
Where countries treat train connectivity as rail infrastructure and pair onboard Wi-Fi with rail-specific infrastructure (trackside, LEO satellite or both), everyday outcomes improve measurably for passengers. This study is the first of its kind to use crowdsourced Ookla Speedtest® data to benchmark country-level train Wi-Fi performance across Europe and Asia.
Key Takeaways:
The gap separating Europe’s best and worst is startling. In Q2 2025, Sweden set the pace for train Wi-Fi in Europe with a 64.58 Mbps median download, followed by Switzerland (29.79 Mbps) and Ireland (26.33 Mbps). Laggards like Spain (1.45 Mbps), the UK (1.09 Mbps) and the Netherlands (0.41 Mbps) featured the poorest outcomes, with download speeds as much as 158 times slower than top-performing Sweden.
Legacy Wi-Fi tech drags many rail networks. Across the European markets studied, nearly two in five connections still run on Wi-Fi 4 (a standard dating to 2009), and ~22% use the lower-capacity, more congestion- and interference-prone 2.4 GHz band. The UK still sees over half of all rail connections on Wi-Fi 4, with 38% on 2.4 GHz. In Poland, rail connections remain almost entirely on Wi-Fi 4 and the 2.4 GHz band.
Band and Wi-Fi gen matter, but backhaul is the real bottleneck. Within-country comparisons show substantial uplifts for 5 GHz vs 2.4 GHz (e.g., +328% in Germany) and Wi-Fi 5 vs Wi-Fi 4 (e.g., +241% in Germany). Yet countries that feature a more modern Wi-Fi mix and thus drive greater use of the 5 GHz band, like Spain and Italy, can still underperform on speeds. This demonstrates that backhaul (i.e., the connection between the train’s roof antennas and the public mobile networks), not just cabin Wi-Fi, is the dominant driver of performance.
Asian rail networks feature modern Wi-Fi mix and lower latency but are not always faster. Taiwan posted the lowest latency and the only material Wi-Fi 6 share (~20%), while Japan and South Korea showed virtually no legacy Wi-Fi 4 or 2.4 GHz usage. Across Asia, typical median download speeds (6-8 Mbps) cluster below Europe’s leaders but above its laggards, reflecting different policy approaches (i.e., greater emphasis on cellular than Wi-Fi).
Policy fingerprints are unmistakable and outweigh topographic and demographic factors. When governments and operators treat mobile networks as core rail infrastructure, and invest in dedicated trackside systems, higher-order MIMO with multi-operator bonded train-mounted antennas, and RF-permeable rolling-stock window retrofits, outcomes improve dramatically.
Fragmented Wi-Fi outcomes reflect different policy attitudes across Europe and Asia
Sweden and Switzerland lead the frontier, puncturing the premise that terrain is destiny
Analysis of Speedtest Intelligence® data reveals Europe’s train Wi-Fi experience is split between a performance frontier and a long tail, with a distribution that resembles two radically different market contexts. Sweden led the continent in Q2 2025 with a median download speed of 64.58 Mbps, more than four times Europe’s country-level median (7.59 Mbps) and over 150 times the Netherlands (0.41 Mbps). This lead extended to upload performance, with Sweden delivering uploads (54.95 Mbps) more than twice as fast as the next fastest country.
It was not always this way. From Q1 2022 to Q1 2024, Wi-Fi performance on Sweden’s train networks was flat at ~2 Mbps down and ~0.7–1.9 Mbps up, placing it in the bottom half of European countries. In Q2 2024, however, there was a clear structural break in the trend, with speeds jumping sharply and continuing to rise through Q1 2025. In practical terms, this means Swedish rail users have moved from a constrained Wi-Fi experience (where even video access was marginal) to a level that supports multi-user carriages with HD streaming and smoother video conferencing.
Sweden Delivers the Fastest Wi-Fi on European Trains by a Wide Margin
Speedtest Intelligence® | Q2 2025
Sweden’s strong performance in mobile coverage along rail corridors has emerged despite challenging conditions, such as long, sparse tracks in the northern regions that face severe winter weather. This success stems from a pragmatic, modular policy framework that delivers targeted state aid where market failures are most evident. For instance, in 2022, the Swedish telecoms regulator PTS allocated €2 million to Telia and Net4Mobility for installing passive, operator-neutral infrastructure in select tunnels. Additionally, rail-specific coverage and capacity obligations were integrated into the 2023 spectrum auction for the 900/2100/2600 MHz bands, setting performance targets to boost capacity on mainlines using the 2100 and 2600 MHz bands while adding new sites for 900 MHz coverage.
In 2023, the Swedish government and PTS proposed that the rail infrastructure operator open access to mobile sites, fibre and power along rights-of-way. It also mandated mapping tunnel coverage, which identified 45 tunnels longer than 300 meters still lacking mobile service, along with developing a comprehensive cost plan. The assessment revealed 630 km of track falling below a 10 Mbps threshold (with a 16 dB margin), prompting efforts to address these gaps through the tunnel support initiatives and rail coverage obligations.
While eclipsed by Sweden for the first time in recent quarters and undergoing a decline in competitiveness, Swiss trains continue to be state of the art in terms of onboard connectivity, delivering median download speeds of 29.79 Mbps in Q2 2025 (albeit down significantly from 85.31 Mbps in Q1 2023, likely reflecting architectural changes or additional congestion). Like Sweden, it represents an exemplary engineering feat for a country characterized by extremely difficult terrain, with Swiss rail operator SBB’s network piercing the Alps with steep approaches, tight valleys, long tunnels, high viaducts and avalanche and rockfall zones.
Northern and Central European Rail Networks Perform Strongest on Wi-Fi Upload Speeds Too
Speedtest Intelligence® | Q2 2025
The Swiss model for onboard connectivity differs markedly from most countries. While SBB offers public Wi-Fi on cross-border services (reflecting the data shared here) and at stations, domestic trains rely primarily on zero-rated mobile data via “SBB FreeSurf” rather than universal onboard Wi-Fi. FreeSurf requires a Swiss SIM and the SBB FreeSurf app; once on board, Bluetooth Low Energy (BLE) beacons in the carriage recognize the device and flag the journey segment, allowing traffic to flow over the public mobile networks without debiting the passenger’s data allowance. SBB then settles the associated data usage with participating mobile operators, effectively subsidizing onboard connectivity.
This model sidesteps the shared onboard Wi-Fi bottleneck and the operating expense of repeaters and cellular backhaul, allowing rail and mobile operators to channel capital into a high-quality radio layer along rail corridors. Its critical limitation is access, however, as onboard connectivity effectively extends only to devices and users with a Swiss-issued SIM, constraining tourists and many business travelers.
Beyond Sweden and Switzerland, other countries that performed well above the European average for download speeds last quarter included Ireland (26.33 Mbps), Czechia (23.36 Mbps) and France (19.12 Mbps). Ireland also recorded the lowest latency of any European country in the period at 40 ms. That strong outcome, despite a disproportionately rural geography, is likely aided by legacy diesel rolling stock. With virtually no electrification and trains operating at lower speeds than many networks on the continent, cellular handovers occur less frequently, which can make better RF outcomes easier to achieve.
Outside Central and Northern Europe, train Wi-Fi slows to a crawl
The performance delta between leading countries and laggards like Spain, the Netherlands and the UK was stark in Q2 2025 and has continued to widen over time. Median download speeds in these countries were as much as 158 times slower than in Sweden in Q2 2025, meaning the average rail passenger connected to a Wi-Fi network in these countries suffers a very poor quality of experience in basic applications like video streaming.
Train Wi-Fi Remains Stuck Firmly in the Slow Lane Across Most European Countries
Speedtest Intelligence® | Q1 2023 – Q2 2025
The UK’s underperformance is not a single-cause issue but the result of weaknesses across multiple layers. At the cabin level, over half of connections still run on Wi-Fi 4, and 38% of samples used the 2.4 GHz band in Q2 2025. This continued reliance on legacy Wi-Fi and the interference-prone, capacity-limited 2.4 GHz band constrains performance regardless of cellular backhaul quality.
Compared with several European peers that organize rail under a single state holding or a clearly empowered state infrastructure manager, the UK has historically split responsibility for stations, services and rolling stock across multiple entities, which complicates collaboration with mobile operators. This friction is easing as GBR reforms bring passenger operations under public control and simplify coordination with state-owned Network Rail. Even so, performance remains weak, reflecting the UK mobile market’s lagging position in network quality (57th globally in the latest Speedtest Global Index™) and the reliance on patchy, incidental public mobile coverage for cellular backhaul.
The Netherlands’ poor train Wi-Fi performance is striking given it ranks in the global top 15 for mobile network quality over the same period, with favorable terrain and high urbanization that enables low-cost coverage along rail corridors. The gap reflects under-investment in the onboard Wi-Fi layer: virtually all connections still use Wi-Fi 4, and usage is very low and has collapsed as passengers shift to their own 5G connections. Dutch rail operator NS has reportedly floated ending the Wi-Fi service if the ministry waives the concession requirement.
Cellular takes precedence over Wi-Fi onboard leading Asian rail networks
Policy muscle in South Korea, Japan and Taiwan has prioritized dedicated trackside cellular coverage, with public Wi-Fi treated more as an amenity than a core service and most passengers relying on their own 4G/5G connections onboard (as in the Netherlands and Switzerland). Even so, rail operators still provide Wi-Fi across much of their rolling stock, and deployments are generally more modern than in Europe.
Wi-Fi 5 and the 5 GHz band are widespread in Japan and South Korea (>90% sample share) on rail networks, with little of the legacy burden seen in countries like the UK or Poland, and Taiwan already features a meaningful and growing share of Wi-Fi 6 (about 20% in Q2 2025) despite still featuring some Wi-Fi 4 (30% sample share).
Taiwan Leads on Latency on the Tracks, Providing a Superior Experience in Interactive Applications
Speedtest Intelligence® | Q2 2025
While none of the studied Asian countries competed at the level of the best European performers in terms of speeds on train Wi-Fi in Q2 2025, each performed well above the long tail of laggards in Europe and close to the average. Taiwan led the pack with median download speeds of 8.1 Mbps in Q2 2025, followed by South Korea (7.11 Mbps) and Japan (6.89 Mbps). The same ranking pattern was observed for upload speeds.
Taiwan delivered the lowest latency of any country in the same period (13 ms), with median response significantly below South Korea (62 ms) and Japan (83 ms).
Rail networks pose one of the most daunting engineering challenges for high-quality Wi-Fi
Rail operators view onboard connectivity as a lever for revenue, loyalty and operations, while policymakers increasingly frame it as part of the digital backbone of national transport systems. The engineering reality is harsher: a train carriage is a metal Faraday cage moving through tunnels, cuttings and rural not-spots, where cellular handovers are frequent and fragile. Best-effort aggregation of public 4G and 5G networks rarely delivers the capacity, stability and latency modern use cases demand.
Delivering a home broadband-like experience on the tracks requires tight coordination across multiple infrastructure layers managed by different entities, typically split into train-to-ground backhaul (via cellular and/or satellite) and on-train distribution systems (via Wi-Fi).
Backhaul still mostly relies on incidental mobile network coverage
The prevailing approach, still used in the vast majority of European countries, relies on wireless backhaul that piggybacks on “incidental” public mobile coverage, feeding dedicated external antennas on each carriage. Because this coverage is incidental, the mobile site grid is usually optimized for nearby population centers rather than the rail corridor itself, creating frequent not-spots and forcing fallback to lower-frequency spectrum with less bandwidth and capacity at cell edges.
Modern Wi-Fi Equipment But Poor Speeds in Countries like Taiwan Indicates Backhaul Problems
Speedtest Intelligence® | Q1 2023 – Q2 2025
On the train itself, regardless of the backhaul feeding the roof-mounted antennas, multi-SIM gateways bond signals from public mobile networks (and, increasingly, LEO providers such as Starlink) and feed an Ethernet backbone to multiple Wi-Fi access points per carriage. Greater bonding diversity across public mobile networks (i.e., using operators with independent infrastructure, not actively shared RAN) typically improves outcomes, since connections can switch dynamically as signal conditions vary. That diversity also adds cost, meaning some rail operators choose a single-network arrangement to contain spend at the expense of performance.
The train carriage itself has become a signal attenuator
The use of external antennas for backhaul is specifically intended to mitigate the fact that rail carriages themselves have become a significant signal attenuator and Faraday cage (and means onboard Wi-Fi can play a complementary role in mitigating against signal loss suffered by 4G and 5G signals on user devices). Modern rolling stock often uses low-E glass with metalized coatings (inducing more signal loss than a layer of concrete in many cases) and foil-backed insulation to reduce heat loss and act as an acoustic barrier. The impact of these RF-hostile designs is compounded at speed, when frequent cell handovers, the Doppler effect, cuttings and tunnels can create jitter (variance in latency over time) and signal dropouts.
Inside the train, crowding adds “body loss” and concentrates hundreds of users onto whatever backhaul is available. This also strains the onboard Wi-Fi, a shared medium whose performance depends on access point placement, channel planning, per-car Ethernet backhaul, and QoS or fair-use policies that may aggressively shape traffic and artificially depress performance.
Leading countries are mobilizing a diverse policy toolkit to deliver better outcomes
Dedicated trackside deployments are needed to tackle cellular not-spots
While cost-effective, leading countries are moving away from the incidental coverage model and converging on dedicated trackside deployments, fostering tighter collaboration between mobile and rail operators to deliver better outcomes. Purpose-built radios along the rail right-of-way, with close inter-site spacing and engineered tunnel coverage using leaky feeders and small cells, allow capacity to scale with corridor demand rather than the surrounding macro grid.
In France, for example, a dedicated trackside layer was introduced on flagship corridors beginning with Paris/Lyon. Orange won an SNCF-run tender to build the network (known as NET.SNCF). Site spacing of ~2–3 km was initially targeted, including the implementation of antenna downtilt and clutter management in cuttings and tunnels, to cater to a TGV (French high-speed train) traveling at 300 km/h handing over base stations as frequent as every 15 seconds.
Notwithstanding the poor performance observed in this study, Austria has employed a similar state-orchestrated, co-funded program since 2015. It has deployed hundreds of mobile sites across 1,500 km of track, initially targeting trackside 4G sites roughly every 5 km and DAS/leaky-feeder systems in tunnels, delivered through a mixture of new-build sites and co-location on existing rail operator ÖBB assets such as GSM-R masts and catenary masts (used to support the overhead electric wires).
Adoption of Higher Wi-Fi Bands Like 5 GHz and 6 GHz Can Improve Performance in Crowded Trains
Speedtest Intelligence® | Q2 2025
Austria’s interventions are based on three-way governance, with ÖBB as the corridor owner and project integrator, mobile operators funding and operating the networks, and the Ministry co-funding and setting expectations via the Rahmenplan (the federal financing instrument that underwrites rail infrastructure programmes in Austria).
In Asia, meanwhile, the Japanese government has subsidized cellular extensions into tunnel segments through a “Radio Shadow Countermeasure Program” with dedicated DAS/relay installations. This means all Shinkansen tunnels have been covered with mobile coverage across NTT Docomo, KDDI and SoftBank since 2020.
Rolling stock retrofits focus on making modern glass less like a layer of concrete
Maximizing returns on dedicated trackside investment means treating the rolling stock as part of the policy toolkit too. Upgrades to the external train-to-ground path focus on multi-band 4×4 (and higher) MIMO and adopting active rooftop antennas powered over Ethernet (PoE). By moving filters and radio components into the antenna radome, operators can avoid long RF coax runs and cut signal losses. Germany’s Deutsche Bahn, for example, used its “advanced TrainLab” program to test and compare rooftop antenna carriers and component combinations, and has since signed a turnkey retrofit and new-build contract with HUBER+SUHNER and McLaren Applied for active PoE rooftop antennas as part of its fleet modernization.
To cut reliance on on-board repeaters and reduce signal attenuation in cellular-based systems (e.g., Switzerland’s SBB FreeSurf) where Wi-Fi is not used, operators have turned to window-replacement programs using laser-treated, RF-permeable low-E glass. Research by EPFL, Swisscom and SUPSI found such windows to be “as good as ordinary glass” for mobile signal, mitigating the 20–30 dB losses recorded by the UK Department for Transport in testing.
Over the last two years, Germany’s Deutsche Bahn announced the laser treatment of 70,000 windows across 3,300 ICE/IC cars (at a cost of €50 million, US$58.7M) and began regional retrofits, following the 2020 decision to equip new high-speed ICE rolling stock with RF-permeable glass as standard. Belgium has pursued a similar policy, abandoning a national on-train Wi-Fi rollout (projected to cost €173 million (US$203M) upfront and €13 million (US $15.3M) in annual operating costs) and redirecting €40 million (US$47M) to alter window coatings and prompt passengers to rely only on their cellular subscriptions while on board.
LEO satellite is emerging as a complement to cellular backhaul for trains
The appeal of low Earth orbit (LEO) for rail operators is increasingly clear. It can add coverage resilience when bonded with cellular on rural, coastal and non-electrified corridors where dedicated trackside and macro layers are thin. LEO’s markedly lower latency and strong burst capacity relative to legacy GEO systems used by many rail operators enables step-change improvements in the onboard passenger Wi-Fi experience and supports operational uses such as CCTV backhaul.
Notwithstanding the opportunity, the constraints of LEO solutions in a rail context are just as real. Hardware maturity still lags aviation and maritime, with far fewer rail-certified, low-profile roof-mount terminals that combine ingress protection, shock and vibration resilience and compliance with EN rail standards, which limits scale for now. Other barriers include sky-view limitations in tunnels and deep cuttings, the operating cost of LEO backhaul for high-demand Wi-Fi unless traffic is shaped and offloaded to cellular, and roof space, power and EMC (electromagnetic compatibility) trade-offs on legacy rolling stock.
Recent commercial and policy developments point to a hybrid end state for LEO on trains, rather than a full replacement for cellular backhaul. Momentum is building in Europe through targeted route trials, limited fit-outs and active procurements, with noticeably less activity in Asia so far. SpaceX’s Starlink and Eutelsat’s OneWeb are the primary LEO constellations in the rail segment, both now in live trials with integrators such as Icomera and CGI, following successful deployments across other transport modes like aviation.
ScotRail, backed by the Scottish Government, has been an early mover with a six-month Starlink pilot on rural northern routes, targeting enhanced passenger Wi-Fi, GPS tracking and live CCTV. In France, SNCF has launched a national tender to equip the fleet with hybrid satellite and terrestrial cellular backhaul, with Eutelsat OneWeb signalling its intent to bid. Italy has ministry-sponsored LEO trials on the Rome to Milan corridor with Trenitalia. PKP Intercity in Poland, České dráhy in Czechia and LTG Link in Lithuania have also tested Starlink terminals to lift onboard Wi-Fi performance.
Policy is converging on using LEO as an additive layer within a multi-link software-defined wide area network ( SD-WAN) gateway onboard that also bonds multiple independent terrestrial cellular networks. In the near term, rail operators will prioritise the corridors with the highest return on investment, need to engineer antenna diversity onboard (for example, two spaced flat-panel terminals to improve link availability through slews, curves and partial obstructions) and issue RFPs that preserve multi-orbit and multi-provider choice with rail-grade certifications for LEO terminals.
Rail connectivity is undergoing a renaissance as satellite and dedicated 5G networks for rail converge
Alongside investments in LEO solutions, rail operators in developed markets are preparing to migrate from legacy GSM-R to Future Railway Mobile Communications System (FRMCS), a 5G-based railway communications standard defined by 3GPP for mission-critical rail. The shift is capital intensive but delivers a dedicated, private 5G trackside network for safety-critical functions such as driver-to-signaler voice, ETCS train control data, remote monitoring and control of trackside assets and live operational and security video.
In Europe, deployments are planned (into the 2030s) primarily in the 900 MHz band with an additional 1.9 GHz capacity layer, and the system will incorporate mission-critical push-to-talk, strict quality of service and, in time, network slicing. While FRMCS focuses on operational communications rather than passenger Wi-Fi or public cellular, the trackside densification it drives is likely to lift the baseline for onboard Wi-Fi by delivering a stronger, more contiguous cellular backhaul layer for bonding.
Together with more capable roof-mounted antennas, RF-permeable window retrofits and Wi-Fi 6E/7 upgrades, these interventions give lagging countries a clear set of levers to lift passenger Wi-Fi performance on board over the coming years.
Ookla retains ownership of this article including all of the intellectual property rights, data, content graphs and analysis. This article may not be quoted, reproduced, distributed or published for any commercial purpose without prior consent. Members of the press and others using the findings in this article for non-commercial purposes are welcome to publicly share and link to report information with attribution to Ookla.
Luke Kehoe leads Ookla’s research and thought leadership efforts in Europe.
An electronic engineering alumnus of University College Dublin, Luke has extensive experience collaborating with mobile operators, telecoms vendors, and government agencies in research and advisory roles across Europe. He has contributed to internationally recognised thought leadership publications in areas such as 5G, IoT, open RAN, and edge computing, working with prestigious organisations like the Telecom Infra Project and the World Economic Forum.
New wireless silicon in the iPhone 17 family delivers material performance improvements over predecessors, pushing it ahead of many Android flagship devices in Wi-Fi.
If the last few smartphone releases were defined by cellular milestones, 2025 has quietly become the year of Wi‑Fi. Apple’s first custom networking chip, the N1, arrives in the iPhone 17 family, while Android flagships (meaning companies’ top-of-the-line models) have leaned into Wi-Fi 7 and 6 GHz with enhanced capabilities made possible by 320 MHz channels. The primacy of Wi-Fi performance in the everyday user experience and the proliferation of new form factors mean device manufacturers are competing more intensely for access to the best networking silicon.
Using global, crowdsourced Speedtest Intelligence® data from the six weeks after the iPhone 17 family of devices hit stores, we compared the performance of Apple’s N1 with its Broadcom-based predecessor and leading Android flagships using Wi-Fi silicon from Qualcomm, MediaTek and Broadcom.
Key Takeaways:
Apple’s N1 chipset is a substantial upgrade. The iPhone 17 family delivers a clear step-change in Wi-Fi performance vs. the Broadcom-based iPhone 16 lineup, with faster download and upload speeds across every region. Globally, median download and upload speeds on the N1 were each up to 40% higher than on its predecessor.
Google’s Pixel 10 Pro and iPhone 17 families jostle for Wi-Fi leadership. The Pixel 10 Pro recorded the highest global median download speed at 335.33 Mbps during the study period, marginally edging out the iPhone 17 family at 329.56 Mbps. The pattern flips at the 10th percentile (worst-case), where the iPhone 17 family leads globally with 56.08 Mbps, just ahead of the Pixel 10 Pro family at 53.25 Mbps.
Xiaomi’s 15T Pro delivers the strongest upload and latency performance. Based on MediaTek Wi-Fi silicon integrated with the Dimensity 9400(+) platform, the 15T Pro performed strongest in 90th-percentile (best-case) download speed at 887.25 Mbps, upload speed at the 10th, median and 90th percentile levels and median multi-server latency (15 ms) globally.
Huawei’s Pura 80 family suffers from lack of 6 GHz support but remains competitive on non-6 GHz networks. Based on a “self-developed chip-level collaboration” (likely from HiSilicon), it lags other flagships in download and upload speeds, with a particularly acute gap at the 90th percentile where the absence of 6 GHz support hurts peak performance. Notwithstanding this, when looking only at non-6 GHz samples, the Pura 80 family is more competitive and, on Wi-Fi 6, delivers the second-fastest upload speeds at the 90th percentile (603.61 Mbps) in Southeast Asia against Android flagships.
Wi-Fi 7 and 6 GHz are force multipliers for flagship Wi-Fi silicon, though adoption remains regionally skewed. Across Android families, median 6 GHz download speeds were at least 77% faster than 5 GHz, and the step from Wi-Fi 6 to Wi-Fi 7 delivered a similar lift. In North America, flagship Android users spend much more time on 6 GHz networks, with the Galaxy S25 family showing over 20% of Speedtest samples on 6 GHz, compared with about 5% in Europe and Northeast Asia and just 1.7% in the Gulf region.
Methodological note: This analysis uses Speedtest® data collected from September 19 to October 29, 2025. The included Wi-Fi 7-capable devices are listed below. For each device family, the results represent the aggregate of all devices in that family:
Apple iPhone 16 family (iPhone 16, 16 Plus, 16 Pro, 16 Pro Max)
Apple iPhone 17 family (iPhone Air, iPhone 17, iPhone 17 Pro, iPhone 17 Pro Max)
Samsung Galaxy S25 family (Galaxy S25, S25+, S25 Ultra)
Google Pixel 10 Pro family (Pixel 10 Pro, Pixel 10 Pro XL)
Huawei Pura 80 family (Pura 80 Pro, Pura 80 Ultra)
Xiaomi 15T Pro
Vivo X200 Pro
Oppo Find X8 Pro
Apple’s N1 focuses on tighter hardware-software integration rather than chasing peak capability
The arrival of the N1 marks the next ambitious step in Apple’s multi-year plan to bring the last major piece of the iPhone’s wireless stack in-house. By moving off Broadcom-supplied parts, Apple gains tighter control over mission-critical silicon, reduces supplier dependence and pricing exposure and creates a reusable radio platform that can scale across iPhone, Mac, iPad, Watch and Home devices.
Technically, the N1 is a single-die chip that integrates Wi-Fi 7, Bluetooth 6 and Thread radios. Aside from the step up from Bluetooth 5.3 to 6 and Apple’s claim that tighter hardware-software integration improves features like AirDrop and Personal Hotspot, the N1’s Wi-Fi capabilities appear, on paper, virtually identical to its Broadcom-based predecessor.
This continuity in Wi-Fi specifications is notable because it means the N1 is capped at 160 MHz channels and lacks support for 320 MHz operation and thus the peak link rates (or PHY speeds) available with flagship silicon from vendors such as Qualcomm and MediaTek.
In practical terms, this should limit the N1’s peak performance in markets that allow the full 6 GHz band, like the US, which offers up to three non-overlapping 320 MHz channels. It should also limit performance (although potentially to a lesser degree) in regions that allow only the lower 6 GHz block, like the EU and UK, which offer just one non-overlapping 320 MHz channel.
iPhone 17 family delivers a clear step up in Wi-Fi performance over its predecessors
Analysis of Speedtest Intelligence data shows that, despite the similar headline specifications between the Broadcom-based iPhone 16 family and the N1-powered iPhone 17, the 17 delivers a clear step-change in real-world Wi-Fi performance. New devices often appear to outperform in their early weeks, partly because early adopters skew toward wealthier markets with more capable Wi-Fi networks. However, the consistency and magnitude of the iPhone 17’s lead indicate this is not a launch-period skew but a genuine improvement.
iPhone 17 Family Delivers Step-Change in Wi-Fi Performance Globally
Speedtest Intelligence® | Sept 19 – Oct 29, 2025. Regional.
To ensure the gains are not a simple country-mix artifact, we matched markets where both families exhibited the most samples during the study period. Across all of those countries analysed, including major markets such as the US, UK, Germany, Japan, Italy and India, the iPhone 17 outperformed the iPhone 16 on download performance. This pattern holds across markets with very high absolute speeds (e.g., France) and more typical markets alike, pointing to genuine device-side improvements.
N1 Silicon is Driving Wi-Fi Gains Across Major Markets
Speedtest Intelligence® | Sept 19 – Oct 29, 2025. Country-level.
The iPhone 17 family delivered higher download and upload speeds on Wi-Fi compared to the iPhone 16 across every studied percentile (10th, median and 90th) and virtually every region. During the study period, the iPhone 17 family’s global median download of 329.56 Mbps was as much as 40% higher than the iPhone 16 family’s 236.46 Mbps. Upload speeds improved similarly, jumping from 73.68 Mbps to 103.26 Mbps.
iPhone 17 Family Sees Biggest Upload Gains in Asia
Speedtest Intelligence® | Sept 19 – Oct 29, 2025. Regional
Notably, the N1 delivers a far bigger generational uplift at the 10th percentile than at the 90th, implying Apple’s custom silicon lifts the floor more than the ceiling, a pattern we also saw in our analysis of the in-house C1 modem’s cellular performance.
iPhone 17 Family is Stronger in Tough Wi-Fi Conditions
Speedtest Intelligence® | Sept 19 – Oct 29, 2025. Regional.
This means the N1 appears to deliver a more consistent experience across a wider range of environments, in particular uplifting performance under challenging Wi-Fi conditions. Specifically, 10th-percentile speeds on iPhone 17 were over 60% higher, versus just over 20% at the 90th percentile.
Singapore and France Lead Global iPhone 17 Speeds
Speedtest Intelligence® | Sept 19 – Oct 29, 2025. Country-level. iPhone 17 family.
At a regional level, iPhone 17 users enjoyed the highest median download speeds in North America at 416.14 Mbps (up from 323.69 Mbps on the iPhone 16 family), mainly due to greater 6 GHz use. At a country level, meanwhile, iPhone 17 users in Singapore (613.80 Mbps) and France (601.46 Mbps) saw the highest speeds out of all the markets where the device has launched, reflecting the very high penetration of multi-gigabit fibre in both.
The lack of 320 MHz support does not yet impact N1 performance in the wild
The N1’s performance not only surpasses its Broadcom-based predecessor but also places the iPhone 17 family in a strong competitive position across all Wi-Fi metrics in every region. Notably, Apple’s latest lineup achieved the highest global 10th-percentile download speed at 56.08 Mbps, reinforcing the observation that the N1 is likely to deliver more consistent performance in non-ideal Wi-Fi conditions.
The N1’s apparent handicap on paper, with channel width capped at 160 MHz rather than the 320 MHz that Wi-Fi 7 supports with 6 GHz, does not materially affect performance in real world use for most people. In theory, this cap could halve peak link rates right next to a top tier router, yet the impact is rarely visible outside controlled tests, highlighting the importance of real-world testing and crowdsourced data to reflect the actual end-user experience.
Strong iPhone 17 Performance in North America
Speedtest Intelligence® | Sept 19 – Oct 29, 2025. North America.
This is evident in the iPhone 17 family posting the highest median (416.14 Mbps) and 90th percentile (976.39 Mbps) download speeds of any device in North America, where gains from 320 MHz channels should be most apparent. The most likely explanation is that the installed base of 320 MHz-capable routers remains very small (and our recent shows Wi-Fi 7 adoption itself is still limited), so usage is not yet material enough to move results at the aggregate level.
North American iPhone 17 Speeds Hold Up Without 320 MHz
Speedtest Intelligence® | Sept 19 – Oct 29, 2025. North America.
This may also explain why Apple chose not to add the capability to the N1, even though the performance benefit of 320-MHz-capable silicon is likely to grow as the Wi-Fi ecosystem matures, making it a future-proofing feature for Android flagships that include it.
Google’s Pixel 10 Pro leads on median download speed, Samsung’s Galaxy S25 delivers lowest best-case latency
Beyond the iPhone 17 family, Google’s Pixel 10 Pro also performed strongly on download speed. Likely powered by Broadcom Wi-Fi silicon (consistent with the Pixel 8 and 9 lineage), it achieved the highest global median download speed at 335.33 Mbps during the study period, narrowly ahead of the iPhone 17 family at 329.56 Mbps. In markets such as North America, where Chinese Android brands have limited share, the Pixel 10 Pro also leads in upload performance at both the median and the 90th percentile.
Pixel 10 Pro Leads Global Wi-Fi Download Speeds
Speedtest Intelligence® | Sept 19 – Oct 29, 2025. Global.
Samsung’s Galaxy S25 family, based on Qualcomm’s FastConnect 7900 Wi-Fi silicon integrated with the Snapdragon 8 Elite platform, did not lead outright in any metric at the global level but was positioned in the upper mid-pack across most. Its clearest regional strength was latency, where it delivered the lowest best-case response times in North America (6 ms), Europe (7 ms) and the Gulf (9 ms). It also led in median multi-server latency in Europe (17 ms) and 90th percentile upload speeds in the Gulf (330.80 Mbps).
Xiaomi’s 15T Pro dominates upload performance with MediaTek Wi-Fi silicon
During the study period, the device ranking for upload speed differed markedly from the download ranking, even after controlling for country mix effects (that is, cases where devices skew toward markets with unusually high or low upload speeds). In markets where it has a large installed base, including Europe and Northeast Asia, Xiaomi’s 15T Pro, built on MediaTek Wi-Fi silicon integrated in the Dimensity 9400 (+) platform, showed a commanding lead in upload performance.
During the study period, Xiaomi’s 15T Pro achieved the fastest upload speeds in Europe at every percentile measured (10th, median, 90th) and also led 10th percentile uploads in Northeast Asia. In fiber-rich markets such as France, which are characterized by very high upstream performance and symmetrical line speeds, the 15T Pro was the only device to surpass 100 Mbps at the 10th percentile, 500 Mbps at the median, and 1,000 Mbps at the 90th percentile.
Xiaomi’s 15T Pro Leads on Upload Speed
Speedtest Intelligence® | Sept 19 – Oct 29, 2025. Global.
Beyond upload performance, Xiaomi’s flagship also provided strong performance on multi-server latency, delivering the lowest response times globally at the median (15 ms) and 90th percentile levels (42 ms).
Huawei’s Pura 80 family performs relatively more strongly where 6 GHz is not used
The Pura 80 series is based on a “self-developed chip-level collaboration” for Wi-Fi 7, suggesting, but not confirming, continued use of a HiSilicon solution after the Pura 70’s in-house silicon. If this is the case, Huawei would be the only other manufacturer besides Apple using vertically integrated Wi-Fi silicon across its current flagship lineup.
Critically, however, Huawei’s Wi-Fi 7 implementation in the Pura 80 family lacks 6 GHz support, both on devices sold in China (where 6 GHz is not available for Wi-Fi anyway) and overseas. This limitation significantly impedes performance capability on 6 GHz-capable Wi-Fi networks, especially in crowded environments, where the additional spectrum unlocks major speed gains on devices that can take advantage of it.
Huawei's Pura 80 Performs Better on Non-6 GHz Wi-Fi
Speedtest Intelligence® | Sept 19 – Oct 29, 2025. Southeast Asia.
The lack of 6 GHz support is particularly evident at the 90th percentile, where the Pura 80 family trailed all other devices in Southeast Asia, the region with the largest observed install base for the device, posting download speeds of 541.33 Mbps that were more than 39% below the top performing Oppo Find X8 Pro there. This lag also extended to median download speeds in the same region, where the Pura 80 family again trailed all other devices.
Notwithstanding this disadvantage, the Pura 80 was competitive on some metrics, including upload performance on access points lacking Wi-Fi 6E and Wi-Fi 7 (which do not benefit from 6 GHz access). On Wi-Fi 6 connections, Huawei’s flagship delivered the second-fastest upload speeds at the 90th percentile (603.61 Mbps) in Southeast Asia against Android flagships.
Wi-Fi 7 and 6 GHz propel flagships to new performance levels, but benefits remain fragmented
Although Wi-Fi outcomes vary by device, even between models using the same silicon because factors like hardware and software integration and chassis tuning affect results, and although they also vary by region, the commonality is a step-change in performance on flagship devices enabled by newer standards such as Wi-Fi 7 and access to the 6 GHz band.
North American Flagship Users Spend More Time on 6 GHz Wi-Fi
Speedtest Intelligence® | Sept 19 – Oct 29, 2025. Samsung Galaxy S25 Family.
On modern access points and devices with Wi-Fi 7-capable silicon, users can take advantage of newer features like Multi-Link Operation (MLO), which enables the use of multiple Wi-Fi bands at the same time (similar to carrier aggregation with cellular).
Flagship Devices See Higher Speeds on Newer Wi-Fi Standards
Speedtest Intelligence® | Sept 19 – Oct 29, 2025. Global.
These upgrades are translating into tangible gains, with Wi-Fi 7 delivering roughly double the median download speeds of Wi-Fi 6 on the same flagship Android devices included in this study (uplift ranging from +74% to +108% depending on device family). The step from Wi-Fi 5 to Wi-Fi 6 delivered a similar uplift on these devices (uplift ranging from +72% to +123%). Similarly, median download speeds on flagship devices connected to 6 GHz were at least 77% faster than 5 GHz.
Flagship Devices Perform Better on Higher Wi-Fi Bands
Speedtest Intelligence® | Sept 19 – Oct 29, 2025. Global.
The diffusion of these benefits in the real-world, however, is still at an early stage and regionally fragmented. For instance, while over 20% of Speedtest samples conducted on the Galaxy S25 family in North America originated on the 6 GHz band during the study period, only about 5% of samples in Europe and Northeast Asia and 1.7% in the Gulf region were based on 6 GHz.
Ookla retains ownership of this article including all of the intellectual property rights, data, content graphs and analysis. This article may not be quoted, reproduced, distributed or published for any commercial purpose without prior consent. Members of the press and others using the findings in this article for non-commercial purposes are welcome to publicly share and link to report information with attribution to Ookla.
Luke Kehoe leads Ookla’s research and thought leadership efforts in Europe.
An electronic engineering alumnus of University College Dublin, Luke has extensive experience collaborating with mobile operators, telecoms vendors, and government agencies in research and advisory roles across Europe. He has contributed to internationally recognised thought leadership publications in areas such as 5G, IoT, open RAN, and edge computing, working with prestigious organisations like the Telecom Infra Project and the World Economic Forum.
From Vulnerability to Resilience: How Portugal’s Mobile Networks Handled the Iberian Peninsula Blackout | Da Vulnerabilidade à Resiliência: Como as Redes Móveis Portuguesas Reagiram ao Apagão na Península Ibérica
Robust power redundancy markedly reduced outage impacts for one operator, while limited backup systems led to widespread service collapse for another, highlighting the importance of resilience planning and investment.
Mobile operators, equipment vendors, and policymakers throughout Europe are grappling with the challenge of hardening telecom infrastructure to withstand increasingly frequent and severe disruptions caused by power outages, sabotage, and extreme weather events.
Earlier this year, the Iberian grid blackout placed Portugal’s mobile operators at the coalface of this resilience challenge, creating a real-world stress test of their infrastructure on an unprecedented scale. Effective power redundancy, supported by battery and generator backups, coupled with energy conservation measures that strategically adjusted network configurations to preserve site availability, emerged as critical tools for limiting outage impact.
However, new analysis of Ookla® background signal scan data from the outage reveals that each operator’s ability to mitigate the disruption varied significantly, offering important lessons for future improvements in Portugal and beyond. This research builds upon our earlier findings in Spain, where we cross-referenced crowdsourced ‘no service’ data with satellite imagery to demonstrate that the profile of network disruptions and recovery moved in lockstep with power grid developments.
Key Takeaways:
At the height of the network disruptions on the evening of April 28th, more than one in three mobile network users in Portugal was left without service. The voltage drop triggered by the grid collapse rapidly cascaded through Portugal’s mobile networks, driving the share of users experiencing total service loss (unable to call, text, or use data as sites went dark) from a pre-blackout baseline below 0.1% to over 10% within two hours. At the peak late on April 28th, as battery and generator backups were progressively depleted, more than 60% of users across the worst-affected areas of Portugal were left without service.
While severe network outages affected all Portuguese operators during the blackout, mobile users on DIGI’s network were significantly more likely to experience a total loss of service. With up to 90% of DIGI subscribers left without any mobile coverage for over twenty-four hours, the outage exposed critical gaps in redundancy across multiple infrastructure layers, from mobile sites at the edge all the way to the core, potentially reflecting the limitations of DIGI’s less mature network buildout in Portugal.
MEO’s network demonstrated significantly greater resilience across Portugal during the April 28th blackout, illustrating how deep and widely deployed battery reserves can materially flatten and delay outage impacts triggered by power loss. At the peak of service disruption six to eight hours after the power loss, MEO’s subscribers were on average half as likely to lose service as those on NOS’s network, four times less likely than Vodafone’s subscribers, and six times less likely than DIGI’s. As a result, at least tens of thousands more MEO subscribers likely stayed connected for calls, texts, and data throughout April 28th.
The variation in outage impact between operators in Portugal was significantly greater than in Spain, revealing much deeper asymmetry in the level of power resilience across Portugal’s mobile networks. As in Spain, however, the pattern of service restoration reflected the geographically phased re-energisation of the power grid, with network disruptions persisting later into the night in Lisbon than in Porto, consistent with transmission operator REN’s blackstart process, which began in the north and moved south.
Blackout cascaded through Portugal’s mobile networks, forcing aggressive energy conservation measures as traffic demand surged and power backups were depleted
When the grid-wide collapse severed power to virtually all of mainland Portugal at 11:33 local time on April 28th, mobile sites were immediately forced off mains electricity and had to rely on batteries or generator backups, triggering a nationwide race between grid restoration and the exhaustion of backup reserves across telecom networks. Sites lacking any power autonomy vanished immediately (such as dense urban small cells), triggering a stepwise collapse in overall network density that resembled a cliff drop followed by a gradually declining tail.
The sudden loss of residential electricity rendered fixed networks and in-home Wi-Fi CPEs unusable, forcing users onto mobile networks and unleashing a massive surge in traffic that put intense pressure on capacity, particularly in urban areas. This was reflected in a rapid degradation of mobile network performance across all metrics, as illustrated in analysis of Speedtest Intelligence® data published in our earlier research.
The spike in demand on the country’s mobile infrastructure occurred just as operators were racing to implement aggressive energy conservation measures to extend the life of backup power at mobile sites. These efforts included phased 5G switch-offs (as 3.5 GHz massive MIMO radios typically draw two to three times the power of a low-band 4G sector), prioritizing core voice and text services, and reducing cell-edge transmit power where network loads were light.
Blackout produced a composite outage curve made of one large step (DIGI) superimposed on several peaked pulses (Vodafone, NOS, and MEO)
Although all of Portugal’s mobile operators implemented similar energy conservation measures during the blackout, the depth and distribution of power autonomy within each operator’s site portfolio, including the partially shared footprint between NOS and Vodafone, ultimately shaped their network resilience. This is evident in the distinct outage trajectories revealed by analysis of background signal scan data, which shows whether a device could connect to any network (2G, 3G, 4G, or 5G) based on a very large, geographically diverse sample across Portugal.
DIGI’s still-nascent network, which is leaner and heavily concentrated in cities (therefore making deployment of power autonomy more challenging at space-constrained rooftop sites), proved particularly brittle. Within four hours of the voltage drop, the share of subscribers on its network with no signal shot up from less than 0.1% to more than 90%, a classic step-function collapse. The operator’s entire radio layer appeared to disappear almost simultaneously, driven by shallow site-level batteries and little layered fallback. In addition, network access remained crippled for more than a day, likely pointing to a catastrophic failure of deeper elements such as the Evolved Packet Core (EPC) in Lisbon, which may have lacked geo-redundancy or sufficient power autonomy.
While Vodafone’s outage curve did not exhibit the same cliff-like profile as DIGI’s, instead following more of a triangular or peaked pulse shape, it still reached a very sharp peak. The heterogeneous distribution of backup power across Vodafone’s site footprint produced a multi-step survival curve, with each autonomy band expiring (for example, sites with four-hour batteries) causing another visible kink in the aggregate outage trajectory.
By 19:30 local time, almost 70% of Vodafone’s subscribers were left without service as the last reserves of backup power began to deplete ahead of grid restoration. While this was still materially lower than the more than 90% service loss seen on DIGI’s network in Portugal, it was nearly twice as high as the peak outage experienced by any operator in Spain on April 28th. Service was, however, rapidly restored on Vodafone’s network from 20:00 in a phased geographic sequence, aligning with the restoration of the grid, with the no service ratio falling below 5% by midnight.
Unlike other operators in Portugal, Vodafone and NOS have extensive RAN sharing, with a joint venture owning and operating actively shared sites in rural and interior areas, while sites in urban areas are passively shared. Despite this, the outage profile for NOS was notably less severe. This indicates that NOS’s network features relatively deeper power resilience in locations where its infrastructure is not actively shared, compared with Vodafone’s independently managed sites. On NOS’s network, the proportion of subscribers without service peaked early at nearly 30%, closely resembling the impact profile of the worst-affected operator in Spain, and remained at this level until power was restored.
The merits of widely deployed and deep battery reserves in flattening and delaying the outage curve (much like masks and vaccines suppress infection spread during a pandemic) were clearly demonstrated in MEO’s case. Its outage peak was lower and the tail shorter, with the proportion of subscribers left without service peaking at just over 16%, which was the best performance observed across Spain and Portugal on April 28th.
Outage experience demonstrates the role of power autonomy and geo-redundancy in hardening telecom infrastructure against external shocks
When the grid collapsed, every Portuguese operator reached for the same first lever by killing off the power-hungry 5G layer, but what happened next diverged. The breadth and depth of each operator’s power autonomy (at the site level) and the extent of geo-redundancy (at the core level), along with their ability to cascade lower-band layers, throttle traffic, and reshuffle spectrum, dictated how much of their network stayed online and for how long during the blackout.
The pronounced asymmetry in outage impacts observed across operators’ subscriber bases highlights the urgent need to harden mobile networks and raise all infrastructure layers to a higher baseline of resilience ahead of future severe events. There is now broad consensus, which is expected to be enshrined in the European Commission’s forthcoming Digital Networks Act (DNA), that telecom networks are critical infrastructure essential for societal functioning, and that even brief service disruptions can quickly escalate into serious public safety risks.
Da vulnerabilidade à resiliência: Como as redes móveis portuguesas reagiram ao apagão na Península Ibérica
Uma forte redundância energética atenuou significativamente os efeitos da falha para um dos operadores, enquanto a escassez de sistemas de reserva provocou a interrupção generalizada dos serviços noutro, evidenciando a importância do planeamento e do investimento em resiliência.
Os operadores móveis, fornecedores de equipamentos e reguladores em toda a Europa estão a enfrentar o desafio de reforçar a infraestrutura das telecomunicações para resistir a interrupções cada vez mais frequentes e graves causadas por falhas de energia, sabotagem e fenómenos meteorológicos extremos.
No início deste ano, o apagão da rede ibérica colocou os operadores móveis portugueses na linha da frente deste desafio de resiliência, criando um teste real de resistência das infraestruturas numa escala sem precedentes. A redundância energética eficaz, apoiada por baterias e geradores de reserva, aliada a medidas de poupança de energia que ajustaram estrategicamente as configurações da rede para preservar a disponibilidade dos sites, revelou-se uma ferramenta crucial para limitar o impacto das falhas de energia.
No entanto, uma nova análise dos dados de monitorização passiva de sinal da Ookla® durante a falha revela que a capacidade de cada operador para mitigar a interrupção variou significativamente, oferecendo lições importantes para futuras melhorias em Portugal e além-fronteiras.
Esta investigação baseia-se nas conclusões anteriores obtidas em Espanha, onde cruzámos dados crowdsourced de “sem serviço” com imagens de satélite para demonstrar que o perfil das perturbações e da recuperação das redes evoluiu em paralelo com a situação da rede elétrica.
Principais conclusões:
No auge das perturbações na rede, na noite de 28 de abril, mais de um em cada três utilizadores de redes móveis em Portugal ficou sem serviço. A queda de tensão desencadeada pelo colapso da rede elétrica propagou-se rapidamente nas redes móveis do país, fazendo com que a proporção de utilizadores com perda total de serviço (sem possibilidade de fazer chamadas, enviar mensagens ou utilizar dados, à medida que os sites ficavam inoperacionais) subisse de um valor inferior a 0,1 % antes do apagão para mais de 10 % em menos de duas horas. No pico, já no final do dia de 28 de abril, à medida que as baterias e os geradores de reserva se esgotavam progressivamente, mais de 60 % dos utilizadores nas zonas mais afetadas de Portugal ficaram sem serviço.
Embora todas as operadoras portuguesas tenham sido afetadas por graves falhas na rede durante o apagão, os utilizadores móveis da rede DIGI foram significativamente mais propensos a experienciar uma perda total de serviço. Com até 90 % dos assinantes da DIGI sem qualquer cobertura móvel durante mais de vinte e quatro horas, a falha expôs lacunas críticas na redundância em vários níveis da infraestrutura, desde as antenas móveis na periferia até ao núcleo da rede, refletindo potencialmente as limitações do desenvolvimento menos amadurecido da rede da DIGI em Portugal.
A rede da MEO demonstrou uma resiliência significativamente maior em todo o território português durante o apagão de 28 de abril, mostrando como as reservas robustas e amplamente implantadas de baterias podem atenuar e atrasar de forma significativa os impactos das falhas de energia. No pico da interrupção do serviço, entre seis e oito horas após a perda de energia, os assinantes da MEO tinham, em média, metade da probabilidade de perder o serviço comparativamente aos da NOS, quatro vezes menos do que os da Vodafone e seis vezes menos do que os da DIGI. Como resultado, provavelmente dezenas de milhares de assinantes da MEO mantiveram-se conectados para chamadas, mensagens e dados ao longo de todo o dia 28 de abril.
A variação do impacto das interrupções entre operadores em Portugal foi significativamente maior do que em Espanha, revelando uma assimetria muito mais profunda no nível de resiliência energética das redes móveis portuguesas. No entanto, tal como em Espanha, o padrão de restabelecimento do serviço refletiu a reenergização faseada geograficamente da rede elétrica, com as perturbações a persistirem até mais tarde durante a noite em Lisboa do que no Porto, em conformidade com o processo de arranque da rede de transporte da REN, que começou no norte e avançou para sul.
O apagão propagou-se pelas redes móveis de Portugal, obrigando a medidas agressivas de poupança de energia, à medida que a procura de tráfego aumentava e as reservas de energia se esgotavam
Quando o colapso de toda a rede cortou a energia em praticamente todo o território português continental, às 11h33, hora local, do dia 28 de abril, as antenas móveis foram imediatamente desligadas da corrente elétrica principal e tiveram de recorrer a baterias ou geradores de reserva, desencadeando uma corrida nacional entre a restauração da rede e o esgotamento das reservas de energia nas redes de telecomunicações. As infraestruturas que não dispunham de qualquer autonomia energética desapareceram imediatamente (como as “small cells”— micro- e pico-células), desencadeando um colapso gradual da densidade global da rede que se assemelhou a uma queda abrupta seguida por uma diminuição gradual.
A súbita perda de eletricidade residencial tornou as redes fixas e os equipamentos de Wi-Fi domésticos (CPE) inutilizáveis, obrigandoos utilizadores a recorrer às redes móveis e desencadeando um aumento massivo de tráfego que exerceu uma pressão intensa sobre a capacidade, em especial nas áreas urbanas. Isto refletiu-se numa rápida degradação do desempenho das redes móveis em todas as métricas, conforme ilustrado na análise dos dados Speedtest Intelligence® publicada na nossa investigação anterior.
O aumento súbito da procura na infraestrutura móvel do país ocorreu precisamente quando as operadoras estavam a correr para implementar medidas agressivas de poupança de energia para prolongar a duração da energia de reserva nos sites móveis. Esses esforços incluíram o desligamento faseado do 5G (já que os rádios MIMO de 3,5 GHz normalmente consomem duas a três vezes a potência de um setor 4G de baixa frequência), priorizando os principais serviços de voz e texto e reduzindo a potência de transmissão de ponta das células quando as cargas de rede eram baixas.
O apagão produziu uma curva de falha composta por um grande salto (DIGI) sobreposto a vários picos distintos (Vodafone, NOS e MEO)
Embora todos os operadores móveis em Portugal tenham implementado medidas semelhantes de poupança de energia durante o apagão, o grau e a distribuição da autonomia energética da infraestrutura de rede de cada operador, incluindo a infraestrutura parcialmente partilhada entre a NOS e a Vodafone, acabaram por moldar a resiliência das suas redes. Isso é evidente nas trajetórias distintas de falhas reveladas pela análise dos dados de monitorização passiva de sinal, que indicam se um dispositivo conseguia ligar-se a uma das redes (2G, 3G, 4G ou 5G), com base numa amostra ampla e geograficamente diversificada de todo o território português.
A rede ainda em fase inicial da DIGI, com uma cobertura mais limitada e fortemente concentrada em áreas urbanas (o que torna a implantação da autonomia de energia mais difícil em infraestruturas no topo de edifícios), revelou-se particularmente frágil. Quatro horas após o colapso da rede elétrica, a percentagem de assinantes da sua rede sem qualquer sinal disparou de menos de 0,1 % para mais de 90 %, um colapso abrupto e generalizado, típico de um corte súbito. Toda a infraestrutura de rádio da operadora parece ter desaparecido quase em simultâneo, impulsionada por baterias de curta duração ao nível dos sites e com pouca redundância em camadas superiores. Além disso, o acesso à rede permaneceu severamente comprometido por mais de um dia, apontando provavelmente para uma falha catastrófica de elementos mais profundos, como o Evolved Packet Core (EPC) em Lisboa, que pode ter carecido de redundância geográfica ou de autonomia energética suficiente.
Embora a curva de falhas da Vodafone não tenha apresentado o mesmo perfil de queda abrupto como a DIGI, seguindo mais uma forma triangular, ainda assim atingiu um pico muito acentuado. A distribuição heterogénea da autonomia energética na rede em toda a área de cobertura da Vodafone produziu uma curva de sobrevivência em várias etapas, com cada faixa de autonomia a esgotar-se (por exemplo, locais de rede com baterias de quatro horas) a provocar um novo ressalto visível na trajetória do apagão.
Por volta das 19h30, hora local, quase 70 % dos assinantes da Vodafone estavam sem serviço, à medida que as últimas reservas de energia de apoio começaram a esgotar-se antes do restabelecimento da rede elétrica. Embora este valor seja significativamente inferior aos mais de 90 % de perda de serviço verificados na rede da DIGI em Portugal, representava quase o dobro do pico de interrupção registado por qualquer operador em Espanha no dia 28 de abril. O serviço, contudo, foi rapidamente restabelecido na rede da Vodafone a partir das 20h00, seguindo uma sequência geográfica faseada, em consonância com a reposição da rede elétrica, com a taxa de ausência de serviço a cair para menos de 5 % à meia-noite.
Ao contrário de outros operadores em Portugal, a Vodafone e a NOS partilham extensivamente a RAN, uma joint venture que possui e opera infraestruturas partilhadas ativamente em áreas rurais e do interior, enquanto nas zonas urbanas as infraestruturas são partilhadas de forma passiva. Apesar disso, o perfil de interrupções da NOS foi notavelmente menos grave. Isto indica que a rede da NOS apresenta uma resiliência energética relativamente maior nos locais onde a sua infraestrutura não é ativamente partilhada, em comparação com os geridos de forma independente pela Vodafone. Na rede da NOS, a proporção de subscritores sem serviço atingiu um pico precoce de quase 30 %, assemelhando-se de perto ao perfil de impacto do operador mais afetado em Espanha, mantendo-se neste nível até a energia ser restabelecida.
Os méritos das reservas de baterias amplas e profundamente distribuídas na atenuação e no adiamento da curva de falhas (de forma semelhante às máscaras e vacinas na contenção da propagação de infeções durante uma pandemia) ficaram claramente demonstrados no caso da MEO. O pico da interrupção foi menor e a retoma mais rápida, com a proporção de assinantes sem serviço a atingir um pouco mais de 16 %, o melhor desempenho observado em toda a Península Ibérica no dia 28 de abril.
A experiência do apagão demonstra o papel da autonomia energética e da geo-redundância no reforço da resiliência da infraestrutura das telecomunicações face a choques externos
Quando a rede elétrica colapsou, todos os operadores portugueses tentaram a mesma primeira alavanca: desligar a camada de 5G, intensiva em consumo energético. Mas a partir daí, os caminhos divergiram. A extensão e a robustez da autonomia energética de cada operador (ao nível das infraestruturas) e o grau de geo-redundância (ao nível do núcleo), juntamente com a capacidade de cascatear camadas em bandas inferiores, limitar o tráfego e reconfigurar o espectro, ditaram quanto da sua rede permaneceu operacional, e durante quanto tempo, durante o apagão.
A acentuada assimetria nos impactos do apagão observada entre as bases de clientes dos diferentes operadores realça a necessidade urgente de reforçar as redes móveis e elevar todos os níveis da infraestrutura a um patamar mais robusto de resiliência, em antecipação a futuros eventos graves. Existe um consenso alargado, que se prevê que venha a ser consagrado no futuro Digital Networks Act (DNA) da Comissão Europeia, de que as redes de telecomunicações são infraestruturas críticas essenciais para o funcionamento da sociedade, e que mesmo interrupções breves do serviço podem rapidamente transformar-se em riscos sérios para a segurança pública.
Ookla retains ownership of this article including all of the intellectual property rights, data, content graphs and analysis. This article may not be quoted, reproduced, distributed or published for any commercial purpose without prior consent. Members of the press and others using the findings in this article for non-commercial purposes are welcome to publicly share and link to report information with attribution to Ookla.
Luke Kehoe leads Ookla’s research and thought leadership efforts in Europe.
An electronic engineering alumnus of University College Dublin, Luke has extensive experience collaborating with mobile operators, telecoms vendors, and government agencies in research and advisory roles across Europe. He has contributed to internationally recognised thought leadership publications in areas such as 5G, IoT, open RAN, and edge computing, working with prestigious organisations like the Telecom Infra Project and the World Economic Forum.
Reliability-led differentiation hinges on low-band reach, mid-band density, and diversified core interconnects
Portugal’s mobile operators are on the defensive as DIGI scales its low-cost, flexible offers. With aggressive pricing across converged bundles that undercut the market by a wide margin, the Romanian disruptor is compressing margins at the value end, driving elevated churn and forcing operators to raise retention opex through cheaper flanker brands and shorter contract terms.
By choosing a rapid greenfield own-build rather than a national roaming agreement, DIGI has kept competition price-led rather than coverage-led. This has elevated network reliability as the established operators’ principal strategic moat and encouraged them to leverage their more mature infrastructure across Portugal as a core differentiator. The Iberian grid blackout earlier this year underscored the point: limited power autonomy and weak geo-redundancy in a greenfield network stack contributed to markedly poorer resilience outcomes, as revealed by first-of-its-kind analysis of background signal scans using Ookla® data.
The established operators’ are now seeking to copper-fasten their resilience and reliability credentials through heavy capital spending on network modernization, focused on diversifying spectrum use for more capable carrier aggregation, commercializing 5G Standalone (SA), and densifying the grid footprint.
To quantify how the network reliability race is unfolding in Portugal’s mobile market, we independently measured performance using RootMetrics’ controlled methodology on the latest Samsung flagship handsets. Testing in 1H 2025 covered indoor and outdoor locations across Lisbon, Porto, Madeira, the Azores, and an extensive national route. Combining walk and drive testing in high-usage areas, we covered more than 9,500 km and collected nearly 110,000 samples, including 146 indoor sites. The methodology is designed to mirror real-world network performance.
Key Takeaways:
MEO and Vodafone lead Portugal in network reliability. MEO prioritizes a wide, contiguous mid-band layer almost everywhere, underpinned by extensive low-band coverage. This yields the highest access and task success on the national route and the fastest call setup times in Portugal, as well as driving its Best 5G award based on Speedtest® data in 1H 2025. Vodafone, for its part, tops access latency and video task reliability in Lisbon and Porto, helped by advanced use of carrier aggregation, a deep low-band layer, and well-peered core paths.
NOS reaps a first-mover advantage from its expanding 5G SA footprint. The operator’s 5G SA deployments remain heavily urban-weighted, with 56% of Lisbon samples on the new core architecture versus 9% on the national route. Its strategy is to deploy 5G SA where there is dense mid-band (3.5 GHz) and carrier aggregation, and to fall back to NSA and low-band spectrum (700 MHz) elsewhere. The latency benefits of moving to the 5G core are validated by NOS’s leading video start times and access latency nationally.
DIGI’s network is mid-band-centric on narrow spectrum with limited carrier aggregation. The early-stage profile of the rollout is evident in its disproportionate reliance on the 2.6 GHz band and the absence of a low-band layer, which constrains coverage reach and increases handover exposure, weighing on network reliability. It does, however, deliver strong 5th percentile performance and national call setup times that are competitive with leader MEO, yet its time on 5G remains materially below the incumbents in every geography tested.
Regional network performance disparities persist in Portugal. Performance is poorer on Madeira and in the Azores because radio grids are sparser and rely more on low-band spectrum to span difficult terrain, so devices see fewer mid-band carriers and less carrier aggregation. Lower time on 5G leads to more frequent moves between network generations, increasing the risk of late handovers and task failures. Core breakout and peering are also less distributed, so traffic often routes via longer paths to mainland gateways, adding delay at busy times.
Network reliability challenges operators to optimize networks across RAN and core layers
MEO and Vodafone Lead in Network Reliability across Portugal
RootMetrics® | 1H 2025
To compare, in a scientifically robust way, how operators’ network investments translate into reliability in Portugal, RootMetrics’ controlled testing asks a simple question: when a user starts a task, does it complete without failing? Tens of thousands of “connect and complete” tests spanning calls, data uploads and downloads, and texts are conducted across varied routes and locations, then aggregated into a single Reliability score. The score is weighted toward data (75%), including calls (20%) and texts (5%) to reflect today’s real-world usage patterns.
The methodology rewards successful starts and uninterrupted completion and penalizes blocks, drops, and timeouts. Since each test follows the full path from device to radio to core to service edge, the results reflect end-to-end robustness rather than any single parameter:
Call Reliability (20% overall weight): This measures voice connection stability. It assigns more weighting to blocking (user presses call and the network refuses or never sets it up) over dropping (the call starts but ends unexpectedly), because initial failures tend to disrupt user intent more profoundly.
Blocking often rises during load spikes when signalling or media resources are exhausted at busy venues or during emergencies. Dropping usually increases with poor radio conditions and handover problems, for example low SINR and coverage gaps in rural areas.
Data Reliability (75% overall weight): This measures whether devices can establish a secure, usable data path (access success) and complete common transfers (task success) without stalls or timeouts. It covers both download and upload under light tasks such as webpage loads and heavier tasks such as file transfers, rewarding successful setup and uninterrupted completion and penalizing setup failures, timeouts, and mid-flow resets.
Even in cases where users see full signal bars on their device, data reliability components like task success can decline due to factors like packet loss and TCP resets (e.g., at a busy stadium) or poor mid-transfer handover (e.g., while on a high-speed train).
Text Reliability: (5% overall weight): This measures the ability to send and receive texts consistently, both within the same operator and across operators.
While text performance is usually robust, it can fail during incidents that span interconnect outages, misrouted numbering, spurious anti-spam filtering or queue backlogs.
Analysis of the controlled testing data in Portugal reveals the most reliable networks consistently combine adequate mid-band capacity to keep the median user out of congestion, meaningful use of low-band spectrum to lift access and task success at the cell edge and indoors, and tight integration between core and radio layers that keeps call setup fast and access latency low.
DIGI’s greenfield buildout gathers pace as established operators focus on RAN modernization and grid densification
DIGI’s commercial launch in Portugal in November 2024 has triggered a flurry of defensive moves by the country’s established operators. Confronted with a sharp rise in churn and renewed ARPU pressure, they have pushed more aggressive retention offers and leaned on low-cost flanker brands. DIGI’s disruptive model has reset reference pricing for entry-level mobile and convergent bundles. Even where rivals have not matched the headline tariffs, their flanker brands now cluster around €8 to €15 for 100 GB tiers to compete with DIGI’s eye-catching plans from as little as €4 for 50 GB, as well as seeking to limit cannibalization of their core brands.
Analysis of ANACOM data on subscriptions and site counts show DIGI’s rise has been exceptional. By Q1 2025 it already held over 3% of mobile internet subscriptions and rolled out 2,385 5G sites. With no national roaming and no low-band spectrum, it has concentrated capex on rapid coverage, densifying urban and suburban grids to compete on performance and offset the less favourable propagation of its mid-band holdings.
Vodafone and NOS Feature Largest 5G Site Footprint in Portugal
ANACOM | Q1 2025
The maturity of the established operators’ infrastructure, and the imperative to defend their network performance moat, puts them at a very different point in the 5G investment cycle to DIGI. MEO, for example, is partway through a multi-year RAN modernization and swap to Nokia, diverting capex into replacing legacy equipment and lifting performance and energy efficiency across its footprint.
NOS and Vodafone, which share mobile infrastructure under a MORAN arrangement (no spectrum sharing) in rural and interior areas to lower site costs and deepen rural coverage, have built leading 5G footprints after earlier, front-loaded expansion capex. NOS in particular has sought to differentiate through early 5G SA commercialization, marketing its Nokia-supplied 5G core as “5G+” and touting higher uplink speeds, lower latency, and better device battery life. MEO has since followed suit and deployed 5G SA atop its 3.5 GHz sites.
Mid-band depth and a 700 MHz underlay puts MEO at the frontier of network access and task success nationally
MEO’s relatively smaller 5G site footprint has driven a focus on efficient spectrum use over sheer volume as it ramps up site expansion (30% increase in 5G site count over the last year, the fastest rate of any operator in the period). Its balanced strategy leans on mid-band capacity with low-band for coverage extension. MEO recorded the highest share of 3.5 GHz (n78) usage in every geography in testing, operating a wide 90 MHz channel nationally. The contiguous mid-band block is the most extensively deployed in Portugal, with more than two-thirds of national route samples using it, 76-80% the islands, and 88% in Lisbon.
Outside dense urban areas like Lisbon and Porto, the operator makes extensive use of the 700 MHz (n28) band as a coverage layer. Nationally, roughly one-third of 5G samples were on 5 MHz of 700 MHz, while Lisbon’s 700 MHz share fell below 10% and the islands sat between 20 and 22%. This strategy maximizes mid-band time-on-air and keeps modulation high for the median user while preserving coverage probability at the edge, which reduces access failures and video stalls.
Because its low-band channel is narrower than rivals (Vodafone and NOS use 10 MHz), its overall 5G site footprint is smaller, and its spectrum mix beyond 700 MHz and 3.5 GHz is limited, with little carrier aggregation and sparse use of 2.1 GHz, devices on MEO’s network spend less time on 5G than those on Vodafone and NOS.
MEO Leads on Call Setup Times, while Vodafone Features Lowest Call Drop Rate
RootMetrics® | 1H 2025 – National Route
Despite this, MEO co-led reliability on the national route, delivering the highest access and task success and the fastest call setup at about 1.8 seconds. Madeira showed the same pattern, with MEO leading on access and task success, best call setup, and top overall reliability. In Lisbon and Porto, MEO was neck and neck with Vodafone on access and task success, and slightly ahead on call drop rate in the capital. The takeaway is that a higher share of time on 5G (enjoyed by Vodafone and NOS thanks to a larger 5G site footprint) and greater use of carrier aggregation does not automatically translate into a more consistent network experience.
Intensive use of carrier aggregation drives spectrum diversity across Vodafone’s site footprint
By Q4 2024, Vodafone’s extensive 5G site footprint placed it alongside NOS for time spent on 5G. In the testing, 84% of Vodafone samples were based on 5G nationally, compared with 66% for MEO and 27% for DIGI. Vodafone’s network profile closely mirrors NOS’s even in passively shared urban areas outside the regions where the pair engage in active sharing, with both showing intensive use of carrier aggregation. Vodafone, unlike NOS, still lacks a 5G SA footprint.
The operator combines its contiguous 700 MHz (10 MHz) and 3.5 GHz (90 MHz) holdings through dual-carrier aggregation (2CC), creating a potent 100 MHz aggregated capacity layer. The 3.5 GHz width matches MEO’s but is 10 MHz narrower than NOS’s. Across the national route, 2CC featured in just over one fifth of 5G samples, rising to a remarkable two-thirds of all samples in Lisbon and Porto. On the islands, where the grid is sparser, testing shows that Vodafone favours a balanced split between 700 MHz and 3.5 GHz for 5G with limited use of carrier aggregation.
Different 5G Spectrum Playbooks: Meo Prioritizes 3.5 GHz, NOS and Vodafone Leverage Carrier Aggregation
RootMetrics® | 1H 2025 (Observed Spectrum Use and Bandwidth, National Route)
Vodafone’s advanced use of 2CC lifts both peak and median performance, and it performs the strongest of all operators at the tail (5th percentile) nationally. This points to fair airtime sharing through effective resource scheduling and strong link adaptation that consistently selects the best modulation and coding, so performance at the cell edge or in busy cells holds up even when carrier aggregation is limited.
These outcomes translate into strong reliability. Vodafone jointly led overall network reliability with MEO in testing and led outright in the Azores, recording the lowest dropped call rate on the national route. In Lisbon and Porto, Vodafone delivered the best access latency and ranked first or joint first for video reliability, demonstrating that optimizations beyond deploying an SA core, such as short core paths and close CDN proximity, can drive strong results.
Early 5G SA underpins NOS’s lead in network responsiveness
Thetesting revealed that NOS features the most advanced network configuration in Portugal, combining a large and growing 5G SA footprint with the broadest range of carrier aggregation combinations. It also operates the largest 5G site grid, nearing 4,800 sites by Q4 2024, which put it neck and neck with Vodafone for time spent on 5G nationally at 84%.
Like Vodafone, NOS pairs a wide mid-band allocation (100 MHz at 3.5 GHz) with low-band spectrum (10 MHz at 700 MHz) and applies aggressive carrier aggregation across both NSA and SA. In Lisbon, 2CC was observed on 59% of samples, delivering the highest capacity configuration of any operator in Portugal at 110 MHz of aggregated spectrum, thanks to the wider mid-band block. On the national route, 2CC appeared in 20% of samples. Notwithstanding this, NOS showed a notably lower use of the 3.5 GHz band on the national route, at 32% of samples, compared with Vodafone at 37% and MEO at 67.6%.
NOS’s first mover advantage in 5G SA is translating into superior access responsiveness and faster video starts in cities. In Lisbon, 94% of samples were on 5G and 56% on SA, delivering the quickest video start at about 530 ms; in Porto it again posted the quickest start at about 540 ms. Outside dense areas, where SA represents only 9% of 5G usage on the national route, NOS still led these metrics, indicating disciplined core routing with clean CDN peering (traffic exiting core close to the user) and a fast, low-latency scheduler that delivers a quick first byte regardless of SA.
Low-band absence drives DIGI to maximize mid-band buildout
DIGI’s greenfield buildout has had to do more with less. Lacking 700 MHz spectrum to anchor a wide-area 5G layer, it has leaned heavily on mid-band assets, which drives more frequent 4G fallback and patchier 5G access indoors and in rural areas. In testing, only 27% of samples on the national route were on DIGI’s 5G network (and only 16% in the Azores and 21% on Madeira), rising to 48% in Lisbon, highlighting the urban skew of its initial rollout.
The operator’s mid-band 5G deployments are concentrated on relatively narrow TDD carriers rather than a single wide 3.5 GHz channel, reflecting the limits of a non-contiguous assignment. DIGI’s two 3.5 GHz carriers are separated by 40 MHz: it initially held one 40 MHz block from the 2021 award and received another from NOWO earlier this year, while Dense Air retains spectrum between them. Carrier aggregation can soften some drawbacks of a split 3.5 GHz allocation, but there remains an inherent efficiency and device support gap for NR intra-band CA versus a single wide carrier, which is less favourable from an RF engineering perspective.
NOS and Vodafone Boast Advanced Carrier Aggregation Depth in Lisbon
RootMetrics® | 1H 2025 (Observed Network Architecture Share, Lisbon)
In Lisbon, about 98% of DIGI’s 5G samples were based on a 20 MHz block of 2.6 GHz (n41) spectrum. On the national route, its mix split more evenly across 3.5 GHz (mostly a 40 MHz n78 configuration, less than half the width of other operators’ n78 assignments) and 2.6 GHz (20 MHz in each of the n38 and n41 bands). It has deployed the 3.5 GHz band more extensively in Porto than in Lisbon, with 37% of time spent on that spectrum in the former.
The nascent nature of DIGI’s greenfield buildout is reflected in its trailing peers on overall network reliability in testing, with lower network access and task success rates across all regions. While it already shows strong performance in call setup time (joint-best with MEO), poor outcomes in call drop rate (behind peers) indicate that factors such as a sparse 5G anchor and handover instability continue to pull down performance.
Conclusion: No one-size-fits-all in the race for network reliability in Portugal
The diversity in spectrum assignments (frequencies, bandwidths, and contiguity), subscriber base profiles (size, location, and traffic demand), and network investment cycles (greenfield buildout, vendor swap, or simple RAN refresh) means Portugal’s operators must pull different levers in their pursuit of competitive differentiation through network reliability. Despite these differences, all operators share an emphasis on low-band coverage for reach, mid-band capacity for depth, diverse and robust core interconnections, and strategic CDN placement
MEO and Vodafone’s lead in overall network reliability stems from distinctly different approaches, with MEO leveraging aggressive deployment of a wide 3.5 GHz block nearly everywhere, while Vodafone applies advanced carrier aggregation selectively, highlighting that no single strategy fits all in the quest for superior reliability. Likewise, NOS’s early rollout of 5G SA is enhancing latency-sensitive performance, and DIGI is delivering strong initial results in metrics like call setup time.
Novo concorrente impulsiona uma corrida à fiabilidade de rede no mercado móvel português
A diferenciação baseada na fiabilidade assenta no alcance em faixa baixa, na densidade em faixa média e em interligações diversificadas no core
Os operadores móveis em Portugal encontram-se na defensiva à medida que a DIGI expande as suas ofertas de baixo custo e elevada flexibilidade. Com uma política de preços agressiva em pacotes convergentes que reduzem significativamente o valor médio de mercado, o operador romeno está a comprimir as margens no segmento de valor, a aumentar a rotatividade de clientes e a obrigar os operadores a reforçar os gastos operacionais de retenção através de marcas secundárias mais baratas e contratos de menor duração.
Ao optar por uma rápida construção de rede própria em vez de um acordo de roaming nacional, a DIGI manteve a concorrência centrada no preço e não na cobertura. Isso elevou a fiabilidade da rede ao estatuto de principal trunfo estratégico dos operadores estabelecidos, incentivando-os a tirar partido das suas infraestruturas mais maduras em todo o país como elemento diferenciador central. O apagão da rede ibérica ocorrido no início deste ano veio sublinhar esta realidade: a autonomia energética limitada e a fraca redundância geográfica de uma rede recém-construída contribuíram para resultados de resiliência significativamente inferiores, conforme demonstrado por uma análise inédita de varrimentos de sinal de fundo com base em dados da Ookla®.
Os operadores estabelecidos procuram agora cimentar as suas credenciais de resiliência e fiabilidade através de forte investimento de capital na modernização da rede, com foco na diversificação do uso de espectro para uma agregação de portadoras mais capaz, na comercialização do 5G Standalone (SA) e na densificação da malha de cobertura..Para quantificar como está a evoluir a corrida à fiabilidade de rede no mercado móvel português, medimos de forma independente o desempenho das redes utilizando a metodologia controlada da RootMetrics, com os mais recentes modelos topo de gama da Samsung.. Os testes realizados no primeiro semestre de 2025 abrangeram locais interiores e exteriores em Lisboa, Porto, Madeira, Açores e uma extensa rota nacional. Combinando testes em caminhada e condução em zonas de elevada utilização, cobrimos mais de 9.500 km e recolhemos cerca de 110.000 amostras, incluindo 146 locais interiores. A metodologia foi concebida para reproduzir o desempenho real das redes.
Principais conclusões:
A MEO e a Vodafone lideram em fiabilidade de rede em Portugal. A MEO privilegia uma camada de banda média ampla e contínua quase em todo o território, sustentada por uma cobertura extensiva em banda baixa. Este equilíbrio proporciona as melhores taxas de acesso e de sucesso de tarefas na rota nacional, os tempos de estabelecimento de chamadas mais rápidos do país e fundamenta o seu prémio de “Melhor 5G” com base em dados Speedtest no primeiro semestre de 2025.
A Vodafone, por sua vez, lidera em latência de acesso e fiabilidade em tarefas de vídeo em Lisboa e no Porto, beneficiando de um uso avançado de agregação de portadoras, de uma camada profunda de banda baixa e de percursos de núcleo bem interligados.
A NOS colhe uma vantagem de pioneiro com a expansão da sua rede 5G SA. As implementações de 5G SA do operador permanecem fortemente concentradas em meio urbano, com 56% das amostras em Lisboa já sobre a nova arquitetura de núcleo, contra 9% na rota nacional. A estratégia passa por ativar o 5G SA onde existe densidade de banda média (3,5 GHz) e agregação de portadoras, recorrendo ao 5G NSA e à banda baixa (700 MHz) nas restantes zonas. Os ganhos de latência decorrentes da migração para o novo núcleo são comprovados pelos melhores tempos de início de vídeo e menor latência de acesso registados pela NOS a nível nacional.
A rede da DIGI é centrada na banda média, com espectro limitado e agregação reduzida. O caráter inicial do seu desenvolvimento é evidente na dependência desproporcionada da faixa dos 2,6 GHz e na ausência de uma camada de banda baixa, o que restringe o alcance de cobertura e aumenta a exposição a transições entre células, penalizando a fiabilidade da rede. Ainda assim, apresenta um desempenho sólido no quinto percentil e tempos de estabelecimento de chamadas a nível nacional competitivos face à líder MEO, embora o tempo em 5G permaneça significativamente inferior ao dos operadores incumbentes em todas as geografias testadas.
Persistem disparidades regionais de desempenho de rede em Portugal. O desempenho é inferior na Madeira e nos Açores devido a redes rádio mais dispersas e maior dependência de espectro de banda baixa para cobrir terrenos difíceis, o que resulta em menor presença de portadoras de banda média e menos agregação. O menor tempo em 5G conduz a transições mais frequentes entre gerações de rede, aumentando o risco de falhas de transição e de tarefas. A distribuição limitada dos pontos de interligação do núcleo também implica que o tráfego seja frequentemente encaminhado por percursos mais longos até gateways no continente, o que acarreta atrasos em períodos de maior utilização.
A fiabilidade de rede obriga os operadores a otimizar as redes nas camadas RAN e Núcle
MEO and Vodafone Lead in Network Reliability across Portugal
RootMetrics® | 1H 2025
Para comparar, de forma cientificamente rigorosa, de que modo os investimentos dos operadores se traduzem em fiabilidade em Portugal, a metodologia controlada da RootMetrics coloca uma questão simples: quando o utilizador inicia uma tarefa, esta conclui-se sem falhar?
São realizados dezenas de milhares de testes “conectar e concluir”, abrangendo chamadas, transferências de dados e mensagens de texto em diferentes percursos e locais, agregados depois num único índice de Fiabilidade. Este índice atribui maior peso aos dados (75%), incluindo chamadas (20%) e mensagens (5%), refletindo os padrões de utilização atuais.
A metodologia recompensa inícios bem-sucedidos e conclusões sem interrupções, penalizando bloqueios, quedas e falhas de tempo limite. Como cada teste cobre o percurso completo — do dispositivo à rádio, ao núcleo e até à extremidade do serviço —, os resultados refletem a robustez de ponta a ponta e não apenas um parâmetro isolado.
Fiabilidade de Chamadas (peso de 20% no total): Mede a estabilidade das ligações de voz, atribuindo maior peso aos bloqueios (quando o utilizador tenta ligar e a rede não responde ou não estabelece a chamada) do que às quedas (quando a chamada inicia, mas termina inesperadamente), dado que as falhas iniciais têm um impacto mais disruptivo na experiência do utilizador.
Os bloqueios tendem a aumentar durante picos de carga, quando os recursos de sinalização ou de media se esgotam em locais muito movimentados ou durante emergências. As quedas, por sua vez, são mais frequentes em zonas com más condições rádio ou falhas de transição entre células, como em áreas rurais.
Fiabilidade de Dados (peso de 75% no total): Avalia se os dispositivos conseguem estabelecer uma ligação de dados segura e utilizável (sucesso de acesso) e concluir transferências comuns (sucesso de tarefa) sem interrupções ou falhas. Inclui tanto downloads como uploads, desde tarefas leves (carregamento de páginas) até transferências mais exigentes, recompensando a conclusão sem falhas e penalizando falhas de configuração, interrupções ou reinícios.
Mesmo quando os utilizadores veem barras de sinal completas, a fiabilidade pode degradar-se devido a perda de pacotes ou reinícios de TCP (por exemplo, num estádio cheio) ou a falhas de transição durante transferências em movimento (como em comboios de alta velocidade).
Fiabilidade de SMS (peso de 5% no total): Mede a capacidade de enviar e receber mensagens de texto de forma consistente, tanto dentro da mesma rede como entre operadores diferentes.
Embora o desempenho neste indicador seja geralmente robusto, podem ocorrer falhas em casos de interrupções de interligação, erros de encaminhamento numérico, filtros anti-spam indevidos ou congestionamento de filas.
A análise dos dados de testes controlados em Portugal revela que as redes mais fiáveis combinam, de forma consistente, capacidade adequada em banda média para evitar congestionamentos, utilização significativa de espectro de banda baixa para melhorar o acesso e o sucesso de tarefas nas extremidades de célula e em interiores, e integração apertada entre as camadas núcleo e rádio, garantindo tempos rápidos de estabelecimento de chamadas e latência reduzida no acesso.
A expansão da rede própria da DIGI ganha ritmo enquanto os operadores estabelecidos apostam na modernização da RAN e na densificação da rede
O lançamento comercial da DIGI em Portugal, em novembro de 2024, desencadeou uma série de movimentos defensivos por parte dos operadores móveis estabelecidos. Perante um aumento acentuado da rotatividade de clientes e uma renovada pressão sobre o ARPU, estes responderam com ofertas de retenção mais agressivas e maior dependência de marcas secundárias de baixo custo. O modelo disruptivo da DIGI redefiniu a referência de preços para os pacotes móveis e convergentes de entrada. Mesmo onde os concorrentes não igualaram as tarifas de destaque, as suas marcas flanqueadoras posicionam-se agora entre os 8 e 15 euros para planos de 100 GB, de modo a competir com as propostas atrativas da DIGI — que começam nos 4 euros por 50 GB —, procurando simultaneamente limitar a canibalização das suas marcas principais.
A análise dos dados da ANACOM sobre assinaturas e número de sites mostra que a ascensão da DIGI tem sido excecional. No primeiro trimestre de 2025, já detinha mais de 3% das subscrições de internet móvel e havia implantado 2.385 sites 5G. Sem roaming nacional e sem espectro em banda baixa, concentrou o investimento de capital em cobertura rápida, densificando as redes urbanas e suburbanas para competir em desempenho e compensar a menor propagação das suas frequências em banda média.
Vodafone and NOS Feature Largest 5G Site Footprint in Portugal
ANACOM | Q1 2025
A maturidade das infraestruturas dos operadores estabelecidos e a necessidade de defenderem a sua vantagem em desempenho de rede colocam-nos numa fase muito distinta do ciclo de investimento em 5G face à DIGI. A MEO, por exemplo, encontra-se a meio de um processo plurianual de modernização da RAN e de substituição de equipamentos pela Nokia, canalizando investimentos para a atualização tecnológica e a melhoria da eficiência energética em toda a sua rede.
A NOS e a Vodafone, que partilham infraestrutura móvel sob um acordo MORAN (sem partilha de espectro) em áreas rurais e do interior para reduzir custos e reforçar a cobertura, consolidaram as maiores redes 5G após um investimento inicial intensivo. A NOS, em particular, procurou diferenciar-se através da comercialização antecipada do 5G Standalone (SA), promovendo o seu núcleo 5G fornecido pela Nokia sob a designação “5G+”, destacando velocidades de upload mais elevadas, menor latência e maior autonomia de bateria nos dispositivos. A MEO seguiu o mesmo caminho e implementou igualmente o 5G SA nas suas antenas de 3,5 GHz.
Densidade de cobertura de banda média e utilização da banda dos 700 MHz colocam a MEO na linha da frente do acesso e sucesso de operações
A NOS e a Vodafone, que partilham infraestrutura móvel sob um acordo MORAN (sem partilha de espectro) em áreas rurais e do interior para reduzir custos e reforçar a cobertura, consolidaram as maiores redes 5G após um investimento inicial intensivo. A NOS, em particular, procurou diferenciar-se através da comercialização antecipada do 5G Standalone (SA), promovendo o seu núcleo 5G fornecido pela Nokia sob a designação “5G+”, destacando velocidades de upload mais elevadas, menor latência e maior autonomia de bateria nos dispositivos. A MEO seguiu o mesmo caminho e implementou igualmente o 5G SA nas suas antenas de 3,5 GHz.
A menor dimensão da rede 5G da MEO tem levado a uma aposta na eficiência no uso do espectro, em vez do número de sites, ao mesmo tempo em que acelera a expansão (aumento de 30% no número de sites 5G no último ano, o crescimento mais rápido entre os operadores). A estratégia equilibrada assenta em capacidade em banda média e cobertura em banda baixa.
A MEO registou a maior utilização da faixa dos 3,5 GHz (n78) em todas as geografias testadas, operando um canal contínuo de 90 MHz a nível nacional. Este bloco de banda média é o mais amplamente implementado em Portugal: mais de dois terços das amostras da rota nacional recorreram a ele, 76–80% nas ilhas e 88% em Lisboa.
Fora dos grandes centros urbanos como Lisboa e Porto, a MEO faz uso extensivo da banda 700 MHz (n28) como camada de cobertura. A nível nacional, cerca de um terço das amostras 5G foram captadas em 5 MHz dos 700 MHz, enquanto em Lisboa a percentagem caiu para menos de 10% e nas ilhas situou-se entre 20% e 22%. Esta estratégia maximiza o tempo de utilização da banda média e mantém alta a modulação para o utilizador médio, preservando simultaneamente a probabilidade de cobertura nas extremidades das células, o que reduz falhas de acesso e interrupções em vídeo.
Por dispor de um canal de banda baixa mais estreito que o dos rivais (a Vodafone e a NOS utilizam 10 MHz), e de uma pegada 5G mais pequena e menos diversidade espectral além dos 700 MHz e 3,5 GHz, com pouca agregação de portadoras e uso limitado dos 2,1 GHz, os dispositivos na rede da MEO passam menos tempo em 5G do que nas redes da Vodafone e da NOS.
MEO Leads on Call Setup Times, while Vodafone Features Lowest Call Drop Rate
RootMetrics® | 1H 2025 – National Route
Apesar disso, a MEO partilhou a liderança de fiabilidade na rota nacional, apresentando os melhores resultados de acesso e sucesso de tarefas e o tempo de estabelecimento de chamadas mais rápido, cerca de 1,8 segundos. Na Madeira, verificou-se o mesmo padrão: liderança em acesso e sucesso de tarefas, melhor tempo de chamada e fiabilidade global superior. Em Lisboa e no Porto, a MEO esteve lado a lado com a Vodafone em acesso e sucesso de serviços ficou ligeiramente à frente na taxa de quedas de chamadas na capital. A conclusão: uma maior percentagem de tempo em 5G — como acontece com a Vodafone e a NOS — e maior uso de agregação de portadoras não se traduzem automaticamente numa experiência de rede mais consistente.
Uso intensivo de agregação de portadoras amplia a diversidade espectral na rede da Vodafone
No quarto trimestre de 2024, a ampla rede 5G da Vodafone colocou-a ao nível da NOS em termos de tempo em 5G. Nos testes, 84% das amostras da Vodafone basearam-se em 5G a nível nacional, face a 66% da MEO e 27% da DIGI. O perfil da rede da Vodafone espelha o da NOS, mesmo em áreas urbanas partilhadas passivamente, com ambas a demonstrarem um uso intensivo de agregação de portadoras (CA). A Vodafone, ao contrário da NOS, ainda não possui rede 5G SA.
A operadora combina as suas faixas contíguas de 700 MHz (10 MHz) e 3,5 GHz (90 MHz) através de agregação dupla (2CC), criando uma camada agregada de 100 MHz de capacidade. A largura dos 3,5 GHz é idêntica à da MEO e 10 MHz inferior à da NOS. Na rota nacional, a agregação 2CC foi observada em pouco mais de 20% das amostras 5G, subindo para dois terços das amostras em Lisboa e Porto. Nas ilhas, onde a rede é mais dispersa, os testes mostram uma divisão equilibrada entre 700 MHz e 3,5 GHz, com uso limitado de CA.
Different 5G Spectrum Playbooks: Meo Prioritizes 3.5 GHz, NOS and Vodafone Leverage Carrier Aggregation
RootMetrics® | 1H 2025 (Observed Spectrum Use and Bandwidth, National Route)
O uso avançado de agregação pela Vodafone eleva o desempenho tanto de pico como mediano, revelando o melhor desempenho no percentil 5 nacional. Isto reflete partilha eficiente de recursos e forte adaptação de ligação, com seleção otimizada de modulação e codificação, permitindo manter o desempenho nas extremidades das células e em áreas de maior tráfego, mesmo com agregação limitada.
Estes resultados traduzem-se em elevada fiabilidade. A Vodafone co-liderou a fiabilidade global da rede com a MEO e liderou isoladamente nos Açores, registando a menor taxa de chamadas caídas na rota nacional. Em Lisboa e Porto, apresentou a melhor latência de acesso e liderou ou partilhou a liderança em fiabilidade de vídeo, demonstrando que otimizações além da adoção do núcleo SA, como rotas curtas no core e proximidade de CDNs, podem gerar excelentes resultados.
A vantagem de pioneirismo da NOS no 5G SA reforça a capacidade de resposta da rede
Os testes revelaram que a NOS dispõe da configuração de rede mais avançada em Portugal, combinando uma extensa rede 5G SA com a maior variedade de combinações de agregação de portadoras. Opera igualmente a maior rede de sites 5G, com cerca de 4.800 locais no final de 2024, o que a colocou ao nível da Vodafone em tempo passado em 5G (84% a nível nacional).
Tal como a Vodafone, a NOS combina uma largura de banda média de 100 MHz (3,5 GHz) com 10 MHz em 700 MHz, aplicando agregação agressiva tanto em NSA como em SA. Em Lisboa, a agregação 2CC foi observada em 59% das amostras, oferecendo a maior capacidade agregada do país (110 MHz), graças ao bloco de banda média mais amplo. Na rota nacional, 2CC surgiu em 20% das amostras. Ainda assim, a NOS registou uma utilização mais baixa da banda de 3,5 GHz na rota nacional (32% das amostras) face à Vodafone (37%) e à MEO (67,6%).
A vantagem de pioneirismo da NOS no 5G SA está a traduzir-se em maior capacidade de resposta e em início de vídeo mais rápido nas cidades. Em Lisboa, 94% das amostras estavam em 5G e 56% em SA, com início de vídeo em cerca de 530 ms; no Porto, voltou a liderar, com 540 ms. Fora das zonas densas, onde o SA representa apenas 9% do uso de 5G na rota nacional, a NOS manteve a liderança nestas métricas, demonstrando roteamento eficiente no núcleo, interligação otimizada com CDNs (tráfego sai do core próximo do utilizador) e agendamento rápido e de baixa latência, garantindo resposta imediata independentemente do tipo de core.
A ausência de banda baixa leva a DIGI a maximizar a construção em banda média
A expansão da rede própria da DIGI tem sido feita com menos recursos. Sem espectro de 700 MHz para suportar uma camada 5G de grande alcance, a operadora apostou fortemente nas bandas médias, o que resulta em recuos mais frequentes para 4G e acesso 5G irregular em interiores e zonas rurais. Nos testes, apenas 27% das amostras na rota nacional estavam em 5G da DIGI (e apenas 16% nos Açores e 21% na Madeira), subindo para 48% em Lisboa, o que evidencia o carácter urbano da sua implementação inicial.
As implementações 5G da DIGI concentram-se em portadoras TDD relativamente estreitas, e não num canal único e largo em 3,5 GHz, refletindo as limitações de um licenciamento descontínuo. As duas portadoras de 3,5 GHz da DIGI estão separadas por 40 MHz: uma atribuída no leilão de 2021 e outra obtida à NOWO no início deste ano, enquanto a Dense Air mantém o espectro intermédio. A agregação de portadoras pode atenuar algumas desvantagens desta configuração dividida, mas subsiste uma lacuna de eficiência e de suporte de dispositivos face a uma portadora única mais larga, menos favorável do ponto de vista de engenharia de rádio.
NOS and Vodafone Boast Advanced Carrier Aggregation Depth in Lisbon
RootMetrics® | 1H 2025 (Observed Network Architecture Share, Lisbon)
Em Lisboa, 98% das amostras 5G da DIGI basearam-se num bloco de 20 MHz em 2,6 GHz (n41). Na rota nacional, a utilização dividiu-se de forma mais equilibrada entre 3,5 GHz (n78) — maioritariamente blocos de 40 MHz, menos de metade da largura dos concorrentes — e 2,6 GHz (n38/n41), com 20 MHz cada. A DIGI utilizou a faixa de 3,5 GHz mais extensivamente no Porto (37%) do que em Lisboa.
A natureza incipiente da rede própria da DIGI se reflete no desempenho inferior em termos de fiabilidade global, com menores taxas de acesso e de sucesso de tarefas em todas as regiões. Embora já demonstre bons resultados em tempos de estabelecimento de chamada (empatando com a MEO), as piores taxas de queda de chamadas indicam que fatores como rede 5G pouco densa e instabilidade nas transições continuam a afetar o desempenho.
Conclusão: Não existe uma solução única na corrida pela fiabilidade de rede em Portugal
A diversidade nas atribuições de espectro (frequências, larguras e contiguidade), nos perfis de clientes (dimensão, localização e procura de tráfego) e nos ciclos de investimento de rede (expansão inicial, substituição de fornecedor ou simples atualização da RAN) implica que os operadores portugueses precisam de estratégias diferenciadas para competir por meio da fiabilidade.
Apesar destas diferenças, todos partilham ênfase na cobertura em banda baixa para alcance, na capacidade em banda média para profundidade, nas interligações robustas no núcleo da rede e no posicionamento estratégico de CDNs.
A liderança da MEO e da Vodafone em fiabilidade global assenta em abordagens distintas: a MEO aposta na implantação agressiva de um bloco largo de 3,5 GHz, enquanto a Vodafone aplica agregação avançada de forma seletiva, o que prova que não existe uma estratégia única para alcançar fiabilidade superior. Da mesma forma, a NOS, com o seu desdobramentoprecoce do 5G SA, está a melhorar o desempenho em métricas sensíveis à latência, e a DIGI já alcança resultados promissores no tempo de estabelecimentode chamada.
Ookla retains ownership of this article including all of the intellectual property rights, data, content graphs and analysis. This article may not be quoted, reproduced, distributed or published for any commercial purpose without prior consent. Members of the press and others using the findings in this article for non-commercial purposes are welcome to publicly share and link to report information with attribution to Ookla.
Luke Kehoe leads Ookla’s research and thought leadership efforts in Europe.
An electronic engineering alumnus of University College Dublin, Luke has extensive experience collaborating with mobile operators, telecoms vendors, and government agencies in research and advisory roles across Europe. He has contributed to internationally recognised thought leadership publications in areas such as 5G, IoT, open RAN, and edge computing, working with prestigious organisations like the Telecom Infra Project and the World Economic Forum.