| January 12, 2025

High-Speed Hospitality: Only Half of MENA's Luxury Hotels Offer Wi-Fi with 50 Mbps or more

High-speed Wi-Fi has become essential for guest satisfaction in luxury hospitality to attract more tourists and business travelers, particularly in the Middle East and North Africa (MENA). Whether you’re a leisure traveler trying to find your next home away from home or a digital nomad looking for the ideal remote work location, this article offers insights into Wi-Fi performance in MENA’s luxury hospitality market. It also discusses how hotels can improve their Wi-Fi network and use it as a differentiator to attract and retain guests.

Key Takeaways:

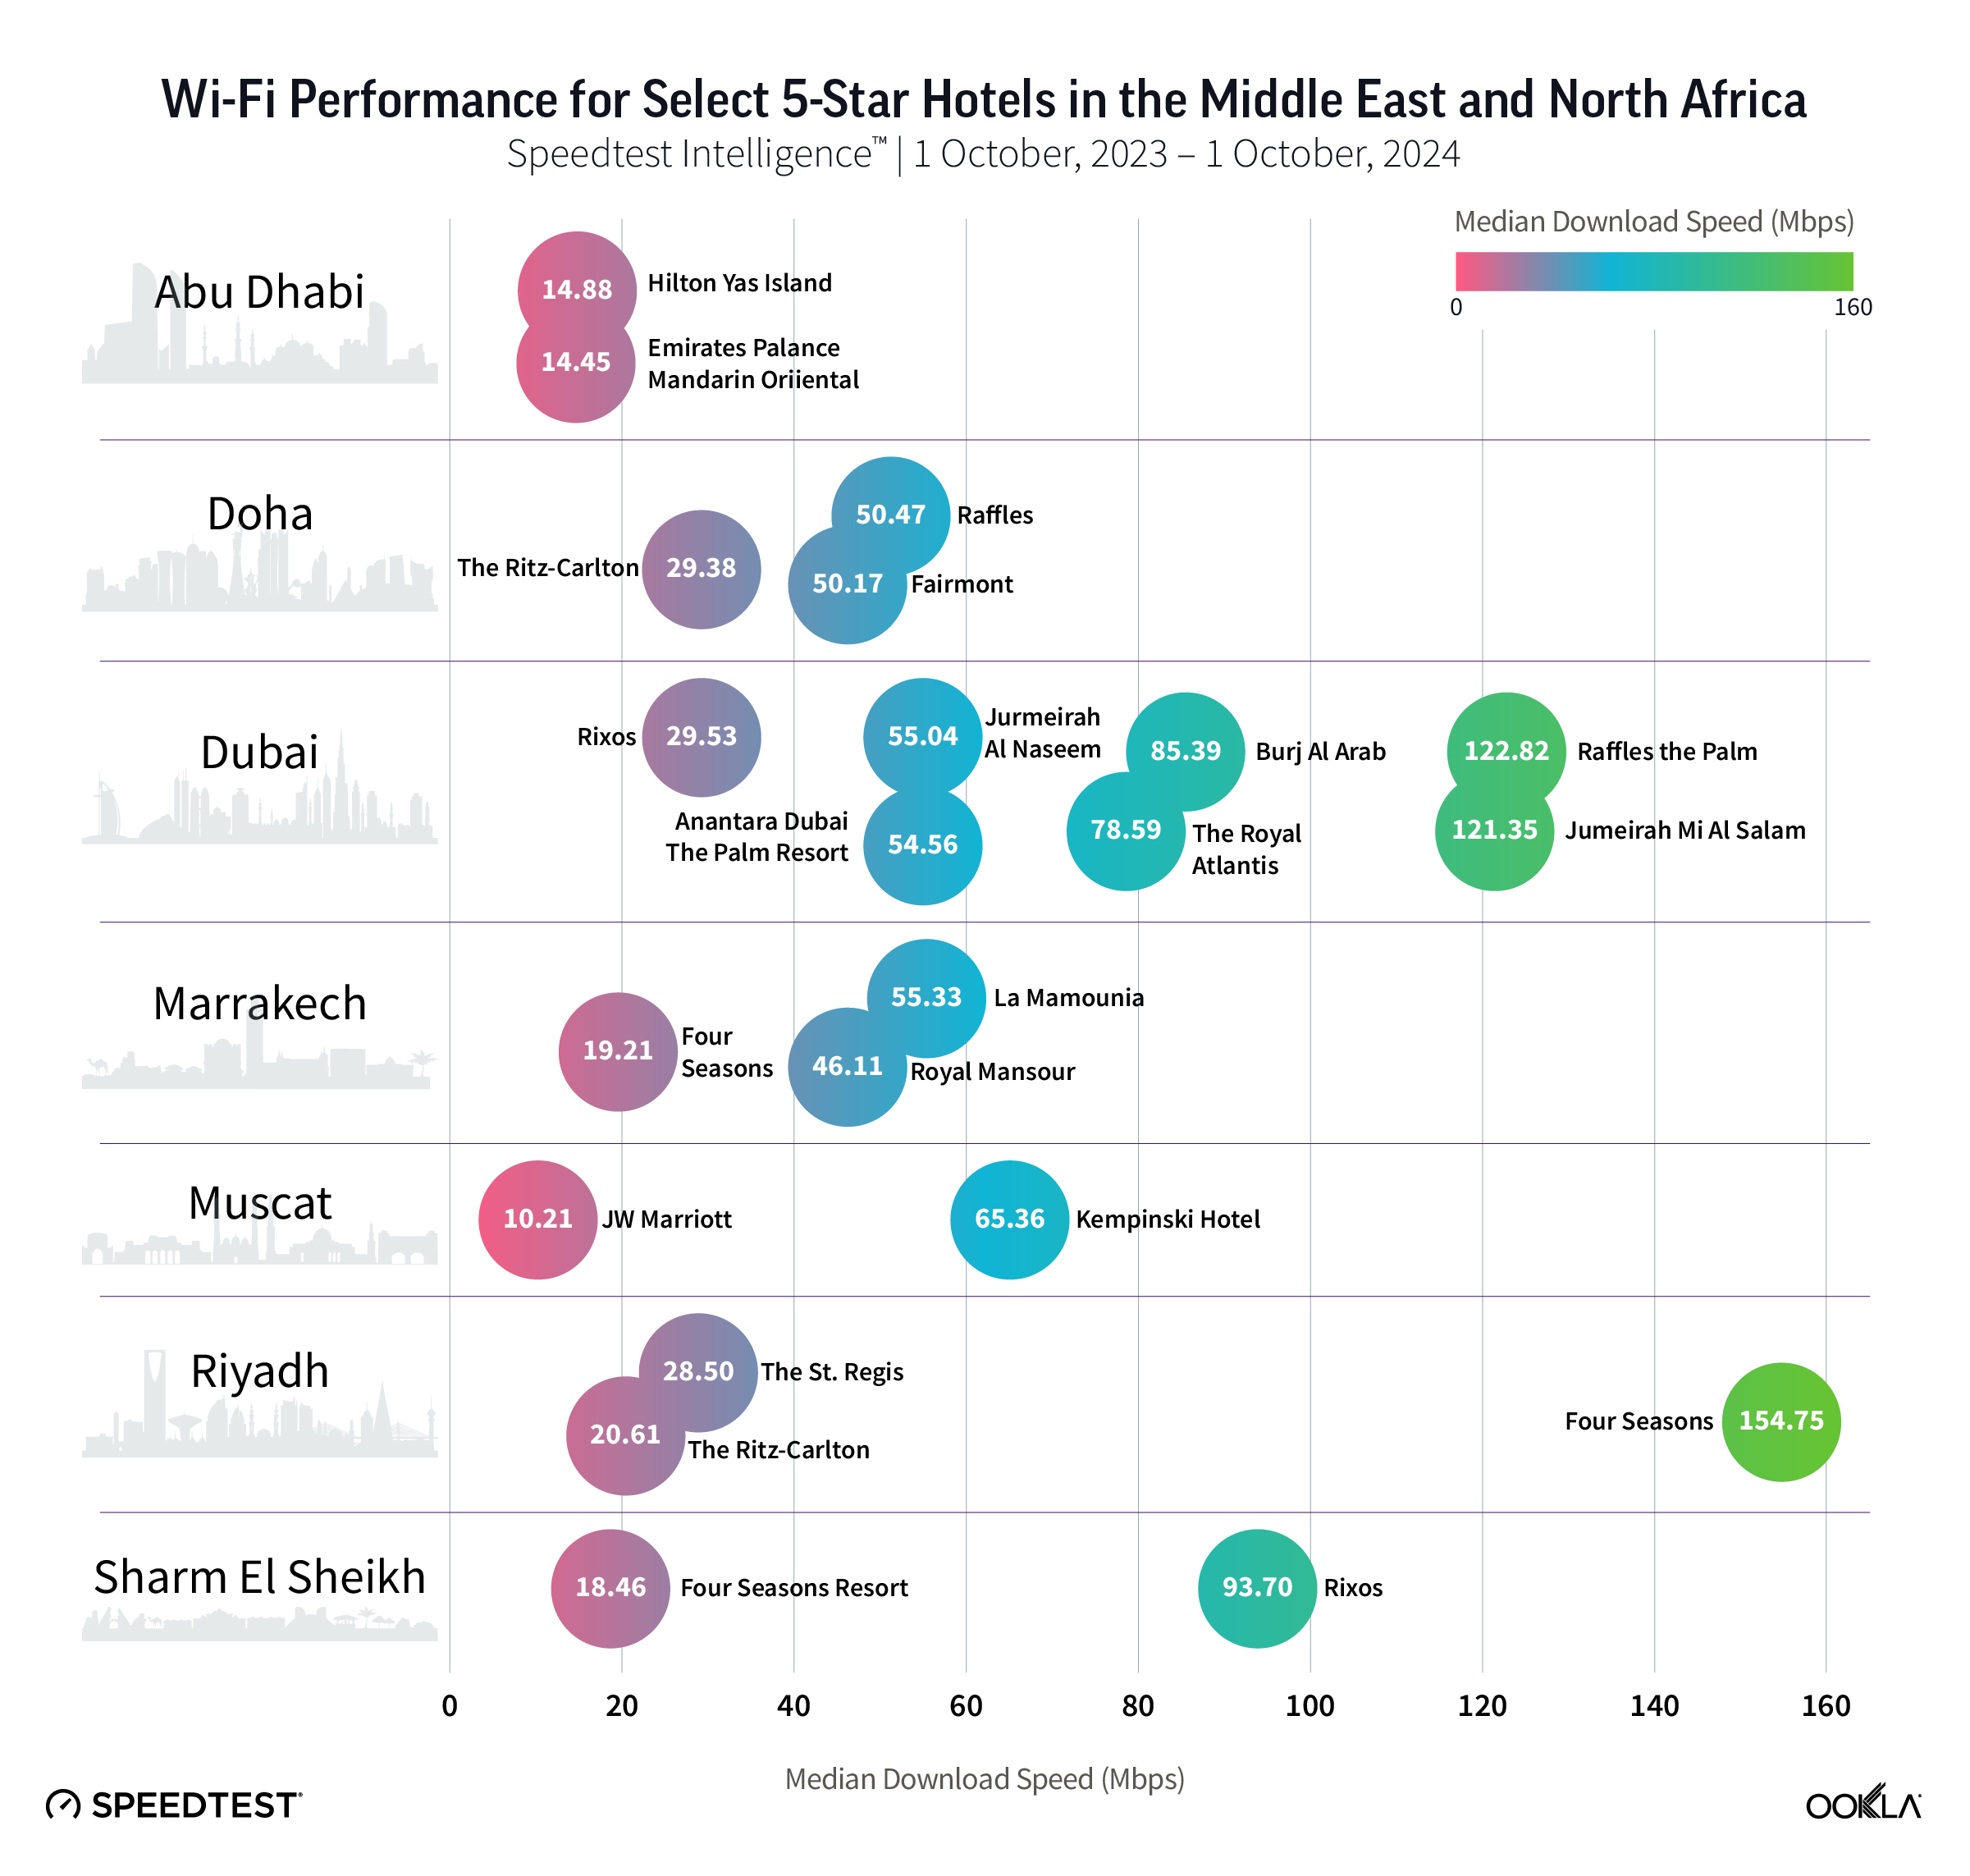
  • Luxury hotels in Riyadh and Dubai offer some of the fastest Wi-Fi in MENA. Only three of the 22 properties and resorts reviewed achieved a median download speed of over 100 Mbps between October 2023 and October 2024. They include Four Seasons in Riyad, with a median speed of 154.75 Mbps, Raffles The Palm, and Jumeirah Mina Al Salam, both in Dubai, with 122.82 Mbps and 121.35 Mbps, respectively. 
  • Just over half of the reviewed hotels provided Wi-Fi with a median download speed of at least 50 Mbps. 41% of the properties provided a speed between 50 Mbps and 100 Mbps; these include iconic hotels, such as Burj Al Arab and the Royal Atlantis in Dubai. The remaining 45% of hotels offered a speed below 50 Mbps, including those in the Gulf region, suggesting that the issue is with the Wi-Fi network and not with the capacity of the broadband connection.
  • Hotels should actively monitor and improve their Wi-Fi to remain competitive. Hotels can enhance Wi-Fi performance by increasing bandwidth, upgrading modern networking equipment, optimizing access point placement, performing regular maintenance, and gathering guest feedback to inform improvements.

Fast and reliable Wi-Fi is critical to the experience of tourists, business travelers, and remote workers

Fast and reliable Wi-Fi is essential for the hospitality industry, particularly in the MENA region, where tourists and business travelers expect seamless internet access to stream their favorite TV shows, have virtual meetings, and stay in touch. The COVID-19 pandemic accelerated this trend, making remote work the new normal. Some cities, such as Dubai and Abu Dhabi, rolled out the red carpet to digital nomads and professionals, offering special visas and incentives to attract them. Even holidaygoers and families require more bandwidth to enjoy premium video streaming services and connect multiple devices simultaneously. 

As the luxury hospitality sector is booming in the region, the quality of Wi-Fi can be a decisive factor in travelers’ decision to select a property over another in a highly competitive market. According to a survey conducted in the USA, 74% of panelists believe that Wi-Fi quality is important to attract guests and maintain their loyalty. Poor Wi-Fi can negatively impact guest experiences, review scores, and occupancy rates.

Luxury hotels in Riyadh and Dubai have among the fastest Wi-Fi networks in MENA

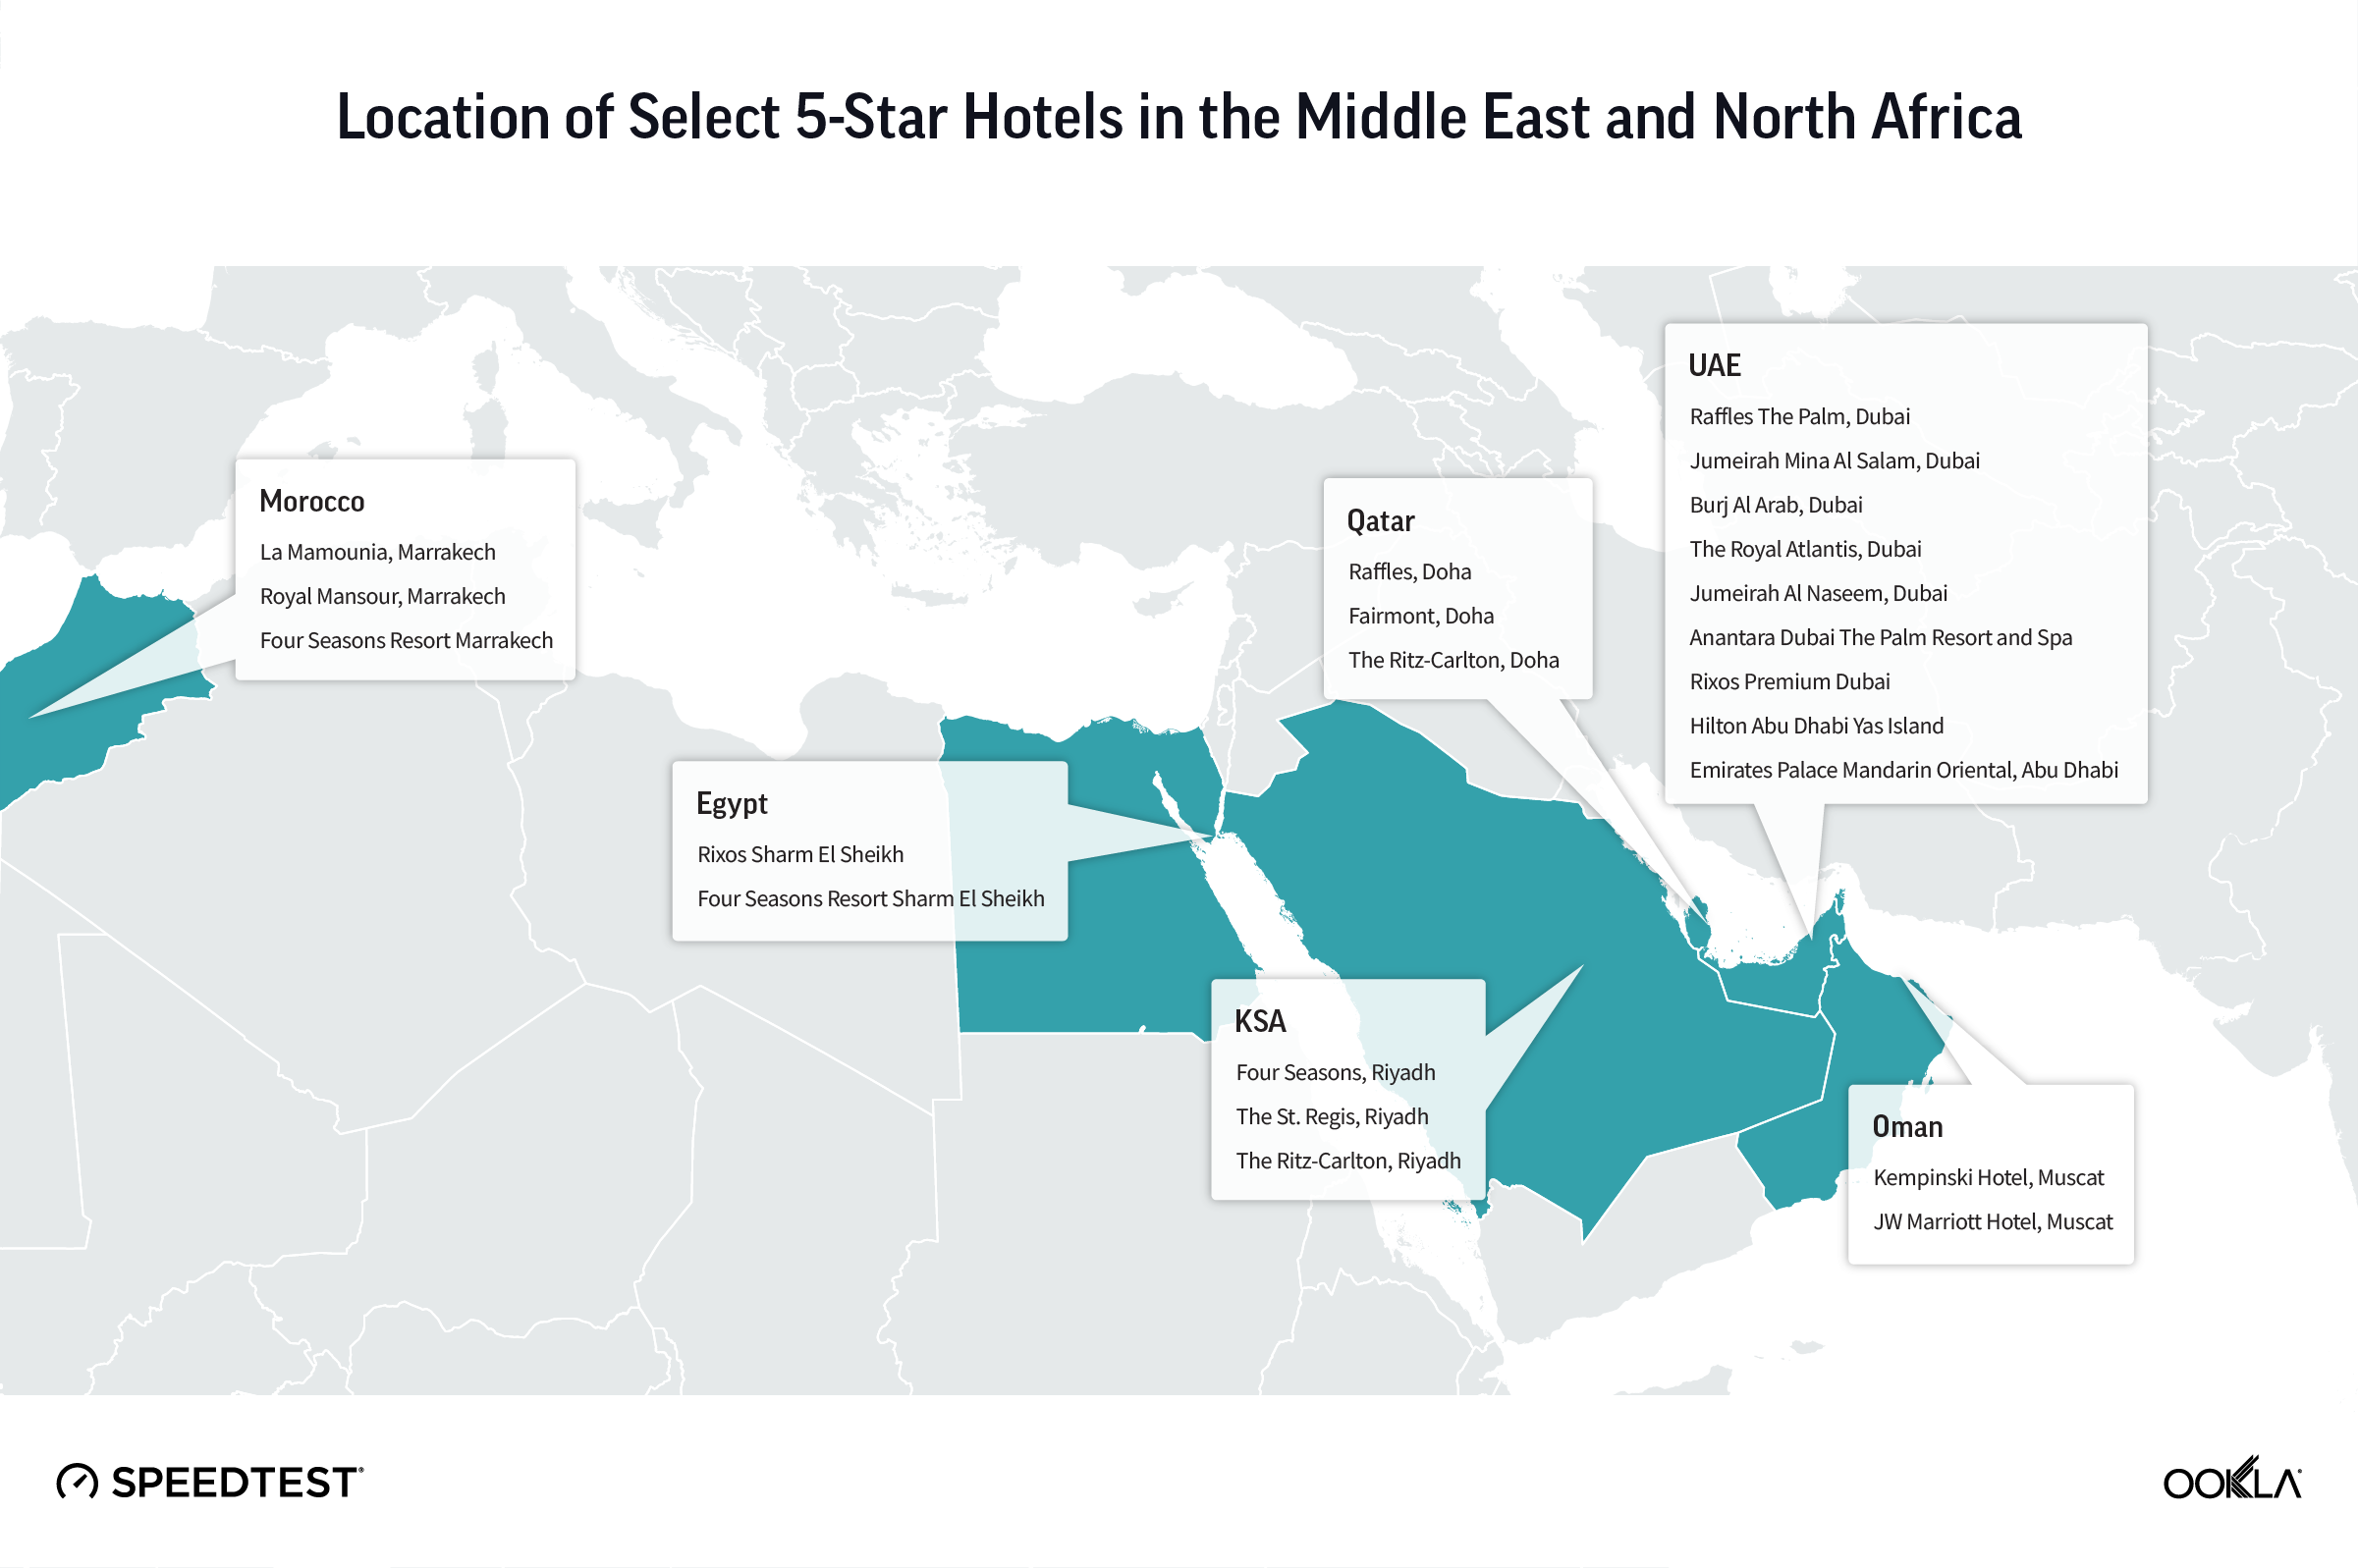
Using Speedtest Intelligence® data, we analyzed Wi-Fi performance across 22 top-rated five-star hotels and resorts shortlisted based on desk research for the most popular properties and recent recommendations from Condé Nast Traveler, Travel + Leisure, and Business Traveller Middle East. We also aimed to have representation from the Gulf region, Middle East, and North Africa. 

The map below shows the city distribution of the hotels selected. The U.A.E. is most represented, with nine properties and resorts spread across Dubai and Abu Dhabi. Riyadh, Doha, and Marrakesh contributed three hotels each, followed by Muscat in Oman and  Sharm El Sheikh in Egypt, with two hotels each.

Map of location of select 5-star hotels in the Middle East and North Africa

We benchmarked median download speeds inside and around the properties over one year (October 2023 and October 2024). This period helps us gauge the performance and stability of the Wi-Fi network with different levels of hotel occupancy and guest profiles. We excluded hotels with low measurement sample counts and considered only the most common Wi-Fi network name in each hotel, which is usually freely accessible to guests. To this end, we excluded Wi-Fi networks set up specifically for special events like sporting competitions.

Data analysis revealed three groups of hotels based on Wi-Fi download speed:

  • Top performers include hotels with a median download speed exceeding 100Mbps. These speeds facilitate multiple 4K streams, ultra-fast downloads, and lag-free video conferencing, catering to the most demanding digital needs.
  • Good performers include hotels with a median download speed between 50Mbps and 100Mbps. These represent 41% of the properties reviewed. This group comprises iconic hotels such as Burj Al Arab and the Royal Atlantis in Dubai.
  • Performance laggards include hotels with a median download speed below 50 Mbps, representing more than 45% of the properties reviewed.  This speed may be suitable for single high-definition to 4K  streaming but struggles with more data-intensive activities at busy times.

Four Seasons in Riyadh, Raffles The Palm, and Jumeirah Mina Al Salam, both in Dubai, top the list with a median download speed of 154.75 Mbps, 122.82 Mbps, and 121.35 Mbps, respectively. The download speeds of good-performing hotels range from just over 50 Mbps for Raffles and Fairmont, colocated in Doha’s Katara Towers, to 93.70 Mbps for Rixos Sharm El Sheikh. The other hotels in this category are located in Dubai, Muscat, and Marrakesh. 

Every city has hotels in the laggards’ category, with speeds ranging from  10.21 Mbps to 46.11 Mbps. At the bottom of the list, we find two in Abu Dhabi, Hilton Yas Island and Emirates Palace Mandarin Oriental, with speeds of 14.88 Mbps and 14.45 Mbps, respectively, and JW Marriott Hotel Muscat, at 10.21 Mbps.

Chart: Wi-Fi Performance for Select 5 Star Hotels in the Middle East and North Africa

For reference, Netflix recommends a minimum of 15 Mbps for 4K video streaming. More specifically, in the hospitality industry, and based on a survey, 56% of hotel guests in the USA expected hotels to offer Wi-Fi speeds of at least 50 Mbps for the service to be acceptable. Speedtest results show that over half of the reviewed hotels in MENA meet or exceed that threshold.

While Gulf countries top the Speedtest Global Index, we note that many hotels in that region offer sub-50 Mbps, suggesting that the issue is with the Wi-Fi network and not with the capacity of the broadband connection. Conversely, hotels in Sharm El Sheikh and Marrakesh outperformed many of their peers in Gulf countries, suggesting a combination of good internet capacity and optimal Wi-Fi installation.

Deploying modern and well-configured Wi-Fi equipment helps to realize speed gains

The placement and configuration of Wi-Fi access points influence the speed and coverage guests can experience. Speedtest data shows that Wi-Fi 6 standard (802.11ax) and 5 GHz frequency spectrum, which privileges speed over coverage, are more commonly found in top-performing hotels than lower-performing ones. 

Speed gains of Wi-Fi 6 over Wi-Fi 5 (802.11ac) and Wi-Fi 5 over Wi-Fi 4 (802.11n) are more significant at higher speed ranges (above 75 Mbps). Furthermore, tests that used the 5 GHz frequency consistently outperformed those over 2.4 GHz (which provides better coverage but with lower performance) across a wide range of speeds, with more substantial improvements at higher speeds.

Test Distribution by Wi-Fi Standard and Frequency Band for Different Hotels’ Performance Categories
Source: Speedtest Intelligence® | 1 October 2023 – 1 October 2024
Test Distribution by Wi-Fi Standard and Frequency Band for Different Hotels’ Performance Categories

Hotels should actively monitor and improve their Wi-Fi to remain competitive

Delivering high-speed and consistent Wi-Fi across different parts of a hotel is challenging because of the inherent design and structure of the property. The size and layout of the hotel play a crucial role; larger establishments with multiple floors and large common areas can create dead zones where the signal weakens or fails. Additionally, the materials used in construction—such as concrete, metal, and glass—can significantly attenuate Wi-Fi signals, leading to inconsistent connectivity in certain areas. Furthermore, the high density of guests during peak seasons can strain the network, resulting in slower speeds and dropped connections. 

In addition to upgrading networking equipment, including routers and access points that support the latest Wi-Fi standards, hotels can improve network experience by adopting the following steps:

  • Increase bandwidth: Ensure sufficient internet bandwidth to accommodate the number of guests and their usage patterns.
  • Conduct a site survey to identify dead zones and areas with weak signals and interference. This will help in planning the placement of access points for optimal coverage.
  • Optimize placement of access points: Distribute access points throughout the hotel to ensure consistent coverage reduce congestion, and upgrade cables to take advantage of increased bandwidth.
  • Regular maintenance and updates: Update firmware and software for networking equipment to ensure security and performance.
  • Monitor network performance: Use monitoring tools to track performance metrics like speed and coverage to identify problems and inform future upgrades.
  • Gather guest feedback: Include questions about Wi-Fi quality in the checkout surveys to better understand their needs and make necessary adjustments.

As the luxury hospitality sector in the MENA region continues to flourish, hotels must recognize that high-speed and reliable Wi-Fi is no longer just a nice-to-have feature but a critical expectation of their guests. Investing in connectivity and optimizing Wi-Fi infrastructure will not only enhance guest experience and satisfaction but also help stand out in the competitive market in MENA. 

By investing in providing seamless connectivity, hotels can attract a broader range of travelers—including digital nomads and business professionals—and foster loyalty among guests. This will also help local luxury hotels become sought-after destinations for luxury holidays and remote work. 

Ookla can assist hospitality property managers in designing Wi-Fi networks, monitoring their performance, and optimizing them. Please contact us to learn more about Speedtest Intelligence and Ekahau.

Ookla retains ownership of this article including all of the intellectual property rights, data, content graphs and analysis. This article may not be quoted, reproduced, distributed or published for any commercial purpose without prior consent. Members of the press and others using the findings in this article for non-commercial purposes are welcome to publicly share and link to report information with attribution to Ookla.

| November 26, 2024

5G is Contributing to Improving MTN's Network Performance in West and Central Africa

This article examines the mobile performance of select MTN subsidiaries and joint-venture (hereafter referred to as “opcos”) across five of its nine markets in West and Central Africa (WCA). We look at how these opcos’ performance compares with each other and how it evolved between Q2 2022 and Q2 2024, analyze the factors that impacted their performance, and discuss their 5G plans.

Key Takeaways:

  • Nigeria leads MTN opcos in West and Central Africa (WCA) in mobile download speed for handsets with modern chipsets, according to Speedtest Intelligence®. In Q2 2024, MTN Nigeria significantly widened its lead over the other opcos in WCA in terms of download speeds, reaching 95.62 Mbps. MTN Nigeria also excelled in median upload speed at 17.01 Mbps, closely followed by MTN Ghana at 16.74 Mbps.
  • Despite challenging macroeconomic and operational conditions, MTN opcos in WCA  improved their network performance. While all reviewed MTN opcos rose in performance since Q2 2022, Nigeria and Ghana stood out by moving up the most in download and upload speed rankings over the last 2 years. The two opcos were also the front runners for median multi-server latency, with Ghana achieving this without launching 5G.
  • 5G service availability in Nigeria has significantly improved over the last 18 months. Speedtest Intelligence shows that 5G Service —a geospatial measure of the percentage of an operator’s known locations with 5G service— in Nigeria increased from 17.2% in Q1 2023 to 35.70% in Q2 2024, surpassing South Africa’s 31.6%.

MTN aims to continue investing in new network technologies and bridging the broadband coverage divide to remain competitive

MTN is the largest operator group in Africa operating in 15 markets, offering voice, data, fintech, digital, enterprise, and wholesale services to nearly 300 million fixed and mobile subscribers. MTN Group’s service revenue grew by 13.5% to ZAR210 billion ($11.1 billion), driven by data revenue of ZAR 84 billion ($4.5 billion) and voice revenue of ZAR 83 billion ($4.4 billion).

African countries in the MTN footprint face economic and political challenges, including slowing growth, high inflation, currency devaluation, and political instability in neighboring countries. These conditions dampen investment appetite and increase the cost of doing business. However, the large, fast-growing, and youthful population combined with low levels of data and digital adoption offer significant growth opportunities for telecom operators like MTN.

Map of MTN Operations' Median Download Speed and Year-on-Year Changes in Select Western and Central African Markets

In 2023, service revenue from West and Central Africa (WCA) accounted for 63.6% of the Group’s revenue. Data revenue surged by 51.3% (excluding Nigeria) and by 38.6% in Nigeria, driven by increased data users and traffic and supported by network investments.

At the beginning of 2021, MTN announced its Ambition 2025 strategy to provide ‘leading digital solutions for Africa’s progress’. This growth strategy’s objective is to double the number of consumer mobile data users to 200 million and home broadband customers to 10 million by 2025, achieve 95% broadband population coverage, and ensure data contributes to half of the Group’s total revenue. This strategy is supported by network expansion, modernization, and improved service affordability.

In the following sections, we analyze MTN opcos’ performance in WCA and review their network deployment plans, including 5G. 

Nigeria delivered the fastest median download speed in Q2 2024 across MTN opcos in WCA

In a previous article, we found that MTN performed best among other operator groups in Sub-Saharan Africa during Q2 2022. For the current analysis, we use Speedtest Intelligence data to compare mobile performance between Q2 2022 and Q2 2024 on modern chipsets across select five (out of nine) MTN opcos in WCA. 

Our results show that Nigeria led MTN’s opcos in WCA in median download speeds, achieving 95.62 Mbps in Q2 2024. Nigeria along with Ghana, more than tripled their median download speeds within two years. Benin, Cameroon, and Nigeria saw greater jumps in download speeds between 2023 and 2024 compared to the previous year.

Generally, all opcos saw more modest improvements in upload speed compared to download speeds. MTN Nigeria led the group with a median upload speed of 17.01 Mbps in Q2 2024, closely followed by MTN Ghana at 16.74 Mbps. Both countries significantly increased their upload speeds between Q2 2022 and Q2 2024. 

Cellular Network Performance, Select MTN Operators in West and Central Africa
Source: Speedtest Intelligence® | Q2 2022 – Q2 2024
Cellular Network Performance, Select MTN Operators in West and Central Africa

MTN Nigeria outperformed the other opcos in the region with a substantial margin in median download speed. Its upload speed also saw a remarkable recovery with an impressive 17.01 Mbps in Q2 2024.

MTN Benin’s download speed significantly increased between Q2 2022 and Q2 2023, plateauing around 56 Mbps. It then slightly declined during H1 2024, maintaining its position as the second-fastest opco in WCA.

MTN Ghana made an impressive turnaround, climbing from the bottom to among the top three operators in download and upload speeds. Its download speed increased more than 3x (similar to Nigeria’s improvement rate), and its upload speed more than doubled over the two years to Q2 2024. This improvement was partly due to MTN’s investments in network infrastructure and high smartphone penetration among its subscribers (63.8%) in 2023.

MTN Côte d’Ivoire, the second-largest mobile operator in the country, saw modest performance improvements until the end of 2023. Then download speeds peaked at 39.49 Mbps in Q1 2024, around the start of the African Football Championship (CAN), but fell to 29.23 Mbps in Q2 2024. Upload speeds also improved, but not as significantly as download speeds. MTN Cameroon showed the smallest network performance improvement over the two years, ending at the bottom of the pack.

MTN Ghana and Nigeria were the front runners for median latency, maintaining a tight range of approximately 42 ms to 54 ms between Q2 2022 and Q2 2024. Opco latency in Benin and Côte d’Ivoire fluctuated between a low of around 38 ms and a high of 143 ms. MTN Cameroon consistently had higher latency, over 230 ms, throughout the period.

MTN Nigeria could further solidify its leadership in Africa by expanding 5G coverage and boosting adoption rates

Nigeria, the continent’s most populous country, boasts the largest mobile market, with 217.5 million subscribers in 2023. Following regulatory impacts from the two SIM campaigns in 2017 and 2021, market growth resumed and is projected to continue into 2024. The country presents significant growth opportunities for data services, with internet penetration reaching 45.4% in 2023

However, Nigeria faces economic challenges, including currency depreciation, high inflation, and a shortage of hard currency. Operational challenges such as fuel shortages, infrastructure vandalism, and regional unrest also impede infrastructure expansion and maintenance. Despite these hurdles, MTN Group announced in 2023 its ambition to invest $3.5 billion in Nigeria over the next five years.

MTN was the first operator to launch 5G in Nigeria, followed by Airtel and ISP Mafab Communications in June and January 2023, respectively. By December 2023, MTN Nigeria’s 5G network covered 11.3% of the population. However, according to the Nigerian Communications Commission (NCC), Nigeria had 2.3 million 5G subscribers by the end of 2023, representing just 1.04% of the total 224.7 million active mobile subscribers.5G coverage has improved over the last 18 months. Speedtest Intelligence shows that 5G Service —a geospatial measure of the percentage of an operator’s known locations with 5G service— in Nigeria increased from 17.2% in Q1 2023 to 35.70% in Q2 2024, surpassing South Africa’s 31.6%. MTN invested $120 million to raise 5G network coverage from 3% to 11%, extending service to key cities in all six regions, but further expansion is needed.

Speedtest Intelligence’s 5G Availability data, which measures the percentage of users with 5G-capable devices who spend most of their time on a 4G or 5G network, indicates an upward trend in Nigeria to reach 13.9% in Q2 2024, reflecting increased service activation and adoption. However, the level remains low compared to South Africa, which reached 31.3% in Q2 2024. Customers may hesitate to activate 5G due to data usage and battery life concerns. MTN can address these concerns by offering affordable data plans and financing options to facilitate the acquisition of newer, more energy-efficient devices.

5G Service and 5G Availability, Nigeria
Source: Speedtest Intelligence® | Q1 2023 – Q2 2024
5G Service and 5G Availability, Nigeria

Apart from Nigeria, MTN’s 5G rollout plans in West and Central Africa are progressing slowly

Côte d’Ivoire is the only other country in the region where MTN launched 5G services. The rollout coincided with the African Football Championship (CAN) in January 2024, covering Abidjan and several major cities. Despite network rollout delays and logistics bottlenecks in 2023, MTN also upgraded its 4G networks in late 2023 in preparation for the football competition. The local telecom regulator, ARTCI (Autorite de Regulation des Telecommunications de Côte d’Ivoire), considered introducing network sharing to expedite 5G deployment, similar to the model adopted in Malaysia, but there have been no updates on this plan so far in 2024.

In the rest of the WCA region, MTN has conducted 5G pilot projects, such as in the Republic of Congo (Congo-Brazzaville) but remains committed to investing in 4G infrastructure to enhance accessibility. In Cameroon, MTN has been expanding its network capabilities and testing 5G since 2021. In 2023, it committed $200 million over three years towards network services. MTN has also pledged to invest $215 million over the next three years in Benin to develop its 5G infrastructure following successful trials. 

In Ghana, MTN initially announced its readiness to roll out 5G in 2022, but the National Communications Authority (NCA) did not grant it the license, considering a shared infrastructure approach. Macroeconomic challenges, including slowed-down economic growth, high inflation (averaging 40.3% in 2023), and currency devaluation (down 34.5% against the US dollar), have also delayed the 5G rollout. In May 2024, the Ghanaian government partnered with seven industry players (excluding MTN) to establish the Next-Gen Infrastructure Company (NGIC) to deploy the infrastructure and launch 5G services within six months. However, concerns have been raised over the lack of transparency around this partnership. NGIC eventually launched 5G on the first of November, 2024. Finally, MTN confirmed its plan to exit Guinea-Bissau and Guinea-Conakry due to high risk and limited growth.

This analysis shows that mobile network performance has improved significantly in some key West and Central African markets. The impact of 5G has so far been limited to Nigeria as it is still in its early stages in most of the region. MTN is keen to expand 5G coverage to the rest of its footprint, following the examples of Nigeria and Côte d’Ivoire, while continuing to invest in its 4G network infrastructure. Despite ongoing political and macroeconomic challenges, MTN and other operators in the region are well-positioned to meet the growing demand for high-speed broadband.

We will continue to monitor mobile networks’ performance across Africa, benchmark countries, and operators, and explore how various factors affect it. For more information about Speedtest Intelligence data and insights, please contact us.

Ookla retains ownership of this article including all of the intellectual property rights, data, content graphs and analysis. This article may not be quoted, reproduced, distributed or published for any commercial purpose without prior consent. Members of the press and others using the findings in this article for non-commercial purposes are welcome to publicly share and link to report information with attribution to Ookla.

| October 21, 2024

GenAI will offer more immersive experiences for consumers and drive network measurement innovation

In the last three years, generative AI (GenAI) has driven most of the hype around AI. Its ability to understand and respond to queries in a human-like way and produce high-quality programming code, music, and video content raises critical questions about network requirements to support these applications and how best to measure network performance. This article covers current and emerging GenAI use cases and discusses the implications of growing consumer adoption on network performance and measurement strategies.

Key Takeaways:

  • The growing adoption of GenAI and its evolution has the potential to disrupt traffic usage patterns significantly. The surge in demand for GenAI and the diversity of the content types it can generate could lead to a significant increase in data traffic and a heightened need for improved bandwidth and latency in the medium to long term. Advancements in data compression and prompting techniques could mitigate demand pressures and lead to less severe outcomes than anticipated.
  • GenAI drives the need for new approaches to measure the quality of experience. The evolution of GenAI from chatbots to real-time conversations with richer and more interactive applications will require a new content distribution infrastructure and unlock new use cases. This will prompt a rethink of how we assess network performance and user experience.
  • Addressing data misuse, misinformation, and mistrust concerns will be crucial for widespread GenAI adoption. As GenAI content becomes more sophisticated, privacy, security, and trustworthiness issues will grow in importance. Establishing robust regulatory and technical safeguards will be vital to building consumer and business confidence in these technologies.

GenAI has captivated users, businesses, and investors alike

GenAI is a small part of AI that specializes in generating novel content using computer models trained on terabytes of existing digital datasets of text, computer code, images, and videos. Despite the recent decline in overall AI private investment, GenAI continues to attract the most funding. Private funding for GenAI surged to $25.3 billion in 2023, nearly nine times the amount raised in 2022. In October 2024, OpenAI, the company behind ChatGPT, the leading GenAI chatbot, raised $6.6 billion in new funding, valuing it at $157 billion despite incurring $5 billion in losses that year.

GenAI is not just capturing the attention of investors; it is also a hot topic among Fortune 500 companies. GenAI was the most frequently cited AI theme on earnings calls, appearing in nearly 20% of all earning calls during 2023. This shows that corporate leaders see significant potential in this technology.

GenAI services have also become very popular among consumers. For example, ChatGPT made headlines with its record-breaking growth. After the release of ChatGPT 3.5 in May 2023, the service reached 100 million users in just 64 days – the fastest-growing consumer application to date. Today, the ChatGPT website attracts over 600 million monthly visitors (down from its peak of 2 billion visits a month), and the service has more than 180 million users. While growth has slowed, ChatGPT is expected to capture 75.2% of GenAI users globally, even as its market share dips due to the rise of many proprietary and open-source alternatives. The U.S. is home to the largest ChatGPT user base, expected to increase to 87.9 million users by 2025.

Businesses are eagerly embracing GenAI for its perceived benefits. A CCS Insight survey found that 82% of U.S. and European companies have already deployed GenAI or plan to do so in the next 12 months. GenAI has been mostly used for administrative-type tasks such as generating draft contracts and summarizing notes, content creation, marketing, and customer support.

The telecom industry is increasingly bullish on GenAI. Operators are using the technology to introduce more sophisticated chatbots that offer a more human-like customer service experience. According to a recent GSMA Intelligence survey, 81% of global telecom operators are currently testing GenAI. While the initial focus is on cost reduction and operational efficiency, GenAI could eventually create new revenue streams by enabling new AI-powered consumer and B2B services. A 2023 McKinsey report suggests that GenAI could boost telecom revenue by 2.3% to 3.7% (as a percentage of total industry revenue), corresponding to an additional $60 to $100 billion. 

The rapid evolution of GenAI services could lead to increased network requirements 

GenAI is a broad category of applications that can generate different types of content. Most users are familiar with large language models (LLM), such as GPT-4, which powers ChatGPT. LLMs are a subset of GenAI trained on vast amounts of text to generate responses in natural language. As such, most current interactions with GenAI services are basic text-based conversations. These conversations are latency-tolerant and do not demand a high throughput since most of the delay is on the server side, where data processing and content generation take place.

The evolution of GenAI, from chatbots to real-time conversations with richer and more interactive content, will require more powerful servers that can process complex requests, do it faster, and send back high-resolution images or videos. In this context, minimizing downlink latency is crucial to maintaining natural conversations between users and GenAI agents. Additionally, download speed becomes essential for sending and rendering media content on users’ devices. In the future, the ease of creating realistic images or videos (or enhancing them) will encourage more people to become content creators and editors. This will enable new use cases that combine real and synthetic content generated on the fly and streamed live. In this scenario, good uplink latency and throughput metrics will be essential to provide viewers with a high-resolution and lag-free experience.

The reduction in the size of the LLM models, the increased optimization of GenAI applications, and the growing power of system-on-chips (SoCs) have given rise to a new generation of GenAI-powered smartphones. Devices such as the iPhone 16 with Apple Intelligence and Samsung Galaxy S24 with Galaxy AI are slowly transforming the way we interact with our phones and consume content, shifting from individual app usage to an ‘app-free’ experience with an intelligent, voice-controlled digital assistant that can draft emails, translate conversations, make a booking, or manage calendars. According to IDC, GenAI smartphones will be the fastest-growing smartphone segment through 2028, with over 234 million units expected to ship in 2024 alone. 

The proliferation of dedicated GenAI applications on smartphones will help to engage more users with GenAI and shift their usage from static to nomadic. While basic tasks will continue to be handled on the device for responsiveness and data privacy, more complex tasks like generating a picture or a video clip will be partially offloaded to a server (similar to Apple’s Private Cloud Compute). In this case, download speed and latency could be paramount to ensuring a good customer experience. Even for offline GenAI usage or when using on a portable processing unit (for example, embedded in a wireless router), mobile users may need to regularly download and update large GenAI models, highlighting the importance of robust cellular download speeds.

There is much uncertainty about GenAI’s overall impact on traffic profiles. The widespread adoption of GenAI media content could significantly disrupt consumer usage patterns, potentially leading to a surge in data traffic that could strain existing network infrastructure. On the other hand, advancements in data compression and prompting techniques could mitigate demand pressures, leading to less severe outcomes than anticipated.

Service providers will need to monitor developments and be prepared to make further investments to upgrade bandwidth and capacity to keep pace with demand and maintain performance levels. If GenAI leads to substantial additional traffic, then operators may ask GenAI service providers to pay their ‘fair share’ use of the infrastructure. 

GenAI drives the need for new service quality metrics and facilitates network optimization for operators

The rise of GenAI is transforming the way we create and consume content. This transformation necessitates new means of collecting network data and methodologies to capture the performance of AI-powered services accurately. Traditional metrics like throughput, packet loss, and jitter remain essential, but new KPIs need to be defined to reflect the ‘perceived quality’ of generated (or enhanced) content. Some aspects that could be considered include the relevance and accuracy of the generated content and the responsiveness of interactive GenAI applications.

The infrastructure required to support the growth of GenAI is likely to be different from traditional content delivery networks (CDNs). Some use cases will support near real-time interaction and require robust data privacy, necessitating edge computing deployment to offload the central cloud-based GenAI servers, reduce latency by processing data closer to the user, and minimize the amount of traffic exchanged between the user and the central server. Therefore, future network measurement approaches should factor in the distributed nature of these edge compute units and redefine latency to include edge processing and content generation time at the edge. 

Operators can use GenAI tools to analyze measurement data, identify patterns, and predict potential issues based on recent incidents. According to a 2023 GSMA Intelligence survey, two-thirds of operators considered troubleshooting and maintenance to be the biggest impact of GenAI. For example, GenAI tools can provide network engineers with automated, tailored network analytics and upgrade recommendations. Ookla is using GenAI in Downdetector Explorer™ to provide network maintenance teams with up-to-date situation reports following service disruptions.

GenAI promises more immersive experiences for consumers while driving network measurement innovation

We are at the beginning of the GenAI revolution, and its potential is undeniable. GenAI promises consumers a more immersive experience, increased engagement, and greater creativity and content sharing. Combining AI-generated text, code, audio, and video could enable highly personalized and hyper-realistic immersive experiences beyond what is currently available. In the medium term, real-time services like video conferencing or gaming could be enhanced with AI-generated content, such as virtual avatars and personalized game characters, pushing network requirements to new heights. This shift will also significantly impact content distribution infrastructure and demand new approaches to moderating content, measuring network performance, and assessing customer quality of experience.

As GenAI content becomes more sophisticated and indistinguishable from human-produced content, concerns around data misuse, the spread of misinformation, and mistrust will grow. Addressing these issues will be crucial for fostering consumer and business confidence, ultimately driving the widespread adoption of AI technologies. In the meantime, GenAI will continue to be deployed with human supervision while we improve their understanding of its risks and limitations and establish regulatory and technical safeguards for its use.

We will continue to follow the development of GenAI and its adoption by consumers and telecom operators to gauge its impact on network performance and optimization. Furthermore, Ookla is actively using GenAI to transform its data into actionable insights and predictive analytics that help providers understand how to deliver better real-world connectivity experiences to consumers.

Ookla retains ownership of this article including all of the intellectual property rights, data, content graphs and analysis. This article may not be quoted, reproduced, distributed or published for any commercial purpose without prior consent. Members of the press and others using the findings in this article for non-commercial purposes are welcome to publicly share and link to report information with attribution to Ookla.

| October 17, 2024

Using Controlled Testing to Complement Crowdsourced Data for Better Insights at Hajj

Nearly 2 million visitors converged on Makkah between 14 and 18 June 2024 to perform the Hajj pilgrimage. As digital connectivity becomes increasingly essential, network performance plays a vital role in ensuring pilgrims can stay in touch with loved ones, access crucial information, and document their journey. However, providing a good network experience during the Hajj season is a big challenge due to the diverse terrain and high population density across multiple locations. The influx of users from different markets with an array of devices, some with outdated technologies, adds to the complexity.

During Hajj 2024, Ookla conducted controlled walk testing across key locations using RootMetrics® to examine how the network expansions and improvements announced by the operators have impacted the pilgrimage experience. Crowdsourced data was overlaid to assess the network’s impact on Quality of Experience (QoE) metrics to gain an even greater picture of the performance improvements.

Examining cellular network performance during the Hajj season

The controlled testing team was equipped with the latest 5G capable handsets, featuring SIM cards from three major operators in the region. A predefined path was tested over four days, covering five locations along the pilgrims’ path (Haram, Mina, Muzdalifah, Arafat, and Jamarat). Each area has its own terrain characteristics, population density, and mobility requirements. Most of the tests were conducted outdoors (68%), except in parts of the Haram (on day 1) and Jamarat (on day 4). 

Testing encompassed various controlled assessments to measure different aspects of network performance and reliability, including:

  • Data throughput download/upload tests
  • Call and SMS tests
  • Secure lite data tests
  • Video tests
Hajj steps and controlled tests itinerary

Controlled plus crowd testing provides a unique perspective

By analyzing network performance across all operators at the same location and the same time, our controlled testing provides accurate benchmarking and unique insights. It also enables us to schedule tests during peak hours to assess networks’ resilience and identify potential bottlenecks. Additionally, it allows for root cause analysis to pinpoint the reasons behind sub-optimal network performance or coverage issues, which may be attributed to configuration problems or inefficient spectrum utilization.

Combining walk test measurements with crowdsourced user experience data can effectively assess the impact of Quality of Service (QoS) parameters on Quality of Experience (QoE) metrics, identify issues, and prioritize improvements. Ookla Consumer QoE™ provides a comprehensive view of real-world consumer network experiences at times and locations that matter most to consumers. This data offers a valuable overlay with the detailed QoS and radio frequency data collected during walk tests.

Learn more about Ookla insights at Hajj

Please get in touch if you would like to know more about network QoS and QoE performance during Hajj 2024 and how it impacted pilgrims’ experience.

Ookla retains ownership of this article including all of the intellectual property rights, data, content graphs and analysis. This article may not be quoted, reproduced, distributed or published for any commercial purpose without prior consent. Members of the press and others using the findings in this article for non-commercial purposes are welcome to publicly share and link to report information with attribution to Ookla.

| September 9, 2024

O2 and T-Mobile Lead in Network Performance in Czechia as 5G Competition Heats Up

Mobile operators in the Czech Republic have made progress in expanding 5G coverage and improving network performance. In this article, we review the 5G performance of O2, T-Mobile, and Vodafone at the national level between Q2 2022 and Q2 2024 and highlight their achievements in three regions.

Key Takeaways:

    • O2 and T-Mobile have steadily increased their download and upload speeds since Q2 2022. O2 saw its median download speed more than double in 2 years to reach 92.78 Mbps in Q2 2024 while T-Mobile achieved a median download speed of 95.48 Mbps. The median upload speed is more highly contested by the two operators, with O2 taking pole position with 23.85 Mbps in Q2 2024. O2 also steadily improved its multi-server latency, leading the market with 33.34 ms in Q2 2024.
    • All operators have considerably improved their 5G coverage since Q1 2023. The percentage of operators’ known locations where a device has access to 5G service has increased from 40.7% in Q1 2023 to 66.2% in Q2 2024. Operators’ efforts to deploy new base stations and use sub-1Ghz frequency bands have driven these coverage improvements.
    • O2 leads in the capital region in 5G download speeds. O2 significantly outperforms its competitors in Prague in download speed at 241.86 Mbps compared to 167.85 Mbps for T-Mobile and 90.2 Mbps for Vodafone.
    • T-Mobile provides faster 5G download speeds in some other regions. T-Mobile notably outperformed O2 in the Central Bohemian and South Moravian regions. T-Mobile download speeds in the two territories were 129.36 Mbps and 165.54 Mbps, respectively, compared to O2’s 93.02 Mbps and 136.68 Mbps. 

O2 and T-Mobile consolidated their lead in 5G performance over the last year while Vodafone outperformed in 5G coverage

The Czech mobile market is very competitive with three key operators: O2, T-Mobile, and Vodafone. The country made a relatively early foray into 5G. O2 introduced 5G services first in July 2020, initially covering parts of Prague and Koline, after acquiring 700 MHz and 3400–3600 spectrum bands. Vodafone followed suit with its 5G network launch in October 2020 and T-Mobile the following month. In November 2023, O2 completed the rollout of 5G across Prague’s metro network, making it the first underground system in Europe with full 5G coverage.

The market remains dominated by the three operators despite the regulator’s efforts to encourage the entry of new players by auctioning the 700 MHz and 3.4-3.6 GHz spectrum bands in 2020. The silver lining is that access to the new spectrum, combined with the refarming of the sunset 3G spectrum, helped incumbent operators expand 5G coverage.

After T-Mobile and O2 began sharing their mobile infrastructure in 2012, their combined networks covered 85% of the population. Following the settlement of an antitrust dispute with the European Commission, they amended the network-sharing agreement in 2022 and extended it through October 2033 to support nationwide 5G deployment. Both operators committed to making their base stations 5G-ready and continue investing in the infrastructure. The network sharing agreement excluded the capital, Prague, and Brno for up to 10 years.

The network performance of both operators improved significantly since Q2 2022 according to Ookla® Speedtest Intelligence® data. O2 more than doubled its download speed over 2 years to reach 92.78 Mbps in Q2 2024, while T-Mobile pulled slightly ahead of O2 with a peak of 95.48 Mbps. The upload speeds of both operators remained relatively stable before Q3 2023 in the range of 15 Mbps to 20 Mbps before increasing, with O2 taking pole position with a speed of 23.85 Mbps in Q2 2024 and T-Mobile following closely behind at 21.28 Mbps. Vodafone’s download and upload speeds remained relatively flat over the same period before increasing rapidly from Q3 2023, in tandem with the other two operators, to reach 15.77 Mbps in Q2 2024.

O2 has maintained a relatively stable latency with a slight improvement observed since Q4 2023 resulting in the lowest latency in the market at 33.34 ms. T-Mobile exhibited a reduction in latency from Q3 2022 through Q1 2023, followed by an increase, bringing it closer to Vodafone’s performance by Q2 2024 at 35.4 ms. Vodafone gradually decreased its latency over the same period, almost converging with T-Mobile and O2 by Q2 2024.

All Technologies’ Network Performance, Czechia
Source: Speedtest Intelligence® | Q2 2022 — Q2 2024
All Technologies’ Network Performance, Czechia

Due to the growing adoption of 5G service, median 5G download and upload speeds have been declining since launch until 2023. This suggests a growing network usage while capacity was not increased sufficiently to cater to the growing demand. However, 5G network performance started recovering after 3Q 2023. T-Mobile leads the market with a 5G download speed of 153.12 Mbps in Q2 2024, after lagging behind O2 across most quarters since Q2 2022.

Vodafone’s 5G download speed has been declining until Q3 2023, when it reversed the trend rapidly to catch up with the other two operators, reaching 93.12 Mbps in Q2 2024. T-Mobile’s lead is more evident for 5G upload as the median speed reached 39.11 Mbps in Q2 2024, while O2 achieved a speed of 31.61 Mbps. Since Q3 2023, Vodafone’s upload speed gained nearly 10Mbps, reaching 20.52 Mbps.

Vodafone had the lowest download and upload speeds among the three operators throughout the period. The use of Dynamic Spectrum Sharing (DSS), which allows it to share spectrum between 4G and 5G, could explain Vodafone’s underperformance. While this approach enables Vodafone to offer 5G services without physically upgrading its radios, it also weighs on performance since both networks share the same radio spectrum. Furthermore, Vodafone demonstrated significant improvement since Q3 2023, suggesting a strategic focus on enhancing network capabilities to remain competitive.

O2 had the lowest 5G latency compared to T-Mobile and Vodafone during most quarters since Q2 2022, though it peaked around Q3 2023 at 32.9 ms before dropping to 31.3 ms in Q2 2024. T-Mobile exhibited the most significant fluctuation, with latency spiking in Q3 2022 but showing a general decline afterward, reaching comparable levels with Vodafone by Q2 2024. Vodafone also displayed a downward trend but remained above O2 throughout the period.

5G Network Performance, Czechia
Source: Speedtest Intelligence® | Q2 2022 — Q2 2024
5G Network Performance, Czechia

Operators have been using the 700MHz and 3500MHz spectrum bands acquired in 2020 to increase 5G coverage. According to Speedtest Intelligence, 5G Service, a geospatial measure of the percentage of an operator’s known locations where a device has access to 5G service (including roaming), has increased from 40.7% in Q1 2023 to 66.2% in Q2 2024. This significant improvement in coverage is driven mainly by Vodafone’s 5G coverage, with 5G Service value boosted from 59.3% to 78.5% during that period. Vodafone reported 70% coverage of the population within less than two years after launching 5G in 2020. O2 and T-Mobile also improved their 5G coverage during the same period to reach 65.8% and 60.0%, respectively, in Q2 2024, according to Speedtest Intelligence.

More users with 5G-enabled SIMs and handsets were connected to 5G networks in Czechia than before, indicating greater popularity and adoption. According to Speedtest Intelligence, 5G Availability, which represents the percentage of users with 5G-enabled devices and 5G-activated services that spend most of their time connected to 4G and 5G, has been increasing for all operators. Vodafone saw the fastest jump since Q1 2023 reaching 64.9% in Q2 2024. O2 and T-Mobile are also trending upwards and at a similar pace, reaching 35.2% and 40.2%, respectively. 

O2 tops 5G performance in Prague but T-Mobile leads in other regions

O2 and T-Mobile have been competing for the top spot for 5G network performance. The tightening of the gap between the two operators in download speeds suggests that subscribers on either network can expect similar performance. However, this similarity in median download speed at the national level hides some disparities at the regional level. For example, O2 excels in Prague, the region with the most samples but lags behind T-Mobile in two parts of the country which are Central Bohemian and South Moravian regions.

O2 and T-Mobile 5G Network Performance, Select Regions, Czechia
Source: Speedtest Intelligence® | Q2 2022 — Q2 2024
O2 and T-Mobile 5G Network Performance, Select Regions, Czechia

Prague

The capital city and its surroundings have the largest population in Czechia with over 2 million people. It is no surprise then that the operators prioritized this region when launching 5G and when upgrading network equipment. We also note that this region has been excluded from the network-sharing agreement signed between O2 and T-Mobile, allowing the two operators to offer distinctively different performances. 

In Prague, O2 significantly outperforms T-Mobile in 5G download speeds, with O2 reaching 241.86 Mbps compared to T-Mobile’s 167.85 Mbps. It is also the region where O2 has a large advantage compared to T-Mobile (compared to the other three regions). However, the median 5G upload speeds between the two providers are much closer, with O2 at 47.04 Mbps and T-Mobile at 46.18 Mbps.

Central Bohemian and South Moravian regions

These two regions show a clear trend where T-Mobile outperformed O2 in both 5G download and upload speeds, varying from the pattern observed in Prague, where O2 had a strong lead in download speed. In the Central Bohemian Region, T-Mobile’s download speed is 129.36 Mbps, notably higher than O2’s 93.02 Mbps. Similarly, T-Mobile’s upload speed of 29.47 Mbps is higher than O2’s.

In the South Moravian Region, T-Mobile is also leading with a speed of 165.54 Mbps compared to O2’s 136.68 Mbps. However, the gap between the two is narrower here than in the Central Bohemian Region. Its lead in 5G upload speeds is less pronounced at 38.39 Mbps compared to O2’s 26.29 Mbps. T-Mobile also outperformed O2 in both metrics in six other regions, while there is no clear winner in the remaining five regions. 

The Czech Republic is on track to reach EU 5G coverage targets ahead of schedule and has opportunities to improve network speed

According to a European Union (EU) report published in September 2023, 5G deployment is accelerating in Czechia with population coverage increasing from 49% in 2021 to 83% in 2022, ahead of the European average of 81%. This puts the country in a very good position to reach the EU’s target of 100% 5G coverage of the population way before the deadline of 2030.

As 5G coverage issues have been largely addressed, operators turned their attention to improving throughput, especially since Q3 2023. They can optimize their usage of the allocated spectrum in the 700 MHz and 3400–3600 MHz bands, while waiting for the release of the 26 Ghz which promises to offer much higher download speed. The extensive use of dynamic spectrum sharing also poses a bottleneck to unlocking 5G’s full potential. According to the EU’s Observatory Report published in June 2024, nearly half of the 13,870 5G base stations deployed in Czechia use that technology. While operators relied on DSS to expand their 5G footprint, they should now consider moving 5G services to dedicated spectrum channels, just like AT&T and Verizon in the U.S., to accelerate speed improvements.

We will continue to monitor fixed and mobile networks’ performance across Europe. For more information about Speedtest Intelligence data and insights, please contact us.

Ookla retains ownership of this article including all of the intellectual property rights, data, content graphs and analysis. This article may not be quoted, reproduced, distributed or published for any commercial purpose without prior consent. Members of the press and others using the findings in this article for non-commercial purposes are welcome to publicly share and link to report information with attribution to Ookla.

| July 29, 2024

Faster Speeds and the Promise of New Use Cases is Driving 5G SA Adoption

The deployment of 5G networks is progressing as demand for faster and more reliable connectivity continues to grow. The standalone (SA) deployment model marks a significant milestone in the evolution of 5G, aiming to offer lower latency, increased bandwidth, and improved reliability compared to earlier network configurations. In this article, we use Ookla Speedtest Intelligence® data to track 5G SA deployments since Q2 2023, 5G SA service adoption, and examine its impact on network performance. We also highlight key regions and countries that made notable advancements in 5G SA infrastructure.

Key Takeaways:

  • India, the U.S., and Southeast Asia are at the forefront of 5G SA adoption. T-Mobile and SK Telekom were among the first to launch 5G SA in 2020, while Chinese operators and Jio in India lead in terms of active 5G SA users. Europe somewhat lags, with operators still hesitant due to the relatively low ROI on existing 5G investments and unclear business cases for 5G SA. However, Europe has the highest number of operators planning to launch it.
  • The U.A.E. and South Korea lead the world in 5G SA performance. 5G SA download speeds reached 879.89 Mbps and 729.89 Mbps, respectively. Their 5G SA upload speeds were also impressive, at 70.93 Mbps and 77.65 Mbps, respectively. This performance is a result of significant advancements made by local operators in deploying 5G SA and testing advanced features such as network slicing and mobile edge computing (MEC).
  • The change in speed of 5G SA varied widely between countries over a year. Speedtest Intelligence data shows that 5G SA performance declined in many countries between Q2 2023 and Q2 2024, primarily driven by increased user base and network traffic. Conversely, markets such as Canada and the U.S. improved their performance thanks to access to additional spectrum.

5G SA deployments are expected to increase this year as adoption gains momentum and ecosystem matures

Most existing 5G deployments use the non-standalone (NSA) model which uses the 4G core network. This model is faster to roll out, requires less investment, and maximizes existing network assets. Unlike 5G NSA, 5G SA uses a dedicated 5G core network, unlocking the full capabilities of 5G with better speed, latency, support for large numbers of devices, and more agile service creation. It also enables new features such as network slicing where an operator can dedicate a network segment to specific customers or use cases. Furthermore, the core network functions provided by a cloud-native architecture enable more scalability and automation than physical or virtualized architectures. However, this comes with higher infrastructure complexity, investment as well as staff training costs.  Many operators use NSA as a stepping stone towards SA, with a few exceptions, such as DISH in the U.S. and Jio in India, which adopted SA from the outset. Other scenarios for deploying 5G SA include an overlay for a public 5G NSA network or as a private network for enterprise use cases. 

The Global Mobile Suppliers Association (GSA) identified 130 operators that had invested in public 5G SA networks as of the end of June 2024. 5G SA represented more than 37% of the 614 operators known to have invested in 5G either through trials or deployments. The GSA reported 1,535 commercially available devices, including handsets and fixed wireless access (FWA) customer premises equipment (CPEs), that support 5G SA, demonstrating the growing maturity of the device ecosystem. 

However, only 11 new 5G SA deployments in nine countries were recorded (out of 46 new 5G networks launched in 32 countries) in 2023, according to Analysys Mason, showing a slowdown in deployments. We expect the pace of 5G SA launches to accelerate in 2024 and beyond supported by the growing device ecosystem and commercial appetite for new 5G use cases. 

To identify where 5G SA access has been activated and the network expanded between Q2 2023 and Q2 2024, we used Speedtest Intelligence® data to identify devices that connect to 5G SA. The maps below confirm that the number of 5G SA samples increased year-on-year and that coverage has expanded beyond urban centers. However, mobile subscribers in most of Africa, Europe, Central Asia, and Latin America have yet to experience 5G SA.

In the following sections, we examine the year-on-year changes in 5G SA performance across different regions and identify which countries are leading in the Developed Asia Pacific, the Americas, Emerging Asia Pacific, and Europe.

The developed Asia-Pacific (DVAP) region is at the forefront of 5G SA launches

Operators in this region boast 5G SA networks, with launches happening as early as 2020. Strong government support, operators’ technology leadership, and a high consumer appetite for high-speed internet services drove this rapid adoption.

South Korea is considered a pioneer in the adoption and deployment of 5G technology, with SK Telecom deploying one of the first 5G SA services in H1 2020, and supporting advanced features such as network slicing and mobile edge computing (MEC). Speedtest Intelligence data shows that the country led the region in download and upload speeds in Q2 2024. South Korea has one of the highest median speeds among the countries analyzed at 729.89 Mbps (download) and 77.65 Mbps (upload). The other top-performing country is the U.A.E with a median download speed of 879.89 Mbps and a median upload speed of 70.93 Mbps. 

All three service providers in Singapore commercialized 5G SA services, covering more than 95% of the country. Users experienced excellent download speed with a median value of 481.96 Mbps. However, Singapore lagged in upload speed with a median value of 32.09 Mbps.

Macau and Japan are second and third in the region with median download speeds of 404.22 Mbps and 272.73 Mbps, respectively. Mainland China followed with a median speed of 236.95 Mbps. Policies and initiatives such as network-sharing agreements and government subsidies supported 5G growth.

In Australia, TPG Telecom launched its 5G SA network in November 2021, following Telstra’s announcement in May 2020. However, the country lagged behind its regional peers with median download speeds and upload speeds of 146.68 Mbps and 17.69 Mbps, respectively.

The performance of most reviewed DVAP countries remained largely stable or slightly declined between Q2 2023 and Q2 2024. The only two exceptions are South Korea and Australia where performance improved by 12% and 18%, respectively. The most substantial declines were observed in upload speeds, while South Korea stood out with a 17% boost in performance.

5G Standalone Network Performance, Select Countries in Developed Asia Pacific
Source: Speedtest Intelligence® | Q2 2023 – Q2 2024
5G Standalone Network Performance, Select Countries in Developed Asia Pacific

T-Mobile and DISH Push 5G SA Coverage in the U.S.

In the U.S., T-Mobile launched its 5G Standalone (SA) network over 600 MHz spectrum in August 2020, becoming one of the first operators in the world to do so. This was followed by a faster service over 2.5 GHz mid-band spectrum in November 2022 which helped the operator to maintain its national lead in 5G performance. On the other hand, Verizon extensively tested 5G SA in 2023 but so far has been slow to deploy a nationwide SA network. DISH, another notable 5G SA operator, pioneered a cloud-native Open RAN-based 5G SA network in June 2023 and expanded coverage to 73% of the population by the end of that year. In Canada, Rogers Wireless launched the first 5G SA at the beginning of 2021, a year after introducing 5G NSA. 

In Brazil, the median download and upload speeds reached 474.65 Mbps and 32.36 Mbps in Q2 2024, respectively, exceeding those in Canada and the U.S. The main operators in Brazil, Claro, Telefonica (Vivo), and TIM have launched 5G SA over the 3.5 GHz band, making the service available to a large proportion of the population.

While download and upload speed improved in Canada and the U.S. between Q2 2023 and Q2 2024, according to Speedtest Intelligence, it declined in Brazil. The deployment of C-band has likely helped to increase download speed in both Canada and the U.S.

5G Standalone Network Performance, Select Countries in the Americas
Source: Speedtest Intelligence® | Q2 2023 – Q2 2024
5G Standalone Network Performance, Select Countries in the Americas

India leads in the Emerging Asian Pacific (EMAP) region with fast expansion to 5G SA network

India is at the forefront of the Emerging Asian Pacific region’s rapid 5G Standalone (SA) network expansion. However, according to Ookla’s Speedtest data for Q2 2024, the Philippines surpasses both India and Thailand with a median 5G SA download speed of 375.40 Mbps. Globe, the first mobile operator to introduce 5G Non-Standalone (NSA) in the Philippines, expanded its 5G outdoor coverage to 97.44% of the capital by the end of H1 2023. The company also launched 5G SA private networks in 2023, along with network slicing.

India follows closely behind the Philippines, with a median download speed of just under 300 Mbps. Jio has been a leader in enhancing 5G SA coverage since its launch in October 2022, while Bharti Airtel initially opted for NSA, with plans to transition to full 5G SA. 

Jio’s rapid coverage expansion and high throughput are supported by its access to mid-band (3.5 GHz) and low-band (700 MHz) frequencies. Additionally, all new 5G handsets released in India are SA-compatible, boosting the adoption of 5G SA services, and more than 90% of them support carrier aggregation and Voice over New Radio (VoNR). 

Thailand lags behind in median download speed for Q2 2024 but outperforms India and the Philippines in upload speed. It was among the first countries in the region to introduce 5G services, with operators quickly expanding coverage to reach over 80% of the population. AIS, the leading operator in Thailand, launched 5G NSA services in February 2020 using 700 MHz, 2.6 GHz, and 26 GHz bandwidths, followed by 5G SA in July 2020. The operator enabled VoNR in 2021. 

Unlike the DVAP region, countries in EMAP have experienced a more substantial decline in 5G SA network performance compared to Q2 2023. The rapid coverage expansion and adoption have likely increased the load on 5G SA infrastructure, putting pressure on the operators to scale up network capacity in the future to at least maintain a similar performance level.

5G Standalone Network Performance, Select Countries in Emerging Asia Pacific
Source: Speedtest Intelligence® | Q2 2023 – Q2 2024
5G Standalone Network Performance, Select Countries in Emerging Asia Pacific

Europe is home to the highest number of operators looking to deploy 5G SA

A growing number of European operators are offering or planning to offer 5G SA, driven by a maturing device ecosystem. However, many remain hesitant due to cost and the need to demonstrate clear business cases for 5G SA. GSMA Intelligence reports that Europe has the highest number of planned 5G SA launches, with 45 operators planning to deploy it as of Q1 2024.

Elisa in Finland was one of the first operators in the region to launch 5G SA in November 2021. Other notable examples of SA implementations include Vodafone in Germany (April 2021) and the UK (June 2023), Bouygues Telecom (2022) in France, Three in Austria, Wind Tre in Italy (both in 2022), Orange and Telefónica in Spain, and TDC Denmark in 2023. 

The recent 5G SA launch in Spain may explain why that country saw such high speeds, with Speedtest Intelligence reporting download and upload speeds of 614.91 Mbps and 56.93 Mbps, respectively, in Q2 2023. However, Spain experienced a significant drop in performance in 2024, with speeds falling to 427.64 Mbps (download) and 30.55 Mbps (upload). Despite this decline, Spain continued to outperform the UK and Germany.

5G Standalone Network Performance, Select Countries in Europe
Source: Speedtest Intelligence® | Q2 2023 – Q2 2024
5G Standalone Network Performance, Select Countries in Europe

While 5G SA deployments appear to have slowed in 2023 compared to previous years, we expect momentum to increase from 2024 due to rising enterprise demand for private networks and interest in network slicing, as well as consumer demand for immersive gaming and VR applications.  The ecosystem’s maturity and the availability of more network equipment and devices supporting 5G SA will also stimulate the market. According to the GSA, 21% of operators worldwide investing in 5G have included 5G SA in their plans.

Interestingly, the growing popularity and adoption of 5G SA have impacted its performance, with many markets seeing some degradation compared to 2023, according to Speedtest Intelligence.  Nonetheless, 5G SA still offers a markedly faster download speed than 5G NSA. Beyond speed, 5G SA promises new capabilities, such as network slicing, that have started to emerge in the most advanced markets but will take time to become a reality for most consumers and enterprises worldwide.

We will continue to track the deployments of 5G SA and monitor their impact on network global performance. For more information about Speedtest Intelligence data and insights, please contact us.

Ookla retains ownership of this article including all of the intellectual property rights, data, content graphs and analysis. This article may not be quoted, reproduced, distributed or published for any commercial purpose without prior consent. Members of the press and others using the findings in this article for non-commercial purposes are welcome to publicly share and link to report information with attribution to Ookla.

| June 11, 2024

Downdetector Helped the Early Detection of Major Outages During the First Half of 2024

Since the beginning of 2024, there have been several high-profile outages causing service disruptions. Ookla’s Downdetector™ captured these events based on consumer reports, providing a unique perspective that can help us understand how they affect end-users. In this article, we analyze this data to assess the scale of selected outages, explore how they spread, and uncover interesting consumer behavior patterns.

Key takeaways

  • On February 22, 2024, AT&T experienced the largest operator outage in the world since 2020. Downdetector captured over 1.8 million reports related to AT&T’s nationwide outage reflecting its large scale. Ookla’s platform also helped alert Verizon and T-Mobile customers about the outage caused by AT&T to reduce unnecessary reports to their respective Downdetector pages.
  • In March 2024, Meta experienced one of the largest outages to date affecting several core services. Over 6.5 million reports were submitted in just over 2 hours related to Facebook on March 5th. A second outage in April 2024 highlighted the value of Downdetector to rapidly detect the outage for swift response times, as it identified the issue quickly through user reports, unlike traditional network and application testing solutions.
  • Telkom in South Africa witnessed a few network outages since March 2024: On May 13th, Telkom’s South African network experienced a temporary nationwide outage, causing customers to lose signal and access to their services. That outage followed a series of disruptions affecting subsea cables in Africa, highlighting the vulnerability of this critical communications infrastructure and the need for diversification and backup solutions such as satellite internet.

Services outages have been more in the news in recent months and have an ever-growing impact on consumers and businesses alike

In the past 18 months, several high-profile outages have disrupted services across several industries – from telecommunications (AT&T in the U.S.) and social media (Meta) to cloud services (Microsoft and AWS). These disruptions extend far beyond momentary inconvenience. As consumers increasingly depend on constant connectivity for communication, entertainment, and essential services like emergency response, the stakes are high. Businesses with a strong online presence and those reliant on cloud services are particularly vulnerable, risking productivity and revenue loss, as well as potential reputational damage.

Our digital infrastructure’s highly interconnected nature means a single outage can trigger a cascade of disruptions across various sectors. In today’s era of round-the-clock media and social platforms, even small disruptions can quickly escalate into significant crises, amplifying their visibility and impact.

It is therefore crucial to have systems in place to detect such events, manage outages, and develop a comprehensive contingency plan. By spotting anomalies early, service providers can isolate problems, minimize downtime, prevent escalations, and keep users informed throughout the outage. In this context, crowdsourced data can complement internal fault detection systems by assessing the outage’s scale and providing real-time information to affected users. Identifying priority areas allows for a more coordinated response, minimizing impact and protecting the company’s reputation.

Ookla’s Downdetector™ is the leading source for real-time status and outage information for thousands of services and websites around the world. Powered by unbiased, transparent user reports and problem indicators from around the web, it helps understand disruptions to vital services, empowering consumers, and informing businesses when customers are experiencing issues. The platform tracks over 14,000 services from around the world and receives reports from more than 200 million unique users. Users submit problem reports on Downdetector localized websites, which also collect indicators from social media and other web sources. These reports are then validated and analyzed in real-time to flag potential service disruptions and other problems. An incident is confirmed when the volume of reports significantly exceeds the typical baseline for a service. 

In the sections that follow, we leverage Downdetector data to analyze three outages that occurred during the first half of 2024 by tracing back their evolution, providing insightful analysis, and uncovering interesting consumer behavior trends.

AT&T experienced the largest operator outage in the world since 2020 according to Downdetector

AT&T, the largest mobile operator in the U.S.A. with over 240 million subscribers, experienced a nationwide network outage on February 22. This affected its mobile network, leaving thousands of users without voice, messaging, and data services for several hours. Based on the number of reports on Downdetector.com, this was the largest outage of any telecom operator in the world since November 2020.

At 2:45 AM CST on 22 February 22, 2024, Downdetector started receiving thousands of self-reported incidents related to AT&T services, far exceeding the baseline. Reports peaked at 73,502 at 8:15 AM CST as people started their day. In total, AT&T received nearly 1.8 million issue reports on Downdetector between 2:45 AM CST and 5:45 PM. The number of reports started to dwindle rapidly after 10:45 AM, returning to normal by day’s end. This outage also affected AT&T’s sub-brand, Cricket Wireless, with reports tailing off in the late afternoon.

Rivals Verizon and T-Mobile also had higher-than-normal report volumes but on a much lower scale. Self-reported incidents peaked at 7:00 AM CST at 4358 and 1990 for Verizon and T-Mobile, respectively. The majority of these reports resulted from customers trying to connect to AT&T customers since both operators confirmed their networks were operating normally. These consumers are not wrong, though: they were unable to use their service as intended. To reduce the number of reports, Verizon and T-Mobile customers visiting Downdetector.com were informed that the issues being reported were likely related to AT&T. Such proactive measures helped to alert customers unaware of issues with third-party services that affect their experience and avoid unnecessary support calls.

Chart of Outage Reports for AT&T, Verizon, and T-Mobile

Downdetector data points to an internal root cause within the AT&T network since no major cloud services provider, or popular online services, received a large number of reports at the same time as it did. The issues were reported from across the US, with users from Houston, Chicago, and Dallas generating the most reports. AT&T attributed the issue to a technical error in the application and execution of an incorrect process during the network expansion process. Initial concerns were about potential cyberattacks but there was no evidence to suggest that. The outage onset also corroborates with the explanation provided by AT&T that it occurred during typical maintenance hours in the very early morning. According to AT&T, three-quarters of the network was restored by the afternoon. 

The outage also meant that customers were unable to call emergency services. Some public services, such as the New York Police Department, could not use their phones connected to the AT&T network. However, AT&T’s FirstNet network for first responders such as the police and fire departments remained operational.

As a result of this incident, AT&T’s share price fell by 2% and it could face fines due to the inaccessibility of emergency services during the outage. AT&T also offered customers a $5 credit in compensation for the incident. This highlights the potential financial cost of service disruption if not managed efficiently and if the network is not quickly restored. 

Two months later to the day, AT&T experienced another, albeit more limited, outage that affected residents of Virginia and North Carolina due to equipment failure. The number of self-reported issues peaked at nearly 1300 in the morning of 22 May before subsiding one hour later.

Meta experienced one of the largest outages to date based on the number of services affected and the duration

On March 5, 2024, Meta experienced a widespread global outage impacting several of its core services including WhatsApp, Facebook, Facebook Messenger, Instagram, and Threads. The outage was first reported by mid-afternoon and began to clear at about 5:00 pm UTC, lasting about 2 hours. During this time, people could not log in to their Facebook accounts, with the site erroneously indicating that their passwords were no longer correct, sparking concerns about potential hacking.

Reports of issues with Meta’s services followed a similar trend:

  • Facebook reports started pouring into Downdetector around 03:15 PM UTC, peaking just 15 minutes later at over 2.35 million trouble notifications within that period. Between 3:15 PM and 5:15 PM, the total number of submitted reports exceeded 6.5 million.
  • For Instagram, the number of reports peaked at 529,140 at 3:30 PM UTC, with users reporting problems with the app.
  • People started reporting issues with Facebook Messenger‘s chatting services and problems logging in mid-afternoon, with a peak of 158,419 reports at 3:30 PM UTC.
  • Users on WhatsApp were comparatively much less affected by the outage, with only 25,312 reports between 3:00 PM and 5:30 PM, compared to 6.5 million for Facebook, over 1.8 million for Instagram, and 410,281 for Facebook Messenger.

Chart of Outage Reports for Meta's Services

Meta attributed the outage to an unspecified technical issue, with most users regaining access to its services by late afternoon. This episode highlights the potential risk of not quickly communicating about ongoing outages, raising customers’ concerns, and prompting them to change their passwords multiple times to regain access to their accounts, compounding incoming traffic to Meta platforms.

At the beginning of April, WhatsApp services went briefly offline again. Users could open the app and view their chats and history, but could not send or receive any messages. The same applied to Facebook Messenger; Instagram and Threads were less impacted. Starting at 6:10 PM UTC on April 3, 2024, Meta services, particularly WhatsApp, received many user reports on Downdetector. Between 6:00 PM and 8:30 PM UTC, WhatsApp reports amounted to over 1.7 million, much higher than that of Instagram at over 200,000 and Facebook at 35,721. Meta did not make an official statement explaining the cause of this outage.

Traditional network and application testing solutions did not detect this Meta outage because the network paths looked normal and did not exhibit any errors from the outside (using Ping-type tests). However, Downdetector identified the issue early thanks to user reports, highlighting the importance of quicker outage detection enabling faster response times.

Chart of Outage Reports for Meta's Services

Telkom in South Africa has witnessed a few network outages since March 2024

On May 13, 2024, a significant outage affected Telkom’s nationwide operations, leaving customers unable to use internet services, place calls, or send text messages. The service interruption began around 1:00 PM UTC, with user reports peaking between 1:00 PM and 3:00 PM UTC. During this window, approximately 48,433 outage reports were logged in Downdetector. Users also went to social media platforms such as X (formally Twitter) to voice their frustration. 

Although service was largely restored by 4:00 PM UTC, lingering issues persisted in some areas. Downdetector received reports well into the evening, indicating that certain users continued to face connectivity problems. In response to the inconvenience, Telkom offered all affected customers compensation of 1GB of data, valid for two days.

Chart of Outage Reports for Telkom

Analysis of the outage reported by Telkom subscribers revealed that 40% pertained to internet connectivity, while 35.2% related to mobile phone services. Almost a quarter of the complaints described the situation as a “total blackout” of the mobile network, suggesting an extensive disruption. The outage inevitably impacted access to popular online platforms, including TikTok, YouTube, and Netflix.

Chart of Outage Reports for Telkom, by Types

The root cause of Telkom’s outage on May 13, 2024, remains unspecified but it follows another disruption that occurred the day before and affected online services in South Africa and several countries on the east coast of the continent including Kenya, Tanzania, Rwanda, and Uganda. This broader disruption was attributed to damage to the undersea cable system that connects the region to the rest of the world. Customers reported slow internet speeds and intermittent service throughout the day.

A more extensive outage had previously impacted the Western and Southern parts of Africa, including South Africa, on March 14, 2024. This disruption was due to multiple failures of the undersea cables and resulted in significant economic repercussions. For example, banks were forced to close in several countries including Nigeria, and mobile users across the region faced sluggish speeds and interference with financial transactions.

Regardless of whether Telkom’s recent service disruption was directly related to the recent subsea cable damages or not, these events underscore the critical importance of this infrastructure in sustaining Africa’s connectivity with the globe and expose the vulnerabilities inherent in a communications network reliant on limited pathways. They also show the important role of South Africa in serving parts of the continent since big regional companies have data centers located in the country. 

The situation highlights the urgency for diversifying subsea cables and exploring alternative technologies, such as satellite internet from providers like Starlink, to serve as a contingency measure. However, even these technologies are not immune to challenges, as evidenced by the disruptions to Starlink in May 2024 due to a geomagnetic storm.

The network outages experienced by major service providers like Meta and AT&T emphasize that even the most extensive and relied-upon networks are susceptible to major service interruptions. Such disruptions can have a profound impact and disrupt critical services given consumers’ and businesses’ dependence on such infrastructure. The network disruptions faced by countries in Africa since March 2024 also highlight the economic risks linked to the limited number of subsea cables.

While infrastructure resilience improves over time, the complexity of modern systems means that organizations must proactively identify and mitigate network failures. Tools like Downdetector enable early detection, informed contingency planning, and transparent communication with concerned users – all essential for navigating outages and preserving user trust in an increasingly interconnected world.

If you would like to know more about Downdetector, please contact us.

Ookla retains ownership of this article including all of the intellectual property rights, data, content graphs and analysis. This article may not be quoted, reproduced, distributed or published for any commercial purpose without prior consent. Members of the press and others using the findings in this article for non-commercial purposes are welcome to publicly share and link to report information with attribution to Ookla.

| June 3, 2024

Gigabit Internet is the New Competition Ground for ISPs in the Middle East

Several Middle Eastern countries, including Bahrain, Jordan, Qatar, and the U.A.E., have emerged as leaders in fiber deployment and adoption. The introduction of gigabit packages and the increase in entry-level speeds have significantly boosted their ranking in the Speedtest Global Index®  for fixed broadband. This article examines the factors driving performance in these countries, the initiatives of ISPs to enhance indoor performance, and key enablers for wider gigabit internet adoption in the region.

Key Takeaways:

  • According to Ookla’s Speedtest Intelligence®, the U.A.E. leads the Middle East in fixed broadband performance in Q1 2024. The U.A.E. achieved a median download speed of 270.91 Mbps and an upload speed of 124.37 Mbps. Meanwhile, Bahrain and Qatar saw significant improvements in download and upload speeds, while the median download speed in Jordan rose rapidly from a small base, surpassing Saudi Arabia by Q1 2024. 
  • ISPs are addressing indoor performance bottlenecks with more modern consumer premise equipment (CPE). In-premise connectivity is crucial to guarantee maximum throughput on-premise. That is why ISPs started bundling Wi-Fi 6 compatible CPEs and deploying fiber-to-the-room (FTTR) for ubiquitous gigabit wireless access indoors.
  • Affordability is a barrier to wider gigabit adoption in the Middle East. While geography, level of competition, and government policies all impact fiber deployment, affordability is key to unlocking faster speeds in the region. Making gigabit plans more accessible can help operators boost fiber subscribers and aspiring countries to move up the Speedtest Global Index.

The U.A.E. tops the Middle East in Speedtest Global Index for fixed broadband

The analysis focuses on countries in the Middle East that are leading in fiber coverage, adoption, and speed enhancements, namely Bahrain, Jordan, Qatar, Saudi Arabia, and the U.A.E. These achievements were thanks to significant progress by local ISPs in extending fiber coverage, encouraging migration to higher-speed plans, and making services more affordable. Government support has been vital in accelerating fiber roll-outs to keep pace with the demand for data services and to ensure universal access to high-speed internet as part of national broadband development strategies. 

As a result, these countries continue to improve their Speedtest Global Index rankings. For example, the U.A.E rose from 18th in June 2020 to the second position in March 2024. Jordan jumped from 64th to 33rd while Bahrain jumped up 32 places to 63rd in the Index over the same period. Qatar’s position fluctuated between 29 and 45, with steady improvements since 2021. Saudi Arabia’s speed increase rate has been more modest than in other markets, causing a drop in the global ranking by 11 places to 46th in March 2024. The country is the largest in the group, which makes fiber coverage more limited outside the big cities, while there is a relatively large base of legacy copper connections.

Speedtest Global Index™ Rankings for Fixed Broadband, Select Countries in the Middle East
Speedtest Intelligence® | June 2020-March 2024
Speedtest Global Index Rankings for Fixed Broadband, Select Countries in the Middle East

Fixed broadband performance improved as faster entry-level fiber plans and gigabit packages were introduced

According to Speedtest Intelligence, the U.A.E. leads the Gulf region in median download speeds at 270.91 Mbps in Q1 2024, more than double the Q3 2022 figure. This represents the largest speed improvement among the reviewed countries. The turning point came in Q4 2022 when ISPs lifted the minimum broadband package speed from 250 Mbps to 500 Mbps and offered aggressive discounts to encourage upselling to faster fiber packages. The median upload speed also saw notable improvement, reaching 124.37 Mbps in March 2024.

Median Download Speeds for Fixed Broadband, Select Countries in the Middle East
Speedtest Intelligence® | Q1 2022-Q1 2024
Median Download Speeds for Fixed Broadband, Select Countries in the Middle East

Bahrain and Qatar also experienced significant and rapid rises in median download speeds, reaching 83.09 Mbps and 135.34 Mbps, respectively. The ISPs in the two countries saw significant improvements in upload speeds too. Users in Qatar saw the biggest jump in median upload speed, tripling from Q1 2022 to Q1 2024 to 115.74 Mbps. In Bahrain, the median upload speed increased by over 2.7x but remained the lowest of the group at 20.70 Mbps.

In Bahrain, the telecoms regulator mandated ISPs to double the speed of entry-level fiber packages in April 2023 while maintaining the same wholesale prices. This immediately impacted the market, with median broadband download speeds jumping from 48.14 Mbps in Q1 2023 to 70.17 Mbps in Q2 2023 (over 40%).

Qatar was the first country in the GCC to offer 10 Gbps consumer broadband packages. However, Ooredoo and Vodafone maintained a relatively low download speed on entry-level tariffs at 100 Mbps. This changed in June 2023, when they raised the minimum speed to 1 Gbps while offering discounts on more expensive fiber packages. These initiatives resulted in a step change in download speeds, increasing by 41% in Q1 2024 compared to Q2 2023.

Jordan began ramping up its fiber infrastructure in 2013-2014, with strong take-up since 2019 driven by increased competition, extended coverage outside the capital, and rising demand due to the COVID-19 pandemic. The launch of Fibertech, a fiber wholesale company, in 2019 significantly boosted service competition and led to more accessible and affordable fiber services for consumers. Fibertech, set up as a joint venture between ISP Umniah and Jordan Electricity Company, covered 1.2 Million households by July 2023 and planned to reach 1.4 million premises, 70% of Jordan’s households, by the end of that year.

Fiber overtook fixed wireless access (FWA) and ADSL connections in Q2 2021 and represented 56% of fixed broadband connections by the end of 2022. Fiber maintained its upward trajectory, capturing 64% of the market in 3Q 2023 with 513,744 active connections according to the last reported data from the Telecommunication Regulatory Commission (TRC)). Local ISPs have also been increasing the speed of entry-level plans and offering gigabit packages. For example, Orange Jordan introduced 2 Gbps and 10 Gbps plans in May 2023.  This accelerated fiber take-up boosted the median speeds for both download and upload, reaching 130.41 Mbps and 108.08 Mbps, respectively, in Q1 2024. Notably, Jordan doubled its median upload speed in two years, narrowing the gap with its median download speed.

In Saudi Arabia, stc led the way by increasing the minimum download speed from 100 Mbps to 300 Mbps in the summer of 2022. Mobily followed suit in 2023 by doubling the speed of its entry-level package and introducing a 1 Gbps broadband plan during Q2 2023. Zain initially reserved higher download speeds (ranging from 200 Mbps to 500 Mbps) for customers on 2-year contracts, while those on 12-month contracts received speeds between 100 Mbps and 300 Mbps. However, in 2023, Zain merged its plans into a standard 18-month contract starting at 200 Mbps, with 1 Gbps at the high end. These initiatives began to impact the market in Q2 2023, when the median download speed surpassed 90 Mbps for the first time, reaching 108.95 Mbps by Q1 2024. Upload speeds also saw significant growth, rising to 53.75 Mbps during this period.

Speedtest Intelligence’s Enrichment API allows us to track the adoption and performance of individual fixed broadband technologies and assess their impact on the Saudi market. For example, the fiber share of stc Speedtest samples has been growing – fiber represented 75.4% of Speedtest samples in March 2024, up from 69.9% in Q4 2023. This increased fiber adoption contributed to raising overall fixed broadband performance across download, upload, and latency metrics and widened the performance gap with legacy DSL lines. This result also highlights the potential for further improvement if most samples (and by extension, customers) switch to fiber.

DSL and Fiber Performance, Saudi Arabia
Speedtest Intelligence® | Q4 2022 – Q1 2024
DSL and Fiber Performance, Saudi Arabia

Improving indoor coverage is key to ensuring maximum fiber performance delivery to customers

ISPs in the analyzed countries have rapidly expanded their fiber footprint and migrated customers to faster broadband services, helping to increase the median download speed. However, the last few meters indoors, closer to the end-users, can be a potential bottleneck to achieving maximum throughput. To address this, local ISPs have taken steps such as:

  • Offering upgraded CPEs that support Wi-Fi 6. The choice of Wi-Fi standards and spectrum bands directly influences indoor connectivity quality, throughput, and network coverage. Our recent analysis found that over one-third of test samples in the Gulf region reported using Wi-Fi 4 to connect to the fixed CPE. More ISPs are now offering Wi-Fi 6 compatible CPEs and including additional mesh Wi-Fi nodes at no extra costs to improve indoor coverage and speed.
  • Deploying fiber-to-the-room (FTTR). This relatively new technology involves deploying and extending fiber connectivity to each room, usually through transparent cables, to provide ubiquitous gigabit wireless access. ISPs started deploying this technology in East Asia to differentiate their broadband offering and it is now being adopted by ISPs in the Middle East, including Jordan (Umniah and Zain), Qatar (Ooredoo), Saudi Arabia (Salam, stc), and the U.A.E. (Etisalat by e&).

Making gigabit internet more accessible will unlock faster speeds and drive wider adoption

Countries with small landmasses and populations, and high urbanization, such as Singapore, the U.A.E., Hong Kong (SAR), Iceland, and Monaco, top the Global Speedtest Index. While such geographical and demographic characteristics give an advantage to smaller nations as they facilitate the deployment of fiber infrastructure, other factors including market competition, government support, and service affordability are key to driving mass adoption.

Many of the top 10 markets in the Global Speedtest Index have multiple ISPs competing which drives investments in better technology and continuous upgrades to attract customers. A competitive landscape benefits consumers because it helps to keep prices relatively low. It also accelerates increases in median speeds as ISPs tend to offer free speed upgrades to existing customers. For example, in Hong Kong (which had 28 licensed ISPs as of March 2024) and Singapore, gigabit broadband speeds have been available to residential customers since the early 2010s, and ISPs have eliminated sub-1 Gbps plans. As a result, 85% of residential homes in Singapore and 68.0% in Hong Kong have at least 1 Gbps services. Chile, Latin America’s leader in fixed line performance and fourth in the Speedtest Global Index in Q1 2024, has six ISPs with more than 5% market share, all of which are heavily focused on migrating customers to fiber.

Governments in these leading countries have also prioritized strong digital infrastructure development with significant investment in infrastructure. For example, China has pursued a state-coordinated infrastructure deployment program to promote economic development. In France, the government’s “France Très Haut Débit” initiative aimed to provide fiber optic access to all citizens by 2025 through public-private partnerships. The Singaporean government invested S$1 billion to build the infrastructure of its National Broadband Network (NBN) which supported speeds of up to 10 Gbps and reached more than 95% premises in 2013. In February 2023, it announced an additional investment of up to S$100 million to upgrade the NBN to enable more than half a million households to benefit from speeds of up to 10Gbps by 2028.

While the broadband infrastructure in some countries from the Middle East is gigabit internet-ready, the disparity in income and the high price of these packages hinder the adoption rate of high-speed broadband services. For example, a 1 Gbps fiber line in Hong Kong or Singapore could cost as little as $30 per month, and a plan with a similar speed starts at $100 per month in Qatar,  $150 in the U.A.E., $250 in Saudi Arabia, and $345 in Bahrain. This highlights the need to make gigabit plans more affordable if the operators want to boost fiber subscribers and countries aspire to move up the Speedtest Global Index.

As demand for high-speed internet continues to grow, we expect increased adoption of 10 Gbps speeds to support more demanding applications and improve the user experience. Work is underway in some developed markets to build higher-capacity broadband networks to enable new cases and make the infrastructure future-ready. For example, In March 2024, Hong Kong Telecom announced the availability of 50 Gbps lines for residential and business customers. This trend is slowly emerging in the Middle East – Etisalat by E& in the U.A.E and Ooredoo in Qatar announced early experiments with 50G PON technology. We anticipate continued innovation and competition in the region, driving further advancements that will ultimately benefit end-users by delivering faster and more affordable gigabit connectivity options.

For more information about Speedtest Intelligence data and insights, please contact us.

Ookla retains ownership of this article including all of the intellectual property rights, data, content graphs and analysis. This article may not be quoted, reproduced, distributed or published for any commercial purpose without prior consent. Members of the press and others using the findings in this article for non-commercial purposes are welcome to publicly share and link to report information with attribution to Ookla.

| May 15, 2024

Qatar Shone During AFC Asian Cup 2023 on the Pitch and in Mobile 5G Performance

Following the FIFA World Cup® 2022, the first in the Middle East and the pioneering global football competition to be supported by 5G networks, Qatar welcomed an estimated 1.5 million fans for the 18th edition of the Asian Football Confederation’s (AFC) Asian Cup from 12 January to 10 February 2024. This article examines the performance of 5G networks in selected stadiums during the event and compares it to the 2022 FIFA World Cup and other major international sporting events in 2023 and 2024. 

Key takeaways

  • Qatar tops Ookla’s Speedtest Global Index®. Qatar moved into the top spot of the Speedtest Index in February 2024, surpassing the United Arab Emirates (UAE). This result showcases operators’ commitment to delivering the best network performance for visitors and residents.
  • Qatari stadiums delivered world-class 5G network performance. All six stadiums we tracked during the competition had a median download speed of at least 600 Mbps. The Ahmed bin Ali Stadium took a top spot with a speed of 964.33 Mbps, ranking favorably in the leaderboard of global sporting events, second only to the Super Bowl® in the U.S.
  • Superior network capabilities significantly enhanced web browsing and real-time online services. The high download speeds combined with ultra-low latency, under 34 ms across the stadiums, suggest that fans experienced minimal lag when streaming, video calling, or gaming online. The web browsing experience over 5G was excellent, evidenced by the low webpage load times ranging from 1.0 to 1.4 seconds.

Qatar was well-prepared for the AFC Asian Cup, drawing from its experience as the host of the 2022 FIFA World Cup 

Operators should prepare in advance and invest heavily in upgrading infrastructure in preparation for large sporting events. 5G is helping to transform the live event experience, creating a more engaging and interactive experience. Spectators and fans expect to share their experiences with friends and family through social media and stream the actions while watching live action from the pitch and replays from multiple angles and enjoy augmented reality games and services.

The AFC Asian Cup 2023 concluded in February 2024 with the host nation, Qatar, beating Jordan 3-1. Matches were played in nine stadiums across five cities as part of the international football tournament that involved 24 national teams.

It follows the successful organization of the World Cup 2022 in the country that saw 5G networks support 2.45 million cumulative stadium spectators and set a high standard, surpassing other major events like the French Open and Wimbledon in terms of 5G download speeds. The two local operators, Vodafone and Ooredoo, invested heavily in 5G infrastructure in preparation for this regional sporting event. 

The analysis covers eight stadiums across five cities. We used Speedtest Intelligence® to examine download and upload speeds and multi-server latencies for 5G within 200m of the stadiums’ center throughout the tournament for both operators combined. We also used Consumer QoE™ data with the same criteria to determine web page load time, reflecting the quality of supporters’ experiences, whether posting a picture or a message on Facebook or checking their live scores.

Map of Stadiums Analyzed with Speedtest Intelligence® and Consumer QoE™ During AFC Asia Cup 2023 in Qatar

Qatar outdid itself with ever better mobile 5G performance during AFC Asian Cup 2023

We used Speedtest Intelligence data to observe performance in the lead-up to and during the AFC Asian Cup. From September 2023 to February 2024, Qatar witnessed significant advancements in 5G network speed.  The median 5G download speed rose from 441.46 Mbps to 607.0 Mbps, and the upload speed increased from 24.79 Mbps to 36.66 Mbps. 

Chart of 5G Performance in Qatar

Qatar welcomed over 1 million visitors during the group stage, beating the previous AFC record achieved 20 years ago during the 2004 tournament in China. During that period, Ooredoo reported 190 TB of data volume while 5G usage share reached 50.1%. The tournament concluded with an estimated 1.5 million fans attending 51 games. The final match attracted over 86,000 fans at Lusail Stadium, where Ooredoo reported total data traffic of 35TB and delivered an average download speed of 244 Mbps and an upload speed of 50 Mbps.

These improvements contributed to elevating Qatar’s ranking to the number one position on the Speedtest Global Index® in February 2024, surpassing the United Arab Emirates, with a median download speed of 286.42 Mbps across all technologies. Qatar maintained its top spot in March 2024, following the Asian Cup, with a median download speed of 313.3 Mbps. To increase capacity and improve speed, operators have been deploying additional 5G sites and activating new 5G carriers, delivering exceptional network performance for their customers.

Qatari stadiums delivered world-class 5G network performance during the Asian Cup

Speedtest Intelligence data show that all six surveyed stadiums recorded a median 5G download speed of over 600 Mbps and a median upload speed of over 90 Mbps.  We identified two distinct groups based on their 5G performance:

  • The first group is where fans experienced the fastest speeds. It is led by Ahmed bin Ali Stadium, with a median download speed on 5G of 964.33 Mbps, followed by  Al-Janoub Stadium and Khalifa International Stadium, with median download speeds of 899.27 Mbps and 888.36 Mbps, respectively. 
  • The second group of stadiums had weaker performance overall but still commanded very high speeds, ranging from 602.20 Mbps for Education City Stadium to 730.73 Mbps for Al Bayt Stadium.

The leading stadiums in terms of median download speed also excelled in upload, with speeds exceeding 108 Mbps. Ahmed bin Ali Stadium and Al-Janoub Stadium had upload speeds of 110.46 Mbps and 110.87 Mbps, respectively. Education City Stadium was at the bottom of the list but still offered excellent download and upload speeds.

Chart of Median 5G Performance of Select Stadiums During AFC Asian Cup 2023 in Qatar

There has been a marked improvement in 5G network performance around the stadiums when comparing the 2023 AFC Cup to the FIFA World Cup in 2022. Al Janub Stadium, previously the top performer, saw an 18.7% increase in download speed to 757.77 Mbps. However, Ahmed bin Ali Stadium surpassed it with a 54.5% increase, reaching 964.33 Mbps in 2024. Khalifa International Stadium saw the most significant improvement since World Cup 2022, an increase in download speed to 888.36 Mbps. Al Bayt Stadium’s median download speed also climbed to 730.73 Mbps.

Chart of Median Download Speeds of Select Stadiums During AFC Asian Cup 2023 and FIFA World Cup 2022 in Qatar

Significant 5G performance improvements during the AFC Asian Cup propelled the six Qatari stadiums to rank favorably against other major sporting venues in the region and beyond, with the six surveyed stadiums used in AFC Cup 2023 just behind Allegiant Stadium in Las Vegas where the Super Bowl took place in 2024.

Chart of Median 5G Performance of Select Stadiums During AFC Asian Cup 2023 in Qatar

Latency is crucial for streaming, video calling, and online gaming and measures real-time online interactions. AFC stadiums had a tight range of multi-server latencies for 5G, except for Khalifa International Stadium. The latter had a lower latency at 20.3 ms, offering less lag and a better streaming experience than Al Bayt Stadium, which had a much higher latency at 33.8 ms. Fans in the other stadium experienced decent response times, ranging from 30.5 ms in Lusail Stadium to 32.7 ms in Education City Stadium.

Chart of Median 5G Multi-server Latency of Select Stadiums During AFC Asian Cup 2023 in Qatar

Web browsing performance across stadiums was excellent during the competition

We used Consumer QoE data to explore web page load time over 5G. These measurements reflect consumers’ real-world experiences of using the internet, like accessing social media sites and searching for information online. Accessing these services with little or no delay means less customer frustration and increased satisfaction. 

For this analysis, we included Abdullah bin Nasser bin Khalifa and Jassim bin Hamad Stadiums due to their larger data samples compared to Education City Stadium. The data shows that users experienced very quick webpage load times over 5G in all surveyed stadiums, with median load times ranging from 1.4 seconds to as low as 1.1 seconds. Fans in Abdullah bin Nasser bin Khalifa and Al-Janoub Stadiums enjoyed marginally faster webpage load times than those in other venues.

Chart of Internet Page Load Time of Select Stadiums During AFC Asian Cup 2023 in Qatar

The introduction of 5G has undoubtedly opened up new possibilities for enhancing the stadium experience for fans and spectators. Thanks to its high speed and low latency, 5G can enable more immersive and personalized experiences beyond traditional live viewing. Insights from the latest AFC Cup demonstrate how Qatar elevated its stadium mobile infrastructure to a world-class level, surpassing its notable efforts during the FIFA World Cup 2022.  This achievement also reflects the significant investments made by network operators to enhance 5G performance and ensure a great internet experience for fans and spectators alike.

To find out how Ookla’s crowdsourced data and analytical tools can help you track network performance during major sporting events, contact us.

Ookla retains ownership of this article including all of the intellectual property rights, data, content graphs and analysis. This article may not be quoted, reproduced, distributed or published for any commercial purpose without prior consent. Members of the press and others using the findings in this article for non-commercial purposes are welcome to publicly share and link to report information with attribution to Ookla.

| March 19, 2024

Sunsetting Networks in Africa will be Gradual and More Selective Than in Other Regions

We recently examined operators’ plans for sunsetting 2G and 3G networks in the Middle East and North Africa (MENA) and highlighted the benefits and challenges of phasing out legacy networks. In contrast, Sub-Saharan Africa (SSA) is just beginning this journey, with South Africa leading the way compared to other large markets like Nigeria, as it aims to shut down 2G and 3G by 2027. This article examines the factors contributing to slower progress in SSA and suggests how operators might expedite the transition.

Key Takeaways:

  • Sunsetting is not yet a priority for most African operators. The shift from 2G/3G to more advanced technologies will be slower in Africa due to economic, social, and infrastructural factors as well as the strong dependence on existing legacy ecosystems. A gradual approach is recommended to maintain digital inclusiveness in Africa.
  • South Africa is the only country in SSA with an established plan to sunset 2G and 3G networks. Cell Analytics® data shows a large concentration of 2G and 3G users in suburban and rural areas as well as along transportation routes. South Africa plans to decommission these networks by 2027, but most countries, including Nigeria, have not yet set a date. We expect network sunsetting to be in full swing from 2030 onwards.
  • Operators should strike a balance between driving progress and maintaining the inclusivity of their services. African operators should continue to support and potentially expand their legacy networks to ensure continued access to critical communication services for most of the population while investing in the roll-out of 4G and 5G networks.

Network sunsetting could play a key role in addressing the growing demand for data and spectrum in Africa

More operators are contemplating turning off their 2G and/or 3G networks to refarm their existing spectrum and combine it with other bands to enhance 4G and 5G services, promising faster data speeds, lower latency, and enhanced connectivity. At the same time, operators seek to optimize spectrum utilization as it is a scarce and expensive resource. 

Our previous article delved into how decommissioning 2G or 3G networks can boost efficiency, reduce costs, and improve customer satisfaction. We also emphasized the importance of careful planning to minimize service disruption and potential financial and reputational damage.

2G and 3G network sunsetting across Africa is evolving very slowly, with no country on the continent having completed the transition yet. This delay in transitioning to newer network technologies has significant implications on the ability of the population to access high-speed internet which is vital for socio-economic development. It is important to explore the reasons behind the slow progress and identify potential strategies to overcome the challenges associated with sunsetting old networks.

3G remains the most prevalent network technology in SSA, but 4G will overtake it by 2027. The GSMA predicts that 3G’s share of connections will fall below 50% in 2025, while 2G adoption will decline under 10%. 4G connections will almost double between 2022 and 2030 to represent nearly half of the total, overtaking 3G by the end of 2027. Continued network upgrades and better device affordability will drive this surge. While 5G adoption will initially be slow, it is anticipated to gain momentum during the second half of the decade, reaching 17% by 2030. This shift will lead to a fourfold increase in mobile data traffic per smartphone by 2028, a higher rate than any other region, to 19 GB per month.

Network sunsetting is more important in SSA because of limited spectrum availability and the rapid growth in demand for faster-speed data services. As regulators released only a small quantity of spectrum, operators resorted to refarming existing spectrum bands to deploy 4G and 5G services. The low-frequency bands occupied by earlier network technologies are valuable due to their excellent propagation characteristics, making them ideal for fulfilling coverage obligations with 4G and 5G.

Network sunsetting in Africa is hampered by the prevalence of legacy infrastructure and the high cost of migrating customers

Many parts of the continent still heavily rely on legacy technology and will continue to do so in the short-to-medium term. This reliance makes the transition to newer generation networks more challenging and costly. In 2023, 3G represented 55% of mobile connections in SSA and is expected to represent a third of total connections by 2030. 

This shows that many revenue-generating customers are still on legacy networks. Operators are understandably hesitant to risk service disruptions and incur the significant investment and planning required to upgrade the infrastructure, which will make the transition more challenging and lengthier. Besides, 3G was launched less than a decade ago in several countries. In Burundi, Cameroon, Ethiopia, and Liberia, some operators have only introduced 3G services since 2019 or later, meaning the network costs have not yet been fully amortized. 

In the enterprise sector, Africa hosts millions of machine-to-machine (M2M) devices, some of them in difficult-to-reach geographies or embedded in cars and equipment, making replacement or upgrades challenging. For example, South Africa had 11.5 million M2M connections in Q3 2022, according to the Independent Communications Authority of South Africa (ICASA), while Kenya recorded more than 1.5 million M2M connections in Q3 2023.

Despite the expansion of mobile networks in many African countries, coverage gaps persist, posing a connectivity challenge. If operators decide to rush the decommissioning of older networks, they could leave many people losing mobile access, thus widening the digital divide. 2G is particularly suitable for the region’s large rural population because 2G base stations can provide good coverage across large distances. That is why in many African countries, 2G coverage of the population has reached or exceeded 90% while that of 3G and 4G lag behind.

The prevalence of basic and feature phones across the continent is another barrier. Handset compatibility issues with newer technologies and the higher costs of smartphones and data plans represent significant hurdles for low-income populations, complicating the transition process.

Finally, operators may face regulatory challenges when retiring old technologies. Spectrum freed from legacy networks may not be readily available for new networks after the switch-off if it is tied to a specific technology. Repurposing it for modern networks can also be a bureaucratic and time-consuming process.

African operators can adopt different strategies to address challenges that hinder the sunsetting process

The challenges outlined above contribute to the slower rate of network sunsetting in Africa compared to other regions. However, operators can employ various strategies to facilitate the decommissioning process while mitigating the negative impact on revenue and brand.

The decision to sunset one network before another should be informed by market conditions, including the number of customers that use legacy networks, the cost of maintaining their operations, and the dependency of enterprise services on these networks. In either case, it is important to adopt a phased approach to sunsetting, prioritizing areas with higher 4G coverage first, before moving to rural and remote regions. This approach will help to minimize disruption and allow users more time to prepare for the transition.

Operators could encourage subscribers to upgrade to newer devices that support 4G and 5G networks through incentives such as handset trade-in programs or subsidies for low-income individuals. They should couple it with awareness campaigns to educate subscribers about the benefits of newer networks and the steps they need to take to ensure a smooth migration.

Operators should also communicate early about potential service disruptions and the timeline for the switch-off to make the necessary adjustments to their M2M systems. For example, they could offer incentives or subsidies to upgrade to 4G-grade M2M technologies, such as LTE-M, which offer longer usable life, larger operating range, and higher data rates. Offering assistance to enterprises to address any network compatibility and reliability issues during and after the migration is also essential. The regulator should be involved in the discussions around sunset plans as it may require operators to maintain some capacity and coverage for critical IoT infrastructure.

For spectrum reuse, operators should lobby the regulators for technology-neutral licenses, enabling them to use the old spectrum once released. Reducing regulatory constraints and requirements will help to improve network coverage and reduce capital expenditure. A recent GSMA report highlights that countries in Africa that adopted technology-neutral licensing have seen a 30% rise in mobile internet penetration, and a 74% improvement in 4G coverage, in contrast to 24% and 57%, respectively, for countries without such licensing.

Network sunsetting is not yet a priority in Africa given the prevalence of 2G and 3G connections

2G will likely remain important during the rollout of 4G and 5G for years to come because it supports essential consumer services in Africa, including voice, basic information, and mobile money transactions. As 4G provides a much better data experience than 3G, operators will likely consider sunsetting 3G before 2G. We used Speedtest Intelligence’s “Availability” data to get the percentage of users with a service-active device who spend the majority of their time connected to 2G and 3G in Nigeria and South Africa, the two largest markets in Sub-Saharan Africa by revenue. This data is a proxy for the relative penetration of 2G and 3G in these markets. Since customer-initiated Speedtest® measurements require a relatively modern phone, samples reported as 2G or 3G indicate the unavailability of 4G and 5G coverage rather than actual 2G and 3G usage. As such, we rely on this data solely to gauge the relative penetration of 2G and 3G in these markets. 

Speedtest Intelligence® data showed that the 2G/3G share of connections has been trending down in Nigeria and South Africa throughout 2023. By February 2024, 3G penetration in Nigeria was at 7.4% and in South Africa at 4.3%, with 2G penetration significantly lower at 0.7% and 0.4%, respectively. This suggests that more subscribers in Nigeria than in South Africa spend the majority of their time on 2G/3G.

According to the Nigerian Communications Commission (NCC), 67.6% of subscribers used 2G or 3G as of December 2023. ICASA in South Africa does not publish detailed mobile connection technology data. However, we can estimate that 2G/3G subscribers accounted for around 35-40% of total connections in South Africa at the end of 2023 based on Speedtest Intelligence and NCC data. Since South Africa is the most developed mobile market in SSA, the penetration of legacy networks is expected to be much higher in less developed markets.

Chart of Share of2G and 3G Samples of Total in Nigeria
Chart of Share of2G and 3G Samples of Total in South Africa

Network sunsetting is not yet on the table for Nigerian operators

Nigeria’s journey with 5G began in December 2022 with the auctions for 5G licenses using the 3500 MHz spectrum band. MTN and ISP Mafab Communications emerged as winners. Airtel acquired its 5G license about a year later. MTN launched 5G in September 2022, initially in seven cities, expanding to 300 cities by the end of 2023. Despite this, 5G adoption has been limited, with 4G capturing a growing market share and 5G representing just 1.0% of mobile subscribers by the end of 2023.

This is mainly due to limited 5G coverage, device affordability, and customer demand. ITU’s report shows that while 94% and 87% of the population had access to 2G and 3G coverage, respectively, only 6% could access 5G at the end of 2022. Furthermore, 58% of the urban population had a smartphone at the end of 2022, compared to only 32% in rural areas, according to the GSMA.

Call Analytics® identified areas with 2G and 3G concentration between February 2023 and January 2024 in high-population centers, Abuja, Ibadan, and Lagos. The red dots on the map pinpoint customers connected to 2G and 3G because they have SIM cards not provisioned for LTE (including roamers), lack 4G coverage, or use devices incompatible with 4G.

Data shows that mobile operators still heavily rely on 2G and 3G networks to provide connectivity across city centers, suburban regions, rural areas, and along transport routes. With the rising cost of living, people are expected to reduce their data usage and continue using 2G and 3G devices due to budget constraints and increasing mobile phone prices. Notably, Nigeria’s annual inflation rate reached a nearly 30-year high of 28.9% in December 2023 due to currency devaluation, reduction of subsidies, and foreign exchange liberalization. 

The combination of high living expenses and Nigeria’s extensive geography suggests the full transition to modern networks will be slow and gradual while 2G and 3G networks remain in operation for the foreseeable future. This is evidenced by MTN and Airtel’s renewal of their 2100MHz spectrum license in 2022, primarily for 3G uses while progressing with 5G deployment. An operator can choose to repurpose that spectrum for 4G and 5G in the future or use dynamic spectrum sharing to share it between different technologies. 

South Africa plans to turn off 2G and 3G by the end of 2027

Local operators have long awaited the release of new spectrum to enhance 4G services and launch 5G. Faced with this delay, Vodacom and MTN introduced 5G services in May and June 2020 using the emergency spectrum granted by ICASA during COVID-19 and refarming some of their existing spectrum assets on 2G and 3G.

The much-anticipated spectrum auction was finally completed in March 2022 with spectrum bands across 700 MHz, 800 MHz, 2.6 GHz, and 3.5 GHz bands awarded to six operators Cell C, Liquid Intelligent Technologies, MTN, Rain, Telkom, and Vodacom. 

Cell Analytics’ Service Availability maps show that 2G and 3G remain prevalent in suburban and rural areas of major cities like Cape Town, Johannesburg, and Pretoria. While South Africa leads SSA in 4G and 5G penetration, 3G is still widespread and offers a satisfactory experience for basic use cases like checking the news. 2G is less relevant since it supports mainly voice services but occupies a valuable sub-1Ghz spectrum which could be repurposed for more efficient technologies.

In light of this, the Department of Communications and Digital Technologies (DCDT) proposed a plan in 2022 to sunset 2G and 3G networks to free up spectrum for 5G and future technologies. Initially, the plan aimed to shut down 2G and 3G networks by the end of June 2024 and March 2025, respectively. The DCDT subsequently extended the deadlines twice to give more time for the operators to prepare for the transition. The most recent amendment was in February 2024, scheduling the phase-out to begin in June 2025 and conclude by the end of 2027. It will also include new spectrum auctions, likely to take place in 2024

The revised deadline seems to be more practical, but it still needs to be discussed with all the stakeholders to make sure that the end-users and businesses don’t face any challenges during this transition. The DCDT will allow operators to choose which network to switch off first. Based on operators’ current positions on network retirement, 3G will likely be the first to go:

  • Vodacom’s initial plan was to end 3G services before 2G, but their latest stance is less definitive. Their decision will significantly impact Cell C, whose contract customers use Vodacom’s network.
  • Telkom has already shut down most 2G services as they account for less than 1% of its traffic.
  • MTN suggested that 3G should be shut down before 2G, as migrating 2G devices to 4G will take longer than moving from 3G. This presents a challenge as MTN has the highest proportion of 3G samples in South Africa, (according to Speedtest data) at 6.35% in January 2024 compared to 3.4% for Vodacom and 3.3% for Telkom.

A phased approach to retiring networks, with consideration for affordability and coverage, is essential to maintain digital inclusiveness

The sunsetting of 2G and 3G networks is a global trend, led by developed countries. It promises to bring benefits like faster data speeds, improved connectivity, and more efficient spectrum usage. Yet, Sub-Saharan Africa trails in this transition because of the heavy reliance on legacy networks, the cost barrier to the operators and consumers, and the unequal distribution of new network infrastructure, especially in poorer regions. 

2G and 3G networks form the backbone of mobile communications for a large proportion of the population, enabling vital services such as voice and mobile money transactions. Operators thus face the challenge of investing in advanced network rollouts while maintaining and even expanding their legacy networks to ensure everyone has access to communication services. 

Using network analytical tools such as Ookla’s Speedtest Intelligence and Cell Analytics can provide valuable insights to help prepare for network decommissioning. These tools can track the progress of the switch off, and monitor its impact on network and spectrum usage as well as gauge consumer sentiment, ensuring that the transition to 4G and 5G is as smooth and beneficial.

Ookla retains ownership of this article including all of the intellectual property rights, data, content graphs and analysis. This article may not be quoted, reproduced, distributed or published for any commercial purpose without prior consent. Members of the press and others using the findings in this article for non-commercial purposes are welcome to publicly share and link to report information with attribution to Ookla.