| October 11, 2021

Internet Access on U.S. Tribal Lands is Imperative to Daily and Creative Life


Tribal lands in the United States have often been sidelined or simply excluded from decisions critical to funding infrastructure initiatives and improvements. As COVID-19 revealed the internet to be an essential utility for daily life, the internet served as a lifeline and an opportunity for people living on reservations and other Tribal lands to connect with education, telehealth resources, businesses and the “at large” community. But with 628,000 Tribal households having no access to the internet, access to those critical services is lacking for too many.

In honor of Indigenous People’s Day, Ookla for Good spoke with a Cherokee Nation citizen and advocate about the importance of the internet to Native communities. We’ve also provided analysis on internet performance on federally recognized Tribal lands and off-reservation trust land areas, including an easy download for anyone who would like to do further research on this important topic.

The internet is a vital connector between places and cultures

We sat down with Joseph Cloud, formerly the Community Hope Center Project Manager at the Boys and Girls Club of Chelsea, Oklahoma and a student of the Cherokee Cultural Studies program at Northeastern State University, to discuss the impact that digital access has on Indigenous communities.

The Boys and Girls Club of Chelsea is funded by the Delaware Tribe and Cherokee Nation to help the children of the region reach their full potential. Cloud began working with the Club when they received a grant from the state of Oklahoma through the CARES Act. Cloud recounted that the CEO contacted him to say they had received a large grant and needed to spend it within a month.

The best way to do that was to install high-speed internet at the Club. Before, they had the one router that served the whole space and you couldn’t access the Wi-Fi from the outbuildings. I thought, “How can we make this center a space for kids who don’t have internet at home?” We installed internet and bought lots of equipment so kids could come there and do their homework. We bought specialized laptops with different editing suites so they could grow their skills in things like photography as they grew older. We weren’t designing for a certain kid, we were growing the program for the future.

The internet was important to getting this project done, too. Cloud was living in New Orleans at the time. He contacted a friend who was a tech wizard in Nashville, Tennessee to consult on this project in Oklahoma. Together they settled on a Ubiquiti system that provides high speed internet throughout the facility.

Cloud has unique insight into how the internet benefits kids on the reservation beyond access to Wi-Fi, too. He grew up as part of the Cherokee Nation in Oklahoma but he was separated from the Tribal community when his family moved to Florida. “All I’ve had in the last 21 years to stay connected to my culture is the internet,” he stated, “I needed to follow an instinct to strengthen my connection with my culture and my heritage.” He found the Cherokee studies program at Northeastern through online research and now continues to rely on the internet to attend class and connect with peers. “Schools are doing very little to hold together Native scholars — so we must turn to the internet to stay connected, not just across the country, but also locally” he said.

Last year, Cloud attended the Symposium on the American Indian, which was held virtually for the first time in 2020. Attending from Florida, he learned from leaders within the Indigenous advocacy community about a variety of issues. Digital access has empowered Joseph to reconnect with his Indigenous heritage through virtual events, online school and a cross-cultural online community.

Digital access has also had a large impact on his advocacy work, “The internet allows us to bring people into the conversation. We can combat power dynamics by addressing Indigenous issues with predominantly white institutions. These are very important moments.” For Joseph Cloud and so many other Native people, the internet is essential. It provides them with a platform to connect with other scholars, artists and with the world at large — allowing them to be heard and advocate for themselves and their communities.

Too many Tribal lands fall behind U.S. averages for internet performance

As we’ve seen, the internet is a critical utility for people living on Tribal lands in the U.S. However, that vital connection only works well if the internet performance is strong enough to support modern use cases, like video conferencing and streaming. We analyzed Speedtest Intelligence® data from American Indian/Alaska Native/Native Hawaiian (AIANNH) Areas in the U.S. during Q3 2021 to see how they compare to the U.S. as a whole.

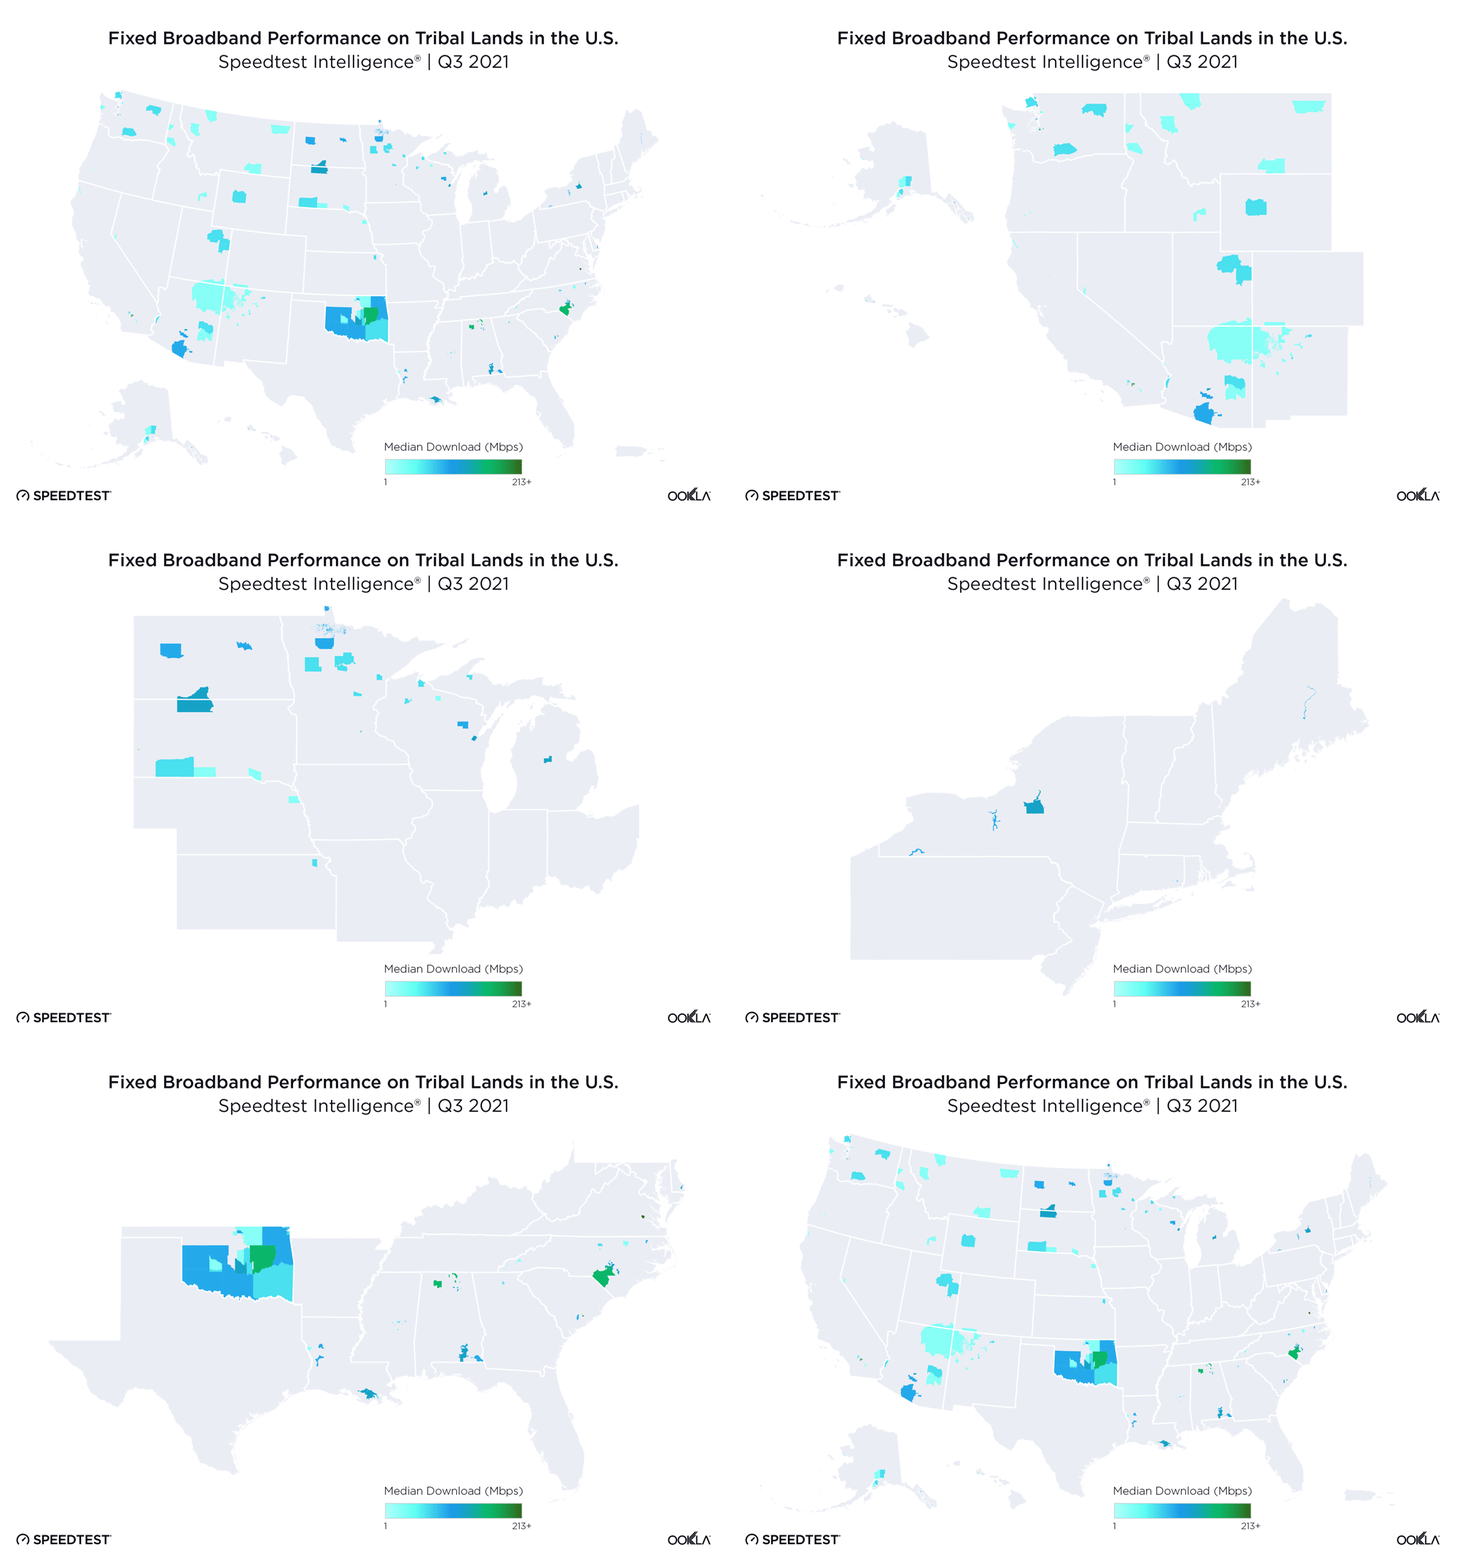
29% of Tribal lands did not meet the FCC’s fixed broadband standards for download speed

Our analysis showed that fixed broadband speeds varied wildly between different AIANNH areas in the U.S. during Q3 2021. The Chickahominy Tribal designated statistical area between Richmond and Williamsburg, Virginia, for example, with one of the fastest median broadband speeds among Tribal lands in the U.S. at 218.86 Mbps, serves as a model of how state funding can radically improve internet infrastructure and performance. Quinault Reservation in northwestern Washington had one of the slowest download speeds at 3.98 Mbps.

Of the 140 AIANNH areas that met our sample count criteria for fixed broadband, 36 did not meet the FCC minimum download speed for broadband of 25 Mbps. Sixteen did not meet the minimum 3 Mbps for upload. For context, the median download speed over fixed broadband in the U.S. was 119.84 Mbps. Only 13 Native areas exceeded that.

ookla_tribal-lands_us_fixed-broadband_1021-1

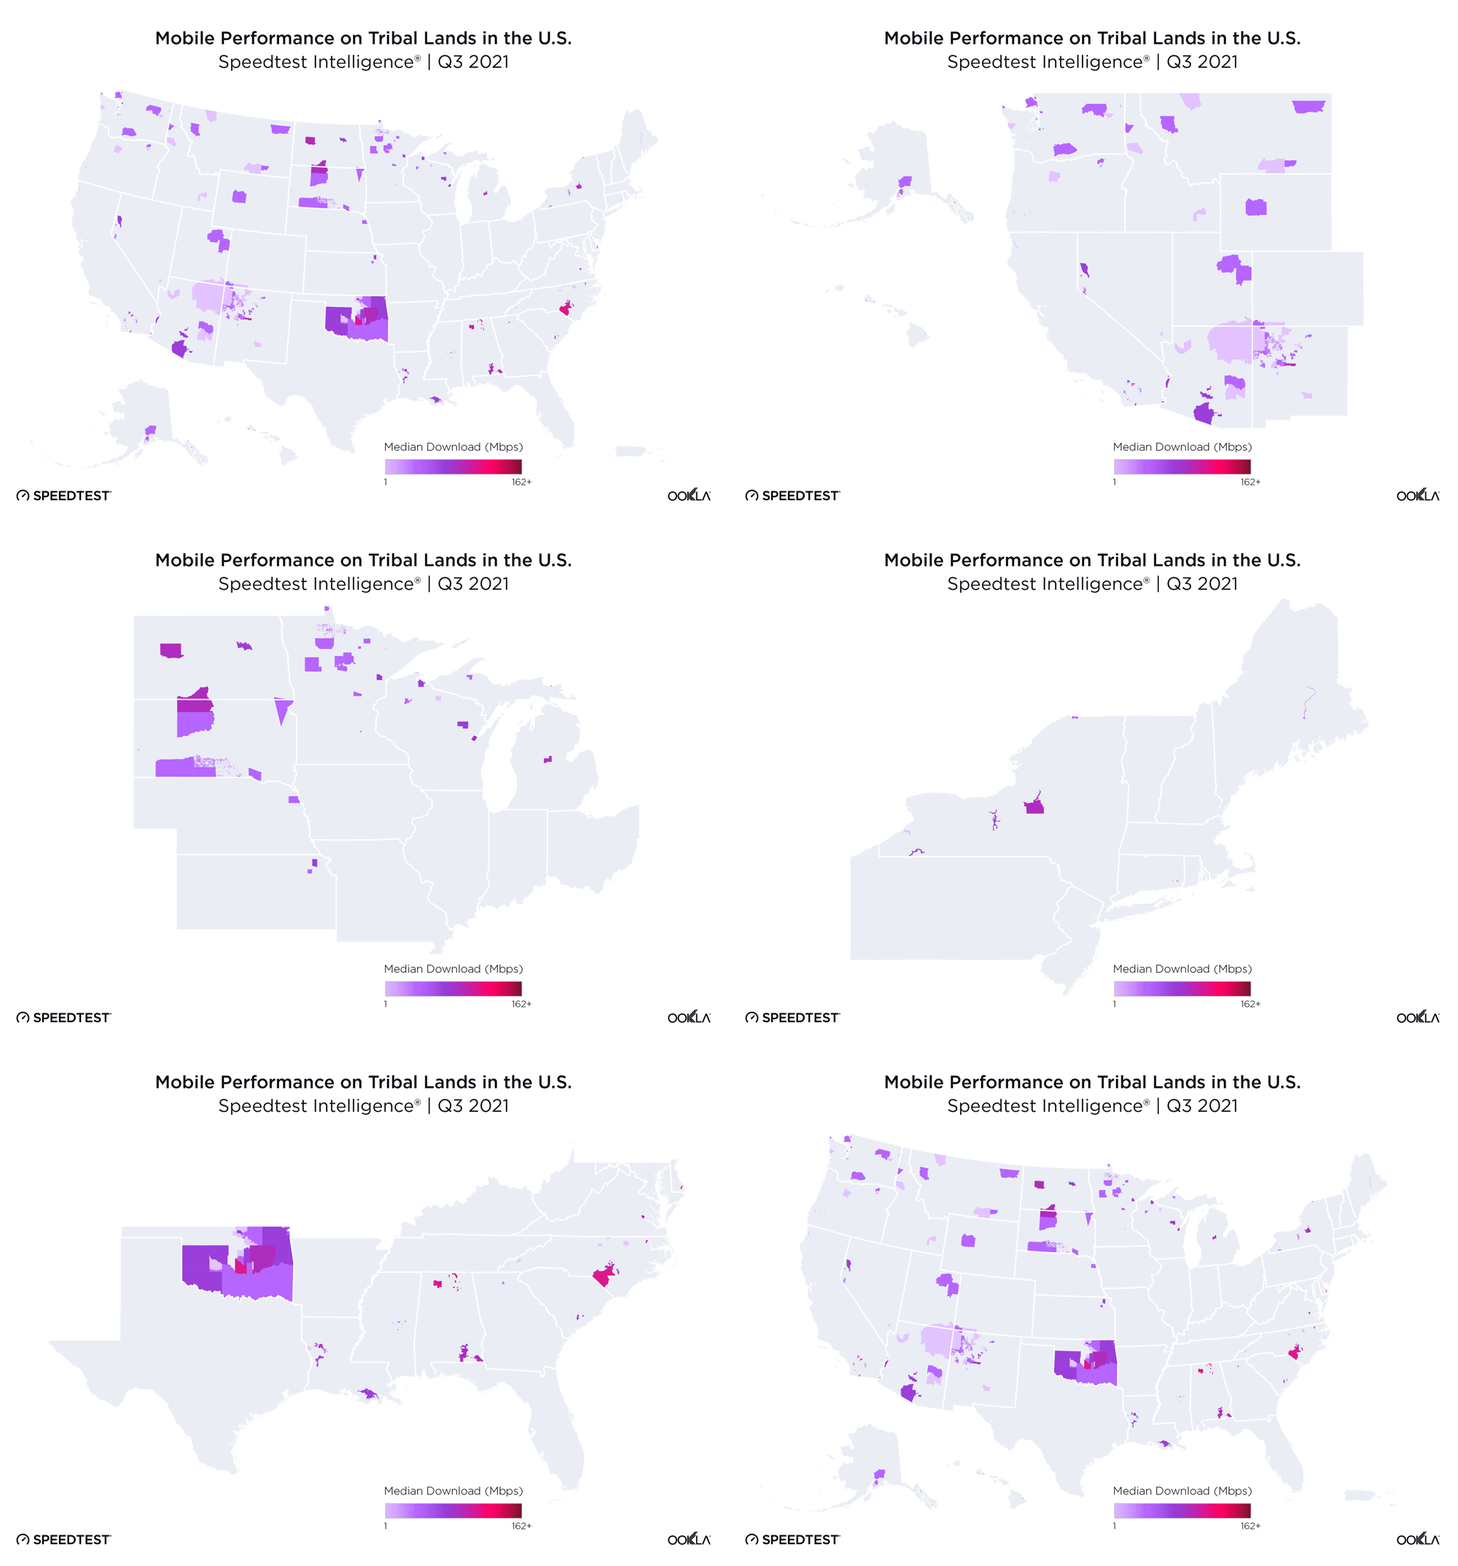
124 Tribal lands had slower mobile download speeds than U.S. average

There was also a wide array of mobile speeds across AIANNH areas in the U.S. during Q3 2021. Of the 203 Tribal lands that met sample count criteria for mobile performance, 124 showed a slower median download speed than the U.S. average of 44.84 Mbps. Fifty-eight Native areas showed a mobile download speed less than 25 Mbps and 17 had uploads slower than 3 Mbps. Lualualei Hawaiian Home Land, on the west side of Oahu, had one of the fastest median download speeds over mobile during Q3 2021 at 162.09 Mbps. Moapa River Indian Reservation in southern Nevada had one of the slowest median download speeds over mobile during the same period at 3.73 Mbps.

ookla_tribal-lands_us_mobile_1021

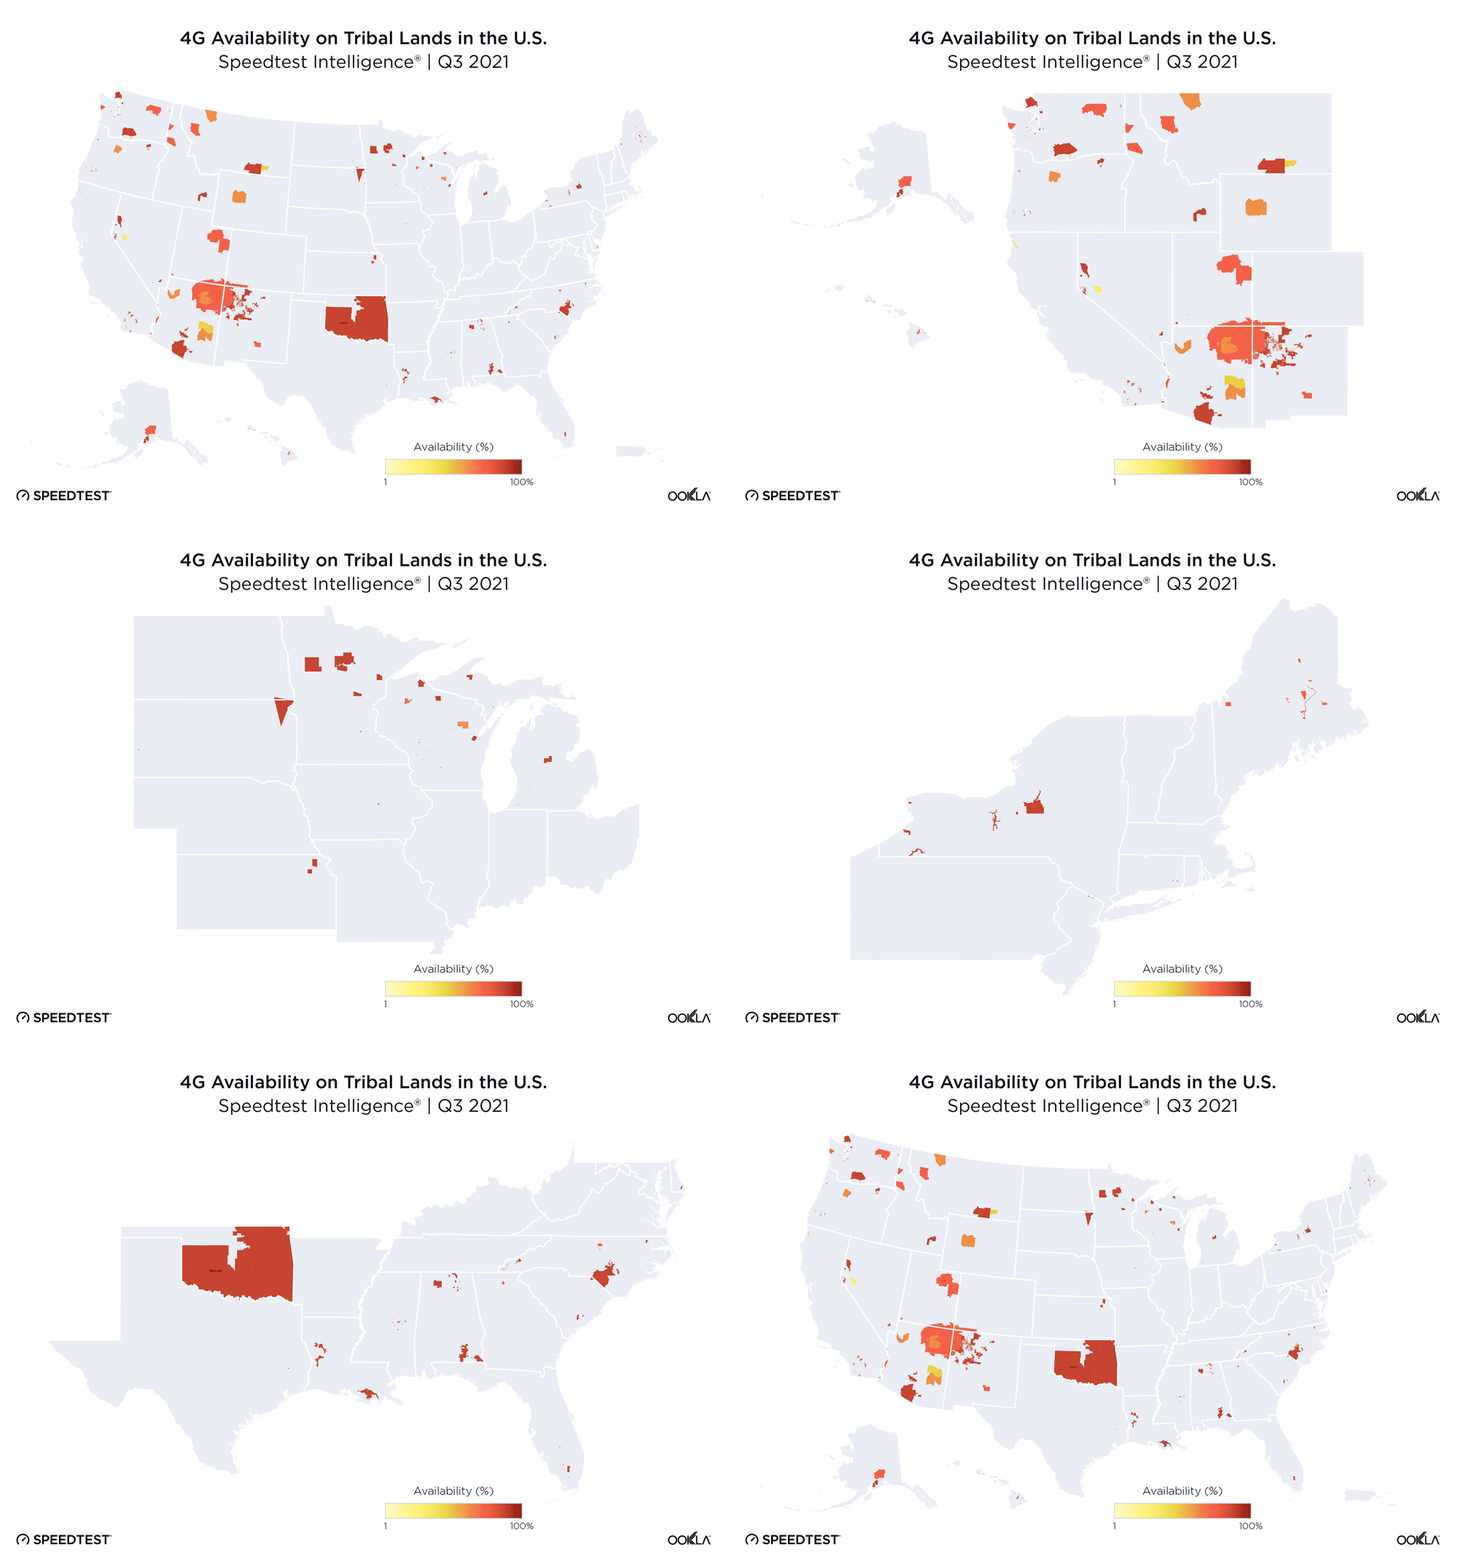
4G Availability varies widely between Tribal lands

Of the 217 Tribal lands with sufficient samples, 102 showed a 4G Availability (the percent of users on all devices that spend the majority of their time on 4G and above) lower than the U.S. average of 96.0% during Q3 2021. Nine Tribal lands showed 100% 4G Availability: Auburn Rancheria in California, Big Pine Reservation in California, Reno-Sparks Indian Colony in Nevada, Soboba Off-Reservation Trust Land in California, Sycuan Reservation in California, Viejas Reservation in California, Kapolei Hawaiian Home Land, Waimanalo Hawaiian Home Land and the Kiowa-Comanche-Apache-Fort Sill Apache/Caddo-Wichita-Delaware joint Oklahoma Tribal statistical area. Walker River Reservation in Nevada had one of the lowest 4G Availability calculations at 30.2%.

ookla_tribal-lands_us_4g-availability_1021g-1

The internet is a lifeline and a basic utility. While some Tribal lands do have good connectivity and speeds according to our data, those that do not are being further left behind. As experts in internet performance (but not Tribal policy), we are offering our full Tribal data set for anyone who would like to do further analyses. Download the full data set here.

Ookla retains ownership of this article including all of the intellectual property rights, data, content graphs and analysis. This article may not be quoted, reproduced, distributed or published for any commercial purpose without prior consent. Members of the press and others using the findings in this article for non-commercial purposes are welcome to publicly share and link to report information with attribution to Ookla.

| February 14, 2018

Android or iOS, Who’s Winning Gold in the Global Speed Race?

All eyes are on South Korea this month as the world’s top athletes compete to stand on top of that all-important podium. But what we’re interested in is how their mobile networks are holding up back home. So we took a look at Speedtest results to get a global picture of the competition between Android and iOS — the operating system that powers all those Apple devices — by comparing speeds, top devices and operating systems by country.

In order to qualify for this round of analysis, countries had to show Speedtest results from at least 670 unique mobile devices during January 2018.

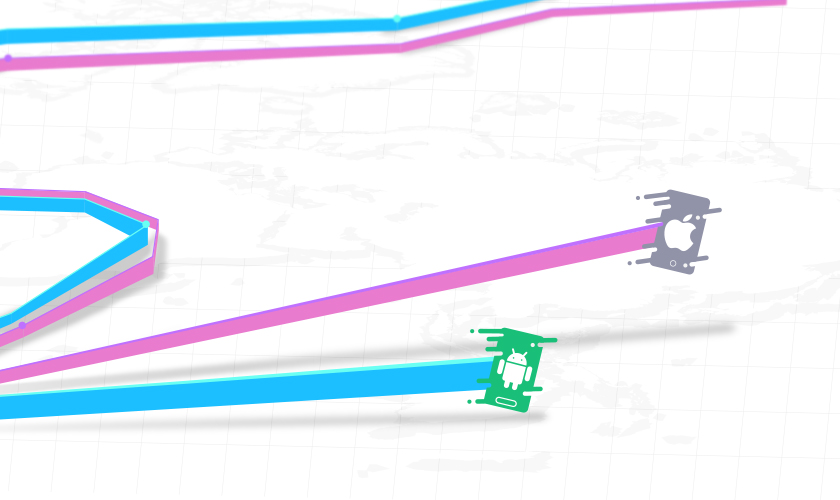
Who’s faster? #TeamAndroid or #TeamiOS?

You might think that speeds on Android and iOS are relatively similar within a country. Not true.

While the average country-level speeds we report in the Speedtest Global Index are a good indicator of the baseline internet speeds in a country (and how they compare with the world), there’s more to the story. From device age to market saturation, there are a lot of factors that play into potential differences in speeds experienced by users on Android versus those on iOS.

But those effects vary by country. And this is where things get really interesting.

Android’s best showings

Android devices saw a faster mean download than those on iOS in 25 of the countries we surveyed. Android download speeds were 24.9% higher than those on iOS in Iraq, 23.9% in South Africa, 19.0% in Mongolia, 17.2% in Hong Kong and 12.8% in Kuwait.

Where iOS wins

On the other hand, when iOS devices are faster, they’re a lot faster. There are 60 countries on our list where the mean download speed on iOS is more than 10% higher than that on Android. Highlights include: Thailand where mean speed for iOS results was 60.5% faster than those over Android, Nigeria (51.7%), Kenya (43.4%), Bangladesh (41.5%) and Japan (38.3%).

What devices are people really using?

Poke around the above map a little and you’ll see the list of the four most common devices we were able to identify in our results.

Apple dominates

With only 28 different models of iPhone in our results and 1,983 different types of Android phones, math is on Apple’s side when it comes to ranking for top devices. The iPhone 7 takes the top spot in 72 countries, including Brazil, Germany, Italy, Russia, Saudi Arabia and the United Kingdom. The iPhone 6 leads the list in 12 countries, including China, Malaysia and Thailand. Georgia was the only country whose most common device was the iPhone 5.

Android wins for diversity

While only 16 countries showed an Android device as the most common phone in our data, it was refreshing to see a wide number of brand names. The Samsung Galaxy S7 topped the list in Croatia, Israel and Peru. The Samsung Galaxy S7 Edge was the leading device in Honduras, Pakistan and Tunisia. The Samsung Galaxy S8 was the most popular device in Serbia.

Six countries showed the Xiaomi Redmi Note 4 as their most popular device, including Bangladesh, Belarus, Greece, India, Indonesia and the Ukraine. The Xiaomi Redmi 4X was the most common device in Kyrgyztan. In Finland the most common device in our results was the OnePlus 3T. In Algeria it was the Oppo F1s.

The diversity of manufacturers increases as we look beyond the top spot. Despite difficulty cracking the US market, the Huawei Honor 8 is the number 2 phone in Finland and two Huawei models make number 4 in Nigeria and Serbia. We also saw a lot more Samsungs in the number 3 and 4 slots.

Ookla retains ownership of this article including all of the intellectual property rights, data, content graphs and analysis. This article may not be quoted, reproduced, distributed or published for any commercial purpose without prior consent. Members of the press and others using the findings in this article for non-commercial purposes are welcome to publicly share and link to report information with attribution to Ookla.

| April 13, 2022

The Mixed Picture for 5G in Europe

Ookla® recently hosted a webinar on “Why is 5G in Europe Falling Behind, and what can we do about it?” We gathered representatives from two of Europe’s leading 5G operators, Three UK and KPN, to talk about their approach to 5G and some of the challenges they have faced. We were also joined by industry experts from the U.K. regulator Ofcom, leading equipment vendor Ericsson, as well as Counterpoint Research. Here is our summary of some of the key takeaways from that webinar.

5G makes headways in Europe … uptake disappoints 

Operators’ lack of interest in 5G cannot be blamed. According to GSMA Intelligence, a majority of European countries (34 out of 50) have already deployed 5G, and just over half of operators in the region (92 out of 173) have launched 5G networks. 

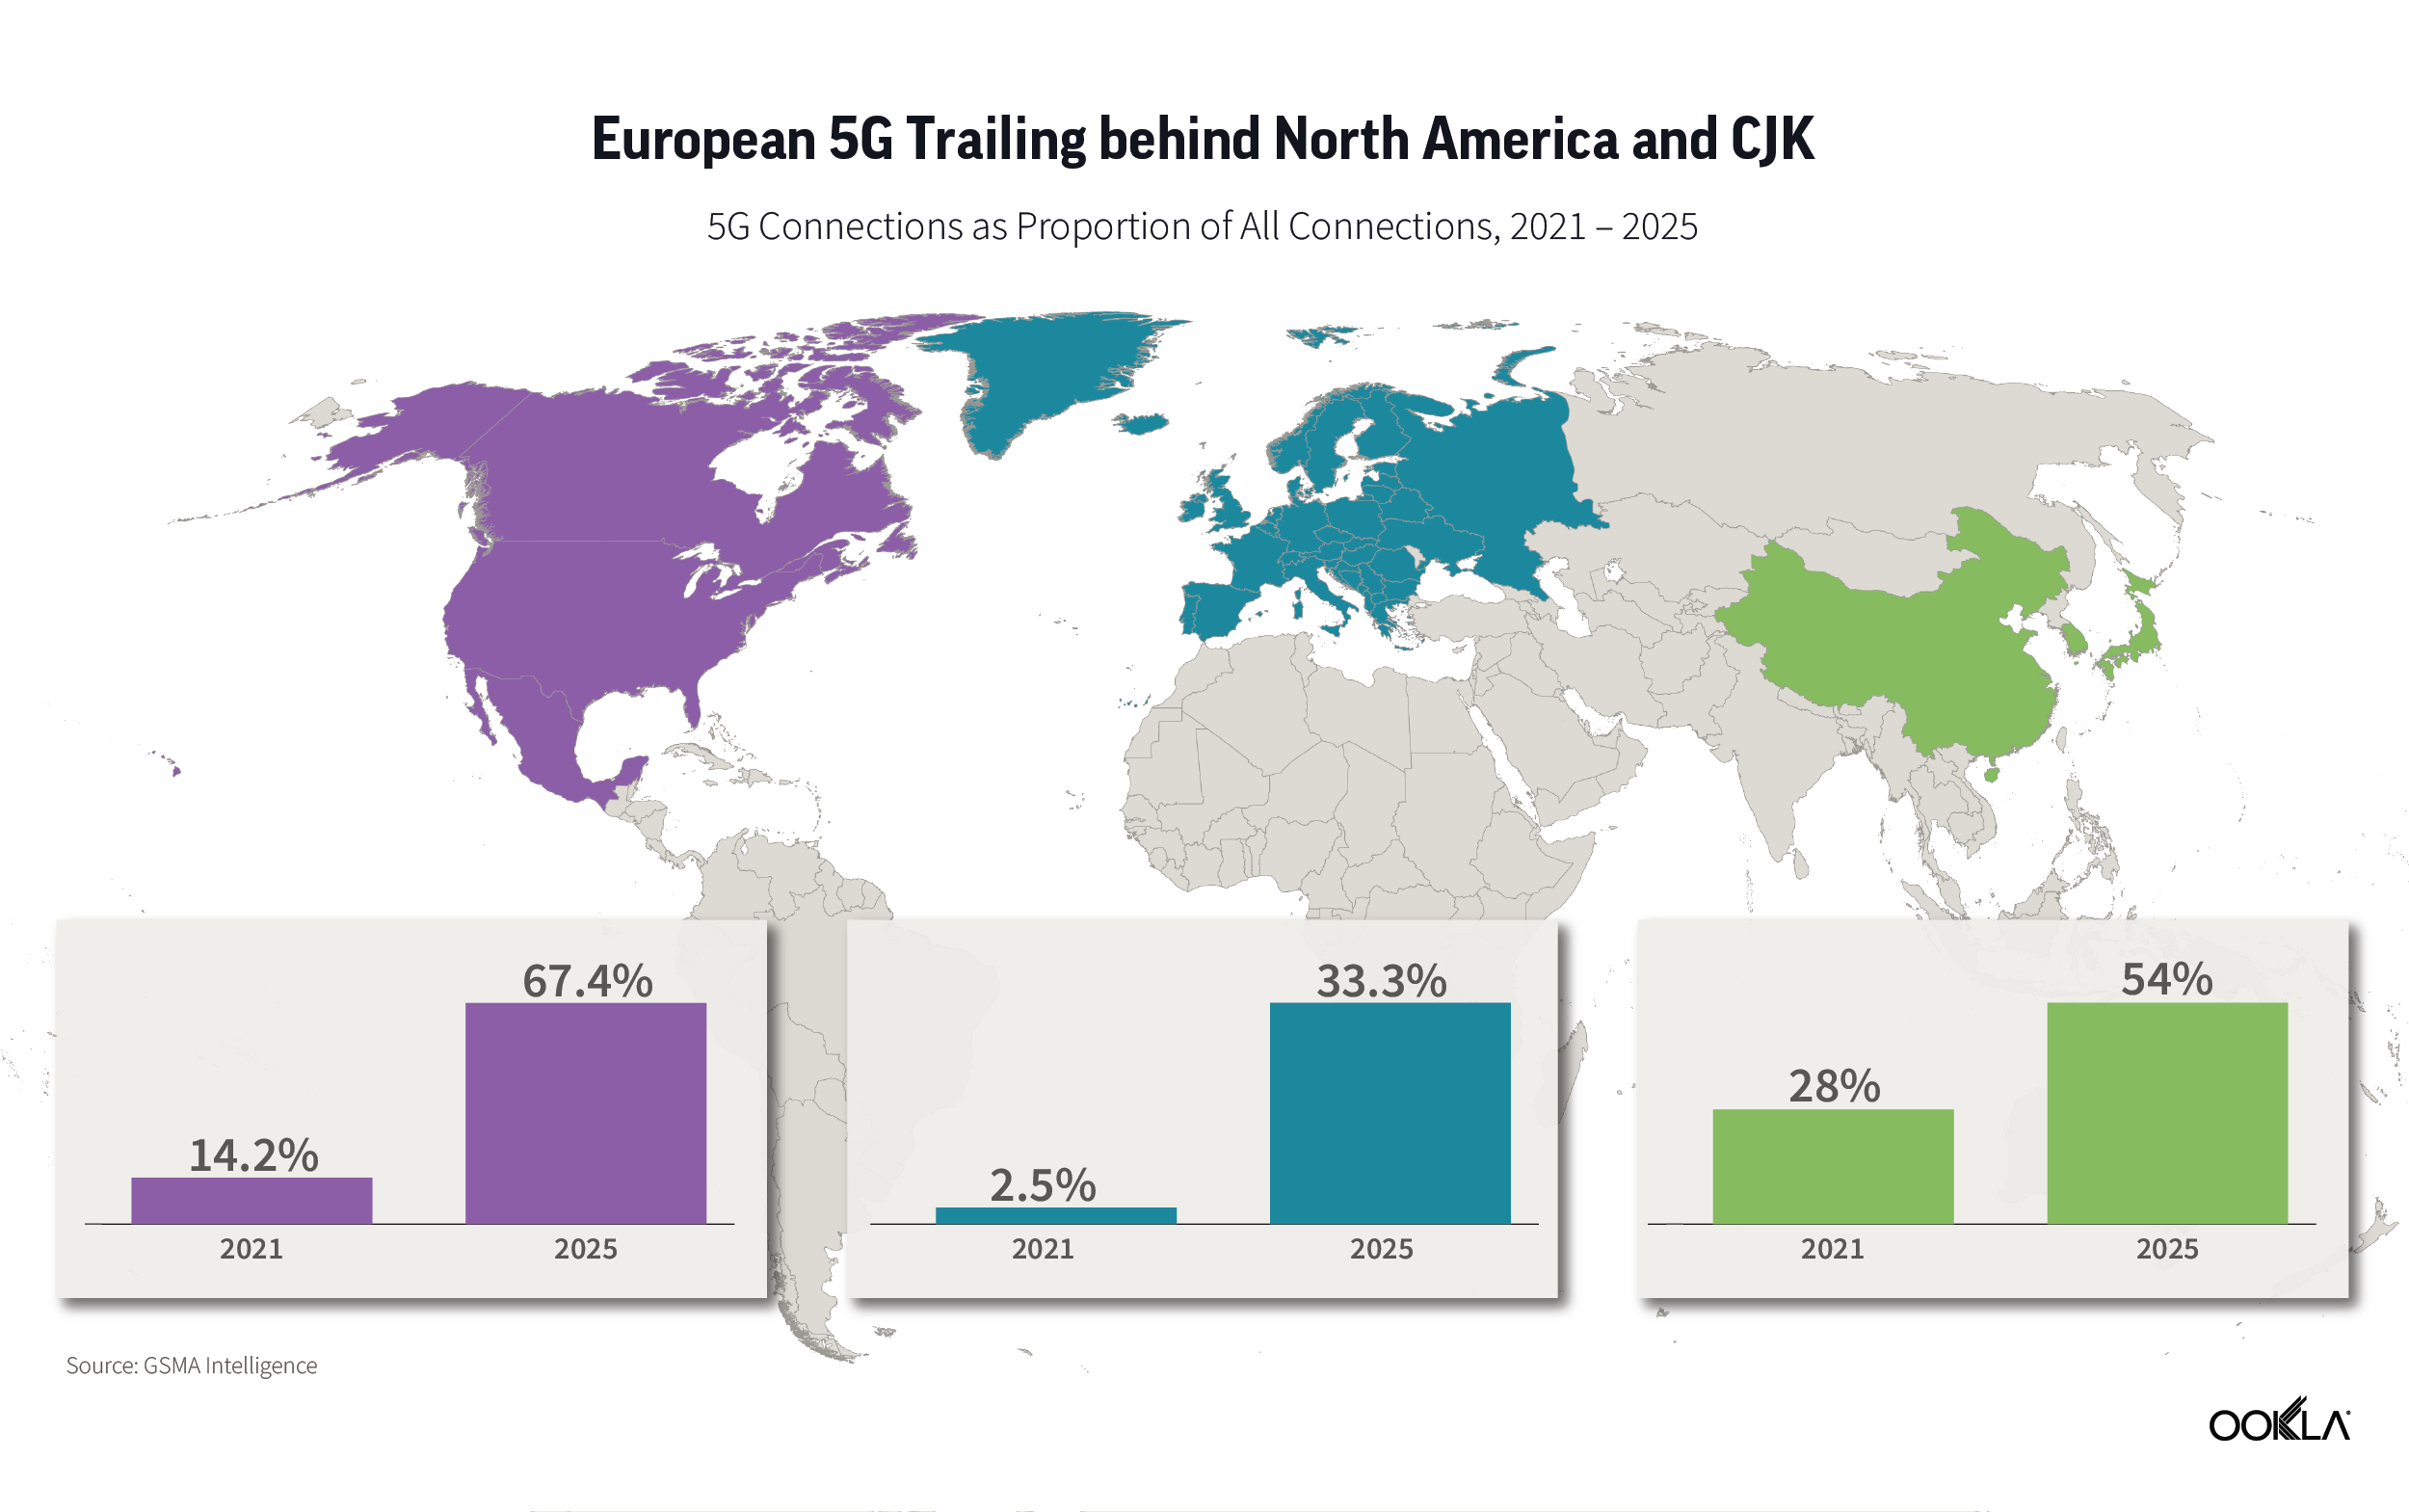
However, looking at 5G uptake measured as the proportion of 5G connections of total connections) Europe performs poorly with only 2.5% as of Q4 2021 according to GSMA intelligence. This places it well behind North America, China, Japan, and South Korea. While adoption will pick up over the next couple of years, Europe will still lag behind other regions. 

Factors driving 5G adoption


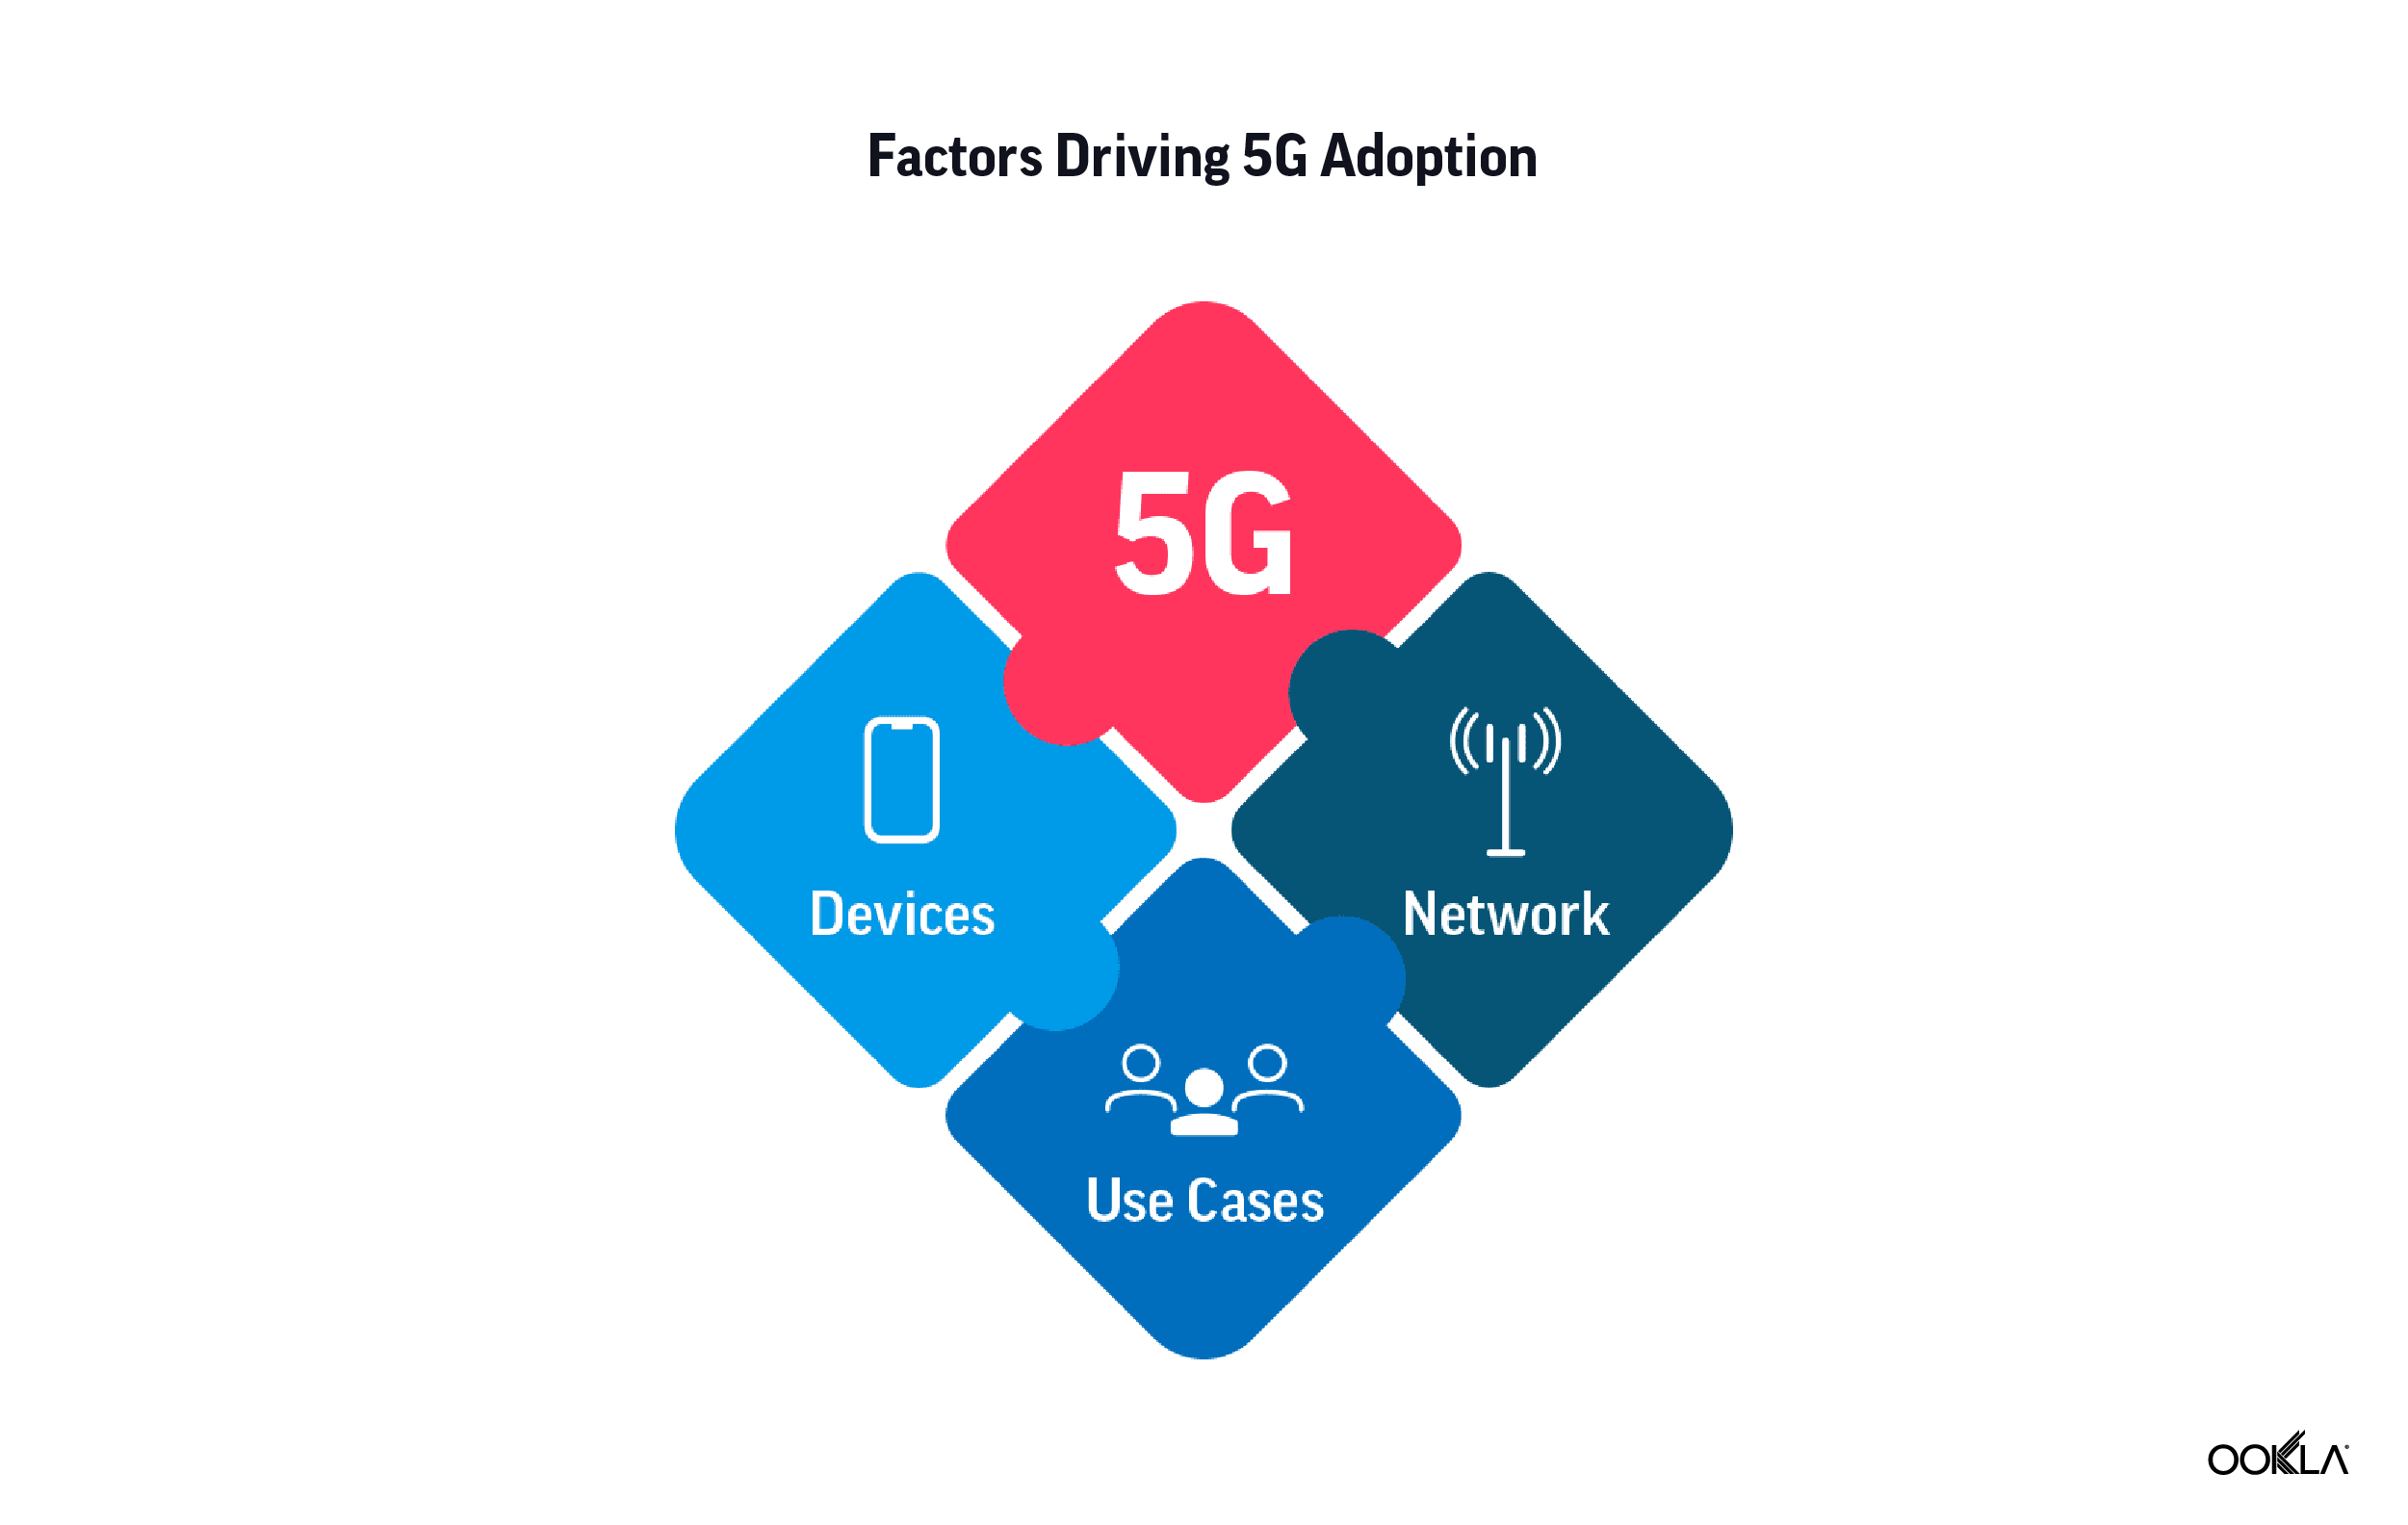
The best way to express the key takeaways from the discussion is to think about the factors that affect 5G adoption:

  • Network. This covers spectrum assignments, network roll out, and market structure 
  • Devices. Here this includes consumer devices such as smartphones, but as 5G scales there will be more dedicated industrial 5G devices in the market and other connected consumer devices e.g. AR/VR.
  • Use cases. The fact of the matter is that technology for the technology’s sake won’t sell. Unless there are appealing use cases leveraging the technology the end users will remain unconvinced. These could range from delivering broadband access to rural areas via 5G Fixed Wireless Access (FWA) or private 5G networks for manufacturing plants. 

The many flavors of 5G

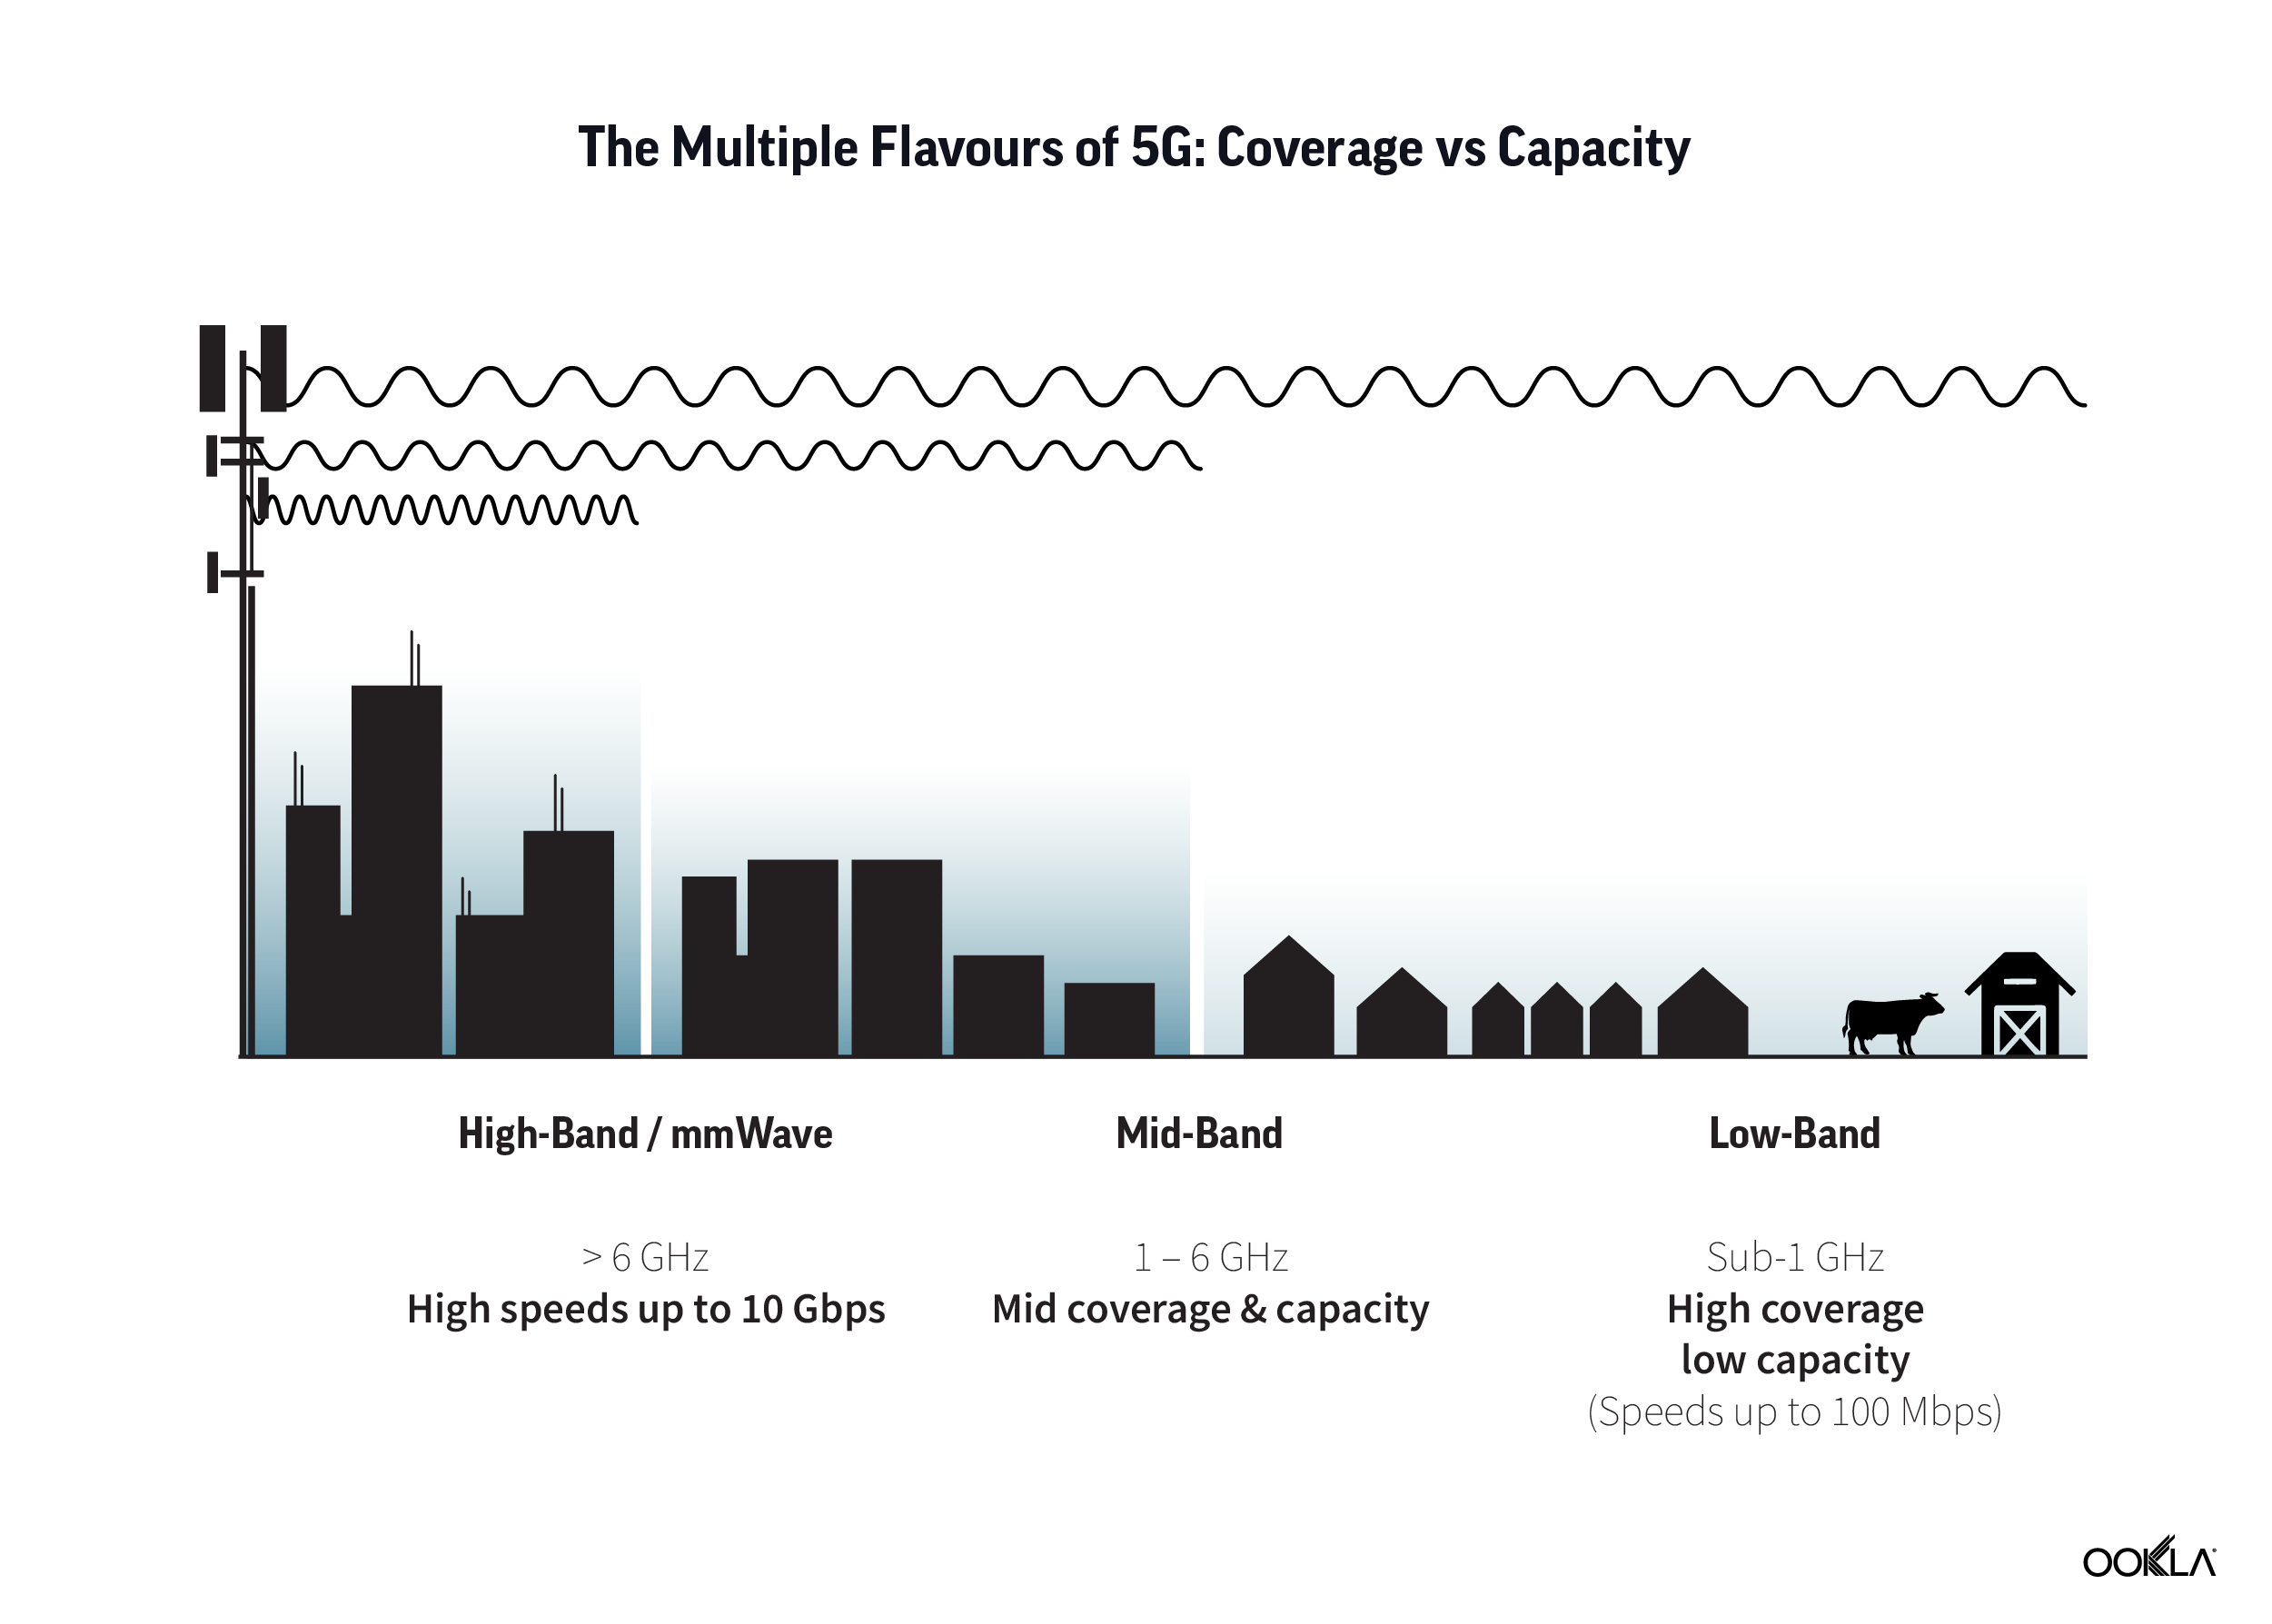
The fact that “5G is not one size fits all,” was highlighted throughout the panel. The key to understanding 5G is understanding the spectrum and there are two key considerations to keep in mind: speed performance and geographical coverage.

While mmWave is capable of delivering super-fast speeds — much faster than those that sub-6 GHz spectrum can support — sub-6 GHz signals are able to travel farther than mmWave, cover a greater geographical region, and provide deeper penetration within buildings. 

Operators’ 5G performance depends heavily on their 5G spectrum holdings. In some cases, in the absence of dedicated 5G spectrum or to supplement existing spectrum, operators can use Dynamic Spectrum Sharing (DSS) to use the same spectrum band for different RAN technologies, which are allocated in real time – this in turn impacts 5G performance. 

Market structure and the role of government

The optimal market structure and role of governments in supporting the rollout of 5G remains a heavily debated topic. As Brian Potterill from Ofcom pointed out, governments and regulators are not in the best position to decide on targets, and that investment decisions should be left to the market to decide. As a result, Ofcom pursues a light-tough approach to 5G, working to enable the market to remain competitive. In addition, he downplayed the role of 5G targets, given the different flavors of 5G networks and the fact that unless tied to license obligations, they wouldn’t be binding. Despite this, the EU maintains key targets on 5G rollout for member states, a position we critiqued in our report 5G in Europe: EU Targets Require a Rethink.

For Gabriel Solomon of Ericsson, the main reason why Europe is falling behind on 5G lies in the investment environment, given the weighted average cost of capital remains higher than the return on invested capital in the region. He noted that there are huge sums of public money being made available via the EU’s Recovery and Resilience Facility, some of which is being directed by member states at improving connectivity. Beyond this investment, he outlined three main levers governments have to help spur 5G deployment:

  1. Spectrum. There is a need for a trade off between spectrum fees and incentives for operators to deploy networks more widely.
  1. Removing barriers to deployment. This is clearly an issue, with the EC recently announcing a new Connectivity Infrastructure Act designed to make barriers to passive infrastructure and backhaul much more available and affordable. In the U.K., the Government recently announced new plans to slash red tape from 5G roll out in a bid to help spur deployment. 
  1. Market structure. Half of European markets have four or more mobile operators. There is a clear desire for further mobile network consolidation which operators see as key in helping improve the investment case for 5G deployment. During Three UK’s recent 2021 results announcement, Robert Finnegan, Three UK’s Chief Executive Officer, warned that despite achieving positive results, “the U.K. market with four operators continues to remain dysfunctional and requires a structural change to improve the overall quality of infrastructure that U.K. customers should expect.”

KPN: The tale of 5G Availability

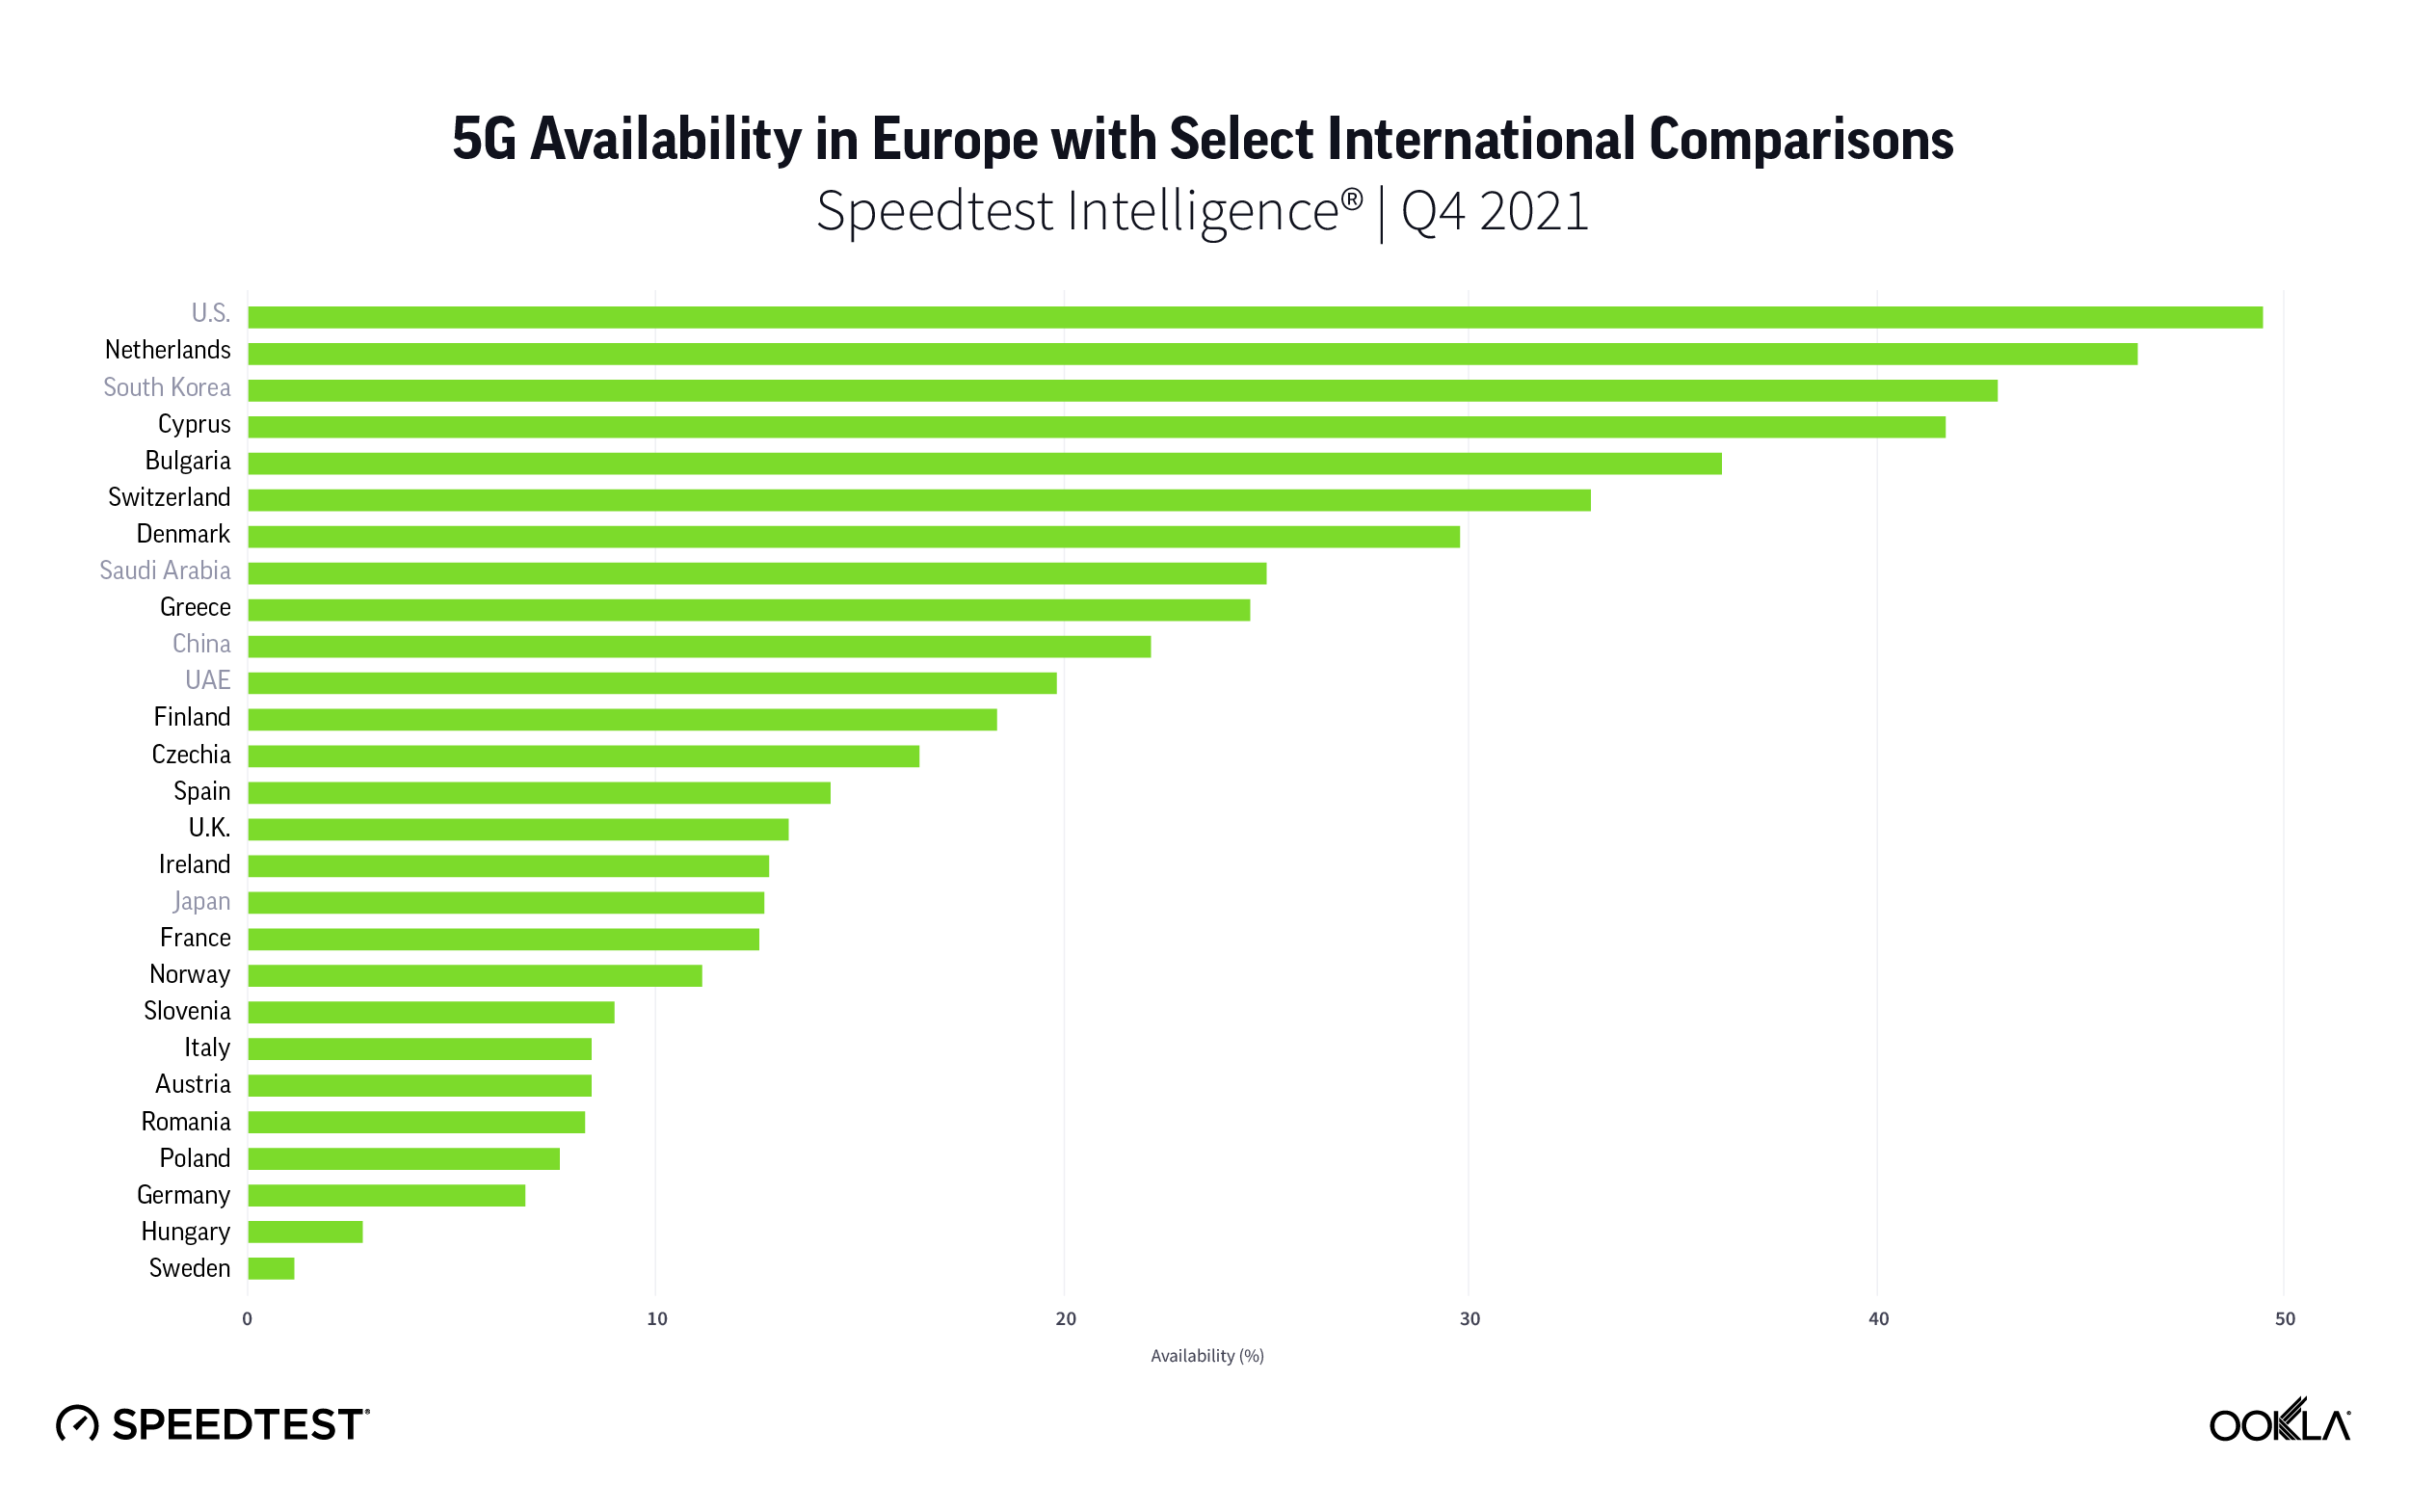
Within Europe, the Netherlands comes top in terms of 5G Availability (the proportion of users of 5G capable devices who spend a majority of their time on 5G networks). Only six European markets had 5G Availability above 20% by Q4 2021. Not surprisingly, the U.S. is in the lead with almost 50% 5G Availability, having started 5G deployment in the 600 MHz (low band) range. 

Erik Brands from KPN explained that they had a good starting point with over 99% nationwide 4G LTE coverage. In 2019, KPN embarked on a nationwide network modernization — a full upgrade of all equipment on every site, installing all available frequencies and making it technology neutral so they refarm frequencies by software. As a result KPN scores well on 5G coverage, partially because they have access to low band 5G spectrum (700 MHz). They have managed to extend 5G coverage to more than 80% of the country, including rural areas. Some of this is driven by the coverage requirement as part of the 700MHz licenses: a minimum speed of 8 Mbps in 98% of the cases in each municipality of the country in 2022.

While KPN scores well on 5G Availability, 5G performance is not yet at gigabit levels. This is mainly caused by the lack of available spectrum in the C-band, which is currently occupied by Inmarsat and local licenses. The Netherlands is very late clearing this band and it still isn’t clear when it is going to be auctioned. In time, KPN will need this spectrum to maintain quality and to enable other applications. KPN currently sees mmWave, which is also not available yet, as addressing more niche use cases that require very high bandwidth.

Three UK: “We can’t run as fast as we want to”

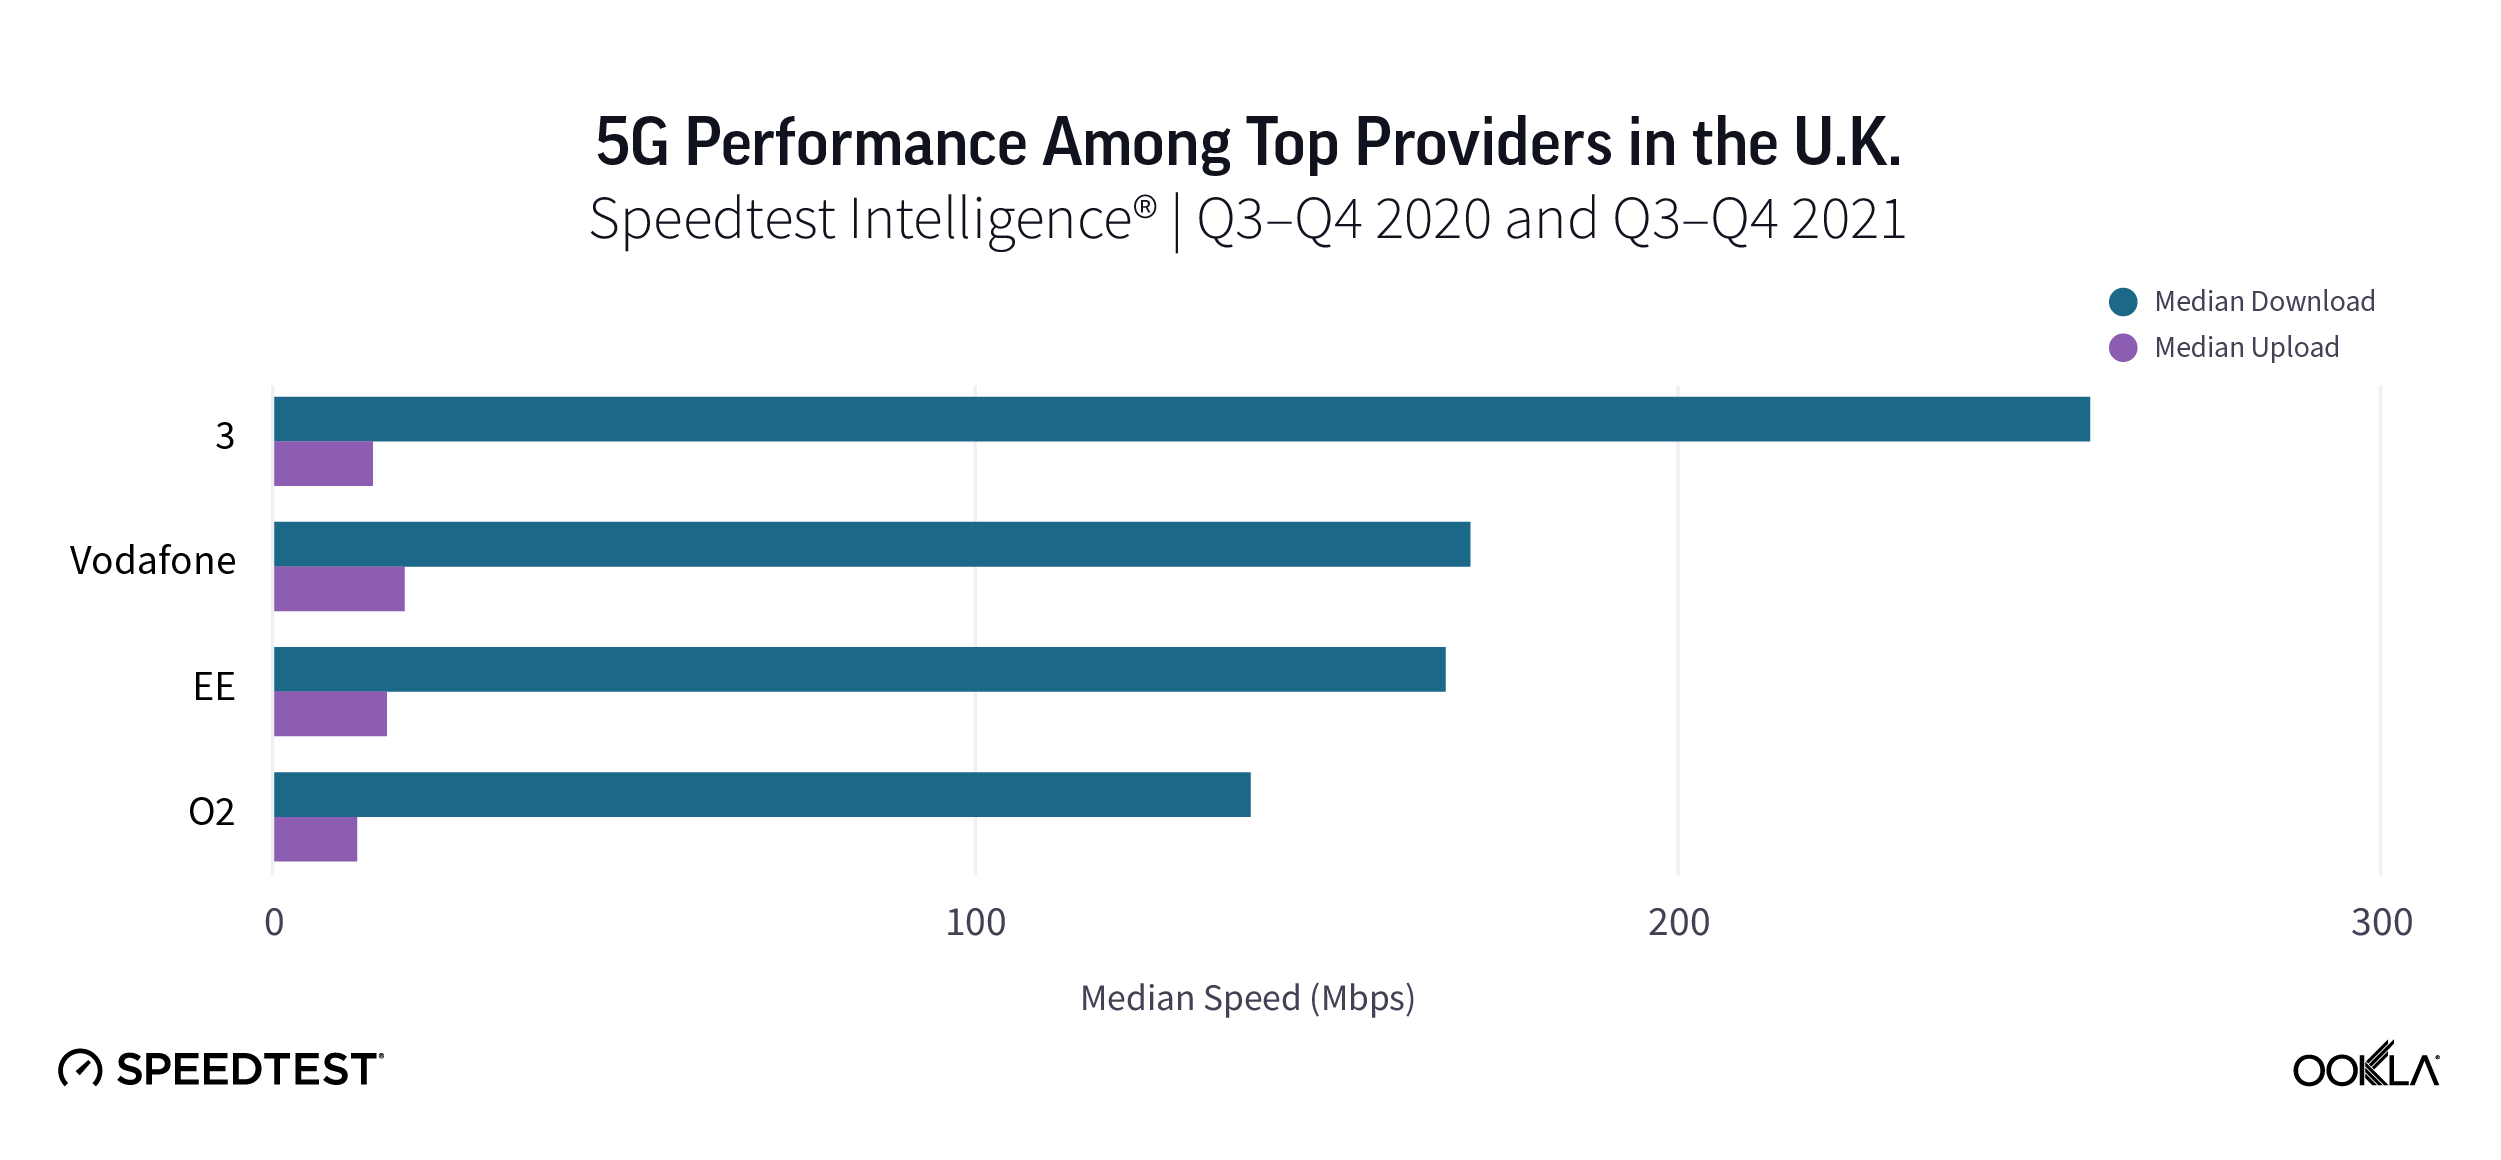
Three UK has a very “data hungry” customer base —  while their subscribers account for around 15% of the UK population, the network is carrying 30% of the traffic. Three UK benefited from having the largest, dedicated 5G spectrum — 140 MHz of frequency across several 5G spectrum bands, including a 100 MHz block of continuous spectrum in the 3.3-3.8 GHz band, which positions it well in terms of median download speeds compared to other U.K. operators — read our latest article to find out more about 5G in The U.K.

In order to fulfill their customers’ demand, the operator has embarked on a network transformation journey, consisting of upgrading all sites over time to 5G. They are also deploying C-band with Massive MIMO on 60% of all sites — targeting all major cities, towns and even villages covering 85-90% of total traffic on their network — Anil Darji, Three UK’s Chief Network Architect, called it “a capacity play.” In the remaining 40% of sites, which are rural and mostly coverage driven, the operator will utilize DSS and potentially refarm some of the 4G spectrum to 5G NR — this is “a coverage play” to get the 5G capabilities like reduced latency out there. 

Both operators pointed to a number of constraints in terms of deployment, including planning, regulation, site landlords, and aging infrastructure. Anil Darji mentioned that even once planning approval has been granted for a new site, some local councils can look to delay deployment through the process of requiring application for road closures. Three UK’s strategy is to upgrade all its sites and to build new macro sites to respond to growing demand. However, recent planning reforms fell short in terms of allowing them to deploy taller sites required for the deployment of all 4G & 5G spectrum, and he called for more government support and reforms to the planning process.

European 5G smartphone sales picked up strongly in 2021 

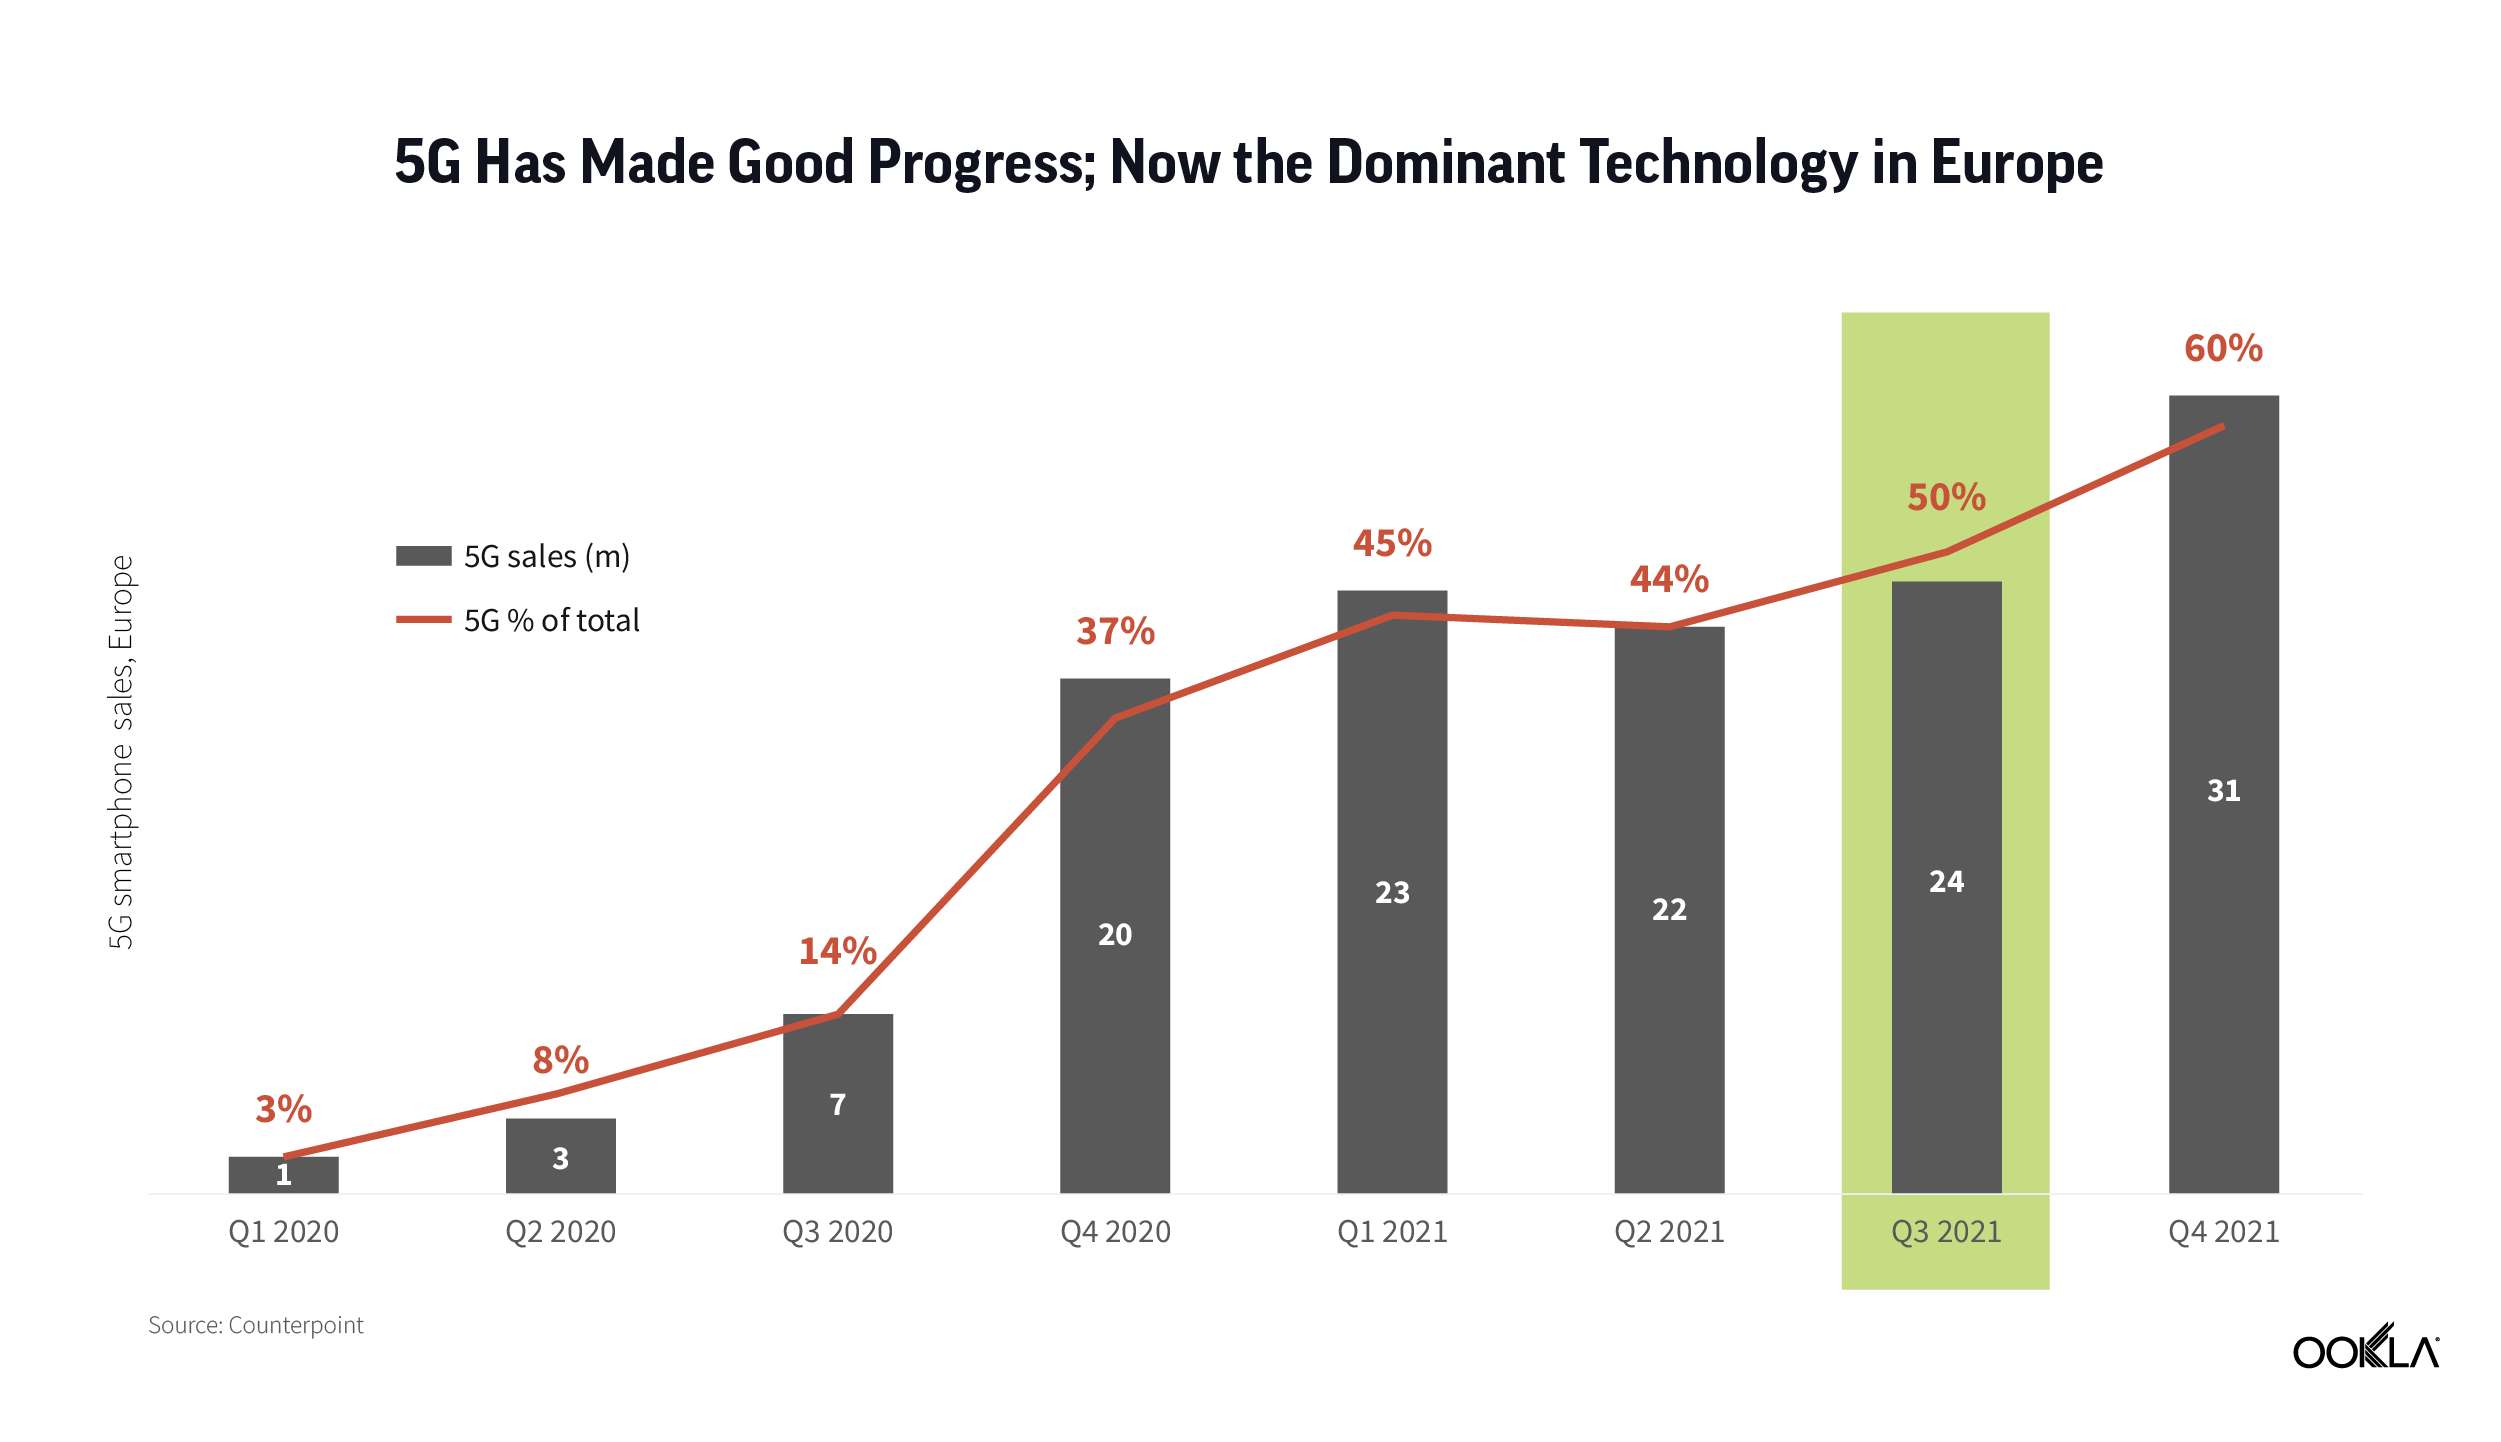
Jan Stryjak of Counterpoint Research struck a positive note on 5G smartphone sales in Europe, noting that 5G now accounts for a majority of smartphone sales in the region. However, Europe lags behind other advanced markets in smartphone adoption with the latest data for Q4 2021 showing 5G smartphones accounted for 60% of smartphone sales vs. 73% in North America and 79% across China, Japan and South Korea. Within Europe itself there is wide variation, with the U.K. having the highest ratio globally at 83%, while some Eastern European markets come in below 40%. 

5G is also moving down the smartphone price tiers. It is ubiquitous in the premium tiers (wholesale price of over $700) boosted by the iPhone 12 in Q4 2020 and iPhone 13 in Q4 2021, accounts for the majority in the mid tier ($250 – $499) and growing, where it is driven mostly by the Samsung A series. It is even growing fast in the budget tiers too ($100 – $249), thanks to affordable 5G devices from the likes of realme and Xiaomi sub-brand Redmi.

In time, smartphone sales will translate into a larger installed base of 5G devices and share of overall subscriptions. 

The importance of 5G use cases cannot be overlooked  

The vast majority of European 5G networks are Non Standalone (NSA), meaning that they still rely on the 4G LTE core network and therefore don’t offer the full advantage of 5G. So far, only four operators across three countries deployed 5G Standalone (SA), partially because most operators started 5G deployment by utilizing DSS, where 5G SA is less relevant. As operators move to focus more on massive MIMO using mid-band spectrum (which delivers a step change in capacity and throughput) then the functionality of SA becomes more attractive to use. Not surprisingly, the GSA says 46 operators across 27 counties are planning to deploy 5G SA. 5G SA also enables additional 5G capabilities beyond high speed such as  Ultra-Reliable Low-Latency Communication (URLLC)  and virtual network functions such as network slicing, which will in turn, enable new 5G use cases. 5G Fixed Wireless Access (FWA) is also one of key use cases for consumers, in areas with limited fiber rollout across Europe. 

Brian Potterill of Ofcom sees connectivity as enabling economic growth and productivity and in this context more connectivity is good, and 5G plays an important role as it enables higher bandwidth and lower latency. He says that it is important that regulators allow the market to function effectively and also sees regulators and governments playing an important role in helping to understand how customers — both consumers and enterprises — can take advantage of 5G and different use cases, and helping to bridge the information gap.

All in all, there is a clear agreement that “build it and they will come attitude” does not work with 5G, there is a need to educate the customers on the benefits that 5G brings and attract them with innovative use cases to persuade them to upgrade, both their devices and tariffs.

See the full webinar recording here.

Ookla retains ownership of this article including all of the intellectual property rights, data, content graphs and analysis. This article may not be quoted, reproduced, distributed or published for any commercial purpose without prior consent. Members of the press and others using the findings in this article for non-commercial purposes are welcome to publicly share and link to report information with attribution to Ookla.

| May 3, 2021

How Etisalat Went from Regional Leader to the World’s Fastest Mobile Network Operator in 2020 [Case Study]

The upheaval of the COVID-19 crisis has created acute challenges for mobile network operators. As consumers are more reliant on their networks for access to work, education and other vital services, the resulting surges in traffic have disrupted years of careful network planning for most operators. Already the winner of the Speedtest Award for Fastest Mobile Network in the Middle East for 2019, Etisalat sought both to maintain its high standard of network performance and quality — and to support the United Arab Emirates’ national initiatives to ensure connectivity while citizens stayed safe at home.

Etisalat used Ookla® Speedtest® data to understand the impact of COVID-19 on the state of networks, to support national initiatives from the Ministry of Education and Telecommunications Regulatory Authority (TRA) and to consistently improve their network performance and capabilities in the face of unprecedented demand. As a result of their network’s performance, Etisalat was awarded the Speedtest Award for World’s Fastest Mobile Network in 2020.

image-etisalat-quote

Situation

As the country locked down, Etisalat was faced with an exponential surge in network demand. In addition to meeting their own customers’ expectations, the operator also needed to meet goals set by the regulatory bodies and to help fulfill national initiatives for the UAE Vision 2021 plan, which aims to establish the country as a cohesive knowledge economy by 2021. In support of these missions, Etisalat focused efforts on improving their mobile network, supporting business continuity in a work-from-home environment, facilitating distance learning and providing entertainment to families at home.

Read the full case study

Ookla retains ownership of this article including all of the intellectual property rights, data, content graphs and analysis. This article may not be quoted, reproduced, distributed or published for any commercial purpose without prior consent. Members of the press and others using the findings in this article for non-commercial purposes are welcome to publicly share and link to report information with attribution to Ookla.

| September 22, 2020

How Georgia is Leveraging Cell Analytics™ to Enable Virtual Classrooms

Students are returning to class as the school year begins, but in many areas it is not safe to return to the classroom. This means the massive and unprecedented shift to remote learning we saw in the early spring continues for many into the fall. Even where schools have chosen to reconvene in-person classes, the moment a case of COVID-19 is detected, students and faculty are pushed back out of the facility and into online learning. Eager to keep their 1.7 million students connected, education boards in cities and counties throughout the state of Georgia are outfitting school buses with hotspot devices. And they are using Cell AnalyticsTM data from Ookla® to identify the best locations to position those buses to help remote learners.

The digital divide makes remote learning even harder for some families

Many families are simply not equipped to deal with remote learning. This is especially true in economically stressed households where children often do not have the equipment or connectivity necessary to participate in virtual classes. In the state of Georgia alone, an estimated 80,000 households with students cannot access a wireline service.

National wireless operators have donated thousands of portable Wi-Fi hotspots to connect students to their 4G LTE networks (5G networks are so new, coverage is limited and only a few devices are available). As generous as these donations have been, they do not come close to filling the total need.

CARES Act funding provides resources

The U.S. Congress passed the $2.2 trillion Coronavirus Aid, Relief, and Economic Security Act, also known as the CARES Act, earlier this year. Signed into law on March 27, this stimulus bill includes funding to assist each state with providing broadband connectivity for students so that they can continue to attend classes remotely. The CARES Act has provided the respective state departments of education and municipal and county education boards with resources needed to buy the millions of laptops required to allow remote learning as well as hotspots that can connect these new laptops or existing ones to the internet.

Hotspots can only help in areas with adequate coverage

Programs providing broadband for education over the past decade have focused on installing high-speed service in community anchor institutions, which include schools and libraries. If these facilities are closed for safety reasons, those connections may not be available. Even when those connections are available, wireless coverage at many anchor institutions is quite poor. Compounding the issue, some constituents have objected to installing critically important cell sites near schools.

Additionally, schools are sometimes located where a plot of land is inexpensive or large enough to accommodate a new campus. This may place the anchor institution far from the residential areas from which students are trying to connect to their online classes.

Hotspots can help by connecting previously unserved buildings with the internet. Even when service is available to a building, some families cannot afford the additional expense of a fixed internet connection. However, indoor coverage from hotspots can be insufficient to provide enough throughput for sustained video streaming for one user, let alone multiple students at a time. In many rural areas, even outdoor hotspot coverage will be too weak to provide students with the level of connectivity needed to remain engaged in the remote classroom.

Read the full case study

Ookla retains ownership of this article including all of the intellectual property rights, data, content graphs and analysis. This article may not be quoted, reproduced, distributed or published for any commercial purpose without prior consent. Members of the press and others using the findings in this article for non-commercial purposes are welcome to publicly share and link to report information with attribution to Ookla.

| April 26, 2022

The Case for Private Networks in India

The recent recommendation from the Telecom Regulatory Authority of India (TRAI) around providing an enabling framework for enterprises to build their own private networks is in line with other 5G markets, where governments are looking to drive the digitization of key industries. However, Indian operators see this as limiting their return on investment in the 5G spectrum. Looking at the example of private networks across Europe, and Germany in particular, we believe that Indian telcos shouldn’t see TRAI’s proposal as a threat. Rather, they should use the buzz around the spectrum for verticals as a way to get enterprises interested in digitalization.

The overall financial health of the Indian telecom industry remains fragile. Furthermore, operators’ ability to invest in upgrading their network is negatively impacted by low average revenue per user (ARPU) levels and high regulatory costs. As a result, India’s mobile performance is affected. According to the Speedtest Global Index™, in March 2022 India ranked 120 (out of 142 countries) with a 13.67 Mbps median mobile download speed vs. the global average of 29.96 Mbps. The 5G network rollout will require intensive capital  investment and allowing enterprises to have access to dedicated spectrum can potentially limit operators’ 5G-addressable revenue.

The case for 5G in manufacturing

On the consumer side, 5G will boost Indian mobile performance, as we have postulated in our recent article, new 5G launches in Asia Pacific point to a potential 10x increase in median download speeds (5G vs 4G-LTE). However, 5G will also deliver socioeconomic benefits in India, on account of a number of 5G use cases that could enable new applications across all sectors. According to GSMA Intelligence, 5G is expected to contribute around $455 billion to the Indian economy over the next 20 years, accounting for more than 0.6% of GDP by 2040. One of the sectors that stands to benefit from 5G is the manufacturing sector, representing 20% of the total benefit. Retail, ICT and agricultural sectors should also benefit.

The Indian government has already zeroed in on making India’s manufacturing sector more competitive on a global scene. As such, the “Make in India” goal is to make India self-reliant and also to increase the share of the manufacturing sector to 25% of GDP “in the coming years.”

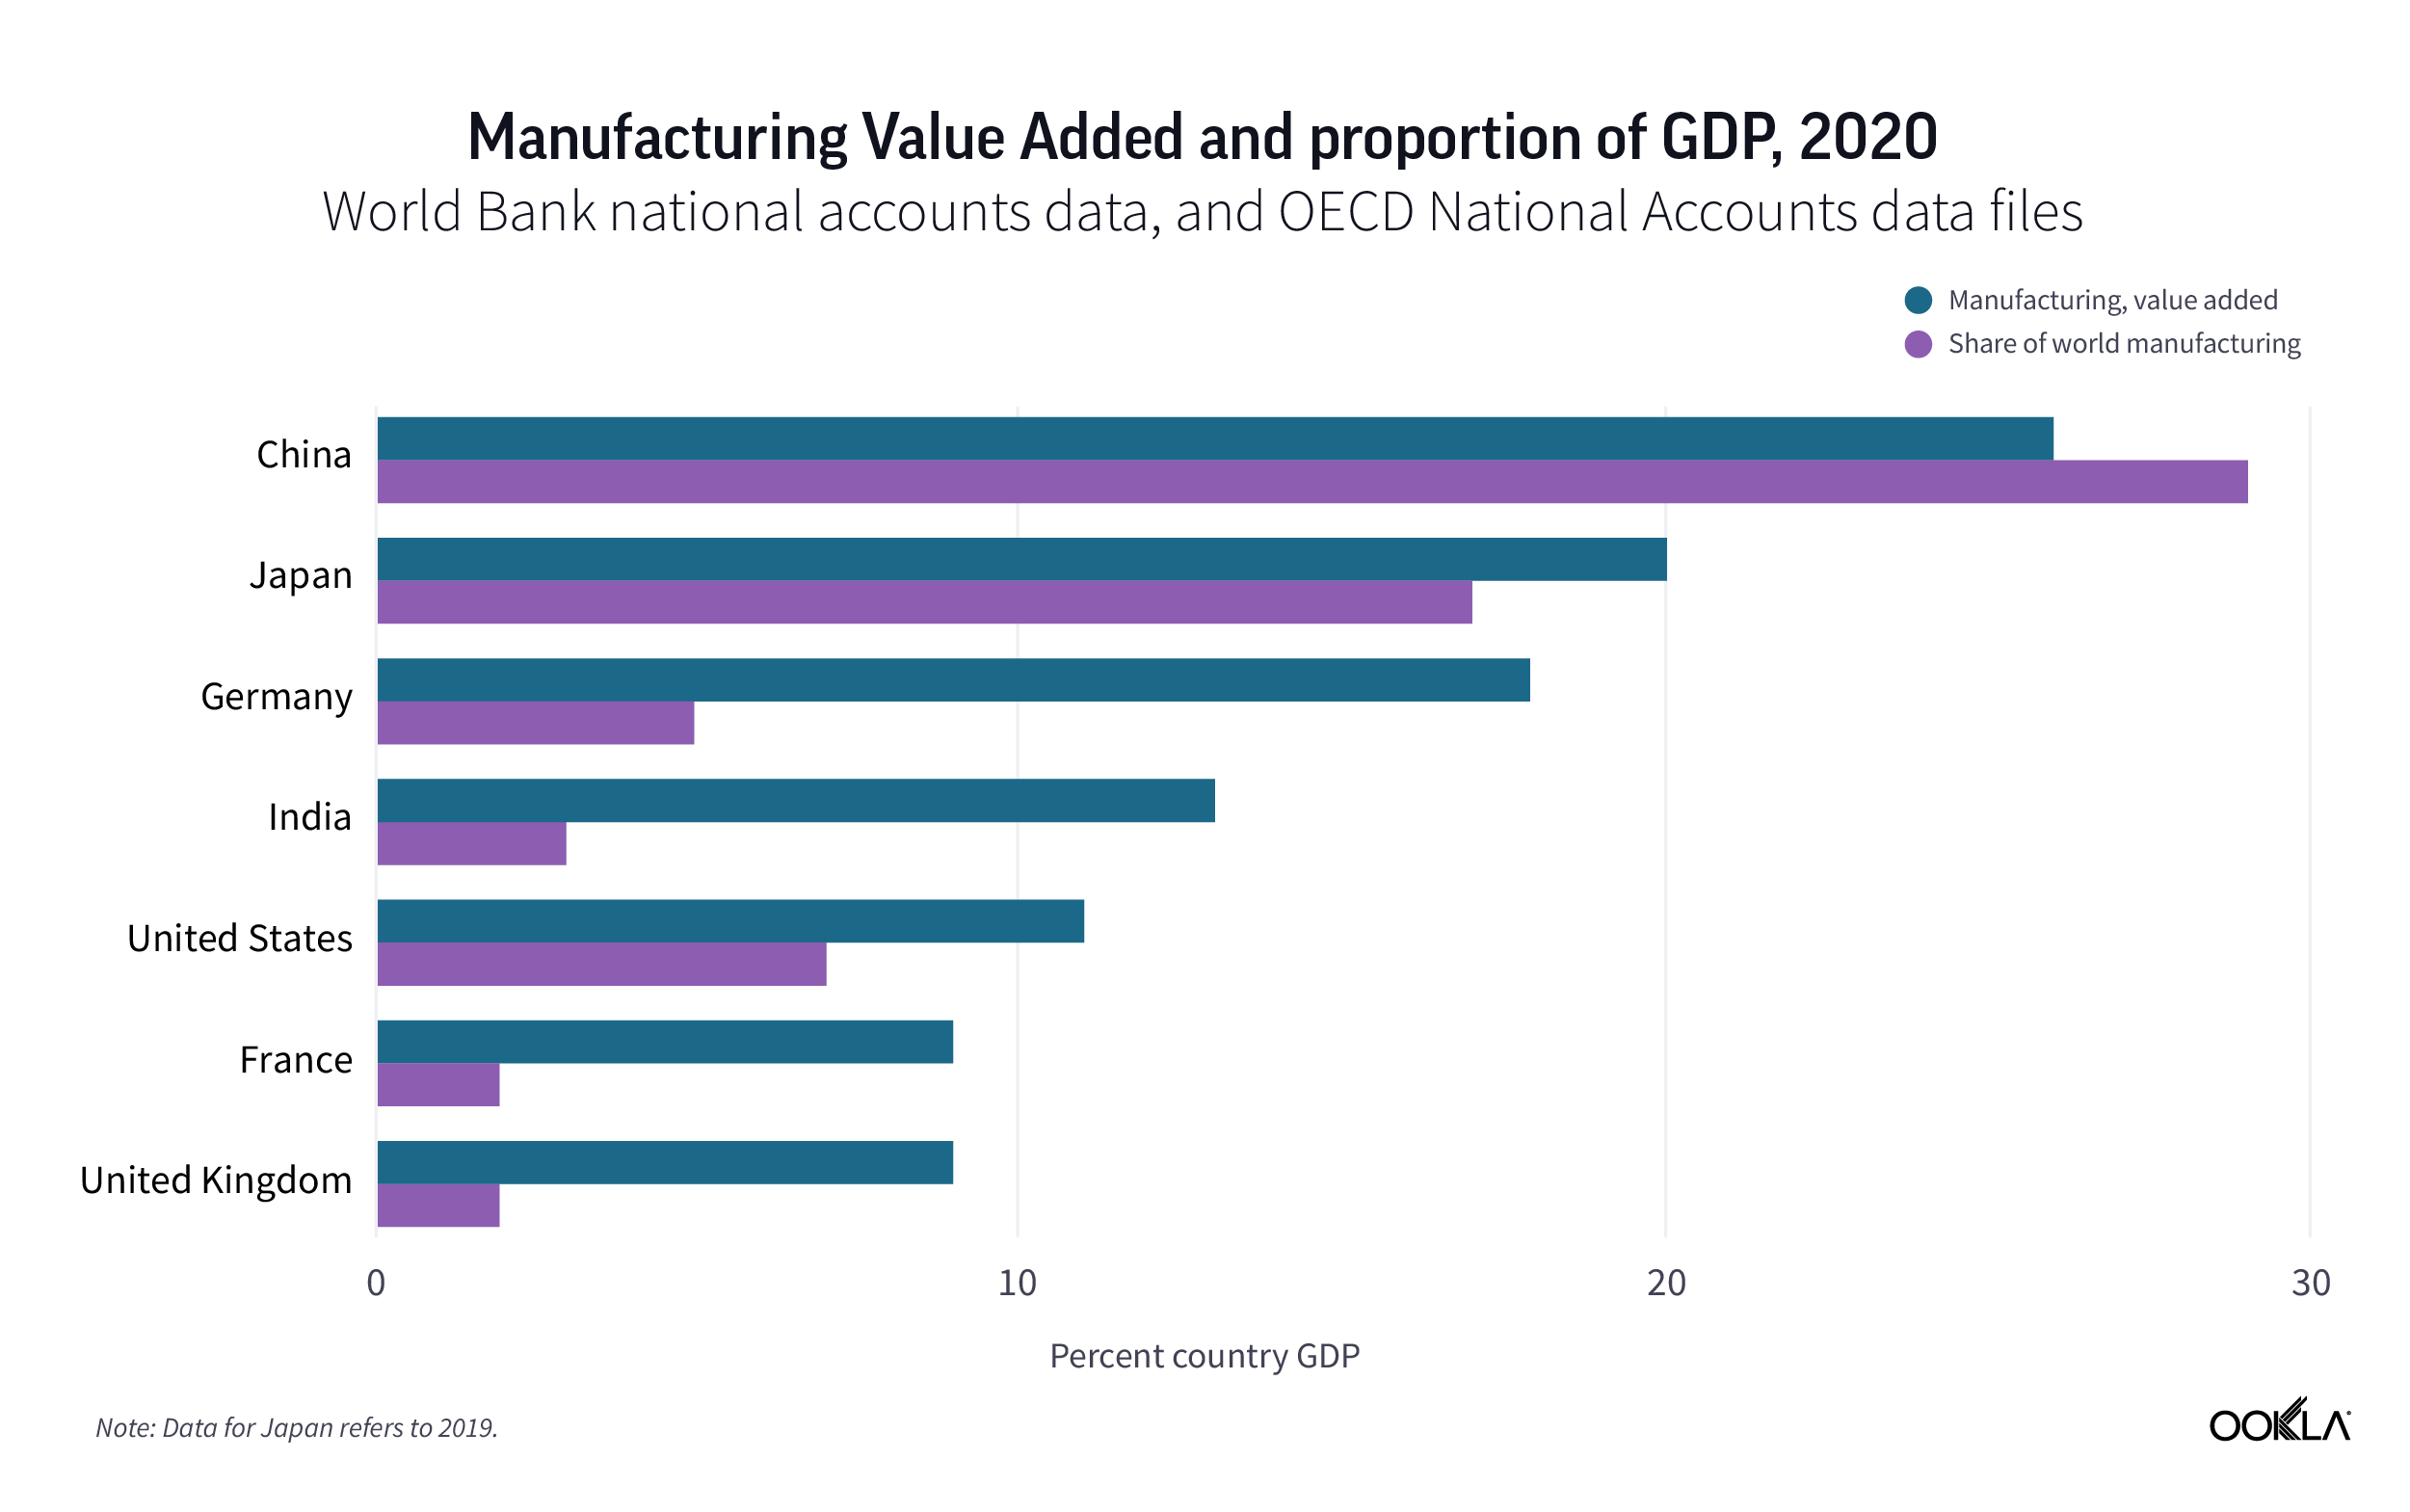
As of now, this is a distant goal. China is still the world’s manufacturing superpower, accounting for 29% of global manufacturing output in 2020, followed by Japan (17%) and Germany (5%). All of these countries have embarked on digitization strategies.

In addition, manufacturing companies look to optimize and control production processes, improve safety, and reduce costs in order to maximize the return on investment. The COVID-19 pandemic has exacerbated existing challenges and pain points for manufacturers, highlighting the need to improve supply-chain resilience and boost production speed and flexibility. However, even before the pandemic, the manufacturing sector was undergoing digital transformation – the so-called fourth industrial revolution or Industry 4.0, referring to the use of technologies such as machine learning, edge computing, IoT, digital twins, and new networks to aid automation and enable data exchange.

According to Ericsson, typical revenue increases when manufacturers digitize their processes come from increased throughput and quality (2–3%), while typical cost savings originate from improved capital efficiency (5–10%) and decreased manufacturing costs (4–8%). A proportion of manufacturers will need dedicated network resources to meet their transformation goals and ensure data isolation and security. According to the GSMA Intelligence Enterprise in Focus 2020 survey, 22% of manufacturers require location-specific coverage (e.g. factory, campus).

Historically, Wi-Fi has been the connectivity choice for private networks. However, mobile technologies such as 4G/LTE and 5G are better suited to Operational Technologies’ network requirements of high volume, high reliability, mobility, and always-on operations. 5G and 5G Standalone in particular offers the most benefits related to eMBB, massive IoT, and critical IoT. Additionally, enterprises decided to deploy proprietary networks to have more control over their networks; the increased security offered by isolating their data from public networks is an attractive benefit.

Private networks aren’t new 

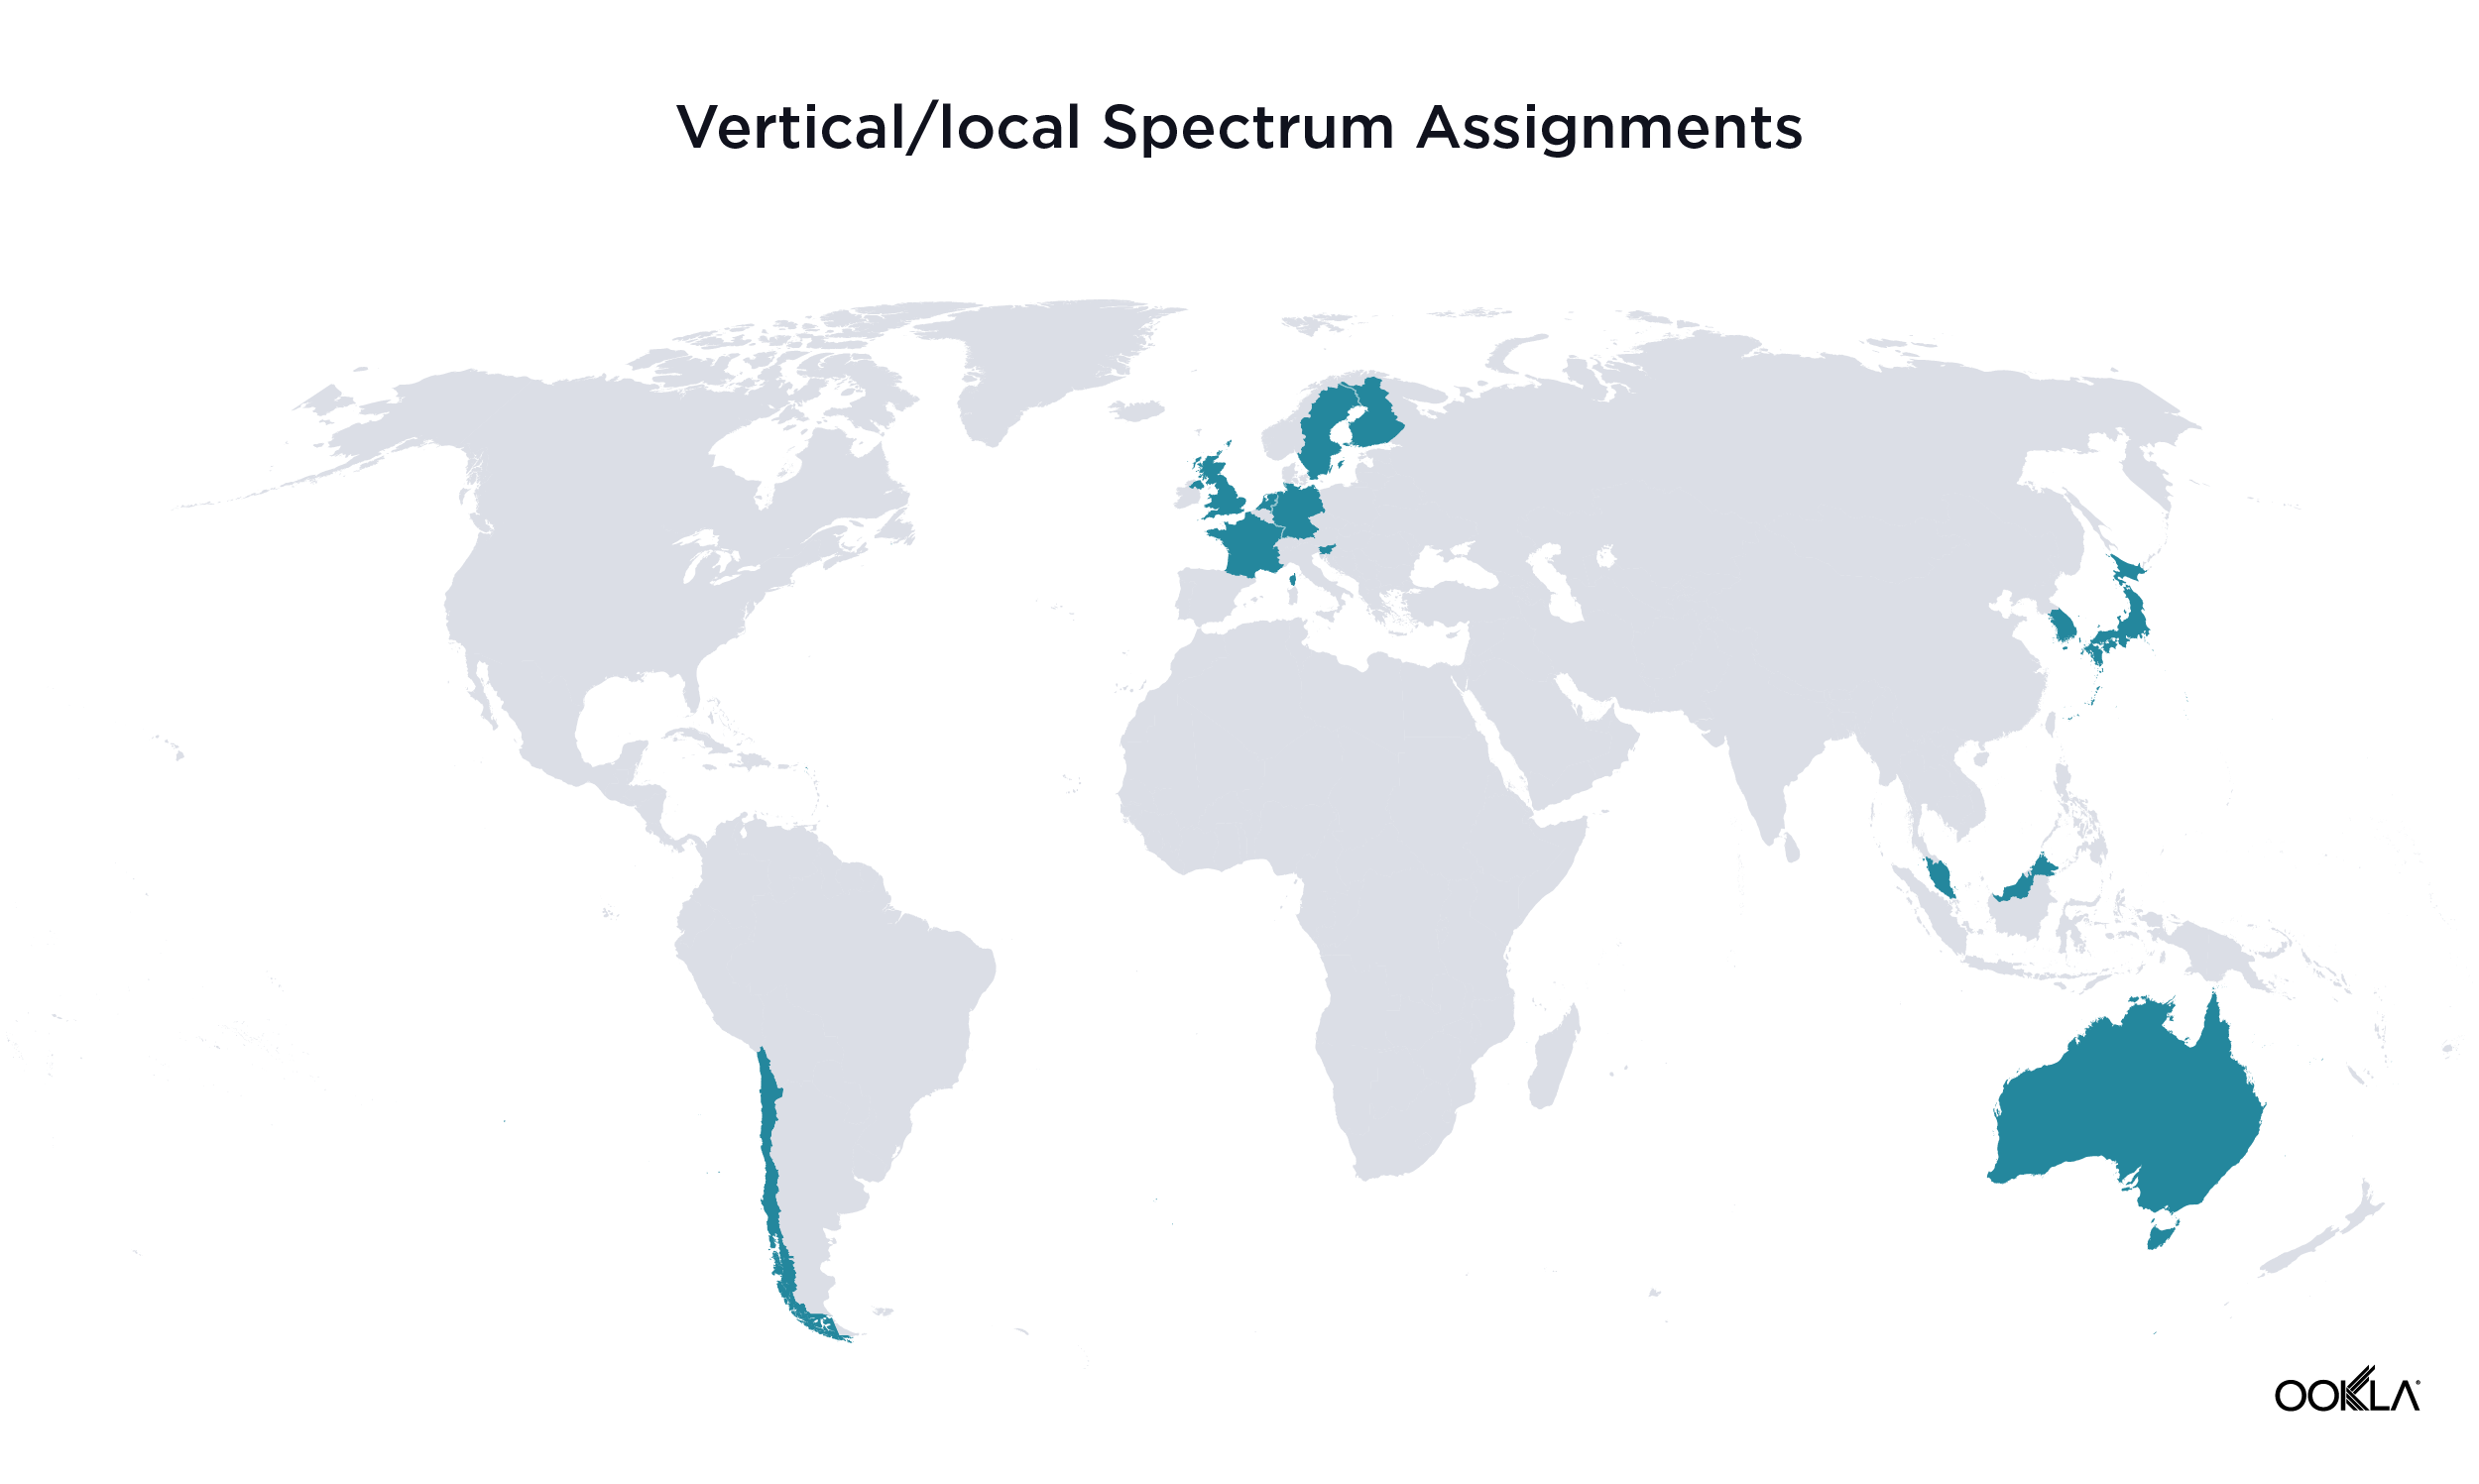
A number of countries are looking to private networks to address Industry 4.0 objectives and awarding spectrum for vertical use e.g. Germany, Japan and France. According to GSA data, as of February 2022 there were 656 organizations deploying LTE or 5G private mobile networks. GSA’s data points to the manufacturing sector as a strong adopter of private mobile networks, with 111 identified companies involved in known pilots or deployments, which is up from 51 at the start of 2021.

Dedicated spectrum available for private mobile networks has already been allocated in France, the United States, Germany, Japan, and the United Kingdom. Germany is considered to be a poster child for Industry 4.0. Afterall, the term “Industry 4.0” was coined at Hannover Messe over a decade ago. It is therefore only natural to look to Germany and its approach to private networks. In Germany, the national regulatory authority (BnetzA) is promoting industrial policy and reserved 100 MHz in the 3,700-3,800 MHz for local networks, noting that the spectrum can be used in particular for Industry 4.0. “By awarding spectrum for local 5G networks, we are creating scope for innovation for enterprises,” stated Jochen Homann, Bundesnetzagentur President. As of April 15, 2022, the Federal Network Agency (BNetzA) received a total of 208 applications for the allocation of frequencies for local 5G networks and granted the same amount.

We have commented on how the private networks landscape is developing in Europe here. Simply assigning spectrum to verticals isn’t enough to drive market adoption. In an upcoming analysis, we will discuss how the French government has prioritized 5G as an avenue to drive digital transformation of the economy via a number of funds. According to the GSA, there were a total of 66 private networks all together in France, Germany, and Japan, despite enterprises being able to acquire spectrum since 2019.

Despite the 208 applications that BNetzA received, the GSA has counted 45 private networks in Germany, with a majority distributed between three verticals: manufacturing (14), power and water utilities (11), and devices testing and lab as a service (seven).

It is important to note that globally, as per the latest GSA data, only 21% of networks were 5G only, and mostly composed of test networks. Until the 5G device ecosystem matures, the majority of private networks will remain 4G/LTE, though using equipment that is 5G ready. Only after the availability of industrial-feature-rich 5G release 16 chipsets, which will happen in the next few years, will the 5G deployments move beyond trials and proof of concept into full scale deployments. Germany is an outlier here: 5G and 5G SA are making headways in Germany. Audi, KUKA, Volkswagen, and Siemens take an active role in testing and deploying 5G SA private networks utilizing localized spectrum in the 3500 MHz band (n78).

The many routes to market

TRAI has proposed an enabling framework for enterprises to build their own private networks via a range of deployment scenarios, including spectrum leasing and dedicated spectrum. The Cellular Operators Association of India (COAI) representing major telecom companies such as Bharti Airtel Ltd, Reliance Jio Infocomm Ltd, and Vodafone Idea Ltd. opposed this, stating that TRAI should: “Disallow private enterprise networks for the financial viability and orderly growth of the telecom industry, which is more than capable of delivering  these services to businesses”.

Yes and no. Operators can utilize various deployment models, from public dedicated networks through hybrid networks (network slicing, public/private campus, private RAN with public core) to private networks. Within these various models, network slicing and edge computing add the benefits of QoS, privacy, security, and specific SLAs.

When it comes to private networks, the typical rules of engagement no longer apply, and with network virtualization continuing, the ecosystem of vendors has expanded beyond traditional telco players. Just recently Cisco entered this crowded market that already consists of operators, hyperscalers, startups, and equipment vendors. Amazon’s introduction of AWS Private 5G network is a good example of the growing “coopetition” trend. In some cases, AWS would work with operators to provide 5G core and edge computing capabilities, while in some others, it could compete to offer end-to-end solutions. Nokia is looking to address the enterprise demand in India via working with network operators, but also by working directly with enterprises, as Ricky Corker, Chief Customer Experience Officer, Nokia recently stated.

We can draw lessons by looking at the approach that European operators took when addressing the enterprise opportunity. Deutsche Telekom has been offering campus network solutions for enterprises since 2019, and now operates more than ten such local networks based on 5G non-standalone technology or LTE across Germany. In January 2022, the operator expanded its offering to include location-specific 5G mobile networks for companies based on 5G Standalone Technology (5G SA), powered by the Ericsson Private 5G portfolio. The operator can also position itself as a systems integrator (SI) for 5G private networks for Industry 4.0 by utilizing T-Systems’ credentials and its deal with AWS.

Similarly, Vodafone takes an active role in deploying private networks, and distinguishes three degrees of industrial control depending on a private network setup.

In the first scenario, a dedicated mobile private network (MPN) brings total control to the enterprise because everything stays on site. There is no interoperability with public networks. This is particularly well suited for mission- or business-critical applications that don’t need to interface with the public internet.

The second option is a hybrid private network, which is a blend of public and private infrastructure. It enables interoperability with public networks for those devices and users which move outside the private network, while at the same time giving the end user a choice regarding where the data is stored.

The third option, a virtual private network, uses a dedicated slice of a public 5G network. End-user control over the setup is reduced, but compared to the public network it has a dedicated network resource, and allows for greater data isolation, security and privacy, and further SLA customization (availability and reliability). According to Marc Sauter, head of mobile private networks for Vodafone’s business division, network slicing hinges on future releases of the 5G standard, available from next year. “That is when virtual private networks will be more relevant, and a new market will open up with smaller customers.” Vodafone is also very vocal about the importance of the ecosystem, and working on innovation. In its innovation hub in Milan, Vodafone works with developers and startups, and large companies can play around with 5G use cases.

Leveraging existing credentials and forming partnerships to go beyond core competencies can open up new markets for operators. Partners’ ecosystem is key, and to be successful,  operators need to partner across the ecosystem. As enterprises’ needs vary, having a broad portfolio of vendors that can address various verticals, technological, and coverage needs will only stimulate the growth of the market.

Indian telcos have already embarked on this journey. Airtel has partnered with Tech Mahindra for a joint 5G innovation lab to develop “Make in India” use cases for the local and global markets, including customized enterprise-grade private networks. These services will combine Airtel’s integrated connectivity portfolio of 5G ready mobile network, fiber, SDWAN, and IoT along with Tech Mahindra’s SI capabilities.Meanwhile, Vodafone Idea (Vi) joined forces with A5G Networks to enable industry 4.0 and smart mobile edge computing in India. They have jointly set up a pilot private network in Mumbai using existing 4G spectrum.

Rather than seeing spectrum for verticals as a threat, operators can use it as a way to get enterprises, in particular manufacturing companies, interested in digitalization. According to the FICCI-EFESO survey, 36% of organizations will implement “Use of Industry 4.0 technologies for predicting failures in machines, products and processes” in the next 1-2 years, while 22% have already done so. The opportunity is there for the taking.

To learn more about how Ookla® has worked with operators and industries to help plan for 5G growth, contact us.

Ookla retains ownership of this article including all of the intellectual property rights, data, content graphs and analysis. This article may not be quoted, reproduced, distributed or published for any commercial purpose without prior consent. Members of the press and others using the findings in this article for non-commercial purposes are welcome to publicly share and link to report information with attribution to Ookla.

| August 18, 2021

How Loudoun County, VA Secured Over $17M in Broadband Funding Using Ookla Data to Create Accurate Maps and Challenge FCC Data [Case Study]


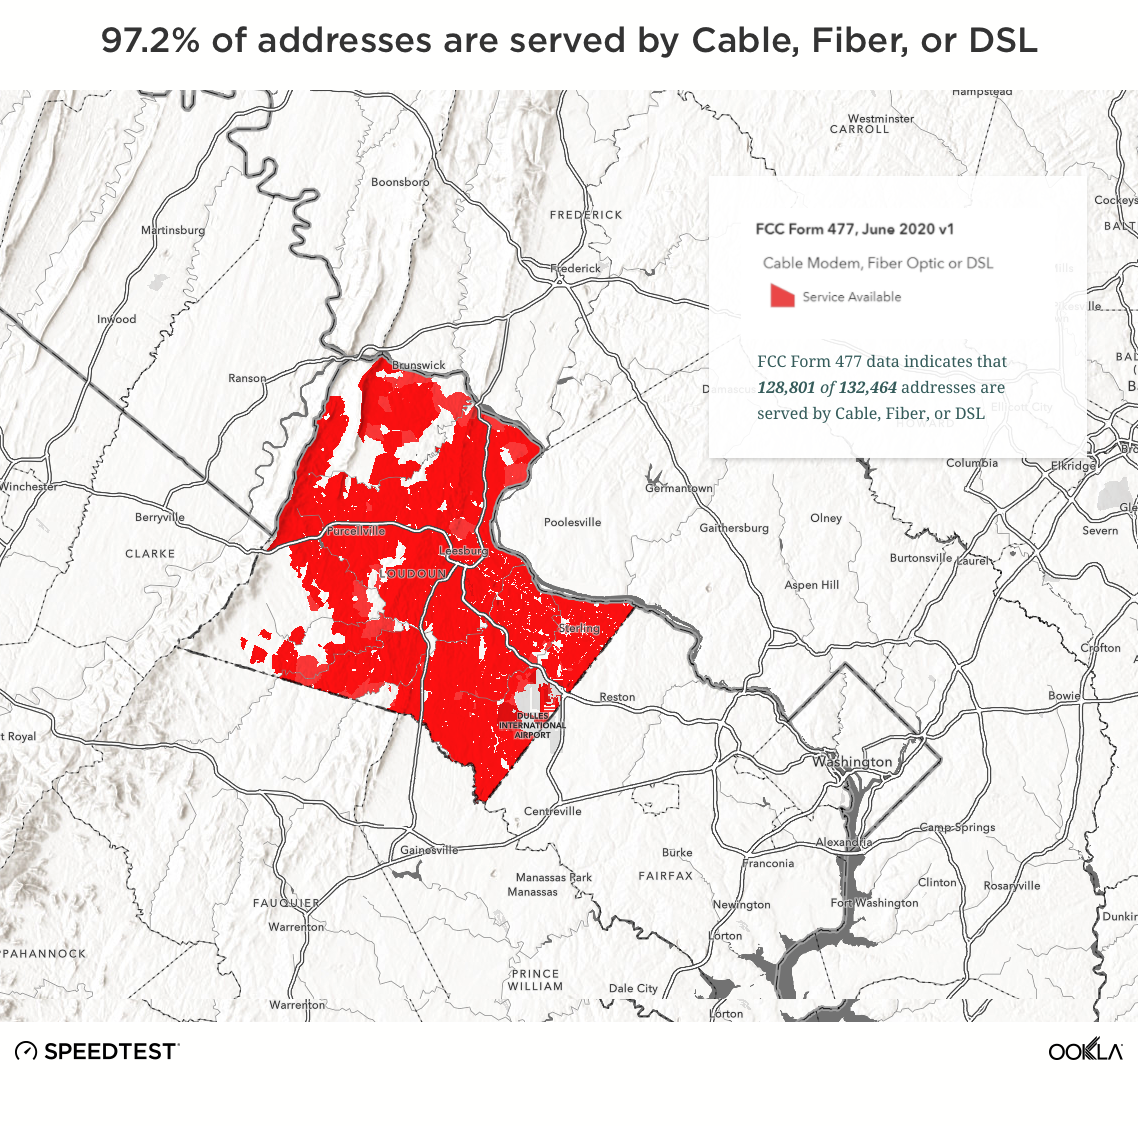
Virginia’s Loudoun County is interwoven with rural and suburban landscapes, making it especially difficult for policymakers to understand where the county’s residents are — or are not — able to access the Internet. FCC Form 477 broadband availability data shows that nearly 100% of Loudoun residents have access to what the FCC defines as broadband (25 Mbps download, 3 Mbps upload). This is inconsistent with the connectivity experiences of county residents, so Loudoun Broadband Alliance (LBA) set out to create an accurate, reliable broadband access mapping methodology using real-world network performance data.

Loudoun Broadband Alliance (LBA) chose Ookla® Speedtest Intelligence® to research residents’ actual connectivity and network performance. With this data, LBA identified a large number of unserved households in contrast to FCC data which showed them as served. Loudoun County was subsequently awarded over $17 million of funding to help eliminate the broadband gap.

Situation

In an effort to close the digital divide in rural and urban communities across the nation, the United States federal government has allocated billions of dollars in broadband funding with the American Rescue Plan (ARP) Act. Funding allocation is based on current federal broadband mapping through FCC Form 477 data. For Loudoun County, FCC data reports:

loudon-map-1-3

loudon-map-2-2

However, the FCC’s findings were not reflective of the real-world network experience of Loudoun County residents. LBA used Speedtest Intelligence data in conjunction with other publicly available datasets to get a more accurate picture of broadband accessibility in their county.

Read the full case study

Editorial note: This case study was updated on April 25, 2022 to include the broadband funding won by Loudoun County.

Ookla retains ownership of this article including all of the intellectual property rights, data, content graphs and analysis. This article may not be quoted, reproduced, distributed or published for any commercial purpose without prior consent. Members of the press and others using the findings in this article for non-commercial purposes are welcome to publicly share and link to report information with attribution to Ookla.

| May 17, 2022

Federal Broadband Funding is Available for Local Governments — It’s Time to Get in Line

Local governments, the clock is ticking. The Infrastructure Investment and Jobs Act (IIJA) set billions of dollars out on the infrastructure buffet table for local governments in the United States and there are more guests invited to the party than ever before. This funding is almost certainly a once-in-a-lifetime opportunity to connect your community and provide access for all to the digital economy. The question is: will you be at the front or the back of the line?

Ookla® can help you. This article is designed to give you the information you need to get started on the path toward getting the funding you need for your communities.

Look to your state for funding

Historically, broadband funding has had a very top-down approach. The FCC has held almost all the power to determine where federal broadband infrastructure dollars have been spent. But for the first time, state governments will have an active role in guiding these decisions.

The Infrastructure Investment and Jobs Act (IIJA) directs $65 billion to improving broadband connectivity across the US, with $42.45 billion earmarked for building new infrastructure. Once the initial FCC map has been released, each state that has declared their intent to participate through NTIA will be provided a minimum $100 million to get the process started (U.S. territories will split an additional $100 million). Much of the remaining $22 billion will target affordability, but more on that later. The race for resources will be officially off and running.

Following this initial disbursement, there will be roughly $37 billion more to be awarded from the IIJA alone. Many states are still sitting on billions of dollars from the American Rescue Plan Acts (ARPA) and broadband is an allowable expenditure for these remaining stimulus dollars. Add to that the long running connectivity programs such as CAF, RDOF, Mobility Fund, and the upcoming Rural 5G Fund, and all those programs combined approach $100 billion over the next decade.

Plan ahead to increase your competitiveness

Past programs have provided funding without setting proper expectations on results. More emphasis is now being placed on planning. With a focus on estimated cost per service address, network design takes a front seat to ensure these resources are spent efficiently and state officials will be allowed to use up to five percent of this for mapping, designing, and cost estimation. 

Most states are already planning, or already building, their own broadband availability maps. But if you have connectivity issues in your community, it’s time to make it known to those who will be responsible for directing funds and deciding which communities will see investment and which will not.

Ookla helped Loudoun County, Virginia secure $17 million

We have experience helping local governments navigate this challenging planning process. When FCC Form 477 broadband availability data showed that nearly 100% of Loudoun residents have access to what the FCC defines as broadband (25 Mbps download, 3 Mbps upload), this was inconsistent with the connectivity experiences of county residents. So the Loudoun Broadband Alliance (LBA) chose to use Ookla Speedtest Intelligence® to create an accurate and reliable broadband access mapping methodology using real-world network performance data. With this data, LBA identified a large number of unserved households in contrast to FCC data which showed them as served. Loudoun County was subsequently awarded over $17 million of funding to help eliminate the broadband gap.

Keep in mind that the maps will never be finished. They will change and evolve as the networks in your area grow. Funded projects will need to be monitored for compliance and older networks will need to be watched for signs of deterioration. Everyone will need to keep an eye on progress, measure successes, and have the data to act early when projects go off track.

Acadiana, Louisiana used Speedtest data to win $30 million

With Speedtest data, the Acadiana Planning Commission (APC) was able to successfully challenge FCC maps on over 900 out of approximately 1,000 census blocks. The APC applied for funding through the NTIA Broadband Infrastructure Program, which made $288 million in funding available to help close the digital divide in the U.S.. There were over 230 applicants, and only 13 grants were awarded. Vice President Kamala Harris visited Acadiana in March to announce that the APC had been awarded a $30 million grant that will fund high-speed internet in 11 rural Acadiana communities.

Think big! Broadband funding is available for more than just infrastructure

Accessibility to broadband requires at least four components: infrastructure, affordability, equipment, and knowledge. The lack of any one of these means an individual does not have access to today’s digital economy. Much of the focus has been on the lack of infrastructure in many rural communities, but infrastructure is the absolutely essential piece for anyone in any community to get connected. The second component, affordability, often drives the last two requirements as people who cannot afford internet service often cannot afford the necessary equipment and, therefore, are less likely to have developed the knowledge to use it. Tracking both of these two primary elements is key to understanding the digital divide.

You might qualify for funding in more than one of these four areas. For example, over $14 billion in a new Affordable Connectivity Program is included in the broadband portion of the IIJA. Remaining funds include $2.75 billion for the Digital Equity Grant Program and the $2 billion Tribal Broadband Connectivity Program, as well as two more programs that will assist the USDA improve the internet in agricultural communities.

Agencies and local governments should work together

Cities should be coordinating with counties and other government entities within the same region — but someone needs to be in charge. If your local government does not have an individual charged with coordinating all these efforts, there is bound to be duplication of efforts, wasted resources, stagnation of ideas, or all of the above. Whether this person reports directly to the CTO, CIO, Mayor, or City Manager, their purpose is to understand what all departments are doing in the space and coordinate discussions, grant opportunities, and overlapping initiatives to make sure that departments aren’t working at cross purposes. Non-profits, community activists, and local corporations all have a stake in the success of these efforts. Traffic problems won’t suddenly end at the municipal boundary. Improving traffic on one side of the line may create more problems on the other side. Working together with your neighbors is just as important as working with internal departments. The same can be said of both fixed and wireless broadband infrastructure.

Dig-once projects will score extra points in the competition to have projects selected. Broadband is only part of the $1.2 billion infrastructure law. Roads, bridges, ports, and rail have billions of dedicated dollars as well. Digging a new trench for a clean water system? Coordinate with the project to include conduit and fiber and your efficient use of taxpayer funds will likely be rewarded.

Consider funding for multiple technologies 

As great as it might be to provide every service address in the country with a fiber connection, it may not make economic sense in some places. But an important detail was clearly stated in the legislation that recognizes a technology neutral stance on solutions. The rules are not yet complete on how the FCC and NTIA will award the IIJA funds and contend with challenges to their findings, but there are certainly far fewer restrictions on the ARPA funds that are already disbursed to the states. Many connectivity projects are already underway whether through infrastructure development, equipment distribution, or subsidies for affordable service.

Wireless services can get people connected much faster and there are several forms. Traditional mobile operators are rolling out 5G and Fixed Wireless Access (FWA) in some areas that can directly compete with traditional fixed services. Wireless Internet Service Providers (WISPs) have launched coverage to homes and businesses that previously had satellite as their only option. Some municipalities and school systems have launched private 4G LTE networks to connect underserved areas in their communities. And municipal Wi-Fi can still be an important part of an overall solution.

A portion of families may never find subscribing to a fixed network practical, but wireless services allow for easier movement and some don’t even require a residence. Understanding wireless network availability and performance across your jurisdiction is just as important as planning a fiber network. And here’s a bonus — cellular and other transmission sites need fiber for any new 5G cell site. So if you know where your wireless networks need additional infrastructure, you can plan for places in the network to offer them accessible fiber connections.

If your state still has ARPA funds available, you still have an opportunity to make improvements and learn more about connectivity issues so you are better able to make your case for the IIJA funds as they begin to flow.

Ookla can provide you with the data you need to be competitive for federal funding

It has been said for years that broadband is the fourth utility. Local governments have spent a lot of their resources managing the first three: water, gas, and electricity. If any of those become unavailable, even for a brief period of time, their citizens will make their unhappiness known. Resiliency of these services will play a part in how elected officials are judged, whether the local government supplies these services or just manages an external provider.

If you serve in local government, you should anticipate the same expectations going forward for broadband in your community. The internet has become vital to the way we live our lives, and access to it dictates much of our success both as residents and businesses. Recognizing connectivity as a critical service may have been a consequence of a pandemic, but that change in thinking is here to stay.

That’s why Ookla is here to help you learn more about the connectivity in your area. We’ve already helped local governments secure tens of millions of dollars in federal funding in Loudoun County, Virginia and Acadiana, Louisiana. We are also working with state broadband offices as well as municipalities to help them gain visibility into network availability and performance. If you want your community to take advantage of the billions pouring into improving connectivity, get in line before it’s too late. 

Drawn from billions of Speedtest® results, Ookla’s Broadband Performance Dataset provides governments, regulators, ISPs, and mobile operators with insights about the state of fixed networks and broadband accessibility. The Broadband Performance Dataset helps you identify unserved and underserved areas, prioritize investment opportunities to improve access to broadband, challenge funding decisions, and secure grants. 

To learn more about the Broadband Performance Dataset, Speedtest Intelligence, and other solutions for your state and/or local governments, please contact us.

Ookla retains ownership of this article including all of the intellectual property rights, data, content graphs and analysis. This article may not be quoted, reproduced, distributed or published for any commercial purpose without prior consent. Members of the press and others using the findings in this article for non-commercial purposes are welcome to publicly share and link to report information with attribution to Ookla.

| May 12, 2022

How EXPO 2020 Dubai Became the Fastest Show on Earth

A project 8 years in the making

The UAE was awarded the right to host the World EXPO 2020 in November 2013 following its successful bid. EXPO 2020 Dubai, the first in the MEASA (Middle East, Africa and South Asia) region was originally scheduled for 2020, but was delayed due to the COVID-19 pandemic, opening to visitors for 6 months between October 2021 and March 2022. 

While international travel had resumed from many markets when the EXPO opened its doors in October 2021, the event had to contend with a subsequent wave of COVID-19 restrictions around the world. Despite this, and the resultant impact on international travel and the maintenance of social distancing and other COVID-19 safety measures, EXPO 2020 operated without interruption during the six months it was open. It was a huge event, welcoming in excess of 24 million visitors to a greenfield build consisting of pavilions from 191 countries, across a site covering 4.38 square kilometers.

Showcasing 5G’s potential

The Telecommunications and Digital Government Regulatory Authority (TDRA) of the UAE has been very proactive in creating an enabling telecoms regulatory environment. In November 2018 it allocated 100 MHz of spectrum in the C-band, to both Etisalat and du, to enable them to roll out 5G networks. In addition, it has been proactive in enabling the operators to begin the sunsetting of their legacy 2G networks, to be able to refarm spectrum for use for newer mobile technologies. Thanks in part to this early allocation of 5G spectrum, and a favorable investment climate, as of March 2022 the UAE ranked 1st in Ookla’s Speedtest Global Index, based on median mobile network download speeds.

EXPO 2020 represented an opportunity for both Etisalat and du to showcase the performance of their 5G networks on a global stage. As a greenfield build, EXPO 2020 represented a unique opportunity, but also a significant challenge, given its sprawling layout across 4.38 square kilometers, and the coverage challenges posed by 191 pavilions which varied significantly in terms of size and construction material, as well as the main dome at the center of the EXPO. Both network operators had to be able to deliver a consistent 5G experience, supporting up to 25 million visitors across the six month period, with an anticipated peak of up to 300,000 visitors at a time.

Fastest global event

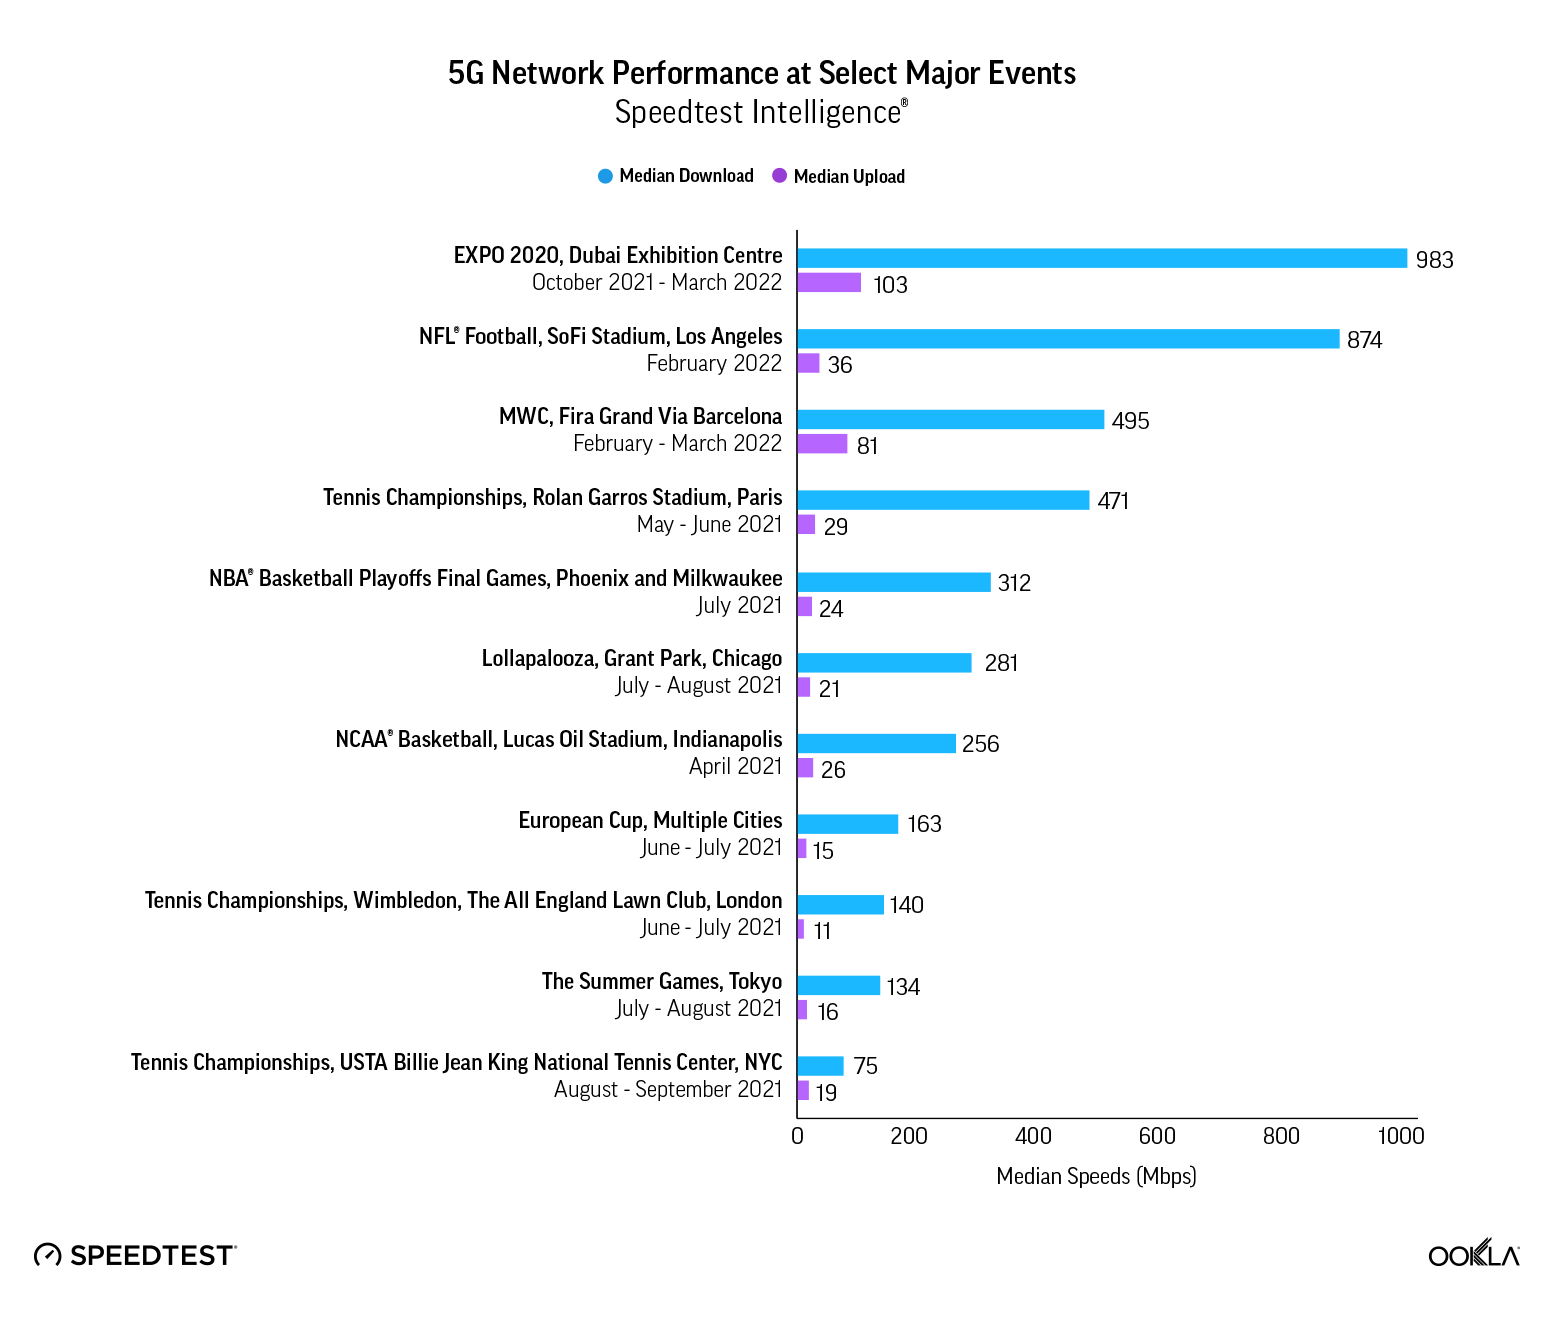
We compared the network performance at EXPO 2020 against other select major events worldwide, to understand how operators are building improved consumer experiences using 5G, and pushing the boundaries for performance at large scale events. The macro sites of EXPO 2020’s 5G network utilized 200 MHz of spectrum in total, using dual carrier aggregation to link high-capacity C-band spectrum with 90 MHz of spectrum in the 2.6 GHz band.

The 5G speeds recorded at the event by Ookla Speedtest Intelligence, confirm that EXPO 2020’s 5G network is the fastest event on record, with peak 5G download speeds in excess of 2 Gbps on Etisalat’s network. According to Doug Suttles, CEO and Founder of Ookla, “the speeds delivered on the Expo 2020 network are truly impressive – the fastest we’ve seen on 5G using mid-band spectrum, and testament to the work of Etisalat’s network build and the vision of the Expo 2020 team.”

5G Network Performance at Major Events

Across the duration of the event, the EXPO 2020 network achieved a median 5G download speed of 983.19 Mbps, putting it ahead of the next fastest event surveyed, the 2022 Super Bowl, which recorded a median 5G speed of 874.48 Mbps. It also outstripped its closest competitor on median 5G upload speed, recording 103.06 Mbps to the 81.32 Mbps recorded at MWC Barcelona 2022. For users without a 5G capable device or tariff, 4G/LTE performance at EXPO 2020 was also the fastest event we measured, with a 4G/LTE median download speed of 122.65 Mbps, putting it ahead of MWC Barcelona 2022, which recorded a speed of 90.41 Mbps.

Etisalat’s median 5G network speed clocked at over 1 Gbps

EXPO 2020 signed a premium partnership agreement with Etisalat in June 2016 to be its telecommunications and digital services provider. As part of this, Etisalat was responsible for developing the EXPO site’s telecoms infrastructure, which aimed to provide visitors and participants a cutting-edge, immersive digital experience to bring EXPO 2020’s themes of Opportunity, Mobility, and Sustainability to life.

Etisalat was tasked with deploying a greenfield dedicated network for EXPO 2020, capable of supporting up to 25 million visitors in total, and up to 300,000 per day, across an area of 4.38 square kilometers. As part of the 5-year network build project, the first commercial 5G network in the MEASA region, Etisalat clearly wanted to showcase the capabilities of a next-generation 5G network. However, with 191 pavilions, as well as the main dome in the center of the EXPO, to ensure the best blend of coverage and performance, it deployed:

  • Over 8,500 mobile access points, including 20 macro cell sites, 91 small cells, and 40 in-building sites, to provide full coverage
  • 700km of fiber optic cable, including 10 Gbps connections to all sites
  • 800km of cabling to support indoor mobile and Wi-Fi network requirements
  • 2 data centers within the EXPO itself
  • Redundancy in the form of a dedicated fallback Wi-Fi network, as well as the option to rapidly deploy cells on wheels (COW)

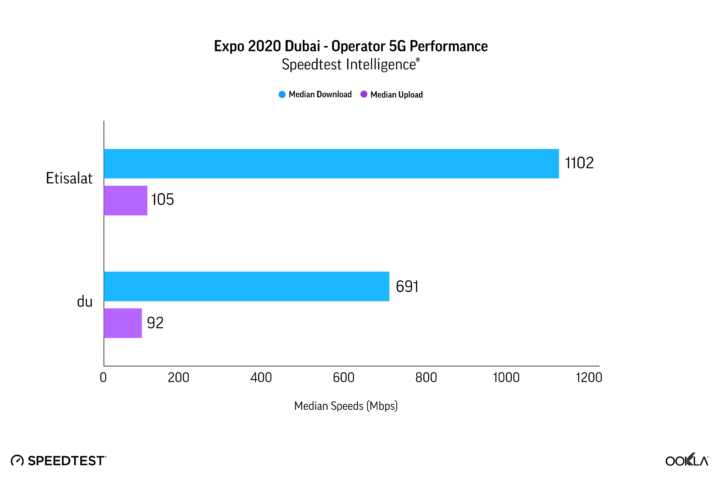
Across the six months that EXPO 2020 Dubai was open, and despite the much larger and more complex coverage requirement compared to other events (given the multitude of exhibitions pavilions), both Etisalat and du recorded impressive median 5G network speeds. Etisalat’s median speed of 1.10 Gbps, ahead of du’s 691 Mbps, helped drive Expo 2020 to first place as the fastest event on record. Median upload performance between the two operators was a closer affair, with Etisalat recording 105.09 Mbps, ahead of du’s 91.79 Mbps.

EXPO 2020’s economic impact and legacy 

EXPO 2020 provided a significant contribution to the UAE economy. In a February update, the IMF claimed that the UAE’s economic recovery was gaining momentum, estimating that it grew 2.2% in 2021, and forecasting that growth will accelerate to 3.5% in 2022. The IMF noted that this momentum was due to the country’s swift response to the COVID-19 pandemic alongside macroeconomic policies that have helped key sectors rebound, and economic activity related to EXPO 2020. With EXPO 2020 now complete, as part of its legacy, it will transition into District 2020 – a smart city deployment. District 2020 will re-use at least 80% of the EXPO-built infrastructure, including key components of the 5G network build, for both residential and business use.

Please contact us to learn how Ookla® can help you determine if your network is prepared for the massive crowds that accompany a marquee event, and analyze how your network performs both indoors and out, down to the building level.

Ookla retains ownership of this article including all of the intellectual property rights, data, content graphs and analysis. This article may not be quoted, reproduced, distributed or published for any commercial purpose without prior consent. Members of the press and others using the findings in this article for non-commercial purposes are welcome to publicly share and link to report information with attribution to Ookla.

| June 2, 2022

Fixed Broadband Network Performance in Indonesia Falling Further Behind Regional Peers

Bahasa Indonesia

Key messages:

  • Fixed performance in Indonesia continues to lag behind regional peers. While Indonesian fixed broadband network performance continues to improve quarter over quarter, Ookla® Speedtest Intelligence® shows that Indonesia lags behind many of its regional peers on key metrics such as median download speed and the penetration of more advanced routers supporting 5 GHz Wi-Fi, and this disparity is growing.
  • East and Central Java among the slowest performing Indonesian regions. Most regions of Indonesia achieve similar median download speeds. However there remain outliers: Bali was the top-performing region, and the more populous regions of East and Central Java continued to record some of the slowest performance in the market.
  • Faster speeds equal happier customers. Consumer sentiment towards fixed broadband providers in Indonesia, as measured by Ookla’s 5-Star Rating, tracks closely with network performance over the past year.
  • Competition ramps up in the Indonesian fixed broadband market. Speedtest Intelligence® sample data for Q3-Q4 2021 shows 306 ISPs active in the market. Of these, four major national network operators meet our threshold to be considered top providers (with a minimum of 3% of samples) — Telkom, First Media, MyRepublic, and Biznet. At a regional level, this list of top providers expands to ten, including CBN, MNC Play, StarNet, PT Global Media Data Prima, MTM Bali, and GlobalXtreme.
  • Biznet leads the market in fixed broadband network performance according to Speedtest Intelligence. Biznet is the leading operator both nationally and in many of Indonesia’s regions, achieving almost symmetrical download and upload speeds.

Singapore leads in fixed broadband network speeds in Southeast Asia

Indonesia ranks 114th on the Speedtest® Global IndexTM for median fixed download speeds, based on data for May 2022. According to Speedtest Intelligence, fixed broadband speeds in the country have increased over the past year, from a median download speed of 17.37 Mbps in March 2021 to 21.23 Mbps in March 2022. Fixed broadband upload speeds in the market have improved by a greater margin, from 4.95 Mbps in March 2021, to 9.73 Mbps in March 2022. However, as with its mobile market, and despite its improving trajectory, Indonesia’s fixed broadband performance continues to lag behind many of its regional peers. 

Looking at performance across 2021 in Southeast Asian markets, Singapore and Thailand continue to maintain a sizable performance gap compared to their regional peers, with both achieving median fixed broadband download speeds in excess of 150 Mbps during Q4 2021. There was also clear separation in performance between Malaysia (75.91 Mbps), Vietnam (67.91 Mbps), and the Philippines (47.50 Mbps). Of the remaining four markets, Brunei and Laos achieved speeds of close to 30 Mbps, while Indonesia and Cambodia were the slowest fixed-line markets, recording median download speeds of 20.08 Mbps and 18.89 Mbps respectively.
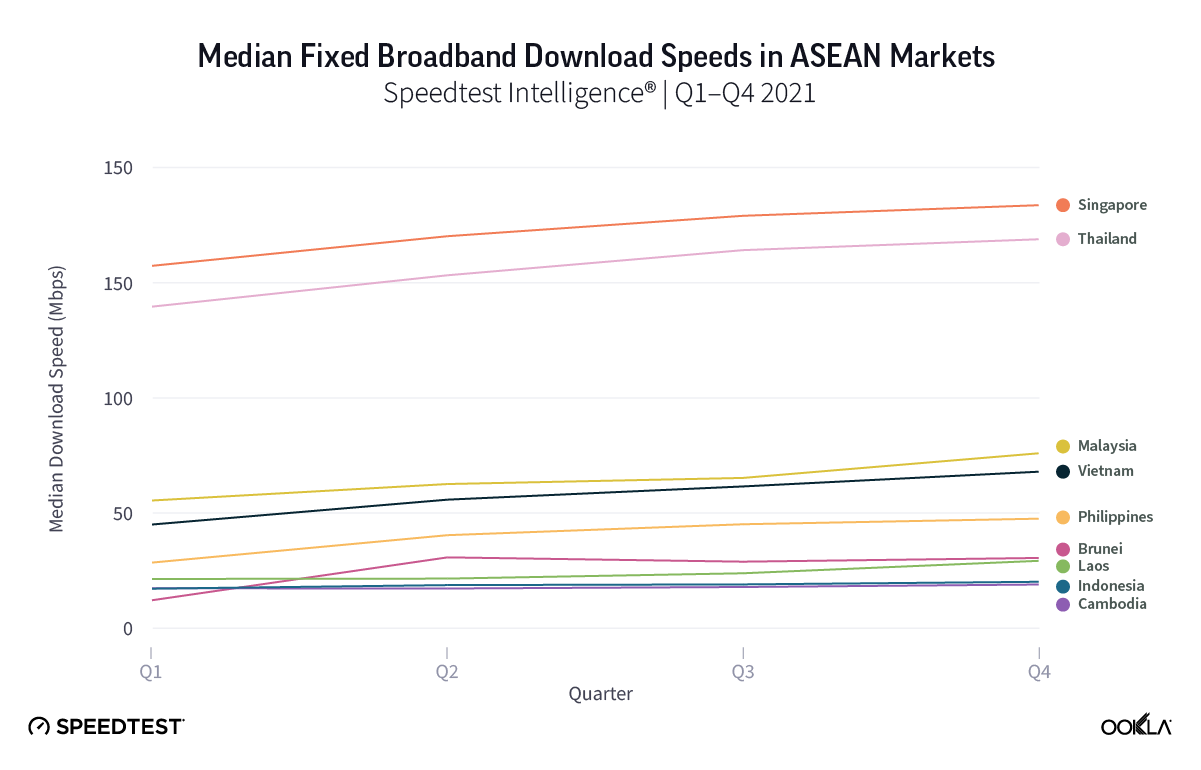
median fixed broadband download speeds in ASEAN markets

We used data from Speedtest Intelligence to evaluate fixed broadband performance in Indonesia during Q3-Q4 2021. Our analysis examines fixed broadband speeds at the country and provider-level. We also examine Wi-Fi performance as a subset of total fixed broadband samples in order to assess the speed delivered to end-user devices and look at the share of samples that utilize routers that support 5 GHz over Wi-Fi.

Operators worldwide are increasingly offering home networking solutions in order to help improve Wi-Fi speeds and coverage within the home. In Indonesia, First Media, Biznet, and MyRepublic offer mesh networking solutions, while some ISPs also offer the option to upgrade to routers that support the 5 GHz band. This offers greater channel bandwidth and typically lower interference than Wi-Fi over the 2.4 GHz band, allowing for improved performance for high bandwidth activities such as gaming and streaming high definition video content.

Looking at the distribution of fixed Wi-Fi Speedtest samples run over 2.4 GHz versus 5 GHz Wi-Fi connections, regional leaders Singapore and Thailand are joined by Malaysia as the only markets on this list with a majority of samples recorded using 5 GHz. Indonesia again came last with 5 GHz connections accounting for only 22% of samples.
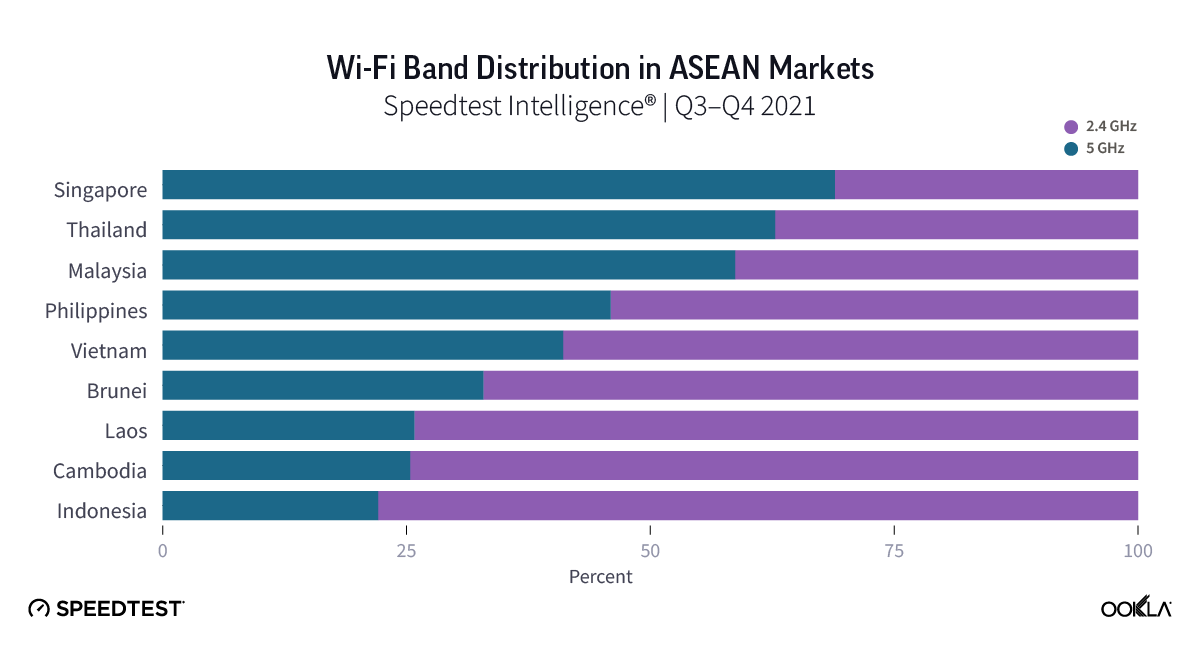
wi-fi band distribution in ASEAN markets

Biznet leading in Indonesia nationwide fixed broadband download speed

Our statistical methodology sets a minimum threshold of 3% of samples for an operator to be considered a top provider and part of our analysis. Using this methodology, Biznet was the fastest fixed broadband operator for both median download and upload speeds in Q3-Q4 2021, followed by My Republic. Biznet attained almost symmetrical results of 40.85 Mbps download and 39.29 Mbps upload, with My Republic achieving 34.27 Mbps download 21.93 Mbps upload. As of May 2022, Biznet’s fiber optic network extends to a total of more than 64,000 km, with its access network currently passing over 1.46 million households. In a bid to compete more aggressively with Telkom’s IndiHome service, Biznet launched an IPTV service in February 2020. The remaining two national ISPs, Telkom and First Media, lagged behind, achieving median download speeds of 18.91 Mbps and 16.54 Mbps respectively.
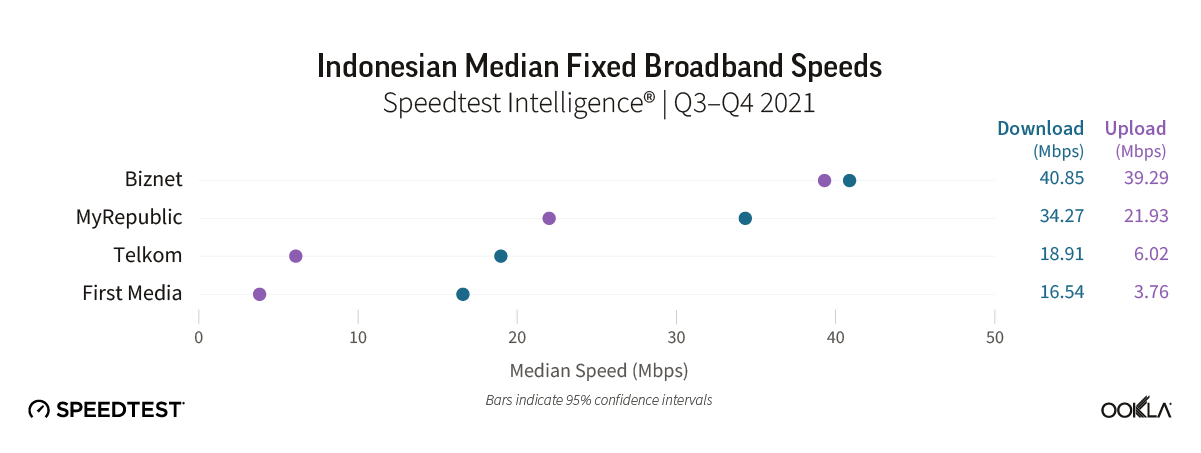
indonesian median fixed broadband speeds

Looking at the split of samples from 2.4 GHz versus 5 GHz Wi-Fi connections shows some divergence between the market leaders, Biznet and MyRepublic and First Media and Telkom. However, all four fixed broadband operators recorded in excess of 70% of tests using 2.4 GHz Wi-Fi connections. If we look at Wi-Fi performance in Indonesia as a subset of total fixed broadband samples, then a similar picture emerges, with Biznet and My Republic outperforming both Telkom and First Media.

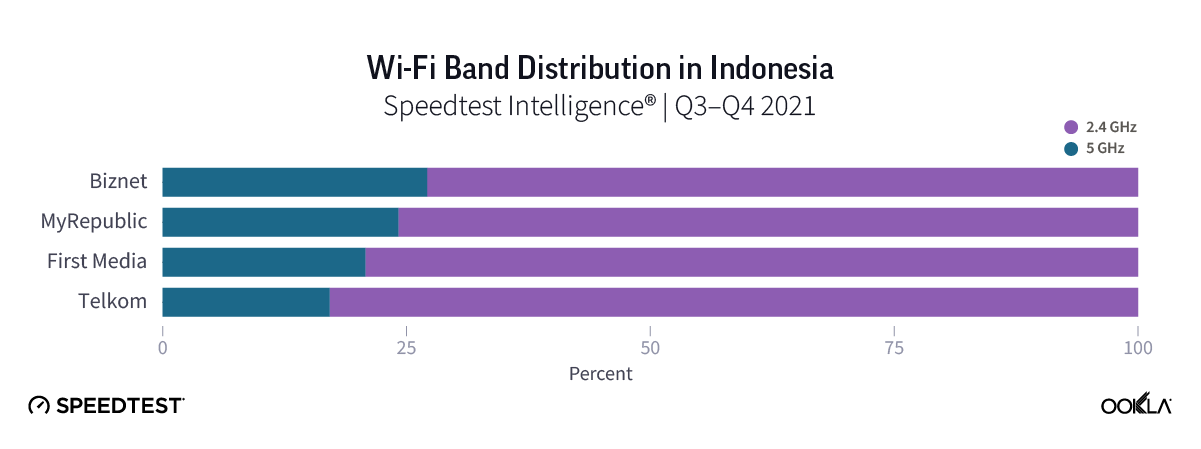
indonesian median wi-fi broadband speeds

wi-fi band distribution in indonesia

Consumer sentiment tracks network performance

There is a clear positive correlation between fixed network performance and consumer sentiment within the Indonesian fixed broadband market. Based on the mean of Speedtest 5-Star Ratings in the market, Biznet was the top-rated fixed operator in Q3-Q4 2021 with a score of 3.9, while First Media placed last with a score of 2.8.

consumer sentiment (ranking) for top isps in indonesia

Regional disparities in fixed broadband download speeds over Wi-Fi persist

Despite the Indonesian Broadband Plan’s goal to improve speeds across Indonesia, some regional disparities in median download and upload speeds persist. For a broad section of Indonesia’s regions, download speeds show little variation, ranging between 16 Mbps and 20 Mbps. There are however outliers. Tourist hotspot Bali, which has also emerged as a popular destination for digital nomad workers,  and the Indonesian capital Jakarta occupied the top two positions nationally during Q3-Q4 2021, with download speeds of 22.77 Mbps and 21.92 Mbps respectively. 

At the other end of the scale, two of the country’s most populous regions, East and Central Java, scored some of the lowest median download speeds at 15.34 Mbps and 15.17 Mbps, respectively. Upload speeds across the market show much more variation, ranging from a high of 17.47 Mbps in Bali, to a low of 3.97 Mbps in Bengkulu.
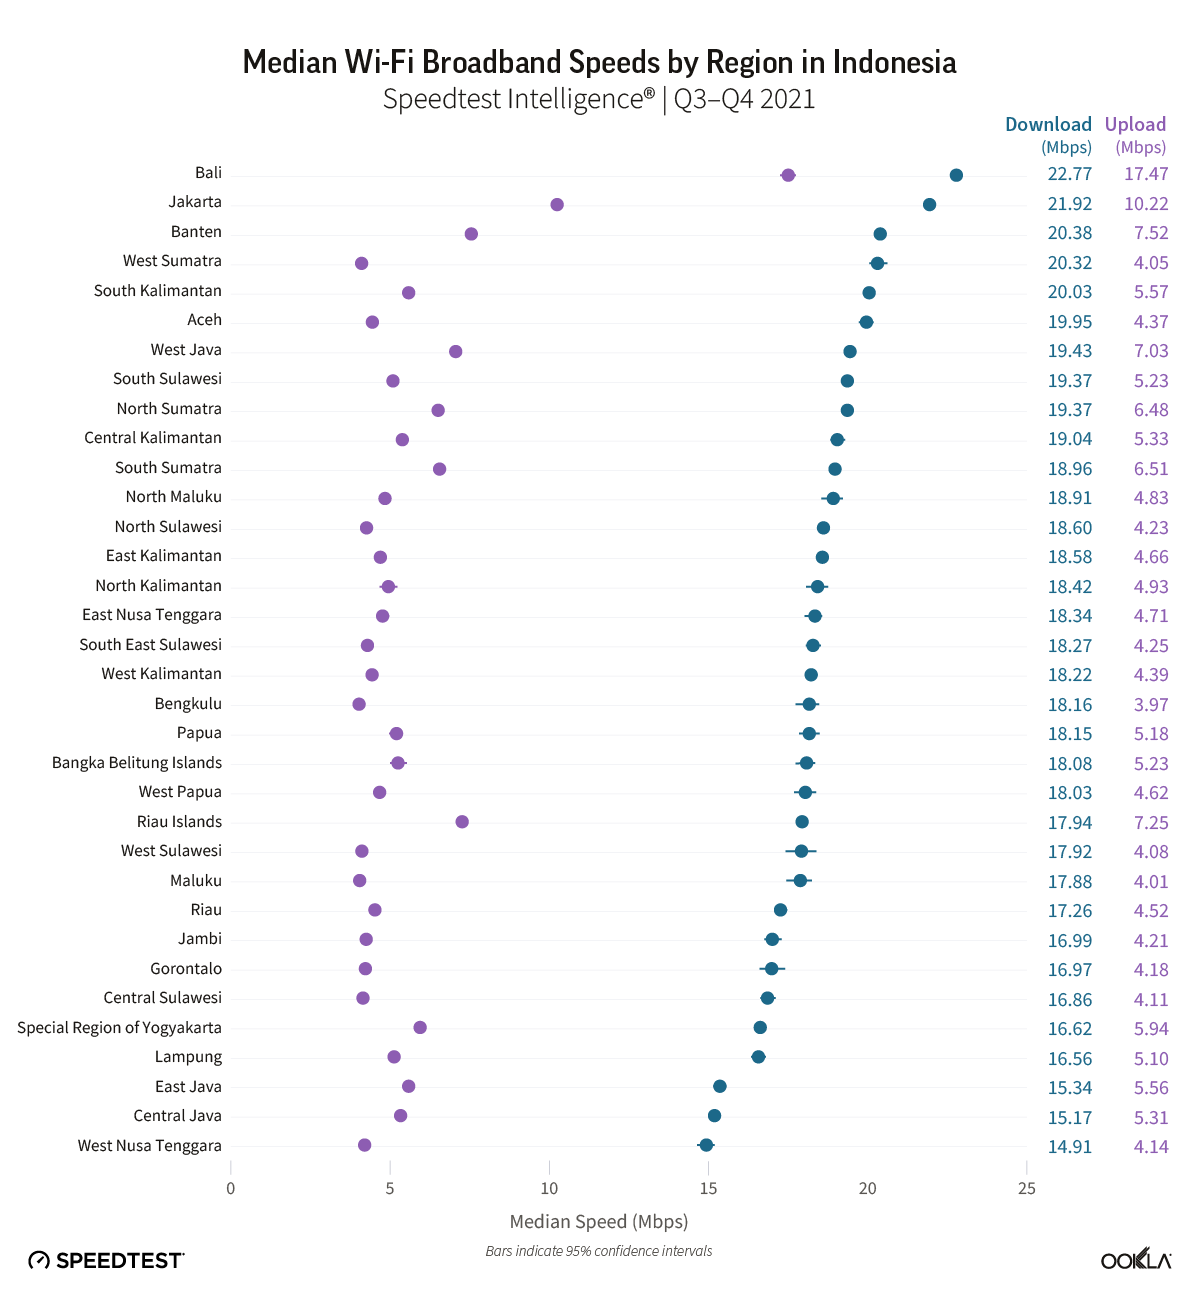
median wi-fi broadband speeds by region in indonesia

Biznet leading in Jakarta Region for Wi-Fi download speeds

Biznet was the fastest fixed provider in the Indonesian capital Jakarta during Q3-Q4 2021, recording near symmetrical speeds for median download (42.59 Mbps) and upload (41.22 Mbps). It was followed by MyRepublic, with a download speed of 32.47 Mbps and upload of 25.46 Mbps, and CBN which also achieved symmetrical speeds at about 28 Mbps. Wi-Fi performance for the remaining three providers, First Media, Telkom, and MNC Play lagged behind, with First Media and Telkom recording upload speeds well below the competition, both below 10 Mbps.
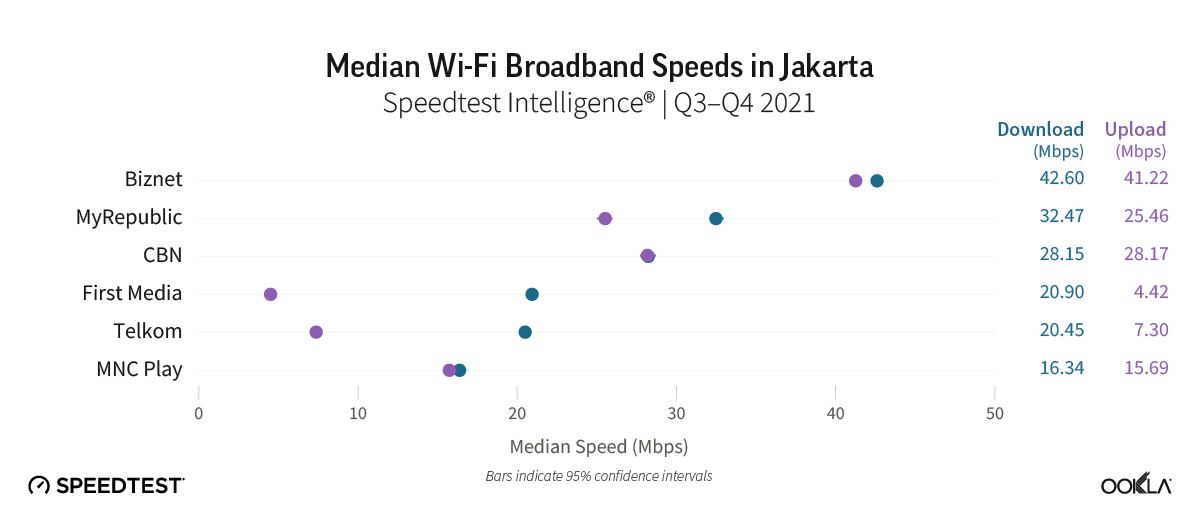
median wi-fi broadband speeds in jakarta

One in three Speedtest samples for provider CBN utilized 5 GHz Wi-Fi, the largest share of any operator in Jakarta. Biznet, MyRepublic and First Media followed, while Telkom and MNC Play showed the lowest share of samples using 5 GHz Wi-Fi.

wi-fi band distribution in jakarta

MyRepublic leading in Banten Region fixed broadband download speed over Wi-Fi

In Banten, the westernmost province of the island of Java, Biznet was the fastest provider over Wi-Fi. Biznet has extended its reach in this region, and obtained sufficient samples (in excess of 3% of the market) to be included as a top provider in our analysis of Banten. Biznet recorded a median download speed of 42.73 Mbps and upload of 41.32 Mbps.
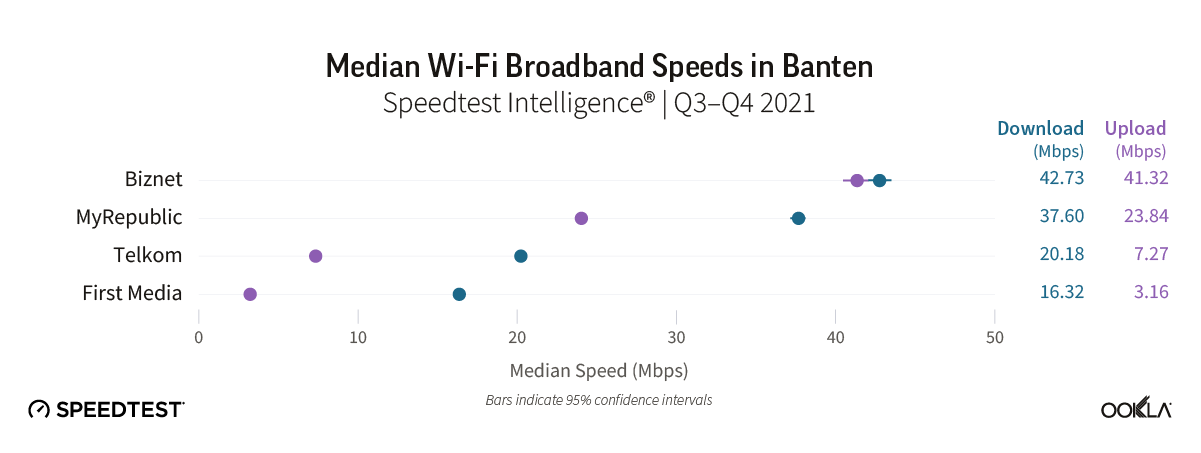
median wi-fi broadband speeds in banten

Biznet also led the region for use of 5 GHz Wi-Fi, at 29% of samples. MyRepublic followed with a download speed of 37.60 Mbps and upload of 23.84 Mbps, setting it apart from both Telkom and First Media.
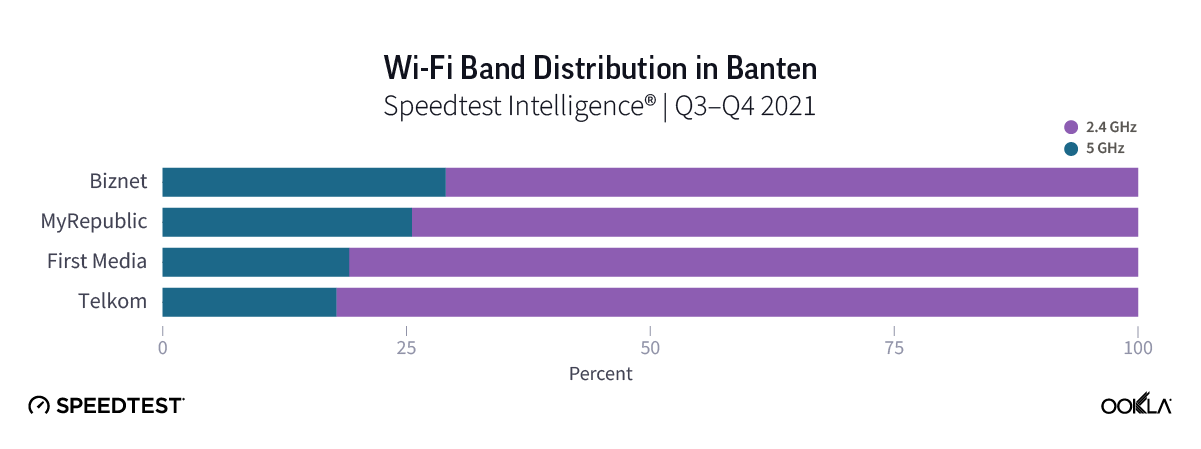
wi-fi band distribution in banten

Biznet leading in West Java Region fixed broadband download speed over Wi-Fi

As the most populous region in Indonesia, West Java saw more providers meet the minimum statistical threshold to be included in our analysis. Biznet was once again the fastest provider over Wi-Fi, albeit with slower speeds than in its other coverage regions, at 36.18 Mbps for median download and 35.76 Mbps for upload speed. MyRepublic was the second placed operator for download speeds, recording 29.57 Mbps, followed by Telkom, StarNet, and First Media.
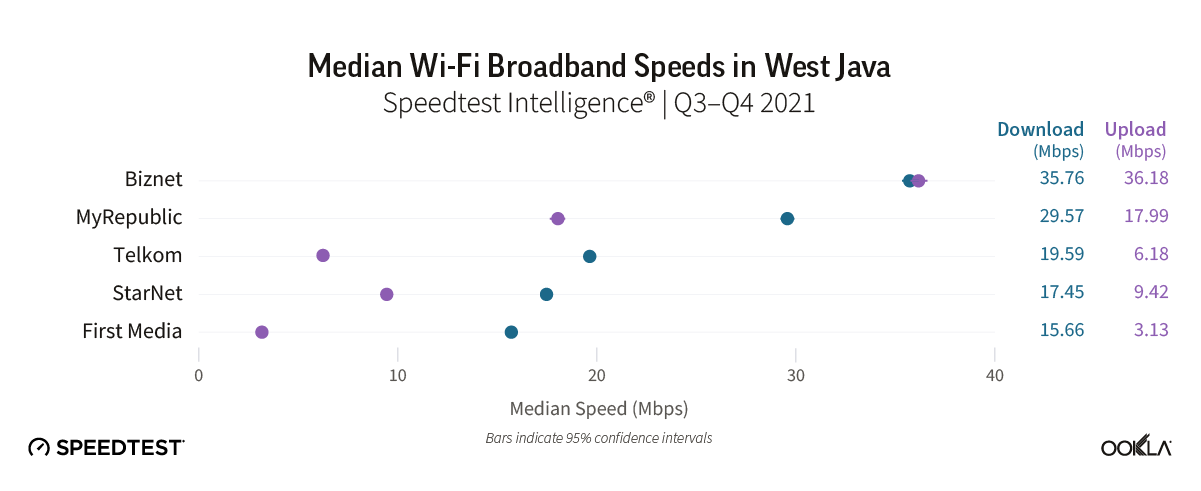
median wi-fi broadband speeds in west java

Providers in West Java generally recorded slower speeds than in other regions, and the distribution of Wi-Fi samples between 2.4 GHz and 5 GHz also skewed further towards 2.4 GHz than elsewhere, with First Media, Telkom, and StarNet all recording approximately 85% of samples over 2.4 GHz.
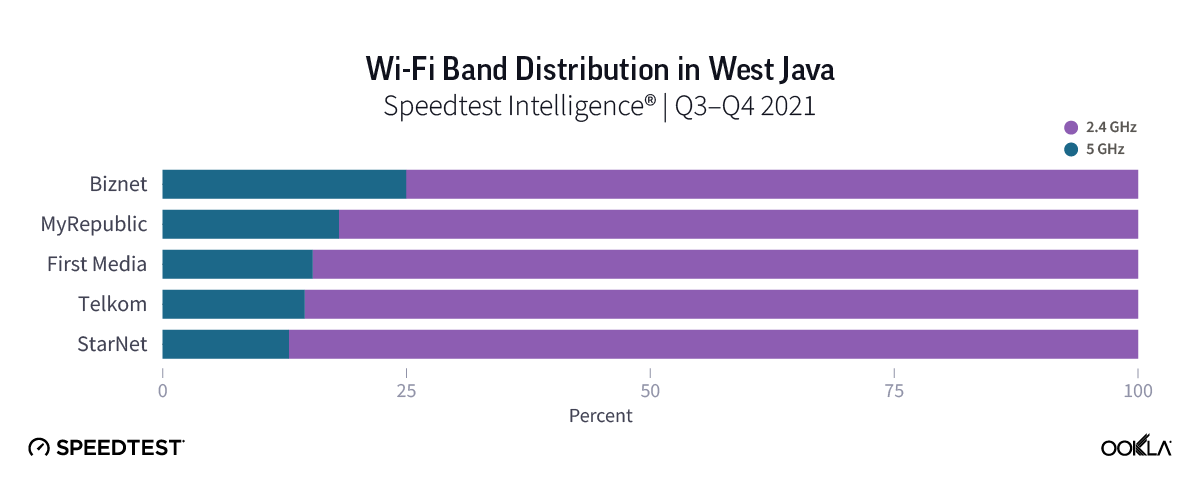
wi-fi band distribution in west java

MyRepublic leading in Central Java Region Wi-Fi fixed broadband download speed

In Central Java, in contrast to most other Indonesian regions, MyRepublic outperformed Biznet on median Wi-Fi download speeds, recording 29.11 Mbps during Q3-Q4 2021. Biznet followed with 25.85 Mbps, but also recorded the fastest upload speed of 18.95 Mbps. Telkom followed with a download speed of 16.39 Mbps, while PT Global Media Data Prima lagged behind the rest of the region with a median download speed of 3.81 Mbps. It also recorded the lowest proportion of Wi-Fi samples using 5 GHz, at only 5%.
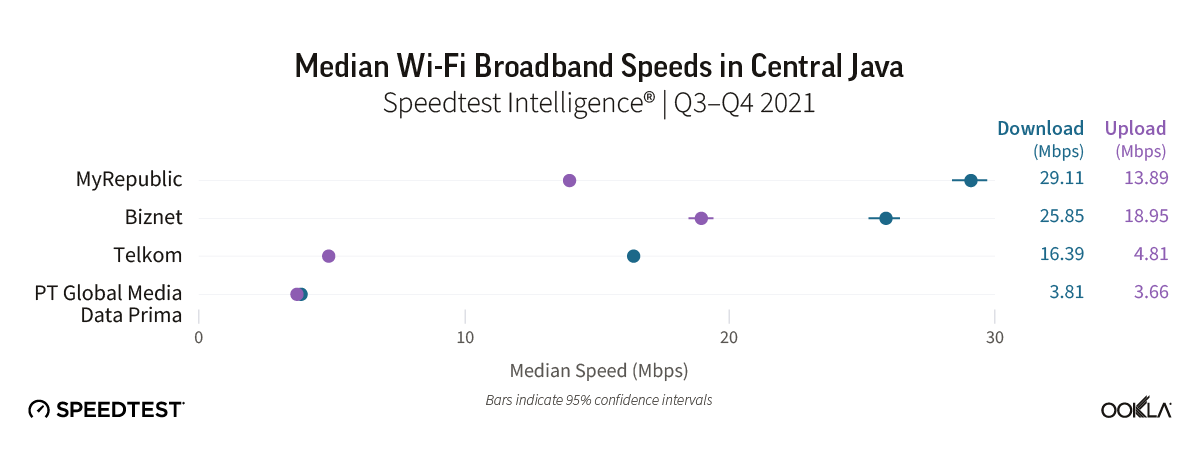
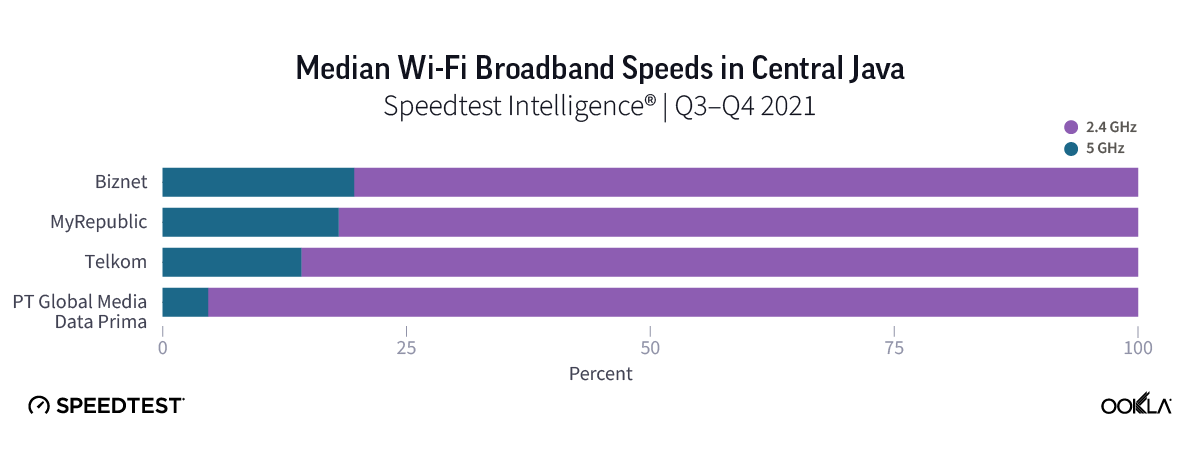
median wi-fi broadband speeds in central java

median wi-fi broadband speeds in central java

Biznet leading in East Java Region for Wi-Fi fixed broadband download speed

East Java saw a return to form for Biznet as the fastest performing provider over Wi-Fi, with a median download speed of 33.11 Mbps and upload speed 29.34 Mbps. It was closely followed in terms of download speeds by MyRepublic with 27.75 Mbps. Telkom and First Media came next with download speeds of 15.68 Mbps and 14.39 Mbps respectively, while their upload speeds lagged far behind their rivals.
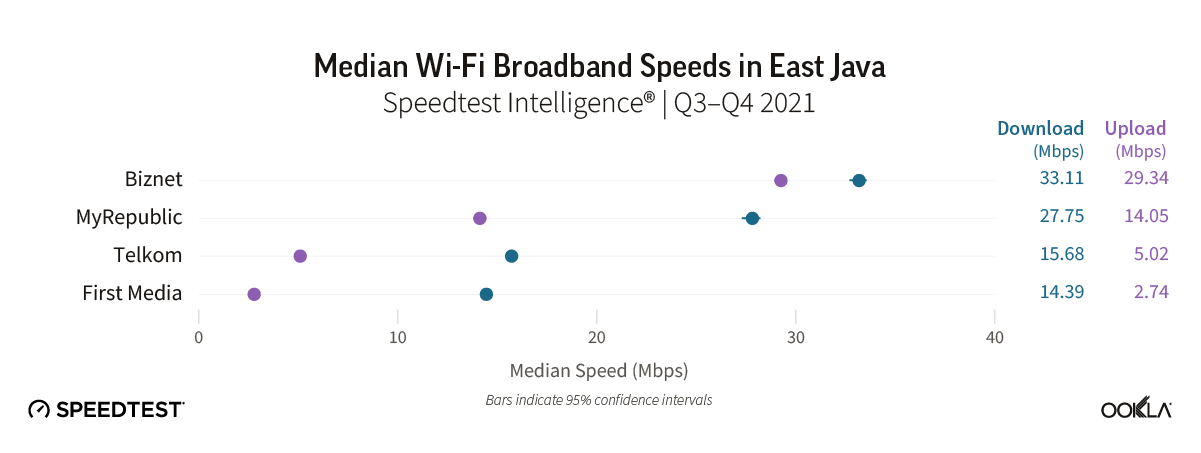
median wi-fi broadband speeds in east java

Wi-Fi distribution showed a similar story, with Telkom and First Media scoring the lowest share of samples over 5 GHz, at 16% and 14%, respectively.
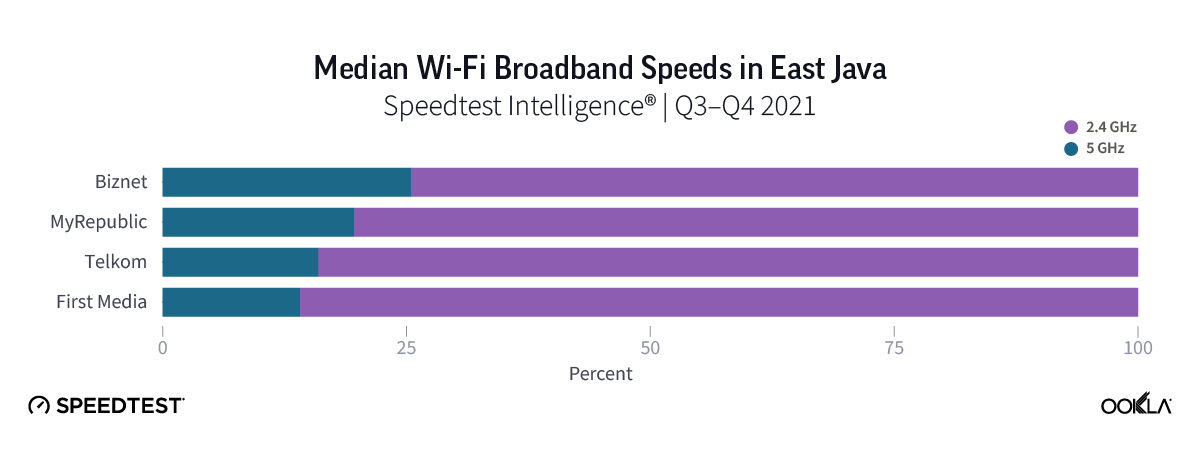
MTM Bali leading in Bali Region fixed broadband download speed over Wi-Fi

Bali was the most competitive region in this analysis in terms of top speeds among providers, with three providers all recording similar median download and upload speeds of close to 40 Mbps. We could not declare a statistical winner based on median Wi-Fi download speeds, with both MTM Bali and GlobalXtreme’s download speeds in the same range, although GlobalXtreme’s upload speeds were demonstrably faster.
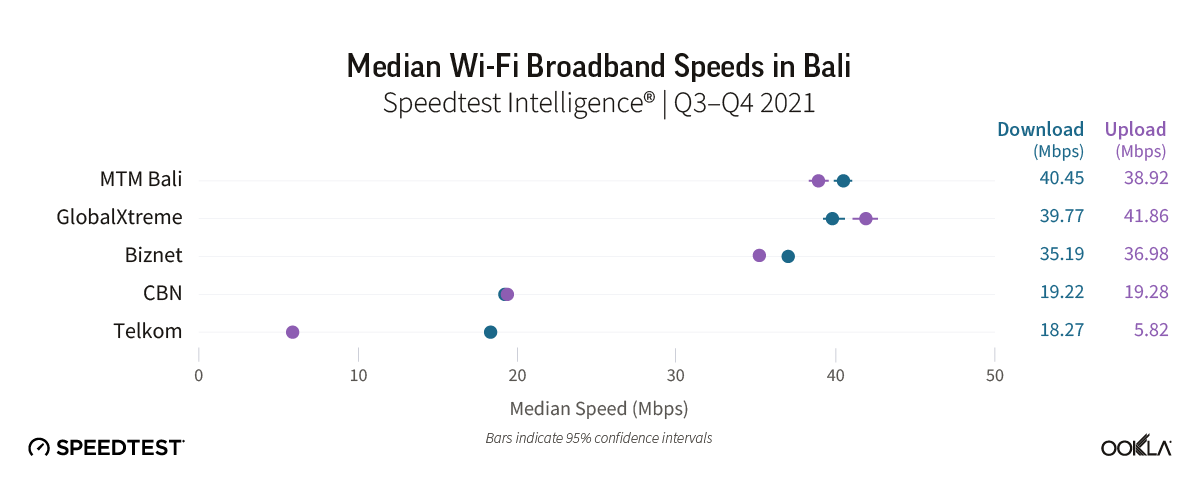
median wi-fi broadband speeds in bali

GlobalXtreme also recorded the highest share of 5 GHz Wi-Fi samples, at 35% of total, far outpacing the competition, with the remaining operators achieving 20% or less.
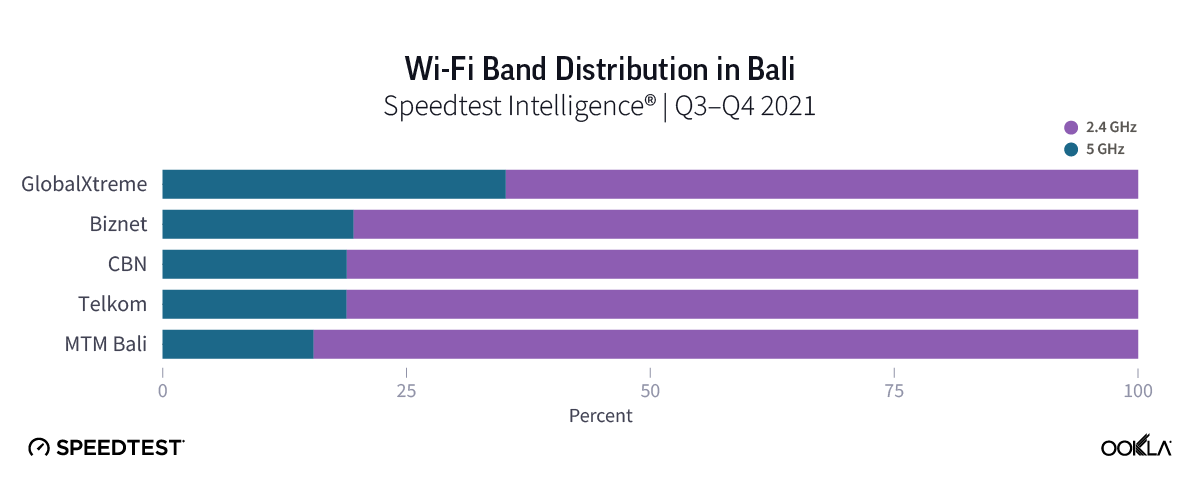
wi-fi band distribution in Bali

Indonesian fixed broadband outlook

Fixed broadband penetration among Indonesian households remains low, at below 20% according to most estimates. Mobile internet remains the dominant access technology in the market, but the move to working and studying at home as a result of the COVID-19 pandemic has driven more households to subscribe to fixed broadband services. Competition is ramping up in the market, with smaller players such as Biznet and MyRepublic actively rolling out networks and targeting gains from Telkom, which still maintains a majority market share of broadband connections. The recent news that Axiata Group and its Indonesian subsidiary XL Axiata have signed a non-binding agreement to acquire a majority share of Indonesian broadband provider LinkNet is further evidence that providers see strong opportunity for growth. We expect this will help accelerate network rollout and the provision of more sophisticated bundled broadband services in the market, which in turn will help drive up Indonesian fixed broadband speeds, particularly in the densely populated regions covered in this report.


Performa Jaringan Fixed Broadband di Indonesia Semakin Tertinggal dari Rekan-rekannya di Satu Kawasan

Pesan utama:

  • Performa jaringan fixed di Indonesia terus tertinggal dari rekan-rekannya di satu kawasan. Meskipun performa jaringan fixed broadband di Indonesia terus meningkat dari kuartal ke kuartal, Ookla® Speedtest Intelligence® menunjukkan bahwa Indonesia tertinggal dari banyak rekannya di satu kawasan pada metrik utama seperti median kecepatan unduh dan penetrasi router yang lebih canggih yang mendukung Wi-Fi 5 GHz, dan perbedaan ini semakin besar.
  • Jawa Timur dan Jawa Tengah termasuk wilayah di Indonesia yang paling lambat performanya. Sebagian besar wilayah di Indonesia mencapai median kecepatan unduh yang sama. Namun masih ada beberapa pencilan (outlier): Bali adalah wilayah dengan performa terbaik, dan wilayah-wilayah di Jawa Timur dan Jawa Tengah yang penduduknya lebih padat terus mengalami performa yang paling lambat di pasar.
  • Dengan kecepatan yang lebih tinggi, pelanggan pun lebih bahagia. Sentimen konsumen terhadap penyedia jaringan fixed broadband di Indonesia, yang diukur dengan Peringkat Bintang 5 Ookla, berkaitan erat dengan performa jaringan selama setahun terakhir.
  • Persaingan kian sengit di pasar jaringan fixed broadband Indonesia. Data sampel Speedtest Intelligence® untuk K3-K4 2021 menunjukkan 306 ISP aktif di pasar. Dari jumlah tersebut, empat operator jaringan nasional utama memenuhi ambang batas kami untuk dianggap sebagai penyedia teratas (dengan minimal 3% sampel) – Telkom, First Media, MyRepublic, dan Biznet. Di tingkat regional, daftar penyedia teratas ini berkembang menjadi sepuluh, termasuk CBN, MNC Play, StarNet, PT Global Media Data Prima, MTM Bali, dan GlobalXtreme.
  • Biznet memimpin pasar dalam performa jaringan fixed broadband menurut Speedtest Intelligence. Biznet merupakan operator terkemuka, baik secara nasional maupun di banyak wilayah di Indonesia, dengan kecepatan unduh dan unggahnya yang hampir simetris.

Singapura memimpin dalam kecepatan jaringan fixed broadband di Asia Tenggara

Indonesia menempati peringkat ke-114 pada Speedtest® Global IndexTM untuk median kecepatan unduh tetap (fixed download), berdasarkan data Mei 2022. Menurut Speedtest Intelligence, kecepatan fixed broadband di negara ini telah meningkat selama setahun terakhir, dari median kecepatan unduh 17,37 Mbps pada Maret 2021 menjadi 21,23 Mbps pada Maret 2022. Kecepatan unggah fixed broadband di pasar telah meningkat dengan margin yang lebih besar, dari 4,95 Mbps pada Maret 2021, menjadi 9,73 Mbps pada Maret 2022. Namun, sebagaimana pasar selulernya, dan meskipun lintasannya membaik, performa fixed broadband Indonesia terus tertinggal dari banyak rekannya di satu kawasan  

Mengamati performa selama tahun 2021 di pasar Asia Tenggara, kesenjangan performa yang cukup besar terus terjadi antara Singapura dan Thailand dibandingkan dengan rekan-rekan keduanya di satu kawasan, di mana keduanya mencapai median kecepatan unduh tetap (fixed download) lebih dari 150 Mbps selama K4 2021. Juga terjadi perbedaan performa antara Malaysia (75,91 Mbps), Vietnam (67,91 Mbps), dan Filipina (47,50 Mbps). Dari keempat pasar yang tersisa, Brunei dan Laos kecepatannya nyaris 30 Mbps, sementara Indonesia dan Kamboja menjadi pasar fixed-line yang paling lambat, dengan median kecepatan unduh masing-masing 20,08 Mbps dan 18,89 Mbps.
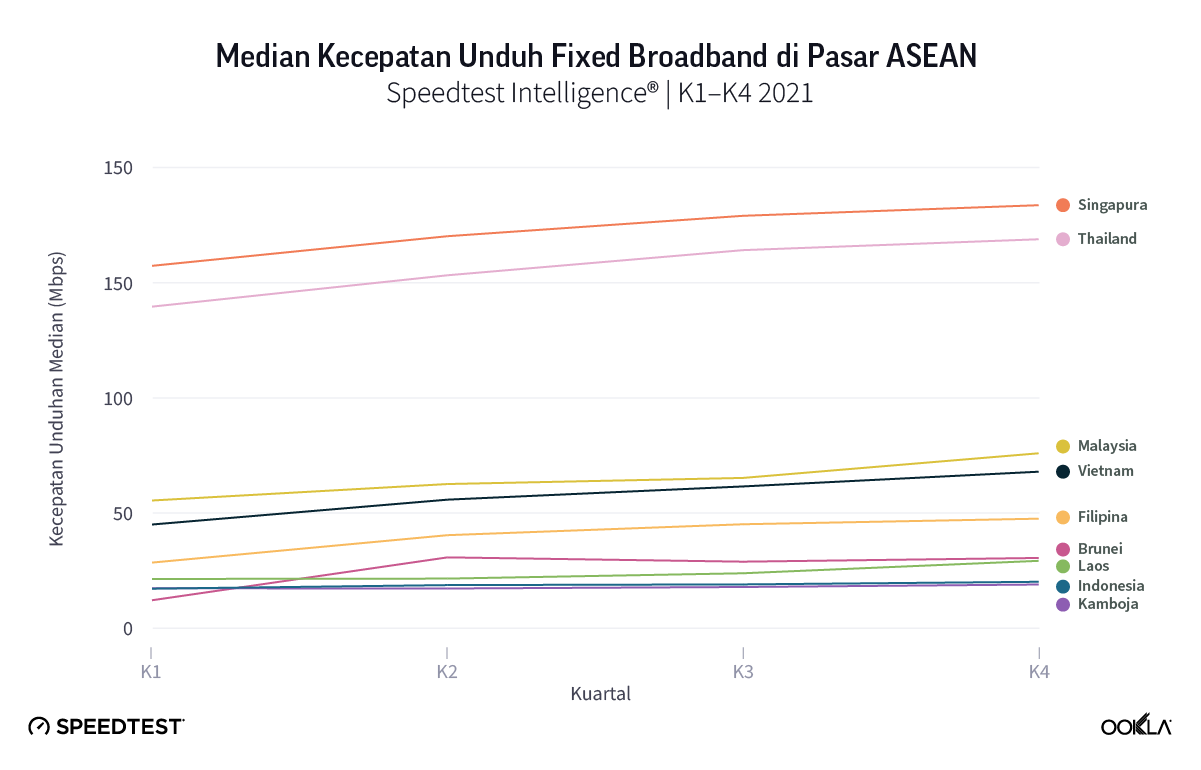
Kami menggunakan data dari Speedtest Intelligence untuk mengevaluasi performa fixed broadband di Indonesia selama K3-K4 2021. Analisis kami memeriksa kecepatan fixed broadband di tingkat negara dan penyedia. Kami juga memeriksa performa Wi-Fi sebagai subset dari total sampel fixed broadband untuk menilai kecepatan yang dikirimkan ke perangkat pengguna akhir dan melihat pangsa sampel yang menggunakan router yang mendukung 5 GHz melalui Wi-Fi.

Semakin banyak operator di seluruh dunia yang menawarkan solusi jaringan rumah untuk membantu meningkatkan kecepatan dan jangkauan Wi-Fi di dalam rumah. Di Indonesia, First Media, Biznet, dan MyRepublic menawarkan solusi jaringan mesh, sedangkan beberapa ISP juga menawarkan opsi untuk melakukan upgrade ke router yang mendukung jalur (band) 5 GHz. Dengan jalur ini, bandwidth saluran yang dihasilkan menjadi lebih besar dan gangguan yang ditimbulkan pun biasanya lebih rendah daripada Wi-Fi di jalur (band) 2,4 GHz, yang memungkinkan peningkatan performa untuk aktivitas bandwidth tinggi seperti bermain game dan streaming konten video definisi tinggi.

Mencermati distribusi sampel Speedtest untuk fixed Wi-Fi yang berjalan pada koneksi Wi-Fi 2,4 GHz versus koneksi Wi-Fi 5 GHz, pemimpin di kawasan ini, Singapura dan Thailand, berikut Malaysia, menjadi satu-satunya pasar di daftar ini yang mayoritas sampelnya tercatat menggunakan 5 GHz. Indonesia kembali berada di urutan terakhir dengan koneksi 5 GHz yang hanya menyumbang 22% sampel.
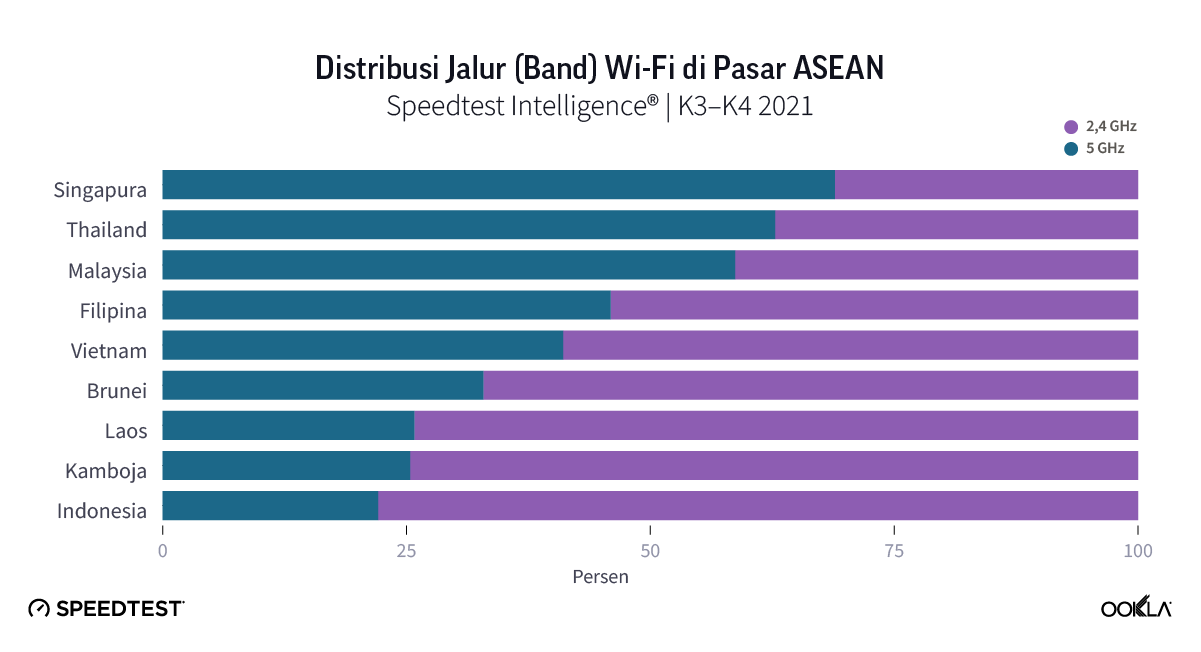
Biznet memimpin di Indonesia secara nasional pada kecepatan unduh fixed broadband

Metodologi statistik kami menetapkan ambang batas minimal 3% sampel bagi operator agar dapat dipertimbangkan sebagai penyedia teratas dan bagian dari analisis kami. Dengan menggunakan metodologi ini, Biznet menjadi operator fixed broadband tercepat untuk median kecepatan unduh dan unggah selama K3-K4 2021, disusul oleh My Republic. Biznet meraih hasil yang hampir simetris dari kecepatan unduh 40,85 Mbps dan kecepatan unggah 39,29 Mbps, sedangkan My Republic mencapai kecepatan unduh 34,27 Mbps dan kecepatan unggah 21,93 Mbps. Hingga Mei 2022, jaringan fiber optik Biznet meluas hingga mencapai total lebih dari 64.000 km, dengan jaringan aksesnya saat ini yang mencakup lebih dari 1,46 juta rumah tangga. Untuk bersaing lebih agresif dengan layanan IndiHome Telkom, Biznet meluncurkan layanan IPTV pada Februari 2020. Dua ISP nasional lainnya, Telkom dan First Media, tertinggal, yang masing-masing mencapai median kecepatan unduh 18,91 Mbps dan 16,54 Mbps.
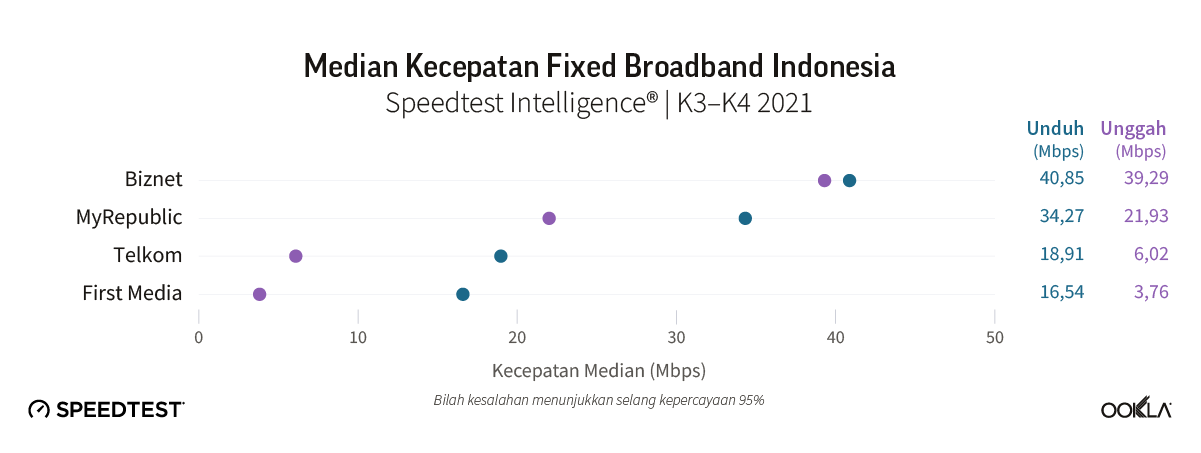
Mencermati pemisahan sampel dari koneksi Wi-Fi 2,4 GHz versus koneksi Wi-Fi 5 GHz, terlihat adanya perbedaan antarpemimpin pasar, antara Biznet dan MyRepublic serta First Media dan Telkom. Namun, keempat operator fixed broadband tersebut mencatat lebih dari 70% tes menggunakan koneksi Wi-Fi 2,4 GHz. Jika kita mengamati performa Wi-Fi di Indonesia sebagai bagian dari total sampel fixed broadband, maka muncul gambar serupa, di mana Biznet dan My Republic mengungguli Telkom dan First Media.
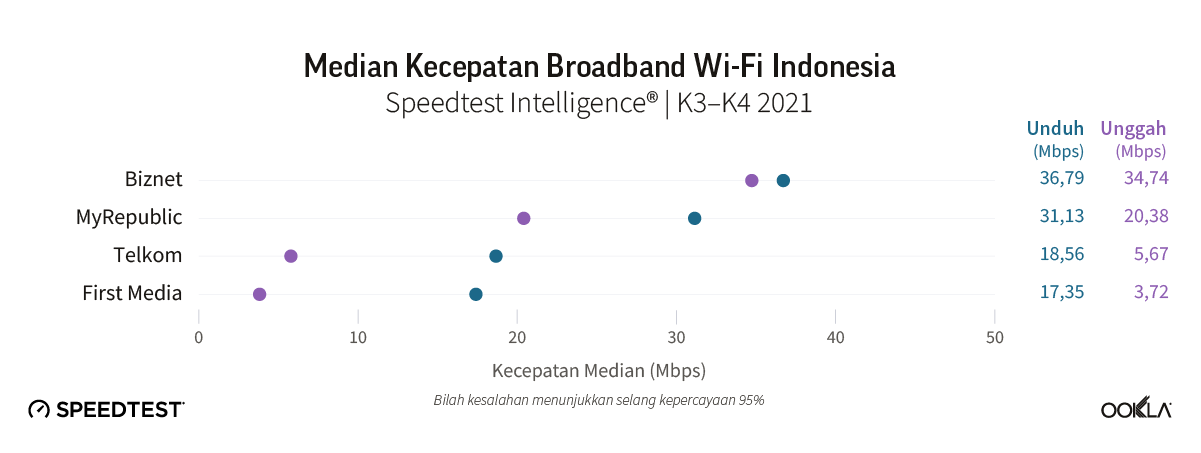
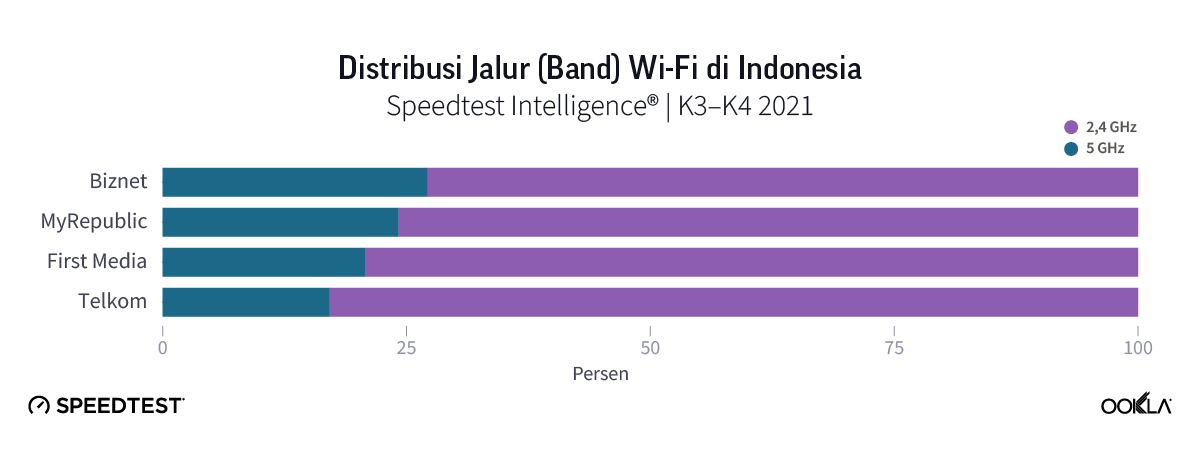
Sentimen konsumen mengikuti jejak performa jaringan

Ada korelasi positif yang jelas antara performa jaringan tetap (fixed) dan sentimen konsumen di pasar fixed broadband Indonesia. Berdasarkan rata-rata (mean) Peringkat Bintang 5 Speedtest di pasar, Biznet menjadi operator tetap (fixed) dengan peringkat teratas di K3-K4 2021 dan skor 3,9, sedangkan First Media menempati posisi terakhir dengan skor 2,8.
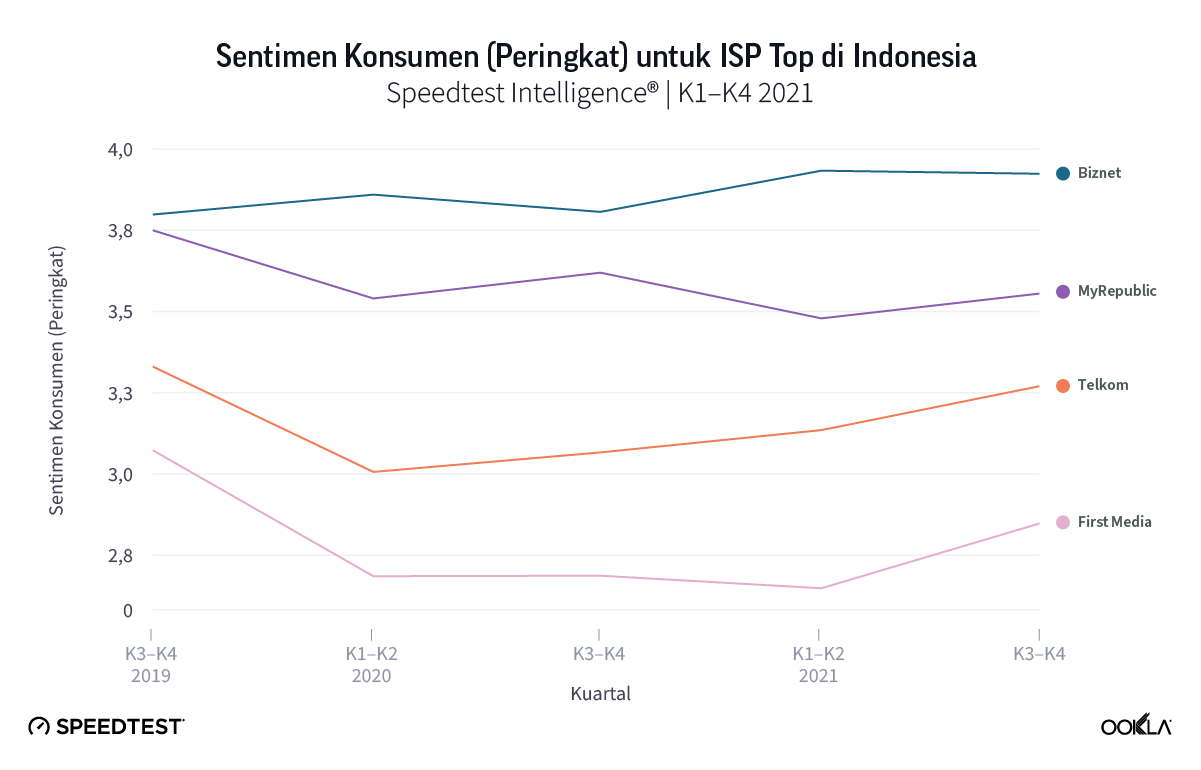
Kesenjangan di tingkat regional dalam hal kecepatan unduh fixed broadband melalui Wi-Fi tetap terjadi

Terlepas dari tujuan Rencana Broadband Indonesia untuk meningkatkan kecepatan di seluruh Indonesia, tetap terjadi sejumlah kesenjangan di tingkat regional dalam hal median kecepatan unduh dan unggah. Bagi sebagian besar wilayah di Indonesia, kecepatan unduh menunjukkan adanya sedikit variasi, berkisar antara 16 Mbps dan 20 Mbps. Namun terdapat beberapa pencilan (outlier). Bali, sebagai hotspot wisata dan berkembang menjadi tujuan populer bagi pekerja nomaden digital, dan Jakarta, sebagai ibukota Indonesia, menempati dua posisi teratas secara nasional selama K3-K4 2021, dengan kecepatan unduh masing-masing 22,77 Mbps dan 21,92 Mbps.

Sementara itu, dua wilayah terpadat di negeri ini, Jawa Timur dan Tengah, menghasilkan median kecepatan unduh terendah, masing-masing 15,34 Mbps dan 15,17 Mbps. Kecepatan unggah di seluruh pasar menunjukkan variasi yang lebih banyak, mulai dari tertinggi 17,47 Mbps di Bali, hingga terendah 3,97 Mbps di Bengkulu.
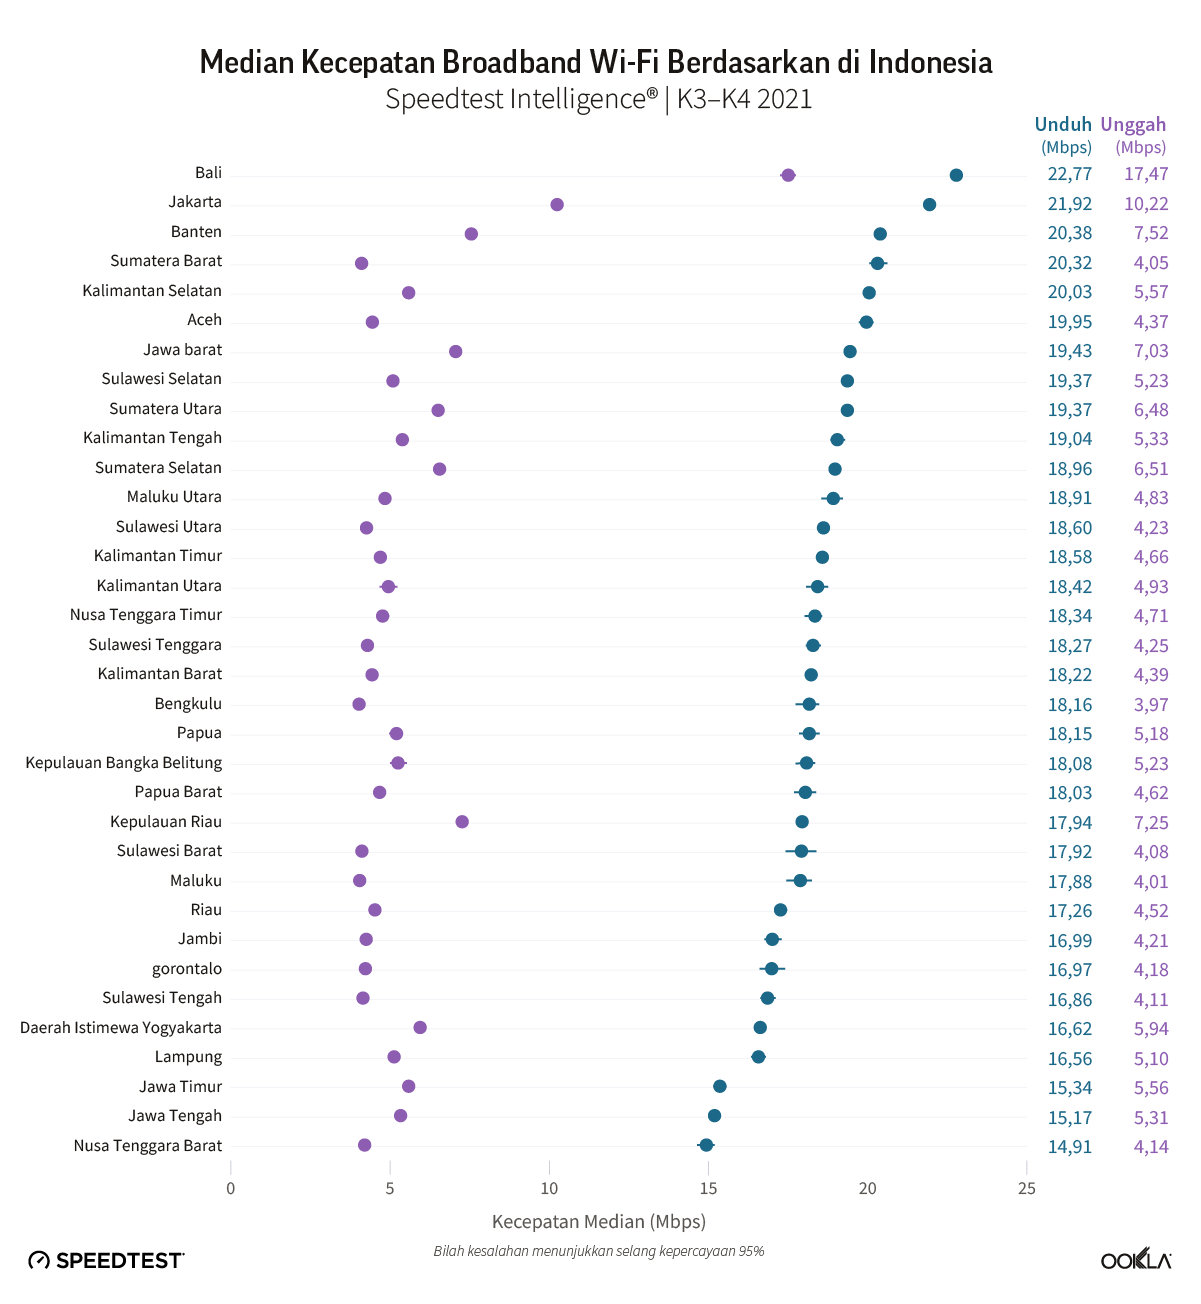
Biznet memimpin di wilayah Jakarta dalam kecepatan unduh Wi-Fi

Biznet adalah penyedia broadband fixed tercepat di Jakarta, ibukota Indonesia, selama K3-K4 2021, dengan kecepatan yang hampir simetris untuk median unduh (42,59 Mbps) dan unggah (41,22 Mbps). Disusul oleh MyRepublic, dengan kecepatan unduh 32,47 Mbps dan unggah 25,46 Mbps, serta CBN yang juga mencapai kecepatan simetris sekitar 28 Mbps. Performa Wi-Fi untuk tiga provider lainnya, First Media, Telkom, dan MNC Play justru tertinggal, di mana First Media dan Telkom mencapai kecepatan unggah jauh di bawah pesaing, keduanya kurang dari 10 Mbps.
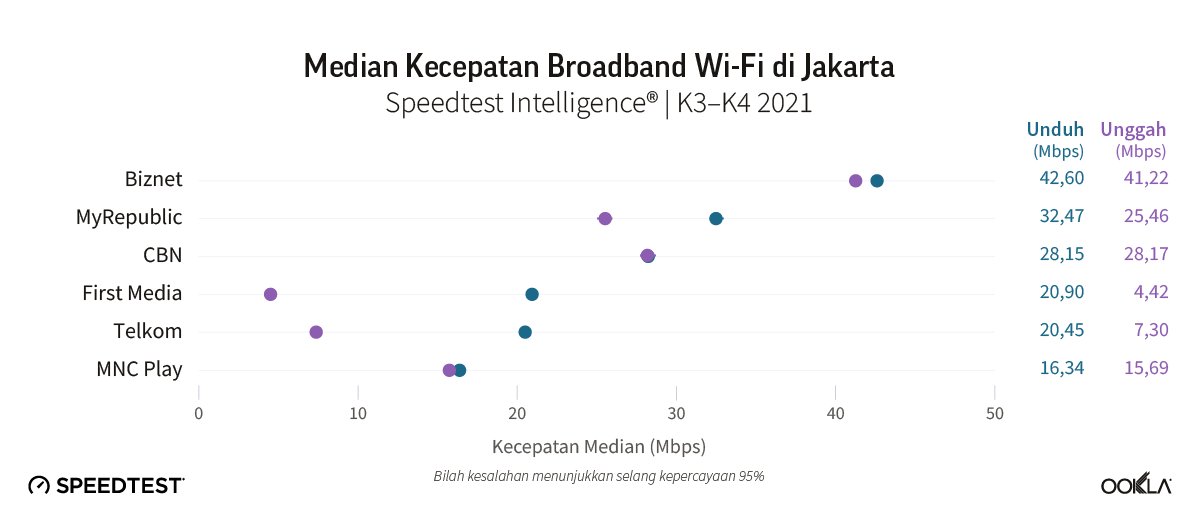
Satu dari tiga sampel Speedtest untuk penyedia CBN menggunakan Wi-Fi 5 GHz, yang terbesar di antara seluruh operator di Jakarta. Biznet, MyRepublic, dan First Media menyusul, sementara Telkom dan MNC Play menunjukkan sampel terendah dengan menggunakan Wi-Fi 5 GHz.
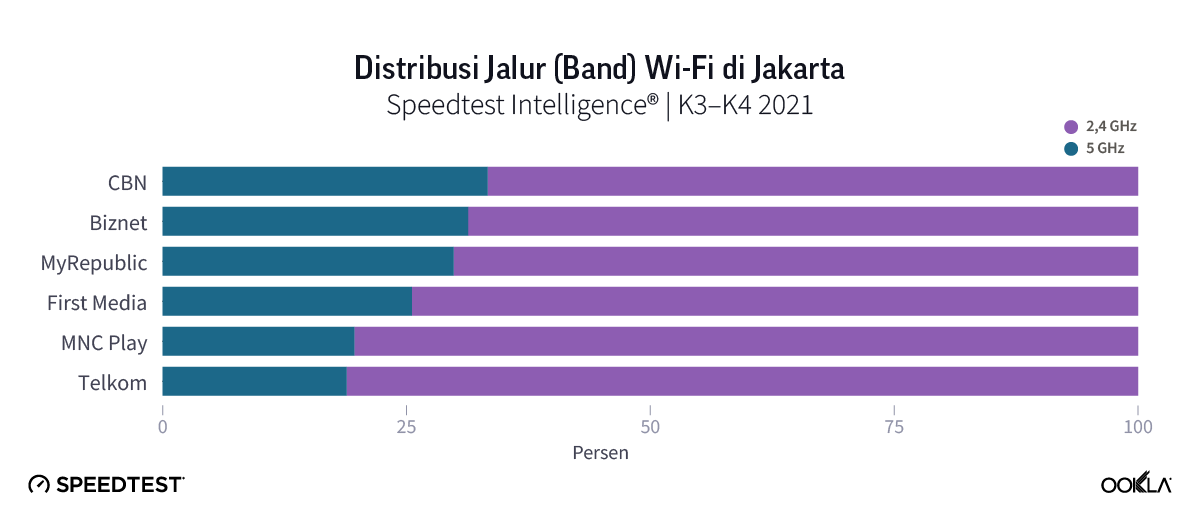
MyRepublic memimpin di wilayah Banten dalam kecepatan unduh fixed broadband melalui Wi-Fi

Di Banten, provinsi paling barat di Pulau Jawa, Biznet menjadi penyedia tercepat melalui Wi-Fi. Biznet telah memperluas jangkauannya di wilayah ini, dan memperoleh sampel yang cukup (lebih dari 3% dari pasar) untuk dimasukkan sebagai penyedia teratas dalam analisis kami di Banten. Biznet mencatat median kecepatan unduh 42,73 Mbps dan unggah 41,32 Mbps.
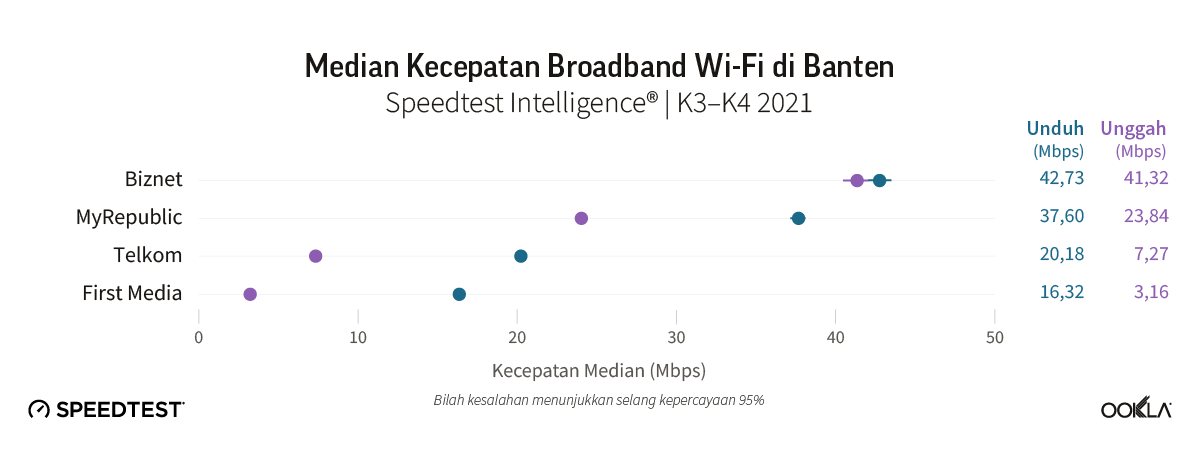
Biznet juga memimpin di wilayah tersebut dalam penggunaan Wi-Fi 5 GHz, pada 29% sampel. MyRepublic mengekor dengan kecepatan unduh 37,60 Mbps dan unggah 23,84 Mbps, sehingga tampak berbeda dari Telkom dan First Media.
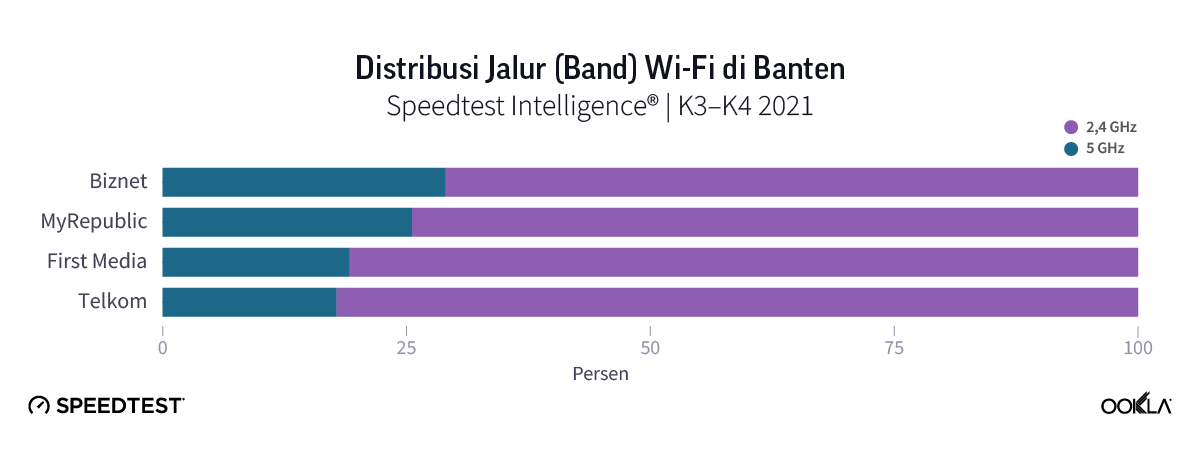
Biznet memimpin di wilayah Jawa Barat dalam kecepatan unduh fixed broadband melalui Wi-Fi

Sebagai wilayah terpadat di Indonesia, Jawa Barat memiliki lebih banyak penyedia yang memenuhi ambang batas statistik minimal untuk dimasukkan dalam analisis kami. Biznet sekali lagi menjadi penyedia tercepat yang menggunakan Wi-Fi, meskipun dengan kecepatan yang lebih lambat daripada di wilayah cakupan lainnya, pada 36,18 Mbps untuk median unduh dan 35,76 Mbps untuk kecepatan unggah. MyRepublic menjadi operator di urutan kedua untuk kecepatan unduh, mencatat 29,57 Mbps, diikuti oleh Telkom, StarNet, dan First Media.
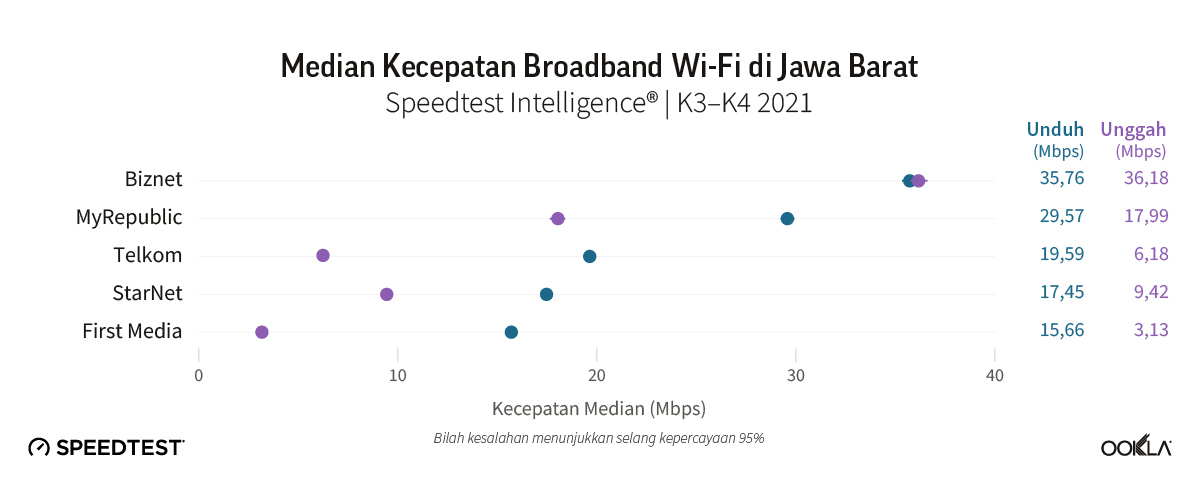
Para penyedia jaringan di Jawa Barat umumnya meraih kecepatan yang lebih lambat daripada di daerah lain, dan distribusi sampel Wi-Fi antara 2,4 GHz dan 5 GHz juga condong lebih jauh ke arah 2,4 GHz daripada di tempat lain, di mana First Media, Telkom, dan StarNet semuanya merekam sekitar 85% sampel pada 2,4 GHz.
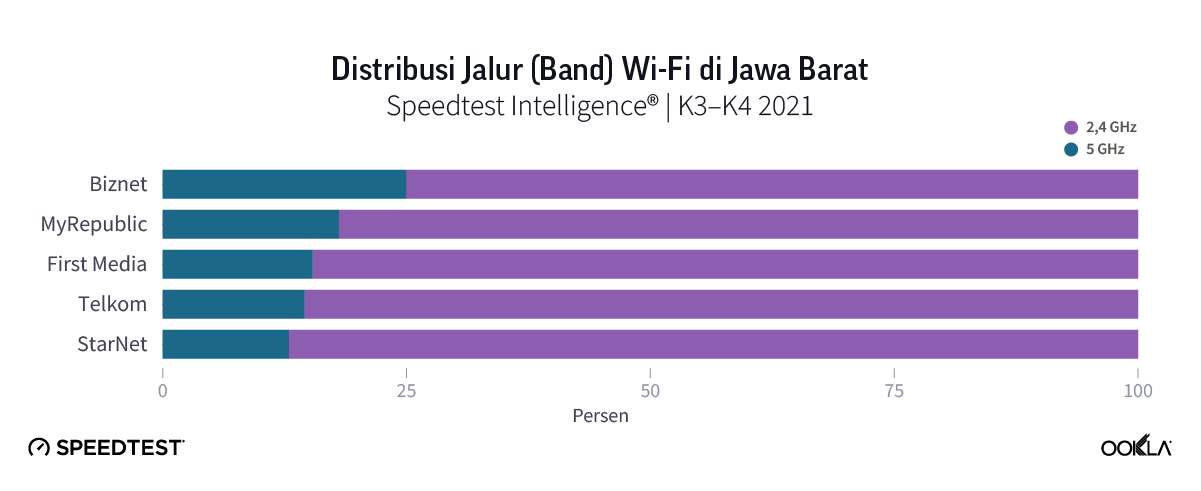
MyRepublic memimpin di wilayah Jawa Tengah dalam kecepatan unduh fixed broadband melalui Wi-Fi

Di Jawa Tengah, berbedar dari sebagian besar wilayah Indonesia lainnya, MyRepublic mengungguli Biznet pada median kecepatan unduh Wi-Fi, mencapai 29,11 Mbps selama K3-K4 2021. Biznet menyusul dengan kecepatan unggah 25,85 Mbps, namun sekaligus mencatat kecepatan unggah tercepat 18,95 Mbps. Telkom menyusul dengan kecepatan unduh 16,39 Mbps, sedangkan PT Global Media Data Prima jauh tertinggal dari wilayah lainnya dengan median kecepatan unduh 3,81 Mbps. Penyedia ini juga mencatat proporsi terendah sampel Wi-Fi menggunakan 5 GHz, hanya 5%.

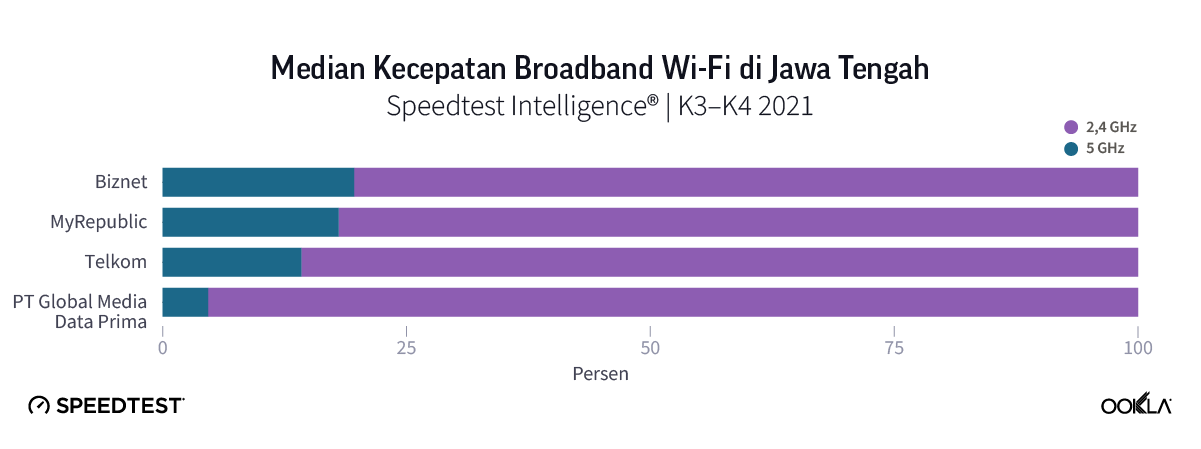
Biznet memimpin di wilayah Jawa Timur dalam kecepatan unduh fixed broadband melalui Wi-Fi

Jawa Timur kembali hadir untuk Biznet sebagai penyedia dengan performa tercepat melalui Wi-Fi, dengan median kecepatan unduh 33,11 Mbps dan kecepatan unggah 29,34 Mbps. Selanjutnya diikuti oleh MyRepublic dalam hal kecepatan unduh dengan 27,75 Mbps. Telkom dan First Media berada di urutan berikutnya dengan kecepatan unduh masing-masing 15,68 Mbps dan 14,39 Mbps, sementara kecepatan unggah mereka tertinggal jauh di belakang saingan-saingan mereka.

Distribusi Wi-Fi menunjukkan hal yang senada, di mana Telkom dan First Media mencetak persentase sampel terendah pada 5 GHz, masing-masing sebesar 16% dan 14%.

MTM Bali memimpin di wilayah Bali dalam kecepatan unduh fixed broadband melalui Wi-Fi

Bali merupakan wilayah yang paling kompetitif pada analisis ini dalam hal kecepatan tertinggi di antara para penyedia, dengan tiga penyedia semuanya merekam median kecepatan unduh dan unggah serupa yang mendekati 40 Mbps. Kami tidak dapat menyatakan pemenang statistik berdasarkan median kecepatan unduh Wi-Fi, dengan kecepatan unduh MTM Bali dan GlobalXtreme dalam kisaran yang sama, meskipun kecepatan unggah GlobalXtreme terbukti lebih cepat.
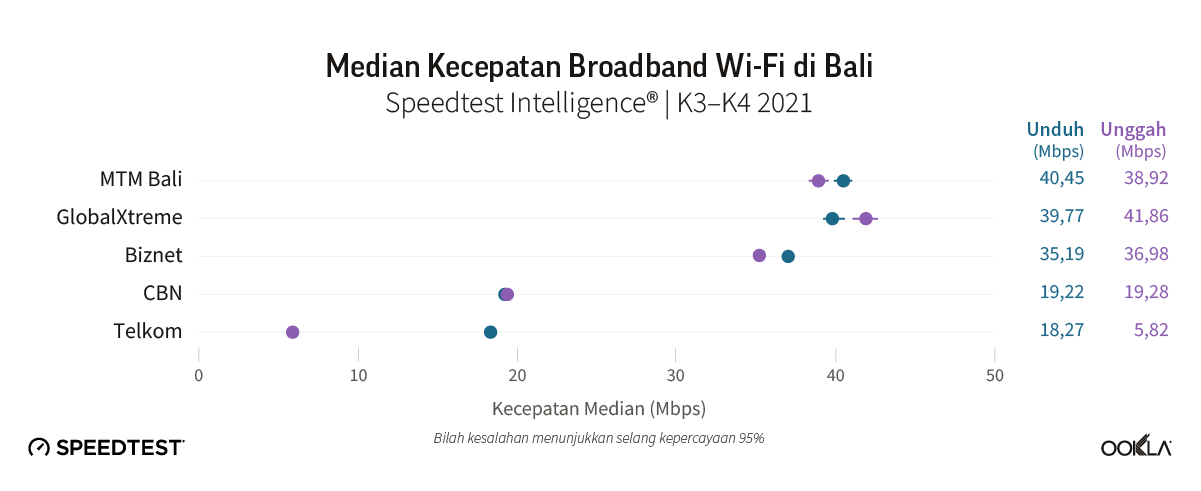
GlobalXtreme juga mencatat persentase tertinggi dari sampel Wi-Fi 5 GHz, pada 35% dari total, jauh melampaui persaingan, dengan para operator yang lain mencapai 20% atau kurang.
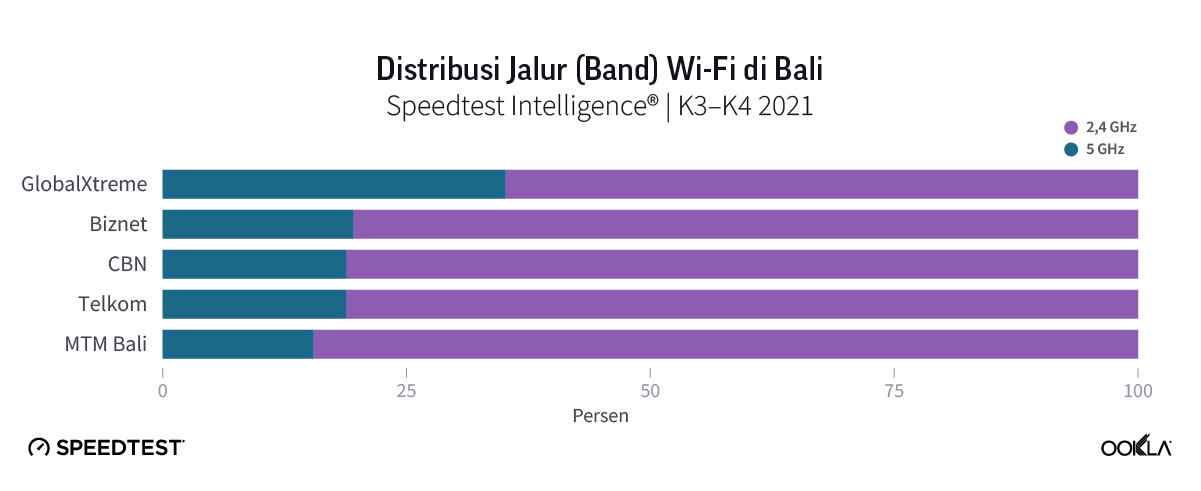
Prospek fixed broadband di Indonesia

Penetrasi fixed broadband dalam lingkup rumah tangga di Indonesia tetap rendah, di bawah 20% menurut sebagian besar perkiraan. Internet seluler tetap menjadi teknologi akses yang dominan di pasar, tetapi peralihan ke opsi bekerja dan belajar di rumah sebagai akibat dari pandemi COVID-19 telah mendorong lebih banyak rumah tangga untuk berlangganan layanan fixed broadband. Persaingan semakin meningkat di pasar, di mana para pemain yang lebih kecil seperti Biznet dan MyRepublic aktif meluncurkan jaringan dan menargetkan keuntungan dari Telkom, yang masih mempertahankan pangsa pasar mayoritas koneksi broadband. Berita yang muncul baru-baru ini yang menyatakan bahwa Axiata Group dan anak perusahaannya di Indonesia, XL Axiata, telah menandatangani perjanjian yang tidak mengikat untuk mengakuisisi mayoritas saham penyedia broadband Indonesia, LinkNet, menjadi bukti lebih lanjut bahwa para penyedia melihat adanya peluang besar untuk pertumbuhan. Kami berharap hal ini akan membantu mempercepat peluncuran jaringan dan penyediaan layanan broadband bundel yang lebih canggih di pasar, yang pada gilirannya akan membantu meningkatkan kecepatan fixed broadband Indonesia, terutama di wilayah-wilayah padat penduduk yang diulas pada laporan ini.

Ookla retains ownership of this article including all of the intellectual property rights, data, content graphs and analysis. This article may not be quoted, reproduced, distributed or published for any commercial purpose without prior consent. Members of the press and others using the findings in this article for non-commercial purposes are welcome to publicly share and link to report information with attribution to Ookla.