| November 20, 2023

The State of Taiwan’s 5G Network With Telecom Mergers On the Horizon

Taiwan’s mobile market is fiercely competitive, driven by three major operators – Chunghwa Telecom, FarEasTone, and Taiwan Mobile, and two smaller ones, Asia Pacific Telecom (GT) and Taiwan Star (T Star). Earlier this year, two major mergers of telecom operators were approved, which is expected to alter the telecommunication competitive landscape of the country. In this article, we will examine the current state of 5G in Taiwan before the mergers take place and evaluate the potential impact these mergers will have on Taiwan’s telecommunications market.

Key Takeaways

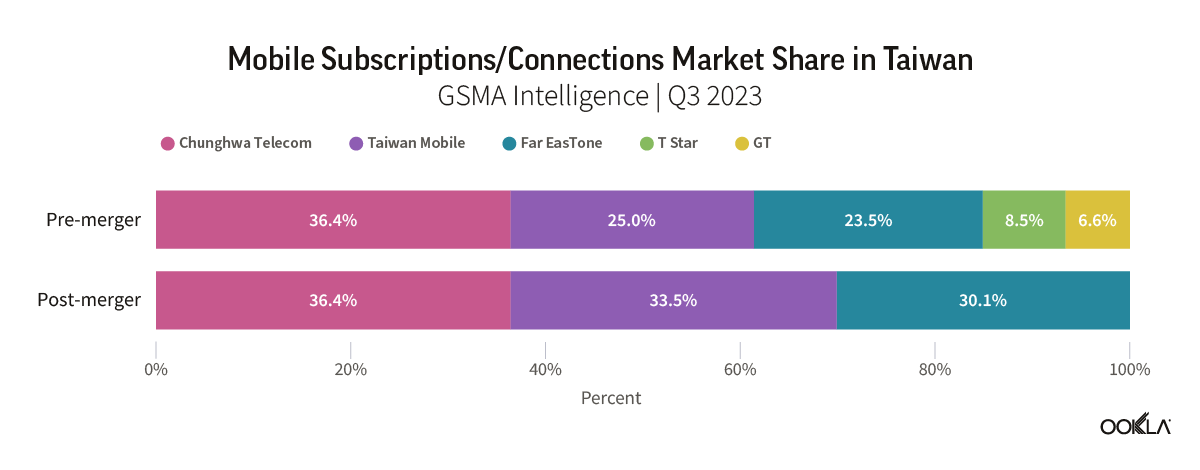
  • Recent mergers are set to alter Taiwan’s mobile market dynamics. The number of operators will be reduced from five to three major players, each with a comparable market share. Far EasTone and Taiwan Mobile will inherit additional spectrum bandwidth as a result of the mergers, enabling both operators to enhance customer experience, introduce new services, and compete more effectively with Chunghwa Telecom, the largest operator.
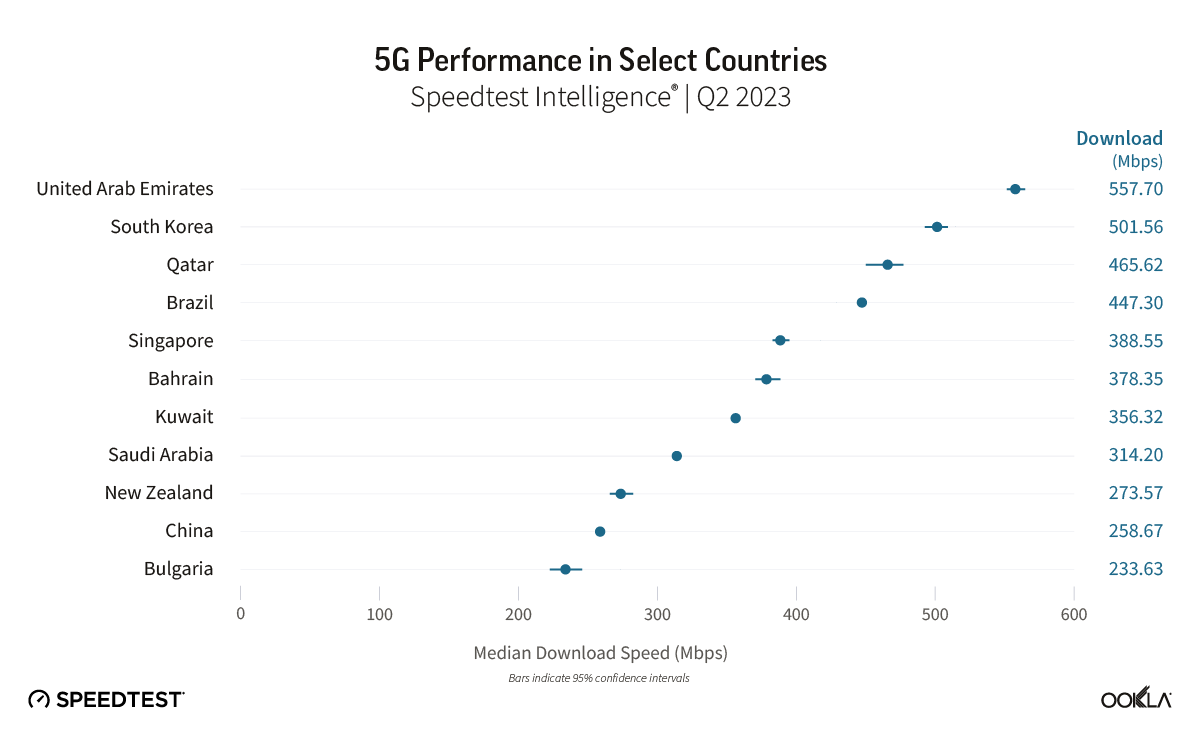
  • Taiwan’s 5G network performs well compared to other countries in the region. In Q3 2023, Taiwan’s 5G network had a median download speed of 263.35 Mbps, outperforming other countries in the region, such as Vietnam, China, Hong Kong, the Philippines, and Japan.
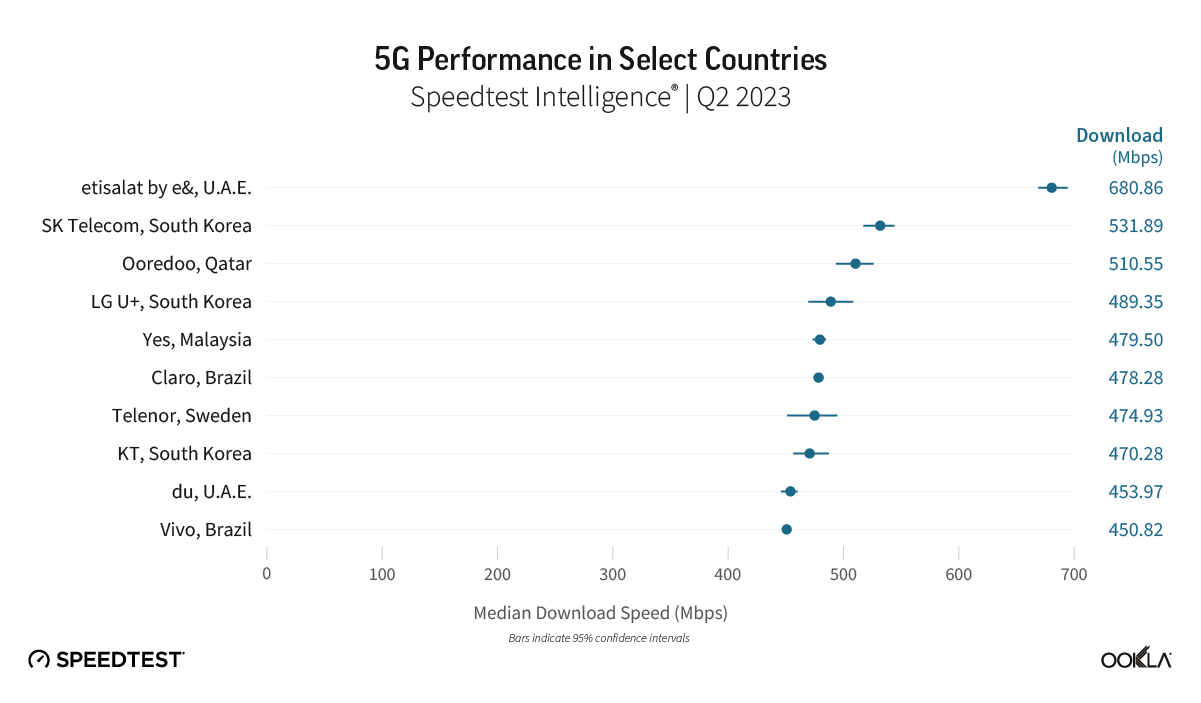
  • Chunghwa Telecom leads the way in terms of 5G download speeds. Based on Speedtest Intelligence® data for Q2-Q3 2023, Chunghwa Telecom had the fastest median download speed with a reported speed of 361.83 Mbps. Far EasTone and Taiwan Mobile came in second and third place, respectively. GT and T Star ranked fourth and fifth, with median download speeds of 190.48 Mbps and 113.85 Mbps.
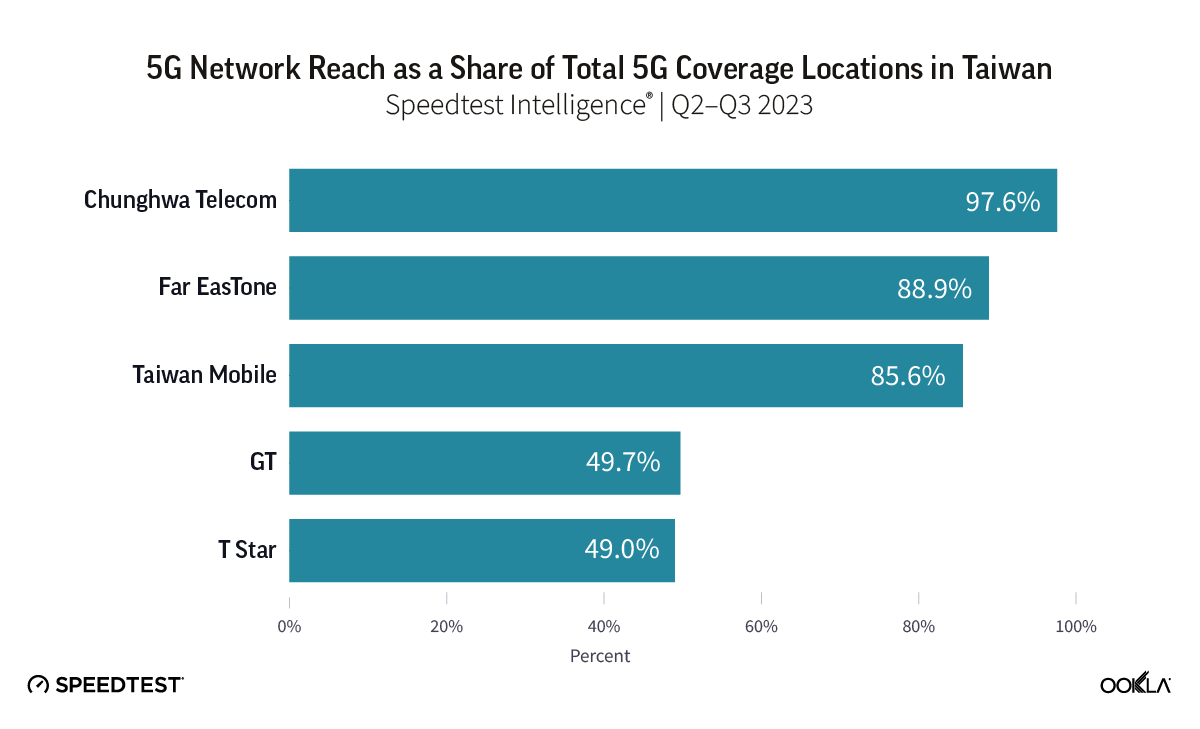
  • Chunghwa Telecom’s 5G network extends to 97.6% of locations in Taiwan with 5G coverage. Chunghwa’s 5G network reached more locations across the island than its competitors, with next-placed Far EasTone following with 88.9%, and Taiwan Mobile with 85.6%.

Change in Taiwan’s Telecom Landscape

The Asia Pacific telecommunications markets have witnessed several notable mergers and acquisitions in recent years. This trend is primarily attributed to heavy investments in 5G technology, as companies strive to stay competitive in the market and sustain their growth in the face of economic challenges. Taiwan’s market is one such example, where the National Communications Commission (NCC) approved two mobile operator mergers earlier this year, which will significantly transform Taiwan’s telecommunications market landscape.

Mergers will increase market competition with three major players

The two mergers involve the consolidation of two major operators with minor operators. The first merger involves the integration of Taiwan Mobile and Taiwan Star Telecom (T Star), while the second merger sees Far EasTone partnering with GT’s parent company Asia Pacific Telecom (APT). As a result of the mergers, the number of operators will be reduced from five to three players with comparable market share. More importantly, this will give the new entities additional scale, allowing them to directly compete with Chunghwa Telecom, the current largest operator.

Chart of Mobile Subscriptions/Connections Market Share in Taiwan

The merged operators could provide more competition to Chunghwa Telecom across all market segments, not only mobile. For instance, the newly merged entities could look at convergent offerings to compete with Chunghwa Telecom, which currently leads the fixed broadband market share and differentiates its services with value-added and bundling packages.

Additional spectrum for 5G use for merged entities

The merging of these operators will bring about significant benefits through synergies. Far EasTone and Taiwan Mobile will inherit the spectrum bandwidth previously held by the two dissolved entities, increasing their competitive edge in the market. The availability of increased resources will enable more efficient use of 5G spectrum, optimize network infrastructure, and reduce energy usage by decommissioning redundant base stations, resulting in a more cost-effective network.

Chart of Awarded 5G Spectrum ?Holding Pre- and Post-merger

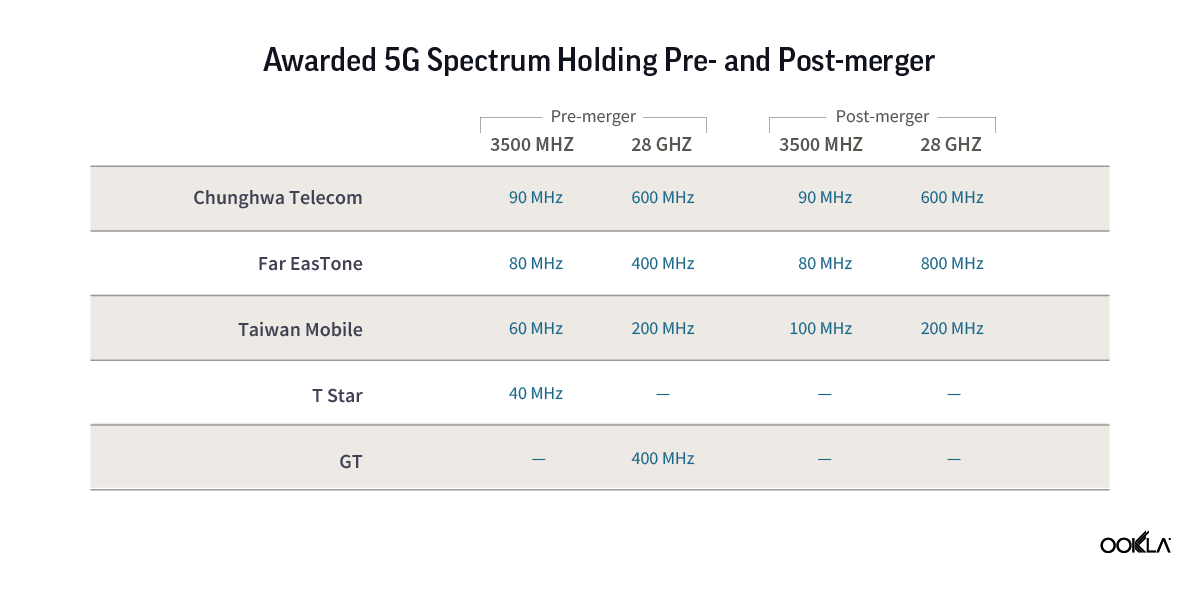
After the consolidation, Far EasTone will see an increase of its 28 GHz spectrum holding from 400 MHz to 800 MHz, in addition to the 80 MHz of the 3.5 GHz band it initially acquired. Taiwan Mobile will now have a block of 100 MHz of the 3.5 GHz band, making it the operator with the most medium frequency bandwidth capacity in the market. When it comes to the high band of 28 GHz, Taiwan Mobile only holds 200 MHz, much less than Far EasTone’s 800 MHz, and Chunghwa Telecom, which holds 600 MHz. The additional spectrum bandwidths will come in very handy to enhance customer experience and introduce new enterprise offerings post-merger.

While the additional spectrum is welcome, in compliance with regulations, operators may only own up to one-third of the available spectrum. After merging with Taiwan Star, Taiwan Mobile will have 60MHz of sub-1GHz spectrum, exceeding one-third of the total available. They will need to divest 10MHz of their frequencies. Similarly, following its merger with GT, FET will be required to surrender any excess spectrum in bands below 3GHz, bands between 3GHz and 6GHz, and bands above 24GHz. How these operators will divest the excess spectrum remains to be seen.

Close scrutiny by the NCC on coverage and service enhancements

As the Taiwanese market undergoes a significant shift, it will naturally require thorough regulatory scrutiny to ensure a smooth transition. Apart from the disposal of excess bandwidth as mentioned earlier, the NCC also imposed additional conditions, including coverage targets, and ensuring uninterrupted subscriber services during the transition period.

 Both Taiwan Mobile and Far EasTone will be required to increase 4G coverage across the island to 99% of the population, while 5G coverage must be at least 98% by 2027. The operators will also need to explore ways to reduce carbon emissions and implement effective energy-saving systems to achieve an annual energy saving of approximately 160 million kWh.

Taiwan’s 5G performs well compared to its regional counterparts

Taiwan rolled out its 5G network in 2020, with Chunghwa Telecom being the first operator to introduce 5G services in July of that year. Since then, Taiwan has experienced significant growth in mobile performance, particularly in 5G performance, compared to other countries across the globe.

Chart of Taiwan's 5G Performance and Its Regional Peers

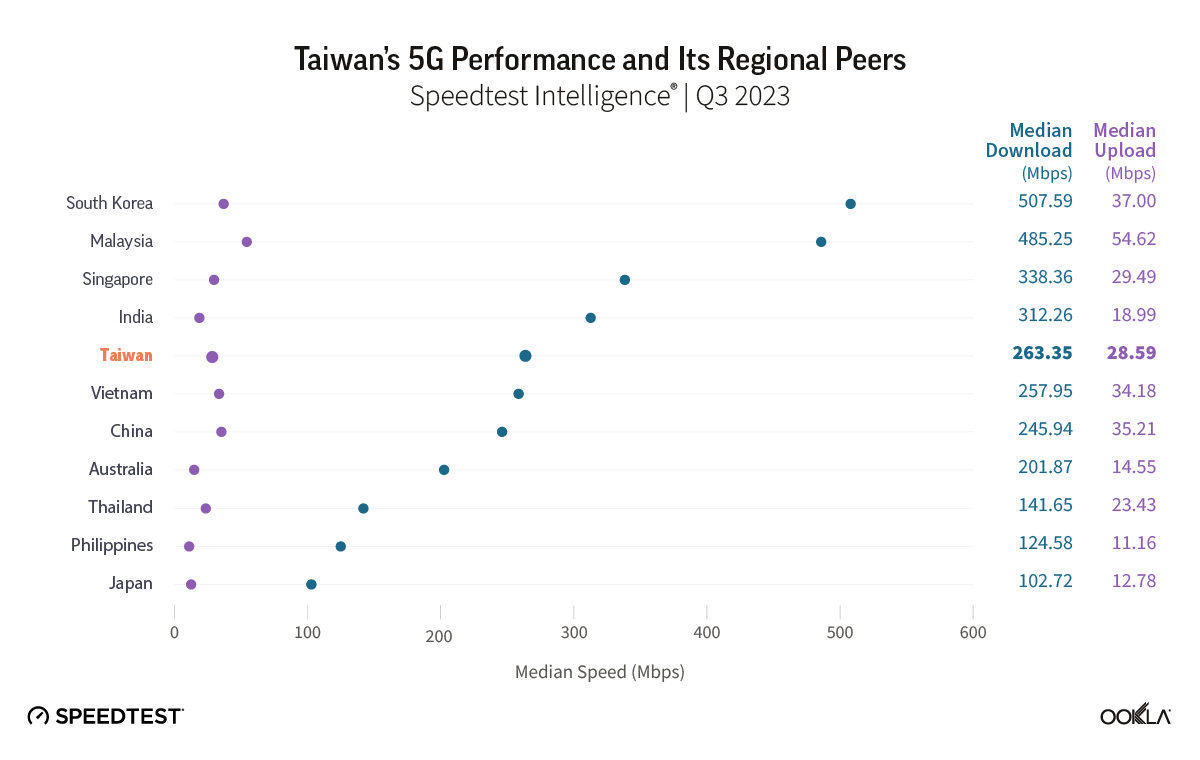
In Q3 2023, Speedtest Intelligence® data revealed that Taiwan’s 5G network had achieved a median download speed of 263.35 Mbps, outperforming its regional counterparts, including Vietnam (257.95 Mbps) and China (245.94 Mbps). Furthermore, Taiwan’s 5G network was notably faster than those of Hong Kong (136.51 Mbps), the Philippines (124.58 Mbps), and Japan (102.72 Mbps).

Chunghwa Telecom tops 5G performance in Taiwan

Chart of 5G Performance Among Operators in Taiwan

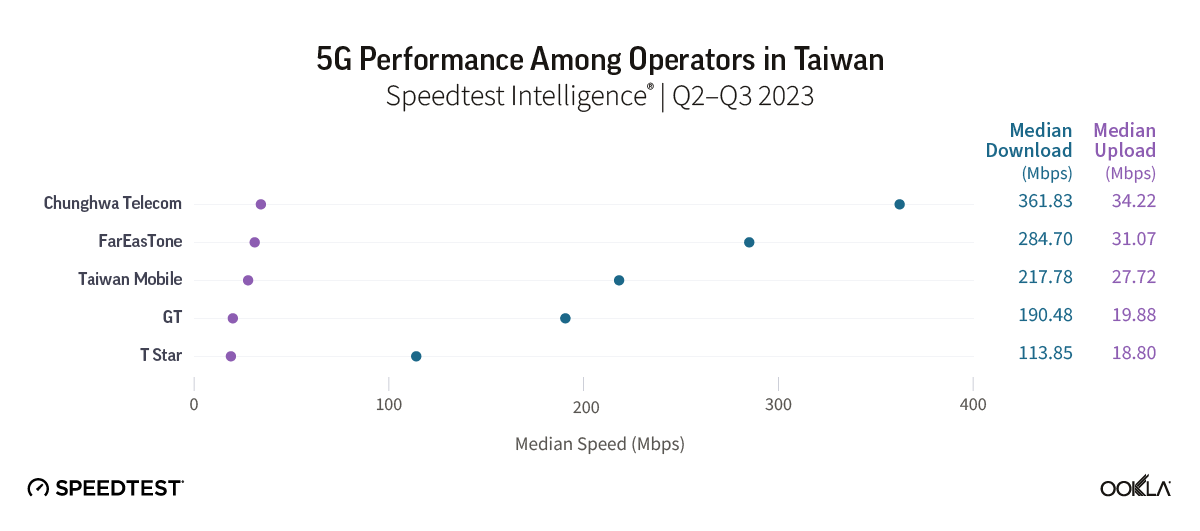
Based on Speedtest Intelligence data, Chunghwa Telecom reported Taiwan’s fastest median 5G download speed during Q2-Q3 of 2023. It recorded a median download speed of 361.83 Mbps and a median upload speed of 34.22 Mbps. Far EasTone and Taiwan Mobile came second and third, respectively. The smaller operators, GT, and T Star, had median download speeds of 190.48 Mbps and 113.85 Mbps, placing them fourth and fifth in the rankings.

5G Coverage in Taiwan

Taiwan’s terrain consists of rugged mountains dominating the length of the island, while the western part where most of the population lives is relatively flat. This contrast poses significant challenges in providing nationwide 5G coverage. In order to assess the reach of operator 5G networks, we examined Speedtest Intelligence data to plot locations with access to 5G across the island, with the results shown in the following maps.

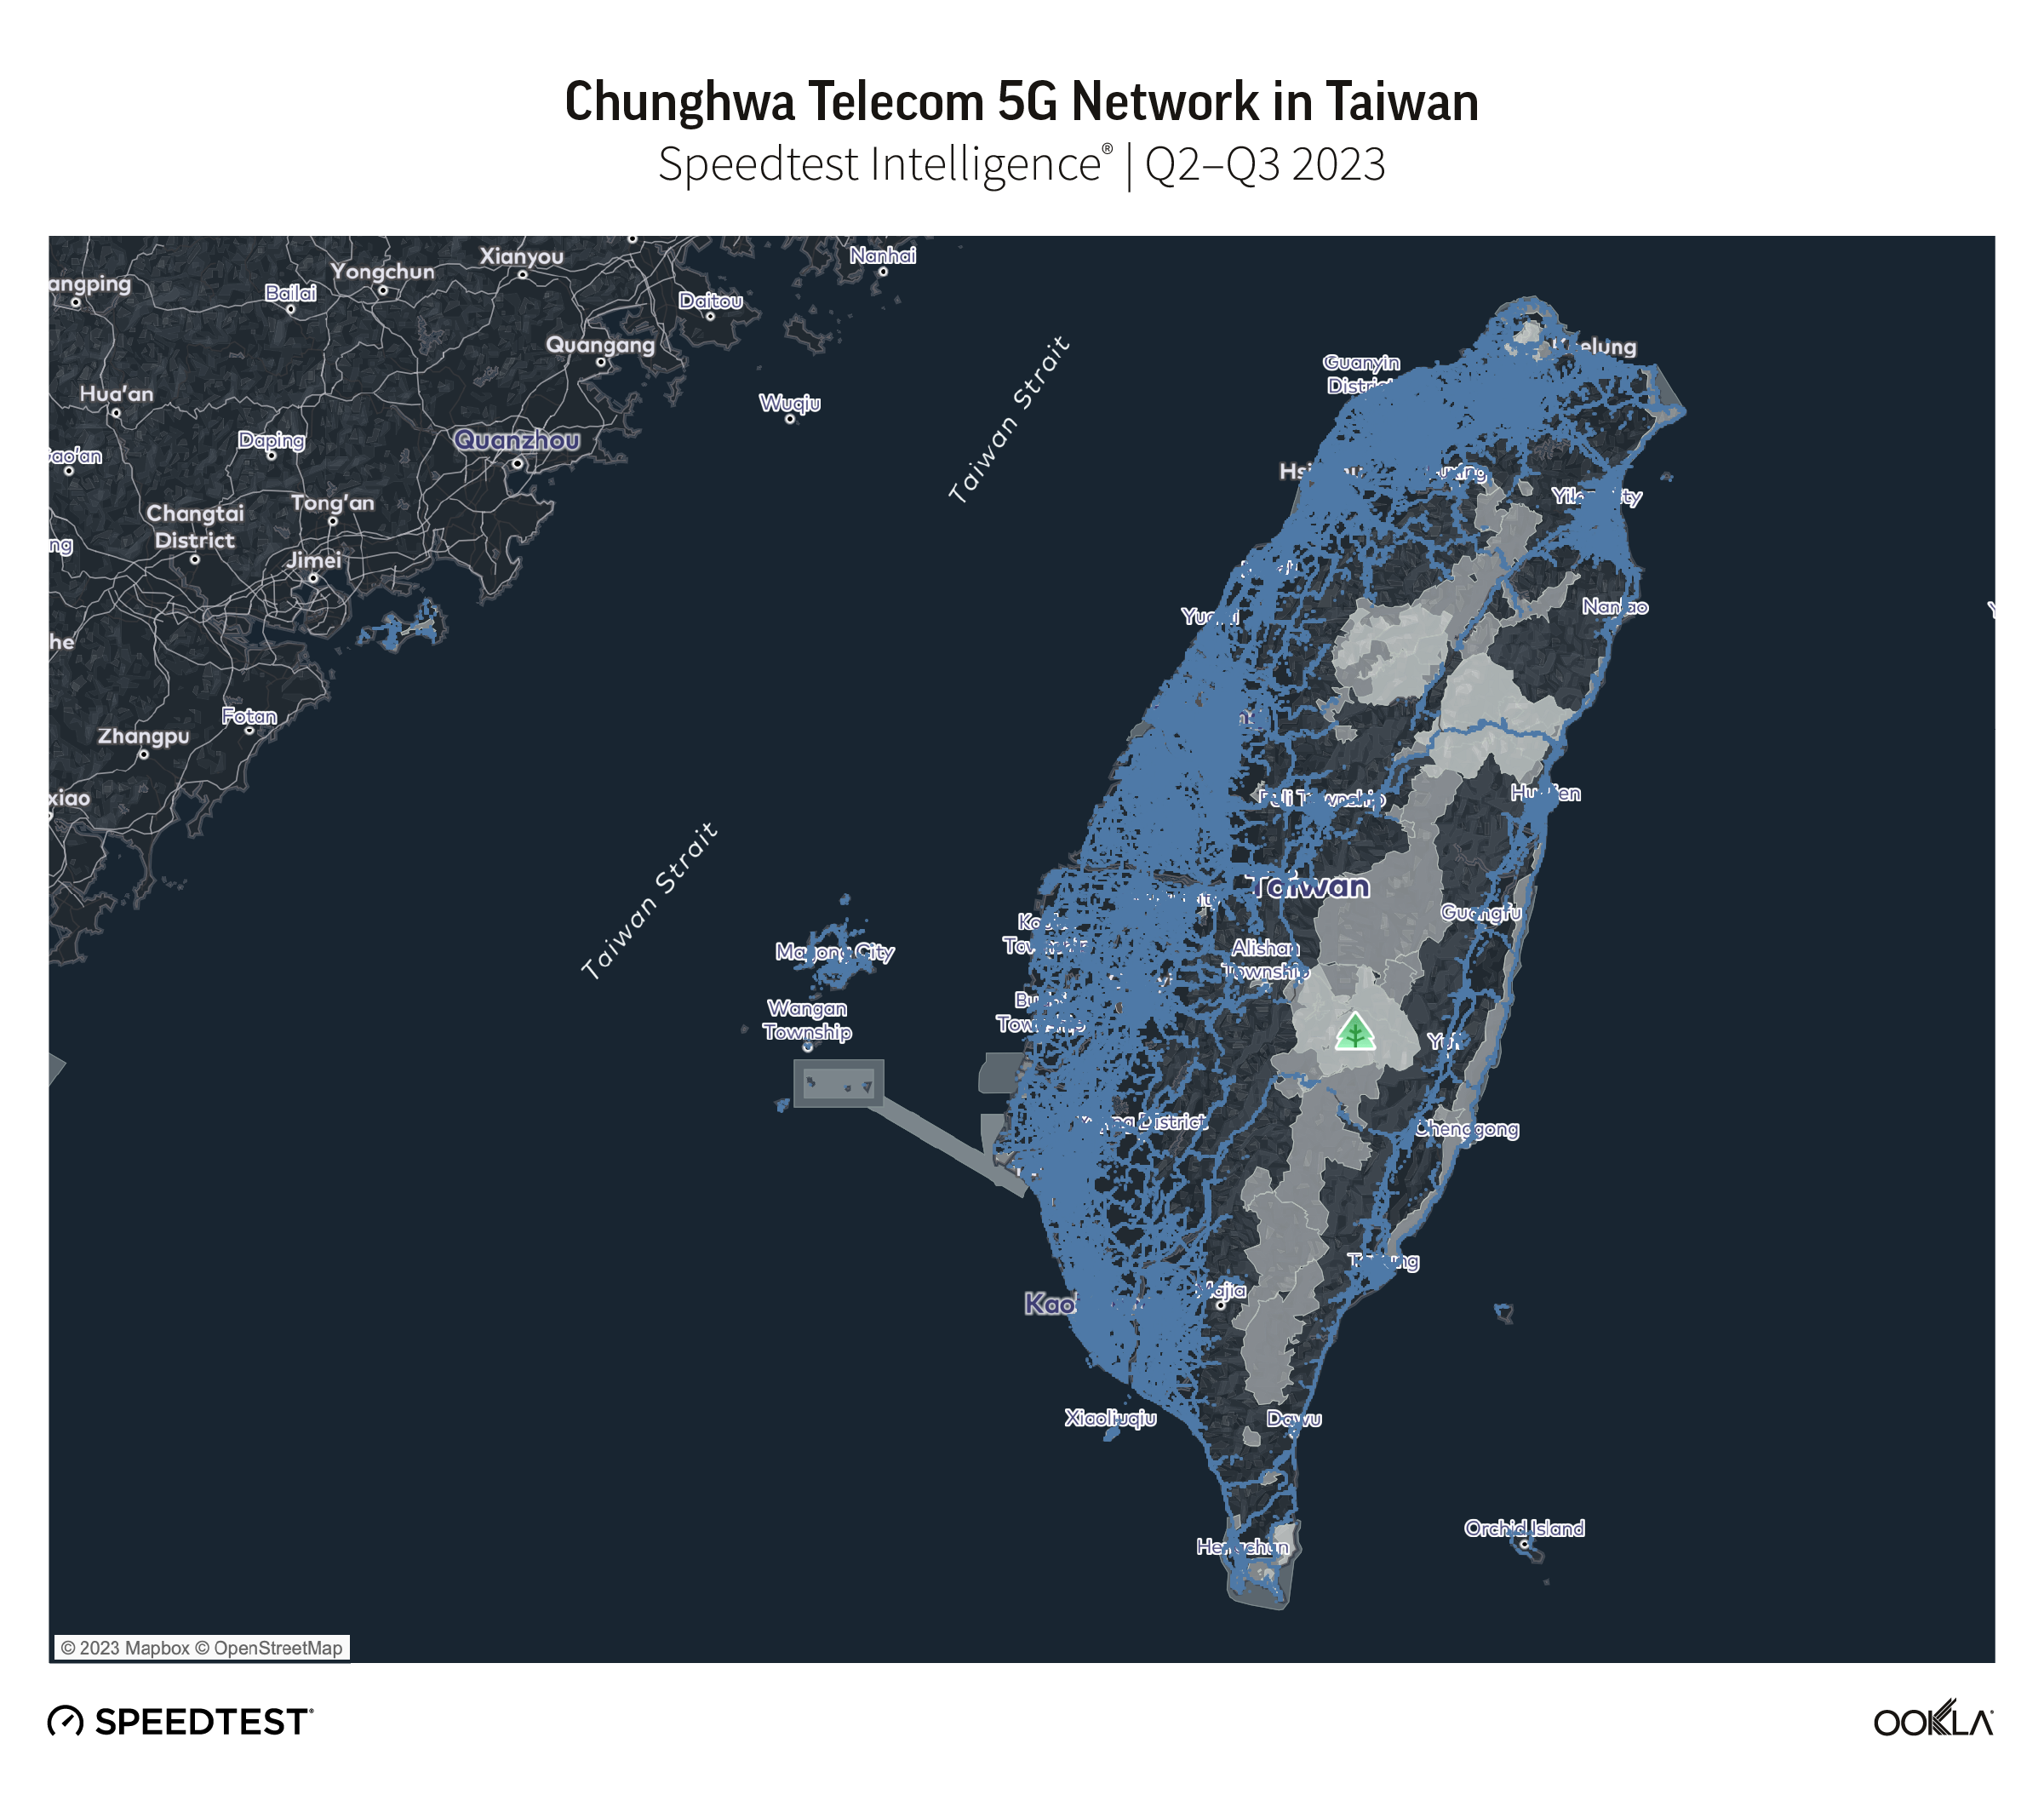
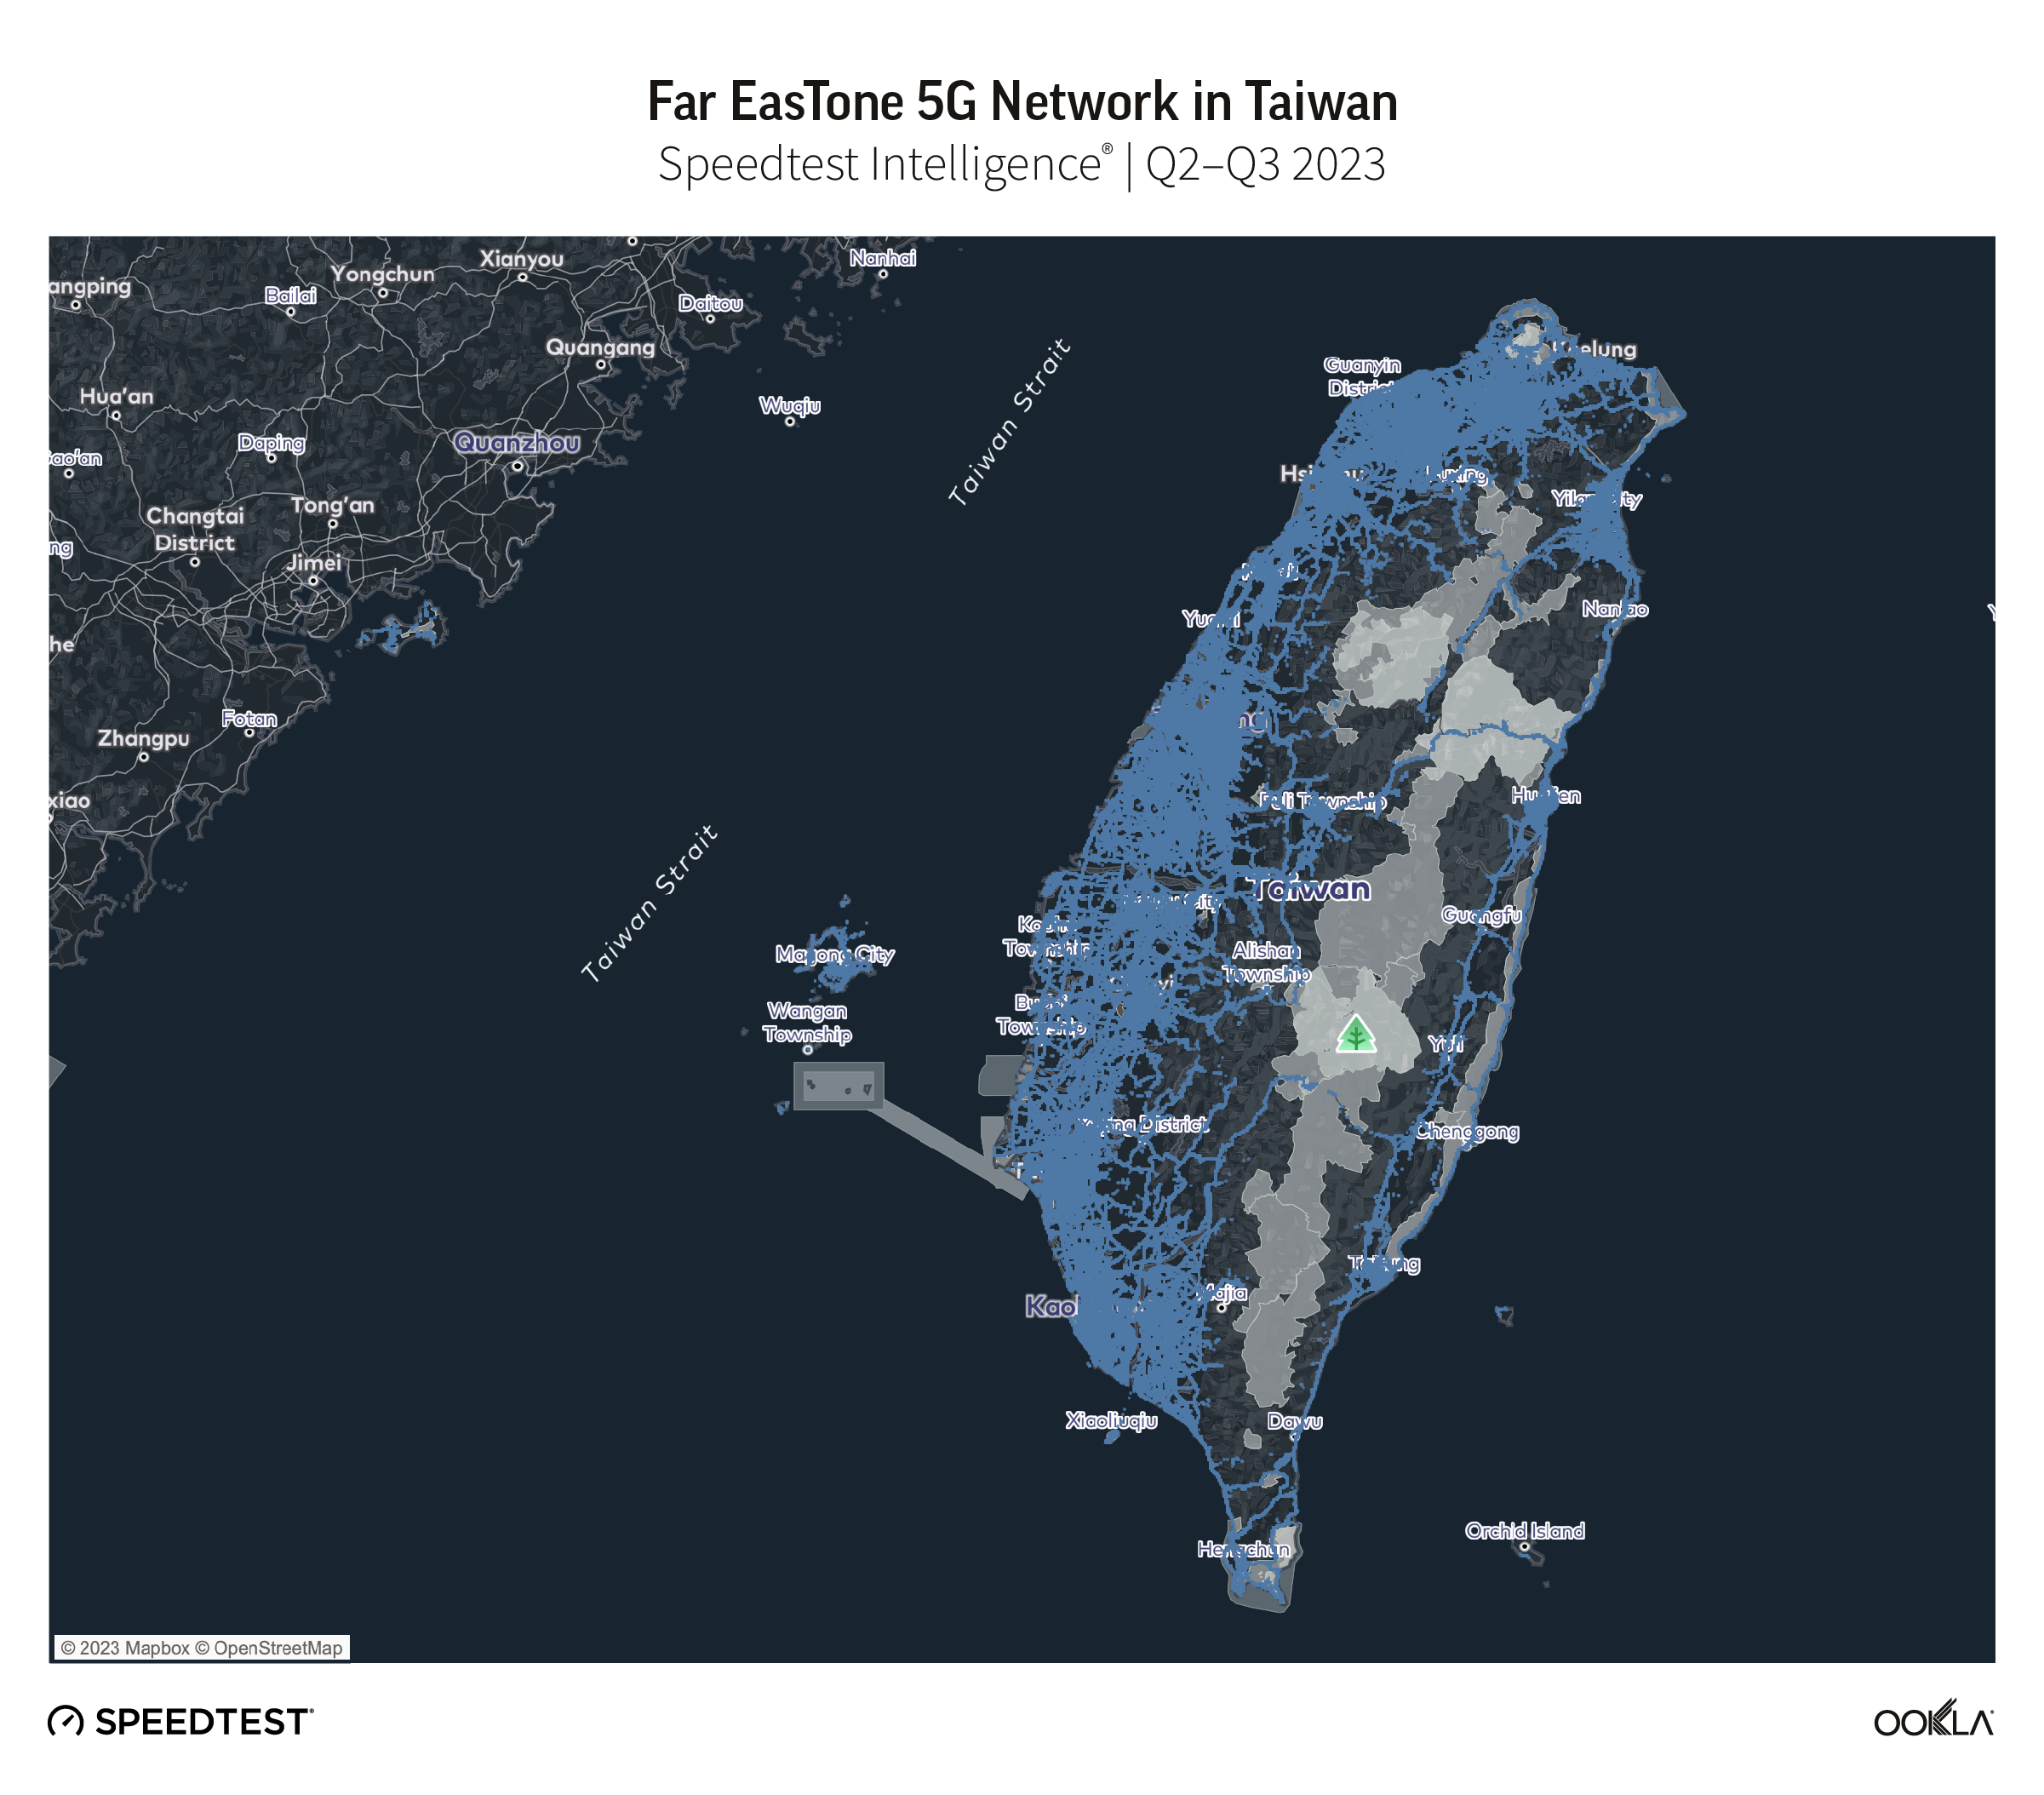
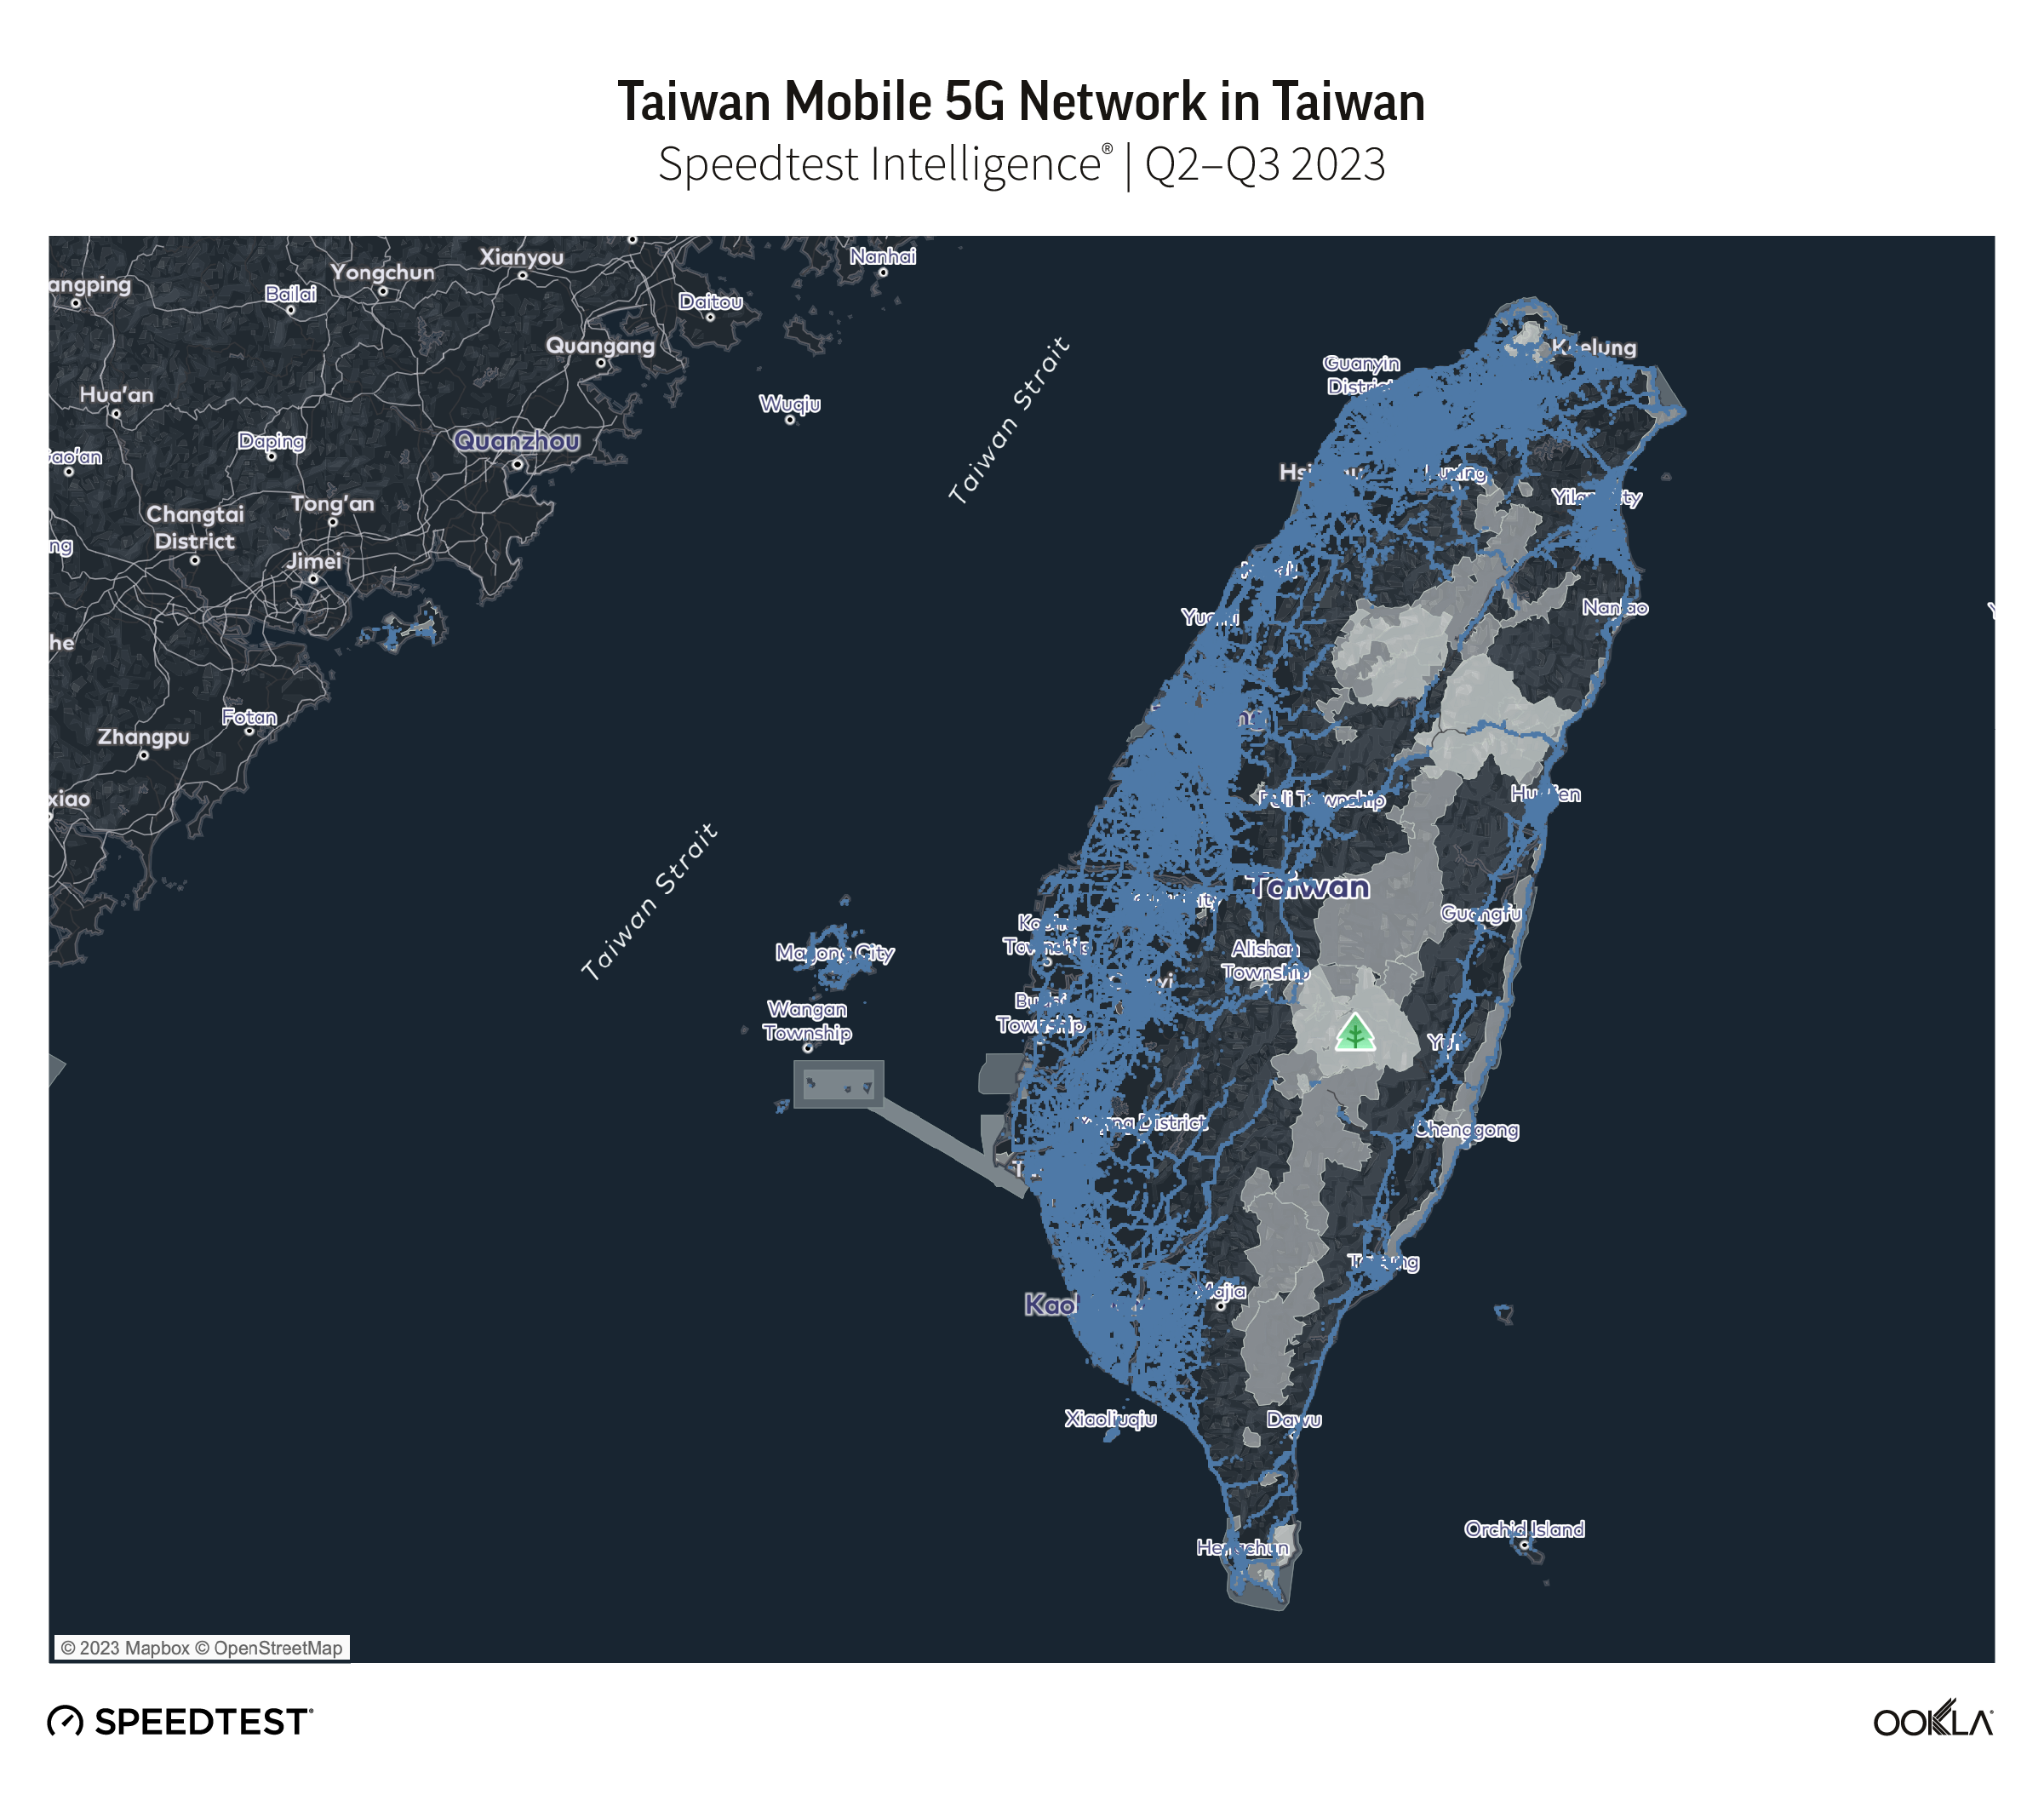
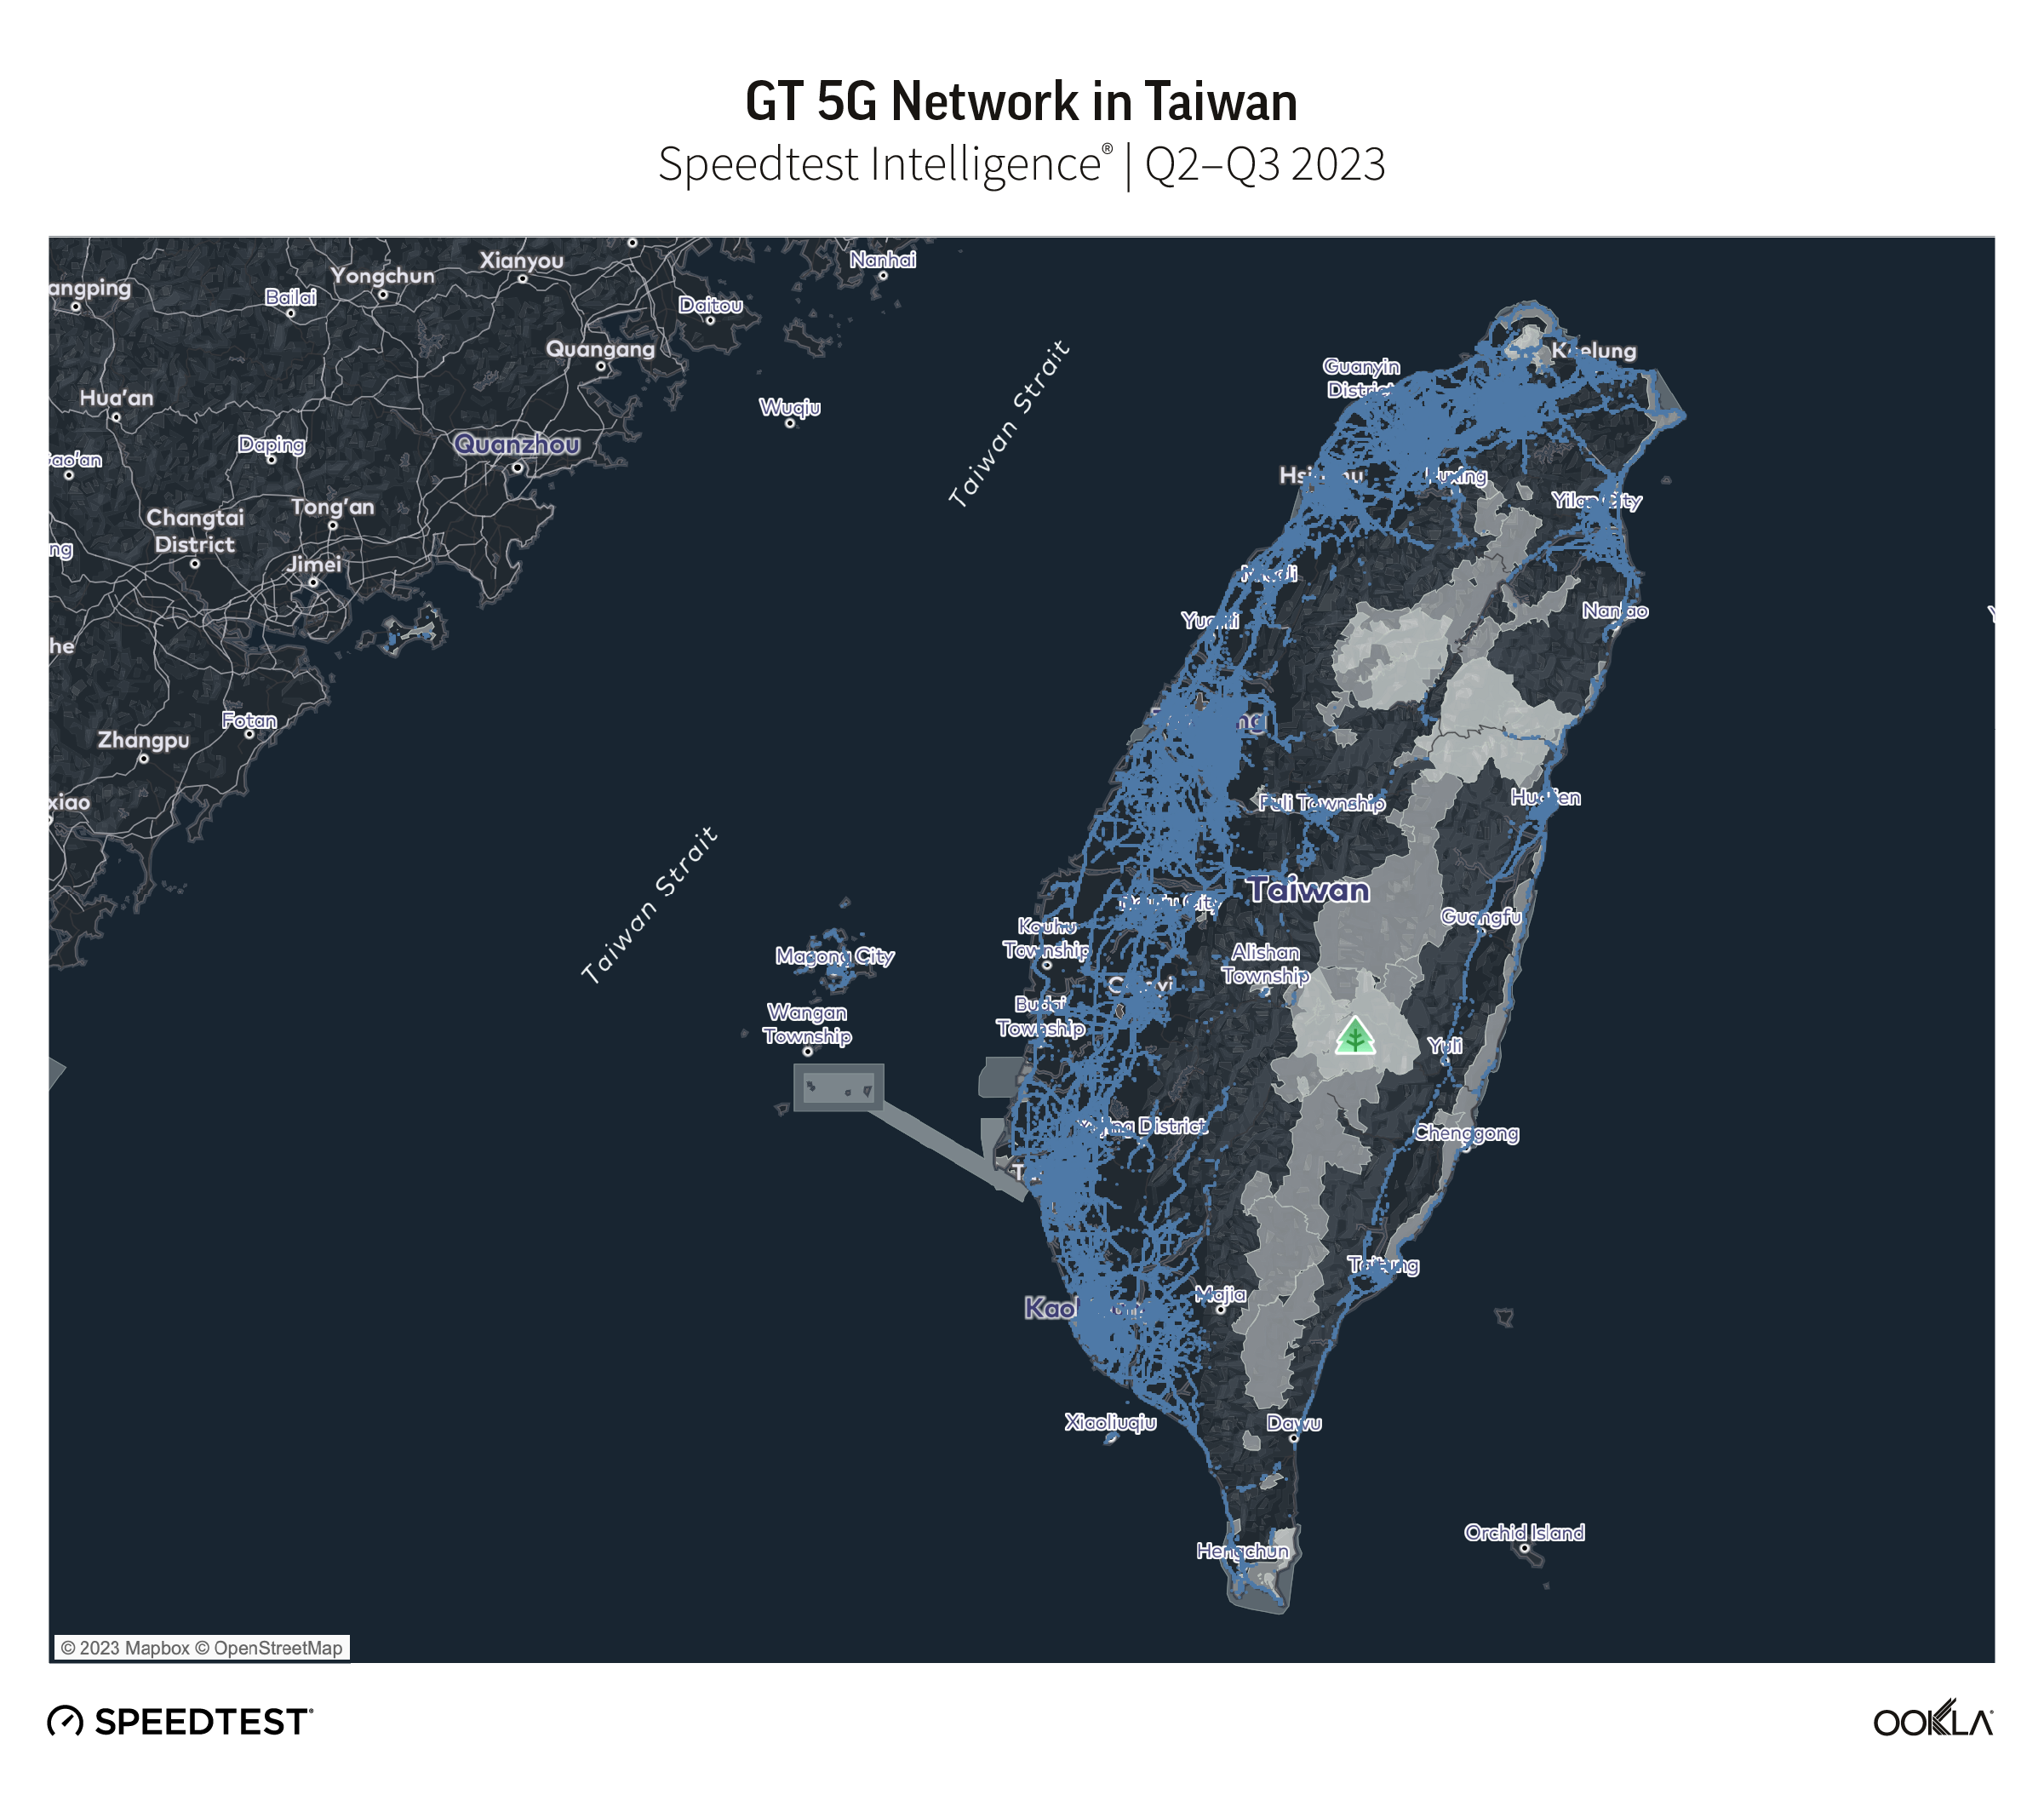
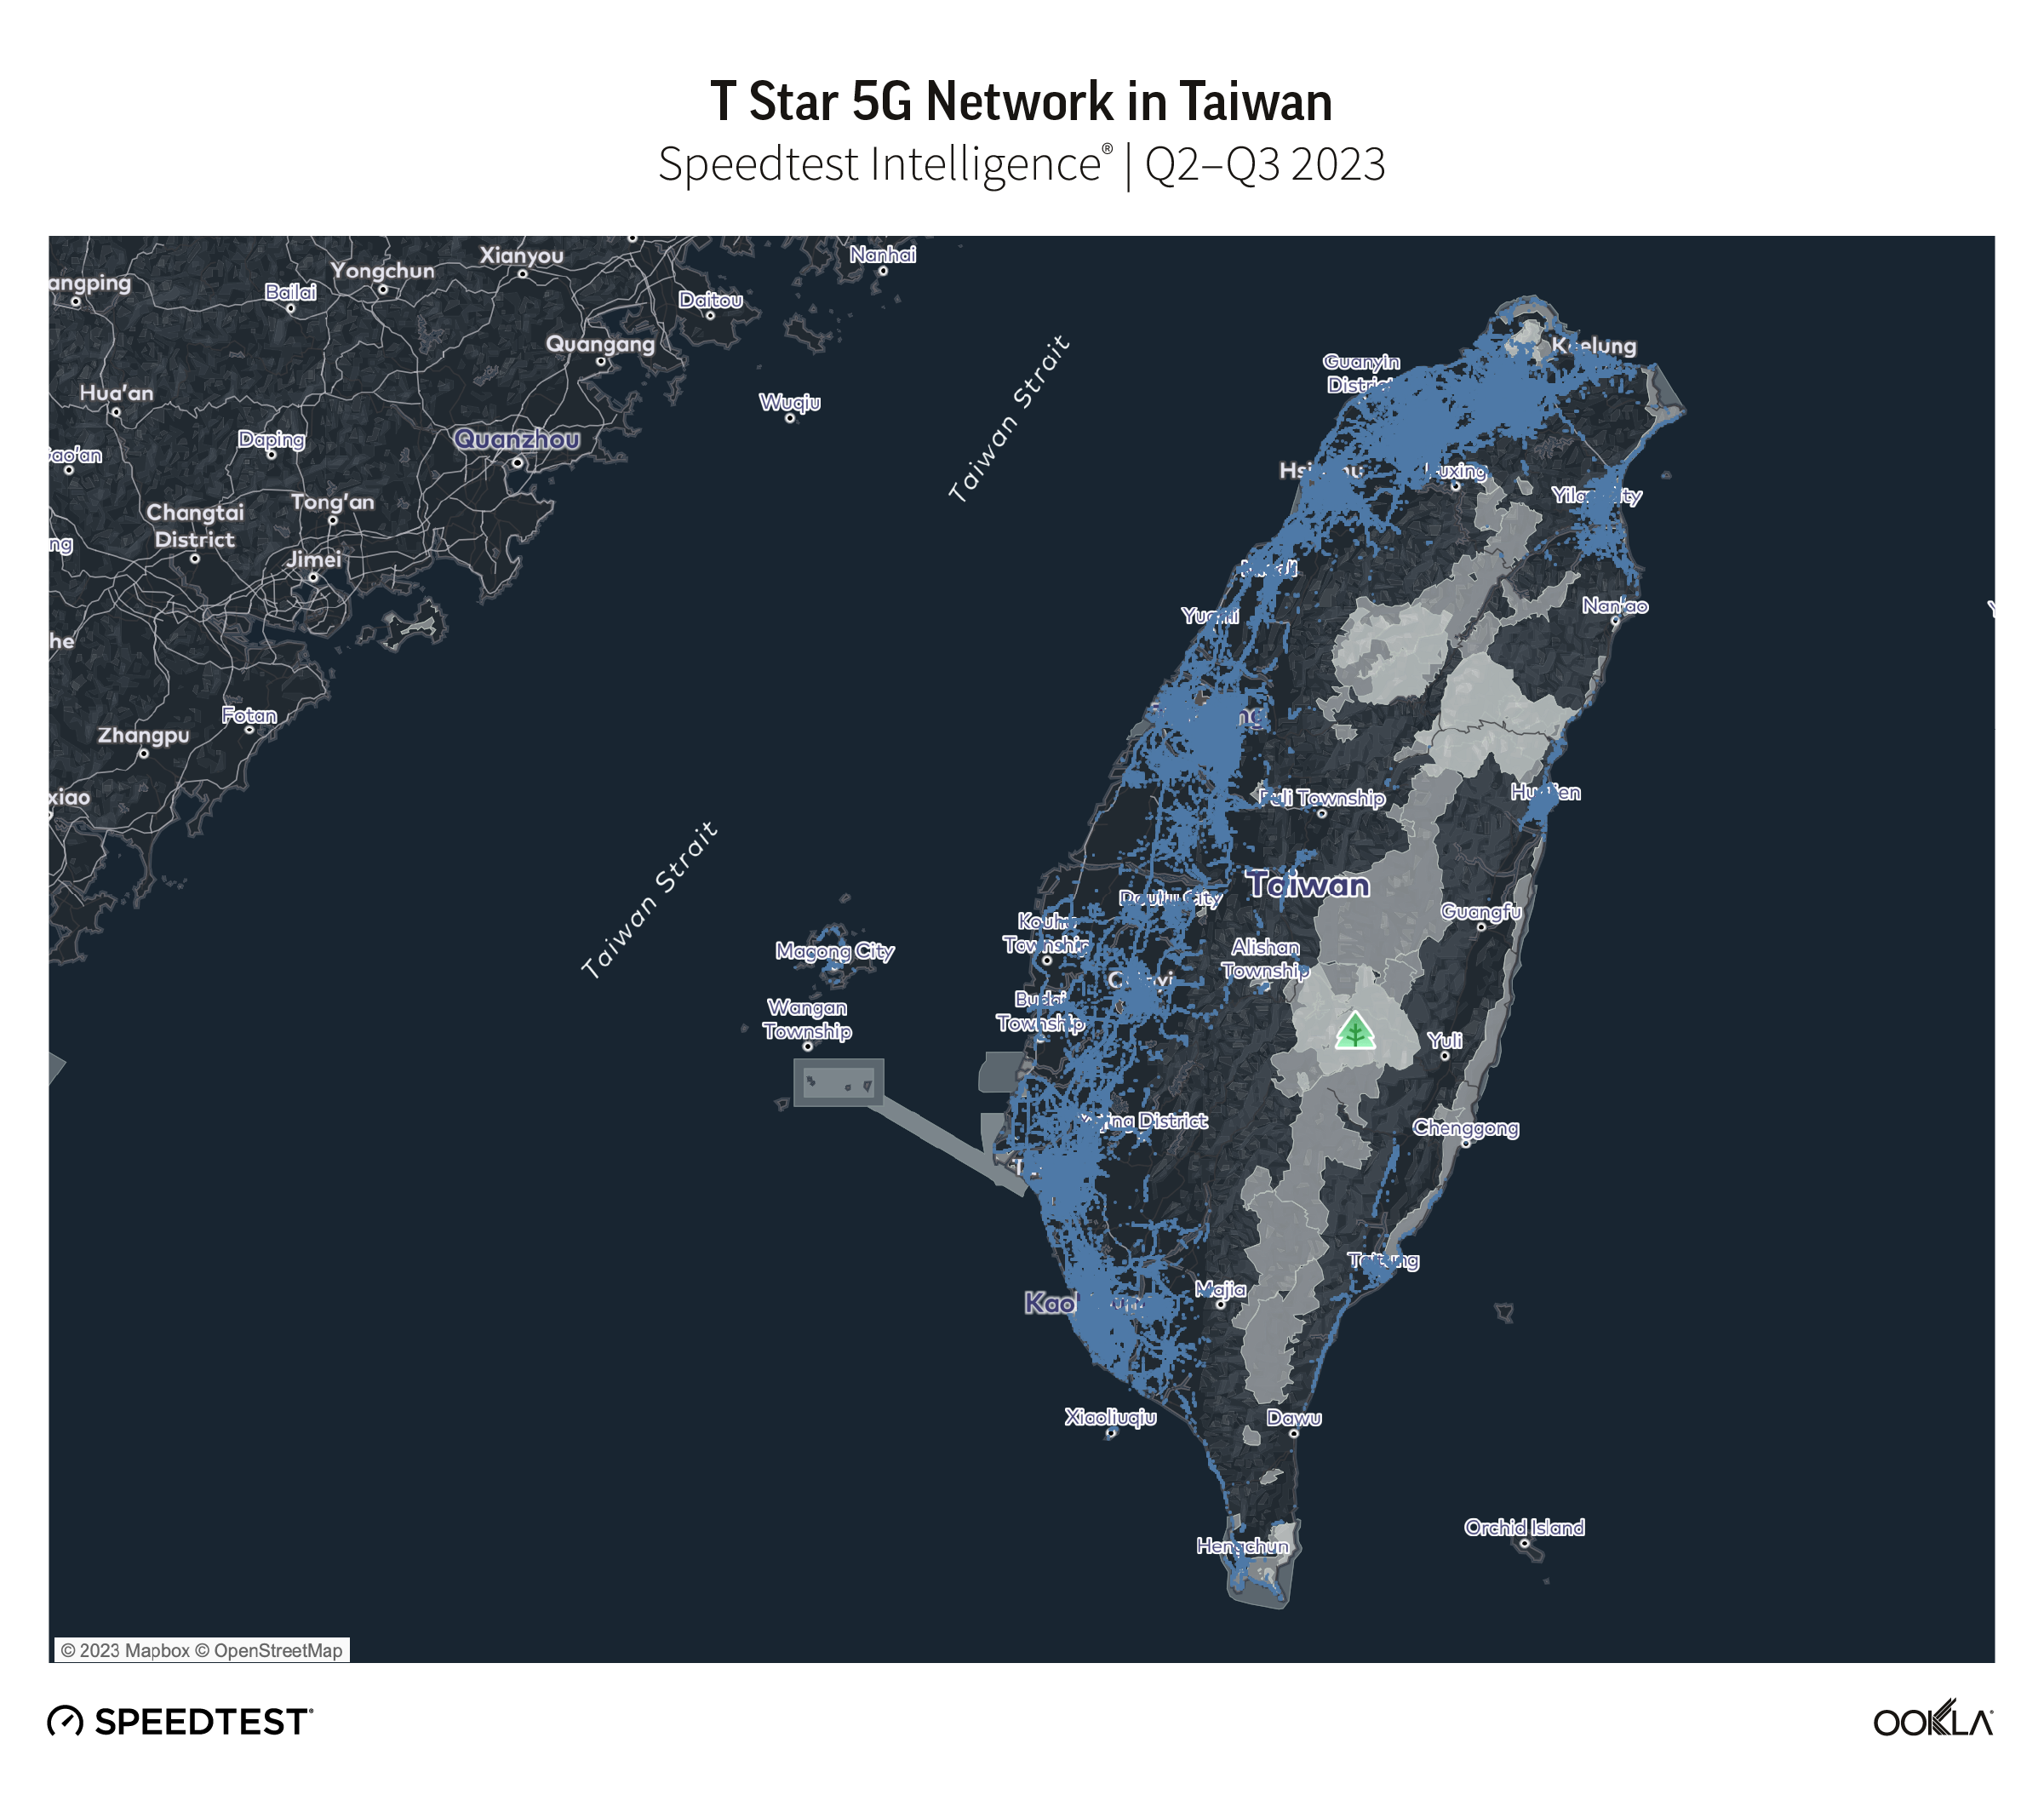
Chunghwa Telecom’s 5G network extended furthest across Taiwan, at 97.6% of locations with 5G coverage during Q2-Q3 2023. Far EasTone followed with 88.9%, and Taiwan Mobile with 85.6%. GT and T Star have an almost equal 5G footprint, reporting 49.7% and 49.0% respectively.

Chart of 5G Network Reach as a Share of Total 5G Coverage Locations in Taiwan

The full impact of the mergers will become apparent over time

It may take a while before we witness the effects of the two mergers. In fact, it may take years before consumers can benefit from the newly combined entities. However, one thing is sure – the market’s competitive landscape will change due to the reduction of major operators from five to three in Taiwan. We will continue to keep a close eye on the progress of these mergers and how they affect mobile performance in Taiwan. If you are interested in benchmarking your performance or want to learn more about internet speeds and performance in other markets around the world, visit the Speedtest Global Index™.

Ookla retains ownership of this article including all of the intellectual property rights, data, content graphs and analysis. This article may not be quoted, reproduced, distributed or published for any commercial purpose without prior consent. Members of the press and others using the findings in this article for non-commercial purposes are welcome to publicly share and link to report information with attribution to Ookla.

| December 11, 2023

U.S. Starlink Data Points to Larger Addressable Base for LEO Broadband ISPs

The telecoms industry continues to watch SpaceX Starlink’s expansion and performance closely, as the number of subscribers to its broadband service grows and other satellite providers enter the fray. While median download performance remains a key benchmark, we see strong demand to understand how Starlink is balancing net new additions with its network capacity as the service scales, and how LEO NTN (Non-Terrestrial Network) performance stacks up against the competition, particularly in rural locations.

Key takeaways

  • Starlink isn’t shooting for the stars, but is successfully managing to balance capacity and demand. Starlink median download performance in the U.S. was 64.54 Mbps in Q3 2023, a marginal decline quarter on quarter, though Starlink did show strong increases in September, October and November.
  • Starlink’s U.S. LEO broadband performance eclipses that of GEO satellite internet providers. Starlink offers a significant boost on GEO satellite broadband speeds, but its multi-server latency is where Starlink really shines, eclipsing the performance of GEO satellite services in the U.S.
  • Starlink’s performance in rural U.S. locations orbits at a similar level to the competition. While it can’t match leading cable or fiber providers on median speeds or multi-server latency, Starlink offers a very viable alternative in locations where cable and fiber access networks aren’t present. A big part of this is due to a more uniform distribution of download performance across Speedtest samples, compared to FWA and DSL-based services where distance from the cell site or exchange/DSLAM impacts performance.
  • The constellation of Speedtest Starlink samples highlights significant urban LEO broadband demand. While still skewing towards rural locations if we adjust for population, 16.1% of Speedtest Starlink samples were recorded in urban locations in the U.S. The ability to sign up to Starlink’s “Roam” services which allow users to take Starlink with them (with options for use across the U.S. and internationally) may inflate the number of urban samples, but given their scale, it’s clear that LEO satellite internet is seen as a viable option in many urban U.S. locations.

Starlink continues to balance capacity and demand

SpaceX’s Starlink satellite/NTN service continues to expand at pace, with over 5,000 LEO satellites in orbit, with plans to increase this to 42,000 over the long term, and customer numbers approximately doubling in the first nine months of 2023, exceeding 2 million. Last quarter we covered Starlink’s performance across Europe and Oceania, where in a majority of cases it recorded download performance gains quarter-on-quarter, indicating the capacity it continues to add through new satellite launches is offsetting the demand for bandwidth from net customer additions.

In the U.S. the picture is more mixed. Ookla Speedtest Intelligence data shows Starlink recorded a median download speed of 64.54 Mbps in Q3 2023, a marginal decline quarter-on-quarter, but still an increase over the 53.00 Mbps it recorded in Q3 2022. Median upload performance continues to track upwards, hitting 9.72 Mbps, while median multi-server latency reached a low of 60 ms. Looking at monthly data shows Starlink has increased performance from August this year onwards, following declines in June and July, and recorded a high of 79.04 Mbps in November.

The FCC recently announced that it is seeking input on a planned increase to its definition of broadband/high speed internet, to 100 Mbps download and 20 Mbps upload, up from the current 25 Mbps download and 3 Mbps upload. At present, this would place Starlink and the technology provided by a number of other broadband providers at risk of missing the grade.

Starlink U.S. Performance
Speedtest Intelligence® | November 2022 – November 2023

LEO satellite broadband eclipses GEO but compares less favorably to terrestrial options

It’s important to consider how far satellite internet has progressed with the arrival of Starlink, and with other LEO satellite providers entering the fray, competition is set to increase. GEO satellite service providers HughesNet and Viasat lag behind most of the market, recording median download speeds in the U.S. of 15.87 Mbps and 34.72 Mbps, respectively, in Q3 2023. Viasat’s download performance placed it alongside AT&T Internet (which comprises a mix of DSL- and FWA-based access technologies, but excludes its fiber service). GEO satellite internet service really suffers on network latency, with median multi-server latency well above 500 ms for both providers. It must be noted that GEO satellite internet service is often priced at a discount to LEO satellite internet, and its performance characteristics lend it to different use cases where low latency isn’t a requirement, in remote locations, or as a back-up service option.

Network Performance for Major Terrestrial and NTN players in the U.S.
Speedtest Intelligence® | Q3 2023

Starlink’s LEO satellite service median download performance improves upon the GEO providers, placing it alongside CenturyLink (which offers DSL and fiber-based broadband), and just behind T-Mobile’s broadband service, which is based on a mix of 4G and 5G Fixed-Wireless Access (FWA). However, despite this improvement, LEO satellite service lags well behind leading terrestrial broadband networks from U.S. cable operators such as Cox, Spectrum (Charter) and Xfinity (Comcast). LEO service does, however, offer a step-change in latency performance over GEO, recording 60 ms in Q3 2023, placing it ahead of T-Mobile (63 ms).

LEO is narrowing the performance gap in rural locations

In rural locations in the U.S., Starlink competes more favorably with its peers, both in terms of median download speeds and when we look at the range of speeds for users experiencing below median performance – indicating more stable performance across its user base. 

Starlink’s primary use case is in providing connectivity to more rural locations where it’s either not economically viable for terrestrial networks to be deployed or to be upgraded with the latest technology. Starlink’s performance in rural U.S. locations stacks up even more strongly against the competition, with median download performance of 65.77 Mbps, up on its national median value, placing it almost level with T-Mobile, and ahead of Verizon. When we look at the 25th percentile of its download speed range (speeds that 75% of Starlink Speedtest samples exceed), we see it overtake both T-Mobile and Frontier, indicating its performance is more stable across the lower range of speeds its users experience. It is worth noting that fiber and cable services are not available nationwide, and therefore in many rural locations the choice may often be between a DSL or FWA based internet service, or satellite.

Rural U.S. Network Performance – Major Terrestrial vs NTN players
Speedtest Intelligence® | Q3 2023

Starlink’s appeal is broader, with strong urban-based usage

While perceived primarily as a rural internet service, Ookla Speedtest data shows a considerable proportion of Starlink samples located within urban U.S. locations. Our data for GEO satellite internet providers shows that 0% of HughesNet samples came from urban locations, while Viasat recorded 36.7%. Starlink recorded 16.1% of samples in urban locations.

Rural U.S. Share of Speedtest Samples by ISP
Speedtest Intelligence® | Q3 2023

When you consider that 80% of the US population is based in urban locations (as per the 2020 Census), it’s clear that satellite broadband service still skews towards rural locations, but it also has broad applicability in urban locations. Starlink has added options to its service to allow users to roam (both within a market and internationally), and this portability of its service may explain some of the urban-based Speedtest samples – from rural-based users moving into urban locations, and urban-based users who value the ability to take Starlink with them, and in some cases use it as a redundancy option to their existing broadband subscription. 

The scale of the number of samples, however, indicates LEO satellite internet is a viable option for many urban-based U.S. broadband subscribers. If Starlink can continue to balance capacity and demand to drive overall performance gains, while continuing to address the affordability of its service, then this wider addressable market should enable Starlink to sustain the strong subscriber growth it has witnessed to date. We’ll return in Q1 2024 to continue our quarterly NTN analysis. Please contact us if you’d like to know more about Speedtest Intelligence data and insights.

Ookla retains ownership of this article including all of the intellectual property rights, data, content graphs and analysis. This article may not be quoted, reproduced, distributed or published for any commercial purpose without prior consent. Members of the press and others using the findings in this article for non-commercial purposes are welcome to publicly share and link to report information with attribution to Ookla.

| May 13, 2025

Connecting Africa: The Performance and Impact of Starlink's Satellite Internet

Satellite technology is transforming broadband access and reshaping the telecom market in Sub-Saharan Africa (SSA), thanks to new players such as Starlink. With its wide coverage and increasing affordability, it presents a chance to close the connectivity gap in rural areas while also appealing to urban users. This article examines the performance of Starlink services in SSA, compares them to terrestrial services, and assesses their impact on the broadband market.

Key Takeaways:

  • Starlink outperforms terrestrial ISPs in Sub-Saharan Africa in terms of download speed, though it falls short on latency. While speed varies across the continent, Starlink delivered a median download speed exceeding 40 Mbps in Q1 2025 in most countries where it’s available, significantly outpacing terrestrial ISPs. However, latency remains high, though the deployment of local Points of Presence (PoP) has considerably reduced the delay in some East African countries, like Kenya, to below 60 ms.
  • Botswana, Eswatini, Rwanda, Burundi, Sierra Leone, Mozambique, and Ghana lead the continent in median download speeds: Starlink users in these countries experienced a download speed of around and above 75 Mbps in Q1 2025. In contrast, speeds in Nigeria, Zimbabwe, South Sudan, Kenya, and Madagascar –arguably some of Starlink’s biggest markets– were below 50 Mbps, most likely because the provider faces capacity issues and halts new sign-ups. Nevertheless, these speeds are still much more than double those of terrestrial networks in Q1 2025 in most countries.
  • Starlink’s entry into the African market has significantly increased access to fixed broadband, particularly in Nigeria and Kenya, where it has become competitive. However, regulatory hurdles and varying costs across countries highlight the complexities of expanding satellite internet services in the region. Partnerships with local telecom operators are crucial for Starlink to enter new markets and provide more affordable internet services to underserved areas.

Starlink’s network performance is generally excellent across Africa, though it varies significantly by country

Starlink operates thousands of low-earth orbit (LEO) satellites to provide high-speed internet globally. With 4.6 million customers globally, the service targets expansion in underserved markets, such as Africa, to drive its growth. Since its launch in 2019, the network has expanded to more than 7,000 satellites, covering most of the globe. Starlink’s rapid expansion across Africa began with Nigeria in February 2023 and Rwanda in March 2023. The service now reaches 18 countries, with plans to add at least 10 more by the end of the year. 

Starlink offers a speed advantage over fixed alternatives in many African countries, potentially offering great experiences in downloading files and live streaming. However, its performance varies significantly. Using Speedtest Intelligence data, we identified three countries’ tiers based on median download speeds. Note that this analysis does not include Benin, Cape Verde, and Liberia. We will revisit these markets as Starlink’s service expands and more data becomes available.

  • 85+ Mbps. This includes Rwanda, Eswatini (Swaziland), and Botswana, which achieved speeds of 85.53 Mbps, 86.18 Mbps, and 106.36 Mbps, respectively. 
  • 70-80 Mbps. A solid group of six countries falls into this category, ranging from Zambia (69.73 Mbps) to Burundi (79.47 Mbps).
  • Under 50 Mbps. Madagascar, Kenya, South Sudan, Zimbabwe, and Nigeria lag behind, with speeds between 44 Mbps and 50 Mbps. 

Kenya stands out prominently with the highest upload speed, nearing 15 Mbps. Ghana and Rwanda are not far behind, both exceeding 13 Mbps. A strong upper tier – including Burundi, Nigeria, South Sudan, Eswatini, Mozambique, and Botswana – also demonstrates healthy performance, with speeds above 10 Mbps. On the other hand, Zambia, Zimbabwe, and Madagascar lag, with upload speeds remaining below 9 Mbps.

Starlink’s Network Performance, Select African Countries
Speedtest Intelligence® | Q1 2025
Starlink’s Network Performance, Select African Countries

One of the significant advantages of LEO satellite systems like Starlink over GEO and MEO is their proximity to Earth, which reduces signal travel distance and results in lower latency. However, there still is a need for local Points of Presence (PoP) that act as ground-based internet gateways to relay user data from satellites to major internet exchange points (IXPs). That is why they are near high-speed fiber networks to minimize data travel time. Starlink has established two Points of Presence (PoP) in Africa—Nigeria and Kenya— to help lower latency, and the impact is visible. During Q1 2025, Kenya, Nigeria, and Rwanda led the continent in median multi-server latency at 53 ms, 60 ms, and 67 ms, respectively. Latency in the remaining countries varied considerably, with most experiencing delays between 100 and 185 ms. A few countries, such as Madagascar and Sierra Leone, had very high lags, making them unsuitable for latency-sensitive gaming and video conferencing applications.

Starlink’s Multi-Server Latency, Select African Countries
Speedtest Intelligence® | Q1 2025
Starlink’s Multi-Server Latency, Select African Countries

Deployment of a new PoP significantly enhanced user experience in East Africa

East African countries saw a significant leap in both Starlink’s upload speeds and latency, likely linked to deploying a new PoP in Nairobi in January 2025. For instance, Kenya more than doubled its upload speeds between Q4 2024 and Q1 2025, reaching 14.85 Mbps. Rwanda, Malawi, and Zambia also saw substantial gains, with upload speeds increasing by over 60%. Other East African countries experienced more moderate increases in median upload speed, ranging from 25% in Madagascar to nearly 59% in Mozambique.

The same countries have experienced significant latency reductions. Kenya and Rwanda saw drops of 81% and 70% in multi-server latency in Q1 2025 compared to Q4 2024 to reach 53 ms and 67 ms. Most other countries in East Africa saw a reduction ranging from 42% in Botswana to 62% in South Sudan. This highlights the crucial role local PoPs play in optimizing Starlink’s performance. This enhancement not only makes the satellite service more competitive with terrestrial ISPs but also unlocks a better user experience, particularly for latency-sensitive applications like gaming and video conferencing.

Starlink’s Performance Improvement, Select East African Countries
Speedtest Intelligence® | Q4 2024 – Q1 2025
Starlink’s Performance Improvement, Select East African Countries

Starlink outperforms terrestrial ISPs across Africa in terms of download speed but lags in terms of latency

Network performance and price are crucial in attracting users from existing fixed broadband solutions, whether DSL or fiber. According to Speedtest Intelligence, Starlink delivers substantially higher median download speeds than the overall median for other ISPs across all surveyed markets. For example, Starlink offers median speeds of 106.36 Mbps and 86.18 Mbps in Botswana and Eswatini, respectively—far exceeding the 9.36 Mbps and 13.6 Mbps provided by other ISPs. In Burundi and Mozambique, the Starlink-to-other-ISP download speed ratio is also high at 7.6 and 6.6, respectively. Even in Ghana and Rwanda, with the fastest median download speed for terrestrial ISPs at 44.66 Mbps and 44.15 Mbps in Q1 2025, respectively, Starlink outperformed them with 75.1 Mbps and 85.5 Mbps.

More generally, Starlink is still faster than other ISPs in Zimbabwe, Nigeria, Kenya, Malawi, and Zambia by a factor of 2 to 4. The speed difference is less than double in a few spots, like Ghana, Rwanda, and Madagascar.

Median Download Speed Comparison Between Starlink and Other ISPs, Select African Countries
Speedtest Intelligence® | Q1 2025
Median Download Speed Comparison Between Starlink and Other ISPs, Select African Countries

Despite significant improvements in latency in Q1 2025, as discussed above, they remain higher than terrestrial networks. Even in countries with high latency, Starlink may still be valuable in remote areas where terrestrial ISPs are unavailable, especially since its download speed is usually many times that of traditional ISPs.

Starlink’s latency is quite competitive at under 70 ms in Kenya, Nigeria, and Rwanda, thanks to its local PoPs. Starlink also offers a latency of less than 200 ms in most African countries, often 2 to 5 times higher than what is available through terrestrial ISPs. The largest gap in latency is found in Ghana, a market with a high fiber share of the fixed broadband market, where Starlink’s latency is nearly 10 times higher than what fiber users can experience, at just under 13 ms.

Median Multi-Server Latency Comparison Between Starlink and Other ISPs, Select African Countries
Speedtest Intelligence® | Q1 2025
Median Multi-Server Latency Comparison Between Starlink and Other ISPs, Select African Countries

Starlink’s expansion across Africa continues amidst regulatory challenges in several countries

While consumers and businesses are eager to adopt the service due to its superior speeds compared to fixed broadband,  ISPs are concerned about the competition Starlink poses, given their substantial investments in local network infrastructure. While some regions have embraced the service, others have imposed stringent foreign ownership and ISP licensing regulations, delaying Starlink’s deployment. Starlink has partnered with local equipment distributors (such as Paratus Group) and ISPs to navigate these challenges, leveraging existing licenses.

The cost of a Starlink subscription varies significantly by country in Africa, while hardware costs for the terminal range between US$200 and US$700, making the service prohibitive to most businesses and households across the continent. However, Starlink has offered steep discounts in countries where traditional fixed broadband services are expensive, such as in Zimbabwe, where Starlink offers unlimited internet in Zimbabwe for US$30 per month (excluding the reception kit), compared to more than US$100 for a standard fiber package. In Kenya, the Starlink “Residential Lite” plan costs around US$30 per month, and the terminal equipment is available for monthly lease.

These initiatives directly boosted its popularity and the growth of its customer base. For example, Starlink became the country’s second-largest ISP in Nigeria in Q3 2024, with 65,564 subscribers in Q3 2024, according to the Nigerian Communications Commission (NCC). In Kenya, satellite service subscribers more than doubled between June and September 2024 to 17,042 (representing 1.4% of fixed wired subscriptions). Demand has reached a point where Starlink halted sign-ups in some of the biggest cities across Africa, like Abuja and Lagos (Nigeria), Nairobi (Kenya), Lusaka (Zambia), and Harare (Zimbabwe), due to capacity limitations. However, the launch of Starlink’s newer satellites with greater capacity than the initial generations should help alleviate these constraints over time.

Amidst this expansion, Starlink continues to face resistance from local operators and regulators. For example, in April 2024, the government of Cameroon banned the import of Starlink kits, accusing the company of operating without a license. The NCC in Nigeria forced the company not to increase its prices without prior approval. It delayed its launch in Angola due to a delay in obtaining a license. The company has also yet to receive approval in Côte d’Ivoire, Burkina Faso, DR Congo, South Africa, and Senegal.

As Starlink continues to expand and optimize its network, it has the potential to become an even more competitive solution for broadband access in Sub-Saharan Africa. For now, users must weigh the benefits of higher speeds at potentially higher costs against increased latency when choosing between Starlink and terrestrial broadband services.  Partnerships between LEO satellite operators like Starlink and local telecom operators could be the way forward to deliver more affordable internet services to underserved areas. For instance, satellite technology can provide direct-to-phone internet service without requiring special equipment. Satellites could also connect shared hotspots, providing much-needed connectivity to remote regions, or be used as backhaul to connect rural base stations. This is already taking shape as Airtel Africa signed an agreement with Starlink in May 2025 to integrate satellite services into its offerings in nine of the fourteen countries across its footprint, with regulatory processes underway for the other five.

We will continue to monitor the expansion of Starlink and other LEO satellite operators around the world and benchmark their network performance against terrestrial operators. If you are interested in Ookla’s solutions and services for network intelligence and management, get in touch.

Ookla retains ownership of this article including all of the intellectual property rights, data, content graphs and analysis. This article may not be quoted, reproduced, distributed or published for any commercial purpose without prior consent. Members of the press and others using the findings in this article for non-commercial purposes are welcome to publicly share and link to report information with attribution to Ookla.

| July 30, 2023

U.A.E. – World’s Fastest 5G Market Driving Consumer Experience Gains

Key takeaways

  • Top-performing global 5G market and network operator. The U.A.E. was the fastest 5G market globally in Q2 2023 according to Ookla Speedtest Intelligence data, with growing competition between the nation’s two network operators helping to drive overall performance in the market to reach a median download speed of 557.63 Mbps. etisalat by e& was the fastest 5G operator globally with a median download speed of 680.73 Mbps.
  • 5G networks trump 4G-LTE for mobile gaming and video streaming experiences. Users accessing both etisalat by e&’s and du’s 5G networks experienced median gaming latency of 43 ms and 57 ms respectively, lower than those recorded across 4G LTE. 5G users also experienced improved video start times and experienced less buffering when streaming video compared to those on either 4G LTE or Wi-Fi.
  • Improved network experience driving industry leading Net Promoter Scores (NPS). With 5G driving improved experiences across use cases such as mobile gaming and video streaming, and with the U.A.E. ranking first in terms of median 5G performance, it’s no surprise that NPS in the market are leading the industry. Indeed, 5G users in the market are more likely to recommend the nation’s networks when compared to 4G, with etisalat by e& leading the market with a score of 64.7 in Q2 2023, and du following with 46.7.
  • Lower 10% of Speedtest samples point to room for improvement. du led the market for 5G Consistency – the proportion of Speedtest samples that met a minimum performance threshold of 25 Mbps download and 5 Mbps upload during Q2 2023. Reviewing 5G performance of the lower 10% of samples at a city-level highlights where etisalat by e& has been targeting improvements, while du’s has seen its performance erode quarter-on-quarter.

Return to economic growth driving mobile market competition

etisalat by e& and du both launched commercially available 5G services across the U.A.E. in Q2 2019, following the allocation of spectrum for 5G use by U.A.E. regulator, the TDRA (Telecommunications and Digital Government Regulatory Authority). Since then, both operators have rolled out 5G networks aggressively, achieving near universal 5G population coverage as of 2022. Both operators have had to contend with a challenging macroeconomic environment brought on by the COVID-19 pandemic, which led to declining mobile revenues, constrained prepaid spending, and reduced roaming and device revenues.

However, 2022 saw growth return to the market with etisalat by e&’s U.A.E. mobile revenues increasing by 6.0% to reach 11,406 million AED, while du’s mobile revenues grew by 8.4% to reach 5,748 AED million. The outlook for the U.A.E. economy going forward is very positive, with the IMF predicting GDP growth of 3.5% in 2023, following a strong rebound in 2022 of 7.4% as COVID-19 restrictions were lifted, international visitors returned to the country and rising oil prices helped bolster economic growth. For the nation’s mobile network operators, this return to growth is driving increased competition as both operators seek to demonstrate network leadership, convert prepaid users to postpaid, while also focusing on driving enhanced customer experiences and offering new digital services.

Both mobile network operators are prioritizing the growth of their postpaid customer bases. For example, subscribers of either operator can choose plans that allow them to pick and choose additional services with a strong focus on entertainment options, such as video streaming services, live sports, and mobile gaming, among others.

U.A.E. leads on 5G performance globally

The U.A.E. was the fastest 5G market globally in Q2 2023, according to Ookla Speedtest Intelligence data, recording a median download speed of 557.63 Mbps, with South Korea placing second at 501.56 Mbps.

etisalat by e& places first in global 5G performance stakes

etisalat by e& was the fastest operator within the U.A.E. and globally on 5G, recording a median download speed of 680.73 Mbps during Q2 2023, ahead of du’s 453.93 Mbps. The same was true for 4G LTE, with etisalat by e& recording a median download speed of 83.35 Mbps, ahead of du’s 64.96 Mbps. 5G performance between the two mobile operators remained similar throughout 2022, peaking in time to support Dubai EXPO 2020. Both operators increased speeds through Q4 2022 and Q1 2023, helping drive overall 5G performance in the U.A.E. to reach 557.63 Mbps, but du’s performance declined in Q2 2023, with etisalat by e& extending its 5G performance lead to 226.80 Mbps.

Among a selection of the top-performing 5G networks globally by median download speed, etisalat by e& ranked first in Q2 2023. Du’s 5G performance also ranked it among the world’s fastest, which reflect the strong position of the GCC States, and leading markets in Asia Pacific, in terms of 5G performance.

Recent news indicates that both operators will continue to drive investment toward further performance gains, while also looking to offer new use cases over their 5G networks. At MWC Barcelona 2023, etisalat by e& announced the commercial launch of its 5G Standalone (SA) network in the U.A.E., which will initially be dedicated to fixed-wireless access (FWA) customers. At the same time, du announced an agreement with Huawei to collaborate on 5G-Advanced technology and use cases.

etisalat by e& leading on 5G download performance across U.A.E. cities

Speedtest Intelligence data showed that etisalat by e& was the leading operator across all major cities in the U.A.E. for both median 5G download performance and multi-server latency in Q2 2023. It also led on median 5G upload speed in Abu Dhabi, Dubai and Sharjah, however there was no statistically significant difference between it and du in Al Ain and Ajman.

Lower 10% of Speedtest samples point to need for further improvement

Median 5G performance allows us to gauge the midpoint of user experience on 5G networks, however it doesn’t always tell the full story, as 5G performance can vary widely, depending on factors such as the spectrum used, network congestion, and the distance and any obstacles between the user device and the cell site. Ookla tracks network Consistency, which for 5G networks records the proportion of samples which meet or exceed 25 Mbps download speed (the recommended speed for streaming in 4K) and 3 Mbps upload speed.

du and etisalat by e& both performed strongly on 5G Consistency, with scores of 92.1% and 90.9% respectively. Drilling down into the city-level data, and looking at performance for the lowest 10% of samples, reveals some potential improvement points for both operators. For the city of Ajman, etisalat by e& has recorded a significant improvement in the lower 10th percentile of 5G samples, increasing from 9.76 Mbps in January to 93.67 Mbps in June. However despite the increase, its performance in Ajman remains below that recorded in other U.A.E. cities. du on the other hand has returned more stable 5G performance among the lower 10% of samples in the city over the past six months, but is seeing performance decline, from 138.33 Mbps in January to 50.85 Mbps in June.

5G delivering improved mobile gaming and video streaming experiences

With both operators keen to grow their customer bases and prioritizing migration toward higher value postpaid subscribers, translating 5G performance gains into discernible improvements for the end-user experience is vital.

Consumers in the U.A.E. spent on average 4.7 hours per day playing mobile games during 2021, the most of all MENA markets, according to data.ai’s State of MENA 2022. Usage continues to grow, fueled by a young and tech-savvy population with high disposable income. 5G offers the potential for lower latency than previous generations of mobile technology, which alongside higher throughput, enables improved experiences for both consumer and enterprise use cases that rely on a high level of network responsiveness. This is particularly true for online gaming and cloud streaming of games. For example, network response times are critical for Call of Duty Mobile (which etisalat by e& has bundled with some of its postpaid plans.) 

According to Ookla Consumer QoE™ data, etisalat by e& recorded lower median latency across both its mobile and fixed networks when compared to du during Q2 2023. 5G latency for both operators was lower than for 4G LTE,  with etisalat by e& achieving a 5G latency of 43 ms, and du 57 ms. Wi-Fi performance differed between the operators, with etisalat by e&’s Wi-Fi recording the lowest latency across all access types, while du’s Wi-Fi latency lagged behind its mobile network latency performance.

Video content is a primary focus for both network operators in the U.A.E. and a common route for operators globally to add value to consumer mobile subscriptions. We examined Ookla Consumer QoE data, looking at two key video streaming metrics as measures of the consumer experience delivered: video start time and video rebuffering ratio.

Video start time measures the time between when a user clicks play, or the video auto-starts, and when the first frame of a video is rendered. Based on Ookla’s Consumer QoE data for Q2 2023, our results showed that 5G networks offered a faster video start time for both network operators compared to their 4G LTE or Wi-Fi networks, of almost half a second.

Video rebuffering ratio compares the time users have experienced buffering during a video to the total playtime of the video, excluding the initial video start time. Rebuffering occurs when the video stalls during playback and the user must wait for the video to resume. It is a major source of poor quality of experience, and if rebuffering is severe enough, it can lead to audience abandonment and can also serve as an indication of poor overall network performance. In good news, Ookla’s Consumer QoE data for Q2 2023 showed a substantial reduction in median video rebuffering ratios for both network operators, with rebuffering reduced to nearly 0% on 5G for both networks.

5G driving an uplift in industry-leading NPS scores for both operators

With the fastest median 5G download performance globally, it’s no surprise that NPS for 5G users within the U.A.E. are leading the industry. NPS is a key performance indicator of customer experience, categorizing users into Detractors (score 0-6), Passives (score 7-8), and Promoters (score 9-10), with the NPS representing the percentage of Promoters minus the percent of Detractors, displayed in the range from -100 to 100. 

Ookla’s Speedtest Intelligence data showed that du’s 5G service recorded the largest difference in NPS when comparing users on its 4G LTE network to those on 5G during Q2 2023, with an uplift of 61.0 basis points to reach 46.7. etisalat by e& recorded the higher NPS scores on its 5G network, of 64.7, while its 4G LTE NPS score of 40.4 was equally impressive.

Both operators in the U.A.E. are in prime position to capitalize on their 5G network investment to date, which is already helping drive improved consumer experiences on their networks. They are also poised to take advantage of the deployment of 5G Standalone networks in the market, offering further performance gains, but also opening up opportunities to target services for key enterprise verticals that among other things often demand highly reliability, as well as low latency communications.

Ookla retains ownership of this article including all of the intellectual property rights, data, content graphs and analysis. This article may not be quoted, reproduced, distributed or published for any commercial purpose without prior consent. Members of the press and others using the findings in this article for non-commercial purposes are welcome to publicly share and link to report information with attribution to Ookla.

| October 1, 2023

India’s Remarkable 5G Advancement Elevates its Global Mobile Ranking

Ookla® data shows that in India over the past year, mobile download speeds in the country have seen significant improvement. In fact, India jumped 72 places on the Speedtest Global Index™ over the past year, with India’s 5G launch largely responsible for boosting the country’s ranking.

Key messages

  • India ranked 47 in August 2023. The country’s speed performance has seen a 3.59 times increase since the introduction 5G, with median download speeds improving from 13.87 Mbps in September 2022 to 50.21 Mbps in August 2023. This improvement has led to India’s rise in the Speedtest Global Index, moving up 72 places, from 119th place to the 47th position.
  • 5G benefits extend to all telecom circles. 5G deployments have led to an improved overall user experience across all telecom circles thanks to operators investing in backhaul infrastructure. The launch of 5G technology by operators like Jio and Airtel has led to a substantial increase in 5G subscribers, and operators still have ambitious rollout plans, with the deployment of a significant number of 5G base stations across the country.
  • Not only faster speeds. 5G has not only brought faster speeds but also higher customer satisfaction, as indicated by the Net Promoter Score (NPS), which shows that 5G users in India consistently rate their network operators more positively compared to 4G users. Additionally, 5G Fixed Wireless Access (FWA) services have been introduced to provide broadband connectivity in areas where laying fiber is costly or impractical.

India climbed by 72 places on Speedtests’s mobile rankings thanks to 5G rollouts

Speedtest Intelligence® data shows that median download speeds across India increased by 259% since before 5G launched, jumping from 13.87 Mbps in September 2022 to a median download speed of 50.21 Mbps in August 2023. As a result, India’s position on the Speedtest Global Index™ improved by 72 places, from 119th in September 2022 to 47th in August 2023. This puts India ahead of its neighbors, Indonesia, Bangladesh, Sri Lanka, and Pakistan, but also some G20 countries, such as Mexico (90th), Turkey (68th), the UK (62nd), Japan (58th), Brazil (50th place), and South Africa (48th place).

Chart of Global Index Raking Among Select Countries Compared to India

Mobile performance improved in all telecom circles

Mobile users in India are among the most data-intensive consumers in the world. However, India’s 4G networks have been unable to keep up with consumer expectations, primarily due to network congestion caused by population density, lack of cellular infrastructure, backhaul, as well as spectrum constraints. Following the 5G spectrum auction, operators have been able to addres some of those issues and help to offload 4G traffic onto 5G networks, thus reducing 4G network congestion – the strategy has proven successful already, as 25% to 35% of traffic is already getting offloaded on 5G from 4G. 

Map of India Median Cellular Download Speed by Telecom Circles, All Operators Combined

According to Speedtest data, India’s median download speed has improved remarkably, increasing by 3.59 times since 5G was launched in the country. Back in October 2022, for example, India’s median download speed ranged from 10.37 Mbps in North East to 21.49 Mbps in Jammu and Kashmir. However, by August 2023, the range of median download speeds had widened significantly, with each circle clocking a speed of more than 28 Mbps. The North East saw a median download speed of 28.02 Mbps, while Jammu and Kashmir recorded a high of 150.95 Mbps.

In August 2023, Jammu and Kashmir, located in the northernmost part of India, emerged as the leader in mobile median download speeds at 150.96 Mbps, surpassing Bihar (73.00 Mbps) and Kolkata (66.47 Mbps). Jammu and Kashmir was one of the last states to launch a mobile network in 2003, and due to security concerns and internet shutdowns, there were occasional disruptions in mobile network services. However, the local administration has been focusing on developing infrastructure in various tourist places, particularly in Kashmir.

Fast-paced 5G adoption

Jio and Airtel have been implementing 5G technology since October 2022, following the acquisition of 5G spectrum licenses. At first, they concentrated on launching in major cities, but their coverage has expanded significantly, and 5G performance has improved across all telecom circles. In October 2022, there was a noticeable difference in the performance of 5G networks on 5G-compatible devices. Median download speeds ranged from 512.57 Mbps in Gujarat to 19.23 Mbps in Uttar Pradesh West as the networks were under development. In fact, in nine telecom circles: Andhra Pradesh, Kolkata, North East, Haryana, Rajasthan, Bihar, Punjab, Kerala, and Uttar Pradesh West, median 5G download speeds were below 100 Mbps because networks were in early testing stages. However, by August 2023, median 5G download speeds exceeded 240 Mbps across all telecom areas, with Kolkata leading the pack with a median download speed of 385.50 Mbps.

Map of India Median 5G Download Speed by Telecom Circles, All Operators Combined

As 5G deployments continue in India, the number of subscribers keeps growing. Reliance Jio announced it has over 50 million customers, and Bharti Airtel claimed it had over 10 million 5G customers in June

Jio also has ambitious rollout targets – it aims to deploy nearly 1 million base stations by December 2023 to address growing data consumption on its network. According to The Department of Telecommunications (DoT), the country had 338,572 5G base stations (BTS) as of August 28, 2023, a significant increase from the 53,590 reported at the beginning of the year. The three most populous states in India – Uttar Pradesh, Maharashtra, and Bihar – account for 25% of all wireless subscribers in the country and also hold a 25% share of 5G BTS.


5G speeds in India are particularly impressive compared to those on 4G; in August 2023, for example, median download speeds on 5G were 2,003% faster than those on 4G, with 5G showing a median download speed of 316.24 Mbps compared to 14.97 Mbps on 4G. The speed increase has been heavily propelled by operators investing in fiber technology to improve backhaul.

5G has a positive impact on Net Promoter Scores

Chart of 5G NPS in India

The Net Promoter Score (NPS) is a tool that gauges customer loyalty and satisfaction. NPS is a key performance indicator of customer experience, categorizing users into Detractors (those that score 0-6), Passives (scores between 7 and 8), and Promoters (score of 9-10), with the NPS representing the percentage of Promoters minus the percent of Detractors, displayed in the range from -100 to 100. 

In our recent article, we found that 5G users, on average, rated their network operator with NPS scores that were universally higher than those for 4G LTE users. The story is similar in India, where in Q2 2023, 5G scored 15.80 compared to -29.65 for 4G. In most telecom regions, except for the North East, the 5G NPS consistently outperforms that of 4G/LTE.

Ookla understands real-life consumer experience

Median 5G performance allows us to understand the midpoint of the user experience on 5G networks, but it doesn’t paint the complete picture. Speedtest® is designed to thoroughly saturate a user’s connection, uniquely allowing us to accurately measure the maximum speeds available. This is especially important for 5G connections, which can be capable of tremendous speeds, such as those we observed in India. Using Speedtest data, we can see that operators in India have already achieved maximum download speeds exceeding 1.7 Gbps. Speedtest simultaneously measures download speeds from multiple servers to ensure a fully utilized connection.

Chart of 5G Maximum Download Speed in India for Jio and Airtel

Early days for 5G FWA

In addition, operators have introduced 5G Fixed Wireless Access (FWA) services to complement their existing 5G offerings. FWA offers an excellent opportunity to cover areas that are too costly to lay fiber and is an alternative to fixed networks. 5G FWA offers an opportunity in India because it will use 5G as the last-mile technology to provide broadband connectivity. 

5G FWA has already been very successful in the United States, South Africa, and the Philippines. Bharti Airtel launched ‘Airtel Xstream AirFiber’ in Delhi and Mumbai in August 2023, extending their services beyond their fiber footprint. Their plans start at Rs 799 ($9.64) per month and offer download speeds of up to 100 Mbps. Jio also launched ‘JioAirFiber,’ in September, initially available in eight cities, including Ahmedabad, Bengaluru, Chennai, Delhi, Hyderabad, Kolkata, Mumbai, and Pune. There are several plan options available for ‘AirFiber’ and ‘AirFiber Max’ with download speeds ranging from 30 Mbps to 1 Gbps. Pricing starts at INR 599 ($7.22) per month and goes up to INR 3,999 ($48.23). 


We will continue to monitor 5G performance in India, see how operators scale networks, and assess the real-world performance as more consumers will connect with 5G devices and use 5G FWA. If you want to learn more, subscribe to Ookla Research™ to be the first to read our analyses.

Ookla retains ownership of this article including all of the intellectual property rights, data, content graphs and analysis. This article may not be quoted, reproduced, distributed or published for any commercial purpose without prior consent. Members of the press and others using the findings in this article for non-commercial purposes are welcome to publicly share and link to report information with attribution to Ookla.

| May 6, 2025

How stc Bahrain Is Transforming Indoor 5G Connectivity with Ookla Data [Case Study]

Seamless connectivity has become essential in indoor environments like hotels and shopping malls where people gather, and network congestion can significantly affect the user experience. In Bahrain, telecommunications operator stc Bahrain has adopted a proactive approach to enhancing the indoor 5G customer experience by deploying innovative solutions at premium locations such as The Ritz-Carlton Bahrain and City Centre Bahrain.

stc Bahrain’s initiative leverages Ookla’s Speedtest Intelligence® and Cell Analytics™ platforms, enabling data-driven decisions throughout the entire indoor 5G deployment lifecycle — from network planning and technology implementation to validation of coverage and performance improvements.

Situation

In today’s highly competitive telecommunications market, premium indoor locations represent both a significant challenge and opportunity for network operators. These environments — luxury hospitality venues, commercial centers, and other high-density public spaces — are where customers with 5G-capable devices and premium service plans expect flawless connectivity, yet they’re also the same areas where traditional outdoor network infrastructure often struggles to deliver consistent coverage.

For stc Bahrain, addressing indoor connectivity wasn’t just a technical issue but a critical strategic priority. Premium venues like The Ritz-Carlton Bahrain host international business travelers who demand seamless connectivity for video calls, while retail destinations like City Centre Bahrain require reliable 5G for mobile payments and augmented shopping experiences. Failure to deliver would mean not just dissatisfied customers but potentially losing valuable high-tier clients to competitors who could meet these growing expectations.

To maximize the impact of its investments, stc Bahrain required a precise, data-driven approach to identify indoor areas with poor 5G coverage, strategically deploy solutions where they would drive the most value and validate network improvements. Enter Ookla.

Download the full case study

Check out our full case study to discover how stc Bahrain leverages Ookla data to plan, implement, and validate connectivity improvements within premium indoor locations.

Ookla retains ownership of this article including all of the intellectual property rights, data, content graphs and analysis. This article may not be quoted, reproduced, distributed or published for any commercial purpose without prior consent. Members of the press and others using the findings in this article for non-commercial purposes are welcome to publicly share and link to report information with attribution to Ookla.

| February 28, 2023

5G in India: 25 Times Faster than 4G

5G has been in place in India for over four months and already it’s having a tremendous impact on the state of mobile in the country compared to last October when we commented on initial 5G speeds just after 5G networks launched. 

Key takeaways

  • India’s mobile speeds increased by 115%. India has climbed 49 places on the Speedtest Global Index™ since launching 5G, from 118th in September 2022 to 69th in January 2023. Ookla® data shows improvement in LTE speeds for both Jio and Airtel since the launch of 5G services, as all their investments into network modernization are paying off.
  • Median 5G download speeds are 25 times faster than 4G. 5G performance has increased across early 5G adopters in most of the telecom circles, Kolkata achieved the fastest median 5G download speeds in January 2023 at above 500 Mbps. Jio experienced a top median 5G download speed of 506.25 Mbps in Kolkata, while Airtel of 268.89 Mbps in Delhi. 
  • 5G Availability increased 55-fold. Airtel and Jio have ambitious targets in terms of 5G network rollout. From 5G networks’ inception, 5G Availability across 5G-capable devices has steadily increased, reaching 8.0% for Airtel and 5.1% for Jio.
  • 5G is further impacting the competitive landscape. We can see Speedtest® users migrating away from Vi, which has been further stimulated by the operator’s inability to launch 5G.

5G will benefit Digital India

Speedtest Intelligence® data shows that median download speeds across India increased by 115%  since before the 5G launch, from a 13.87 Mbps median download speed in September 2022 to 29.85 Mbps in January 2023. As a result, India’s position on the Speedtest Global Index improved by 49 places from 118th in September 2022 to 69th in January 2023. This puts India ahead of some of the G20 countries, such as Mexico, Russia, and Argentina, and its neighbors: Indonesia, Bangladesh, Sri Lanka, and Pakistan. India is also catching up with the likes of Turkey (a 30.98 Mbps median download speed/65th place on the Speedtest Global Index), South Africa (34.71 Mbps/58th place), and Brazil (35.85 Mbps/57th place).

chart of global index ranking among select countries

There are over half a billion internet users in India, making it the second-largest online market worldwide, just behind China. India has already made significant progress in terms of mobile broadband growth. One of the key reasons behind the acceleration in adoption was the launch of the Digital India initiative in 2015, which made government services digitally available to citizens. Digital India’s goal is to transform India into a digital society and economy. Since its launch, almost 270 million Indians have been connected to the internet via mobile internet. This was enabled by expanding mobile broadband networks, particularly using 4G technology. Now, 5G is stepping in to play a role in enabling digital transformation across multiple sectors of the Indian economy. GSMA Intelligence forecasts that 5G could contribute $455 billion to GDP by 2040. 

Median 5G download speed is 25 times that of 4G 

map of median 5g download speed by telecom circles, all operators combined

When 5G was first launched in October 2022, there was a wide disparity in the early 5G network performance users were experiencing on 5G-capable devices; median 5G download speeds oscillated between 512.57 Mbps (Gujarat) and 19.23 Mbps (Uttar Pradesh West) as the 5G networks build out started. In fact, in nine telecom circles: Andhra Pradesh, Kolkata, North East, Haryana, Rajasthan, Bihar, Punjab, Kerala, and Uttar Pradesh West, the median 5G download speed was below 100 Mbps because networks were very much at the testing stage. Four months on, in January 2023, 5G median download speeds had greatly increased across all of the telecom circles — exceeding 200 Mbps everywhere except Jammu and Kashmir, with Kolkata clocking speeds over 500 Mbps. 

5G investment has also propelled an increase in 4G LTE speeds thanks to the modernization of the underlying infrastructure. When we compare 5G and 4G performance in January 2023: 

  • median 5G download speed is 25 times that of 4G LTE (338.12 Mbps vs. 13.30 Mbps), and
  • median 5G upload speed is 4.5 times 4G LTE (19.65 Mbps vs 3.55 Mbps)

We see improvements in LTE speeds (both for Airtel & Jio) in multiple cities as they are offloading 4G traffic onto their 5G network, therefore reducing 4G network congestion.  This has to be caveated by the fact that these are still early days for 5G in India, and 5G performance will most likely decrease once those networks are commercially available. 

Jio and Airtel are expanding their 5G networks

map of median 5g download speed by teleocm circles, jio and airtel

Jio’s $25 bn investment seems to be paying off. In January 2023 Jio achieved median 5G download speeds above 400 Mbps across ten telecom circles. Jio’s True 5G network is based on a 5G Standalone (5G SA), which doesn’t rely on a 4G LTE network. While Jio’s initial 5G speeds fluctuated massively – from low single-digit to speeds well above 800 Mbps, which pointed to the operator recalibrating its networks, Jio’s 5G performance has stabilized over the past four months. In January 2023, Jio’s 5G early adopters experienced speeds ranging from 246.49 Mbps median download speed in Himachal Pradesh to 506.25 Mbps in Kolkata. 

Airtel looks to 5G to offload capacity from 4G to 5G. Gopal Vittal, MD & CEO of Bharti Airtel Limited, mentioned during the latest quarterly results call that “between 25% to 35% of traffic is already getting offloaded on 5G from 4G.” Airtel deployed 5G in a Non-Standalone mode (5G NSA) – the operator stated that commercial trials using NSA give a 30% higher coverage than SA. In January 2023, Airtel’s 5G early adopters experienced speeds ranging from a 78.13 Mbps median download speed in Kolkata to 268.89 Mbps in Delhi. 

Operators have already committed a significant amount of capex towards 5G. One of the key challenges Indian telcos face is low ARPU levels, which came in below Rs 200 ($2.41) in Q3 FY 2023 results: Airtel led the pack at Rs 193 ($2.33), Jio followed at Rs 178.2 ($2.15), Vi at Rs 135 ($1.63). Recently, Airtel has removed its based Rs 99 ($1.20) plan across 17 circles, with the new base plan priced at Rs 155 ($1.87). The other two operators have not followed the lead yet. While this could lead to churn, it could help solidify ARPU as Airtel plans to use 5G to migrate customers to higher-value postpaid plans. 

chart of 5g maximum download speed, jio and airtel

Median 5G performance allows us to understand the midpoint of user experience on 5G networks, but it doesn’t paint the full picture. Using Speedtest data we can see that operators have achieved maximum download speeds exceeding 1.6 Gbps – close to speeds that operators in the United States achieved using mmWave spectrum

Spectrum is not the only factor affecting 5G performance 

chart of 5g median download speed by spectrum band

Operators’ spectrum holding affects their speeds; we have recently commented on the relationship between low- and C-band spectrum and 5G performance. A similar holds true in India. Using Speedtest Intelligence data, we can see that Jio’s 5G performance differs depending on the spectrum band it uses. Jio’s 5G network using the C-band (n=78) results in a 462.60 Mbps median download speed. When Jio’s 5G network uses the lower – 700 MHz frequency band (n=28), the so-called coverage band, the median download speed was 75.70 Mbps. This, however, doesn’t necessarily explain the difference in performance between Jio and Airtel, which also uses the C-band spectrum. Airtel deployed 5G utilizing only its C-band spectrum holding in an NSA (Non-Standalone Mode), and it clocks a median 5G download speed of 277.30 Mbps. 

There is another factor at play that can explain the difference in performance between the operators – the type of backhaul network they are using. Indian operators heavily rely on terrestrial wireless backhaul solutions. While fiber penetration in backhaul networks is increasing, according to the DoT, only a third of mobile towers are connected with fiber – versus the National Broadband Mission’s goal of 70% being connected by 2024. The reason why this presents a challenge in the face of 5G rollout is that the capacity per tower site has to increase substantially to accommodate 5G traffic requirements, which in turn requires fiberized backhaul. E-band spectrum, which operators received last year, helps but isn’t enough to support a 5G rollout.  

There are various challenges related to laying fiber, including right-of-way (RoW) access and availability of stable power that operators have to overcome. Airtel looks to AI to understand where most of its traffic is located and plans its network roll-out strategy accordingly. 

5G Availability in India increased 55 times

chart of 5g availability for top providers in india, 5g capable devices

Speedtest Intelligence data shows that 5G Availability – the proportion of users with 5G-capable devices that use 5G network – had increased 55 times between September 2022, when 5G Availability stood at 0.1%, and January 2023, when it reached 5.5%. Operators already have an existing base of consumers owning 5G-capable devices. During the latest quarterly call, Airtel shared that about 11% of their smartphones are 5G ready. Airtel users with 5G smartphones can access Airtel 5G Plus services at no additional cost using their existing 4G SIM cards. Airtel is busy carrying out a 5G network rollout, planning to go live in about 300 cities by March 2023 and to cover all urban areas by March 2024.  

Jio also has ambitious targets for 5G network deployment, it recently stated that it is on track to complete the pan-India 5G rollout by December 2023, having already deployed over 25,000 sites across 700MHz and 3.5 GHz bands. Jio’s customers can connect to 5G at no additional cost upon receiving the 5G Welcome offer, which is extended to users with 5G-enabled smartphones who subscribe to a plan or Rs239 or higher. The existing 4G SIM will also connect to the 5G network. There is a need to do a software upgrade for older models of smartphones to be able to connect to Jio’s 5G SA network. 

chart of 5g availability across cities in India, all operators combined

During the early days of 5G – in October 2022 – we could see 5G device testing in just over a dozen of cities. Only three cities had a 5G Availability exceeding 2% – namely, the capital, New Delhi, Hyderabad, and Siliguri. Fast forward to January 2023, and 5G Availability exceeded 2% across 39 cities where both Jio and Airtel had rolled out their networks. 5G Availability across three cities was above 13%, namely in Cuttack, Chennai, and Noida.  

5G will further change the competitive landscape in India

chart of cumulative monthly percentage change in the number of speedtest® users

Based on our data, we can infer churn pattern of Speedtest users from January to December 2022, we can see that Vi India has been losing users throughout 2022, following the 5G launch, the disconnections increased significantly. On the other hand, Jio has been adding new users. This has been validated by the latest data released by TRAI, which shows a similar trend: Vodafone Idea had negative 2.5m net additions in December 2022, compared to Reliance Jio (1.7 million net adds) and Bharti Airtel (1.5 million net adds). 

We can also gain insights into where consumers move when changing their network providers. Most of Vi’s customers have moved away to Jio (1.88%) and Airtel (1.32%). Jio gained around 1.3% of customers from Airtel & Vi India. In comparison, Airtel has lost 0.53% to Jio but gained 0.63% from Vi over the same period of time.

chart of overall movement of speedtest® users

We will continue to monitor 5G performance in India, see how operators scale networks, and assess the real-world performance as more consumers will get online with 5G devices. If you want to learn more, subscribe to Ookla Research™ to be the first to read our analyses.

Methodology note:

Speedtest® is designed to fully saturate a user’s connection, which uniquely allows us to accurately measure the maximum speeds available. This is especially important for 5G connections, which can be capable of tremendous speeds. Speedtest simultaneously measures download speeds from multiple servers in order to ensure that a connection is being fully utilized.

Ookla retains ownership of this article including all of the intellectual property rights, data, content graphs and analysis. This article may not be quoted, reproduced, distributed or published for any commercial purpose without prior consent. Members of the press and others using the findings in this article for non-commercial purposes are welcome to publicly share and link to report information with attribution to Ookla.

| February 20, 2023

Illustrating the Worldwide State of 5G (Poster Download)

Our recent analysis showed that the global average for 5G speeds is stabilizing even as 5G access increases. To fully appreciate how far 5G has expanded, we’ve created a high-resolution downloadable poster (mobile friendly version available here) that also highlights major 5G achievements around the world.

graphic of Ookla 5G poster download link

This poster maps 5G coverage and highlights the countries with the fastest 5G. Download the Ookla® State of 5G Worldwide poster here to see the global state of 5G. It works as a desktop background or you can hang it on your wall.

If you’re at Mobile World Congress this year, stop by Booth 2i28 in Hall 2, to say hello.

Ookla retains ownership of this article including all of the intellectual property rights, data, content graphs and analysis. This article may not be quoted, reproduced, distributed or published for any commercial purpose without prior consent. Members of the press and others using the findings in this article for non-commercial purposes are welcome to publicly share and link to report information with attribution to Ookla.

| March 21, 2025

Bridging the Digital Divide: How Regulators Use Crowdsourced Data to Improve Rural Connectivity

Digital connectivity has become essential for modern life, with access to high-speed internet now allowing people to work remotely, access education, receive healthcare services, and participate in online commerce and banking. Yet a stark digital divide persists: while 40% of urban centers globally enjoy download speeds exceeding 100 Mbps (sufficient for most demanding online activities including HD video streaming and remote work), rural communities across the world — including in Africa, Central and Southern Asia often struggle with slow connectivity or none at all. These disparities can create profound differences in opportunity, limiting the potential for many communities worldwide.

To effectively address connectivity gaps, regulators and policymakers need granular, accurate data on real-world network performance, and that’s where data from Ookla® can help. Crowdsourced data from Ookla’s Speedtest® provides crucial insights into actual user experiences, helps identify underserved areas, tracks improvements, and holds service providers accountable for deployment promises.

In this article, we’ll examine the current state of global connectivity disparities, explore how the digital divide affects education, healthcare, and economic opportunities in underserved areas, and show how Egypt’s Decent Life Initiative is using data-driven approaches to transform rural connectivity. 

For a deeper look into these topics, including case studies and methodological insights from Ookla and the National Telecom Regulatory Authority (NTRA) of Egypt, watch our full webinar.

The State of Global Digital Connectivity

Effective solutions start with an accurate diagnosis. Before meaningful progress can be made in bridging the digital divide, stakeholders need precise data showing where connectivity gaps are widest and which communities are most affected. Without detailed mapping of these disparities, stakeholders risk directing investments to the wrong areas and missing chances to help those most in need. 

A study by the European Commission’s Joint Research Center, conducted in partnership with Ookla, revealed several key findings about global connectivity disparities:

  • Many countries in Africa lag significantly behind, with some regions experiencing median download speeds below 3 Mbps.
  • Broadband speeds vary dramatically between and within regions, with 40% of urban centers enjoying speeds over 100 Mbps while others struggle with basic connectivity.
  • A strong correlation exists between connectivity and economic development, with high-income countries enjoying significantly better broadband speeds.
  • In many countries in Africa and other developing regions, mobile networks are more widespread and better performing than fixed broadband networks.

These findings highlight the complex nature of the digital divide and the need for targeted approaches to address connectivity challenges in different regions. By mapping end-user speeds and coverage differences with precision, stakeholders can develop more effective interventions tailored to specific geographic and socioeconomic situations.

Map of Bridging the Digital Divide: Understanding the need

The Real Impact of the Digital Divide

Connectivity gaps aren’t just data points on a map – they represent real barriers that affect people’s everyday lives. When communities lack reliable internet access, they face serious disadvantages across multiple areas of life, as seen in Sub-Saharan Africa, where GSMA reports two-thirds of the population (710 million people) do not currently use mobile internet despite living within the footprint of a mobile broadband network. These impacts include:

  • Limited access to information directly affects civic participation, with disconnected communities unable to access government services, agricultural guidance, and essential public health information.
  • Educational inequality deepens when rural students cannot access digital learning resources and research materials or utilize remote learning options available to their urban counterparts.
  • Healthcare outcomes suffer as communities without reliable connectivity cannot benefit from telemedicine, remote diagnostics, or timely access to medical specialists.
  • Economic opportunities vanish when rural residents cannot participate in e-commerce, access online job markets, or utilize digital financial services

Addressing connectivity problems requires understanding not just where internet access is lacking, but how that absence affects real people in these communities. With this understanding, stakeholders can develop more effective strategies that prioritize the most impactful investments. 

Leveraging Crowdsourced Data for Better Connectivity

When making connectivity decisions, actual user experiences matter more than theoretical coverage maps. Regulators need to know where people are truly experiencing poor or great service, not just where internet providers claim to provide coverage. Ookla’s crowdsourced data reveals these real-world experiences, helping stakeholders make better decisions through several practical applications:

  • Creating precision maps of connectivity disparities by visualizing actual speeds geographically rather than relying on operator-reported coverage claims.
  • Identifying socioeconomic impacts through targeted research, such as the World Bank’s use of Ookla data to discover that 30% of areas near Brazilian educational facilities had inadequate speeds for effective e-learning.
  • Guiding evidence-based policy decisions, as demonstrated in the OECD’s analysis, revealed that rural fixed broadband speeds averaged 31% below national averages even in developed countries.
  • Establishing accountability frameworks, exemplified by South Carolina’s use of Ookla data to track rural-urban connectivity gaps and verify that providers delivered promised service improvements.

The examples from Brazil, OECD countries, and South Carolina demonstrate how empirical, user-generated data provides crucial insights that theoretical coverage models simply cannot offer. With such a granular understanding of actual network performance, regulators can target investments more precisely, measure progress accurately, and hold providers accountable for delivering on any promised improvements.

Graph of Crowdsourcing Helps with Strategic Planning

Case Study: Egypt’s Decent Life Initiative

Egypt’s ambitious Decent Life Project is a comprehensive national development program launched to improve the quality of life in rural areas, with telecommunications infrastructure as a key component. Launched in 2019, it demonstrates how data-driven planning, strategic investment, and public-private collaboration can transform rural connectivity at scale. This nationwide program tackles both coverage and quality issues in some of the country’s most underserved communities:

  • A comprehensive approach targeting 4,500 villages and directly impacting over 58 million Egyptians through improved infrastructure and services
  • Collaborative implementation involving more than 20 ministries, 23 civil society organizations, and numerous volunteers to address connectivity alongside other development needs
  • Strategic two-pillar telecommunications strategy focusing on mobile network expansion (establishing 1,096 new stations) and fiber optic deployment (targeting 2.8 million buildings)
  • Measurable improvements in download speeds across targeted governorates, documented via before-and-after performance testing using Ookla data
  • Innovative funding model combining government funding resources with private operator investments to share costs and accelerate deployment

With 80% of the first phase complete and plans to reach 99% mobile coverage by 2025, Egypt’s Decent Life Project demonstrates how targeted interventions can dramatically reduce rural-urban connectivity disparities. Egypt’s approach also underscores the power of coordinated action across government agencies, private sector partners, and civil society organizations. 

Best Practices for Addressing the Digital Divide

Successful digital divide initiatives like Egypt’s Decent Life Project and many others revealed a crucial insight: technical solutions alone cannot solve connectivity challenges when underlying economic, regulatory, and social barriers remain unaddressed.

Indeed, meaningful change occurs when comprehensive strategies align policy, funding, and technology toward clearly defined connectivity goals. Across initiatives aimed at narrowing the digital divide, several approaches consistently deliver positive results:

  • Data-centric planning that uses granular performance metrics to identify specific underserved areas rather than relying on broad regional generalizations
  • Technology diversity that combines mobile, fixed, and alternative technologies based on local geography, population density, and economic conditions
  • Collaborative funding frameworks that blend public resources with private investment to distribute costs and create appropriate incentives
  • Focus on outcomes rather than specific technologies, allowing solutions to adapt to local contexts and evolving capabilities
  • Parallel investment in digital literacy and relevant content to ensure infrastructure investments translate into actual adoption and usage
  • Continuous performance monitoring to maintain accountability, document improvements, and adjust strategies based on measured results

Practical experience from successful initiatives around the world shows that these elements form not just a theoretical framework but a proven roadmap for accelerating connectivity improvements. By combining data-driven planning, appropriate technology choices, innovative funding, and continuous performance monitoring, countries can make rapid progress even in challenging environments. 

Conclusion

Bridging the digital divide requires a comprehensive understanding of both coverage and usage gaps, strategic investment in infrastructure, and ongoing assessment of performance improvements. As demonstrated by Egypt’s Decent Life Project, crowdsourced data plays a critical role in guiding these efforts and measuring their impact.

When regulators leverage accurate, real-time performance data, they can more effectively address connectivity challenges and ensure digital resources are accessible to all communities. The result is not just improved network statistics but meaningful improvements in education, healthcare, economic opportunity, and quality of life.

For a more detailed examination of how regulators are using crowdsourced data to improve rural connectivity, including additional case studies and methodological insights, check out our recent webinar, “How Regulators Use Crowdsourced Data to Improve Connectivity in Underserved Rural Communities.”  


Ookla retains ownership of this article including all of the intellectual property rights, data, content graphs and analysis. This article may not be quoted, reproduced, distributed or published for any commercial purpose without prior consent. Members of the press and others using the findings in this article for non-commercial purposes are welcome to publicly share and link to report information with attribution to Ookla.

| October 17, 2024

Using Controlled Testing to Complement Crowdsourced Data for Better Insights at Hajj

Nearly 2 million visitors converged on Makkah between 14 and 18 June 2024 to perform the Hajj pilgrimage. As digital connectivity becomes increasingly essential, network performance plays a vital role in ensuring pilgrims can stay in touch with loved ones, access crucial information, and document their journey. However, providing a good network experience during the Hajj season is a big challenge due to the diverse terrain and high population density across multiple locations. The influx of users from different markets with an array of devices, some with outdated technologies, adds to the complexity.

During Hajj 2024, Ookla conducted controlled walk testing across key locations using RootMetrics® to examine how the network expansions and improvements announced by the operators have impacted the pilgrimage experience. Crowdsourced data was overlaid to assess the network’s impact on Quality of Experience (QoE) metrics to gain an even greater picture of the performance improvements.

Examining cellular network performance during the Hajj season

The controlled testing team was equipped with the latest 5G capable handsets, featuring SIM cards from three major operators in the region. A predefined path was tested over four days, covering five locations along the pilgrims’ path (Haram, Mina, Muzdalifah, Arafat, and Jamarat). Each area has its own terrain characteristics, population density, and mobility requirements. Most of the tests were conducted outdoors (68%), except in parts of the Haram (on day 1) and Jamarat (on day 4). 

Testing encompassed various controlled assessments to measure different aspects of network performance and reliability, including:

  • Data throughput download/upload tests
  • Call and SMS tests
  • Secure lite data tests
  • Video tests
Hajj steps and controlled tests itinerary

Controlled plus crowd testing provides a unique perspective

By analyzing network performance across all operators at the same location and the same time, our controlled testing provides accurate benchmarking and unique insights. It also enables us to schedule tests during peak hours to assess networks’ resilience and identify potential bottlenecks. Additionally, it allows for root cause analysis to pinpoint the reasons behind sub-optimal network performance or coverage issues, which may be attributed to configuration problems or inefficient spectrum utilization.

Combining walk test measurements with crowdsourced user experience data can effectively assess the impact of Quality of Service (QoS) parameters on Quality of Experience (QoE) metrics, identify issues, and prioritize improvements. Ookla Consumer QoE™ provides a comprehensive view of real-world consumer network experiences at times and locations that matter most to consumers. This data offers a valuable overlay with the detailed QoS and radio frequency data collected during walk tests.

Learn more about Ookla insights at Hajj

Please get in touch if you would like to know more about network QoS and QoE performance during Hajj 2024 and how it impacted pilgrims’ experience.

Ookla retains ownership of this article including all of the intellectual property rights, data, content graphs and analysis. This article may not be quoted, reproduced, distributed or published for any commercial purpose without prior consent. Members of the press and others using the findings in this article for non-commercial purposes are welcome to publicly share and link to report information with attribution to Ookla.