
| December 6, 2017

Mapping Gigabit: Where in the World We’ve Seen Gigabit-speed Results

Gigabit-speed internet is all over the map, literally. With the exception of Antarctica, we found Speedtest results on fixed broadband gigabit speeds (download speeds of 750 Mbps or faster) on every continent. While some continents were better represented than others, we were heartened to see just how far gigabit internet has spread across the globe.

Using data from Speedtest Intelligence during the period August 1, 2017 – November 28, 2017, we defined gigabit tests as any result with a download speed in excess of 750 Mbps for the purposes of this article. While gigabit technically means 1,000 Mbps (or 1 Gbps), that’s the available speed and device limitations and throughput overhead often limit the actual performance of a connection. We’ve also calculated a gigabit user penetration (GUP) figure that represents the number of users who have gigabit results divided by the total population of the country.

Note that gigabit service is often highly localized, so just because your country (or even city) is represented does not mean that you can get gigabit at your house.

Continents with the Most Gigabit Speedtest Results
August 1, 2017 – November 28, 2017
Region Number of Tests Number of Users Mean Download (Mbps) Mean Upload (Mbps)
North America 256,210 163,260 866.54 555.09
Europe 210,638 146,062 868.80 418.17
Asia 141,674 70,544 852.28 570.79
Australasia 11,792 7,188 879.70 520.43
South America 1,093 831 845.04 672.86
Africa 723 525 844.85 559.65

What might not be obvious is that North America has the largest number of gigabit tests. Europe is close behind and Asia takes third. Gigabit-speed results fall off dramatically in Australasia, South America and Africa.

Cities with the most tests are likewise spread across the globe from Hong Kong and Singapore to Austin, Texas.

Global Cities with the Most Gigabit Speedtest Results
August 1, 2017 – November 28, 2017
City Country/Region Number of Tests Number of Users Mean Download (Mbps) Mean Upload (Mbps)
Hong Kong Hong Kong (SAR) 58,051 15,037 872.99 637.09
Singapore Singapore 42,469 26,421 886.77 677.34
Paris France 17,211 11,891 860.71 672.39
New York United States 14,509 8,637 854.58 667.06
Bucharest Romania 13,977 8,615 842.61 707.09
San Francisco United States 8,525 3,899 859.41 733.37
Toronto Canada 7,320 4,319 839.01 627.89
Milan Italy 7,184 4,447 855.95 476.41
Budapest Hungary 6,958 4,319 848.34 571.25
Austin United States 6,045 3,960 859.49 744.89

North America

When looking at the top ten locations for gigabit tests in North America, the U.S. dominates with nearly ten times the number of tests as second-place Canada. Mexico comes in a distant third.

North American Countries with the Most Gigabit Speedtest Results
August 1, 2017 – November 28, 2017
Country/Region Number of Tests Number of Users Mean Download (Mbps) Mean Upload (Mbps) GUP
United States 228,475 145,551 866.54 555.09 0.04%
Canada 26,616 16,897 871.46 319.00 0.05%
Mexico 638 520 839.13 754.97 0.00%
Puerto Rico 344 189 828.09 640.15 0.01%
Dominican Republic 36 26 835.04 520.70 0.00%
Guadeloupe 21 15 899.16 239.94 0.00%
Panama 15 7 823.69 72.70 0.00%
Trinidad and Tobago 14 14 827.42 735.84 0.00%
Barbados 12 7 883.45 220.43 0.00%
Martinique 10 7 944.56 238.61 0.00%

Digging deeper into the data, Canada is first place for gigabit user penetration (GUP) in North America with 0.05% of people having received a gigabit speed result. The U.S. has a GUP of 0.04%, Puerto Rico 0.01% and Mexico 0.00%. Gigabit tests pop up elsewhere on the continent, but the numbers are low enough that the service appears to be either prohibitively expensive or available to a very small segment of the population.

Canada, Guadeloupe, Barbados and Martinique have much slower upload speeds than downloads. Asynchronous speeds, when download speed is radically different from upload, like this frequently occur when gigabit is delivered over cable rather than fiber. Panama’s upload speed is especially slow for gigabit service.

Nine ISPs in the U.S. showed more than 1,000 gigabit-level results with AT&T Internet coming out on top. Canada had two ISPs that met the 1,000 test threshold with Rogers having the most.

North American Cities with the Most Gigabit Speedtest Results
August 1, 2017 – November 28, 2017
City Country/Region Number of Tests Number of Users Mean Download (Mbps) Mean Upload (Mbps)
New York United States 14,509 8,637 854.58 667.06
San Francisco United States 8,525 3,899 859.41 733.37
Toronto Canada 7,320 4,319 839.01 627.89
Austin United States 6,045 3,960 859.49 744.89
Houston United States 3,518 2,061 853.92 647.13
Kansas City, MO United States 3,135 2,229 871.52 628.74
Seattle United States 3,040 1,961 822.84 578.96
Charlotte United States 2,934 1,773 856.05 769.20
San Antonio United States 2,901 1,780 861.50 681.93
Dallas United States 2,433 1,499 841.77 729.27

At the city level, all but one of the ten North American cities with the largest number of gigabit tests are in the U.S. This isn’t surprising given the volume of tests in the U.S. versus the rest of the continent. Several of these cities were ranked among the fastest in the U.S. in our recent market snapshot.

Europe

Among the ten European countries with the most gigabit tests, France comes out on top with nearly four times as many tests as second-place Romania.

European Countries with the Most Gigabit Speedtest Results
August 1, 2017 – November 28, 2017
Country/Region Number of Tests Number of Users Mean Download (Mbps) Mean Upload (Mbps) GUP
France 94,269 65,437 877.68 254.05 0.10%
Romania 23,552 14,997 856.94 470.48 0.08%
Hungary 20,487 15,093 867.51 241.52 0.15%
Italy 15,822 9,896 871.29 236.80 0.02%
Switzerland 7,947 6,073 850.61 771.78 0.07%
Ukraine 5,852 4,051 873.57 677.24 0.01%
Netherlands 4,225 3,285 872.46 730.00 0.02%
Denmark 4,223 3,191 860.26 716.82 0.06%
Iceland 3,604 2,446 884.64 860.23 0.71%
Sweden 3,532 2,439 864.62 639.76 0.02%

Gigabit test penetration is another matter entirely with Iceland, the continent’s least populated country, coming first in the world for GUP with 0.71%. Hungary and Monaco are second and third with 0.15% and France is fourth. Lithuania, Jersey, Romania, Switzerland, Luxembourg and Denmark all have GUPs that are higher than any seen in North America.

Italy has a much slower mean upload speed than download for gigabit results. This asynchronicity usually means that gigabit is delivered over cable rather than fiber.

France has the most ISPs with 1,000 or more gigabit test results with four. Orange slightly edges out Bouygues for number of tests. Hungary, Italy and Lithuania have two ISPs apiece that meet the threshold with DIGI having the most in Hungary and Vodafone in Italy. Skynet and Telia are virtually tied in Lithuania. In Romania only Digi showed more than 1,000 gigabit tests during the period. In Ukraine and the U.K. we only saw Lanet and Hyperoptic, respectively, meeting the criteria.

European Cities with the Most Gigabit Speedtest Results
August 1, 2017 – November 28, 2017
City Country/Region Number of Tests Number of Users Mean Download (Mbps) Mean Upload (Mbps)
Paris France 17,211 11,891 860.71 672.39
Bucharest Romania 13,977 8,615 842.61 707.09
Milan Italy 7,184 4,447 855.95 476.41
Budapest Hungary 6,958 4,319 848.34 571.25
Lyon France 4,379 2,962 880.79 219.38
Kiev Ukraine 4,254 2,921 842.36 745.55
Vilnius Lithuania 2,414 1,945 869.76 717.92
Marseille France 2,320 1,530 868.89 400.53
Turin Italy 2,299 1,275 873.64 175.66
Reykjavík Iceland 2,166 1,413 884.52 778.67

The ten European cities with the largest number of gigabit tests are well distributed throughout the continent. France holds three spots with Paris, Lyon and Marseille, while Italy holds two with Milan and Turin. Not surprisingly, most of the remaining cities are capitals of the countries they represent.

Asia

As the city with the most gigabit tests in the world, Hong Kong also tops Asia. Singapore is second, Russia third, and Japan a close fourth.

Asian Countries with the Most Gigabit Speedtest Results
August 1, 2017 – November 28, 2017
Country/Region Number of Tests Number of Users Mean Download (Mbps) Mean Upload (Mbps) GUP
Hong Kong 58,051 15,037 872.99 637.09 0.20%
Singapore 42,469 26,421 886.77 677.34 0.47%
Russia 9,923 7,666 889.75 571.38 0.01%
Japan 9,128 6,600 808.31 645.69 0.01%
South Korea 5,761 4,640 827.78 724.92 0.01%
India 2,760 1,547 874.98 692.43 0.00%
China 2,354 1,524 848.91 435.53 0.00%
Thailand 2,111 1,242 848.46 369.85 0.00%
Israel 1,920 1,137 878.52 488.73 0.01%
Philippines 1,535 980 856.26 569.88 0.00%

Gigabit user penetration (GUP) shows that Singapore has the largest percentage of users with gigabit tests per capita in Asia and the second largest in the world. Hong Kong comes in second in Asia and Macau third. All three beat the GUPs of any country in North America and are competitive with what’s seen in Europe.

Upload speeds in the ten Asian countries with the most gigabit tests are much more consistent with gigabit expectations than they are in North America or Europe which likely means that fiber is prevalent.

Singapore had five ISPs with more than 1,000 gigabit tests with SingTel coming in first for volume. Hong Kong had three with NETVIGATOR showing by far the most tests. India, Russia and South Korea each only showed one ISP that met the 1,000 gigabit test threshold. Those ISPs were ACT, Rostelecom and KT, respectively.

Asian Cities with the Most Gigabit Speedtest Results
August 1, 2017 – November 28, 2017
City Country/Region Number of Tests Number of Users Mean Download (Mbps) Mean Upload (Mbps)
Hong Kong Hong Kong (SAR) 58,051 15,037 872.99 637.09
Singapore Singapore 42,469 26,421 886.77 677.34
Seoul South Korea 3,688 2,971 838.86 661.27
Saint Petersburg Russia 2,021 1,411 853.75 660.11
Hyderabad India 1,416 859 884.32 662.62
Chiyoda Japan 1,336 967 840.09 543.03
Moscow Russia 1,185 896 838.54 690.63
Perm Russia 1,113 883 942.74 327.28
Macau Macau (SAR) 966 384 831.81 845.07
Petah Tikva Israel 813 383 865.03 580.17

As Hong Kong and Singapore top the list of cities with the highest gigabit test volume in the world, they also win Asia. Russia has three cities on the list.

Australasia

New Zealand has ten times as many gigabit speed tests as Australia. No other country in Australasia showed gigabit tests during the period we studied.

Australasian Countries with the Most Gigabit Speedtest Results
August 1, 2017 – November 28, 2017
Country/Region Number of Tests Number of Users Mean Download (Mbps) Mean Upload (Mbps) GUP
New Zealand 10,832 6,458 866.91 464.42 0.13%
Australia 956 726 903.62 621.10 0.00%

New Zealand’s gigabit user penetration (GUP) was a globally competitive 0.13% while Australia’s barely registered.

Mean upload speed on gigabit tests in Australia are faster than those in New Zealand, though both countries show competitive speeds which likely means that gigabit service is delivered over fiber.

In New Zealand we saw two ISPs that topped the 1,000 gigabit test threshold we set with MyRepublic slightly edging out Spark in gigabit test volume. No ISP in Australia showed 1,000 or more gigabit results in the period we studied.

Australasian Cities with the Most Gigabit Speedtest Results
August 1, 2017 – November 28, 2017
City Country/Region Number of Tests Number of Users Mean Download (Mbps) Mean Upload (Mbps)
Auckland New Zealand 4,842 2,681 861.30 498.28
Christchurch New Zealand 1,402 706 865.43 452.40
Wellington New Zealand 763 465 830.37 400.74
Lower Hutt New Zealand 551 361 846.45 384.60
Dunedin New Zealand 386 242 850.17 378.93
Hamilton New Zealand 385 188 871.34 506.14
Sydney Australia 172 101 907.97 678.12
Porirua New Zealand 122 86 834.68 349.24
Tauranga New Zealand 113 69 861.28 484.67
Tamahere New Zealand 61 48 873.57 477.33

All but one of the cities with the highest volume of gigabit tests in Australasia were in New Zealand with Auckland coming in first, Christchurch second and Wellington third. Sydney represents for Australia at seventh.

South America

South America has about one tenth the number of gigabit results compared to Australasia. Brazil has the most, while Peru, Argentina, Chile and Colombia show enough tests to indicate that gigabit service is available but not at all common. We saw a scattering of tests in Paraguay, Bolivia and Ecuador, but they were sparse enough that we’re not prepared to say gigabit internet is truly available in those countries.

South American Countries with the Most Gigabit Speedtest Results
August 1, 2017 – November 28, 2017
Country/Region Number of Tests Number of Users Mean Download (Mbps) Mean Upload (Mbps) GUP
Brazil 643 466 844.87 683.65 0.00%
Peru 139 121 842.75 657.95 0.00%
Argentina 98 88 852.33 549.25 0.00%
Chile 95 70 842.88 751.91 0.00%
Colombia 89 63 844.74 655.26 0.00%

No country in South America showed a gigabit user penetration (GUP) that rounded higher than 0.00%, but mean upload speeds on gigabit tests were more consistently strong in all countries than on any other continent which we would expect to be true if gigabit was delivered over fiber.

Similarly, because of the overall volume of tests, we saw no ISP with more than 1,000 tests.

South American Cities with the Most Gigabit Speedtest Results
August 1, 2017 – November 28, 2017
City Country/Region Number of Tests Number of Users Mean Download (Mbps) Mean Upload (Mbps)
Rio de Janeiro Brazil 76 62 825.36 810.89
Buenos Aires Argentina 62 53 863.71 604.84
Santiago Chile 61 54 841.49 745.66
Bogotá Colombia 58 37 826.31 684.34
San Miguel Peru 52 48 836.41 561.17
Salvador Brazil 46 41 787.51 735.29
San Borja Peru 32 32 857.22 847.14
São Paulo Brazil 30 26 819.34 626.76
Santana de Parnaíba Brazil 26 10 880.58 840.19
Santiago de Surco Peru 23 23 858.76 805.75

While the number of tests in all cities in South America is low, Brazil boasts not only the city with the largest number of gigabit tests (Rio), but three other cities on the above list. Buenos Aires, Argentina and Santiago, Chile are neck and neck for second in test volume. Peru has three cities on the list.

Africa

For the most part, gigabit-speed internet does not seem to have come to Africa. South Africa is the main exception as the only country with more than 100 gigabit results during the period we studied. Kenya, Algeria, Namibia and Reunion show enough results to suggest that an elite few have access to gigabit speeds. We can’t say whether that’s for reasons of infrastructure or price. We also spotted Gigabit results in Botswana, Egypt, Ghana, Mauritius and Nigeria, but those were very rare and not necessarily indicative that gigabit service is available.

African Countries with the Most Gigabit Speedtest Results
August 1, 2017 – November 28, 2017
Country/Region Number of Tests Number of Users Mean Download (Mbps) Mean Upload (Mbps) GUP
South Africa 560 383 859.06 556.61 0.00%
Kenya 46 39 803.20 581.40 0.00%
Algeria 34 32 799.76 575.62 0.00%
Namibia 21 16 833.33 622.48 0.00%
Reunion 18 13 823.89 357.91 0.00%

No country in Africa showed a gigabit user penetration (GUP) that rounded higher than 0.00% and the test volume was low enough that no ISP had more than 1,000 gigabit results.

African Cities with the Most Gigabit Speedtest Results
August 1, 2017 – November 28, 2017
City Country/Region Number of Tests Number of Users Mean Download (Mbps) Mean Upload (Mbps)
Cape Town South Africa 153 120 864.69 723.17
Johannesburg South South Africa 136 103 856.19 484.43
Sandton South Africa 65 32 817.85 499.56
Randburg South Africa 52 30 854.43 385.01
Nairobi Kenya 45 38 801.11 590.09
Pretoria South Africa 34 21 859.63 463.39
Windhoek Namibia 21 16 833.33 622.48
Johannesburg South Africa 18 11 796.53 214.87
Krugersdorp South Africa 15 7 834.64 99.52
Midrand South Africa 14 10 918.12 738.05

All but two of the African cities with the largest volume of gigabit tests are in South Africa. Cape Town comes in first for test volume with Johannesburg South second and Sandton third. Nairobi represents for Kenya and Windhoek for Namibia.

Are you seeing gigabit-level service that we missed? Take a Speedtest on our desktop app for MacOS or Windows so we can count you in when we update our data.

Ookla retains ownership of this article including all of the intellectual property rights, data, content graphs and analysis. This article may not be quoted, reproduced, distributed or published for any commercial purpose without prior consent. Members of the press and others using the findings in this article for non-commercial purposes are welcome to publicly share and link to report information with attribution to Ookla.

| May 19, 2021

Choose Your National Park Adventure: The Best Places to Work Remotely or Digitally Disconnect

The great outdoors provided a refuge to many last year when travel options were limited. Now that many are vaccinated, national parks in Canada and the U.S. expect a surge in the number of visitors over the summer months. To find out if those visitors will be able to stretch the definition of “remote work” or if they should count on being unplugged, we looked at mobile internet performance, availability and coverage in national parks in Canada and the U.S. We included data from Q3 2020-Q1 2021 to account for the variability in dates that parks were actually open over the last year.

Gateway Arch had the fastest download speed among U.S. parks, Waterton Lakes in Canada

Fastest parks in the U.S. are near urban areas

national-parks-tables-1

According to data from Speedtest®, U.S. travelers looking for time in the great outdoors this summer without giving up mobile performance should stick to national parks located in or near urban areas. Gateway Arch National Park, located on the shores of the Mississippi River in St. Louis, Missouri, is definitely at an advantage when it comes to accessing the faster speeds that come with urban infrastructure. Gateway Arch had the fastest median download speed on our list of national parks in the U.S. Saguaro National Park and Mount Rainier National Park share a similar story and were second and third for median download speed, respectively. Saguaro borders on Tucson, Arizona and Mount Rainier is very near to Tacoma, Washington. For comparison, the median download speed over mobile in the U.S. during Q1 2021 was 41.19 Mbps.

Denali National Park in Alaska was an exception, placing seventh on this list despite being located deep in the center of the state, far from major cities.

Quick take: Whether you’re posting from the top of the Gateway Arch or Mt. Rainier, there’s a high likelihood that you can livestream your view from national parks located near urban areas.

Slowest parks in the U.S. are in more remote locations

national-parks-tables-2

On the other hand, U.S. travelers wanting to disconnect can achieve those dreams by visiting parks that are farther from major cities or nestled deep in difficult terrain. Sequoia National Park in California had the slowest median download speed on our list at a barely manageable 1.43 Mbps — not even enough to stream a 720p video. Yellowstone was second slowest and Lassen Volcanic National Park in California third. If you’re dreaming of visiting Sequoia National Park but need a slightly faster connection, try neighboring Kings Canyon National Park where the median download speed, while still only 5.40 Mbps, was 277.6% faster.

These slow speeds are a good reminder that sometimes visiting the great outdoors can be about slowing down and enjoying the offscreen splendor. You can always post your pics later.

Canadian parks show a narrower range of speeds

national-parks-tables-3
We can’t say if Canadians are better at logging off while discovering national parks than folks in the U.S. or if service is harder to get, but there were far fewer parks with sufficient data to report on in Canada. As a result, the spread in download performance was not nearly as wide for Canadian national parks as it was for those in the U.S. And, unlike the U.S., all of the Canadian national parks that made our list were in more remote locations.

Waterton Lakes National Park had the fastest median download speed during the period. Jasper and Banff were second and third, respectively. Riding Mountain National Park had the slowest median download speed, followed by Yoho National Park and Saguenay-St. Lawrence National Park. For comparison, the median mobile download speed in all of Canada was 66.90 Mbps during Q1 2021.

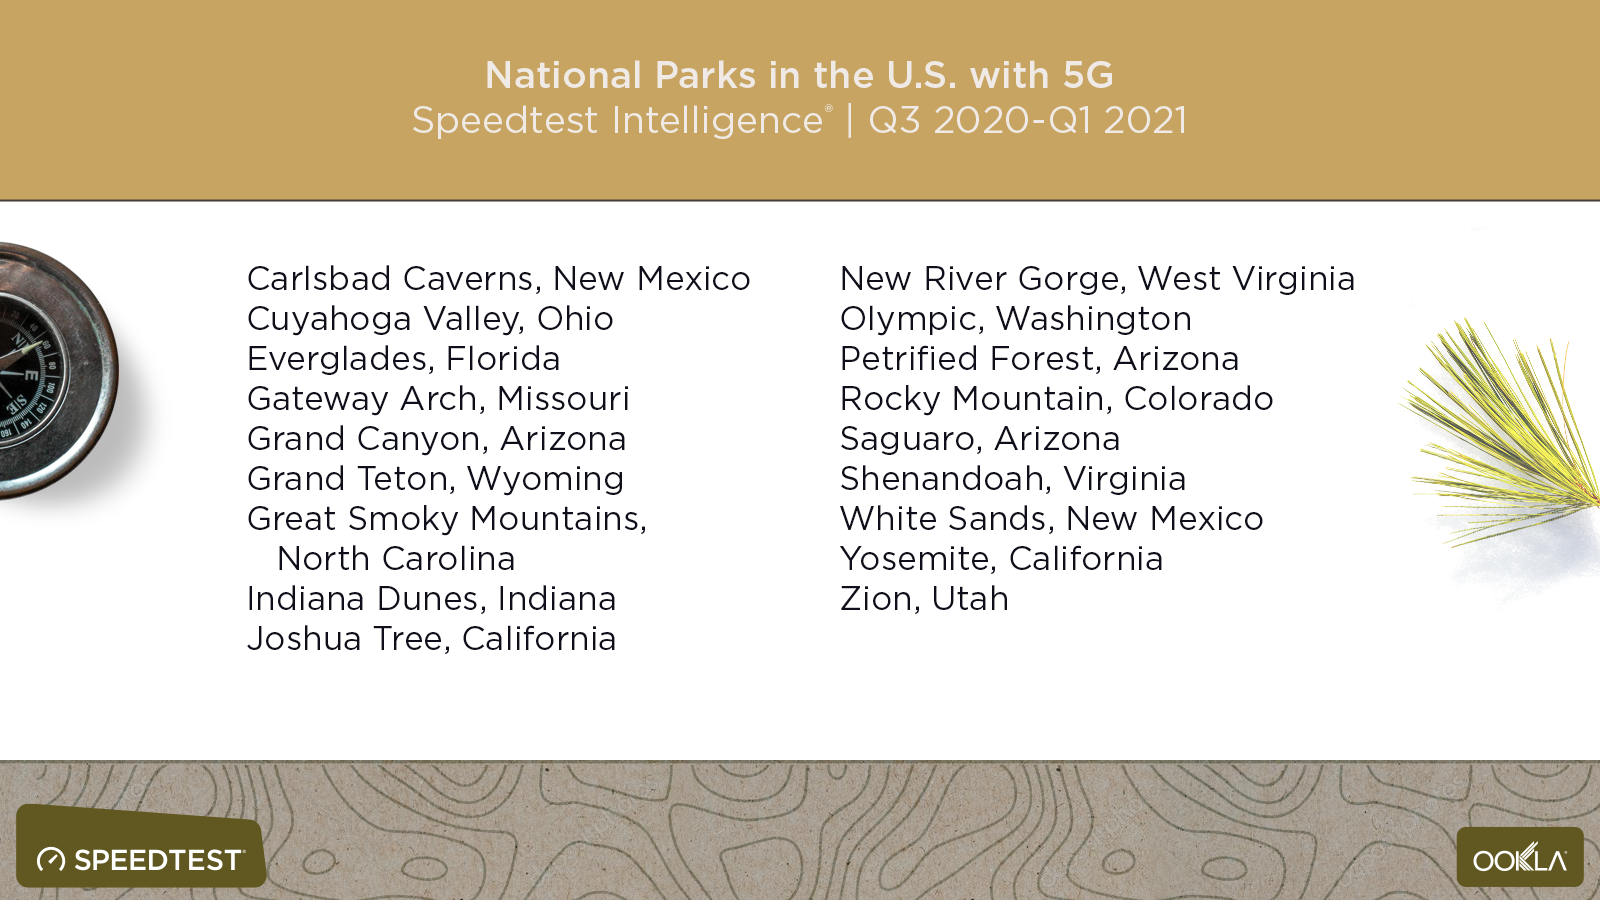
38 national parks across the U.S. and Canada show 5G

5G offers the fastest speeds for travelers looking to make arrangements on the go or tether to a laptop to fit in a few hours of remote work. Data from Android users with 5G-capable phones during Q3 2020-Q1 2021 showed 36 national parks in the U.S. and two in Canada with sufficient samples to confirm 5G at least somewhere in the park.

national-parks-tables-4

Speedtest data showed 5G in 36 U.S. National Parks from Florida to Washington. If the park you want to visit is on this list, you should have access to all that 5G has to offer at least somewhere in the park.

national-parks-tables-5

In Canada, only Banff and Jasper showed a sufficient number of 5G samples to make the list.

4G Availability varies widely among U.S. parks, less so in Canada

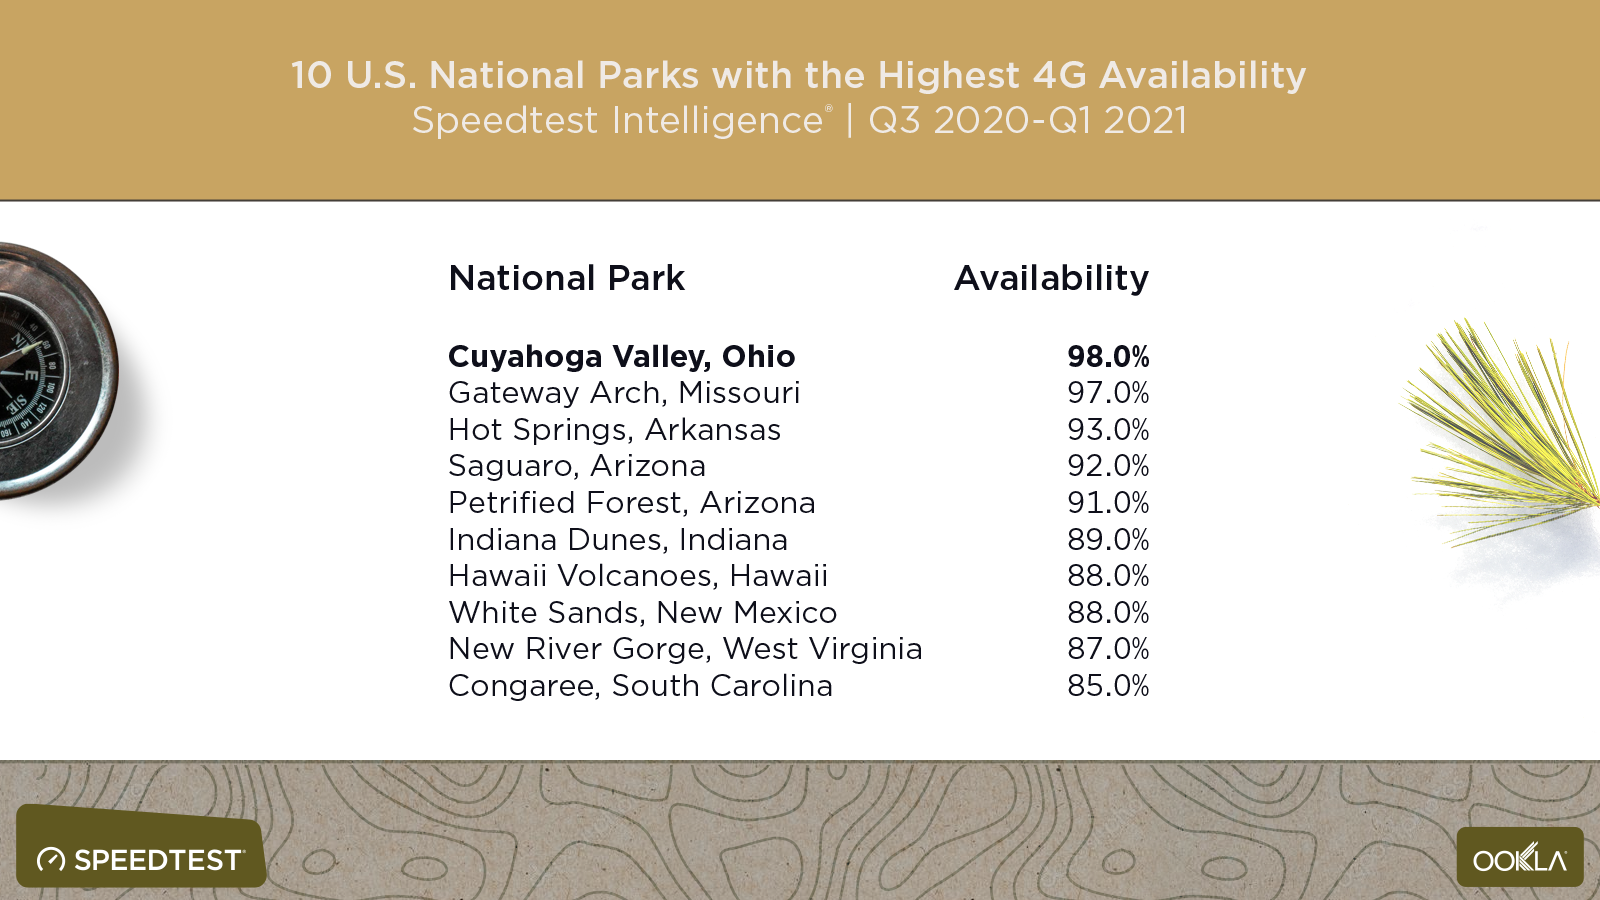
In many cases, National Parks are located in gorgeous rural locations — exactly where you’d expect not to find 4G. We looked at 4G Availability, the percent of users on all Android devices that spend the majority of their time on 4G and above (both roaming and on-network), across both countries’ park systems to see where users can connect to a modern signal.

Because terrain varies widely in parks, the presence of 4G in a park does not mean service is uniformly available throughout that park (so prepare your emergency contact plan accordingly).

Less remote U.S. national parks have higher 4G Availability

national-parks-tables-6
Cuyahoga Valley National Park in Ohio had the highest 4G Availability of any U.S. National Park, followed by Gateway Arch in Missouri and Hot Springs in Arkansas. All but four of the 10 U.S. National Parks with the highest 4G Availability were on the list of parks with the fastest median download speeds. Even the parks on this list that are farther from cities are still close to areas like highways that are often better served by mobile infrastructure.

national-parks-tables-7-1

If you’re looking to unplug while in the outdoors, try Sequoia National Park in California and Big Bend National Park in Texas. These two parks had the lowest 4G Availability of all the U.S. National Parks. There was significant overlap between the list of national parks with the lowest 4G Availability and those with the slowest median download speeds. With 4G Availability numbers like these, spectral efficiency will suffer and the network will likely not be able to serve as many people per cell, dragging down your mobile performance. Save yourself the frustration — log off and enjoy the view.

Only two Canadian parks show less than 50% 4G Availability

national-parks-tables-8
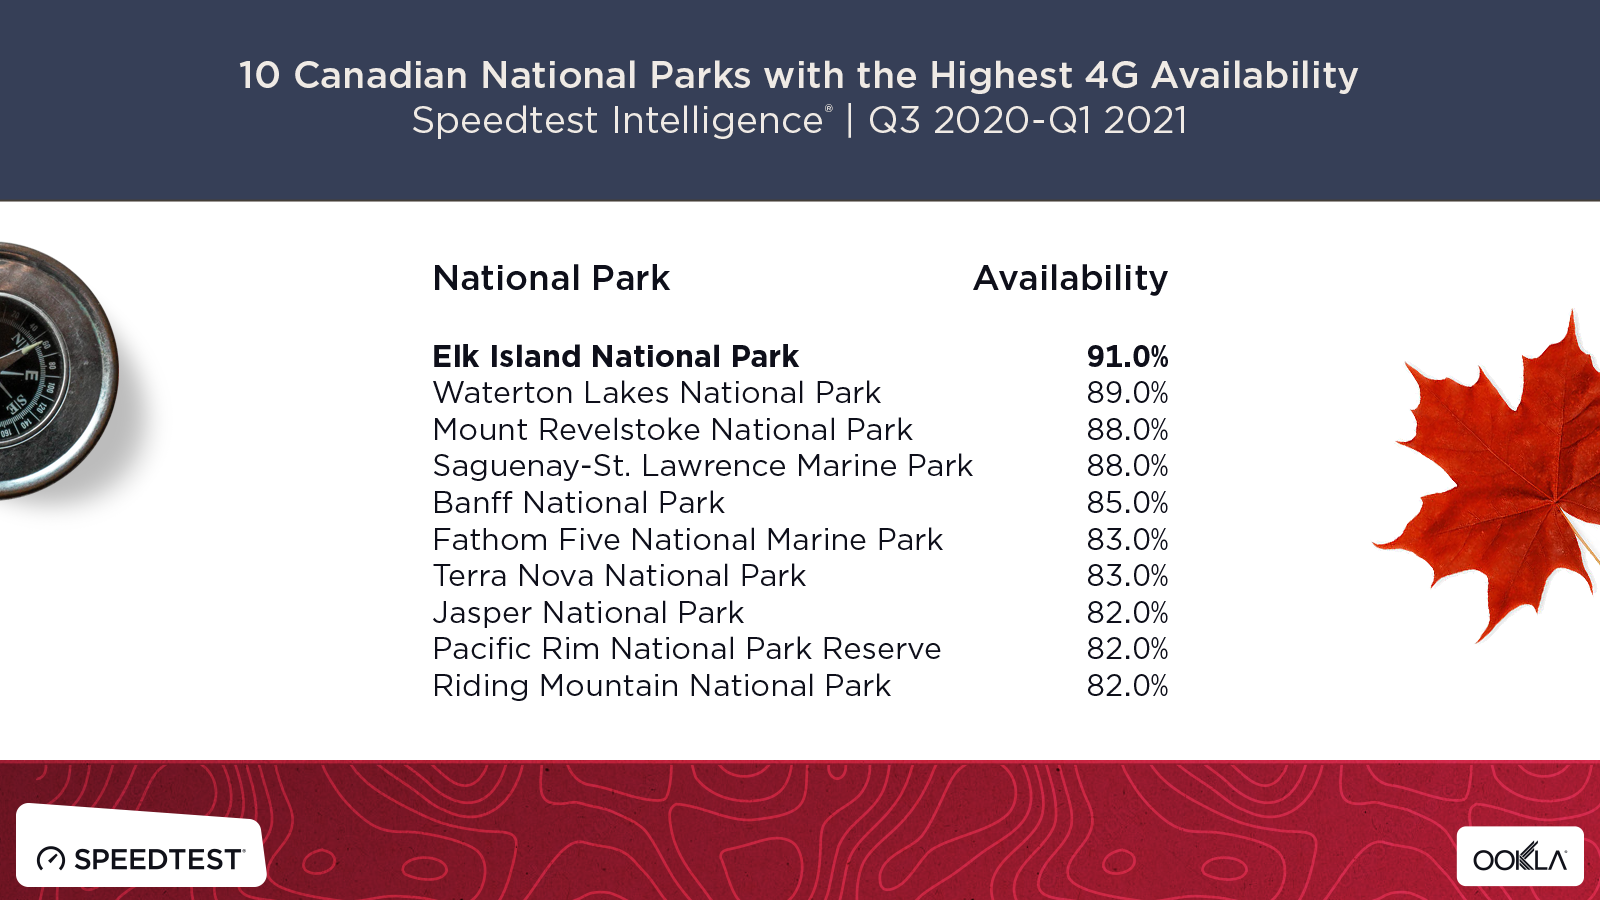
Elk Island had the highest 4G Availability among national parks in Canada, Waterton Lakes National Park was second and Mount Revelstoke National Park third. The national parks on this list had strong 4G Availability regardless of their proximity to or distance from population centers.

national-parks-tables-9

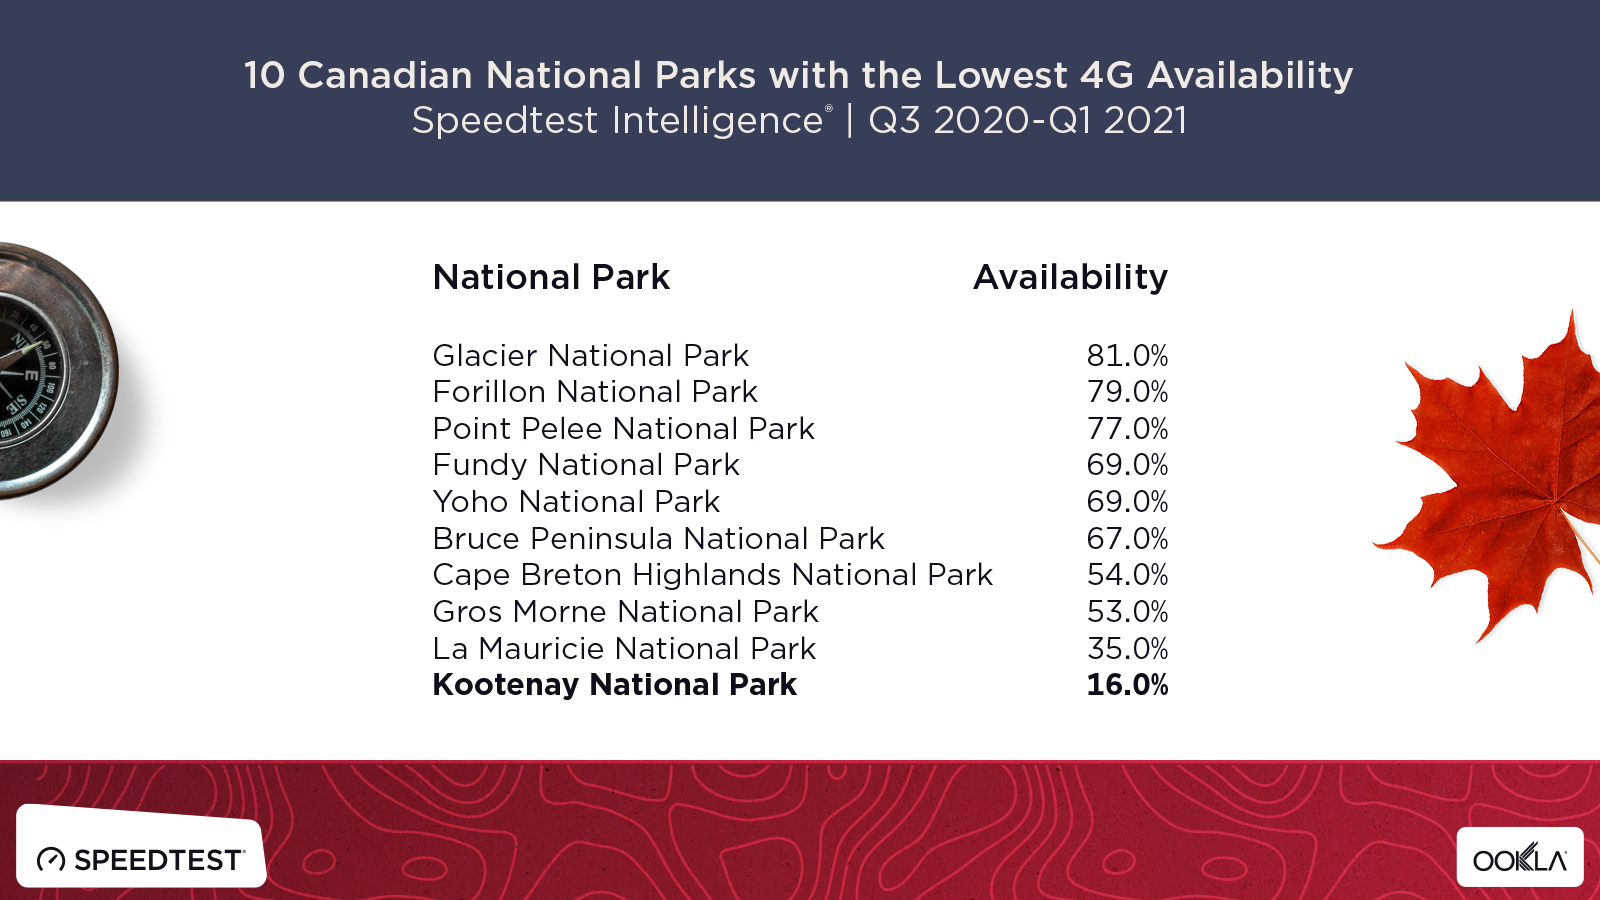
Kootenay National Park had the lowest 4G Availability among national parks in Canada. La Mauricie was second and Gros Morne third. It’s worth noting that the Canadian National Parks on this list had, for the most part, much higher 4G Availability than the U.S. National Parks with the lowest 4G Availability.

Mobile service not guaranteed

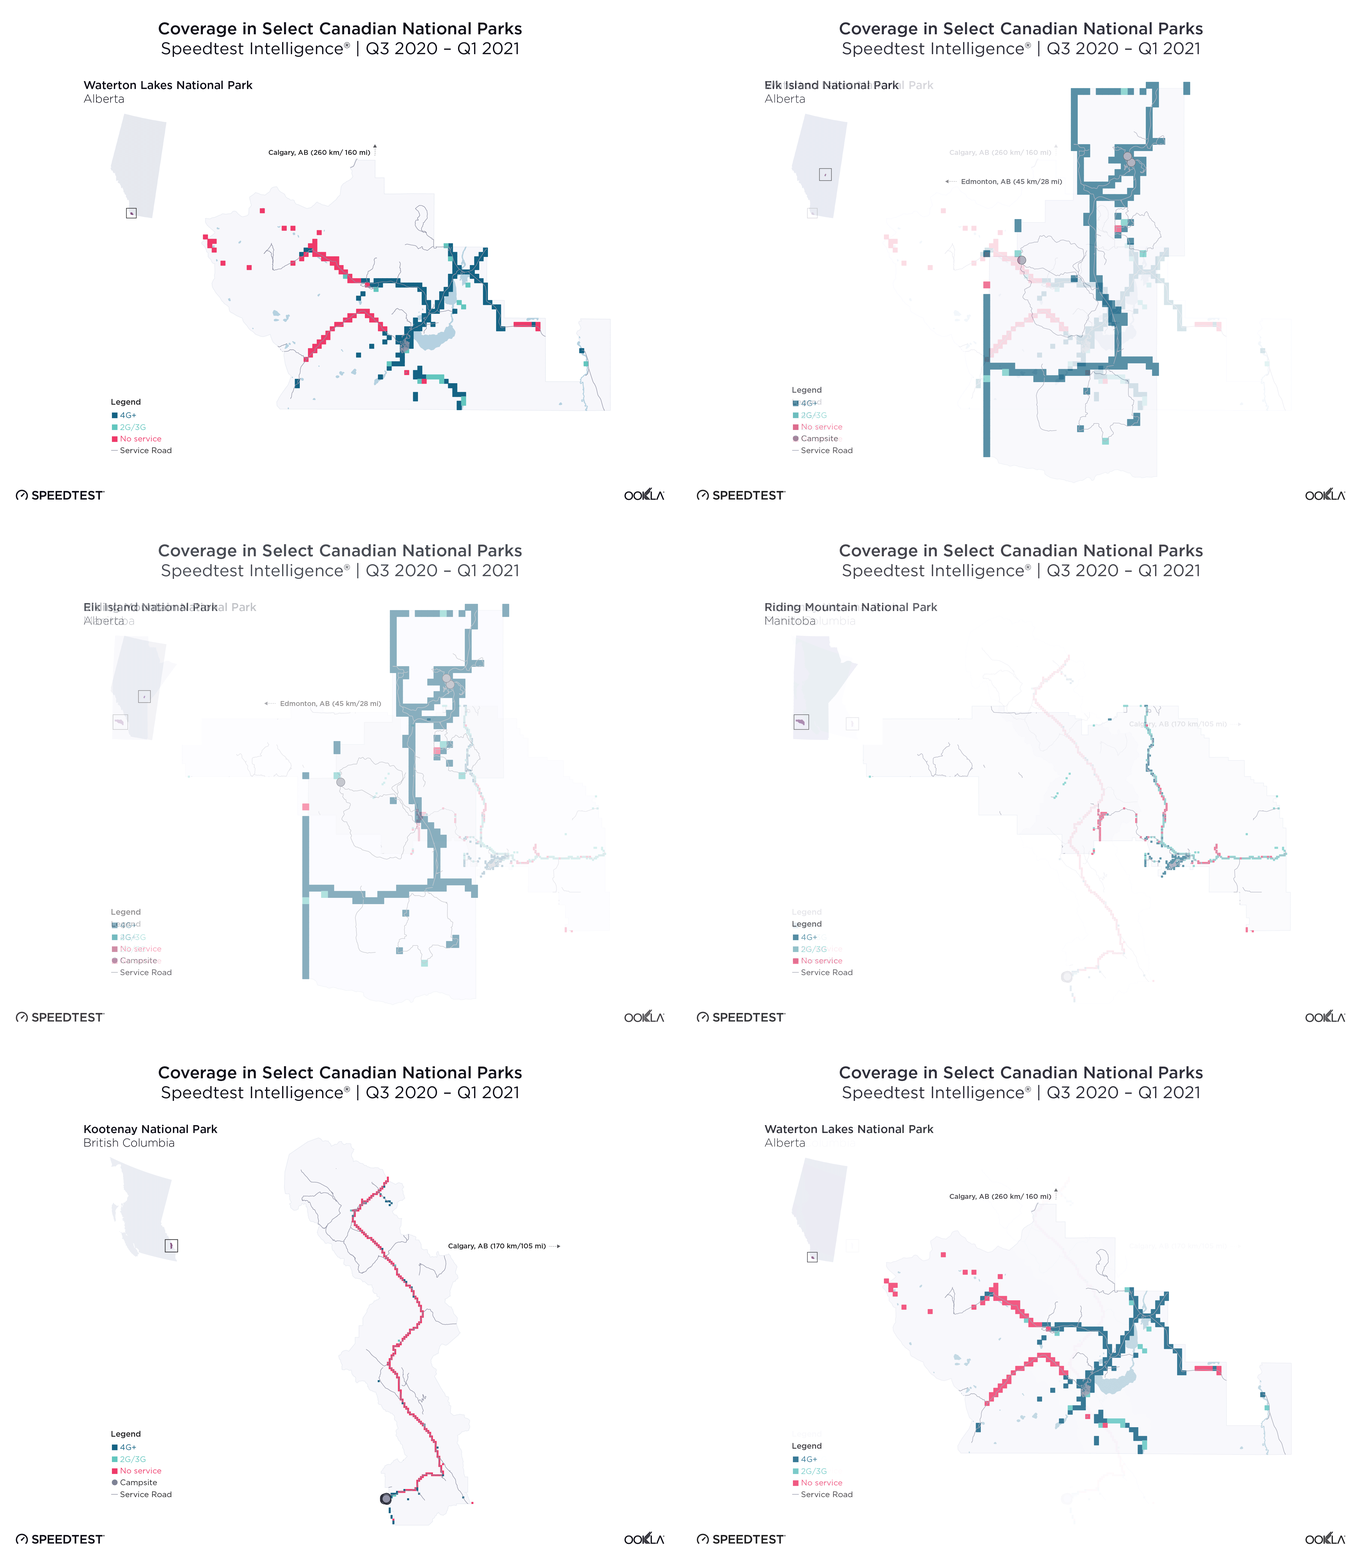
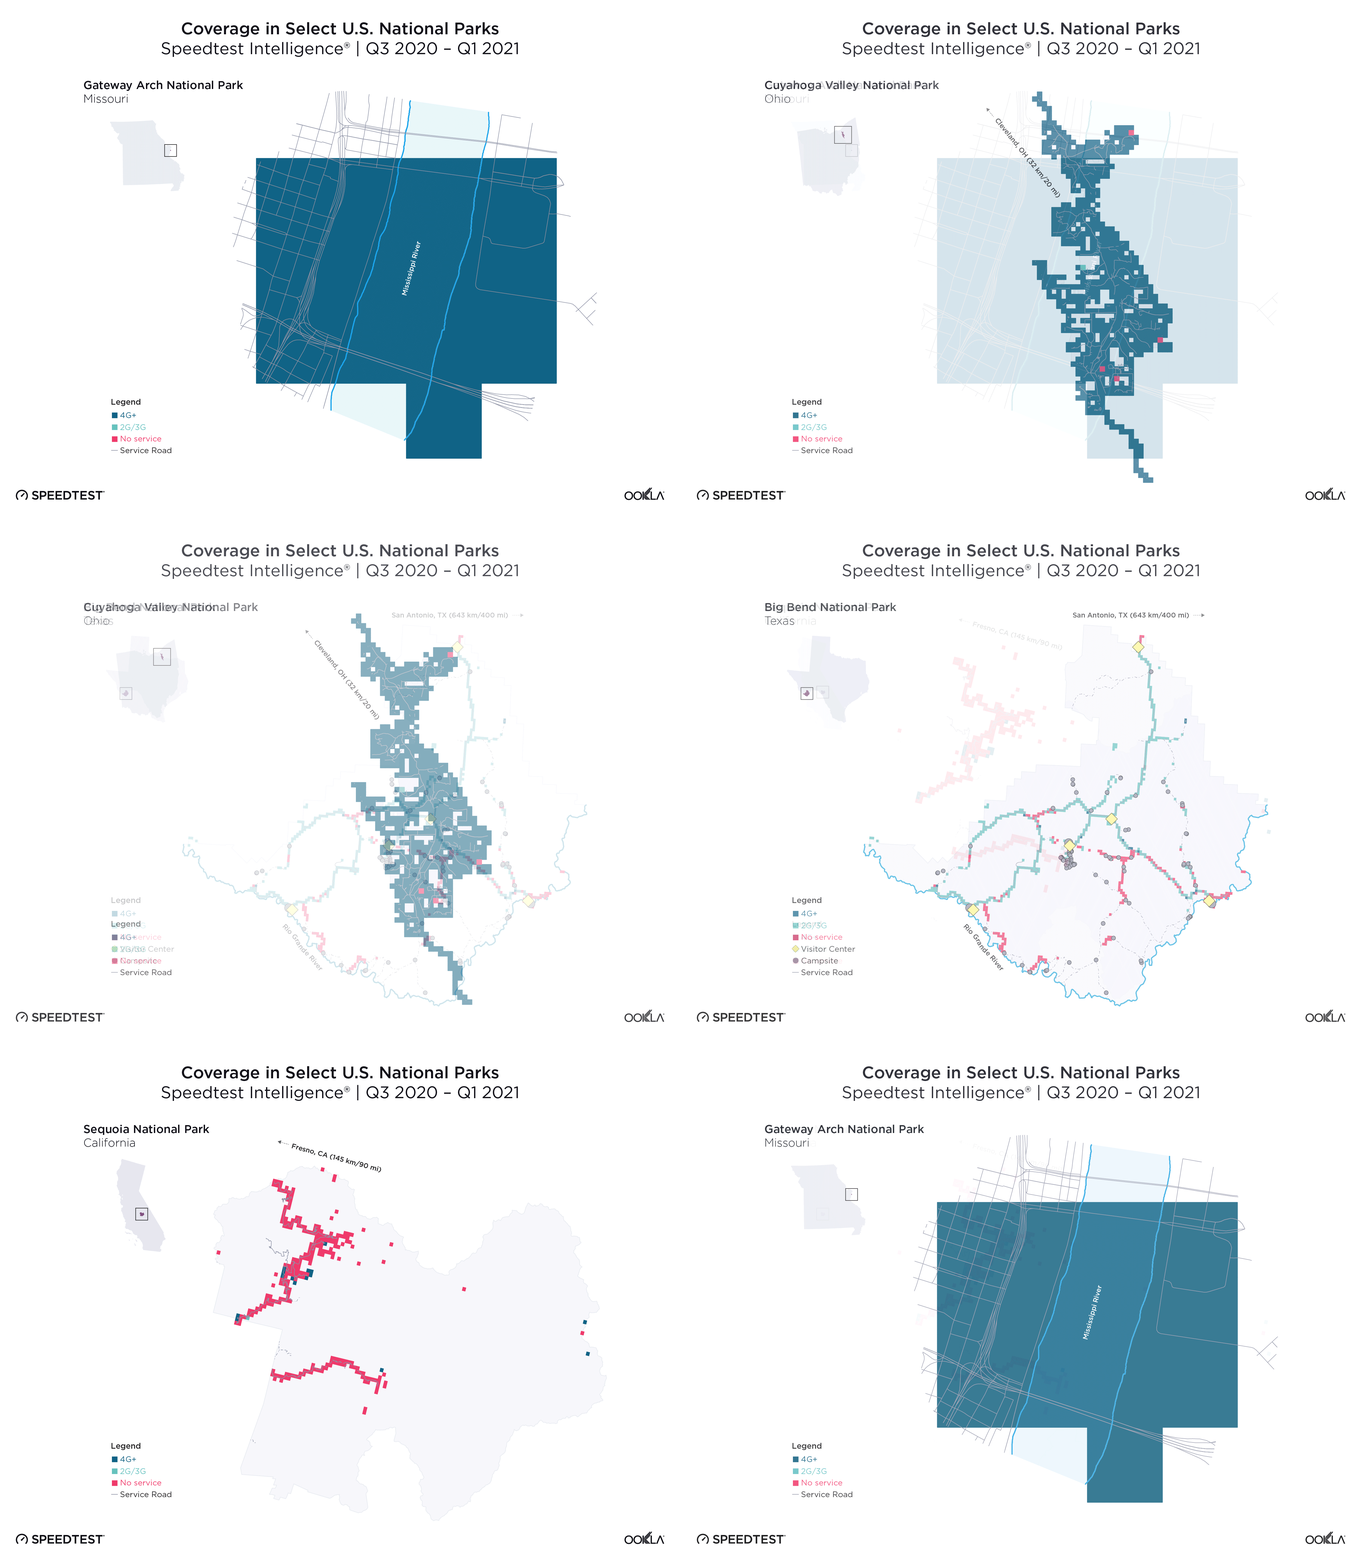
We’ve mentioned this throughout the article, but median performance only applies where you can actually get a signal. Below, we’ve mapped the Canadian and U.S. National Parks with the fastest and slowest speeds and the highest and lowest 4G Availability from our lists above to show how varied that coverage can be.

ookla_national_parks_can_0521

Although Waterton Lakes National Park had the fastest download speed among Canadian National Parks, travelers will only find reliable 4G service in the eastern half of the park, particularly along Highway 5, the first half of Red Rock Parkway, and the road to the Waterton Valley View Point. There’s also spotty connectivity on the Crypt Lake Trail. Meanwhile, we saw a 4G signal along most of the roads in Elk Island National Park and at the southeast and southwest corners of Flyingshot Lake. Knowing where service is and is not could help Canadians exercise their right to disconnect.

It’s not surprising that Riding Mountain National Park showed the slowest download speed among Canadian National Parks as even the major roads often only have 2G or 3G service. Visitors to this park have the best chance of connecting to 4G around Clear Lake. Parks Canada warns there is no cell coverage in Kootenay National Park and Speedtest data mostly backs this up. We saw almost no service along Highway 93 along the length of the park. There were small pockets of 4G service near the Stanley Glacier and Radium Hot Springs, but visitors facing an emergency will likely need to seek out the emergency phone at Kootenay Crossing as advised by the Park.

ookla_national_parks_us_0521

In the U.S., Gateway Arch National Park and Cuyahoga Valley National Park both show service in all or most of the park. This is not surprising given that Gateway Arch covers only 91 (mostly flat) acres in St. Louis. The gaps in 4G service at Cuyahoga Valley are few given that the park covers more than 32,000 acres (for comparison, Yellowstone has 2,221,766 acres). Either park would be good destinations if you need to be connected most of the time.

Mobile service is much poorer at both Big Bend National Park and Sequoia National Park. Visitors to Big Bend should be able to connect to a 2G or 3G signal if they are along the north and western service roads while the south and eastern service roads show spotty or no service at all. Most of the major roads at Sequoia show no service at all, with only a couple of spots where 4G peeks through. If you’re traveling to either of these parks, plan on being mostly off the grid.

5G all the time or completely disconnected, we hope this data will help you get outside and enjoy nature this summer — either with your mobile lifeline or completely off the grid. If you do visit a national park in Canada or the U.S., take a Speedtest® on Android or iOS to help us provide even better information next year.

Ookla retains ownership of this article including all of the intellectual property rights, data, content graphs and analysis. This article may not be quoted, reproduced, distributed or published for any commercial purpose without prior consent. Members of the press and others using the findings in this article for non-commercial purposes are welcome to publicly share and link to report information with attribution to Ookla.

| June 6, 2022

How the University of Chicago Data Science Institute is Using Speedtest® Data

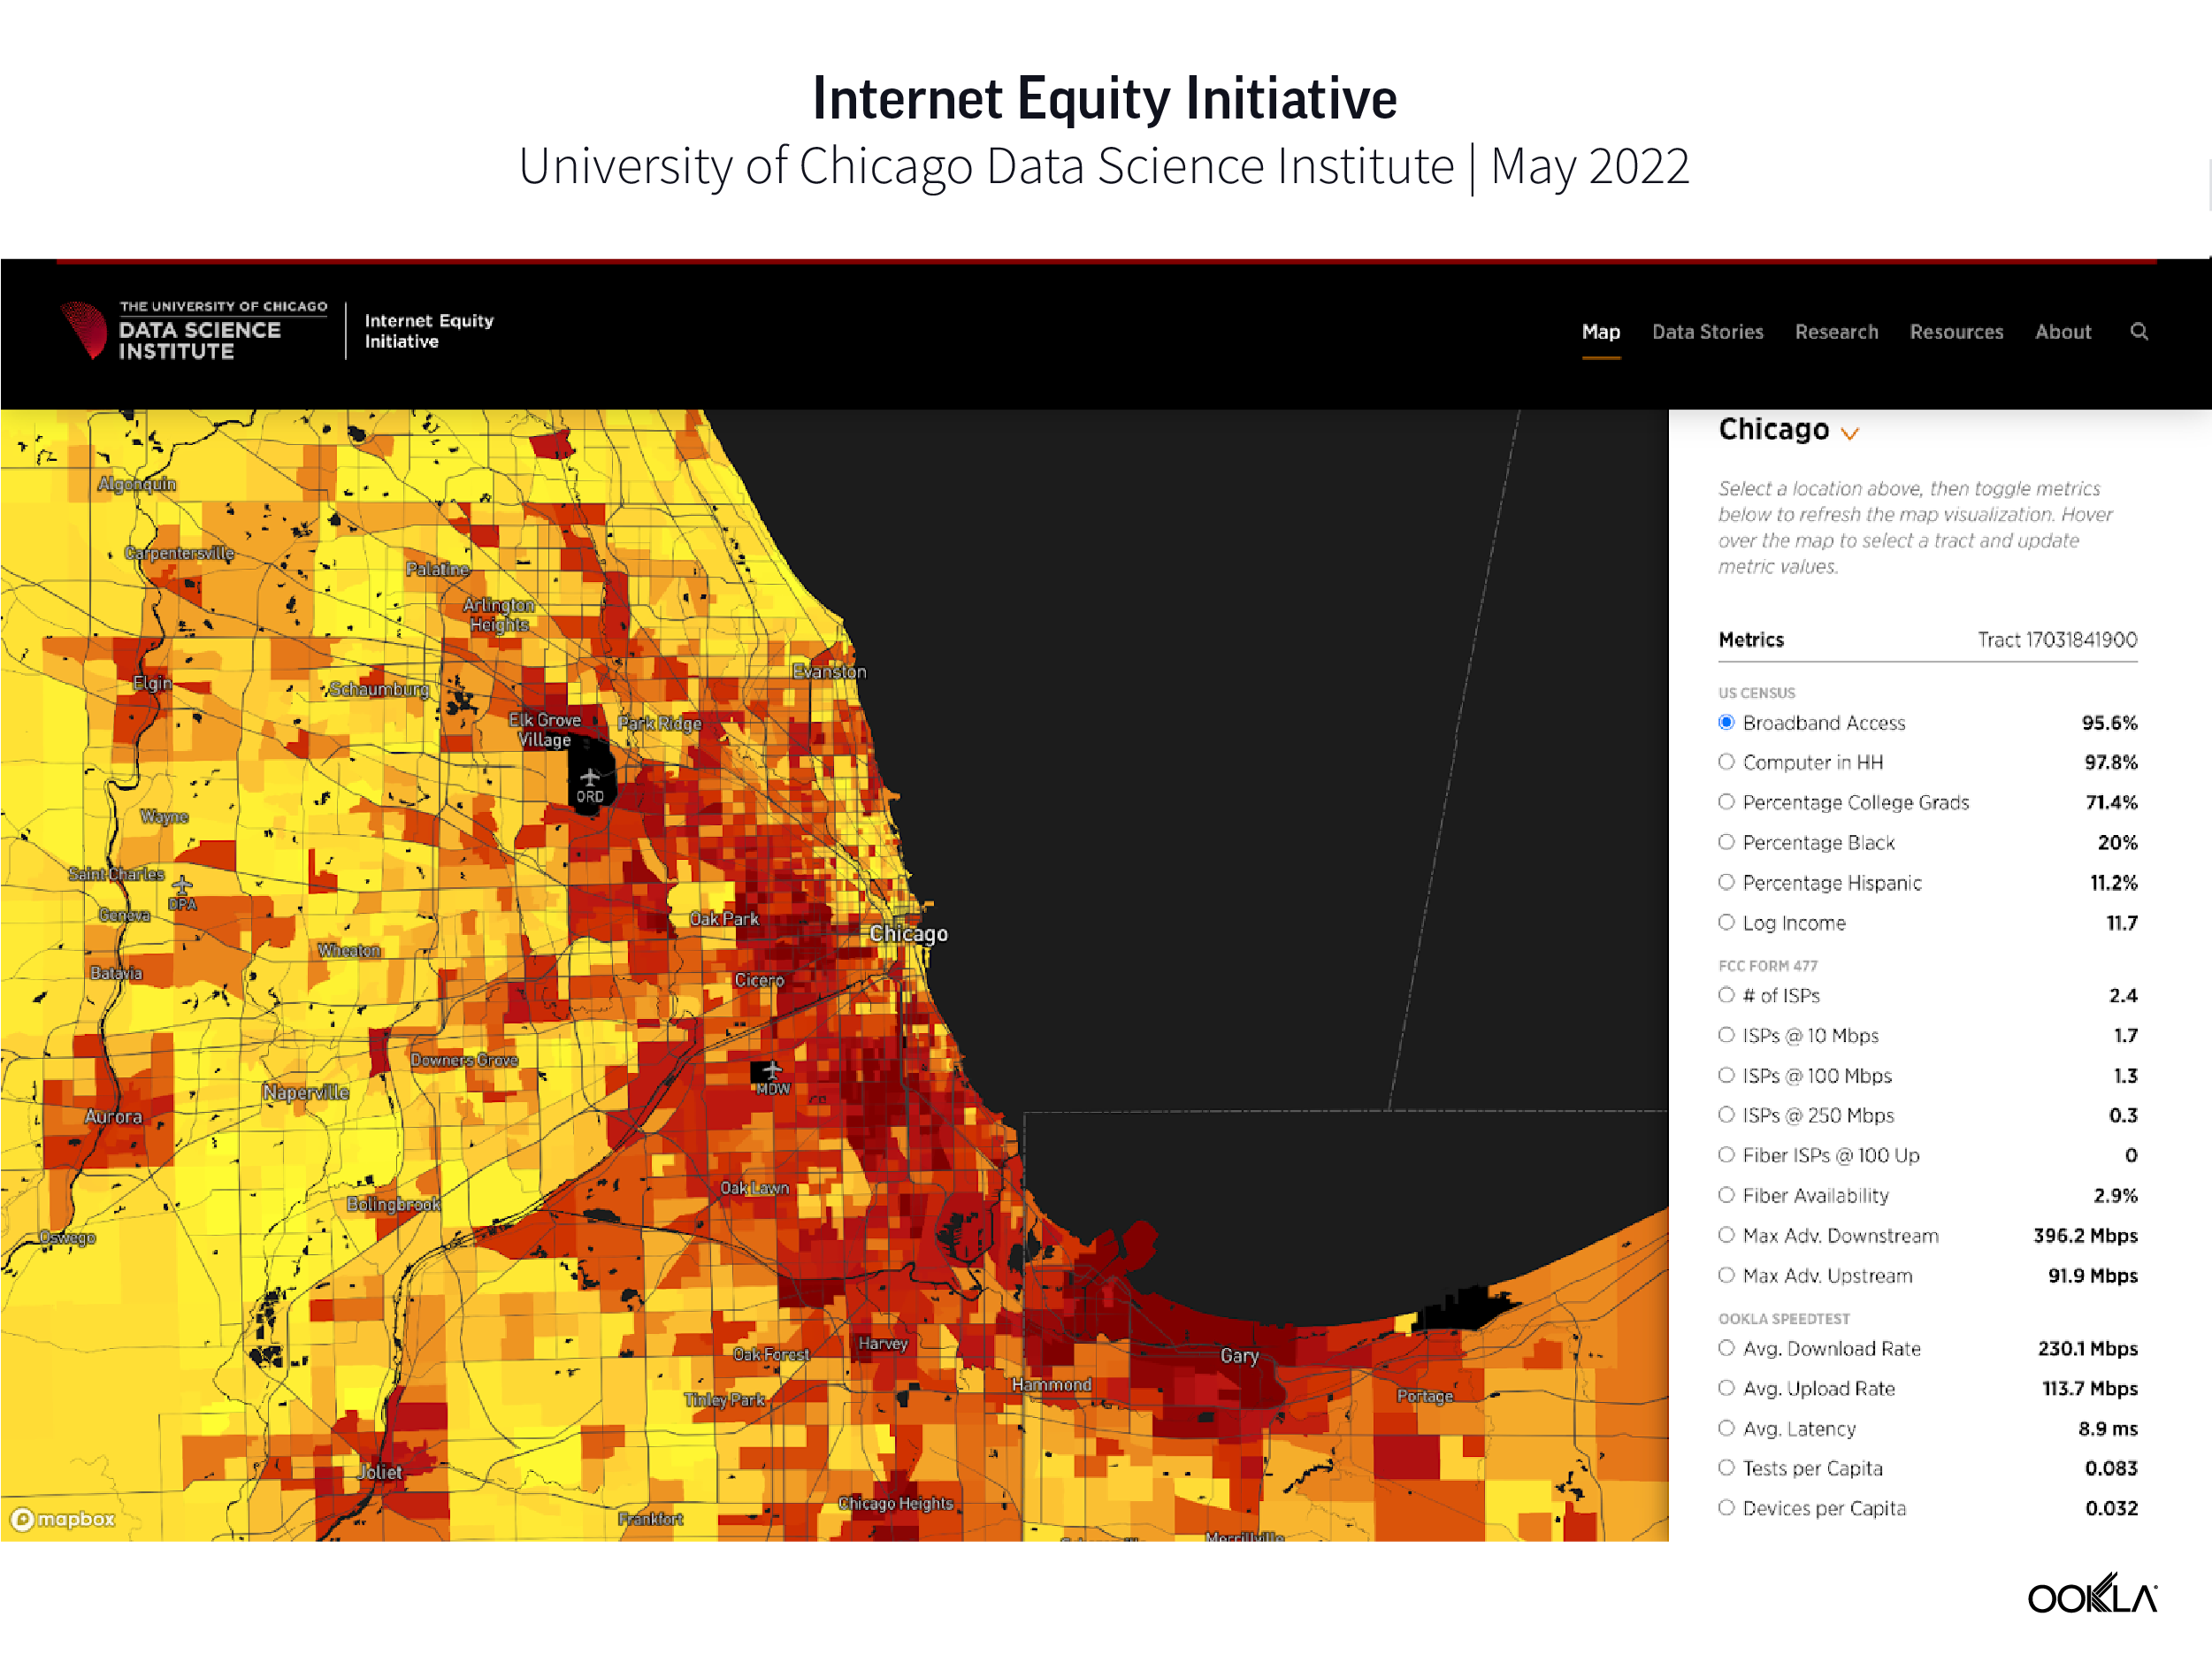
The recent Inaugural Data Science Institute Summit at the University of Chicago brought experts together to discuss topics in data science research, education, and outreach, including digital inequities across the United States. Ookla® was honored to attend and see how Speedtest® data is being used by the Data Science Institute (DSI) at the University of Chicago through our Ookla For Good™ initiative to help identify digital inequities.

Ookla data is helping to identify internet inequities

During the summit, DSI Director of Research Nick Feamster announced the launch of the new Internet Equity Initiative data portal, which uses Speedtest data along with other data sets to map out internet inequities across U.S. Census tracts. This important work shows the disparity of internet access and performance, as well as a variety of different demographic measures, including race, wealth, and education by Census tract. 

You can explore that map here and see how internet connectivity ranks in your community, as well as discovering average internet performance and latency using Speedtest open data.

The initiative has also deployed Internet measurement devices in over 100 households across Chicago, with a particular focus on measuring disparities in Internet performance and reliability between low-income and high-income neighborhoods. The initiative’s measurement devices collect a variety of performance and reliability measurements and use Speedtest to measure a connection’s download and upload speeds continuously over time. You can read more about the data they collect and download their data for free here.

More ways DSI is using Speedtest data

In addition to the Internet Equity Initiative map, researchers at DSI are using Ookla data to create data stories and research studies to understand the digital inequities many people face in the U.S. Here are a few recent publications:

  • A Tale of Two Gigs explores internet performance in two households in two different neighborhoods in close proximity to show that even among the same ISPs, internet speeds and access can vary by a wide margin. 

We’re excited about what our partnership with DSI holds for the future, because we know it exposes great work toward creating a better, faster, and more accessible internet for all. Want to learn more about Ookla For Good? Please reach out here.

Ookla retains ownership of this article including all of the intellectual property rights, data, content graphs and analysis. This article may not be quoted, reproduced, distributed or published for any commercial purpose without prior consent. Members of the press and others using the findings in this article for non-commercial purposes are welcome to publicly share and link to report information with attribution to Ookla.
| May 14, 2019

Ookla’s New 5G Map Tracks 5G Rollouts across the Globe

After years of preparation, 5G is finally rolling out in city after city around the world. Also known as “Fifth Generation” Wireless Technology, 5G is the biggest thing to come to mobile after nearly a decade of 4G LTE, offering theoretical speeds up to 5 times faster. Not every city currently benefits, however, as 5G availability depends on a variety of factors including government regulation and technological improvements by mobile operators. If you’re as eager as we are to see which cities are 5G ready, you’ll love the Ookla 5G Map™.

Introducing the Ookla 5G Map™

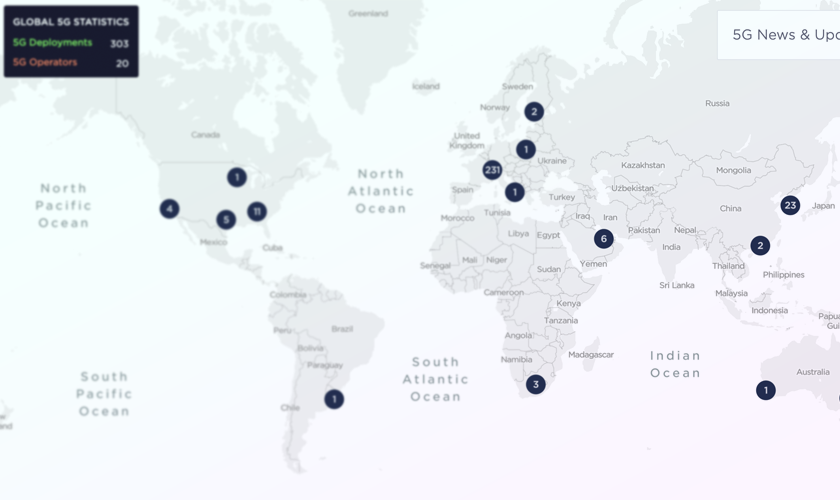
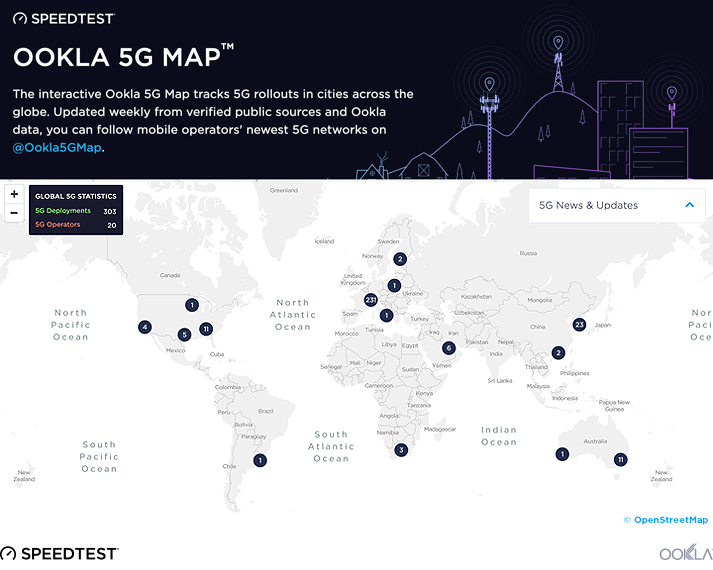
The interactive Ookla 5G Map tracks 5G rollouts in cities across the globe. We update the map weekly with the information available to us about 5G deployments as they occur.

5g-map-global-5

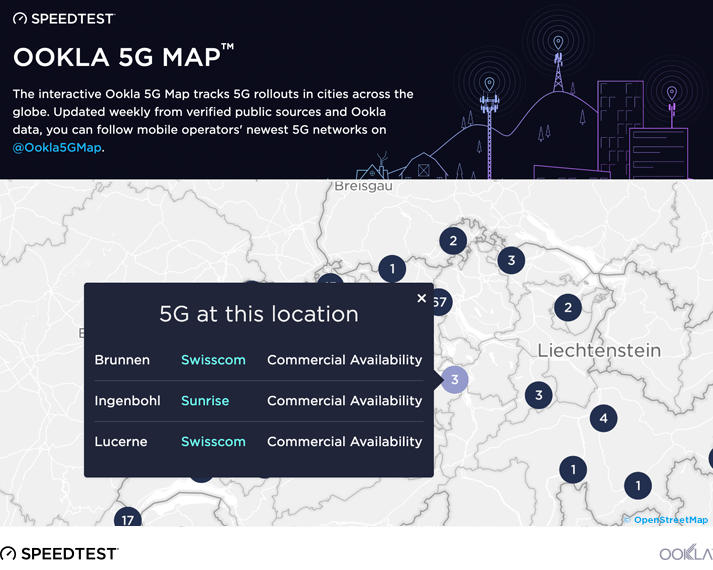
Click on an individual pin to see more detailed information including city name, a list of operators who have rolled out 5G, and the status of the 5G network in the area. The status is divided into two types of availability: limited and commercial. Limited availability is when a 5G network is present but devices are limited to select users, usually in a testing environment. Commercial availability refers to a 5G network where any consumer can purchase a device for use on this network.

5g-map-pin-3

At this point all of the deployments we’ve mapped are 5G New Radio (NR). To learn more about the types of 5G and other network intricacies, visit our comprehensive 5G guide. As different types of networks launch we’ll continue to expand this map to provide you with accurate, in-depth information.

Currently, the majority of identified deployments are based on corporate press releases and other publicly available communications. As deployments continue to become commercially available and tests taken with Speedtest use a 5G connection, identified deployments will also be based on Ookla data.

Get regular updates on the progress of 5G by following @Ookla5GMap on Twitter where we will share network rollouts as they are added. You can also find this Twitter feed directly to the right of the interactive 5G map where the ten most recent updates will be displayed.

Where we’ve seen 5G so far

5g-pull-quote

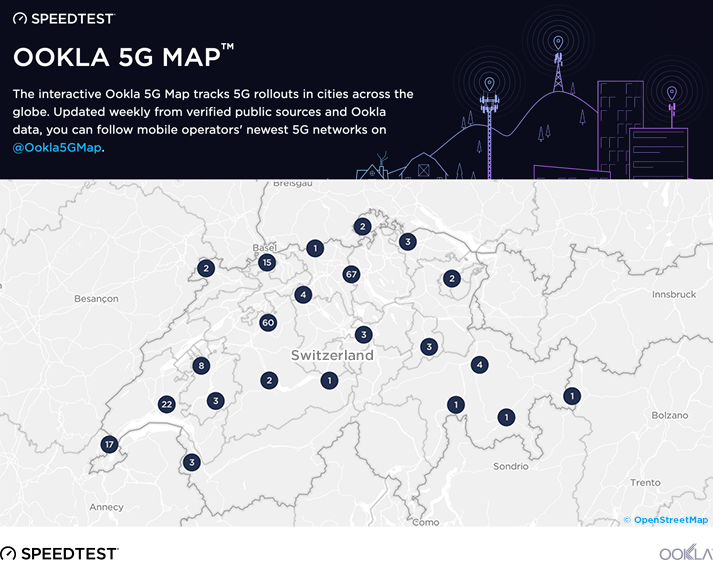
At time of launch, we’ve identified 20 operators that have deployed 5G networks in 294 locations across the globe. As certain locations benefit from multiple rollouts, the total number of deployments comes to 303. Swiss operators Swisscom and Sunrise are leading the 5G charge by providing 5G network accessibility in a combined total of 217 cities, each with commercial availability. Across the ocean, 21 cities in the United States have 5G availability. All but two of these rollouts being launched by AT&T with limited availability. Verizon launched their 5G network with commercial availability in two Midwest cities: Chicago and Minneapolis.

Switzerland-Map-3

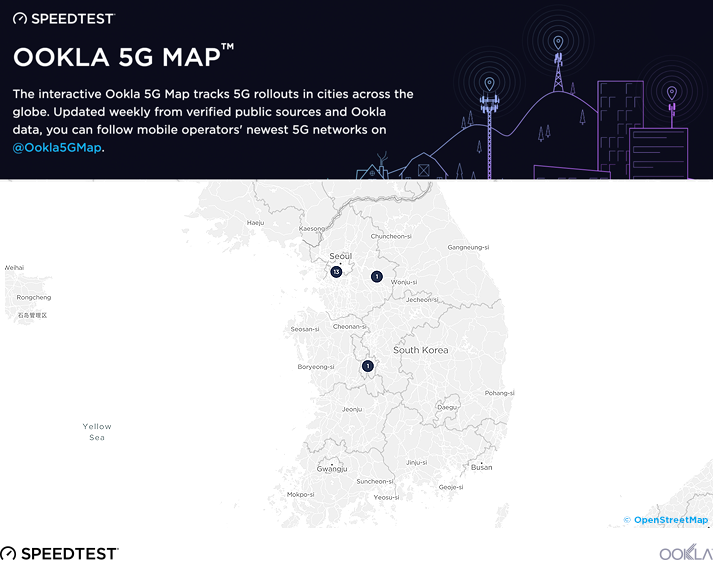
In South Korea we are tracking 16 cities with limited availability and two with commercial availability for 18 total 5G rollouts. The country’s capital city of Seoul benefits from 5G accessibility served by all three major operators: SK Telecom, LG Uplus and KT Telecom.

south-korea-map-3

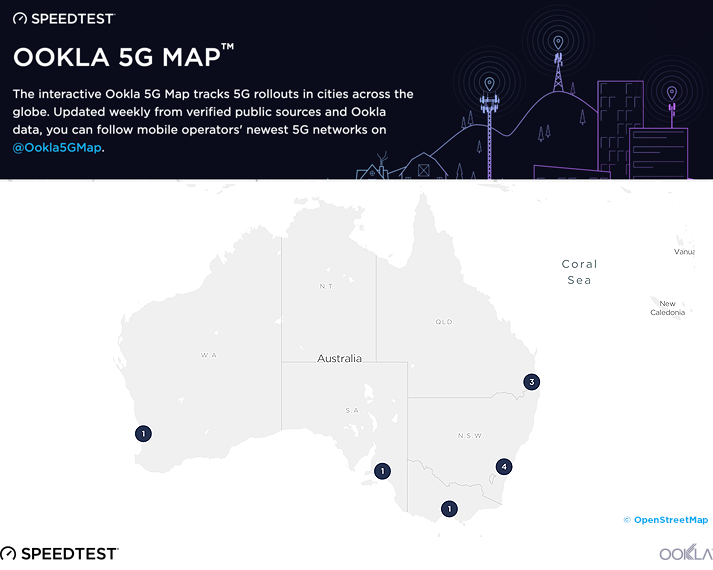
Telstra and Optus in Australia operate limited availability 5G networks in 10 cities, many of these in the more populated coastal regions. We’re also tracking 5G rollouts in a number of European countries (Estonia, Finland, Spain and Italy) as well as in Qatar, South Africa and United Arab Emirates.

australia-map-1

If you’re a consumer who is already on 5G, share your Speedtest results by tweeting to @Speedtest.

If you are an operator planning to release your 5G network, we welcome your feedback. Tweet details of your release @Ookla5GMap or e-mail press@ookla.com and we will add your location to the map when it’s live. In the meantime, our researchers will be hard at work tracking global 5G announcements as they happen.

Editor’s note: This article was updated on May 14, 2019 to clarify the number of deployments in Switzerland and Australia versus the number of cities served. We’ve also since updated the map to include a new “Pre-Release” status. Check the Ookla 5G Map for the latest information.

Ookla retains ownership of this article including all of the intellectual property rights, data, content graphs and analysis. This article may not be quoted, reproduced, distributed or published for any commercial purpose without prior consent. Members of the press and others using the findings in this article for non-commercial purposes are welcome to publicly share and link to report information with attribution to Ookla.
| June 24, 2020

Ookla Partners with House Majority Whip Clyburn on Broadband Maps for South Carolina

Yesterday, United States House Majority Whip James E. Clyburn showcased South Carolina’s innovative and entrepreneurial approach to broadband mapping. This new approach utilizes advanced data science to analyze FCC Form 477 and Ookla® Speedtest® data together to produce exceptionally accurate maps that show the best available broadband technology in a given area, as well as which areas are in need of better service. Once rendered, these maps – representing all 46 counties in South Carolina – are made available for free to all who are interested via the nation’s first broadband map store.

Congressman Clyburn was joined by Jim Stritzinger, President, CEO & Founder, Revolution D, Inc.; Doug Suttles, CEO, GM and Co-Founder, Ookla; Molly Spearman, South Carolina Superintendent of Education; Kathy Schwarting, CEO, Palmetto Care Connections and Jason Dandridge, CEO, Palmetto Rural Cooperative on the announcement via conference call. They discussed challenges in education, healthcare and economic development due to the digital divide in South Carolina, while also providing an introduction to broadband maps and methodologies used by telephone companies, ISPs and localities to better compete for broadband infrastructure funding. Watch the video.

Ookla is passionate about improving internet access and performance

Ookla is aware of the challenges and disparities many face in accessing fast and reliable internet. We’ve been listening and learning as we work to find ways to use our data to spotlight disparities and opportunities for improvement.

We’ve learned that countries need funding and legislation at the federal level to improve data collection and broadband mapping efforts. This information helps governments more accurately understand where people are falling on the wrong side of the digital divide. It’s also important to work with and learn from leaders and providers within local and regional communities who understand the specific challenges and opportunities in a given area.

How this project came about

We were thrilled to be invited by Congressman Clyburn’s team to join an early 2019 brainstorming session on how to close South Carolina’s broadband divide. As the brainstorming session began, Congressman Clyburn and his team challenged us to develop a new approach to mapping that would use real-world network performance data, rather than relying solely on self-reported network speeds advertised by internet service providers. Further, he asked us to get it done in 18 months. We were more than happy to oblige.

During that initial call, we were introduced to Jim Stritzinger, the person leading broadband efforts in South Carolina. As the Founder and CEO of Revolution D, Stritzinger proposed a new approach to broadband mapping based on his background as an electrical engineer with extensive experience in software development, artificial intelligence (AI) and geographic information systems (GIS). This novel approach determined the best deployed technology in each census block (fiber, cable, DSL etc.) and then built a model which could calculate, with a high degree of confidence, the likely available download and upload speeds. Ookla’s role was to help ensure the integrity of the model by comparing calculated values with actual consumers’ network performance results as seen in Ookla’s Speedtest Intelligence®.

This working hypothesis got everyone excited, especially Congressman Clyburn. He clearly understood the national significance of overcoming the potential discrepancies between what providers report in the FCC Form 477 and was elated that we could develop a national prototype to validate network information in his home state.

Congressman Clyburn’s team, Revolution D and Ookla kicked off the project in the summer of 2019. With funding from the S.C. Hospital Association, the S.C. Office of Rural Health and Palmetto Care Connections, Revolution D spent several months developing the model together with a preliminary set of GIS maps. Separately, the Ookla data science team packaged up nearly 7 million data records for the first iteration. Ookla delivered this first dataset in mid-August and the broader team delivered the first comprehensive set of S.C. broadband maps – all 46 counties – on August 31, 2019.

This project has been a huge success, and Congressman Clyburn frequently proclaims “South Carolina has the best broadband maps in the United States!”

Announcing Ookla for Good™

Our work within South Carolina quickly became part of an existing internal initiative to further explore how we could help Ookla achieve its mission: “To help make the internet better, faster and more accessible for everyone.” Through conversations with city leaders, educators, healthcare providers and more, we quickly came to a realization. Our wealth of data, insights and expertise would also be of value to NGOs, research institutions, humanitarian nonprofits and local governments looking to improve lives through better and more reliable internet access.

This realization and the desire to help more led to the development of our new initiative, Ookla for Good, to formalize a program around this and other similar initiatives we’ve been working on.

At its core, Ookla for Good is about the people at Ookla wanting to help others by making the internet better, faster and more accessible to all — at a more personal, grassroots and community engagement level. Why? Because in today’s connected world, reliable internet access is vital for many aspects of life: education, healthcare, economics, safety, just to name a few. The combination of our vast trove of data from Speedtest Intelligence and the industry-leading knowledge of our team gives us the tools to help providers improve internet speeds and connectivity all over the world. It’s also important to us to listen and learn from those on the ground in state capitals, nonprofits and at universities working hard to close the digital divide. These conversations allow us to better understand how we can help, and then follow up that understanding with actionable support, whether that be through the sharing of data, industry knowledge, skills, mentoring the next generation or something else we have yet to discover.

So far, we’ve learned that by partnering up with those who passionately want to make a difference at a grassroots level, we can help them do great things.

Other in-flight initiatives

Over the past year, we’ve licensed certain datasets to assist academic institutions, NGOs and local governments that are focused on understanding where better internet quality provides a higher quality of life. These organizations include:

  • World Bank
  • Fundacio puntCAT
  • Onja
  • Brookings Institution
  • Dorset Council
  • State of South Carolina
  • And a number of universities both in the U.S. and abroad:
    • Massachusetts Institute of Technology
    • Nara Institute of Science and Technology (NAIST)
    • National Institute of Design Bengaluru
    • New York University
    • Polytechnic University of Madrid (UPM)
    • University of Illinois Chicago
    • University of North Carolina Wilmington
    • University of Tennessee Chattanooga
    • University of Texas Austin

We’ve also become actively involved within industry groups, working together to help educate, share insights and help define policies and global telecommunications standards. These include partnering with GSMA Intelligence as its exclusive network performance data provider and membership in the ITU-T.

Are you an academic exploring how internet speeds may affect economic opportunities within a state? Or a non-profit organization needing to know where high-quality internet exists to set up classrooms for your online learning? Or a local government needing to prove where internet access does not meet minimum standards in order to apply for grants to improve infrastructure for your citizens? If you are, we’d love to hear from you and explore how we may be able to help.

Ookla retains ownership of this article including all of the intellectual property rights, data, content graphs and analysis. This article may not be quoted, reproduced, distributed or published for any commercial purpose without prior consent. Members of the press and others using the findings in this article for non-commercial purposes are welcome to publicly share and link to report information with attribution to Ookla.
| December 13, 2022

Ookla's Take on Telco Trends in 2023

2023 is shaping up to be a challenging year. The ongoing war, energy crisis, rising interest rates, and rampant inflation have created a perfect storm for the telco industry. That said, there are plenty of exciting developments and changes on the horizon. As we approach 2023, we took stock of what happened during 2022 to predict what might be in store for next year.

5G roll outs continue but speed gives way to QoE 

According to the Ookla® 5G Map, there were 127,509 5G deployments in 128 countries as of November 30, 2022, compared to 85,602 in 112 countries the year prior. 5G download speeds stabilized as more consumers adopted 5G, with a median global 5G download speed of 168.27 Mbps in Q3 2022 compared to 166.13 Mbps in Q3 2021. However, some operators believe they may have over-invested in their early emphasis on speed; they now need to monetize their investments through differentiation. One of our clients has famously said: “We are aiming for 1st world speeds and using 3rd world ARPU.” Indeed, in 2023 we will see a big focus on the Quality of Experience (QoE) and initiatives to increase ARPU (average revenue per user) and consumer stickiness by adding entertainment services such as television and music streaming or cloud gaming platforms. 

FWA will continue to be a poster child for 5G

Fixed Wireless Access (FWA) solutions received renewed interest in 2022 as a key use case for 5G networks and as a way to connect rural and underserved areas. In fact, one-third of service providers are offering 5G FWA, according to Ericsson Mobility Report. Fixed Wireless Service solutions have been a success story in the U.S., where T-Mobile has added 1.6 million new subscribers so far this year. T-Mobile now has 2.1 million total FWA customers, with Verizon totaling 620,000 consumer FWA clients and 440,000 business customers. Moreover, emerging markets such as Mexico, South Africa, Nigeria, and the Philippines are seeing an uptick in FWA adoption, and there is a growing interest in India too. Jio announced that it will launch Jio AirFibre, a plug-and-play device connected to Jio’s 5G network that will act as a hotspot. While the exact launch date is still unknown, the operator revealed that it targets 100 million households with its 5G FWA offering. With the demand for fast networks growing, FWA offers an excellent opportunity to cover areas that are too costly to lay fiber and is an alternative to fixed networks. We expect further adoption of FWA on the back of CPE devices getting cheaper, as well as more schemes aimed at connecting the unconnected. 

Satellite coming to your home and phone 

Globally, satellite already plays an important role in providing network backhaul for 2G, 3G, and 4G technologies in rural and remote areas while also connecting a range of enterprise verticals such as logistics. Thanks to the emergence of Low Earth Orbit (LEO) satellite technology can provide access to areas outside 5G coverage. As our recent analysis shows, LEO satellites benefit from lower latency than Medium Earth Orbit (MEO). Therefore, they will be well-suited to offer backhaul and provide direct connectivity. As the 5G standard is adopted, new markets will open up for satellite operators, including IoT, private 5G, and cellular backhaul for densification to enable more cell sites and edge devices. At the same time, start-ups such as Lynk were the first to demonstrate the power of the direct-to-satellite communication market. The recent Starlink/T-Mobile and Globalstar/Apple partnerships point to this market seeing further growth. We will see more players entering the market in 2023 as providers attempt to bring connectivity to all.

The quest for Net Zero becomes more urgent 

Focus on energy efficiency isn’t new; we have already seen this as a major trend for 2022. Across the broader tech industry, vendors look at the option of dialing down performance to help save energy costs – Microsoft’s survey of X-Box users asks how they feel about features that would reduce frame rates and resolution, thus reducing power consumption and saving money. Unsurprisingly, cost-cutting and optimizing operations are top-of-mind for telcos in 2023 as energy prices and broader inflation remains high. We are already seeing operators look to sustainable solutions, such as wind and solar farmers, to supply sites with green energy instead of commercial electricity, partially to reduce costs. Network planning and optimization teams also play a critical role. Using the right site locations, configuration, and optimum coverage/quality service for consumers reduces interference, resulting in less waste of power resources and fewer emissions. Some other ways telcos will reduce energy usage will be through hybrid power implementations instead of relying on petrol/diesel for off-grid sites. They will also implement the latest software features that include smart sleep mode at times of no/low traffic demand. Energy efficiency will be a key focus area in 2023, with vendors lending a hand to telcos to help them reduce energy consumption. 

Convergence helps to capture shrinking consumers’ wallets

Raising interest rates, inflation, and the contraction of disposable income will force many consumers to re-evaluate their telecom spending. Operators will be forced to reprice tariffs further, and consumers will shop around for better deals, which in turn will lead to churn. We have already seen an increase in the adoption of fixed-mobile bundles across Europe during the economic downturn in 2008 when several European operators introduced convergent bundles, offering discounts on the discrete underlying services. History could repeat itself in 2023. In the U.S. we already see moves by operators to offer converged services as we have stipulated in our recent article but also elsewhere as consumers look for discounts across fixed and mobile. 

Metaverse work will continue behind the scenes

Metaverse will not become mainstream next year, but investments will continue despite continued financial woes for the tech industry. The year ahead will primarily focus on standardization. Ookla plays an active role in defining the network requirements as part of the Metaverse Standards Forum (MSF). We expect new devices to launch in 2023 and beyond at a lower cost than Meta’s Quest Pro, priced at $1,499. Apple is not participating in the MSF as it follows its usual walled-garden approach. There is talk of an Apple device that will give the metaverse device ecosystem a boost too. But for the metaverse to become real, it will have to be more than just about devices. Metaverse is about creating a virtual world, with Meta, Microsoft, and Nvidia all working on creating them. 2023 will see more telco players jumping on the metaverse bandwagon and including it as part of their strategic roadmap.

Operators’ M&A activities will heat up

In Asia and Europe, companies facing challenging economic times will try to merge, with regulators having the last word on whether they can. M&A activity heated up across the Asia Pacific region recently, with deals on the table across several countries such as Thailand, Malaysia, Taiwan, and Indonesia but potentially also in Japan and Hong Kong. Mergers and acquisitions should continue in Europe as well, as we discussed in our recent article, with recent examples including the agreed joint venture between MasMovil and Orange in Spain, Iliad’s recent bid for Vodafone Italy, and Vodafone and Three UK talks to merge. In Asia, Telenor and Axiata were allowed to merge their Malaysian operations, while Thailand still awaits regulatory approval. European operators will closely follow whether Orange and MasMovil will consolidate in Spain. If they succeed, others in Europe will follow in 2023. 

5G SA will power enterprises 

The majority of 5G networks thus far are 5G Non-Standalone (NSA), which still uses 4G core to support enhanced mobile broadband and FWA use cases, while also providing significant capacity increases. Evolving to 5G Standalone (SA) brings additional service differentiation possibilities such as URLLC, network slicing, and edge computing. In the future, 5G SA will also deliver time-sensitive networking for high-precision devices.  When RootMetrics® measured the performance of T-Mobile’s 5G SA vs NSA in Las Vegas, it found that T-Mobile’s 5G SA network delivered speeds over twice as fast as its speed on NSA 5G. According to GSMA Intelligence as of Q3 2022, 31 operators had launched 5G SA networks, with a further 11 expected by the end of 2022. In total, 123 operators from 55 countries have launched or demonstrated intent to launch 5G SA networks. Recently, Singapore covered 95% of the country with 5G SA, with operators focusing on developing innovative services for enterprises supported by encouraging regulation from the government and the regulator. 

Private networks growth will continue

Private mobile networks play an important role in broader digital transformation and will only continue to gain traction. As enterprise digitization continues to gain momentum, countries are looking to private networks to address Industry 4.0 objectives. Dedicated spectrum for private mobile networks has already been allocated to industry players in France, the U.S., Germany, Japan, and the UK. We have commented on how the private networks landscape is developing in Europe and made a case for private networks in India. According to GSA, at the end of June 2022, 889 customers were deploying private mobile networks across 70 countries. Increasingly, these networks are using 5G and 5G SA. However, the 5G device ecosystem has yet to mature, so most of these networks are still 4.9G. The availability of industrial-grade devices depends on the standardization of 3GPP Releases. The industrial chipsets, based on Release 16, are scheduled to come to market in 2023. As a result, mainstream adoption of 5G solutions will likely happen later in the year.

Furthermore, once available, Release 16 5G industrial features (reliability, low latency, etc.) will need to be tested in partnership with industrial OEMs to help to convince them of the enhanced scope of capabilities of 5G for industrial use cases. As such, it will be some time beyond 2023 when 5G private networks will start to scale. 

Ookla will be at MWC Barcelona 2023 – visit us at our Stand 2I28 in Hall 2, to talk with us about telco trends. In the meantime, if you’re interested to find out more about Ookla Speedtest Intelligence and its wealth of fixed and mobile consumer-initiated data and insights, please get in touch.

Ookla retains ownership of this article including all of the intellectual property rights, data, content graphs and analysis. This article may not be quoted, reproduced, distributed or published for any commercial purpose without prior consent. Members of the press and others using the findings in this article for non-commercial purposes are welcome to publicly share and link to report information with attribution to Ookla.
| October 3, 2017

Spooky Speeds: Investigating Mobile Performance at Some of the Eeriest Places on Earth

Have you ever wondered if ghosts use the internet too? While we can’t quite picture Casper using a cellphone, we can say that there are some odd things happening with cellular internet speeds at some of the spookiest places we’ve ever heard of. For the month of October, we’ll be counting down the haunted houses, mysterious mansions and peculiar prisons to find the fastest Speedtest results on mobile and reveal where specters might be interfering with the spectrum.

Look for new data on Spooky Speeds posted right here every Tuesday, Wednesday and Thursday until Halloween.

13. Calcasieu Parish Courthouse

Download 2.74 Mbps, Upload 0.34 Mbps

Calcasieu Parish Courthouse

Is the ghost of Toni Jo Henry, the first woman executed in the state of Louisiana, interfering with mobile signals at this Louisiana courthouse? Toni is already notorious for causing flickering lights and other electrical blips at this, the site of her execution for killing Joseph Calloway during a carjacking on the way to spring her beloved from jail. Three trials and one trip to the electric chair later, it seems cell signals might be her next target as mobile download speeds at the courthouse are 85% slower than those in the surrounding town.

12. Château de Châteaubriant

Download 3.82 Mbps, Upload 0.24 Mbps

Château de Châteaubriant

Poisoned or bled to death? We may never know what truly happened to Françoise de Foix, mistress of King Francis I, after her husband discovered her betrayal. What we do know is that her ghost reportedly walks the halls of this 11th century French castle every October 16, the anniversary of her death. We also know that mobile downloads at the castle are 87% slower than in the rest of the small village of Châteaubriant. Spectral interference or stone walls? You decide…

11. Winchester Mystery House

Download 5.54 Mbps, Upload 2.47 Mbps

Winchester Mystery House

Was the widow Winchester duped into building this labyrinthine house by a Boston psychic? Perhaps. Or perhaps a guilty conscience led her to want to create a home for the spirits of those killed by rifles built by her husband. But the stairways aren’t the only things that lead nowhere in this famous California mansion, the mobile download speeds are an abysmal 78% slower than those in San Jose as a whole. The lesson? Don’t count on calling for outside help if you’re trapped in the Witch’s Cap.

10. Alcatraz Island

Download 6.56 Mbps, Upload 5.92 Mbps

Alcatraz Island

With a mobile download speed that’s 48% slower than nearby San Francisco, the jury’s still out on whether the ghosts at this famous island prison are interfering with cell reception or it’s just a little too far from the nearest cell tower. Either way, we would not want to be locked in Cell 14D with any of the spirits reported to haunt The Rock, especially the likes of Al Capone and the Butcher. For that matter, we’ll steer clear of the moaning ghosts of cell blocks A, B and C while we’re at it.

9. The Tower of London

Download 12.34, Upload 6.67 Mbps

The Tower of London

From Thomas Becket to Anne Boleyn, murdered princes to the White Lady, this paragraph is not long enough to name all the ghosts associated with this castle on the River Thames. During its more than 900 years of life, this building has seen more than its fair share of death and its reputation as the most haunted building in England is well-earned. We don’t think all those ghosts are messing with the cellular spectrum, though, as the mobile download speed here is ever so slightly faster than London’s average.

8. Cuban Club

Download 14.80 Mbps, Upload 4.19 Mbps

Cuban Club

Flickering flashlights, a murdered board member and an actor’s suicide on stage mark this building that once housed a mutual aid society for Cuban residents of Tampa, Florida as one of the most haunted buildings in the U.S. Is this really the voice of Jimmy, the boy who’s said to have drowned in the basement pool? Either way, wait to watch that video until after you’ve left the building — the mobile download speed inside is 42% slower than in the rest of Tampa.

7. St. Augustine Lighthouse

Download 18.79 Mbps, Upload 3.78 Mbps

St. Augustine Lighthouse

The tragic drowning of three children one July afternoon in 1873 was the start of the most famous haunting in this lighthouse’s history. A light keeper also fell to his death while repainting the lighthouse in the mid-19th century. But the story isn’t all bad, because visitors report hearing the girls laughing from the top of the tower and the light keeper is reportedly still keeping watch over his beloved tower. Perhaps happy ghosts cause less spectrum interference, because mobile download speeds at the lighthouse are only 22% slower than in the rest of St. Augustine.

6. The Stanley Hotel

Download 19.76 Mbps, Upload 4.74 Mbps

The Stanley Hotel

This picturesque hotel offers an extravaganza of ghoulish ghosts — so much so that a stay here inspired Stephen King to write The Shining. While you won’t find Jack Torrance running around with his axe (thank goodness!), the fourth floor is filled with the voices of otherworldly children. One ghost plays piano in the ballroom while another turns lights on and off (he even takes requests). And the mobile download speed is 26% faster than in town. All the better to stream a little Kubrick with…

5. (Dracula’s) Bran Castle

Download 24.15 Mbps, Upload 8.06 Mbps

Dracula's Bran Castle

A mere image of this Transylvanian fortress inspired Bram Stoker to write one of the greatest horror novels of all time. Though the legend of Count Dracula is likely greatly exaggerated (if not entirely made up), the appeal is real and visitors flock from all over the world to tour the castle. If you go, it’ll be easy to post selfies because the mobile download speeds are 40% faster than those in nearby Bran.

4. The Banff Springs Hotel

Download 27.84 Mbps, Upload 12.19 Mbps

The Banff Springs Hotel

Was it an architectural mistake that created a secret room in this Alberta hotel or some otherworldly force? Since that space was exposed by fire there have been reports of strange noises, a family was murdered but the little girl’s fingerprints still appear on mirrors and a bride who tripped on her wedding gown reappears on the stairs where she died. The paranormal forces seem strong here with a 36% slower mobile download speed at the hotel than in town. Whatever you do, don’t hand your precious phone to the bellman. It’s said he never would retire, but he sure does appear and disappear at will.

3. The Skirrid Inn

Download 44.07 Mbps, Upload 22.03 Mbps

The Skirrid Inn

Another haunted hotel, this Welsh inn is over 900 years old. It once served as a courtroom where as many as 180 people were hanged from an oak beam. Visitors report rope burns accompanied by a choking sensation, and the hanging judge purportedly remains in residence on the upper floors. Friendlier ghosts are also in residence, including a chambermaid and a clergyman, and one night money levitated above the bar. If the spooks are affecting the cellular spectrum, it’s in a positive way as the mobile download speed at the Skirrid Inn is 52% faster than the average for Monmouthshire county.

2. Akershus Fortress

Download 60.84 Mbps, Upload 13.28 Mbps

Akershus Fortress

Built to protect Oslo, this complex has housed dungeons, royal tombs and a prison. These days it’s the site of official banquets. Ghost hunters, though, will be more interested in the reports of otherworldly screams and rattling chains that echo through the halls after dark. You may encounter Mantelgeisten, a faceless maiden in a long robe, but pray you never meet Malcanisen, a ghoulish dog that’s rumored to portend death within three months for anyone he meets. All this psychic activity doesn’t seem to affect mobile speeds at the castle, though. They’re only 5% slower than Oslo as a whole.

1. Fort George

Download 99.68 Mbps, Upload 21.23 Mbps

Fort George

By far the location with the fastest mobile download speeds on our list of haunts, this War of 1812 battle site doesn’t disappoint when it comes to spooky activity, either. From red-coated soldiers to “The Woman in the Mirror”, the fort is filled with apparitions, inexplicable footsteps and doors that open and close themselves. We have to wonder if those spirits have a magical effect on cellular signals, too, because downloads at the fort are 163% faster than in town.

We hope you enjoyed this tour of mobile internet speeds at spooky locales. While the internet speed data is solid, we cannot actually say if it’s the ghosts causing the anomalies we saw. We can say that we’ll be careful approaching any of these places after dark. Especially on Halloween…


Ookla retains ownership of this article including all of the intellectual property rights, data, content graphs and analysis. This article may not be quoted, reproduced, distributed or published for any commercial purpose without prior consent. Members of the press and others using the findings in this article for non-commercial purposes are welcome to publicly share and link to report information with attribution to Ookla.

| June 1, 2022

Capitalizing on C-band — United States Q1 2022 Results Show Room for Improvement

Key messages

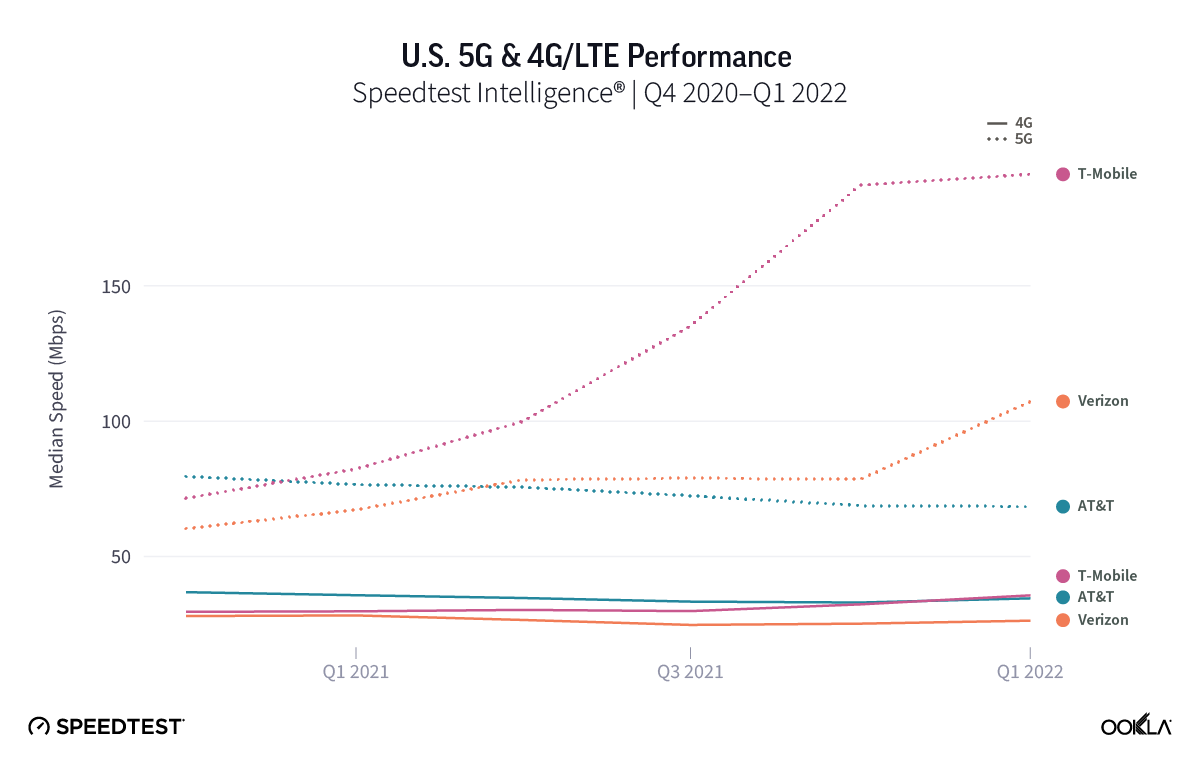
  • T-Mobile maintains a sizable lead on 5G performance. Median 5G performance for Verizon reached 107.25 Mbps in Q1 2022, fuelled by its C-band deployment, but T-Mobile maintains the upper hand in the performance stakes, recording 191.12 Mbps.
  • Verizon looking to capitalize on C-band advantage. While still early days for C-band in the US, Verizon will hope that its improved 5G performance will feed through into growth in postpaid net phone additions, following a decline in Q1 2022.
  • AT&T continues to surpass expectations. AT&T’s postpaid net phone additions have exceeded expectations, driven by stronger 4G/LTE performance relative to Verizon, coupled with wider 5G coverage and aggressive postpaid pricing.
  • Rising costs could well shift the competitive dynamic in Verizon’s favor. While the release of further C-band spectrum will shift this dynamic, that won’t happen until the end of 2023. In the meantime rising inflation will play a larger role, forcing operators to either consider raising prices or absorb additional costs. AT&T has already signaled that it favors the former. Verizon could well be a beneficiary.

AT&T & T-Mobile outperform Verizon

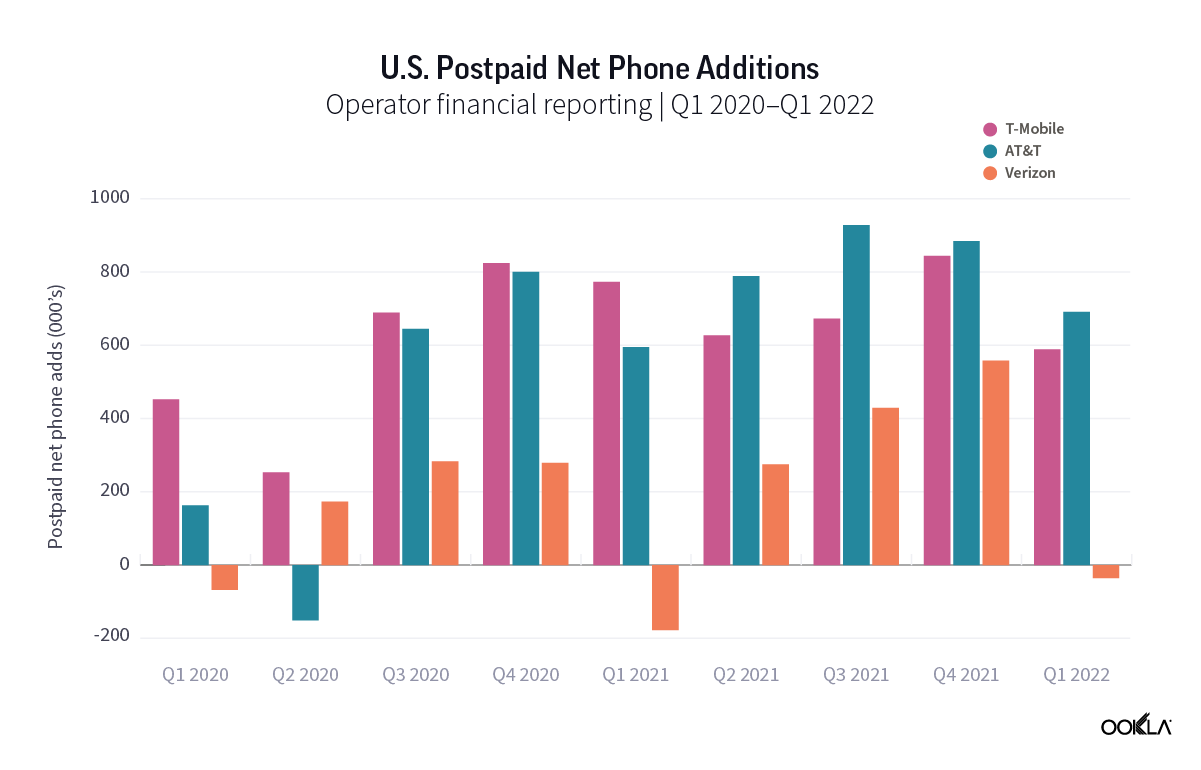
Postpaid net phone additions, a key barometer of the health of the wireless industry in the United States, has shown strong growth since Q3 2020, following the outbreak of COVID-19. The latest Q1 2022 reporting from the big three US operators, showed a return to negative growth for Verizon (a decline it has now replicated annually over the last three years), but also showed continued strong gains for both T-Mobile and AT&T. 

While we’d expect T-Mobile to perform strongly given its leading position in the market based on 5G performance, AT&T and Verizon’s relative performance is surprising. On the one hand, AT&T has outperformed even T-Mobile since Q2 2021, despite lagging both T-Mobile and Verizon on 5G performance according to Speedtest Intelligence®. More concerning is Verizon’s decline in postpaid net phone additions, despite it deploying C-band spectrum in Q1 2022 and seeing an uplift in speeds as a result. Since its deployment in the C-band, Verizon’s 5G speeds have set it apart from AT&T, but it continues to lag behind market leader T-Mobile.

The factors driving AT&T’s strong postpaid customer acquisition

Network performance isn’t the only factor driving postpaid net phone additions. A March 2021 YouGov survey listed cost as the main driver of churn for U.S. consumers, followed by network quality and services. AT&T’s strong performance, particularly relative to Verizon, reflects a number of factors:

  • Strong 4G/LTE performance. During Q1 2022, AT&T recorded a median speed of 34.57 Mbps over 4G/LTE, versus 26.33 Mbps for Verizon. 
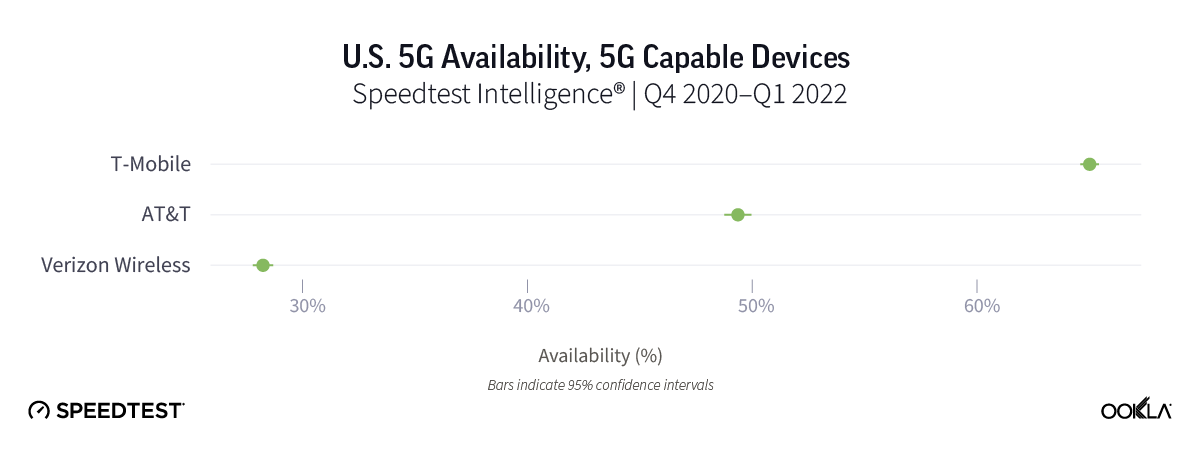
  • Greater 5G Availability. 50.6% of AT&T customers with a 5G capable device spent a majority of their time on 5G networks during Q1 2022, versus only 28.9% of Verizon customers. And when they’re not on its faster 5G network, Verizon customers fall back on its slower 4G/LTE network. 
  • Aggressive pricing. In a bid to drive customer acquisition, AT&T has been aggressive on pricing, looking to attract new and existing customers to 5G phones and its unlimited plans. This has had a knock-on impact on its financial results, with postpaid ARPU down marginally over the last two years, from $50.63 in Q1 2020, to $48.88 in Q1 2022. In addition, the EBITDA margin for its mobility division fell from 45.6% to 39.4% over the same 2-year period.
  • C-band delay and controversy. With Verizon targeting a big competitive push alongside its deployment in the C-band, the concerns raised by the FAA relating to interference at U.S. airports and the subsequent delay in launch, will have had a knock-on impact on its ability to attract new customers in Q1.

Economic pressure could play into Verizon’s hands

As economic headwinds build in the US, with inflation surging to a 40-year high, we expect the dynamics of the U.S. wireless market to shift. AT&T CEO John Stankey pointed to rising wages adding approximately $1 billion to the company’s costs in 2022 during its Q1 2022 earnings call. Set against a backdrop of an already declining wireless EBITDA margin, rather than absorb the cost, Stankey raised the prospect of increasing prices. Shortly afterwards, AT&T announced that it would raise prices for older mobile service plans (the first such rise in three years) and at the same time attempt to transition these users onto newer plans. Verizon has since followed suit, raising the administrative fee it charges on postpaid voice accounts.

At the same time, competition is increasing. Having just launched 5G service in Las Vegas, Dish, which has been beset by problems with its network rollout, is set to ramp up 5G coverage. More targeted competition currently comes from some of the US regional carriers, for example US Cellular, which has built up its mid-band spectrum holdings (including C-band), and is currently targeting a balance between customer acquisition and ARPU growth. These changes could well begin to shift the dynamic in terms of postpaid net phone additions between AT&T and Verizon and other regional carriers, if they can continue to broaden the coverage of their 5G networks and build on their C-band fuelled speed advantage.

If you want to learn more about how Speedtest Intelligence can help you benchmark your 5G performance against competitors, please inquire here.

Ookla retains ownership of this article including all of the intellectual property rights, data, content graphs and analysis. This article may not be quoted, reproduced, distributed or published for any commercial purpose without prior consent. Members of the press and others using the findings in this article for non-commercial purposes are welcome to publicly share and link to report information with attribution to Ookla.
| January 18, 2017

Which US Airport has the Fastest Internet?

You may have read our recent coverage of the airports and carriers with the fastest internet during the holidays. But the holidays are behind us and it’s time to get real about the year’s upcoming business trips and vacations to sunny spots. That has us asking, “Which airports have the fastest mobile and Wi-Fi speeds right now?”

We went bigger this time, examining the 20 US airports with the most passenger boardings. Once again we looked at Speedtest data for the four largest carriers: AT&T, Sprint, T-Mobile and Verizon as well the airport-sponsored Wi-Fi at each location. We chose to focus on data from the last three months of 2016 because, thankfully, the internet keeps getting faster (except for Wi-Fi at nine of these airports, more on that later). Wi-Fi gets upgraded and carriers are regularly rolling out new technology and capacity at US airports.

Enough methodology already, you want to know who won and how that affects your next wait at the gate.

The fastest connections

You’ve probably noticed that your internet experience varies a little when traveling, but you likely had no idea how much the airports you’ve chosen to fly through affect the mobile internet speeds you’ll achieve. So who’s winning the airport internet game?

Fastest airports (cellular)

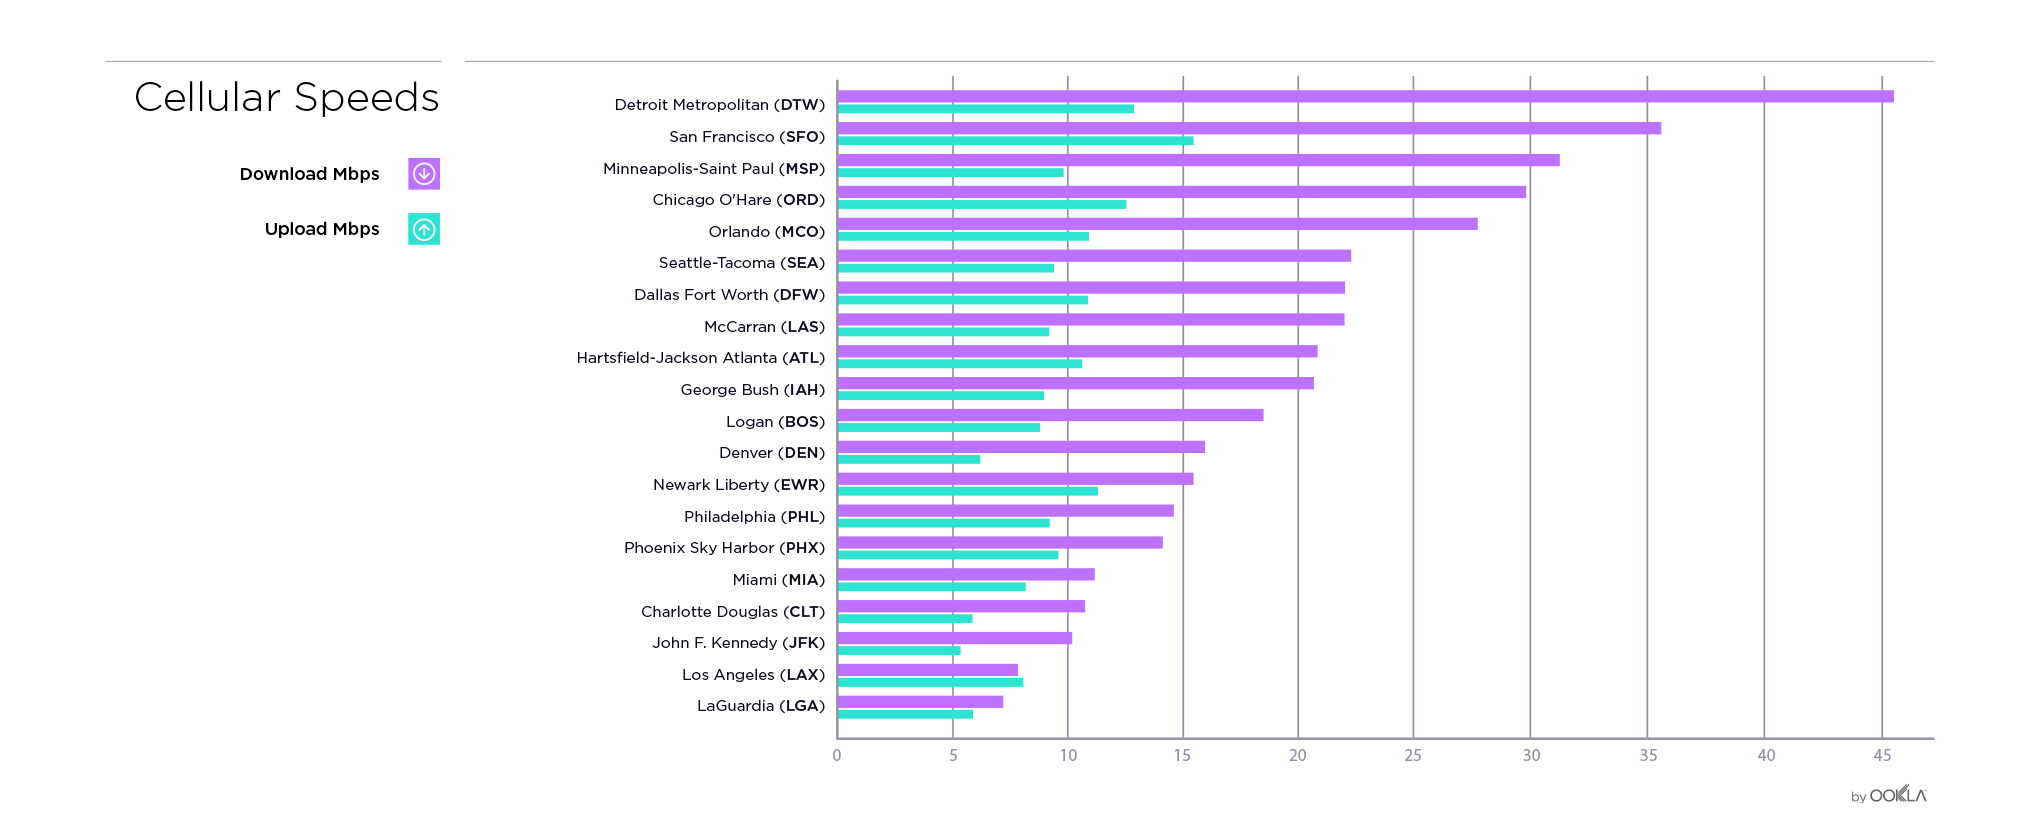
If you’re connecting via cellular signal, the difference between the average download speed of 7.25 Mbps at LaGuardia and Detroit’s 45.79 Mbps is the difference between kinda sorta getting through the latest episode of Westworld on your phone and enjoying the full HD video experience on your tablet.

For context, mean mobile speeds in the US during the same period are 21.77 Mbps for download and 8.54 Mbps for upload.

Although San Francisco’s upload speeds are nearly three times as fast as those at JFK, upload speeds at these airports fell into a much narrower band that’s pretty close to the national average. So unless you’re trying to upload all of your vacation photos while waiting for that connecting flight, you’re probably going to have the bandwidth you need no matter where you’re departing from.

Fastest airports (Wi-Fi)

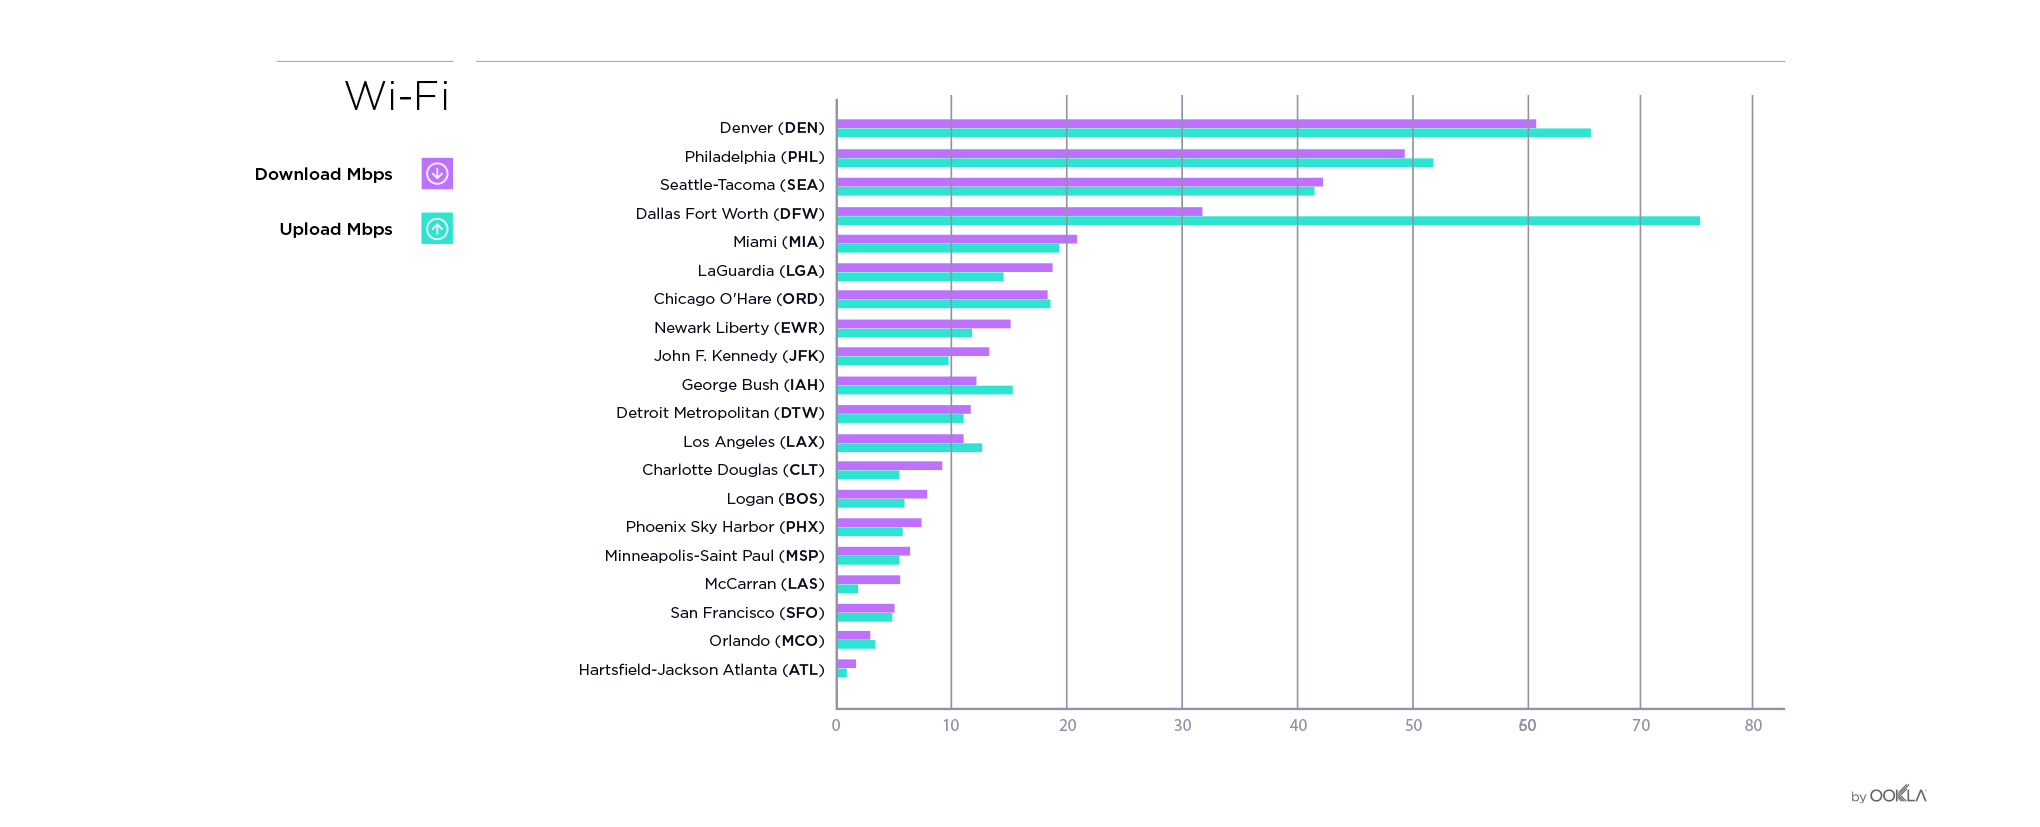
If you’re committed to using airport Wi-Fi, you’ll find an even bigger range of speeds for both download and upload depending on your location. From a dismal 2.71 Mbps average download speed over Atlanta’s Wi-Fi to Denver’s average of 61.74, you could be facing the difference between an audio-only experience and actually being able to distract your weary travel companions with an HD movie.

Interestingly, Wi-Fi uploads are faster than downloads at seven of the airports we surveyed. Atlanta’s uploads are also snail-paced, so you probably want to wait on uploading your Walking Dead Zombie Tour pics until the next leg of your trip, but if you’re in Dallas you’ll have the speed you need to video chat while uploading every photo and video you ever took. Ever.

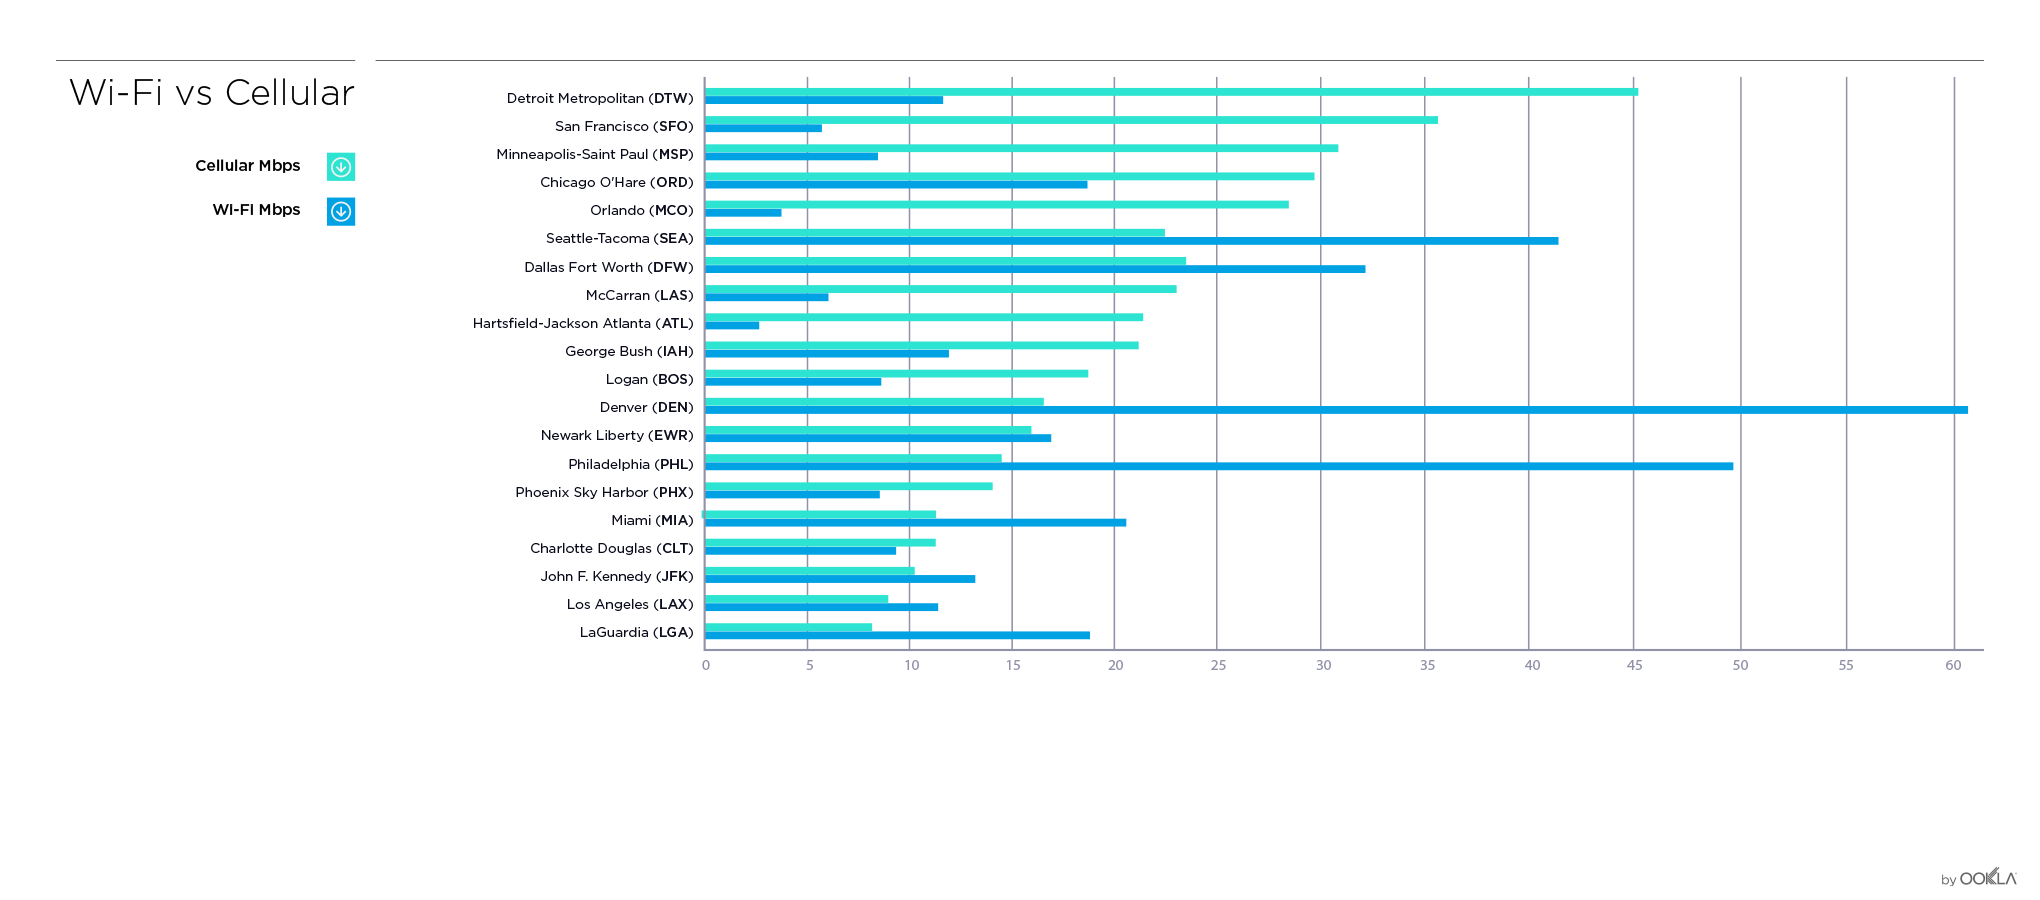
Airport download speeds (cell vs. Wi-Fi)

You might think cell signals are a lot faster than Wi-Fi. Our data show that when it comes to airports, it’s impossible to guess which type of connection will be faster until you’ve actually arrived. Unless, of course, you have this handy chart:

In seven of the airports we looked at, Wi-Fi easily won the speed race, especially in Denver where Wi-Fi is more than three times faster than cellular service. In fact, Denver’s Wi-Fi is faster than cell or Wi-Fi at any of the other 19 busiest airports. Which is probably a good thing, considering Denver recently invested $2.5 million in their Wi-Fi network.

LaGuardia and Philadelphia’s public Wi-Fi networks were nearly three times faster than their average cell download speed, and in Miami and Seattle, Wi-Fi is nearly twice as fast as cell.

In airports like Charlotte Douglas, JFK and Newark, your internet download speeds are relatively similar on cell or on Wi-Fi.

On average, cellular downloads are the way to go at ten airports. In San Francisco and Orlando, cell was about seven times faster than Wi-Fi while McCarran in Las Vegas and Minneapolis-Saint Paul say cell downloads were about four times faster than airport Wi-Fi.

Fastest carriers

Frequent flyers who are also Verizon subscribers will be pleased to know that Verizon wins at nine out of 20 airports we surveyed for Q4 2016. AT&T takes eight and one airport is tied between Verizon and AT&T. Sprint and T-Mobile each check in at one.

Who has the fastest internet where you’re connecting

The map below breaks down the fastest carrier at each of the 20 busiest airports in the US. You’ll also find that carrier’s download and upload speed.

Though Verizon offers the fastest downloads at the most airports, the company doesn’t dominate any particular area of this map. Instead, Verizon and AT&T vie for fastest at top airports across the US except at those closest to the Great Lakes. In that area, Sprint takes fastest carrier title in Chicago and T-Mobile wins Detroit. In Miami, fastest carrier is really too close to call.

Just because a carrier is fastest in a given airport doesn’t mean that the speeds there are good. AT&T’s 8.69 Mbps at LaGuardia is particularly slow. At eight of the 20 airports we examined (LaGuardia, LAX, Charlotte Douglas, Miami, Phoenix, Newark, Philadelphia and JFK), the speeds offered by fastest carriers AT&T and Verizon are below the US average.

On the other end of the spectrum, T-Mobile’s average download speed at Detroit Metropolitan Airport is more than three times the national average while Verizon’s speed at San Francisco International Airport and Sprint’s showing at O’Hare are more than double that national average. And it’s hard to complain about the 30+ Mbps download speed offered by the fastest carriers at airports in Dallas, Atlanta, Minneapolis and Orlando.

Carriers are improving service

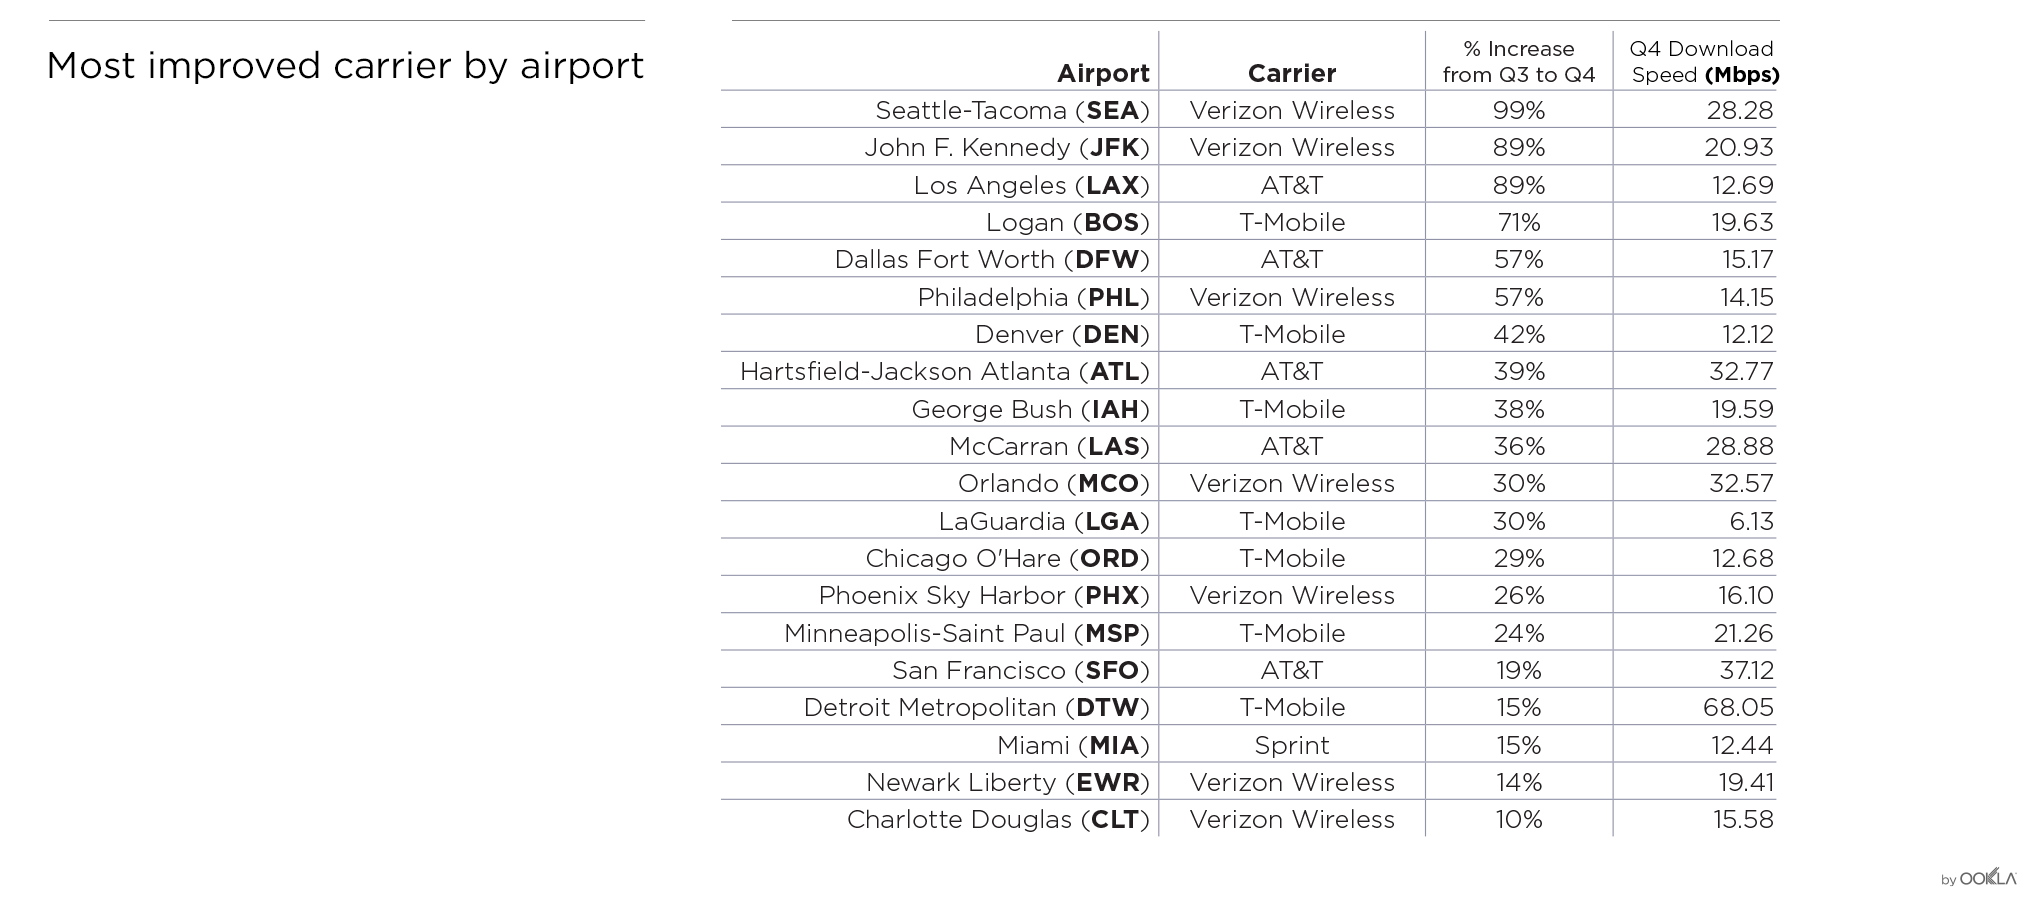
Just because a carrier didn’t win, doesn’t mean their speeds are slow or that they aren’t improving. Now you know who the fastest carriers are today, but who will be fastest a few months or a year from now? We took a look to see which carriers improved their download speed the most at each airport between Q3 and Q4 2016.

As expected, the news is mostly good. Speedtest data shows that in some cases, like O’Hare, Dallas and SeaTac all four carriers boosted their mobile download speed. We’re proud to boast that at SeaTac, our home airport, those percent increases were all in the double digits.

Verizon made an excellent showing with massive improvements at JFK and SeaTac. They were also the most improved carrier at five other airports. AT&T’s improvements at LAX are a bright spot in an otherwise slow airport. AT&T was also most improved at four other airports. T-Mobile demonstrated the biggest improvements at seven airports from Denver to Boston. And Sprint was the most improved carrier at Miami International.

We did see minor dips for individual carriers at some airports. We’d like to keep the emphasis on the winners this time, but we are keeping an eye out to see how those speeds evolve over time.

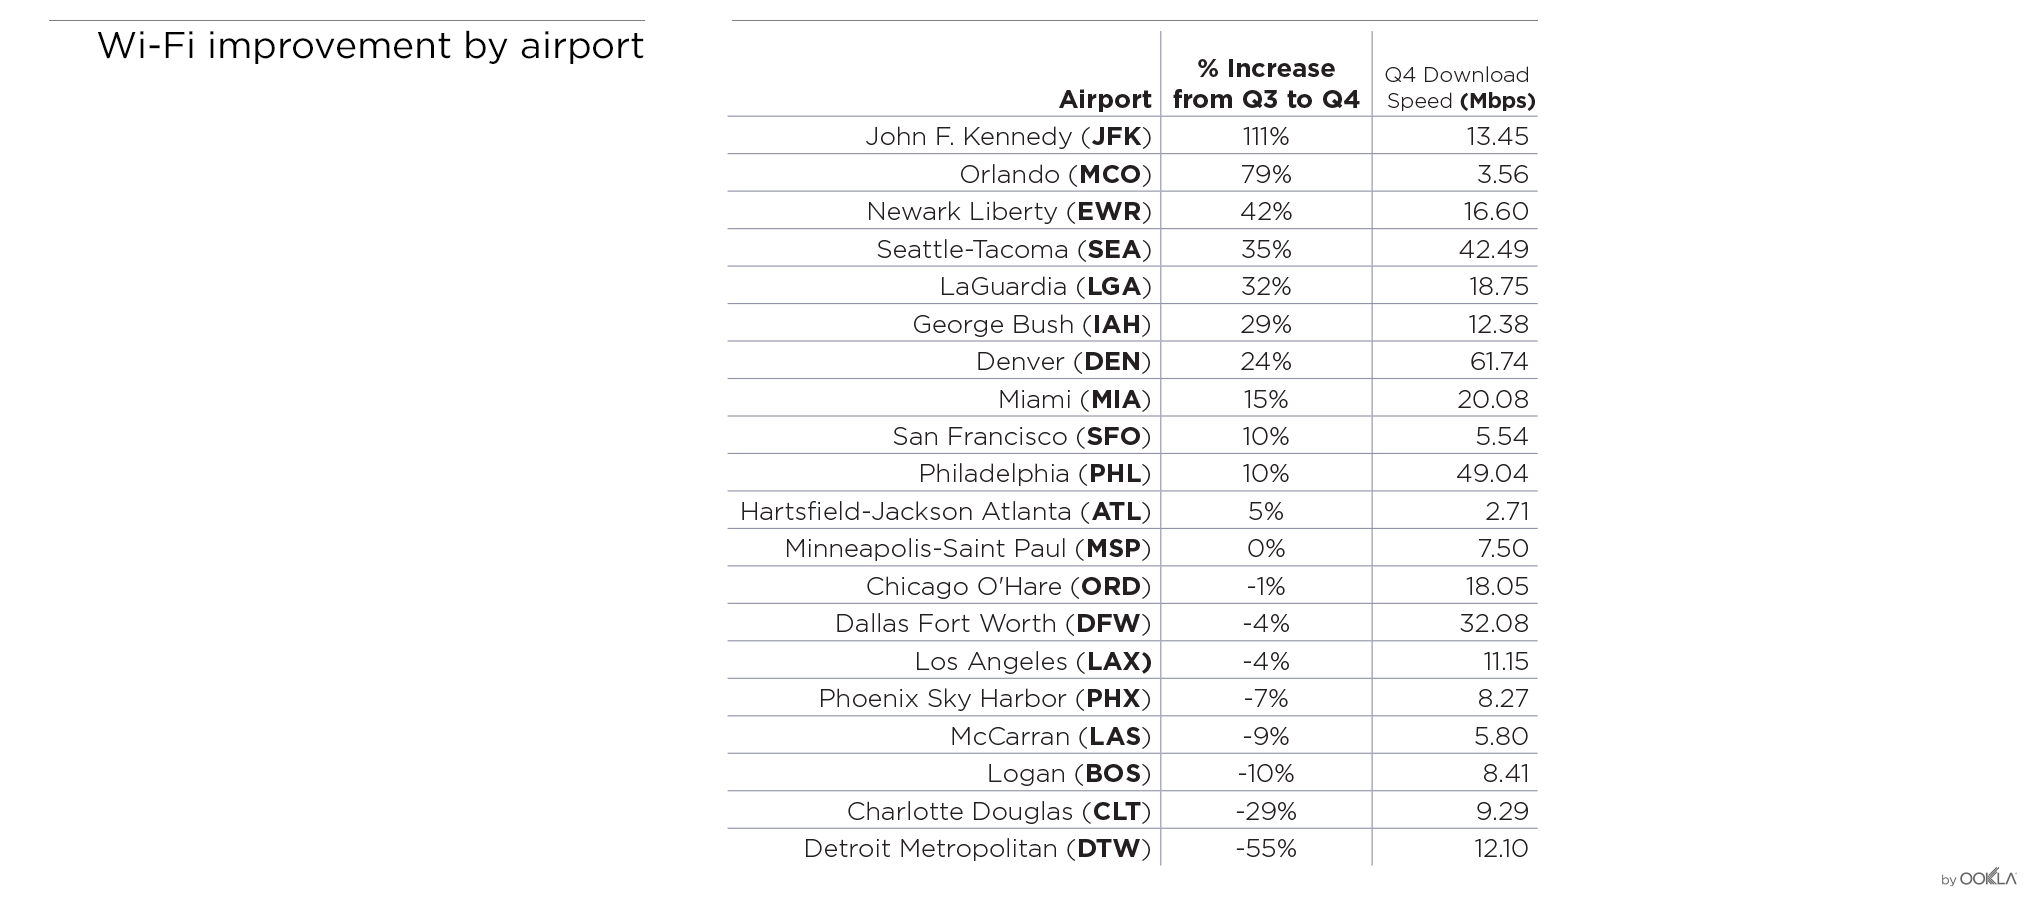
Wi-Fi gets better (mostly)

At 12 of the 20 busiest airports in the US, Wi-Fi download speed increased when comparing Q4 2016 to Q3 2016. Cheers to JFK for more than doubling their Wi-Fi download speed. Speeds in Denver and Philadelphia continued to improve between Q3 and Q4 of 2016. Because both airports have already invested significantly in their Wi-Fi, what’s good is only getting better. Seattle also gets a shout-out for a strong improvement on an already above average speed.

As needed as some of these improvements are, airports would do well to shoot for a benchmark speed rather than incremental increases. Orlando International, in particular, could benefit from a large investment in Wi-Fi, because although they show the second highest percentage increase, the resulting average download speed still is not at all serviceable for anything beyond basic calls and texts.

And then there are the airports where average Wi-Fi speeds decreased: Detroit Metropolitan, Charlotte Douglas, Logan in Boston, McCarran in Las Vegas, Phoenix Sky Harbor, LAX, Dallas Fort Worth and Chicago’s O’Hare. Whether their existing Wi-Fi systems are reaching their limits or something else went wrong, no one wants to see internet speeds decrease. If Idaho Falls Regional Airport offers 100 Mbps Wi-Fi (and our tests show on average, users were achieving speeds of over 200 Mbps) there’s a path to Wi-Fi success for every airport.

Worth mentioning is the fact that public Wi-Fi is not the only option. For example, Comcast is testing new Xfinity-on-the-Fly lounges in Philadelphia. While we did not include tests over this network in our ratings, they did show an impressive average download speed of 101.37 Mbps. Though we’re reporting on public Wi-Fi networks only, if your airport Wi-Fi isn’t cutting it, try looking for airline-specific networks in lounges.

What this means for you

Now that you know which airports have the fastest internet, it’ll be that much easier to book the most productive business trip or the most frustration-free vacation.

And if you have an extra second during your next layover, please download our app for iOS or Android then take a Speedtest. We’ll tell you how fast your connection is and use that data to create more content like this in the future.

Ookla retains ownership of this article including all of the intellectual property rights, data, content graphs and analysis. This article may not be quoted, reproduced, distributed or published for any commercial purpose without prior consent. Members of the press and others using the findings in this article for non-commercial purposes are welcome to publicly share and link to report information with attribution to Ookla.
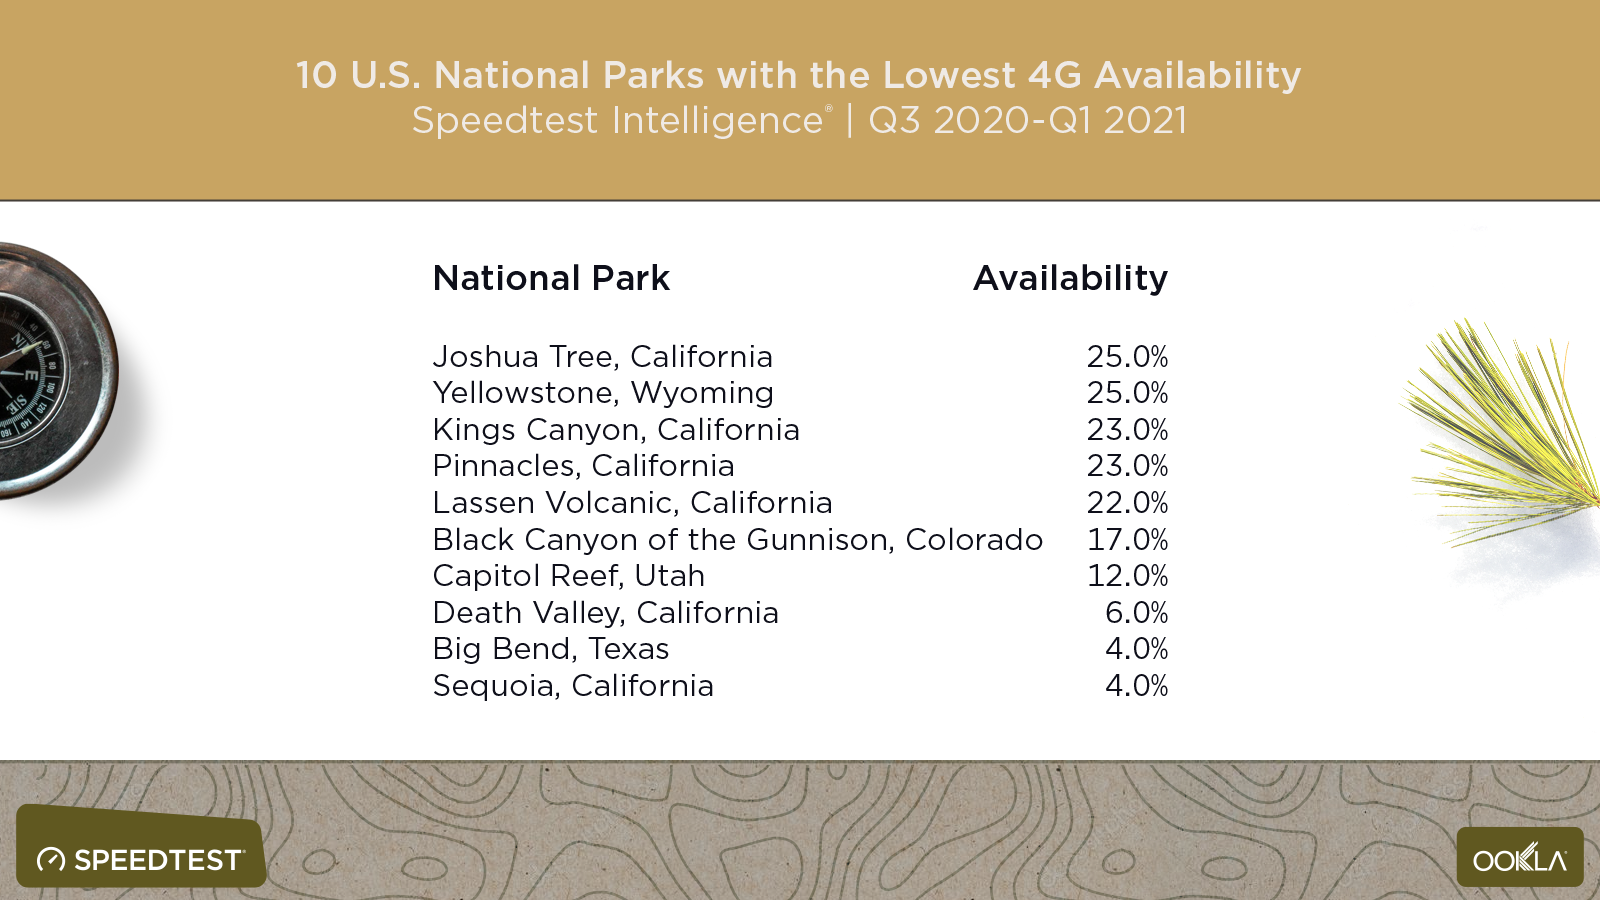
| November 27, 2023

Disaster Recovery: Restoring Connectivity and Ensuring Network Resiliency [Webinar]

The world has recently witnessed a surge in natural disasters, with events like the devastating wildfires in Maui serving as a reminder of the urgent need for comprehensive disaster preparedness and network resiliency. Connectivity is paramount for coordinating emergency response efforts, disseminating timely information, and facilitating the evacuation of affected areas. This article will share a recent example of how the state of Hawaii was able to quickly understand the impact that wildfires had on connectivity in Maui. 

To learn more about network recovery and resiliency, please register for our December 7 webinar, where a panel of industry experts from the GSMA, OECD, and the World Bank will come together to share examples of real-world disaster recovery efforts. 

A look at how Maui wildfires impacted connectivity on the island

The wildfires in Lahaina, Maui started on August 8, 2023. Looking at background scans across all mobile network operators for the island of Maui before the wildfires started, we can see that there are users distributed all around the island and coverage along all of the roads.

Once the wildfires started in the Lahaina area on the west side of the island, you can see most users fled Lahaina (upper left) towards central Maui (center). Increased network traffic in central Maui led to congestion that degraded the signal strength in that area.

Mobile network operators were able to focus on network resiliency and determine if they had enough capacity for all of the users fleeing to central Maui, while governments were able to evaluate where relief management was needed for users. Register for the webinar to hear more details about how Hawaii restored connectivity after the wildfires. 

When a disaster strikes, communication is essential

Connectivity acts as a lifeline during a crisis, enabling individuals to stay informed, connect with loved ones, and access crucial resources. The provision of reliable and resilient communication infrastructure is a critical component of disaster response to the unpredictable forces of nature. Government bodies, NGOs, and other humanitarian organizations are all faced with the challenge of developing disaster recovery plans — and network operators must build networks that can be repaired quickly so that people can communicate and stay connected in an emergency.

To learn more about restoring connectivity and ensuring network resiliency, join the webinar at 8 a.m. PST / 11 a.m. EST / 4 p.m. GMT on Thursday, December 7. A recording will be provided for registrants who can’t join the live presentation. Register now

Ookla retains ownership of this article including all of the intellectual property rights, data, content graphs and analysis. This article may not be quoted, reproduced, distributed or published for any commercial purpose without prior consent. Members of the press and others using the findings in this article for non-commercial purposes are welcome to publicly share and link to report information with attribution to Ookla.