| January 20, 2022

Why Verizon and AT&T Couldn’t Wait Any Longer for U.S. C-band to Go Live

Key takeaways

  • Verizon and AT&T’s concessions on 5G around affected airports marks a breakthrough in a situation that could easily have escalated further and ended up in court, with subsequent delays to their planned C-band launch.
  • The opportunity cost of any delay is significant, as T-Mobile continues to extend its lead on 5G performance, which has helped the self-styled “Un-carrier” attract more postpaid net additions than its key rivals combined. This is why both Verizon & AT&T had little choice but to placate the FAA.
  • Further mid-band spectrum auction results announced on January 14, saw AT&T and DISH in particular increase their holdings, and underline just how critical mid-band spectrum is to operator performance.
  • Comparable international benchmarks from operators in France, Germany and Taiwan show that similar C-band spectrum holdings can drive 5G performance well over 100 Mbps, offering a means for Verizon and AT&T to close the gap with T-Mobile and potentially even move ahead.

Verizon and AT&T play catch-up with T-Mobile

Opportunity cost of further C-band delay too great

Back in February 2021, Verizon and AT&T paid $45.4 billion and $23.4 billion, respectively, for C-band spectrum for 5G use in the most expensive spectrum auction in history. Fast forward almost a year, and both telcos voluntarily agreed in early December to postpone their C-band deployment for a month due to Federal Aviation Administration (FAA) concerns that the use of these 5G bands could interfere with existing radio-based safety equipment, a delay which was subsequently extended to January 19.

In early December, Verizon CEO Hans Vestberg and AT&T Communications CEO Jeff McElfresh were bullish about the prospect of being able to launch in early January following a “short delay,” and that it would have no meaningful impact on their businesses. However, their insistence on a January 19 launch belies obvious concerns over T-Mobile’s increasingly strong lead on 5G performance — a lead which it continued to extend throughout the second half of 2021 — and coinciding with stronger postpaid net adds than its two main rivals combined during the year ended Q3 2021.

Averting an impasse with the FAA was critical

It was critical for both telcos that the delay to their C-band launch was only temporary, despite any skepticism over the potential impact on aircraft passenger safety. Part of the frustration evident from the network operators lies in the fact that C-band spectrum is already widely used elsewhere in the world for 5G, without showing any detrimental impact on aircraft passenger safety. C-band spectrum has already been deployed, and commercial networks launched, by a total of 136 network operators in 56 countries worldwide, according to the Global mobile Suppliers Association (GSA). This includes almost 11,000 airports (assuming nationwide coverage in each market). It’s also not new — the earliest use of C-band spectrum for 5G was in South Korea, which launched in Q4 2018.

Both have sought to compromise by agreeing not to turn on 5G equipment in the vicinity of affected airports. The delayed launch in these locations will enable the FAA to analyze proposed 5G cell site deployments and the impact on airports nationwide. One of the affected airports is Dallas/Fort Worth International Airport. If we look at Verizon’s current 5G (excluding C-band) footprint around the airport using Ookla Cell Analytics below, we can see widespread 5G coverage across its terminal buildings, as well as surrounding highways. The operators have been at pains to point out that their C-band spectrum includes a 220 MHz wide guard band, utilizing the lower portion of the C-band, from 3.7 GHz to 3.8 GHz.

C-band spectrum resets the playing field for 5G in the US

C-band spectrum is considered a sweet spot for 5G, as it strikes a good balance between capacity and coverage. While its reach isn’t as wide as the lower frequency spectrum, it allows operators to add much more capacity while also allowing for significantly better geographical reach when compared to mmWave. At launch, AT&T and Verizon won’t be able to utilize all their C-band assets, being limited to 40 MHz and 60 MHz, respectively, until the end of 2023. Despite this, deployments in the 3.7 GHz band will drive a considerable uplift in performance, helping them begin to close the gap on T-Mobile. The recently announced results of a further auction of mid-band spectrum (3.45 GHz) highlight the importance of mid-band holdings among the US network operators, with AT&T and DISH emerging as the main winners, in the third most expensive spectrum auction in US history. Once made available, this spectrum will allow them to gain further ground on T-Mobile and Verizon (which holds a greater share of C-band spectrum).

If we look internationally at other markets where operators have deployed 5G in the C-band with similar bandwidths, we see 5G median download speeds well in excess of 100 Mbps for O2 in Germany and SFR in France. At the top end of the scale, Taiwan Mobile has deployed 5G in 60 MHz of C-band spectrum, but has pursued an aggressive 5G densification strategy in what is a very competitive 5G market to achieve median speeds approaching 300 Mbps.

Examining the transition from LTE to 5G in France, which launched 5G in the C-band in late November 2020, shows a considerable uptick in performance from day one. Median LTE download speeds in France were 35.30 Mbps in Q4 2020, while 5G median speeds were 94.66 Mbps once launched and have since advanced strongly to a high of 194.69 Mbps in Q4 2021.

While this indicates that both Verizon and AT&T may continue to play catch-up with T-Mobile upon the initial launch of 5G in the C-band, the margin of difference will be substantially reduced, and then it will largely come down to how many 5G cell sites each operator deploys, and when they can turn on additional spectrum resources — the race is on.

This is good news for consumers and businesses alike, and over time will help propel the U.S. up the Ookla Speedtest Global Index™, where it sits in 24th place as of December 2021, and languishes well behind global leaders such as South Korea and China in terms of absolute median speeds.

Ookla retains ownership of this article including all of the intellectual property rights, data, content graphs and analysis. This article may not be quoted, reproduced, distributed or published for any commercial purpose without prior consent. Members of the press and others using the findings in this article for non-commercial purposes are welcome to publicly share and link to report information with attribution to Ookla.

| November 7, 2022

17 U.S. Airports With Supersonic Wi-Fi (And 12 that Are Still Stuck at the Gate)

The holiday travel season is fast approaching in the United States and with it the anticipation of spending more time than you’d hoped at the airport. To help you know whether you’ll have the speeds you need to freely stream videos or whether you’ll need to download those shows in advance, we’ve expanded our previous analysis to examine free airport Wi-Fi at 50 of the busiest airports in the U.S. We’ve also taken a look at some of the other Wi-Fi options available at airports across the country to see how you can get the best network experience (even if you have to pay for it).

Free Wi-Fi at 17 airports beat 100 Mbps

Chart of U.S. airports with over 100 Mbps internet speeds over free Wi-Fi

Speedtest Intelligence® shows Norman Y. Mineta San José International Airport, Cincinnati/Northern Kentucky International Airport, and San Francisco International Airport were among the fastest free airport Wi-Fi among the 50 busiest airports in the U.S. with median download speeds of 203.00 Mbps, 177.16 Mbps, and 162.38 Mbps, respectively, during Q3 2022. Daniel K. Inouye International Airport in Honolulu (158.05 Mbps) and Oakland International Airport (154.62 Mbps) rounded out the top five. All 17 of the airports at this performance level showed free airport Wi-Fi that’s capable of keeping the whole family entertained online for as long as your devices hold a charge.

Fort Lauderdale-Hollywood International Airport splits their free airport Wi-Fi among four separate SSIDs (the name of the network you log into), which we have listed separately in these results. The performance does not vary widely between them, but you will see that airport listed here and in the list below.

20 airports with 50-100 Mbps download speed over free airport Wi-Fi

Chart of U.S. airports with 50-100 Mbps internet speeds over free Wi-Fi

John Wayne Airport, two SSIDs at Fort Lauderdale-Hollywood, Detroit Metropolitan Airport, and Washington Dulles International Airport were at the top of the next performance tier for free airport Wi-Fi. Travelers at airports with Wi-Fi speeds in this range should have enough speed to adequately rebook flights as needed on one device while streaming distractions on another.

Note that Harry Reid International Airport in Las Vegas has two SSIDs on this list with comparable speeds. Philadelphia has a second SSID on the list below with a much lower speed, so you’ll want to make sure you’re connecting to “Free PHL Airport WiFi” when possible, rather than “Free PHL Airport WiFi-24”.

Pittsburgh and Houston have the slowest free airport Wi-Fi among 12 airports below 50 Mbps

Chart of U.S. airports with less than 50 Mbps internet speeds over free Wi-Fi

Internet performance might be an issue at airports on this lowest tier. While one device connected to a network that’s offering 20-40 Mbps might have no issues streaming 4K video, airports are notoriously high-volume places as travelers sit and wait for flights, mobile devices in hand for as long as it takes. The real issue is that on high traffic travel days (or worse, if there’s a weather delay) the connection might bog down. Airports at the bottom of our list — like Pittsburgh International Airport (5.23 Mbps median download speed) and George Bush Intercontinental Airport (8.79 Mbps) and William P. Hobby Airport (8.90 Mbps) in Houston — have the least leeway for performance to drop and still be usable, especially in an emergency situation when folks most want to connect.

Wi-Fi speeds decreased at four airports

Our most recent global analysis of free airport Wi-Fi included seven of these airports (over eight SSIDs, with Denver having two). The nominal download speed decreased when comparing Q1 2022 to Q3 2022 in four of those airports: Sea-Tac (32.06 Mbps drop), O’Hare (29.10 Mbps drop), Los Angeles (20.74 Mbps drop), and San Francisco (13.87 Mbps drop). Dallas/Fort Worth showed a 7.02 Mbps increase in median download speed over the same period. There was no meaningful difference in download speed between quarters at Hartsfield-Jackson and on both SSIDs at Denver. We generally expect speeds to improve over time as airports and internet service providers upgrade equipment. When airport Wi-Fi speeds decline we usually expect it’s due to that infrastructure not keeping up with increases in passenger volume or internet usage.

If you’re counting, you’ll see that we have data for 49 airports above, this is because there were insufficient samples at San Diego International Airport for us to analyze to our statistical standards.

Wi-Fi on other SSIDs

While most of the free airport Wi-Fi we saw had more than adequate speeds to do most things on your mobile device, there are other Wi-Fi options if you find that the free Wi-Fi is bogged down by too many users or if you just can’t find the popup to accept the terms and conditions required to connect to the local network. We looked at Speedtest® results across SSIDs to see if your best option might be Wi-Fi at an airport lounge or club or another option entirely.

Wi-Fi at airport lounges and clubs

We found Speedtest results for seven major airport lounge and club chains that serve a variety of airports. Wi-Fi is often free at these locations for folks who have paid for the privilege of lounge access, but median download speeds varied widely by airport within each brand so the Wi-Fi alone may not always be worth the price of admission.

The Alaska Lounge was the only lounge where we saw median download speeds in excess of 100 Mbps in all locations with sufficient samples to analyze, from 100.17 Mbps in Portland to 334.23 Mbps at LAX. The United Club showed everywhere from 57.98 Mbps at Dulles to 232.85 Mbps at SeaTac, and The Delta Sky Club ranged from 57.35 Mbps in Honolulu to 123.23 Mbps in Atlanta. American Airlines Lounge had median download speeds between 5.08 Mbps in Phoenix Sky Harbor and 74.94 Mbps at SFO and British Airways Lounge Wi-Fi download speed was between 25.00 Mbps at Dulles and 56.40 at Boston’s Logan Airport.

Non-airline lounges were equally variable with The Centurion Lounge featuring download speeds from 19.55 Mbps at SeaTac to 127.25 Mbps at George Bush Intercontinental, while The Club fluctuated from 12.90 Mbps in Orlando to 108.79 Mbps in New Orleans.

With such wide variations in Wi-Fi performance we can’t recommend any specific lounge. Your best bet is to take a Speedtest at your regular connections so you know what your options are next time you fly through.

Other Wi-Fi options

Of course there are still more companies that offer Wi-Fi at airports either as part of a tie-in with another business (like your mobile operator or credit card), by subscribing to a paid service, or as part of a larger deal with the airport. Our analysis turned up Speedtest results for three such Wi-Fi options at multiple airports in the U.S.: Boingo, Passpoint, and Skyfi. Median download speeds for Boingo were between 51.41 Mbps at LAX and 149.49 Mbps at Oakland. Passpoint Wi-Fi download speeds showed a low of 10.15 Mbps in Miami and a high of 106.59 Mbps in Oakland. And Skyfi’s median download speeds ranged between 50.15 Mbps in Orlando and 100.04 at LAX. It’s worth checking out which other Wi-Fi services you might have access to before you leave the house.

Overall, travelers should be pleased with the news on airport Wi-Fi in the U.S. Speeds are mostly good and there are a lot of options for travelers if one network gets crowded. Now you just have to remember to charge your devices before you pack them. If you’re traveling this holiday season, download the Speedtest app for Android or iOS before you go, then take a Speedtest at the airport to see how your experience compares.

Ookla retains ownership of this article including all of the intellectual property rights, data, content graphs and analysis. This article may not be quoted, reproduced, distributed or published for any commercial purpose without prior consent. Members of the press and others using the findings in this article for non-commercial purposes are welcome to publicly share and link to report information with attribution to Ookla.

| June 16, 2022

How Wireless Infrastructure Providers Can Maximize ROI with Crowdsourced Network Intelligence [Webinar]

Tower companies, DAS, neutral hosts, and other infrastructure providers are heavily investing in wireless assets to deliver expansive, uninterrupted connections with lightning-fast speeds to create a more connected world. While this presents wireless infrastructure providers with opportunities for major growth, they need the right data to make the most profitable investment decisions. This type of data includes network performance, user density, data usage, and other indicators to determine the best locations for investments or partnerships.

In the next Ookla® webinar, learn how wireless infrastructure providers can make smarter investments, more informed real estate decisions, and help improve network performance by using crowdsourced network intelligence to prioritize efforts.

Keep reading to learn how wireless infrastructure providers can use these insights, and sign up for the webinar on Wednesday, June 29, at 10 a.m. PDT (5 p.m. GMT), for a more in-depth discussion.

1. Make more informed wireless infrastructure planning decisions

When wireless infrastructure providers are ready to invest in new assets, they need an accurate view into the availability of coverage and performance in a given area. An oversaturated, congested network may require different solutions than an underserved area.

A map of crowdsourced data showing how infrastructure providers can use it to make better planning decisions.

This map shows the location of a mobile network operator’s (MNO’s) towers and the corresponding signal strength on that network, allowing infrastructure providers to better understand where to approach the operator for new assets.

2. Better prioritize future deployments and investments

As MNOs prepare for 5G and other new network deployments, infrastructure providers can use crowdsourced data to determine spots of low coverage and performance in both urban and rural areas. This allows infrastructure providers to determine what areas need additional assets to improve connectivity to serve the population, and they can make those determinations based on usage.

A map showing how mobile network data can help infrastructure companies can better prioritize future deployments and investments.

As the operator deployed 5G in Las Vegas, infrastructure providers can use this information to put the right assets in place, such as adding DAS, to support a new network.

3. Benchmark the performance, quality, and availability of existing indoor and outdoor networks

Infrastructure providers can also use crowdsourced network intelligence to find potential co-location opportunities and compare operators to find new business opportunities. By analyzing KPIs for all operators in a given area, an infrastructure provider can determine which operators need to improve network coverage, performance, or quality in key locations.

A map of crowdsourced data showing the various signal strengths.

For example, the above image shows areas of poor signal strength for one operator in a city block in Chicago. Comparing this to other operators in the area, an infrastructure provider can identify new sales opportunities down to the individual building level.

4. Identify buildings and areas with high user concentration and data usage, as well as poor network quality, coverage, and performance

By pinpointing congested areas or buildings, wireless infrastructure providers can better plan where to add DAS and other equipment to help offset the network density.

A map that shows where new assets could be used to help with connectivity.

This map shows infrastructure providers where new assets could help with network performance issues related to user density.

5. Drive a more efficient sales process with per-building intelligence

With accurate, detailed insights, the infrastructure provider can export data to pinpoint the exact issues building by building. The provider can then use that data to proactively determine the optimal locations for leasing roof or building space to build new equipment. They can even use that data to identify where operators should lease additional cell sites to improve coverage and performance, which gives them an advantage when starting those business development conversations.

A map that shows coverage by the individual building name.

With this data, infrastructure providers can look up the building name and see the individual operator’s performance, and then approach them with the right asset solution.

For more information on how to use crowdsourced data to improve your ROI, join us for the webinar on June 29 at 10 a.m. PDT. Even if you can’t attend at this time, you will receive a video recording after the live event. We look forward to sharing how wireless infrastructure providers are making better investment decisions and answering your questions.

Ookla retains ownership of this article including all of the intellectual property rights, data, content graphs and analysis. This article may not be quoted, reproduced, distributed or published for any commercial purpose without prior consent. Members of the press and others using the findings in this article for non-commercial purposes are welcome to publicly share and link to report information with attribution to Ookla.

| April 25, 2023

How a DAS Integrator, Wireless Services, Resolved a Carrier’s Mobile Network Issues at Miami International Airport with Ookla Wind® [Case Study]

Airports are critical locations for mobile network operators to ensure reliable, high-quality service — both for the millions of travelers passing through each year and for the airlines that rely on mobile networks for key technology. When a major U.S. mobile network operator updated its network technology around Miami International Airport, one of their biggest commercial customers started experiencing issues because their equipment was configured for legacy technology. Complicating the situation, the network operator and airlines had conflicting results from their testing and devices, both seeing different issues at the same spots within the airport.

Wireless Services is the design, installation, commission, and testing provider of distributed antenna systems (DAS) that manages DAS and critical infrastructure in the area. To troubleshoot the issues that arose during this major network update, Wireless Services needed the ability to accurately test the network, identify spikes in usage, and quickly make recommendations for optimizations and added capacity. To better serve the operators, Wireless Services used Wind®, Ookla’s handset-based mobile network testing solution, to walk test Miami International Airport and rapidly deliver recommendations.

Situation

As a major U.S. operator updated its network technology around Miami International Airport, an important commercial airline customer began to experience problems. During this crucial time period, the operator started experiencing massive issues with service at the airport. Wireless Services, who provided DAS and other infrastructure services to the operator, needed to rapidly discover the root cause of the network issues and make recommendations. Beyond testing their own infrastructure, it was important to analyze the entire airport to discover areas of poor performance, throughput, or signal strength, as well as locations where users were connecting to unexpected cell sites.

Read the full case study here.

Ookla retains ownership of this article including all of the intellectual property rights, data, content graphs and analysis. This article may not be quoted, reproduced, distributed or published for any commercial purpose without prior consent. Members of the press and others using the findings in this article for non-commercial purposes are welcome to publicly share and link to report information with attribution to Ookla.

| November 15, 2023

Your Black Friday/Cyber Monday Guide to iPhone 15 and Samsung Galaxy Z Fold5 and Flip5 Performance

To upgrade or not to upgrade, with Black Friday and Cyber Monday deals on the latest iPhone and Samsung devices on the horizon you may be asking yourself just that question. We analyzed data from Speedtest Intelligence® in 13 major markets to see how well the Apple iPhone 15 devices and the Samsung Galaxy Z Fold5 and Flip5 models are performing in comparison to last year’s models over 5G to help you make an informed decision. For details on performance by Samsung Galaxy S23 models, read our analysis from earlier this year. We’re especially interested in seeing if technical improvements on iPhone 15 models including support for WiFi 6E drive better performance.

Data for iPhone models is provided for the period from September 22-October 20, 2023, while data for the Samsung models is for the period from August 11-October 20, 2023. Keep in mind that device data differs across markets due to a variety of factors, including: 5G investments by governments and mobile operators, different 5G spectrum allocations, and mobile 5G plans. As many of these devices are very new, the sample counts in some countries are still low so the statistical ranges of expected performance are wider for the newer devices than the older models.

Half of models surveyed worth the upgrade in Australia

Chart of New Device Performance on 5G in Australia

In Australia, two out of four iPhone 15 models showed median 5G download speeds that were significantly faster than their iPhone 14 equivalents during the September 22-October 20, 2023 period. Speedtest Intelligence reveals the iPhone 15 Pro and the iPhone 15 Pro Max both had a 14% better download speed than their prior year counterparts. There was no statistical winner for the iPhone standard model or the iPhone Plus in Australia during this period.

The Galaxy Z Flip5 had a 30% better download speed than the Galaxy Z Flip4 during the August 11-October 20, 2023 period in Australia, while there was no statistical winner for the Galaxy Z Fold.

Recommendation: Depending on your model of choice, only half the devices surveyed merit an upgrade based on performance alone in Australia.

iPhones mostly worth the upgrade in Brazil

Chart of New Device Performance on 5G in Brazil

Three out of four iPhone 15 models in Brazil showed median 5G download speeds that were significantly faster than their iPhone 14 equivalents during the September 22-October 20, 2023 period. Speedtest Intelligence showed the iPhone 15 had a better download speed than the iPhone 14, with the iPhone 15 Pro Max having a 8% better download speed than the iPhone 14 Pro Max, and the iPhone 15 Pro showing a 1% better download speed than the iPhone 14 Pro. There was no statistical winner for the iPhone Plus in Brazil during this period.

There was no statistical winner for 5G median download speed during the August 11-October 20, 2023 period for the Galaxy Z Flip or the Galaxy Z Fold in Brazil.

Recommendation: iPhone users in Brazil should consider an upgrade based on performance, while Samsung Galaxy fans only need to upgrade if they are looking for feature improvements.

All iPhones show improvement over prior models in Canada

Chart of New Device Performance on 5G in Canada

All four iPhone 15 models in Canada showed median 5G download speeds that were significantly faster than their iPhone 14 equivalents during the September 22-October 20, 2023 period. Data from Speedtest Intelligence demonstrated the iPhone 15 had a better download speed than the iPhone 14, with the iPhone 15 Pro Max having a 26% better download speed than the iPhone 14 Pro Max, the iPhone 15 Pro Plus showed a 12% better download speed than the iPhone 14 Pro Plus, and the iPhone 15 Pro had an 8% better download speed than the iPhone 14 Pro.

The Galaxy Z Fold5 had a better download speed than the Galaxy Z Fold4 during the August 11-October 20, 2023 period in Canada, while there was no statistical winner for the Galaxy Z Flip.

Recommendation: iPhone users in Canada should consider an upgrade based on performance, while Samsung Galaxy fans should make a decision based on which model they’re considering.

Three iPhone models show decent improvement over prior versions in France

Chart of New Device Performance on 5G in France

Three out of four iPhone 15 models in France showed median 5G download speeds that were significantly faster than their iPhone 14 equivalents during the September 22-October 20, 2023 period. Speedtest Intelligence reveals the iPhone 15 and the iPhone 15 Pro Max both had 18% better download speeds than their respective prior year models. The iPhone 15 Pro had a 5% better download speed than the iPhone 14 Pro. There was no statistical winner for the iPhone Plus in France during this period.

There was no statistical winner for 5G median download speed during the August 11-October 20, 2023 period for the Galaxy Z Flip or the Galaxy Z Fold in France.

Recommendation: iPhone users in France should consider an upgrade based on performance, and Samsung Galaxy users only need to upgrade if they are looking for feature improvements.

Galaxy Z Fold5 shows some improvements in Germany

Chart of New Device Performance on 5G in Germany

Two out of four iPhone 15 models showed median 5G download speeds that were significantly faster than their iPhone 14 equivalents in Germany during the September 22-October 20, 2023 period. Speedtest Intelligence reveals slight improvements with the iPhone 15 Pro Max having a 6% better download speed than the iPhone 14 Pro Max and the iPhone 15 Pro having a 2% better download speed than the iPhone 14 Pro. There was no statistical winner for the iPhone standard model or the iPhone Plus in Germany during this period.

The Galaxy Z Fold5 had a 13% better download speed than the Galaxy Z Fold4 during the August 11-October 20, 2023 period in Germany, while there was no statistical winner for the Galaxy Z Flip.

Recommendation: Apple users won’t see major performance improvements from the new models, but the Galaxy Z Fold5 is worth the upgrade on performance alone.

India sees better performance on three iPhone models

Chart of New Device Performance on 5G in India

Three out of four iPhone 15 models in India showed median 5G download speeds that were significantly faster than their iPhone 14 equivalents during the September 22-October 20, 2023 period. Speedtest Intelligence showed the iPhone 15, iPhone 15 Pro, and the iPhone 15 Plus had better speeds than their respective prior models. There was no statistical winner for the iPhone Pro Max in India during this period.

There was no statistical winner for 5G median download speed during the August 11-October 20, 2023 period for the Galaxy Z Flip or the Galaxy Z Fold in India.

Recommendation: Indian iPhone users should consider an upgrade based on performance, and Samsung Galaxy users only need to upgrade if they are looking for feature improvements.

No significant performance gains on new devices in the Philippines

Chart of New Device Performance on 5G in the Philippines

Neither the iPhone 15 Pro nor the iPhone 15 Pro Max had a statistically better median download speed over 5G than their prior year models during the September 22-October 20, 2023 period in the Philippines. There were not enough samples to properly assess the performance of the other two iPhone models.

Likewise, there was no statistical winner for 5G median download speed during the August 11-October 20, 2023 period for the Galaxy Z Flip or the Galaxy Z Fold in the Philippines.

Recommendation: Filipino consumers looking to upgrade their phones to the latest models will have to look for reasons beyond performance.

Galaxy Z Fold5 sees performance improvement in South Korea

Chart of New Device Performance on 5G in South Korea

Mobile speeds in South Korea are already fast with a top 10 performance on the Speedtest Global Index™ as of September 2023. New phones may not push performance boosts, though, as Speedtest Intelligence data did not show significant increases in median download speed over 5G for the iPhone 15 Pro or the iPhone 15 Pro Max in South Korea during the September 22-October 20, 2023 period. However, the iPhone 15 Pro Max had a 16% better upload speed than the iPhone 14 Pro Max. There were not enough samples to properly assess the performance of the other two iPhone models.

On the other hand, the Galaxy Z Fold5 had a 10% better download speed than the Galaxy Z Fold4 during the August 11-October 20, 2023 period in South Korea, while there was no statistical winner for the Galaxy Z Flip.

Recommendation: If South Korean consumers are looking for better performance, upgrading from the Galaxy Z Fold4 to the Galaxy Z Fold5 is worth looking into.

Spain sees major increases in iPhone speed

Chart of New Device Performance on 5G in Spain

Three iPhone 15 models in Spain showed median 5G download speeds that were significantly faster than their iPhone 14 equivalents during the September 22-October 20, 2023 period, and the improvements in performance were mostly greater than we saw in other countries, with the exception of the United States. Speedtest Intelligence reveals the iPhone 15 Pro had a 40% better download speed than the iPhone 14 Pro, the iPhone 15 Pro Max had a 36% better download speed than the iPhone 14 Pro Max, and the iPhone 15 had an 11% better download speed than the iPhone 14. There were not enough samples to properly assess the performance of the iPhone Plus.

There were not enough samples to evaluate the Galaxy Z Flip or the Galaxy Z Fold during the August 11-October 20, 2023 period in Spain.

Recommendation: Spanish iPhone fans should definitely upgrade their devices while Samsung users can hold off for now.

Unbeatable performance in U.A.E. makes upgrades unnecessary

Chart of New Device Performance on 5G in U.A.E.

While Speedtest Intelligence data did not show significant increases in median download speed over 5G for the iPhone 15 Pro or the iPhone 15 Pro Max during the September 22-October 20, 2023 period, performance likely isn’t a concern in the United Arab Emirates, whose blisteringly fast download speeds topped the Speedtest Global Index™ in September 2023. There were not enough samples to properly assess the performance of the other two iPhone models.

Similarly, there was no statistical winner for 5G median download speed during the August 11-October 20, 2023 period for the Galaxy Z Fold in the U.A.E., and there were not enough samples to evaluate the Galaxy Z Flip.

Recommendation: Consumers in the U.A.E. should upgrade if they are looking for the new features on the new phone models, but upgrades for performance are unnecessary.

iPhone upgrades are the way to go in the U.K.

Chart of New Device Performance on 5G in the United Kingdom

All four iPhone 15 models in the United Kingdom showed median 5G download speeds that were significantly faster than their iPhone 14 equivalents during the September 22-October 20, 2023 period. Speedtest Intelligence reveals the iPhone 15 had a 16% better download speed than the iPhone 14, the iPhone 15 Pro had a 14% better download speed than the iPhone 14 Pro, iPhone 15 Pro Max had a 10% better download speed than the iPhone 14 Pro Max, and iPhone 15 Plus has a 4% better download speed than the iPhone 14 Plus. 

There was no statistical winner for 5G median download speed during the August 11-October 20, 2023 period for the Galaxy Z Flip or the Galaxy Z Fold in the U.K.

Recommendation: iPhone users in the U.K. should see performance improvements that make upgrading to the latest models worthwhile. Samsung Galaxy users only need to upgrade if they are looking for new features.

U.S. consumers see some of the highest improvements when upgrading to new iPhone models

Chart of New Device Performance on 5G in United States

Not only did all four iPhone 15 models in the United States show median 5G download speeds that were significantly faster than their iPhone 14 equivalents during the September 22-October 20, 2023 period, the improvements in performance were greater than we saw in most other countries, with the exception of Spain. Speedtest Intelligence showed the iPhone 15 Plus had a 54% better download speed than the iPhone 14 Plus, the iPhone 15 had a 45% better download speed than the iPhone 14, iPhone 15 Pro Max had a 27% better download speed than the iPhone 14 Pro Max, and iPhone 15 Pro has a 25% better download speed than the iPhone 14 Pro. 

Samsung users also saw increased median download speeds over 5G when using the newer models during the August 11-October 20, 2023 period in the U.S. The Galaxy Z Flip5 had a 15% better download speed than the Galaxy Z Flip4, and the Galaxy Z Fold5 had a 10% better download speed than the Galaxy Z Fold4.

Recommendation: Upgrades for all this holiday season!

No performance boost on iPhone 15 Pro Max in Vietnam

Chart of New Device Performance on 5G in Vietnam

The iPhone 15 Pro Max did not have a statistically better median download speed over 5G than the iPhone 14 Pro Max during the September 22-October 20, 2023 period in Vietnam. There were not enough samples to properly assess the performance of the other three iPhone models. Likewise, there were not enough samples to evaluate the Galaxy Z Flip or the Galaxy Z Fold.

Recommendation: Vietnamese consumers don’t need to upgrade to newer models on performance alone.

Ookla will continue evaluating device performance

We’re excited by the number of countries where mobile device performance increased with the new models and even more excited by the countries where performance is so fast that consumers can look to new modes of connectivity. Even if your country didn’t see the speed boosts you were hoping for, don’t hold back on upgrading if you want to treat yourself or a loved one based on any other number of reasons. Remember to download the iOS or Android Speedtest® app on any new devices to make sure your mobile operator is delivering the speeds you expect.

Ookla retains ownership of this article including all of the intellectual property rights, data, content graphs and analysis. This article may not be quoted, reproduced, distributed or published for any commercial purpose without prior consent. Members of the press and others using the findings in this article for non-commercial purposes are welcome to publicly share and link to report information with attribution to Ookla.

| November 7, 2023

Improvements in Free Airport Wi-Fi: The Holiday Gift You Didn’t Know You Needed

With the holiday travel season on the horizon in the United States, we checked back in on our previous analysis of free airport Wi-Fi at 50 of the busiest airports in the U.S. to see what you can expect when you’re waiting for your flight home to see the family. We found you may have a lot to be thankful for this year. Three more airports have free Wi-Fi download speeds over 100 Mbps than last year. Read on for detailed performance at the specific airports you’ll be flying through.

20 airports have free fixed broadband Wi-Fi at over 100 Mbps

Fixed Broadband Internet Speeds Over Free Wi-Fi at U.S. Airports
Speedtest Intelligence® | Q3 2023
A map showing fixed broadband speeds in selected airports in the United States.

Speedtest Intelligence® shows Norman Y. Mineta San José International Airport, Cincinnati/Northern Kentucky International Airport, and Oakland International Airport, were among the fastest free airport Wi-Fi among the 50 busiest airports in the U.S. with median download speeds of 259.37 Mbps, 210.09 Mbps, and 206.25 Mbps, respectively, during Q3 2023. Daniel K. Inouye International Airport (187.58 Mbps) and Phoenix Sky Harbor International Airport (178.32 Mbps) rounded out the top five. San Francisco International Airport (155.99 Mbps) slipped down the list compared to last year. 100 Mbps is more than fast enough to stream video and keep the whole family entertained for as long as your devices hold a charge.

On the other end of performance, six airports (William P. Hobby Airport, Raleigh-Durham International Airport, Philadelphia International Airport on SSID Free PHL Airport WiFi-24, George Bush Intercontinental Airport, and Logan International Airport) showed median download speeds over Wi-Fi of less than 25 Mbps, the threshold set by the FCC to qualify as broadband. Learn more about how much speed you need for specific activities here.

There was one change to our airport list this year, which is based on passenger volume: John Glenn Columbus International Airport was removed from the list and Kahului Airport added. We have not included Kansas City International Airport or San Diego International Airport because there were insufficient samples.

Fort Lauderdale-Hollywood International Airport splits their free airport Wi-Fi among four separate SSIDs for different terminals, which we have listed separately in these results. The performance does not vary widely enough between them to hang out in the wrong terminal, but if you’re in Philadelphia you definitely want to choose “Free PHL Airport WiFi” when possible, rather than “Free PHL Airport WiFi-24”.

Mobile performance at 24 airports beats 100 Mbps

Mobile Broadband Internet Speeds Over Free Wi-Fi at U.S. Airports
Speedtest Intelligence® | Q3 2023
A map showing mobile broadband speeds in selected airports in the United States.

Speedtest Intelligence® shows John Wayne Airport, Midway International Airport, St. Louis Lambert International Airport, Salt Lake City International Airport, and Sacramento International Airport were among the airports with the fastest mobile download speeds on our list in the U.S. with median download speeds of 369.29 Mbps, 283.56 Mbps, 281.74 Mbps, 277.65 Mbps, and 275.87 Mbps, respectively, during Q3 2023.

Three airports (Washington Dulles International Airport, Orlando International Airport, and William P. Hobby Airport) showed median download speeds over mobile of less than 25 Mbps.

Wi-Fi or mobile? The airports where it makes a difference

Wi-Fi is the correct choice at 12 airports where download speed over mobile network service is significantly slower than the free airport Wi-Fi. Free airport Wi-Fi is 291% faster than mobile service at Orlando International Airport, 225% at Dallas/Fort Worth International Airport, 193% at Washington Dulles International Airport, and 110% at Hartsfield–Jackson Atlanta International Airport. Wi-Fi at Cincinnati/Northern Kentucky International Airport was 91% faster than mobile, 87% at San Francisco International Airport, 79% at Norman Y. Mineta San José International Airport, 72% at Seattle–Tacoma International Airport, 62% at John F. Kennedy International Airport, 47% at Harry Reid International Airport, 46% at Fort Lauderdale–Hollywood International Airport, and 42% at Baltimore/Washington International Airport.

Twenty-one airports had faster download speeds over mobile than over free airport Wi-Fi during Q2 2023. Mobile service at Logan International Airport was a whopping 1,037% faster than airport Wi-Fi. At Tampa International Airport, mobile was 851% faster than Wi-Fi, and mobile was 341% faster than airport Wi-Fi at Raleigh-Durham International Airport.

Mobile service was 3X faster than airport Wi-Fi at Salt Lake City International Airport, Philadelphia International Airport, Indianapolis International Airport, Southwest Florida International Airport, and John Wayne Airport. Mobile was 2X faster than airport Wi-Fi at Cleveland Hopkins International Airport, Sacramento International Airport, Midway International Airport, George Bush Intercontinental Airport, Portland International Airport, Minneapolis–Saint Paul International Airport, and Detroit Metropolitan Airport. And mobile service was 1X faster than airport Wi-Fi at Charlotte Douglas International Airport, Kahului Airport, Los Angeles International Airport, Denver International Airport, LaGuardia Airport and Louis Armstrong New Orleans International Airport.

We know from our work with Ekahau® that optimizing Wi-Fi at airports is particularly challenging. There can be up to 900 people waiting at each boarding gate, especially during busy travel periods. Airport IT teams have to decide how many Wi-Fi access points to put in each location and how to balance the load across all those access points. Not to mention that mobile hotspots can interfere with all this careful planning. All of this to say that the averages we report here are based on real-world data, but your experience may differ, especially on a busy travel day.

Based on this data, we predict your airport Wi-Fi experience this year will be a big improvement over last year. You can always do your part by downloading at least a few of your entertainment options before you leave the house. While you’re downloading, don’t forget the Speedtest apps for Android and iOS. Help out travelers next year by taking a Speedtest at the airport to share your experience.

Ookla retains ownership of this article including all of the intellectual property rights, data, content graphs and analysis. This article may not be quoted, reproduced, distributed or published for any commercial purpose without prior consent. Members of the press and others using the findings in this article for non-commercial purposes are welcome to publicly share and link to report information with attribution to Ookla.

| October 23, 2023

A Reality Check on the Progress toward a Gigabit Society

The European Commission has set forth an ambitious goal of achieving a Digital Decade 2030 strategy, also known as the Digital Compass. The aim is to expedite the digital transformation of Member States by 2030. One of the primary objectives of this strategy is to improve digital connectivity, which will be measured through specific targets such as 100 Mbps services by 2025 and gigabit coverage to all EU households by 2030. In this article, we will discuss the progress made so far, the disparities in user experience, and the challenges that need to be addressed to achieve Europe’s connectivity goals.

Key messages 

  • Digital Decade Ambition: The ambitious goals of the EU’s Digital Decade strategy are indeed lofty. Broadband services might promise speeds in excess of 1 Gbps, but the reality is that users rarely experience that level of speed. However, while the gap between advertised speeds and actual speeds for gigabit services is wide, speeds approaching 100 Mbps are far more common. 
  • Median Download Speeds and Infrastructure Development: Several European countries are making substantial progress in offering high-speed broadband. Denmark, Spain, France, and Romania have notably fast median download speeds, primarily due to their fiber-to-the-home (FTTH) infrastructure investments. The type of broadband technology used in those countries (and others) significantly influences the gap between download and upload speeds, with fiber-based networks showing more balanced speeds.
  • AltNets Drive Fiber Adoption: Alternative network providers (AltNets) play a vital role in accelerating fiber adoption and addressing challenges mainstream ISPs face. Their role varies across countries and regions.
  • Take-up rates remain a challenge: With the completion of fiber rollout in several countries, the focus has now shifted towards promoting fiber subscriptions. However, there are challenges that persist, such as consumer reluctance and the need for incentives. A survey conducted in rural France revealed that 42% of the respondents found their current internet sufficient, while 37% said that they would be encouraged to upgrade if offered incentives.

You can also register for our November 8 webinar, where a panel of industry experts will discuss how Europe can accelerate the expansion of gigabit-capable infrastructure. Register now

On the road to 100 Mbps

Chart of Percentage of Households Subscribing to Fixed Broadband of at Least 1 Mbps and Proportion of Users that Achieved 100 Mbps

The European Commission aims to ensure that all European households, businesses, and public institutions should have access to “high internet speeds” of at least 100 Mbps by year-end 2025. The EU is showing progress in terms of achieving that target. According to Broadband Coverage in Europe 2022, 86.6% of EU households were within 100 Mbps + coverage, meaning they had access to broadband services capable of providing at least 100 Mbps download speeds. 

While having networks available does not automatically equate to real penetration or adoption rates, it is an important prerequisite. Physical accessibility to network services is a vital first step before actual usage, which is influenced by factors such as affordability, awareness, and the perceived need for the service.

According to the Digital Economy and Society Index DESI 2023 dashboard for the Digital Decade, 55.08% of EU households had already subscribed to fixed broadband services with internet speeds of at least 100 Mbps. While this rate of subscribers is significant and an indicator of the EC’s ongoing progress, the region is still far from achieving its goal of universal, 100 Mbps coverage by 2025. Some countries like Spain, Sweden, and Romania, where over 80% of households subscribe to broadband exceeding 100 Mbps, have already made significant progress in terms of fiber coverage. 

However, in those countries, there is a significant gap between what households subscribe to and what we see from Ookla® data in terms of users actually experiencing speeds above 100 Mbps. Netherlands, France, and Germany are the outliers where we see more users having “high internet speeds” compared to the speeds advertised in their broadband subscription package. This is particularly interesting because Germany still heavily relies on VDSL for high-speed access technologies. Still, there is a significant amount of work to be done before countries can deliver on their strategies to achieve the 100 Mbps target.

Chart of Fibre to the Premise Coverage as Percentage of Households

The EC’s goal of gigabit connectivity is certainly one of the driving forces behind the rollout of fiber networks in the region. So far, progress is mixed across the region in terms of fiber network rollouts and adoption. As we have discussed, regulatory incentives propel the move to fiber. For example, Romania has one of the highest Fiber to the Home/ Building (FTTP/B) penetration rates across the region — nearly 97.7% of households — which is partially driven by government-backed fixed infrastructure projects such as RoNet, and the special attention given to rural and disadvantaged areas. Portugal, which already scored high on fiber coverage, plans to launch an international public tender by the end of 2023 for a project to cover all underserved areas with fiber-optic networks to boost fiber penetration further.

The reality of gigabit speeds 

The European Commission’s Digital Decade 2030 strategy seeks to extend gigabit (1 Gbps) connectivity to every European Union household by 2030. To track the progress of these objectives, the DESI plays a crucial role in tracking EC’s progress. Only 56% of households in the EU have access to the necessary fiber networks for gigabit connectivity, and the take-up rate (proportion of households that subscribe to fiber) is even lower. According to the DESI 2023 dashboard for the Digital Decade, 13.76% of households in the European Union have subscribed to fixed broadband with at least 1 Gbps as of 2022. Nevertheless, there is a significant disparity in these percentages across different EU nations. For instance, only five countries surpassed the EU value – France leading with 39.94%, Hungary second at 29.81%, followed by Romania at 23.35%, Denmark at 18.66%, and Spain at 14.57%.

Chart of Percentage of Households Subscribing to Fixed Broadband of at Least 1 Gbps

Looking at this data one might believe that many European households have access to Gigabit internet speeds. However, the reality is different as not all of them genuinely experience such high speeds. In fact, the proportion of Speedtest® users registering median download speeds of at least 1 Gbps in many countries is quite low. For example, France only had 1.42%, Hungary at 0.54%, Romania at 0.1%, Denmark at 0.03%, and Spain at 0.27%. 

The significant gap between expectations and reality underscores the importance of not only rolling out gigabit-capable networks but also stimulating demand for those services. Service providers also need to pay attention to home networking equipment. Our research has shown that in markets where legacy broadband technology (such as DSL or coax cable) is being replaced by advanced cable and fiber connections, Wi-Fi performance can lag behind ethernet. Wi-Fi speeds typically range from 30-40% of ethernet, indicating a need to accelerate the adoption of more advanced Wi-Fi technologies and optimize the home network environment.

Median download and upload disparities

Median speeds are a standard metric for measuring performance, but there’s more to the story for the end-user experience. Access technology, be it DSL, cable, or fiber, as well as customer premises equipment and end-user devices, significantly influence the user experience. In our recent article, we highlighted how the persistent use of legacy and underperforming Wi-Fi standards in home networks can hamper efforts to provide the best network experience to customers despite progress in terms of fiber rollout and adoption.

Median Download and Upload Speed across a Sample of European Countries

According to Speedtest Intelligence® in Q3 2023, across Europe, Denmark had the fastest median download speed for fixed broadband (196.43 Mbps), followed by Spain (176.08 Mbps), France (170.51 Mbps), and Romania (166.39 Mbps). Notably, several of those countries have a substantial gap between median download and upload speeds. The type of broadband technology implemented can heavily influence the divergence between download and upload performance. Nations still reliant on DSL and cable often exhibit lower median upload speeds and a wider gap between upload and download speeds. On one hand, the UK and Germany lag behind other countries in broadband infrastructure upgrades due to their reliance on copper-based technologies and cable networks and are at the tail end of the ranking. 

On the other hand, Sweden, with a 63% Fiber-to-the-Home (FTTH) penetration rate in 2022, has the narrowest gap between download and upload speeds. Forward-thinking broadband infrastructure and significant municipal involvement have positioned Sweden to reach the EC’s goals in the coming years. France, Spain, Denmark, Romania, and Portugal are also making significant progress toward achieving full-fiber coverage, with France expecting a full-fiber rollout by 2025. As fiber broadband adoption increases, the gap between download and upload speeds will narrow, mainly because fiber subscriptions are typically offered with symmetrical speeds, where users would experience the same level of speed for both download and upload usage. 

However, even when we look at “the best-connected” Speedtest users (those seeing speeds in the top 10th percentile of our results), there’s a wide range of performance. Download speeds ranged between 417.23 Mbps and 844.04 Mbps, while the range for upload speeds was even wider, with median upload speeds ranging from 57.11 Mbps to 599.39 Mbps. 

When looking at speeds at the 10th percentile, only four countries topped 700 Mbps. France led with a top speed of 844.08 Mbps, followed by Hungary at 765.85 Mbps, Denmark at 734.91 Mbps, and Romania at 704.04 Mbps. Notably, three of these countries (Romania, France, and Denmark) also lead in the top 10% of upload speeds, with all three exceeding 500 Mbps. 

While for most countries included in this analysis, top speeds are at least a few hundred Mbps apart, there are a few exceptions. Spain shined bright, with the top 10% of its download and upload speeds closely matched at 611.17 Mbps and 609.17 Mbps, respectively. 

Chart of Top 10% Download and Upload Speed across a Sample of European Countries

Beyond median speeds

To delve deeper into the performance and reliability of internet services across different countries, it can be helpful to look at the expected speed range, i.e., the range of speeds that the majority of users experience. This middle 50% of speeds are captured by the interquartile range, with the lower value of the range, or lower quartile, indicating the bottom 25% of speeds and the upper value of the range, or upper quartile, indicating the top 25% of speeds. Examining Speedtest Intelligence data from Q3 2023, the lower quartile download speed across European countries ranged from 28.15 Mbps to 81.48 Mbps (in other words,, 25% of downloads were below that speed), while upper quartile speeds clocked in between 166.16 Mbps and 441.38 Mbps (i.e., 25% of downloads were above this speed). 

Chart of Distribution of Interquartile Speeds in European Countries, All Providers Combined

Role of AltNets

According to the FTTH Council Europe, alternative operators (AltNets) are playing a significant role in the adoption of fiber in the EU39 region. The EU39 region comprises the EU27, the UK, Iceland, Israel, North Macedonia, Norway, Serbia, Switzerland, Turkey, and 4 CIS other countries. In 2021, around 56% of FTTH/B initiatives were led by AltNets, which marks a shift from 2011 when alternative ISPs had a 71% share, and incumbents accounted for only 21% of initiatives. 

Chart of Number of Active Internet Service Providers (ISPs) and FTTH Share of All Connections

We looked at data from Omdia to determine whether there is a correlation between the number of active ISPs and the speed of the transition to fiber networks measured by FTTH share of all connections. The relationship is not straightforward and varies significantly depending on each country’s competitive landscape and government initiatives. 

Across a number of countries fiber accounts for the majority of subscriptions – Spain comes on top with 81.8%, followed by Romania (81.7%), Sweden (77.5%), and Portugal (62.4%). Spain is a good example of a market that has been migrating to fiber away from copper ahead of the incumbent Telefonica turning off its legacy fixed network in 2024. Furthermore, Spain’s National Commission for Markets and Competition (CNMC) has simplified its ‘MARCo offer’, making it easier for alternative operators to access Telefonica’s infrastructure to launch their own fiber optic services. 

It is worth noting that countries like the UK and Poland, which have many ISPs, are also leading the way in AltNet-driven fiber initiatives. In our previous article looking at the impact of AltNets in the UK, we concluded that AltNets played an important role. In fact, AltNets provided the top speeds in London, Glasgow, Liverpool, and Manchester, as well as across a number of counties. Public funding has helped facilitate the emergence of fiber ISPs in rural areas where fiber deployment is not commercially viable. Other AltNets like Hyperoptic are already well established, deploying and operating an FTTP network in high-density areas, which connects existing and new multi-dwelling buildings.

Take-up rates come with challenges

As fiber rollout nears completion in some countries, the focus shifts to selling fiber subscriptions to households that are within fiber network coverage. Sweden leads with an 80.1% consumer take-up rate (proportion of households that subscribed to and are actively using fiber-optic broadband services), but Spain, Norway, and France also boast high rates above 70%. 

Chart of FTTP Take-up Rate in European Countries

Sweden was the country that pioneered the open access model for fiber networks to drive competition and contributed to the country’s high fiber broadband penetration rates. Fiberhost, a Polish open-access network provider, is a significant beneficiary of EU funds, with 99% of funding for building the country’s fiber network in white spot areas (areas with limited or no access to high-speed internet).

There also has been notable progress in the wholesale networks market in Europe, some of which look to connect remote and rural areas. The Italian wholesale operator, Open Fiber, is partially funded by the country’s National Recovery and Resilience Plan (PNRR), with the goal of connecting the grey areas (where no other operator has plans to develop an NGA network) to gigabit speeds. 

However, challenges persist in convincing consumers to switch to full fiber, even in countries with high take-up rates. For instance, a joint venture by Orange conducted a survey in rural areas of France to understand why households with FTTH access hadn’t upgraded to fiber services. The study revealed that 42% found their current internet sufficient, while 37% said incentives would encourage them to upgrade. Incentives and other initiatives are being implemented to migrate customers onto fiber networks in many countries in the region and across the world. 

Future Initiatives and Investments

Fiber offers superior internet speeds, lower latency, enhanced security, and environmental sustainability – a noteworthy upgrade from copper networks and also a path forward for some cable operators (instead of DOCSIS 4.0). AltNets are making strides in driving fiber deployment across Europe, pushing toward the EC’s ambitious goals of achieving a gigabit society.

Despite progress, obstacles remain in convincing consumers to fully transition to fiber services. Comprehending consumer behavior, promoting fiber benefits, and inspiring initiatives will all play significant roles in this endeavor. Likewise, continued investments must be made to keep Europe on track to attain its connectivity targets

For more insightful updates on Europe’s fiber connectivity status, look forward to the Network X event in October 2023. It’ll offer a live pulse on the latest developments in fiber connectivity. We will continue to follow European countries’ progress toward Gigabit society and monitor its impact on fixed broadband speeds. If you’d like to learn more about internet speeds and speed performance in other markets around the world, visit the Speedtest Global Index™.

You can also register for our upcoming webinar, “Accelerating Europe’s Gigabit Revolution” on Wednesday, November 8 at 9 a.m. CET (GMT+1). A panel of industry experts will come together to discuss how Gigabit Society fits into Europe’s digital transformation strategy and propose strategies to ensure digital access for all. A recording will be provided for registrants who can’t join the live presentation. Register now

Ookla retains ownership of this article including all of the intellectual property rights, data, content graphs and analysis. This article may not be quoted, reproduced, distributed or published for any commercial purpose without prior consent. Members of the press and others using the findings in this article for non-commercial purposes are welcome to publicly share and link to report information with attribution to Ookla.

| November 1, 2023

Plan, Optimize, and Monitor Your 5G Network with QoS and QoE Data

5G is a critical technology for the future of mobile communications. To meet the growing demand for mobile data and to enable innovative applications, mobile network operators are expanding 5G networks around the world. As operators face economic challenges with inflation and constrained Capex budgets, the optimization of existing infrastructure and cost-effective investments is essential. Having access to good quality data can help them make informed decisions on how best to allocate resources. Crowdsourced data needs to be a part of the 5G network strategy because it provides operators with a real-time view of their 5G network performance and coverage, as well as insights into how users are experiencing the network. 

Operators can use QoS (Quality of Service) and QoE (Quality of Experience) metrics to plan, monitor, and optimize 5G network performance. In this article we will look at an example of how an operator in Bangkok, Thailand has used Ookla’s QoS and QoE data over the past two years. 

Planning where to add 5G SA cell sites or deploy 5G NSA 

QoS and QoE data can help operators understand whether to add 5G standalone (SA) cell sites or deploy 5G non-standalone (NSA) on existing 4G cell sites. Using Ookla Cell AnalyticsTM, operators can find out where they have poor coverage and performance with existing cell sites, so that they can prioritize additional cell sites in areas that need the most improvement. 

As 5G replaces 4G LTE footprints, operators need to understand existing LTE network performance. LTE optimization priority is a KPI that can help operators identify where optimization is needed by showing areas that have good LTE signal level and poor signal quality. A high percentage indicates that optimization is most urgently needed, and a low percentage indicates that no optimization is needed. 

Looking at data from late 2021, we can see areas with high optimization priority (shown by the red bins in the first image), and network performance test results that indicate low LTE downlink throughput and low 5G downlink throughput (shown by the red dots in the second image). 

Operator A was able to visualize the areas with high optimization priority and low download speeds on LTE and 5G, indicating that those areas have good coverage but bad quality, and should be prioritized for adding new 5G sites.

Operators can also use Consumer QoETM to understand where they have poor user experience and where a new 5G cell site would have the most impact on QoE metrics such as web page load time for web browsing. Customers expect to have good connectivity on the go, so slow page load time for web browsing leads to poor customer experience. 

Looking at data from 2022, Operator A was able to see on a map where web pages were taking the most time to load on customer devices (shown in red). 

Operators can also use Cell Analytics to see where existing 5G cell sites are on their network. In the screenshot below, we can see all of the 5G cell sites for Operator A in Bangkok, Thailand. 

Using 5G cell site locations in conjunction with RF metrics such as LTE optimization priority and QoE metrics like web page load time, Operator A was able to make informed decisions about where to add new 5G SA cell sites or deploy 5G NSA. 

Optimizing your 5G network

After adding new 5G SA cell sites and deploying 5G NSA, operators can use Ookla data to continually optimize their 5G network. QoS and QoE data supports optimization use cases including pinpointing overshooting cells, finding areas with a lack of cell dominance, and identifying areas where users are experiencing poor performance, coverage, quality, or degrading QoE. 

For example, Operator A was able to identify areas with high data traffic that was leading to poor signal quality. In the image below, Operator A can see that mobile data usage is particularly high (shown in red) in the Ratchaprasong District, a popular shopping area with 9 major malls and more than 5,500 shops. 

Taking a look at 5G RSRQ data for this area, Operator A was able to see that signal quality was poor (shown in green and blue) in some of the busier areas of the shopping district.

These problem areas with high traffic and low signal quality are areas where Operator A should optimize their network by ensuring signals are routed efficiently. One year later in Q2 2023, there are many more areas with strong signal quality (shown in red), indicating that Operator A has improved the signal quality in the area. 

We can see that the improvement is due to a new 5G cell site, and we can examine its cell ID and PCI along with its coverage footprint. We can also see that this operator is using the 2500 MHz frequency band for 5G in the area.

Monitoring your 5G network performance and competitor rollouts 

To ensure that customers are realizing the improved QoS and QoE that 5G has promised, it’s important that operators are continuously monitoring and optimizing their network. Operators can use Ookla data to validate the impact that the rollout has had on performance, coverage, and quality. 

Looking again at LTE optimization priority and downlink throughput two years later in 2023, we can see that Operator A has successfully optimized the network and is providing better RSRP, RSSNR, and download speeds to their customers than they were in 2021 (less red and more green). 

Additionally, Operator A can validate improved QoE by looking at web page load time in 2023. There are significantly more green areas on the map than there were in 2022, indicating that page load times in Bangkok have become much faster and Operator A is now providing a better quality of experience.

Operators can also monitor the rollout of their own network and competitor networks by viewing 5G cell site locations. Operator A can see their 5G cell sites (shown in green), as well as their competitor Operator B’s 5G cell sites (shown in red). Operator A is able to see that they are leading the way in 5G deployments for Bangkok. 

From 2021 to 2023, Operator A used Ookla data to plan where to build 5G SA cell sites and deploy 5G NSA, optimize their 5G network, validate network improvements, and monitor competitor rollouts. 

As operators expand their 5G networks to meet the increasing demand for mobile data and support innovative applications, the need for efficient network management becomes paramount. Ookla can help operators make data-driven decisions at every stage of the 5G lifecycle — planning, optimizing, and monitoring — allowing them to stay ahead and deliver exceptional mobile performance to customers. If you’re interested in getting started with Cell Analytics or Consumer QoE, inquire here

Ookla retains ownership of this article including all of the intellectual property rights, data, content graphs and analysis. This article may not be quoted, reproduced, distributed or published for any commercial purpose without prior consent. Members of the press and others using the findings in this article for non-commercial purposes are welcome to publicly share and link to report information with attribution to Ookla.

| October 24, 2023

Government and Regulatory Support is Key to Improving 4G Performance in Africa

In this article, we analyze select African countries that have consistently improved their ranking in Ookla’s Speedtest Global Index™ between June 2020 and June 2023 and discuss the drivers that contributed to this rise. These countries can provide lessons and best practices that other operators and regulators can apply to bridge the 4G performance gap.

Key takeaways

  • Government and policy intervention is critical in supporting the rollout of 4G networks in Africa. Operators need more than ever support amid the challenging macroeconomic, operating conditions, and shrinking consumer disposable income. For example, the government intervened in Nigeria to cancel excise tax to reduce operators’ financial burden, promoted infrastructure sharing in Cote d’Ivoire and Zimbabwe to speed up network deployment, and led the expansion of 4G infrastructure in Libya.
  • Spectrum availability is crucial to improving network performance and coverage to meet growing data demand. For example, public authorities encouraged the efficient spectrum usage by freeing up legacy bands and refarming existing ones in Mauritius, Namibia, and Tanzania, and by adopting technology-neutral spectrum licensing in Zimbabwe.
  • Non-punitive network QoS compliance policies can help drive investments and promote fair competition. Policymakers and regulators in Africa are increasingly adopting alternatives to financial sanctions to encourage operators to meet coverage and QoS obligations. For example, the regulator in Tanzania mandated network investments instead of issuing non-compliance penalties.

Some African countries show a marked improvement in 4G download and upload speeds as well as coverage

Cellular networks are critical to connect individuals and businesses as internet access in Africa is predominantly mobile. In addition, the adoption of digital services, spurred by the COVID-19 pandemic, has rapidly increased the demand for data services. As a result, consumer needs and economic growth will increasingly depend on a fast, reliable mobile network.

We used Ookla’s Speedtest Global Index™ to identify African countries that have consistently improved their mobile speed ranking between June 2020 and June 2023. We then used Speedtest Intelligence® data to compare 4G mobile performance on modern chipsets between Q2 2020 and Q2 2023.

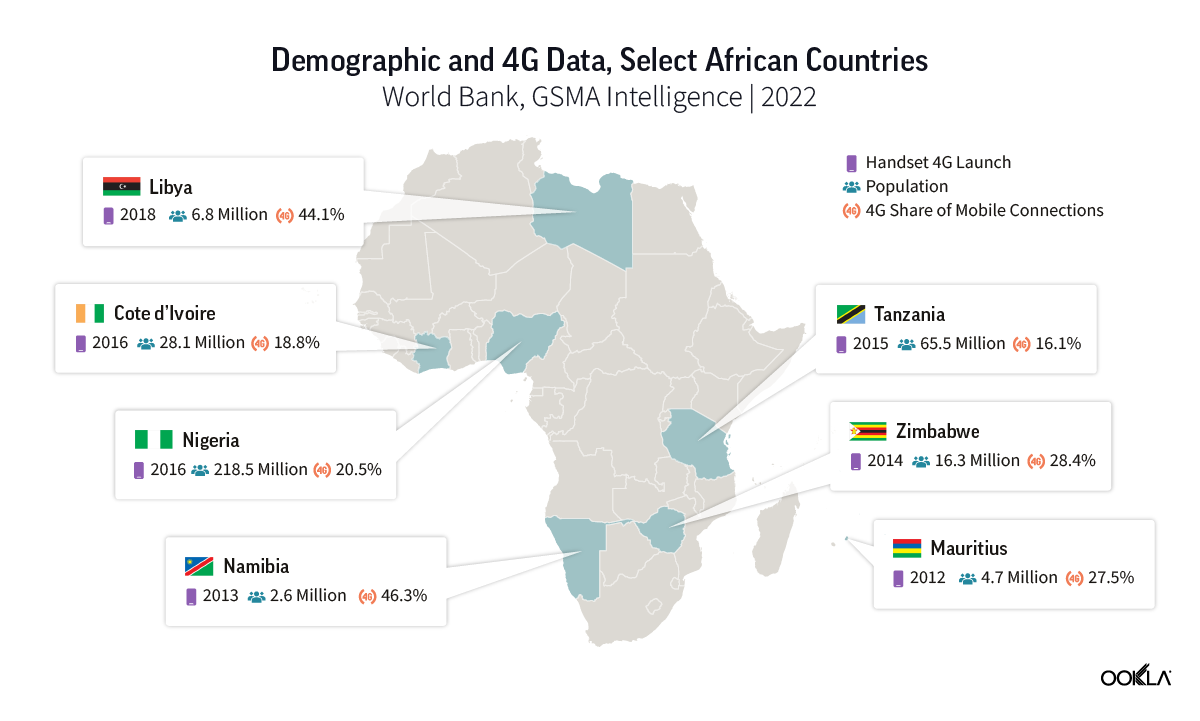
We focused on markets that offer strong growth potential for 4G, so we selected countries whose 4G share of connections was lower than 50% at the end of 2022 (based on data from GSMA Intelligence). The shortlisted countries represent different sub-regions and have different demographical and geographical characteristics, as shown on the map below. 

Map of Demographic and 4G Data in Select African Countries

According to Speedtest Intelligence data, Cote d’Ivoire showed impressive improvement in 4G network performance since Q2 2020, reaching a median download speed of 23.8 Mbps in Q2 2023, the third highest speed behind only Mauritius with 27.33 Mbps and Namibia with 26.92 Mbps. Tanzania doubled its 4G download speeds to 20.83 Mbps while Libya, Nigeria, and Zimbabwe had download speeds between 15 Mbps and 20 Mbps in Q2 2023.

Chart of 4G Median Mobile Downloads Speeds Comparison in Select African Countries | Q2 2020 - Q2 2023

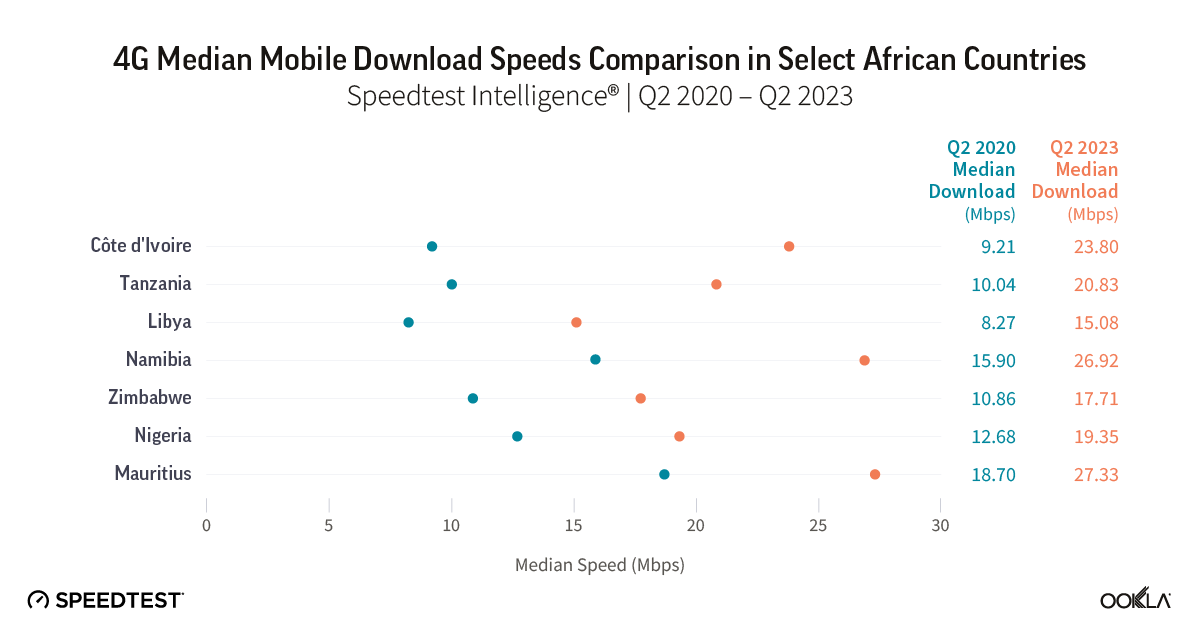
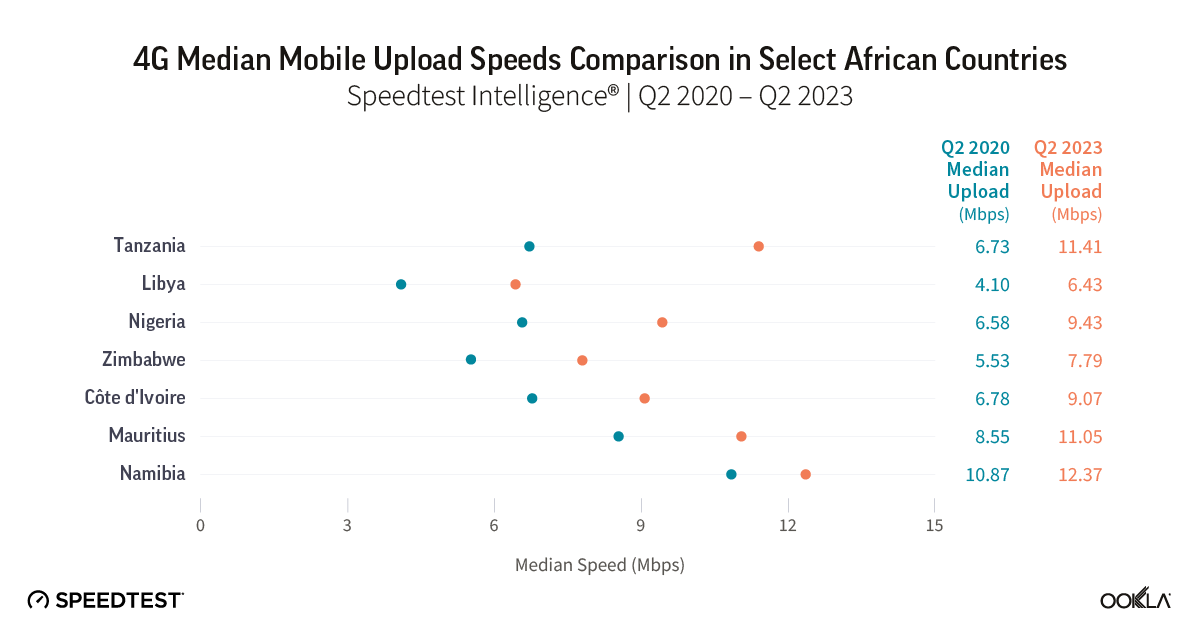
Improvements in upload speeds over the same period and the differences between the countries were less pronounced than download speed results. With a jump of 1.6 times in 4G upload speed between Q2 2020 and Q2 2023, Tanzania moved from fourth to second place, ahead of Cote d’Ivoire and Mauritius and just behind Namibia. Notably, Libya lagged behind other countries in download and upload speeds but improved markedly over three years, despite being the last one to launch 4G in 2018, and arguably, where operators had the most challenging environment. 

Chart of 4G Median Mobile Uploads Speeds Comparison in Select African Countries | Q2 2020 - Q2 2023

In the following sections, we analyze market dynamics in each country, review operators’ 4G investments, and discuss the factors that drove (or inhibited, at times) 4G market development.

Cote d’Ivoire has plenty of room to increase 4G adoption

Mobile penetration of the population in Cote d’Ivoire increased rapidly since 2020 to reach 142.4% in Q1 2023 (according to Autorité de Régulation des Télécommunications (ARTCI)). 

Orange is the largest mobile operator in Côte d’Ivoire in terms of subscribers (45.6% in Q1 2023) and 4G network population coverage (90.6% in December 2022). It launched 4G services in March 2016 over 1800 MHz. It expanded its subscriber base rapidly thanks, in part, to a $312 million investment in network deployment and upgrades in 2019 and 2020. It also set a plan to invest a further USD120 million between 2020 and 2025 to upgrade the fiber-optic backbone of its 4G network. 

MTN captured just over a third of mobile subscribers in March 2023. It launched 4G shortly after Orange, followed by LTE-A in Abidjan in December 2020, the only operator to offer this service to date in the country. In October 2022, it signed a $75 million five-year contract with Canadian infrastructure supplier NuRAN Wireless to expand its network coverage in rural areas. However, we understood that this only concerns 2G and 3G services. MTN’s 4G coverage reached 57.4% of the population at the end of 2022, way behind Orange. 

Moov had been capturing an increasing share of mobile connections until 2018. Since then, its market share has remained mostly stable at around 20%. It launched 4G services in Q3 2016 over 900 MHz. Moov has extensive network coverage in remote areas, which has helped it to grow its subscriber base. Coverage reached just over half of the population at the end of 2022, lagging behind Orange and MTN.

The three operators managed to rapidly expand 4G coverage after launch. According to Speedtest Intelligence®, 4G service availability, which represents the proportion of an operator’s known locations where a device has access to 4G LTE service, already reached 83.5% in 2018 and increased to 94.3% during Q1-Q3 2023. Despite this, 4G share of mobile connections remains low at 18.8% in 2022 (according to GSMA Intelligence). The unaffordability of smartphones, combined with the limited coverage in rural areas and poor network QoS remain obstacles to mobile data adoption.

To address these challenges, Orange and MTN launched financing schemes and introduced affordable handset models. Further, ARTCI initiated discussions with the operators in 2022 on how to implement improvements in their network and was given additional powers to improve service quality levels. ARTCI also awarded the three operators 2×20 MHz in the 2600 MHz band for LTE to improve network data capacity and is looking for infrastructure sharing as an option to speed up 5G deployment, in time for the African Cup, which will take place at the beginning of 2024.

Government support was pivotal in Libya to accelerate 4G rollout amidst challenging conditions

Libya experienced prolonged political unrest and violence since 2011, leading to the destruction of communication networks, equipment theft, and power shortage. The progressive return to stability since 2021 has somewhat enabled the restoration and extension of existing network infrastructure.

Despite these challenges, Libya has one of the highest mobile penetration in Africa (178.5% in June 2023, according to GSMA Intelligence), and it is one of the few North African countries with an MVNO (albeit capturing less than 1% of the market). The market is a duopoly with two subsidies of Libyan Post, Telecommunication and Information Technology Company (LPTIC): Al Madar Aljaded and Libyana. Both operators introduced 4G over 1800 MHz in 2018, initially covering only a few cities.

Libyana took the lead by launching LTE in January 2018 and covering 30 major towns and cities by the end of that year. It subsequently expanded coverage to more than 49 towns and cities by April 2022. 

Almadar Aljaded launched LTE and LTE-A in October 2018 in Greater Tripoli Benghazi and Misrata before expanding nationwide, claiming coverage for more than 80% of the population in 2022. 

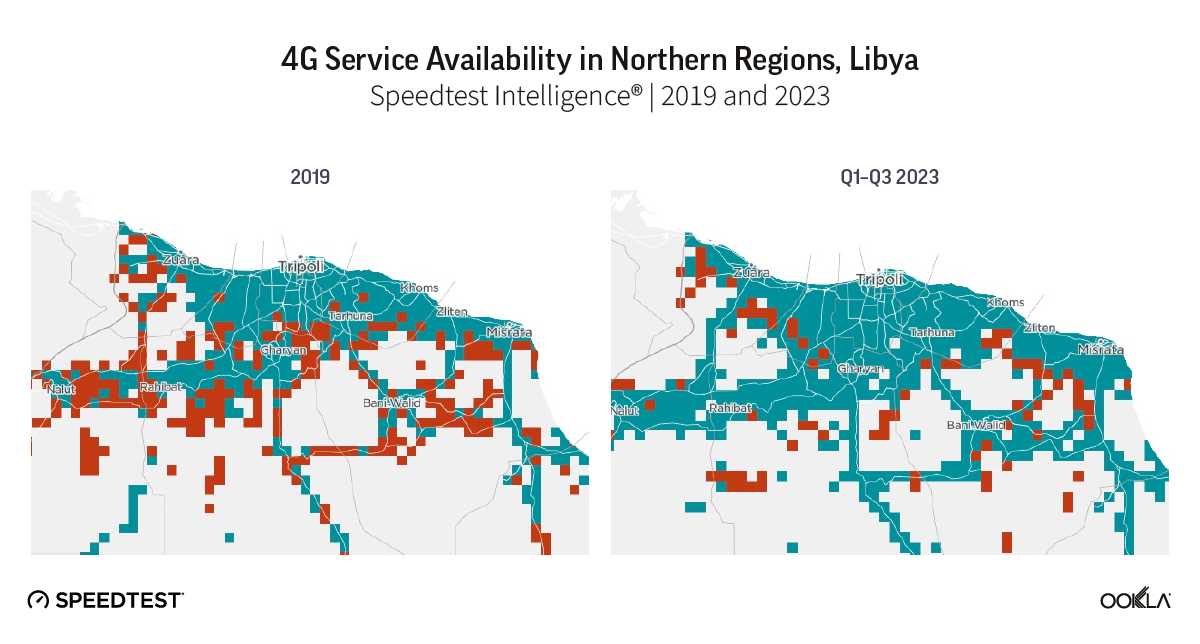
4G deployment gained momentum and the restoration of the telecoms infrastructure resumed thanks to LPTIC’s program launched in 2021 to extend LTE coverage to underserved areas thanks to cooperation agreements with foreign governments and telecoms groups. According to Speedtest Intelligence®, access to 4G service increased from 11.8% in 2019 to 76.8% during Q1-Q3 2023. Northern regions had particularly benefited from network coverage enhancements as shown in the map below where green squares show locations where 4G service is available and red squares where 4G service is unavailable.

This coverage expansion was accompanied by a boost to median download and upload speeds reaching 15.08 Mbps and 6.43 Mbps in Q2 2023, respectively. However, 4G network throughput is low compared to the performance of other countries featured in this article, suggesting that there is room to improve capacity.

Unfortunately, the deadly floods that struck the eastern part of the country in September 2023 are a significant setback. We expect network expansion and upgrade efforts will be delayed as funding will be directed toward relief efforts and the restoration of basic mobile services.

Maps of 4G Service Availability in Northern Regions, Libya | 2019 and 2023

The allocation of additional spectrum in Mauritius helped to improve 4G coverage and speed

Mauritius is an early adopter of 4G with a saturated mobile market (population penetration reached 160.0% in Q3 2023). The market has three active mobile network operators: incumbent operator Cellplus Mobile Communications (under my.t mobile), Emtel, and Mahanagar Telephone Mauritius Limited (MTML) (operating under the CHiLi brand).

Cellplus Mobile launched 4G in 2012 over the 1800 MHz band. It initiated a major network modernization project in 2017, which resulted in a 50% increase in data traffic in 2018 enabling 4G traffic to overtake 3G traffic for the first time. It achieved quasi-nationwide 4G coverage by mid-2019.

The second operator Emtel also launched 4G in 2012 and claimed its 4G network covered the whole island by end-2022. Lastly, MTML (CHiLi), introduced LTE services in 2015 and progressively expanded coverage until it reached 90% of the population by end-2022. This led to a 7% increase in monthly data traffic year-on-year in FY2022/2021.

Operators continued to improve 4G coverage and speed as they prepared to launch 5G. According to Speedtest Intelligence®, access to 4G service increased from 64.40% in 2019 to 96.3% during Q1-Q3 2023. During that period, Mauritius pulled further ahead than the other countries with 27.33 Mbps median 4G download speed in Q2 2023, overtaking Namibia which, until then, had the fastest download speed among the countries analyzed.

These achievements were partly driven by initiatives led by the Information and Communication Technologies Authority (ICTA) which continually encouraged the refarm and release of additional spectrum. For example, the 2100 MHz spectrum (1920‐1980 MHz paired with 2110‐2170 MHz) was reused for LTE and LTE-A services since 2018, after being used exclusively for 3G. ICTA also assigned 2×10 MHz of spectrum in the range 832MHz-862MHz and 791MHz-821MHz for LTE services in 2021, which helped to increase 4G coverage.

Access to additional spectrum and operators’ investment in Namibia helped to boost 4G coverage and performance

Mobile population penetration reached 110.7% in Q3 2023, behind other African markets with similar GDP. Similar to Libya, the market is a duopoly with two mobile operators controlled by a state company, Namibia Post and Telecommunications Holdings (NPTH): MTC, with an 86% market share, and Telecom Namibia (TN Mobile).

Market leader MTC launched a 4G LTE network over 1800 MHz in May 2012, initially for mobile broadband only. MTC then activated LTE-A in April 2016 contributing to boosting download speed, despite limited service availability in selected urban areas. MTC refarmed 2100 MHz for LTE in 2018 and was awarded 2x5MHz lots in the 900 MHz spectrum band in August 2021, but that was deemed insufficient to serve its large subscriber base. It initiated the ‘081EVERY1’ project to build additional base stations and upgrade 4G infrastructure in towns to provide 100% population coverage by the end of 2023. However, we understand that this objective has not been attained as of October 2023 (LTE coverage expanded to more than 68% of the population in 2022).

TN Mobile launched 4G in November 2013 and LTE-A in late 2019, using only 1800 MHz. In July 2022, the operator outlined a plan to invest more than $124 million over five years to modernize its network, starting with its national backbone, core network, and access technologies to boost population coverage and network QoS. Before that, TN Mobile had been deploying or upgrading mobile sites in selected rural and urban areas since 2019 to achieve 100% population 4G coverage by end-2023. However, the cost of competing with the dominating incumbent operator will likely make it difficult to achieve it.

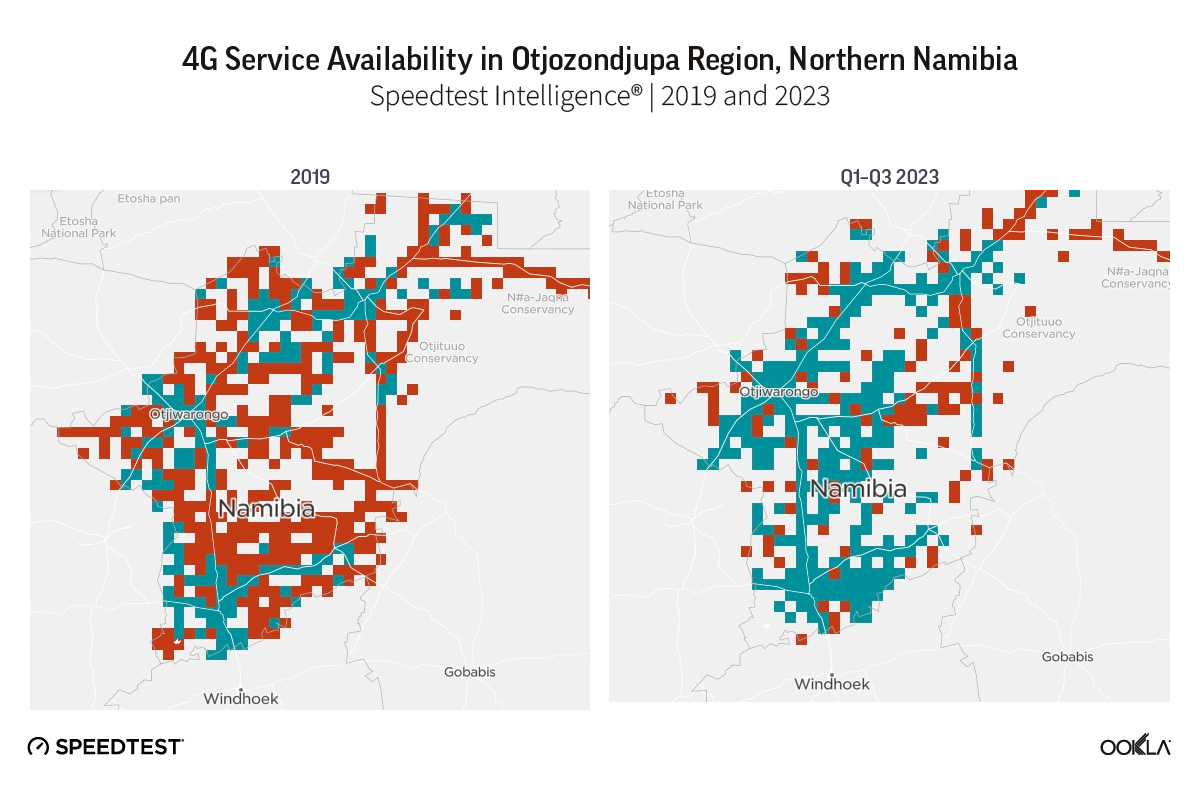
According to Speedtest Intelligence, 4G service availability in Nambia increased from 24.7% in 2019 to 76.6% over January-October 2023, with the Otjozondjupa region showing substantial improvement (see map below). However, according to the Communications Regulatory Authority of Namibia (CRAN), only seven out of fourteen regions were covered by 4G, calling for more private-sector investment to increase 4G footprint. To support these efforts, the CRNA kicked off the auction process for 700 MHz (703-788 MHz) and 800 MHz (790-862 MHz) frequency bands in February 2023. The spectrum was awarded in October 2023 to the two mobile operators and local ISP Loc8 Mobile for 4G and 5G services.

The three licensees should provide 4G and 5G services with at least 20 Mbps download speed and have to extend 4G coverage to at least 80% of the population in six out of the 14 regions. This suggests that operators will need substantial investments in network infrastructure to satisfy these coverage and speed requirements.

Maps of 4G Service Availability in Otjozondjupa Region, Northern Namibia | 2019 and 2023

Access to multiple spectrum bands helped operators in Nigeria to rapidly expand 4G network coverage

Nigeria is the largest market in Africa in terms of mobile connections with over 220 million mobile subscribers. The market peaked in 2020 and then contracted due to the implementation of the SIM registration policy. The market started recovering more in the second half of 2021 as previously-restricted subscribers obtained a new SIM through ID verification. Mobile penetration reached 90.3% in Q3 2023.

The market is highly competitive with three main players: MTN (38.7% share of subscribers in July 2023), Glo (Globacom) (27.82%), and Airtel (27.24%). 4G coverage increased rapidly to reach 80.9% at the end of 2022 though adoption peaked at around 25% before starting to fall as some customers migrate to 5G. 

Glo was the first main operator to introduce 4G services in 2016 over 700 MHz, which it then combined with 1800 MHz spectrum in 2019. It launched LTE-A in 2023 by combining  700 MHz, 1800 MHz, and 2600 MHz (which it acquired recently), and plans to deploy 4,000 LTE-A mobile sites in major towns and cities.

MTN launched 4G the same year using 1800 MHz and 2600 MHz bands. It then launched LTE-A by combining 2600 MHz and 1800 MHz in 2019. MTN then acquired 800 MHz spectrum to improve coverage 4G coverage which reached 83% in 2023. Its CAPEX (excluding right-of-use assets) increased by 18.1% in 2022 to around $470 million to accelerate 4G and 5G network expansion. In September 2023, it acquired an additional 10 MHz of spectrum in the 2600 MHz band to improve the capacity of its LTE network. 

Airtel was the last to launch LTE over 1800 MHz, before incorporating 2600 MHz in 2019 and 900 MHz in 2022, which helped to expand coverage to more than 463 locations in the country.

Maps of 4G Service Availability in Nigeria | 2019 and 2023

Operators faced several technical and operational challenges that impacted the quality of 4G connectivity in Nigeria. This was the result of the network infrastructure not being able to keep up with pent-up demand for mobile device services. Other factors also contributed to the deterioration of network quality including the limited access to continuous power supply, vandalism, and multiple taxes and levies. 

Furthermore, the Nigerian Communications Commission (NCC) and the government took a tough stand against operators for failing to meet QoS obligations or delaying tax payments, resulting in significant fines between 2012 and 2016. 

The NCC started adopting less punitive measures against operators recently and being more actively engaged with them on QoS issues, following the South African model. The government also reversed its decision to impose a 5% excise duty on telecom services in 2023. These measures should help somewhat operators weather the current challenging macroeconomic climate.

The regulator’s efforts helped improve 4G coverage in Tanzania but data services remain unaffordable to most of the population

Tanzania has a crowded mobile market with seven operators and fierce price competition. The introduction of biometric SIM identification slowed market growth in 2020 (the market contracted by 9.5 million) before recovering in 2021. Mobile penetration reached 93.9% in June 2023.

Three operators dominate the market: Vodacom (30% of subscribers in June 2023), Airtel (27%), and third-placed Tigo (27%), which was acquired by a consortium led by Axian Telecom in April 2022.

Vodacom launched 4G commercially in 2016. It uses 700 MHz and 1800 MHz spectrum bands. It reported having deployed 2315 4G sites by the end of 2022 (up from 1814 in September 2021) and that broadband coverage reached 93% of the population.

Airtel launched LTE services over 1800 MHz in the capital Dodoma in November 2019 then expanded to other cities in 2020. It announced the deployment of its ‘Supa 4G’ LTE-A network in 2021 which uses 700 MHz and 2100 MHz in 500 cities and villages. It claims to have rolled out LTE-A in 80% of its mobile sites by April 2022. Airtel was also allocated an additional spectrum in the 1800 MHz band in 2019. 

Tigo launched LTE services in Dar es  Salaam in April 2015 over 800 MHz. It progressively expanded its network to reach 26 regions by February 2022. It launched LTE-A in September 2018 over 800/1800 MHz in a limited number of cities. In May 2022, Axian Telecom announced plans to invest $500 million in infrastructure over the next five years to improve 4G coverage and QoS, especially in rural areas, and to support the country’s digital transformation and bridge the digital divide. 

Maps of 4G Service Availability in Tanzania | 2019 and 2023

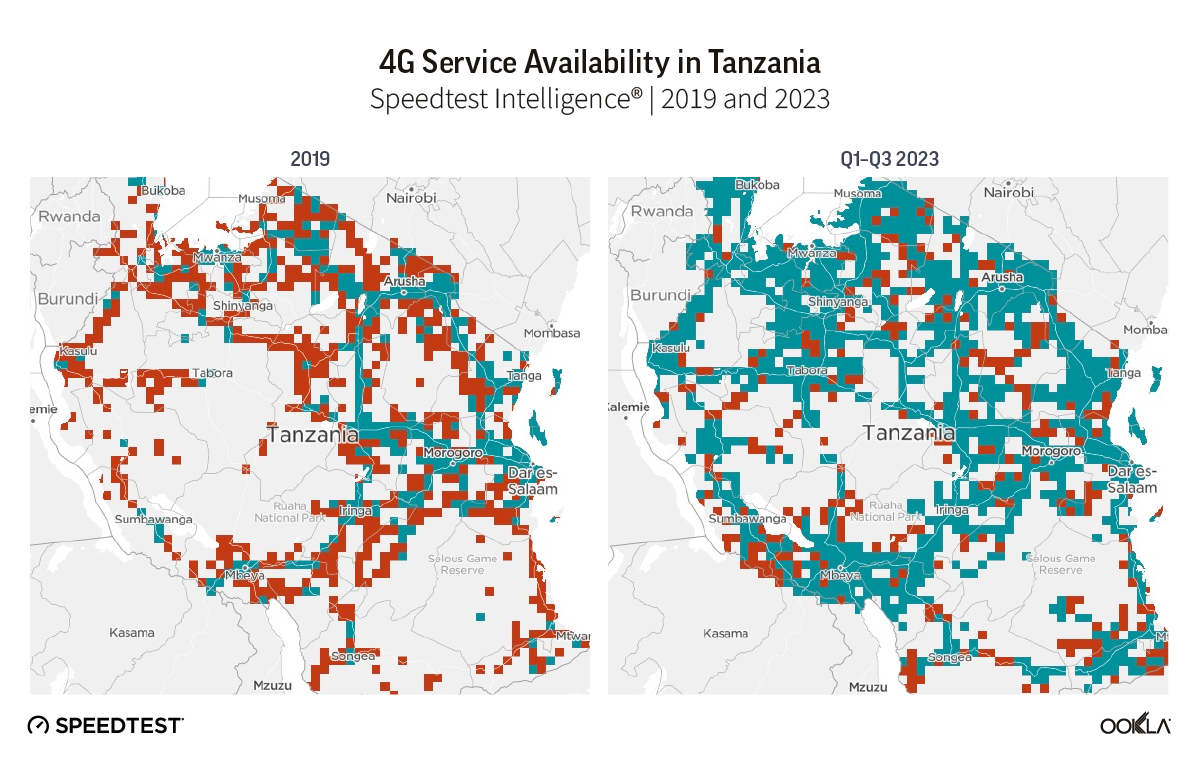
The Tanzania Communications Regulatory Authority (TCRA) has been less punitive than before. For example, in 2019, it fined the six operators $2.6 million for failing to meet QoS standards. However, in 2021, the TCRA ordered the operators to invest $16.4 million to address network issues rather than issue a new fine

The government also freed up the 700 MHz band and auctioned it off in 2018 to enable operators to provide 4G data services to more communities. Four years later, another auction was completed for 2300 MHz, 2600 MHz, and 3500 MHz bands to be used for 4G and 5G. More recently, the government launched the ‘Digital Tanzania’ project in May 2023 in partnership with mobile operators and with support from the World Bank to reach 80% broadband population penetration by 2025. Operators will use the universal access fund to deploy 758 mobile towers to provide data services to 1407 villages and over 8.5 million potential users. 

While 4G coverage reached 65%, Tanzania has the lowest 4G share of connections among the countries reviewed in this article, at 17.8% in Q2 2023. Furthermore, according to TCRA, only 27% of Tanzanians owned smartphones and mobile internet-enabled devices in 2022. 

This suggests that many consumers still can not afford data-enabled handsets and that data tariffs remain out of reach for most Tanzanians, given low income levels, since most of them live in rural areas and work in the agriculture sector.

The government plays a crucial role in progressing the national broadband connectivity agenda in Zimbabwe

According to the Postal and Telecommunications Regulatory Authority (POTRAZ), mobile penetration reached 91.9% at the end of Q2 2023. Mobile data connectivity is the most common way to access internet services. 3G and 4G services represented more than 98% of data connections in the country, and the main driver for internet penetration.

The market is dominated by Econet which controls 72.3% of subscriptions as of June 2023. It launched 4G over 1800 MHz in August 2013, but adoption was muted because of limited coverage, and expensive tariffs. Fast forward to October 2022, and 4G network reached 39% of the population. Econet has the highest number of LTE base stations in the country, 54.3% of the 1962 stations in June 2023. In September 2023, it announced the deployment of 30 new 4G sites by March 2024 and an upgrade of all existing 2G sites to 4G in the eastern provinces. 

NetOne is a state-owned operator and the second-largest player with a 25.5% market share in June 2023. It launched 4G in November 2014, using 1800 MHz before adding 700 MHz in 2016. It resumed deployment of LTE base stations in rural areas in 2021, which helped it to control more than 44.5% of total 4G towers in the country (867 base stations) and grow its data subscribers.

Telecel has been struggling to maintain its market share over the past few years. It initially opted not to launch LTE along with competitors because it believed that the market was not ready. It eventually introduced LTE in late 2017 but had just 17 LTE base stations according to the regulator by mid-2022.

The government announced its plan to raise internet penetration to above 75.0% by 2025, up from 65.2% in Q2 2023. It announced the national broadband program covering 2023–2030 to reduce the cost of broadband access to 2% of the average monthly income from 10.1%. The government is committed to raising the funds for this plan which includes the deployment of fibre infrastructure for broadband access and backhaul. It also plans to deploy 300 base stations across the country to be shared by the operators to support mobile services in rural areas using the universal services fund.

This is a vital initiative as operators are struggling to finance their network deployment and upgrade their networks due to currency depreciation, and limited access to foreign currency to pay for equipment. Their revenues are also down due to the reduction in consumer spending as a result of inflation and reduced disposable income, which is impacting their ability to finance their infrastructure development plan.

It is clear, from the examples discussed above, that the role of governments and regulatory authorities is crucial to making mobile data services accessible in Africa. Operators need sufficient spectrum, favorable policies and regulations, and the support they need to expand 4G infrastructure. In light of the current macroeconomic and operational challenges hindering the adoption of 4G, such as spectrum availability, coverage requirements, and handset affordability, overcoming these challenges will help with the next phase of 5G development.

Connectivity is crucial to economic development, competitiveness, and innovation in the Middle East and Africa region. Ookla’s crowdsourced insights and data help policymakers make informed decisions on how to use spectrum efficiently and improve network performance and user experience. Ookla also regularly hosts events in the region to help regulators share knowledge and experiences on how to close the digital divide. Regulatory officials from Jordan, Palestine, Iraq, Qatar, Bahrain, and Libya attended the last regulatory summit in June 2023 in Jordan.

Ookla retains ownership of this article including all of the intellectual property rights, data, content graphs and analysis. This article may not be quoted, reproduced, distributed or published for any commercial purpose without prior consent. Members of the press and others using the findings in this article for non-commercial purposes are welcome to publicly share and link to report information with attribution to Ookla.

| October 24, 2023

You Did It! Speedtest Reaches 50 Billion Tests!

Speedtest® has always been about the people. Built by a few to help the many, Speedtest.net has grown from a side project to a global brand with a full set of apps, from a tool used by select gamers to test their ping to a resource used by millions of people (and one superhero) to diagnose and measure internet connectivity around the world. And anonymized data from Speedtest now fuels internet service providers, mobile operators, governments, and NGOs with the information they need to improve internet connectivity for everyone. That’s because of you. Collectively you have helped us achieve over 50 billion Speedtest results. Thank you!

50 Billion Speedtests Taken Animation

How Speedtest has grown

The internet has changed a lot since that first touch of the “Go” button. Speeds have improved dramatically, new technologies like 5G have taken hold, and more and more people have gained internet access across the world.

Timeline of median download speeds across Speedtest's history

In 2006 when we reached our first billion tests, we didn’t yet have mobile apps and the median download speed of fixed broadband for the world was 1.48 Mbps. By 2015 we had 10 billion results, the median mobile download speed was 7.87 Mbps and the median download for fixed broadband was 10.08 Mbps. Fast forward to today when we have over 50 billion Speedtest results and the world averages for mobile and fixed broadband download speed are 47.81 Mbps and 85.06 Mbps, respectively.

Thank you again for helping make Speedtest the global brand it is today. If you want to help us in our mission to improve connectivity for all, take a Speedtest or download the apps for Android or iOS to be part of a movement.

Ookla retains ownership of this article including all of the intellectual property rights, data, content graphs and analysis. This article may not be quoted, reproduced, distributed or published for any commercial purpose without prior consent. Members of the press and others using the findings in this article for non-commercial purposes are welcome to publicly share and link to report information with attribution to Ookla.