The summer travel season is about to officially begin across the northern hemisphere and we’re back with fresh data for our series on airport Wi-Fi performance. This year we examined mobile Wi-Fi on free Wi-Fi provided by the individual airports as well as mobile speeds at some of the busiest airports in the world during Q1 2023. While airports in the United States top the list of fastest free airport Wi-Fi, the fastest mobile speeds we saw were in China. Read on for a specific look at internet performance including: download speed, upload speed, and latency.
U.S. airports have fastest airport Wi-Fi
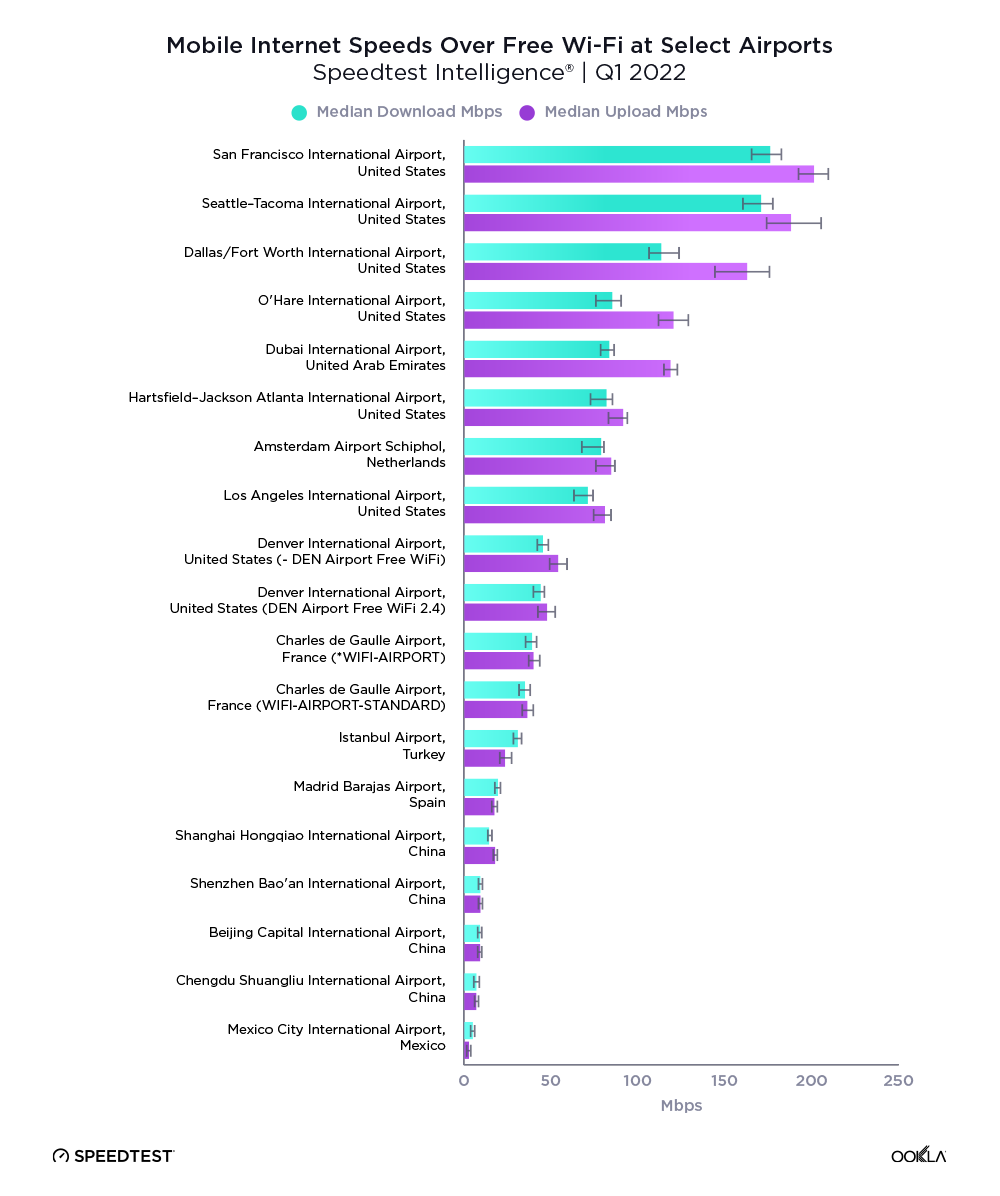
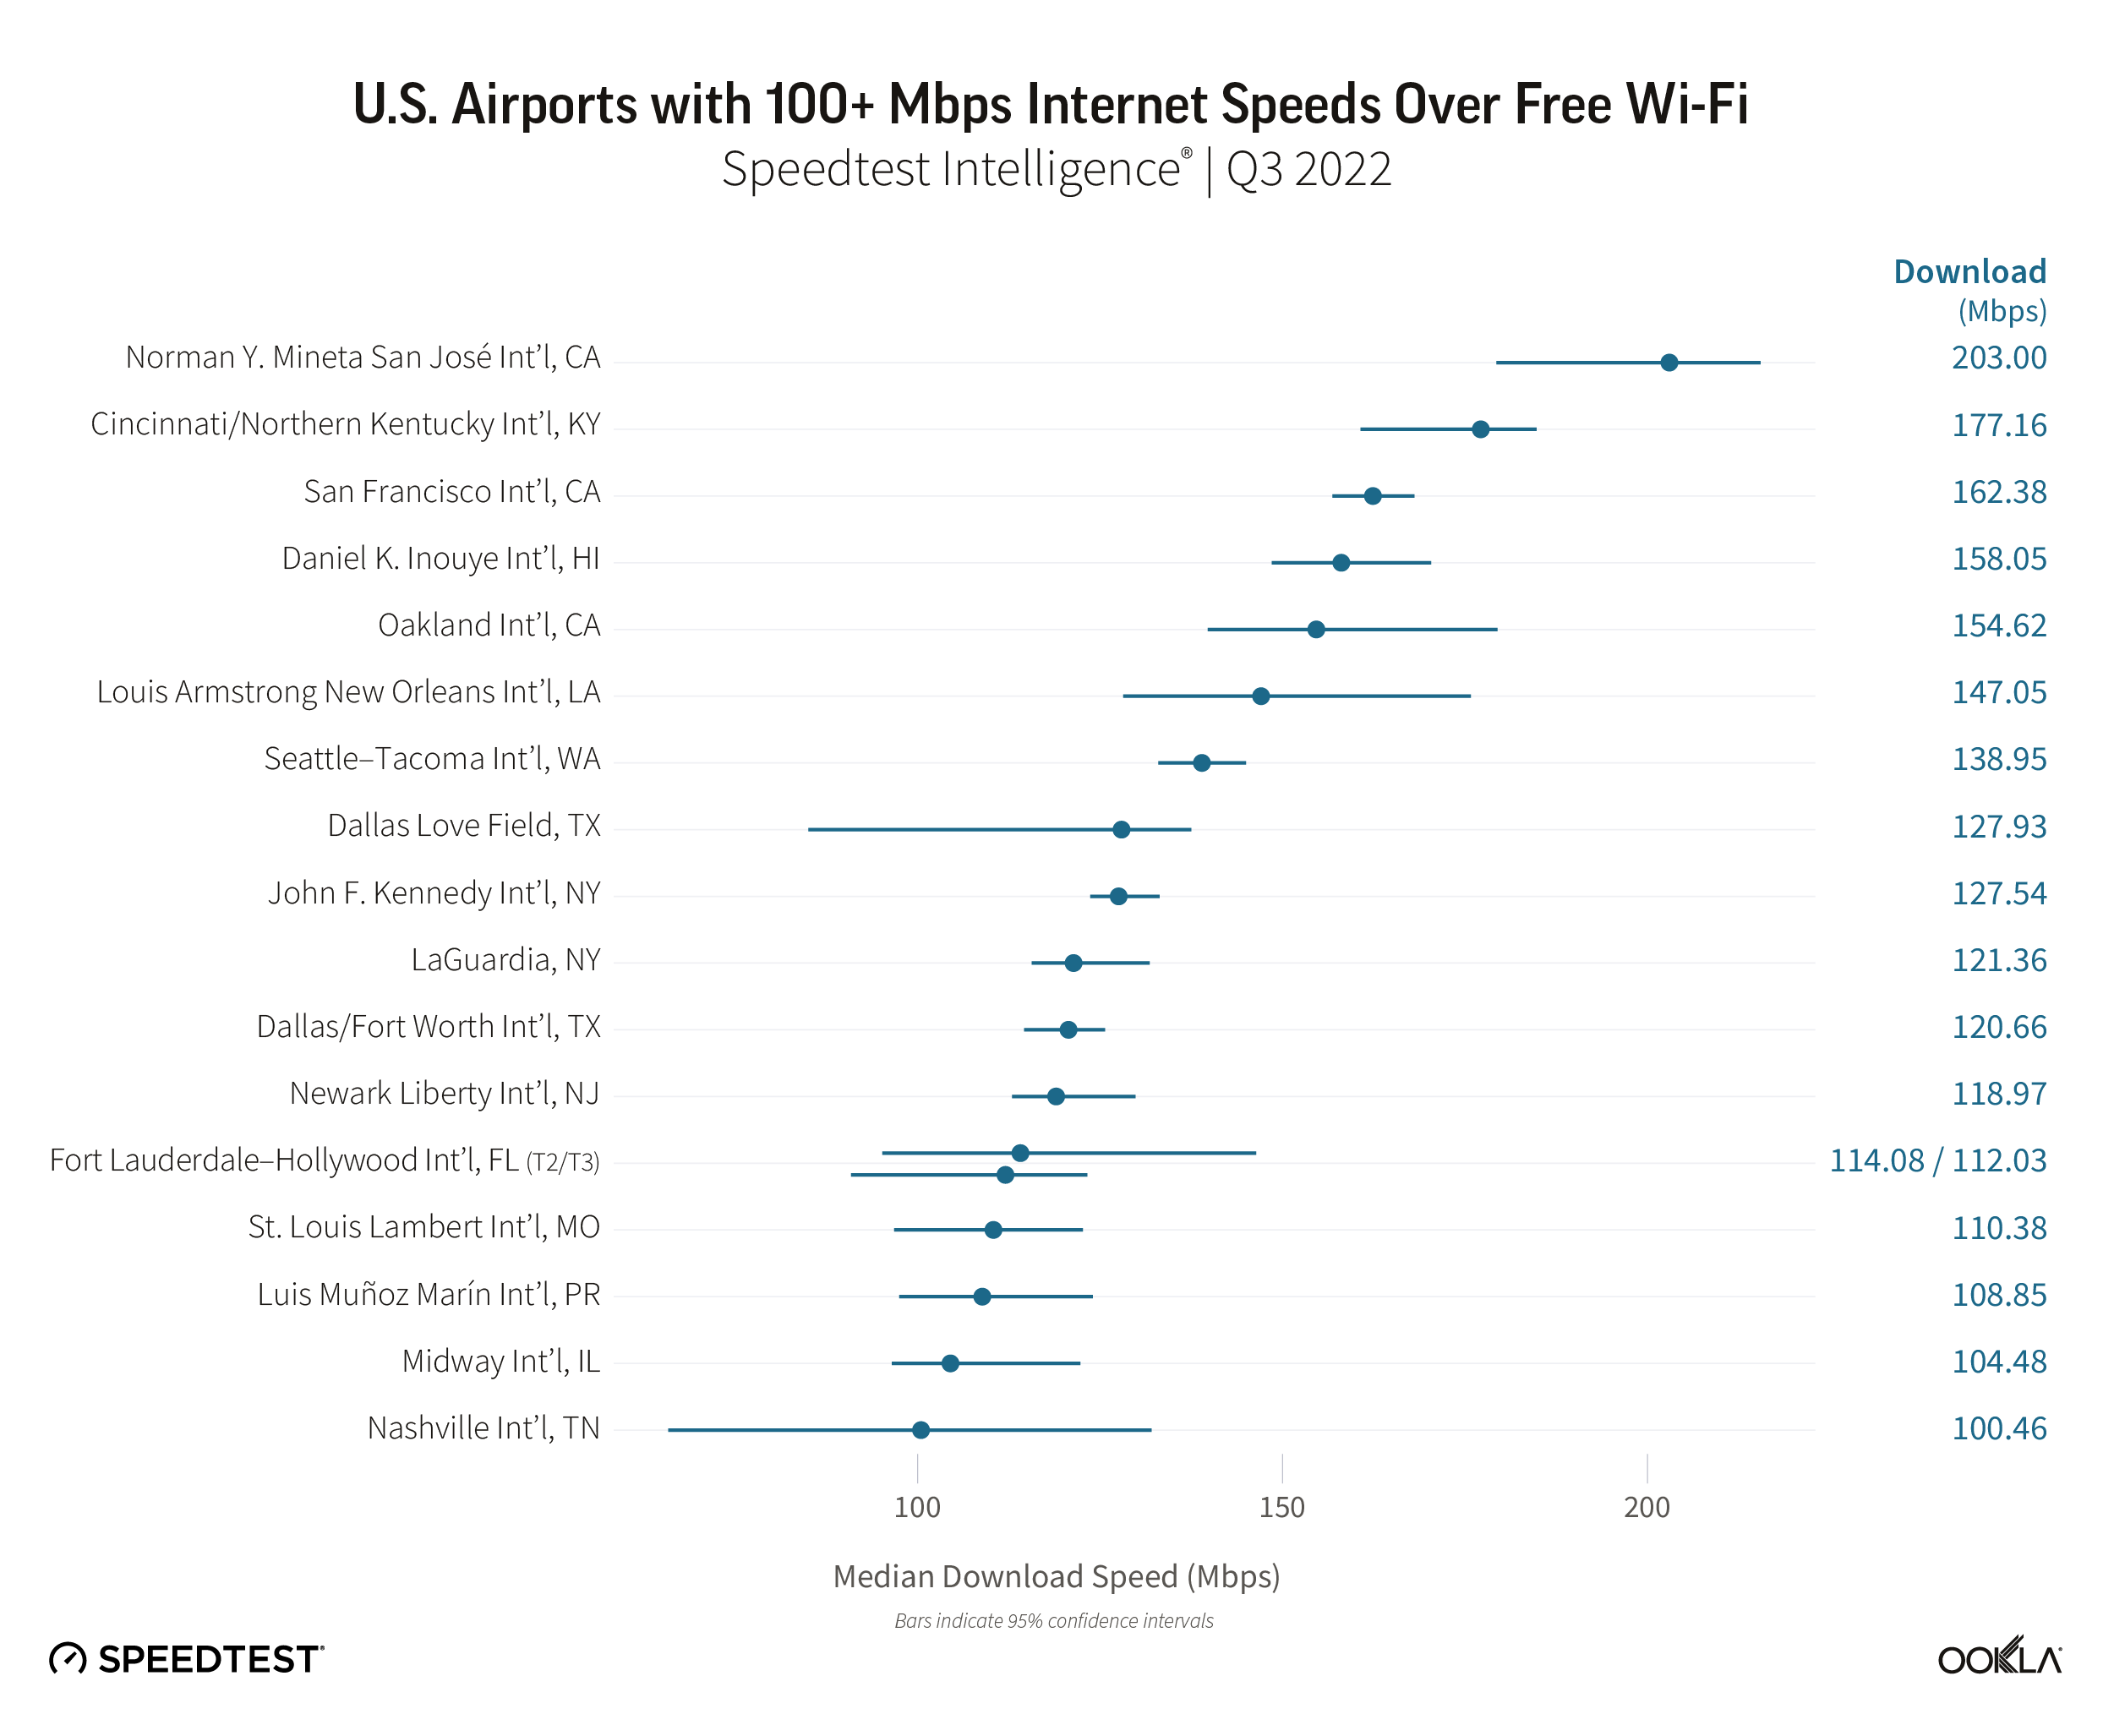
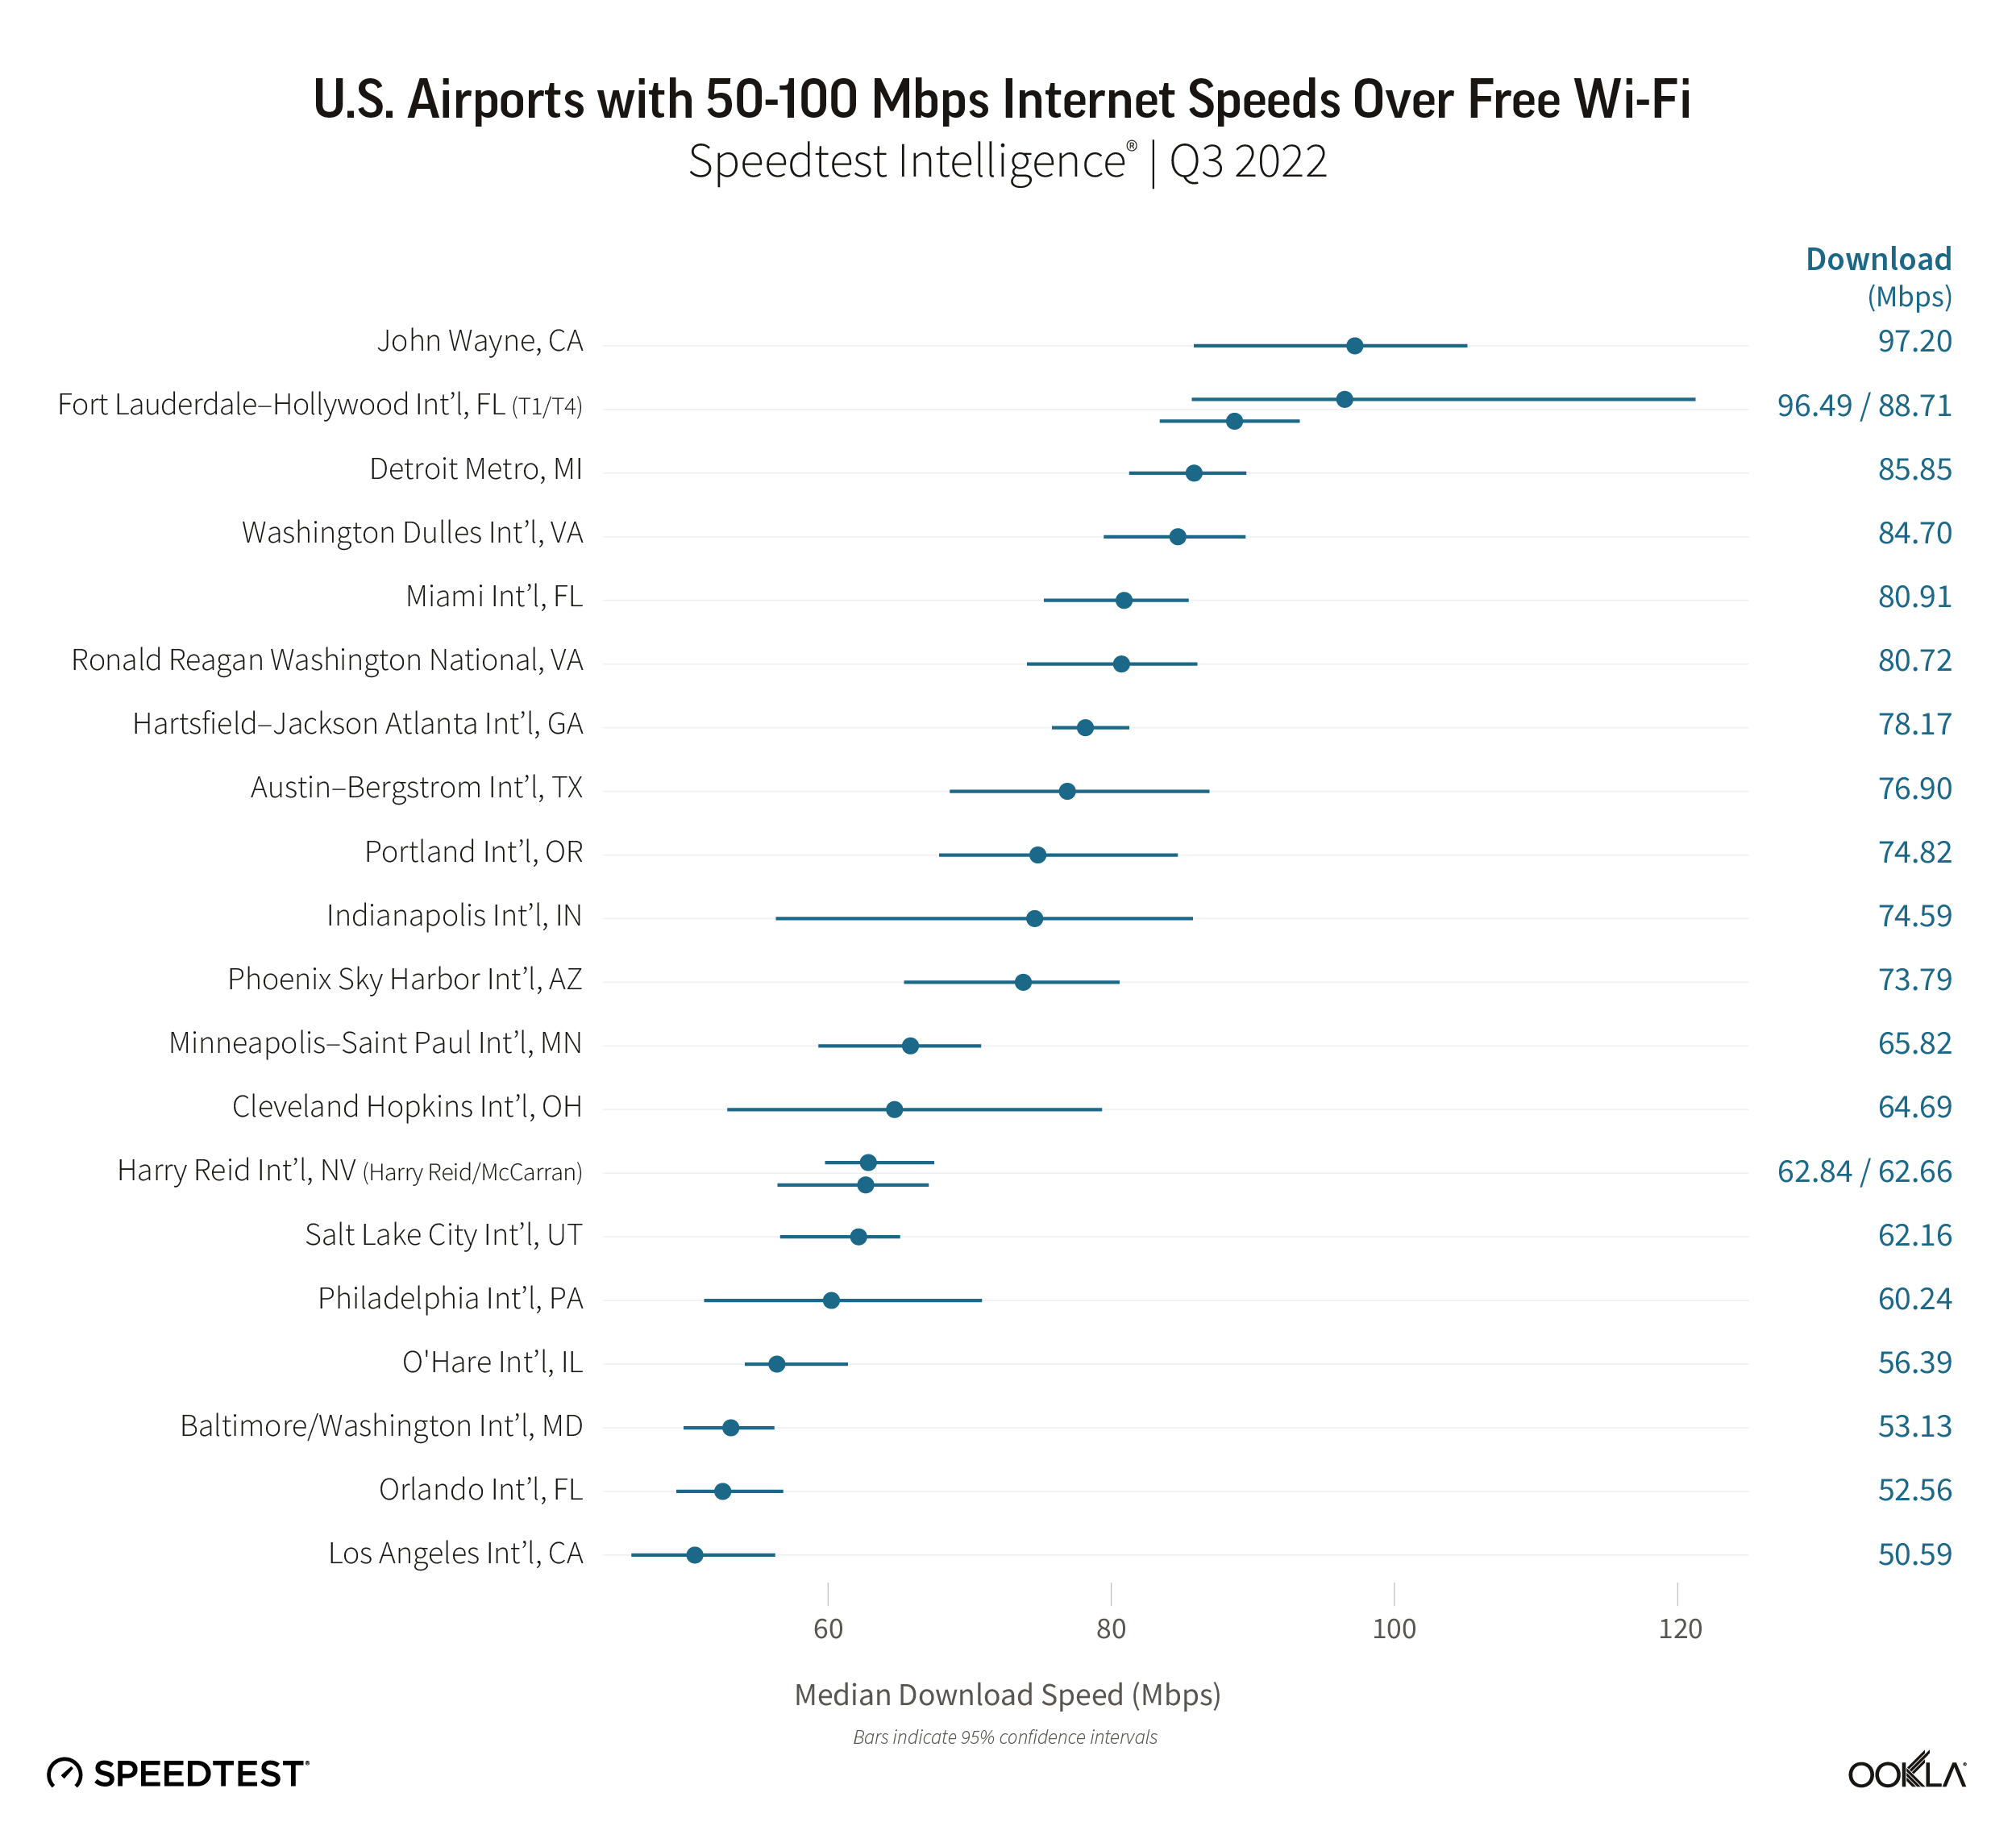
Speedtest Intelligence® showed two U.S. airports at the top of the list for free airport Wi-Fi with Fort Lauderdale’s Hollywood International Airport Terminal 3 and San Francisco International Airport showing median download speeds of 157.60 Mbps and 156.66 Mbps, respectively, during Q1 2023. This represented a small drop for SFO since our November analysis but an increase for FLL. Dallas/Fort Worth International Airport (143.42 Mbps), John F. Kennedy International Airport (136.06 Mbps), and Seattle–Tacoma International Airport (136.02 Mbps) rounded out the top five with three additional SSIDs from FLL following closely behind with median download speeds from 122.07 Mbps to 134.62 Mbps.
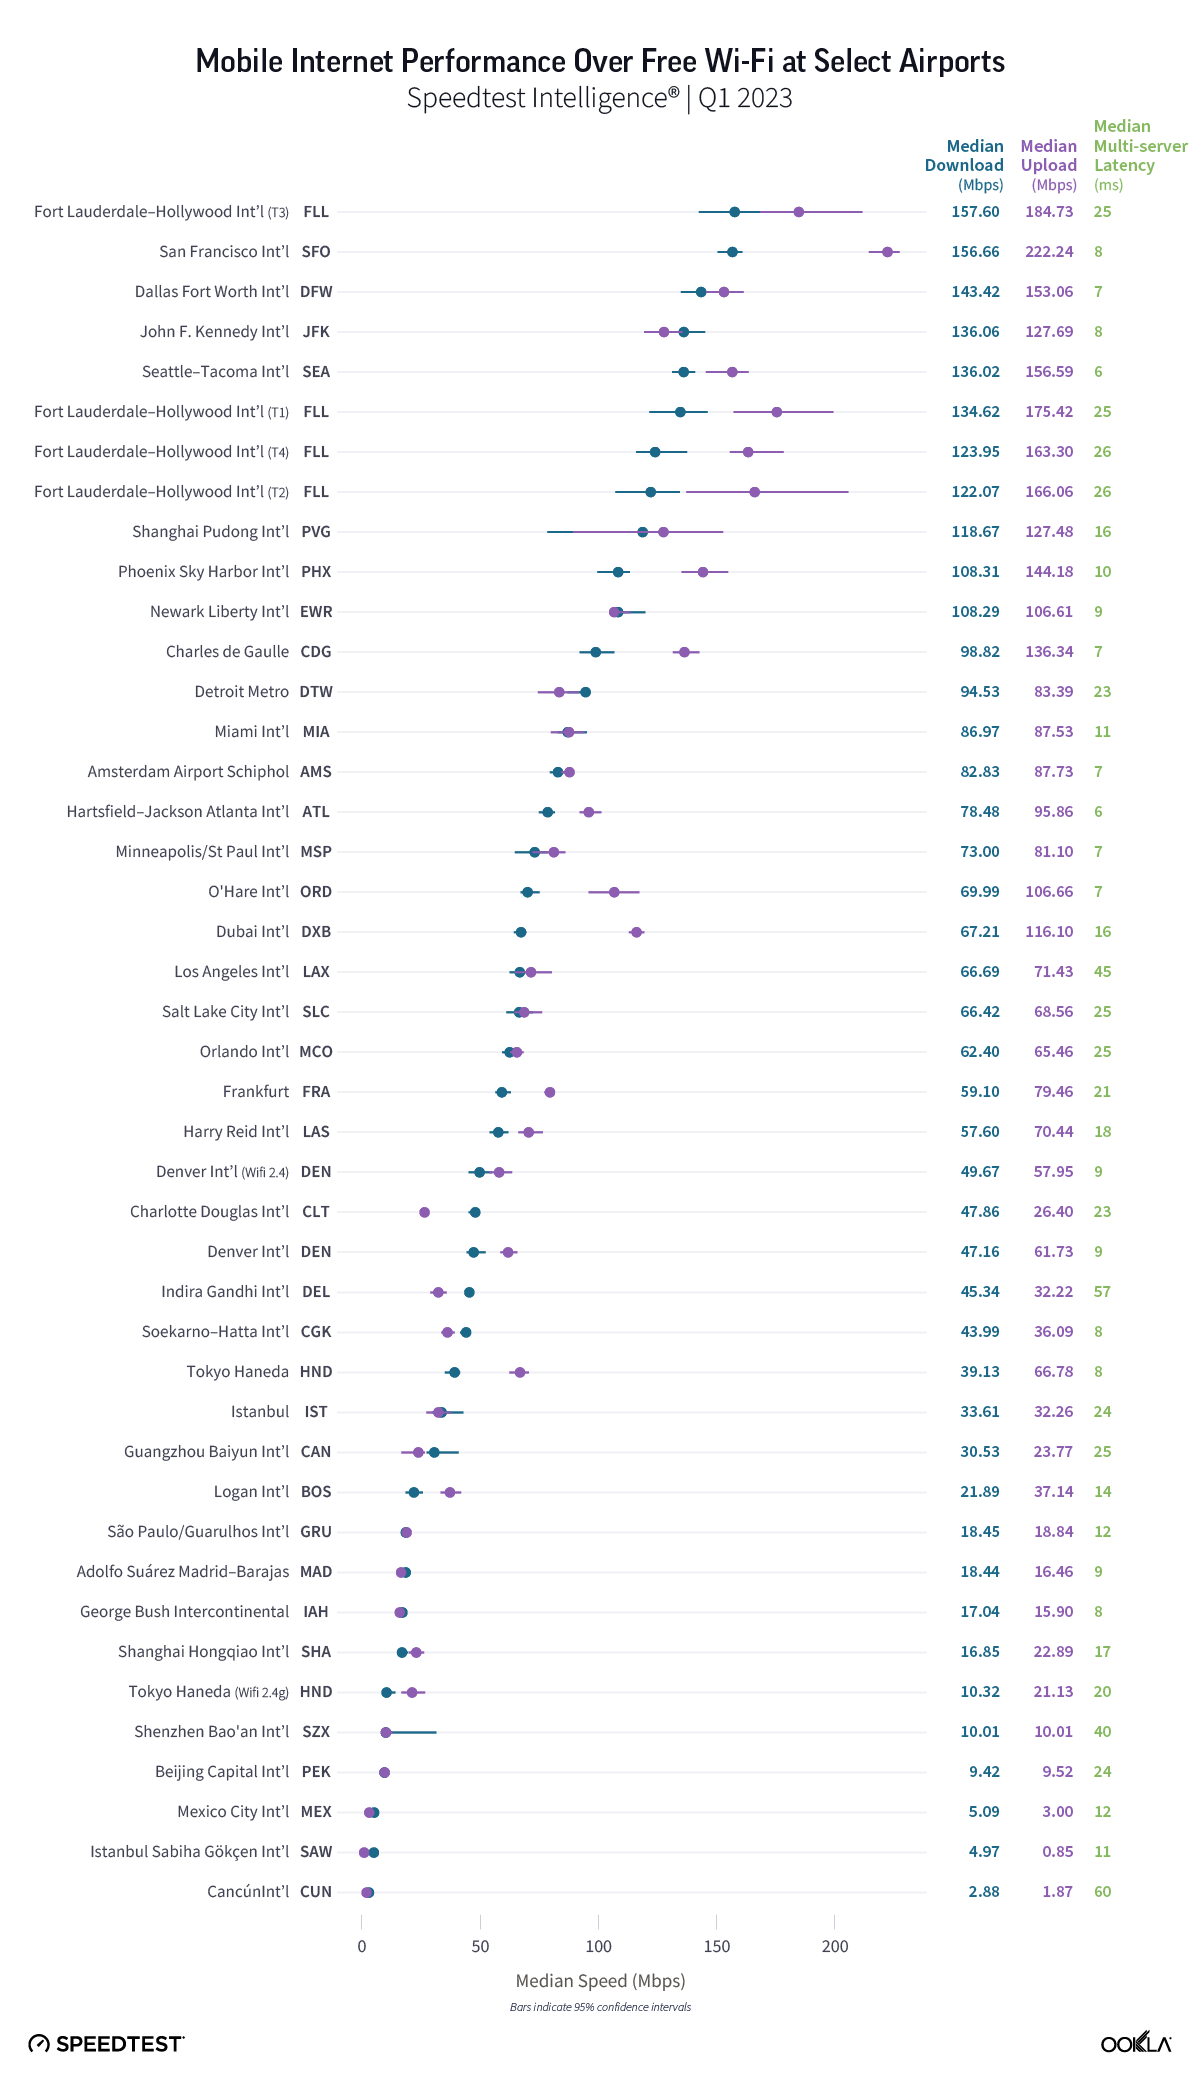
As we’ve seen in most recent analyses, the airports with the fastest Wi-Fi are international hubs that passengers from around the world pass through on their way to all kinds of destinations. If you are connecting through any of these airports, you should have no trouble with internet speeds this fast. In case of video calls, upload speeds are even faster than downloads at almost all of these airports, and SFO had the fastest uploads on the list.
Hartsfield–Jackson Atlanta International Airport and SEA had the lowest median multi-server latency on Wi-Fi of any of the airports surveyed during Q1 2023. This means your device should see very little delay when relaying information across the web.
Shanghai tops Wi-Fi performance at global airports
Shanghai Pudong International Airport was the fastest non-U.S. airport on our list with a fastest median download speed of 118.67 Mbps. Charles de Gaulle Airport in Paris (98.82 Mbps), Amsterdam Airport Schiphol (82.83 Mbps), Dubai International Airport (67.21 Mbps), and Frankfurt Airport (59.10 Mbps) followed for median download speeds at non-U.S. airports. All of these airports have internet speeds that qualify as at least good, which means you should be okay unless you want to try multi-player gaming (which is probably not your first choice on an airport layover anyway). Both Mexican airports on our list showed speeds in the slow range, so log off early and enjoy your vacation if you’re at the airport in Cancún or Mexico City.
Chinese airports have fastest mobile speeds
Get ready to connect to local mobile service or tether your phone to your laptop if you’re traveling through airports in Shanghai and Beijing and have access to 5G. Not only did Shanghai Pudong International Airport, Beijing Capital International Airport, and Beijing Daxing International Airport have the fastest median downloads over mobile on our list at 308.51 Mbps, 304.87 Mbps, and 300.70 Mbps, respectively, during Q1 2023 — the mobile speeds at these airports were dramatically faster than the airport Wi-Fi. Salt Lake City International Airport (282.21 Mbps) and Hangzhou Xiaoshan International Airport (259.86 Mbps) rounded out the top five.
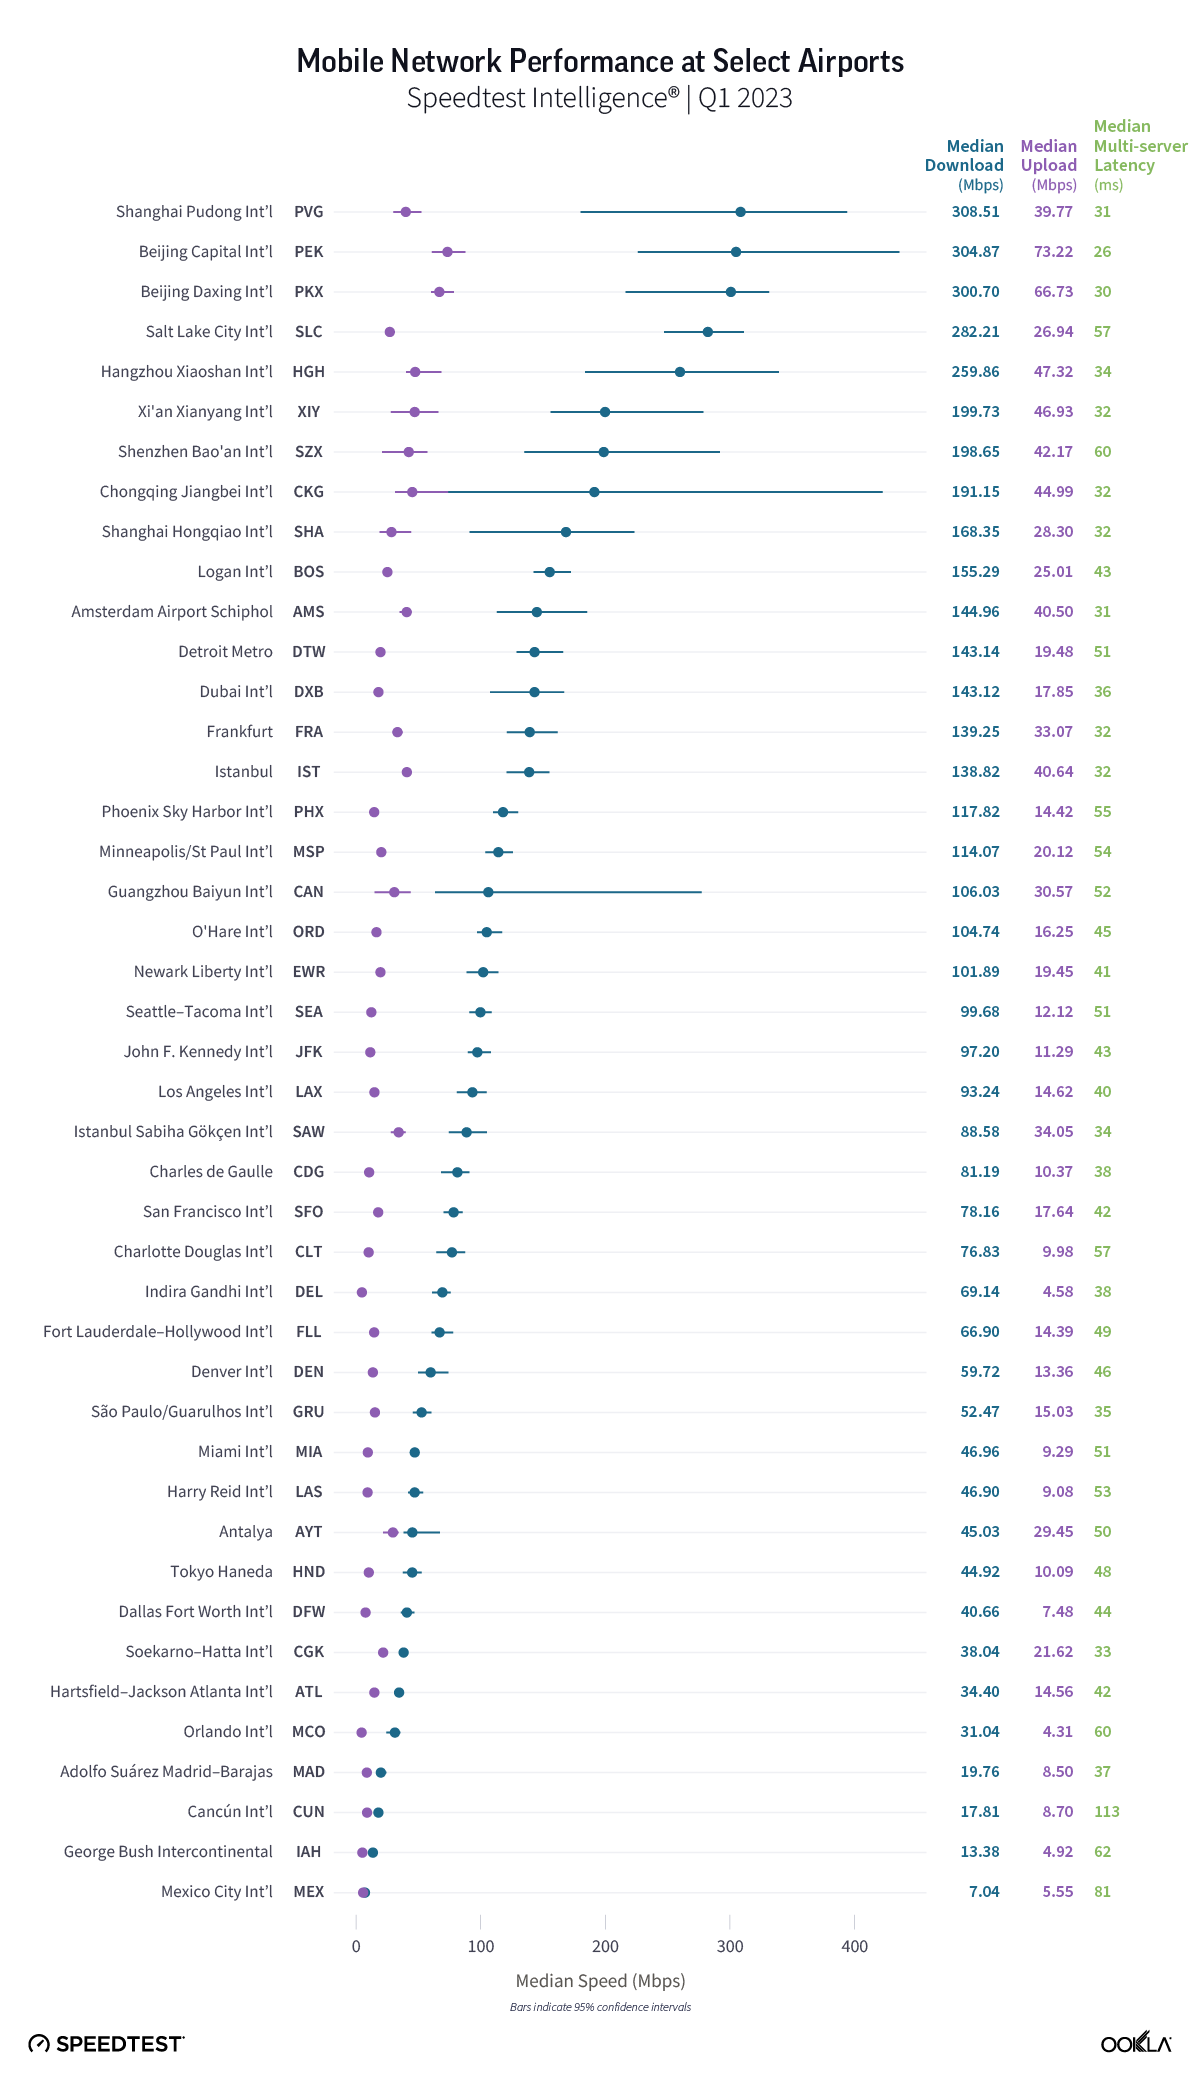
While latency on mobile was generally higher than that on Wi-Fi, these same three Chinese airports (PEK, PKX, and PVG) also showed the lowest median multi-server latency on mobile during Q1 2023, indicating that your internet experience at these airports will have the least lag. Airports outside the U.S. performed better for latency overall with the top 16 airports for latency all located outside North America. CUN had the highest latency on mobile.
We were able to include more airports in the mobile analysis because there were more mobile samples to analyze at those airports than there were samples over Wi-Fi.
Airport Wi-Fi or mobile? Connecting on your next trip
Save yourself time by using this checklist to decide whether to try out the Wi-Fi or simply use the local mobile network. We compared internet performance on free airport Wi-Fi with median download speeds over mobile for the 38 airports we have both Wi-Fi and mobile data for during Q1 2023. Twenty-one airports had faster mobile internet than airport Wi-Fi. Twelve airports had faster Wi-Fi than mobile, and four airports showed only a slight distinction between Wi-Fi and mobile so we gave both the green check marks.

Airport Wi-Fi has come a long way since we started this series in 2017. We hope your connections are smooth and if you’re traveling this summer, take a Speedtest® at the airport to see how your experience compares.
Ookla retains ownership of this article including all of the intellectual property rights, data, content graphs and analysis. This article may not be quoted, reproduced, distributed or published for any commercial purpose without prior consent. Members of the press and others using the findings in this article for non-commercial purposes are welcome to publicly share and link to report information with attribution to Ookla.