

If you’re lucky, there are many, many mobile operators and internet service providers (ISPs) in your area who are clamoring for your business — courting you with ads that claim they are the fastest, best, most reliable, etc. Great! But how do you sort through that information to understand what you really need? This guide to marketing awards and claims should help you sort through some of the details so you can choose the mobile operator or internet service provider (ISP) that matches your needs.
Know that we at Ookla® are always looking carefully at our data to ensure that any claim using the Ookla or Speedtest® name is one you can rely on. For example, any provider that licenses a claim from Ookla must have at least 3% of the market share by sample count in a given location throughout the period — that’s to say that you should be able to actually access their services in the place described. A provider must also have a statistically significant lead over the competition to qualify to license a claim. And we don’t monkey with questionable timeframes. A provider either qualifies for the claim based on data from a full calendar quarter (or longer) or they don’t. For more information on individual metrics, read our methodology. Any claim that Ookla verifies is built on real-world consumer-initiated results and backed by rigorous data science. Look for your specific region, state or city to make sure you’re getting the provider that’s right for you.
What “Fastest Provider” really means
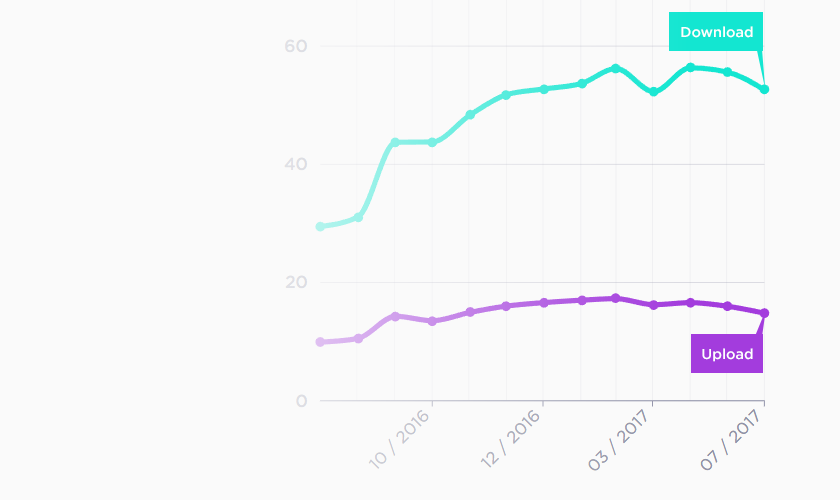
Many people look for the fastest service around — and why wouldn’t you? Having the fastest internet service can allow you to watch movies, livestream events or even play multiplayer games. Any provider named as having the Fastest Network by a Speedtest Award™ has been thoroughly vetted by our data science team using a combination of download and upload speeds that make up their Speed Score™. The top provider with the highest Speed Score who has provided service for the entire award period is then qualified to license the Fastest Award.
How customers inform “Top-Rated” mobile and fixed networks
How would you rate your internet provider? Would you recommend them to friends and family? We present Speedtest users with single-question surveys at the end of a test where they can give feedback on their mobile or fixed broadband provider. This data is used to inform “Top-Rated” Awards for the provider with the highest star rating in a specific location and time period.
Which mobile networks have the “Best Coverage”
If you’ve ever tried to get a call or text out only to find you have no service, you know mobile coverage matters. Every day Ookla receives hundreds of millions of coverage scans from Android Speedtest users around the world. This data is processed to assign a Coverage Score™ for each operator in a given location. The operator we stand behind as having the “Best Coverage” is your best bet for having access to service in the areas where people go most often.
Why “Best Availability” matters to mobile customers
Some people are most interested in making sure they always have access to a particular level of service. The “Best Availability” claim for mobile operators can help those consumers see the proportion of users who spend the majority of their time on a given cellular technology, both on network and when roaming. Availability claims are based on data from Android devices. Specific availability claims Ookla supports are:
- Best 5G Availability describes the mobile provider with the highest percentage of users with 5G-capable devices who spend the majority of their time on 5G. Check the Ookla 5G Map™ to see if 5G is available in your area.
- Best 4G Availability describes the mobile provider with the highest percentage of users who spend the majority of their time on 4G and above.
- Best Network Availability describes the mobile provider with the highest percentage of users who spend the majority of their time connected to any cellular technology (i.e., 2G, 3G, 4G, or 5G) rather than having no service. This is similar to Best Coverage, but focuses on the amount of time spent connected to a network rather than the distinct locations in which service is available.
How we determine which provider is “Most Consistent”
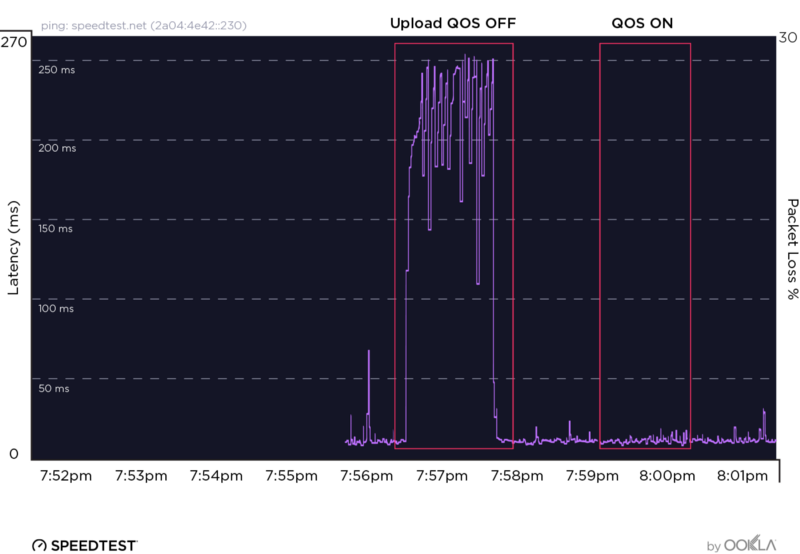
Consumers who prioritize consistent performance should look for a provider licensing the “Most Consistent” claim, which is based on our Consistency Score™. Consistency Score describes the percentage of a provider’s users who experienced download and upload speeds that met or exceeded our thresholds for the majority of their tests.
For mobile (all technologies), the threshold of consistent service is 5 Mbps download and 1 Mbps upload. For mobile 5G and fixed broadband, the threshold is 25 Mbps download and 3 Mbps upload. Achieving these speeds means you’re likely to be able to do things like stream HD and 4k video where and when you want to.
Best Availability + Most Consistent = “Most Reliable Mobile Network”
We all hope for the provider who is best at everything. Starting in July, Ookla’s “Most Reliable” claim can be used for mobile operators who have achieved both the best availability on a given technology and the best Consistency Score for that technology in the area described. The Most Reliable Network is one that should provide you with good performance and network availability. The Most Reliable 5G will represent the mobile operator with the best 5G Availability and best Consistency Score on 5G.
Fastest speeds + Best Coverage = “Best Mobile Network”
A fast internet speed with poor coverage leaves you hopping around trying to find that one spot you could stream from. Good coverage without fast speeds leaves you crossing your fingers that you can stream at all. The combination of speed and coverage is so important, in fact, that Ookla only allows a superlative claim of “Best Mobile Network” when a mobile provider has been confirmed to win the “Fastest Mobile Network” and “Best Mobile Coverage” awards.
A quick guide to choosing a provider
We hope the above information helps you choose the mobile operator or internet service provider that meets your needs. Here is a quick cheat sheet of the most common terms:
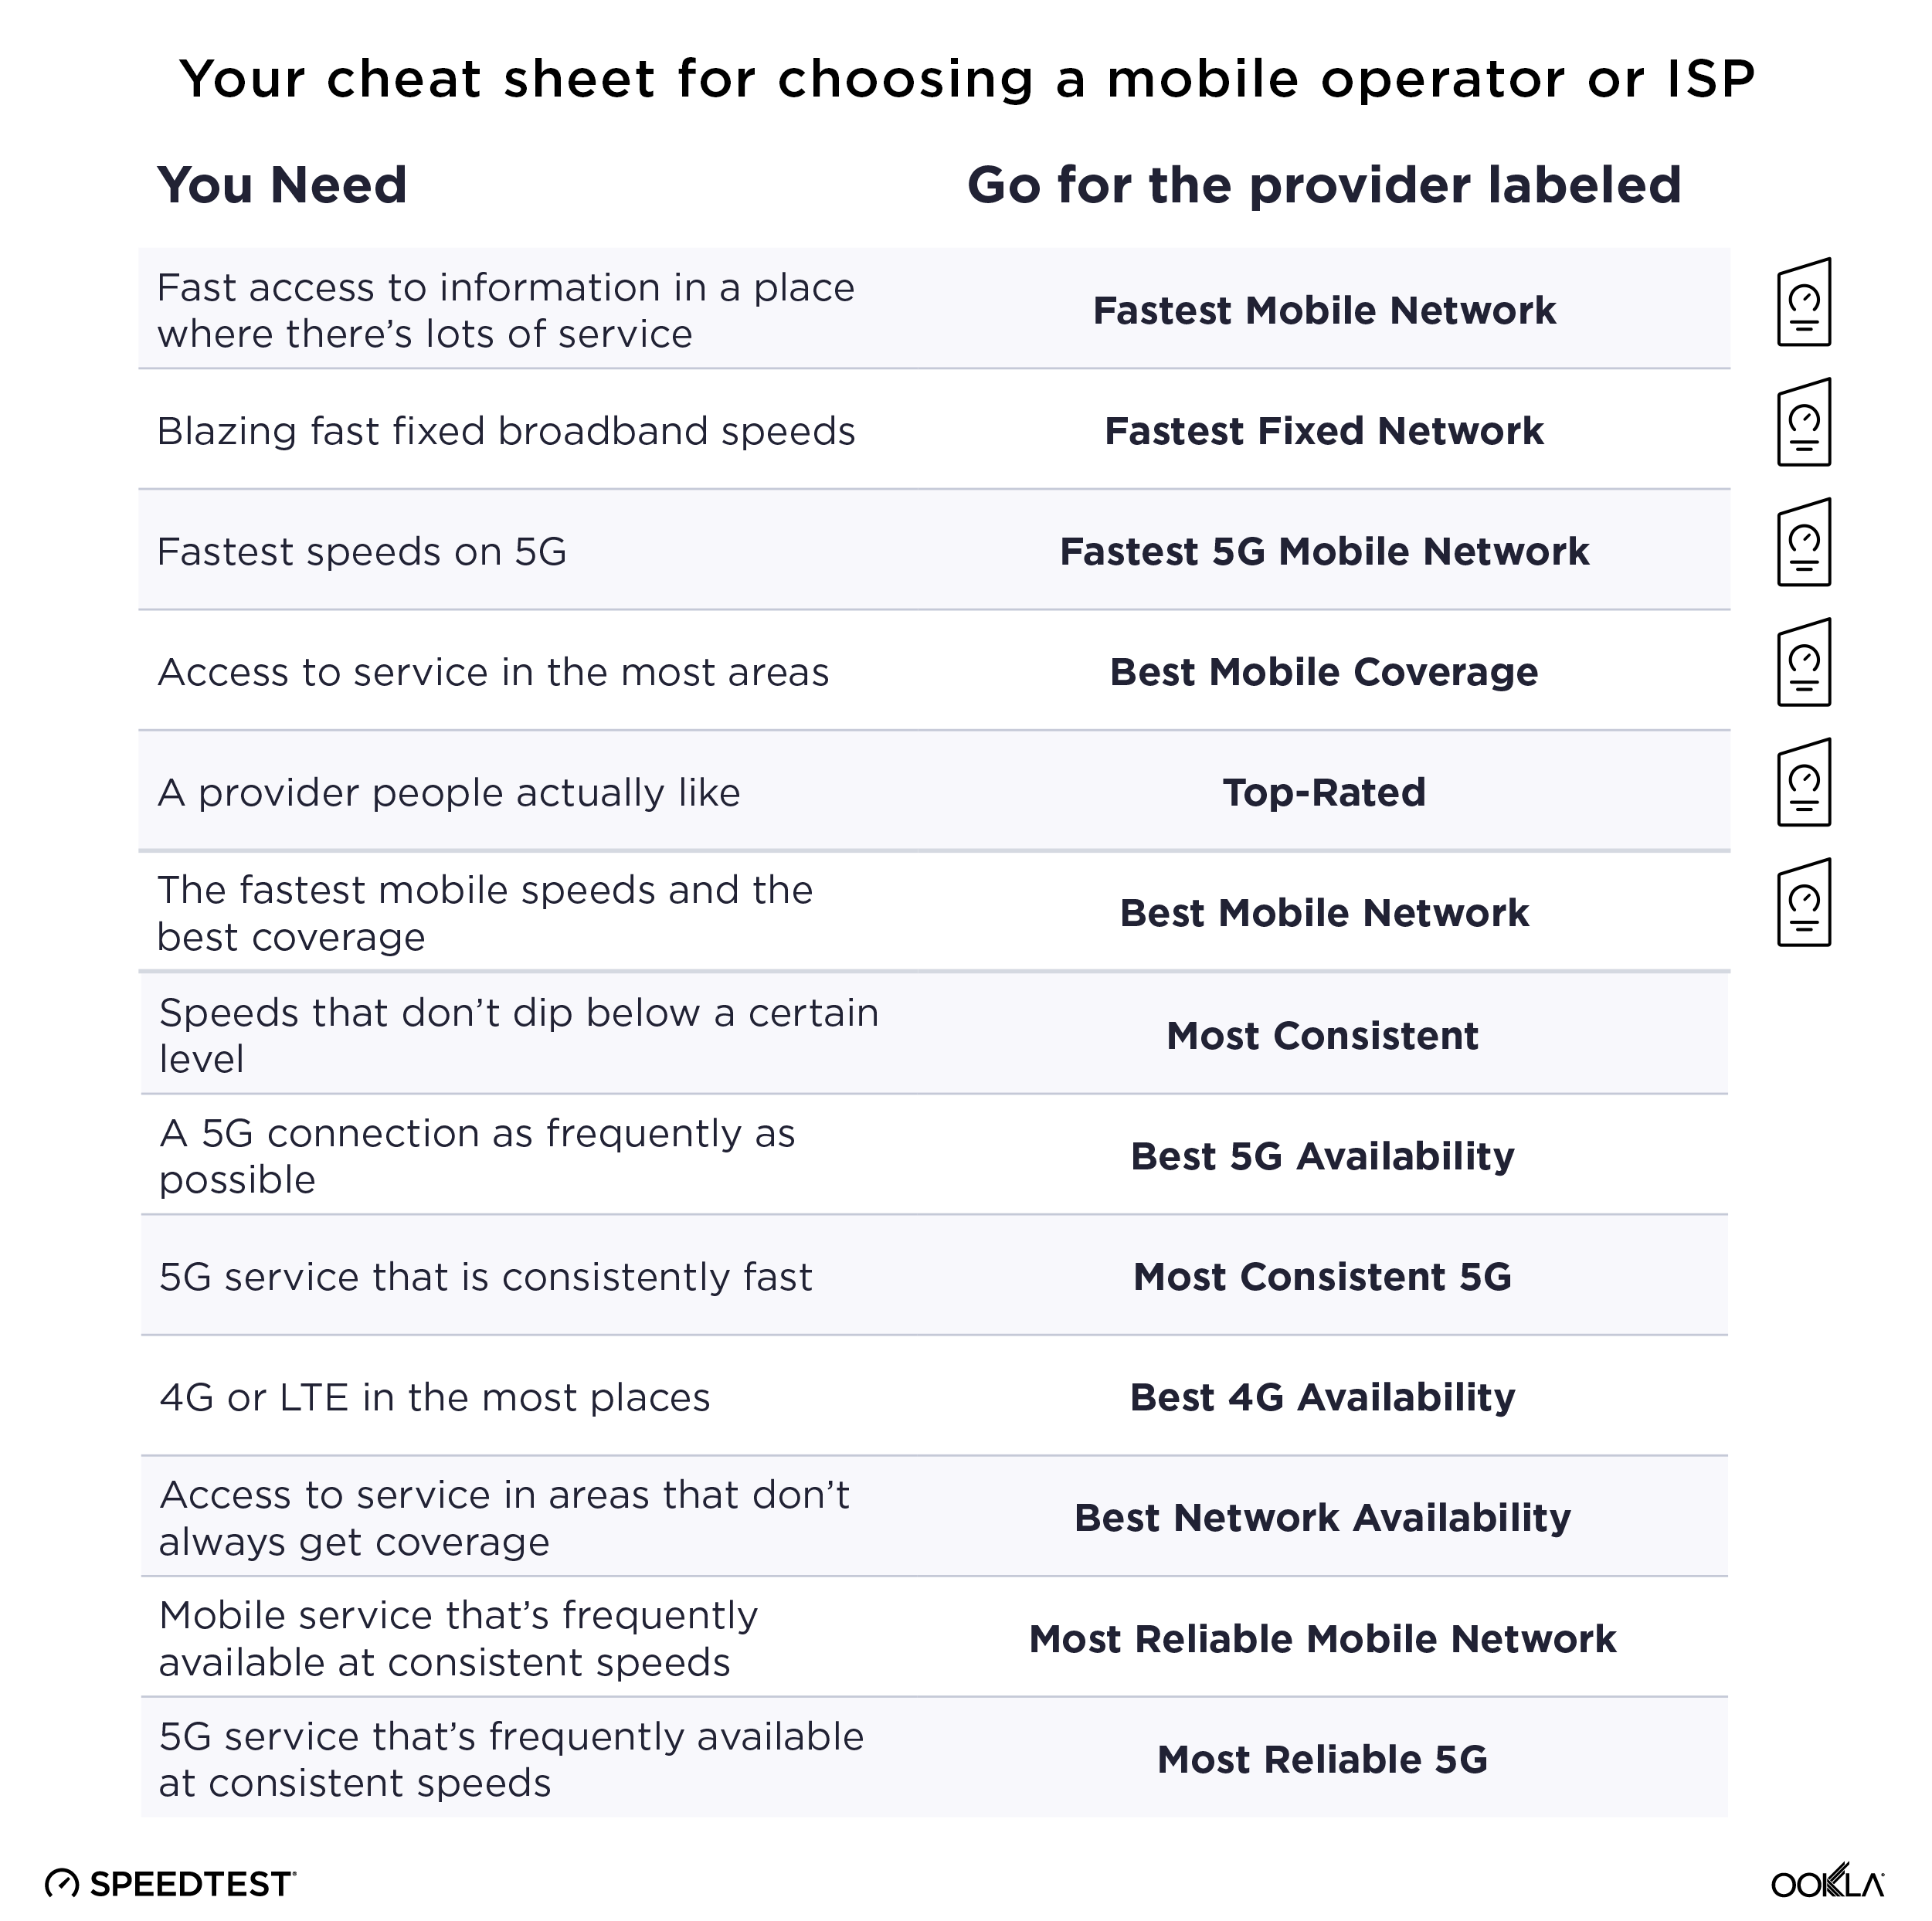
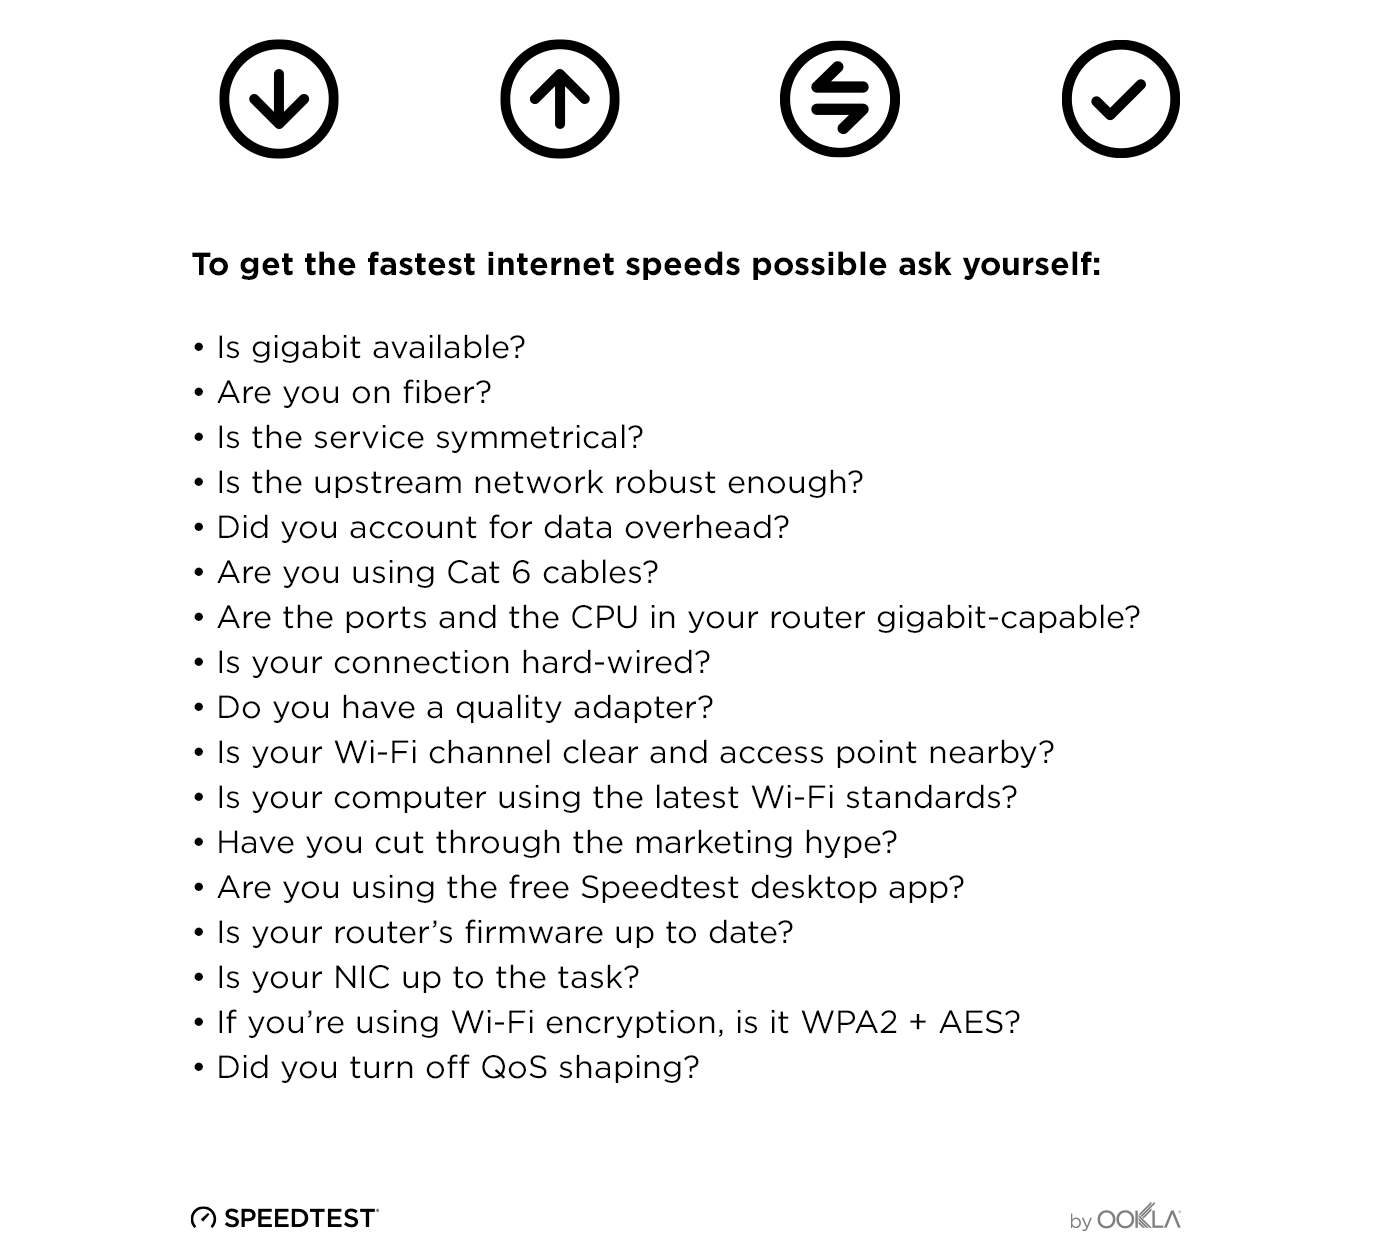
There are many factors that go into choosing a mobile operator or ISP. We hope this guide to claims and awards will help you find the provider that matches your needs. Once you have your new service in place, be sure to take a Speedtest to check if you’re getting the speeds you expect from your provider.
Ookla retains ownership of this article including all of the intellectual property rights, data, content graphs and analysis. This article may not be quoted, reproduced, distributed or published for any commercial purpose without prior consent. Members of the press and others using the findings in this article for non-commercial purposes are welcome to publicly share and link to report information with attribution to Ookla.


