| November 17, 2024

iPhone 16 5G Performance: How Does Apple's Latest and Greatest Compare to Previous iPhones and Samsung Galaxy Flagships?

The latest iPhone 16 family of smartphones launched on September 20, and with Black Friday approaching, many potential buyers are considering upgrading to a new iPhone model. But a key question remains: Is it worth it? To help answer that question, we’ve analyzed how the iPhone 16 family of devices measures up against its predecessors in terms of 5G speed and latency during its first several weeks on the market. 

Looking at Speedtest® data from 11 select countries around the world from September 20 – October 20, 2024, we examined whether the iPhone 16 lineup — comprising the iPhone 16, 16 Plus, 16 Pro, and 16 Pro Max models — outpaced Apple’s earlier iPhone 14 and 15 families for 5G speed and latency performance. We’ve also compared the 5G speeds and latency of iPhone models with Samsung’s most recent offering, the Galaxy S24 family, including the S24, S24+, and S24 Ultra.

It’s important to note that device performance metrics can vary significantly from one country to another. Factors such as the performance of networks themselves in each country, government and mobile operator investments in 5G infrastructure, spectrum allocations, and the extent of 5G network deployment all contribute to speeds and variations across countries. 

Key takeaways:

  • The Apple iPhone 16 lineup showed a statistically significant lead for median 5G download speeds in five out of 11 countries in this study. 
  • At the slower end of the scale, the Apple iPhone 14 offered the slowest median 5G download speeds in 7 out of 11 countries. It’s worth noting, however, that speed differences between the devices were relatively minor in some of the countries analyzed (see the charts below for details). 
  • The Samsung Galaxy S24 family recorded the lowest (and, therefore, best) median 5G multi-server latency in 8 countries, whereas the iPhone 16 lineup led for 5G latency in one market. 
  • The Galaxy S24 family led on median 5G upload speeds in 8 of 11 countries, while iPhone 14 and 15 devices typically showed the slowest upload speeds. 

To learn more about what speeds mean in real-world terms, check out our article looking at how much speed users need for a variety of daily mobile activities.

Take me straight to the data!

Asia Pacific | Europe | Latin America | North America 

New chipsets and modems in the iPhone 16 lineup 

When investing in an expensive new smartphone, consumers naturally want to know if the upgrade will be worth it. While the iPhone 16 lineup includes various new upgrades and features, let’s look at the components that impact connectivity performance, specifically the chipsets and modems across our study’s devices:

  • iPhone 16 base model and 16 Plus use the Apple A18 system on a chip (SoC), while the Pro and Pro Max models feature the A18 Pro, with all iPhone 16 devices incorporating the Snapdragon X75 5G modem.
  • iPhone 15 base models use the A16 Bionic chipset and Pro models run on the A17 Pro, and both are paired with the Snapdragon X70 5G modem
  • iPhone 14 and 14 Plus models are equipped with an A15 chipset, and the iPhone 14 Pro and Pro Max feature the A16 Bionic chip. All iPhone 14 devices use a Snapdragon X65 5G modem
  • Samsung Galaxy S24 devices also utilize the Snapdragon X75 5G modem

Do you own one of these devices? See how your speeds compare by taking a quick Speedtest

Digging into the data: Where does the Apple iPhone 16 lead its earlier iPhone and Samsung counterparts around the world?  

Early findings from Speedtest Intelligence® show that the latest iPhone 16 family outperformed its predecessors in terms of 5G performance across several of the markets we analyzed. While the performance differences between device families were minimal in some countries, iPhone 16 models demonstrated major speed advantages over previous generation Apple and Samsung devices in markets like Canada, France, Taiwan, and the United States.

Does that mean users in those locations should upgrade immediately? Not necessarily. The decision to upgrade depends on factors other than network performance, from price to new features and plenty of other things. However, our initial data on the 5G capabilities of the iPhone 16 series is encouraging in its early days of release.

Read on to see our complete analysis of all 11 countries in this study or select a region below to dig into more localized results.

Asia Pacific | Europe | Latin America | North America 

Asia Pacific 

iPhone 16 shows modest lead in 5G speeds in India

In India, all device families posted strong 5G results, with speeds ranging from 231.94 to 261.57 Mbps. The iPhone 16 lineup posted a median 5G download speed of 261.57 Mbps and the lowest median 5G multi-server latency at 44 ms. The Galaxy S24 family followed closely at 251.17 Mbps for downloads and claimed the top spot for 5G upload speeds at 19.69 Mbps. The iPhone 15 and 14 families trailed but still delivered solid speeds above 230 Mbps, with median 5G upload speeds of roughly 14 Mbps each.

Bottom line: Current iPhone 14 users might be tempted by the 30 Mbps advantage seen with the iPhone 16 lineup in this study. While 5G speeds were excellent across all device families in India, early adopters who want the latest and greatest might find the iPhone 16’s performance edge helps justify that upgrade itch.

Galaxy S24 family leads the Philippines for 5G speeds, while iPhone 16’s show modest advantage over previous iPhones

Speedtest Intelligence data revealed the Galaxy S24 family leading the Philippines market with a median 5G download speed of 158.47 Mbps and the lowest median 5G multi-server latency at 32 ms. The iPhone 16 lineup showed relatively minor improvement over its predecessors, posting a median 5G download speed of 125.68 Mbps, a tick above the iPhone 15 and 14 families (both registered speeds of about 120 Mbps).  

Bottom line: While the iPhone 16 showed slight improvements over previous iPhone generations, the Galaxy S24 family offered the strongest 5G performance in the Philippines, with a roughly 33 Mbps advantage in 5G download speeds.

iPhone 16 lineup leads Taiwan for 5G speed, with impressive performance across all devices

5G speeds were excellent across the board in Taiwan, with median 5G download speeds ranging from 287.83 to 342.37 Mbps. The iPhone 16 lineup led the market with a median 5G download speed of 342.37 Mbps. The Galaxy S24 family followed at 313.96 Mbps and matched the iPhone 16’s 5G upload performance at around 38 Mbps. The iPhone 15 and 14 families trailed the 16 lineup but still impressed with speeds above 287 Mbps.

Bottom line: The iPhone 16 lineup led Taiwan’s impressive 5G speed landscape by roughly 30 Mbps. However, with all device families delivering median 5G download speeds of at least 287 Mbps, users should experience excellent 5G performance regardless of which phone they choose, making the decision to upgrade a bit tricky and potentially more about the new model’s features than about speed.

Europe 

For users in Belgium, the iPhone 16 is worth a look

Speeds in Belgium were strong across the board, with the iPhone 16 lineup clocking a median 5G download speed of 237.37 Mbps. The iPhone 14 and 15 lineups trailed, posting median 5G download speeds of a little over 170 Mbps each. Latency was also impressive in general, with all four device families registering median 5G multi-server latency of 40 ms or better.

Bottom line: The iPhone 16 family’s current speed advantages over its predecessors in Belgium suggest an upgrade might be worth considering for users focused on 5G performance. That said, all devices in the market delivered good speeds that should provide users with quick downloads and strong connectivity overall. 

Upgrading to an iPhone 16 may be appealing for France users

In France, the iPhone 16 lineup led the way for 5G speed with a median 5G download speed of 279.29 Mbps, offering a speed advantage of nearly 60 Mbps compared to older iPhones. The Galaxy S24 family placed second at 242.34 Mbps and posted the lowest median 5G multi-server latency at 38 ms.

Bottom line: With the iPhone 16 lineup clocking 5G download speeds significantly faster than both previous iPhone generations and the latest Samsung devices, users seeking faster speeds may want to consider a new iPhone.

German users could see 5G speed gains with an iPhone 16 

The iPhone 16 lineup led the pack in Germany with a median 5G download speed of 172.69 Mbps, more than 40 Mbps faster than iPhone 14 and 15 models, which delivered speeds of roughly 130 Mbps each. Meanwhile, the Galaxy S24 series trailed in download speed, but it registered the lowest median 5G multi-server latency in the market at 34 ms.

Bottom line: If you’re using an older iPhone in Germany, the iPhone 16’s speed advantage over previous models – and Galaxy S24 devices – could make it an appealing upgrade option.

Latin America

No compelling reason to upgrade just yet in Brazil

All devices in our study showed outstanding 5G speeds in Brazil, with speeds ranging from the iPhone 14’s median 5G download speed of 444.29 Mbps to the Galaxy S24’s 482.95 Mbps. The iPhone 16 and 15 families posted similar speeds of 468.11 Mbps and 465.75 Mbps, respectively.

Bottom line: Brazil was home to the fastest 5G speed on an iPhone in our 11-country study, with even the “slowest” speed in the market outpacing the top performers in other markets by over 100 Mbps. With all device lineups performing exceptionally well, the decision to upgrade in Brazil might come down to features rather than speed.

Galaxy S24 outpaces the iPhone 16 lineup for 5G speed in Colombia

The Samsung Galaxy S24 family had a performance edge in Colombia, with its median 5G download speed of 246.05 Mbps coming in about 50 Mbps faster than its iPhone competitors. Its median 5G upload speed of 35.66 Mbps also led the market. All three iPhone lineups posted median 5G download speeds ranging from 181.27 Mbps to 195.25 Mbps.

Bottom line: The Galaxy S24 series led for 5G performance in Colombia, but when deciding whether to get a new device, raw speed isn’t always everything. Apple enthusiasts might consider the iPhone 16’s complete feature set and strong 5G speeds (even though they trailed those of the Galaxy S24 family), while current S24 users in Colombia will likely stand pat with the knowledge that their devices offer strong 5G performance in the market.

North America

iPhone 16 lineup in Canada faster than its predecessors

The iPhone 16 lineup showcased strong performance in Canada with a median 5G download speed of 182.43 Mbps, about 45 Mbps faster than those of earlier iPhone models. The Galaxy S24 family placed second at 155.61 Mbps and achieved the lowest median 5G multi-server latency at 34 ms, while iPhone 14 and 15 models trailed with still-strong speeds of 124.64 Mbps and 137.54 Mbps, respectively.

Bottom line: For Canadians looking for top-notch 5G performance, the iPhone 16 lineup makes a strong case with its lead in speed over older iPhone models. While all device families in Canada delivered good 5G speeds, for users who want both top performance and the latest features, the iPhone 16’s speed advantage might help justify that upgrade you’ve been considering.

No clear speed advantage in Mexico for the new iPhone 16 

The latest iPhone devices showed remarkably close 5G speeds in Mexico, with speeds varying by just a few megabits per second across the different iPhone families. While the iPhone 14 family had a median 5G download speed of 191.31 Mbps, the iPhone 15 and 16 lineups performed similarly well, clocking in at 185.88 Mbps and 185.79 Mbps, respectively. The Galaxy S24 family followed at 173.70 Mbps.

Bottom line: Users in Mexico considering an iPhone upgrade might want to weigh factors beyond 5G performance, as our data shows minimal speed differences between recent iPhone generations. The choice to upgrade likely depends more on desired features and other device capabilities than network performance alone. 

iPhone 16 offers a strong choice in the United States

In the United States, our results showed the iPhone 16 lineup reaching a median 5G download speed of 324.23 Mbps, well ahead of both the Galaxy S24 family at 287.35 Mbps and older iPhones at 244.48 Mbps (iPhone 15) and 220.76 Mbps (iPhone 14). All device families provided solid latency performance below 53 ms.

Bottom line: While all devices in our study provided good speeds in the U.S., the iPhone 16’s standout performance is hard to ignore and makes a strong case for upgrading, particularly for users seeking the fastest 5G.

Ookla will continue monitoring how devices are performing 

We’ll continue to check in on device performance as new models enter the market, so stay tuned for further insights into mobile and fixed broadband performance in countries around the world. 

If you’ve recently made the switch to a new iPhone, make sure you’re getting the speeds you need (and pay for) by downloading the Speedtest app for iOS or Android.

Ookla retains ownership of this article including all of the intellectual property rights, data, content graphs and analysis. This article may not be quoted, reproduced, distributed or published for any commercial purpose without prior consent. Members of the press and others using the findings in this article for non-commercial purposes are welcome to publicly share and link to report information with attribution to Ookla.

| November 15, 2024

Introducing Downdetector® Push Notifications

You know Ookla® Downdetector as a powerful tool to troubleshoot your internet connection, giving you real-time details about internet sites and services that might be having issues. You probably also know you can access Downdetector in the free Speedtest® app. We know you’re busy and sometimes you want to know what’s broken on the internet before you get there, so we’ve added push notifications to the Speedtest app to give you real-time alerts about the services that are most important to you. 

Downdetector push notifications you might want to set up today:

  • Major retailers — discover whether all the Black Friday traffic overwhelmed their servers before you try to load up your cart 
  • Social media sites — did your latest video fail to get likes or is the site just not responding since you uploaded it?
  • Your internet provider — whether a big storm is coming or you have a big call, you want to know early if your internet is out so you can plan for alternatives
  • Streaming services — did the series finale crash the site? Find out before you pop the popcorn
  • Gaming sites and services — launch days are notoriously hard on these. Avoid the frustration of refreshing over and over to get that big game by knowing what’s not working in advance
  • Your bank — get alerted when the site is down before you go to pay your bills

How to set up Downdetector push notifications 

You should see a new “Introducing Downdetector Notifications” pop-up next time you open the free Speedtest app. If you have an account already, you can sign in and visit the Downdetector tab to start selecting favorites. 

If you don’t already have an account or are looking for more detailed instructions, see below.

First create a free account

create account screen

Downdetector push notifications are available to anyone with a free Speedtest account. There are two ways create an account:

  1. In the app — open the Speedtest app on either Android or iOS. Click the hamburger menu in the upper right corner. Click the blue button near the top of the app labeled “Create Account” and fill in the fields on the next screen. We’ll send you a verification email to confirm your account. Click the link in that email and you are ready to go.
  2. On Speedtest.net — click “Sign In” in the upper right corner. This will take you to a page where you can either create an account or sign in to an existing account. To create an account, click “Register” on the left side of the screen. Simply fill in the fields on the “Create an account” screen, check the Captcha box if you see one, and click “Register” again. We’ll send you a verification email to confirm your account. Click the link in that email and you are ready to go.

Pick your favorite services

screen to select favorite services

Tap the Downdetector tab at the bottom of your screen inside the Speedtest app. You’ll see a “Get Outage Alerts” pop-up where you’ll then want to click “Sign In” to sign into your free Speedtest account (if you aren’t already). 

Once you have signed in, you will see the Downdetector page you are used to seeing but with stars to the left of all the services. You can favorite up to three services to monitor by pressing the star the the left of the service name. The stars next to the services you have chosen will then turn blue. 

Next, you will be given a new pop-up where you can select “Allow Notifications.” This is the permission that allows us to notify you when your favorite services are experiencing reports of service disruptions. If you have already enabled push notifications from the Speedtest app, you will not have to do so again.

phone lock screen with Downdetector push notification

You’re all set! We’ll send you a notification the next time one of your favorite services is having issues. 

Prepare for the next major internet outage by setting up push notifications for your favorite services today. Easy access to outage details will help you decide if you need to work on something else for a while. Download the free Speedtest app for Android and iOS to set yourself up for success today.

Ookla retains ownership of this article including all of the intellectual property rights, data, content graphs and analysis. This article may not be quoted, reproduced, distributed or published for any commercial purpose without prior consent. Members of the press and others using the findings in this article for non-commercial purposes are welcome to publicly share and link to report information with attribution to Ookla.

| July 23, 2024

Is Parisian Mobile Coverage Ready for the Gold?

All eyes are on Paris this month for the 2024 Olympic Games. Hundreds of thousands of people will converge to watch the events or compete, and every single one will want to share their experience with friends, loved ones, and the internet at large. Which can only happen if they can find mobile coverage. So we analyzed Speedtest® data from Q2 2024 to help you find the best connection near the various Olympic venues in Paris.

Paris is 5G-ready overall

Map Best Available Mobile Technology in Paris

Our analysis of Speedtest data across Paris shows that 5G is available in almost every corner of the city. Coverage is not quite as complete in or near the cemeteries of Montparnasse or Pere Lachaise or in the parks of Bois de Boulogne or Bois de Vincennes, but for the most part you’ll have a hard time finding an area where you cannot connect at all. 5G offers better performance for mobile customers than 4G LTE, providing higher speeds and lower latency. To learn more about 5G, visit our 5G FAQ.

Each of the sections below will give you a good idea of what cellular connection type is most common in the area. For a view of the most common connection types for each mobile carrier, download the Speedtest app for Android or iOS and check the map tab. Pull up the drawer to select a carrier and whether you want to see the best connection type available or the most common. Remember that if you’re roaming, you may not get the performance you’re used to at home.

4th Arrondissement: Hôtel de Ville

Map of Most Common Mobile Technology in 4th Arrondissement in Paris

The Olympic marathon begins at Paris’s iconic city hall. You should be in luck for 5G coverage both at the start of the race and anywhere you wander along Rue de Rivoli and into the Arsenal section of the Marais. In northern parts of the Marais, 4G is more common, though you may still be able to connect to 5G.

7th Arrondissement: Eiffel Tower Stadium, Champ de Mars Arena, Invalides

Map of Most Common Mobile Technology in 7th Arrondissement in Paris

You’ll probably visit the Eiffel Tower and nearby Champ de Mars, even if you aren’t a fan of beach volleyball, judo, or wrestling. The good news is that 5G is the most common mobile technology near both those venues. The bad news is that there are a few small areas running up the middle of the 7th arrondissement where you’ll be on 3G or you could have no service at all. If this happens, keep walking east because you’ll pass through those areas quickly and find 5G again close to Les Invalides and leading up to Pont Alexandre III.

8th Arrondissement: Grand Palais, La Concorde, Pont Alexandre III

Map of Most Common Mobile Technology in 8th Arrondissement in Paris

The 8th arrondissement is home to venues featuring some of the newest Olympic sports, including breakdancing and skateboarding; it’s also teeming with 5G coverage and shows no dead zones. So whether you’re into fencing, taekwondo, cycling, or swimming, you’ll have access to 5G near all the major venues in this district.

12th Arrondissement: Bercy Arena

Map of Most Common Mobile Technology in 12th Arrondissement in Paris

Sharing all the gymnastics highlights should be easy at Bercy Arena in the 12th arrondissement with 5G solidly covering the southwest side of the venue up and down the Seine on Quai de Bercy. LTE is more common along the northeast side of the venue and deeper into the middle of the district. There are a few anomalous spots of 3G or no service dotted throughout the 12th arr., including near the Musée des Arts Forains, Place de la Nation, and in the Bois de Vincennes.

15th Arrondissement: South Paris Arenas

Map of Most Common Mobile Technology in 15th Arrondissement in Paris

5G is most commonly found along the southwest edge of the 15th arrondissement, including near the South Paris Arena. If you’re walking south from the Eiffel Tower and the 7th arrondissement for the handball, table tennis, volleyball, or weightlifting events at South Paris Arenas, you’ll likely be bumping back and forth between 4G and 5G. There are also a few small areas of 3G or no service scattered throughout the district, so if you’re having trouble connecting, walk a few hundred meters and try again because you’ll be back on LTE.

16th Arrondissement: Trocadéro, Parc des Princes, Stade Roland-Garros

Map of Most Common Mobile Technology in 16th Arrondissement in Paris

If you’re watching football, cycling, boxing, or tennis at any of the three Olympic venues in the 16th arrondissement, you’ll likely have 5G. However, you may quickly find yourself on 4G LTE if you’re wandering the district at large. As we saw in other districts, the edge of the Seine is a reliable place to find 5G should you need a faster connection.

18th Arrondissement: Porte de la Chapelle Arena

Map of Most Common Mobile Technology in 18th Arrondissement in Paris

Fans of badminton and rhythmic gymnastics will find the area around Porte de la Chapelle Arena in the 18th arrondissement to be well covered with 5G. In general, the northern part of this district has more 5G coverage, but there are a few areas of 3G or no service scattered throughout the southern half of the 18th arr.

To see what mobile coverage you can expect at Olympic venues outside of Paris or for a personalized view of mobile coverage by operator, download the free Speedtest app for Android or iOS and check the map tab. Be aware that massive crowds can weigh heavily on a network, so if you are having trouble connecting, check Downdetector® to see if there’s an outage or if a particular service is down.

Ookla retains ownership of this article including all of the intellectual property rights, data, content graphs and analysis. This article may not be quoted, reproduced, distributed or published for any commercial purpose without prior consent. Members of the press and others using the findings in this article for non-commercial purposes are welcome to publicly share and link to report information with attribution to Ookla.

| June 24, 2024

How Much Faster is 5G Anyway? An Analysis of Page Load Speed

There’s nothing quite like picking up your phone for a little “me” time only to open up that first web page… and wait for it to load. Maybe the images aren’t there yet or the content jumps around while the ads load — it’s the worst. 5G is meant to help, so we dug into Speedtest® quality of experience data to see if this newer technology is living up to its promise. Read on for an analysis of page load speed (how many milliseconds it takes for a page to load) on three popular services in nine major countries around the world during Q1 2024.

Click the country below to go directly to that section or read on for the full article:

Brazil | Canada | France | India 

Mexico | Nigeria 

South Africa | Spain | United States

Page speed relies on low latency for the best internet experience

Page load speed is a critical measure of your web browsing experience. It measures how long it takes for a page to load, fully displaying the content on that page. This is directly impacted by latency, which is how quickly your device gets a response after you’ve sent out a request. A typical request on the internet requires two to five round trip communications between various entities over different latency sensitive protocols.

One of the promises of 5G is lower latency, which should lead to a faster (lower) page load speed on any page. The Speedtest Global IndexTM reported the global average for mobile latency as 27 milliseconds (0.027 seconds) with fixed broadband at 9 ms (0.009 s) in May 2024. As seen in the video below, it can take 7x longer to load a full webpage when latency is high, and “40% of users will abandon a site if it takes more than 3 seconds to load,” according to one source. Read more about the importance of latency to quality of experience.

5G lived up to the latency promise, showing a faster page load speed than 4G on all services in all countries we surveyed. However, the improvement was not the same in all places, with Canada topping the list of fastest page load speed over 5G on all the services we surveyed while South Africa had the slowest 5G page load speed on Google and YouTube of countries reviewed here. Read on for details.

5G loads 20-30% faster than 4G in Brazil

Chart of 5G vs. 4G Page Load Speed in Brazil

Speedtest data shows that 5G delivered a much lower page load speed than 4G on all three services in Brazil during Q1 2024. Google loaded 20% faster on 5G than 4G, YouTube was 25% faster, and Facebook was 30% faster on 5G.

Canada’s 5G page load speed among the fastest on all 3 services

Chart of 5G vs. 4G Page Load Speed in Canada

As mentioned, Canada’s 5G page load speed was the fastest or among the fastest for all countries analyzed in this article, with Canada having the fastest page load speed on Facebook, Google, and YouTube. Our analysis demonstrated that 5G delivered a decently faster page load speed than 4G on all three services in Canada during Q1 2024. YouTube loaded 16% faster on 5G than 4G, Google was 18% faster, and Facebook was 23% faster on 5G.

French 5G loads 14-20% faster than 4G

Chart of 5G vs. 4G Page Load Speed in France

Speedtest data shows 5G page load speed on all three services was decently faster than on 4G in France during Q1 2024. YouTube loaded 14% faster on 5G than 4G, Facebook was 19%, and Google was 20% faster on 5G.

5G loads 23-33% faster than 4G in India

Chart of 5G vs. 4G Page Load Speed in India

Analysis of Speedtest data shows the page load speed on all three services was much lower on 5G than 4G in India during Q1 2024. Google loaded 23% faster on 5G than 4G, YouTube was 32% faster, and Facebook was 33% faster on 5G. India and Mexico had the slowest page load speeds for Facebook over 5G of any of the countries we looked at.

Mexican 5G loads 26-28% faster than 4G

Chart of 5G vs. 4G Page Load Speed in Mexico

Speedtest data shows 5G delivered a much lower page load speed than 4G on all three services in Mexico during Q1 2024. Google and Facebook loaded 26% faster on 5G than 4G and YouTube was 28% faster on 5G. Mexico and India had the slowest 5G page load speeds for Facebook among the countries examined.

5G loads up to 47% faster than 4G in Nigeria

Chart of 5G vs. 4G Page Load Speed in Nigeria

Our analysis revealed 5G delivered a much lower page load speed than 4G on all three services in Nigeria during Q1 2024. Google loaded 24% faster on 5G than 4G, YouTube was 27% faster, and Facebook was a whopping 47% faster on 5G.

South Africans see 22-36% faster 5G page load over 4G, but slow Google and YouTube

Chart of 5G vs. 4G Page Load Speed in South Africa

Speedtest data shows 5G delivered a much lower page load speed than 4G on all three services in South Africa during Q1 2024. Google loaded 22% faster on 5G than 4G, YouTube was 27% faster, and Facebook was 36% faster on 5G. South Africa had the slowest 5G page load speed for both Google and YouTube of any of the countries analyzed.

5G loads 11-15% faster than 4G in Spain

Chart of 5G vs. 4G Page Load Speed in Spain

5G page load speed in Spain was somewhat faster than 4G on all three services during Q1 2024. YouTube loaded 11% faster on 5G than 4G, Google was 14% faster than 4G, and Facebook was 15% faster on 5G.

U.S. 5G loads 21-26% faster than 4G

Chart of 5G vs. 4G Page Load Speed in United States

Speedtest data from the U.S. shows 5G delivered a much lower page load speed than 4G on all three services during Q1 2024. Google loaded 21% faster on 5G than 4G, YouTube was 22% faster, and Facebook was 26% faster on 5G.

Your time is valuable. Our data shows that you can get some of that important time back if you have access to 5G and can afford to upgrade. To learn more about your network experience, download the Speedtest app for Android or iOS. Remember, too, that there’s a Downdetector® tab in the Speedtest apps to help you troubleshoot pages that aren’t loading at all.

Ookla retains ownership of this article including all of the intellectual property rights, data, content graphs and analysis. This article may not be quoted, reproduced, distributed or published for any commercial purpose without prior consent. Members of the press and others using the findings in this article for non-commercial purposes are welcome to publicly share and link to report information with attribution to Ookla.

| June 17, 2024

Your Guide to Airport Wi-Fi and Mobile Performance at 50+ Global Airports in 2024

Airports around the world have been packed with travelers this year, which puts extra stress on the Wi-Fi. With summer travel already well in swing in the northern hemisphere, we’re back with fresh data for our series on airport Wi-Fi performance to help you plan for connectivity at all your connections. You’ll find information about Wi-Fi on free networks provided by the individual airports as well as mobile speeds at some of the busiest airports in the world during Q1 2024. Read on for a look at internet performance at over 50 of the world’s busiest airports with data on download speed, upload speed, and latency.

Key takeaways

  • The seven fastest airports for downloads over Wi-Fi were in the United States: San Francisco International Airport, Newark Liberty International Airport, John F. Kennedy International Airport, Phoenix Sky Harbor International Airport, Seattle–Tacoma International Airport, Dallas Fort Worth International Airport, and Harry Reid International Airport.
  • Six U.S. airports had the fastest uploads over Wi-Fi: San Francisco International Airport, Phoenix Sky Harbor International Airport, Newark Liberty International Airport, Seattle–Tacoma International Airport, Dallas Fort Worth International Airport, and John F. Kennedy International Airport.
  • The fastest mobile download speeds on our list were at Hamad International Airport in Doha, Qatar, Shanghai Hongqiao International Airport in China, and Phoenix Sky Harbor International Airport in the U.S.
  • Eight of the 10 airports with the fastest mobile upload speeds were in China.

9 airports have 100+ Mbps Wi-Fi download speeds

Speedtest Intelligence® showed seven of the nine airports with median Wi-Fi download speeds over 100 Mbps were in the U.S.:

  • San Francisco International Airport (173.55 Mbps),
  • Newark Liberty International Airport (166.51 Mbps),
  • John F. Kennedy International Airport (151.59 Mbps),
  • Phoenix Sky Harbor International Airport (151.28 Mbps),
  • Seattle–Tacoma International Airport (137.31 Mbps),
  • Dallas Fort Worth International Airport (119.92 Mbps), and
  • Harry Reid International Airport (107.84 Mbps).

Charles de Gaulle Airport in Paris, France and China’s Hangzhou Xiaoshan International Airport rounded out the list with median download speeds of 107.13 Mbps and 101.01 Mbps, respectively. Hartsfield–Jackson Atlanta International Airport and Sea–Tac had the lowest median multi-server latency on Wi-Fi of any of the airports surveyed during Q1 2024.

Hover on the pins on the map below to see full details for download and upload speeds as well as latency at all the airports analyzed.

Fixed Broadband Internet Speeds Over Free Wi-Fi at Global Airports
Speedtest Intelligence® | Q1 2024
A map showing fixed broadband speeds in selected global airports.

At Ookla®, we’re dedicated to making sure the networks you depend on are always at their best. With Ekahau®, our Wi-Fi solution, we know firsthand just how challenging it can be to optimize Wi-Fi at airports, especially when you have up to 900 people waiting at each boarding gate during the busiest travel times. While the speeds achieved by these top airports are impressive, we saw two smaller U.S. airports with median Wi-Fi download speeds over 200 Mbps during our U.S.-only analysis of airport Wi-Fi in the fall.

Six airports on our list use multiple SSIDs for their Wi-Fi networks for different terminals or to take advantage of the coverage advantages of 2.4 GHz and the speed advantages of 5 GHz frequencies. We have included data for all the SSIDs with sufficient samples in the map and reported in the text on the best result when using multiple SSIDs results in dramatically different speeds.

Eighteen airports on our list had median Wi-Fi download speeds of less than 25 Mbps. Mexico City International Airport in Mexico had the lowest median Wi-Fi download speed at 5.11 Mbps, followed by:

  • Tan Son Nhat International Airport in Vietnam (7.07 Mbps),
  • Beijing Capital International Airport in China (9.45 Mbps),
  • Cairo International Airport in Egypt (10.62 Mbps), and
  • Tokyo Haneda Airport in Japan (11.37 Mbps).

You may struggle with everything from video chatting to streaming at any airport with a download speed below 25 Mbps. Latency is also a factor in performance so if your airport is one of the three with a median Wi-Fi latency over 60 ms, a mobile hotspot may be a better option for a stable connection.

Wi-Fi 6 has arrived

Our analysis shows at least 15 airports on our list were using the new Wi-Fi 6 standard in their Wi-Fi setup. Wi-Fi 6 uses Multi-User Multiple Input, Multiple Output (MU-MIMO) and Orthogonal Frequency Division Multiple Access (OFDMA) to increase performance and throughput, especially when serving multiple devices. This offers a real advantage at a large public location like an airport. In order to get maximum benefit from Wi-Fi 6, consumers would need to be using Wi-Fi 6-compatible devices. Speedtest data shows a fairly even split between airports that saw faster download speeds on Wi-Fi 6 and airports where Wi-Fi 6 results were comparable to those on other earlier Wi-Fi generations.

As you know, international travel can be complicated. Even if the airport offers free Wi-Fi, you may encounter other barriers to access. For example, a local number is required in Cairo to receive the access code to connect to the airport Wi-Fi. And while we’d love to include other large airports like Nigeria’s Murtala Muhammed International Airport in future Wi-Fi analyses, they currently do not offer free Wi-Fi so we have included mobile data below.

11 airports show mobile speeds over 200 Mbps

Speedtest® data shows mobile speeds massively outpaced Wi-Fi, with 14 airports showing faster median downloads over mobile than the fastest airport for Wi-Fi. Hamad International Airport in Qatar had the fastest median download speed over mobile on our list at 442.49 Mbps during Q1 2024, followed by:

  • Shanghai Hongqiao International Airport (341.19 Mbps),
  • Phoenix Sky Harbor International Airport (295.94 Mbps),
  • Shanghai Pudong International Airport (264.71 Mbps),
  • Chongqing Jiangbei International Airport (258.42 Mbps), and
  • Istanbul Airport (255.51 Mbps).

Mobile Network Speeds at Global Airports
Speedtest Intelligence® | Q1 2024

Fastest mobile speeds at airports in Africa and South America

Jomo Kenyatta International Airport in Kenya had the fastest mobile download speeds of the four African airports we analyzed at 88.12 Mbps during Q1 2024. São Paulo/Guarulhos International Airport in Brazil was the faster of the two Latin American airports analyzed with a median download speed of 55.44 Mbps.

Airports with slow mobile speeds

Mobile can’t fix everything, because six airports came in with a median mobile download speed below 25 Mbps. Mexico City International Airport was again at the bottom with 8.75 Mbps, followed by:

  • Josep Tarradellas Barcelona–El Prat Airport (15.21 Mbps),
  • Orlando International Airport (15.84 Mbps),
  • Adolfo Suárez Madrid–Barajas Airport (20.37 Mbps),
  • Chhatrapati Shivaji Maharaj International Airport (20.96 Mbps), and
  • Indira Gandhi International Airport (21.80 Mbps).

Latency on mobile was generally higher than that on Wi-Fi with 46 airports showing a Wi-Fi latency lower than the lowest latency on mobile, 27.51 ms at China’s Shanghai Hongqiao International Airport. As noted above, latency is an important factor in performance, so it might be worth investigating the airport Wi-Fi by running a Speedtest if your mobile performance seems to lag.

Airport Wi-Fi or mobile? Connecting on your next trip

We created a quick guide to help you decide whether to try out the Wi-Fi or simply use the local mobile network if you have access. Use it to compare free airport Wi-Fi performance against mobile performance for the 52 airports we have both Wi-Fi and mobile data for during Q1 2024. Twenty-six airports had faster mobile internet than airport Wi-Fi. Eight airports had faster Wi-Fi than mobile, and seven airports showed only a slight distinction between Wi-Fi and mobile or download speeds over 100 Mbps on both, so we gave both the green check marks. We were able to include more airports in the mobile analysis because there were more mobile samples to analyze at those airports than there were samples over Wi-Fi.

Chart of Comparing Airport Wi-Fi and Mobile Speeds at World Airports

The averages reported here are based on real-world data, so your experience may differ, especially on a busy travel day. Take a Speedtest® at the airport to see how your performance compares. Cheers to safe travels and rapid connections wherever you’re flying.

Ookla retains ownership of this article including all of the intellectual property rights, data, content graphs and analysis. This article may not be quoted, reproduced, distributed or published for any commercial purpose without prior consent. Members of the press and others using the findings in this article for non-commercial purposes are welcome to publicly share and link to report information with attribution to Ookla.

| March 19, 2024

Broadband Consumer Labels are Coming Soon, and Ookla’s Data Can Help ISPs Prepare

The internet has become a fundamental tool of daily life, serving as a key resource for consumers and businesses alike. As our reliance on connectivity continues to grow, it’s become critical for all internet users to have access to accurate and transparent information about their internet service providers (ISPs). This need for transparency has prompted the FCC to introduce its Broadband Consumer Label initiative, which will educate consumers with standardized, easy-to-understand information about the broadband services that ISPs across the United States are offering. 

Broadband Consumer Labels are similar in appearance to the nutrition labels affixed to nearly every product at the grocery store, with both types of labels providing consumers with key information–and transparency–about the products they’re buying. ISPs will soon be required to display their own version of “nutrition labels” at the point of sale, including in marketing materials and on provider websites. Broadband Consumer Labels, which must be machine-readable, are required to disclose several key service attributes, such as the typical download and upload speeds associated with a plan, the typical latency users can expect, as well as pricing and other information. Specifically, ISPs are required to display the following information on Broadband Consumer Labels: 

  • Plan name/tier
  • Monthly pricing information, including one-time charges, early termination fees, introductory discounts, and bundled services
  • Whether or not an ISP participates in the Affordable Connectivity Program (ACP), though this could change if the ACP program isn’t extended 
  • Performance metrics, including typical download and upload speed, as well as typical latency
  • Data cap information
  • Links to ISP policy information 
  • Customer support contact information
  • FCC reference ID (a unique identifier supplied by the FCC), as well as a link to the FCC’s consumer page

Providers with more than 100,000 subscribers are required to display Broadband Consumer Labels by April 10, 2024, while all other providers have until October 10, 2024. 

screenshot of navigating FCC broadband label requirements from webinar

For a more detailed breakdown of the risks, challenges, and importance of these labels, watch our webinar: Navigating FCC Broadband Label Requirements.

The benefit to consumers is clear: transparency

Broadband Consumer Labels will provide consumers with much-needed transparency into the level of service they can expect when choosing an ISP. By organizing performance and pricing details in a simple, repeatable format, users can be sure they’re getting what they pay for, and they can compare different providers and plans more easily. The benefits to providers, meanwhile, largely comes in the form of increased consumer trust, confidence, and ultimately, brand loyalty. The labels will also provide ISPs with a medium to promote their offerings to users across the country.

image of FCC broadband consumer label

Broadband Consumer Label risks & challenges

On the other hand, the introduction and continued maintenance of broadband labels marks a sea change for the telco industry at large. The more pricing tiers and technologies that exist across multiple markets, the more unique labels will need to be published. For example, one provider’s label in Seattle could be different from the same provider’s label in nearby Tacoma in terms of price, plan tiers, speeds, and more. It will be a behemoth effort for many ISPs to create and update labels, and internet providers will undoubtedly face challenges. Providers not only need to adhere to the FCC’s guidelines in relatively short order, but labels must also be updated every six months, as well any time an ISP modifies an existing plan or introduces a new one. 

Providers also face both regulatory and commercial risks with the new labels. Some of those risks and challenges include: 

Regulatory Risks:

  • Although the program begins in April, the rules are subject to change as the FCC is still requesting input from key stakeholders.
  • Latency is considered particularly important for people who use video conferencing, including those with disabilities.
  • The FCC has yet to define what “typical” means in the context of speeds and latency. 
  • Consumer advocacy groups believe many subscribers are not getting what they pay for.
  • Expect FCC enforcement mechanisms to be developed for situations in which the information displayed on labels doesn’t match with the real-world user experience. 

Commercial Risks

  • Competition will have broad visibility into performance claims for every plan a provider offers. 
  • Administrative overhead for ISPs driven by the number of price plans, markets, technologies, etc.
  • Existing subscriber misconceptions of service experienced compared to the actual service delivered.
  • Resellers must provide performance metrics even though they have limited control over quality of service (QoS) metrics.
  • Consumer advocacy groups and consumers pose a legal risk for providers if information on labels isn’t reflected in reality. 

How Ookla can help ISPs with the broadband label revolution 

With deadlines for providers right around the corner, it’s critical for ISPs to coordinate across IT, marketing, legal, and regulatory teams to determine the number of labels needed for various regions, price points, performance metrics, and more. Two label requirements that may prove particularly difficult for providers to manage are the typical speed and latency performance metrics in a given area. 

While the FCC hasn’t yet defined what “typical” means for performance metrics on broadband labels, providers could find it difficult to both determine and validate those metrics because the real-world speeds experienced by consumers often differ from a provider’s advertised speeds, and it can also be difficult to distinguish real-world performance between different technologies or tiers of service, such as fiber or cable. 

That’s where Ookla can help. Ookla receives over 11 million consumer-initiated Speedtests per day from all over the world, with over 50 billion total tests taken to date. Ookla’s detailed data and insights on speed, latency, and a host of other metrics can help Internet Service Providers substantiate typical speed or latency claims, ensuring their subscribers know what to expect and ultimately get what they pay for. 

Three Ookla solutions that should be particularly helpful in both the rollout and maintenance of broadband labels are Speedtest Embedded™, Speedtest Custom™, and the Ookla Enrichment API™. 

  • Speedtest Embedded allows Speedtest to be integrated as a testing solution on servers and desktops, as well as CPE devices. Ookla captures millions of these CPE tests every day on consumer gateways, Wi-Fi routers, and set-top boxes, providing ISPs with measurements directly from or very near to the service connection. 
  • Speedtest Custom provides users with accurate network performance testing backed by the same trusted testing engine as Speedtest, helping ISPs and their customers understand their connected experiences with performance metrics including download, upload, latency, and jitter.  
  • Ookla Enrichment API lets ISPs link a given test to a specific plan subscription, allowing providers to enrich test data with subscriber tiers/provisioned speeds, technology types, whether a test was conducted in a residential or commercial area, and more. Please reach out to learn more about the Ookla Enrichment API.

Conclusion 

As we navigate the quickly approaching deadlines of April and October 2024 for the implementation of Broadband Consumer Labels, the urgency for ISPs to adapt cannot be overstated. These labels should add a new level of transparency and trust within the telecommunications sector, offering consumers and businesses clear, standardized information about broadband services. 

However, the path to compliance won’t be easy. ISPs must navigate complex logistical and data management hurdles to produce and maintain these labels accurately. Each label must reflect specific service characteristics relevant to the geographic location it serves, which will require a granular level of detail and regular updates (every six months) to ensure accuracy. What’s more, regulatory uncertainties and the dynamic nature of broadband services can add layers of additional complexity to this endeavor. The FCC will likely offer some latitude on implementation during the first several months, but ISPs should prepare to contend with eventual enforcement of the rules. Perhaps more immediate is the potential for challenges from aggressive public interest groups and impassioned subscribers. 

Ookla is here to help! With an unmatched depth and breadth of connectivity data derived from millions of consumer-initiated Speedtests taken daily, Ookla’s solutions can help ISPs streamline the process of substantiating the claims made on these new broadband labels. With Speedtest Embedded, Speedtest Custom, and the Ookla Enrichment API, ISPs can access real-time insights into network performance, customer experience, and other critical metrics. 

These tools are instrumental in validating the typical speed and latency performance information required on broadband labels, ensuring that ISPs can meet FCC guidelines with confidence and precision. Contact us to learn more. 

Ookla retains ownership of this article including all of the intellectual property rights, data, content graphs and analysis. This article may not be quoted, reproduced, distributed or published for any commercial purpose without prior consent. Members of the press and others using the findings in this article for non-commercial purposes are welcome to publicly share and link to report information with attribution to Ookla.

| March 18, 2020

Set Yourself Up to Effectively Work from Home or Learn Remotely

If you’ve suddenly found yourself working from home more often or learning remotely, there are a few things you might want to consider to ensure your new workspace has the internet connectivity and speeds you need to work effectively. We also offer some advice on securing your connection and troubleshooting web outages to keep in mind when making your transition from a traditional in-person experience to a home office or classroom.

wfh-explainer-1

1. Understand your home internet needs and capabilities

How to test your internet speed

To begin setting up your home workspace, test your internet speed to make sure your connection is fast enough for your needs. An easy way to test your broadband internet speed at home is by using Speedtest®.

Free Speedtest desktop apps are also available for Windows and Mac, as well as on many other platforms.

speedtest-desktop800

To run a Speedtest, make sure you are connected to the Wi-Fi or ethernet connection you’d like to test, click or tap on the “GO” button and wait a few seconds until your download and upload speeds have been analyzed. You’ll see your speeds at the top along with ping and jitter.

What speeds you need for different tasks

Bandwidth-spectrum

The graphic above illustrates the kind of speeds you need for different activities like video conferencing or uploading large documents.

A download and upload speed of 2 Mbps is sufficient for those who only use email, social media and audio conference calls on one device at a time. For remote work and learning that requires video conferencing or uploading and downloading large documents like videos, average download speeds of 10 Mbps would be preferable. A download speed of 25 Mbps or higher is desirable for those who have multiple people working from home or people using streaming services at the same time.

Keep in mind that internet usage is cumulative. This means that you need to consider all the speed needs that are happening at the same time together: the person in your house who is only sending and receiving emails, the one streaming HD, and the person on video chat (even if they’re all you).

How to get faster internet

If your Speedtest shows your internet connection is not as fast as you need it to be, check to see if you’re running any ongoing downloads or other programs like video chat that might be hogging your bandwidth. Close those programs and test again. If your speeds are still low, reboot your computer, modem and router. You may also want to check the Speedtest Global IndexTM to see the average speeds in your country and how your connection compares.

If your speeds are still not where they should be, this would be a good time to contact your ISP for help or to upgrade your service package. Keep in mind that you may need to upgrade your router to obtain faster speeds.

Get the most out of your Wi-Fi

wifi-waves

Most people are not using a hardwired connection at home, instead they’re using Wi-Fi on their laptops or mobile devices. That’s why getting Wi-Fi right is so important. People are often tempted to use the Wi-Fi connection labeled “5 GHz” because it’s faster. However, 5 GHz has shorter range and is bad at penetrating walls. While 2.4 GHz is slower and can be subject to interference from bluetooth devices, 2.4 GHz Wi-Fi has a longer range and is better at penetrating walls. Choose the connection that’s best for your home Wi-Fi setup and then test your speeds on both 2.4 GHz and 5 GHz to see which one truly works best for you.

2. Secure your connection

For those who deal with sensitive and important data on a daily basis, a secure connection is essential. Multiple companies now rely on Virtual Private Networks (VPNs) to enable their employees to send and receive data across a shared or public network as if their devices were directly connected to a private network.

If you are working from your mobile device, check out Ookla’s recently released Speedtest VPNTM that ensures your online privacy and security from the convenience of your Speedtest mobile application.

Your company or school may also already have a preferred VPN product they use in the office that you can use at home. If they don’t, there are multiple options beyond Speedtest VPN that you can test in your home office. We recommend browsing through PC Magazine’s VPN reviews to find the VPN that is best for you.

3. How to keep up with outages

Sometimes your internet connection is working just fine and it’s the services you rely on that are having an issue. Bookmark Downdetector to keep up with website and online services outages. Part of the Ookla family of products, this website is your go-to resource to see if others are experiencing issues with the same website or app, which can be more common during periods of increased usage and network congestion.

dd-screen-2

Simply type the website or app’s name in the search bar on the home page and click on the search button. You’ll navigate to a page that includes a chart with the number of reports from the last 24 hours, a live outage map where you can see where reports of an outage are coming from, and the most reported problems for the site you searched. You’ll also see comments from other users with the same problems at the bottom of the page.

Remote work and learning requires some adjustment, but with the proper internet setup, you can enjoy the flexibility as much as you enjoy the lax dress code. Visit our Frequently Asked Questions page if you need more information about internet speeds.

Ookla retains ownership of this article including all of the intellectual property rights, data, content graphs and analysis. This article may not be quoted, reproduced, distributed or published for any commercial purpose without prior consent. Members of the press and others using the findings in this article for non-commercial purposes are welcome to publicly share and link to report information with attribution to Ookla.

| March 27, 2023

Early Testing Shows How Fast the New Samsung Galaxy S23 Models Are

The new Samsung Galaxy S23, S23+, and S23 Ultra models launched February 17 and Ookla® is here today to see how they’ve performed over 5G against their predecessor S22 models. Our analysis looks at data from the first month after launching in 12 of the largest mobile markets with an established 5G market and the highest number of connected mobile devices during Q4 2022 according to GSMA. Previously, in October 2022, we used Speedtest Intelligence® to look at 5G performance data right after the launches of the iPhone 14 and Samsung Galaxy Z Fold4 in various countries

Note that device data differs across markets due to a variety of factors, including: 5G investments by governments and mobile operators, different 5G spectrum allocations by operator, 5G Availability, the number of and different kinds of 5G deployments, and other differences, including mobile 5G plans. Read on to learn more and see whether or not you should upgrade your Samsung S22 to a newer model.

Key takeaways:

  • The Samsung S23 models only statistically outperformed corresponding S22 models in Germany and two out of three models in the United States for 5G download speed, but the S23 looks poised to be faster as further 5G adoption and build out continues and more spectrum is allocated for 5G across the C-band and mmWave frequencies.

Key improvements to the new Galaxy S23 models

You want to know if the latest technology is worth the price of an upgrade when you’re looking for a new phone. The S23, S23+, and S23 Ultra have various upgrades, but when it comes to performance, here’s a quick list of what’s different between the new and older models. 

All Samsung Galaxy S23 vs. S22 models

  • The Samsung S23 models have a Qualcomm Snapdragon 8 Gen 2, while the Samsung S22 models have a Samsung Snapdragon 8 Gen 1
  • The S23 models have a Qualcomm Snapdragon X70 modem, while the S22 models have an X65 modem
  • The S23 models have an upgraded GPU

Samsung Galaxy S23 vs. S22 base models

  • The S23 has a bigger battery capacity at 3,900 mAh over the S22’s 3,700 mAh
  • The S23 has slightly better ultra-wide and front cameras and video recording capabilities

Samsung Galaxy S23+ vs. S22+ models

  • The S23+ has expanded storage capacity at a base level of 256 GB (which can be upgraded to 512 GB) over the S22+’s base of 128 GB
  • The S23+ has a bigger battery capacity at 4,700 mAh over the S22+’s 4,500 mAh
  • The S23+ has slightly better ultra-wide and front cameras and video recording capabilities

Samsung Galaxy S23 Ultra vs. S22 Ultra models

  • The S23 Ultra has expanded storage capacity at a base level of 256 GB (which can be upgraded to 512 GB) over the S22 Ultra’s base of 128 GB
  • The S23 Ultra has much better main camera, with up to 200 MP vs. the S22 Ultra’s maximum of 108 MP

Samsung Galaxy S23 performance in the world’s largest mobile device markets

Brazilian S22 and S23 users saw seriously fast 5G speeds (even though 5G Availability remains low)

Chart of Samsung Galaxy S23 vs. S22 5G Performance in Brazil

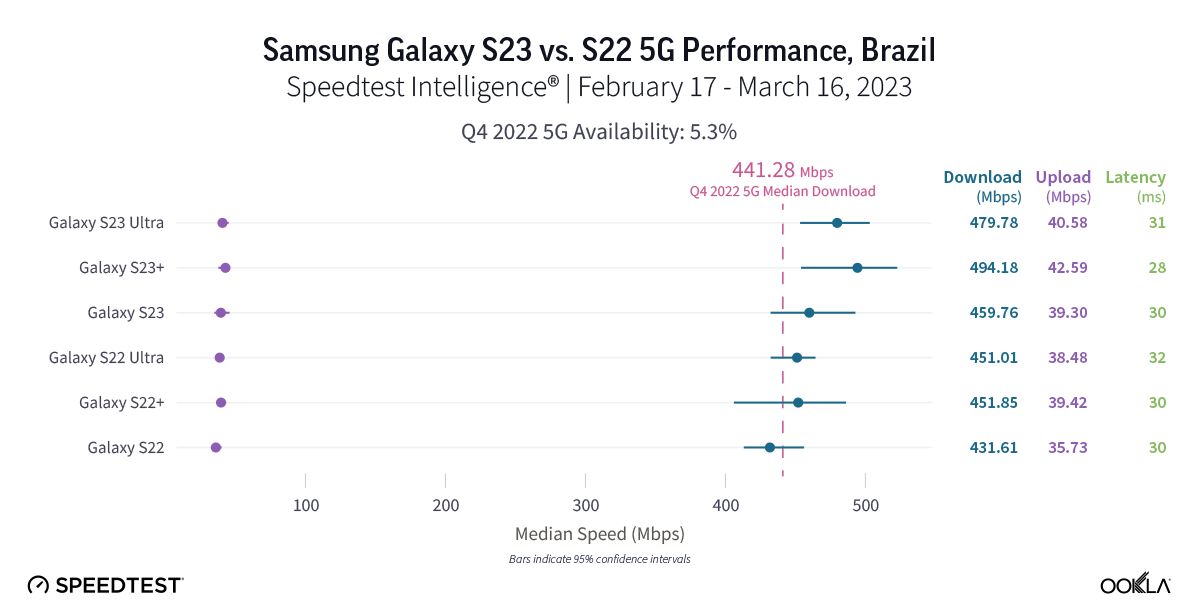
Speedtest Intelligence shows that the new S23 models were not yet statistically faster than the older S22 models in Brazil during the first month of launch, but they did exceed the median 5G download speed in Brazil during Q4 2022. Despite that, every S22 and S23 model had blazing fast speeds in Brazil, with median 5G download speeds faster than 400 Mbps. The S22 had a median download speed of 431.61 Mbps, the S22 Ultra was at 451.01 Mbps, and the S22+ at 451.85 Mbps. While the S23 models were not statistically faster than their S22 counterparts, the S23 had a median download speed of 459.76 Mbps, the S23 Ultra at 479.78 Mbps, and the S23+ at 494.18 Mbps. 5G upload speeds showed a similar trend, with no statistically faster S22 or S23 model, but with S22 models ranging from 35.73 Mbps to 39.42 Mbps and S23 models ranging from 39.30 Mbps to 42.59 Mbps. Multi-server latency — the latency you should expect to encounter more generally when your network is not under heavy load — ranged from 28.01 ms to 31.78 ms across all models over 5G.

Recommendation: Brazilian Galaxy S22 users should consider upgrading your phone if you can get 5G access; you’re going to get fast speeds and the new features of the S23, especially the camera of the S23 Ultra, may be worth it alone.

Chinese S23 users haven’t quite seen an improved 5G experience over S22 users

Chart of Samsung Galaxy S23 vs. S22 5G Performance in China

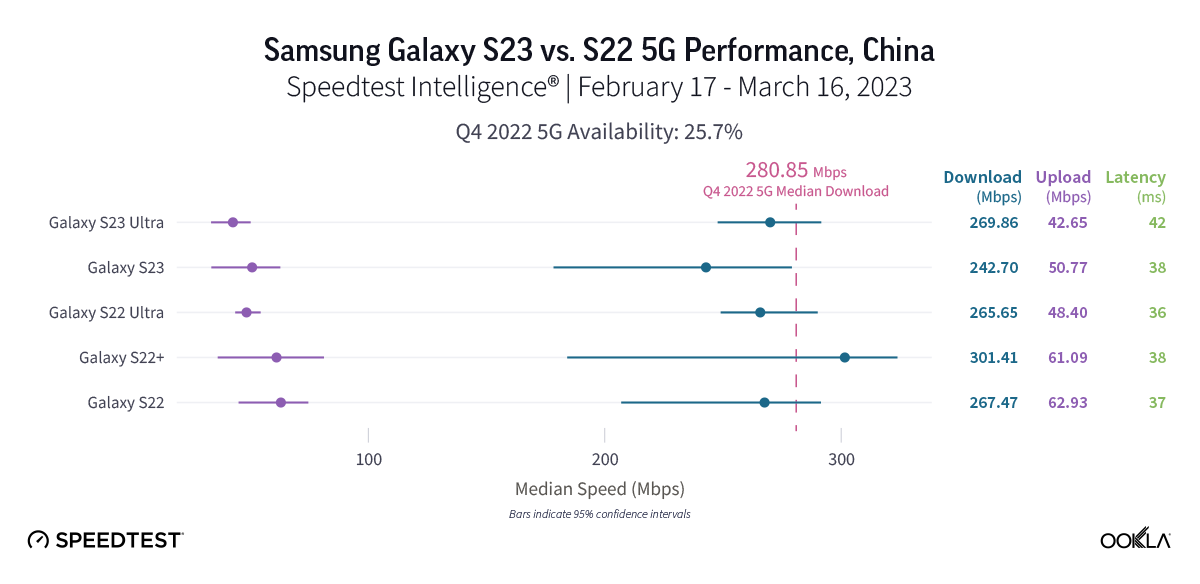
Data from the first month since the Samsung S23 launching illuminates that S23 models did not statistically outperform S22 models over 5G in China, and S23 models also didn’t quite exceed the Q4 2022 median 5G download speed. The S22 had a median 5G download speed of 267.47 Mbps, the S22 Ultra was similar at 265.65 Mbps, and the S22+ was at 301.41 Mbps. The S23 showed a median 5G download speed at 242.70 Mbps, while the S23 Ultra had a median download speed of 269.86 Mbps. 5G upload speeds on S22 models ranged from 48.40 Mbps to 62.93 Mbps, while the S23 and S23 Ultra were at 50.77 Mbps and 42.65 Mbps, respectively. While the S23 models showed lower median multi-server latency over 5G, there was no statistical winner between the S22 and S23 models. The S23+ did not meet the statistical threshold for inclusion in our analysis in China. 

Recommendation: Chinese Galaxy S22 users should wait to upgrade your phone until speeds improve, unless the new S23 model hardware upgrades have you wanting a new phone.

French S23 users saw promising 5G results, S22 users might want to wait to upgrade

Chart of Samsung Galaxy S23 vs. S22 5G Performance in France

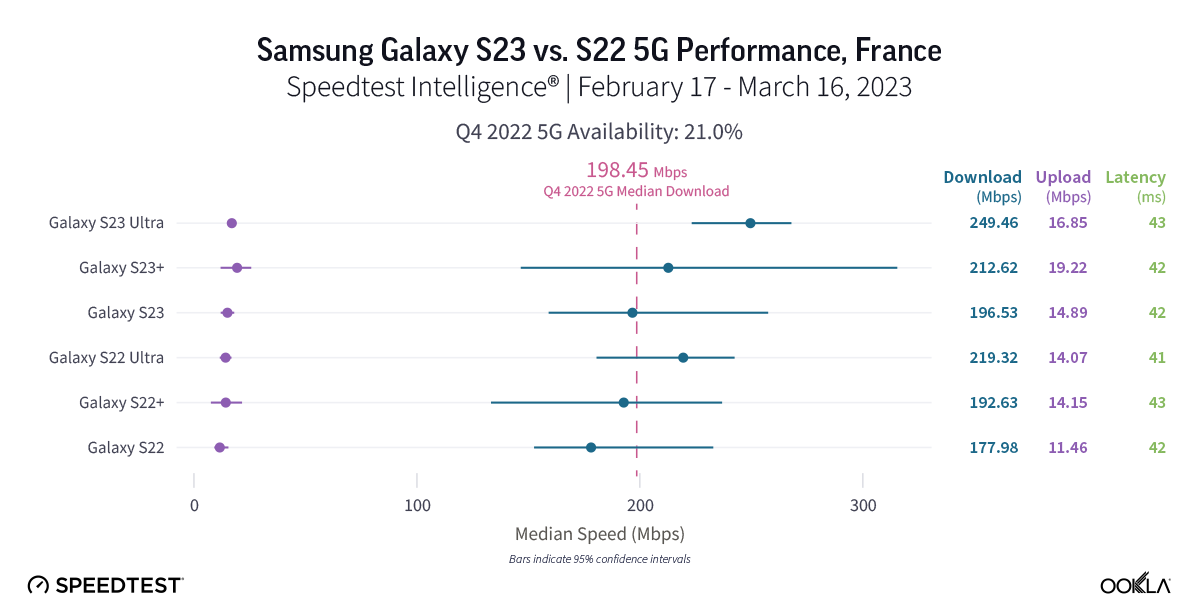
There was no statistically faster Samsung Galaxy S22 or S23 model over 5G in France during the first month of the S23’s release. However, median 5G download speeds for the S22 models ranged from 177.98 Mbps to 219.32 Mbps, while the S23 models ranged from 196.53 to 249.46 Mbps. 5G upload speeds showed a similar story, with no statistical winner. Upload speeds on S22 models ranged from 11.46 Mbps to 14.15 Mbps, and upload speeds on S23 models ranged from 14.89 Mbps to 19.22 Mbps. 5G multi-server latency was virtually the same for both models, which all ranged from 41.40 ms to 43.24 ms.

Recommendation: French Galaxy S22 users who want faster speeds might want to wait to upgrade your phone, but the new features of the S23 may make upgrading very tempting.

German Samsung Galaxy S22 users should feel confident upgrading to S23 models

Chart of Samsung Galaxy S23 vs. S22 5G Performance in Germany

Speedtest Intelligence reveals that German S23 users experienced faster 5G download speeds than their S22 counterparts during the first month of S23 availability across all models. The S23 outperformed the S22 for median 5G download speed, 147.26 Mbps to 112.01 Mbps, the S23 Ultra outperformed the S22 Ultra 141.56 Mbps to 124.45 Mbps, and the S23+ outperformed the S22+ 174.74 Mbps to 128.69 Mbps. Upload speeds had a bit more parity with the S22 models showing a range of 5G upload speeds from 20.47 Mbps to 26.10 Mbps, while the S23 models showed a range from 23.59 Mbps to 31.64 Mbps. Multi-server latency over 5G showed no statistical winner for either model but ranged from 36.76 ms to 38.58 ms.

Recommendation: Germany Galaxy S22 users shouldn’t hesitate to run to your operator to immediately upgrade your phone to an S23 model for faster speeds and better features.

Samsung Galaxy S23 users in Italy saw mixed 5G results after launch

Chart of Samsung Galaxy S23 vs. S22 5G Performance in Italy

New Speedtest Intelligence data reveals that while the basic S23 model outperformed the S22 model over 5G in Italy for median download speed 178.67 Mbps to 128.53 Mbps during the first month after launch, the S23 Ultra and S23+ models didn’t statistically outperform their S22 counterparts. That held true for upload speeds as well, with the S23 recording a median 5G upload speed of 21.73 Mbps to the S22’s 15.50 Mbps, while the S23 Ultra and S23+ weren’t statistically faster than the S22 Ultra and S22+, respectively. All of the S23 and S22 models during the first month of the S23 launch, except the S22 base model, were statistically faster than the 5G median download speed in Italy during Q4 2022. Median multi-server latency showed closer parity, with S22 models ranging from 45.02 ms to 47.79 ms, and S23 models ranging from 43.50 ms to 48.24 ms.

Recommendation: Unless you want a basic Galaxy S23 model and have consistent 5G access in Italy, you might want to wait to upgrade your phone to the S23 models unless you really want the new features.

Samsung Galaxy S23 showed 5G potential in the Philippines

Chart of Samsung Galaxy S23 vs. S22 5G Performance in Philippines

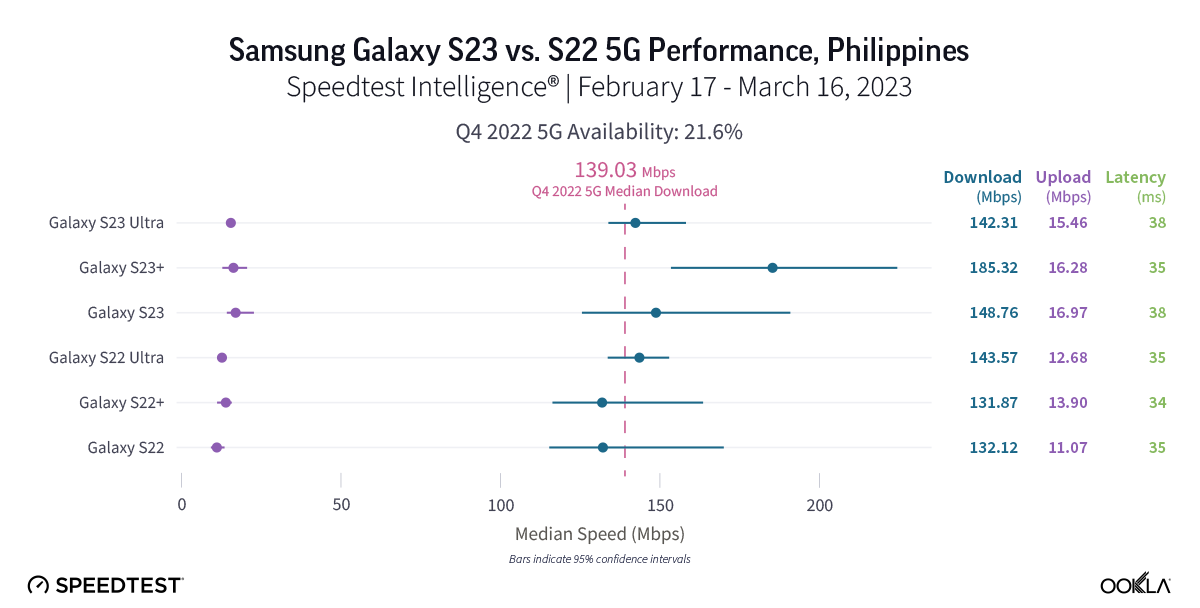
Fresh data from Speedtest Intelligence shows that while the S23 and S23+ had faster median 5G download speeds than their S22 counterparts during the first month of the S23’s launch, there were no statistical winners between the models in the Philippines. The S23 models’ median 5G download speeds ranged from 142.31 Mbps to 185.32 Mbps, while the S22 models ranged from 131.87 Mbps to 143.57 Mbps. Median 5G upload speed for the S23 Ultra was faster than its S22 Ultra counterparts at 15.46 Mbps to 12.68 Mbps, respectively. There were no statistical winners for median multi-server latency over 5G, though the S22 models ranged from 35.42 ms to 38.39 ms, while the S23 models ranged from 34.29 ms to 35.31 ms.

Recommendation: Filippino Galaxy S22 users should upgrade their phones to the S23 models if they want new features, but shouldn’t expect faster speeds and a better experience quite yet.

Polish Samsung S23 models had a promising debut over 5G

Chart of Samsung Galaxy S23 vs. S22 5G Performance in Poland

Speedtest Intelligence data shows Poland had some of the slowest median 5G download speeds on Samsung S23 and S22 models among the countries we surveyed. While the new S23 models had a higher median 5G download speed than their counterparts during the first month after launching, there were no statistically significant faster speeds. The S23 models ranged from 83.74 Mbps to 98.99 Mbps, while the S22 models ranged from 75.70 Mbps to 80.43 Mbps. Upload speeds were similarly faster, but not statistically so, with S22 models ranging from 16.89 Mbps to 19.62 Mbps and S23 models ranging from 19.94 Mbps to 24.25 Mbps. Median multi-server latency over 5G was a mixed bag, with the new S23+ actually having a higher latency than the S22+ 44.25 ms to 38.37 ms, respectively. The other two models were too close to call.

Recommendation: Polish Galaxy S22 users can upgrade their phones to the S23 models for the new features, but might not yet experience faster 5G speeds on the new models.

Samsung S23 models in South Africa don’t live up to the hype just yet

Chart of Samsung Galaxy S23 vs. S22 5G Performance in South Africa

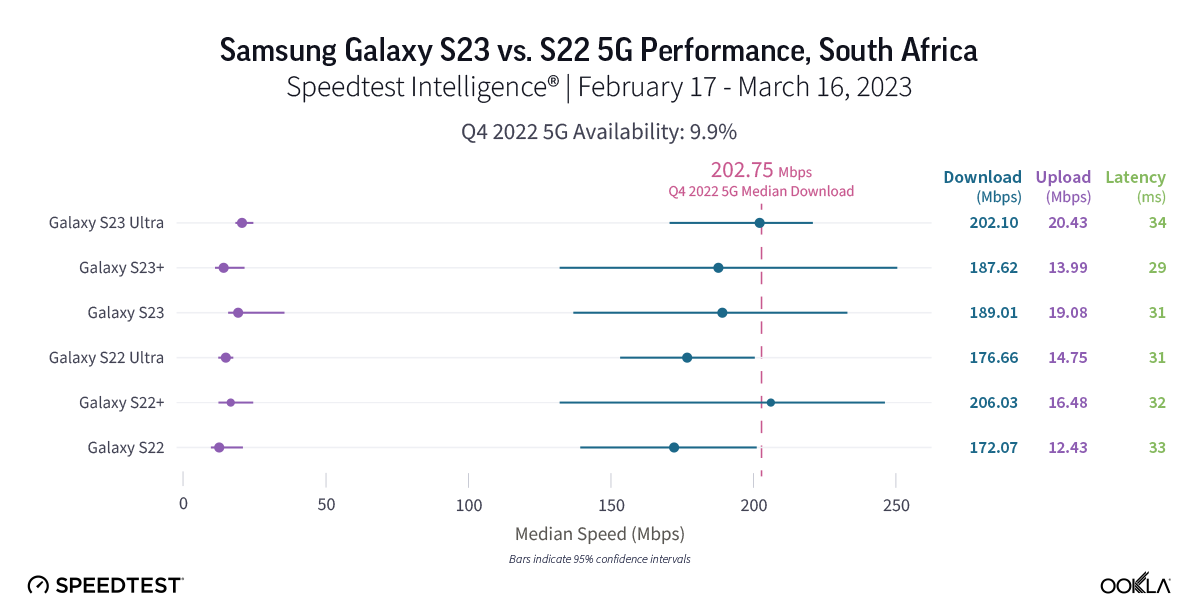
Speedtest Intelligence reveals that the new S23 models weren’t yet statistically faster than their S22 counterparts over 5G in South Africa during the first month after launch. S22 models had median 5G download speeds that ranged from 172.07 Mbps to 206.03 Mbps, while the S23 models ranged from 187.62 Mbps to 202.10 Mbps. There was one bright note — the median 5G upload speed for the S23 Ultra was faster than the S22 Ultra 20.43 Mbps to 14.75 Mbps. Median multi-server latency showed parity over 5G for the S22 models and S23 models. The S22 models ranged from 29.06 ms to 33.75 ms, while the S23 models ranged from 31.41 ms to 32.92 ms.

Recommendation: South African Galaxy S22 users should probably wait to upgrade their phones to the S23 models if they are looking for faster 5G experience, but the S23 features may outweigh the parity in speeds between models.

South Koreans saw fast 5G speeds on the new Samsung Galaxy S23 models

Chart of Samsung Galaxy S23 vs. S22 5G Performance in South Korea

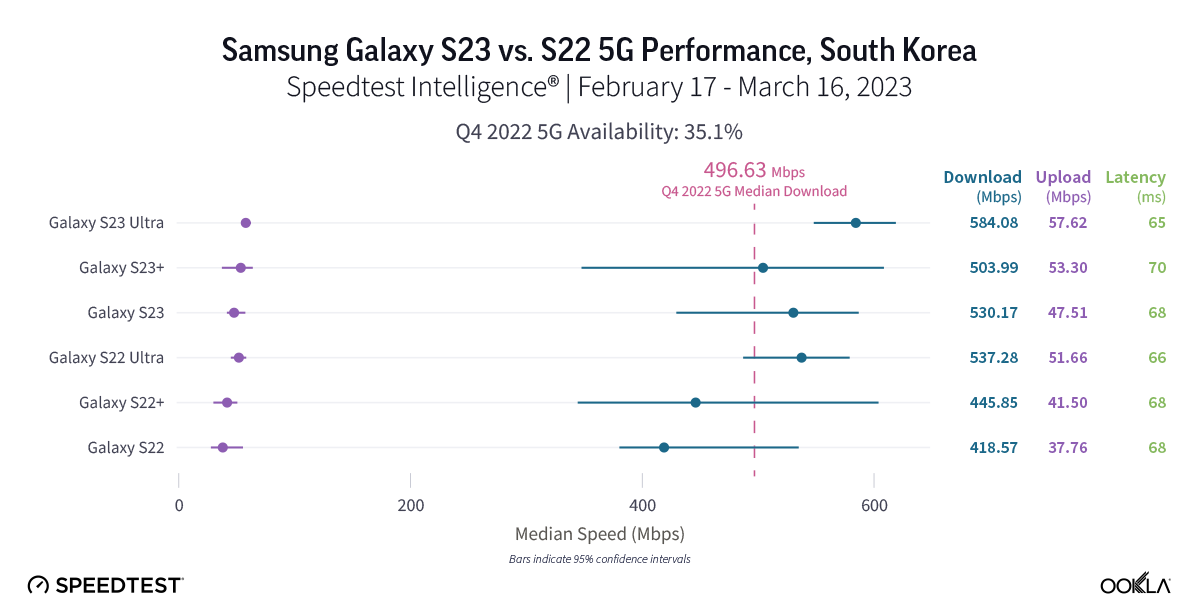
Home to Samsung, South Korea showed some of the fastest 5G speeds on our list. Every S23 model had a faster median 5G download speed than the corresponding S22 models, but statistical winners remained elusive during the first month after launch, which we expect will probably change upon more adoption in the near future. S22 models recorded median 5G download speeds between 418.57 Mbps and 537.28 Mbps, while the S23 models ranged from 503.99 Mbps and 584.08 Mbps. Upload speeds were similarly impressive — though with no statistically faster median 5G upload speeds than another — with S22 models ranging from 37.76 Mbps to 51.66 Mbps over 5G, and S23 models ranging from 47.51 Mbps to 57.62 Mbps. Median multi-server latency over 5G showed ranges from 65.00 ms to 69.81 ms for the S22 models, and a range of 66.13 ms to 68.15 ms for the S23 models.

Recommendation: If you’re a South Korean Galaxy S22 user, you can probably expect slightly faster speeds if you upgrade to the new S23 models, but an upgrade for the new features, especially for the new S23 Ultra camera, might be more justified.

Thai Samsung Galaxy S22 and S23 users saw faster 5G speeds than the median average during Q4 2022

Chart of Samsung Galaxy S23 vs. S22 5G Performance in Thailand

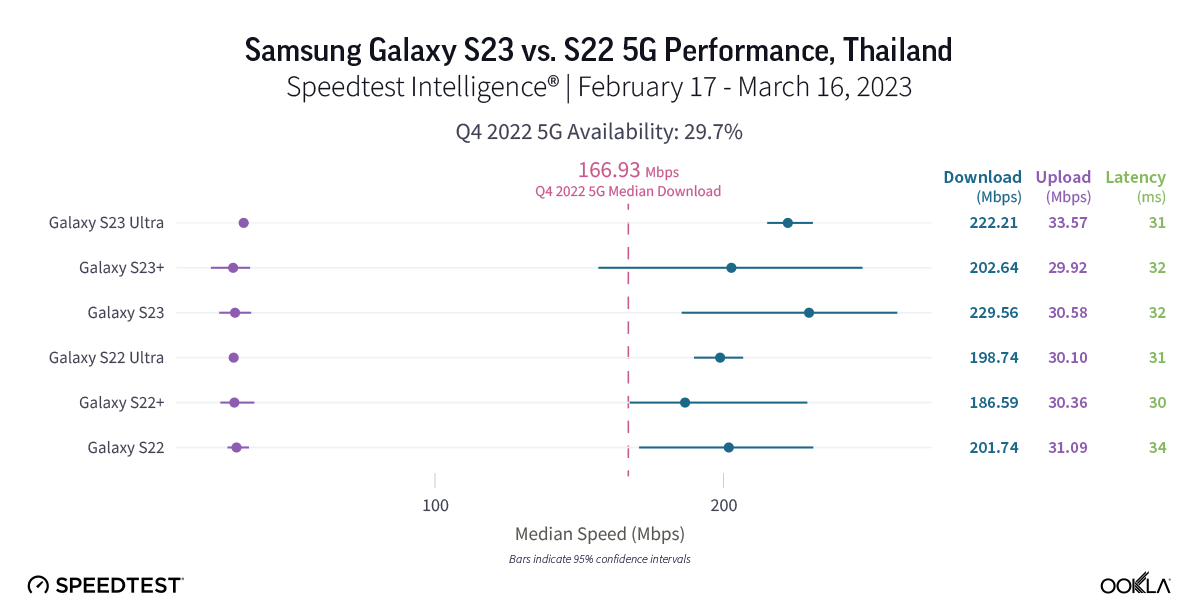
Speedtest Intelligence shows that the Samsung Galaxy S23 Ultra was the only S23 model to achieve faster median 5G speeds than its predecessor in Thailand during the first month after launching. The S23 Ultra outperformed the S22 Ultra 222.21 Mbps to 198.74 Mbps over 5G for download speed and 33.57 Mbps to 30.10 Mbps for upload speed, respectively. The S23 and S23+ were not statistically faster, though the S23+ and S23 had median 5G download speeds of 202.64 Mbps and 229.56 Mbps, respectively. Median 5G multi-server latency showed close parity with the S22 ranging from 31.06 ms to 32.34 ms and the S23 ranging from 30.40 ms to 34.14 ms.

Recommendation: Thai Galaxy S22 Ultra users should feel confident in upgrading your phones to the S23 Ultra, especially for the new features. If you are a S22 and S22+ 5G user, you should absolutely consider upgrading, but might not yet see faster speeds.

Samsung Galaxy S23 results showed potential in the United Kingdom, but you still may want to wait to upgrade

Chart of Samsung Galaxy S23 vs. S22 5G Performance in United Kingdom

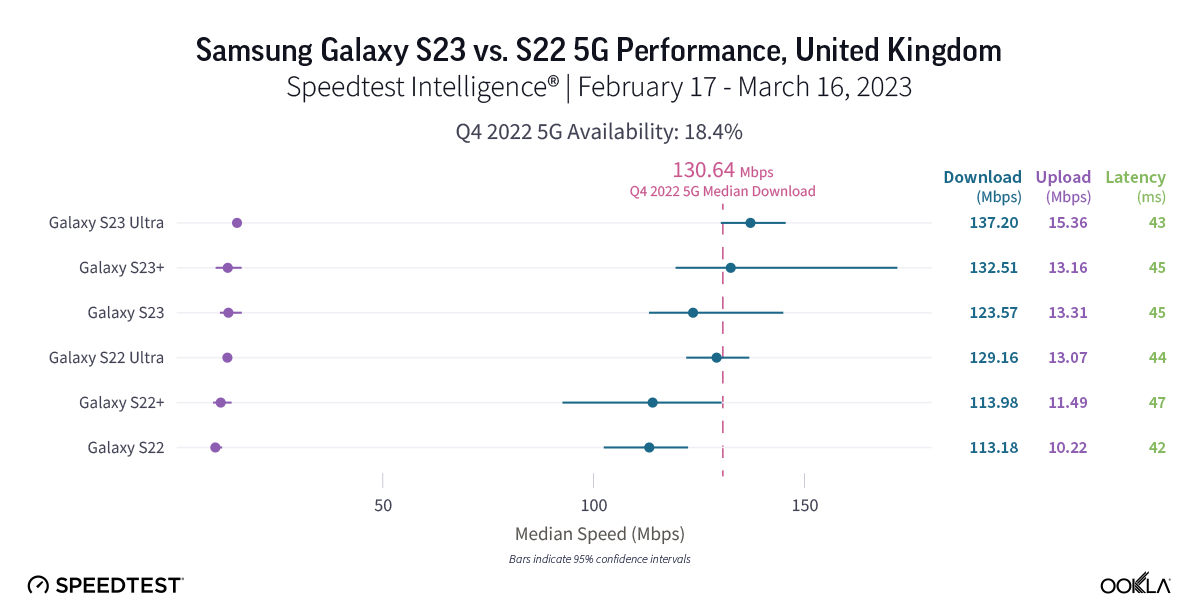
New 5G data from the U.K. reveals that while the new Samsung Galaxy S23 models have higher median download speeds, the S23 models are not statistically faster than the S22 models. The S22 models had median 5G download speeds that ranged from 113.18 Mbps to 129.16 Mbps, and the S23 models ranged from 123.57 Mbps to 137.20 Mbps. 5G download speeds in the U.K. weren’t the slowest we saw among the countries we surveyed, but they were quite close to Poland’s bottom-tier results. The S23 Ultra was one stand-out performer, which had a faster median 5G upload speed than the S22 Ultra at 15.36 Mbps to 13.07 Mbps, though the other models weren’t significantly faster, but came close. Median multi-server latency over 5G was too statistically close to call, with the S22 models between 43.04 ms and 45.09 ms, and the S23 models between 41.77 ms and 46.63 ms. 

Recommendation: U.K. Samsung Galaxy S22 users should wait to upgrade their phones to the S23 models unless you’re dying for the S23’s new features. But don’t expect faster results quite yet, especially as the U.K. continues to lag behind other more mature 5G markets around the world.

If you have 5G and a Samsung Galaxy S22 in the United States, don’t hesitate to upgrade to an S23 model

Chart of Samsung Galaxy S23 vs. S22 5G Performance in United States

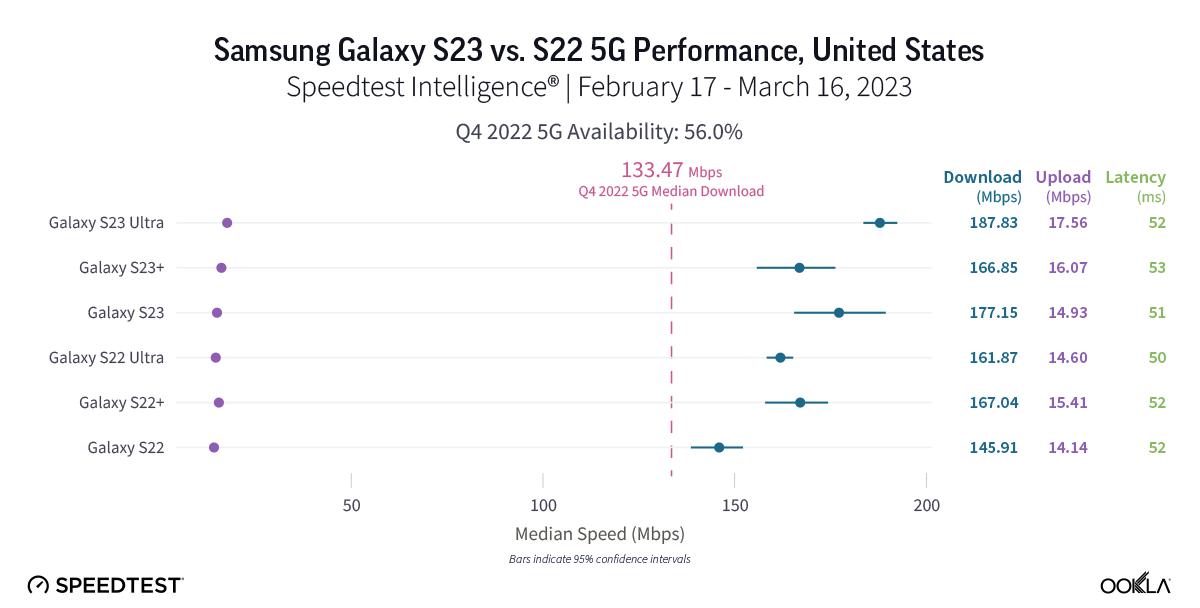
New data from Speedtest Intelligence reveals that during the first month of the Samsung Galaxy S23 series’ availability, the S23 and S23 Ultra outperformed the S22 and S22 Ultra for 5G download speeds, respectively, while the S23+ and S22+ were statistically too close to call. The S23 raced ahead of the S22 177.15 Mbps to 145.91 Mbps, and the S23 Ultra was faster than the S22 Ultra at 187.83 Mbps to 161.87 Mbps. All of the S22 and S23 models outperformed the median 5G download speed in the U.S. during Q4 2022. The Samsung S23 Ultra was the only S23 model to statistically outperform its counterpart for median 5G upload speeds, with an upload speed of 17.56 Mbps to 14.60 Mbps. The S23 and S23+ were too close to call. Looking at median multi-server latency over 5G, the S23 Ultra edged ahead of its S22 Ultra counterpart 50.44 ms to 51.52, while the other S23 didn’t have a statistical leg up. 

Recommendation: U.S. Samsung Galaxy S22 users shouldn’t hesitate to upgrade to the S23 models, especially for the new features and hardware — particularly if you want the S23 Ultra’s 200 MP camera. With 5G networks increasingly getting faster, we suspect the S23 models have yet to see their full potential in the U.S., too.

The Speedtest® Android app can help benchmark your device’s 5G performance

After promising launches that have seen the Samsung Galaxy S23 models pull ever-so-slightly ahead in the U.S. and Germany, you can track how the Samsung Galaxy S23 performs on our next release of Ookla Market Reports™. If you recently upgraded your phone, be sure to download the Android Speedtest app to make sure you are getting the speeds you need along with access to video testing. We’ll be back throughout the year with fresh data on new phone launches, so if you’re considering upgrading your phone, be on the lookout for a new Ookla® device report.

Ookla retains ownership of this article including all of the intellectual property rights, data, content graphs and analysis. This article may not be quoted, reproduced, distributed or published for any commercial purpose without prior consent. Members of the press and others using the findings in this article for non-commercial purposes are welcome to publicly share and link to report information with attribution to Ookla.

| June 6, 2023

Live Fast, Work Abroad: Countries with Remote Work Visas and Great Internet

Taking advantage of remote work in another country is the dream for many. Who hasn’t imagined themselves sipping fresh squeezed juice on a gorgeous tropical beach during a team call, cozying up next to a crackling fire in a European castle while pouring over a spreadsheet, or even just working anywhere that isn’t the office or our home couch? COVID-19 made working remotely more readily an option for some, and 51 countries have even gone so far as to create remote work or “digital nomad” visas. Today, Ookla® brings you fresh data on how these countries’ internet compares so you can start planning a long-term escape from your current reality. 

Using Speedtest Intelligence®, we looked for remote work countries with the fastest internet, tropical countries with remote work visas and fast internet, fastest European countries for remote work, countries where you won’t lose your connection, and seven affordable remote work countries with good internet. Read on to start planning your next life adventure.

Digital nomad countries with seriously fast internet

Chart of Fastest Countries for Remote Work

Getting the fast download speeds you need to do your daily tasks should be the least of your worries when you work abroad. Thailand had the fastest fixed broadband speeds among countries that have remote work visas with a median download speed of 196.20 Mbps and a median upload speed of 164.85 Mbps during Q1 2023. With speeds like those, you’ll be able to eat your Guay Teow while gaming, streaming multiple 4K videos, and uploading videos of your adventures with no issues (and you should be able to work, too). 

Spain (172.04 Mbps) and Romania (171.15 Mbps) were next on our list of fastest remote work destinations, followed by Hungary (134.43 Mbps), Portugal (128.50 Mbps), Taiwan (127.85 Mbps), Norway (111.44 Mbps), Panama (108.84 Mbps), and Brazil (100.38 Mbps), which all had median download speeds over 100 Mbps during Q1 2023. Rounding out our list of fastest remote work countries are Malta (97.55 Mbps) and Bermuda (97.20 Mbps). If speed is of the utmost importance to you while you work and live in another country, rest assured that these countries can handle the bandwidth you need.

Soak up the sun with fast internet in these beachy countries with remote work visas

Chart of Tropical Remote Work Countries with Fast Internet

If you dream of a remote work escape and prefer tropical, sunny beaches where you can sip piña coladas, we’ve got you covered (though don’t forget your sunblock when you venture outside!) Twenty-seven countries have digital nomad visas, average temperatures above 65° F (roughly 18° C), and beach access. Unsurprisingly, Thailand, again takes the top spot with a median download speed of 196.20 Mbps, followed by Taiwan (127.85 Mbps), Panama (108.84 Mbps), Brazil (100.38 Mbps), Malta (97.55 Mbps), Bermuda (97.20 Mbps), Malaysia (92.53 Mbps), Dominica (80.00 Mbps), Barbados (74.21 Mbps), and St. Lucia (71.40 Mbps). Grenada (65.25 Mbps), Costa Rica (65.07 Mbps), and Montserrat (63.22 Mbps) followed closely behind the top 10. 

If you choose to work remotely from one of these countries, we’ll be jealously awaiting you sharing your Speedtest® results on Twitter as you work from the beach, take a dip in the ocean during your break, and relax with a cool ocean breeze as your biggest worry in the world. 

These European countries with remote work visas had the fastest internet speeds

Chart of Internet Speeds in European Countries with Remote Work Visas

Maybe you’ve been watching all the Eurovision or have been dreaming of jetting off to European locations every weekend. Luckily for you, 16 European countries offer some version of a remote work visa. Speedtest Intelligence data reveals that Spain had the fastest median download speed at 172.04 Mbps during Q1 2023. Romania, Hungary, Portugal, and Norway followed with median download speeds above 100 Mbps. Malta (97.55 Mbps), Germany (82.05 Mbps), Latvia (77.76 Mbps), Estonia (64.80 Mbps), and Czechia (55.97 Mbps) rounded out the top 10, with Cyprus (53.71 Mbps) coming up just behind. Regardless of which European country you choose, you’ll be a few hours away from multiple countries with plenty to do and eat! 

10 remote work countries where you won’t lose your connection

Chart of 10 Remote Work Countries with the Most Consistent Internet

You shouldn’t have to stress about your internet connection while you’re working abroad — especially if you have to video chat often. So we used Speedtest Intelligence data to examine the Consistency — calculated by the percentage of results showing at least a 25 Mbps download speed and 3 Mbps upload speed over fixed broadband — in countries with remote work visas during Q1 2023. While there was no statistically highest Consistency, Thailand had a Consistency of 89.8%, Romania 89.7%, and Taiwan 89.5%. Norway followed at 87.3%, then Malaysia, Brazil, Portugal, Hungary, Spain, and Bermuda rounding out the top 10. Rest assured if you choose one of these countries, you should be able to stream and video chat while you work. Just remember to mute that movie during your team call.

Seven affordable places with good internet for digital nomads on a budget

Chart of 7 Affordable Remote Work Countries with Good Internet

Internet speed and consistency are important for remote work — but they’re not everything when you’re deciding where you want to spend your next adventure. If you’re looking for an affordable location to spend your time, save some money, and get good internet, we’ve got you covered.

We used thresholds of 50 Mbps download, 10 Mbps upload, and under 100 ms latency to designate a country of having “good” internet — these speed thresholds are minimums to what should allow you to stream in 4K, video chat, and do most work-related tasks. The latency threshold number is high, but cheap, fast internet with super low latency is not common enough. We compared that list against World Bank data for GDP per capita (PPP) from 2021 which adjusts for cost of living, and narrowed down countries that have less than the world average of $18,607. Seven countries qualified for inclusion on our list based on those criteria: Barbados, Brazil, Dominica, Ecuador, Grenada, Montserrat, and St. Lucia. 

Brazil had the fastest download speed at 100.38 Mbps on our affordable countries for remote work list, followed by Dominica (80.00 Mbps), Barbados (74.21 Mbps), St. Lucia (71.40 Mbps), Grenada (65.25 Mbps), Montserrat (63.22 Mbps), and Ecuador, which eked out a place on this list at 50.55 Mbps. Every country on this list had a median upload speed above 20 Mbps. All of the countries had a Consistency higher than 70%, except St. Lucia, which was just under at 68.3%. If latency, which causes the kind of lag that can make video calls frustrating, is a major concern, only Ecuador (14 ms) and Brazil (18 ms) had latencies under 20 ms. 

Regardless of where you choose to work remotely among these seven countries, you should have access to internet that can keep you on top of what you need to do at work, while you save some cash, live well, and hit the beach, since all of these countries have average temperatures above 70° F (21°C). You might just have to brush up on your Spanish, Creole, Patois, or Portuguese to really get an immersive experience, but you should sleep easy knowing that you can live well and continue to work online.

What do you need to know before applying for a remote work visa?

Currently, there are 51 countries that offer some form of a remote work visa. The requirements for these visas vary widely across each country, but generally there are a few key things you’ll need to know before you choose a country to apply to.

First, you need to decide where you are going! Besides checking internet performance, you’ll want to research how long a remote visa can last, how much money you are going to have to earn to qualify, what costs you’ll be looking at, options to renew the visa, and what kind of fees you’ll need to pay along the way. At a minimum, you’ll need a passport.

You often can’t just show up and start working remotely; for a long-term stay, you’ll need to apply for a visa (along with any family members you might want to bring along). Approval isn’t straightforward — you may need to prove your income, translate documents, get documents notarized, and even make a minimum amount of money each month. Once approved, you’ll typically pay a fee for each family member you are bringing, and you should make certain if you have any additional fees or taxes you’ll be liable to pay throughout your stay.

Once you have your visa in order, you’ll need to figure out your living situation — whether that is something longer term, or moving around a country, you’ll want to keep any requirements of your visa up to date. Do your due diligence while you apply so you don’t find yourself in an unpredictable situation you could have avoided.

Ookla has the resources you need to plan your remote work trip

We hope this short guide will help you choose the right remote work experience to help you feel fulfilled. If you want to learn more about the internet experience in any of the countries we mentioned, or even find city data or internet provider data for your remote work journey, check out the Speedtest Performance Directory™. If you’re struggling to find a decent internet provider in your area, check out our satellite internet series to see if there is a fast satellite internet connection available. And don’t forget to download the Speedtest app for Mac, Windows, or Linux to make sure you’re getting the speeds you need to continue working remotely!

Interested in what Ookla is doing? We offer fully remote positions around the world, so check out if there is an open role for you!

Ookla retains ownership of this article including all of the intellectual property rights, data, content graphs and analysis. This article may not be quoted, reproduced, distributed or published for any commercial purpose without prior consent. Members of the press and others using the findings in this article for non-commercial purposes are welcome to publicly share and link to report information with attribution to Ookla.

| September 3, 2023

The Finals Are On, but Which Australian Football League Stadium Had the Best Mobile Performance?

The Australian Football League (AFL) Finals start this weekend and with the Pies holding off late challenges from the Lions and Port Adelaide to secure the top of the ladder — here at Ookla® we’re sure every team vying for a spot in the Grand Final at the MCG on Sept. 30 is sure to put on a show for fans across the country. With such a great footy season in 2023, the Finals are set to be a breathtaking, best-in-world spectacle, and Ookla wanted to find out which stadium’s mobile experience made fans the real winners this year.

Methodology

We used Speedtest Intelligence® to examine download and upload speeds and multi-server latencies for all mobile technologies and 5G at AFL stadiums with a 100-meter zone around the stadium from the start of the season in Q1 2023 through Q2 2023. We also used Consumer QoE™ data with the same criteria to determine the web page load time at each stadium to see which footy fans were racing ahead to post their team’s come-from-behind wins first, and which fans were left in a lurch waiting for web pages to load to check their rival’s scores.

These AFL stadiums had the fastest download speeds in 2023

Chart of Fastest Mobile Performance at AFL Stadiums

While Sydney are out to avenge their stinging 2022 Grand Finals loss to Geelong, Swans fans should at least feel great knowing the Sydney Cricket Ground had one of the fastest median download speed of any stadium we surveyed with a download speed at 140.96 Mbps during Q1-Q2 2023. The SCG also had one of the fastest median upload speeds at 26.44 Mbps during Q1-Q2 2023, ensuring fans were getting all the latest real-time updates, and posting their photos and videos with relative ease.

Marvel Stadium was a runner up for both download and upload speeds at 117.50 Mbps and 23.06 Mbps during Q1-Q2 2023, with fans of the mighty Blues, the Dons, the Roos, the Saints, and the Bulldogs all sharing runner-up honors in the Docklands in Melbourne. Next on our list was Optus Stadium in Perth with Fremantle and West Coast fans experiencing a median download speed of 100.40 Mbps, followed by GIANTS Stadium in western Sydney at 81.34 Mbps, the Gabba in Brisbane at 70.63 Mbps, the MCG in Melbourne at 69.28 Mbps, and the Adelaide Oval at 66.79 Mbps. The GMHBA in Geelong and Heritage Bank Stadium in Gold Coast didn’t have enough samples to be included in this ranking.

For context, the city of Geelong had a median mobile download speed at 87.60 Mbps during July 2023 and greater Gold Coast had a download speed of 95.32 Mbps during the same time period according to the Speedtest Performance Directory™.

These AFL stadiums with the fastest 5G download speeds were too close to call, but fans in NSW are the true winners

Chart of Fastest 5G Performance at AFL Stadiums

Looking at download speeds over 5G during Q1-Q2 2023, there was no statistically fastest 5G download speed among AFL stadiums we surveyed. However, every stadium we evaluated except the Gabba had median 5G download speeds over 100 Mbps, with the Gabba having a median download speed of just 92.08 Mbps. While there was no winner over 5G, GIANTS Stadium saw a median 5G download speed at 182.61 Mbps, the SCG at 171.43 Mbps, Marvel Stadium at 166.66 Mbps, Optus Stadium at 133.82 Mbps, and the MCG at 122.62 Mbps. The Adelaide Oval, the GMHBA, and Heritage Bank Stadium didn’t have enough 5G samples to be included.

Fans at Marvel Stadium were able to upload their videos from matches the fastest, with the fastest median 5G upload speed at 34.27 Mbps. The SCG (29.02 Mbps), MCG (27.35 Mbps), and GIANTS Stadium (27.16 Mbps) followed with median 5G upload speeds greater than 20 Mbps.

Note that some 5G plans may have limited 5G access and 5G coverage varies by provider.

Multi-server latencies showed good parity between stadiums

Chart of Multi-server Latency at AFL Stadiums

Latency, also known as ping, is the reaction time of your network’s roundtrip connection, which is particularly important for streaming, video chats, and online gaming. For those footy fans who might be video chatting and bragging to their friends about their seats (or more likely their team winning against their friend’s team), latency is increasingly a very important measure for real-time online interactions.

Much like the middle of the ladder this season, the AFL stadiums we surveyed had a tight range of multi-server latencies for all mobile technologies combined with the SCG having the lowest at 28.97 ms and GIANTS Stadium having the highest at 36.17 ms. Multi-server latencies over 5G were about the same, with the SCG being the lowest at 28.63 ms and the Gabba having the highest at 35.86 ms. With lower latencies indicating a more responsive network, those looking to livestreaming a last second winner at the SCG might have a slightly better experience for their friends with less lag than those at the Gabba.

These stadiums had the fastest mobile web page load time experience

Chart of Fastest Page Load Times at AFL Stadiums

Speed and latency are important, but they’re not the only thing footy fans need from their mobile network while watching their team battling it out on the oval. 

Using Consumer QoE data, we looked at web page load time data, which reflects consumers’ real-world experiences of trying to use the internet, to see the stadiums where fans could access websites like social media without any delay. A lower web page load time means fans wait less for websites to load and can get straight to bragging to their friends about their team’s come from behind victory. With a 2016 Google research study reporting 53% users leave a webpage if it takes more than three seconds to load, fast page load times are very important when gauging mobile users’ experience using their network. We’re happy to report all of the stadiums we surveyed fell under this benchmark during Q1-Q2 2023, with some fans experiencing slightly faster load times than others.

The SCG and GIANTS stadium led the pack once again, with a median page load time of 1,457 ms (1.457 seconds) and 1,459 ms (1.459 seconds), respectively, though there was no statistical winner. Marvel Stadium (1,533 ms) and Heritage Bank Stadium (1,540 ms) followed, with the Adelaide Oval (1,602 ms), the Gabba (1,606 ms), the MCG (1,623 ms), and GMHBA Stadium (1,654 ms) all having a median page load time under 1,700 ms. Optus Stadium was the only AFL stadium to have a page load time over 1,700 ms, leaving Dockers and Eagle fans waiting just a hair longer than their eastern Aussie counterparts.

Going to the Finals or Grand Final? Take a Speedtest® and show us your results

If you’re a supporter of Brisbane, Carlton, Collingwood, GWS, Melbourne, Port Adelaide, St. Kilda, or Sydney, and you’re headed to a Finals match — we’re very jealous of you — here at Ookla we’d love to see how your experience stacks up to our findings. Before you head to the nearest oval, download the Speedtest app for your iOS or Android device to test your real-world network experience, and be sure to take a Speedtest while you’re cheering on your team wherever you may be. After the match, share your Speedtest result with us on Twitter or Facebook — and let us know who you support!

Want to learn more about mobile and fixed broadband internet in your area? Head over to the Speedtest Performance Directory to learn more about internet performance in your area and see if you’ve got a goal of a provider or you’re just scoring a behind.

Ookla retains ownership of this article including all of the intellectual property rights, data, content graphs and analysis. This article may not be quoted, reproduced, distributed or published for any commercial purpose without prior consent. Members of the press and others using the findings in this article for non-commercial purposes are welcome to publicly share and link to report information with attribution to Ookla.