| December 20, 2021

Growing and Slowing: The State of 5G Worldwide in 2021


5G continues to offer new and exciting ways of rethinking everything from streaming video to performing remote surgery. However, not everyone shares equally in these possibilities as many countries do not have access to 5G and even those that do, do not experience the same level of performance from their 5G connections. We examined Speedtest Intelligence® data from Q3 2021 Speedtest® results to see how 5G speeds have changed, where download speeds are the fastest at the country and capital level, where 5G deployments have increased and what worldwide 5G Availability looked like in Q3 2021. We also looked at countries that don’t yet have 5G to understand where consumers are seeing improvements in 4G access.

5G slowed down at the global level

Median-Speeds-Worldwide_1221-01

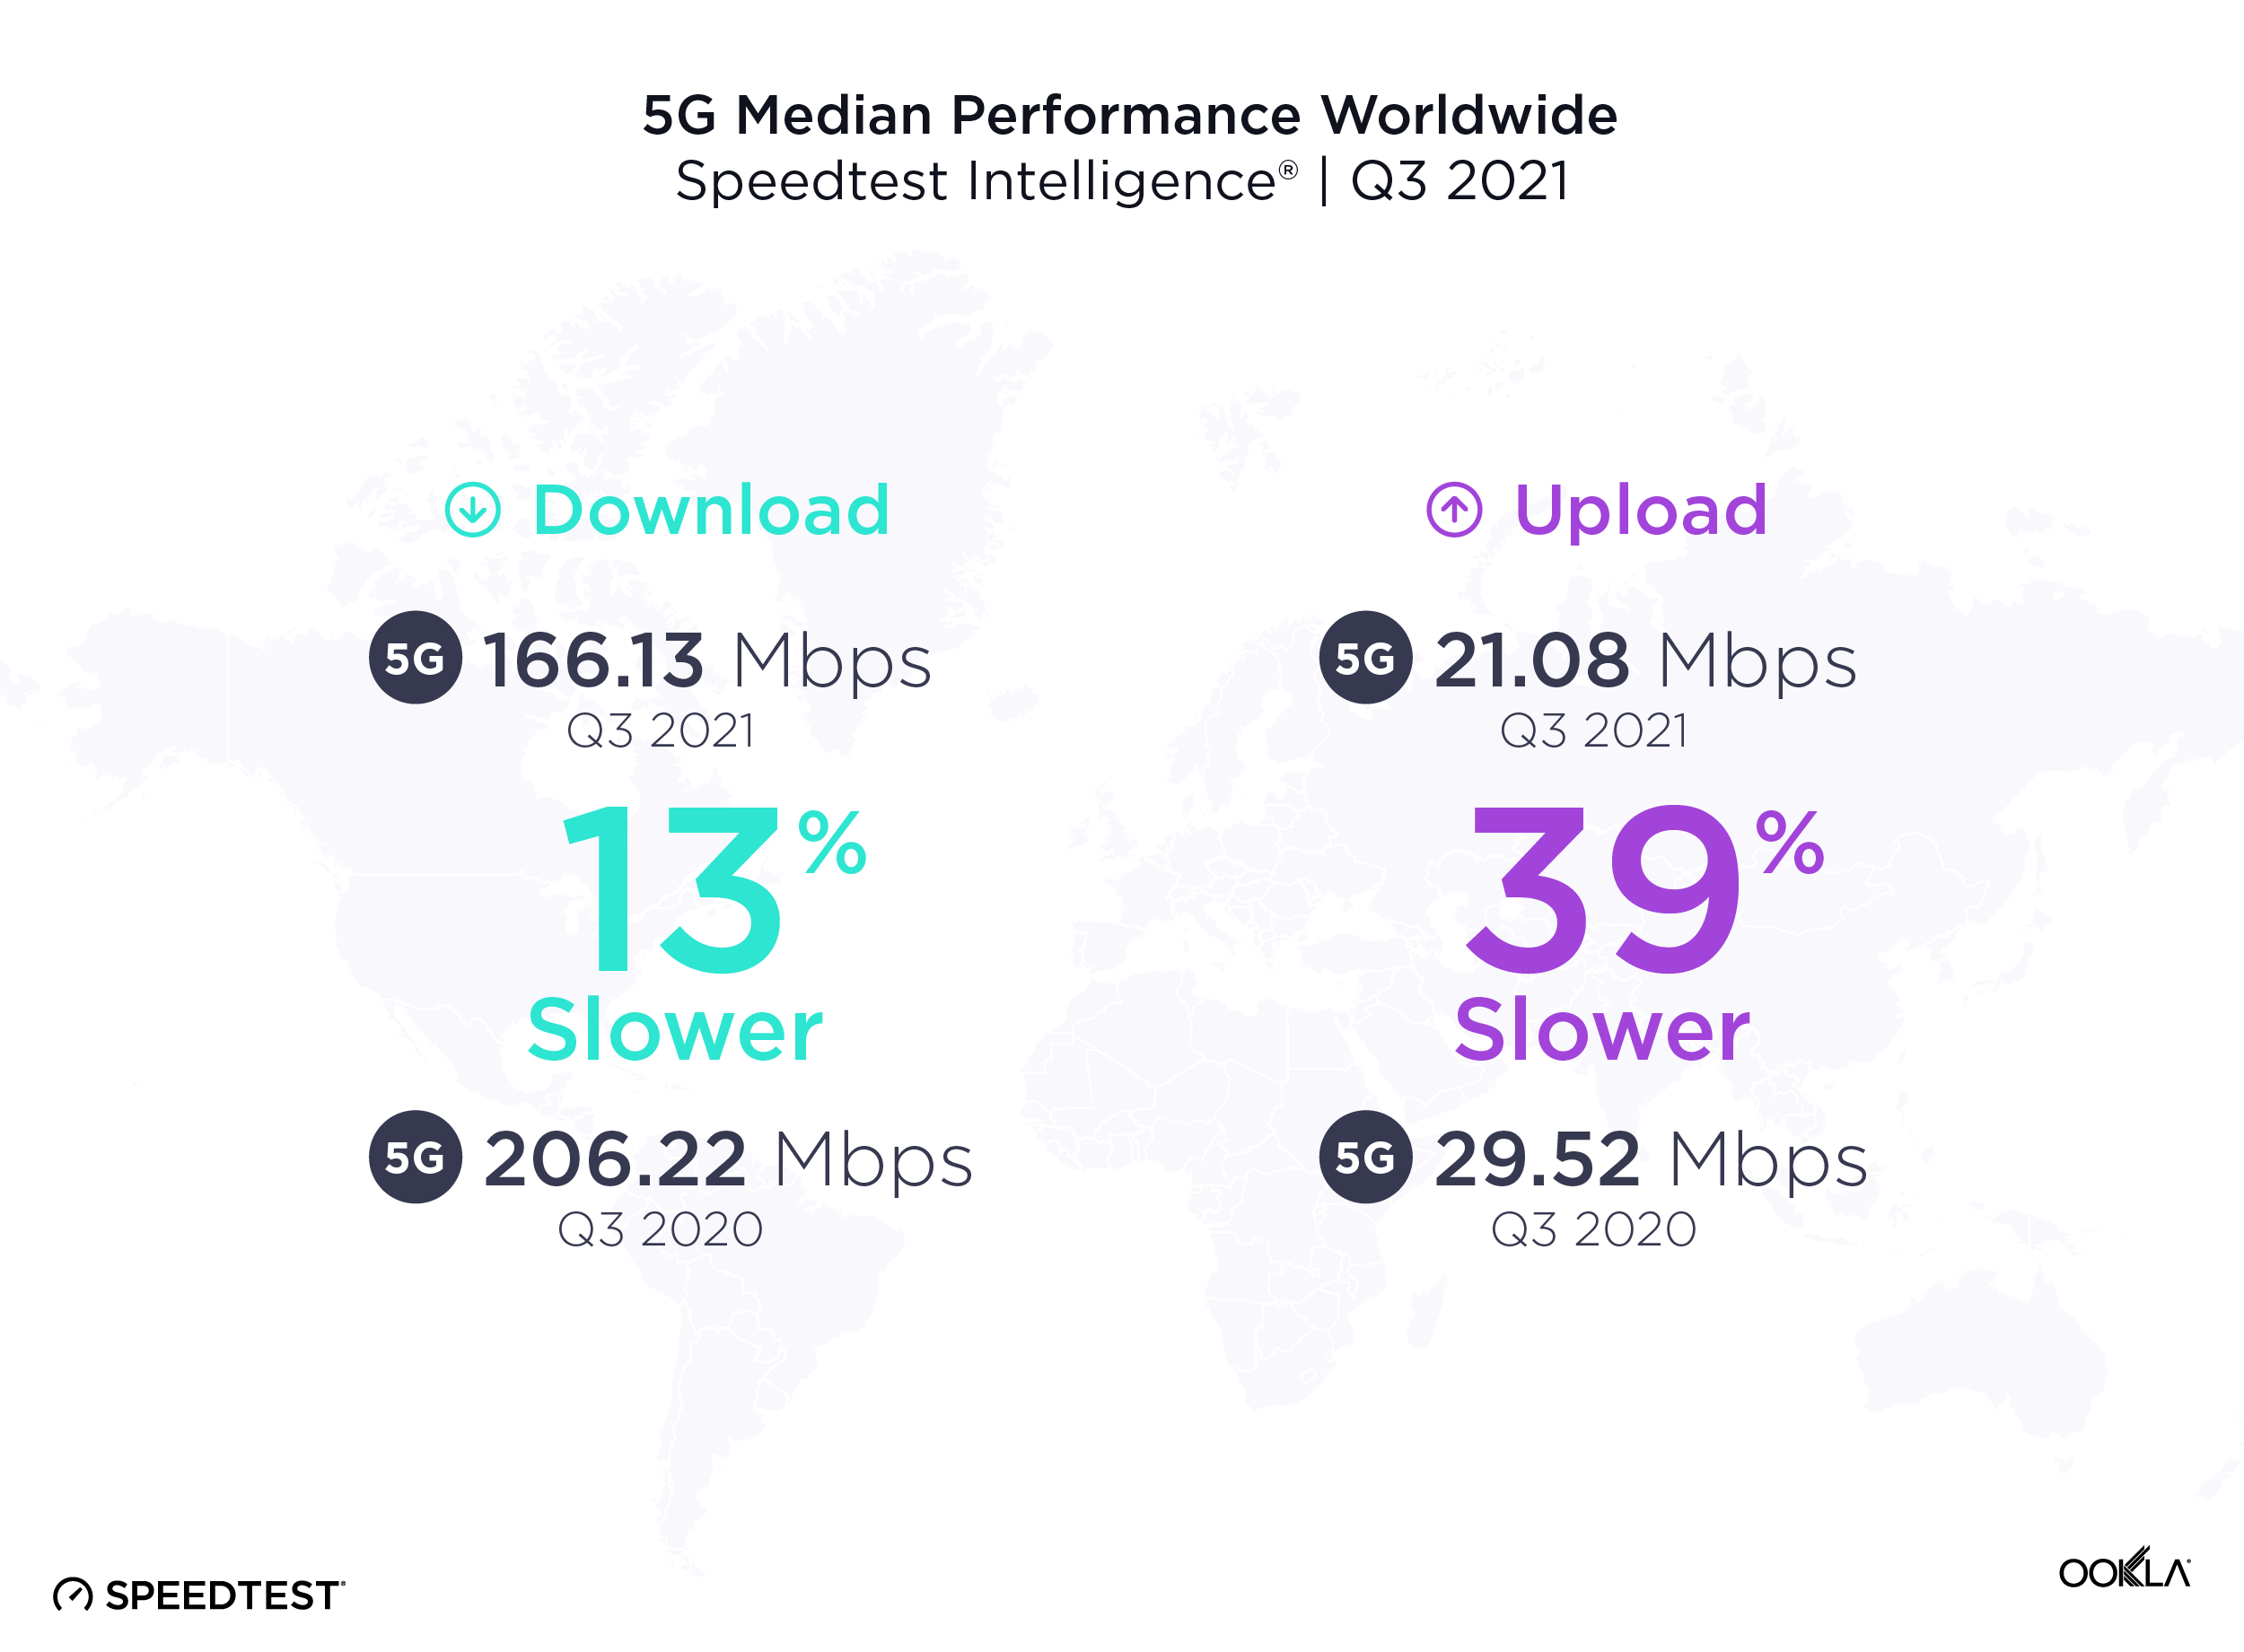
It’s common to see new mobile access technologies slow down as adoption scales, particularly early on in the tech cycle. Over the past year from Q3 2020 to Q3 2021, the median global 5G download speed fell to 166.13 Mbps, down from 206.22 Mbps in Q3 2020. Median upload speed over 5G also slowed to 21.08 Mbps (from 29.52 Mbps) during the same period.

More users are logging on to existing 5G networks, and we’re also at the stage in the evolution of 5G where countries that have historically had slower speeds are starting to offer 5G. In addition, the widespread use of dynamic spectrum sharing that has been used to boost early 5G coverage weighs on 5G download speeds. While the dip in speeds looks like a letdown, it’s more of a compromise to enable broader access. With additional spectrum and further deployments slated for 2022, we anticipate speeds will begin to pick up again.

South Korea had the fastest 5G in the world

ookla_5g-download_performance_countries_1221-01-1

South Korea had the fastest median download speed over 5G during Q3 2021, leading a top 10 list that included Norway, United Arab Emirates, Saudi Arabia, Qatar, Kuwait, Sweden, China, Taiwan and New Zealand. Sweden, China, Taiwan and New Zealand were new to the top 10 in 2021 while South Africa (whose 5G was brand new last year), Spain and Hungary fell out of the top 10.

5G expanded to 13 additional countries

ookla_5G-map_1221-01

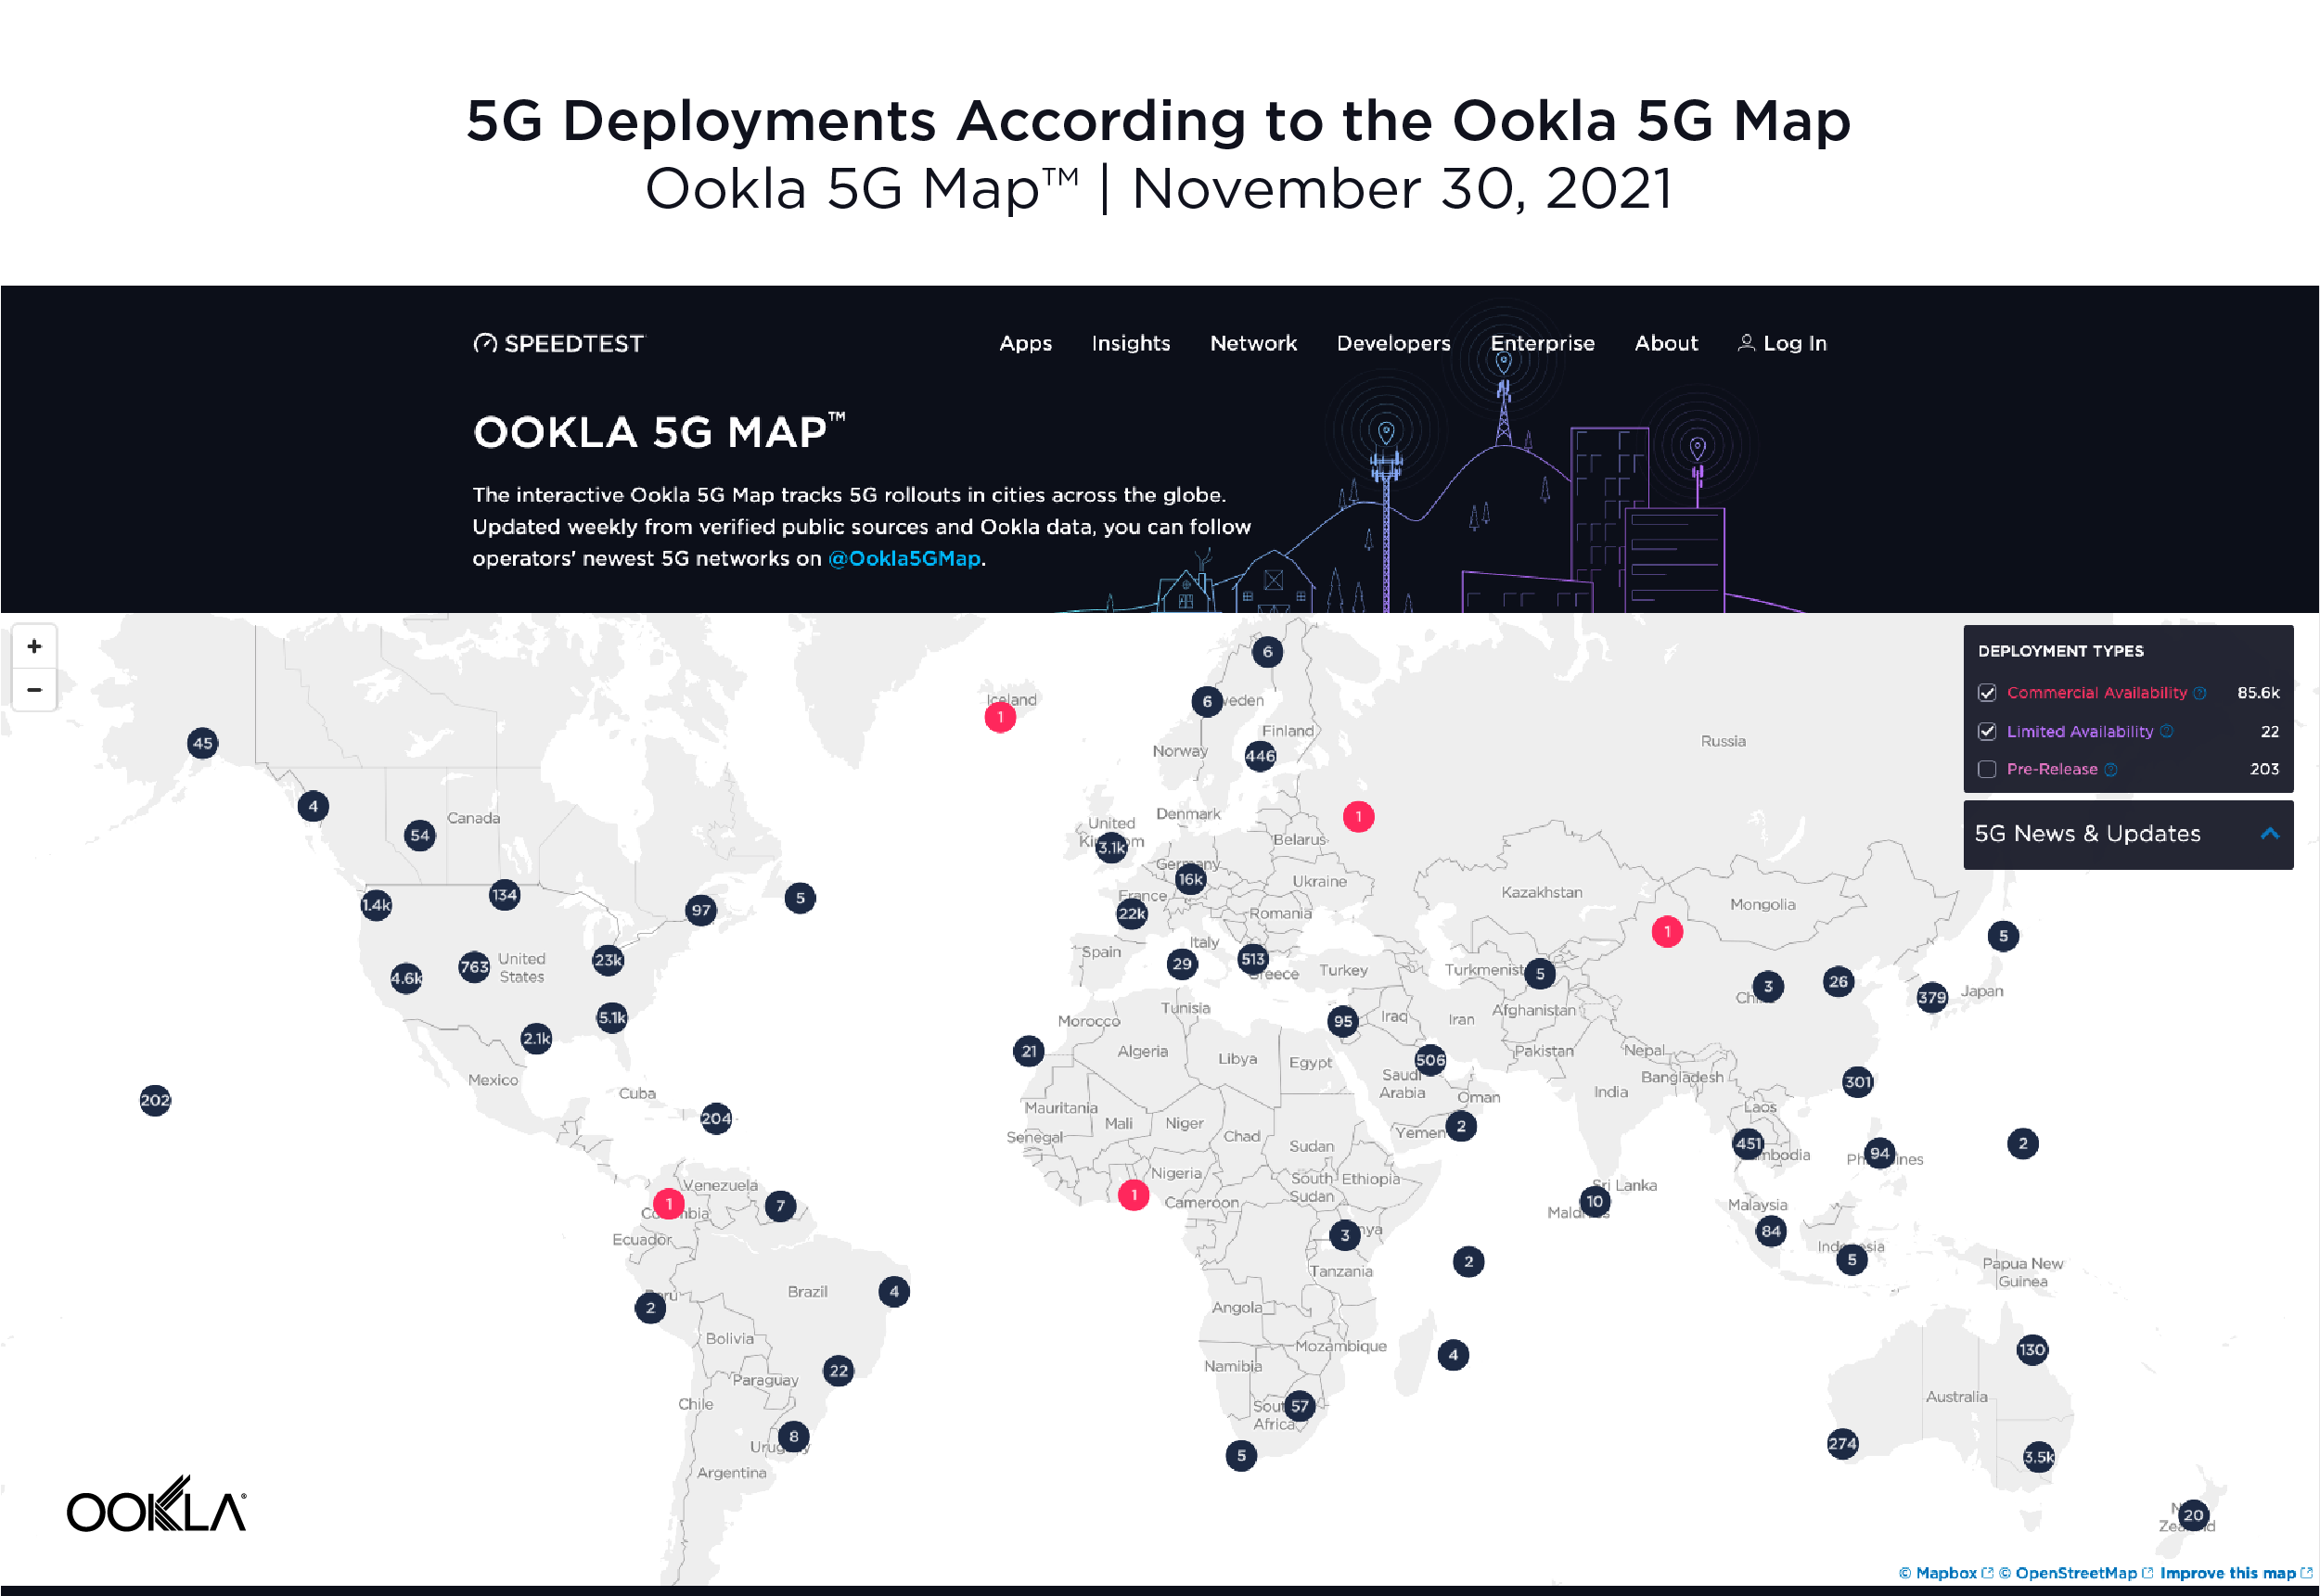
According to the Ookla® 5G Map, there were 5G deployments in 112 countries as of November 30, 2021. That’s up from 99 countries on the same date a year ago. The total number of deployments increased dramatically during the same time period with 85,602 deployments on November 30, 2021 compared to 17,428 on November 30, 2020, highlighting the degree to which 5G networks scaled during the year. Note that there are often multiple deployments in a given city.

Seoul and Oslo lead world capitals for 5G

ookla_5g-download_performance_capitals_1221-01

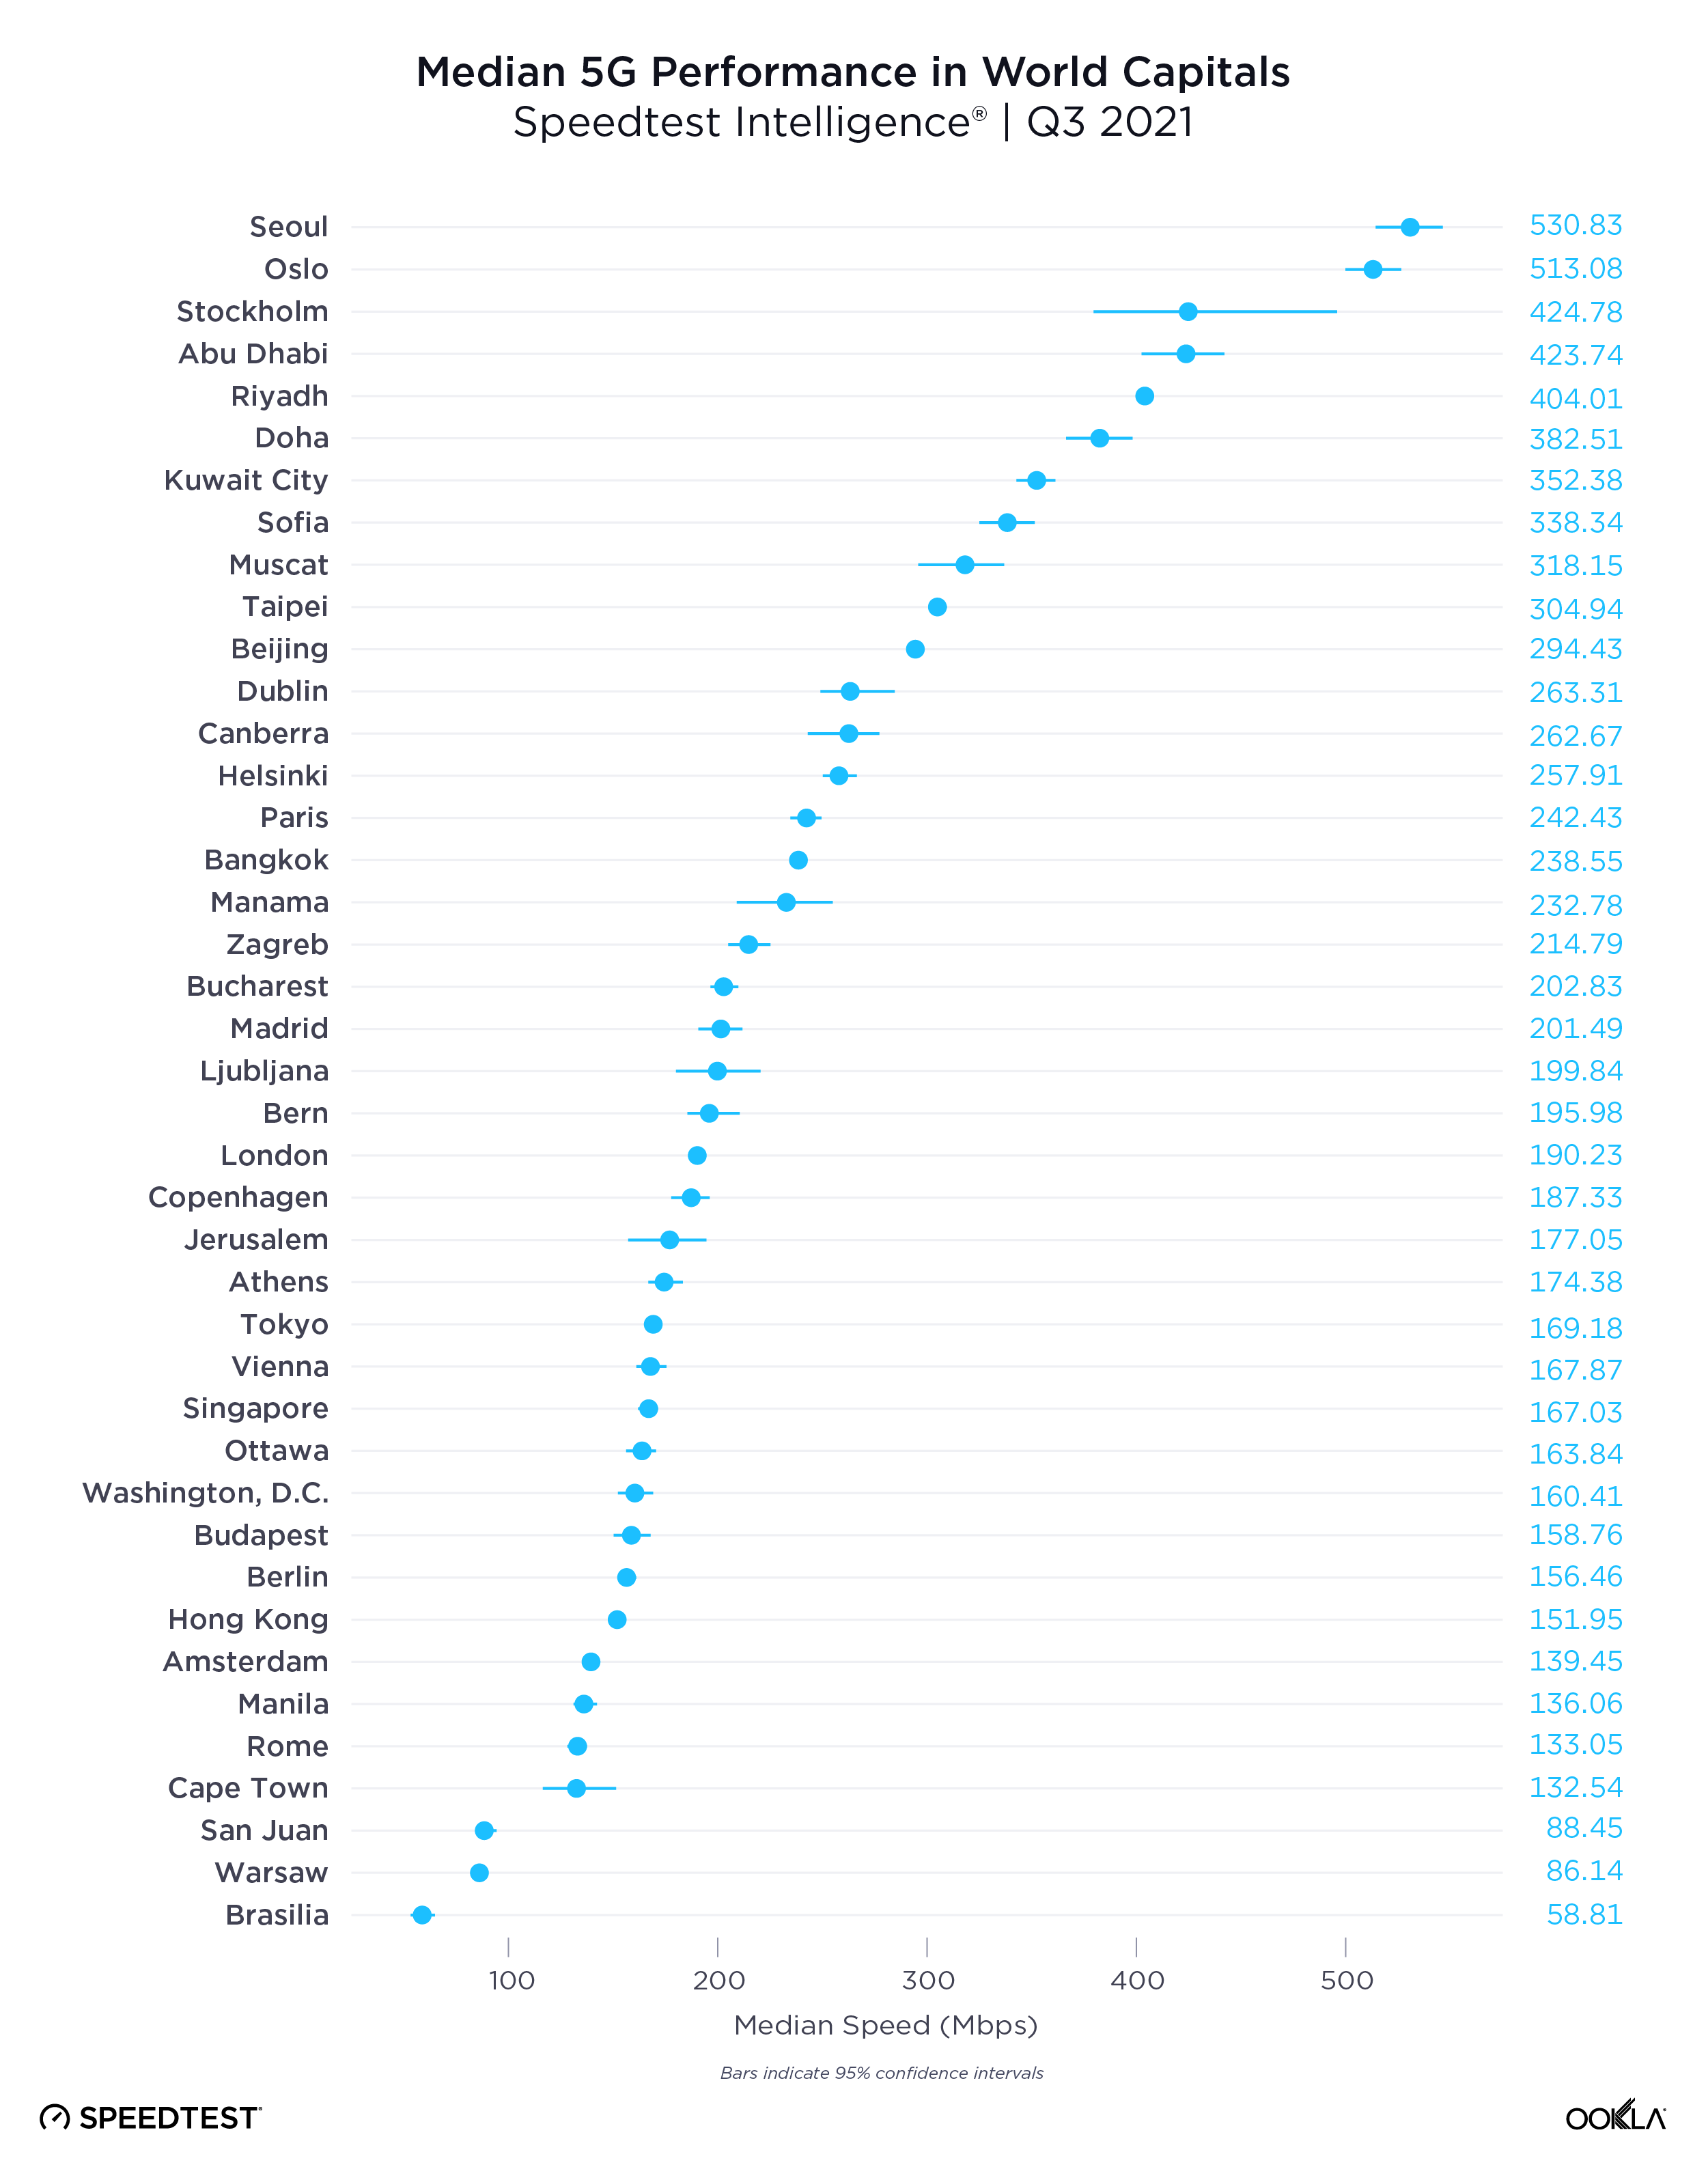
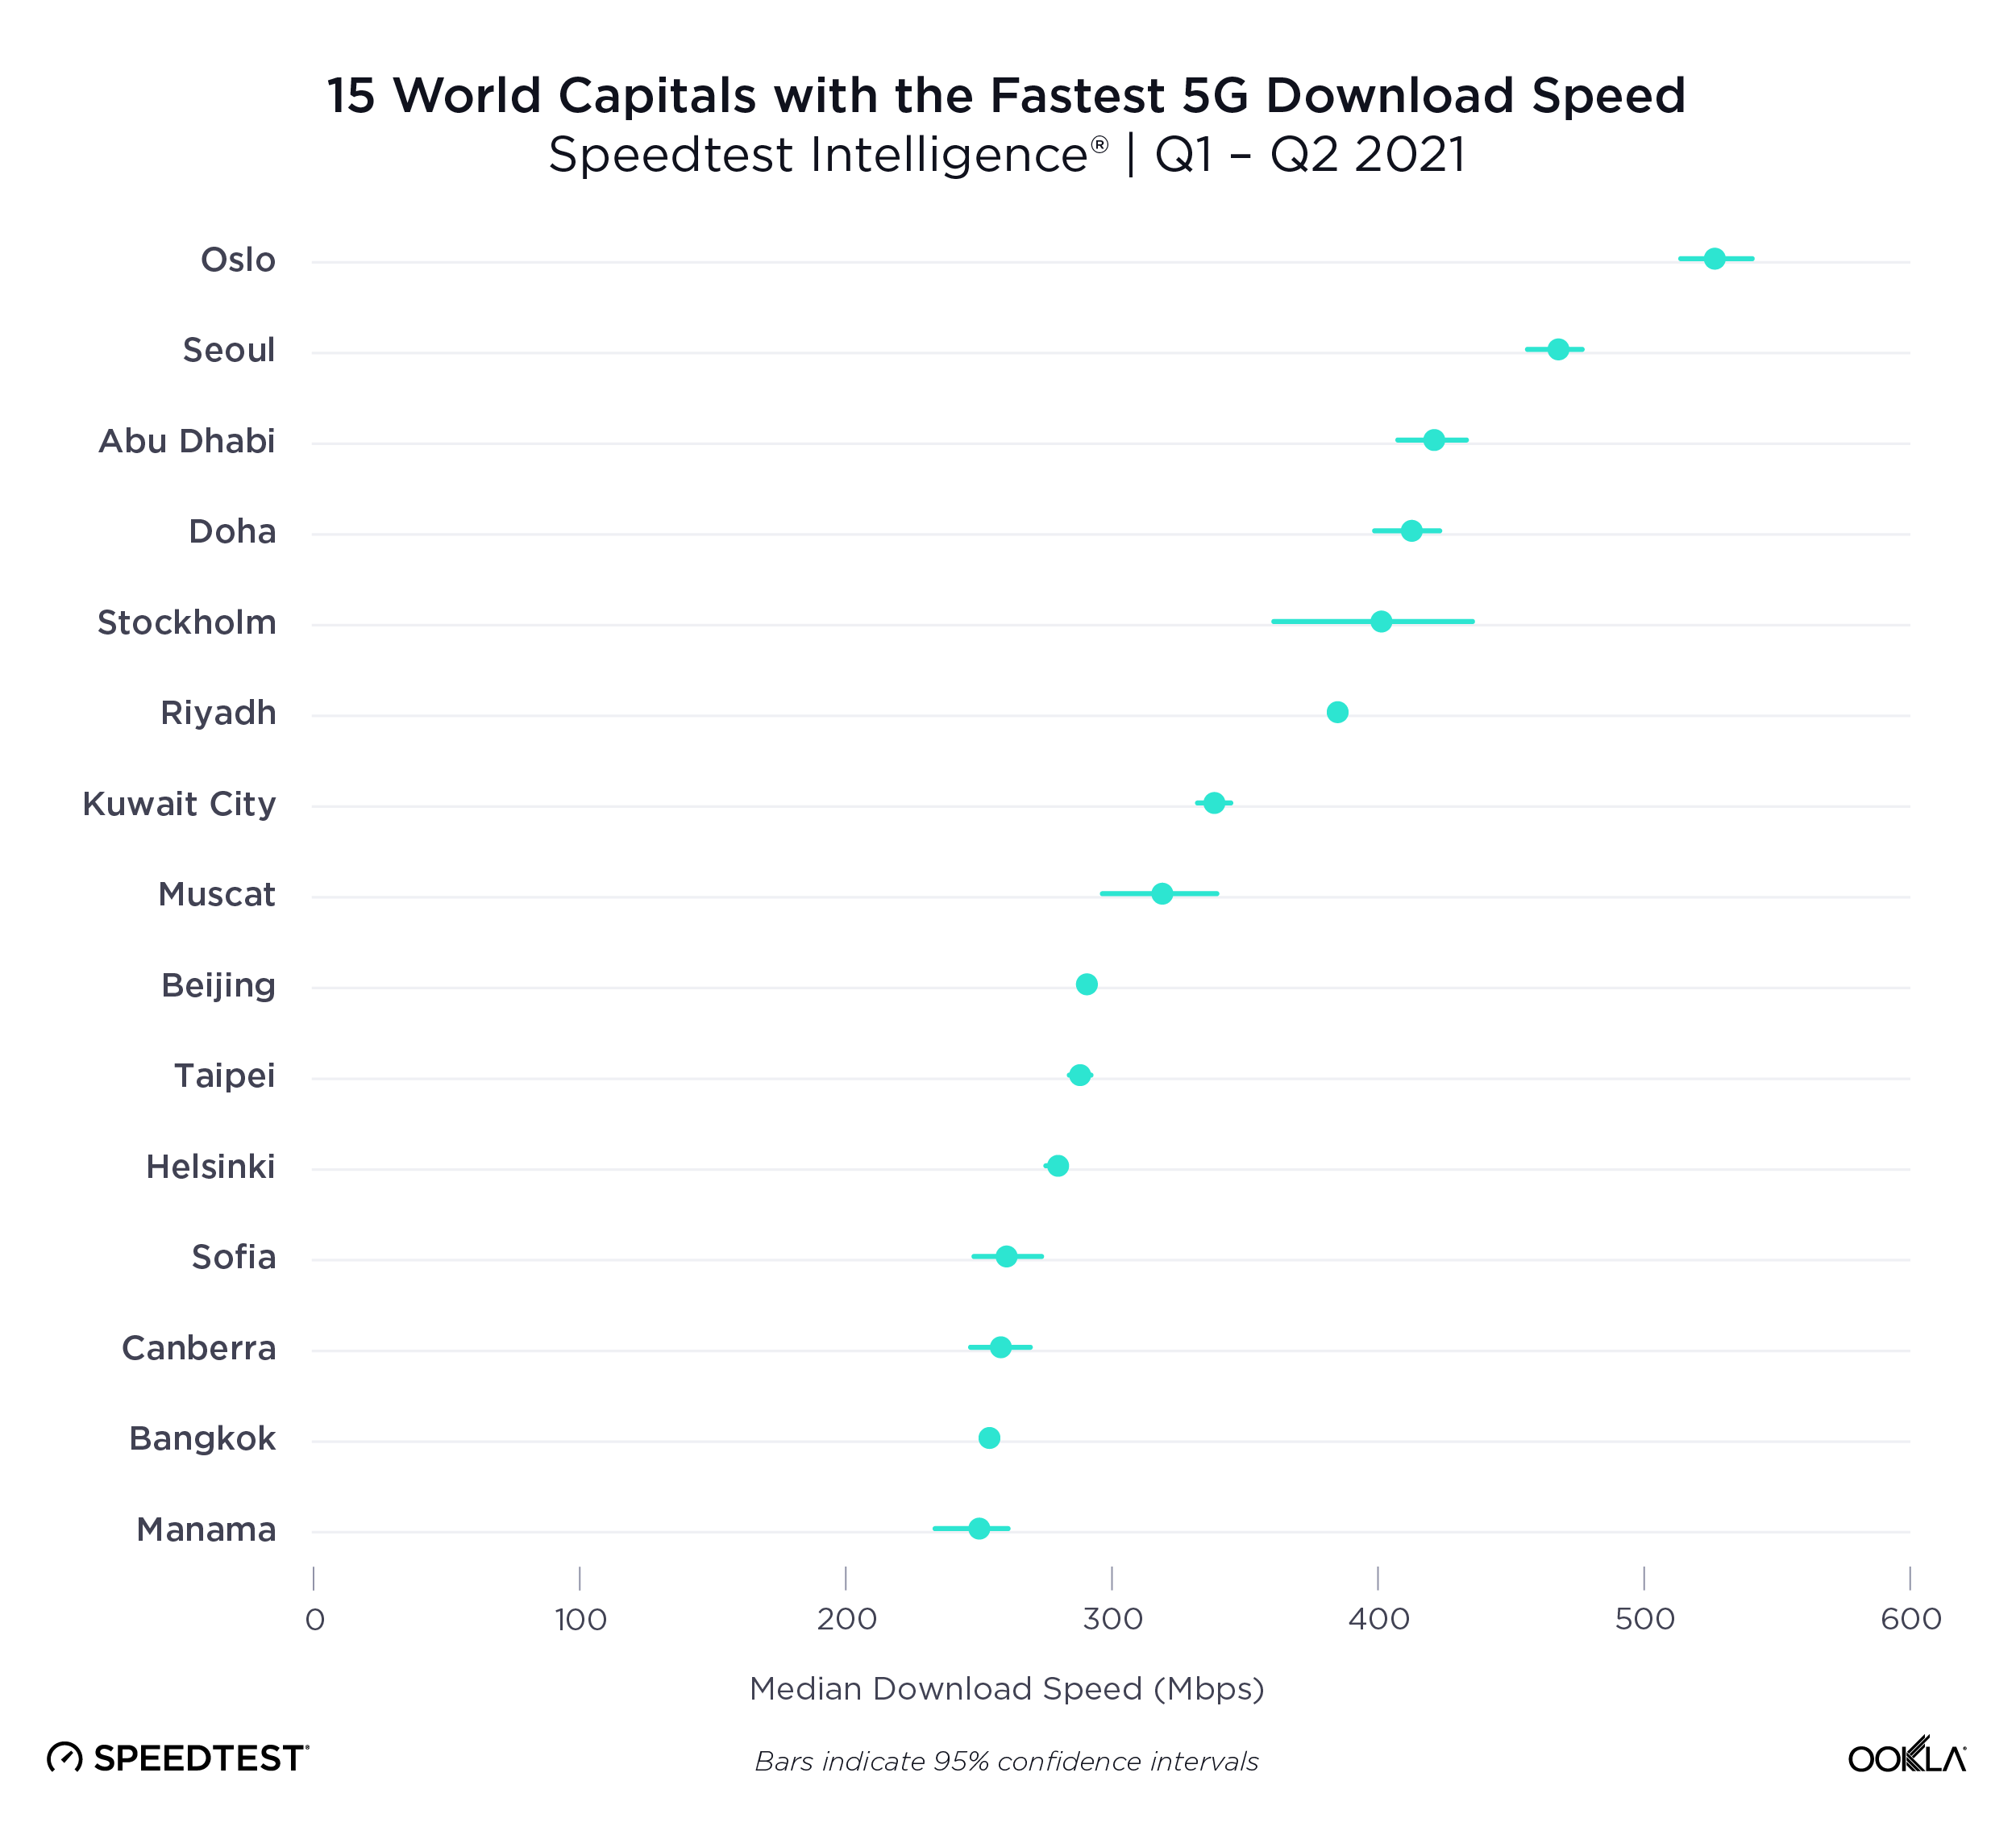
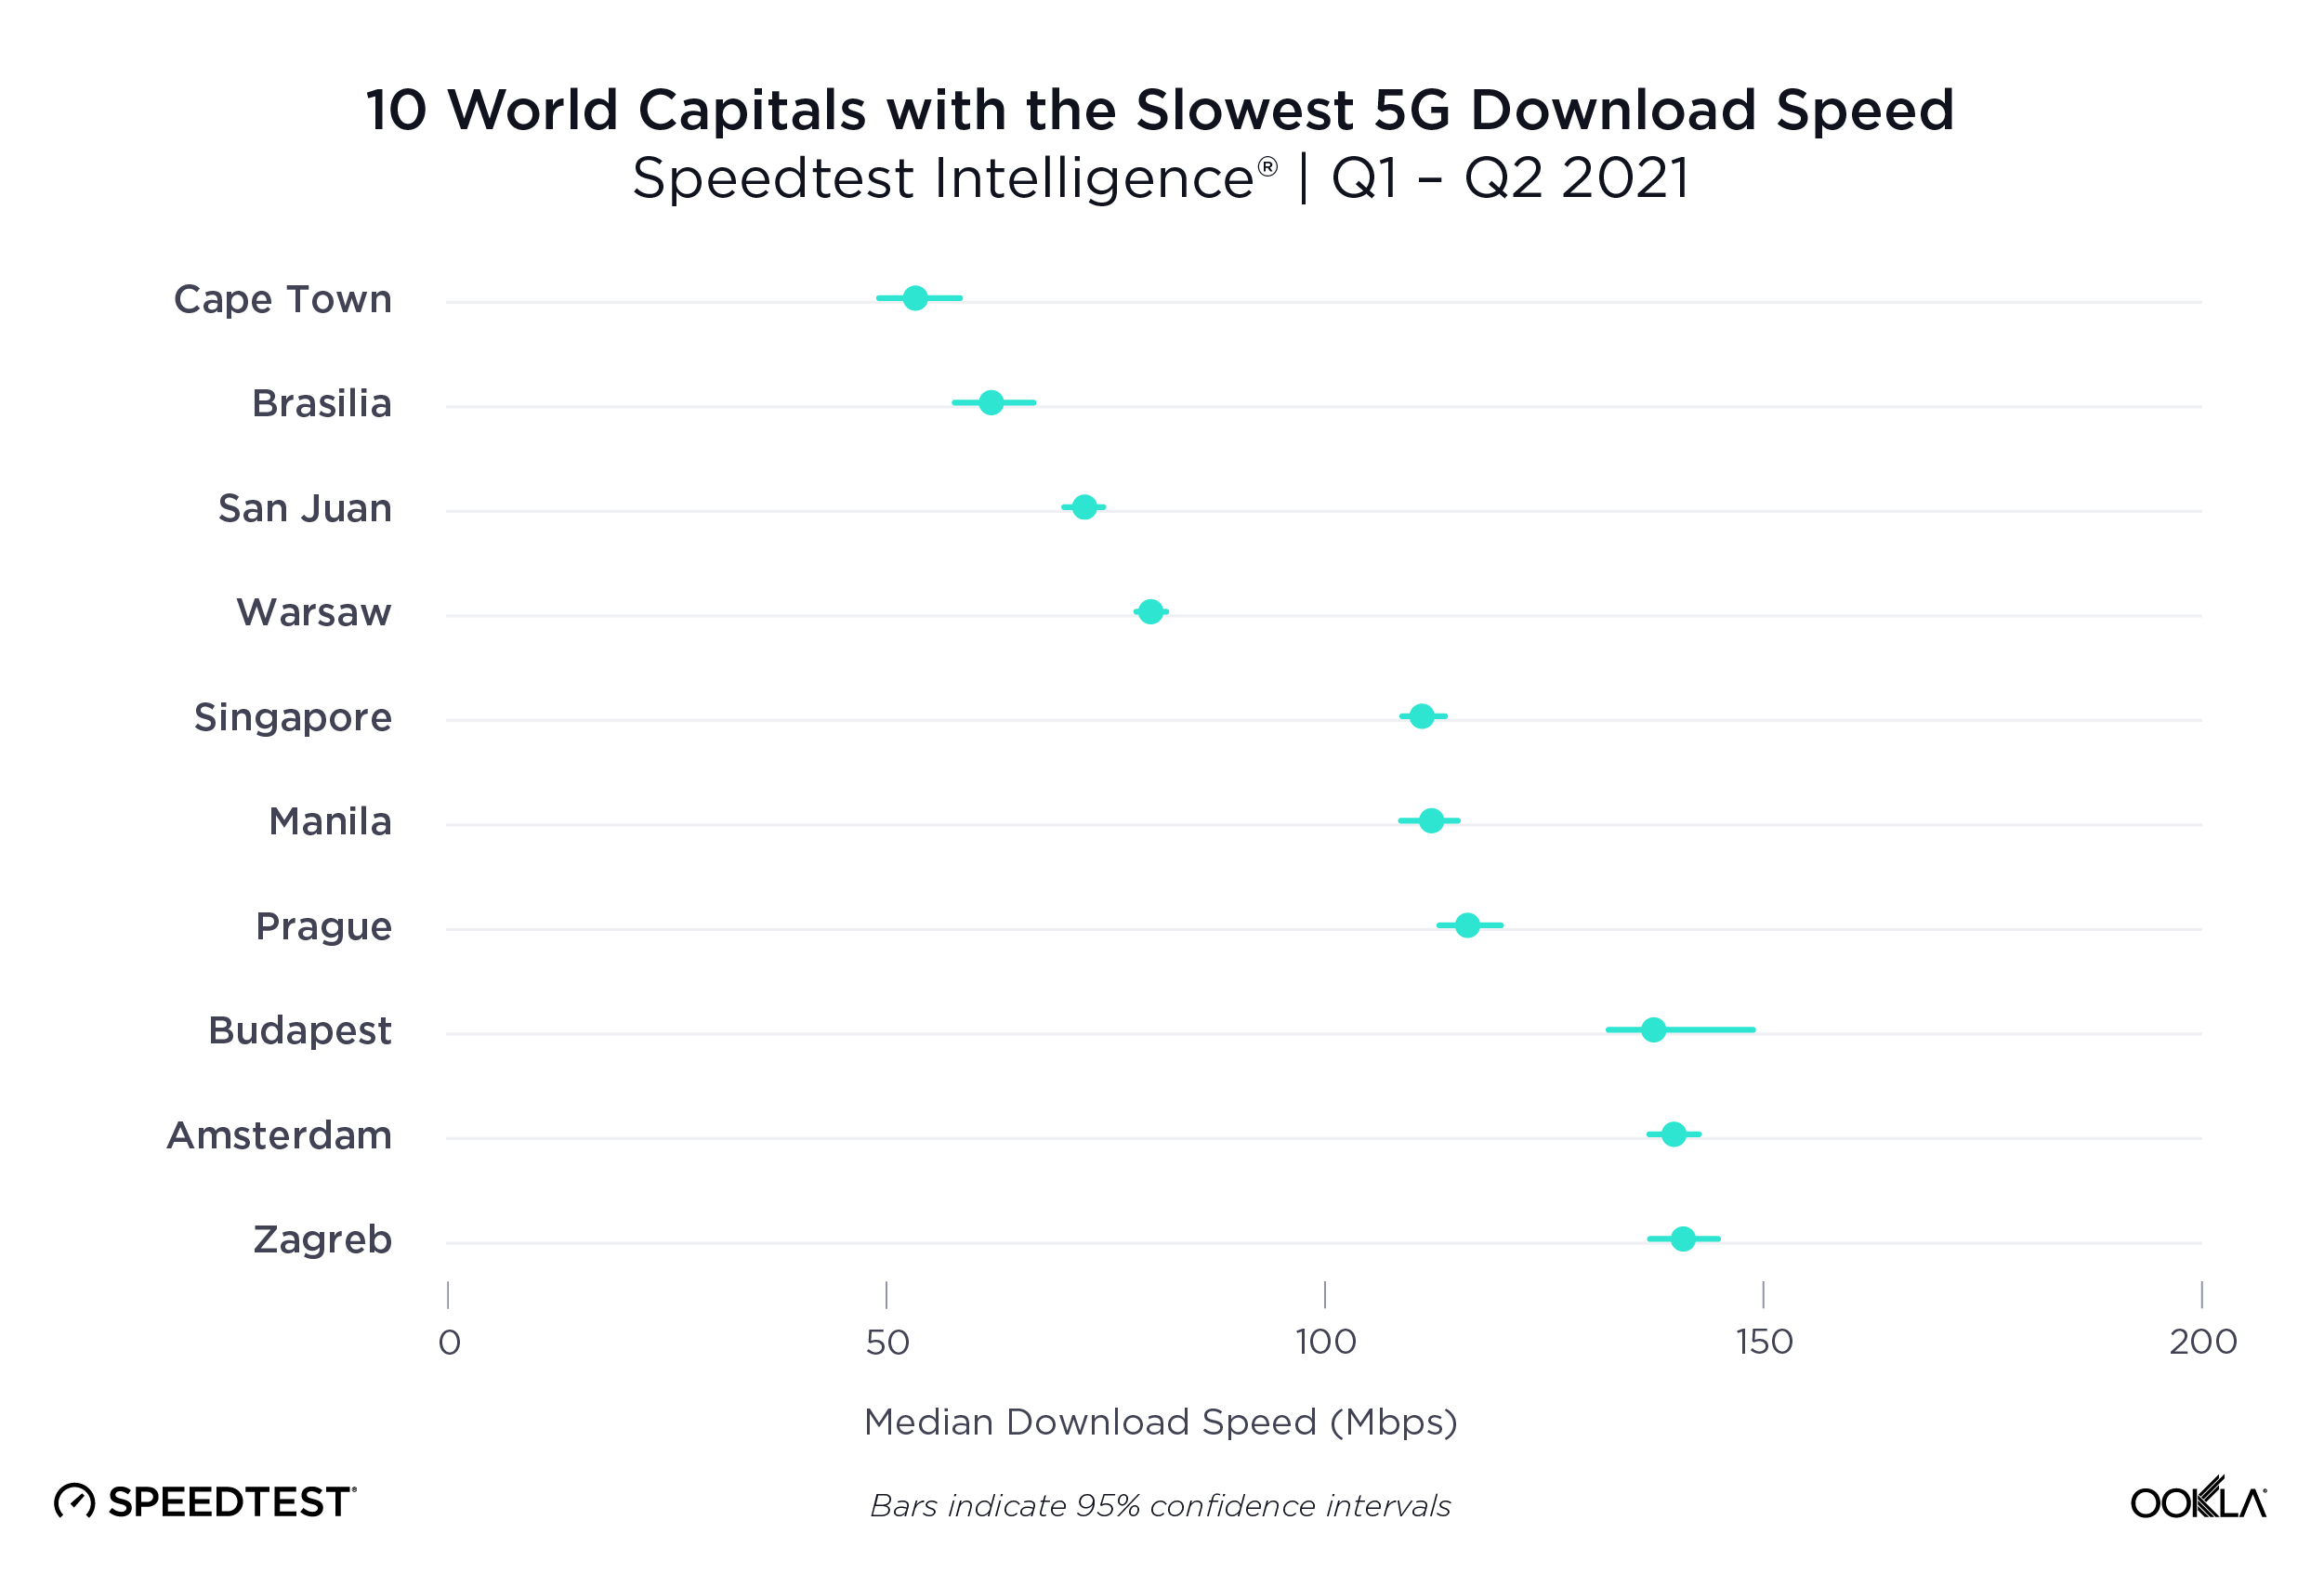
Speedtest Intelligence data from Q3 2021 shows a wide range of median 5G speeds among global capitals. Seoul, South Korea and Oslo, Norway were in the lead with 530.83 Mbps and 513.08 Mbps, respectively; Abu Dhabi, United Arab Emirates; Riyadh, Saudi Arabia and Doha Qatar followed. Brasilia, Brazil had the slowest median download speed over 5G on our list, followed by Warsaw, Poland; Cape Town, South Africa and Rome, Italy. Stockholm, Sweden and Oslo, Norway had some of the the fastest median upload speeds over 5G at 56.26 Mbps and 49.95 Mbps, respectively, while Cape Town had the slowest at 14.53 Mbps.

The U.S. had the highest 5G Availability

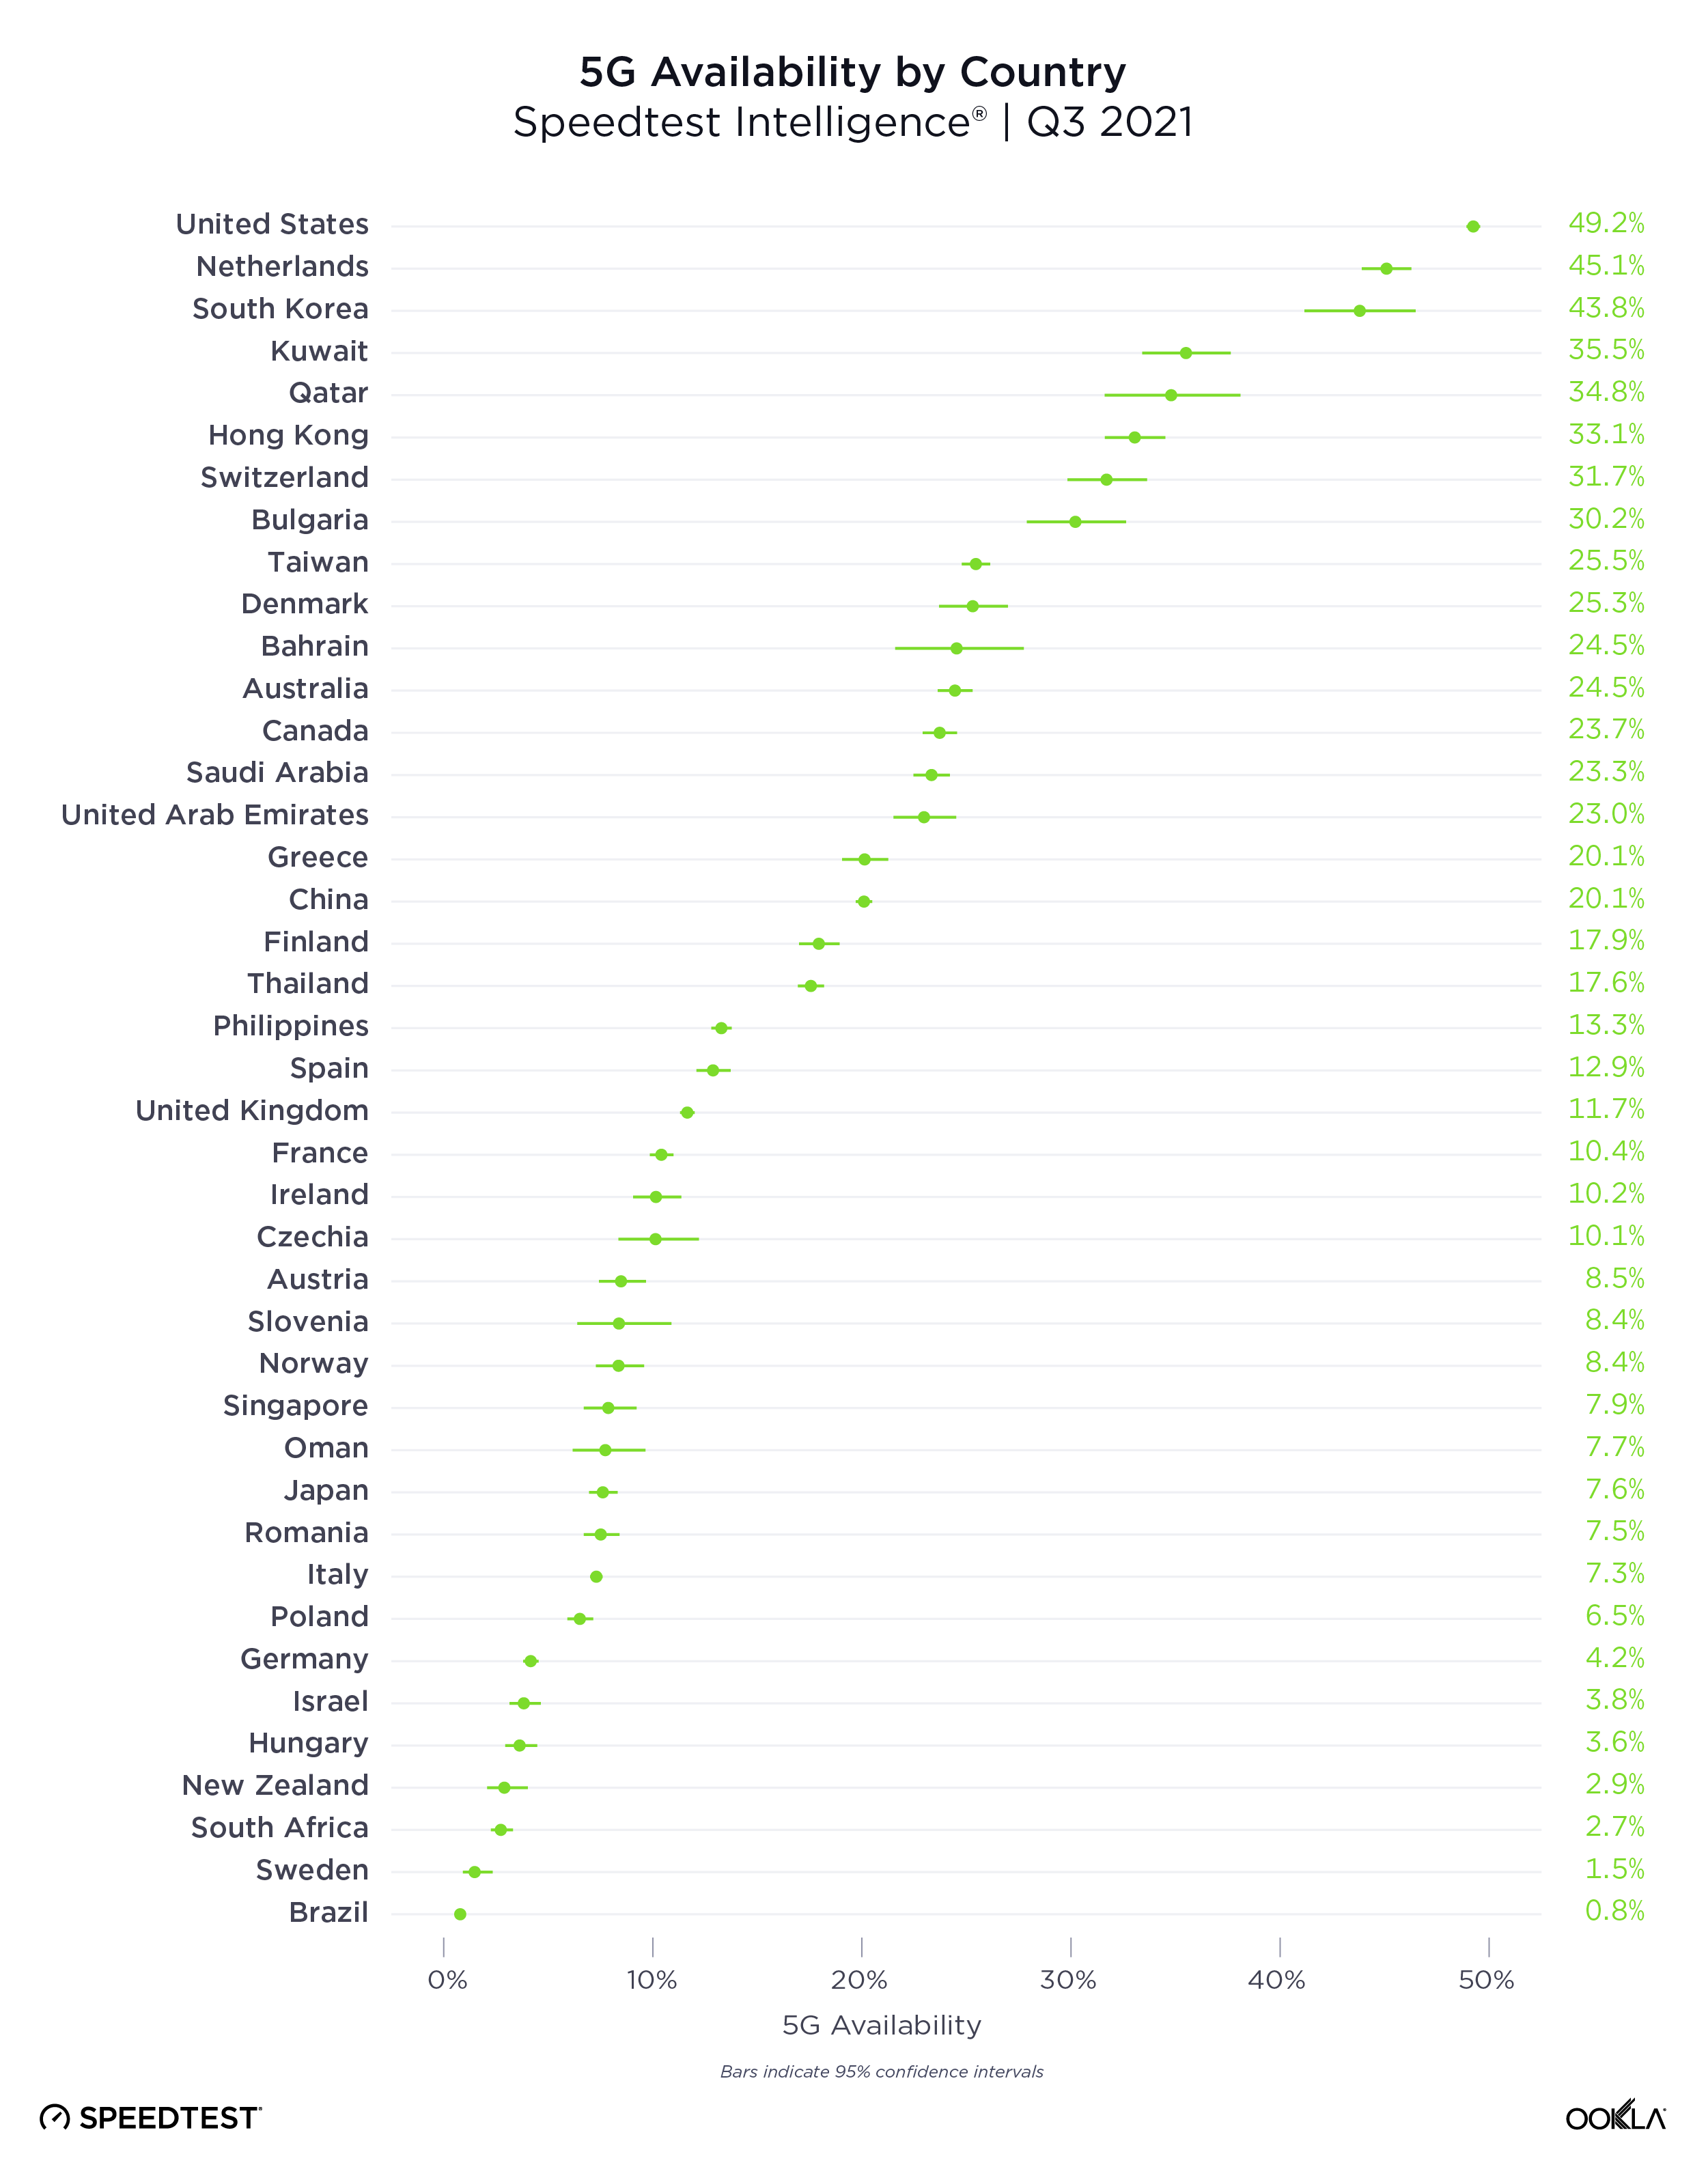
The presence of 5G is only one indicator in a market, because even in markets where 5G has launched, coverage and adoption can be pretty low. We analyzed 5G Availability to see what percent of users on 5G-capable devices spent the majority of their time on 5G, both roaming and on-network during Q3 2021.

ookla_5g-availability_countries_1221-01

The United States had the highest 5G Availability at 49.2%, followed by the Netherlands (45.1%), South Korea (43.8%), Kuwait (35.5%) and Qatar (34.8%). Brazil had the lowest 5G Availability on our list at 0.8%, followed by Sweden (1.5%), South Africa (2.7%), New Zealand (2.9%) and Hungary (3.6%).

Not all 5G networks are created equal

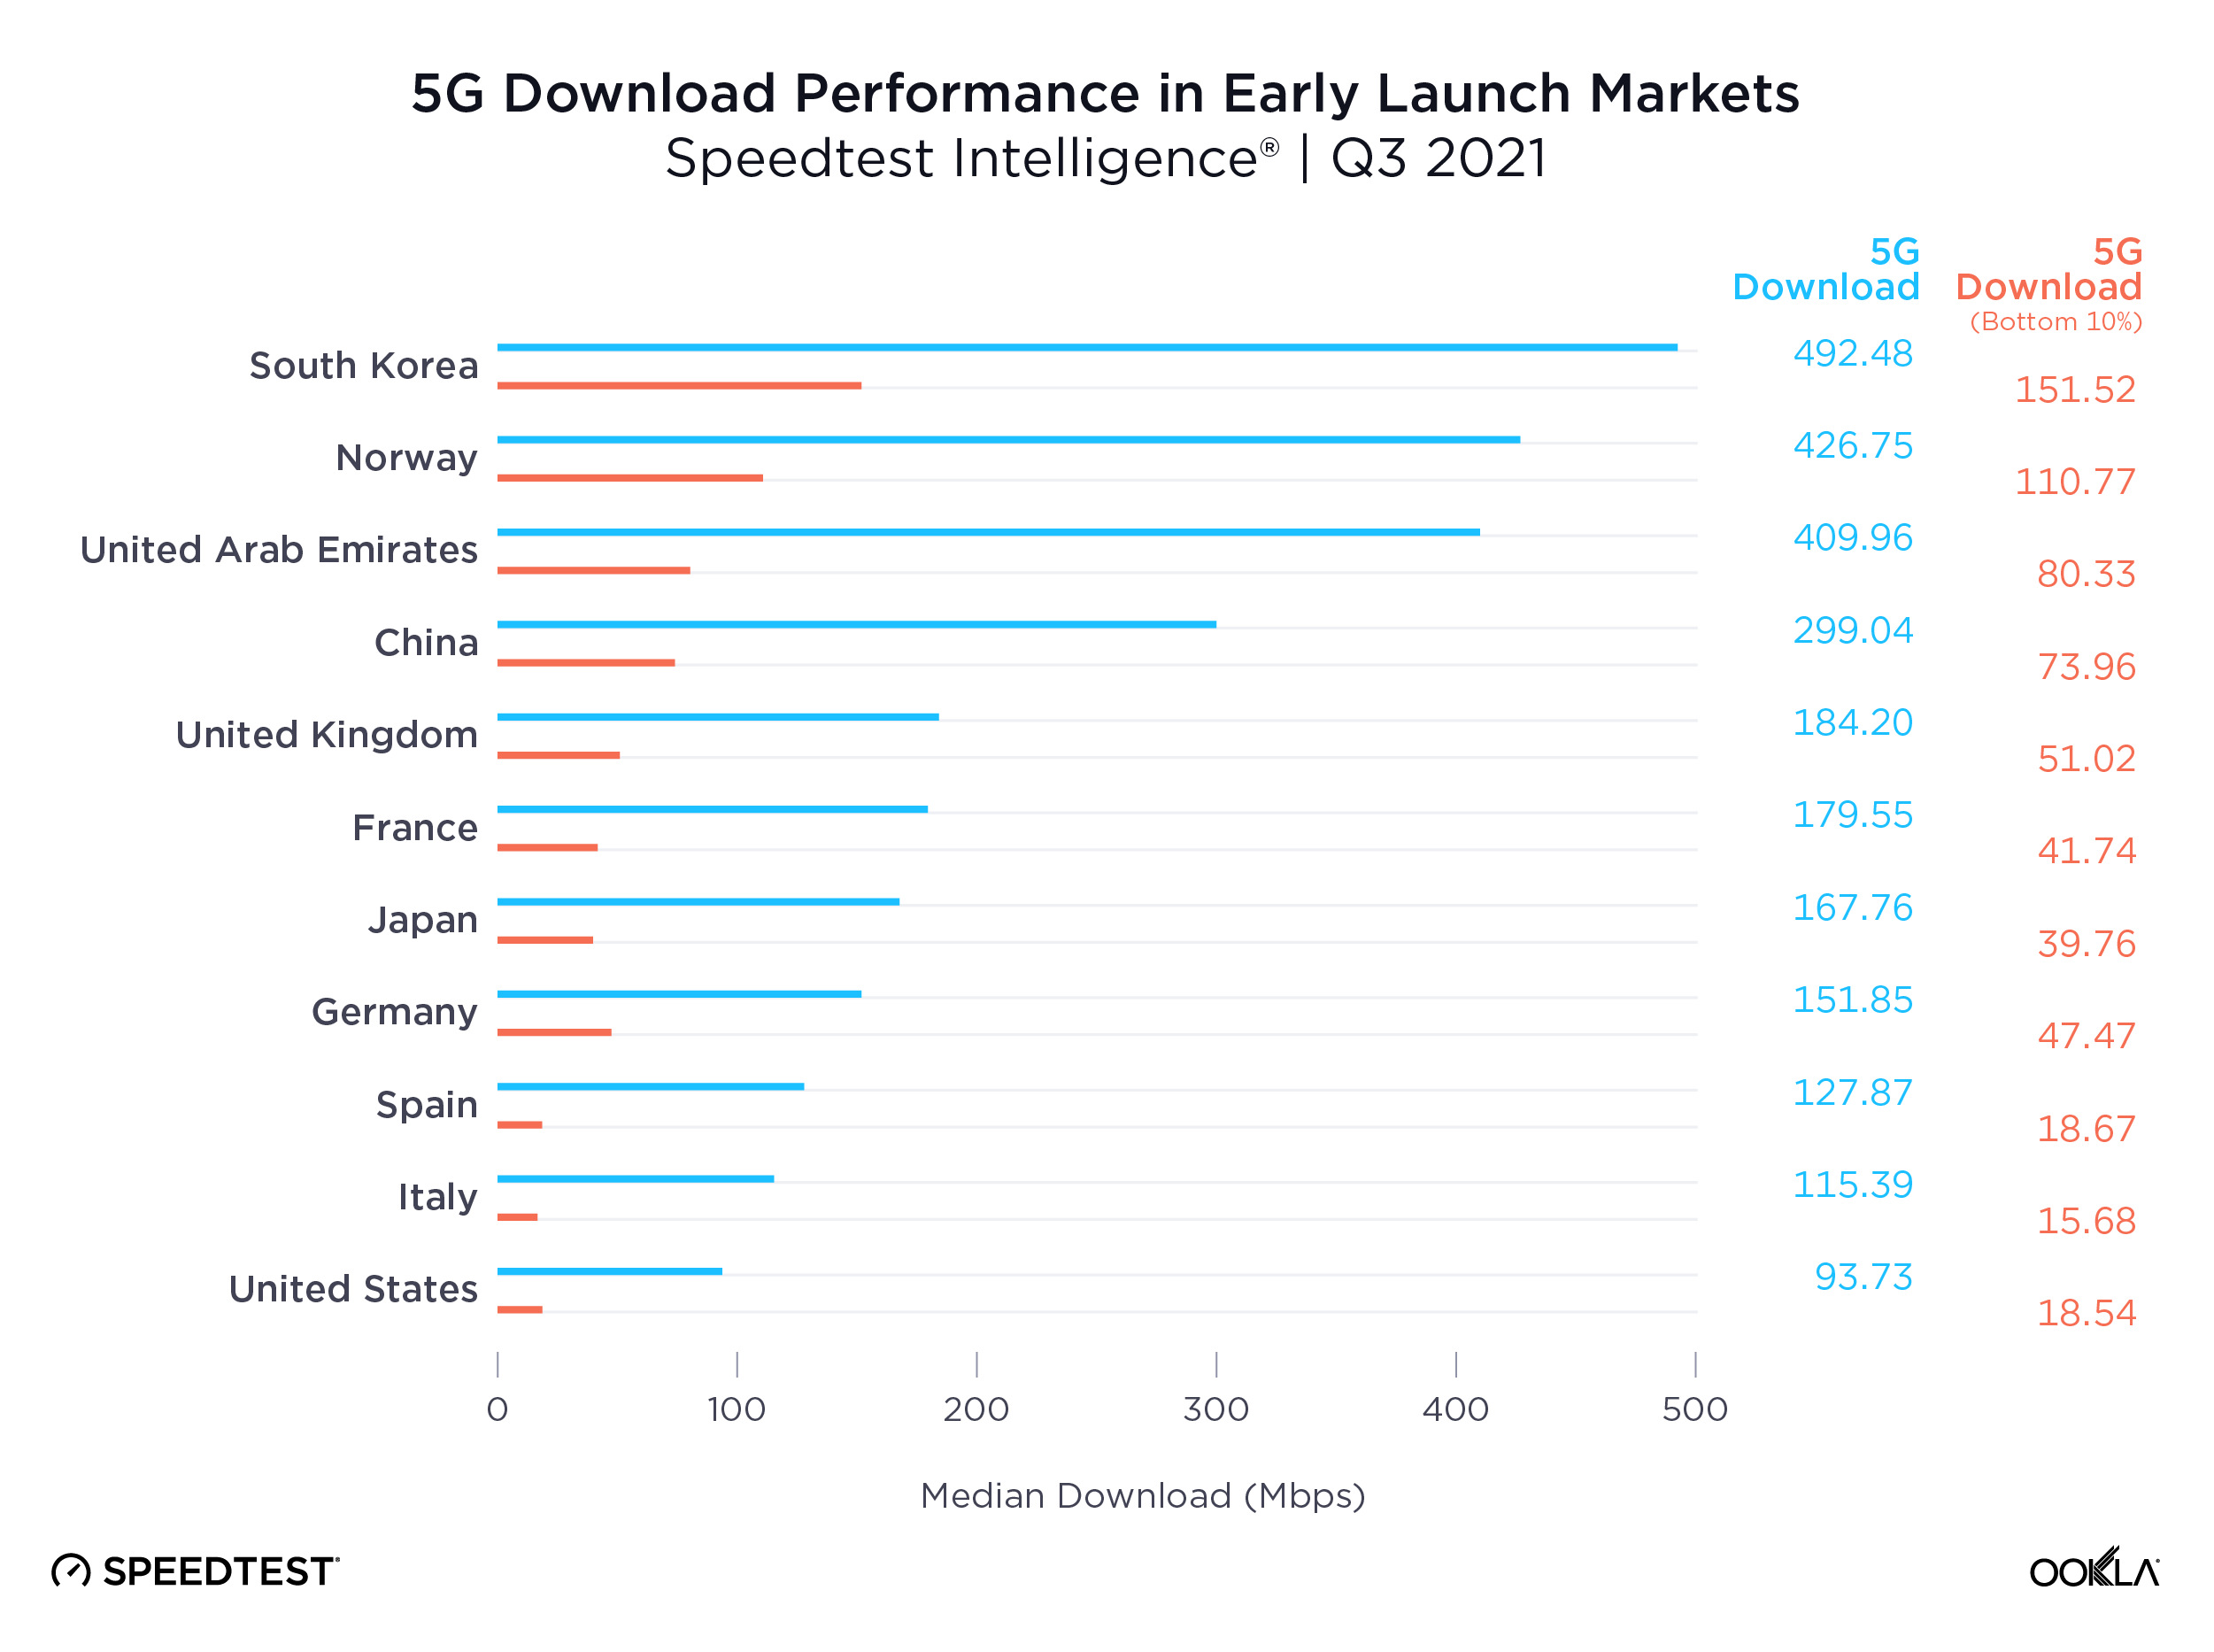
Ookla Speedtest Intelligence data shows a growing disparity in the performance of 5G networks worldwide, even among the pioneer markets who were among the first to launch the new technology. We see leading markets such as South Korea, Norway, the UAE and China pulling well ahead of key European markets, the U.S. and Japan on 5G download speeds, creating what increasingly looks like two tiers of 5G markets.

ookla_5g-download_performance_1221-01

Part of the reason for this divergence is access to key 5G spectrum bands, with Verizon and AT&T in the U.S. for example, soon to deploy their C-band spectrum holdings for 5G use. However, what really seems to separate these markets is the level of 5G network densification. The number of people per 5G base station ranges from 319 in South Korea and 1,531 in China, to 4,224 in the EU and 6,590 in the US, according to the European 5G Observatory’s International Scoreboard during October 2021.

Despite the noise around 6G, 5G still has a long way to run

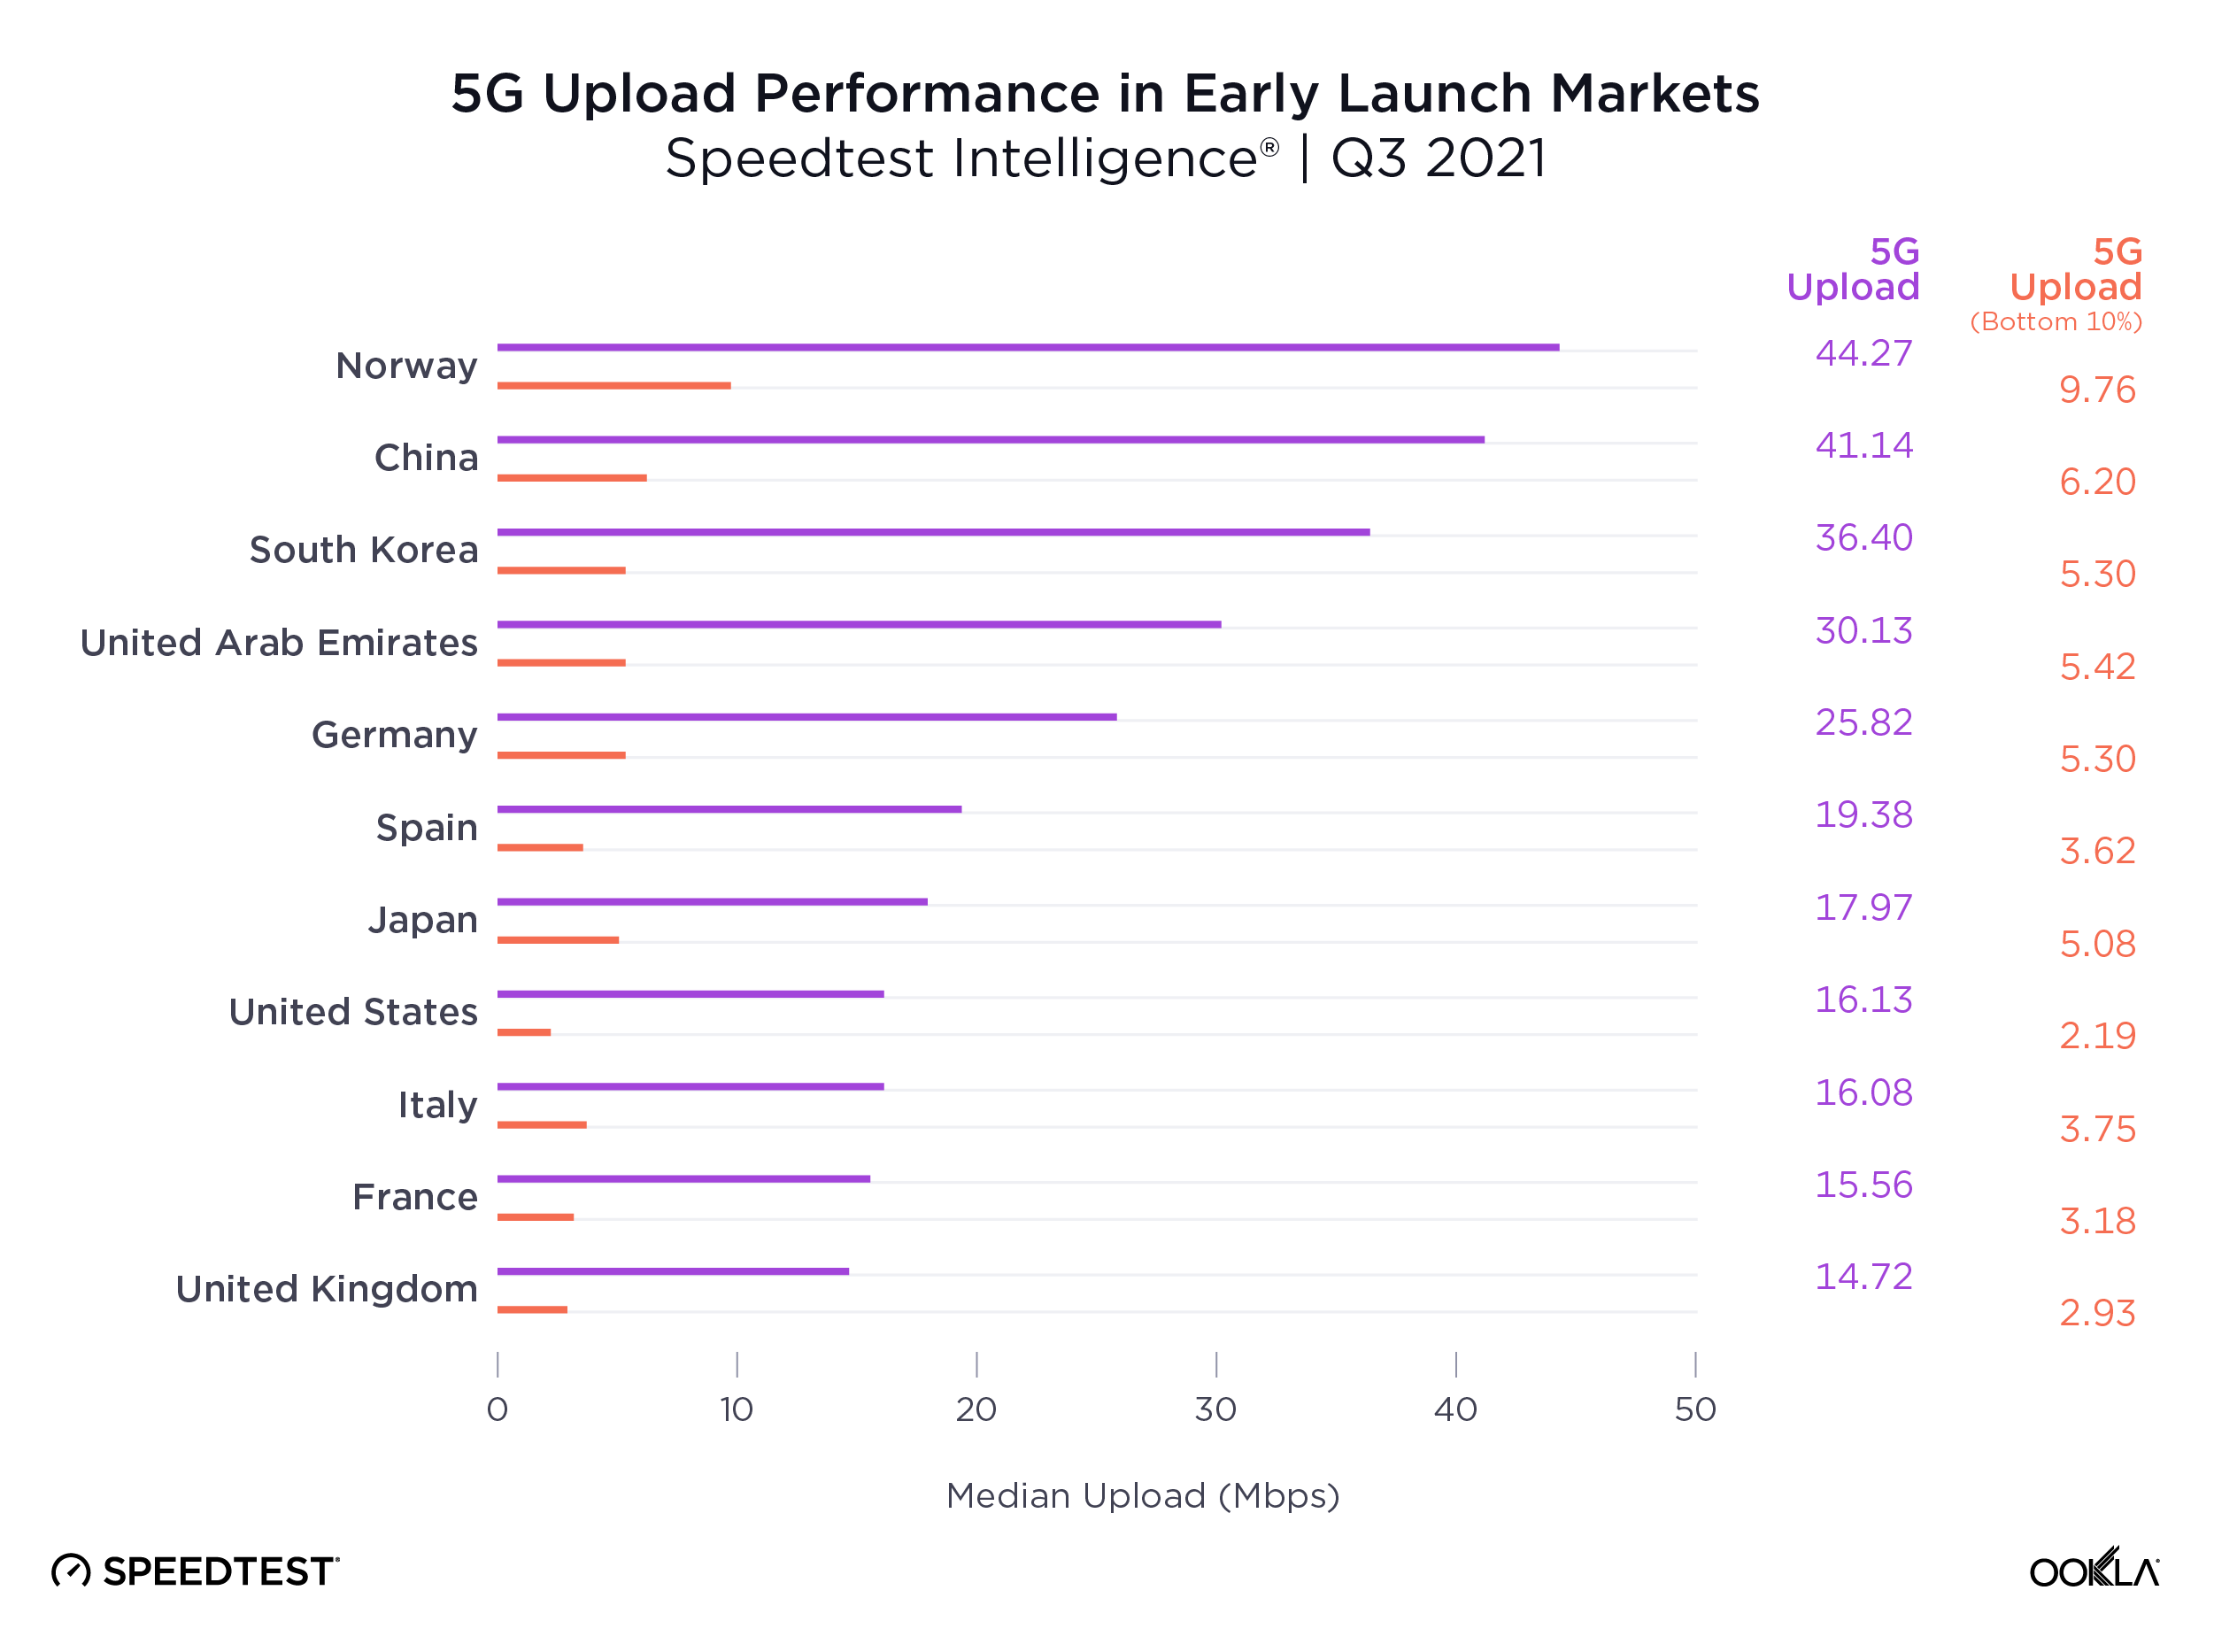
Median 5G mobile download speeds across these markets are respectable relative to the International Telecommunication Union’s (ITU) IMT-2020 target of 100 Mbps for user experienced download data rates. However, 5G Speedtest® results in each market demonstrate significant variability, with the bottom 10th percentile only recording speeds in excess of the IMT-2020 target in South Korea and Norway, and falling significantly short in many other markets, with Spain, Italy and the U.S. below 20 Mbps.

The story gets worse for upload speeds, where no market’s median speed broke the IMT-2020 recommended 50 Mbps, and where the bottom 10th percentile lay in single digits across the board. Operators are clearly prioritizing download speeds over upload, which makes sense given the asymmetric nature of demand, with most consumer applications requiring higher download speeds. However, as operators increasingly look to target the enterprise market with 5G connectivity and consumer demand for services such as video calling and mobile gaming continues to rise, operators will need to boost upload speeds.

ookla_5g-upload_performance_1221-01-1

Demand for mobile internet bandwidth continues to grow, up 43% year-on-year in Q3 2021 according to Ericsson’s latest mobility report. Looking ahead to 2022, operators will need to increase the capacity of their 5G networks to tackle this growing demand while driving network speeds to new heights. We’ve seen the impact the deployment of new spectrum can have on congested networks during 2021, with Reliance Jio witnessing a bump in 4G LTE performance and consumer sentiment following its acquisition of additional spectrum in India.

Where 5G still fails to reach

Speedtest Intelligence showed 70 countries in the world where more than 20% of samples were from 2G and 3G connections (combined) during Q3 2021 and met our statistical threshold to be included. These are mostly countries where 5G is still aspirational for a majority of the population. As excited as we are about the expansion of 5G, we do not want to see these countries left behind. Not only are 2G and 3G decades old, they are only sufficient for basic voice and texting, social media and navigation apps. To deliver rich media experiences or video calling, users need access to 4G or higher. Having so many consumers on 2G and 3G also prevents mobile operators from refarming that spectrum to make 4G and 5G networks more efficient.

Countries That Still Rely Heavily on 2G and 3G Connections
Speedtest IntelligenceⓇ | Q3 2021
Country 2G & 3G Samples
Central African Republic 89.9%
Palestine 84.7%
Yemen 72.4%
Turkmenistan 71.8%
Micronesia 56.3%
Madagascar 55.0%
Belarus 53.2%
Rwanda 51.7%
Kiribati 48.4%
Equatorial Guinea 47.6%
Afghanistan 44.4%
South Sudan 43.4%
Guyana 42.3%
Guinea 37.0%
Angola 36.8%
Cape Verde 35.9%
Tajikistan 35.6%
Zimbabwe 34.7%
Benin 34.4%
Togo 33.8%
Ghana 33.0%
Sierra Leone 31.7%
Antigua and Barbuda 30.2%
Vanuatu 30.1%
Lesotho 30.0%
Syria 29.6%
Moldova 29.4%
Saint Kitts and Nevis 28.9%
Mozambique 28.8%
Sudan 28.4%
Palau 28.3%
Grenada 28.1%
Tanzania 27.6%
Uganda 27.5%
Niger 27.5%
Gabon 27.5%
Haiti 27.4%
Suriname 27.4%
Tonga 27.3%
Liberia 27.0%
Namibia 26.7%
Swaziland 26.5%
The Gambia 26.3%
Saint Vincent and the Grenadines 26.3%
Dominica 26.3%
Somalia 26.1%
Cook Islands 26.0%
Zambia 25.9%
Barbados 25.7%
Armenia 25.5%
Algeria 25.4%
Papua New Guinea 25.2%
Jamaica 24.5%
Venezuela 24.2%
Ethiopia 24.1%
Uzbekistan 24.0%
El Salvador 23.5%
Honduras 23.1%
Nigeria 23.0%
Solomon Islands 22.8%
Caribbean Netherlands 22.7%
Botswana 22.3%
Anguilla 21.7%
Mauritania 20.6%
Saint Lucia 20.5%
Bosnia and Herzegovina 20.3%
Burundi 20.3%
Ecuador 20.2%
Ukraine 20.1%
Trinidad and Tobago 20.0%

We were pleased to see the following countries come off the list from last year, having dropped below the 20% threshold: Azerbaijan, Bangladesh, Belize, Burkina Faso, Cameroon, Costa Rica, Côte d’Ivoire, DR Congo, Iraq, Kenya, Laos, Libya, Maldives, Mali, Mauritius, Mongolia, Nicaragua, Paraguay and Tunisia. While countries like Palestine, Suriname, Ethiopia, Haiti and Antigua and Barbuda are still on this list, they have improved the percentage of their samples on these outmoded technologies when compared to last year (dropping 10-15 points, respectively), 2G and 3G samples in Belarus increased 6.7 points when comparing Q3 2021 to Q3 2020.

We’re excited to see how performance levels will normalize as 5G expands to more and more countries and access improves. Keep track of how well your country is performing on Ookla’s Speedtest Global Index.

Ookla retains ownership of this article including all of the intellectual property rights, data, content graphs and analysis. This article may not be quoted, reproduced, distributed or published for any commercial purpose without prior consent. Members of the press and others using the findings in this article for non-commercial purposes are welcome to publicly share and link to report information with attribution to Ookla.

| January 28, 2025

Powering the Passenger Experience: Insights into Mobile Network Performance of Top Hubs in the Gulf and Turkey

The Gulf region and Turkey have experienced a surge in air passenger traffic. The growth is expected to remain robust in key hubs such as Dubai, Doha, and Istanbul. As airports prepare to accommodate this influx of travelers, reliable and high-performance cellular networks have become increasingly important in shaping the overall passenger experience. This article benchmarks the network performance of the busiest airports in the Gulf region and Turkey, in terms of download and upload speeds, as well as latency, based on Speedtest Intelligence® data. It also provides recommendations on where travelers may get the best online experience.

Key Takeaways:

  • Zayed International Airport (AUH) achieves top-tier mobile download speeds of over ​​450 Mbps. Istanbul Airport (IST) excels in upload speed at 58.40 Mbps, making it particularly suitable for travelers who need to share content efficiently. On the other end, King Abdulaziz International Airport (JED) in Jeddah consistently underperforms across all metrics, with the highest latency and lowest upload speed.
  • Istanbul Airport significantly leads in 5G performance thanks to a dedicated 5G indoor network: IST achieved the highest download and upload speeds at 861.98 Mbps and 101.96 Mbps, respectively. Gulf-based airports showed a high contrast in median 5G download speeds, with those in Qatar and the UAE offering the fastest speeds at over 500 Mbps.

Most airports provided a median download speed of at least 200 Mbps, enabling an excellent online experience for passengers

While Turkey has long been a magnet for tourists, the Gulf region has emerged as one of the world’s premier travel hubs, attracting hundreds of millions of passengers annually. As a result, airport operators in the region face a pressing need to deliver seamless web browsing, lag-free online gaming, and high-quality streaming experiences to enhance the overall passenger experience and set a new standard for airport facilities. We used Speedtest Intelligence to analyze cellular network performance in the busiest airports in the Gulf region and Turkey.

Total Passengers In Selected Busiest Airports In The Gulf Region And Turkey
Wikipedia | 2024
Total Passengers In Selected Busiest Airports In The Gulf Region And Turkey

Download speed is the most important metric for content consumption and online experience. Zayed International Airport (AUH) had a median download speed of 453.18 Mbps. It was closely followed by Hamad International Airport (DOH), with a speed of 426.43 Mbps. King Khalid International Airport (RUH) and Istanbul International Airport (IST) also delivered excellent download speed performances at  329.04 Mbps and 314.84 Mbps, respectively.

In contrast, Sabiha Gökçen Airport (SAW) and Muscat International Airport (MCT) delivered sub-100Mbps speeds of 78.67 Mbps and 95.95 Mbps, respectively. Airports based in Dubai and Kuwait fall into the mid-range, with download speeds of around 250 Mbps. 

Upload speed is important as it determines how efficiently users can upload documents, photos, and videos. IST stands out with a median upload speed of 58.40 Mbps, surpassing all other airports. RUH in Riyadh, DOH in Doha, and SAW in Istanbul follow with upload speeds of 32.83 Mbps, 30.10 Mbps, and 29.10 Mbps, respectively. King Abdul Aziz International Airport (JED) in Jeddah falls short, delivering the lowest upload speed of just 16.11 Mbps, while DXB pulls slightly ahead with 18.99 Mbps. 

Latency measures the delay in transferring data and affects real-time services such as video calls, online gaming, and media streaming. Most airports offer a sub-40 ms latency, which ensures acceptable responsiveness for users. IST and Kuwait International Airport (KWT) have somewhat better conditions, with a delay of under 32 ms. JED stood out again as a poor performer with a latency of 89.98 ms, suggesting a significant impact on real-time applications such as gaming and video conferencing.

All Technologies Network Performance, Select Airports in the Gulf and Turkey
Speedtest Intelligence® | 2024
All Technologies Network Performance, Select Airports in the Gulf and Turkey

Istanbul Airport significantly leads the region in 5G performance thanks to a dedicated 5G indoor network

As 5G adoption increases, consumers and businesses expect the same level of coverage and performance wherever they go. Yet, the characteristics of ‘outdoor’ 5G, which typically operates in mid-band frequencies of 1.8 GHz to 3.5 GHz, pose a challenge for indoor coverage, as these frequencies struggle to penetrate walls and windows, particularly those built of glass and steel. Furthermore, telecom operators have prioritized outdoor coverage because it requires less CAPEX and OPEX per subscriber than indoor coverage and has a better return on investment. In addition, the traffic patterns in the airport are highly variable, which means that the network must be capable of accommodating different connectivity levels.

The introduction of 5G in Turkey lags significantly behind as 700 MHz, 3.5 GHz, and 26 GHz frequencies will be auctioned in 2025, with commercial launch expected in 2026. However, Istanbul International Airport (IST) deployed a dedicated indoor 5G network that serves only users within the airport’s premises. This deployment gives it performance advantages compared to public 5G networks. Speedtest Intelligence data shows that IST secured the top spot for 5G median download and upload speeds at 861.98 Mbps and 101.96 Mbps, respectively.

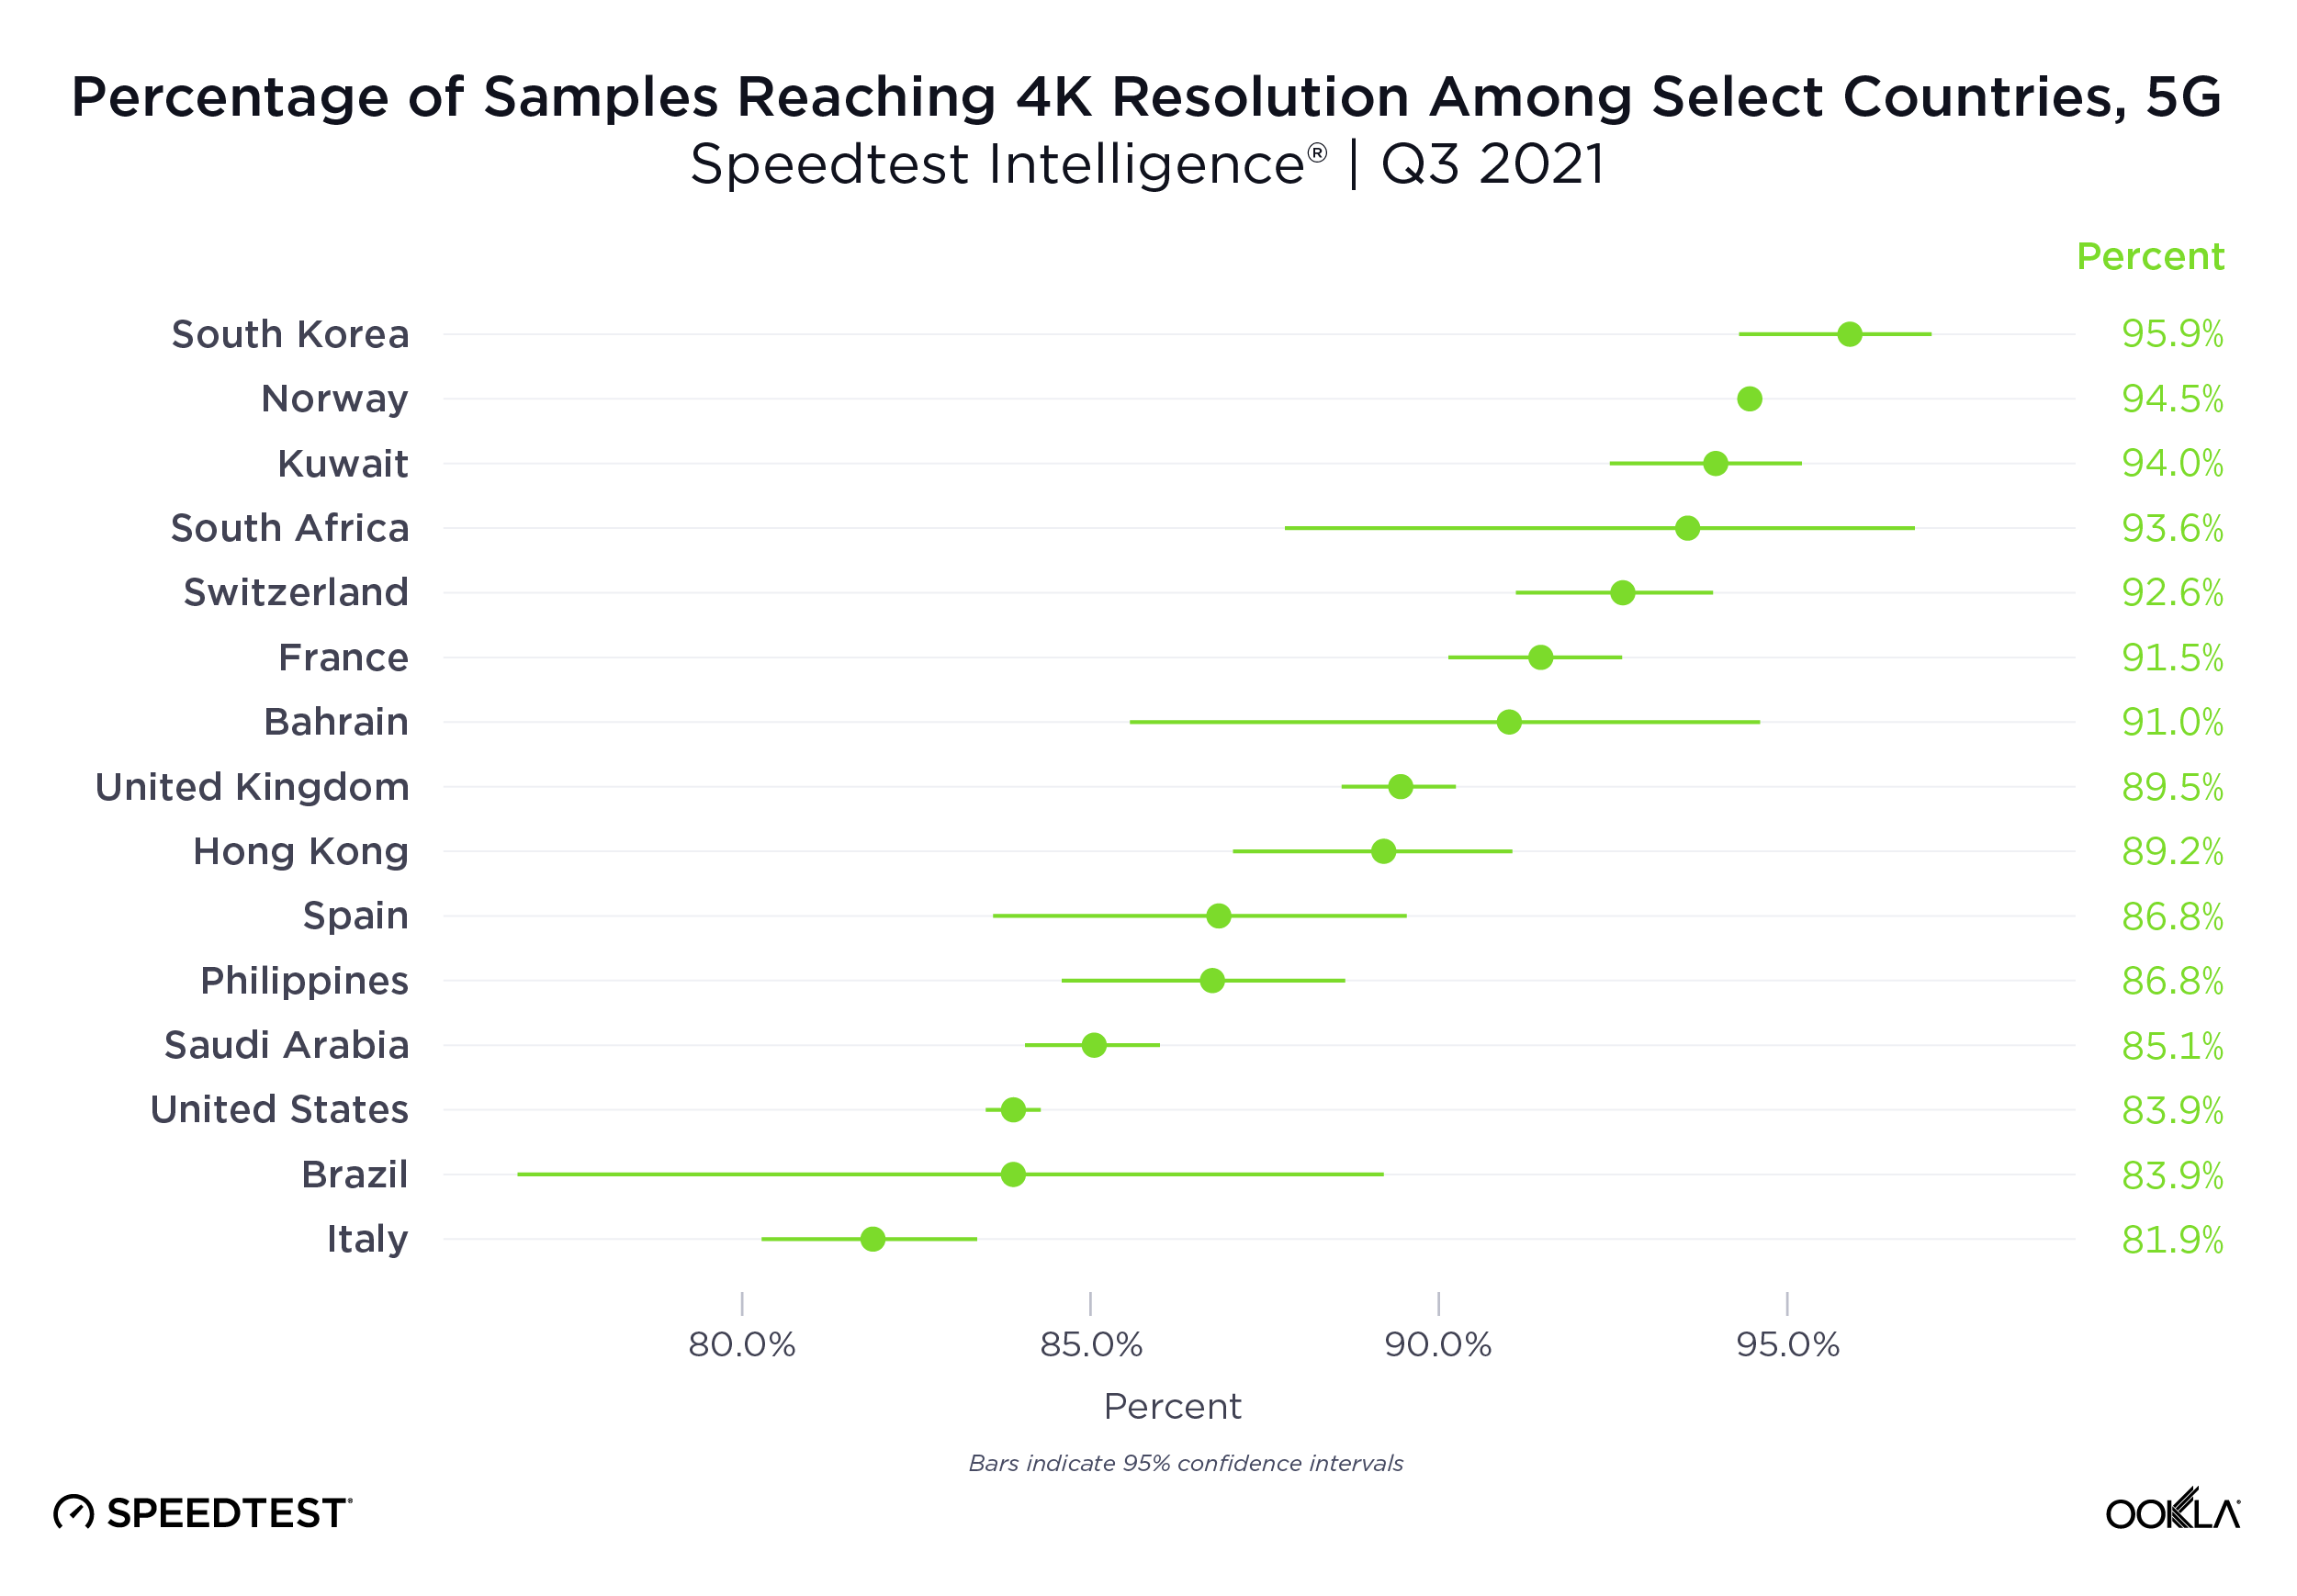
Airports in Abu Dhabi (AUH) and Doha (DOH) also have high 5G download speeds, at 678.11 Mbps and 657.56 Mbps, respectively. All other Gulf-based airports provided a median download speed of at least 107 Mbps, enabling users to stream multiple 4K videos over 5G. 

Gulf airports lagged significantly behind IST in upload speeds, with four locations’ speeds ranging from around 30 Mbps to 45 Mbps. The other four Gulf-based airports underperformed, with MCT and JED at the bottom of the list with a median upload speed of 15.09 Mbps and 17.84 Mbps, respectively, despite deploying solutions to improve indoor network coverage and capacity.

Most airports offer a relatively low 5G latency, around 30 ms to 36 ms, suggesting good service responsiveness. The only exception is JED, with a median latency of 86.59 ms, likely degrading the customer experience of real-time services such as video streaming.

5G Network Performance, Select Airports in the Gulf and Turkey
Speedtest Intelligence® | 2024
5G Network Performance, Select Airports in the Gulf and Turkey

As the results show, airports in the Gulf region and Turkey generally have excellent mobile network performance inside and around these facilities. These achievements were realized thanks to the deployment of 5G and investment in solutions to improve indoor coverage and capacity.

The tourism boom in Turkey and the Gulf region is set to continue and will drive infrastructure investment and economic growth

According to GlobalData, the number of international arrivals into the GCC (Gulf Cooperation Council) reached 73.64 million travelers in 2023. The U.A.E. leads the GCC in terms of tourist numbers with 28.2 million visitors in the city during H1 2024,  while Saudi Arabia received 27.4 million visitors (including pilgrims) with the ambition to grow to 150 million by 2030. The tourism sector in Qatar is also a promising destination, with 3 million visitors in 2023, benefiting from the successful hosting of the World Cup in 2022. Oman welcomed 3.4 million tourists in 2023 and plans to attract 11.7 million by 2040.

These countries have invested heavily in infrastructure, including transport, to address the growing influx of tourists and translate into economic growth. They have also built new airports and upgraded existing ones to cater to the rise in air passenger traffic, which is expected to surge to 449 million in 2024, more than double its 2019 level. 

The new Istanbul airport was inaugurated in 2018 to make Turkey’s capital one of the world’s largest financial and economic centers. It had an initial capacity of 90 million passengers annually, making it a major gateway for international visitors and contributing to the country’s economy.  According to the Ministry of Culture and Tourism, the number of tourist arrivals in the country increased by 7% to 47.3 million during the first 10 months of 2024 compared to the same period the previous year. It plans to expand its capacity to 120 million passengers in 2025

As the Gulf region and Turkey continue to experience a surge in air passenger traffic, it is essential to meet their expectations for fast and reliable connectivity to enhance their overall experience and gain a competitive edge over other airports. By doing so, they can unlock new growth opportunities, improve customer loyalty, and strengthen their position as major global travel hubs.We will continue to monitor network performance in key locations where people spend their time and how it impacts their online experience. If you are interested in Speedtest Intelligence, please contact us.

Ookla retains ownership of this article including all of the intellectual property rights, data, content graphs and analysis. This article may not be quoted, reproduced, distributed or published for any commercial purpose without prior consent. Members of the press and others using the findings in this article for non-commercial purposes are welcome to publicly share and link to report information with attribution to Ookla.

| December 18, 2022

Stable and Expanding: The State of Worldwide 5G in 2022


5G is no longer a new technology, however, consumers in many countries are still waiting to see the full benefits of 5G (or even to connect to 5G at all). We examined Speedtest Intelligence® data from Q3 2022 Speedtest® results to see how 5G performance has changed since last year, where download speeds are the fastest at the country level, and how satellite technologies are offering additional options to connect. We also looked at countries that don’t yet have 5G to understand where consumers are seeing improvements in 4G LTE access.

5G speeds were stable at the global level

Graphic of 5G median speed performance worldwide.

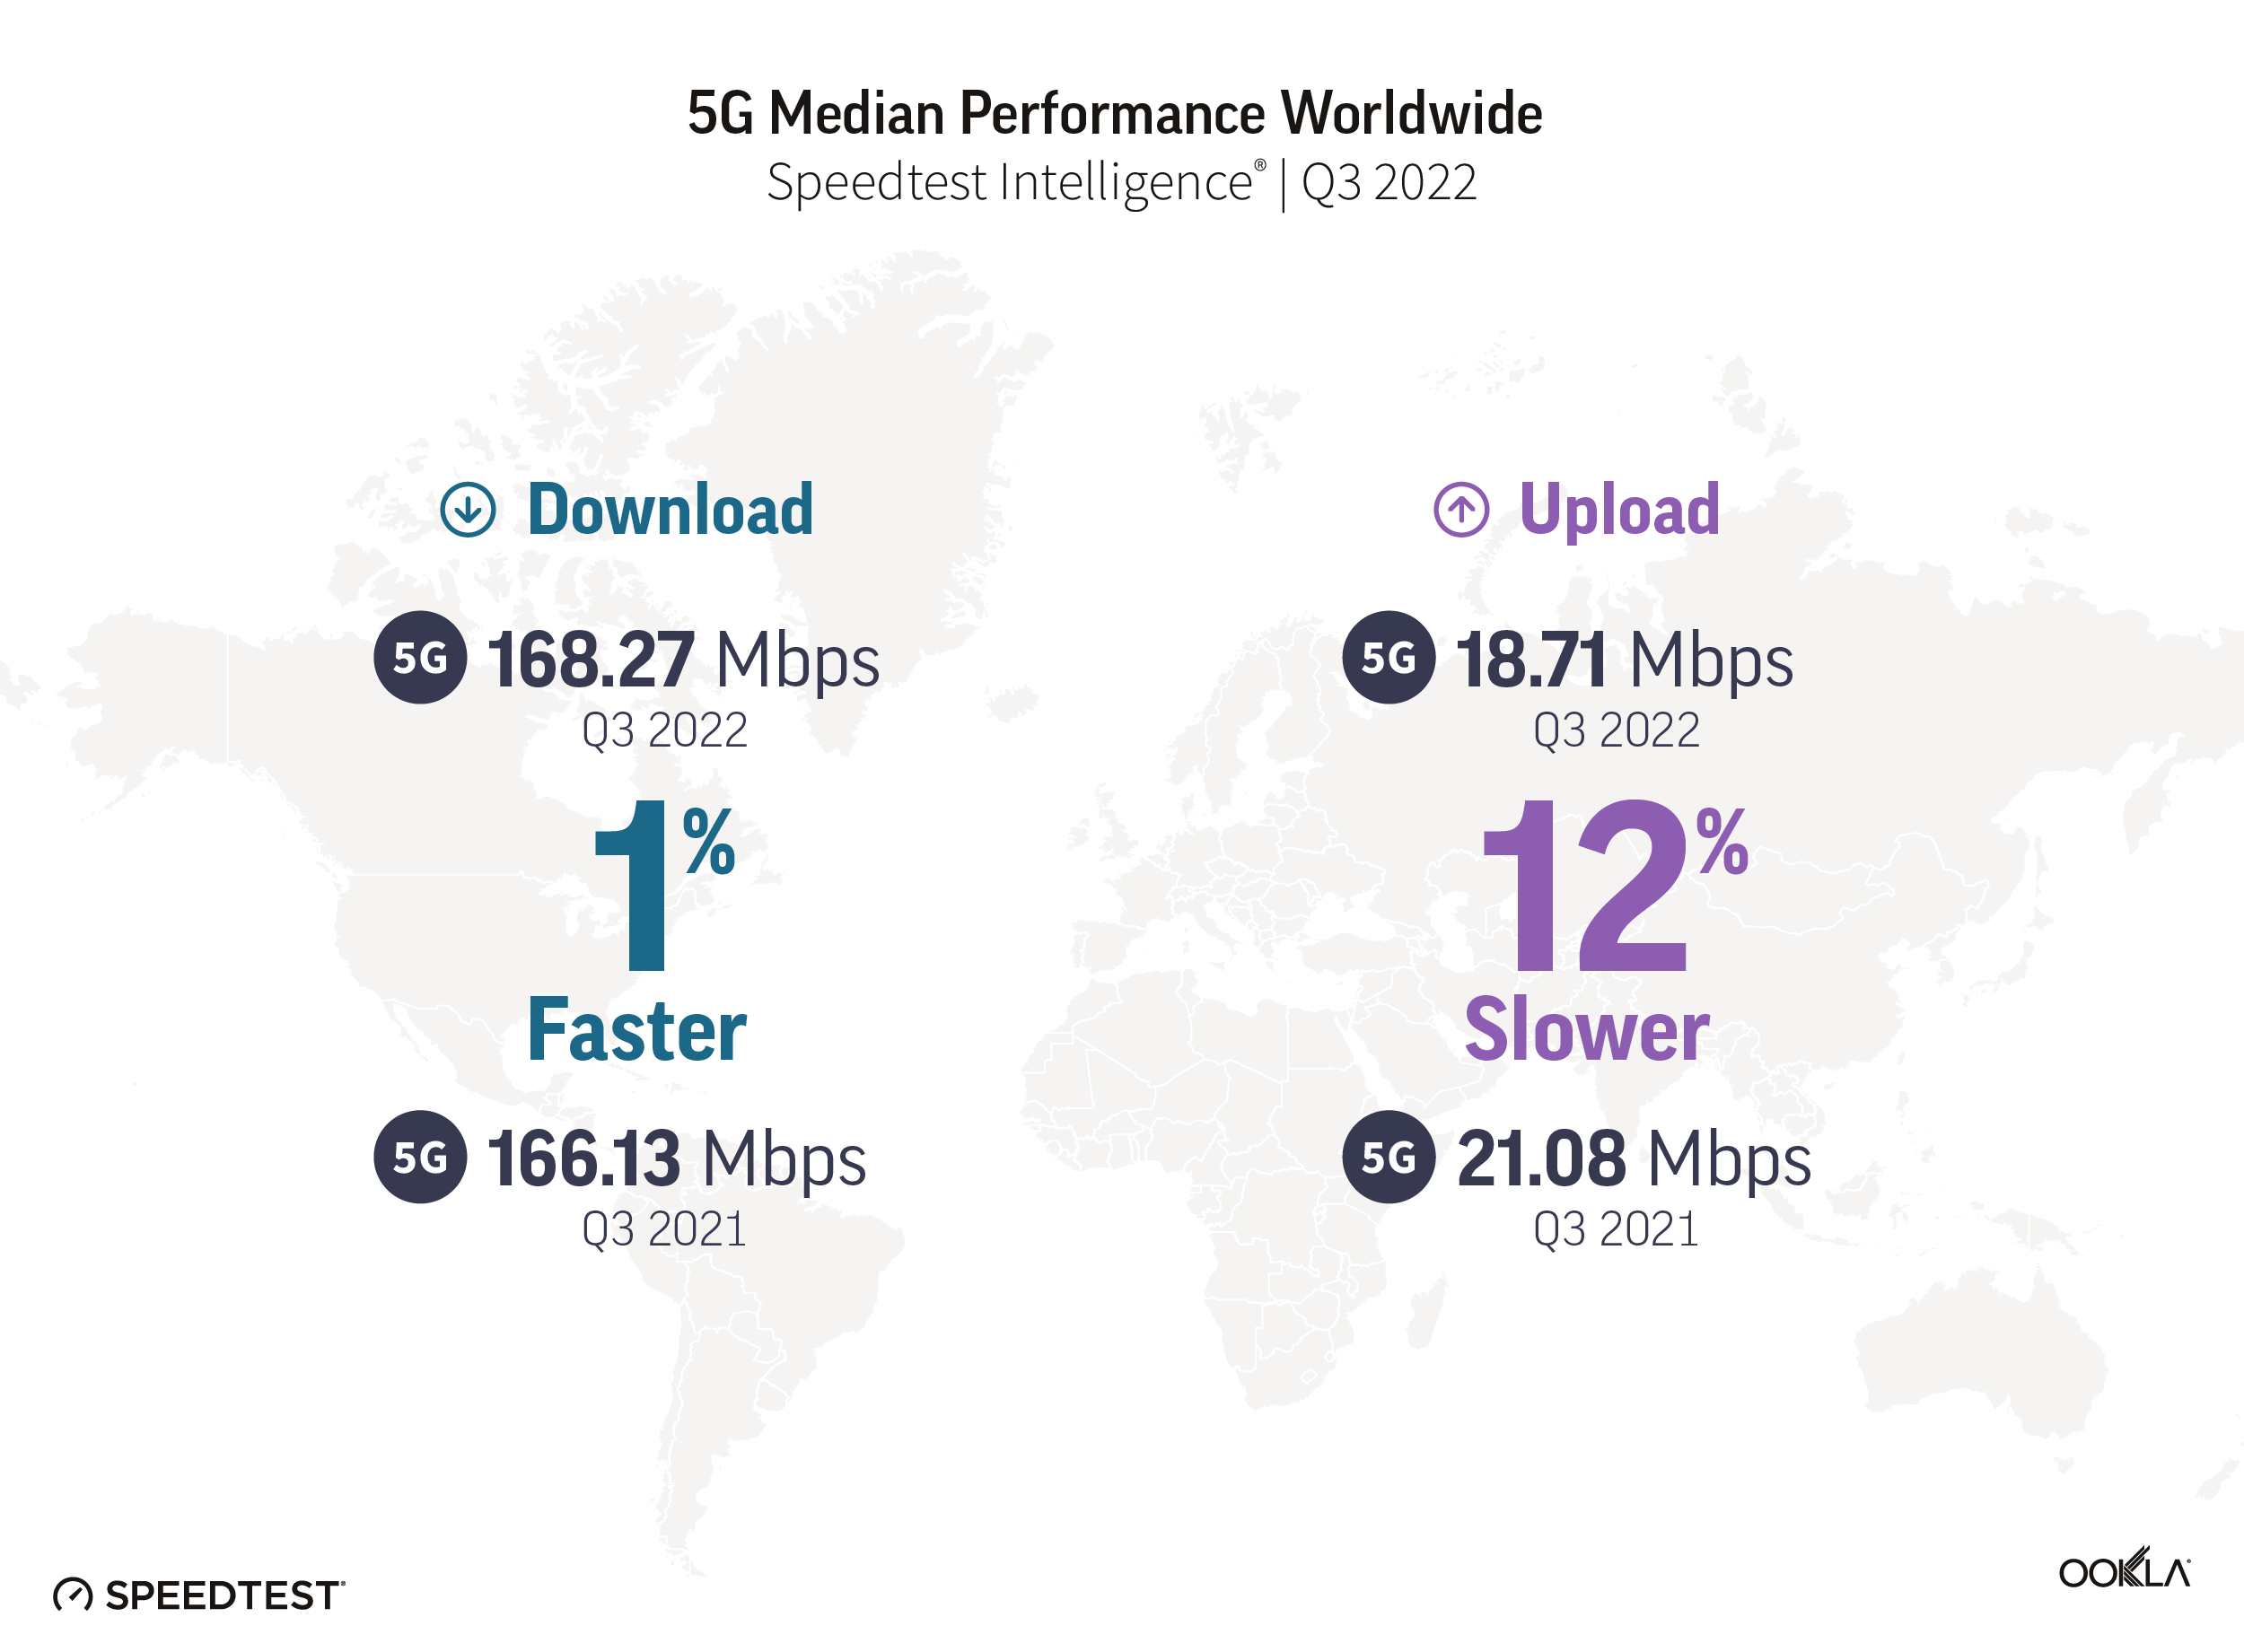
In 2021, we discussed how an expansion of 5G access led to a decline in overall speed at the global level. This year showed a stabilization in overall speed, even as 5G access broadened, with a median global 5G download speed of 168.27 Mbps in Q3 2022 as compared to 166.13 Mbps in Q3 2021. Median upload speed over 5G slowed slightly to 18.71 Mbps (from 21.08 Mbps) during the same period. According to the Ookla® 5G Map™, there were 127,509 5G deployments in 128 countries as of November 30, 2022, compared to 85,602 in 112 countries the year prior.

South Korea and the United Arab Emirates led countries for 5G speeds

Chart of fastest countries for median 5G download speed

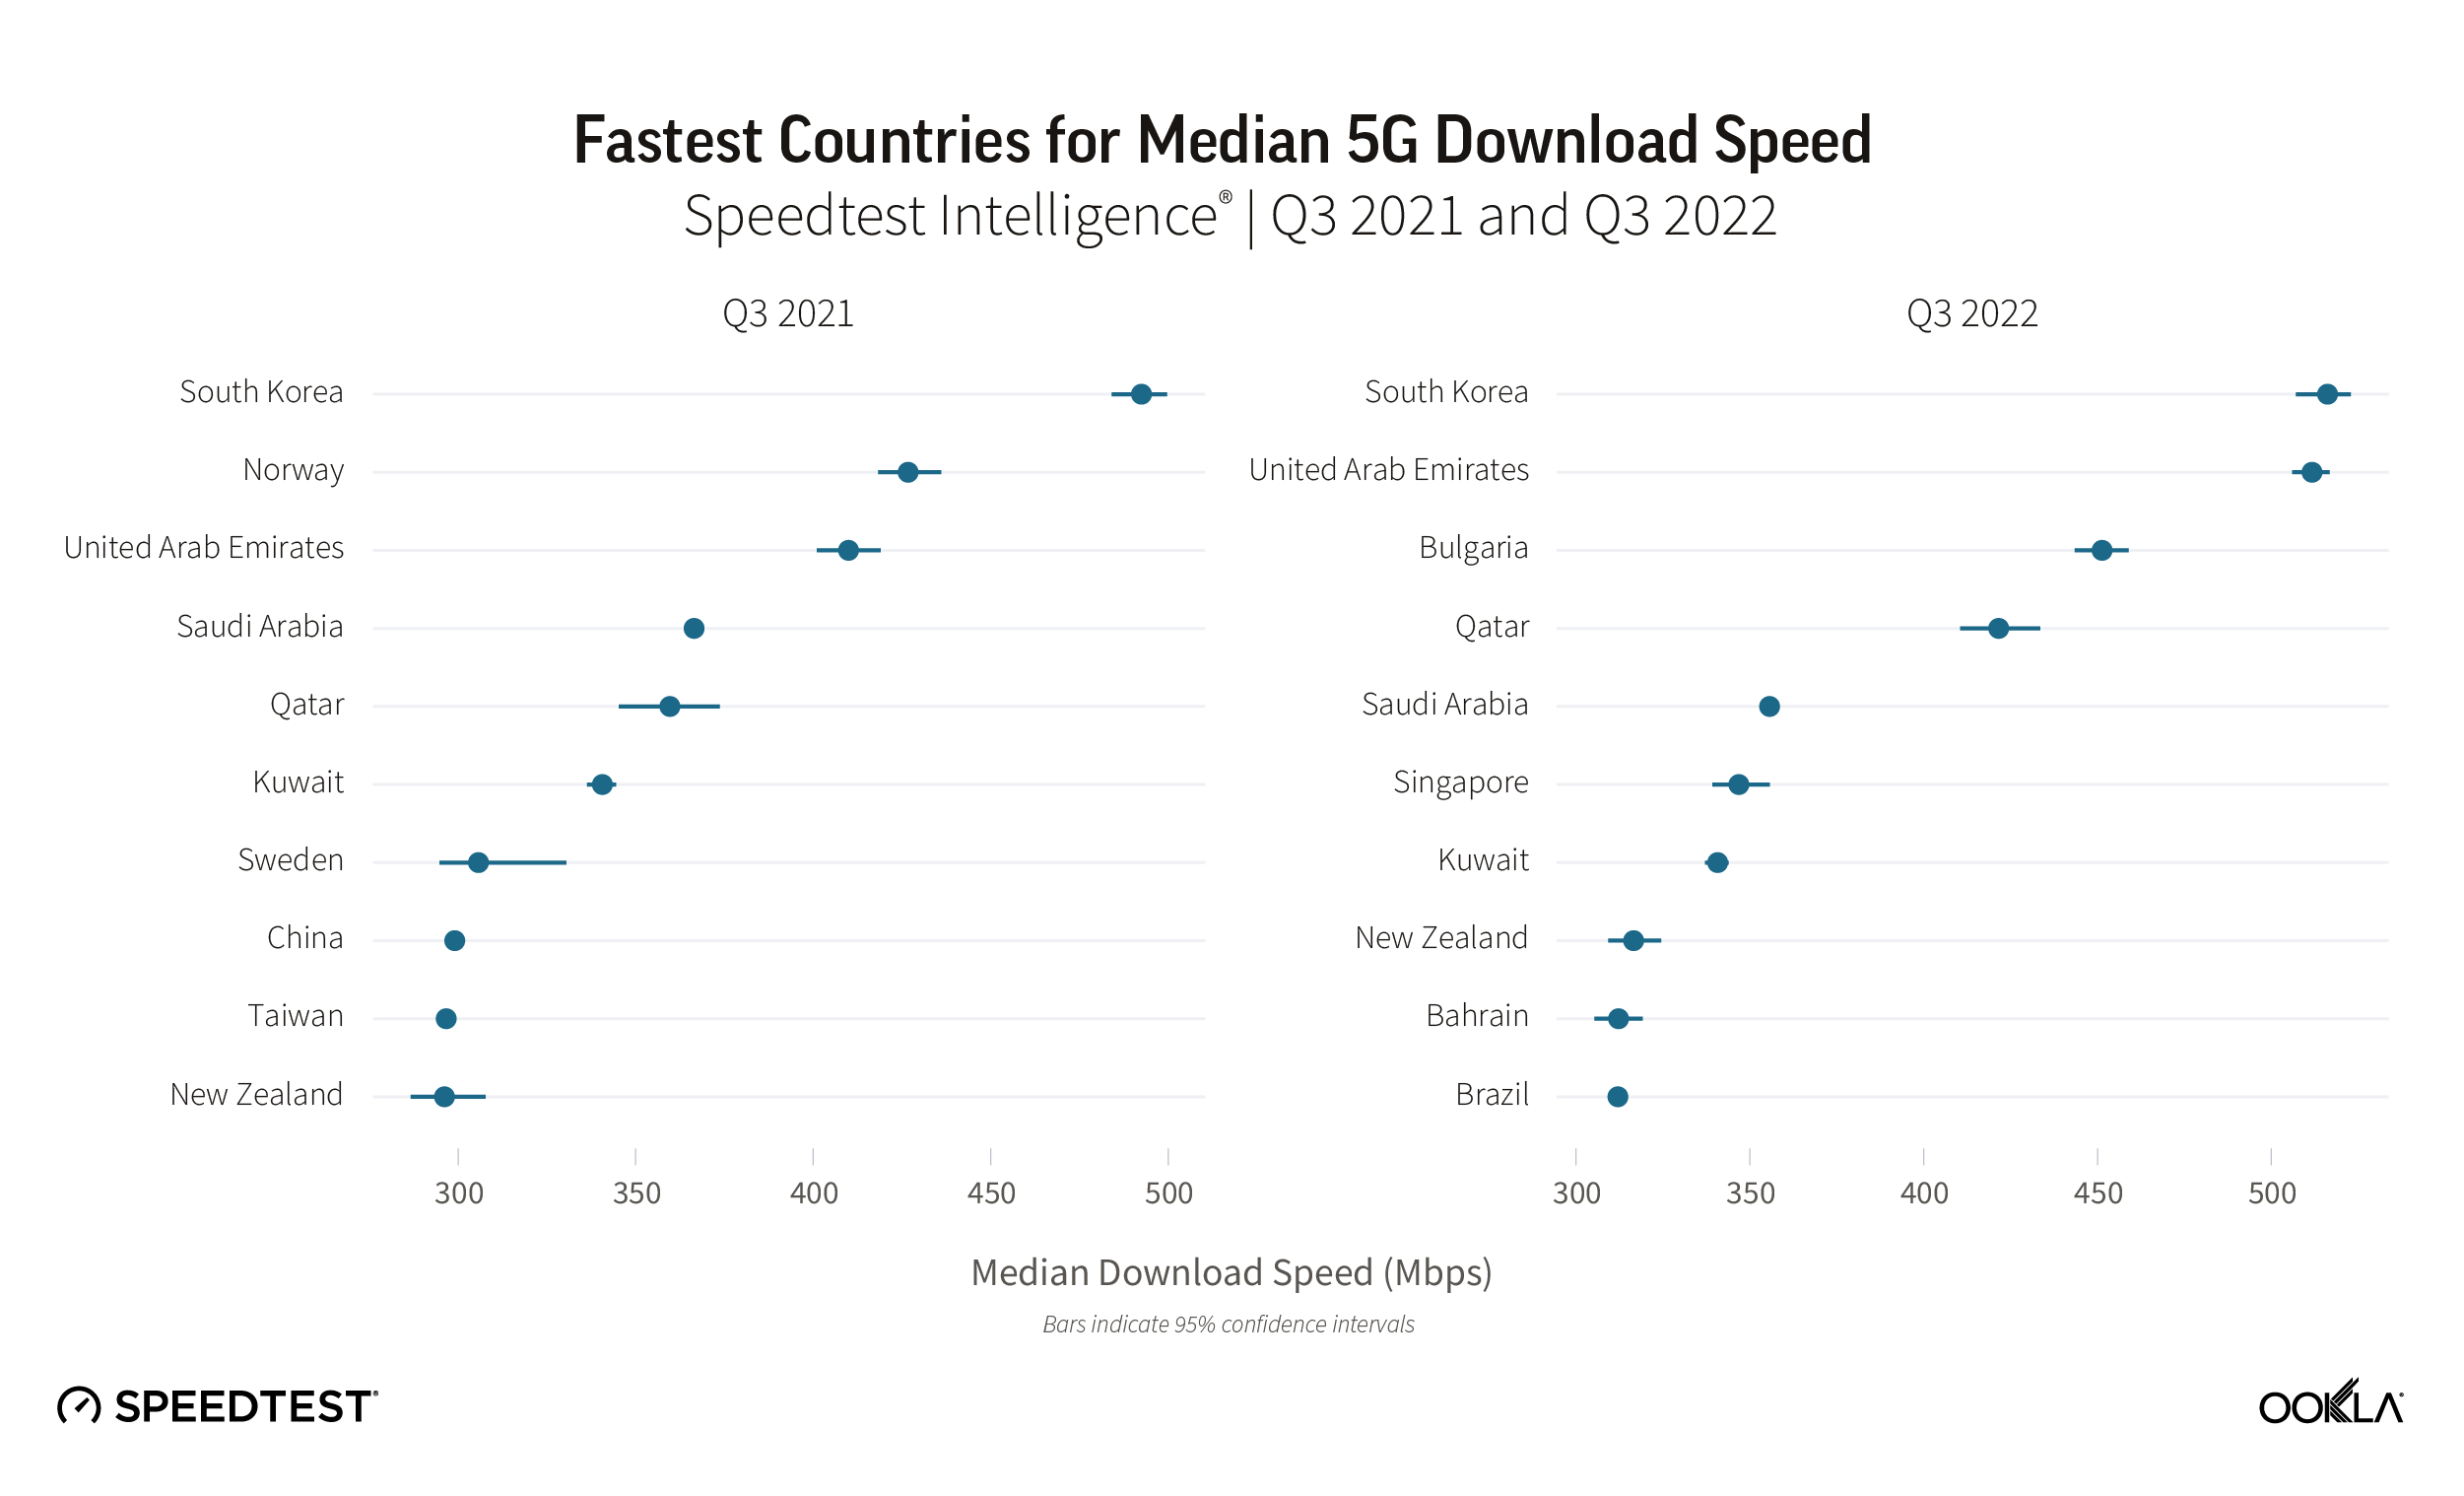
South Korea and the U.A.E. had the fastest median download speed over 5G at 516.15 Mbps and 511.70 Mbps, respectively, during Q3 2022, leading a top 10 list that included Bulgaria, Qatar, Saudi Arabia, Singapore, Kuwait, New Zealand, Bahrain, and Brazil. Bulgaria, Singapore, Bahrain, and Brazil were new to the top 10 in 2022, while Norway, Sweden, China, and Taiwan fell out of the top 10.

Satellite became more accessible but performance slowed

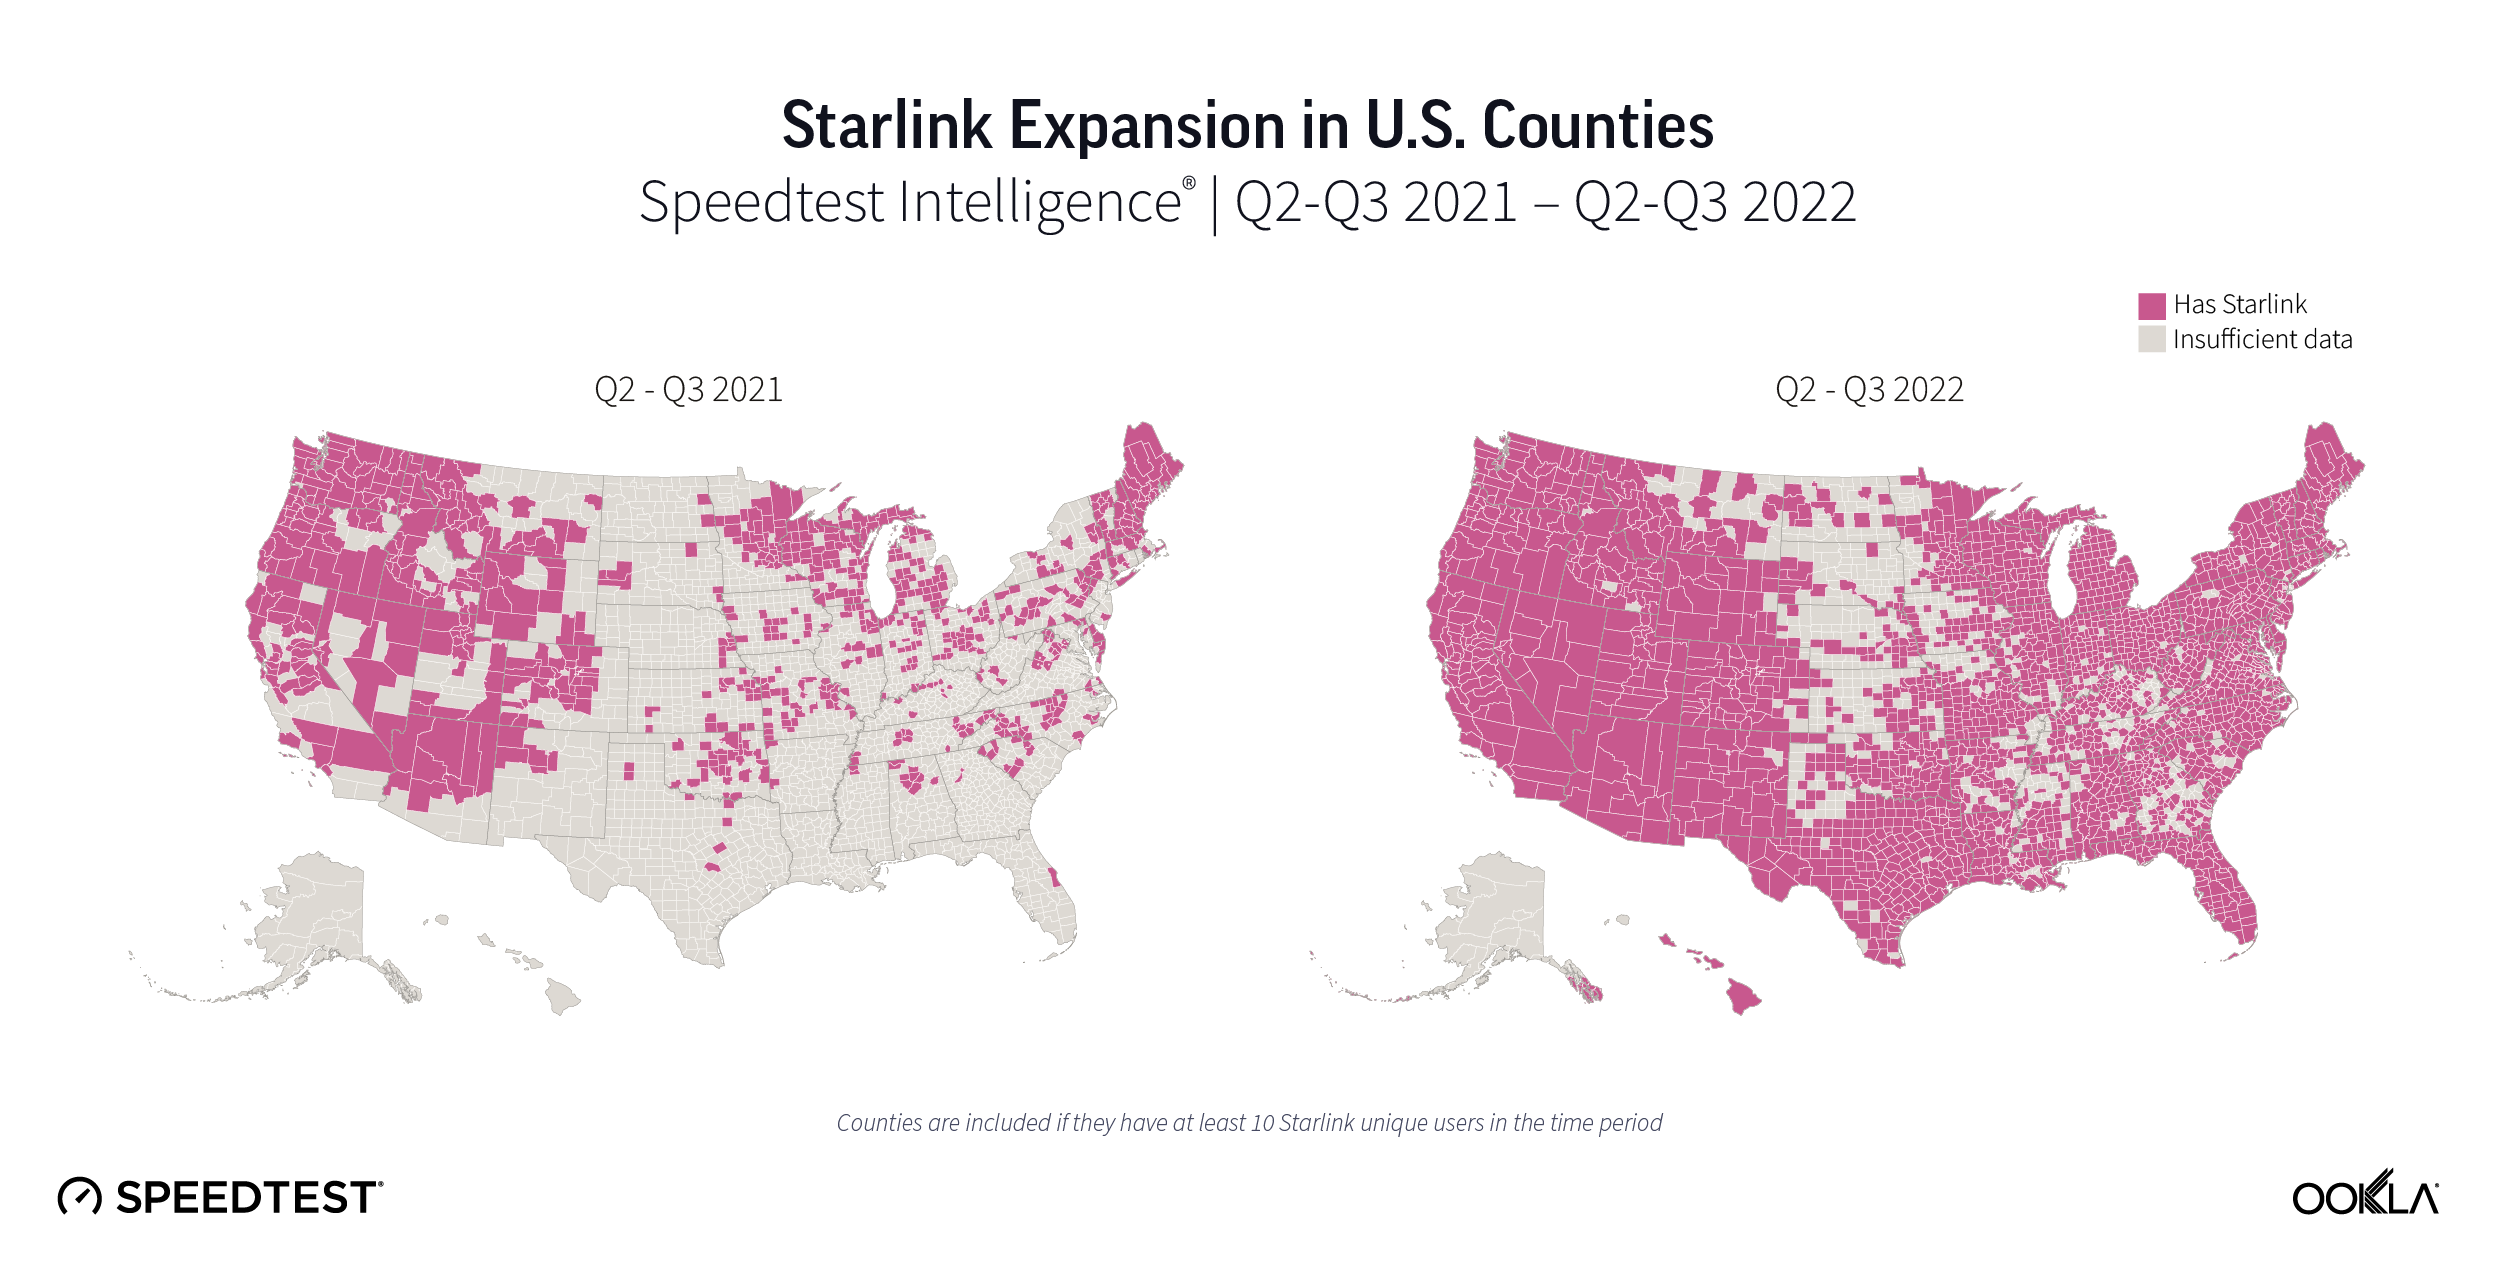
2022 saw a proliferation of fast, low-earth orbit (LEO) satellite internet from Starlink across the world. Q1 2022 saw Starlink speeds increase year over year in Canada and the U.S., with Starlink in Mexico having the fastest satellite internet in North America, Starlink in Lithuania the fastest in Europe, Starlink in Chile the fastest in South America, and Starlink in Australia the fastest in Oceania.

Q2 2022 saw Starlink speeds decrease in Canada, France, Germany, New Zealand, the U.K., and the U.S. from Q1 2022 as Starlink crossed the 400,000 user threshold across the world. Starlink in Puerto Rico debuted as the fastest satellite provider in North America. Starlink outperformed fixed broadband averages in 16 European countries. Starlink in Brazil had the fastest satellite speeds in South America. And Starlink in New Zealand was the fastest satellite provider in Oceania.

During Q3 2022, Starlink performance dipped once again from Q2 2022 in Canada and the U.S., while remaining about the same in Chile. Starlink in Puerto Rico and the U.S. Virgin Islands had the fastest satellite speeds in North America, while Starlink in Brazil again was the fastest satellite provider in South America.

With Viasat, HughesNet, and Project Kuiper set to launch huge LEO constellations in 2023, consumers around the world are poised to have more fast satellite internet options, particularly as the European Commission makes its own play for a constellation and Eutelsat and OneWeb potentially merging.

5G Availability points to on-going challenges

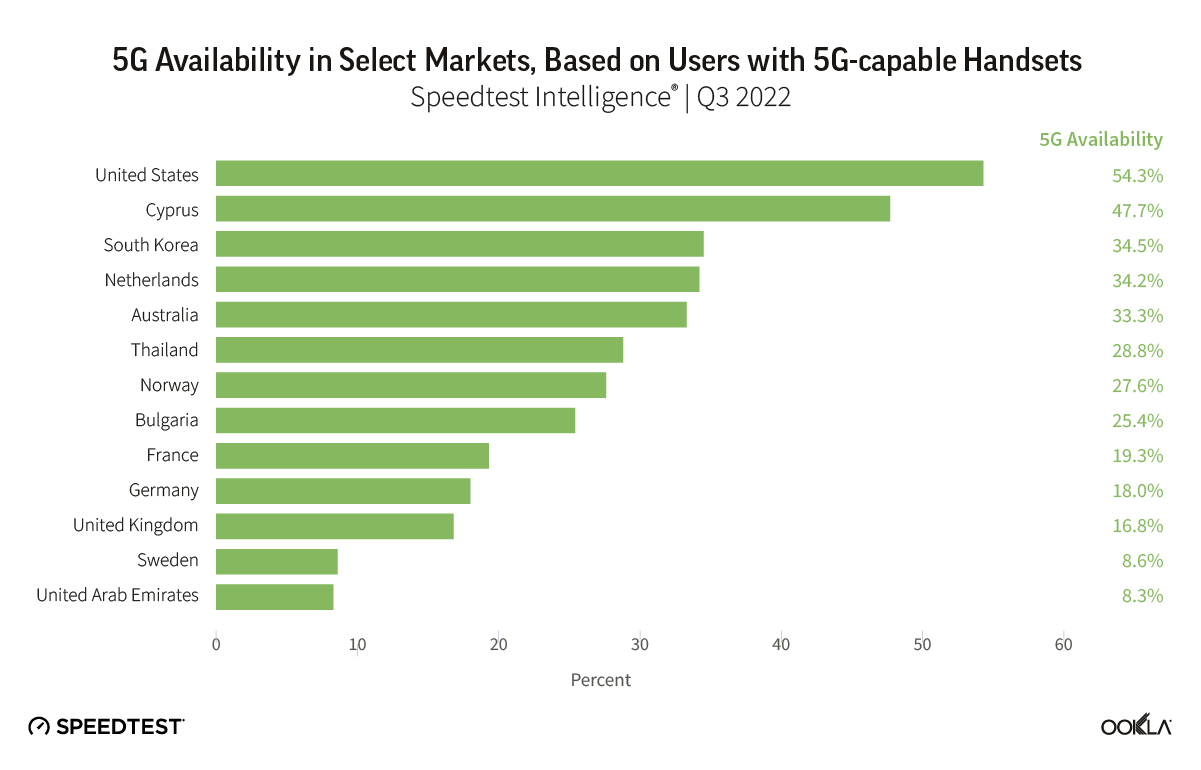
5G Availability measures the proportion of Speedtest users with 5G-capable handsets, who spend a majority of time connected to 5G networks. It’s therefore a function of 5G coverage and adoption. We see wide disparity in 5G Availability among markets worldwide, with for example the U.S. recording 54.3% in Q3 2022, well ahead of markets such as Sweden and the U.A.E., with 8.6% and 8.3% respectively.

Chart of 5G availability in select markets, based on users with 5G-capable handsets

Critical levers for mobile operators to increase 5G Availability include:

  • Increasing 5G coverage by deploying additional base stations
  • Obtaining access to, or refarming, sub-GHz spectrum, to help broaden 5G coverage, as sub-GHz spectrum has superior propagation properties than that of higher frequency spectrum bands.
  • Encouraging 5G adoption among users with 5G-capable handsets.

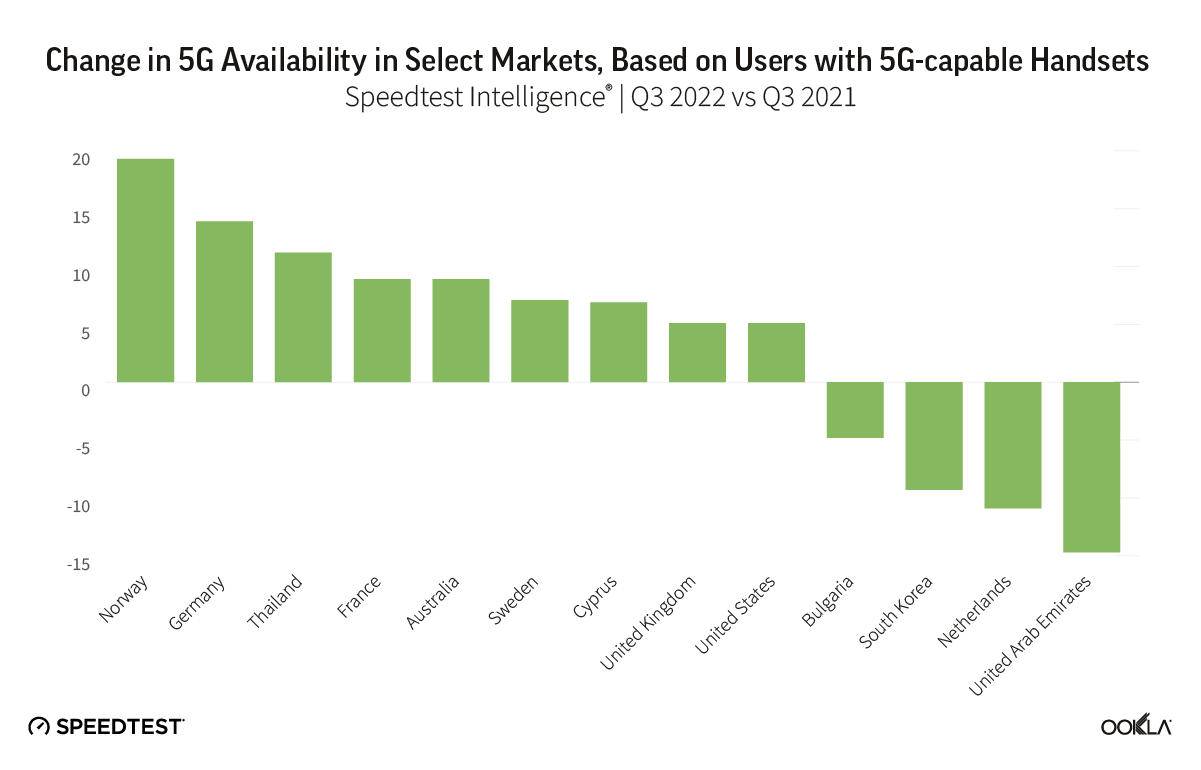
Speedtest Intelligence points to 5G adoption challenges in some markets, with 5G Availability dropping in Bulgaria, South Korea, the Netherlands, and the U.A.E. As more users acquire 5G-capable devices, operators need to balance their pricing models to ensure users have sufficient incentives to purchase a 5G tariff.

Chart of percentage change in 5G availability in select markets, based on users with 5G-capable handsets

Where 5G continues to fail to reach

Speedtest Intelligence showed 29 countries in the world where more than 20% of samples were from 2G and 3G connections (combined) during Q3 2022 and met our statistical threshold to be included (down from 70 in Q3 2021). These are mostly countries where 5G is still aspirational for a majority of the population, which is being left behind technologically, having to rely on decades-old technologies that are only sufficient for basic voice and texting, social media, and navigation apps. We’re glad to see so many countries fall off this list, but having so many consumers on 2G and 3G also prevents mobile operators from making 4G and 5G networks more efficient. If operators and regulators are able to work to upgrade their users to 4G and higher, everyone will benefit.

Countries That Still Rely Heavily on 2G and 3G Connections
Speedtest IntelligenceⓇ | Q3 2021
Country 2G & 3G Samples
Central African Republic 76.2%
Turkmenistan 58.5%
Kiribati 51.6%
Micronesia 47.4%
Rwanda 41.1%
Belarus 39.7%
Equatorial Guinea 37.7%
Afghanistan 36.7%
Palestine 33.5%
Madagascar 27.5%
Sudan 27.4%
Lesotho 26.5%
South Sudan 26.3%
Benin 26.0%
Guinea 25.5%
Cape Verde 24.3%
Tonga 24.3%
Syria 23.4%
The Gambia 23.4%
Ghana 23.3%
Palau 22.9%
Niger 22.8%
Tajikistan 22.7%
Mozambique 22.4%
Guyana 21.8%
Togo 21.8%
Congo 21.1%
Moldova 20.8%
Saint Kitts and Nevis 20.0%

We were pleased to see the following countries come off the list from last year, having dropped below the 20% threshold: Algeria, Angola, Anguilla, Antigua and Barbuda, Armenia, Barbados, Bosnia and Herzegovina, Botswana, Burundi, Caribbean Netherlands, Cook Islands, Dominica, Ecuador, El Salvador, Ethiopia, Gabon, Grenada, Haiti, Honduras, Jamaica, Liberia, Mauritania, Namibia, Nigeria, Papua New Guinea, Saint Lucia, Saint Vincent and the Grenadines, Sierra Leone, Solomon Islands, Somalia, Suriname, Swaziland, Tanzania, Trinidad and Tobago, Uganda, Ukraine, Uzbekistan, Vanuatu, Venezuela, Yemen, Zambia, and Zimbabwe. While countries like Belarus, Cape Verde, Central African Republic, Guinea, Guyana, Madagascar, Palestine, Rwanda, South Sudan, Tajikistan, Togo, and Turkmenistan are still on this list, they have improved the percentage of their samples on these outmoded technologies when compared to last year by at least 10 points. Palestine improved by more than 50 points. 2G and 3G samples in Kiribati increased 3.2 points when comparing Q3 2022 to Q3 2021.

We’re glad to see performance levels normalize as 5G expands to more and more countries and access improves and we are optimistic that 2023 will bring further improvements. Keep track of how well your country is performing on Ookla’s Speedtest Global Index™ or track performance in thousands of cities worldwide with the Speedtest Performance Directory™.

Ookla retains ownership of this article including all of the intellectual property rights, data, content graphs and analysis. This article may not be quoted, reproduced, distributed or published for any commercial purpose without prior consent. Members of the press and others using the findings in this article for non-commercial purposes are welcome to publicly share and link to report information with attribution to Ookla.

| December 19, 2023

The State of Worldwide Connectivity in 2023

To gain insight into the current performance of networks, we analyzed Speedtest® data in Q3 2023. Our analysis compares changes in 5G performance to the previous year, identifies the top 10 countries with the best performance, and discusses customer satisfaction with 5G. We also ranked countries based on the performance of their fixed networks and investigated the connectivity gap across the world.

5G | Fixed | Connectivity for All

Key takeaways 

  • Global 5G download speed improved. The median global 5G download speed experienced a substantial 20% increase in Q3 2023, reaching 203.04 Mbps, compared to 168.27 Mbps in Q3 2022. This improvement aligns with a significant rise in global 5G subscriptions, indicating positive progress in user adoption of 5G and the performance of 5G networks. 
  • Top 5G performers have shifted. The top 10 countries for 5G performance witnessed notable changes, with the United Arab Emirates claiming the top spot, surpassing South Korea. Malaysia, India, and the Dominican Republic also made significant strides, showcasing a dynamic shift in the global 5G landscape.
  • Speedtest user ratings indicate room for 5G improvement. Despite advancements in 5G technology, there has been a decline in the Net Promoter Score (NPS) among 5G users. Factors contributing to this dissatisfaction could include unmet expectations and discrepancies between actual 5G speeds and advertised speeds.
  • Fixed Networks Advancements. On a global scale, fixed networks demonstrated significant performance improvement, with a 19% increase in median download speed (83.95 Mbps) and a 28% increase in upload speed (38.32 Mbps) in Q3 2023 compared to the previous year. This highlights the ongoing transition to more advanced broadband technologies, particularly Fiber-to-the-Home (FTTH).
  • The imperative of closing the connectivity gaps. Despite improvements in global connectivity, there are still areas that fall outside of network coverage. Speedtest® data highlights disparities in internet performance between fixed and mobile networks across different regions, emphasizing the importance of addressing connectivity challenges worldwide.

5G Networks

Global 5G download speed improvements
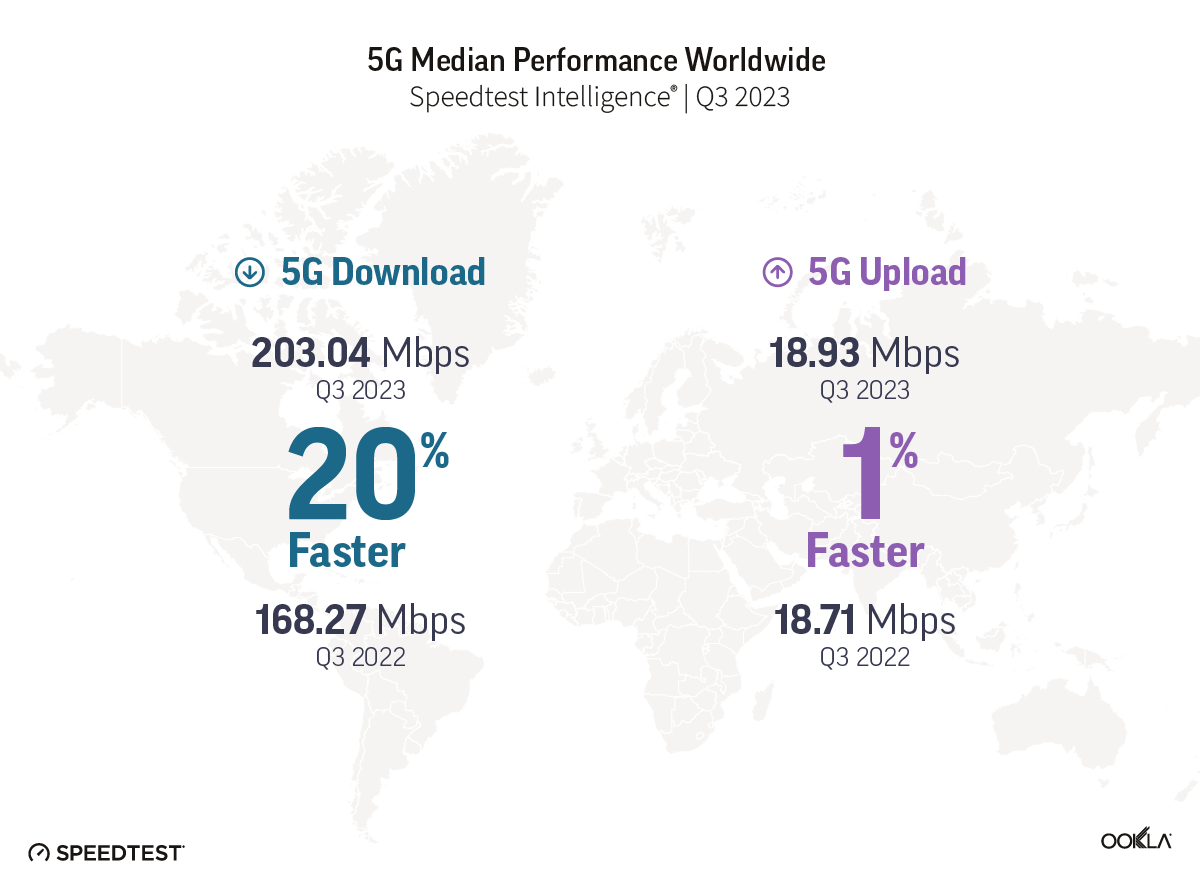
Illustration of 5G Median Performance Worldwide

The median global 5G download speed has experienced a noteworthy surge, registering a 20% increase and reaching 203.04 Mbps in Q3 2023, compared to 168.27 Mbps in Q3 2022, according to Speedtest Intelligence® data. This improvement coincides with a substantial rise in global 5G connections, reaching 1.4 billion according to GSMA Intelligence, representing a 65% year-on-year increase from 872 million a year ago. 

In terms of upload speed and latency, only a very modest improvement of 1% occurred. Median 5G upload speeds reached 18.93 Mbps in Q3 2023, compared to 18.71 Mbps in the same period last year; multi-server latency, a critical metric for network responsiveness, improved from 45 ms in Q3 2022 to 44 ms in Q3 2023. 

Speedtest users experiencing the top 10% of 5G download speeds globally have seen a 9% increase, rising from 525.54 Mbps in Q3 2022 to 573.12 Mbps in Q3 2023. However, speeds have not yet reached Gigabit levels, primarly because of network economics. 5G was originally designed to deliver peak data rates of up to 20 Gbps based on IMT-2020 requirements, but we are still a ways off before gigabit speeds become the new normal. For instance, symmetrical download, upload speeds, and ultra-low latency haven’t been realized, partially because the vast majority of 5G networks are not ‘true 5G’ as they have been deployed in Non-Standalone (NSA) mode, meaning they rely on a 4G LTE network core. According to GSA, over 40 operators have launched 5G standalone (SA) in public networks, but the rollout is not yet complete. Nevertheless, the industry is actively exploring the prospect of 5G Advanced, which promises symmetrical upload and download speeds and ultra-low latency, signaling a proactive stance ahead of the eventual transition to 6G.

Malaysia joined South Korea and the U.A.E at 5G speeds podium
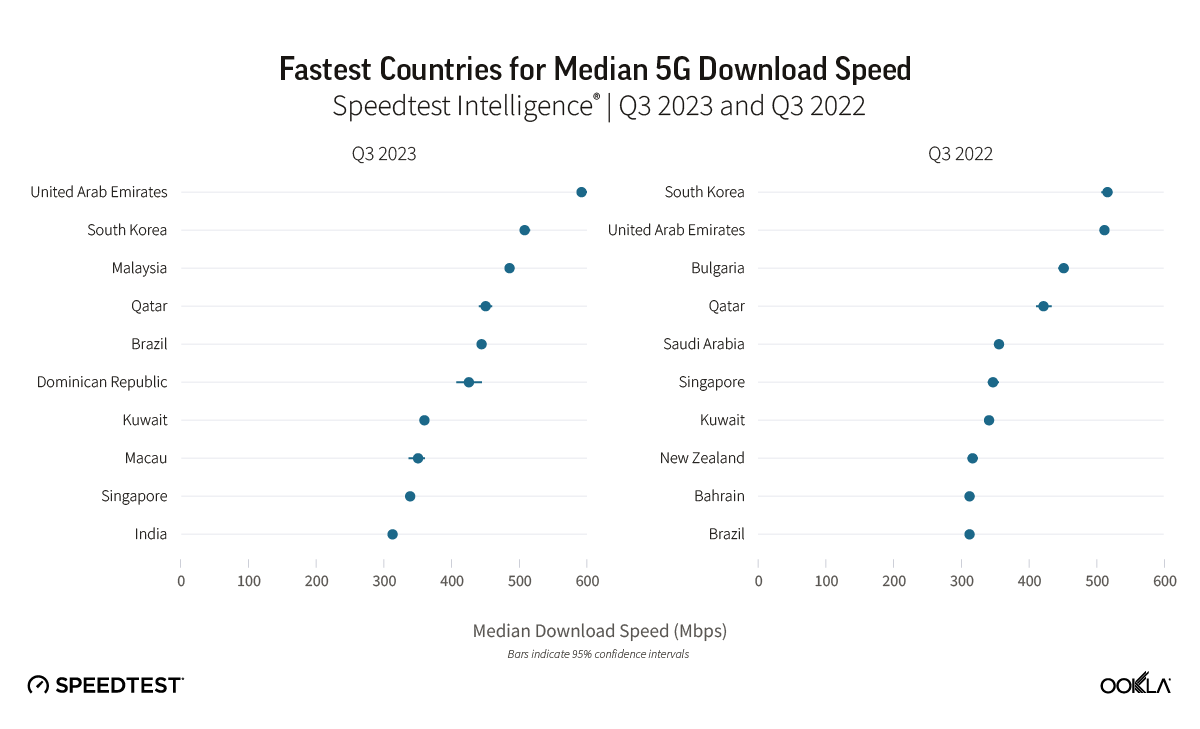
Chart of Fastest Countries for Median 5G Download Speed

During Q3 2023, the United Arab Emirates and South Korea stood out as leaders in 5G performance, boasting the fastest median 5G download speeds globally at 592.01 Mbps and 507.59 Mbps, respectively. Our top 10 list also includes Malaysia, Qatar, Brazil, the Dominican Republic, Kuwait, Macau, Singapore, and India. The shift in the top 10 rankings reveals dynamic changes, with Malaysia, the Dominican Republic, and India making significant strides, while Bulgaria, Saudi Arabia, New Zealand, and Bahrain dropped out of the rankings.

The U.A.E showcased a 14% increase in its median 5G download speed, reaching 592.01 Mbps in Q3 2023, up from 511.68 Mbps in Q3 2022, allowing the U.A.E to take the top spot from South Korea. Key factors contributing to the U.A.E.’s 5G leadership include fierce market competition driven by Etisalat and du, resulting in extensive 5G coverage and widespread access to 5G services. Additionally, the allocation of a 100 MHz of contiguous spectrum, as discussed in our 5G spectrum article, has played a pivotal role in achieving faster speeds, lower latency, and improved spectral efficiency.

The regional shift in 5G performance leadership is noteworthy. In 2022, half of the top 10 countries were from the Middle East, while in 2023, the same proportion hailed from the Asia Pacific region. Our analysis suggests that early adopters in the Asia Pacific region have outperformed major European markets in 5G performance, due to factors such as early spectrum availability and supportive government policies.

Malaysia’s remarkable achievement in reaching the third spot globally for 5G download speed, with a reported speed of 485.24 Mbps in Q3 2023, is particularly noteworthy. Despite launching its nationwide 5G network less than two years ago, Malaysia’s unconventional deployment strategy has proven effective. India has also made a significant leap, with its median 5G download speed of 312.26 Mbps allowing India to reach the top 10 worldwide. The country’s climb of 72 places on the Speedtest Global Index™ between September 2022 and August 2023 is primarily credited to the launch of 5G. Following a 5G spectrum auction in India, operators have successfully addressed network congestion issues by offloading 4G traffic onto 5G networks.

In Brazil, 5G download speed increased 1.4 times, jumping from 312.09 Mbps in Q3 2022 to 443.93 Mbps in Q3 2023. Before Brazil’s 5G spectrum auction, operators had offered 5G using DSS since July 2020. While DSS can provide broad 5G coverage, its speeds are often similar to those on 4G LTE networks. In November of 2021, however, Brazil’s multi-band 5G spectrum auction closed, which not only generated BRL47.2 billion ($8.5 billion) in total commitments, but it also allowed operators to deliver much faster speeds on dedicated 5G spectrum compared to DSS. National operators – Telefonica Brasil (Vivo), Claro Brazil, and TIM Brazil – ended up with 40 MHz or 50 MHz in the 2.3 GHz spectrum band and 100 MHz each in the 3.5 GHz band. The subsequent simultaneous activation of 5G networks in July 2022 marked a transformative moment with the continuous expansion of 5G services to 623 municipalities by December 2023. An upcoming spectrum auction expects to improve Brazil’s 5G standing even further.

The Dominican Republic’s entry into the top 10 fastest 5G countries was marked by its official launch of 5G services in December 2021, making it the first Caribbean nation and the third in Latin America to adopt a 5G network.

Disparity Between 5G Performance and Consumer Perception

The Net Promoter Score (NPS) is a tool that gauges customer loyalty and satisfaction. At the end of Speetest, users may be asked to answer “How likely is it that you would recommend [provider] to a friend or colleague?” on a scale from 0-10. Net Promoter Scores are applied to both users and providers. Users are categorized into Detractors (score 0-6), Passives (score 7-8), and Promoters (score 9-10). NPS is the percent of Promoters minus the percent of Detractors and is displayed in the range from -100 to 100. Providers are ranked in descending order of NPS. NPS categorizes users into Detractors (those that score 0-6), Passives (scores between 7 and 8), and Promoters (scores of 9-10). NPS represents the percentage of Promoters minus the percent of Detractors displayed in the range from -100 to 100. 

In our article discussing whether 5G was meeting customer expectations, we found that 5G users typically rate their network operator with NPS scores universally higher than those for 4G LTE users. In Q3 2023, that trend continued, as 5G  users that were on 5G network when answering the NPS question still scored higher than those on 4G across all markets analyzed. It isn’t surprising given that at a global level, 5G had a 637% better median download speed than 4G and a 130% better median upload speed. 
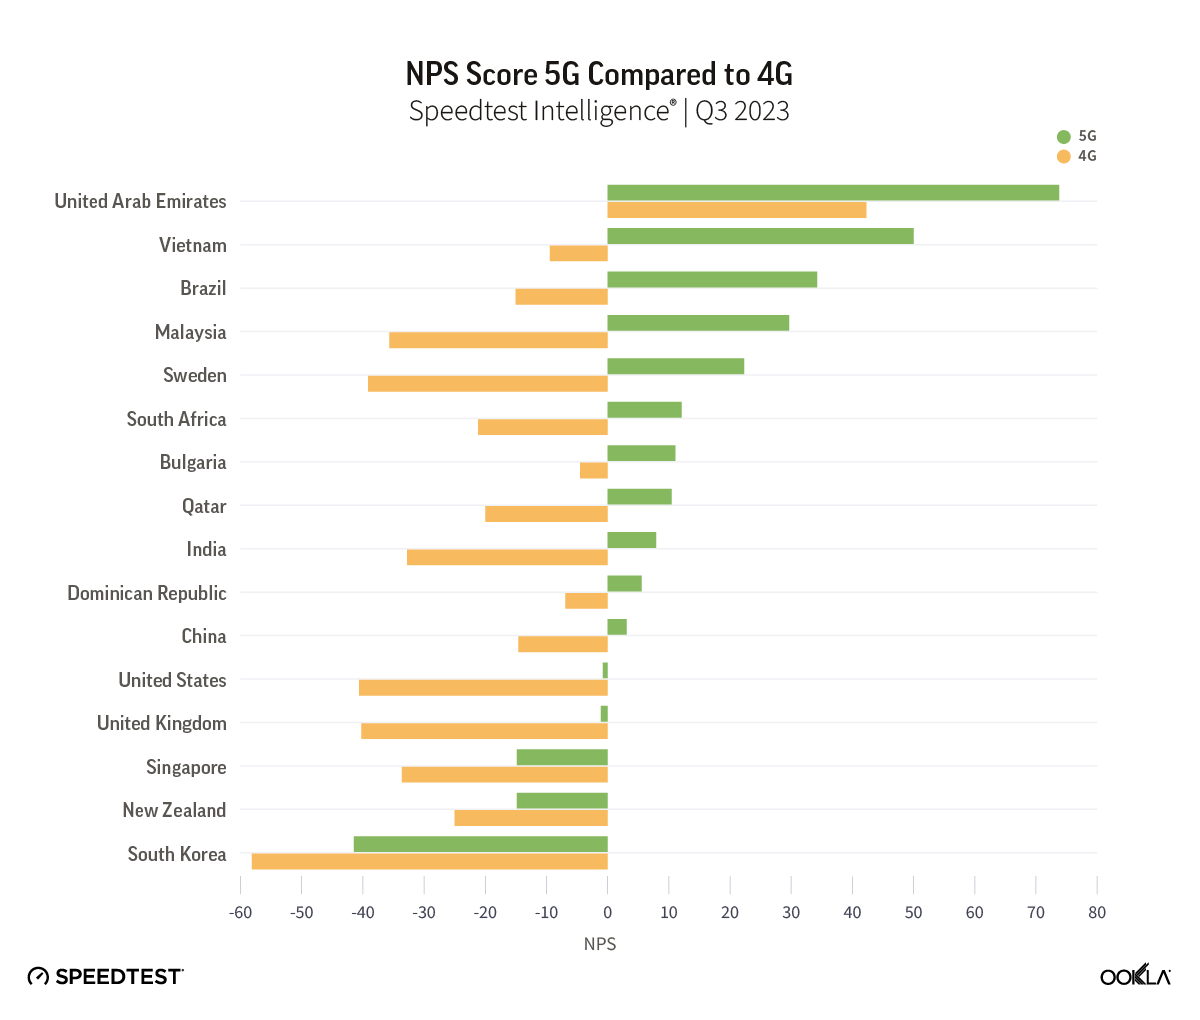
Chart of NPS Score, 5G Compared to 4G

While 5G NPS still outpaces scores on 4G, our data shows that 5G NPS has been decreasing annually. This could point to the fact that excitement about 5G as a new technology is waning as users become used to faster speeds, or as customers await new use cases that can take advantage of the faster speeds that 5G can provide. After all, we are still waiting for that killer app for 5G, the way the video and streaming were for 4G. 

While it is difficult to fully explain the reasons behind the 5G NPS decrease without further research, we can clearly see that network performance isn’t the only factor at play influencing NPS declines. Others can include customer care, pricing, and other services. For example, in South Korea, one of the first countries to launch 5G with one of the world’s fastest speeds, consumers scored 5G networks -41.47 in Q3 2023 compared to -20.51 in Q3 2022. 

In March 2021, South Korean consumers launched a class action suit against operators because they felt they were being misled by the promises of 5G in the country. Recently, South Korea’s antitrust regulator fined three 5G operators a total of 33.6 billion won ($25.06 million) for making exaggerated claims about the level of performance their networks could achieve. South Korean operators claimed consumers could experience theoretical 5G speeds, which are not practically achievable in a “real world” environment, as factors such as spectrum usage, network densification, user location, and device capability significantly affect actual performance. Our data shows that the top 10% of 5G users in South Korea experienced speeds of 1.004 Gbps in Q3 2023, which, although impressive, are far lower than the advertised 20 Gbps speeds. 
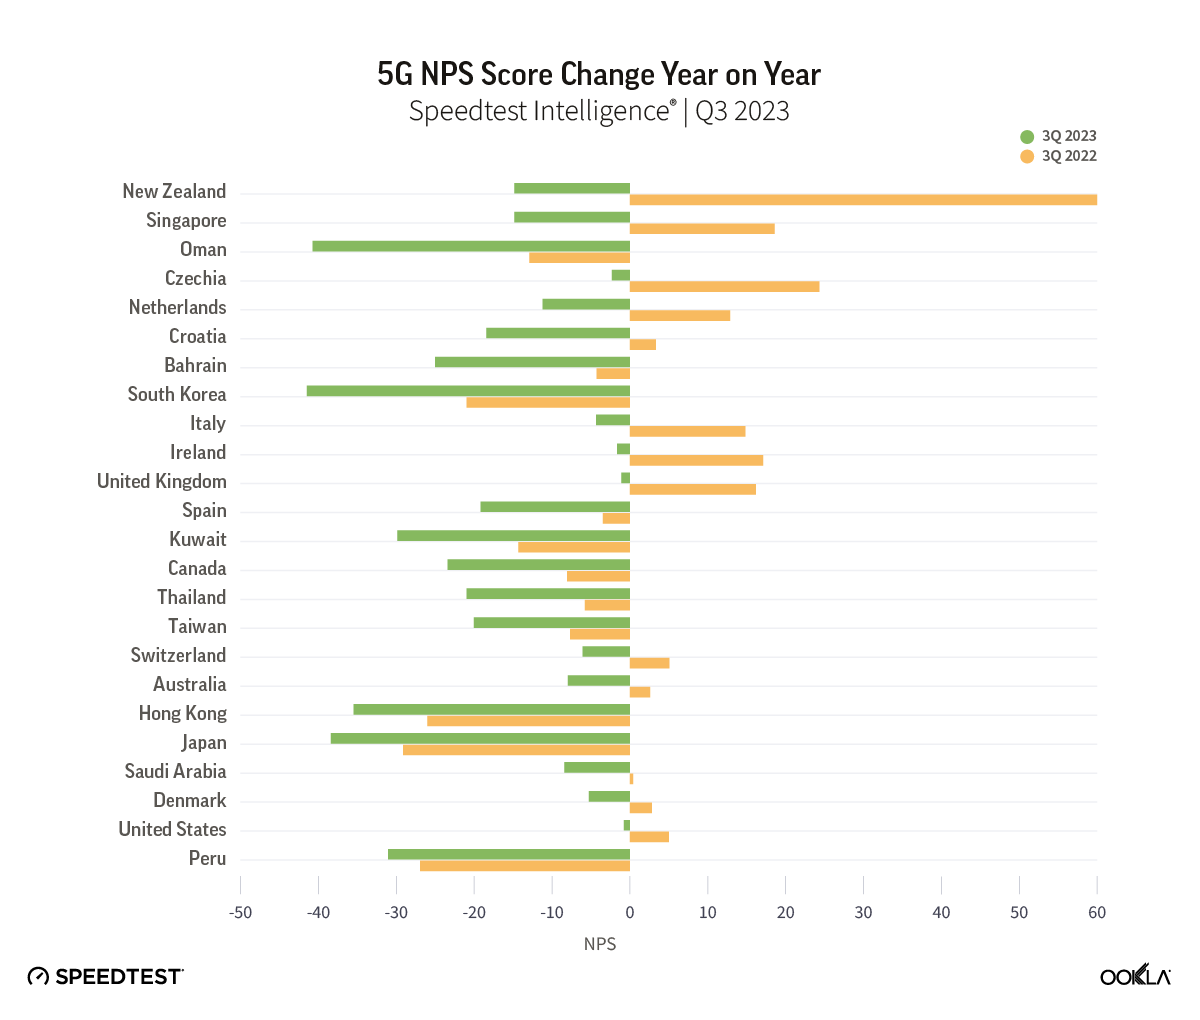
Chart of 5G NPS Score Change Year on Year

Fixed Networks

Fiber driving fixed performance gains 
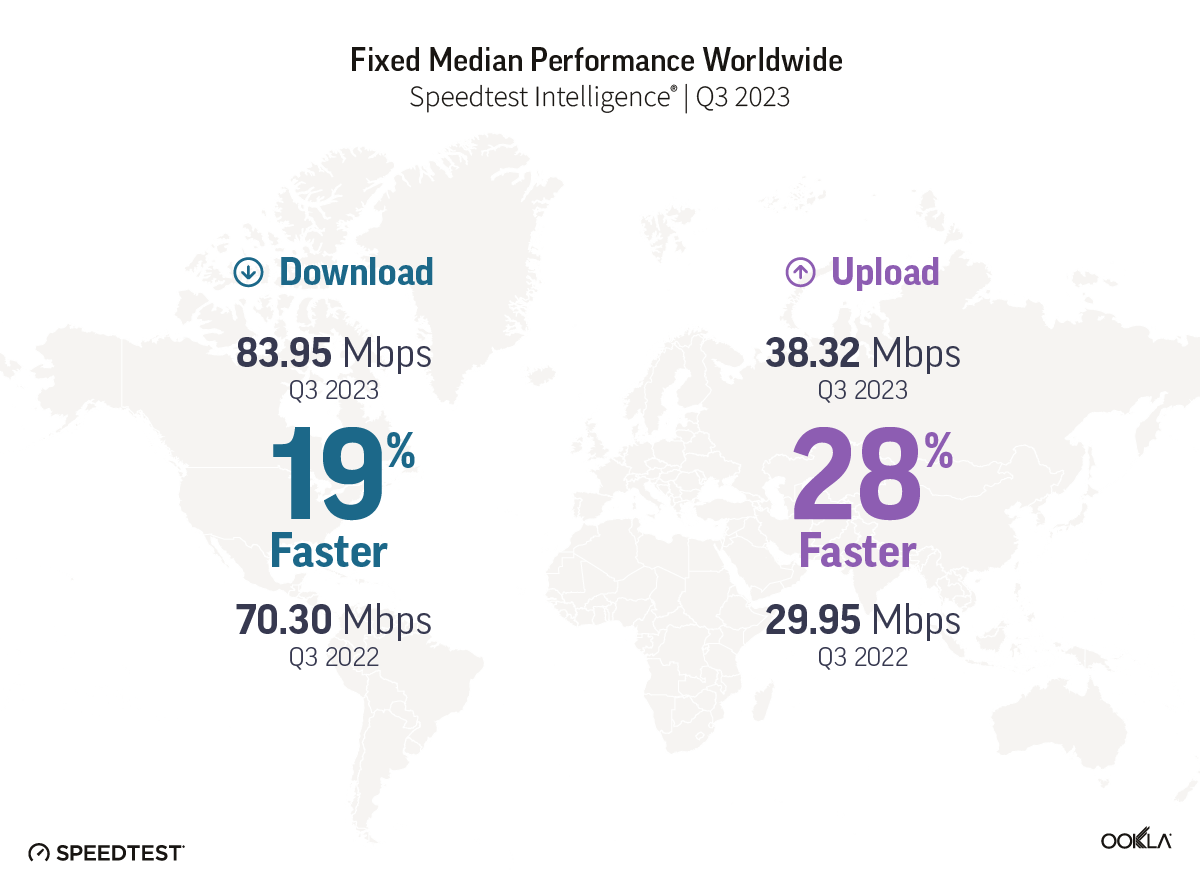
Illustration of Fixed Median Performance Worldwide

On a global scale, fixed networks have demonstrated significant advancements, achieving a median download speed of 83.95 Mbps and an upload speed of 38.32 Mbps in Q3 2023, per Speedtest Intelligence data. This signifies a substantial 19% improvement in download speed and an impressive 28% enhancement in upload speed compared to those in 2022. This also indicates that more fixed connections have migrated to fiber networks.

According to the World Broadband Association (WBBA) report titled “Next Generation Broadband Roadmap 2023 to 2030” Fiber-to-the-Home (FTTH) is identified as the natural progression from copper-based xDSL broadband networks. The shift towards FTTH varies across different countries and regions, but the industry is committed to embracing more advanced and efficient broadband technologies. 

Oftentimes, despite improvement in underlying broadband technology, Wi-Fi is the bottleneck that reduces customer experience. Our research has shown that Wi-Fi performance can lag behind ethernet in markets where advanced cable and fiber connections are replacing legacy broadband technology (such as DSL or coax cable). Wi-Fi speeds typically range from 30-40% of ethernet, indicating a need to accelerate the adoption of more advanced Wi-Fi technologies and optimize the home network environment.

The UAE, Singapore, and Hong Kong are in the lead for fixed
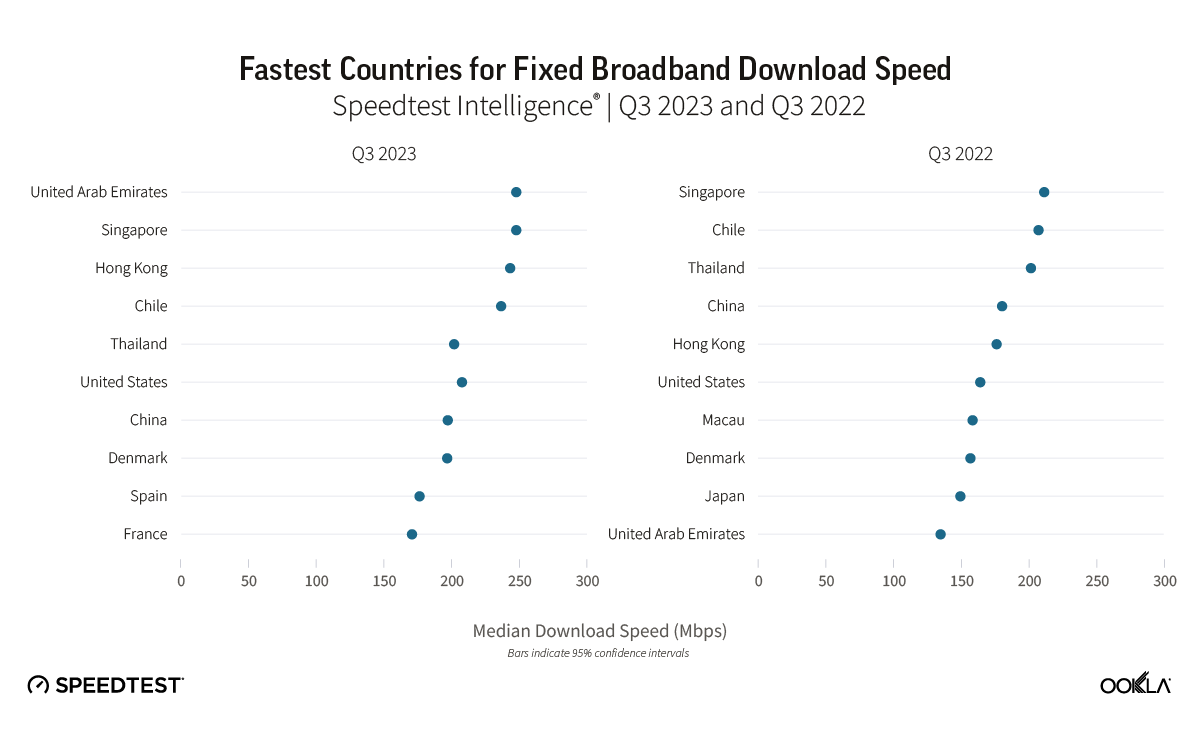
Chart of Fastest Countries for Fixed Broadband Download Speed

The United Arab Emirates (UAE) and Singapore led the way in fixed network performance.

The UAE achieved a median download speed of 247.63 Mbps in Q3 2023, representing a notable 1.83 times increase compared to the previous year. Most customers in the UAE have access to fiber networks, and additional measures have been implemented by operators in the region to enhance internet speeds, such as increasing the minimum download speed from 250 Mbps to 500 Mbps and offering price discounts to incentivize users to upgrade to higher-tier plans. 

Singapore also leads on the 2023 Fiber Development Index (FDI), with maximum scores in seven of the nine metrics. Singapore, along with Qatar and South Korea, has achieved 100% FTHH coverage. One of the reasons for this success, besides having a smaller area, is that Singapore’s regulator mandates building owners and real estate developers to provide adequate space, facilities, and accessibility for network operators to pre-install fiber networks.

Hong Kong also demonstrated significant progress, with a 37% increase in median download speed and a 40% increase in upload speed. To track broadband adoption, the Office of the Communications Authority (OFCA) in Hong Kong monitors broadband adoption by advertised speed and technology mix; as of August 2023, 66% of residential clients already subscribed to the Internet with a download speed equal to or greater than 1 Gbps.

Chile has seen a 14% improvement in median download speed and a 29% improvement in upload speed on the back of a greater fiber adoption. Chile has been the top-performing fixed broadband market across Latin America, consistently outperforming other regional markets but over the last three years, it has also closed the performance gap with other leading markets globally. Chile’s strong fixed broadband performance — an anomaly in the region — is primarily due to strong competition among Chilean ISPs. Chile has seven ISPs with over 5% market share, all heavily focused on migrating customers to fiber. 

Thailand is a newcomer to the ranking as FTTH continues to grow strongly. FTTH constitutes an impressive 95% of fixed broadband users in Thailand, equivalent to around 58.96% of household penetration. Operators have been actively rolling out fiber in adherence to the Digital Thailand National Policy.

In the United States, there has been a 26% improvement in median download speed and a 7% improvement in upload speed. In this very competitive market, with a range of access technologies vying for customers, a combination of migration to fiber, 5G fixed-wireless access (FWA), and faster cable connections is helping drive higher performance levels. In line with the demand for faster network performance in the market, the FCC recently announced that it is seeking input on a planned increase to its definition of broadband/high-speed internet to 100 Mbps download and 20 Mbps upload, up from the current 25 Mbps download and 3 Mbps upload standard.

As discussed in our recent article, several European countries are making substantial progress in offering high-speed broadband. Across Europe, Denmark had the fastest median download speed for fixed broadband (196.43 Mbps), followed by Spain (176.08 Mbps) and France (170.51 Mbps). Denmark experienced a 25% improvement in median download speed and a 16% improvement in upload speed. Spain also showed significant improvement, with a 32% increase in median download speed and a 29% increase in upload speed. France exhibited even stronger progress, with a 53% increase in median download speed and a 41% increase in upload speed. The speed gains we’ve seen in Spain and France are correlated with an increase in fiber adoption; for example, Spain boasts nearly 90% fiber optic coverage, thanks to private initiatives and government support, while France expects a full-fiber rollout by 2025.

Connectivity for All

The imperative of closing the connectivity gap

Massive investments are being made to bridge the connectivity gap as recognition of connectivity as a fundamental human right is growing. According to a WBBA Whitepaper, a high level of broadband penetration is critical to the country’s socioeconomic development. However, it’s not only about being connected to the network per se; the quality of that broadband connection is equally crucial. Unlike other utility services like gas and electricity, where quality is generally stable, with broadband, the quality of the network experience is crucial to ensure users can benefit fully from multiple applications.

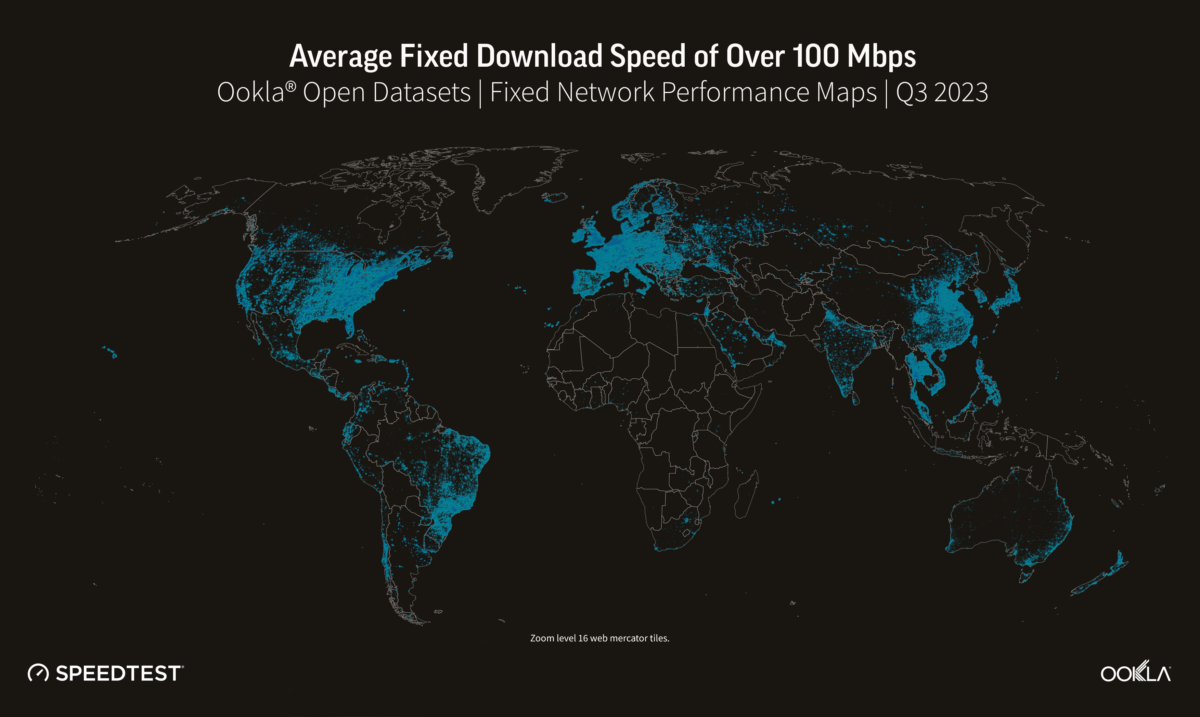
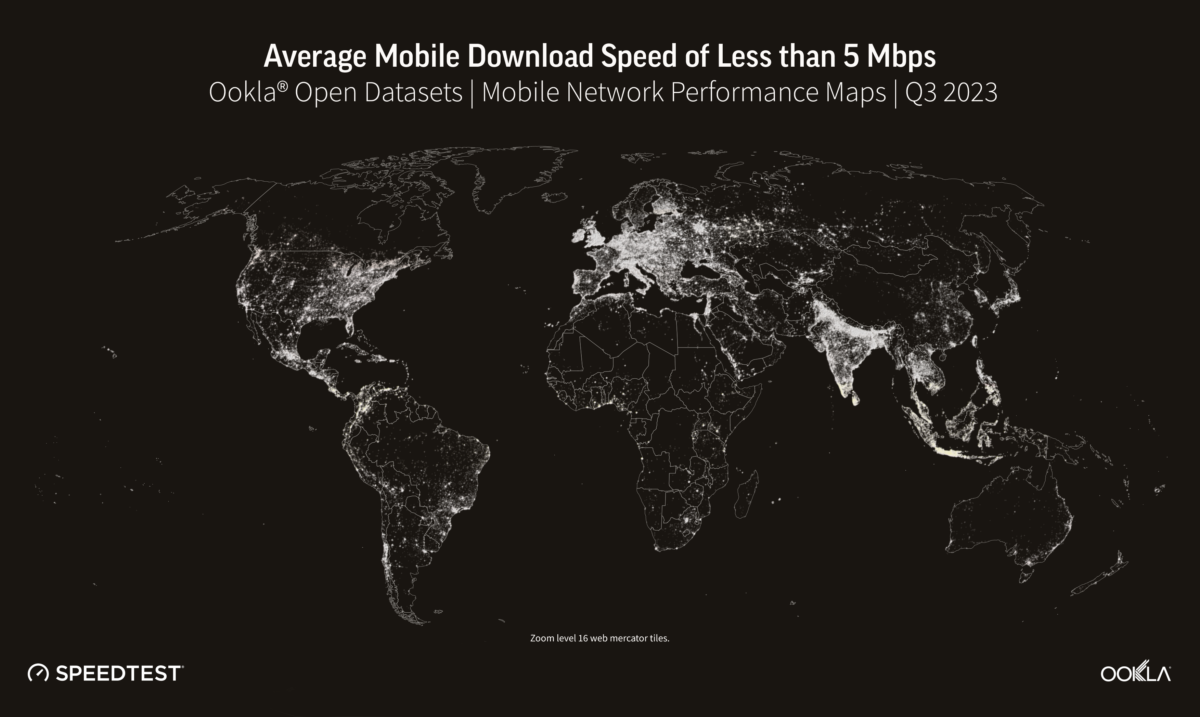
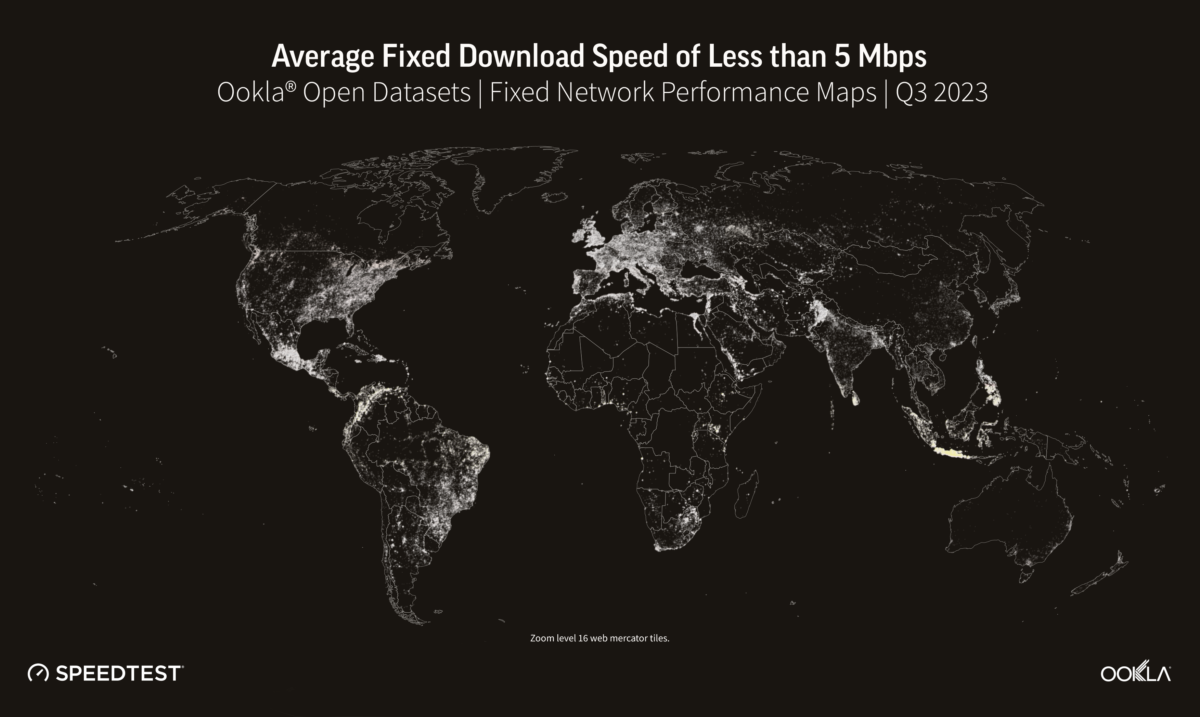
To assess the digital divide, we mapped mobile and fixed internet performance using data from the Open Data Initiative, which Ookla provides as part of Ookla for Good

Determining where a digital divide exists is a complex issue that involves identifying where network infrastructure is located, where people need connectivity, and how affordable it is. Although it can be challenging to dig into a specific location, it is evident that there are varying levels of Internet performance worldwide. A quick glance at our data shows that fixed broadband customers are more likely to experience faster networks (measured as an average download speed of 100 Mbps and above) than mobile across the Americas and Europe. The opposite is true for mobile networks across Africa and APAC, where mobile networks are often the primary means of connectivity. Compared to urban areas, rural communities are often ill-equipped for broadband access. Due to a lack of bandwidth (and therefore slower speeds), people in these areas need help doing many things on the internet, such as streaming videos. The US regulator FCC defines broadband in the United States as access to  25 Mbps download and 3 Mbps upload speeds. Areas without those speeds are classified as broadband “digital deserts,” even if those areas have internet access. Although broadband definitions can vary considerably from country to country, we can see in the next section that many areas fall outside any standards of connectivity globally.

Despite the world becoming increasingly connected, many rural and remote areas still struggle to access the internet. For example, large swathes of South America and Africa fall outside terrestrial network coverage. As discussed in our recent article, cellular networks are critical to connecting individuals and businesses as internet access in Africa is predominantly mobile. Before we can start discussing 5G, connecting communities with the internet in general is a priority. Affordable 4G smartphones and targeted financing for under-served demographics are key for bridging the digital divide and reducing poverty, as a World Bank study found that 4G coverage can help cut poverty by up to 4.3%. 

5G technology can potentially replace fixed internet access in situations where the cost of fiber deployments is high and rolling out traditional fixed broadband networks isn’t commercially viable. However, in countries like Indonesia, satellite technology may be a more effective solution for connecting remote areas. While 5G Fixed Wireless Access (FWA) and satellite technology can complement each other, the adoption of satellite technology is currently limited by factors such as coverage, device affordability, and service cost. As revealed in our recent article, Starlink outperforms GEO satellites and is a suitable replacement for fixed networks in rural areas. While it may not match the leading cable or fiber providers in terms of median speeds or multi-server latency, satellite internet provides a viable alternative in places where cable and fiber access networks are unavailable. This is mainly due to a more consistent distribution of download performance across Speedtest samples, unlike FWA and DSL-based services, where performance is impacted by the distance from the cell site or exchange/DSLAM.

Fixed and mobile network operators across the globe widely use Speedtest data to enhance Internet quality, improve accessibility, and inform network expansion. The United States Federal Communications Commission and the Malaysian Communications and Multimedia Commission rely on Speedtest data to ensure accountability of telecommunications entities and allocate funds for rural and urban connectivity development. Ookla also licenses data to NGOs and educational institutions to help bridge the digital divide between areas with and without modern Internet access. Our mapping data is used to track results and determine whether broadband infrastructure can handle growth as more people connect devices and technologies demand more bandwidth. We are also actively involved in discussing best practices for ensuring digital transformation and connectivity for all in the APAC region, Central Asia, and Europe. If you are interested in working with us, please reach out. 

Keep track of how well your country is performing on Ookla’s Speedtest Global Index and get advice on how to plan and optimize your network.

Ookla retains ownership of this article including all of the intellectual property rights, data, content graphs and analysis. This article may not be quoted, reproduced, distributed or published for any commercial purpose without prior consent. Members of the press and others using the findings in this article for non-commercial purposes are welcome to publicly share and link to report information with attribution to Ookla.

| February 18, 2025

5G Significantly Enhanced Experience for Tourists and Business Travellers to the Gulf Region

Roaming is a significant revenue stream for Gulf operators, especially as the region is becoming an important tourist destination. Travelers increasingly expect network experiences abroad to match or exceed what they have at home. This article uses Ookla’s Speedtest Intelligence® data to assess the mobile experience of inbound roamers visiting select Gulf countries – Kuwait, Qatar, Saudi Arabia, and the U.A.E. – in  2024, comparing their experience across different destinations and their respective home networks.

Key Takeaways:

  • Travelers to Qatar, the U.A.E., and Kuwait enjoy top speeds over 5G. Median download speeds over 5G reached 381.05 Mbps in Qatar, 374.60 Mbps in the UAE, and 240.37 Mbps in Kuwait in 2024.
  • Generally, travelers experience slower mobile speeds when roaming in the Gulf region than on their home networks. However, exceptions include Russian travelers in the U.A.E., Pakistani tourists in Saudi Arabia, and Saudis and Indonesians in Qatar who experience notable speed improvements.
  • Visitors from outside the Gulf typically experience slower speeds than those from within it. This could be due to more favorable agreements between regional operators to keep fees low and encourage usage when traveling within the region. In contrast, high roaming charges and speed caps for travelers from Europe, Asia, or the United States would constrain usage and speed.

The Gulf region is rapidly becoming a popular global tourist destination, creating opportunities to increase roaming revenue

The Gulf Cooperation Council (GCC) region is experiencing a tourism boom, rapidly becoming a popular global tourist destination. According to Fitch Ratings, the tourism sector contributed around USD 130 billion to GCC’s GDP in 2023, with projections to surpass USD 340 billion by 2030, equating to 10% of total GDP. This growth is fueled by the GCC’s ambitious goals to diversify their economies beyond oil and enhance their global standing.

Unlike Europe and other parts of the Middle East, the Gulf region recovered quickly from COVID-19. In 2023, passenger traffic at its airports exceeded pre-pandemic levels by 8%. The region’s appeal is not just its warm weather, beaches, and shopping; it also offers modern amenities and top-notch services for both business travelers and vacationers. The straightforward entry visa process and the introduction of a unified tourist visa further facilitate travel.

Mobile connectivity through roaming is important for the travel experience. It allows travelers to stay connected with family and friends, use mapping and navigation tools, locate attractions, read restaurants’ reviews, and share experiences on social media. With 5G, roamers can access high-speed internet, stream HD videos, and make lag-free video calls. However, 5G roaming is still in its nascent stages, and not all hosting operators provide access to its full capability.

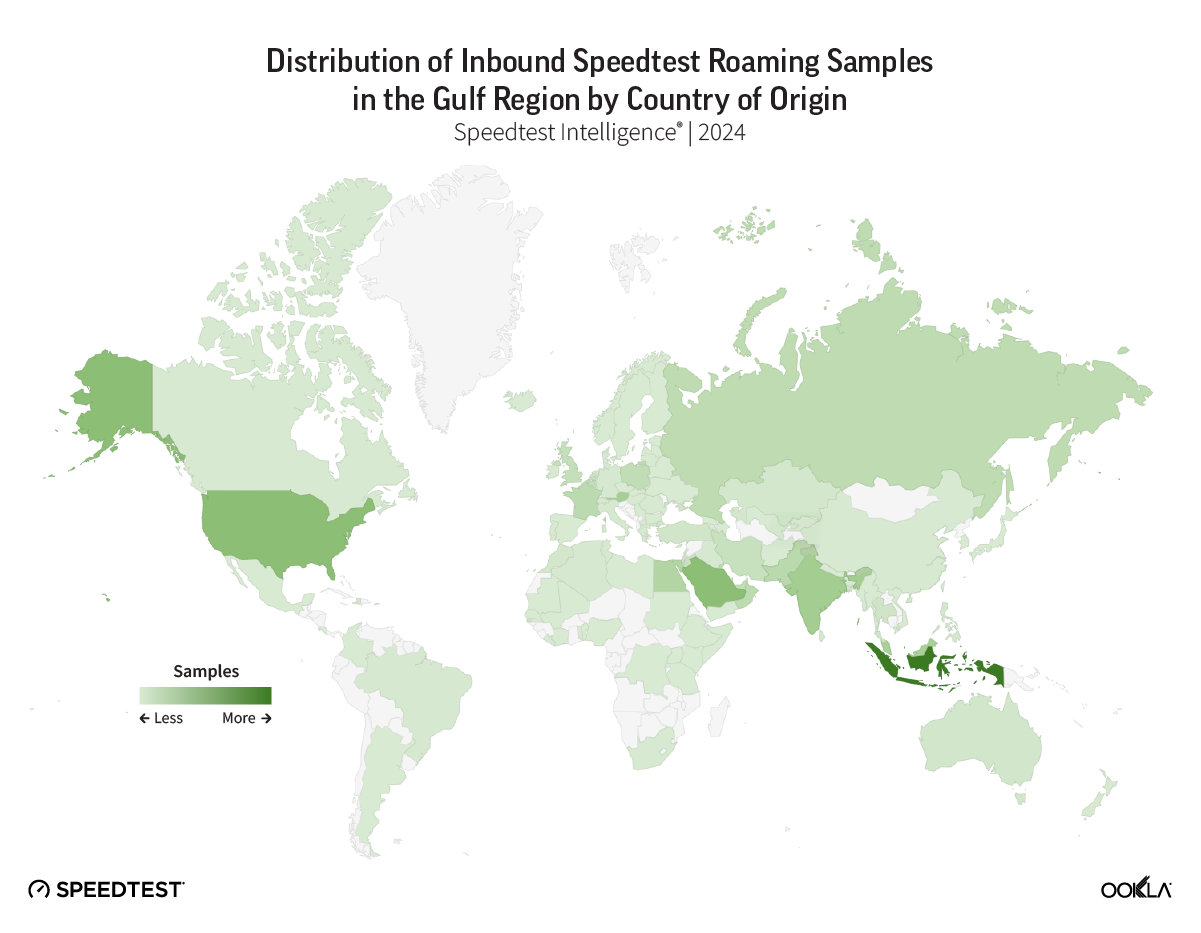
Most inbound roamers originate from Asian countries, the Gulf region, and the U.S.A. 

We used Ookla’s Speedtest Intelligence® to assess the mobile network performance for inbound mobile roamers to Gulf countries during 2024, comparing it with their home network performance. Based on Speedtest samples, the U.A.E. and Saudi Arabia are the top roaming destinations for international travelers, followed by Kuwait and Qatar. Bahrain and Oman saw fewer roamers.

Indonesia accounted for 14.4% of total inbound roamers in 2024, with most heading to Saudi Arabia. The latter received the second-highest number of inbound roamers, behind the U.A.E., likely linked to the Hajj and Omra pilgrimages. Saudi Arabian visitors were also prominent within the region  (8.0% of total samples), with the U.A.E., Bahrain, and Qatar being favored destinations. 

Outside the Gulf, the U.S.A. had the most travelers to the GCC who activated roaming services and ran speed tests (7.9%), followed by India and Austria at 5.6% and 5.3%, respectively. Other Asian regions, such as Malaysia, Hong Kong, and Pakistan, also contributed strongly to the roaming cohort. Egypt is the largest non-GCC Arab country, contributing to the visitor pool (4.2%).

Map of distribution of inbound Speedtest Roaming Samples in the Gulf region by country of origin

Our findings also reveal that among the top 10 countries contributing to roamers in the Gulf region, Austria, Saudi Arabia, and Hong Kong had the highest proportion of 5G users. On the other hand, travelers from Pakistan, India, and Egypt were the least likely to use 5G while roaming.

5G Share of Inbound Roamers Speedtest Sample, Top-10 Countries of Origin
Speedtest Intelligence® | 2024
5G Share of Inbound Roamers Speedtest Sample, Top-10 Countries of Origin

The following sections provide additional insights into network performance for international roamers visiting the U.A.E., Saudi Arabia, Kuwait, and Qatar in 2024. For each country of origin and destination, we include the median download speed for roamers during travel and compare it with the median download speed on their home networks. 

Saudi Arabian and Russian Roamers Enjoy Top 5G Speeds in the U.A.E.

Over 37% of the Speedtest sample roaming in the U.A.E. came from India, Saudi Arabia, Austria, Russia, and Hong Kong. Network experiences varied significantly between these countries. Saudi Arabian and Russian travelers experienced the fastest download speeds for all technologies and 5G. Saudi visitors had comparable roaming experiences to their home countries. At the same time, Russian tourists saw more than a threefold increase in median download speeds in the U.A.E compared to their home networks. On the other hand, travelers from Austria, India, and Hong Kong experienced comparatively lower performance.

Network Performance By Technology for Roamers in the U.A.E and Comparison with Home Network for All Technologies
Speedtest Intelligence | 2024
Network Performance By Technology for Roamers in the U.A.E and Comparison with Home Network for All Technologies

French and American Tourists Enjoy Excellent 5G Performance in Saudi Arabia

Most travelers to Saudi Arabia are religious pilgrims, with a significant number from Indonesia and Malaysia comprising 38.7% of total inbound roamers in 2024, as captured in Speedtest data, reported the best mobile experience and 5G download speeds when visiting Saudi Arabia. Median download speeds reached 78.46 Mbps for all technologies and 153.66 Mbps for 5G among American visitors, while French tourists experienced speeds of 49.33 Mbps and 153.79 Mbps.

Saudi operators delivered a more moderate performance to travelers from Malaysia, Pakistan, and Egypt, with median download speeds below 50 Mbps across all technologies. However, there were notable improvements over 5G for users from Malaysia and Pakistan, with speeds reaching 90.97 Mbps and 112.68 Mbps, respectively. Interestingly, Indonesian operators appear to enforce a uniform speed cap of 10 Mbps across all networks in Saudi Arabia, suggesting a restriction from the home operator rather than the host network.

Generally, inbound roamers experience similar or worse network conditions in Saudi Arabia compared to their home networks, with Indonesians feeling the most restricted due to the speed cap. Pakistanis are the only exception among the top six countries in Speedtest samples, with median download speed increasing from 19.38 Mbps at home to 27.22 Mbps when roaming.

Network Performance By Technology for Roamers in Saudi Arabia and Comparison with Home Network for All Technologies
Speedtest Intelligence | 2024
Network Performance By Technology for Roamers in Saudi Arabia and Comparison with Home Network for All Technologies

Inbound roamers from Saudi Arabia enjoy the fastest 5G network speeds in Kuwait

Saudi visitors enjoyed fast 5G speeds at 240.37 Mbps, though ‘all technologies’ speeds were around 40% lower than their 5G speeds and about 30% less than what they would have experienced back in the Kingdom. The other major tourist groups in Kuwait saw a decline in median download speeds compared to their home countries, most notably those from the United States.

Network Performance By Technology for Roamers in Kuwait and Comparison with Home Network for All Technologies
Speedtest Intelligence | 2024
Network Performance By Technology for Roamers in Kuwait and Comparison with Home Network for All Technologies

Qatar offers exceptionally fast 5G speeds to its inbound roamers from Saudi Arabia and Kuwait

Many travelers to Qatar come from Saudi Arabia and the U.S.A., representing an aggregate of 36.2% of total roamers. There is also a huge difference in speeds experienced by roamers, with those coming from neighboring countries enjoying the best performance. Saudi and Kuwaiti visitors experience a median download speed of 381.0 Mbps and 227.1 Mbps over 5G, respectively. By contrast, those from Austria would have experienced a much more modest speed of around 36 Mbps on both ‘all technologies’ and 5G.

Comparing the network experience of visitors in Qatar to their home networks, travelers from Indonesia and Saudi Arabia saw significant improvements, with roaming-to-home download speed ratios of 1.7 and 1.5, respectively. On the other hand, those from Kuwait, the U.S.A., and Austria likely experienced a decline in network performance.

Network Performance By Technology for Roamers in Qatar and Comparison with Home Network for All Technologies
Speedtest Intelligence | 2024
Network Performance By Technology for Roamers in Qatar and Comparison with Home Network for All Technologies

Operators generally offer good mobile roaming experience in the Gulf region, but there is room to make it more accessible

This analysis shows that Gulf operators provide excellent mobile experiences to roaming customers. Kuwait, Qatar, and the U.A.E. tend to offer top speeds for all technologies and 5G, especially for tourists coming from within the region.

Performance differences between countries and operators can stem from technical and commercial factors. Roamers’ experience can degrade if home operators impose data speed and usage limitations to manage costs, prevent bill shocks, or favor certain operators for roaming. Host operators can also restrict roamers’ full-capacity access to avoid network congestion. 

To ensure optimal visitor experiences and maximize potential revenue from increased traffic, some guest and host operators should review roaming agreements, offer speed-tiered tariffs, and alleviate speed caps. Domestic operators can also address roaming charge concerns by offering local SIMs. For instance, tourists arriving in the UAE receive a free local SIM at Dubai airport. Maintaining roaming high charges and applying speed or data caps might push users towards eSIM options, where operators have less control over their experience.

Ookla provides unique insights into inbound and outbound roamers’ experiences and conducts country-level and operator-level benchmarks. If you want to learn more about Speedtest Intelligence, please contact us.

Ookla retains ownership of this article including all of the intellectual property rights, data, content graphs and analysis. This article may not be quoted, reproduced, distributed or published for any commercial purpose without prior consent. Members of the press and others using the findings in this article for non-commercial purposes are welcome to publicly share and link to report information with attribution to Ookla.

| December 13, 2024

Performance Benchmarking of Mobile Operators in Small to Mid-Sized Markets

As mobile connectivity demand grows, particularly in urban areas, network performance has become a crucial indicator of a country’s development, competitiveness, and quality of life. This report focuses on the performance of mobile networks in small to mid-sized markets, which strike a balance between fostering competition and allowing operators to concentrate on urban connectivity. Based on the selected criteria, the top-performing operators identified in this analysis come from nine countries: Bulgaria, Denmark, Finland, Hungary, Kuwait, Norway, Singapore, Switzerland, and the U.A.E.

Key Takeaways

  • Operators from the U.A.E. and Kuwait dominate the top five positions. Speedtest Intelligence® 1H 2024 data showed that U.A.E.’s e& led with a median download speed of 351.73 Mbps, followed by du at 264.41 Mbps. Kuwait’s Ooredoo (234.45 Mbps), Zain (218.06 Mbps), and stc (190.42 Mbps) rounded out the top five.
  • Early 5G adoption has been a key factor in driving improved network performance, with operators like e& (U.A.E.), du (U.A.E.), Ooredoo (Kuwait), and Zain (Kuwait) achieving globally competitive median download speeds since launching 5G in 2019. Speedtest Intelligence data highlights consistent growth in 5G Availability and 5G Service metrics over the past two years. For instance, Ooredoo (Kuwait) increased 5G Availability from 67.0% to 73.7% and 5G Service from 78.3% to 83.9%, while Telenor Norway improved 5G Availability from 40.4% to 55.9%, and YouSee (Denmark) reached 84.0%, showcasing the significant impact of 5G expansion on network performance.
  • The top-performing operators predominantly came from a select group of highly urbanized and economically developed countries. Only nine countries accounted for the top 20 mobile operators in small to mid-size markets. Notably, all operators in the top ten were from countries with urbanization rates exceeding 87%, highlighting the correlation between high urban density and network performance.

Understanding mobile performance in advanced small to mid-size markets

Mobile network performance is shaped by multiple factors, each impacting speed, reliability, and user experience. Spectrum availability, infrastructure density, and advanced technologies like 5G are essential for meeting user demand effectively. Additionally, geographic, economic, and regulatory factors influence the level of investment and an operator’s ability to deploy and optimize services. Large markets spanning vast regions pose unique logistical and technical challenges for operators trying to serve both densely populated cities and remote rural areas. In contrast, operators in smaller markets, such as city-states, focus on compact urban areas, requiring a more targeted and agile approach to network deployment.

For the purpose of this analysis, we defined small-to-mid sized markets as having populations between 4 million and 10 million.  The majority of the population is concentrated in high-density areas, allowing for a clearer examination of urban network strategies without the intricate infrastructure needs of large rural areas. There are 35 markets globally that fit this criteria, and of these, more than 65% occupy land areas smaller than 200,000 km². Using Speedtest Intelligence data, we examined the mobile performance in these markets during the first half of 2024, highlighting the top 20 ranked mobile providers based on median download speed.

Operators from the U.A.E. and Kuwait dominate the top ten rankings

Using Speedtest Intelligence® data collected in the first half of 2024, we ranked the top ten mobile operators in small to mid-size markets based on all mobile technologies combined. Operators from the United Arab Emirates and Kuwait dominate the top five positions, with a few operators from Denmark, Norway, and Singapore also making it into the top ten list. Notably, all operators in the top ten were from highly urbanized countries, with an urbanization rate exceeding 87%. These markets were also economically developed, having an average GDP per capita of just under USD 60,000.

Top 10 Ranked Operators Performance, Small to Medium Markets
Source: Speedtest Intelligence® | 1H 2024

U.A.E.’s e& (U.A.E) leads by a significant margin, achieving a median download speed of 351.73 Mbps for all technologies combined. This lead is indicative of the e&’s strong investment in telecommunication infrastructure and advanced network capabilities. Following e& is du, which has a median download speed of 264.41 Mbps. Both e& and du reported similar median upload speeds, with 26.58 Mbps and 26.25 Mbps respectively. The results underscore the U.A.E.’s robust telecommunications landscape, driven by strong competition among the leading operators.

Kuwait’s Ooredoo and Zain rank third and fourth with median download speeds of 234.45 Mbps and 218.06 Mbps, respectively. Another Kuwaiti operator, stc, completes the top five with a speed of 190.42 Mbps. The presence of three Kuwaiti operators in the top five highlights the country’s substantial progress in mobile network development, driven by a concentrated urban population and high levels of mobile broadband penetration. 

The dominance of operators from the Middle East, particularly the U.A.E. and Kuwait, in overall network performance highlights the significant investments and advancements in 5G infrastructure within the region. Our previous report examined how the U.A.E. was the fastest 5G market globally in 1H 2024, with a median download speed of 660.08 Mbps, with e& UAE leading both domestically and globally at 749.63 Mbps. In Kuwait, Zain topped 5G median download speed in the market with a speed of 411.06 Mbps, surpassing Ooredoo at 379.04 Mbps during the same period. These achievements underscore the region’s strategic focus on enhancing connectivity and setting benchmarks for global 5G performance. 

Northern Europe also has strong representation in the top ten, with Telenor (Norway) achieving 174.34 Mbps and three Danish operators (3, Telia, and YouSee) rounding out the list, all offering speeds above 148 Mbps. Singtel of Singapore is positioned in eighth place at 159.22 Mbps, indicative of Singapore’s efficient, urban-focused mobile deployment.

European operators were the most prominent beyond the top ten

11-20 Ranked Operators Performance, Small to Medium Markets
Source: Speedtest Intelligence® | 1H 2024

The next tier of mobile operators, ranked 11 to 20 by median download speed, offers a broader view of competitive performance across smaller European and Asian markets. Leading this group is A1 of Bulgaria, with a median download speed of 140.56 Mbps, placing it just below the top 10. Close behind Telenor (Denmark) and Telia (Norway), at 135.83 Mbps and 134.53 Mbps, respectively, highlight Northern Europe’s strong network performance capabilities, where dense urban populations and advanced network deployment have created solid foundations for high-speed connectivity.

Finnish operators make up a substantial part of this ranking, with DNA at 120.72 Mbps, Telia at 103.51 Mbps, and Elisa at 93.50 Mbps. The inclusion of the three Finnish operators in the list is notable, given the complex mix of population distribution and challenging coverage requirements of the market, which make consistently high speeds difficult across various geographies.

Other European operators, such as Swisscom in Switzerland, which had a speed of 117.29 Mbps, and Yettel in Hungary, with 94.58 Mbps, demonstrated that smaller, urbanized markets could still maintain competitive internet speeds. Singapore’s StarHub, with a speed of 100.46 Mbps, ranked 18th, highlighting the country’s strong mobile infrastructure.

Proactive 5G strategies contributing to overall performance gains among top operators

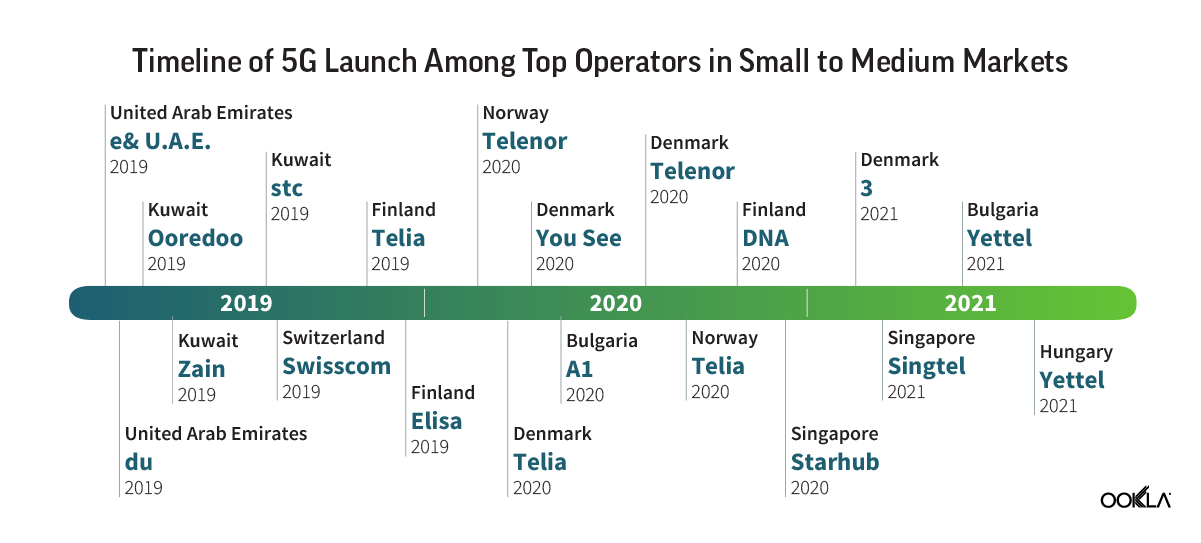
The majority of the operators in the top 20 list were early adopters of 5G technology, with most launching 5G services as early as 2019 or 2020. This early adoption has proven to be a factor in enhancing their overall network performance, allowing them to deliver faster speeds, greater reliability, and a better overall user experience compared to markets that lagged in 5G rollout.

Timeline of 5G Launch Among Top Operators in Small to Medium Markets

Operators such as e& (U.A.E.), du (U.A.E.), Ooredoo (Kuwait), and Zain (Kuwait) launched 5G services in 2019 and have consistently achieved higher median download speeds compared to other operators globally. In May 2019, etisalat by e& became the first operator in the Middle East and North Africa (MENA) region to introduce 5G Non-Standalone (NSA) technology to subscribers. The U.A.E. and Kuwait have regularly ranked as the fastest operators in Ookla’s Speedtest Global Index, alongside other early 5G adopters like Qatar and South Korea.

Government support and operator investments have played a crucial role in driving 5G success in these markets. In the U.A.E., the telecom regulator TDRA waived fees for 5G frequencies above 3 GHz for five years, giving operators access to extensive spectrum resources in the 2500-2600 MHz and 3300-3800 MHz ranges. Similarly, Kuwait’s CITRA allocated additional spectrum in the 2.3 GHz and 2.6 GHz bands, enabling operators to enhance their 5G networks and prepare for the rollout of 5G-Advanced technology.

European operators, including Telenor (Norway), 3 (Denmark), and A1 (Bulgaria), as well as Singtel and StarHub in Singapore, have also leveraged early 5G implementation to enhance service quality. GSMA’s 5G Connectivity Index highlights that markets with proactive 5G strategies tend to outperform in network performance metrics. 

Leading operators demonstrate ongoing 5G adoption and coverage expansion

The overall performance gains are closely linked to the increased adoption of 5G services and the expansion of 5G coverage in key markets. As more users spend a larger share of their time on 5G networks, reliance on older technologies like 4G has steadily declined. This transition has contributed to faster speeds, lower latency, and overall improvements in mobile network performance for users across these top-performing operators.

5G Availability (%) Quarterly Trend
Source: Speedtest Intelligence® | Q1 2023 – Q3 2024

5G Service (%) Quarterly Trend
Source: Speedtest Intelligence® | Q1 2023 – Q3 2024

Top operators have continued to expand their 5G networks across their respective markets. Over the past 24 months, quarterly data has shown a consistent upward trend in both 5G Availability—the percentage of time users with 5G-capable devices spend connected to 5G—and 5G Service, which measures the percentage of geographical areas with reported 5G coverage. This dual growth demonstrates the operators’ commitment to improving both user experience and network reach.

e& (U.A.E.) and du (U.A.E.) have shown steady increases in 5G Availability. e& rose from 13.9% in Q2 2023 to 25.6% in Q3 2024, while du increased from 16.5% to 20.9% over the same period. 5G Service also improved, with e& expanding from 41.5% in Q2 2023 to 52.9% in Q3 2024, and du growing from 56.4% to 67.2%. 

Kuwaiti operators Ooredoo, Zain, and stc consistently maintained high levels of 5G Availability. Ooredoo increased from 67.0% in Q2 2023 to 73.7% in Q3 2024, while 5G Service also saw growth, with Ooredoo rising from 78.3% to 83.9% and Zain expanding from 81.1% to 90.6% during the same period. 

European operators also showed notable progress. Telenor Norway achieved significant growth in 5G Availability, rising from 40.4% to 55.9%. Denmark’s YouSee maintained one of the highest levels, increasing from 72.8% to 84.0%. In Finland, DNA and Telia demonstrated consistent improvements, with DNA rising from 52.6% to 71.6% and Telia making steady advancements as well. These trends reflect the continued expansion of 5G in both urban and outskirts, supporting increased 5G connectivity  across these markets.

Majority of the top operators’ 5G networks are utilizing C-band spectrum

Spectrum availability plays an important part in network performance, impacting speed and coverage. In urbanized small to mid-size markets, operators must strategically manage and, where possible, the ability to access adequate spectrum resources is crucial for reducing network congestion and maintaining a consistent, high-quality experience for users.

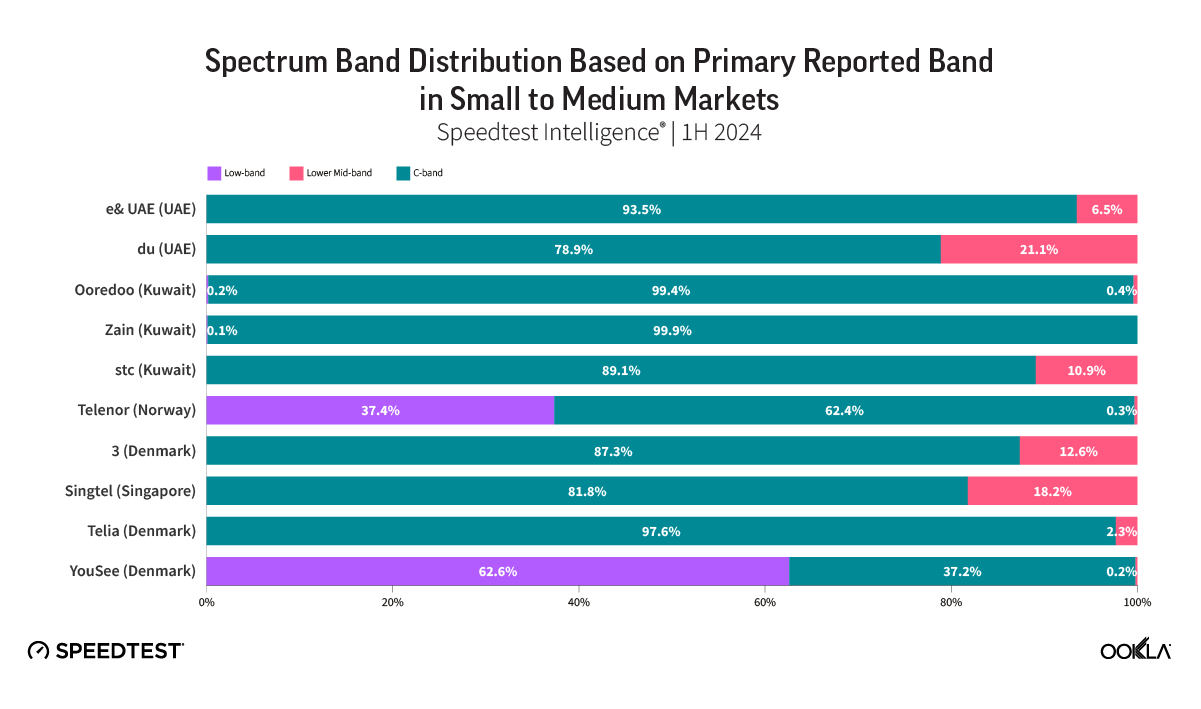
We analyzed the distribution of Speedtest data samples based on the primary reported 5G spectrum bands used by the top ten performing operators to gain insights into the spectrum bands utilized by operators. It’s important to note that operators will employ differing strategies to optimize spectrum utilization and the user experience. Consumer-initiated tests will attempt to saturate a network connection, and operators will tend to serve this capacity demand through the spectrum bands with the highest capacity and, where required, supplement this capacity through carrier aggregation. This gives a better indication of the maximum throughput and state of the network, in contrast with background idle-state testing, which will often camp on lower frequency bands and, more specifically, on 4G-LTE.

The results show that upper mid-band spectrum, or  C-Band (3.3-4.2 GHz), is the most widely utilized spectrum band among these operators, playing a critical role in balancing performance, availability, and coverage. The C-band offers an optimal balance between speed and coverage, making it suitable for urban and broader coverage areas.

Operators like e& (U.A.E.) and du (U.A.E.) rely heavily on the C-band, with 93.5% and 78.9% of test samples reported in this range, respectively. Similarly, operators in Kuwait, including Ooredoo, Zain, and stc, show a near-exclusive reliance on the C-band (ranging from 89.1% to 99.9%), enabling them to deliver widespread 5G availability and improved median download speeds.

In Nordic markets, operators like Telenor Norway and YouSee Denmark demonstrate more diverse spectrum strategies. Telenor Norway combines significant use of the C-band (62.4%) with a notable portion of low-band spectrum (37.4%), which enhances coverage in rural and less densely populated areas. This mixed approach allows these operators to ensure nationwide 5G rollout while maintaining urban performance. 

Top performing operators came from a few highly urbanized countries.

Our data shows that operators from only nine countries made up the top 20 mobile operators with the best median download speed within small to mid-size markets. Denmark had the highest representation, contributing four operators to the top 20 list. Kuwait and Finland follow closely, each with three operators ranked among the best. Other countries with top-performing operators include the U.A.E., Singapore, Norway, Bulgaria, Switzerland, and Hungary, each featuring one or two operators.

Top 20 Operators Countries
Source: Speedtest Intelligence® | 1H 2024, World Population Review | 2023

These markets share several common characteristics that likely contribute to their high mobile network performance. Most are highly urbanized and economically developed, which facilitates the deployment of advanced telecommunications infrastructure.  Additionally, these countries often have high levels of investment in digital connectivity, enabling operators to maintain robust, high-speed networks. Many of these markets, such as Singapore, Switzerland, and Norway, are relatively compact, allowing operators to concentrate network resources and deliver consistent performance across their territories.

In contrast, markets with lower urbanization levels, such as Austria (59.5% urbanization) and Ireland (64.5% urbanization), despite sharing similar characteristics with the high-performing markets—such as strong economies and investments in telecommunications infrastructure—reported lower median download speeds of 79.46 Mbps and 38.20 Mbps, respectively. This highlights the need for tailored strategies in less urbanized markets to enhance coverage and optimize performance.

Ookla will continue to monitor overall mobile performance and 5G deployments globally and benchmark countries and operators. For more information about Speedtest Intelligence data and insights, please get in touch.

Ookla retains ownership of this article including all of the intellectual property rights, data, content graphs and analysis. This article may not be quoted, reproduced, distributed or published for any commercial purpose without prior consent. Members of the press and others using the findings in this article for non-commercial purposes are welcome to publicly share and link to report information with attribution to Ookla.

| January 20, 2021

ICYMI: Ookla Data and Research from December 2020


Highlights from the Speedtest Global IndexTM

Global-Index-Tweet-Image-Dec-2020

These are the top stories from December 2020:

  • Thailand has climbed two spots on fixed broadband to reach first place for the first time.
  • On mobile, Qatar climbed two spots to land in first place for mobile. While the country has ranked among the top five for the past year, this is the first time the country has reached the top spot.
  • Hungary has been steadily climbing the fixed broadband chart and currently ranks seventh.
  • Kuwait has reached sixth place, its highest mobile ranking to date, most likely due to an expanding 5G market.

New Global Index Market Analyses

United States

AT&T had the fastest Speed ScoreTM in the U.S. on mobile in Q4 2020. Washington, DC showed the fastest median mobile download speed while Gilbert, AZ was the fastest city for fixed broadband.

Canada

Bell showed the fastest median download speed on 5G during Q4 2020. The city of Edmonton had the fastest mean download speed over fixed broadband and mobile.

China

China Telecom showed the fastest Speed Score on fixed broadband. China Telecom was also fastest on mobile 5G and had the highest 4G Availability on mobile. China Mobile showed the fastest Speed Score on mobile.

France

Lyon showed the fastest mean download speed over fixed broadband while Nice was fastest on mobile. Orange had the fastest Speed Score on mobile overall and on 5G. Free was the fastest provider for fixed broadband.

Indonesia

Telkomsel was the fastest mobile operator in Indonesia during Q3-Q4 2020 while Biznet was the fastest ISP. IM3 Ooredoo had the highest 4G Availability among mobile operators.

New Global Index Market Analyses are also available for:

Articles worth a second look

2020 Recap: How the Internet Held Up During a Global Pandemic


This comprehensive report reveals how speeds over fixed broadband held up in 2020 using data from Speedtest Intelligence®.

Apple has 5G! But How Fast is the iPhone 12?


Find out how Apple’s iPhone 12 series performed in select cities around the world in Q4 2020.

Ookla retains ownership of this article including all of the intellectual property rights, data, content graphs and analysis. This article may not be quoted, reproduced, distributed or published for any commercial purpose without prior consent. Members of the press and others using the findings in this article for non-commercial purposes are welcome to publicly share and link to report information with attribution to Ookla.

| July 27, 2021

Oslo Tops the List of World Capitals with the Fastest 5G in Q1-Q2 2021

Mobile operators are rapidly expanding 5G deployments across the globe, with 16,410 new 5G deployments across 109 countries added to the Ookla 5G Map in June 2021 alone. Huge investments in 5G are being made to increase performance, especially in major cities. We used Speedtest Intelligence® to see which world capitals have the best 5G speeds and availability, based on locations with commercially available 5G during Q1-Q2 2021.

Oslo, Norway was the fastest world capital for 5G during Q1-Q2 2021

ookla_fastest_5g_download_speed_world_capitals_0721

The race for fastest 5G performance among world capitals was extremely competitive during Q1-Q2 2021. Oslo, Norway had the fastest 5G of any world capital, clocking in with a median download speed of 526.74 Mbps. Seoul, South Korea had the second fastest median download speed over 5G at 467.84 Mbps; Abu Dhabi, United Arab Emirates was third (421.26 Mbps); Doha, Qatar fourth (413.40 Mbps) and Stockholm, Sweden fifth (401.30 Mbps). Riyadh, Saudi Arabia (384.66 Mbps); Kuwait City, Kuwait (338.97 Mbps), Muscat, Oman (318.95 Mbps); Beijing, China (291.19 Mbps); and Taipei, Taiwan (287.86 Mbps); rounded out the top 10. Helsinki, Finland showed a median 5G download speed of 279.59 Mbps; Sofia, Bulgaria 260.55 Mbps; Canberra, Australia 258.39 Mbps; Bangkok, Thailand 253.73 Mbps; Manama, Bahrain 249.71; Dublin, Ireland 223.01; Luxembourg City, Luxembourg 209.98 Mbps; Paris, France 208.48 Mbps and Bucharest, Romania 203.44 Mbps.

We saw median 5G download speeds between 150 Mbps and 200 Mbps in the following world capitals during Q1-Q2 2021: Ottawa, Canada (196.11 Mbps); Hanoi, Vietnam (195.99 Mbps); Bratislava, Slovakia (188.23 Mbps); Madrid, Spain (183.37 Mbps); Bern, Switzerland (175.69 Mbps); Rome, Italy (171.79 Mbps); London, United Kingdom (167.50 Mbps); Tokyo, Japan (167.02 Mbps); Athens, Greece (164.95 Mbps); Copenhagen, Denmark (162.75 Mbps); Ljubljana, Slovenia (158.50 Mbps); Hong Kong (153.78) and Washington, D.C., United States (151.80 Mbps).

Cape Town, South Africa was the slowest world capital for 5G in Q1-Q2 2021

ookla_slowest_5g_download_speed_world_capitals_0721

Speedtest Intelligence shows Capetown, South Africa had the slowest median download speed over 5G during Q1-Q2 2021 at 53.33 Mbps. Other world capitals with slower median 5G download speeds included: Brasilia, Brazil (62.18 Mbps); San Juan, Puerto Rico (72.59 Mbps); Warsaw, Poland (80.18 Mbps); Singapore (111.20 Mbps); Manila, Philippines (112.23 Mbps); Prague, Czechia (116.30 Mbps); Budapest, Hungary (137.54 Mbps); Amsterdam, Netherlands (139.75 Mbps); Zagreb, Croatia (140.92 Mbps); Vienna, Austria (144.93 Mbps); Jerusalem, Israel (145.17 Mbps); and Berlin, Germany (148.16 Mbps).

Capitals not mentioned on either of these lists did not have sufficient 5G samples during Q1-Q2 2021 to be included in this report.

The fastest 5G speeds are yet to come

5G is rapidly improving across the world and we’re eager to see how countries, cities and operators continue to perform during Q3 2021 and beyond. If you want to see how your 5G network performs against these benchmarks, please download the Android or iOS app, and take a Speedtest®. Learn more about 5G provider performance in select cities here, and visit the Ookla 5G MapTM to see which providers are offering 5G in your area.

Editor’s note: This article was updated on July 28 to reorganize the content for clarity.

Ookla retains ownership of this article including all of the intellectual property rights, data, content graphs and analysis. This article may not be quoted, reproduced, distributed or published for any commercial purpose without prior consent. Members of the press and others using the findings in this article for non-commercial purposes are welcome to publicly share and link to report information with attribution to Ookla.

| December 6, 2021

Ookla Video Analytics Reveals the State of Global Video Experience


Video is essential to today’s internet across the world. We use it to watch shows and movies, stream live events and even keep up to date on our favorite cats on social media. Ookla® launched video testing in the Speedtest® app for iOS and Android earlier this year so consumers can measure the quality of their video experience. Already, millions of video tests have been initiated by consumers. Today we’re sharing some of that data to provide insight into video experience around the world, specifically, we’ve analyzed adaptive start time and highest overall video resolution over all mobile technologies, 5G and fixed broadband in select countries during Q3 2021.

Switzerland had the fastest adaptive start time for all mobile technologies, South Africa fastest for 5G

Video streaming services use adaptive bitrate technology

All modern video streaming platforms use adaptive bitrate technology to automatically adjust video quality based on network conditions and device capabilities in order to display the highest quality video that a device can support, while minimizing buffering and slow video start time. Speedtest Video Analytics provides deep insights and competitive benchmarking for device and network video streaming capabilities.

Adaptive start time — the time it takes for adaptive bitrate playback to initiate — allows us to see how quickly videos are loading. A 2012 study found that users will leave a video if it doesn’t begin playing within two seconds. We have to imagine in 2021, that timeframe is being squeezed even further. Our analysis shows how countries are performing against this important benchmark.
ookla_adaptive-start-time_all-mobile-tech_1121-01-3

Speedtest Intelligence® reveals that Switzerland had the fastest median adaptive start time for all mobile technologies combined among the countries we analyzed at 1.02 seconds during Q3 2021. South Korea and Norway were close behind at 1.07 seconds and 1.10 seconds, respectively. Five more countries achieved a median adaptive start time at or under 1.25 seconds during Q3 2021, including Hong Kong (SAR) and Croatia (1.17 seconds), Portugal (1.24 seconds), and Kuwait and Mexico (1.25 seconds). All but three of the remaining countries we surveyed achieved a median adaptive start time between 1.25 seconds and 2.00 seconds during Q3 2021 except Colombia (2.11 seconds), Saudi Arabia (2.12 seconds) and India (2.13 seconds).
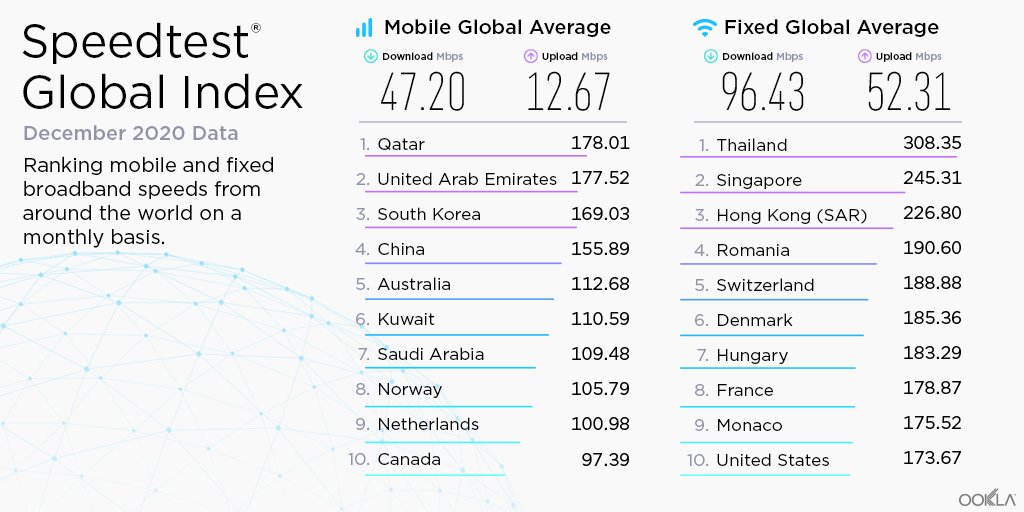
Most 5G-capable video tests showed blazing fast adaptive start times

ookla_adaptive-start-time_5g_1121-01

We’ve seen median 5G download speeds zoom ahead of traditional mobile technologies, even reaching median download speeds 10 times faster than on 4G LTE. It’s no surprise Video Analytics revealed adaptive start time was often much faster on 5G than on all mobile technologies combined. Five countries achieved median adaptive start times faster than 1.00 second during Q3 2021: South Africa (0.73 seconds), Switzerland (0.79 seconds), Norway (0.82 seconds), Hong Kong (0.86 seconds) and South Korea (0.90 seconds). Video Analytics shows the only countries with a median 5G adaptive start time slower than 1.25 seconds were the United States (1.27 seconds), Brazil (1.42 seconds) and Saudi Arabia (1.94 seconds).

Five countries’ adaptive start time improved more than 0.25 seconds on 5G compared to all technologies combined during Q3 2021: the Philippines (-0.62 seconds), South Africa (-0.53 seconds), Brazil (-0.39 seconds), Hong Kong (-0.31 seconds) and Norway (-0.29 seconds). However, several countries showed a less than 0.20 second improvement when comparing adaptive start rate on 5G to that on all technologies combined during Q3 2021: the U.S. (-0.14 seconds), Bahrain (-0.16 seconds), South Korea and Saudi Arabia (-0.17 seconds), and the United Kingdom (U.K.) and France (-0.18 seconds).

Adaptive start time is not always faster on fixed broadband

ookla_adaptive-start-time_fixed_1121-01-1

Speedtest Intelligence showed a narrower range for adaptive start time on fixed broadband than on 5G with every country on our list achieving between 0.67 and 1.85 seconds during Q3 2021. Ten countries on our list achieved a median adaptive start time faster than 1.00 second during Q3 2021: South Korea (0.67 seconds), Norway (0.74 seconds), Hong Kong (0.75 seconds), Switzerland (0.76 seconds), the U.K. (0.79 seconds), France (0.86 seconds), the U.S. (0.87 seconds), Spain (0.88 seconds), Portugal (0.89 seconds) and Italy (0.98 seconds).

Twenty out of the 24 countries we surveyed had a median fixed broadband adaptive start time faster than 1.50 seconds during Q3 2021. Colombia (1.50 seconds), Egypt (1.59 seconds), Turkey (1.64 seconds) and Saudi Arabia (1.85 seconds) were the only countries with a median adaptive start time slower than 1.50 seconds on fixed broadband during Q3 2021.

South Korea video tests reached 4K resolutions at the highest proportion on mobile and fixed broadband

Video resolution is incredibly important in the experience of streaming video and the higher the resolution, the more definition and clarity we are able to see. These days, the difference between an SD and 4K experience is gigantic. Resolution is measured in the numbers of pixels in a 16:9 ratio, with 2160 pixel height representing a 4K picture. Video Analytics measures the resolution rates, which represent the portion of samples that reach a particular resolution. In this analysis, we evaluated the resolution rates for 4K, typically the highest resolution users will need.

ookla_highest-video-resolution_all-mobile-tech_1121-01

Using Speedtest Intelligence, we found South Korea and Switzerland had the highest overall successful resolution rates for all mobile technologies combined during Q3 2021, reaching 4K resolutions 80.4% and 80.3% of the time, respectively. Croatia (79.7%), Kuwait (77.4%) and Norway (75.4%) were the only other countries on our list that achieved 4K video resolution more than 75.0% of the time. Only seven countries on our list did not reach a 4K resolution at least 50% of the time on all mobile technologies combined: the Philippines (38.4%), India (41.1%), Indonesia (44.8%), Colombia (45.3%), Mexico (46.3%), Russia (49.7%) and Egypt (49.9%).

5G led to higher video resolution, but 4K mobile devices still remain rare

ookla_highest-video-resolution_5g_1121-01

5G provided a higher resolution for mobile devices during Q3 2021 than all technologies combined. Every country we surveyed reached a 4K resolution over 80.0% of the time over 5G. In fact, six out of the 14 countries we surveyed for 5G achieved a 4K resolution more than 90.0% of the time, including South Korea (95.9%), Norway (94.5%), Kuwait (94.0%), South Africa (93.6%), Switzerland (92.6%) and France (91.5%). On the lower end of our list, only Italy (81.9%), Brazil (83.9%) and the U.S. (83.9%) achieved 4K resolutions less than 85.0% of the time.

While this is great news for the future of mobile devices, 4K resolutions in mobile devices still aren’t common: Sony is the only popular device manufacturer producing 4K mobile devices. In the meantime, users who can connect to 5G through either a hot spot or fixed wireless access (FWA) will reap the benefits of being able to stream on 4K devices like computers, televisions or tablets.

South Korean fixed broadband delivers ultra-high definition resolutions

ookla_highest-video-resolution_fixed_1121-01

Speedtest Intelligence reveals South Korea had the highest fixed broadband 4K resolution rate among countries surveyed at 92.2% during Q3 2021. Other countries that achieved 4K resolution rates above 85.0% on fixed broadband during Q3 2021 included: Switzerland (89.4%), Hong Kong (87.6%), Norway (87.1%) and the U.S. (86.7%). Every other country in our analysis achieved 4K resolution rates between 65.0% and 85.0%, except Egypt (49.5%), Indonesia (52.5%), the Philippines (64.2%) and Turkey (64.3%).

Video Analytics gives you the information you need about your video playback

We’re excited to share more about video performance and quality of experience using Video Analytics in the coming months. In the meantime, if you want to learn more about Video Analytics and how it can help you benchmark and improve your network, please join our upcoming webinar, December 9 by clicking here.

Ookla retains ownership of this article including all of the intellectual property rights, data, content graphs and analysis. This article may not be quoted, reproduced, distributed or published for any commercial purpose without prior consent. Members of the press and others using the findings in this article for non-commercial purposes are welcome to publicly share and link to report information with attribution to Ookla.

| December 21, 2021

Oman’s Mobile Performance Is Blazing Ahead and 5G Will Boost Speeds


pdf_download_button_ar-1

Middle Eastern countries — particularly within the oil-rich Gulf — have been investing heavily in expanding and upgrading their mobile networks over the past few years. That’s been paying off for consumers across the region, with United Arab Emirate (U.A.E.) operator Etisalat being awarded with the World’s fastest mobile network operator in 2020 and Gulf nations holding four of the top 10 spots on the Speedtest Global Index during September 2021. With Oman rising in the mobile rankings and Muscat placing in the top 10 world capitals for fastest 5G during Q1-Q2 2021, Oman’s rise as a potential mobile powerhouse merits further investigation.

This article examines the state of Oman’s mobile performance during Q3 2021, including which provider had the fastest mobile performance, Oman’s 5G evolution, a governorate-level mobile analysis and snapshot of provider performance in Muscat using Ookla® Cell Analytics.

Oman is behind its regional partners for mobile performance during Q3 2021, but speeds are rapidly accelerating

ookla_download-comparison_oman_1021_en

Speedtest Intelligence® revealed the U.A.E. had the fastest median mobile download speed among Oman’s regional trading partners at 109.92 Mbps during Q3 2021. Oman was a hair faster than Bahrain at 46.85 Mbps. Jordan and Iraq had the slowest median download speeds on this list at 18.82 Mbps and 33.74 Mbps, respectively.

Ooredoo overtook Omantel as Oman’s fastest mobile operator

ookla_mobile_performance_oman_1121_en

Competition between Oman’s top providers, Ooredoo and Omantel, has been fierce over the past year. However, Ooredoo pulled ahead of Omantel during Q3 2021, achieving a median mobile download speed of 48.22 Mbps to Omantel’s 44.56 Mbps. Ooredoo also had the fastest median mobile upload speed during Q3 2021 at 13.74 Mbps to Omantel’s 12.00 Mbps.

Ooredoo outpaced Omantel for fastest 5G download speed

ookla_5G_performance_oman_1121_en

Ooredoo also achieved the fastest 5G in Oman during Q3 2021, achieving a median 5G download speed of 346.37 Mbps to Omantel’s 228.25 Mbps. The fastest median 5G upload speed during Q3 2021 was much closer with Ooredoo achieving a median upload speed of 27.37 Mbps to Omantel’s 24.78 Mbps.

Ooredoo beat Omantel for 4G Availability, Omantel pulled ahead for 5G Availability

ookla_4G-5G-availability_oman_1121_en

Competition for the highest 4G and 5G Availability — with 4G Availability representing the proportion of users who spend most of their time on 4G or greater networks and 5G Availability representing the proportion of users who spend most of their time on 5G networks — was also close in Oman during Q3 2021. Ooredoo had the highest 4G Availability at 84.3% to Omantel’s 78.4%. For 5G Availability there was no statistical winner, but Omantel achieved 8.1% and Ooredoo achieved 7.4% during Q3 2021.

Muscat had the fastest mobile download speed among Oman’s governorates

ookla_mobile-performance_oman_map_1121_en

We used data from Speedtest Intelligence to examine Oman’s 11 governorates and found Muscat Governorate had the fastest median mobile download speed at 66.96 Mbps during Q3 2021. Al Buraymi Governorate was next on this list at 47.22 Mbps, followed by Al Batinah North Governorate (46.74 Mbps), Al Batinah South Governorate (44.68 Mbps) and Ad Dakhiliyah ‍Governorate (42.49 Mbps). Ash Sharqiyah North Governorate, Dhofar Governorate and Ad Dhahirah Governorate and Ash Sharqiyah South Governorate achieved between 34.00 Mbps and 39.00 Mbps. Al Wusta Governorate had the slowest median download speed at 33.21 Mbps. Musandam Governorate lacked sufficient data for inclusion.

Four governorates achieved the 4G Availability above 80% during Q3 2021

ookla_4g-availability_oman_map_1121_en

Speedtest Intelligence found that there was no statistical winner for highest 4G Availability in Oman during Q3 2021, but Muscat Governorate (84.4%), Al Batinah North Governorate (83.5%), Al Batinah South Governorate (83.0%) and Dhofar Governorate (82.8%) all achieved 4G Availability above 80%. All the rest of Oman’s governorates had 4G Availability between 72.0-80.0% except Al Wusta Governorate, which had the lowest 4G Availability in Oman at 57.9% during Q3 2021.

Signal strength is competitive in Muscat

We identified several key locations in Muscat to highlight using Cell Analytics data from Q2-Q3 2021. Each of these maps shows the strongest 4G reference signal received power (RSRP) in a given area, which can help mobile operators locate areas where they can improve their networks. Cell Analytics can identify the strongest RSRP by mobile network provider for a given area if there is a statistically-significant winner and color codes that plot bin to the provider’s color. Provider-level maps show the performance of individual providers for a given area, with pink and red showing a strong signal and blue indicating a weak signal.

Al Mawaleh South and Al Mouj Muscat

Located west and northwest of the Muscat International Airport, Al Mawaleh South and Al Mouj Muscat are high-traffic areas frequented by many Omani residents. The image below shows the strongest 4G LTE RSRP signal strength by provider with the dark blue representing Omantel and purple representing Ooredoo. As evidenced by the bands of solid colors, Omantel and Ooredoo have a strong presence by the major throughways in this area, while competition throughout the neighborhood is tight, particularly around the City Centre Muscat mall just west of the airport.

cell-analytics_best-rsrp_al-mawaleh-south_1021_en

The maps below show areas where each top provider has high and low signal strength data. Omantel had areas of high signal strength (pink and red), particularly on the major throughways and crowded shopping areas. Omantel also had a strong presence near the Al Mouj Marina, as well as key locations at the Seeb Stadium and City Centre Muscat mall. Ooredoo had deployments in similar locations with a strong signal near 18th November St., just north of the airport.

cell-analytics_rsrp_al-mawaleh-south_1021_en

Ruwi and Al Wadi Al Kabir

Located in central Muscat, Ruwi and Al Wadi Al Kabir Industrial Estate represent the commercial heart of Muscat. As the images that follow show, it’s clear mobile operators have recognized how valuable this valley is to Omanis. Ooredoo had a strong presence in this area during Q2-Q3 2021, particularly through the central throughways, downtown core and central Al Wadi Al Kabir Industrial Estate. Omantel had strong signal strengths along most of Bait Al Falaj St. as well as south of this map.

cell-analytics_best-rsrp_al-wadi-al-kabir_1021_en

It comes as no surprise then that Ooredoo showed very strong 4G LTE signal strength near the central and southwest areas of this map during Q2-Q3 2021, as well as a few pockets of strong RSRP throughout. Interestingly, there were a few weaker areas between Ruwi St. and 41 Way near the center of the map. Omantel had strong signal strength near the north of this map, the southern half and central core, though there were a few areas of weaker signal strength (green and blue) in the west and center.

cell-analytics_rsrp_al-wadi-al-kabir_1021_en

Al Ghubrah South, Al Ghubrah Ash Shamaliyah, Al Azaiba North, Al Azaiba South and Al Khuwayr South

Home to the busy downtown Muscat area as well as the Sultan Qaboos Grand Mosque, national Omani soccer stadium and beautiful beaches, this central Muscat area contains major local and international points of interest. The map below shows the provider with the strongest RSRP signal strength for a given area during Q2-Q3 2021. We saw a seemingly even competition between Ooredoo and Omantel, with each provider showing stronger RSRP signal strength in bands near the major highway and major sightseeing activities.

cell-analytics_best-rsrp_al-ghubrah_1021_en

However, when we look at each individual mobile operators’ 4G LTE RSRP, we see the area on Sultan Qaboos St. that includes Oman Avenues Mall, LuLu Hypermarket-Bousher, Muscat Grand Mall, Sharaf DG Muscat Mall and IKEA Muscat was fiercely competitive. Ooredoo had strong signal strength near the north of this area while Omantel had strong signal strength near in the middle of this area, fading slightly within the shopping mall areas. Omantel also had strong signal strength along most of Qaboos St. and lower signal strength within many of the neighborhoods beyond that core roadway. In that last respect, Ooredoo seemed to be doing a little better with more red showing in some of the neighborhood areas where Omantel fell short.

cell-analytics_rsrp_al-ghubrah_1021_en

Oman’s future mobile experience is faster, competitive 5G

Like many of its peers in the Gulf Cooperation Council (GCC), Oman has set in place a strategic vision for its economic development as it looks to diversify its economy away from a reliance on oil. Its e.Oman 2030 strategy highlights the realization of a high-speed, high density network infrastructure as a key enabling factor in achieving its goals of increased digital literacy and skills, the development and adoption of e-government services, and the digital transformation of Omani industries.

In October 2019, Oman’s Telecommunications Regulatory Authority (TRA) outlined its 5G roadmap in support of this objective. The regulator has granted Omantel and Ooredoo rights to a 100 MHz block of spectrum each in the C-band for 5G services, while reserving an additional 100 MHz block for a new entrant. The regulator also waived annual frequency fees for a year to encourage investment, while the operators undertook deploying 4,400 5G base stations over the following five years. According to the RTA, a total of 1,300 5G sites had been deployed in the market as of June 2021, equating to 5G coverage of 40% of the population. With 5G Availability in the market below 10%, it’s clear that operators need to do more to encourage 5G adoption.

Oman Future Telecommunications (OFT), operating under the Vodafone Oman brand, plans to launch commercial services in late 2021. OFT signed a strategic partnership with Vodafone in 2019 and was granted a license in 2021 to become Oman’s third network operator. OFT recently signed a managed services agreement with Ericsson to build and operate a greenfield 4G and 5G core and radio access network and already has agreements in place with Oman Tower Company and Oman Broadband to accelerate its network build. Increased competition in the market, particularly when 5G adoption is still in its early stages, will bring renewed focus on network speed as a differentiator. This is backed up by Vodafone Oman’s aggressive network rollout with Ericsson. Vodafone‘s experience in India — where the early 4G era and entrance of Reliance Jio saw price wars that led to both network operator consolidation and the amassing of large debt burdens by operators in the market — is likely to dissuade Vodafone from pursuing an aggressive pricing strategy in Oman.

Internet speeds in Oman are blazing forward and we’ll be watching closely to see how they change. Click here to learn more about Speedtest Intelligence and Cell Analytics.

Ookla retains ownership of this article including all of the intellectual property rights, data, content graphs and analysis. This article may not be quoted, reproduced, distributed or published for any commercial purpose without prior consent. Members of the press and others using the findings in this article for non-commercial purposes are welcome to publicly share and link to report information with attribution to Ookla.