| February 8, 2021

Introducing Video Testing from Speedtest


Video. Can you imagine the internet without it? Truth is that most of us spend much of our online time consuming video of one sort or another. Given how much time we all spend streaming video, the ability to directly measure video experience is an important tool for network management. We’re excited to announce that Ookla® Speedtest® has a new video test that can help you measure the quality of your streaming experience before you queue up your next video. Video testing is free and currently available on Speedtest for iOS with more platforms coming soon.


Why you need a dedicated video test

Speedtest has been measuring overall network bandwidth to provide reliable internet performance data for over a decade. While network speed certainly impacts your video experience, providers around the world sometimes limit the resolution or prioritize video traffic differently than other traffic. This means that video can perform very differently than the rest of the things you do online, no matter how fast the download speed of your network.

Enter video testing from Speedtest, which plays an actual video to specifically measure the performance of video streaming on your network at any time. An accurate video measurement requires an actual video to be played, because video traffic cannot be simulated across a network.

Get actionable results

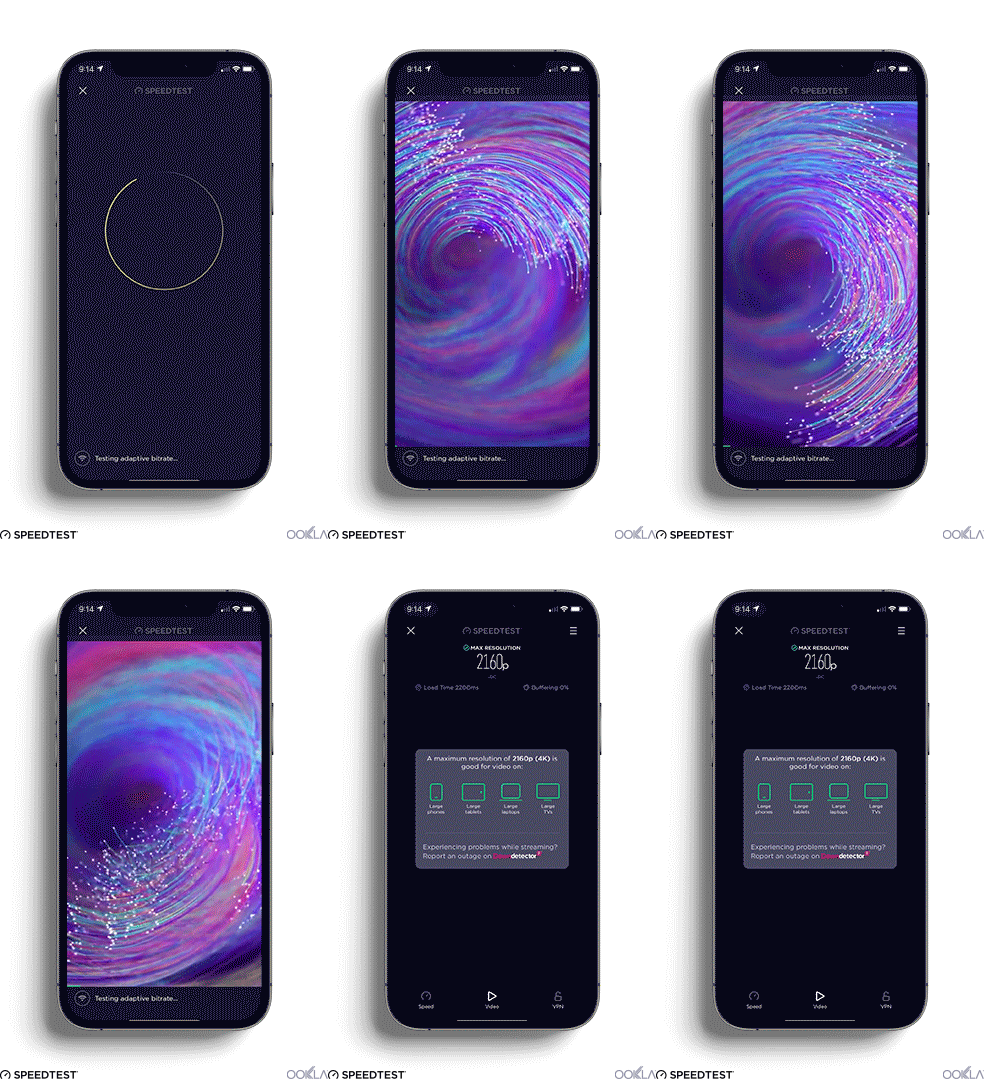
Streamed video content is typically delivered via adaptive bitrate technology, which adjusts the quality of the video stream based on network conditions. A video test measures this adaptive bitrate to tell you the maximum resolution, load time and buffer you should be able to expect given current network conditions. It’s a great way to assess whether now is a good time to settle in for that video you’ve been waiting for or if you’ll be stuck buffering for the duration.

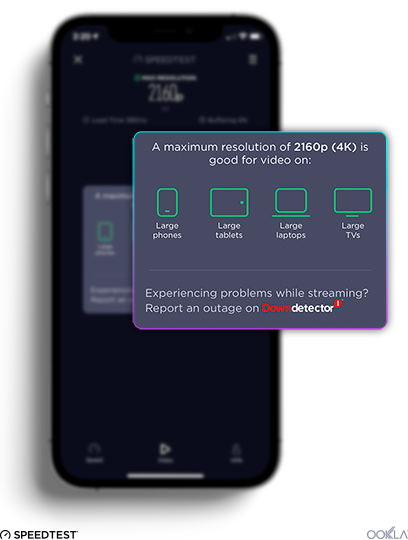
A video test will also tell you which devices work best at that performance level. This can help you decide whether to try to stream on your largest TV or if you should use your phone instead.


If the video test determines your network cannot successfully stream the maximum resolution supported by your device, you most likely have a network problem. Taking a Speedtest will let you know whether you’re getting lower than expected network bandwidth needed to stream your video. If your video test results reveal that you are frequently not able to stream well, you can use your video test history to advocate for yourself when talking to your provider.

Where to find video testing in the Speedtest iOS app

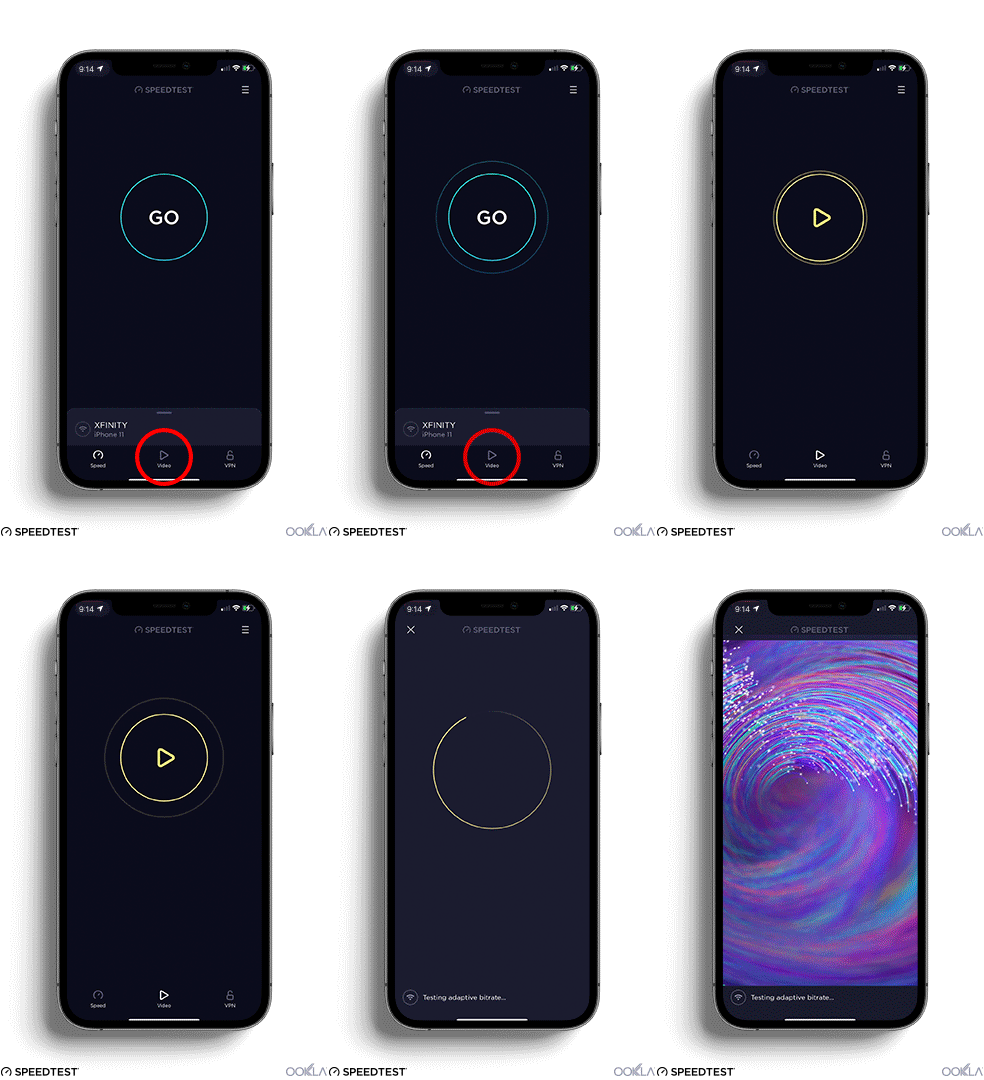
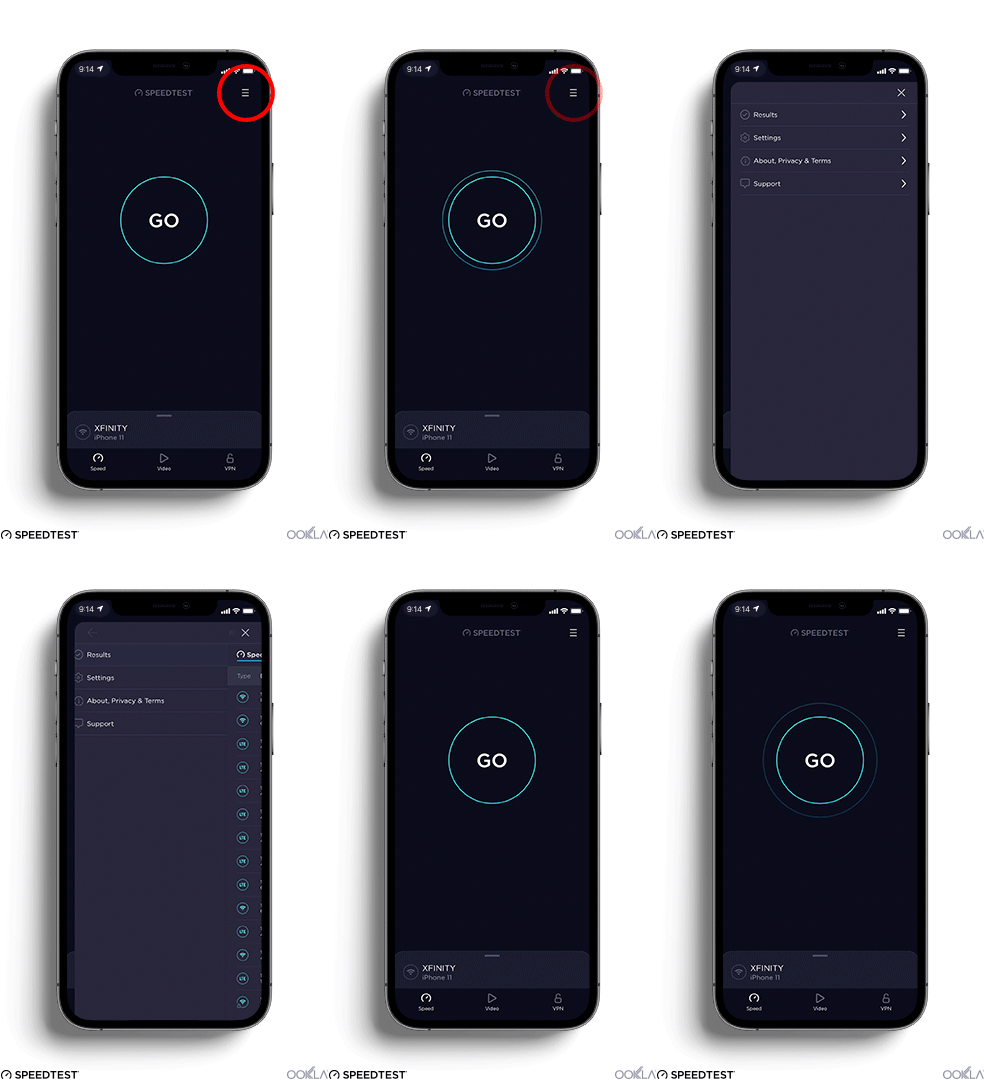
Video testing is already part of the Speedtest app on iOS and will be available on more platforms coming soon. The test is conveniently accessed from a tab at the bottom of the app. Just tap the video icon in the menu bar at the bottom of the app to get started.


Along with the new video test, we’ve also moved some other things around in the Speedtest app to provide a better organized user experience.

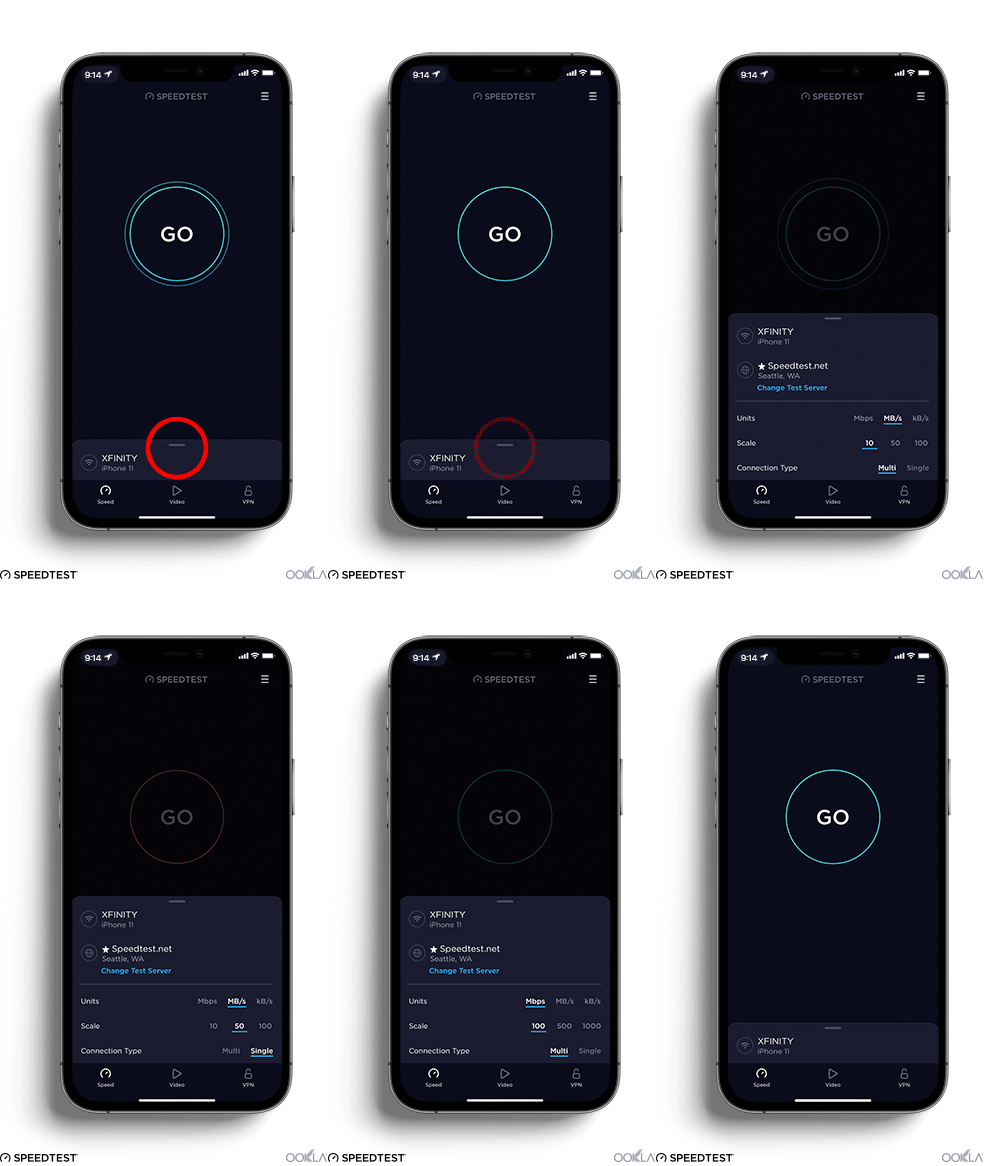
  • Network and device information, server selection, and Speedtest settings preferences are available in the sliding drawer at the bottom of the speed tab.


  • Your results history (including video test results), app settings, privacy policy and terms of use, and support resources are available in the hamburger menu in the upper corner of the app.


Try video testing on Speedtest for iOS today by opening the Speedtest app on your phone (or downloading it from the Apple App Store if you don’t already have it).


If the video test finds that the video streaming quality meets or exceeds the resolution supported by your device and you are still unable to stream your video, you will have the option to continue on to Ookla’s Downdetector® to see what online services are currently experiencing any issues.

Ookla retains ownership of this article including all of the intellectual property rights, data, content graphs and analysis. This article may not be quoted, reproduced, distributed or published for any commercial purpose without prior consent. Members of the press and others using the findings in this article for non-commercial purposes are welcome to publicly share and link to report information with attribution to Ookla.

| February 11, 2021

Emerging 5G Market Keeps Canada in the Global Top 10 for Mobile Speeds


5G may still feel like an emerging technology in Canada as it’s less than a year old and is only available in limited cities. However, operators are actively working to expand coverage, and the country’s 5G speeds are already impressive. This article explores how much of an improvement 5G represents over 4G, which provinces and cities are seeing the most benefit and how individual operators are performing over 5G.

5G is 205% faster than 4G in Canada

Comparing Median 5G and 4G Performance in Canada
Speedtest Intelligence® | Q4 2020
5G Download (Mbps) 4G Download (Mbps) % Change
Canada 169.46 55.50 205.3%

Mobile speeds in Canada are strong, with the country consistently ranking in the top ten globally for mobile download speed over the past year according to the Speedtest Global Index™. 5G can only improve overall mobile speeds in Canada, and data from Speedtest Intelligence® reveals Canada’s median download speed over 5G was 205.3% faster than that over 4G during Q4 2020.

Bell was the fastest operator for 5G in Canada

5G-performance_canada_operator_0221_en

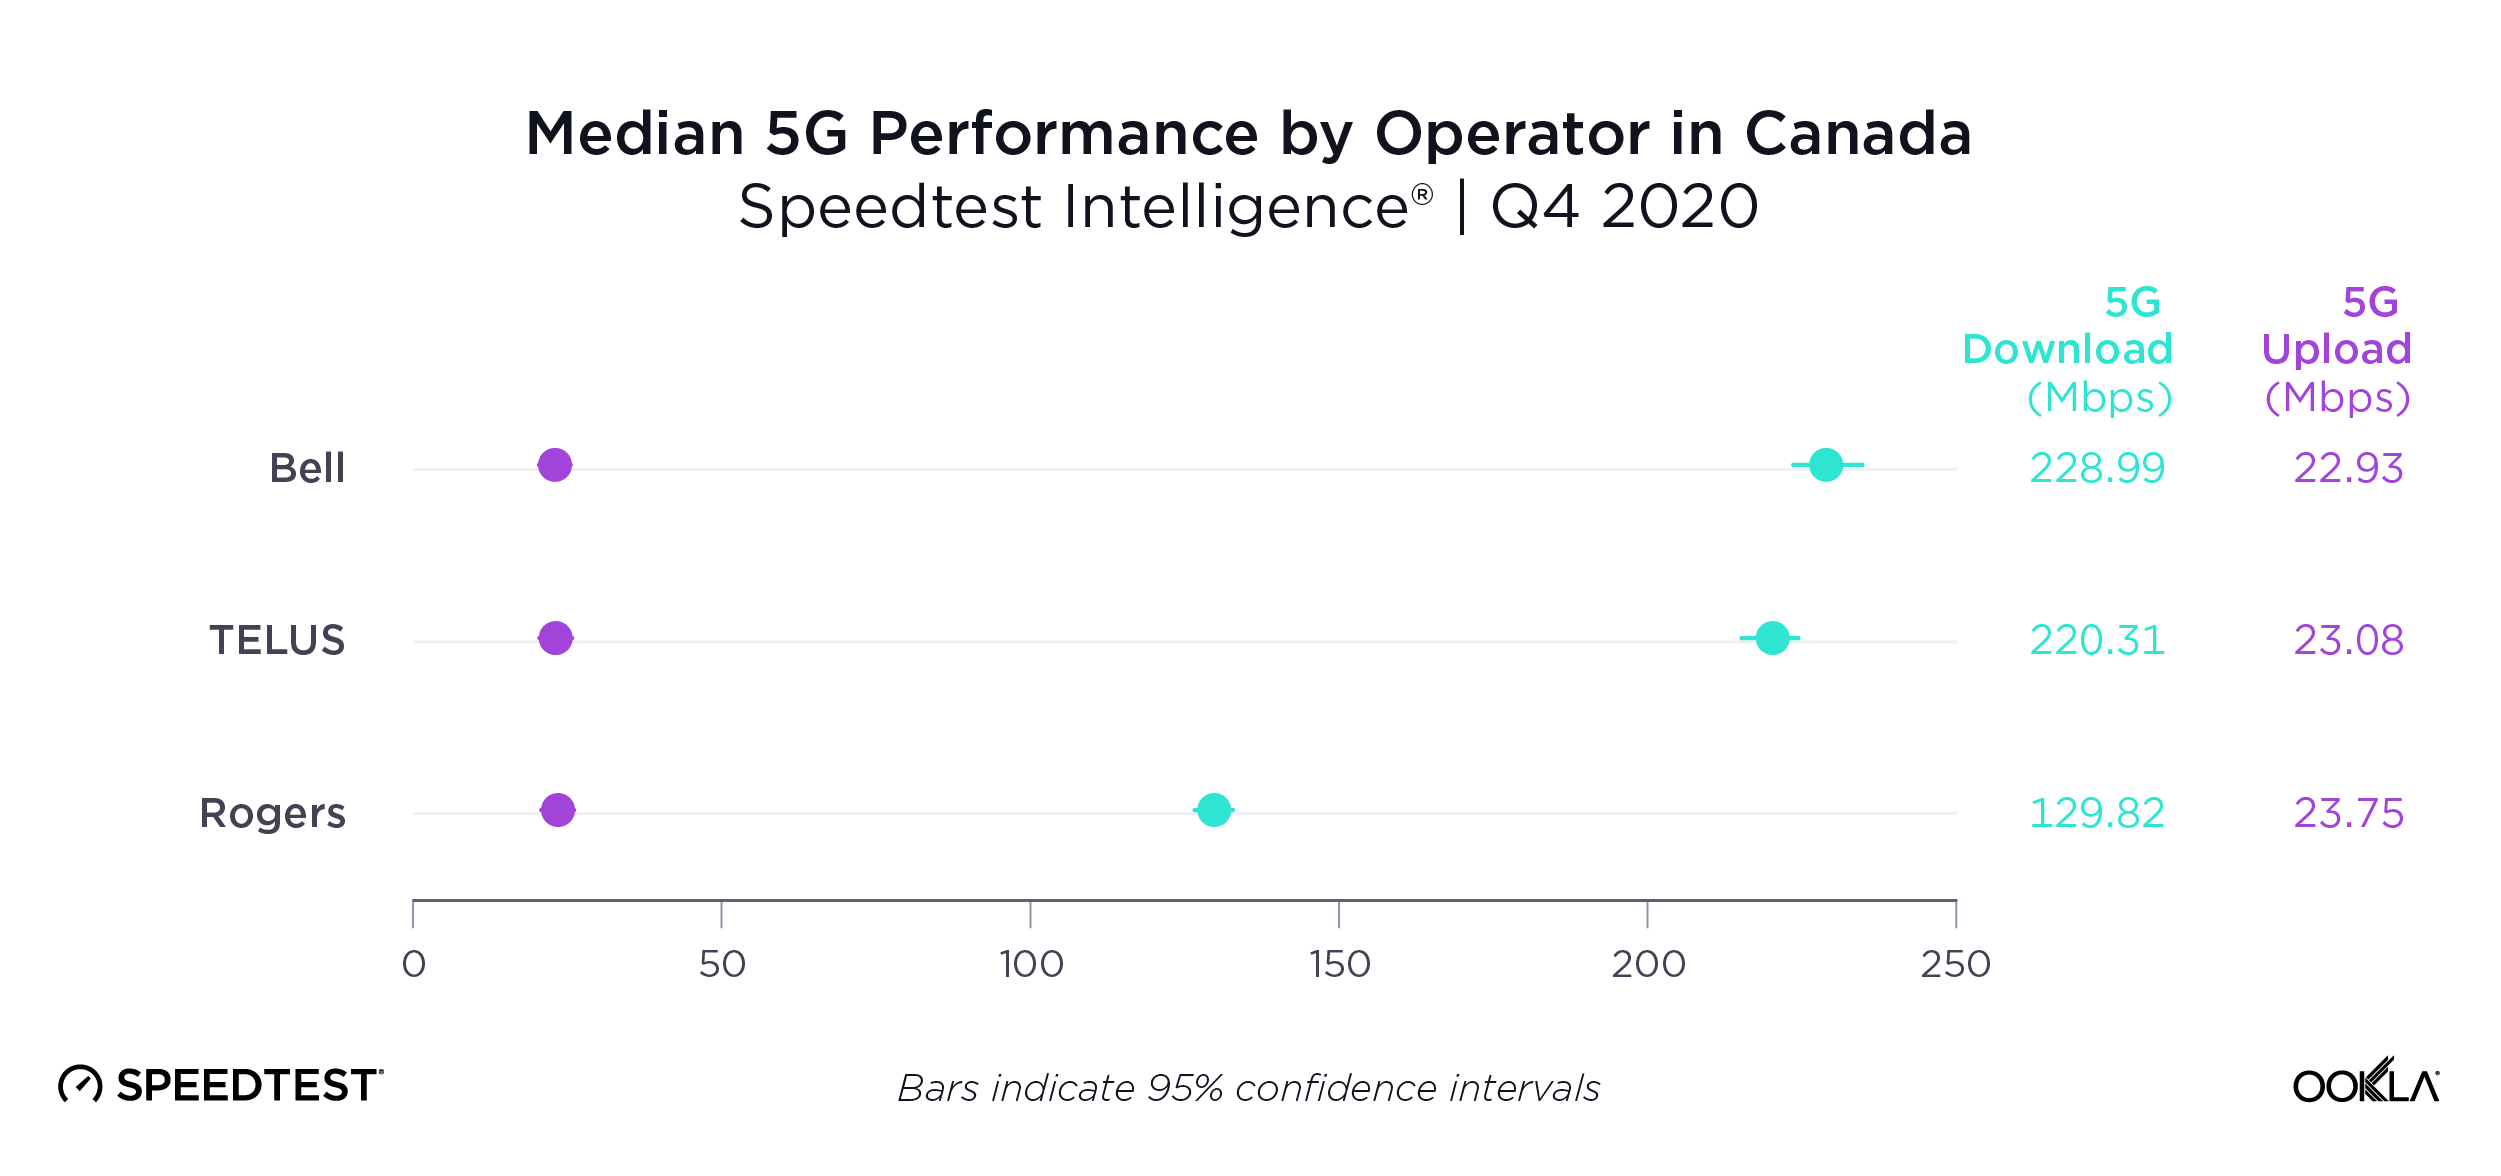
As reported in our Canada Market Analysis, Bell was the fastest operator for 5G in Canada in Q4 2020 with a median download speed of 228.99 Mbps. TELUS was a close second and Rogers third.

Rogers had the highest time spent on 5G in Canada

5G-time-spent_canada_operator_0221

We calculated the proportion of time that users with 5G-capable devices spent on 5G in Canada and found that Rogers had the highest 5G Time Spent during Q4 2020 at 27.0%. TELUS had the second highest 5G Time Spent in Canada at 21.0% and Bell was third at 12.7%. Time Spent includes time spent on both 5G and 5G roaming.

Over the past several months Canadian operators have continued to expand their 5G footprints, bringing 5G network capabilities to users across many new cities and towns. All major operators have now launched non-standalone 5G deployments leveraging FDD FR1 spectrum assets across low, mid and high bands.

Equipped with 2.5 GHz spectrum to spare, Rogers launched a 5G network in various cities a year ago, now reaching over 160 communities across Canada. With the addition of newly acquired 600 MHz licenses, the operator is looking to deliver even broader coverage and capacity. Recently, Rogers announced the rollout of their standalone 5G core network, which will eventually allow the operator to deliver even more benefits of this technology to users, including ultra low latency and network slicing.

TELUS and Bell utilized AWS-3 spectrum allocation for their initial 5G launch back in June. The operators have been working in close partnership with Ericsson and Nokia to improve network efficiency and user experience.

Canada’s upcoming spectrum auction will unlock a significant amount of bandwidth in the 3.5 GHz range, which should deliver on the promise of greater speeds. It’s worth noting that the current generation of flagship devices powered by Qualcomm Snapdragon X60 5G Modem-RF System are capable of FDD+TDD 5G aggregation, which streamlines the process of adding the soon to be available 3.5 GHz channels on top of the existent FDD 5G coverage layer. This should provide a stepping stone to standalone 5G, and much greater capacity across the 5G footprint.

British Columbia has the most cities with 5G deployments

Ookla_Canada_5G_Deployment_Map_0221-1

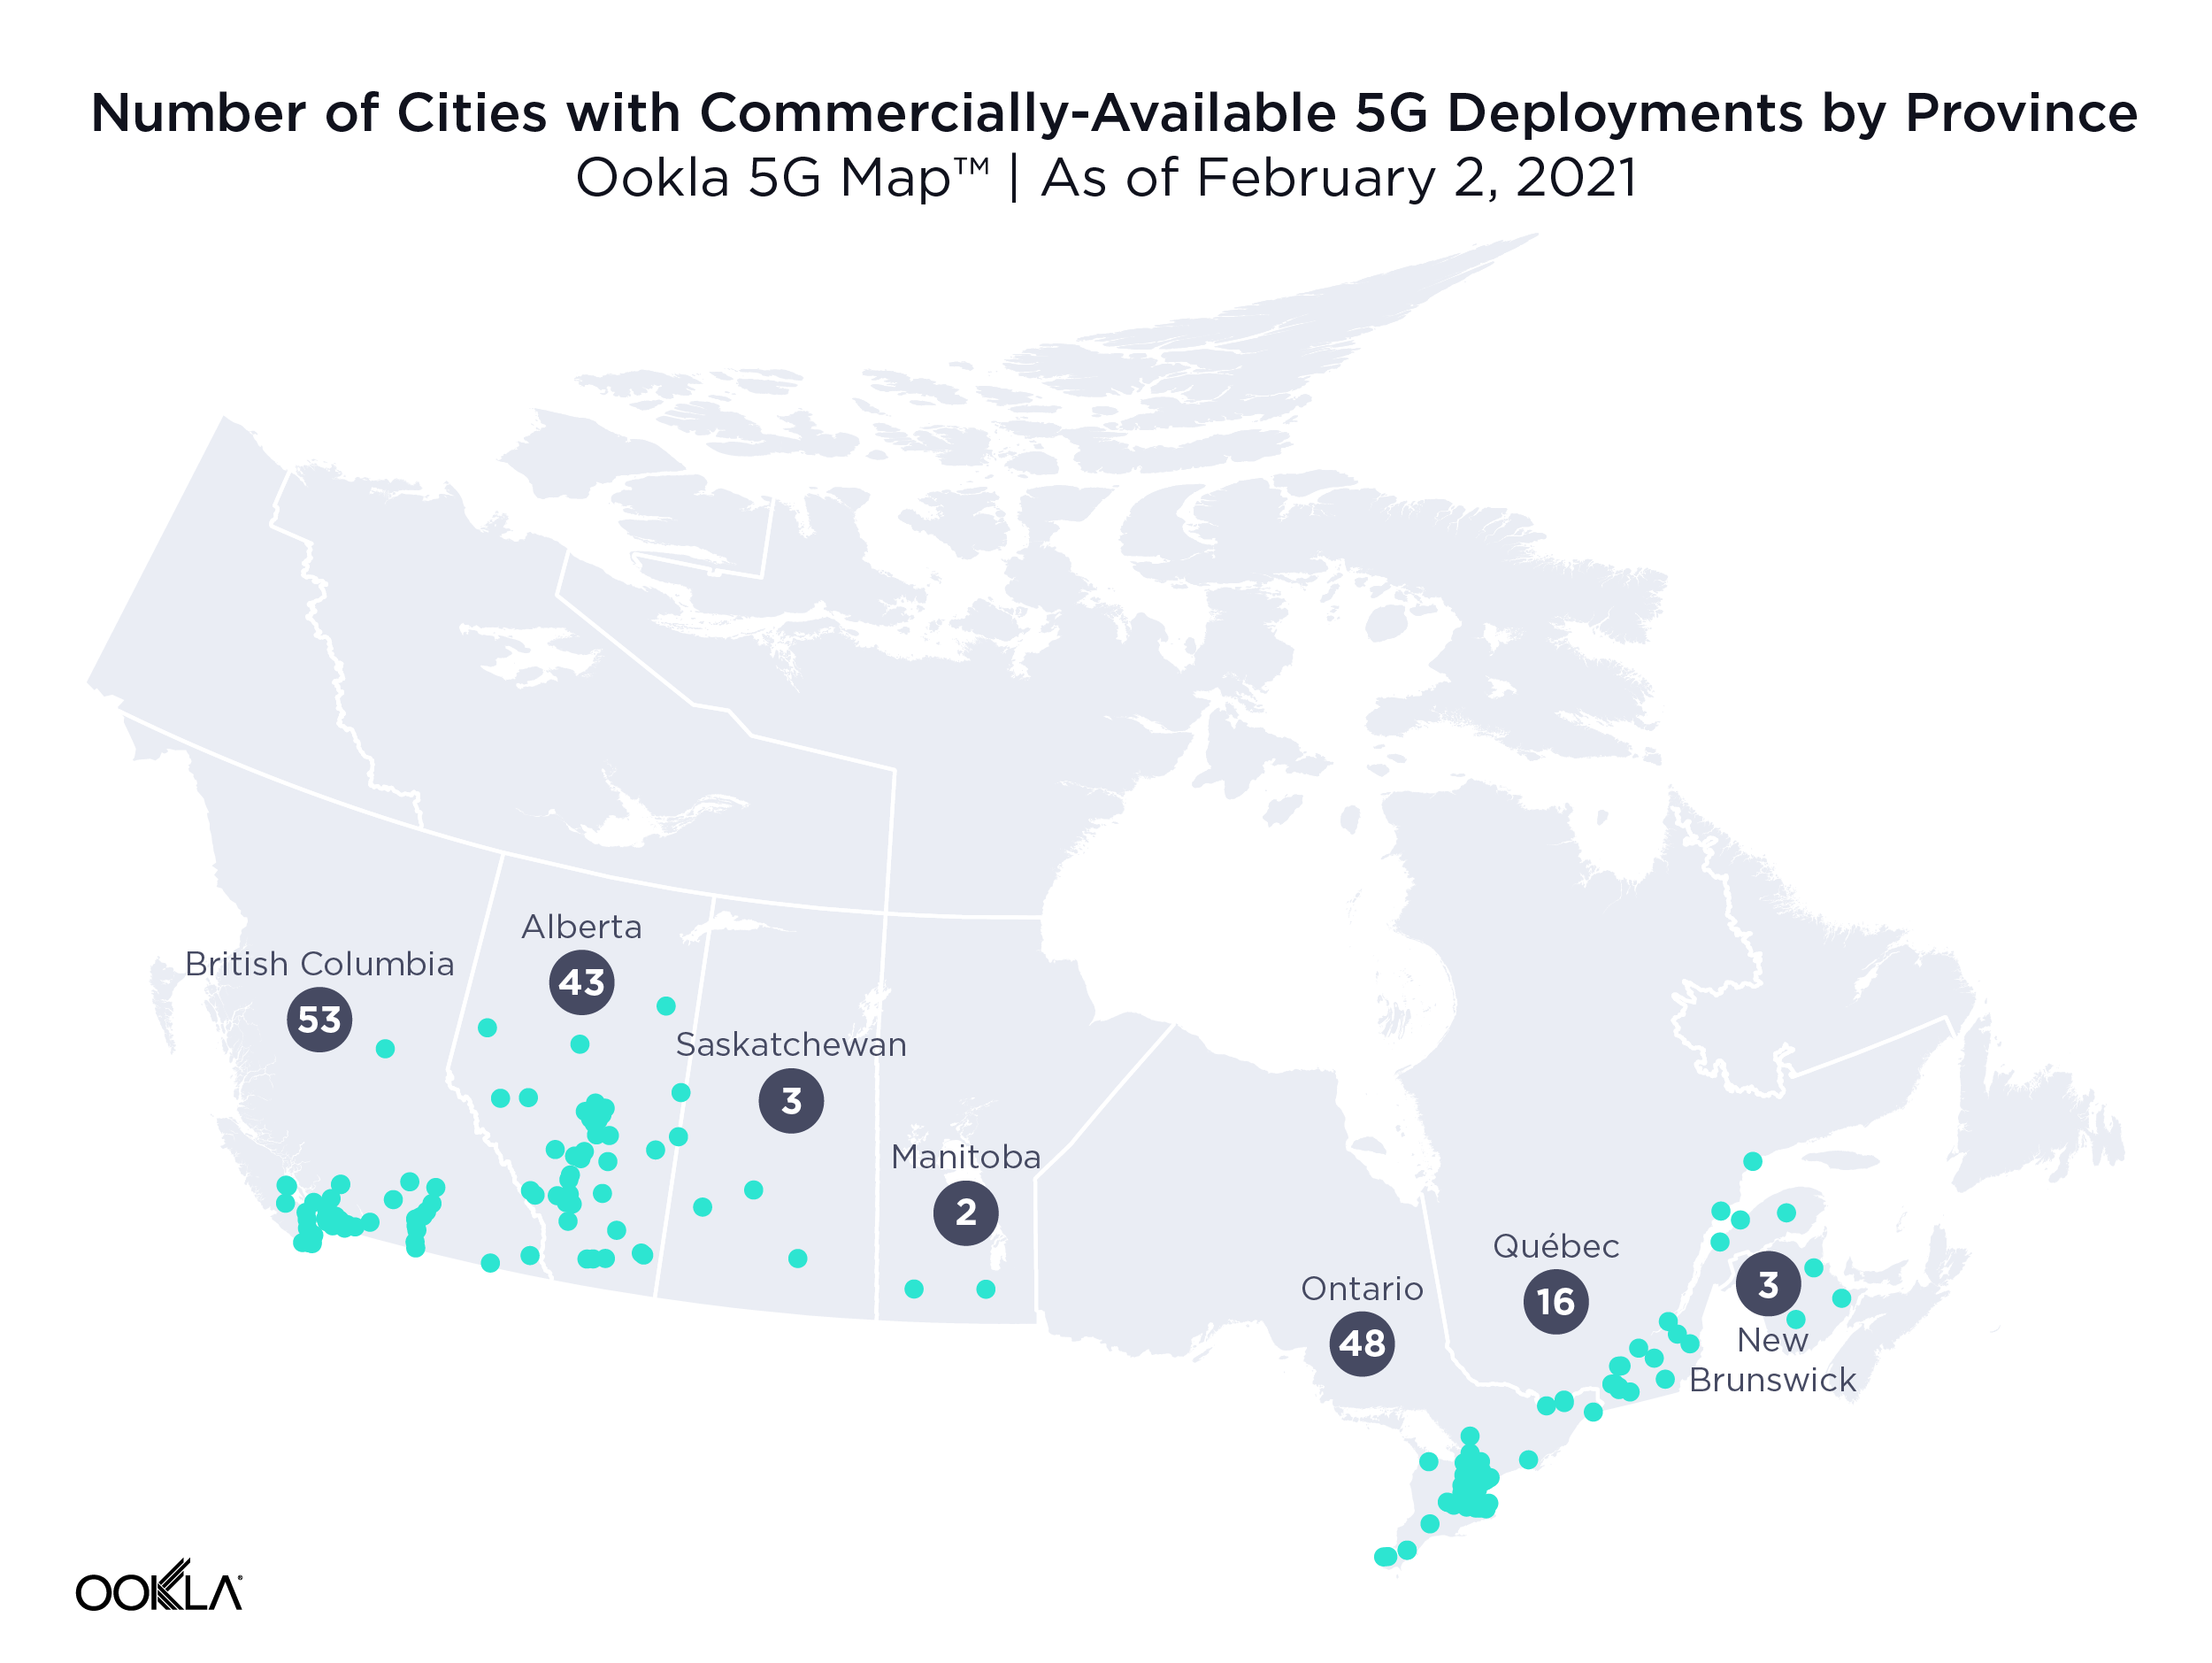
According to the Ookla 5G MapTM, which shows the location of 5G deployments across the globe, British Columbia showed the largest number of cities with commercially available 5G deployments in Canada, as of February 2, 2021. Ontario was second and Alberta third (we included Lloydminster in Alberta’s count).

Québec and Alberta had the fastest 5G download speed

5G-performance_canada_province_0221_en

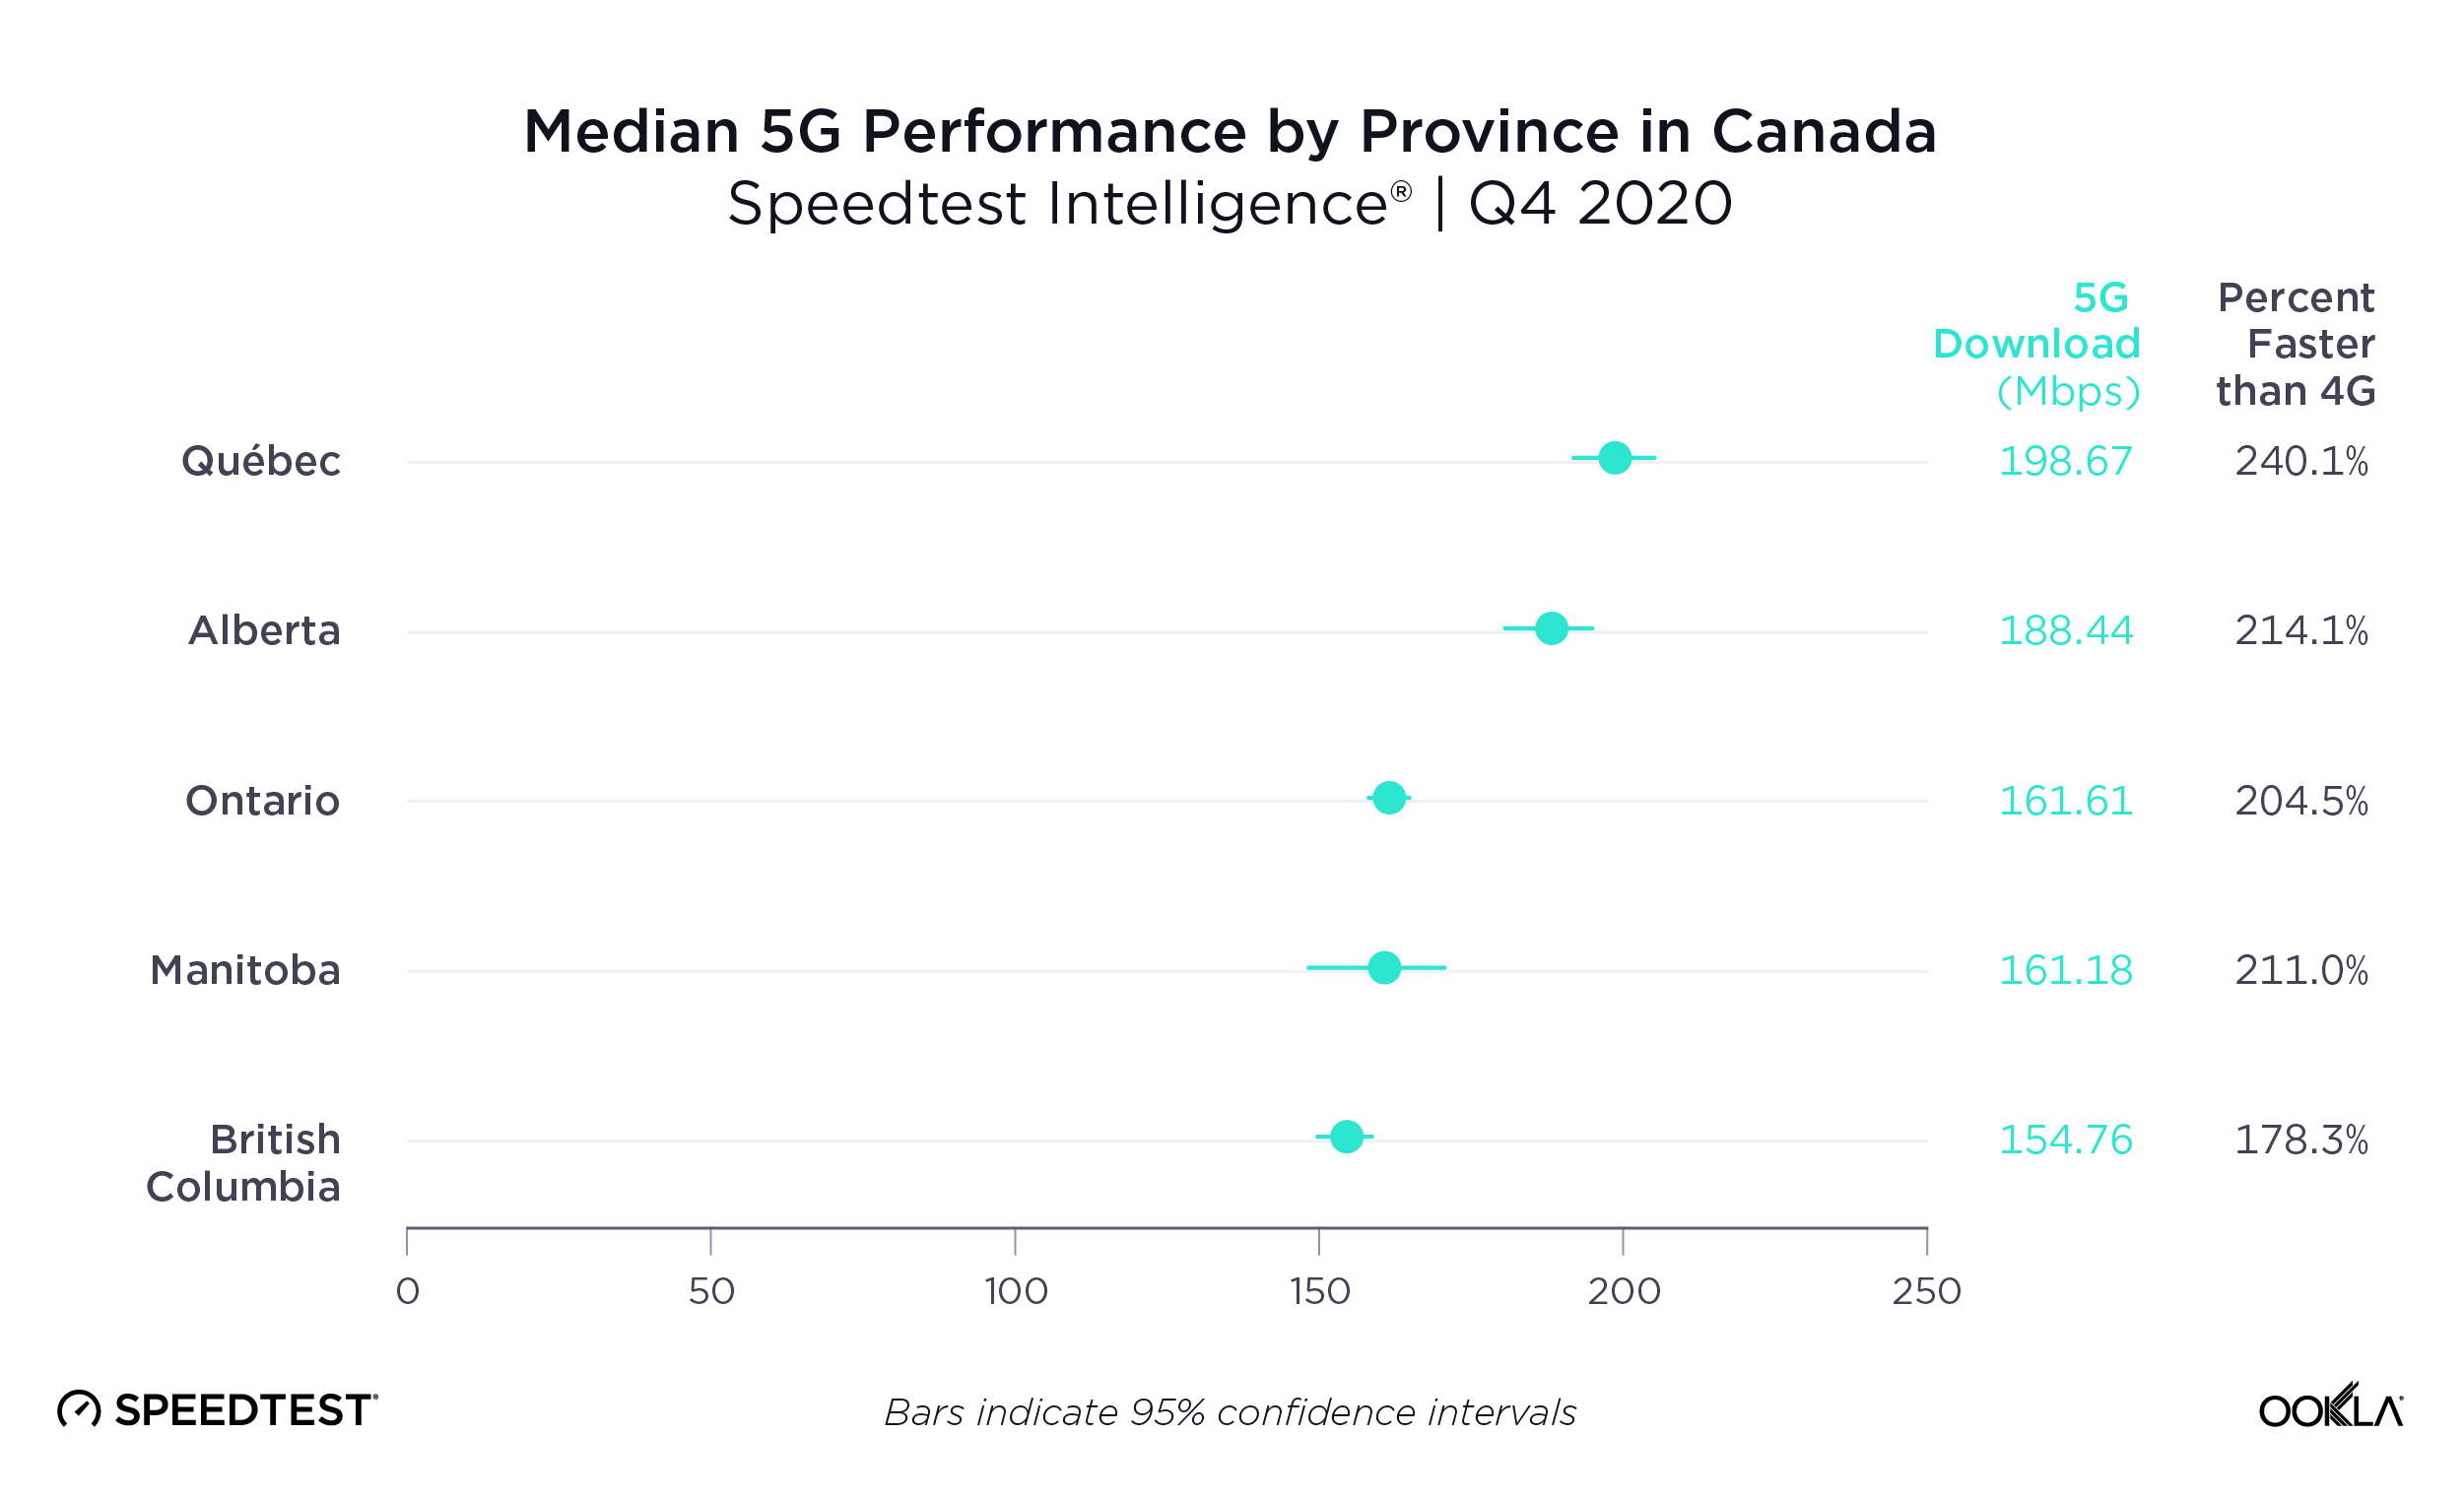
Data from Speedtest Intelligence reveals Québec and Alberta had the fastest median download speeds over 5G during Q4 2020 among Canadian provinces with sufficient 5G samples. The confidence intervals in the chart show that most provinces have comparable 5G performance.

Alberta showed the highest time spent on 5G

5G-time-spent_canada_province_0221

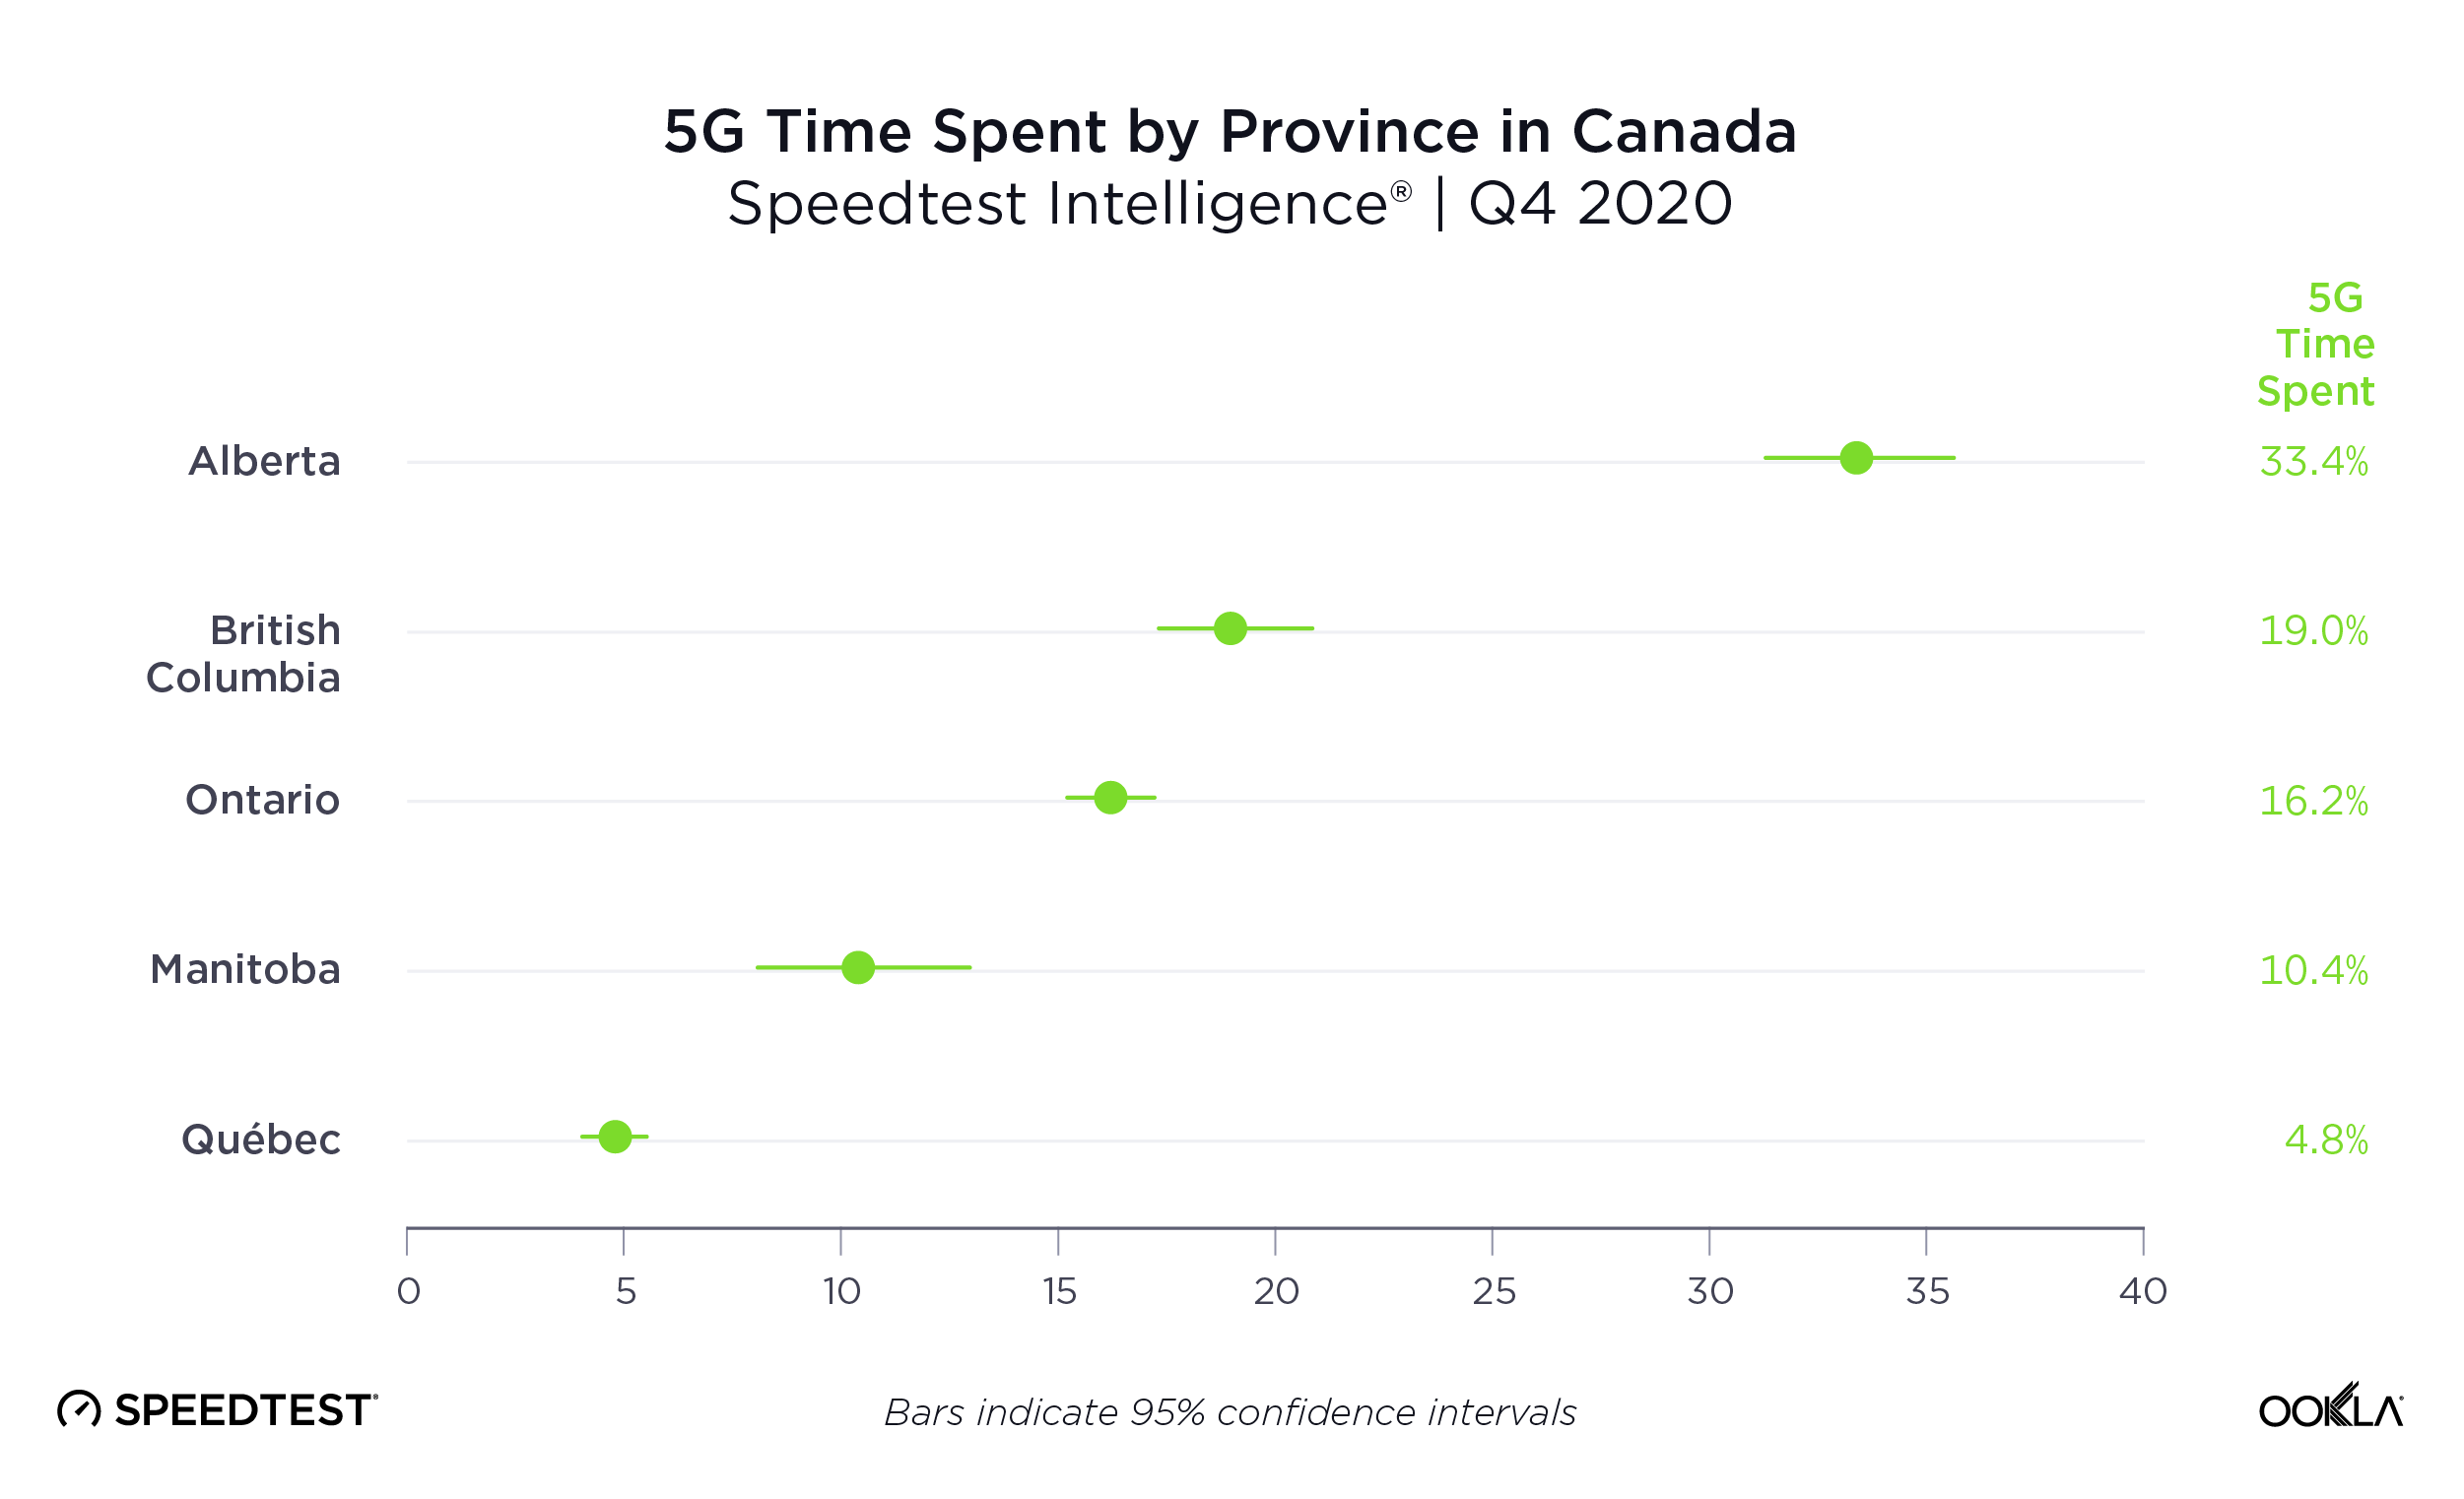
Alberta had the highest percentage of 5G Time Spent among Canadian provinces with sufficient samples during Q4 2020. Users with 5G-capable devices in British Columbia spent the second highest proportion of time on 5G in Canada at 19.0%, and Ontario showed the third highest 5G Time Spent. Québec had the lowest 5G Time Spent on this list during Q4 2020.

Montréal had the fastest 5G download speed

5G-performance_canada_municipalities_0221

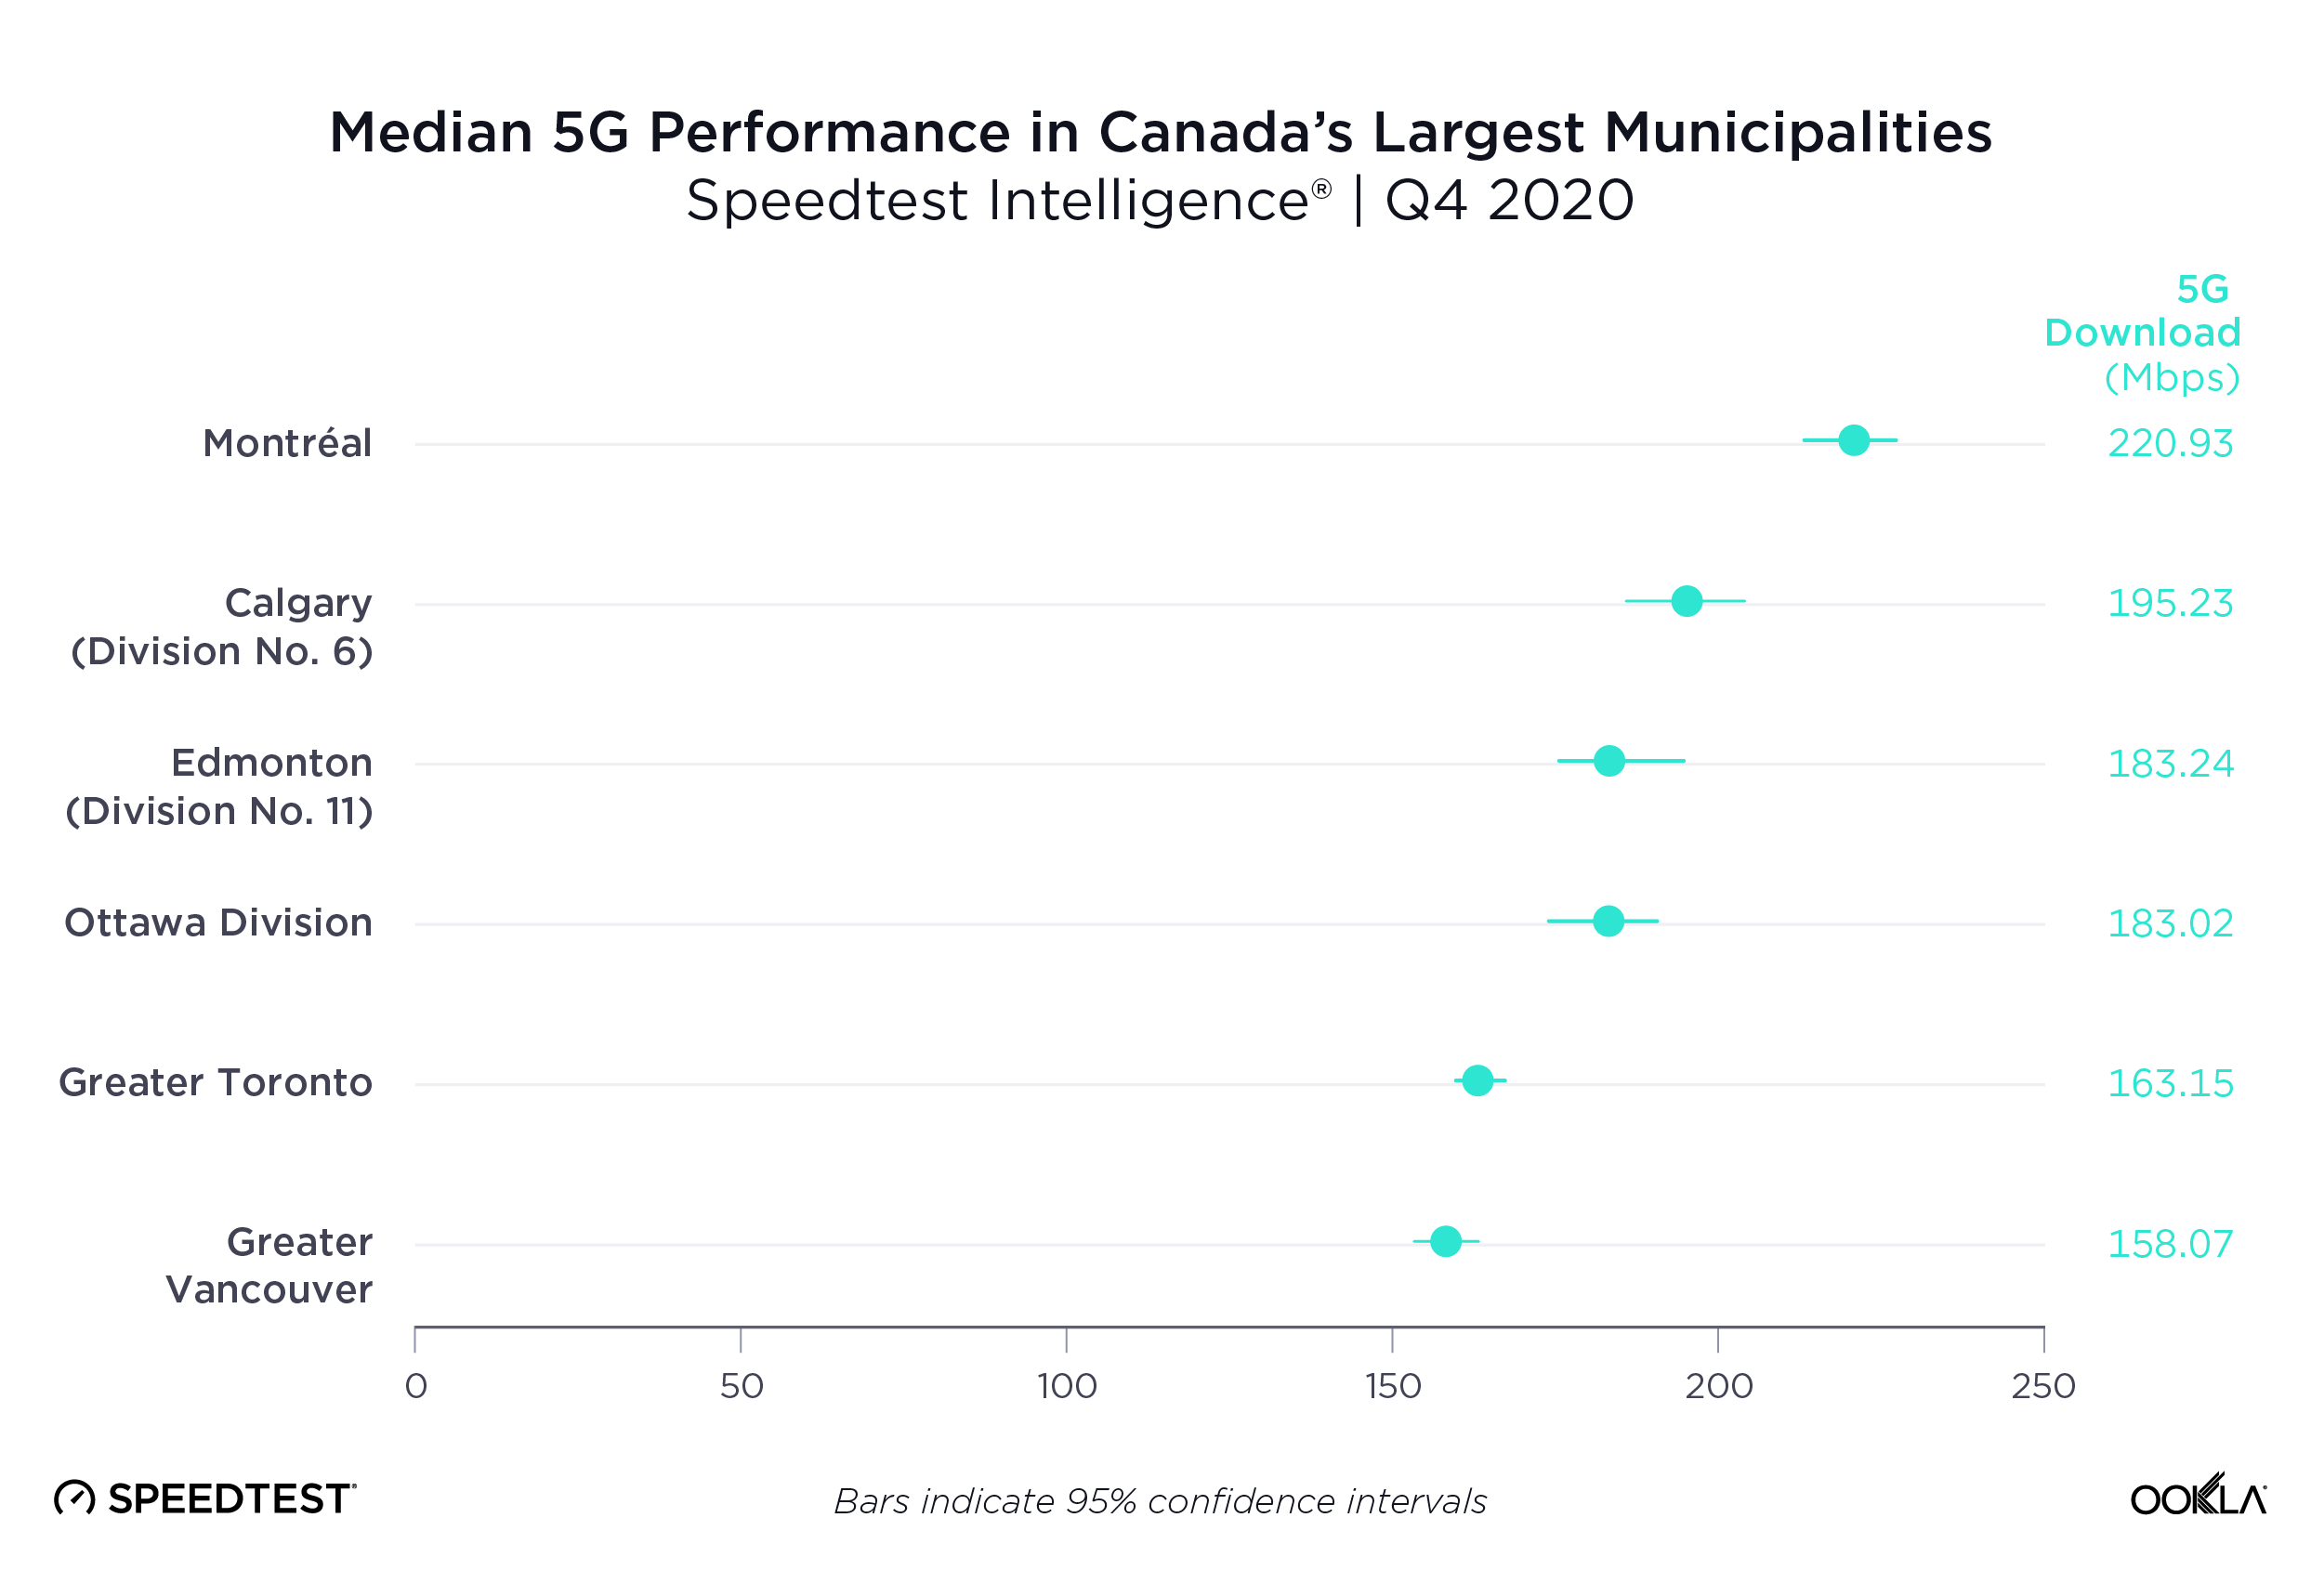
Analysis of median 5G download speed in Canada’s largest municipalities found that Montréal was the fastest during Q4 2020. Calgary, Edmonton and Ottawa formed the group of next fastest cities, followed by Greater Toronto and Greater Vancouver. The confidence intervals in the above chart indicates that the performance among these two groups of cities was too close to definitively rank them.

We’ll be very excited to see how Canada expands on this performance, given the country’s already impressive speeds and expanding 5G footprint. Inquire about Speedtest Intelligence for detailed information about city-level performance by provider or take a Speedtest to see how your network compares.

Ookla retains ownership of this article including all of the intellectual property rights, data, content graphs and analysis. This article may not be quoted, reproduced, distributed or published for any commercial purpose without prior consent. Members of the press and others using the findings in this article for non-commercial purposes are welcome to publicly share and link to report information with attribution to Ookla.

| March 10, 2021

India’s Internet Speeds Improve, But 5G Can’t Come Fast Enough


India has seen strong internet speed increases during a year when internet access has been crucial. 4G expansions are leading to mobile speed improvements, while fiber rollouts are driving jumps in fixed broadband speeds. Today we’re looking closely at how India’s improvements compare to other countries in the South Asian Association for Regional Cooperation (SAARC). We have also paired the internet speed performance of India’s top internet providers with data on consumer sentiment to shed light on how consumers view their operators.

India’s fixed broadband is fast for SAARC countries (and getting faster)

Mean-Fixed-Broadband-Speeds_SAARC_0321

India started 2020 with the fastest mean download speed over fixed broadband among SAARC countries, and strong improvements in India from Q2 2020 onward only widened the gap. India’s government has been instrumental in these improvements with both Digital India and the Smart Cities Mission.

A jump in fixed broadband download speed in Bangladesh brought the country to second by the end of the year, while a decline in speeds put Sri Lanka in third place. Afghanistan had the lowest mean download speed over fixed broadband among SAARC countries during 2020.

Despite increases, Indian mobile speeds lag among SAARC countries

Mean-Mobile-Speeds_SAARC_0321

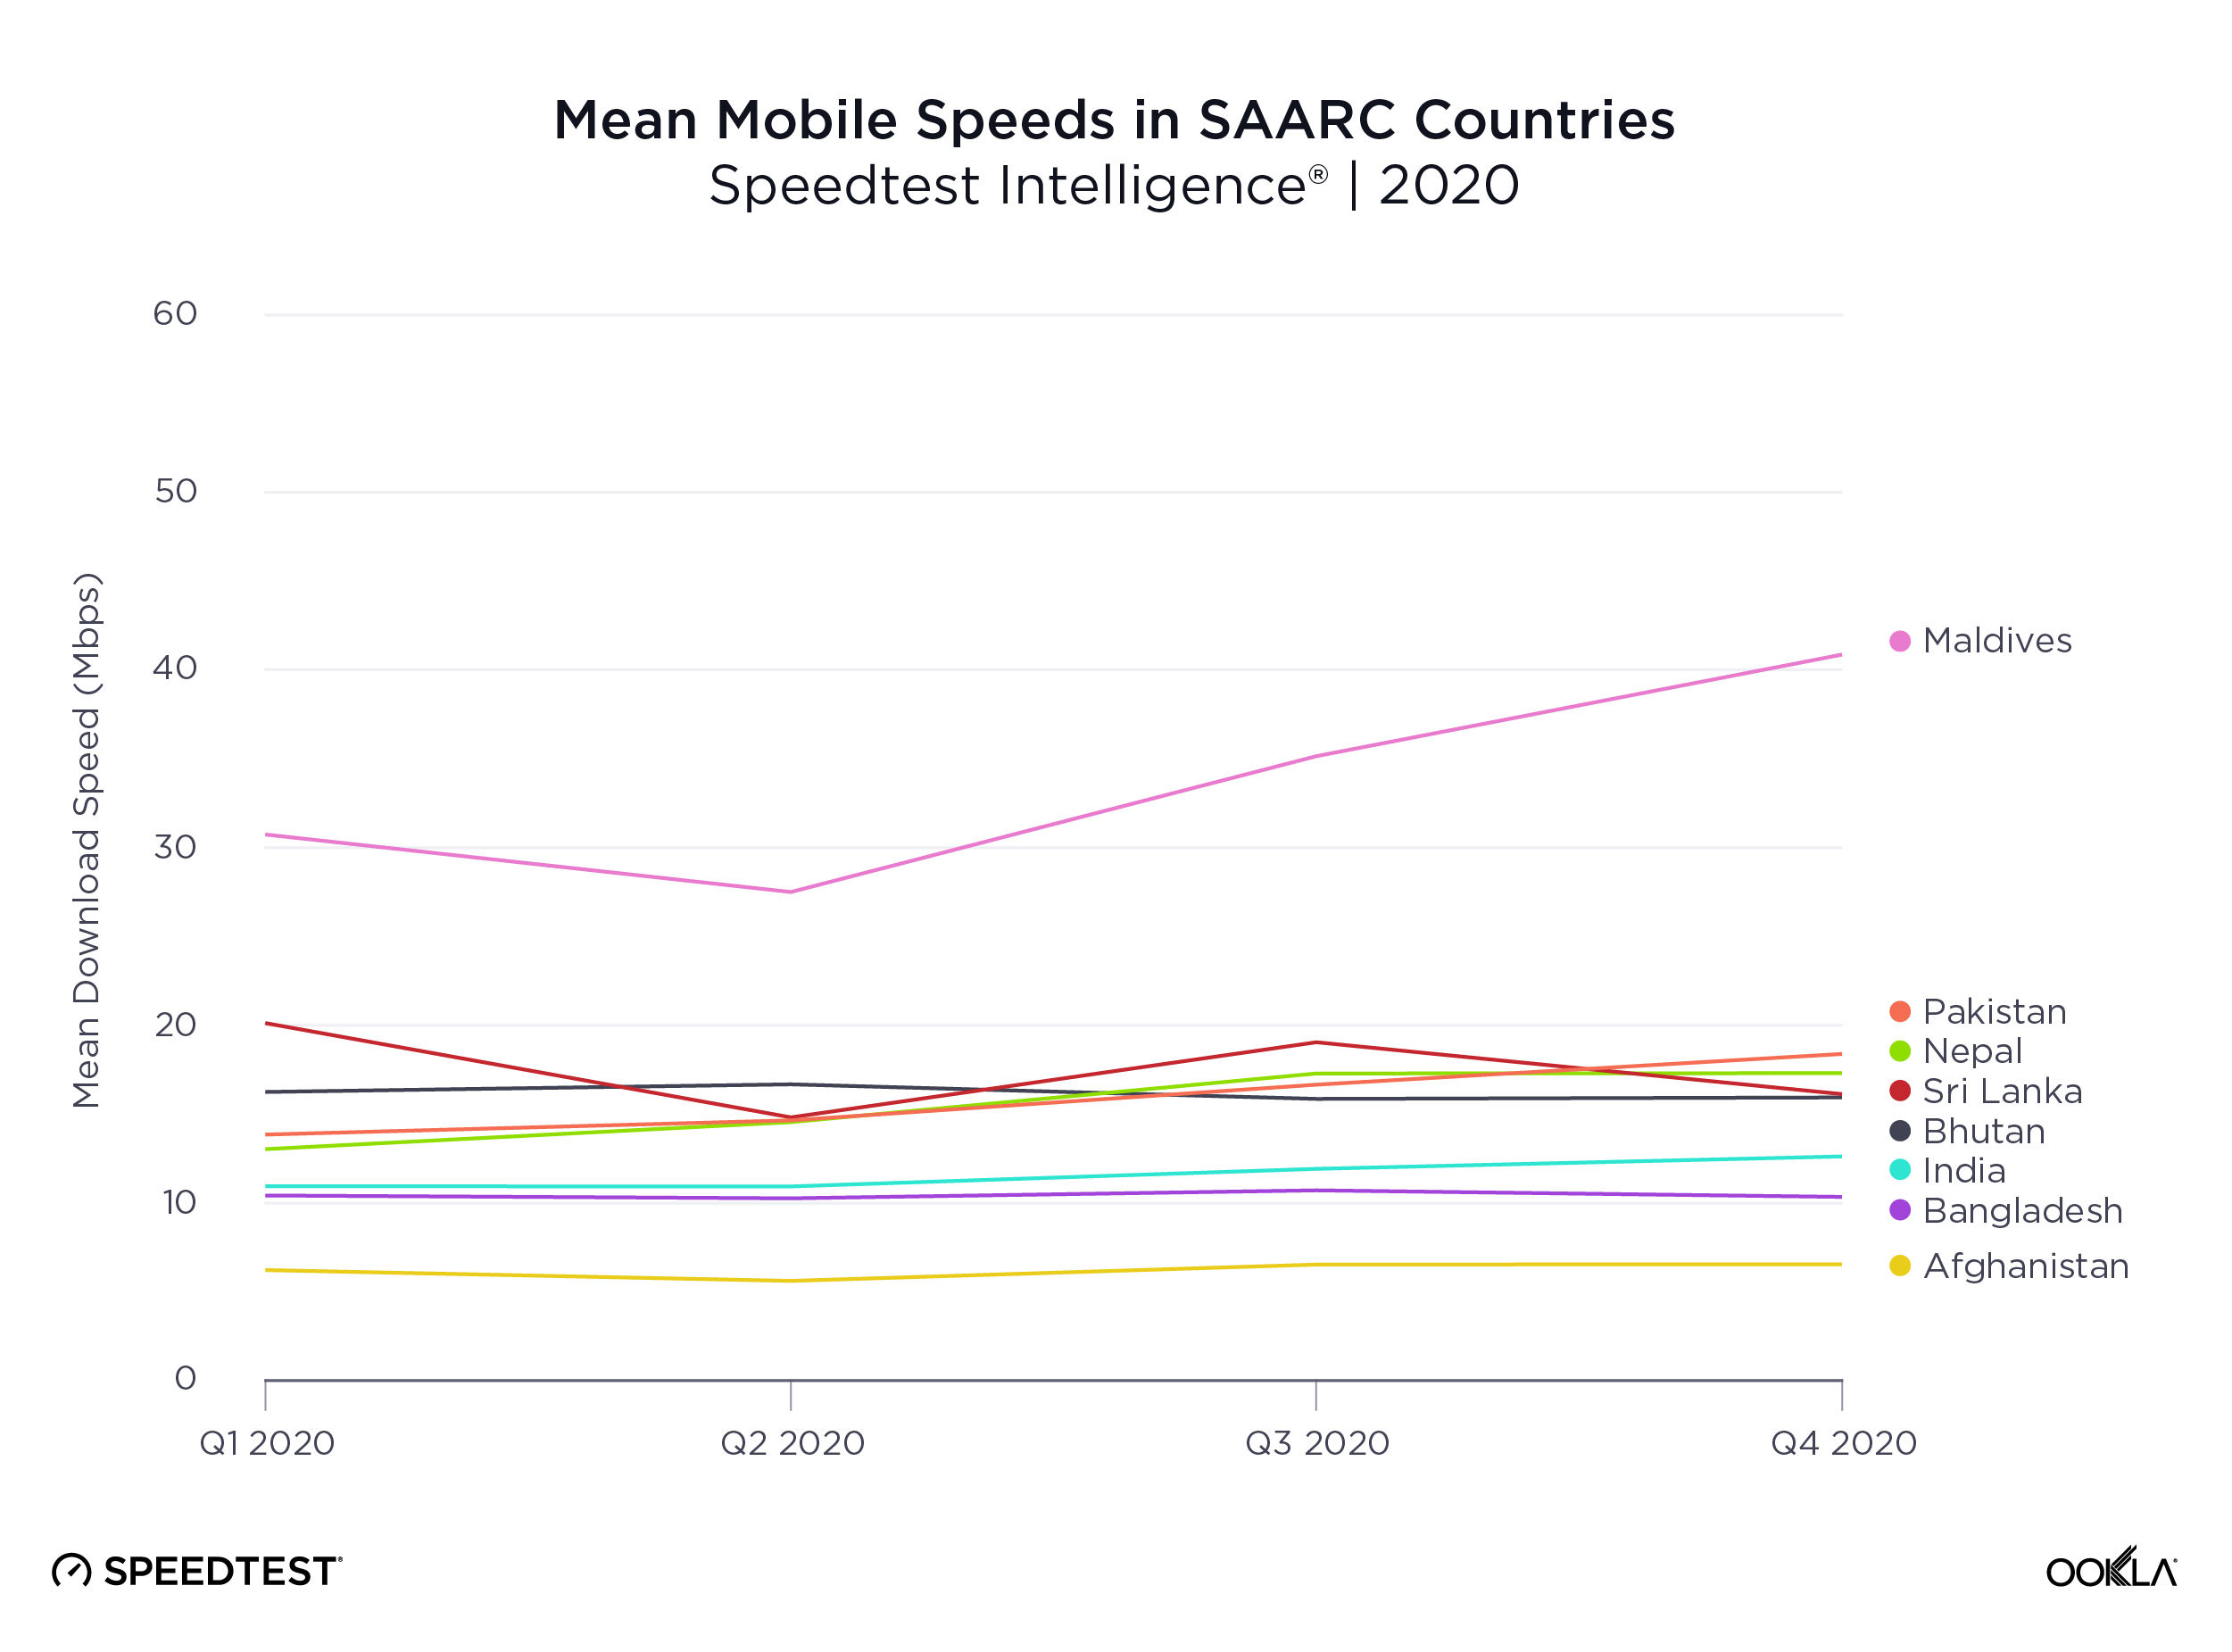
The Maldives, the only SAARC country with active 5G during 2020, was the fastest for mean download speed over mobile throughout 2020. Pakistan, Nepal, Sri Lanka and Bhutan were very closely grouped for second, third, fourth and fifth fastest during Q4 2020. Afghanistan had the slowest mean download speed over mobile among SAARC countries throughout 2020. Bangladesh was second slowest and India third. According to the Ookla 5G Map™, India, Pakistan and Sri Lanka each have at least one location where 5G is available, but only in pre-release.

Jio had the fastest fixed broadband, highest ratings by customers

Speedtest® Consumer Sentiment data is gathered from single-question surveys presented to users at the end of a Speedtest. This data set provides rich insights into customer satisfaction over time, as well as competitive benchmarking, by providing data on both customers’ overall satisfaction with their network providers (based on a five-star scale) and Net Promoter Score (NPS). Operators and government regulators across the globe use this data to monitor improvements over time. By comparing Q4 2020 ratings data from India’s top providers with their speeds during the same period, we can explore the relationship between customer satisfaction and network performance.

Mean-Fixed-Speeds_India_0321

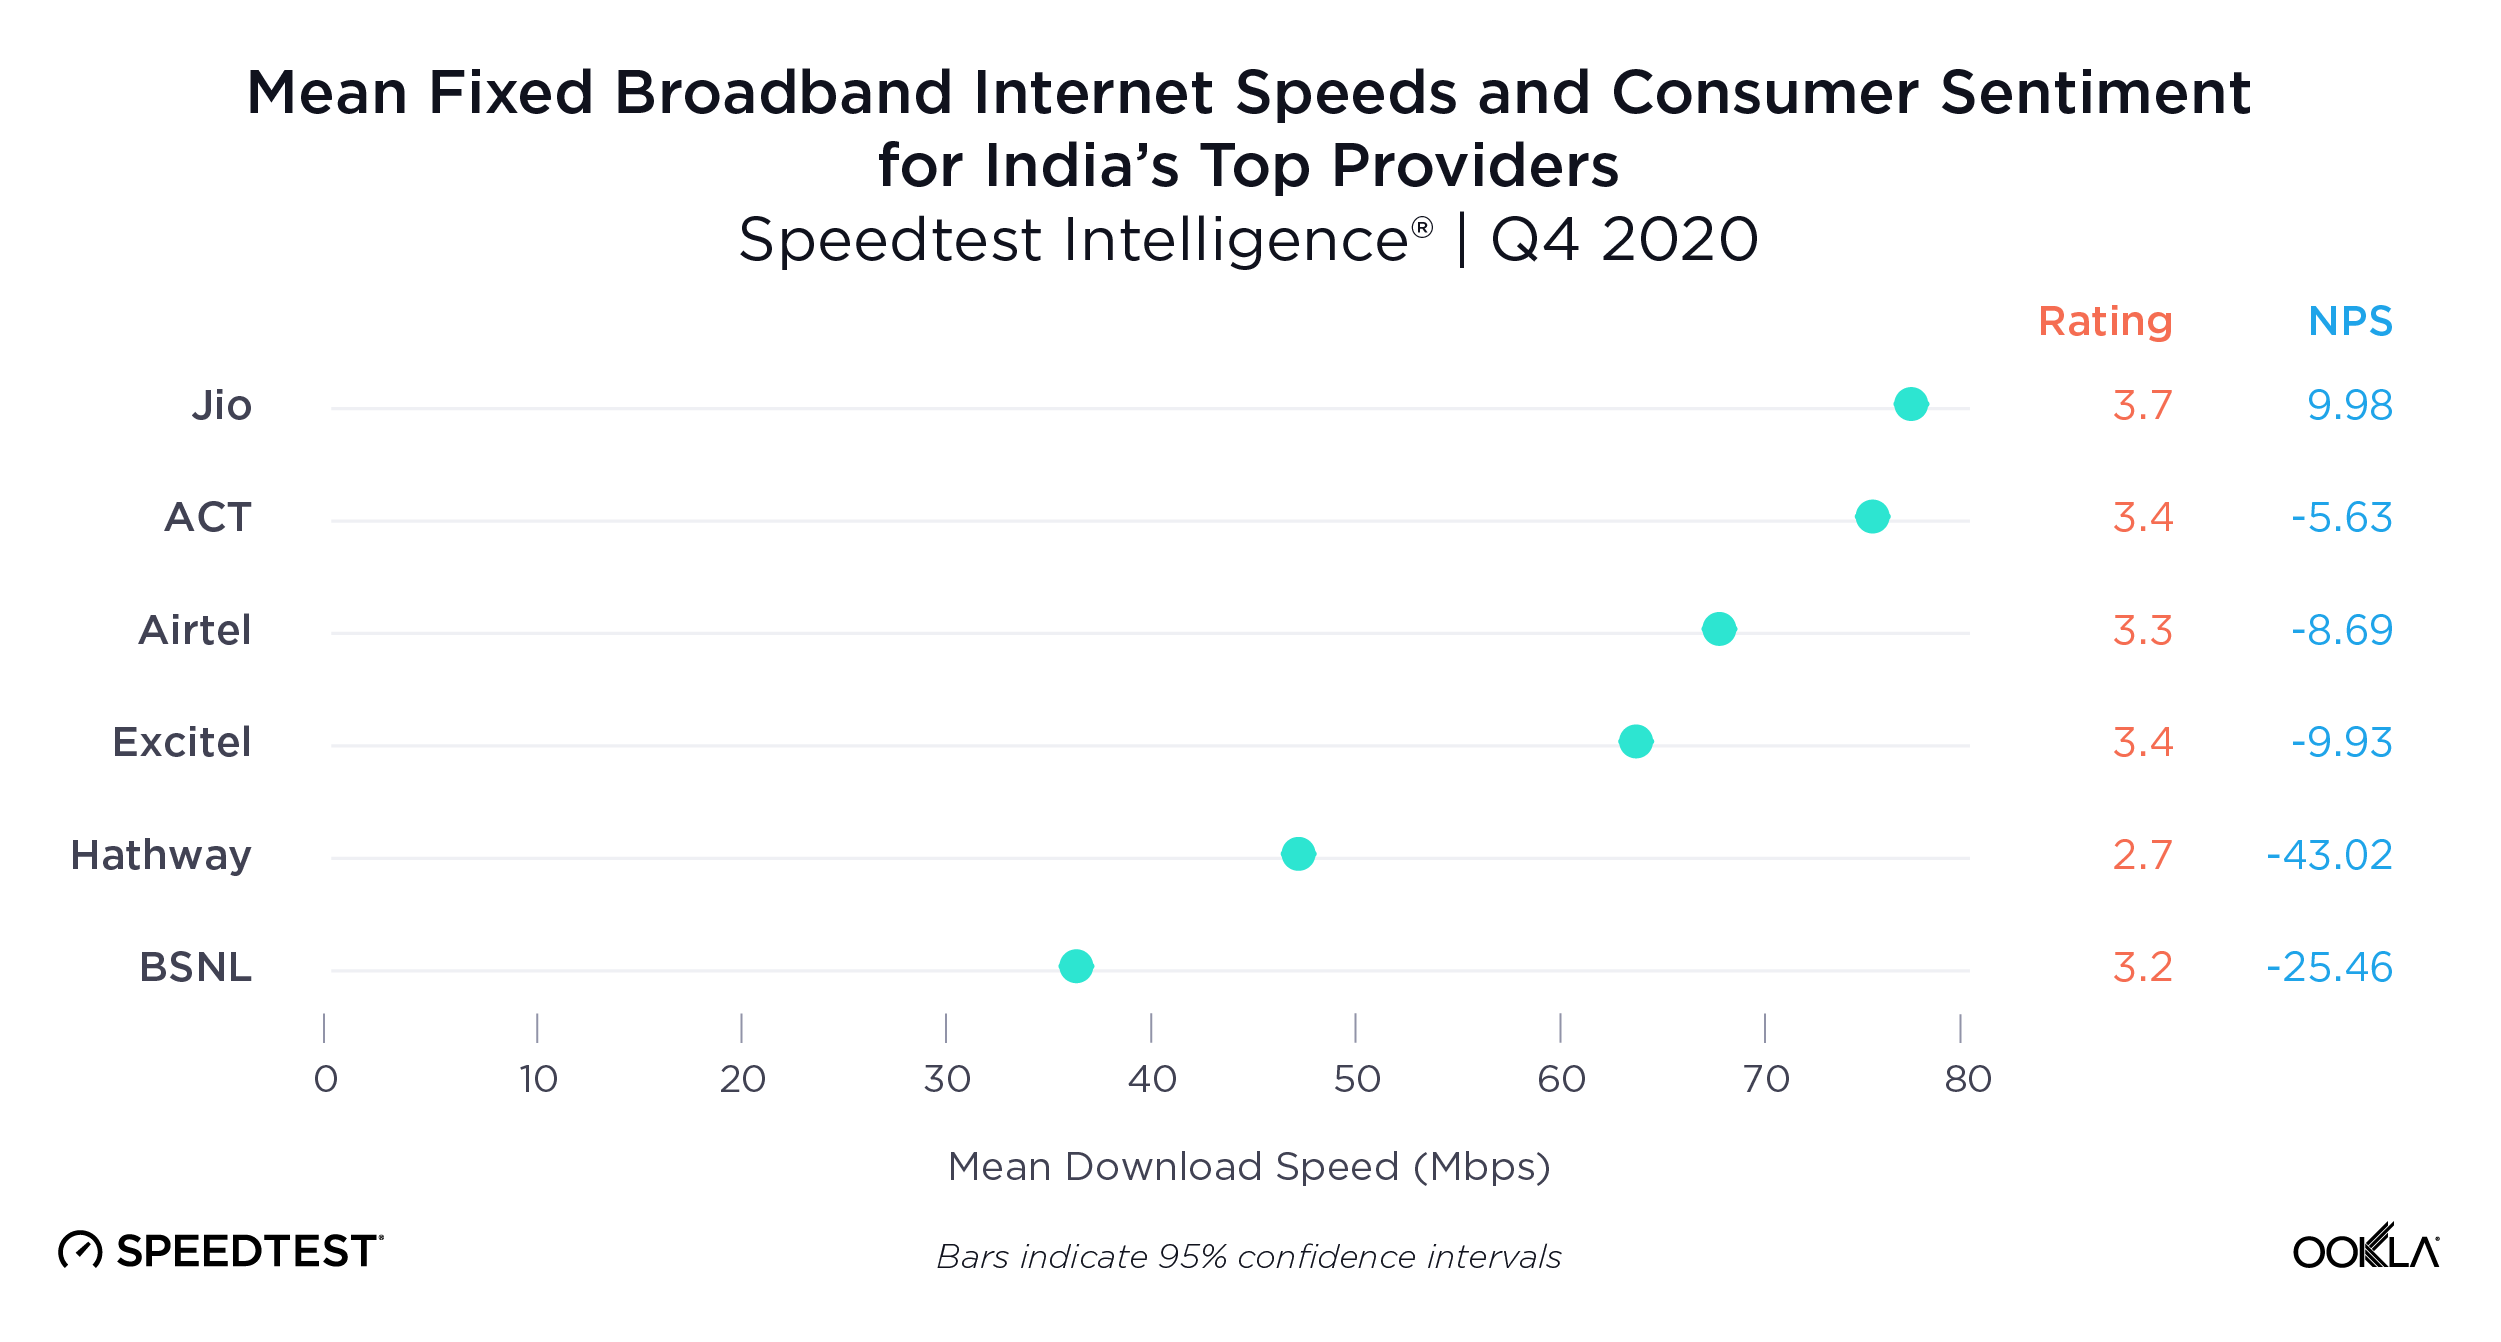
Jio had the fastest mean download speed over fixed broadband among India’s top providers during Q4 2020. Jio also had the highest rating at 3.7 stars and the only positive NPS. ACT was second for download speed over fixed broadband, Airtel third and Excitel fourth. ACT and Excitel had the same star rating, while ACT had a higher NPS. Airtel had the third highest NPS.

BSNL had the slowest mean download speed over fixed broadband during the same period, although Hathway had the lowest rating and the lowest NPS. Note that the confidence intervals are narrow enough that they are obscured in the above chart and the one below.

Jio along with BSNL and Airtel offers fixed-line broadband service at Pan-India level. ACT, Excitel and Hathway are fixed broadband ISPs which offer services in a few key Indian cities and metros.

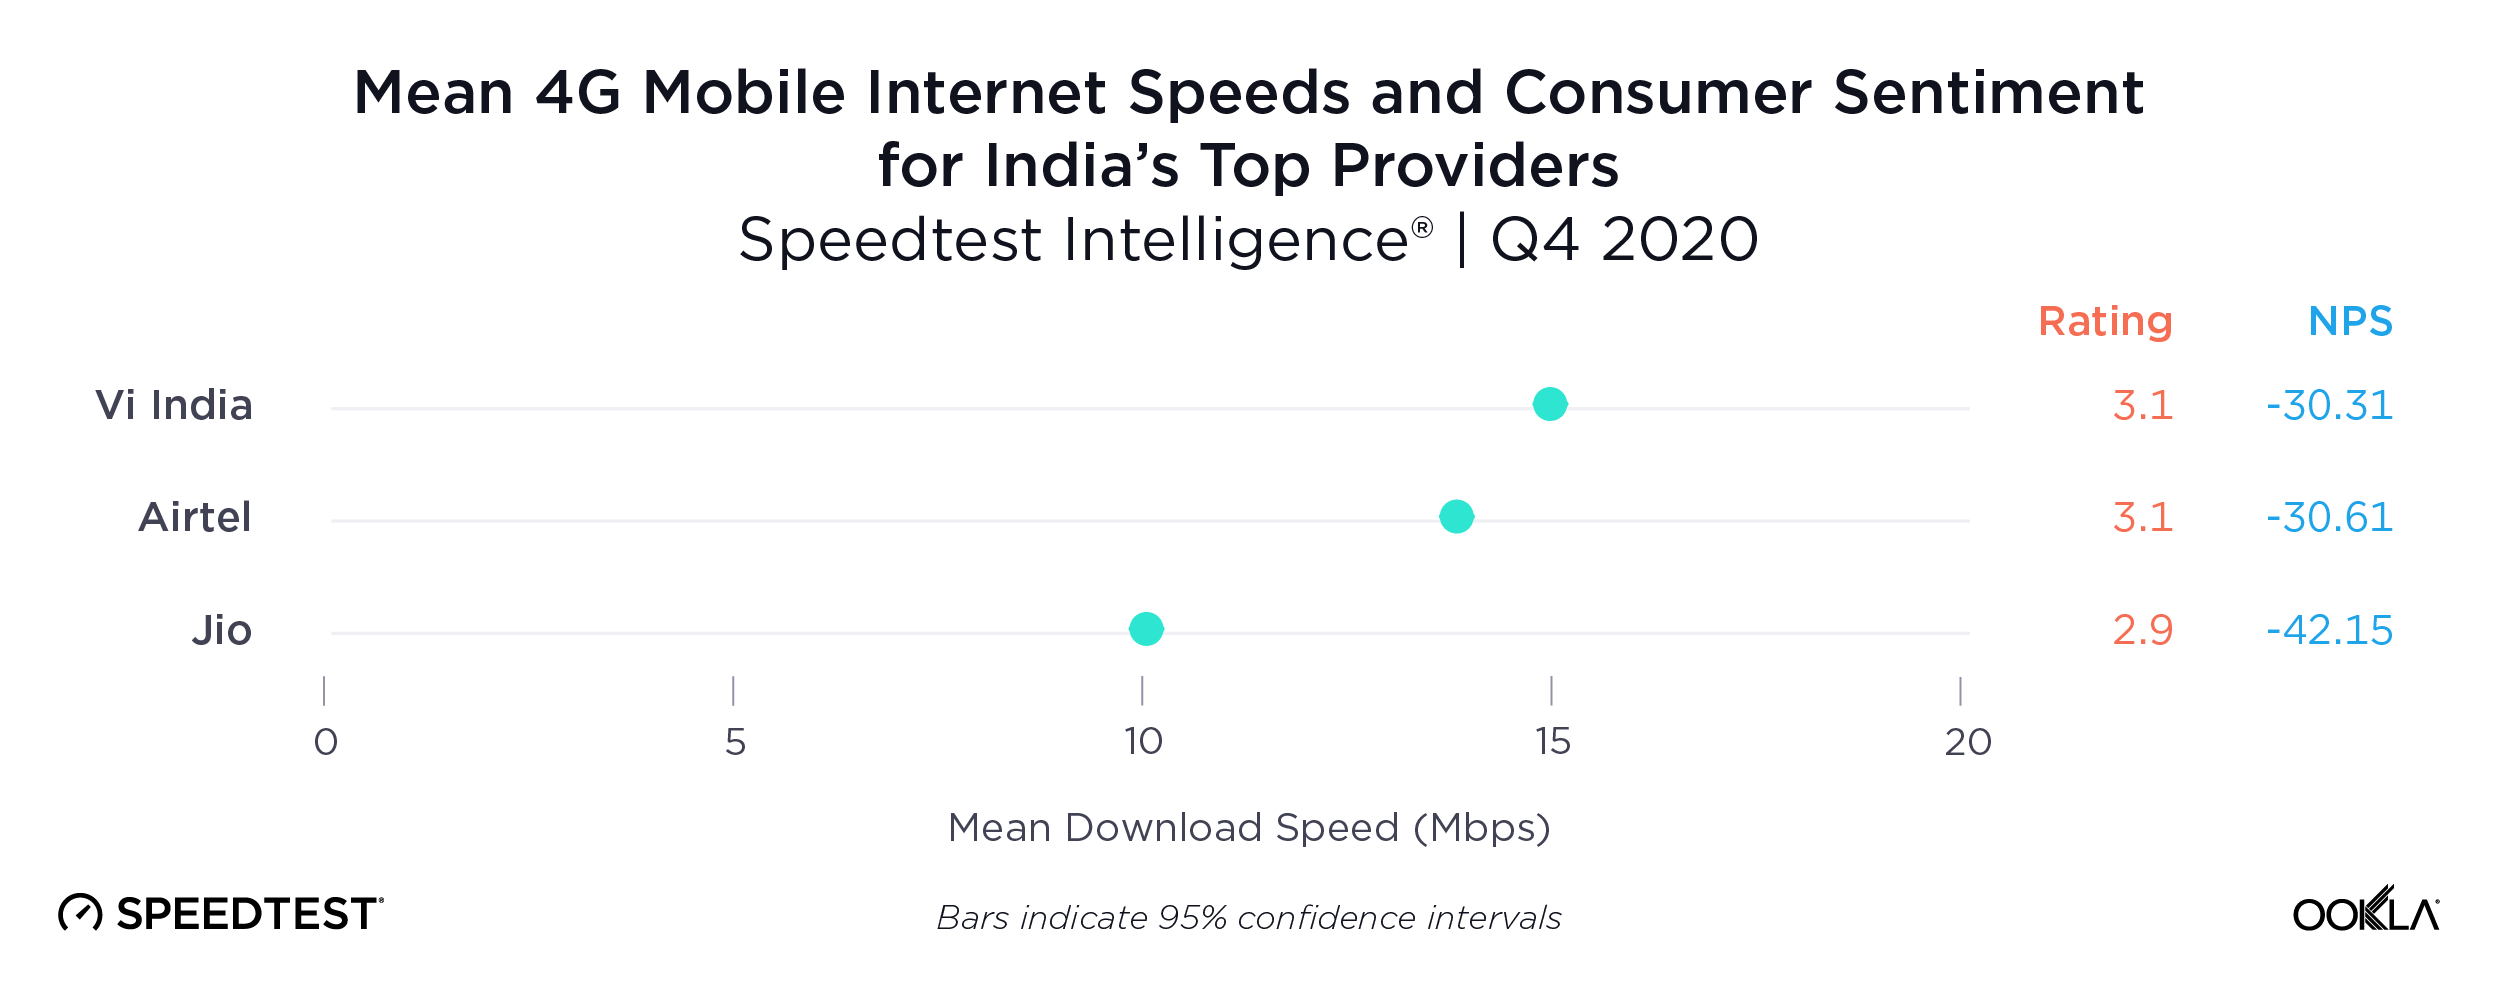
Vi India is fastest for mobile

Mean-Mobile-Speeds_India_0321

Vi India had the fastest mean mobile download speed during Q4 2020 as it increased its download speed performance lead over Airtel from Q3. This confirms that Vi India is continuing to provide its users with a better network speed experience than its rivals. In Consumer Sentiment ratings, Vi tied with Airtel.

Airtel had the second-fastest mean download speed. Jio came in third place for performance, ratings and NPS. Vi led Airtel and Jio on NPS, but none of the providers’ scores were positive, indicating that customers were not likely to recommend any of the providers.

How Indian operators are approaching 5G

While 5G still isn’t commercialized in India, Airtel’s commercial 5G network is ready to roll out services once spectrum is allocated in late 2021 or early 2022. On January 28, 2021, Airtel successfully conducted a 5G trial in the Hyderabad region using Dynamic Spectrum Sharing (DSS) on a 1800 MHz spectrum band. This demonstration was made possible by the Swedish infrastructure giant Ericsson (which provided the software to its radio infrastructure) and the device manufacturer Oppo (which provided its 5G-capable device powered by Qualcomm’s Snapdragon 865 5G Mobile Platform). Over the past year, Airtel has deployed LTE services using “5G-ready” Altiostar’s virtual open RAN software stack. This indicates that the operator’s 5G strategy may at least partially include O-RAN.

In a recent interview, Vi India’s CEO declared the company is also ready for a 5G rollout, but Vi India will wait for the 5G spectrum auction in the 3.3 GHz – 3.6 GHz band.

Jio, the telecom branch of Reliance Industries Limited (RIL), has been getting ready to roll out its homegrown O-RAN 5G network. Building an in-house cloud-native 5G core and radio access network from the ground up — while leveraging containerized network functions — will lay the groundwork for the operator to deliver improved security and spectral efficiency. This network approach can also enable new use cases like ultra-reliable low-latency communications (URLLC), network slicing and improved reliability, to name a few. Similar to Rakuten Mobile’s approach, Jio aims to leverage automation and artificial intelligence for network monitoring and optimization, as well as capacity planning. A zero-touch deployment approach promises to deliver rapid cell site provisioning, which opens the door for massive infrastructure scaling.

However, without a sufficient amount of wireless spectrum, LTE and 5G technologies won’t be able to deliver the ultra-fast speeds and low latency promised by the emerging technology. This is why the Indian Department of Communications (DoT) held a spectrum auction on March 1, 2021 to license the spectrum blocks in the 700 MHz and 800 MHz bands. Airtel opted for spectrum in the sub-GHz, mid band and 2300 MHz bands. Vi India did not disclose which spectrum it had purchased and Jio reportedly purchased spectrum in the 800 MHz, 1800 MHz and 2300 MHz bands to renew permits expiring in July. The 700 MHz band did not get any offers.

Mobile and fixed broadband are rapidly improving in India, and we’ll be watching this market for continued performance improvements in the near future. Soon, we’ll also be using data from Speedtest video testing to assess how networks are performing when streaming video. Try video testing on Speedtest for iOS now to see how well your operator supports streaming video.

Ookla retains ownership of this article including all of the intellectual property rights, data, content graphs and analysis. This article may not be quoted, reproduced, distributed or published for any commercial purpose without prior consent. Members of the press and others using the findings in this article for non-commercial purposes are welcome to publicly share and link to report information with attribution to Ookla.

| May 26, 2021

How to Choose the Best Provider For Your Needs: A Guide to Marketing Claims and Awards

If you’re lucky, there are many, many mobile operators and internet service providers (ISPs) in your area who are clamoring for your business — courting you with ads that claim they are the fastest, best, most reliable, etc. Great! But how do you sort through that information to understand what you really need? This guide to marketing awards and claims should help you sort through some of the details so you can choose the mobile operator or internet service provider (ISP) that matches your needs.

Know that we at Ookla® are always looking carefully at our data to ensure that any claim using the Ookla or Speedtest® name is one you can rely on. For example, any provider that licenses a claim from Ookla must have at least 3% of the market share by sample count in a given location throughout the period — that’s to say that you should be able to actually access their services in the place described. A provider must also have a statistically significant lead over the competition to qualify to license a claim. And we don’t monkey with questionable timeframes. A provider either qualifies for the claim based on data from a full calendar quarter (or longer) or they don’t. For more information on individual metrics, read our methodology. Any claim that Ookla verifies is built on real-world consumer-initiated results and backed by rigorous data science. Look for your specific region, state or city to make sure you’re getting the provider that’s right for you.

What “Fastest Provider” really means

Many people look for the fastest service around — and why wouldn’t you? Having the fastest internet service can allow you to watch movies, livestream events or even play multiplayer games. Any provider named as having the Fastest Network by a Speedtest Award has been thoroughly vetted by our data science team using a combination of download and upload speeds that make up their Speed Score. The top provider with the highest Speed Score who has provided service for the entire award period is then qualified to license the Fastest Award.

How customers inform “Top-Rated” mobile and fixed networks

How would you rate your internet provider? Would you recommend them to friends and family? We present Speedtest users with single-question surveys at the end of a test where they can give feedback on their mobile or fixed broadband provider. This data is used to inform “Top-Rated” Awards for the provider with the highest star rating in a specific location and time period.

Which mobile networks have the “Best Coverage”

If you’ve ever tried to get a call or text out only to find you have no service, you know mobile coverage matters. Every day Ookla receives hundreds of millions of coverage scans from Android Speedtest users around the world. This data is processed to assign a Coverage Score for each operator in a given location. The operator we stand behind as having the “Best Coverage” is your best bet for having access to service in the areas where people go most often.

Why “Best Availability” matters to mobile customers

Some people are most interested in making sure they always have access to a particular level of service. The “Best Availability” claim for mobile operators can help those consumers see the proportion of users who spend the majority of their time on a given cellular technology, both on network and when roaming. Availability claims are based on data from Android devices. Specific availability claims Ookla supports are:

  • Best 5G Availability describes the mobile provider with the highest percentage of users with 5G-capable devices who spend the majority of their time on 5G. Check the Ookla 5G Map to see if 5G is available in your area.
  • Best 4G Availability describes the mobile provider with the highest percentage of users who spend the majority of their time on 4G and above.
  • Best Network Availability describes the mobile provider with the highest percentage of users who spend the majority of their time connected to any cellular technology (i.e., 2G, 3G, 4G, or 5G) rather than having no service. This is similar to Best Coverage, but focuses on the amount of time spent connected to a network rather than the distinct locations in which service is available.

How we determine which provider is “Most Consistent”

Consumers who prioritize consistent performance should look for a provider licensing the “Most Consistent” claim, which is based on our Consistency Score. Consistency Score describes the percentage of a provider’s users who experienced download and upload speeds that met or exceeded our thresholds for the majority of their tests.

For mobile (all technologies), the threshold of consistent service is 5 Mbps download and 1 Mbps upload. For mobile 5G and fixed broadband, the threshold is 25 Mbps download and 3 Mbps upload. Achieving these speeds means you’re likely to be able to do things like stream HD and 4k video where and when you want to.

Best Availability + Most Consistent = “Most Reliable Mobile Network”

We all hope for the provider who is best at everything. Starting in July, Ookla’s “Most Reliable” claim can be used for mobile operators who have achieved both the best availability on a given technology and the best Consistency Score for that technology in the area described. The Most Reliable Network is one that should provide you with good performance and network availability. The Most Reliable 5G will represent the mobile operator with the best 5G Availability and best Consistency Score on 5G.

Fastest speeds + Best Coverage = “Best Mobile Network”

A fast internet speed with poor coverage leaves you hopping around trying to find that one spot you could stream from. Good coverage without fast speeds leaves you crossing your fingers that you can stream at all. The combination of speed and coverage is so important, in fact, that Ookla only allows a superlative claim of “Best Mobile Network” when a mobile provider has been confirmed to win the “Fastest Mobile Network” and “Best Mobile Coverage” awards.

A quick guide to choosing a provider

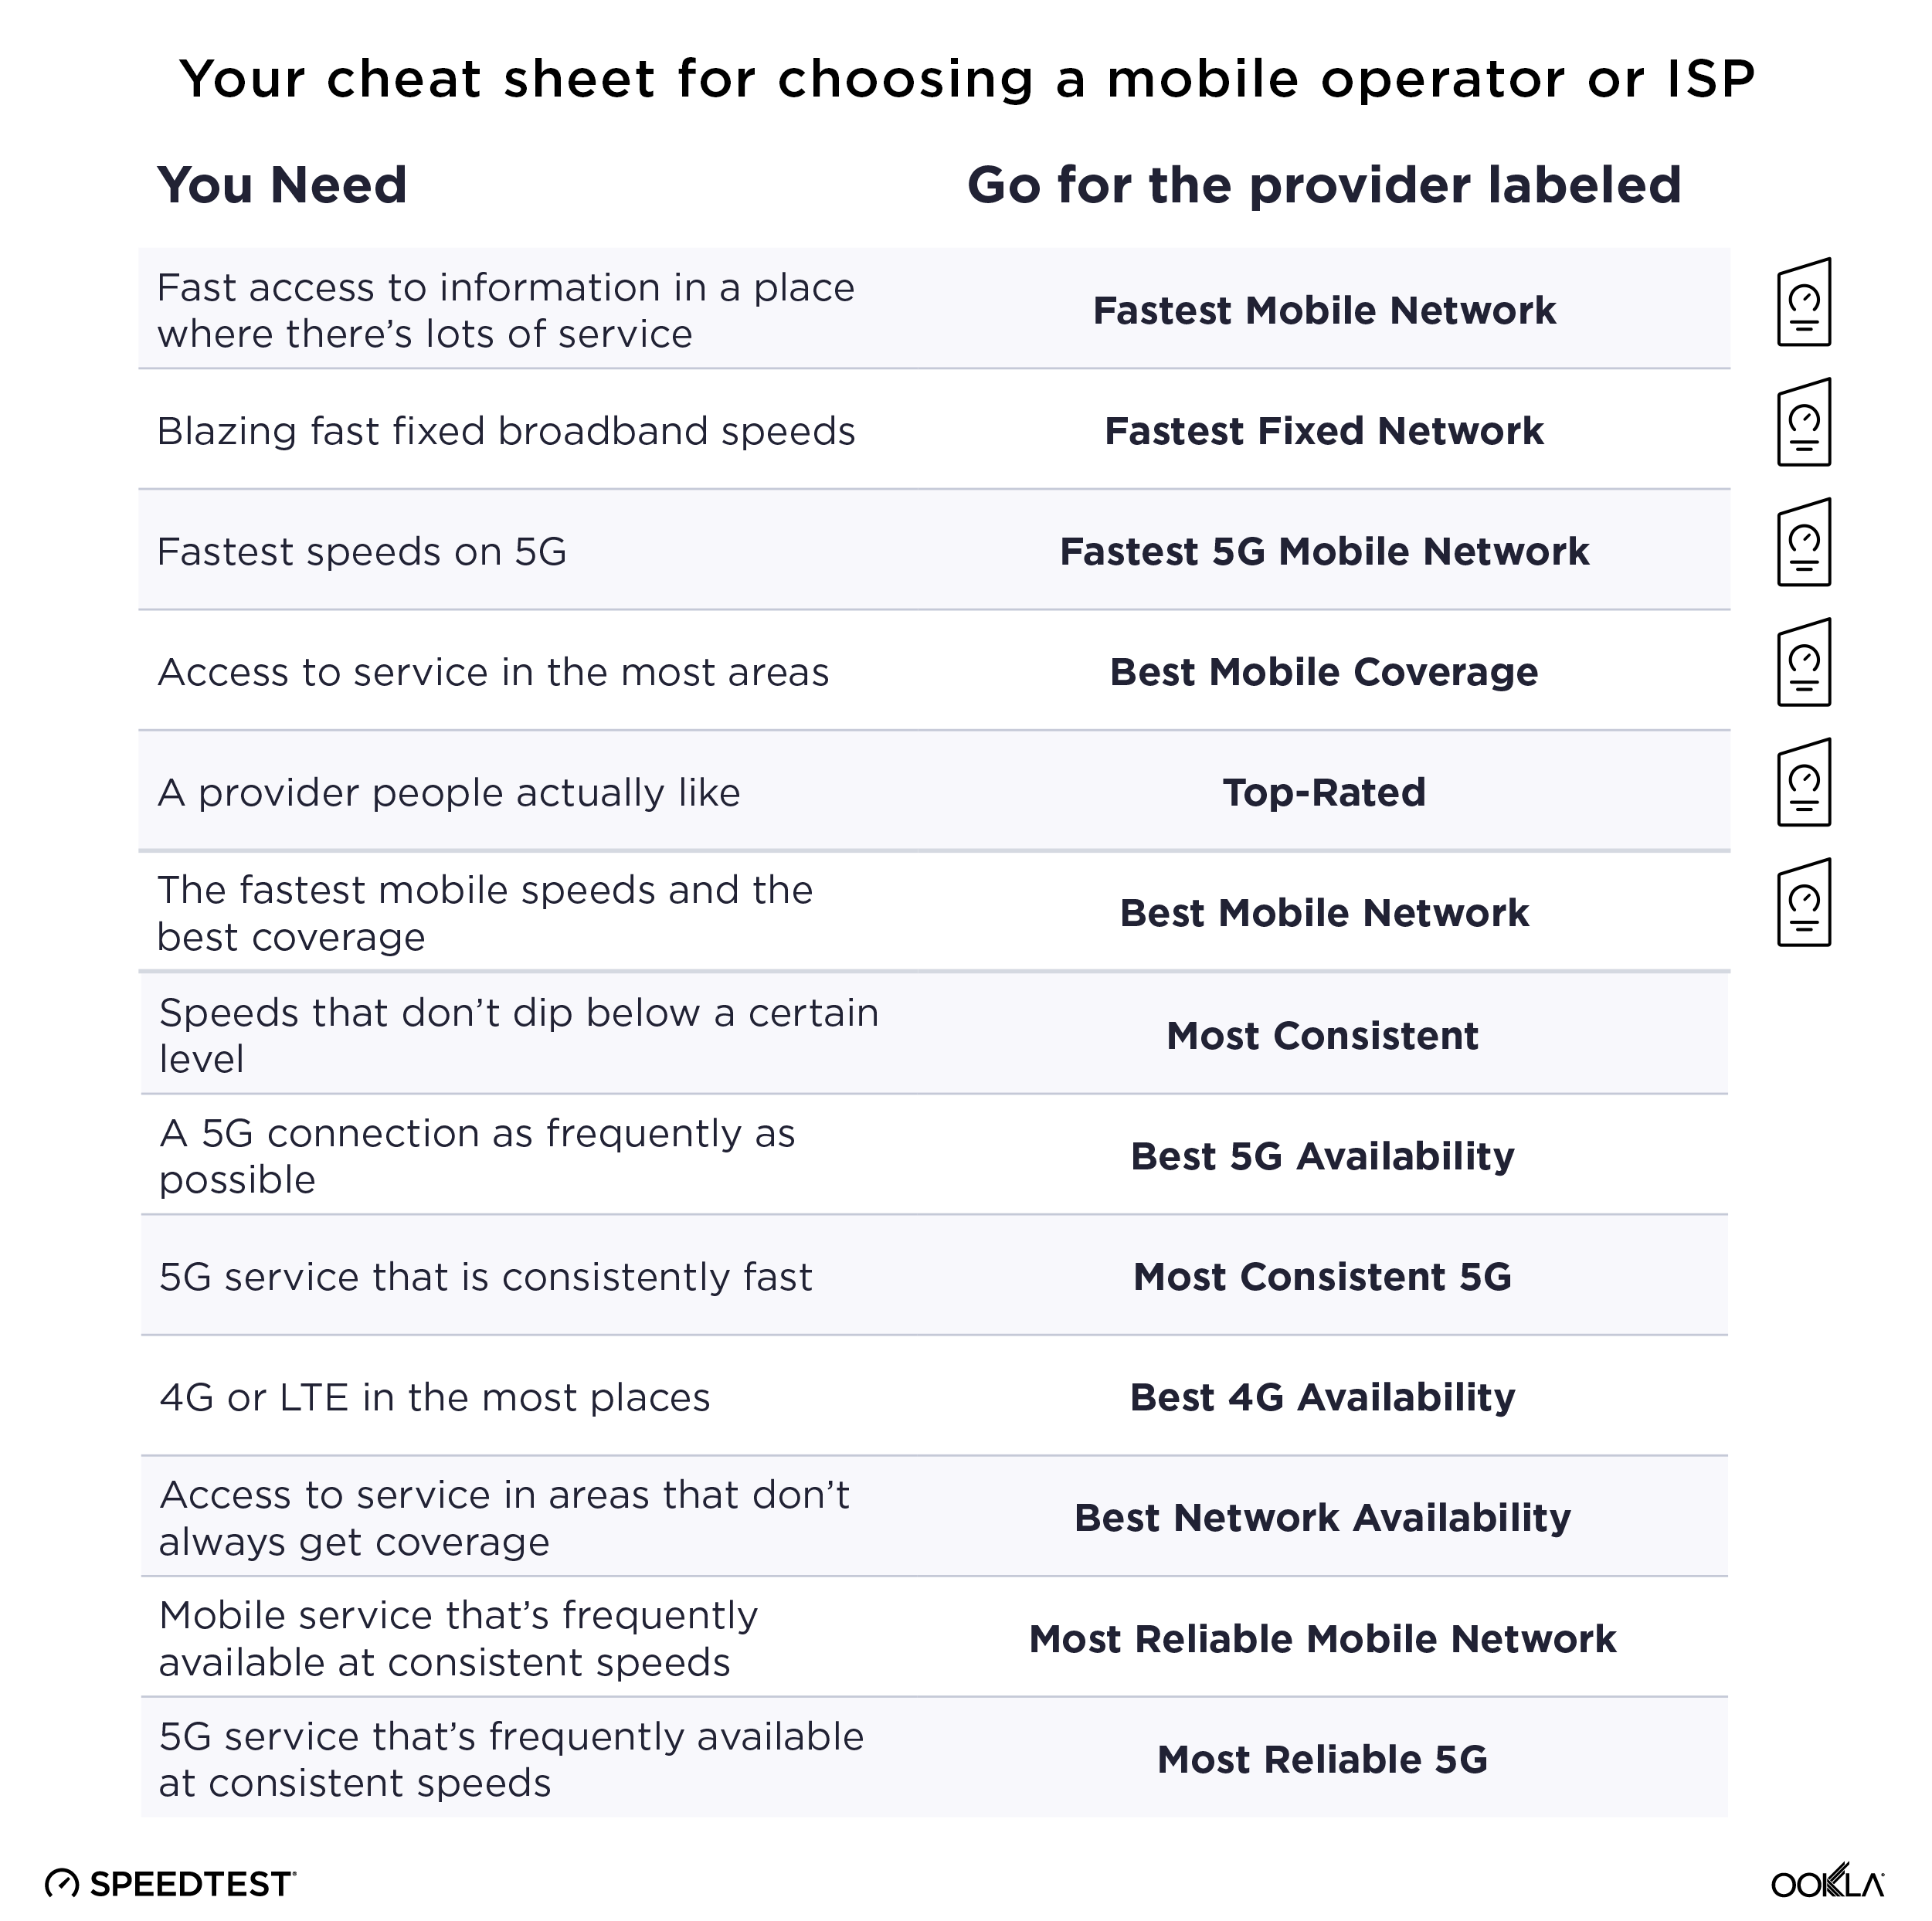
We hope the above information helps you choose the mobile operator or internet service provider that meets your needs. Here is a quick cheat sheet of the most common terms:

Cheat-Sheet-5

There are many factors that go into choosing a mobile operator or ISP. We hope this guide to claims and awards will help you find the provider that matches your needs. Once you have your new service in place, be sure to take a Speedtest to check if you’re getting the speeds you expect from your provider.

Ookla retains ownership of this article including all of the intellectual property rights, data, content graphs and analysis. This article may not be quoted, reproduced, distributed or published for any commercial purpose without prior consent. Members of the press and others using the findings in this article for non-commercial purposes are welcome to publicly share and link to report information with attribution to Ookla.

| July 12, 2021

Introducing Video Testing for Android


In February, we announced video testing from Speedtest® for iOS, and millions of internet speed enthusiasts have since used this free video test to measure the quality of their streaming experience. Today we are excited to announce that video testing is now available for Android users.

How the video test works

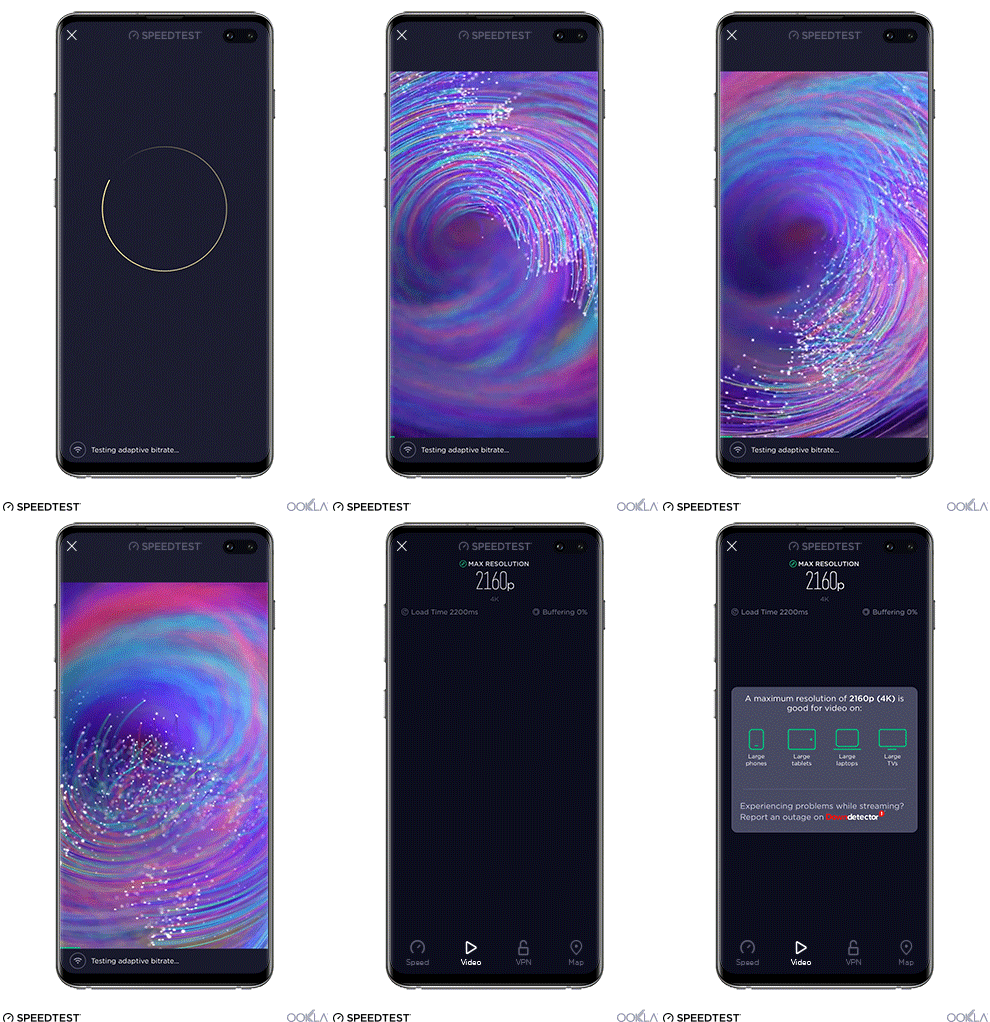
The video test begins by playing a short video using adaptive bitrate streaming. This will measure the typical video streaming experience on your device.


Next, a series of very short videos will be played at increasing video resolutions until the test fails to complete in a reasonable amount of time or reaches a resolution of 4K. This process assesses the maximum video capability of your network — which may exceed the capabilities of your device.


When the test is complete you will get actionable results including maximum resolution, load time, buffering percentage and suggested devices to stream video on at that performance level.

Optimize your online video experience

Taking a video test will give you valuable information to help you optimize your video streaming experience. Here are some examples of what you can do with Speedtest video testing:

  • Find out whether your network is giving you the expected video quality playback
  • Get recommendations for which devices will work best for video on your network
  • Compare historical streaming experiences to your current network performance with test result history
  • Investigate potential outages of the services you are trying to use with Ookla’s Downdetector® if you find that you are unable to stream your video even when the test finds that your video streaming quality meets or exceeds the resolution supported by your device

Where to find video testing in the Speedtest Android app

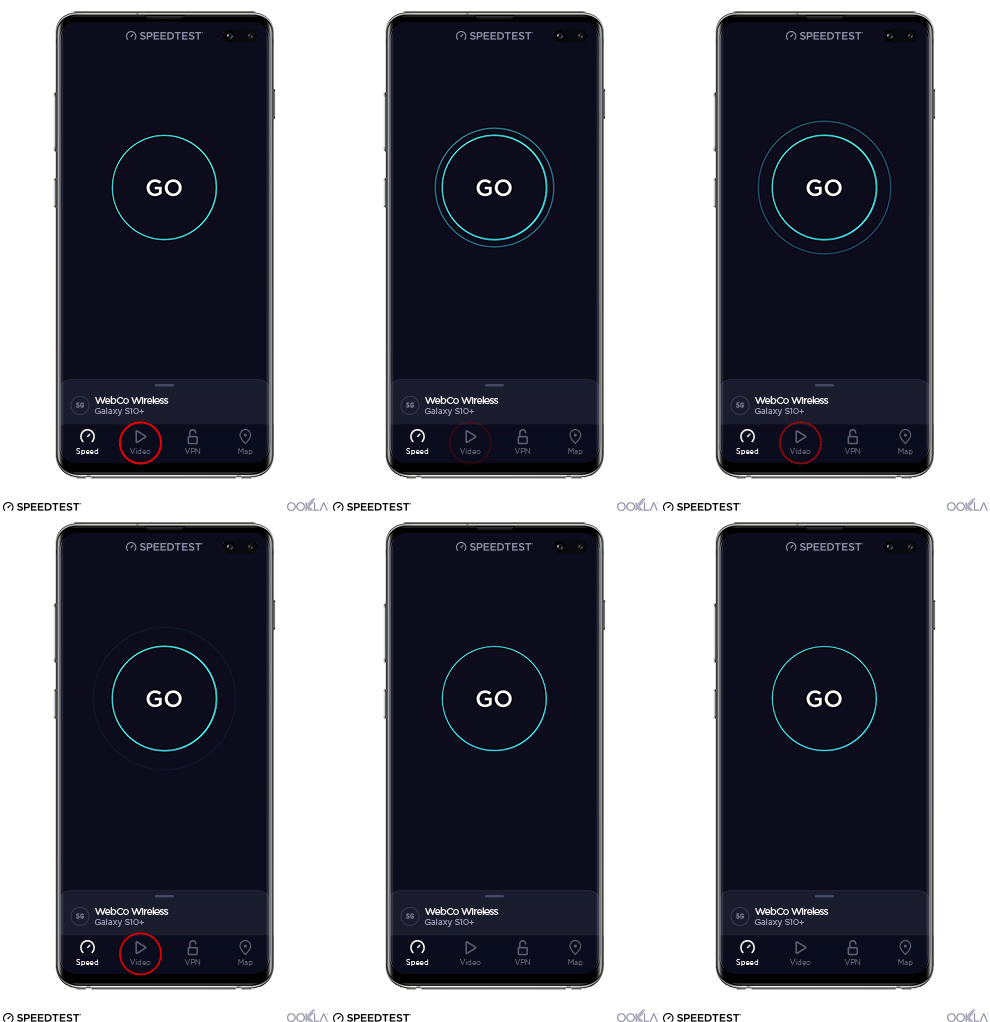
You can now test your network’s video streaming capability in the Speedtest for Android app. Simply open the app and tap on “video” from the menu bar at the bottom of the screen. This will initiate the video test and within one minute you’ll have actionable results and recommendations to optimize your online video experience.


Take a video test today today by opening the Speedtest app on your Android device. If you don’t already have the app, you can download it from the Google Play Store.


Ookla retains ownership of this article including all of the intellectual property rights, data, content graphs and analysis. This article may not be quoted, reproduced, distributed or published for any commercial purpose without prior consent. Members of the press and others using the findings in this article for non-commercial purposes are welcome to publicly share and link to report information with attribution to Ookla.

| December 14, 2021

Find Out if 5G is Worth the Upgrade: A Multi-Country Analysis

The holidays are nearly here and with them the desire to treat yourself or a loved one to an upgraded phone, just because. The first question you’re likely to ask yourself as you browse new models is “To 5G or not to 5G?” Once you check the Ookla 5G Map to see if your operator has deployed 5G in your area, you’ll probably want to know if the 5G speeds are worth the extra cost. We’ve analyzed Speedtest Intelligence® data from the most popular Android and iPhone devices around the world during Q3 2021 to help you see if it’s worth the upgrade. Click a country from the list to jump down to the related analysis.

Australia | Bahrain | Canada | China
France | Japan | Saudi Arabia | South Africa
South Korea | United Arab Emirates | United Kingdom | United States
Our analysis includes data on the five 4G Android devices in each country with the largest number of results during Q3 2021 as well as the five most popular 5G-capable Android devices. We have also compared the iPhone 13 to the iPhone 11. Even the fastest device can only perform at the level of the network it’s on. For that reason, speeds for the same device vary widely from country to country in the data below. Remember that speeds can also vary within a country and the performance you see will depend on the infrastructure in your area.

Australia

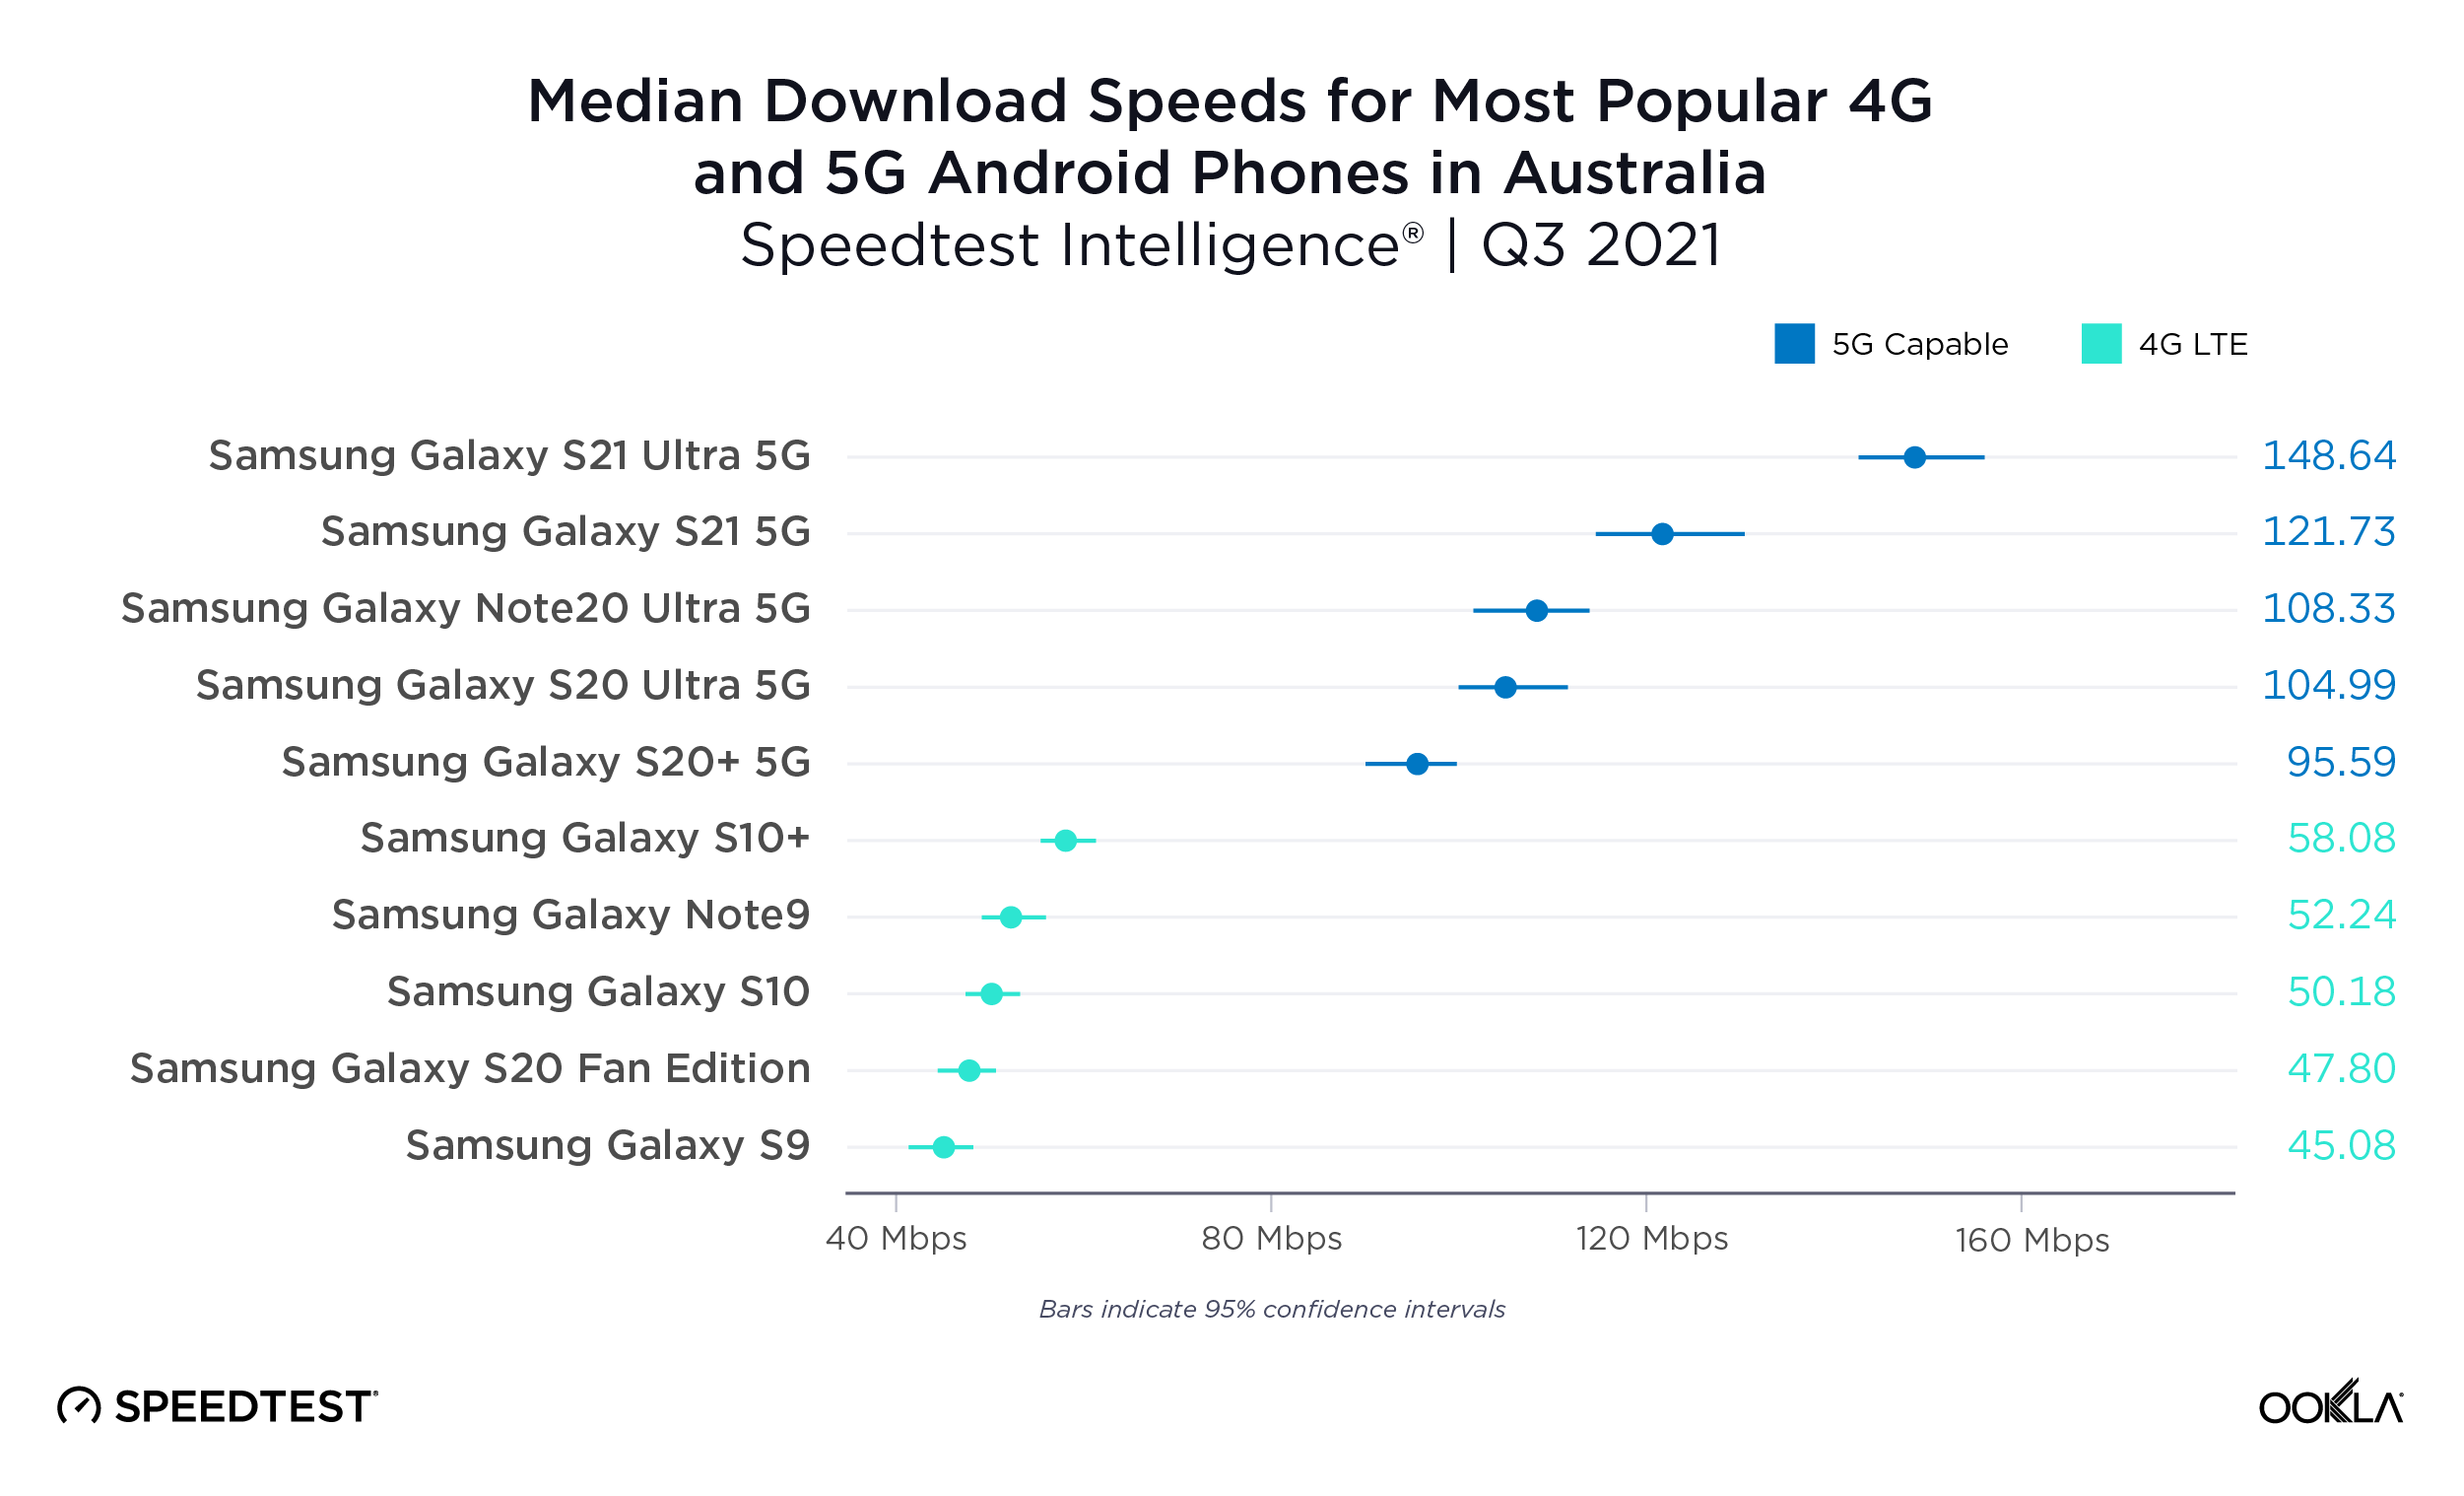
5G Samsung devices more than twice as fast as most popular 4G devices in Australia

Although only a year separates the release of the Samsung Galaxy S10 series and the S20 series devices, the latter were definitely faster in Australia during Q3 2021. Even the slowest 5G-capable device on this list, the Galaxy S20+ 5G was much faster than the fastest 4G phone, the Galaxy S10+.
ookla_android_performance_australia_1121-01

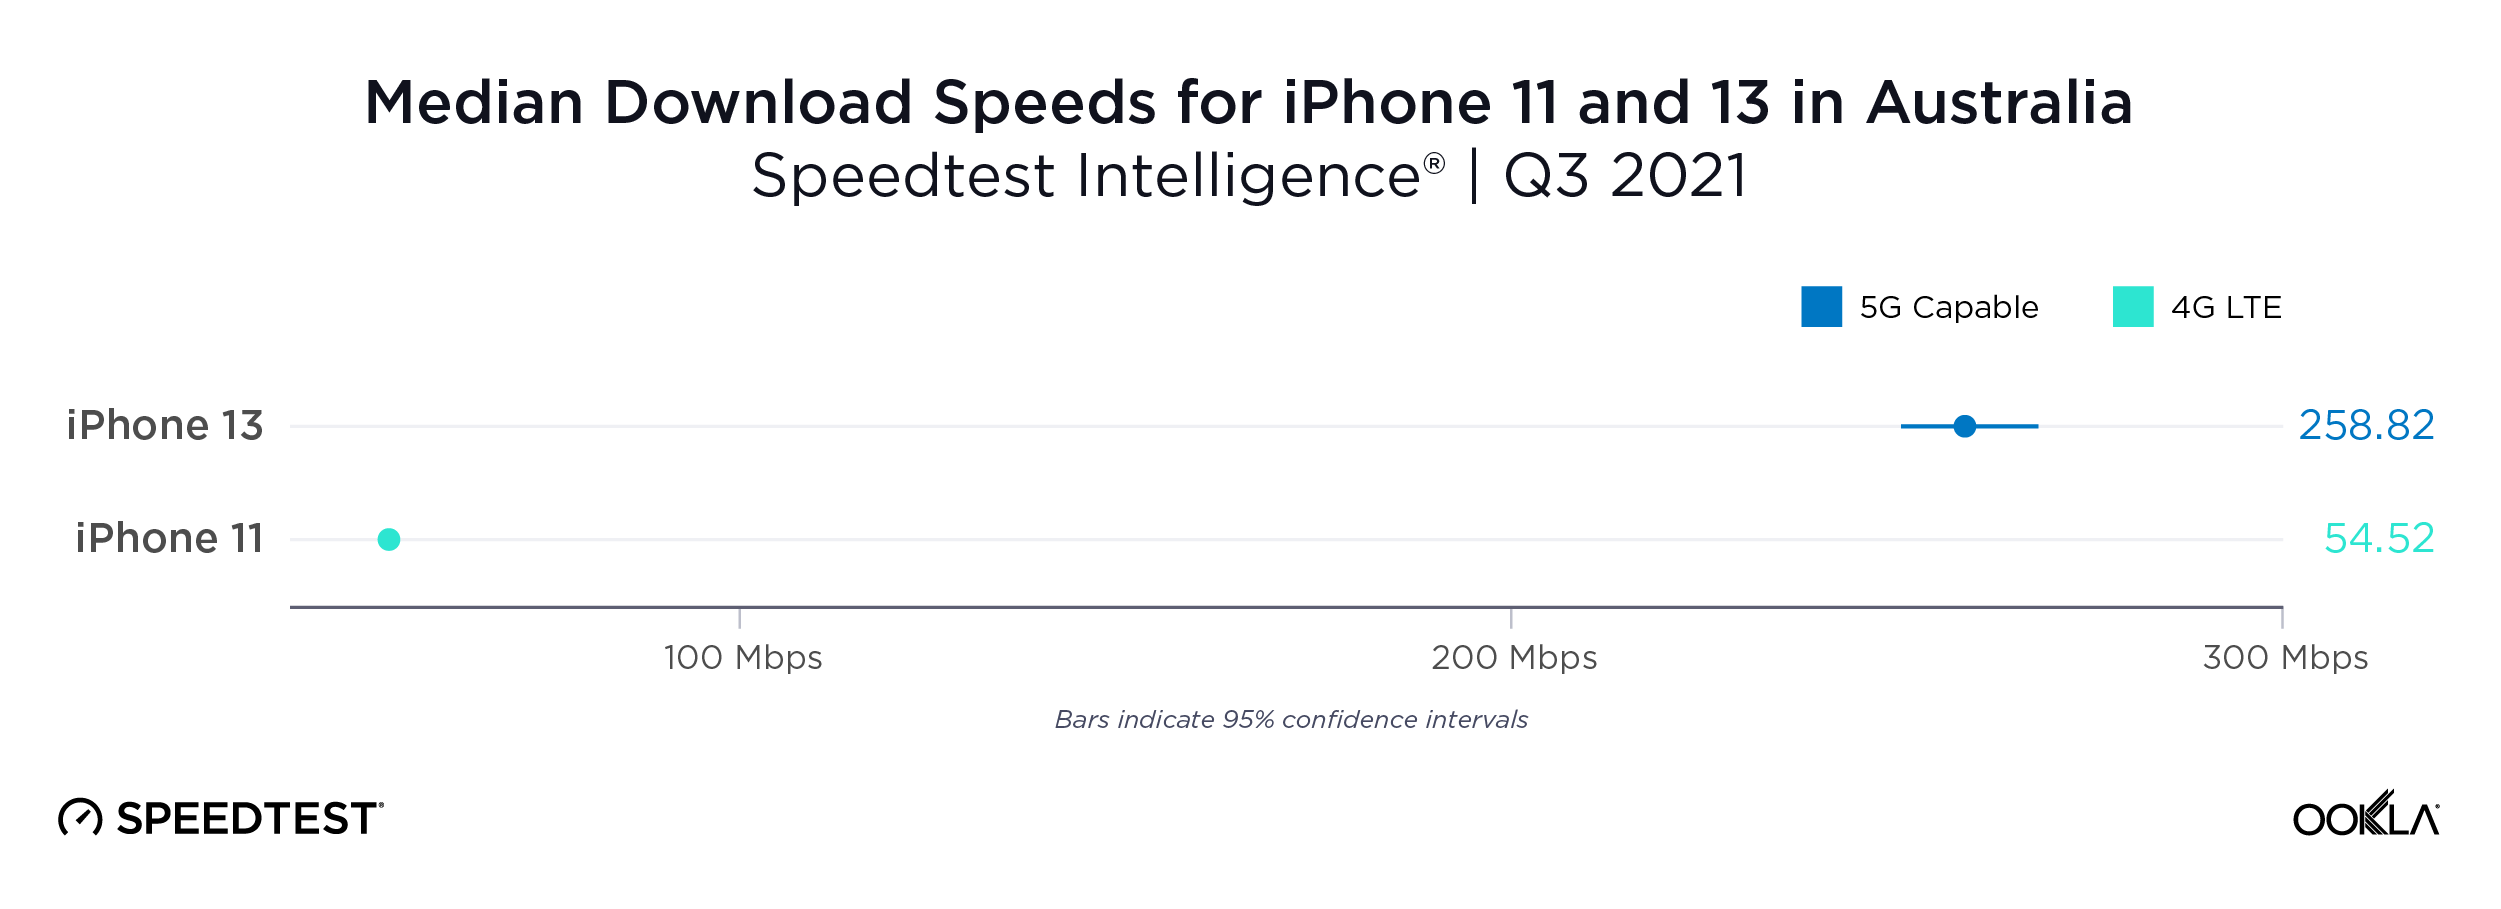
iPhone 13 wallops iPhone 11 for speed in Australia

Australians who recently upgraded their iPhone 11 for an iPhone 13 would have seen a more than 4X increase in median download speed during Q3 2021. If speed is your number one concern, this upgrade is necessary.
ookla_iphone_performance_australia_1121-01

Bahrain

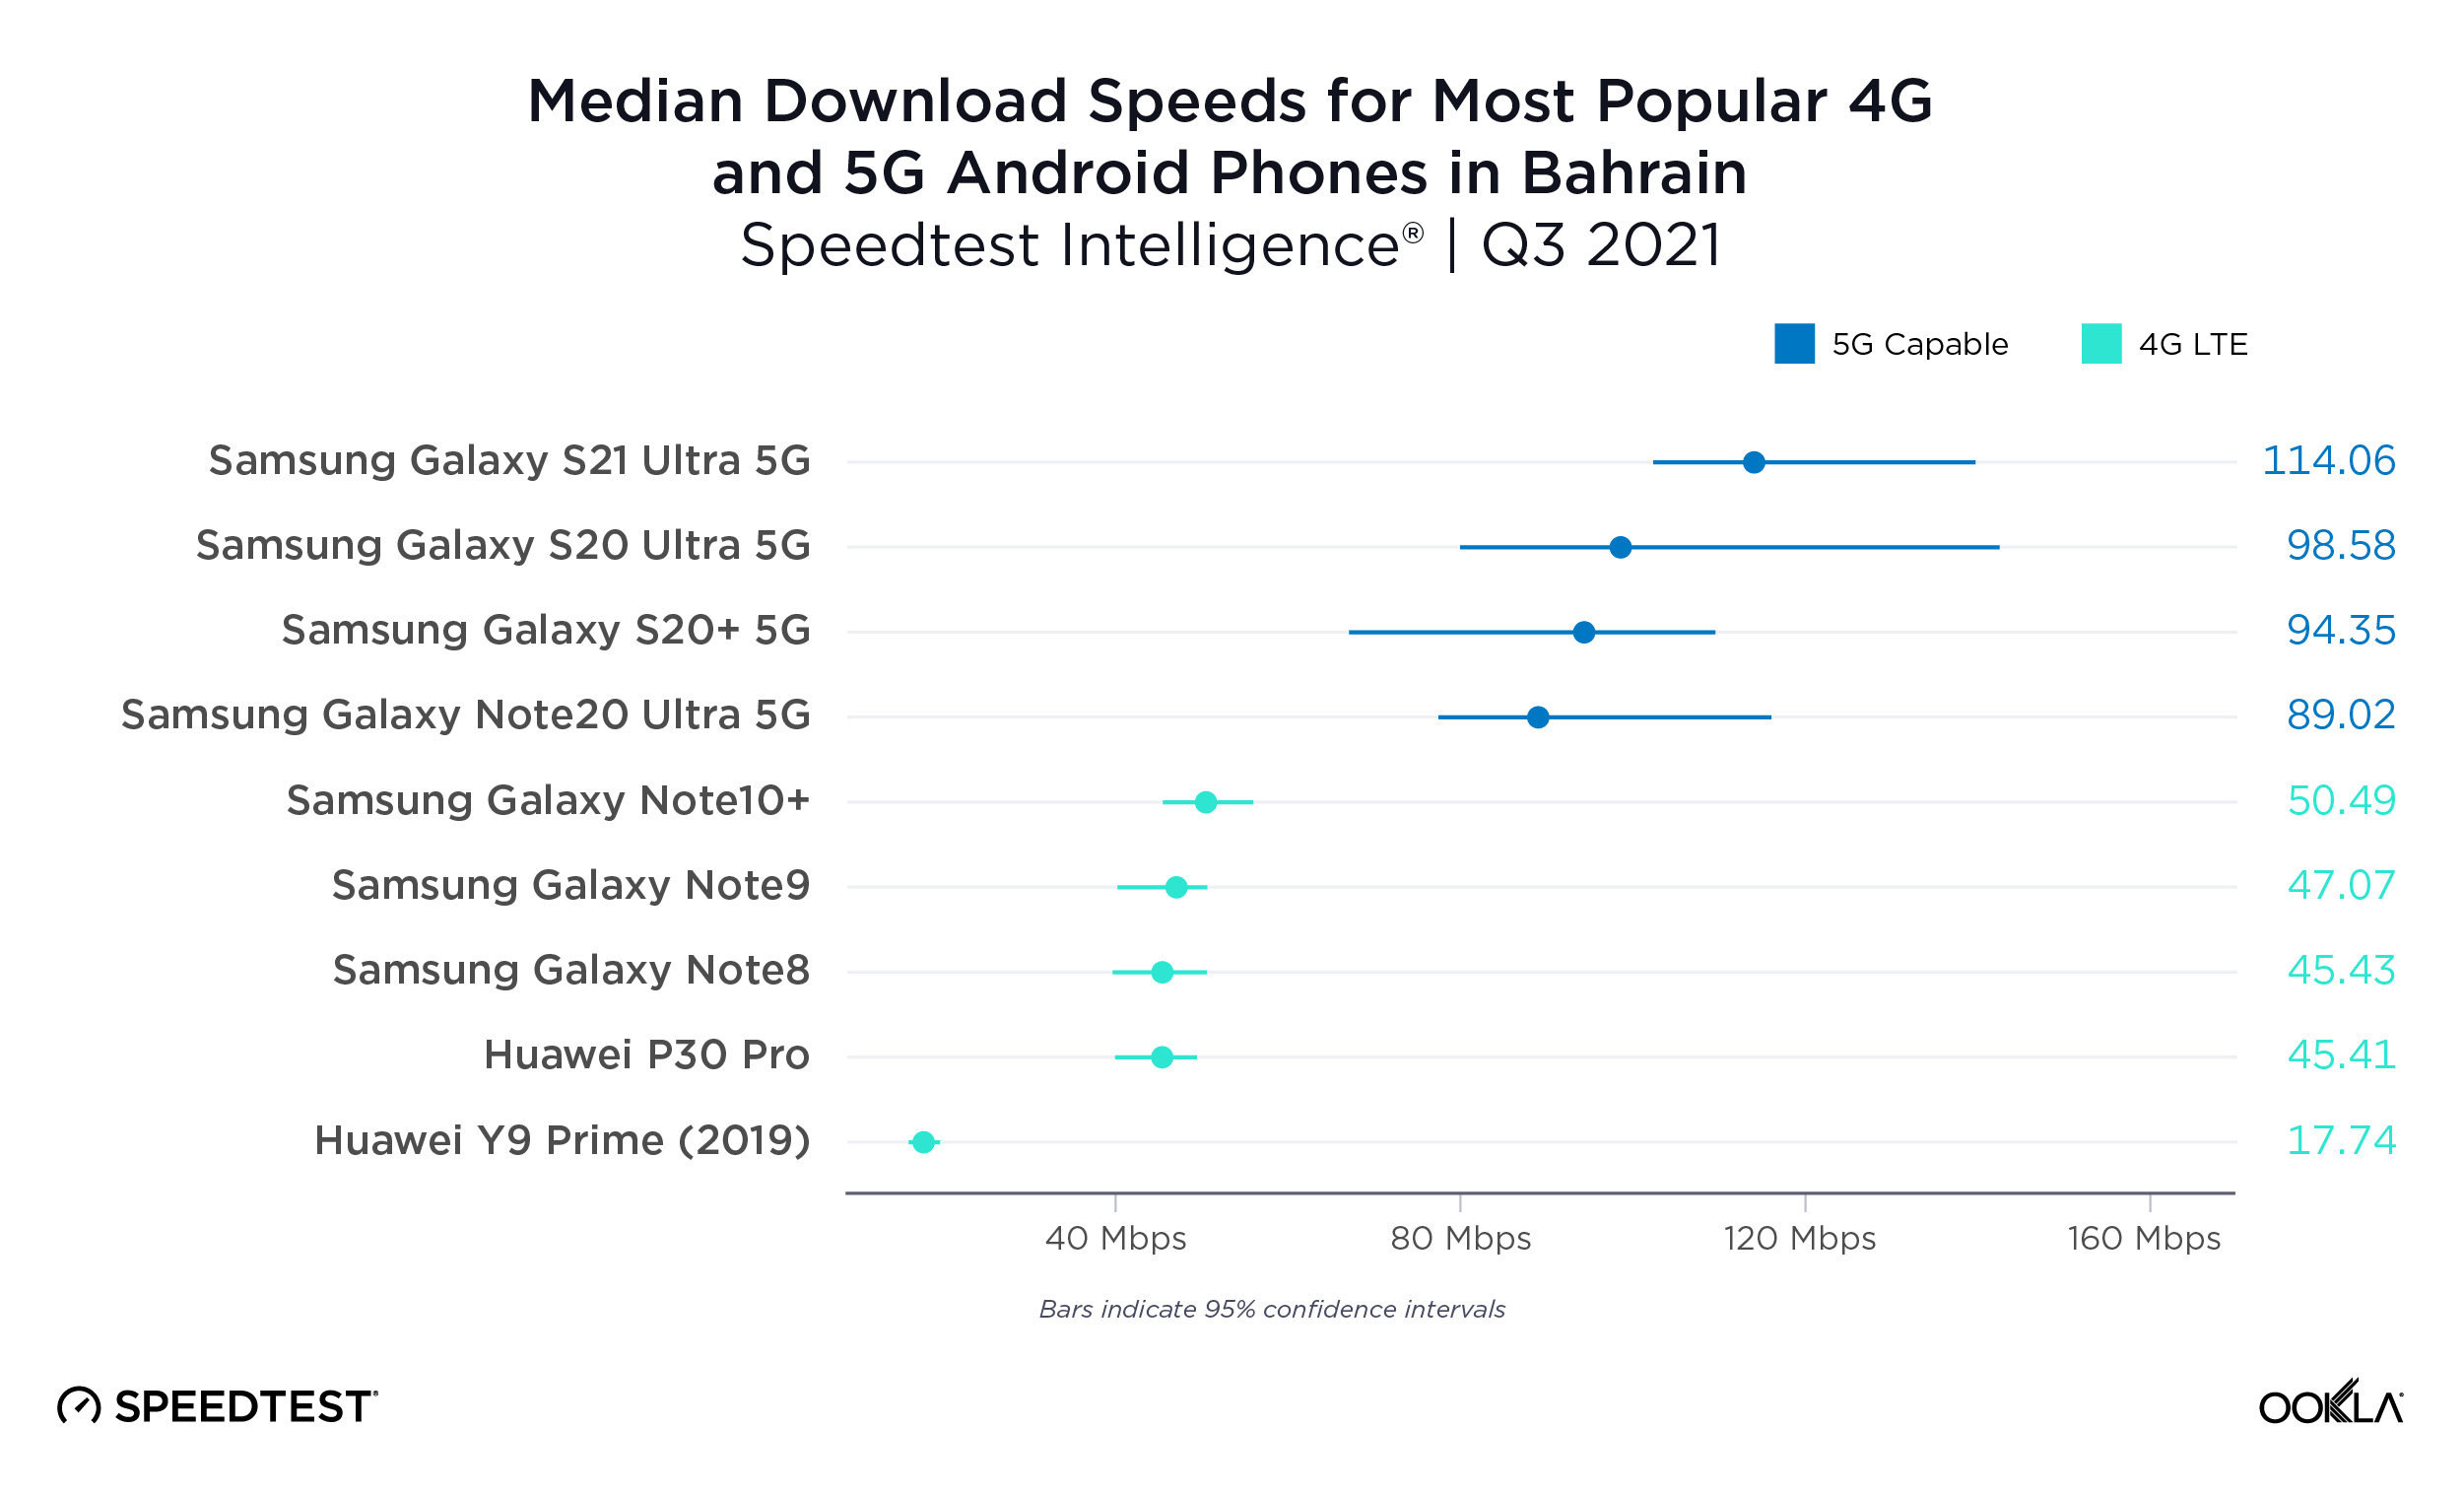
5G Samsung variants live up to the hype in Bahrain

Fewer 5G-capable phones made our list in Bahrain during Q3 2021 due to sample counts, but those that did roundly outperformed the most popular 4G devices. The median download speed of 5G-capable devices on this list was more than two times faster than the median for 4G devices on this list.
ookla_android_performance_bahrain_1121-01

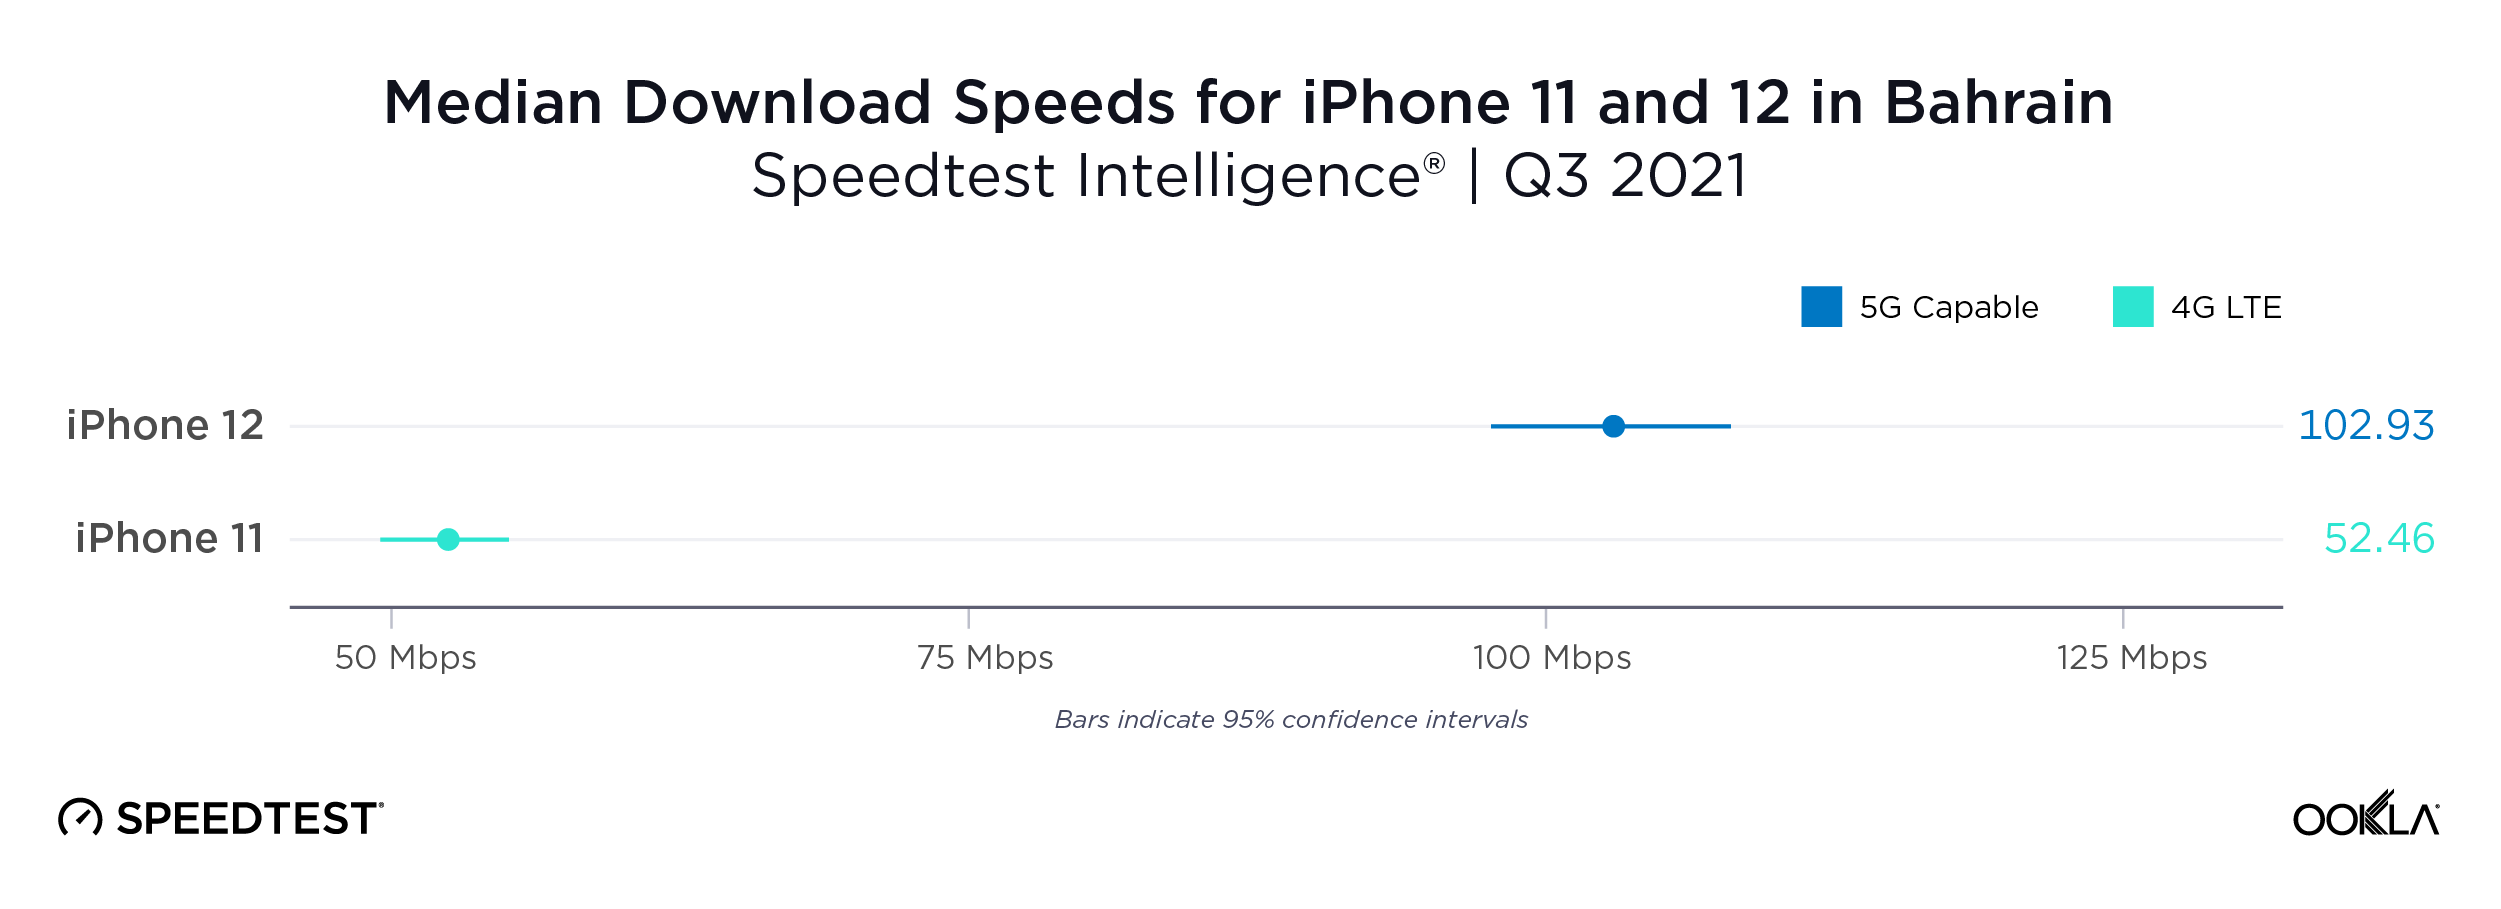
iPhone 12 85% faster than iPhone 11 in Bahrain

There weren’t sufficient samples to analyze performance of the brand new iPhone 13 in Bahrain during Q3 2021, but median download speed on the iPhone 12 was 85.0% faster than that on the iPhone 11.
ookla_iphone_performance_bahrain_1121-01

Canada

Not all 5G Android devices offer a massive improvement in Canada

Q3 2021 data from Canada shows that 5G isn’t the only way to get a fast connection. While the fastest 5G-capable device among the top five most popular (the Samsung Galaxy S21 Ultra 5G) offered very fast median download speeds, two 4G devices (the Note10+ and the S10+) were nearly as fast as the slowest 5G-capable device on this list (the S20 Fan Edition 5G). To upgrade or not is definitely a question here of which device you are upgrading from and which you plan to upgrade to.

ookla_android_performance_canada_1121-01

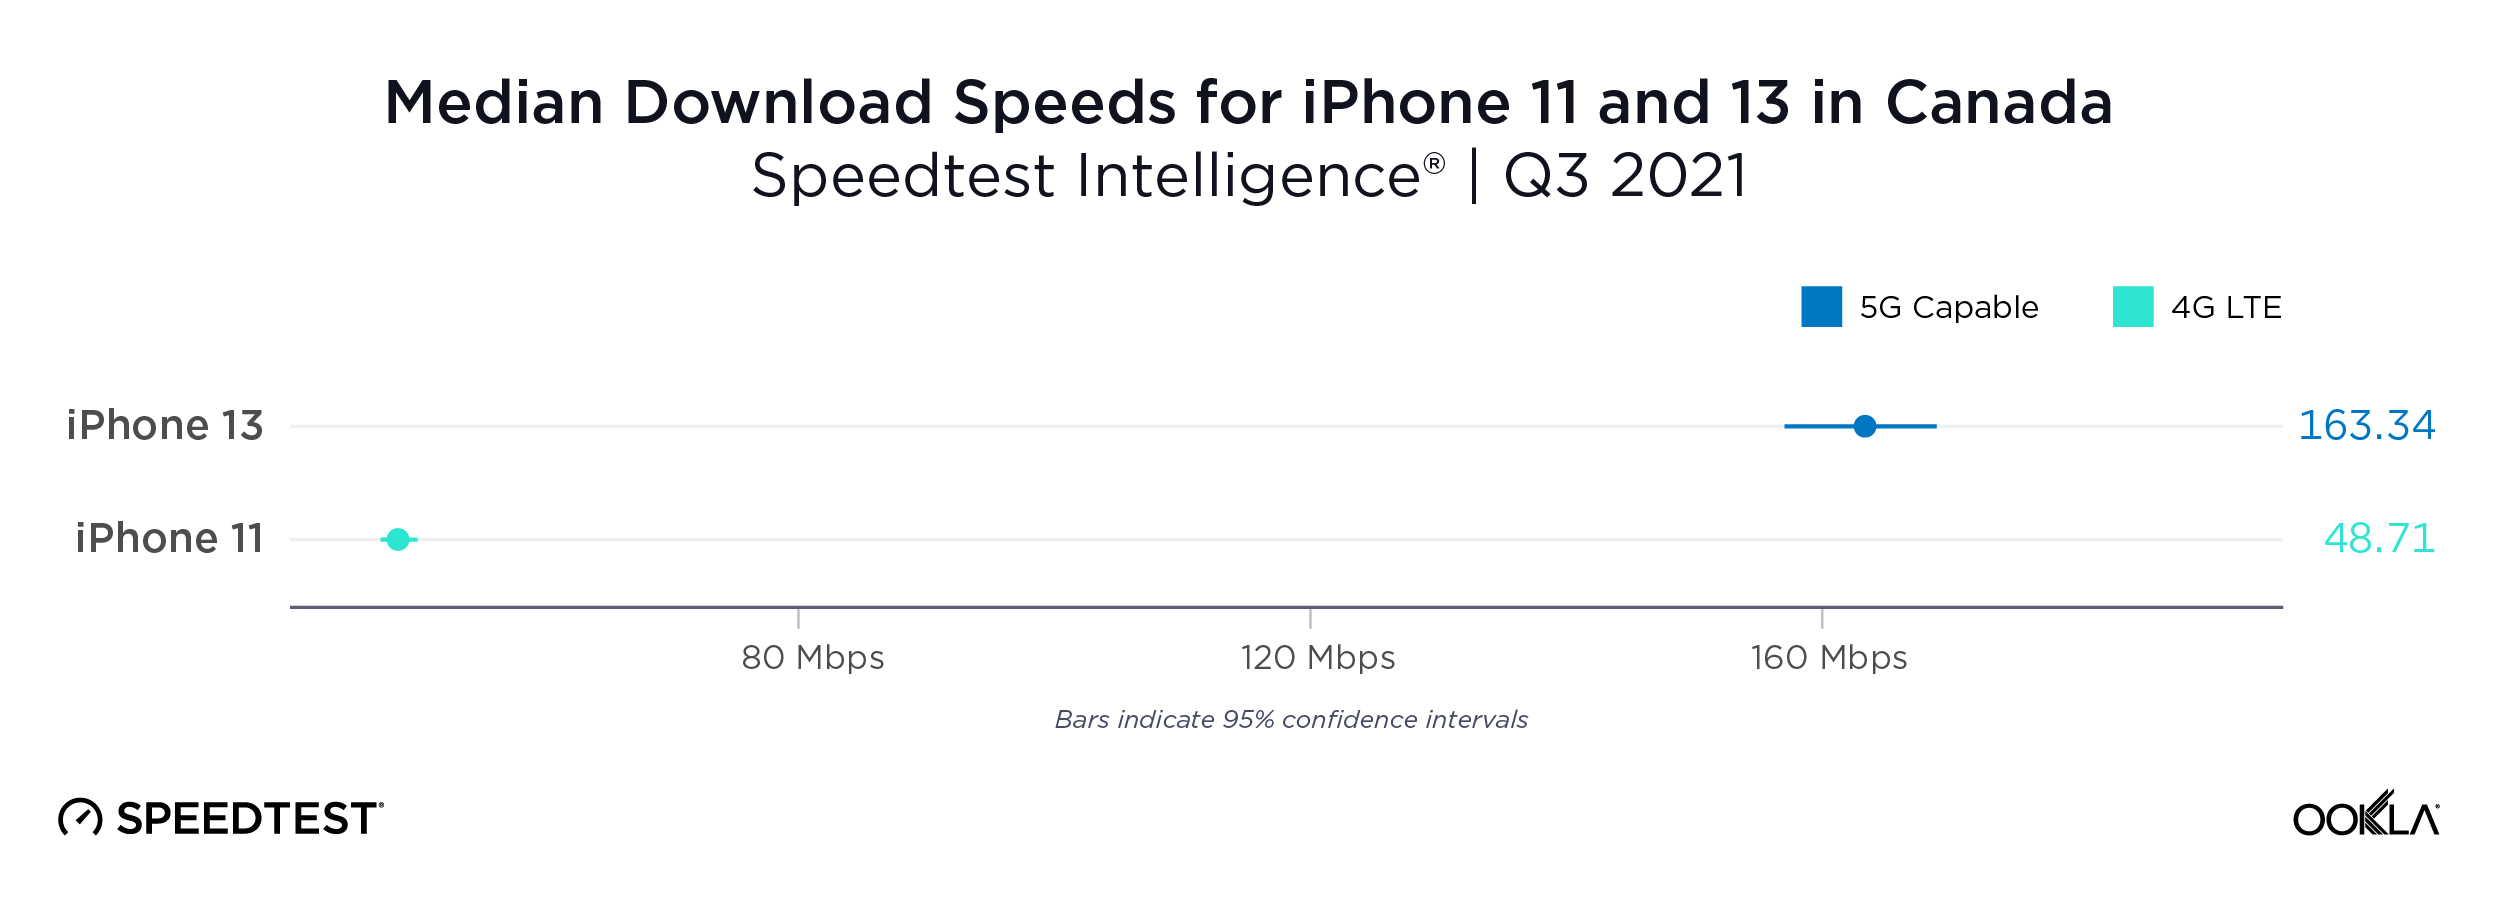
iPhone 13 more than three times as fast as the iPhone 11 in Canada

Canadians looking for fast mobile performance on Apple devices will enjoy an upgrade to the iPhone 13 whose median download speed in Q3 2021 was more than three times as fast as that on the iPhone 11.
ookla_iphone_performance_canada_1121-01

China

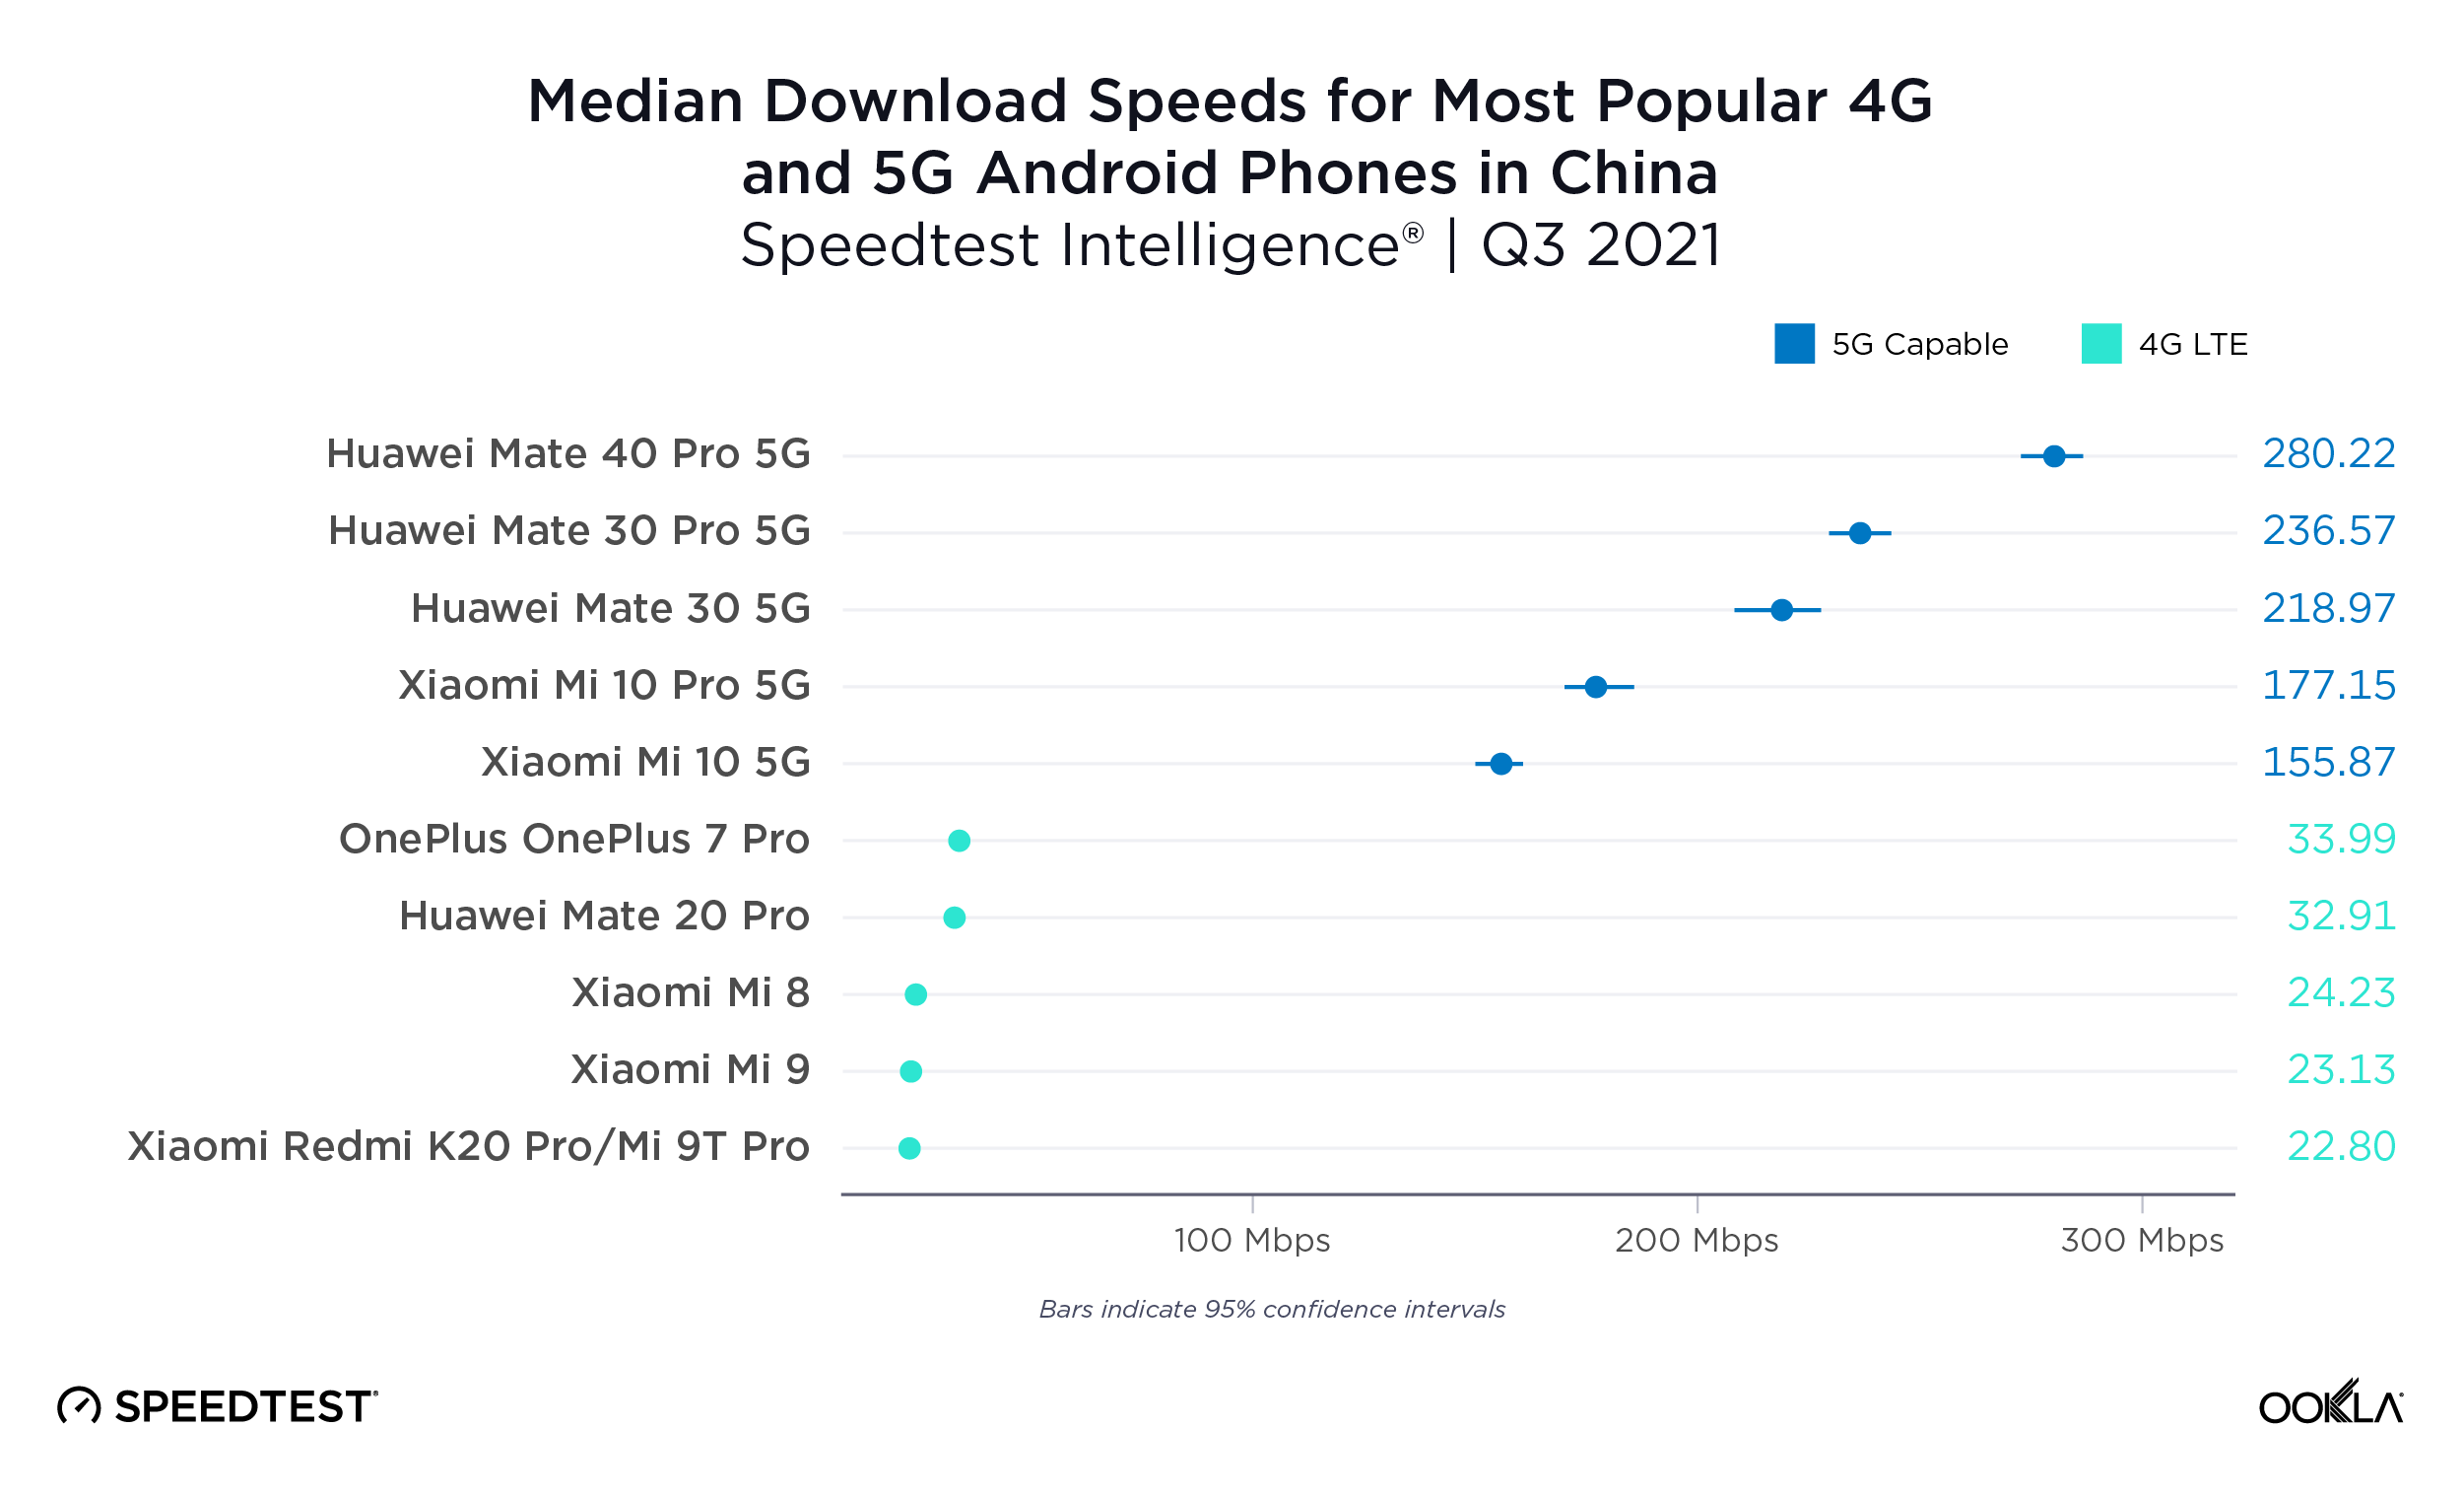
5G offers major advantages on Android in China

There is no question as to whether consumers with one of the five most popular 4G Android devices would see faster speeds with one of the five most popular 5G Android devices. The 4G devices on this list saw median download speeds in the 22.00 to 34.00 Mbps range during Q3 2021 while the 5G-capable devices showed median download speeds between 155.87 Mbps (Xiaomi Mi 10 5G) and 280.22 Mbps (Huawei Mate 40 Pro 5G).
ookla_android_performance_china_1121-01

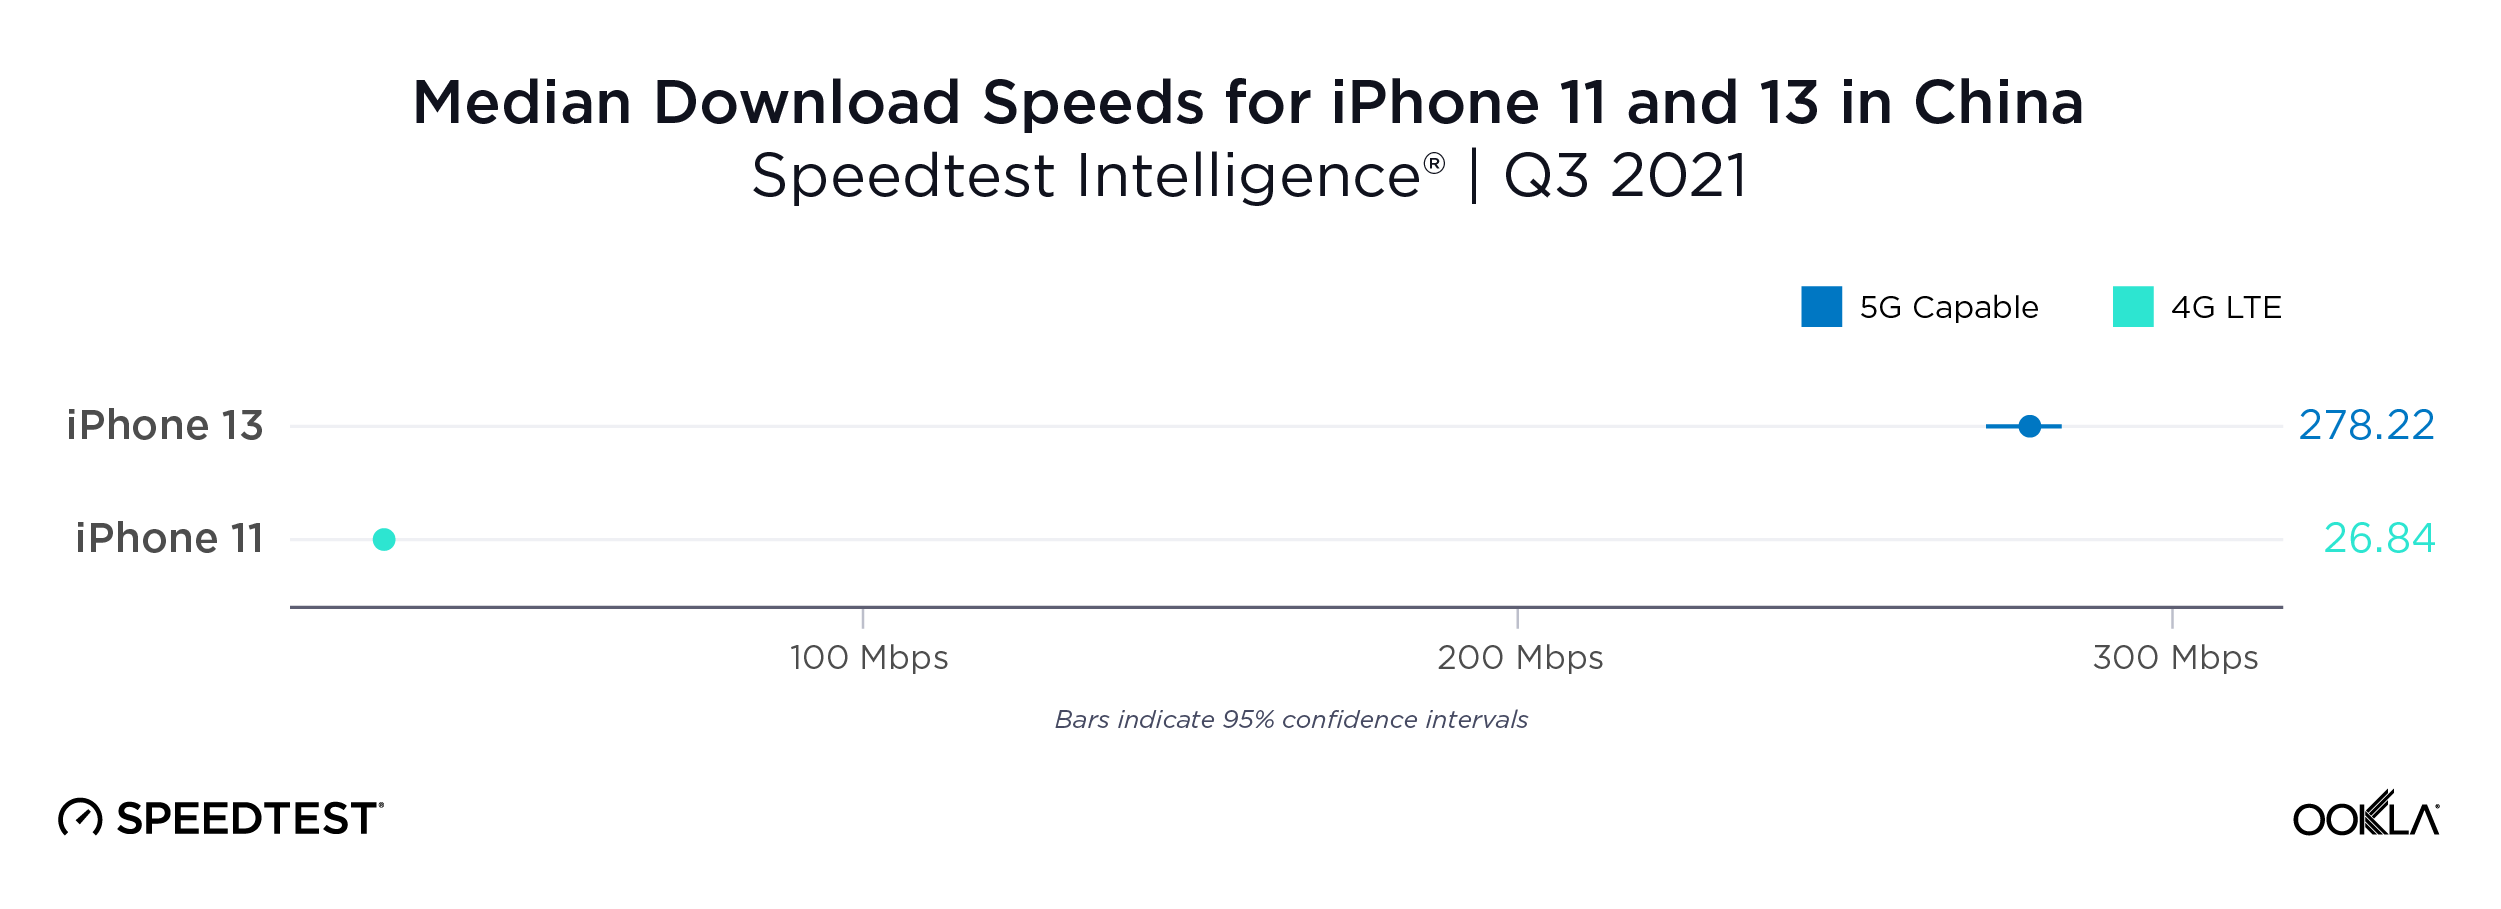
iPhone 13 more than ten times faster than iPhone 11 in China

China was home to the largest performance increase when comparing the iPhone 11 to the iPhone 13. Median download speed on the iPhone 13 was more than ten times faster during Q3 2021 than on the iPhone 11. Some of this difference may reflect market conditions where users in more rural areas have older phones and poorer infrastructure, but it’s still an impressive difference.
ookla_iphone_performance_china_1121-01

France

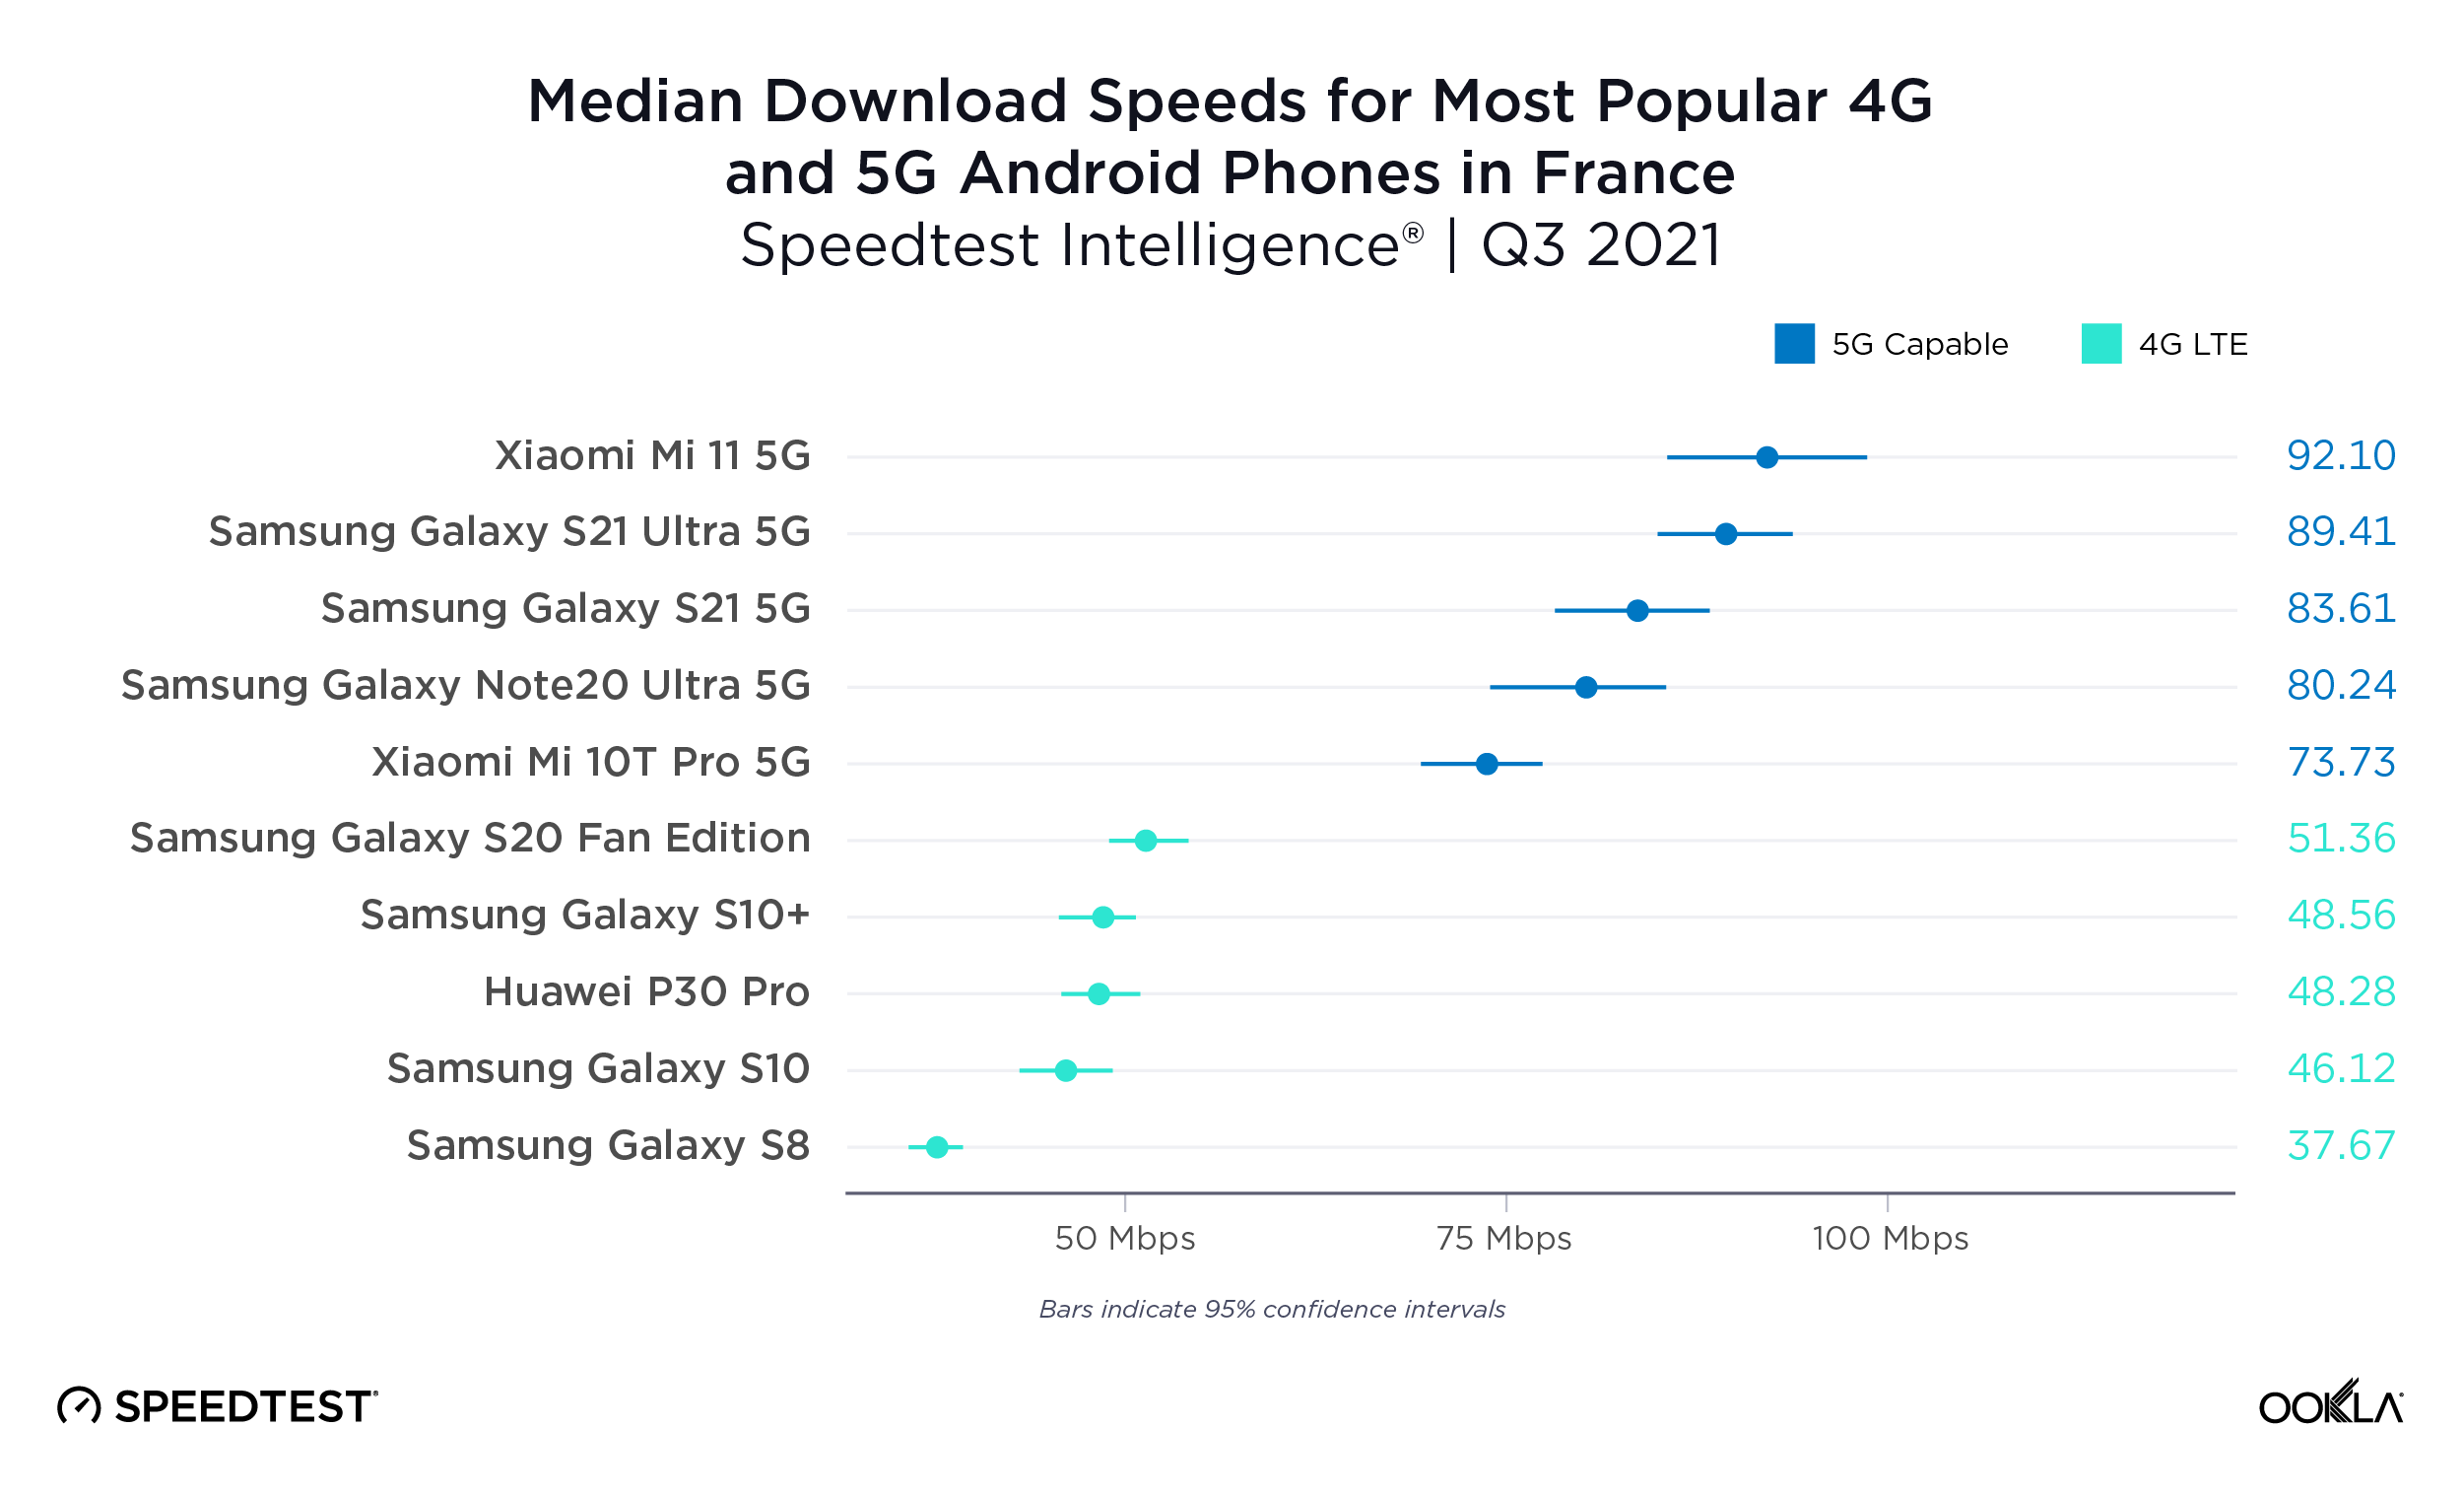
French 5G offers a decent speed boost on Android

The most popular 4G devices in France showed median download speeds between 37.67 Mbps (Samsung Galaxy S8) and 51.36 Mbps (S20 Fan Edition) during Q3 2021. These were easily topped by the 5G-capable devices which showed median download speeds of 73.73 Mbps (Xiaomi Mi 10T Pro 5G) to 92.10 Mbps (Xiaomi Mi 11 5G).
ookla_android_performance_france_1121-01

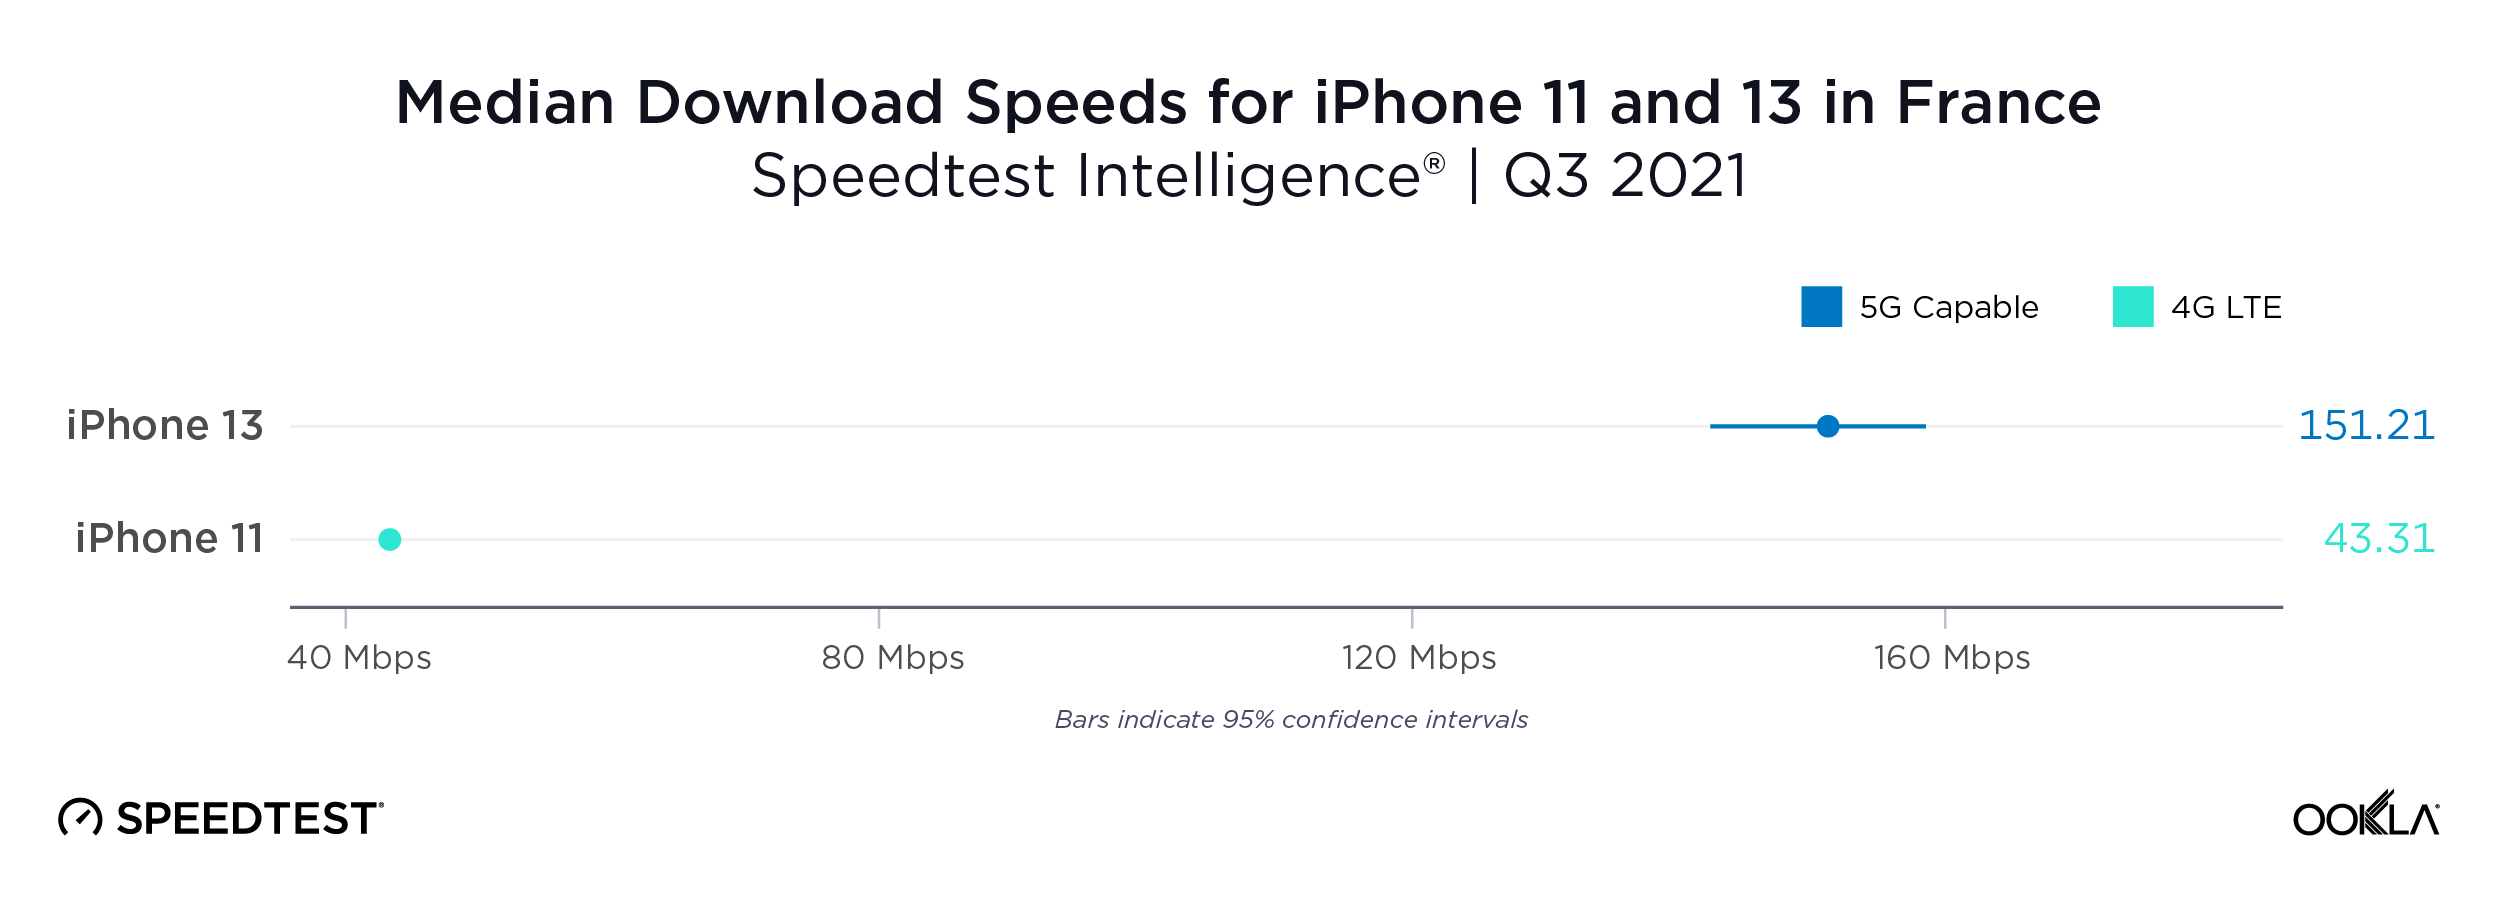
iPhone 13 more than three times faster than iPhone 11 in France

French consumers who upgraded from the iPhone 11 to the iPhone 13 during Q3 2021 would have tripled their median download speed potential on the 5G-capable iPhone 13.
ookla_iphone_performance_france_1121-01

Japan

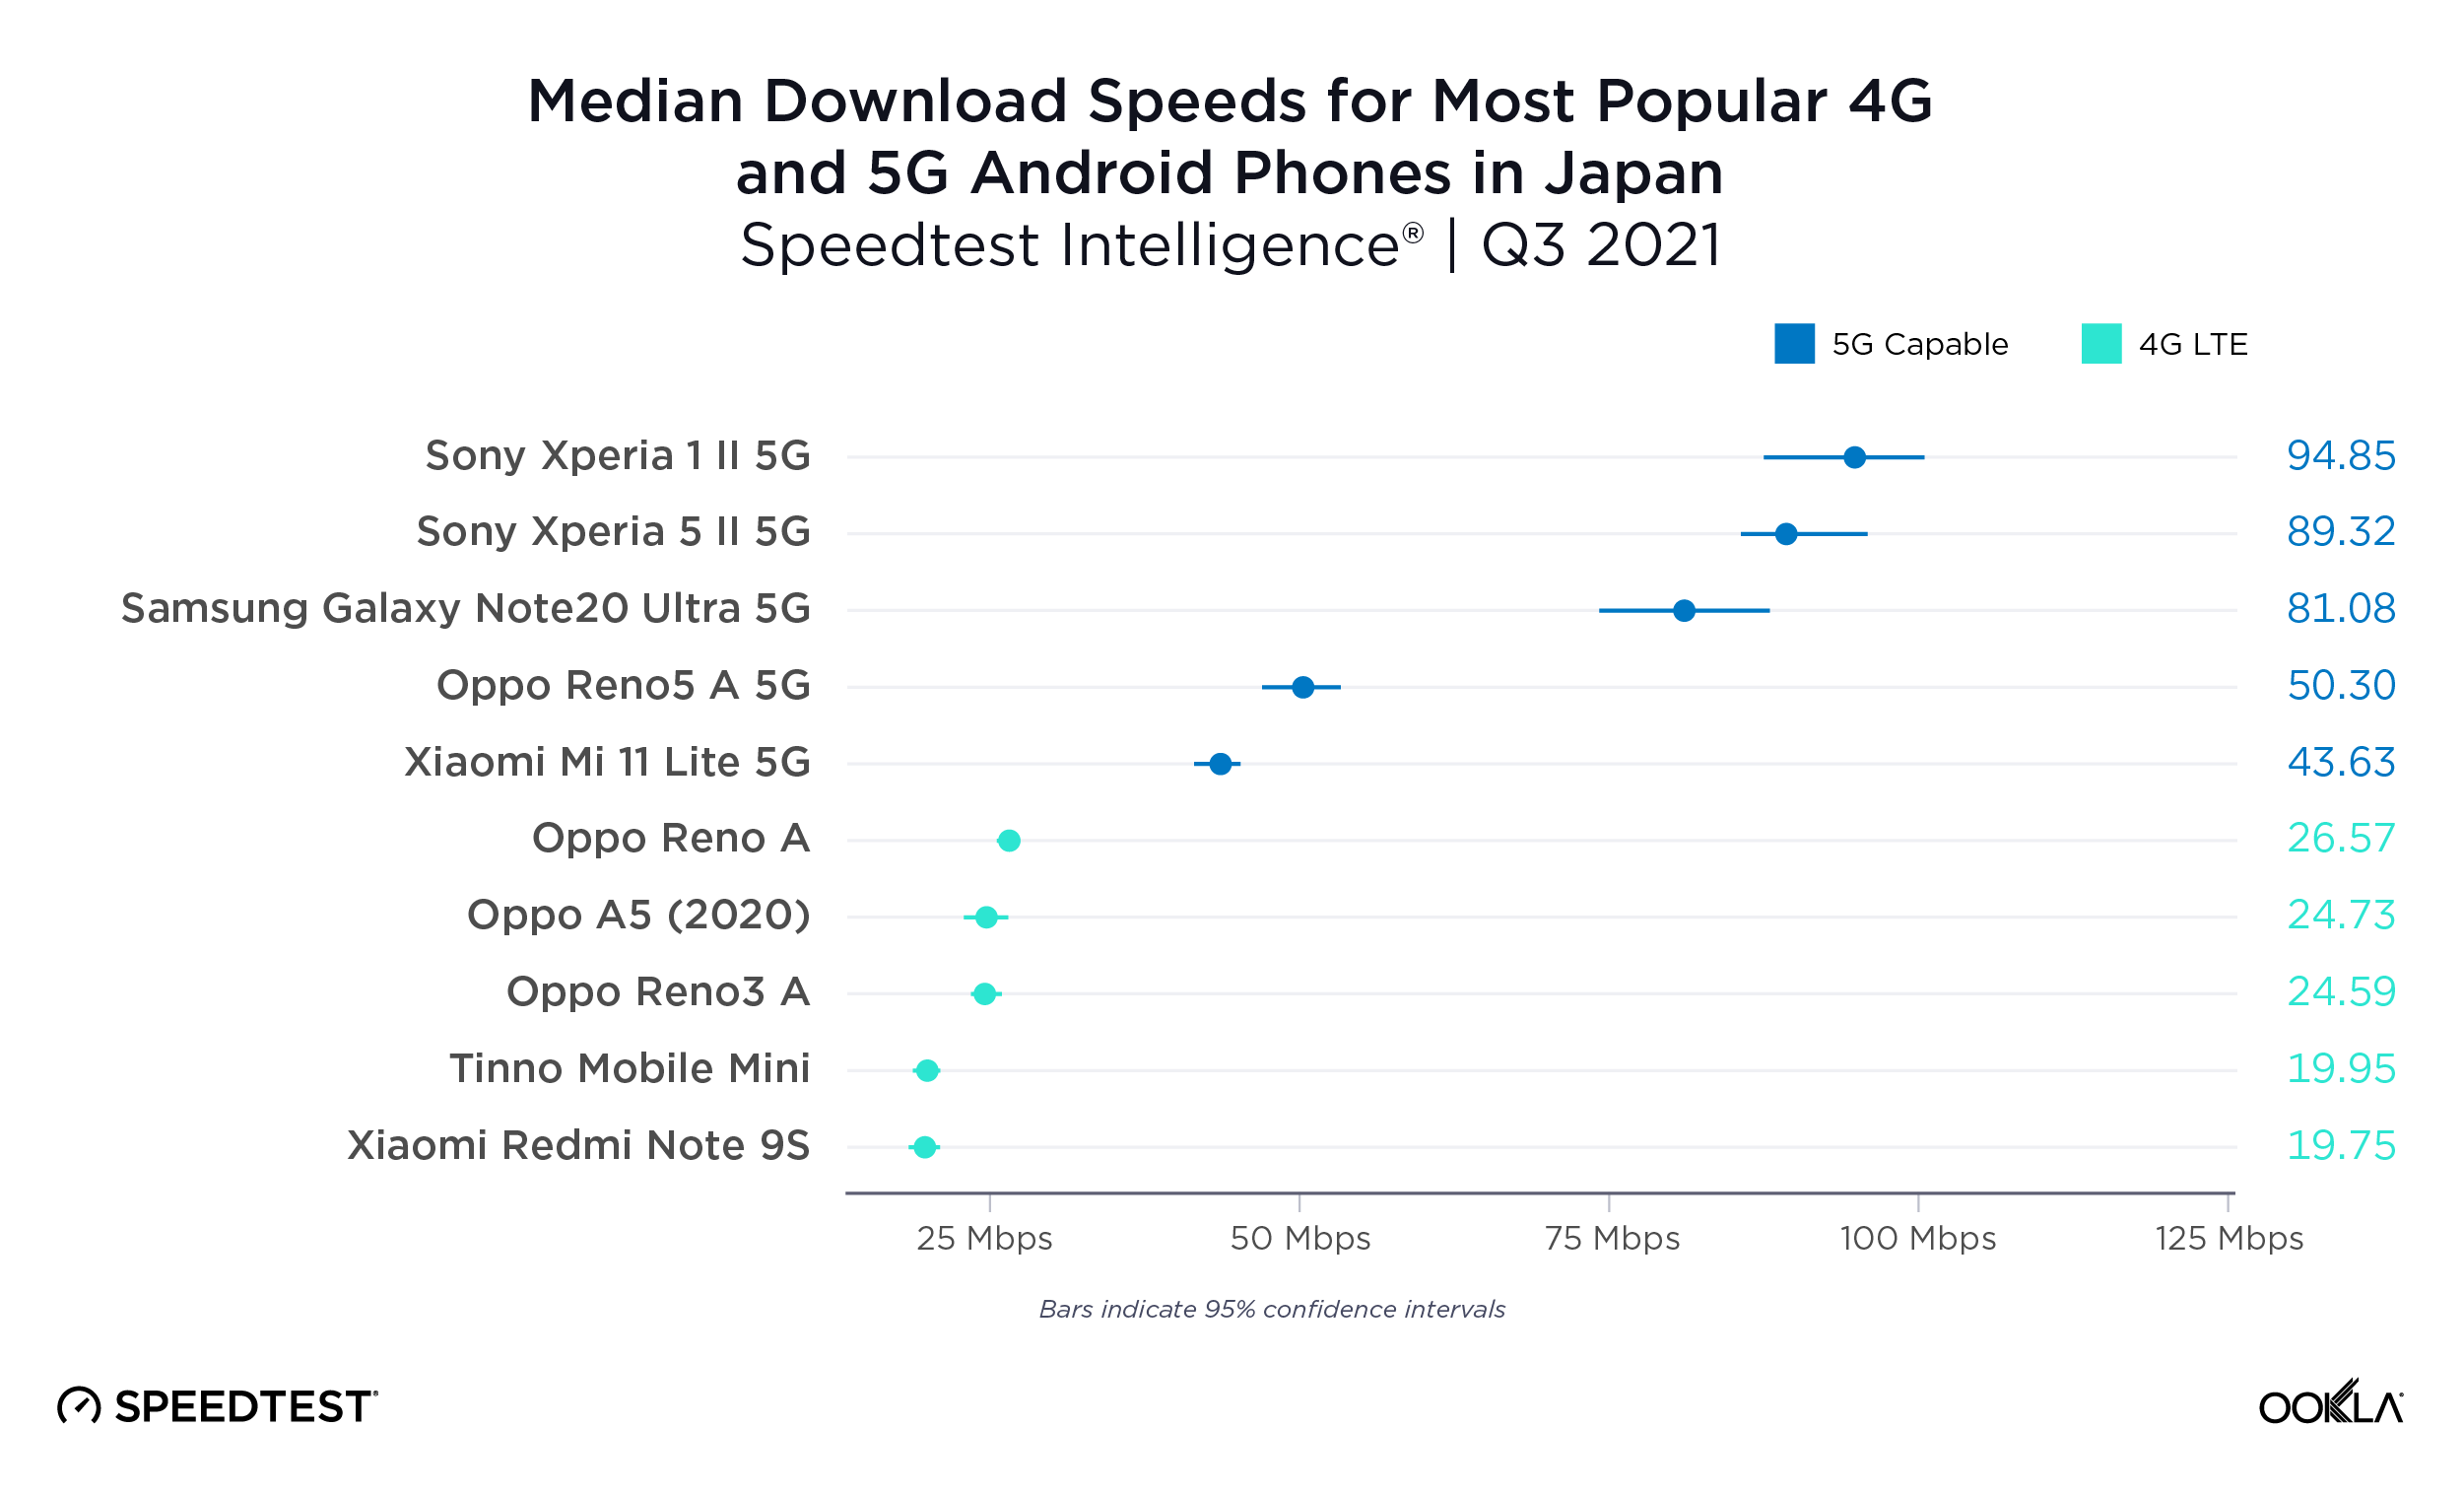
Android 5G devices are faster in Japan, but not always fast

The most popular 4G devices in Japan during Q3 2021 were much slower than the most popular 5G-capable devices. Speedtest Intelligence showed median download speeds on 4G devices ranging from 19.75 Mbps (Xiaomi Redmi Note 9S) to 26.57 Mbps (Oppo Reno A). Even the slowest 5G-capable device on this list, the Xiaomi Mi 11 Lite 5G at 43.63 Mbps, was 56% faster than the fastest 4G devices. However, the fastest 5G-capable device on this list, the Sony Xperia 1 II 5G, was twice as fast as that at 94.85 Mbps.
ookla_android_performance_japan_1121-01

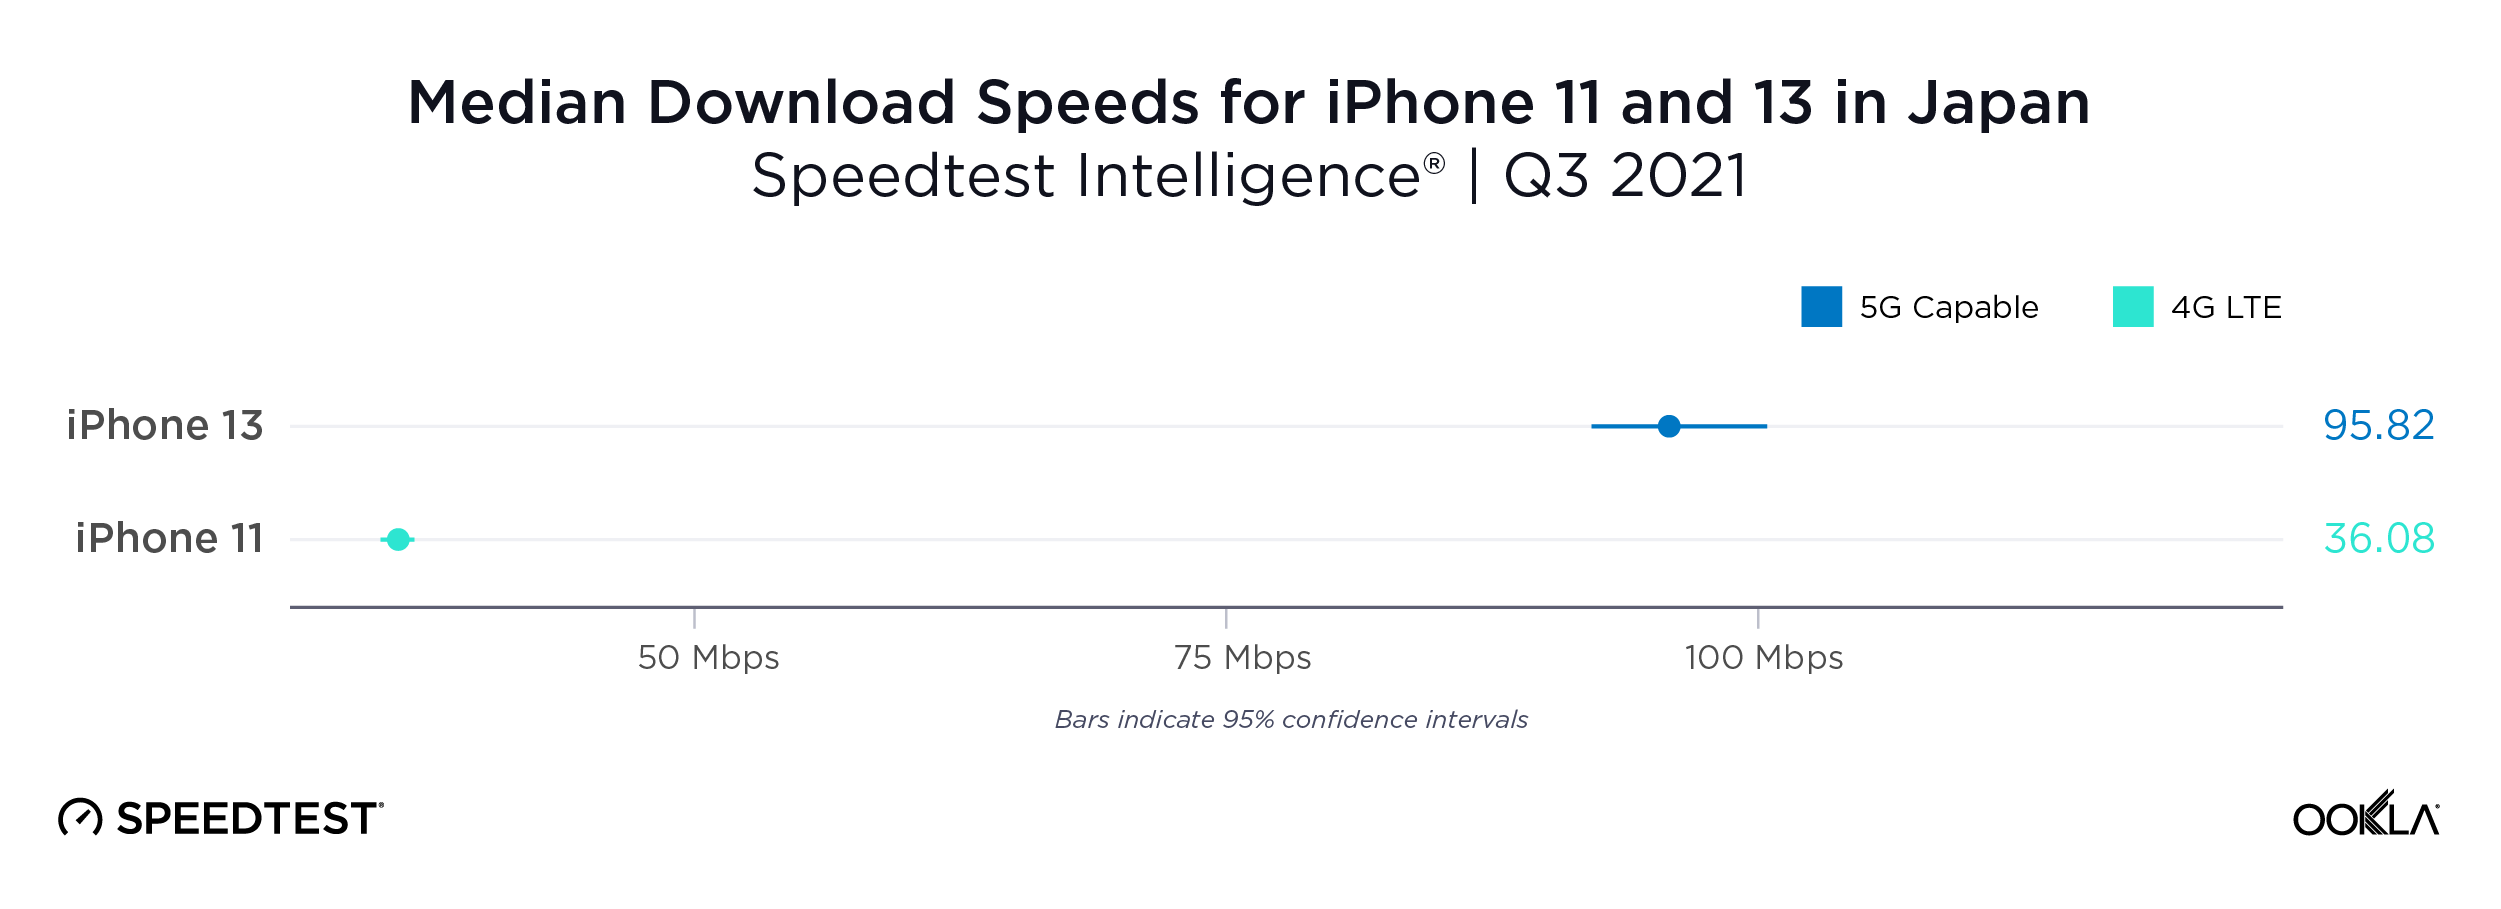
iPhone 13 more than twice as fast as iPhone 11 in Japan

In Japan, the median download speed of the iPhone 13 was more than twice as fast as that over the iPhone 11 during Q3 2021. This was one of the smallest differences in performance between the iPhone 11 and 13 that we saw in our analysis.
ookla_iphone_performance_japan_1121-01

Saudi Arabia

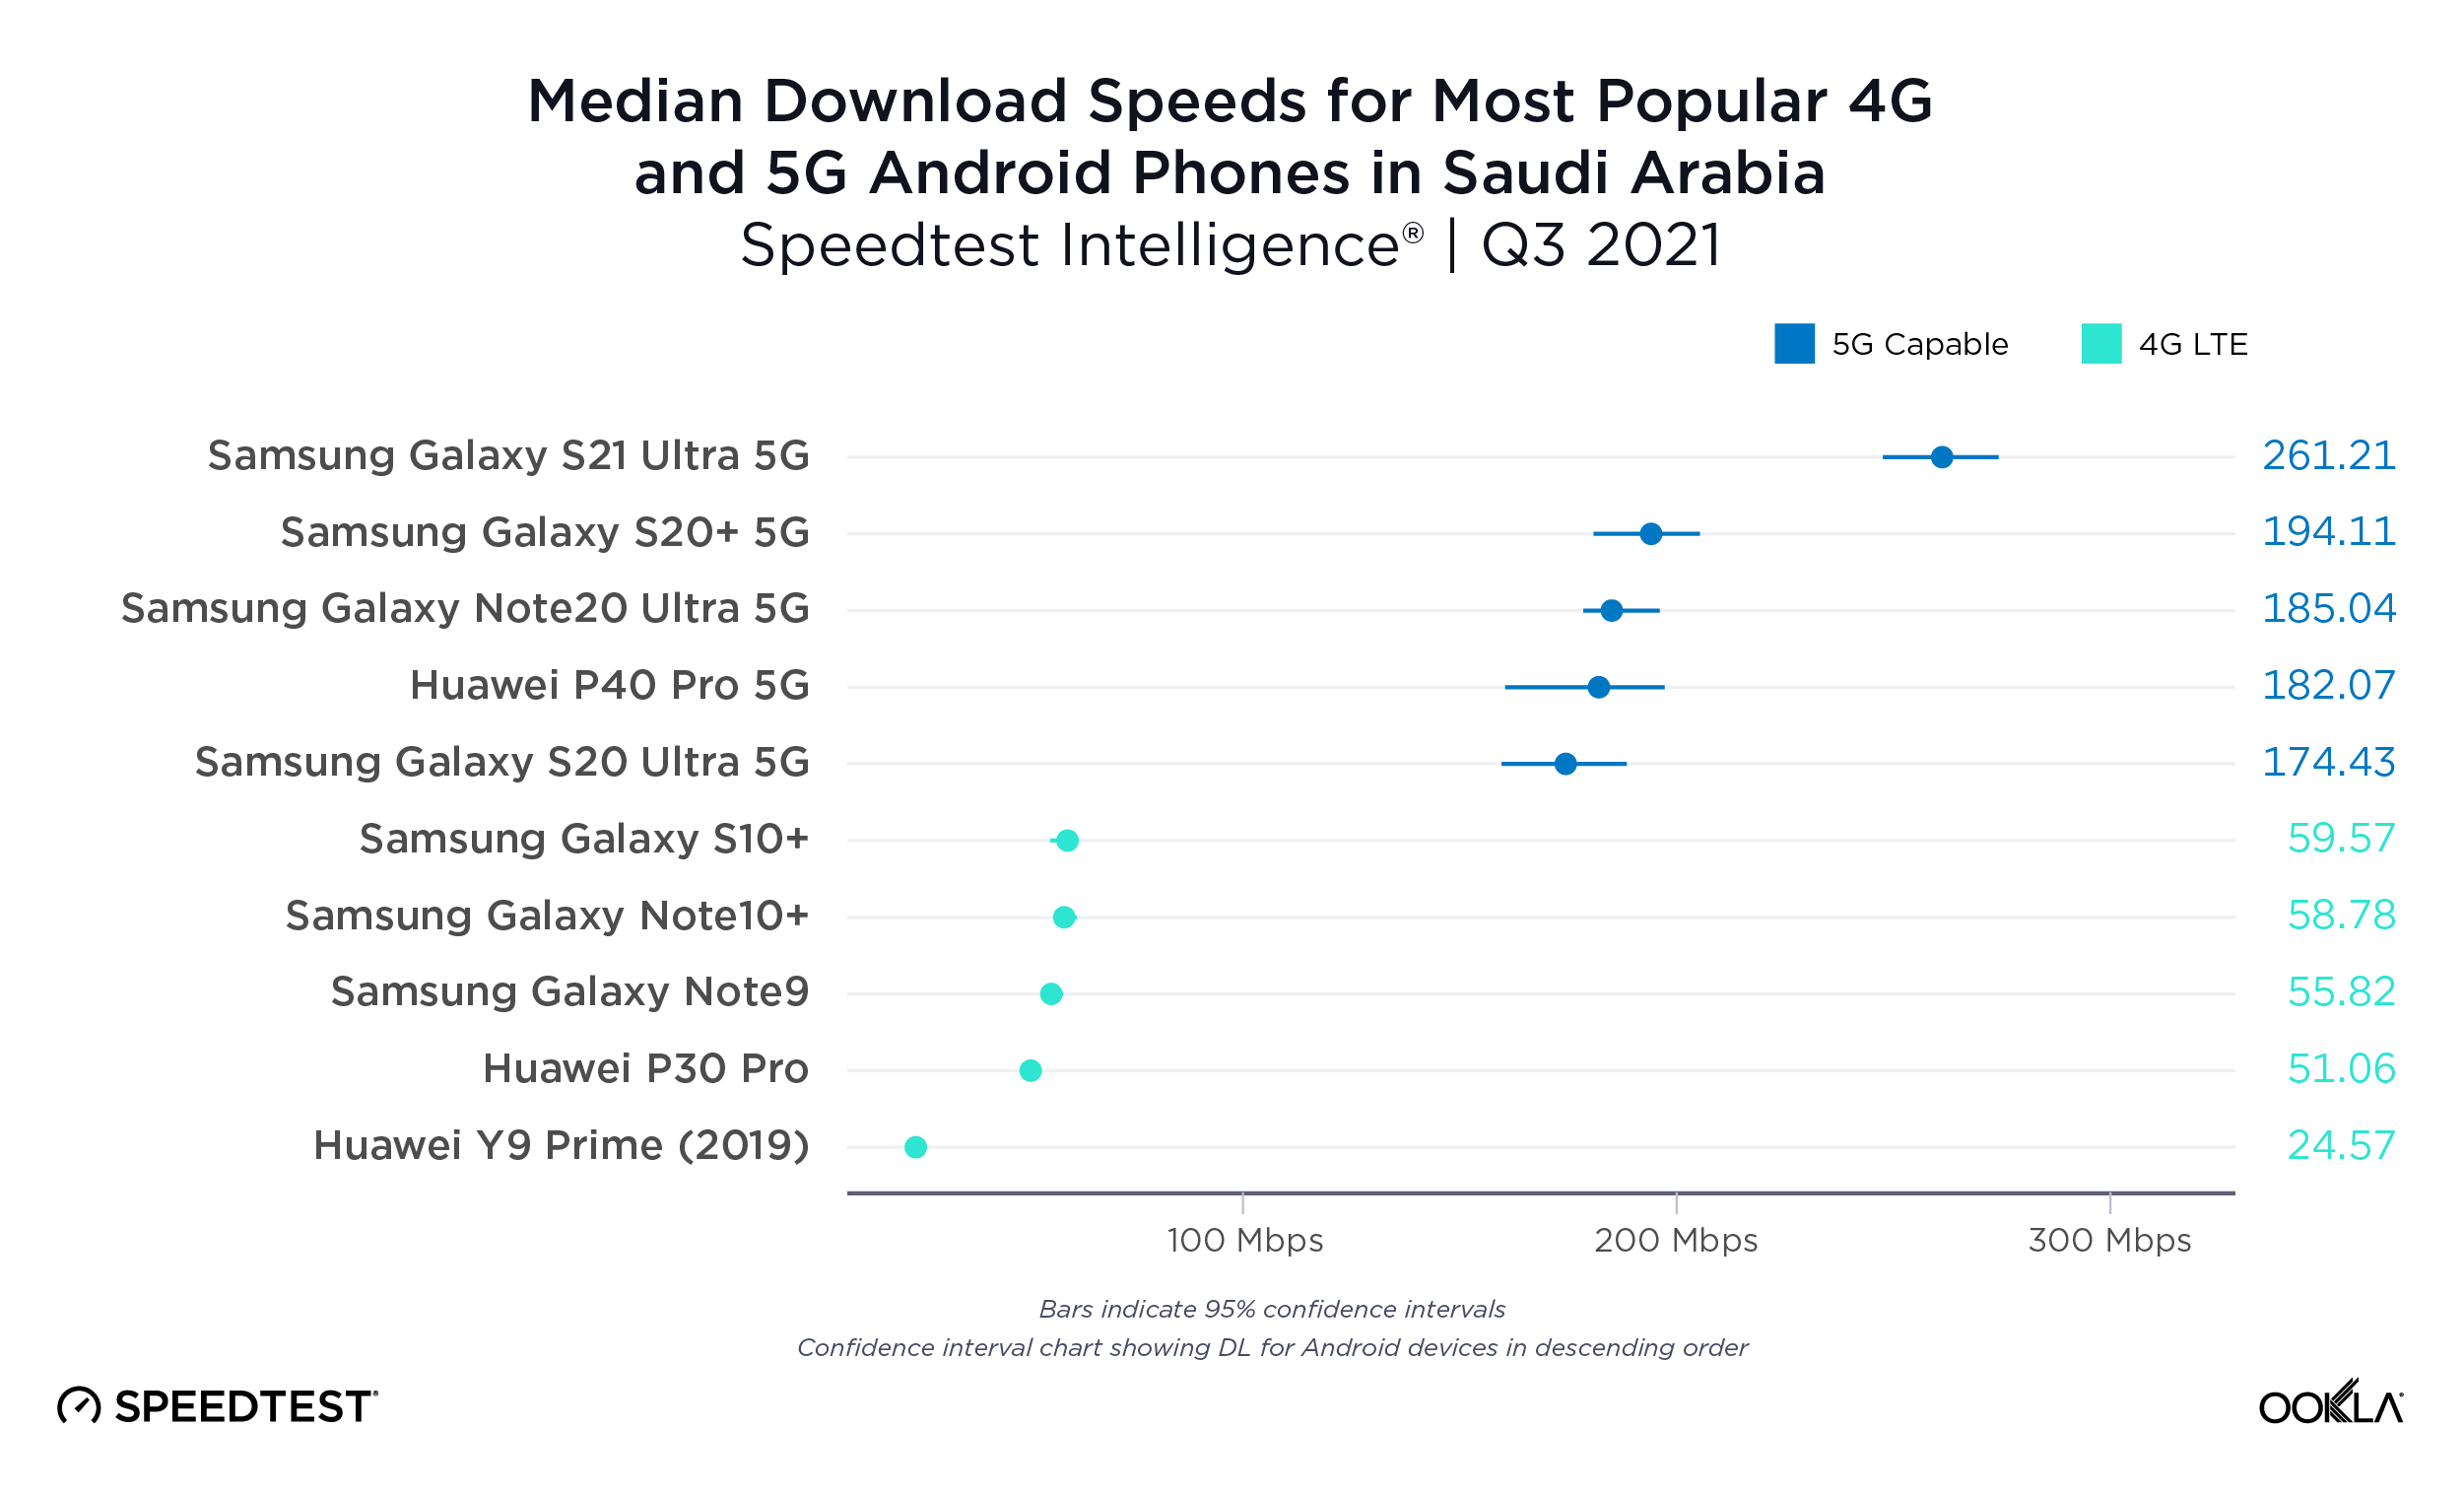
5G Android devices are much faster than 4G in Saudi Arabia

Median download speeds on the most popular 5G-capable devices were fast in Saudi Arabia compared to most other markets. 5G-capable speeds ranged from 174.43 Mbps for the Samsung Galaxy S20 Ultra 5G to 261.21 Mbps for the S21 Ultra 5G. 5G is definitely worth the upgrade in Saudi Arabia.
ookla_android_performance_saudi-arabia_1121-2-01

iPhone 13 was more than five times faster than the iPhone 11 in Saudi Arabia

Not only did Saudi Arabia show the second fastest median download speed over iPhone 13 during Q3 2021, the iPhone 13 was also more than five times faster than the iPhone 11.

ookla_iphone_performance_saudi-arabia_1121-01

South Africa

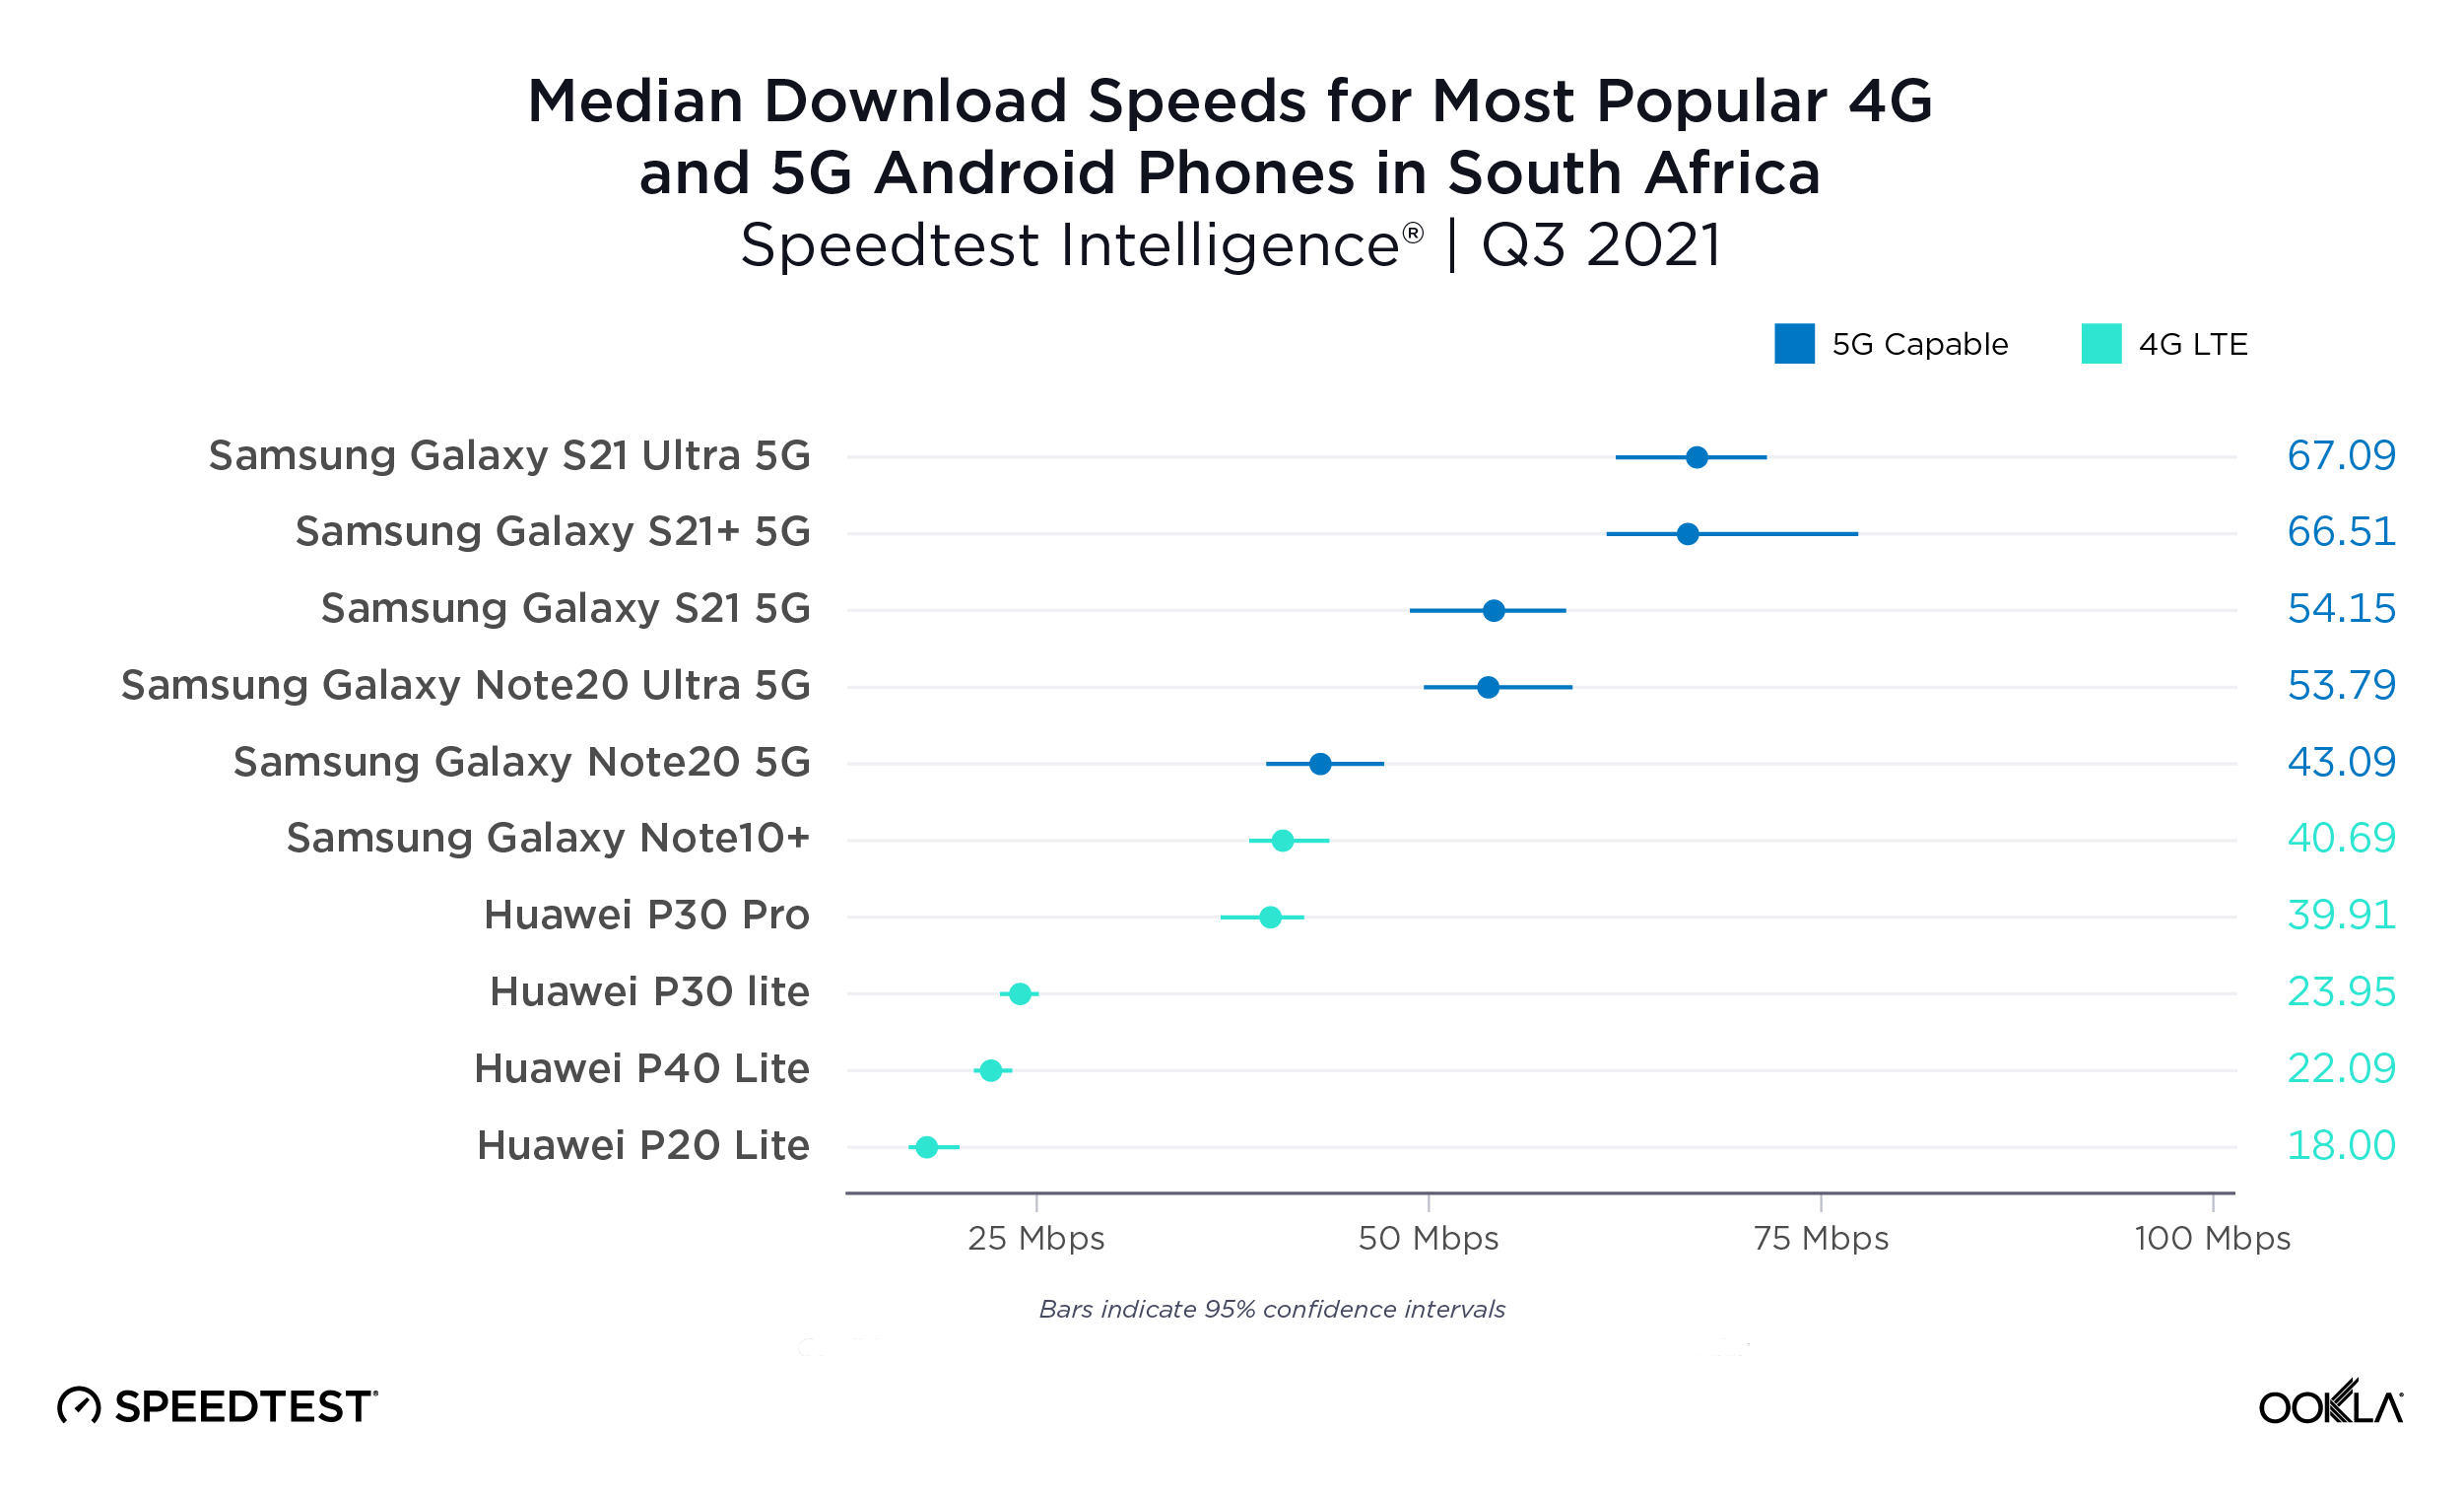
5G shows a small improvement over 4G on Android in South Africa

The most popular 4G devices in South Africa showed a wide range of median download speeds during Q3 2021, from 18.00 Mbps (Huawei P20 Lite) to 40.69 Mbps (Samsung Galaxy Note10+). South Africa’s median download speeds on the most popular 5G devices were among the lowest we saw, from 43.09 Mbps on the Samsung Galaxy Note20 5G to 67.09 Mbps on the S21 Ultra 5G.
ookla_android_performance_south-africa_1121-01

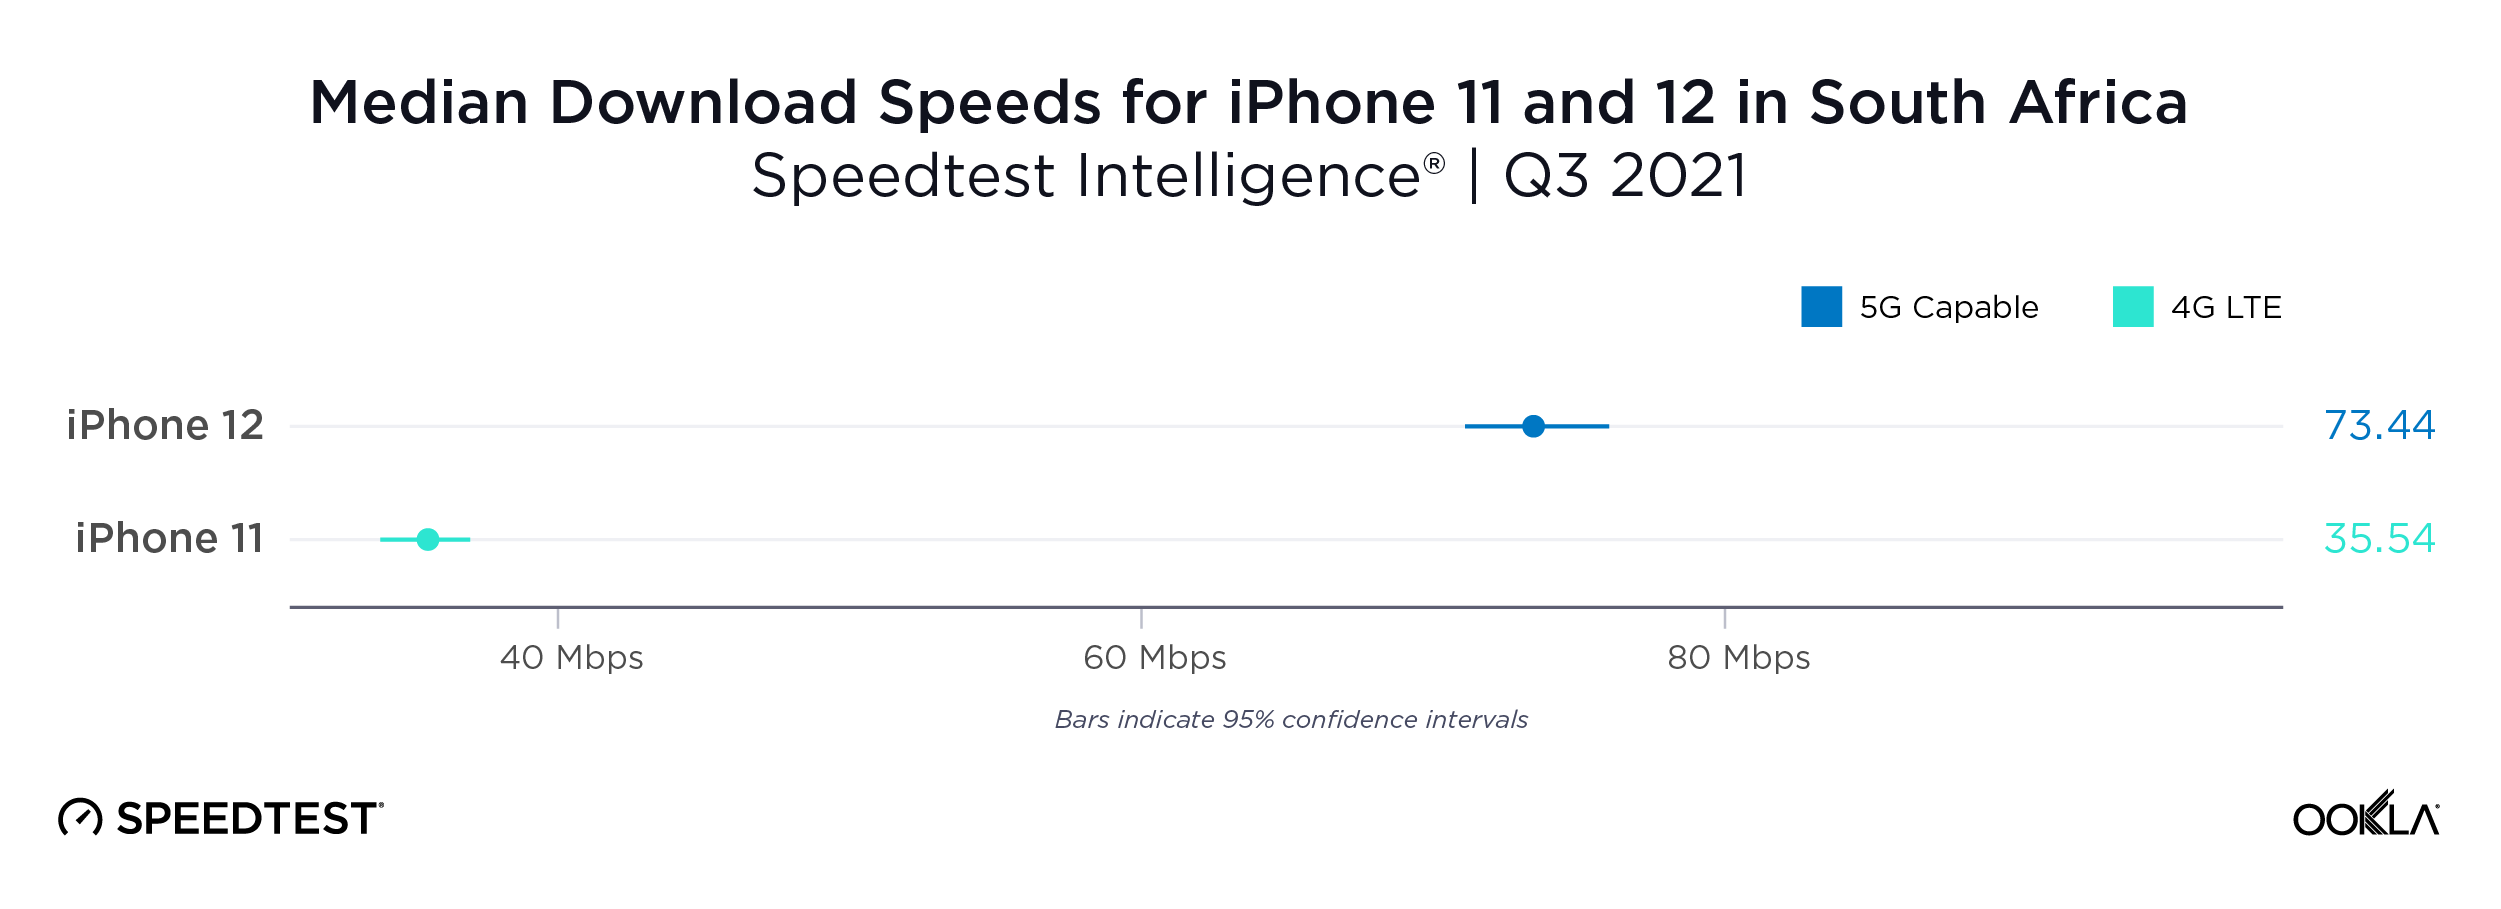
iPhone 12 was almost twice as fast as the iPhone 11 in South Africa

There weren’t sufficient samples in South Africa to analyze the iPhone 13, so we compared the iPhone 12 to the iPhone 11. The median download speed on the iPhone 12 was almost twice as fast as that on the iPhone 11 during Q3 2021.
ookla_iphone_performance_south-africa_1121-01

South Korea

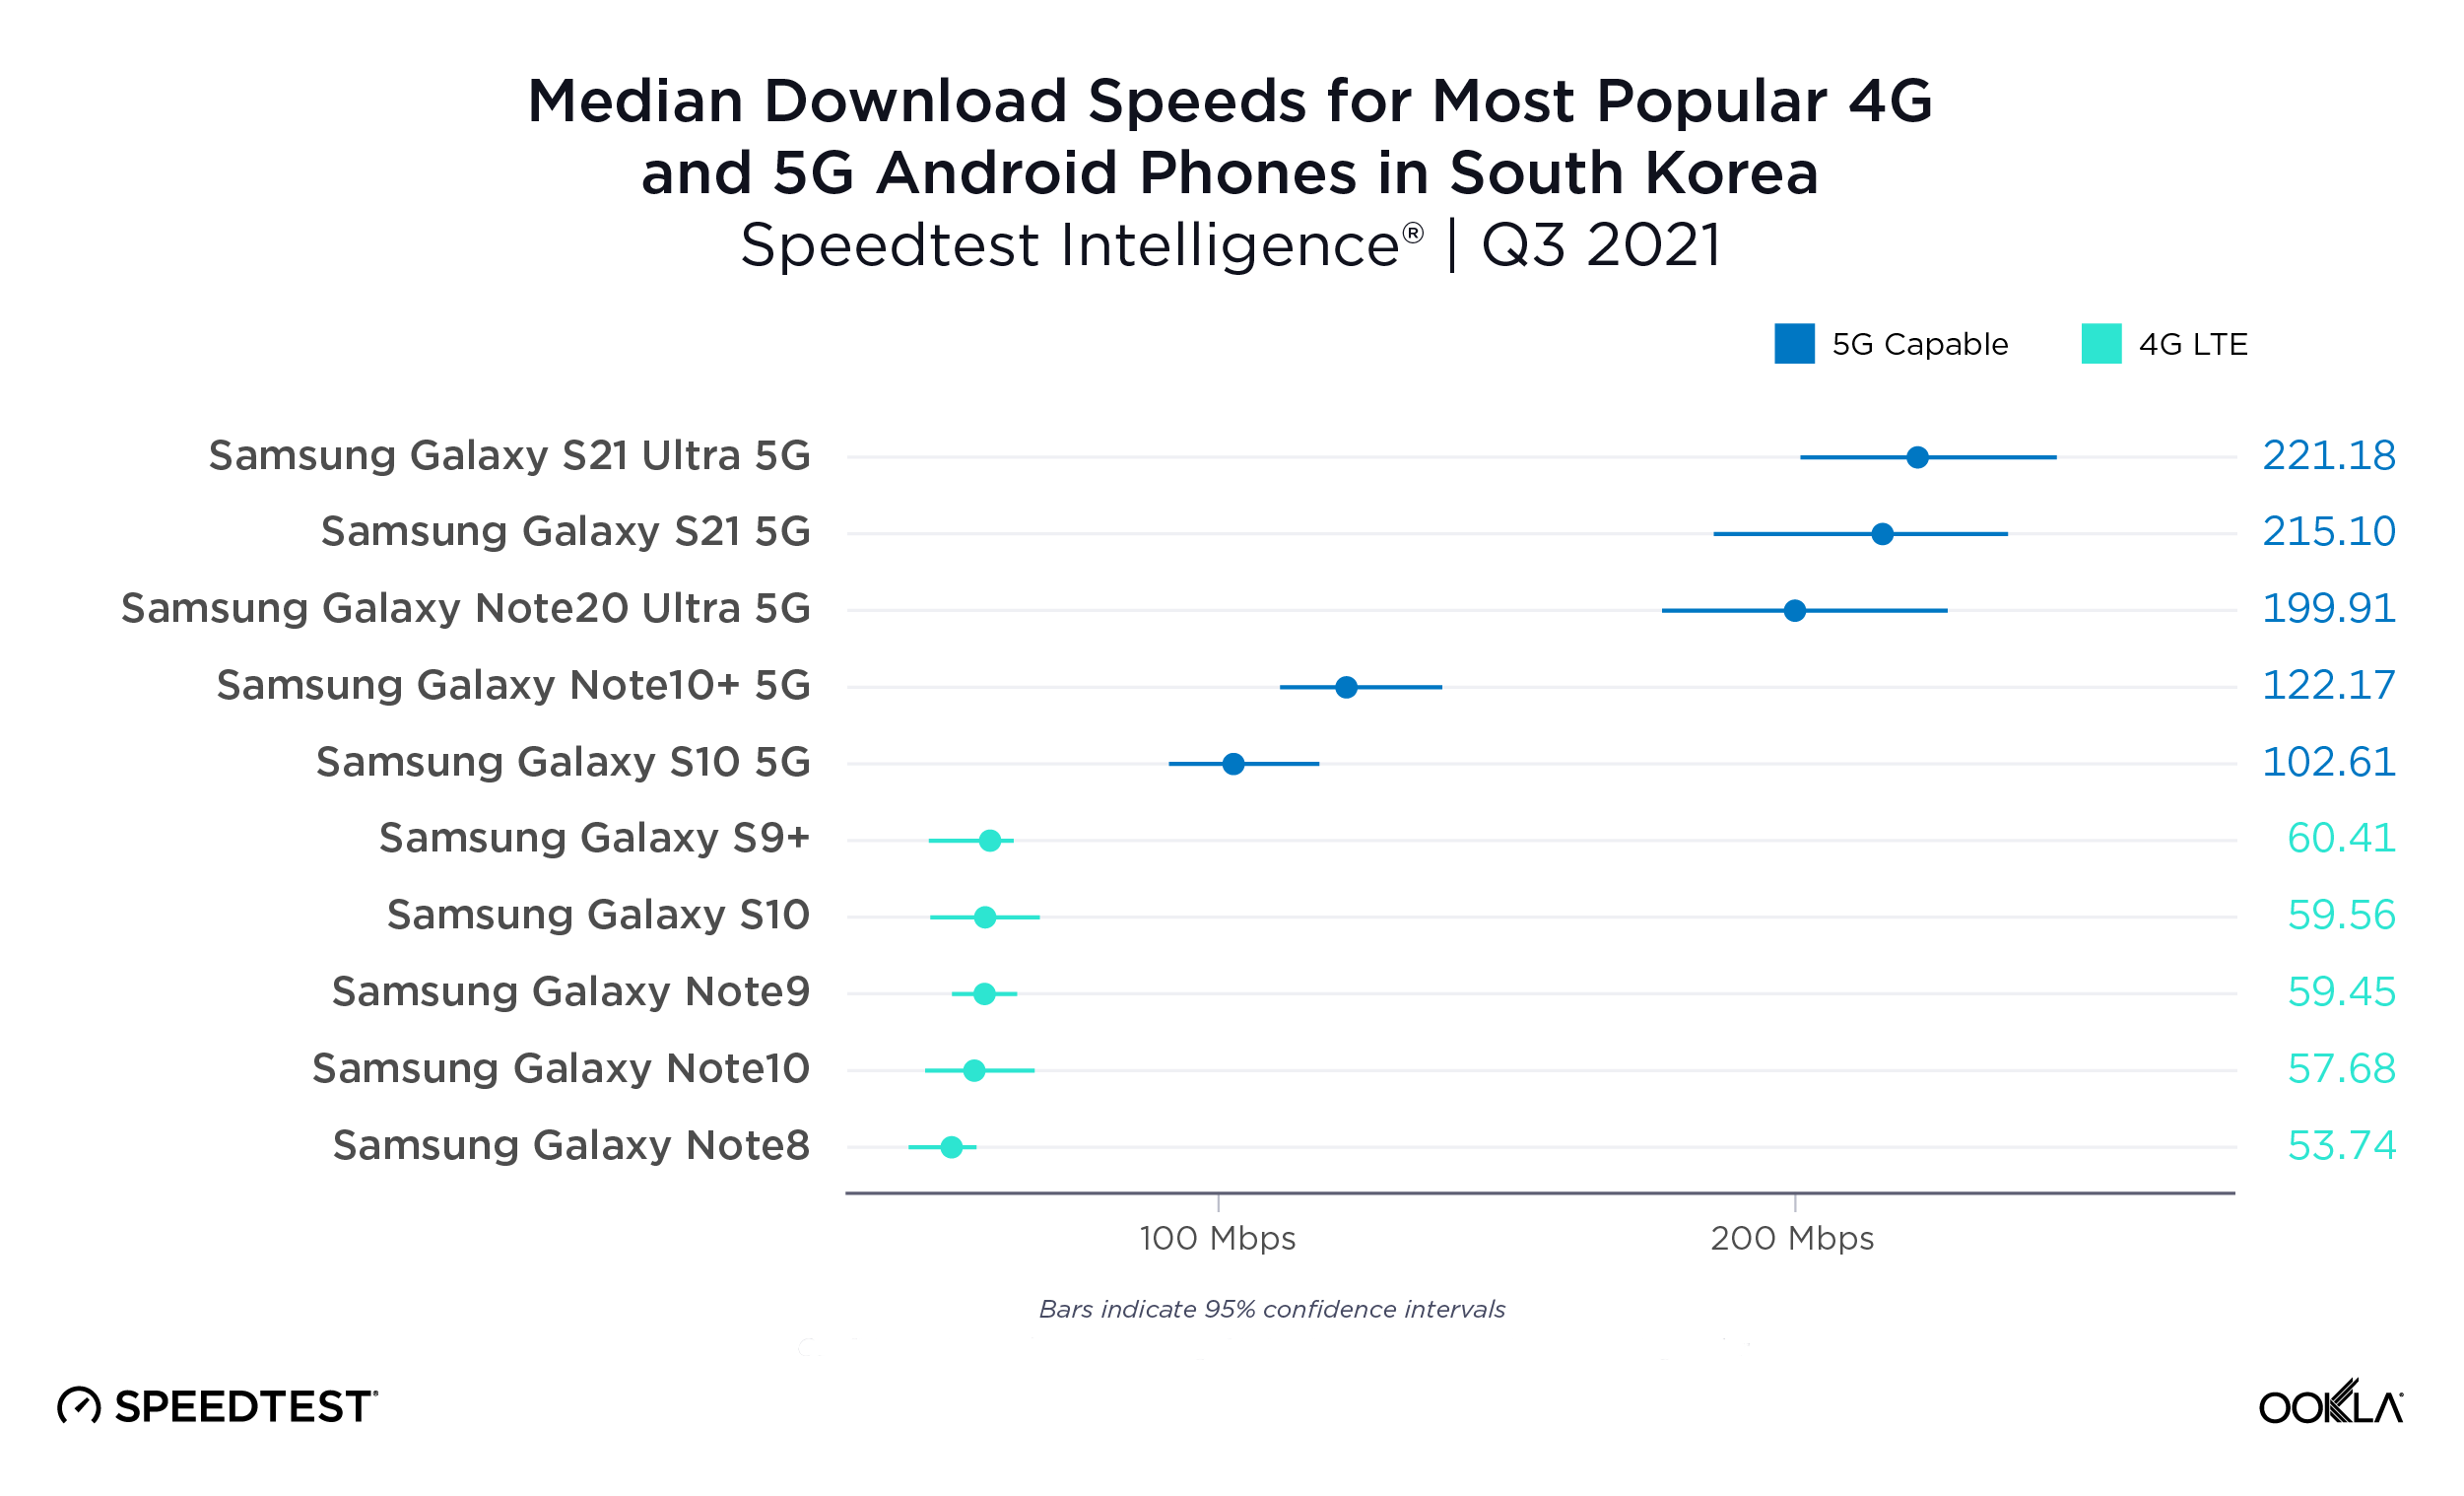
4G Android devices in South Korea are fast, 5G even faster

The median download speeds we saw on the most popular 4G devices in South Korea during Q3 2021 rivaled the 5G speeds in South Africa with speeds ranging from 53.74 Mbps on the Samsung Galaxy Note8 to 60.41 Mbps on the S9+. However, median performance on 5G-capable devices was even faster. There was a wide variety in speeds among the most popular 5G-capable with the S10 5G showing a median download speed of 102.61 Mbps and the S21 Ultra 5G coming in at 221.18 Mbps. 5G is worth the upgrade in South Korea and consumers have a variety of high-performing devices to choose from.
ookla_android_performance_south-korea_1121-01

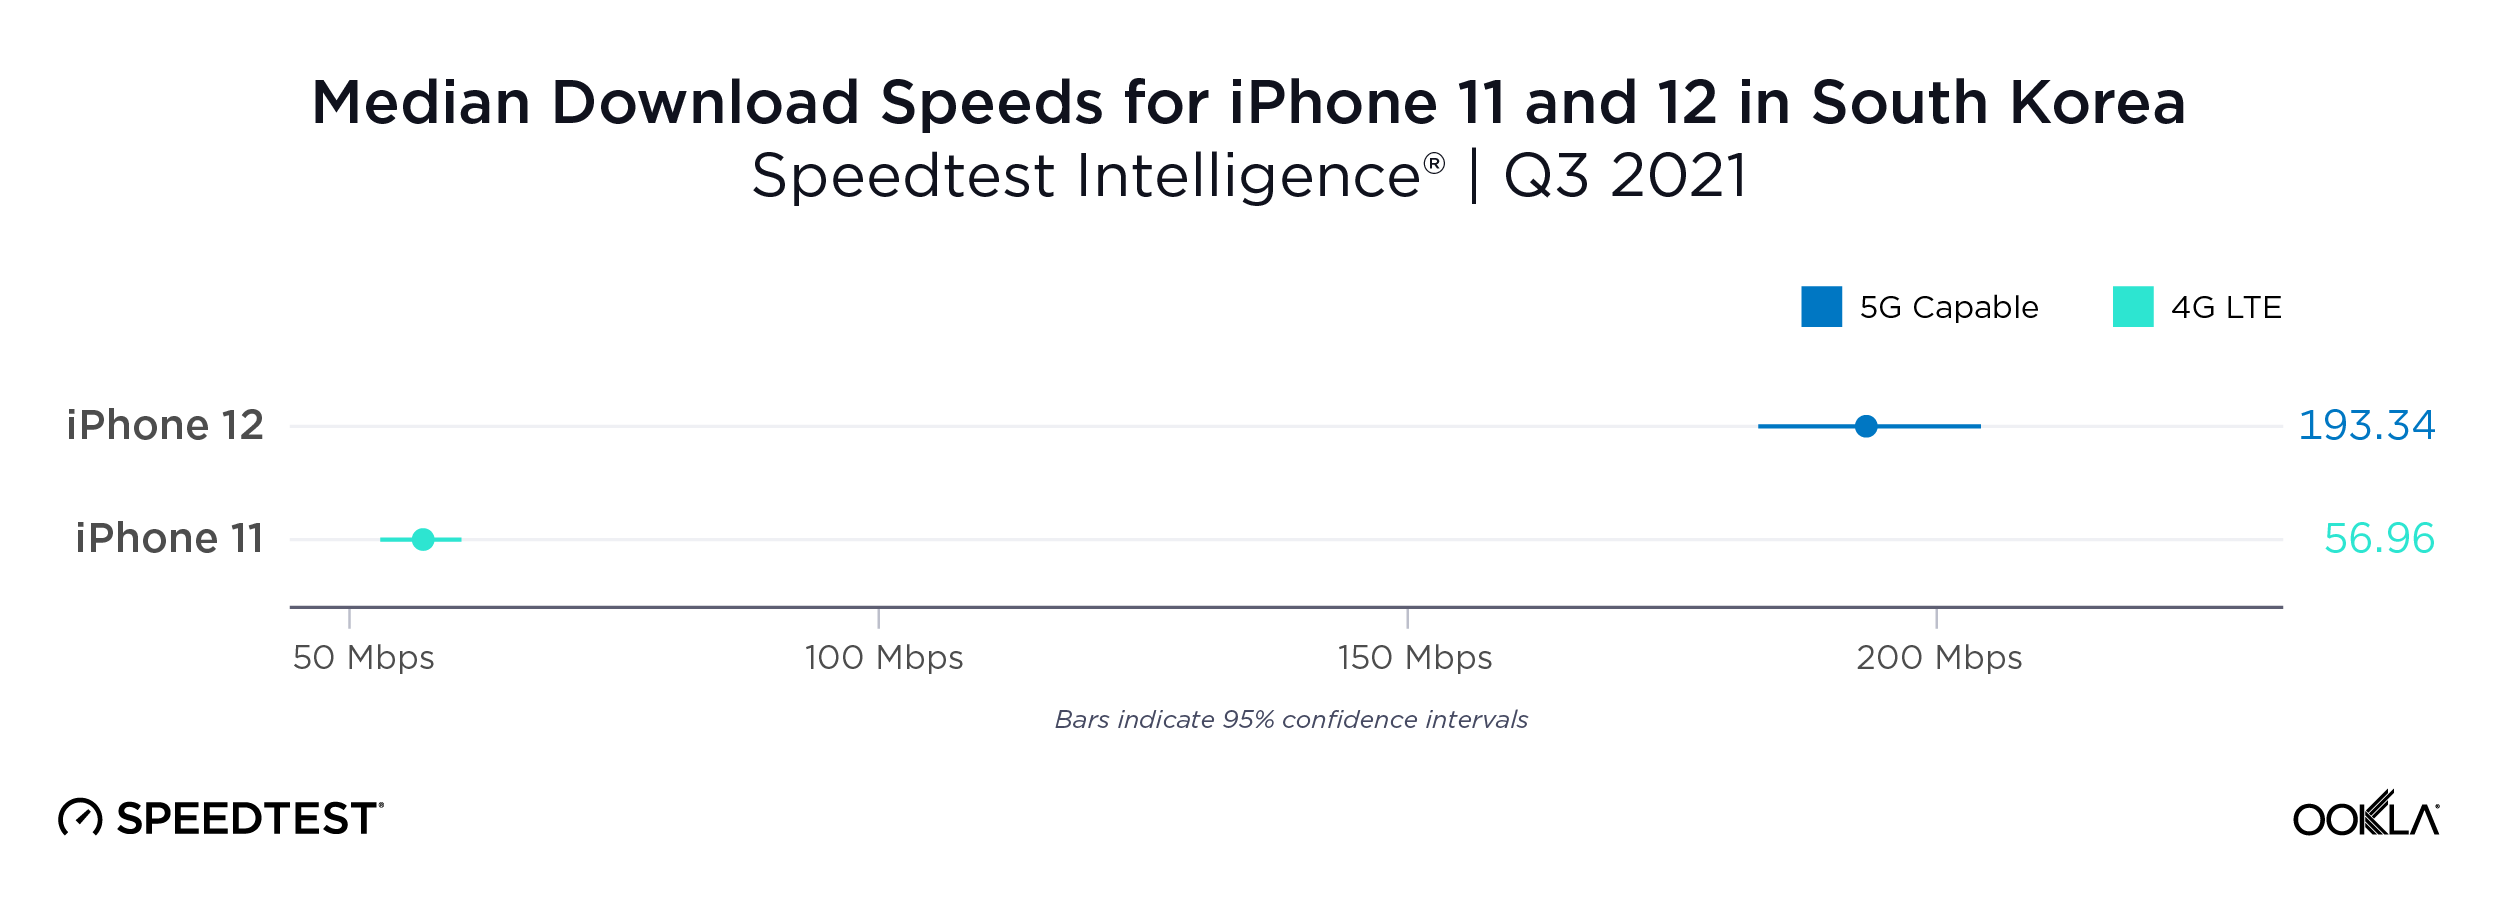
iPhone 12 more than three times faster than iPhone 11 in South Korea

South Korea did not have enough samples from the new iPhone 13, so we compared the iPhone 12 to the iPhone 11. Not only was the iPhone 12 more than three times faster for median download speed than the iPhone 11 during Q3 2021, South Korea’s iPhone 12 download speed beat iPhone 13 download speed in five of the countries we analyzed: Canada, France, Japan, U.K. and the U.S.
ookla_iphone_performance_south-korea_1121-01

United Arab Emirates

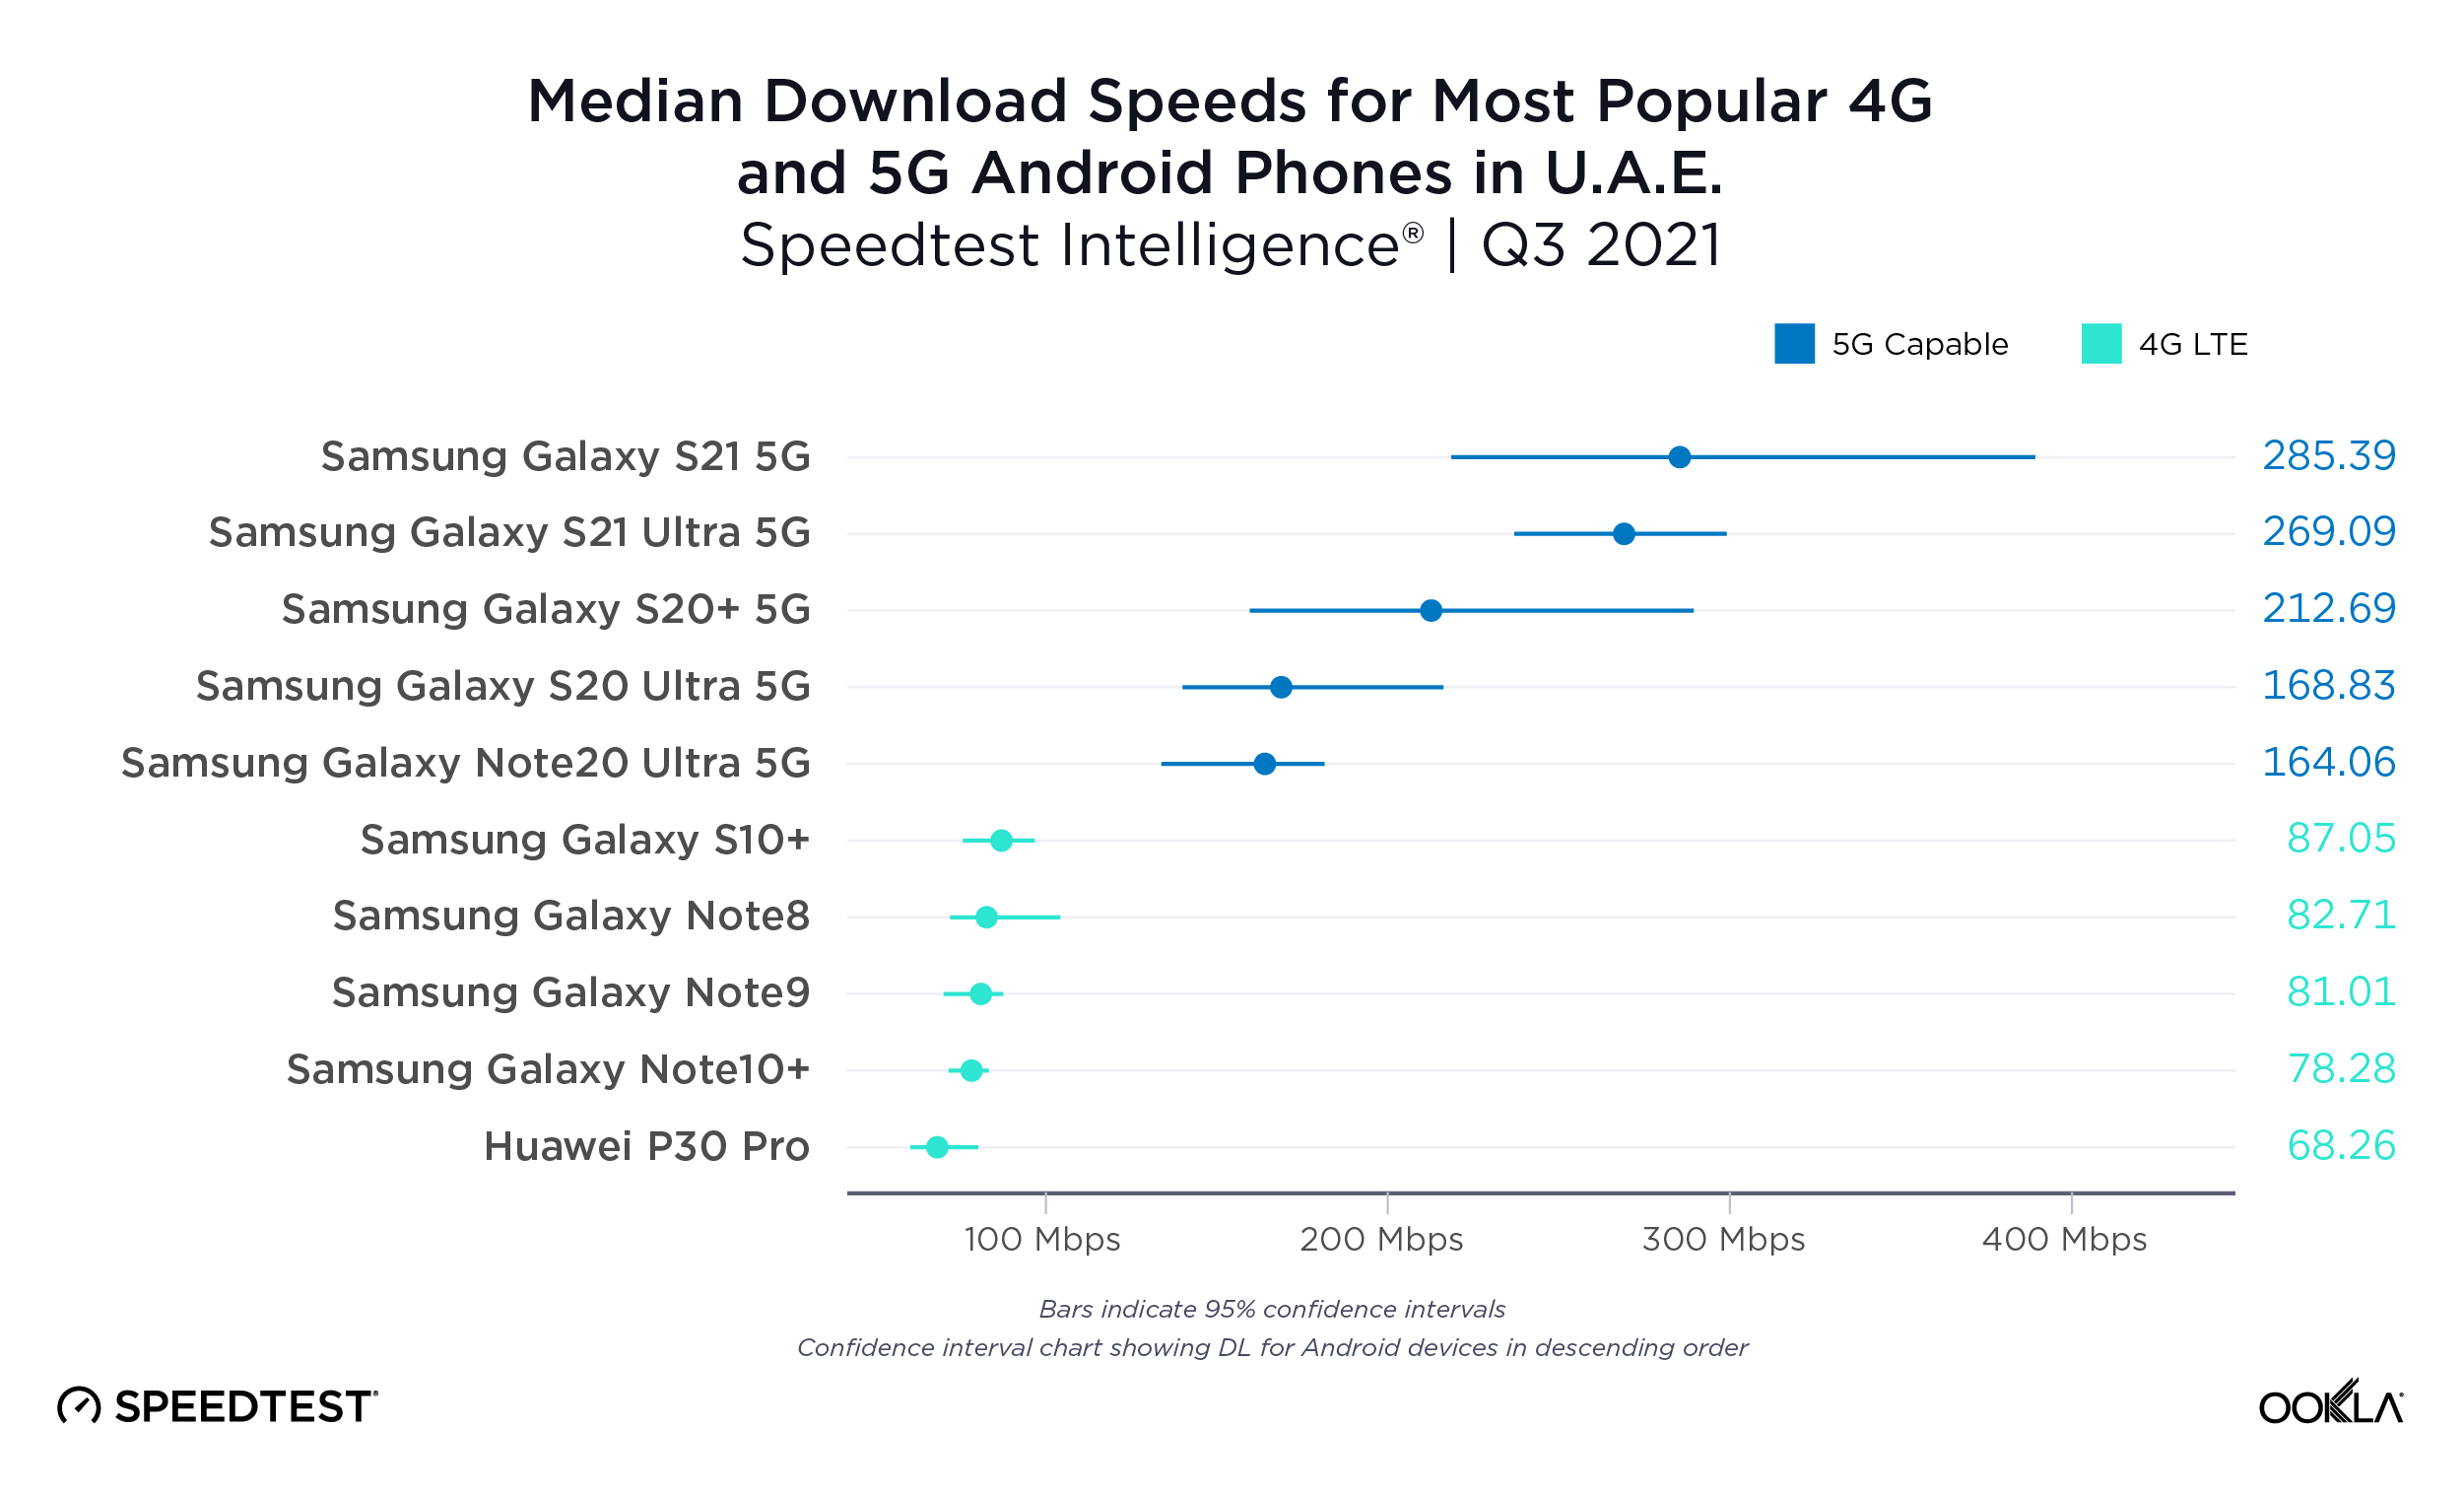
U.A.E. had the fastest speeds on Android 5G devices

While the median download speeds across 4G devices in the U.A.E. during Q3 2021 handily beat those of all the other countries in this analysis, the country’s 5G download speeds were even faster. We can see from this data that some of the 4G devices can perform much better when on a faster network. Even the slowest 4G device on this list, the Huawei P30 Pro, had a median download speed of 68.26 Mbps in U.A.E. compared to 30.20 Mbps in the U.K. on the same device.
ookla_android_performance_uae_1121-2-01-1

A similar story can be told for 5G devices where the U.A.E. was competing only with Saudi Arabia and South Korea for the fastest median performance on devices listed during Q3 2021. The Samsung Galaxy S21 5G showed a median download speed of 285.39 Mbps in the U.A.E. compared to 215.10 Mbps in South Korea while the Galaxy S21 Ultra 5G showed a median download speed of 269.09 Mbps in the U.A.E. and 261.21 Mbps in Saudi Arabia.

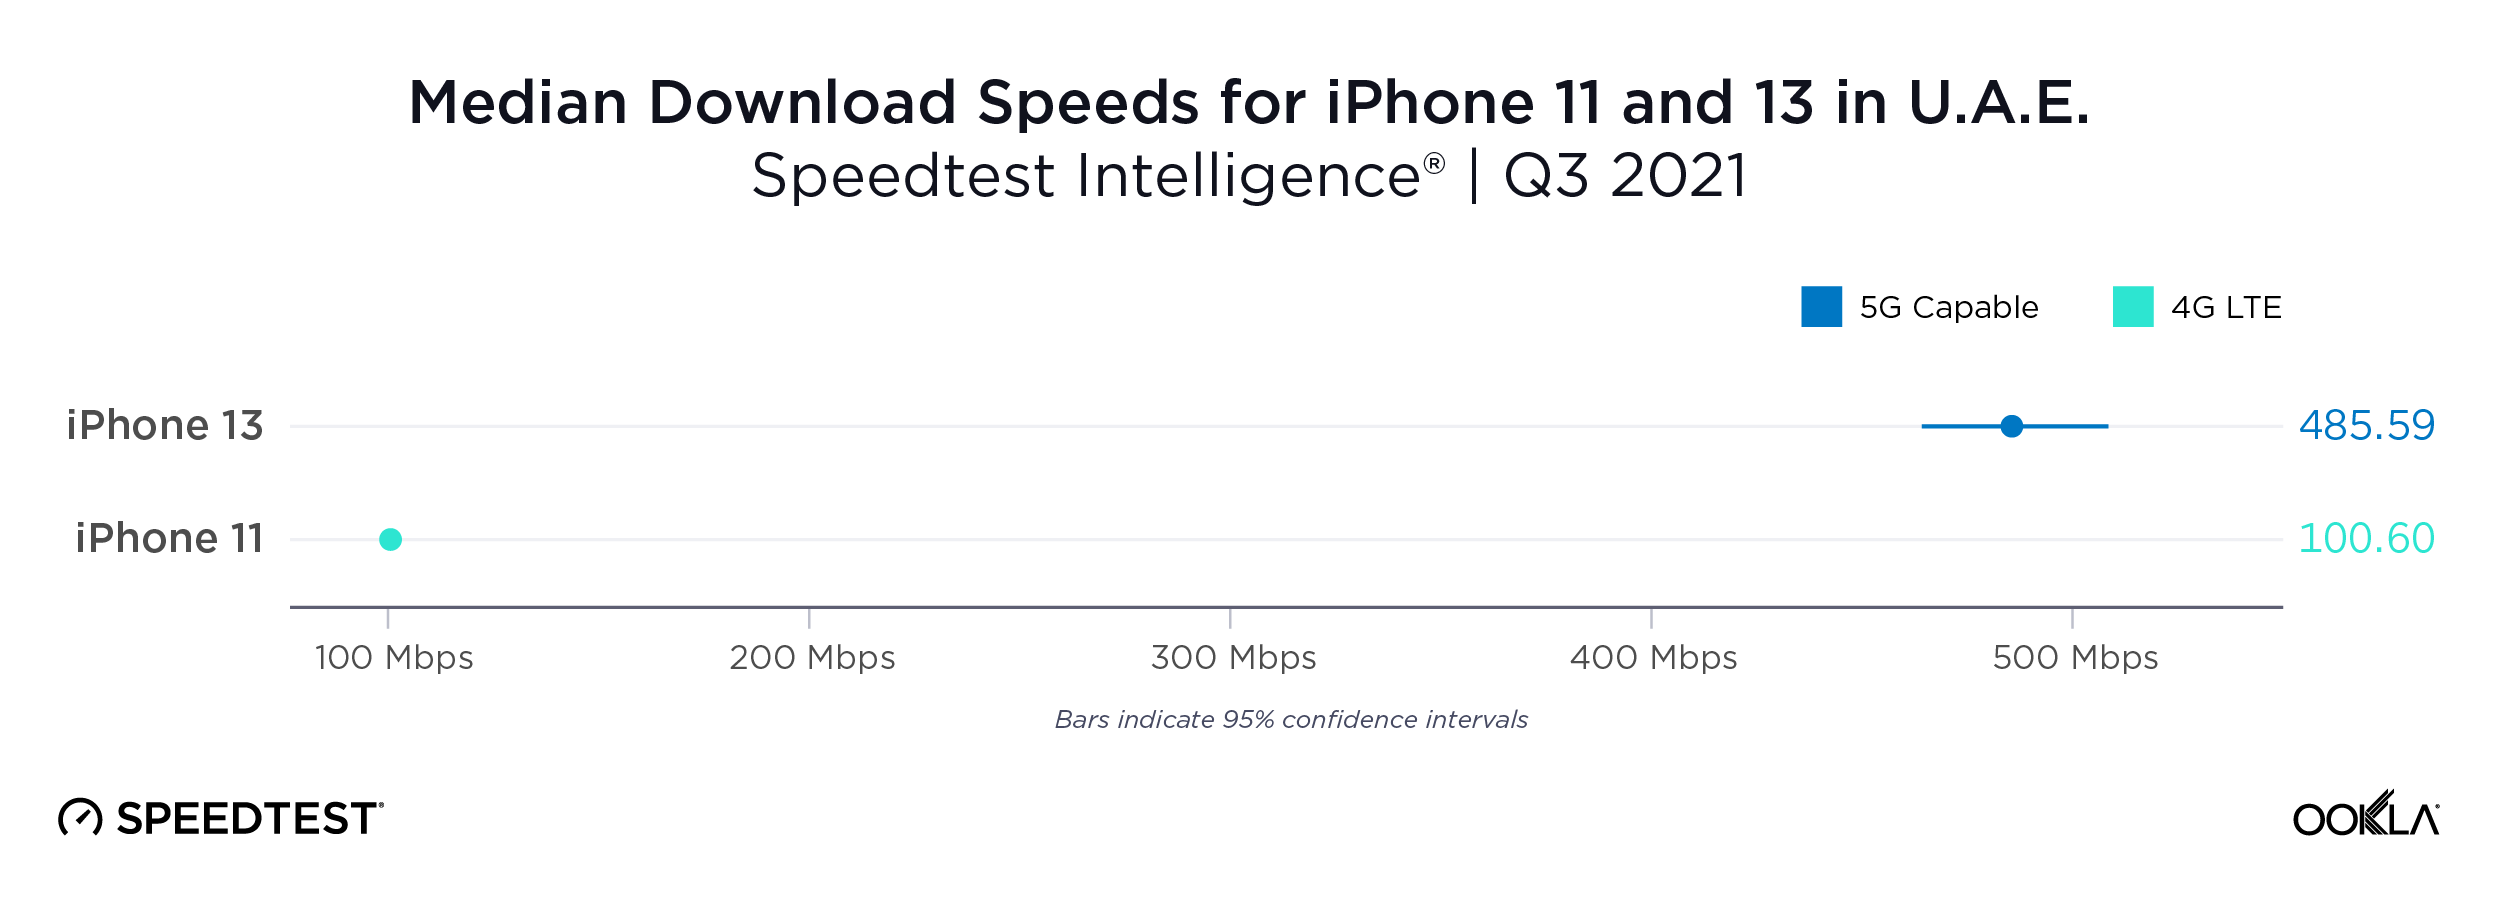
iPhone 13 more than four times faster than iPhone 11 in U.A.E.

Not only did the U.A.E. have the fastest median download speed over iPhone 13 that we saw in this analysis, the 485.59 Mbps download speed was faster than any phone in any country that we analyzed in Q3 2021. The iPhone 13 capitalized on fast 5G in the U.A.E. to have a median download speed that was more than four times faster than that of the iPhone 11.
ookla_iphone_performance_uae_1121-01

United Kingdom

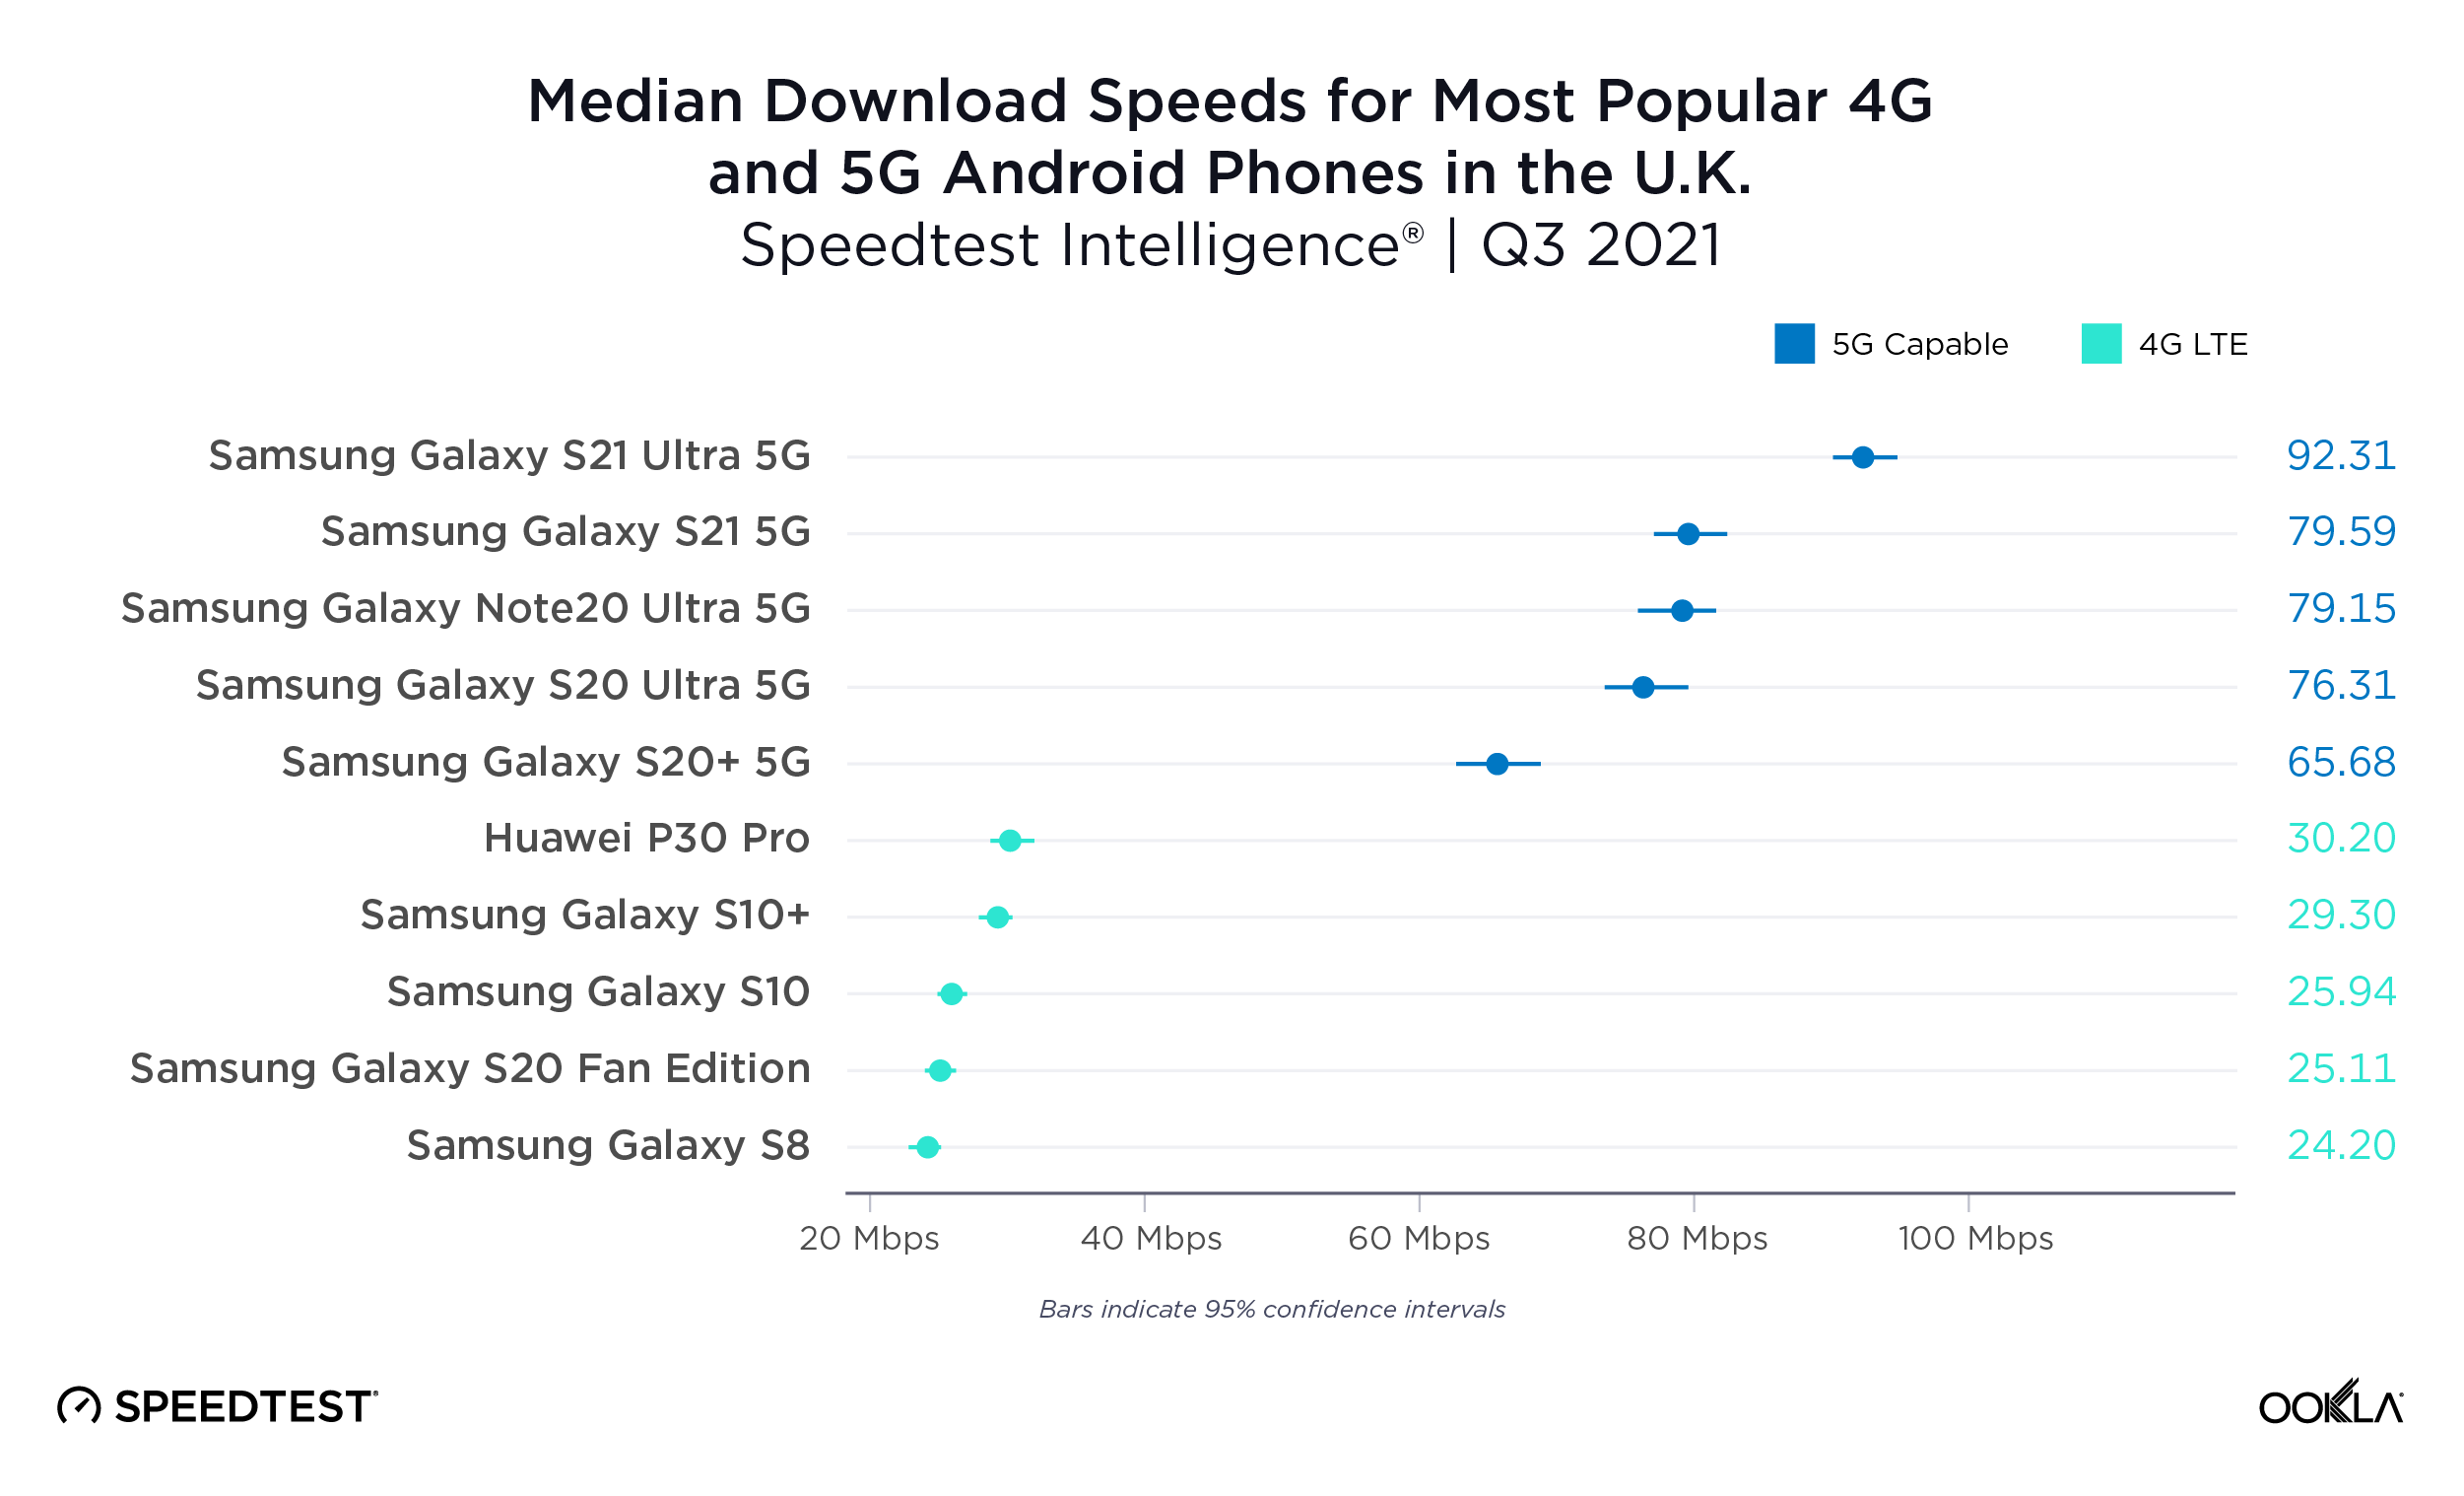
5G represents a solid improvement over 4G on Android devices in the U.K.

Consumers upgrading from one of the most popular 4G devices in the United Kingdom to one of the most popular 5G-capable devices would have seen a 2-3X increase in median download speed during Q3 2021. This is in part because the 4G devices on this list were slower in the U.K. than elsewhere in the world during Q3 2021 as 4G speeds have stagnated in the U.K. For example, the Samsung Galaxy S8 showed a median download speed of 24.20 Mbps in the U.K., 37.67 Mbps in France and 46.31 Mbps in Canada. All five of the 5G-capable devices that we analyzed in both the U.S. and the U.K. were faster in the U.K. during Q3 2021.
ookla_android_performance_uk_1121-01

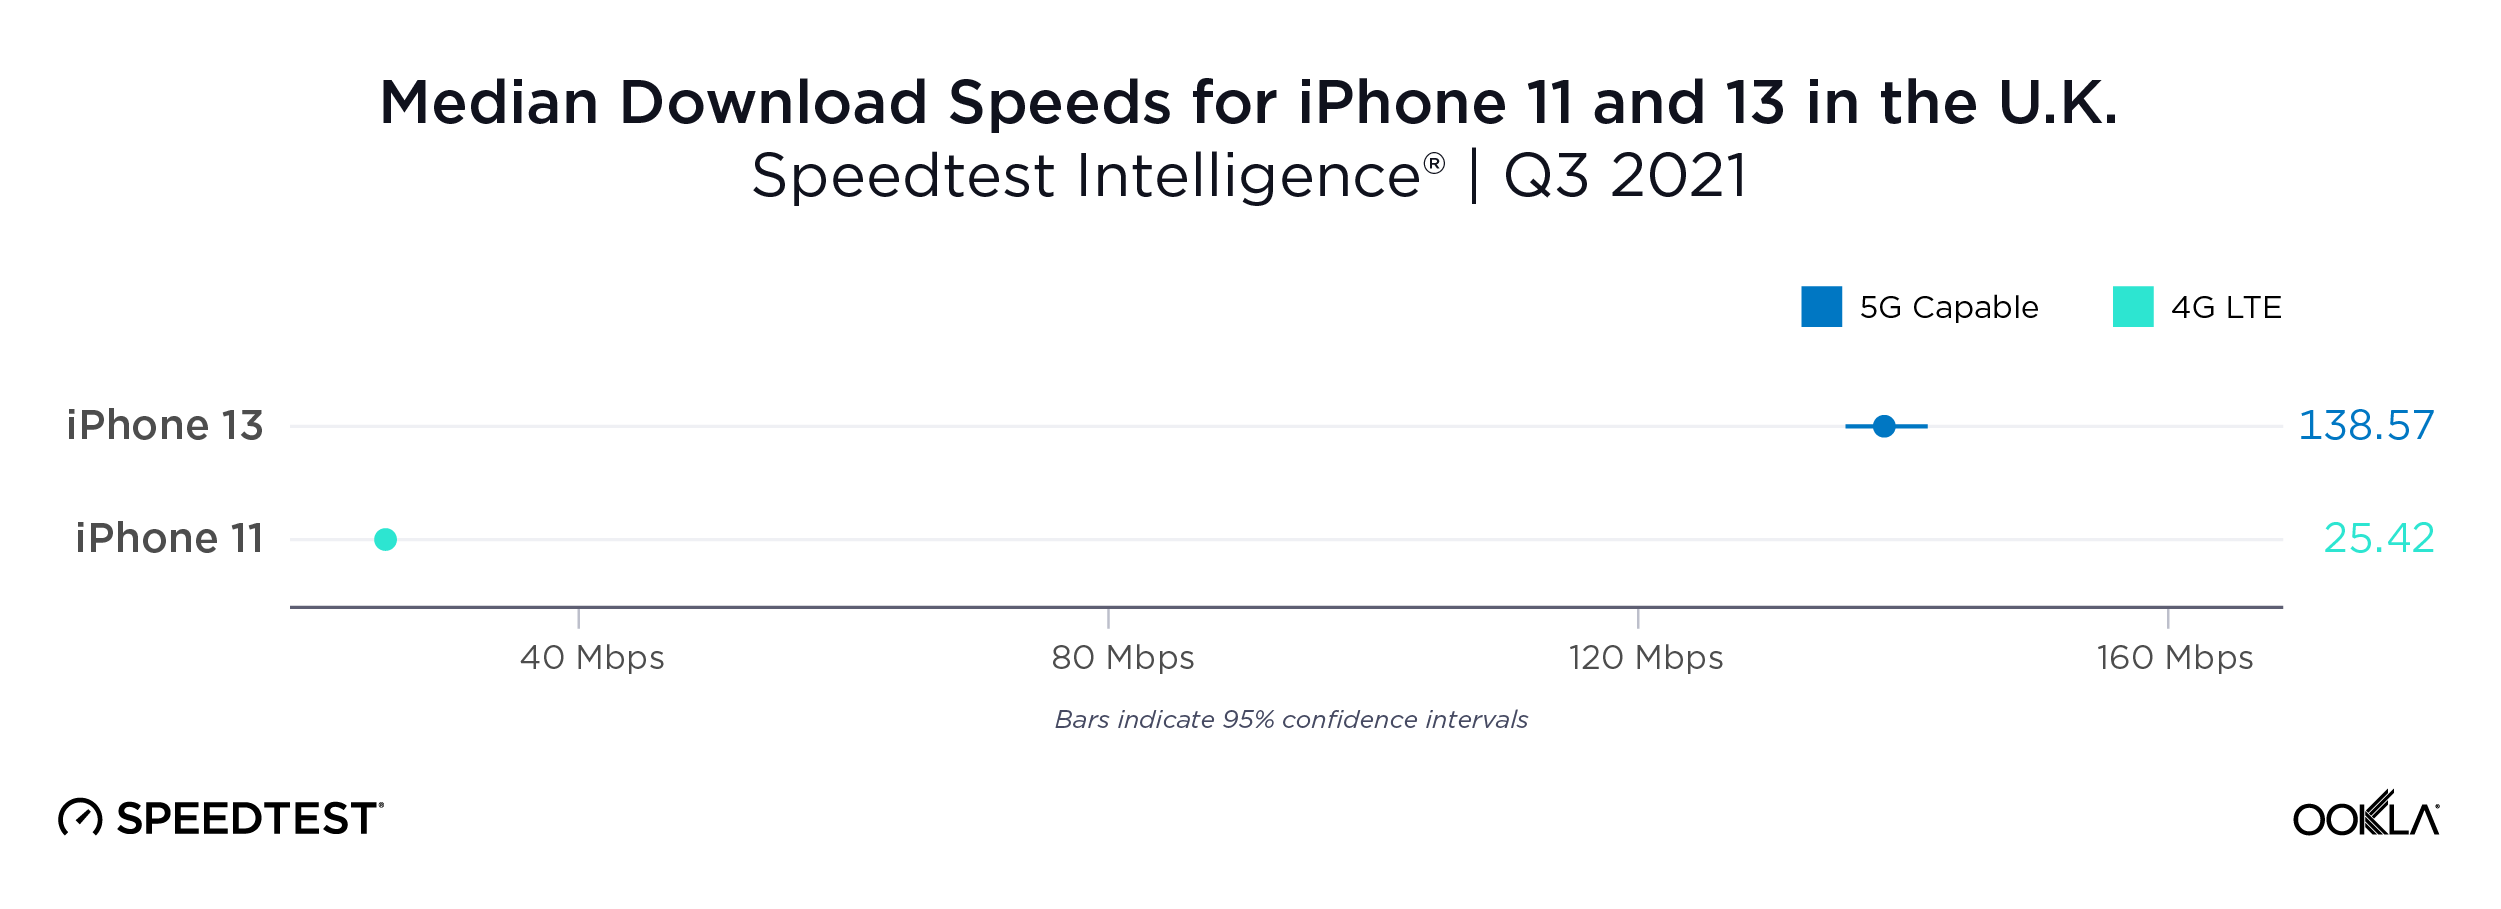
iPhone 13 more than five times faster than the iPhone 11 in the U.K.

Our analysis of Speedtest Intelligence data from Q3 2021 showed that the iPhone 13 had a median download speed that was more than five times faster than that on the iPhone 11. This makes the iPhone 13 very much worth the upgrade if speed is your main concern.
ookla_iphone_performance_uk_1121-01

United States

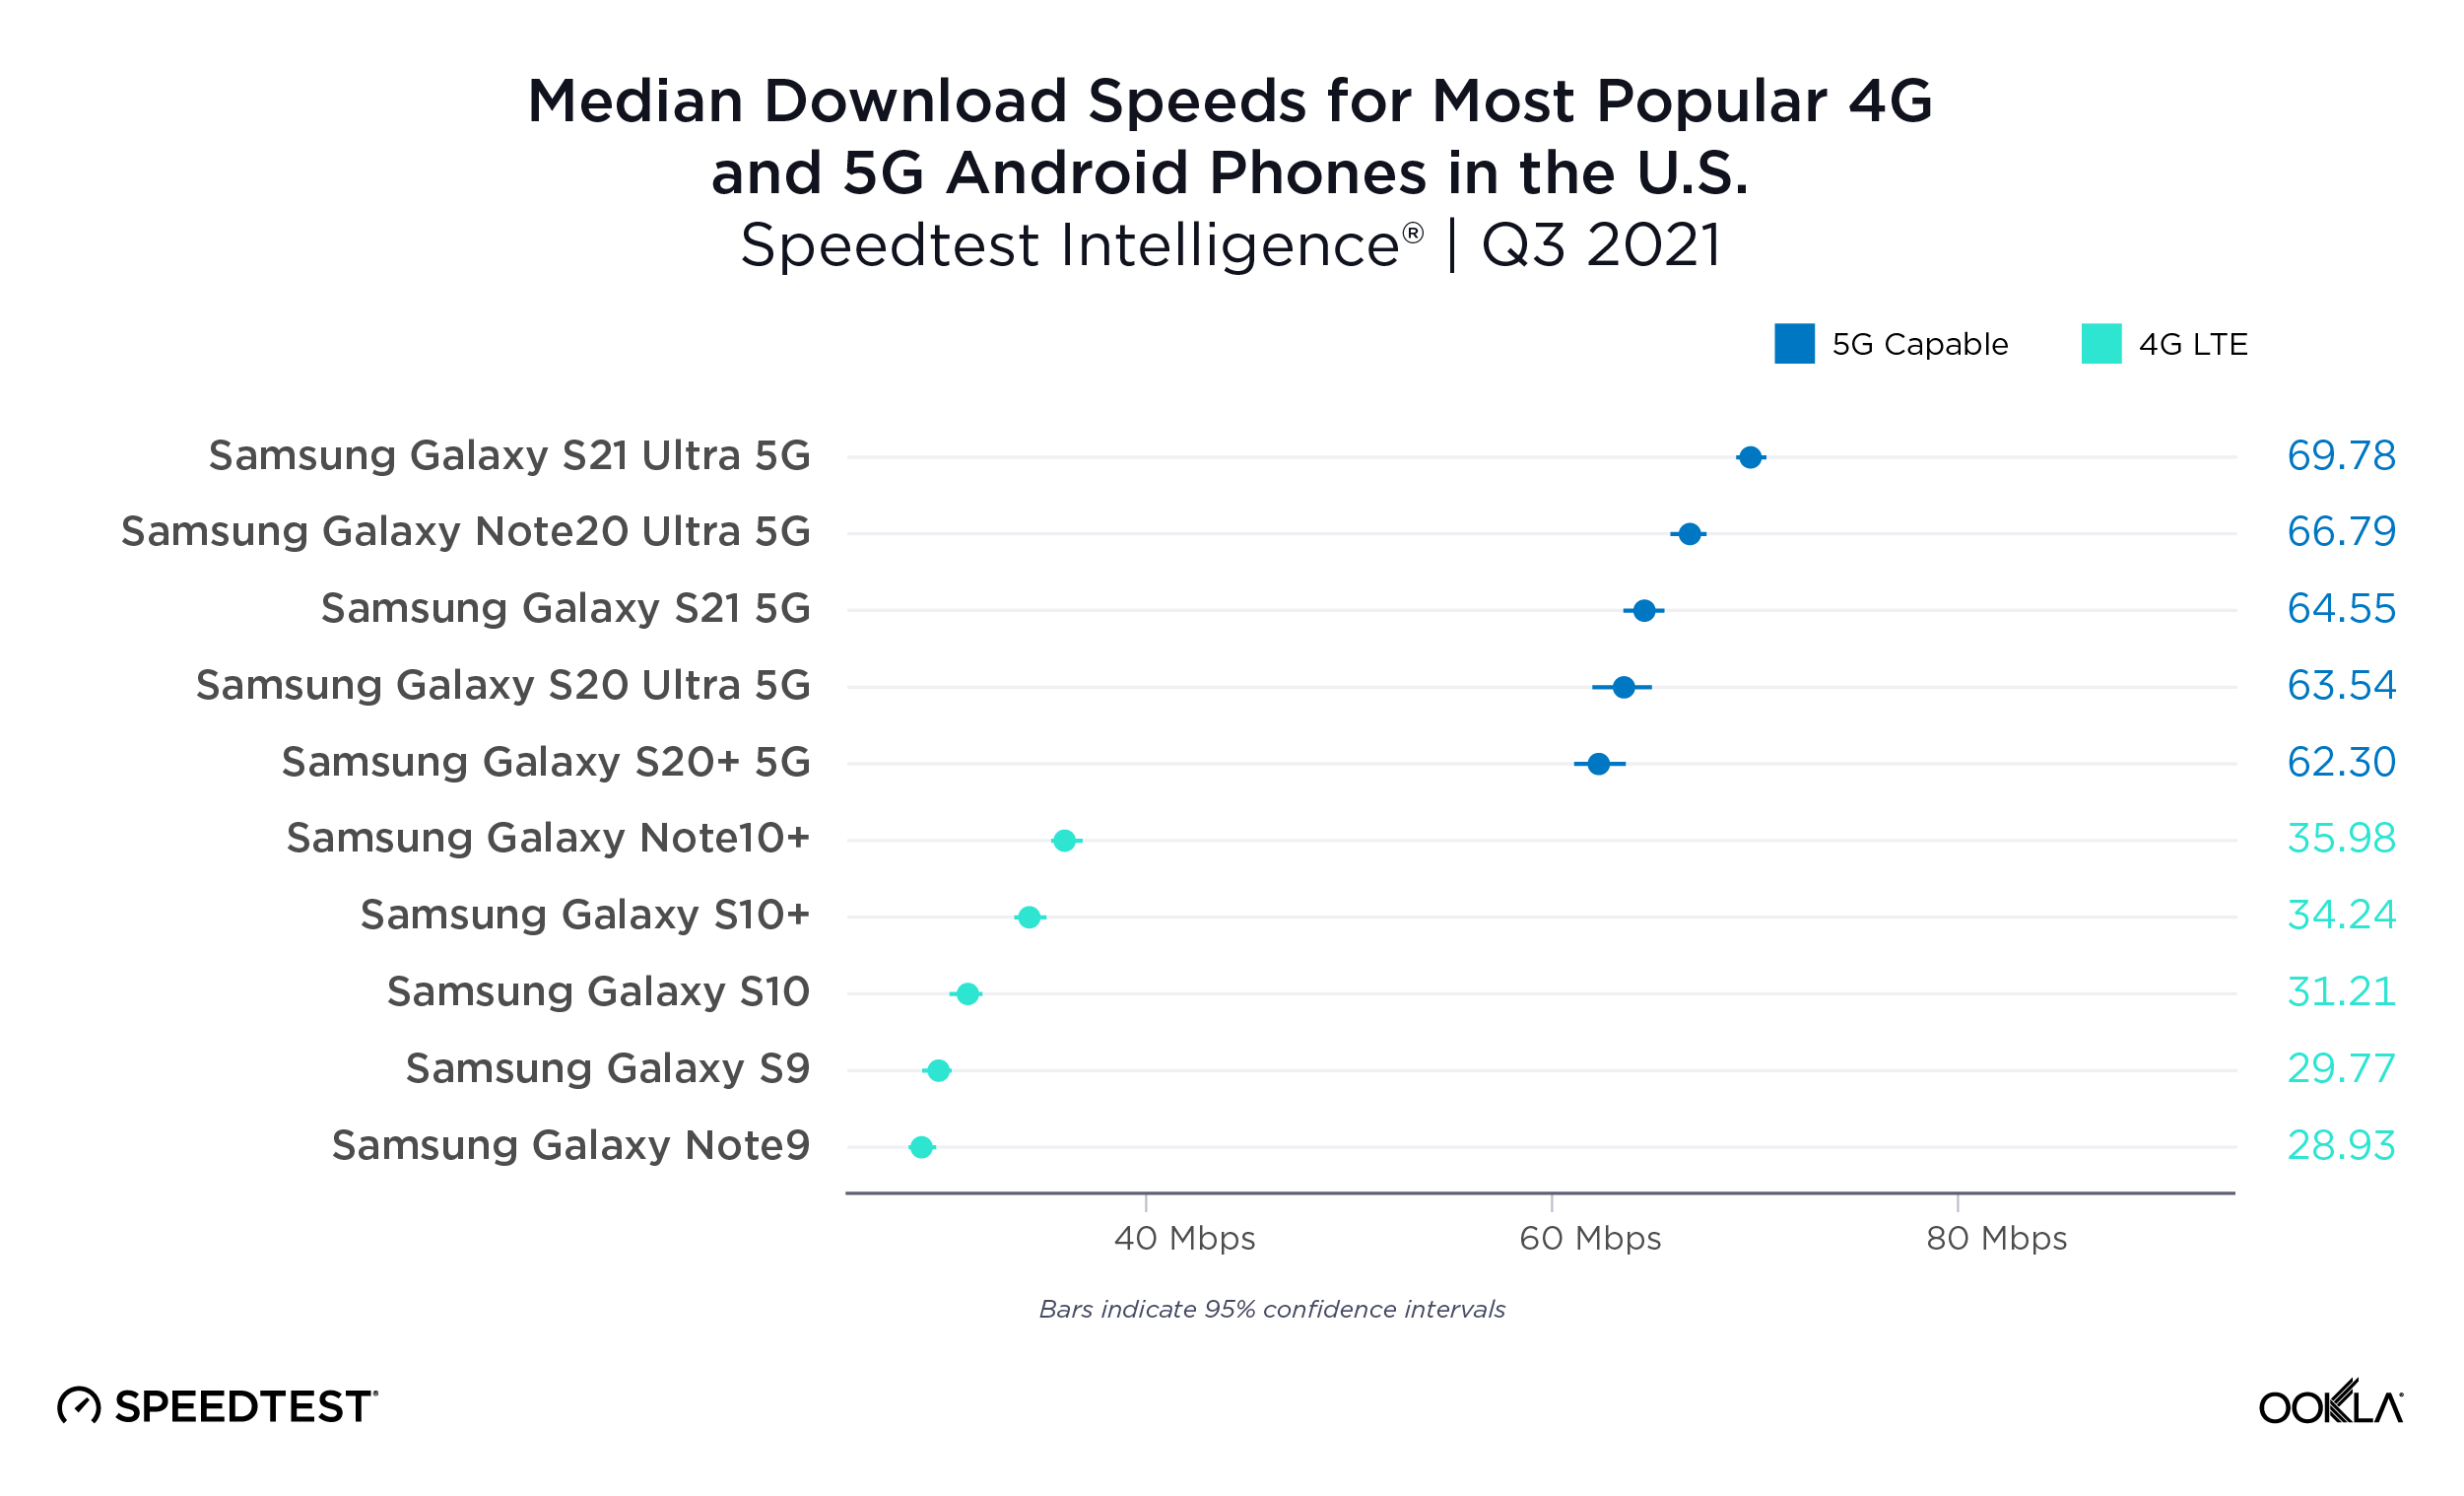
5G Android devices were twice as fast as 4G in the U.S.

The most popular 4G devices in the U.S. were about half as fast for median download speed as the most popular 5G-capable devices during Q3 2021. The Samsung Galaxy S21 Ultra 5G showed the highest median download speed among these devices at 69.78 Mbps, compared to the fastest 4G device surveyed, the Note10+ at 35.98 Mbps. That said, 5G-capable devices in the U.S. underperformed when compared to other countries, except Japan and South Africa.
ookla_android_performance_us_1121-01

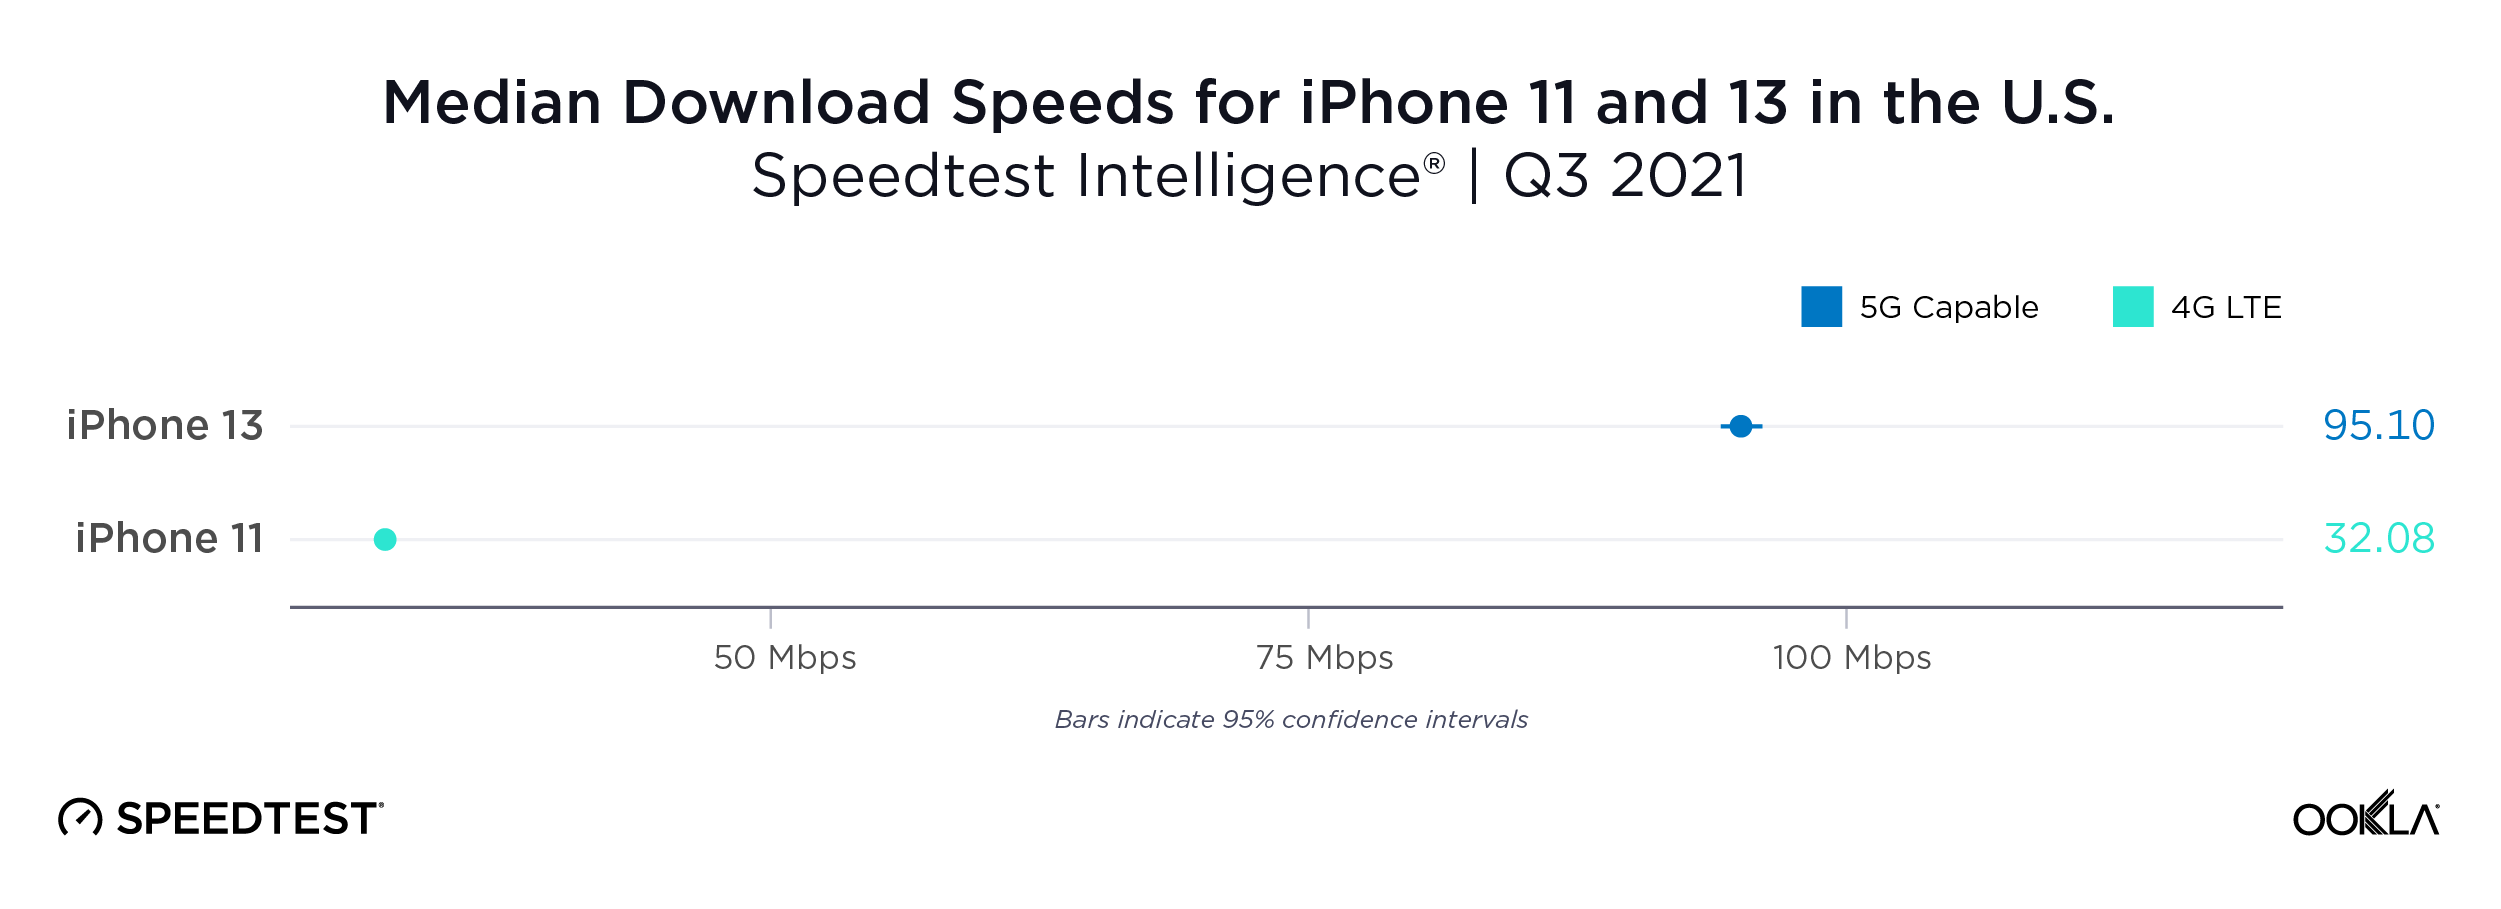
iPhone 13 nearly three times as fast as the iPhone 11 in the U.S.

Data from Speedtest Intelligence reveals that median download speed on the iPhone 13 was nearly three times as fast as that on the iPhone 11 in the U.S. during Q3 2021.
ookla_iphone_performance_us_1121-01

Our analysis shows that increased speed is one of the benefits of upgrading your 4G phone to a 5G-capable one, regardless of where you live but not all countries see the same speed increases. Customers in Saudi Arabia, the U.A.E, China and South Korea will see especially good performance if upgrading an Android phone. The U.A.E., Saudi Arabia, China and Australia have especially good speeds on the iPhone 13. Whatever choice you make for your next phone, take a Speedtest® on Android or iOS to make sure your mobile operator is delivering the speeds you want to see.
Ookla retains ownership of this article including all of the intellectual property rights, data, content graphs and analysis. This article may not be quoted, reproduced, distributed or published for any commercial purpose without prior consent. Members of the press and others using the findings in this article for non-commercial purposes are welcome to publicly share and link to report information with attribution to Ookla.

| February 2, 2022

Downdetector Celebrates 10th Anniversary as the World’s Leading Source of Real-Time Status Information

As we welcome the start of 2022, Downdetector® is celebrating 10 years of monitoring online service outages. Connectivity plays an integral role in how our society functions, and Downdetector has supported consumers and businesses during the most notable service outages of the last decade.

Take, for instance, the massive outage of Facebook, Instagram, WhatsApp, and Facebook Messenger in October 2021. When these platforms went dark, billions of users felt the impact. Besides losing access to these social media platforms, which many businesses rely on for revenue generation, Facebook also serves as an online authenticator for countless internet applications. This resulted in many seemingly unrelated services becoming unavailable, making for an especially chaotic day on the internet. Throughout the incident, Downdetector provided a live global view of problem reports, helping consumers and service providers diagnose the root cause of the issue.

During this and other major service disruptions, Downdetector has kept the world informed with near-real-time analysis on millions of user-submitted reports – and we’ll be there for whatever outages may lie ahead as we continue to expand.

Downdetector began with the need for better outage detection

Feeling frustrated by the lack of incident information, founders Tom Sanders and Sander van de Graaf started Downdetector in 2012 as a platform to empower consumers to improve their internet experience with early outage detection. In particular, Dutch banking services were experiencing a high number of incidents at the time, so Sanders and van de Graaf created Downdetector to help the public identify connectivity disruptions. Downdetector proved to be so insightful that the Dutch parliament even used it to raise awareness with the former minister of finance.

Downdetector by the numbers

Since Downdetector launched, the platform has grown to serve hundreds of millions of users, tracking thousands of services across 47 countries and counting. Celebrating 10 years, here’s a quick snapshot of Downdetector’s global footprint.

Reducing downtime for the world’s leading service providers

By analyzing over 25 million user reports on Downdetector each month, Downdetector Enterprise™ gives businesses a direct line of sight into problems consumers are experiencing with their services. The world’s largest internet service providers, mobile network operators, banks, streaming entertainment services, social media platforms, online gaming providers, and other technology companies use the enterprise platform to rapidly diagnose both internal and external issues.

With early alerting, these businesses can rapidly assess the size, causes, and impacted locations of an incident. And with insights into third-party service issues that impact their own customer experience, they can quickly respond to incidents and proactively keep customers informed.

We’ll be there to continue providing insights on connectivity to both consumers and businesses as we keep expanding. If you’re ready to add real-time alerting and customer experience insights to your existing monitoring solutions, please visit our Downdetector Enterprise page to learn more.

Ookla retains ownership of this article including all of the intellectual property rights, data, content graphs and analysis. This article may not be quoted, reproduced, distributed or published for any commercial purpose without prior consent. Members of the press and others using the findings in this article for non-commercial purposes are welcome to publicly share and link to report information with attribution to Ookla.

| February 16, 2022

This is How Fast Fiber is in Canada’s Provinces and Cities

Consumers want faster internet but they often wonder whether it’s worth the extra money to upgrade from services like DSL to fiber-optic broadband, sometimes referred to as fiber-to-the-home (FTTH). We’ve analyzed new data from Speedtest Intelligence® in Canada during Q4 2021 to help provide an answer for consumers as fiber connectivity expands across Canada. We’ve looked at speeds in provinces and in major cities in Canada.

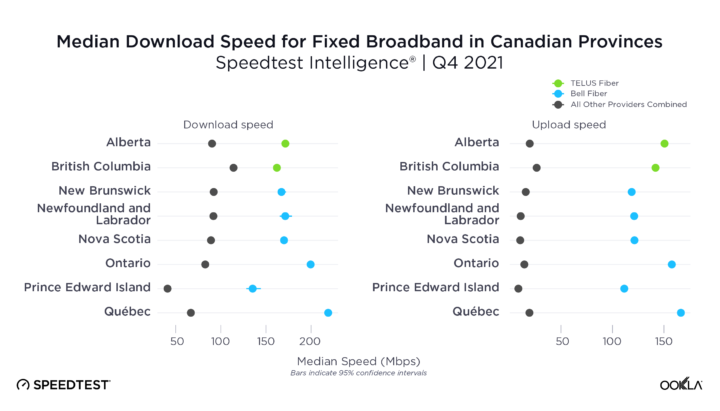
Fiber upload speeds are up to 12x faster at the provincial level in Canada

Bell and TELUS serve different parts of the country with their fiber offerings so we’ve analyzed each province with an eye to how much faster the relevant fiber provider’s offerings are compared to the median speeds for all other fixed broadband providers combined.

Our analysis of Speedtest Intelligence data from all Canadian provinces during Q4 2021 showed that fiber from Bell and TELUS is faster than median speeds for all other fixed broadband providers combined. Bell Fiber was faster than the market average of other internet providers for median download speeds in New Brunswick (1.8x), Newfoundland (1.8x), Nova Scotia (1.9x), Ontario (2.4x), Prince Edward Island (3.1x), and Québec (3.3x). TELUS Fiber was faster than other fixed broadband in Alberta (1.9x) and British Columbia (1.4x).

Upload speed is the major differentiator for fiber compared to other fixed broadband technologies. Bell Fiber showed a huge advantage over other fixed broadband for median upload speeds in all provinces as follows: New Brunswick (7.4x), Newfoundland (10.9x), Nova Scotia (11.5x), Ontario (10.8x), Prince Edward Island (12.4x), and Québec (8.5x). TELUS Fiber was faster than other fixed broadband for upload speeds in Alberta (7.5x) and British Columbia (5.3x).

There were insufficient samples to analyze Bell Fiber, operating as Bell MTS, in Manitoba where the fixed broadband averages were 83.06 Mbps (download) and 16.13 Mbps (upload). Bell Fiber and TELUS Fiber don’t provide service in the following provinces, but we’ve provided their median fixed broadband speeds for comparison: Northwest Territories (55.63 Mbps download / 11.45 Mbps upload), Nunavut (insufficient data), Saskatchewan (68.43 Mbps / 17.04 Mbps), Yukon (43.96 Mbps / 10.56 Mbps). There is clearly a lot of room to expand fiber access to additional Canadian provinces, places that currently show lower fixed broadband speeds overall.

Infrastructure improvements like laying fiber are very expensive as they often require providers to dig up city streets to physically lay new lines. This often means that fiber deployments are limited to areas with high population density where providers are more likely to recoup costs. This means not everyone has access to this faster technology, but in areas where fiber exists, it could well be worth the upgrade. And with data on how much faster fiber is, perhaps consumers can push for more fiber access in underserved areas.

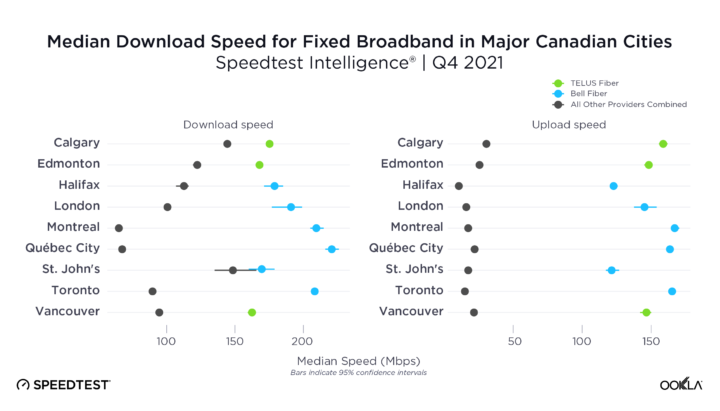
Fiber shows up to 11x advantage for upload speeds in major Canadian cities

A look at data from major cities in Canada during Q4 2021 showed that fiber speeds are  most often comparable to or faster than other fixed broadband. Median download speed on Bell Fiber was faster than other fixed broadband in Halifax (1.5x), London (1.8x), Montréal (3.2x), Québec City (3.2x), St. John’s (1.0x), and Toronto (2.3x). TELUS Fiber was faster for download speed than other fixed broadband in Calgary (1.2x), Edmonton (1.3x), and Vancouver (1.7x).

Fiber upload speeds tell a more dramatic story in major Canadian cities. Bell Fiber’s median upload speed was faster than other fixed broadband in Halifax (11.4x), London (8.6x), Montréal (9.4x), Québec City (7.3x), and Toronto (11.0x). Upload speed set TELUS Fiber apart as faster in Calgary (5.1x), Edmonton (5.6x), and Vancouver (6.6x).

If you’re considering upgrading to fiber, take a Speedtest®. Your results will show you if fiber might be an upgrade or if your service is fast enough for now. If you’re a fixed broadband provider who would like to work with Ookla for in-depth analysis of your fiber offerings versus other tariff plans, contact us.

Ookla retains ownership of this article including all of the intellectual property rights, data, content graphs and analysis. This article may not be quoted, reproduced, distributed or published for any commercial purpose without prior consent. Members of the press and others using the findings in this article for non-commercial purposes are welcome to publicly share and link to report information with attribution to Ookla.

| May 2, 2022

Introducing Speedtest Maps™ for iOS

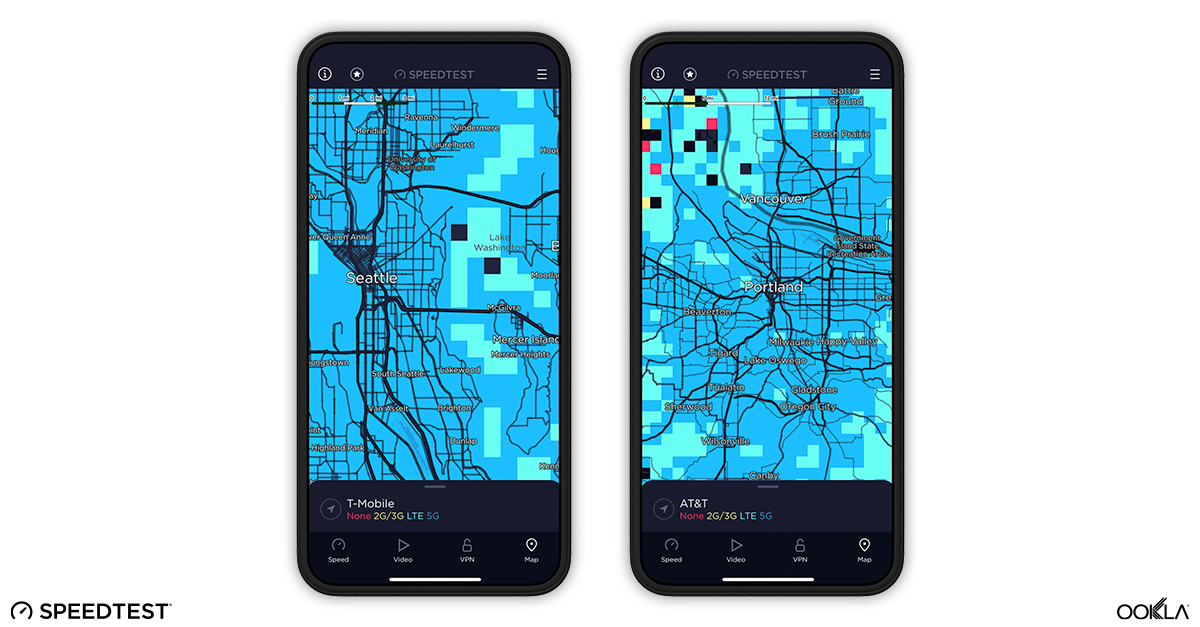
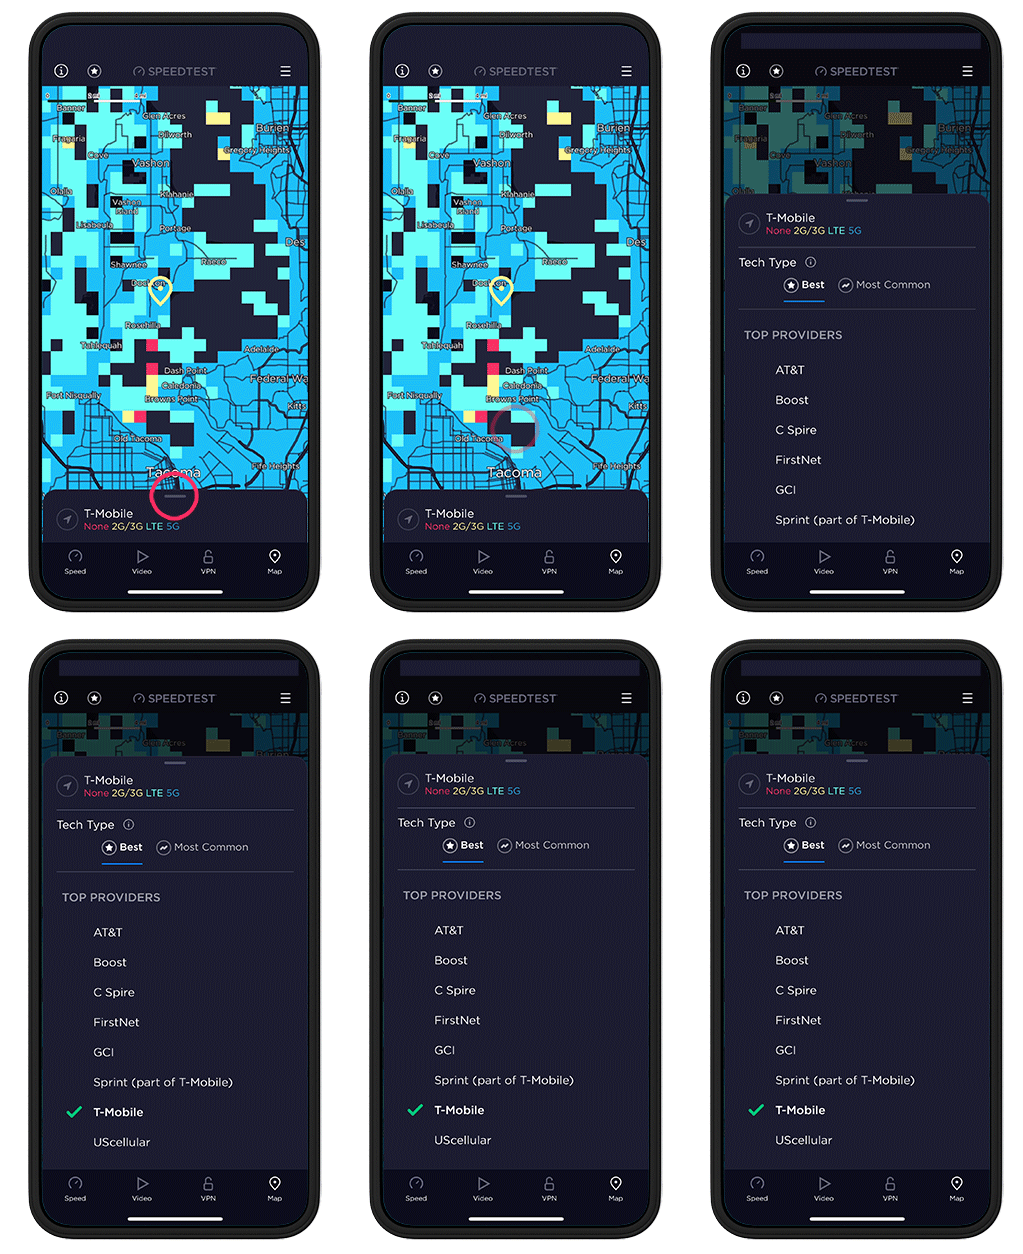
You asked and we listened. Speedtest® fans who use Apple devices have long been requesting access to our Maps feature, and we are happy to report that this feature is now available for Android and iOS. So if you’ve been looking for a map of coverage that highlights which mobile providers have what level of service in the areas that matter most to you, open your Speedtest app today and check out the tab marked “Maps.”

How Speedtest Maps help you

Two Maps Side by Side

Speedtest Maps give you access to information about where you will and will likely not have access to different levels of service in a particular area. For example:

  • If you’re looking to use your brand new 5G phone on an upcoming vacation, you can check the map to see if your operator had 5G service in that location.
  • If you consistently find yourself dropping calls in the same spot on your daily walk, you can check our map to see if others who use the same provider are experiencing the same thing in the same area. Then you can take that information to your operator to ask them to improve service in that area.
  • If you’re looking to change operators, you can check to see who has the kind of service you need in the locations you visit most often.

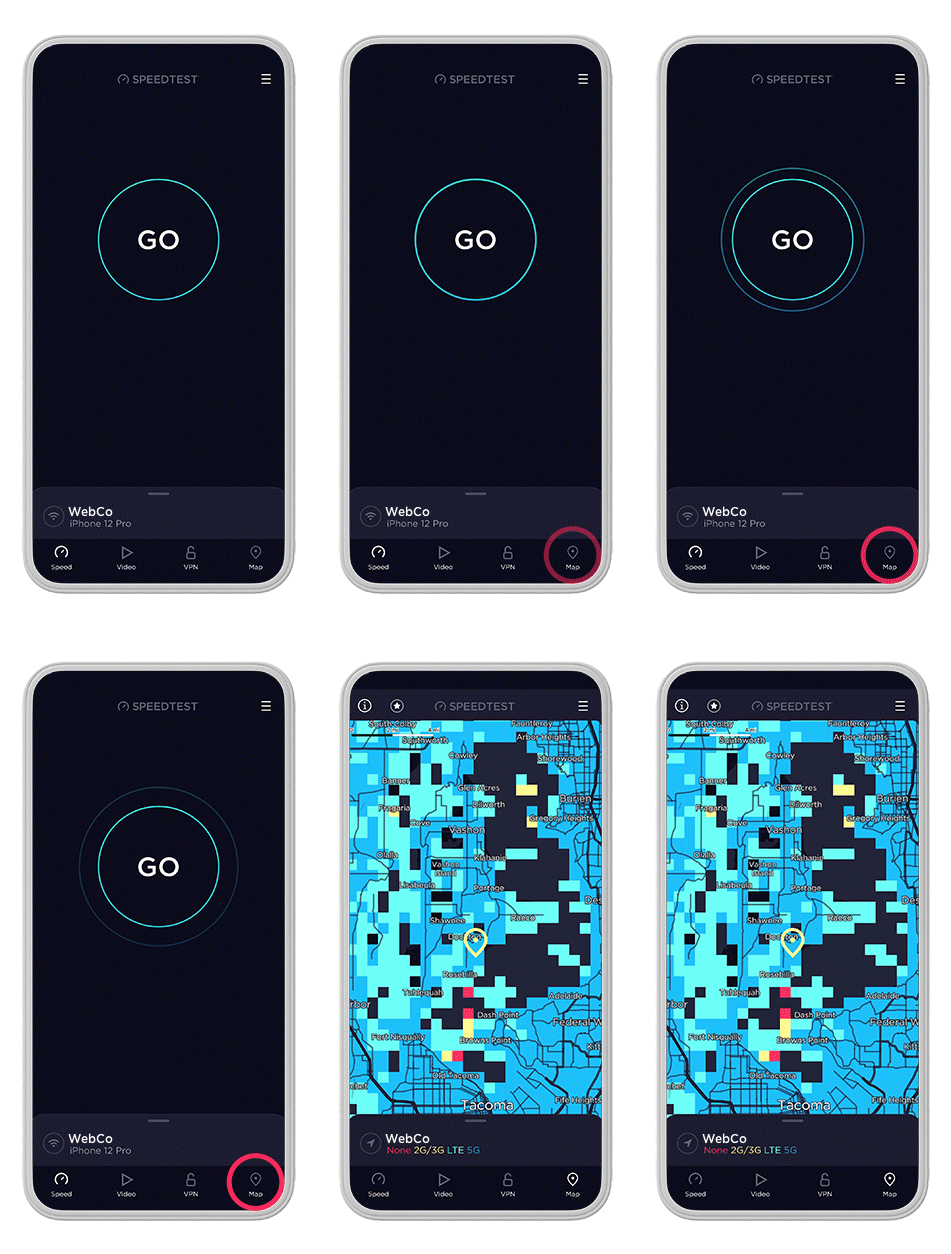
Find and use your Speedtest Map today

If you already have Speedtest on your mobile device, you now have access to Speedtest Maps for both Android and iOS for free within our existing app. If you don’t see the Maps tab in the bottom right of your screen with the map open, simply update the app. And if you don’t have the Speedtest app, download it today for Android or iOS.

Explore maps for a variety of providers

Carrier Selection

Slide the bar up to select which provider you want to see detailed information for using the slider within the Map. You can use this to compare the service you’re subscribed to with that of other operators.

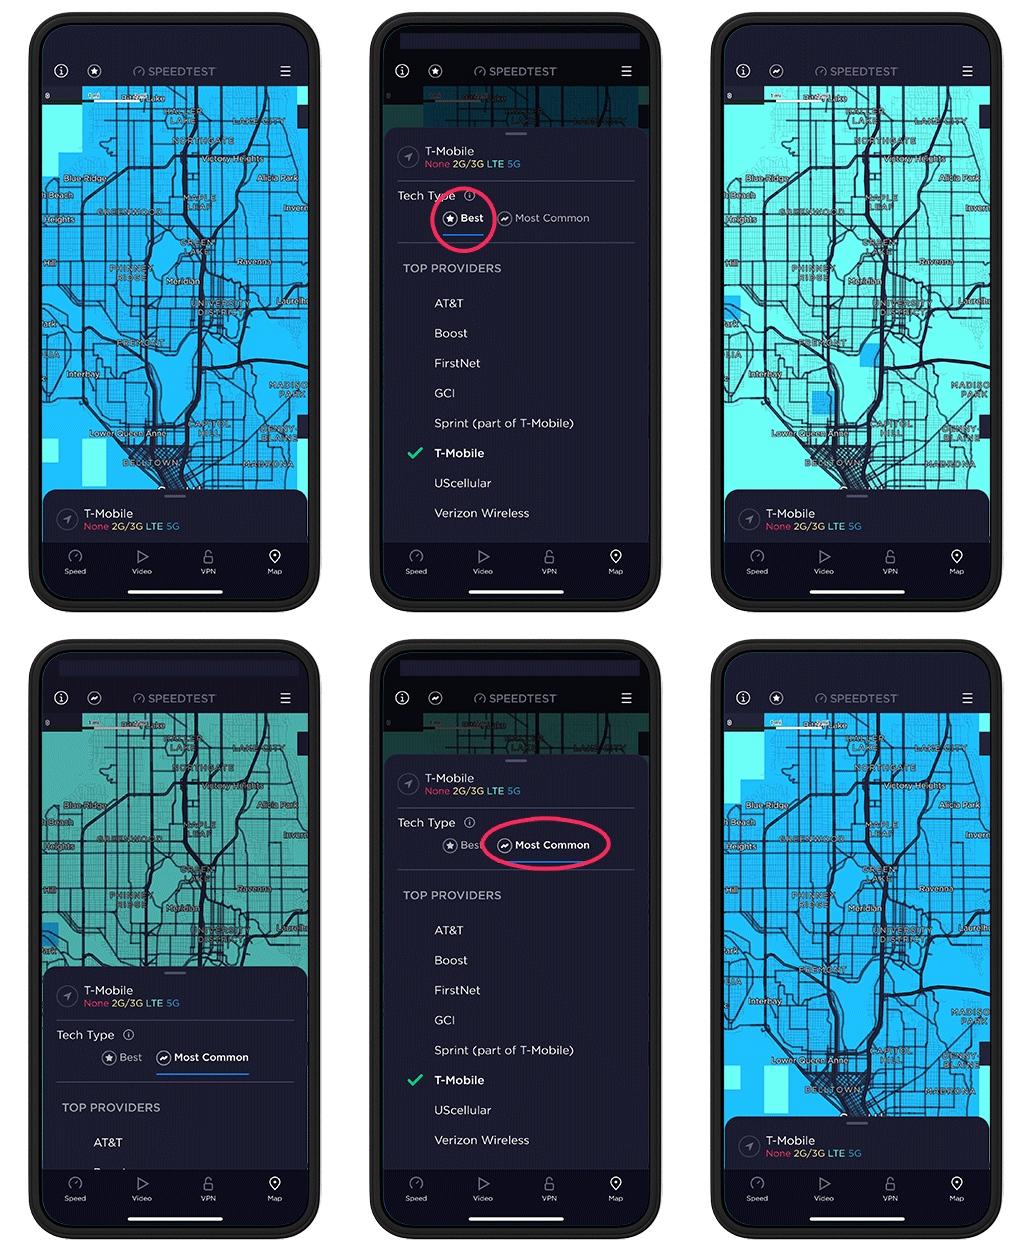
Access details on the best tech type available and the most common

Tech Type Selection

Use the bar at the top of the slider to choose whether you want to see the best available technology in an area or the most common. For example, there may be some 5G available in a certain area (Best) but LTE might be the “most common” tech type you’ll find there. The most common technology type layer in Speedtest Maps shows the technology type we saw at that location most frequently across all device types. This includes devices that are incapable of connecting to a 5G network (devices that support only 2G, 3G, and 4G LTE). If you are measuring whether 5G is available, use the “Best” layer.

Speedtest Maps are built using data from consumers who have opted in to location sharing in the Speedtest app. If you’d like to add valuable data to the maps and help to improve the feature, turn on location sharing in the settings of your device.

Our mission at Ookla is to empower consumers across the globe to understand and optimize their internet experience. Access to Speedtest Maps helps you find detailed information on coverage in the locations that matter most to you. Open the Speedtest app on your mobile device to check your map today or download Speedtest for Android or iOS.

Editor’s note: This article was updated on May 20 to clarify the uses of the “Best” and “Most Common” layers.

Ookla retains ownership of this article including all of the intellectual property rights, data, content graphs and analysis. This article may not be quoted, reproduced, distributed or published for any commercial purpose without prior consent. Members of the press and others using the findings in this article for non-commercial purposes are welcome to publicly share and link to report information with attribution to Ookla.

| May 12, 2022

Introducing a Better Measure of Latency

Latency can seem like a sleeper metric — one that you may not think about when you’re troubleshooting your connections but one that deeply affects your online experience. As speeds increase globally, it’s becoming increasingly obvious to many that something is still getting in the way of the seamless video calls, streaming, and gaming we dream of. That something is often latency and we at Ookla® have recently redesigned how Speedtest® measures latency to give you better access to this essential metric.

What latency is and why it matters

Latency (sometimes called ping) measures how quickly your device gets a response after you’ve sent out a request. A low latency means the server is responding quickly to your request whereas a high latency means a slow response. An example of how this works in online gaming is when you ask your character to move — if your character moves almost immediately, you have a low latency, if there is a delay in your character completing that movement, you might have a high latency.

Latency has always mattered to online experience. However, it has often been difficult to tell the difference between a slow connection and a high latency as both can delay you from getting what you want from the internet. These days, many folks have faster connections but there’s still a disconnect between asking their device to perform an action online and having it complete that action. Which means poor latency is becoming more obvious as the internet gets faster and more devices are connected online.

How our metric is changing (and why)

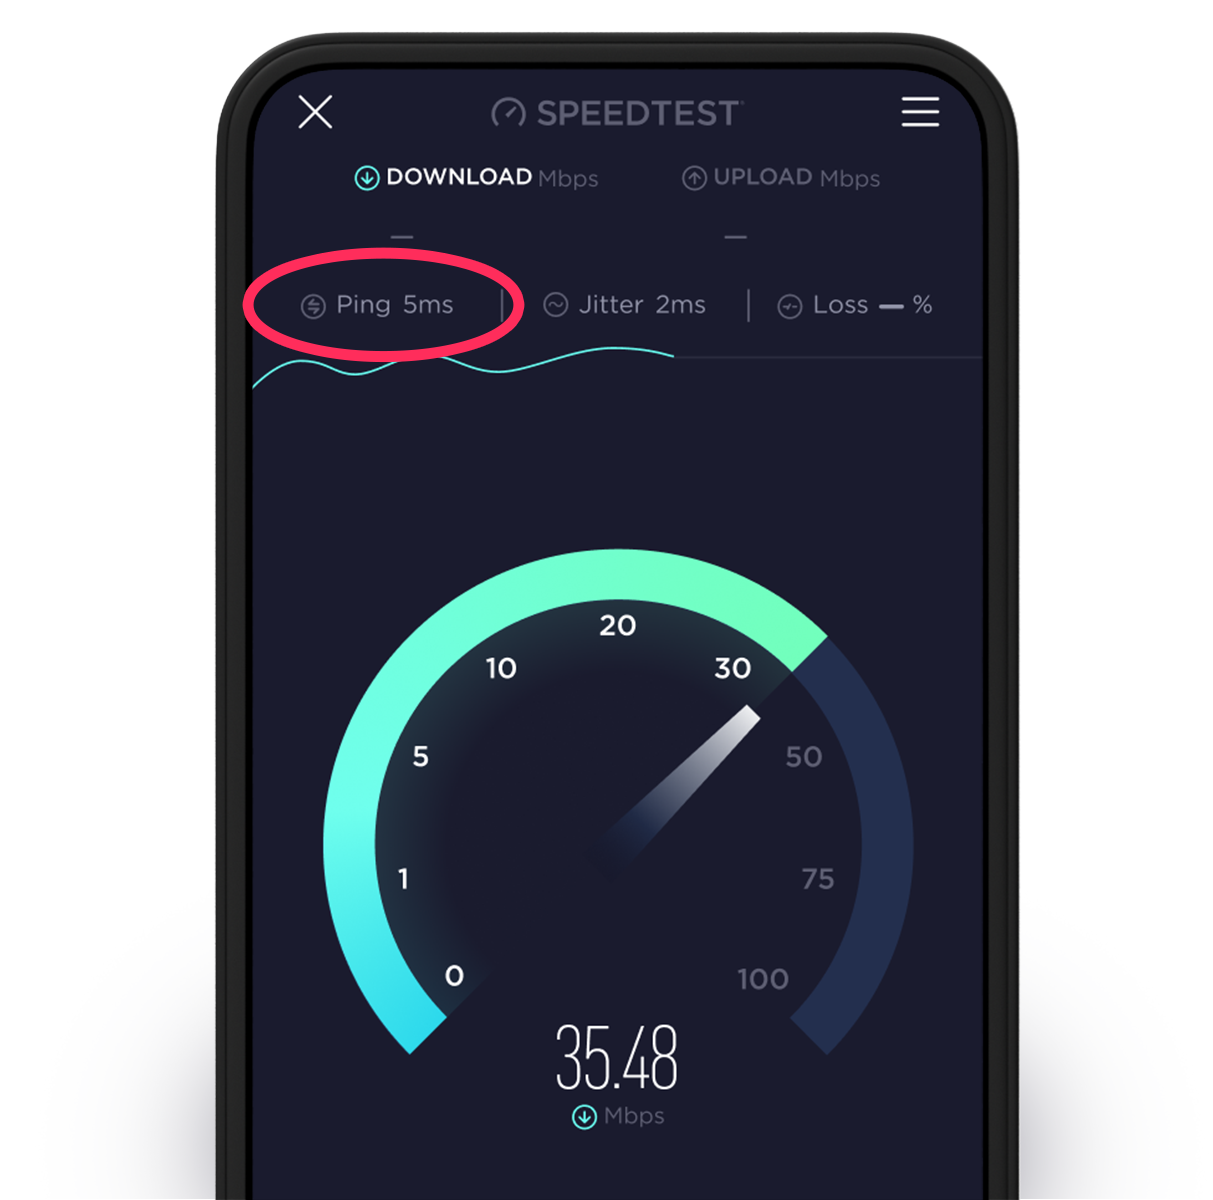
Speedtest has always tested for latency. A simple measure, labeled “ping,” has been at the top of the app next to download speed. However, we’re no longer living in a world where one device is connected to one router. Instead, you might find yourself with a laptop, tablet, phone, TV and even other smart devices connected to Wi-Fi all at once. And that’s just in your living room.

Former Latency Location in iOS Speedtest

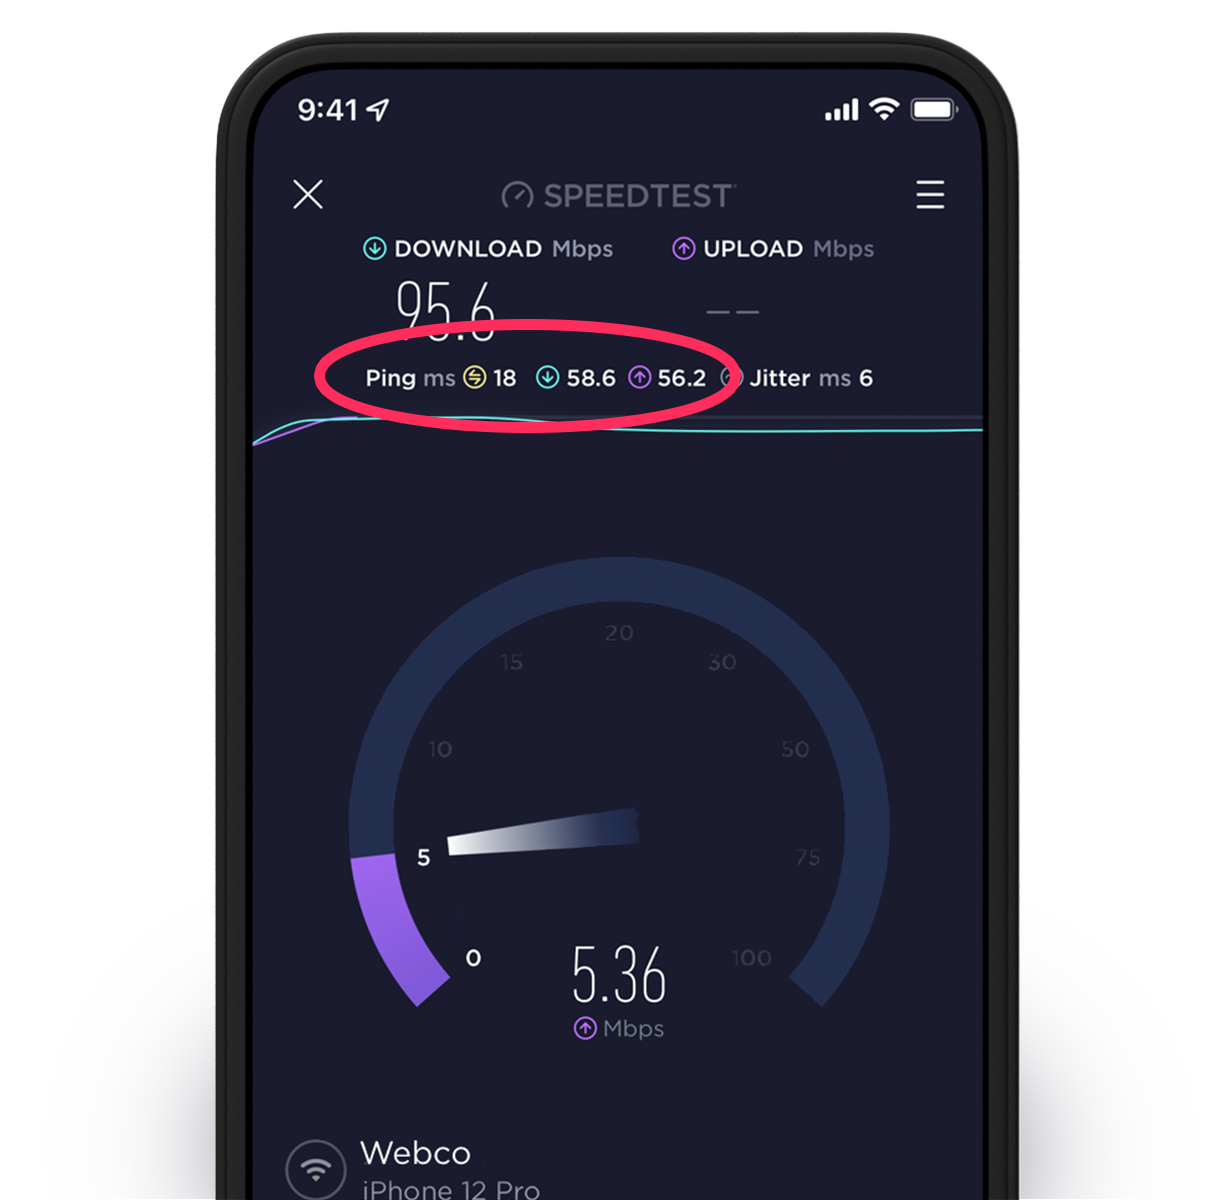
Our new latency test measures loaded latency, giving a more nuanced picture of responsiveness and what the bottlenecks in your connection really are. The loaded latency test measures ping during three stages, giving you a convenient, easy to use way to better understand your network experience. These three stages are:

  • Idle Ping. This test at the beginning of your Speedtest measures the response of a request on your network as if it is not in use.
  • Download Ping. Latency is measured while the download test is in progress to see how it is affected by download activity on your network, like a household member downloading a large game while you’re trying to work.
  • Upload Ping. Latency is also measured while the upload test is in progress to see how it is affected by upload activity on your network, like someone on your home network uploading a year’s worth of photos.

Location of new Loaded Latency information during testing

Our mission at Ookla is to empower consumers across the globe to understand and optimize their internet experience. This new metric gives you the detailed information you need to understand where the bottlenecks in your network’s responsiveness really are. If you’re looking for our old latency metric for comparison, look for the “idle low” in the detailed section of the test.

How you can use our new latency metrics in the real world

All you have to do to get these new latency measures is take the same Speedtest on your Android or iOS device that you’ve been using all along. It’s free (always) and will give you even more insight into the performance of your network. If you don’t see it yet on your mobile device, simply update the app.

Run the Speedtest to see where your latency issues actually lie. You can use your mobile device to test both your cellular network (which you don’t have a lot of control over) and your Wi-Fi network (which you have a lot of room to troubleshoot).

  • If your idle ping is high, you have an overall latency problem. You will want to test the network with another device to see if the issue affects both. If it does, restart your router. If the problem continues, consider moving your router someplace more central.
  • If your download or upload ping is high, you may have a bigger problem. Contact your router manufacturer or internet service provider (ISP) to see if they can help. Advanced users may find this guide useful.

Improve the responsiveness of your online experience. Test your latency on Android or iOS today.

Editor’s note: This article was updated on May 20 with details on where to find the older latency metric.

Ookla retains ownership of this article including all of the intellectual property rights, data, content graphs and analysis. This article may not be quoted, reproduced, distributed or published for any commercial purpose without prior consent. Members of the press and others using the findings in this article for non-commercial purposes are welcome to publicly share and link to report information with attribution to Ookla.