| August 2, 2022

Find Out Which 50 Top European Vacation Destinations Have the Fastest Mobile Internet Speeds

Vacation season is upon us with millions of tourists already flocking to Europe’s top summer destinations despite the heat. Whether you’re a European looking for the best “staycation” or an American taking advantage of the exchange rates, our analysis of mobile internet performance in 50 popular destinations across the continent should help you see how well you will be able to connect (or disconnect, should you so choose) on vacation this summer.

We divided these towns and cities into four categories that might appeal to different types of travelers: big cities, beach life, cultural havens, and forest getaways. Then we compared Speedtest Intelligence® data for median download speeds and multi-server latency across each category. Of course many of the best vacation destinations belong in multiple categories, so be sure to check each list to find your favorite locale, and you’ll want to remember that your experience may vary based on your carrier’s roaming agreement.

“Big cities” with internet performance as exciting as the lifestyle

Oslo, Norway topped our list of 15 European vacation destinations full of big city excitement with the fastest mobile internet with a median download speed of 156.99 Mbps during Q2 2022. Perfect if you’re planning to do live updates from the Øya Festival. Two other Nordic cities rounded out the top three with Stockholm, Sweden showing a median download speed of 136.74 Mbps and Copenhagen, Denmark coming in at 133.16 Mbps. With speeds like these you should be able to host as many “see how glorious my vacation is?” video calls as you want.

There was a large gap between these three cities and the next fastest group, led by Lisbon, Portugal at 86.49 Mbps. Istanbul, Turkey and Rome, Italy had the lowest median download speeds on this list. These are still adequate mobile speeds, especially if you want to lean into the vacation experience and report back on it later (if ever).

Nicosia, Cyprus had the lowest median multi-server latency on our “big city” list at 17 ms during Q2 2022. This metric measures how quickly your device gets a response after you’ve sent out a request during three stages so you can understand if you’ll run into unnecessary lags in your connection. We’ve previously reported how latency in Europe increased while roaming, and higher latency could mean that you encounter glitches in video calls or even have to shut down apps to get your phone to respond in a timely fashion. Rome had the highest latency on this list.

Where internet speeds are fit for “beach life”

Nothing says summer like relaxing on the beach. If your beach vacation needs fast internet access, surf the web in Biarritz, France and Korčula, Croatia. These two locales had the fastest median download speeds on our beach life list during Q2 2022 at 155.65 Mbps and 133.67 Mbps, respectively, though this is not a statistically significant difference. Varna, Bulgaria and Faro, Portugal rounded out the top four at 104.00 Mbps and 101.74 Mbps, respectively.

Amalfi, Italy and Cefalù, Italy are good beach destinations if you’re looking for encouragement to log off. With median download speeds of 31.40 Mbps and 38.18 Mbps, respectively, during Q2 2022, your internet connection should be adequate (though less inspiring than the Tyrrhenian Sea).

Piran, Slovenia had the lowest median multi-server latency (20 ms) on this list while Cefalù had the highest (56 ms).

“Cultural havens” with research-ready internet speeds

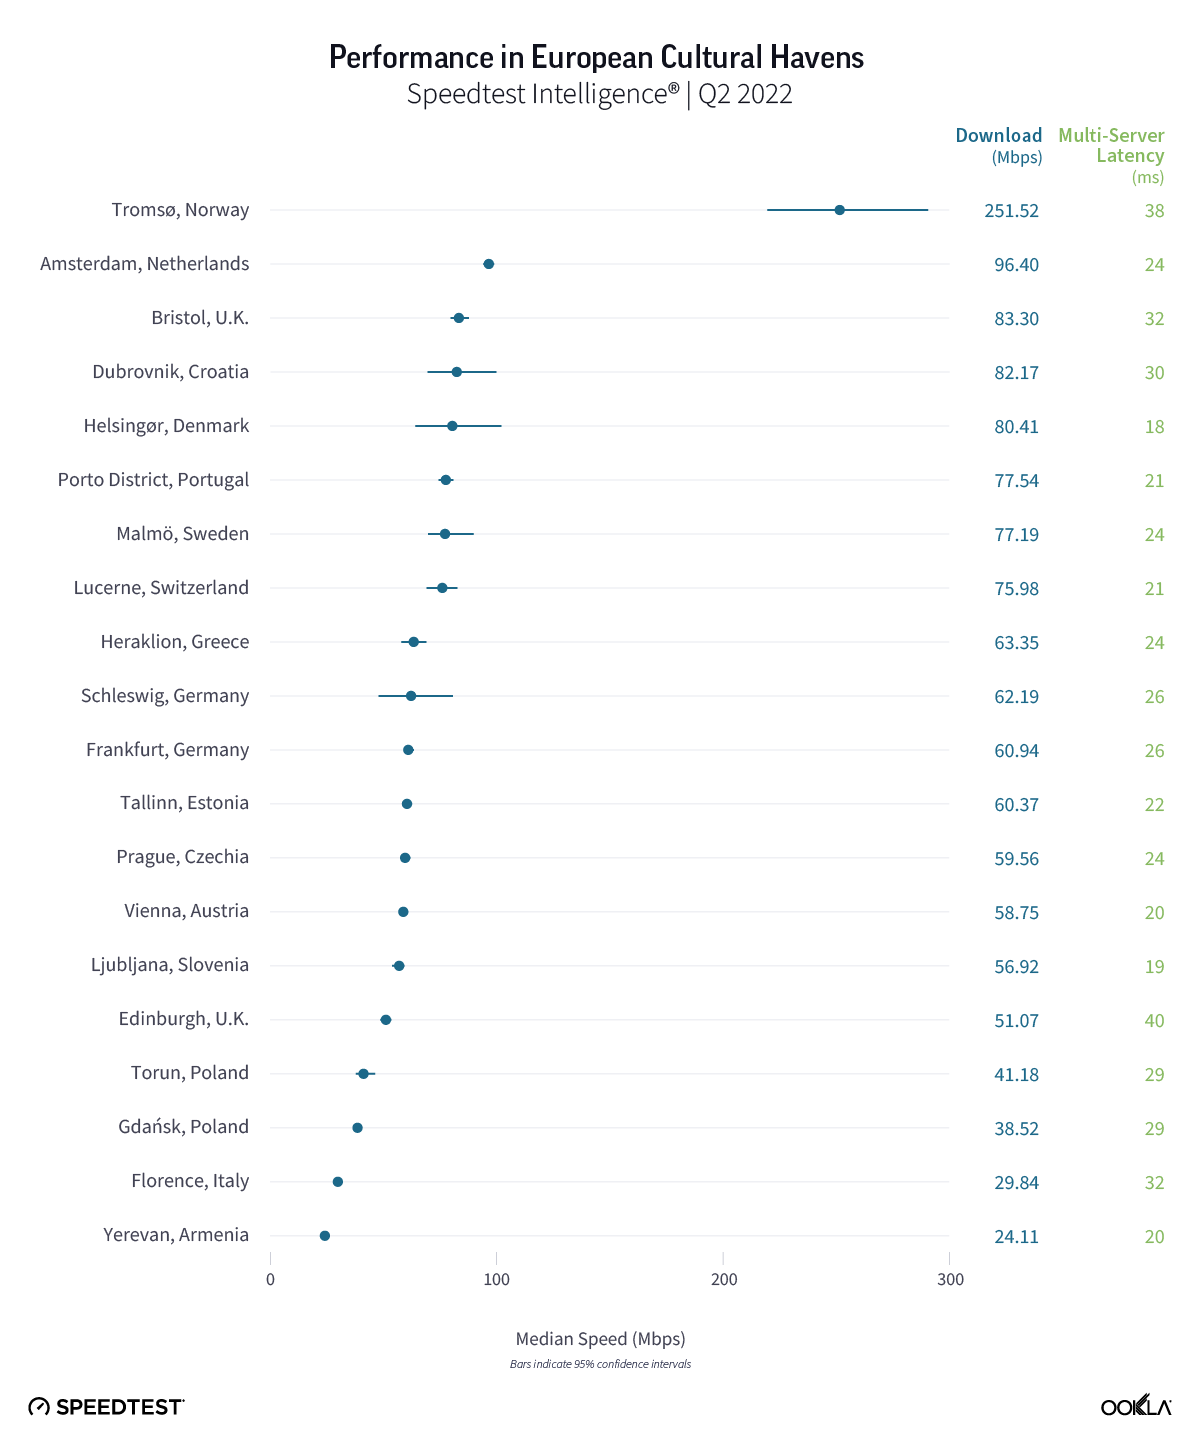
Travelers looking for maximum culture and fast internet speeds can do no better than Tromsø, Norway, which had a median download speed on mobile of 251.52 Mbps during Q2 2022, almost 2.3x faster than runner-up Amsterdam, Netherlands. Whether you’ve traveled to the northernmost bit of Norway for the wooden houses, one of the many summer festivals, or just to escape the heat, you’ll have fast enough internet to thoroughly research all the places you can go if you extend your vacation.

At the other end of the spectrum, if you’re traveling to Yerevan, Armenia or Florence, Italy to enjoy the museums and other cultural highlights of either, you might want to take pictures instead. With median download speeds of 24.11 Mbps and 29.84 Mbps, respectively, these cities were the slowest on this list. All the more reason to immerse yourself in the sights and wait to connect to Wi-Fi before uploading your photos.

Helsingør, Denmark had the lowest median multi-server latency, while Edinburgh, Scotland, United Kingdom had the highest. High latency can impede the performance of your phone even when you’re in an area with great speeds — something to keep in mind if you’re relying on your phone to locate the next Fringe venue.

Navigate internet speeds in “forest getaways”

Some people swear by the forest for the best vacations, especially in the heat of summer. The Alpine cities of Innsbruck, Austria and Digne-les-Bains, France had the fastest median download speeds over mobile on our list of forest getaways during Q2 2022 at 87.34 Mbps and 67.30 Mbps, respectively, though there was no statistical winner between the two. There was also no statistically significant difference between the median download speeds in Zakopane, Poland (43.52 Mbps); Killarney, Ireland (35.90 Mbps); and Sighișoara, Romania (30.48 Mbps). While you may prefer to be offline in the woods, having a strong and fast internet connection available can help you navigate with GPS, check out the names of all the flora you’re encountering, or reach help in case of emergency.

Sighișoara and Killarney had the lowest median multi-server latency on this list at 24 ms and 25 ms, respectively. Digne had the highest latency at 36 ms.

Regardless of where you travel, mobile internet performance will affect your trip. We hope this list prepares you for the getaway you want. If we missed your favorite European vacation destination, take a Speedtest® on Android or iOS to show off your speeds and tweet us your suggestions for next year’s list or share your ideas via this Google form.

Ookla retains ownership of this article including all of the intellectual property rights, data, content graphs and analysis. This article may not be quoted, reproduced, distributed or published for any commercial purpose without prior consent. Members of the press and others using the findings in this article for non-commercial purposes are welcome to publicly share and link to report information with attribution to Ookla.

| September 15, 2022

College Towns Where Internet Speeds Make the Grade (And Where They Fail)

It’s back to school time in the United States, and for many freshmen that means traveling to a brand new town to start your education. To help you know if the internet will be a help or a hindrance as you earn your degree, we analyzed internet performance in 100 college towns across the U.S. This list includes Speedtest Intelligence® data on median download and upload speeds from 100 towns with a large percentage of students where college is a major part of the industry.

While we worked to include a wide variety of college towns on our list, the list is far from comprehensive. If you’d like to see your school on the list next year, please take a Speedtest® then send your result to us via Twitter or Facebook. You can also start your college life on a responsible note by using our new Speedtest Performance Directory™ to check out expected speeds for internet service providers before you sign up for an extended contract.

College towns with the best (and worst) internet speeds

If you started your college search by looking for the top of the top, you’ll relate to the next three sections that highlight the college towns with the fastest speeds on 5G, all mobile technologies combined, and fixed broadband. By choosing a school in a town with great internet speeds, you’re giving yourself access to the fastest streaming and gaming experiences (and good performance for any online classes to boot). We’ve also included the locations with the slowest speeds. While you’ll see college towns broken out by population later in this article, these three sections combined data from all 100 schools on our list.

College towns with A+ and F- 5G speeds

Map of best and worst college towns for 5G speeds

With median download speeds over 300 Mbps, Manhattan, Kansas; Clemson, South Carolina; and College Park, Maryland topped our list of college towns with the fastest 5G in the U.S. during Q2 2022. Auburn, Alabama and Troy, New York rounded out the top five. Students in these places have every advantage when using 5G phones for school or play.

On the other end of the spectrum, Bowling Green, Kentucky; Fayetteville, Arkansas; Blacksburg, Virginia; Cheney, Washington; and Morgantown, West Virginia had the slowest download speeds over 5G. Students in these locations may want to consider if 5G is even worth the extra investment. Check the lists below to see how 5G performance compares to mobile performance on all technologies. It’s likely that the 5G performance will get better with time, but there’s no need to stretch your budget for a service that isn’t delivering in your area.

Overall mobile performance in college towns is sufficient

Map of best and worst college towns for mobile speeds

Tigers rejoice, because Clemson, South Carolina was among the fastest college towns for mobile on our list with a median download speed of 175.77 Mbps during Q2 2022. Tempe, Arizona; Kent, Ohio; College Park, Maryland; and Providence, Rhode Island filled out the top five. These towns all have excellent download speeds, far ahead of the 59.89 Mbps median mobile download speed in the U.S. during July 2022, according to the Speedtest Global Index™. In all, 52 of the college towns on our list showed a median download speed above this during Q2 2022.

Bennington, Vermont; Socorro, New Mexico; Kearney, Nebraska; Bowling Green, Kentucky; and Hanover, New Hampshire had the slowest download speeds on our list. While the download speeds in these places should be adequate for most phone uses, you probably won’t want to rely on tethering your mobile device to your computer for internet access.

Most college towns have acceptable fixed broadband speeds

Map of best and worst college towns for fixed broadband speeds

Grambling, Louisiana topped our list of college towns with a median download speed over fixed broadband of 333.65 Mbps during Q2 2022. Home to the HBCU Grambling State University, Grambling is a small town in north central Louisiana, and Grambling was 14% faster than Murfreesboro, Tennessee, the next fastest college town. Dover, Delaware; Chapel Hill, North Carolina; and Manchester, New Hampshire completed our list of top five fastest college towns for fixed broadband. Forty-seven out of the 100 college towns on our list had a Q2 2022 median download speed over fixed broadband that was faster than the median for the U.S. (159.31 Mbps) in July 2022, according to the Speedtest Global Index.

The slowest college towns on our list were Socorro, New Mexico; Cheney, Washington; Oberlin, Ohio; Tuskegee, Alabama; and Brookings, South Dakota. While the download speed in all but Socorro is within the acceptable range for most uses, anyone connecting more than one device at a time to a router (hello roommates!) is going to struggle with internet performance in these places.

Internet performance in large college towns

Everyone has a different college dream. Our “large college towns” list is for students who want more of a city experience than a town, with 19 locations that have 100,000 or more residents but still retain that college town feel. If your favorite college town is actually a suburb of a larger metropolitan area, look for that list below.

Chart of internet performance in large college towns in the U.S.

Manchester, New Hampshire; Huntsville, Alabama; Lincoln, Nebraska; and Providence, Rhode Island form the top of the list for large college towns with fast median download speeds over fixed broadband during Q2 2022. All four are home to multiple colleges and universities whose students can benefit from these super fast speeds. Even Columbia, Missouri, the place with the lowest median download speed on this list, exceeds the FCC minimum recommendation for broadband of 25 Mbps download. However, 10 of the cities on this list had lower speeds than the U.S. median of 159.31 Mbps in July 2022.

On mobile, Tempe, Arizona and Providence, Rhode Island had the fastest median download speeds among our large college towns list during Q2 2022. In all, eight of the colleges on this list had a median download speed over mobile during Q2 2022 that exceeded the U.S. median of 59.89 Mbps during July 2022. College Station, Texas; Fayetteville, Arkansas; Lincoln, Nebraska; Macon, Georgia; and Columbia, Missouri had the lowest mobile speeds on our list of large college towns, each coming in below 50 Mbps for median download speed.

Medium-sized college towns with fast internet speeds

Chart of internet performance in medium-sized college towns in the U.S.

College students looking for a slightly slower lifestyle might enjoy our medium-sized college town list. This list includes 26 locations where college is a major industry, there are 50,000-100,000 residents, and the city is not part of another metropolitan area.

Dover, Delaware; Jonesboro, Arkansas; and Rock Hill, South Carolina top the list of medium-sized college towns with fast fixed broadband speeds during Q2 2022. Eleven of the 26 places on this list exceeded the median download speed for fixed broadband in the U.S. (159.31 Mbps) during July 2022. Conway, Arkansas; Grand Forks, North Dakota; and Lawrence, Kansas had the slowest median download speeds over fixed broadband on this list during Q2 2022. While all three cities showed faster speeds than the FCC recommendation of 25 Mbps, students looking to use more than one device at a time (or to share an internet connection) may soon find the limits of these speeds.

Dover, Delaware led for mobile download speed on our list of medium-sized college towns during Q2 2022. Only nine of 26 places showed a faster median download speed over mobile during Q2 2022 than the U.S. median of 59.89 Mbps in July 2022. Bowling Green, Kentucky and Bozeman, Montana had the slowest median download speeds over mobile on this list. The speeds in these two places are still sufficient for ordinary use, but students will likely want to rely on fixed broadband for activities that require better performance (like opening 100 tabs to research a paper).

Small college towns with big internet performance

Chart of internet performance in small college towns in the U.S.

If you’ve always dreamed of living in a small town where the entire community seems to revolve around college life, our list of 29 small college towns might be where your heart lies. This list includes places with fewer than 50,000 residents where the college makes up a large part of the economy and the towns aren’t counted as part of a larger metropolitan area.

The Tigers led for fixed broadband and mobile speeds with Grambling, Louisiana (home of Grambling State University) easily topping the list of small college towns with fast fixed broadband (with a median download speed of 333.65 Mbps during Q2 2022). On the mobile side, Clemson, South Carolina (home of Clemson University) eclipsed the competition for download speed with a median of 175.77 Mbps.

Only eight of the 29 small college towns on our list bested the 159.31 Mbps median download speed for fixed broadband in the U.S. during July 2022. For mobile, 11 small college towns exceeded the 59.89 Mbps median download speed for the U.S.

Socorro, New Mexico had the slowest median download speed over fixed broadband by far, well under the FCC suggested 25 Mbps, and Socorro also placed among the slowest for mobile download speed. Looking at mobile, Bennington, Vermont had the lowest median download speed among small college towns. Students with mobile speeds this slow may need to lean heavily on their fixed broadband for both study and play.

Suburban college towns benefit from big city internet infrastructure

Chart of internet performance in suburban college towns in the U.S.

Sometimes you want a college town experience with easy access to the amenities of a big city. That’s where our list of suburban college towns comes in; large or small, each of the 26 places on this list is college-driven but is also close enough to (or part of) a major metropolitan area.

Murfreesboro, Tennessee; Chapel Hill, North Carolina; and New Brunswick, New Jersey had the fastest median download speeds on fixed broadband among our list of suburban college towns during Q2 2022. Kent, Ohio; College Park, Maryland; Troy, New York; and Waukesha, Wisconsin topped our list of mobile speeds in suburban college towns, each coming in with a median download speed above 100 Mbps during Q2 2022.

Proximity to the big city pays off for most of these locations with 16 of 26 suburban college towns showing a Q2 2022 median download speed faster than the 159.31 Mbps median for the U.S. during July 2022. The big city infrastructure effect was even more evident for mobile with 24 of 26 suburban college towns beating the 59.89 Mbps U.S. median for mobile speeds during July 2022.

Oberlin, Ohio had the slowest download speed by far of the suburban college towns we analyzed. While the 56.76 Mbps median speed beats the FCC broadband threshold of 25 Mbps, two or more devices trying to use a connection at that speed could struggle with mission critical activities like video calls home to the parents or the ex you left behind. Oberlin also placed at the bottom for mobile speeds along with Madison, New Jersey, the only two suburban college towns not to exceed the U.S. median.

We were pleased, for the most part, with the internet and mobile speeds we saw in U.S. college towns. There are a lot of options for schools in towns with fast connections and a couple where you could fall off the grid (should you so choose). Did we leave your college town off our list or are you seeing a radically different result in your college town? Take a Speedtest® on Android or iOS and tweet us your feedback. You can also check month-by-month performance for your town and compare expected speeds for internet providers in our new Speedtest Performance Directory.

Ookla retains ownership of this article including all of the intellectual property rights, data, content graphs and analysis. This article may not be quoted, reproduced, distributed or published for any commercial purpose without prior consent. Members of the press and others using the findings in this article for non-commercial purposes are welcome to publicly share and link to report information with attribution to Ookla.

| November 9, 2022

Speedtest + Downdetector = One Stop Troubleshooting for Your Connectivity

When you want to check your internet performance, you take a Speedtest®. If you can’t connect to a site, you check Downdetector®. Now, we’ve added a new Downdetector tab in the Speedtest app so you can do both in one location. This combines the internet’s most trusted app for testing connectivity with Downdetector’s real-time status information for over 12,000 apps, websites, and services across in 47 countries — with one tap. Using these free utilities, you can now diagnose whether your connection is in trouble or if there’s a larger service issue all in one place.

animated gif showing new feature location in speedtest app

This is the same methodology we use for the Downdetector site you’ve come to trust. It’s simply in a more convenient location.

Check for online outages

Tap the “Status” tab at the bottom center of the Speedtest app to see a snapshot of the current status of the apps, websites, and services Downdetector monitors, tailored to show what’s most relevant in your country. Sites and services that are experiencing problems will appear at the top, giving you a quick view of whether the problem you’re experiencing is more widespread. Read more about how a few critical services can take down chunks of the internet here.

Check for details on a specific incident

animated gif showing new feature location in speedtest app

Tap any site or service on the status page for a more detailed view of what’s going on. You’ll see a graph of incident reports over the last 24 hours as well as a chart of what types of issues users have reported. You can also tap on the blue button at the bottom of the page to submit your own report to Downdetector including information about your experience. This helps other users understand what they might also be experiencing.

Coming soon

This update is currently rolling out to Android and iOS devices worldwide. Update your Speedtest app if you don’t see the Downdetector tab. Soon we’ll also be adding in the ability to search for a specific site or service. Keep an eye out for this and other improvements as you troubleshoot your internet connectivity in the Speedtest app.

Download the Speedtest app for Android or iOS today to check out this new feature and let us know what you think on Twitter or Facebook.

Ookla retains ownership of this article including all of the intellectual property rights, data, content graphs and analysis. This article may not be quoted, reproduced, distributed or published for any commercial purpose without prior consent. Members of the press and others using the findings in this article for non-commercial purposes are welcome to publicly share and link to report information with attribution to Ookla.

| August 1, 2023

European Vacation: Your Guide to Roam Like at Home Performance this Summer

Summer is here and with it the August vacation season that most of Europe has been waiting for. We’re here with fresh data from Speedtest Intelligence® to help you know in advance if your phone will be a help or a hindrance on your travels. We’ve examined results from Android devices in the European Union (EU) and the United Kingdom (U.K.) during Q2 2023 and included data on 5G performance to see if “Roam Like at Home” is living up to its promise.

5G boosts European roaming speeds but latency varies 

Speed and latency are two important indicators of online performance. Speed will have a greater effect on streaming content while latency will affect gaming and video chatting. Both come into play while browsing online maps for that hot new gelato place your friends told you about. 

While the EU extended “Roam Like at Home” regulations until 2032, our previous analyses demonstrated that mobile speeds are usually slower when roaming than when exploring your home country. The actual speeds vary dramatically based on roaming agreements between mobile operators, something you can’t really control unless you’re prepared to do the research then shop for a whole new plan before your trip. What you can control is whether you spring for 5G before your big trip. The data below represents the local speeds and multi-server latency for each country as well as those experienced by residents of the named country while roaming in the EU or the U.K. during Q2 2023.

Roaming speeds can’t live up to local performance

Median Mobile Roaming Performance in Europe
Speedtest Intelligence | Q2 2023
Country Local Download (Mbps) Roaming Download (Mbps) Local 5G Download (Mbps) Roaming 5G Download (Mbps)
Austria 59.28 42.77 161.00 80.51
Belgium 48.00 59.86 157.23 124.64
Bulgaria 78.27 48.97 252.75 93.24
Croatia 73.65 47.86 184.29 124.38
Cyprus 56.93 40.83 197.22 64.24
Czechia 46.50 31.96 104.36 72.26
Denmark 118.48 51.74 206.95 115.82
Estonia 64.99 77.51 * *
Finland 78.00 53.43 217.13 106.54
France 61.64 43.46 187.42 95.56
Germany 46.30 39.54 114.07 84.27
Greece 57.41 66.17 143.26 153.28
Hungary 40.44 48.28 85.12 132.98
Ireland 34.49 36.10 98.70 85.38
Italy 36.97 37.68 130.85 99.38
Latvia 59.73 65.13 220.51 146.15
Lithuania 64.70 53.04 * *
Luxembourg 74.86 46.88 * *
Malta 44.56 48.11 109.97 110.80
Netherlands 96.77 37.61 128.04 87.84
Poland 42.14 34.23 78.82 99.51
Portugal 57.86 39.91 212.95 79.88
Romania 43.34 59.59 153.35 99.84
Slovakia 43.16 41.53 139.53 85.16
Slovenia 52.73 49.86 145.83 95.50
Spain 32.33 35.77 85.75 116.48
Sweden 84.00 51.24 160.93 129.43
United Kingdom 40.74 48.06 108.74 98.92

Although EU residents can roam call, text, and surf without additional charges, a drop in speed is an issue while roaming according to Q2 2023 data. Residents from 17 countries showed faster local download speeds than roaming speeds when considering results over all technologies during Q2 2023. The 11 exceptions were Romania (which was much faster roaming), Belgium, Hungary, Estonia, the U.K, Greece, and Spain, which all showed faster roaming speeds, and Latvia, Malta, Ireland, and Italy which showed only slightly improved speeds.  

While roaming speeds varied widely based on country of origin, every country on this list saw much higher median download speeds when roaming on 5G than roaming on all technologies. Despite this uplift, 20 countries showed faster local 5G download speeds than roaming 5G speeds during Q2 2023. The exceptions were Hungary, Spain, and Poland, which all saw faster 5G roaming than locally, while Greece had marginally better 5G roaming than at home, and people from Malta didn’t really see any major difference. Estonia, Lithuania, and Luxembourg did not have enough 5G samples to qualify for analysis.

Latency suffers awfully when roaming

Median Mobile Roaming Latency in Europe
Speedtest Intelligence | Q2 2023
Country Local Multi-server Latency (ms) Roaming Multi-server Latency (ms) Local 5G Multi-server Latency (ms) 5G Multi-server Latency (ms)
Austria 32.19 91.24 30.96 111.08
Belgium 36.51 84.96 31.89 67.61
Bulgaria 31.72 125.60 26.41 124.63
Croatia 39.03 85.25 35.96 80.37
Cyprus 27.90 200.18 23.52 184.68
Czechia 34.72 80.18 30.77 78.72
Denmark 29.47 94.77 28.08 81.85
Estonia 33.10 87.00 * *
Finland 33.67 102.84 32.16 99.14
France 46.97 92.61 44.39 87.49
Germany 41.78 87.19 39.07 77.57
Greece 38.16 137.29 34.63 132.91
Hungary 36.27 85.39 35.06 77.26
Ireland 36.21 116.62 31.70 118.47
Italy 50.87 100.20 49.96 93.87
Latvia 29.88 101.91 26.28 94.70
Lithuania 34.03 107.79 * *
Luxembourg 33.45 67.70 * *
Malta 47.44 146.57 38.69 135.43
Netherlands 33.24 83.25 31.17 79.81
Poland 42.41 108.69 40.25 100.36
Portugal 35.98 123.05 31.62 126.54
Romania 40.65 122.91 34.22 121.21
Slovakia 30.47 80.28 26.39 70.96
Slovenia 30.61 76.68 27.70 75.27
Spain 51.53 112.81 47.11 102.94
Sweden 37.52 114.69 32.97 99.48
United Kingdom 50.45 111.01 46.04 107.59

Residents of every country surveyed had a much higher multi-server latency when roaming during Q2 2023. This is because roaming signals are routed through a user’s home network, making latency a significant issue for Europeans when traveling. The difference was smallest in Italy and France where locals had about a 97% higher latency when roaming compared to at home. On the other end of the scale, residents of Cyprus saw over a 615% higher latency while roaming compared to at home. A high latency means a long response time for any request you send over the internet, perhaps adding more frustration to your vacation than you would want.

The results were similar over 5G with Italy showing the smallest difference between latency while roaming and at home (about 88% greater) and Cyprus having the largest difference (about 685%). Surprisingly, 5G did not reliably improve multi-server latency. 

What this data tells you is that it’s worth upgrading to 5G before a trip if speed is your main concern. Whether 5G will help you with your latency will depend heavily on which country you are traveling from. Regardless, you should expect a high latency while roaming. Plan ahead accordingly.

Outbound roaming speeds vary dramatically

As discussed above, roaming speeds depend heavily on where you are traveling from, where you are traveling to, and what agreements your home mobile operator has with operators in the country you’re visiting. That said, it’s fun to look at what’s possible, so we looked at the very best and very worst roaming speeds in Europe during Q2 2023.

Fastest roaming speeds in Europe

Customers from Italy roaming in Portugal saw one of the fastest median roaming download speeds over 5G in all of Europe during Q2 2023 at 317.94 Mbps. Estonians roaming in Finland saw a 278.69 Mbps median 5G download speed, and Finns in Sweden experienced a median 5G download of 252.57 Mbps. 

Looking at the highest results from all technologies combined, Latvians roaming in Finland experienced a median download speed of 137.49 Mbps, while Greeks saw median download speeds of 129.75 while roaming in Bulgaria and 125.83 Mbps while roaming in Austria.

Slowest roaming speeds in Europe

On the other end of the scale, Slovakian visitors to Poland had one of the slowest median download speeds over all technology while roaming during the same time period at 10.82 Mbps. Polish roamers saw a median download speed of 13.27 Mbps in the U.K. and 14.78 Mbps in Romania. Ten of the 20 slowest roaming speeds on our country-by-country list for all technologies were for Europeans roaming in the U.K. This means that travelers going to the U.K are not only seeing poorer performance, they could also be paying more for the privilege as they do not benefit from “Roam Like at Home” regulations.

Germans in Italy had the slowest median 5G download speed on our list during Q2 2023 at 33.64 Mbps. Austrians in the U.K. saw a median download speed over 5G of 41.57 Mbps, and Portuguese roamers in Spain experienced a median download speed over 5G of 44.18 Mbps.

Whether you choose to roam, pick up a local SIM or eSIM, or simply spend less time online, we hope this information helps you make the most of your vacation. If you have an extra minute between activities, take a Speedtest® to see how your performance compares. 

Ookla retains ownership of this article including all of the intellectual property rights, data, content graphs and analysis. This article may not be quoted, reproduced, distributed or published for any commercial purpose without prior consent. Members of the press and others using the findings in this article for non-commercial purposes are welcome to publicly share and link to report information with attribution to Ookla.

| August 28, 2023

Downdetector Presents the Top 10 Largest Internet Outages of the First Half of 2023

For over 10 years, users have trusted Downdetector® to report problems with their favorite services and get real-time status and outage information. In 2022, we saw huge outages throughout the year and compiled a list of 10 of the largest disruptions. We’re back to see which services experienced major issues that left users in a lurch during the first half of 2023. Read our list of the 10 largest global outages of 2023 so far and find out how users were affected:

10. League of Legends – May 13, 2023

League of Legends players worldwide rushed to Downdetector to report issues with gameplay during a major service disruption over a weekend in mid-May. Hour by hour throughout the day, users noted difficulties accessing the game, totaling nearly 200,000 reports.

9. Microsoft 365 – January 25, 2023

Over 240,000 Microsoft 365 users reported trouble accessing business and education tools during a major outage in January. A suite of Microsoft products were impacted, including Teams, Outlook, OneDrive for Business, Sharepoint Online, Exchange Online, and Microsoft Graph. Reports began at 7 a.m. UTC and continued throughout the day, slowing around 7 p.m. UTC, interrupting morning business hours worldwide.

8. EA – May 4, 2023

A slew of EA accounts and games were down on May 4, 2023, preventing players from connecting to servers or logging into their accounts. Some EA players were unable to access their accounts throughout the day, with the majority of reports coming in between 9 a.m. UTC through 6 p.m. UTC. In total, over 298,000 gamers reported issues.

7. YouTube – February 9, 2023

There were no cat videos, old Vines, vlogs, or Mr. Beast challenges available to watch on February 9 when over 300,000 users found their way to Downdetector to report issues with streaming videos on YouTube. There were an equal amount of reports from users unable to access both the website and mobile application.

6. Steam – June 25, 2023

Steam, one of the most popular video game distributors, experienced service disruptions on Sunday, June 25. Over 308,000 users reported issues with the website, primarily citing server connection and login issues. Reports peaked around 11 p.m. UTC, interrupting players’ crucial late night gaming plans.

5. Diablo – June 8, 2023

We’ve made it to the top five outages! Server connections were down for the game Diablo on Thursday, June 8. This left over 338,000 gamers yelling at their screens on a weekday. Reports peaked at 8 p.m. UTC, lasting through the night until 12 a.m. UTC.

4. Roblox – January 28, 2023

If there is one thing this list made clear, it is that gamers take game interruptions very seriously. Landing at number four on our largest outages list is Roblox. Frustrated players had their games interrupted on a Saturday night, citing server connection and game play issues. Over 470,000 reports were submitted on Downdetector on January 28, resulting in the biggest gaming outage of 2023 so far.

3. Spotify – January 14, 2023

Spotify users reported over 489,000 issues on Downdetector in late January after suffering a major outage. Users worldwide were stuck without music, podcasts, and now audiobooks while the service got back up and running. In all, the service reached peak reports from about 6 p.m. to 8 p.m. UTC, with some users experiencing lingering issues for a few hours.

2. Reddit, March 14, 2023

Landing at number two on our list of largest global outages of the first half of 2023 is Reddit. Over 1.2 million users globally couldn’t reply to other users or downvote bad responses in r/AskReddit so they went to Downdetector to report that Reddit was having issues. The reports flooded in starting at around 7 p.m. UTC and everything was back up and running globally 6 hours later, around 1 a.m. UTC.

1. Instagram, May 21, 2023

Competing social media platforms may be ready to fight in a cage match to be the best, but Instagram took the biggest blow of the first half of 2023 with the dubious honor of having the largest outage on our list. Starting around 10 p.m. UTC and ending around 2 a.m. UTC, users were unable to like photos, slide into DMs, or even scroll through content to capture their attention. Over 2.4 million users worldwide reported issues with the social media giant, making it the largest outage of 2023 so far.

Taylor Swift didn’t break the internet this year … yet

Last year, the singer broke the internet a couple of times. As she continues to sell out her Eras tour and rerelease albums, we’ll continue to deliver real-time analysis and verification of outage reports in Downdetector to ensure we are tracking the services that matter most to consumers.

Want to learn more about how the internet goes down? We’ve got you covered with our article “5 Critical Services that Keep the Internet Up and Running (And How to Identify Which is Causing Your Outage.”

Stay up to date on the largest real-time outages that are important to you by downloading the Speedtest® app (which has Downdetector integrated) for iOS or Android and let us know if you’re experiencing issues disrupting your life.

Ookla retains ownership of this article including all of the intellectual property rights, data, content graphs and analysis. This article may not be quoted, reproduced, distributed or published for any commercial purpose without prior consent. Members of the press and others using the findings in this article for non-commercial purposes are welcome to publicly share and link to report information with attribution to Ookla.

| August 30, 2023

Lessons Learned From a Successful 3G Sunset [Webinar]

Mobile operators around the world are sunsetting legacy technologies in order to free up spectrum for newer technologies and improve network performance for their customers. Zain Bahrain recently became the first operator in the Middle East to sunset 3G. This article will walk through how Zain used crowdsourced network intelligence to successfully shut down 3G in Bahrain.

You can also register for our September 12 webinar, where Zain Bahrain will share firsthand a roadmap for successfully sunsetting 3G. Register now

Why operators are shutting down legacy technology

Sunsetting a technology is not just about repurposing spectrum. Legacy network generations like 3G are more expensive and less effective to maintain as technology advances. By disabling 3G, operators can benefit from reduced network complexity and lower operational costs. It also supports other initiatives, including improved customer experience and reduced energy consumption. 

Ensuring service while shutting down legacy technology

When sunsetting 3G in markets where many consumers don’t have 4G- or 5G-capable devices, it’s important to understand where these customers are located and how much of their time is spent on legacy tech.

Using crowdsourced network intelligence in Ookla Cell Analytics™, Zain Bahrain was able to find out where customers are still relying on 3G — down to where subscribers have user equipment that can’t connect to modern network technology. Looking at downlink throughput on 3G Devices in Bahrain during Q2 2022, we can see that there was a concentration of 3G users in the capital city of Manama. 

Looking at LTE RSRP data during the same time period, Zain was able to determine if customers were using 3G due to a lack of 4G or 5G network coverage. They were also able to understand where improved coverage would be needed in the absence of 3G. The yellow and orange dots below indicate areas where 4G signal strength was poor at the time. 

What happens after 3G is disabled? 

Zain used Cell Analytics to monitor customer adoption of 4G and 5G after disabling 3G. Looking at downlink throughput on 3G devices one year later during Q2 2023 shows that there is “no data available” because there were no users connected to 3G post-sunset. However, downlink throughput for 4G and 5G shows where customers are now connecting to new network technologies — indicating that 4G and 5G adoption is going well. 

Zain Bahrain was able to validate a significant improvement in both downlink and uplink user throughput, as well as improved coverage and customer sentiment as a result of the sunset. To find out how you can prepare to shut down your legacy network technology, join the webinar at 11 a.m. GMT+3 Bahrain / 10 a.m. GMT+2 South Africa / 9 a.m. GMT+1 U.K. on Tuesday, September 12. A recording will be provided for registrants who can’t join the live presentation. Register now

Ookla retains ownership of this article including all of the intellectual property rights, data, content graphs and analysis. This article may not be quoted, reproduced, distributed or published for any commercial purpose without prior consent. Members of the press and others using the findings in this article for non-commercial purposes are welcome to publicly share and link to report information with attribution to Ookla.

| August 23, 2023

Propelling Digital Transformation with Focused Measures: Key Takeaways from the APAC Regulatory Summit

Ookla® hosted its inaugural Telecommunications Regulatory Summit for policymakers across Asia Pacific on July 16, 2023, in Kuala Lumpur, Malaysia. The Summit event brought together over 40 regulatory participants from ten countries in the region, to examine how crowdsourced data can support more effective policy-making. The Summit also reflected on the regional telecommunication landscape, its challenges, opportunities, ways to bridge the digital divide, and ensuring consumers have a good quality of experience (QoE).

Key takeaways

  • Data-driven regulation to drive connectivity. The summit emphasized that crowdsourced data plays a crucial role in measuring progress, identifying connectivity gaps, and making informed decisions to bridge the digital divide, ensuring that high-quality broadband is accessible to everyone, including rural and remote areas. 
  • Diverse technology solutions for connectivity. While 5G technology can replace fixed broadband access in certain scenarios, satellite and 5G FWA technology are effective solutions for remote areas. Adopting these technologies, combined with digital literacy initiatives, can help address challenges related to device accessibility, affordability, and usage gaps. 
  • Regulation and collaboration as catalysts for digital transformation. Effective regulatory policies, collaboration with various stakeholders, and implementing programs like Malaysia’s Jendela initiative are instrumental in promoting digital infrastructure, improving customer experience, and ensuring widespread access to telecommunications services. When internet providers, governments, and regulators work together (like in the Malaysia example), internet service and coverage will continue to improve and expand, including in rural areas.

Data-driven regulation to increase connectivity

Many governments in Asia Pacific see improvements to broadband connectivity as a means to drive digital transformation of their economies. However, this requires that high-quality broadband be accessible nationwide.

Speedtest Intelligence data shows that fixed network performance varies across the region, while mobile networks are catching up in performance and are often the primary means of connection. 5G performance has already exceeded fixed network performance in Malaysia and Indonesia –  Speedtest Intelligence data shows that Malaysia recorded a median 5G download speed of 511.79 Mbps versus 93.19 Mbps for fixed, while in the Philippines, our results showed median download speeds of 133.47 Mbps on 5G versus 93.19 Mbps over fixed broadband.

Chart of median fixed and mobile download speed across a sample of Countries in Asia Pacific

Although connectivity continues to improve, connecting rural and remote areas remains a challenge. To tackle this issue, some countries have established programs like Malaysia’s Universal Service Provision and Indonesia’s Universal Service Obligation fund. These programs aim to provide basic telephony and internet services to individuals and communities. Operators contribute to the fund, which is then used to deploy networks in rural areas that may not be financially viable otherwise. Mr. Sam Majid, CTIO of the Malaysian Communications and Multimedia Commission (MCMC), emphasized the importance of making informed decisions, driving tangible improvements, and revolutionizing the approach to strengthen internet connectivity in the country. He added, “Crowdsourced data has become critical for us to understand where the demand for connectivity is, where we need to improve, and where we need to deploy. These insights help us manage regulatory policy to address the digital divide, support consumer protections, and increase competition within the market.” 

A mix of technologies is required to advance connectivity 

5G technology can potentially replace fixed internet access in situations where the cost of fiber deployments is high and rolling out traditional fixed broadband networks isn’t commercially viable. However, in countries like Indonesia, satellite technology may be a more effective solution for providing connectivity to remote areas. While 5G Fixed Wireless Access (FWA) and satellite technology can complement each other, the adoption of satellite technology is currently limited by factors such as coverage, device affordability, and cost of service (Starlink modems cost around $800) in comparison to existing fixed or mobile broadband options. On the other hand, based on our data from the U.S.A., we can see that in the best-case scenario, 5G-based FWA can compete with fiber in terms of median download speeds. 

Chart of median download speed in the U.S.A. by technology type

Malaysia has taken a proactive approach to address the growing demand for better quality fixed and mobile broadband coverage. The government’s 12th Malaysia Plan (2021-2025) includes the Jalinan Digital Negara (Jendela) initiative, which utilizes various technology solutions for different sub-areas. To achieve its objectives, Jendela uses Ookla’s crowdsourced data to monitor mobile broadband speeds and identify coverage gaps. In contrast to other countries, Malaysia has adopted a nationwide single wholesale network (SWN) approach for its 5G rollout. The Digital Nasional Berhad (DNB) was established in 2021 to construct and operate the 5G network infrastructure and provide 5G services to mobile network operators at wholesale prices. With 5G DNB coverage reaching 64.75% as of June 2023, Jendela is making significant progress in expanding internet access and achieving its goals of digital transformation.

Regulators play a role in advancing digital transformation

In a panel discussion about the impact of regulation on digital transformation, MTC Laos’ Ms. Phavanhna Douangboupha and Indonesia’s DG SDPPI, Mr. Adis Alifiawan, shared their strategies for increasing broadband connectivity and narrowing the digital divide. Ms. Douangboupha revealed that Laos is collaborating with the private sector and government agencies towards Digital Transformation and Digital Economy development. As part of this it recently launched the National Digital Transformation Committee, chaired by the Prime Minister, in order to reduce redundancy to improve efficiency. Laos also launched the 20-year Vision for Digital Economy Development (2021-2040), 10-year Strategy (2021-2030), and 5-year National Digital Development Plan for 2021-2025. The Ministry of Technology and Communications of Laos is also raising awareness for digital transformation by visiting each province and educating on its benefits.

Meanwhile, Indonesia has taken a targeted approach to accelerate the development of digital infrastructure and provide internet access in villages and public service locations as part of the “Connected Indonesia: the more digital, the more advanced” initiative. 

The government has developed all three layers of digital infrastructure, including its Fiber Optic Backbone Network “Palapa Ring,” high throughput satellite (SATRIA-1) for middle-mile connectivity, and last mile connectivity through 4G base stations and WiFi internet access deployed solely by the government in rural areas. Sharing telecom infrastructure is another supportive regulatory framework, which can reduce business costs, ensure faster rollouts and enhance a country’s connectivity, according to Ms. Syeda Shafaq Karim, a representative from the Pakistan’s Telecom Regulator. She also added that enabling Telecom Infrastructure Sharing brings multiple benefits for all stakeholders, from telecom consumers, operators, and regulatory perspective. Additionally, Mr. Tith, during his presentation, discussed how the Telecommunication Regulator of Cambodia intervened to address issues related to QoS and network coverage by setting a floor price for mobile data packages, ensuring they are not sold below the cost base. 

While much progress has been made, in our recent article, we shared how several markets in the Asia Pacific region experienced faster median download performance compared to that in the top five European economies. For example, Malaysia, South Korea, Singapore, India, New Zealand, China, and Australia achieved a median 5G download speed exceeding 200 Mbps. In comparison, only France recorded speeds above 200 Mbps among the European countries mentioned, while Italy, Germany, United Kingdom, and Spain, recorded median download speeds below 150 Mbps. However, there is another important factor to consider when discussing expanding broadband adoption, and that is the usage gap, those people that live within the footprint of mobile broadband networks and not using them. According to GSMA, almost half of the population in Asia Pacific is connected to the mobile internet. The mobile internet usage gap –  in the region has narrowed significantly from 60% in 2017 to 47% in 2022, reflecting the increasing affordability of devices and improving digital skills.

Mr. Kevin Henry, representing the GSMA, during Fireside Chat: Democratizing Broadband  Through 5G Fixed Wireless Access Implementation, discussed the current challenges to expanding internet adoption across the region, such as device accessibility, affordability, coverage, and usage gaps. These challenges can be addressed through digital literacy, relevant content, and education. He also added that governments and mobile operators have a crucial role to play in driving internet adoption via subsidies or tax, as well as educating the citizens on the benefits of being connected.

Overall, the event emphasized the importance of digital transformation, partnerships, and regulation in shaping the future of the telecom ecosystem. The focus of the APAC Regulatory Summit was on improving customer experience, digital advancement, and closing the digital gap, all of which depend on reliable mobile networks. While progress is clearly being made, we will keep a close eye on 5G and network development across Asia going forward. In the meantime, if you want to learn more, subscribe to Ookla research to be the first to read our analyses.

Ookla retains ownership of this article including all of the intellectual property rights, data, content graphs and analysis. This article may not be quoted, reproduced, distributed or published for any commercial purpose without prior consent. Members of the press and others using the findings in this article for non-commercial purposes are welcome to publicly share and link to report information with attribution to Ookla.

| August 15, 2023

Ookla for Good Adds Centroid Coordinates to Open Data

Faster and Easier Mapping for Fixed and Mobile Network Performance Map Tiles

When we first offered our open performance datasets to the public in 2020, Ookla®’s main priorities were to make sure that our fixed and mobile network performance data would be accessible, relevant, and useful to those researching or trying to improve the state of networks worldwide. As conversations around connectivity continue to evolve, so too has our open dataset. For instance, earlier this year we extended our open performance dataset to include additional responsiveness insights by showing latency under load for both saturated downlink and uplink measurements.

As we continue to advance our datasets to include more new, exciting, and relevant metrics, we remain committed to ensuring that key data views are accessible to as many interested parties as possible: more people accessing network performance and consumer quality of experience insights means more important conversations surrounding connectivity and ultimately better public policy to help improve broadband access globally. This is why we are excited to announce the addition of centroid coordinates to our open data.

What are centroids?

So what exactly are centroid coordinates, and how do they help provide more access to our data? Centroids are the point where the medians of a shape intersect. Or, to put it simply, a centroid is the center point of a shape. For more in-depth information on the math behind how centroids are computed, check out RPubs documentation on the subject.

Why centroids are important

The Ookla for Good open dataset makes use of spatial tiles. While the geometries of tiles provide precision in mapping, working with and plotting spatial data can often be a long and arduous process. This issue is further compounded by the global nature of our datasets, making it difficult for users to subset specific areas to look at. Machines with limited RAM may take multiple hours to do a single spatial join to a small area, and if more metrics are added, the joins take longer and longer to run.

The addition of centroid coordinates means that rather than needing a geospatial toolset, users can filter to an approximation of their area of interest using a numerical bounding box. This will dramatically cut down on the time to join our data to other data sources, improving accessibility for those looking to work with Ookla’s Fixed and Mobile Network Performance Map Tiles.

Mapping open data using centroid coordinates

For this example let’s use the country of Brazil to demonstrate one way of mapping our open data with centroid coordinates in R.

library(geobr)
library(ggrepel)
# remotes::install_github("teamookla/ooklaOpenDataR")
library(ooklaOpenDataR)
library(scales)
library(sf)
library(tidyverse)
library(usethis)

# Set global defaults
theme_set(theme_minimal())
theme_update(text = element_text(color = "#181512")) 
theme_update(plot.subtitle = element_text(hjust = 0.5))

# plot colors
purple <- "#8D5DB2"
light_gray <- "#EDEAE6"
mid_gray <- "#9B9893"

colPal <- colorRampPalette(c("#E4AECF", "#3E0E1C"))

I am using the package geobr to grab the geometries for the country. There are multiple functions within this package that allow you to grab geometries at different administrative levels if you want to follow this tutorial for a smaller portion of the country.

We will be using st_bbox() to create a bounding box to help subset the performance map tiles. An alternative to this is to get min/max coordinates from searching online (for ex: google “Brazil bounding box”). We highlighted the dimensions for Brazil’s bounding box on the following map.

#Set up map
brazil <- read_country(year=2020) %>%
  st_transform(4326)

br_bbox <- brazil %>% # use to subset open data
  st_bbox()

ggplot(brazil) +
  geom_sf(color = mid_gray, fill = light_gray, lwd = 0.08) +
  labs(title = "Brazil") +
  geom_text_repel(aes(label = name_state, geometry = geom),
    family = "sans",
    color = dark_gray,
    size = 2.2,
    stat = "sf_coordinates",
    min.segment.length = 2
  ) +
  theme(
    panel.grid.major = element_blank(),
    panel.grid.minor = element_blank(),
    axis.text = element_blank(),
    axis.title = element_blank()
  ) +
  annotate(geom = "rect", ymax = 5.27, ymin = -33.75, xmax = -28.85, xmin = -73.99, colour = purple, fill = colorspace::lighten("#8D5DB2", 0.5), alpha = 0.1)
Map Base of Brazil

We will then download the performance map tiles using the OoklaOpenDataR package, and then subset the global data to make it more manageable to work with when we do our join.

fixed_br_q2 <- get_performance_tiles(service = "fixed", quarter = 2, year = 2023) %>%
  filter(tile_y <= br_bbox['ymax'], tile_y >= br_bbox['ymin'], tile_x <= br_bbox['xmax'], tile_x >= br_bbox['xmin']) %>%
  st_as_sf(wkt = "tile", crs = 4326)

You can then check to see what the remaining data looks like. There will be points outside of the boundaries, but that is to be expected.

ggplot(brazil) + # Check
  geom_sf(color = mid_gray, fill = light_gray, lwd = 0.08) +
  geom_sf(data = fixed_br_q2, color = purple) +
  labs(
    title = "Brazil",
    subtitle = "Ookla® Open Data Fixed Tiles | Q2 2023"
  ) +
  geom_text_repel(aes(label = name_state, geometry = geom),
    family = "sans",
    color = dark_gray,
    size = 2.2,
    stat = "sf_coordinates",
    min.segment.length = 2
  ) +
  theme(
    panel.grid.major = element_blank(),
    panel.grid.minor = element_blank(),
    axis.text = element_blank(),
    axis.title = element_blank()
  )
Map of Brazil with Ookla® Open Data Fixed Tiles Q2 2023

Voilà! You now have a smaller dataset that can then be used to perform analysis as needed.

Aggregating Loaded Latency

As stated before, we announced the addition of additional loaded latency metrics to our data in January. We can use the previous code to show a simple example of how to aggregate it. For more examples and information on how to perform your own analysis on our open data check out this tutorial.

First, use the following code to perform a spatial join to get a more precise location for our tiles.

#Join 
br_tiles <- brazil %>%
  st_join(fixed_br_q2, left = FALSE)

Then aggregate the data up to the desired level of granularity. In this case, we aggregated the data by states in Brazil.

br_aggs <- br_tiles %>%
  st_set_geometry(NULL) %>%
  group_by(name_state) %>%
  reframe(
    tiles = n(),
    avg_lat_download_ms = round(weighted.mean(avg_lat_down_ms, tests, na.rm = TRUE), 2),
    avg_lat_upload_ms = round(weighted.mean(avg_lat_up_ms, tests, na.rm = TRUE), 2),
    total_tests = sum(tests)
  )

Re-join the geometries from Brazil.

br_aggs <- left_join(brazil, br_aggs)

And then map.

ggplot(br_aggs) +
  geom_sf(aes(fill = avg_lat_download_ms), color = "white", lwd = 0.08) +
  scale_fill_stepsn(colors = colPal(5), labels = label_number(suffix = " ms"), n.breaks = 4, guide = guide_colorsteps(title = "")) +
  theme(
    panel.grid.minor = element_blank(),
    panel.grid.major = element_blank(),
    axis.title.x = element_text(hjust = 1),
    legend.text = element_text(color = "black"),
    axis.text = element_blank()
  ) +
  labs(
    title = "Average Download Latency Across Brazil",
    subtitle = "Ookla® Open Data Fixed Tiles | Q2 2023"
  )
Map of Average Download Latency Across Brazil Q2 2023

This example offers one way to filter with the added centroid coordinates, but it is by no means the only approach. If you are interested in exploring more ways to interact with our data, additional tutorials are available on our GitHub page.

Ookla retains ownership of this article including all of the intellectual property rights, data, content graphs and analysis. This article may not be quoted, reproduced, distributed or published for any commercial purpose without prior consent. Members of the press and others using the findings in this article for non-commercial purposes are welcome to publicly share and link to report information with attribution to Ookla.

| July 20, 2023

How Gaming Companies Can Detect and Resolve Outages Faster [Webinar]

Gaming companies can’t always rely on internal monitoring tools when individual users are experiencing problems with their service — and when issues that impact gameplay are caused by external services, diagnosing the root cause can be tricky. Millions of gamers use Downdetector® to report and understand problems with their favorite online games. The world’s leading game developers and hosts use this data to detect and resolve service issues faster. 

Register for our webinar on July 26th to learn how you can can monitor user-reported problems and third-party services to improve your players’ experience and keep downtime to a minimum. In this article, we share a preview of data from a major gaming outage that affected many popular online games, including Apex Legends.

Detecting and monitoring service disruptions

Downdetector monitors over 12,000 services worldwide. Users can go to your company’s page and submit a report if they are experiencing issues with the service. These user-submitted reports can be monitored by service teams within the Downdetector Enterprise™ dashboard.

On June 25th, 2023, there was a surge of reports of issues with Apex Legends, a popular free-to-play hero shooter video game. In the images below, you can see that over 3,500 users reported issues with the service, with the majority indicating that “server connection” was the main problem. We can also view the locations and density of where the reports originated.

Images from the Downdetector Enterprise Dashboard analyzing user-submitted reports during the Apex Legends service disruption

Downdetector can detect when these service disruptions occur and rapidly trigger an alert for providers. Using a proprietary algorithm, Downdetector Enterprise can detect when the number of reports are significantly higher than the average number of alerts for that day and time. Service providers can sign up for email alerts for their services and third-party services. Further, these alerts can be integrated through an RSS feed within internal monitoring tools and apps, such as Slack and Microsoft Teams. 

In this case, those who are tracking Apex Legends would be notified by email and RSS alerts once elevated reports were seen at about 5 p.m. Central. They could then monitor the service disruption within the dashboard, refreshing user-submitted reports in intervals as quick as thirty seconds.

Leveraging user-reported problems to diagnose the root cause 

In order to understand the cause and severity of the issue, we can compare across the gaming industry to check if competitors or third-party services were experiencing similar issues. The image below shows elevated reports across other popular games including FiveM, Dota 2, and Destiny at the same time that Apex Legends players were logging issues on Downdetector.

Images from the Downdetector Enterprise Dashboard comparing service disruptions across popular games

This comparative view helps us determine that these games share the same video game distribution service, Steam. When looking at Steam’s dashboard in Downdetector Enterprise, we see that there were over 200,000 reports of gamers experiencing issues with the service during the same time frame. We can therefore correlate the service disruption experienced by players of Apex Legends with the greater third-party outage occurring on Steam. 

Image from the Downdetector Enterprise Dashboard diagnosing the root cause from third-party distribution service, Steam

This example highlights the critical role that Downdetector Enterprise has in helping gaming companies rapidly detect and diagnose the root cause of service disruptions.  

Are you prepared to resolve your game’s next outage?

Downdetector Enterprise allows gaming providers to detect and resolve outages that impact the gaming experience. With early alerting, you can rapidly determine the size, location, and potential impact of a service issue, decreasing resolution time and keeping your players’ downtime to a minimum. 

If you’d like to learn more about how the world’s leading game developers and hosts are monitoring service disruptions, please join our upcoming webinar at 8 a.m. PDT / 11 a.m. EDT / 4 p.m. BST on Wednesday, July 26th. A recording will be provided for registrants who can’t join the live presentation. Register Now

Ookla retains ownership of this article including all of the intellectual property rights, data, content graphs and analysis. This article may not be quoted, reproduced, distributed or published for any commercial purpose without prior consent. Members of the press and others using the findings in this article for non-commercial purposes are welcome to publicly share and link to report information with attribution to Ookla.

| July 5, 2023

Combating 5G Battery Drain Concerns

Chipset vendors driving generational efficiency gains

  • 5G use drains your smartphone battery faster than 4G-LTE. Ookla® Speedtest Intelligence® data shows that smartphone users accessing 5G networks experience higher battery drain than for those using 4G-LTE, of between 6% and 11%, depending on the System on Chip (SoC) in their device.
  • Qualcomm’s Snapdragon is the most efficient Android SoC. Qualcomm’s latest flagship SoC, the Snapdragon 8 Gen 2, recorded the lowest battery drain of all SoCs in our analysis, recording 31% for users on 5G, and 25% on 4G-LTE.
  • Newer flagship SoCs demonstrate clear improvements in battery performance. While the gap in battery drain between 4G-LTE and 5G use does not appear to be closing over time, newer generations of SoC from Qualcomm, MediaTek, Samsung and Google all demonstrate battery efficiency gains over previous iterations. MediaTek’s latest flagship SoC, the Dimensity 9200 for example, recorded 34% battery drain when using 5G, compared to 45% for its previous generation, the Dimensity 9000.
  • Smartphone users concerned about 5G’s impact on battery life should consider upgrading. For users with 5G-capable devices camping on 4G-LTE networks due to battery life concerns, an upgrade to the latest flagship smartphone (and SoC) and enabling 5G service will in some cases deliver comparable battery performance. Qualcomm’s Snapdragon 8 Gen 2 for example recorded battery drain of 31% when using 5G, compared to 32% for the previous generation Snapdragon 8 Gen 1 on 4G-LTE.

Chart of 5G vs 4G-LTE Battery Drain for Flagship SoCs

Methodology

Analysis based on Speedtest Intelligence data, for Android, split by SoC, for a selection of major markets globally. To measure battery drain, we identified all devices recording 100% battery level during morning hours (6am-12pm), and compared to their minimum battery level in the afternoon (12pm-6pm).

Ookla retains ownership of this article including all of the intellectual property rights, data, content graphs and analysis. This article may not be quoted, reproduced, distributed or published for any commercial purpose without prior consent. Members of the press and others using the findings in this article for non-commercial purposes are welcome to publicly share and link to report information with attribution to Ookla.