| March 13, 2020

Tracking COVID-19’s Impact on Global Internet Performance (Updated July 20)

We are no longer updating this article as internet speeds in most countries have stabilized to pre-pandemic levels. For ongoing information about internet speeds in specific countries, visit the Speedtest Global IndexTM or contact our press team.

Ookla® closely monitored the impact of COVID-19 on the performance and quality of global mobile and broadband internet networks in the early days of the pandemic. We shared regular information based on Ookla data to assist in the understanding of this unprecedented situation. You can still download the July 20, 2020 CSV here which contains all the public data we tracked in this article. If you are looking for information on internet or online service outages, please check Downdetector®.

Ookla retains ownership of this article including all of the intellectual property rights, data, content graphs and analysis. This article may not be quoted, reproduced, distributed or published for any commercial purpose without prior consent. Members of the press and others using the findings in this article for non-commercial purposes are welcome to publicly share and link to report information with attribution to Ookla.

| March 16, 2020

Ookla Launches Speedtest VPN for Mobile

Online privacy is key to today’s web users who want to browse where and how they please with the security of knowing that no one is snooping on their online activity. A Virtual Private Network (VPN) is a crucial part of every consumer’s internet toolbox. And now Ookla® is offering Speedtest VPNTM, a mobile VPN service through the Speedtest® app you already know and trust.

What a VPN is and why you need one

vpns-how-do-they-work-4
A VPN protects your internet browsing and app usage, keeping it private even if you’re using an otherwise unsecured connection. A VPN anonymizes your IP address and encrypts your internet activity on one end and then decrypts it at the other. This means that no one can see what you’re doing online — not hackers at your local coffee shop, not your neighbor who’s borrowing your Wi-Fi, not even your internet service provider (ISP).

Your online activity is vulnerable if you use public Wi-Fi or other unsecured connections. VPNs create a private session to keep what you’re doing online secure. Speedtest VPN routes your internet connection through a trusted server that secures your identity online.

Why Speedtest VPN?

People have been turning to Speedtest for over 13 years for the most accurate and reliable measures of internet speeds. Now with Speedtest VPN, we can help you ensure your online privacy and security from the convenience of your Speedtest® mobile application. Here are five reasons you should try Speedtest VPN:

  • It’s convenient. With no additional app to download or account to create, you can easily try out Speedtest VPN on your mobile device using your existing Google Play or App Store account.
  • It’s everywhere. You can use Speedtest VPN on any mobile network you’re connected to, in any location or context where you use your Android or iOS mobile device.
  • It’s familiar. Not only is Speedtest VPN available within an app that you’re probably already using, it’s also available in all 17 languages that Speedtest supports.
  • It’s trustworthy. We do not collect, store or sell information related to your online activities.
  • It’s free. Your first 2 GB of data over VPN is free every month.

Get started securing your connection today. Download Speedtest on the App Store or get it on Google Play and go to the VPN tab in the app.

Learn more about Speedtest VPN.

How to get and install Speedtest VPN

Speedtest VPN is already in your Speedtest app on your mobile device. Just open Speedtest and then click on the VPN tab at the bottom of your screen to get started. The app will guide you through a quick series of prompts to turn on Speedtest VPN.

Protect all your browsing with Speedtest VPN Premium

For unlimited data protection, upgrade to Speedtest VPN Premium for $4.99 USD per month. Premium subscribers also receive an ad-free Speedtest experience during their subscription. Unlike other VPN services, Speedtest VPN Premium offers flexible monthly billing through the App Store or Google Play with no expensive annual commitments.

Download Speedtest for Android or iOS to try Speedtest VPN.

Ookla retains ownership of this article including all of the intellectual property rights, data, content graphs and analysis. This article may not be quoted, reproduced, distributed or published for any commercial purpose without prior consent. Members of the press and others using the findings in this article for non-commercial purposes are welcome to publicly share and link to report information with attribution to Ookla.

| June 16, 2020

June is Already a Tough Month for International Mobile Operators

On June 15, Downdetector® received numerous reports that T-Mobile was down in the United States. The peak of the outage reports on that day came in around 12:00 pm, PST. There were 113,980 reports during that peak. Soon after, users began reporting issues with AT&T and Verizon (and other smaller operators) as well, though in much smaller numbers (3,861 and 8,619 reports, respectively, at around 1:30 pm, PST).
Downdetector_Outage_T-mobile_effects_0620-2

The relative volume of reports by other operators shown in this chart suggests that, while the major outage was on T-Mobile’s network, customers of other operators may also have been impacted when they tried to contact T-Mobile customers and encountered errors. While we cannot definitively identify the root causes of yesterday’s issues reported by customers of all major U.S. mobile operators, it is valuable for operators to know when their customers are experiencing connectivity difficulties so they can respond appropriately. Even if the root issue does not exist within their network. Access to detailed information about all the outages in a particular ecosystem, as provided on Downdetector, can help consumers and customer support providers focus on where the actual problem lies.

We saw a similar effect in the United Kingdom on June 9 when Vodafone suffered an outage. Downdetector data indicated 9,686 reports from users during the peak at 4:45 GMT. At around the same time, EE users submitted 411 reports to Downdetector while we saw 519 reports from O2 customers and 322 reports from customers of Three in separate spikes throughout the same day.
Downdetector_Outage_Vodafone_effects_0620-1

This is a good reminder that if you’re encountering difficulty in connecting with your mobile operator, it’s worth checking Downdetector as well as trying other online services and apps to see where the real outage lies.

Ookla retains ownership of this article including all of the intellectual property rights, data, content graphs and analysis. This article may not be quoted, reproduced, distributed or published for any commercial purpose without prior consent. Members of the press and others using the findings in this article for non-commercial purposes are welcome to publicly share and link to report information with attribution to Ookla.

| July 17, 2020

Cloudflare Outage Takes Out the Internet

Users in the United States and Europe experienced what appeared to be an internet outage on Friday afternoon, Pacific Daylight Time. What turned out to be an issue at Cloudflare took down a large number of websites and online services across the internet. Downdetector® was also briefly impacted by Cloudfare’s outage, during which time users in the U.S. and Europe were unable to reach the site. Users reported having issues with the following:

  • 4chan
  • Amazon
  • Amazon Web Services
  • Arlo
  • AT&T
  • Bandwidth
  • Canva
  • Cash App
  • CenturyLink
  • Chime
  • Cloudflare
  • Coinbase
  • Comcast
  • Cox
  • Crunchyroll
  • Destiny
  • Discord
  • Doordash
  • Escape from Tarkov
  • Facebook
  • Frontier
  • Gmail
  • Google
  • Google Cloud
  • Grindr
  • Grubhub
  • League of Legends
  • Minecraft
  • Optimum / Cablevision
  • Path of Exile
  • Patreon
  • Peloton
  • Playstation Network
  • PlentyOfFish
  • Plex
  • Postmates
  • Quizlet
  • RCN
  • Reddit
  • Roblox
  • Shopify
  • Sling
  • Spectrum
  • Spotify
  • Sprint
  • Steam
  • Streamlabs
  • Suddenlink
  • T-Mobile
  • Twitch
  • Twitter
  • Uber Eats
  • Udemy
  • Valorant
  • Venmo
  • Verizon
  • Wattpad
  • Wave Broadband
  • Webs
  • WOW
  • WP Engine
  • Xbox Live
  • Youtube
  • Zendesk
  • Zoom

Cloudflare is a content delivery network (CDN) that is relied upon by many industry leaders to deliver portions of their websites. That means when Cloudflare goes down, even briefly as we saw today, large sections of the internet are affected.

Ookla retains ownership of this article including all of the intellectual property rights, data, content graphs and analysis. This article may not be quoted, reproduced, distributed or published for any commercial purpose without prior consent. Members of the press and others using the findings in this article for non-commercial purposes are welcome to publicly share and link to report information with attribution to Ookla.

| August 19, 2020

How to Ensure Your Internet is Ready for Back to School

Autumn means back to school in the Northern Hemisphere, and this year many students’ classroom experience will be at least partially digital. This transition could place a major strain on network infrastructure both at schools and in homes, so we’ve gathered some information to help teachers, students and administrators stay virtually connected.

Internet speed matters

Video conference platforms like Zoom and Google Meet only work well when connected to adequately fast internet. Zoom suggests download and upload speeds of at least 3 Mbps for sending 1080p HD video. Google support documentation recommends having both upload and download speeds of at least 3.2 Mbps for group video meetings with multiple participants.

Take a Speedtest® to ensure that your download and upload speeds are at least 3 Mbps. If your connection is not delivering the speed you need, call your internet service provider.

speedtest-desktop800

More users = less speed

Every new user you add to an internet connection places additional strain on the connection, potentially slowing it down. This is true if you’re a school administrator trying to support multiple teachers streaming from one building. It’s also true if you’re a parent trying to set up multiple remote classrooms in addition to a remote office for yourself.

When measuring the speed of your connection, try connecting all the users to your network at the same time and have them use the network in the way they normally would to see what the throughput really is.

Make sure your modem is up to date

Older modems can be a bottleneck when it comes to internet speeds. In general, if your modem is more than three years old, it might be time for an upgrade. If you’re using a cable modem, you’ll want to look for one that supports DOCSIS 3.1. A DOCSIS 3.1 modem is able to bond multiple frequency channels, offering faster speeds and a more reliable connection. If your ISP supports the technology, you can get even faster speeds by upgrading to a DOCSIS 4.0 modem, but this is not yet universally available.

Replace your modem if it’s more than three years old. Look for DOCSIS 3.1 if you’re upgrading a cable modem.

Wi-Fi can add to your woes

Your router could be slowing you down

Choose a router that supports 802.11ax (802.11ac if you want to drop the price point a bit). You’ll need an up-to-date computer to get the most power out of 802.11ax, but 802.11 is generally backwards compatible. That means you should get improved service with a modern router. Over the years, improved router standards have included wider channel bandwidth (up to 160 MHz), denser constellation and additional spatial streams over previous versions that can keep your Wi-Fi router from becoming a bottleneck.

Look for a router that supports 802.11ax (or at least the most up-to-date standard that your computer can handle).

More antennas mean more speed

The number of transmitting and receiving antenna elements directly affects the ability to extract and process multiple spatial streams out of a single transmission.

Check the number of antennas on your router. More = better.

Wi-Fi extenders can be problematic

wifi-waves
As nice as it is to set up your classroom anywhere in the house or garden, Wi-Fi extenders are notorious for slowing down connections because everything you transmit over your network needs to be sent multiple times. If you cannot run enough wired connections for every user in your space, use traditional Wi-Fi extenders with caution.

Many of the challenges of bolting a Wi-Fi extender onto an existing network can be solved by replacing your existing Wi-Fi access point(s) with a mesh system. Place these devices around your home and they will automatically tune themselves to use the appropriate channels to ensure you are getting the best possible coverage. These mesh points generally use one channel to communicate back to the wired base station and an entirely different channel to communicate with your devices. This allows them to minimize potential interference, and automatically adjust coverage to best suit your needs.

Instead of using a traditional Wi-Fi extender, look to a Wi-Fi mesh system that can more intelligently select channels and route traffic.

Gigahertz matter

Many Wi-Fi setups let you choose between 2.4 GHz and 5 GHz. 2.4 GHz is best for connecting with older devices and when you want the farthest range possible. 5 GHz offers faster speeds and less interference, but it requires your devices to be closer, or have line of sight, to the base station. To get a better connection, especially if you’re using 2.4 GHz, move away from cordless phones, microwaves, baby monitors, Bluetooth devices, and anything that could be broadcasting a signal.

Choose 5 GHz if you’re close to the wireless access point and need speed or are worried about interference. Choose 2.4 GHz for older computers or devices that are farther away from the access point.

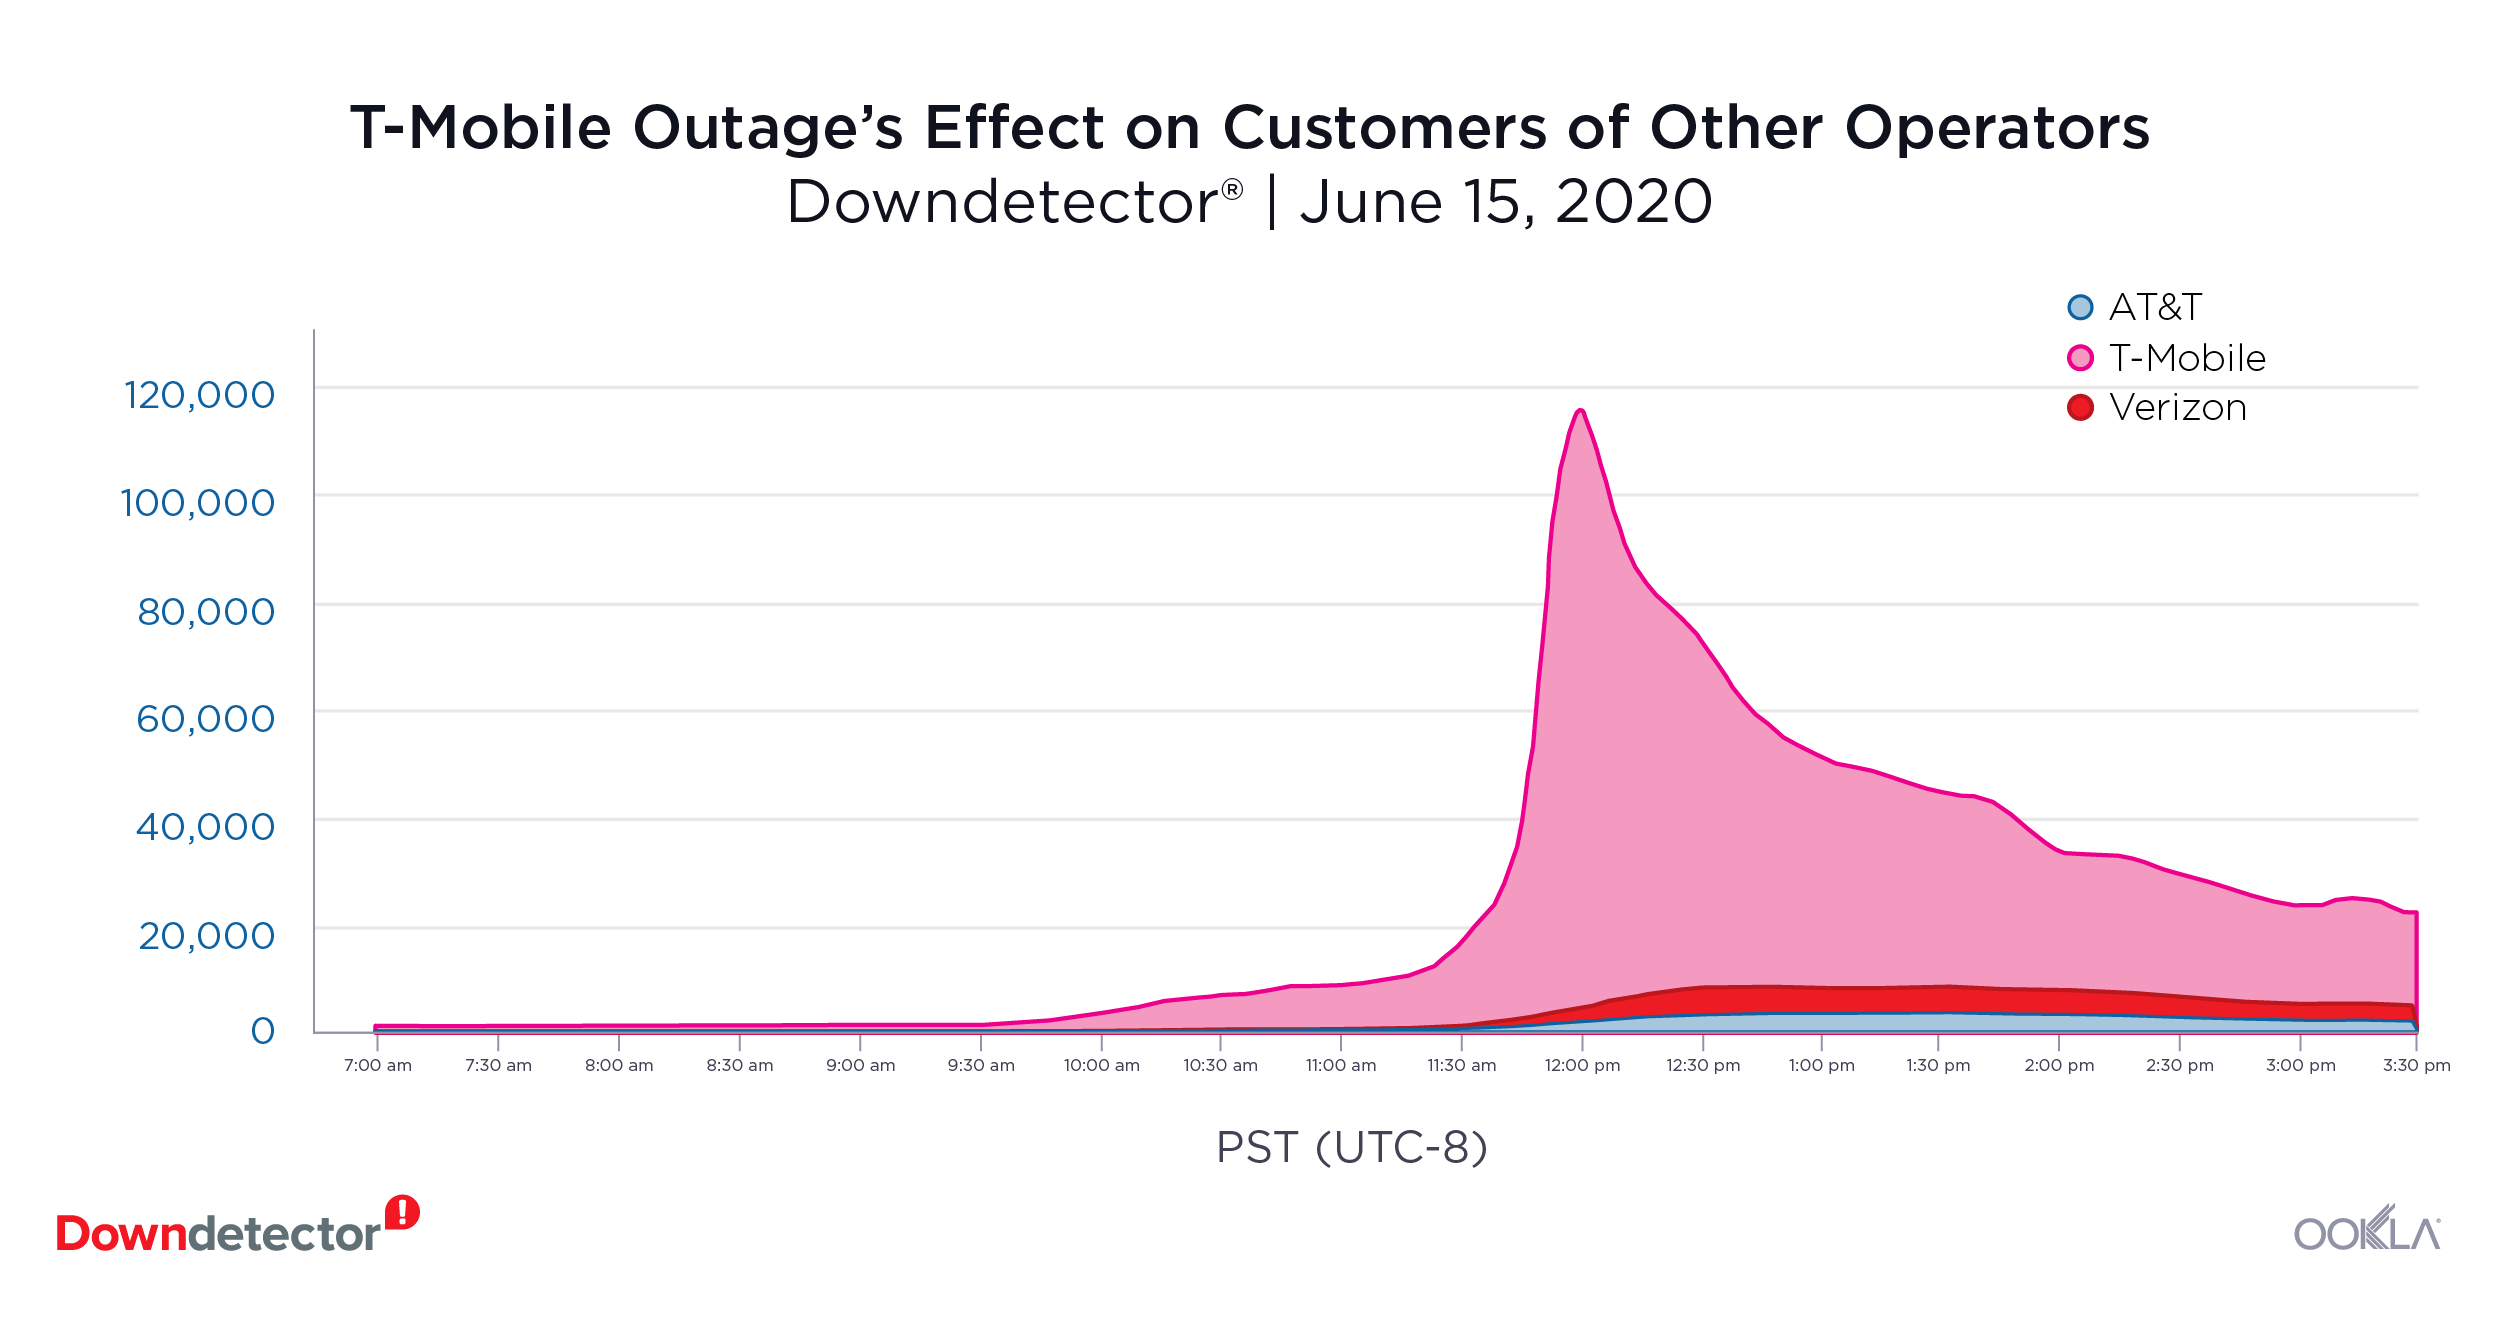
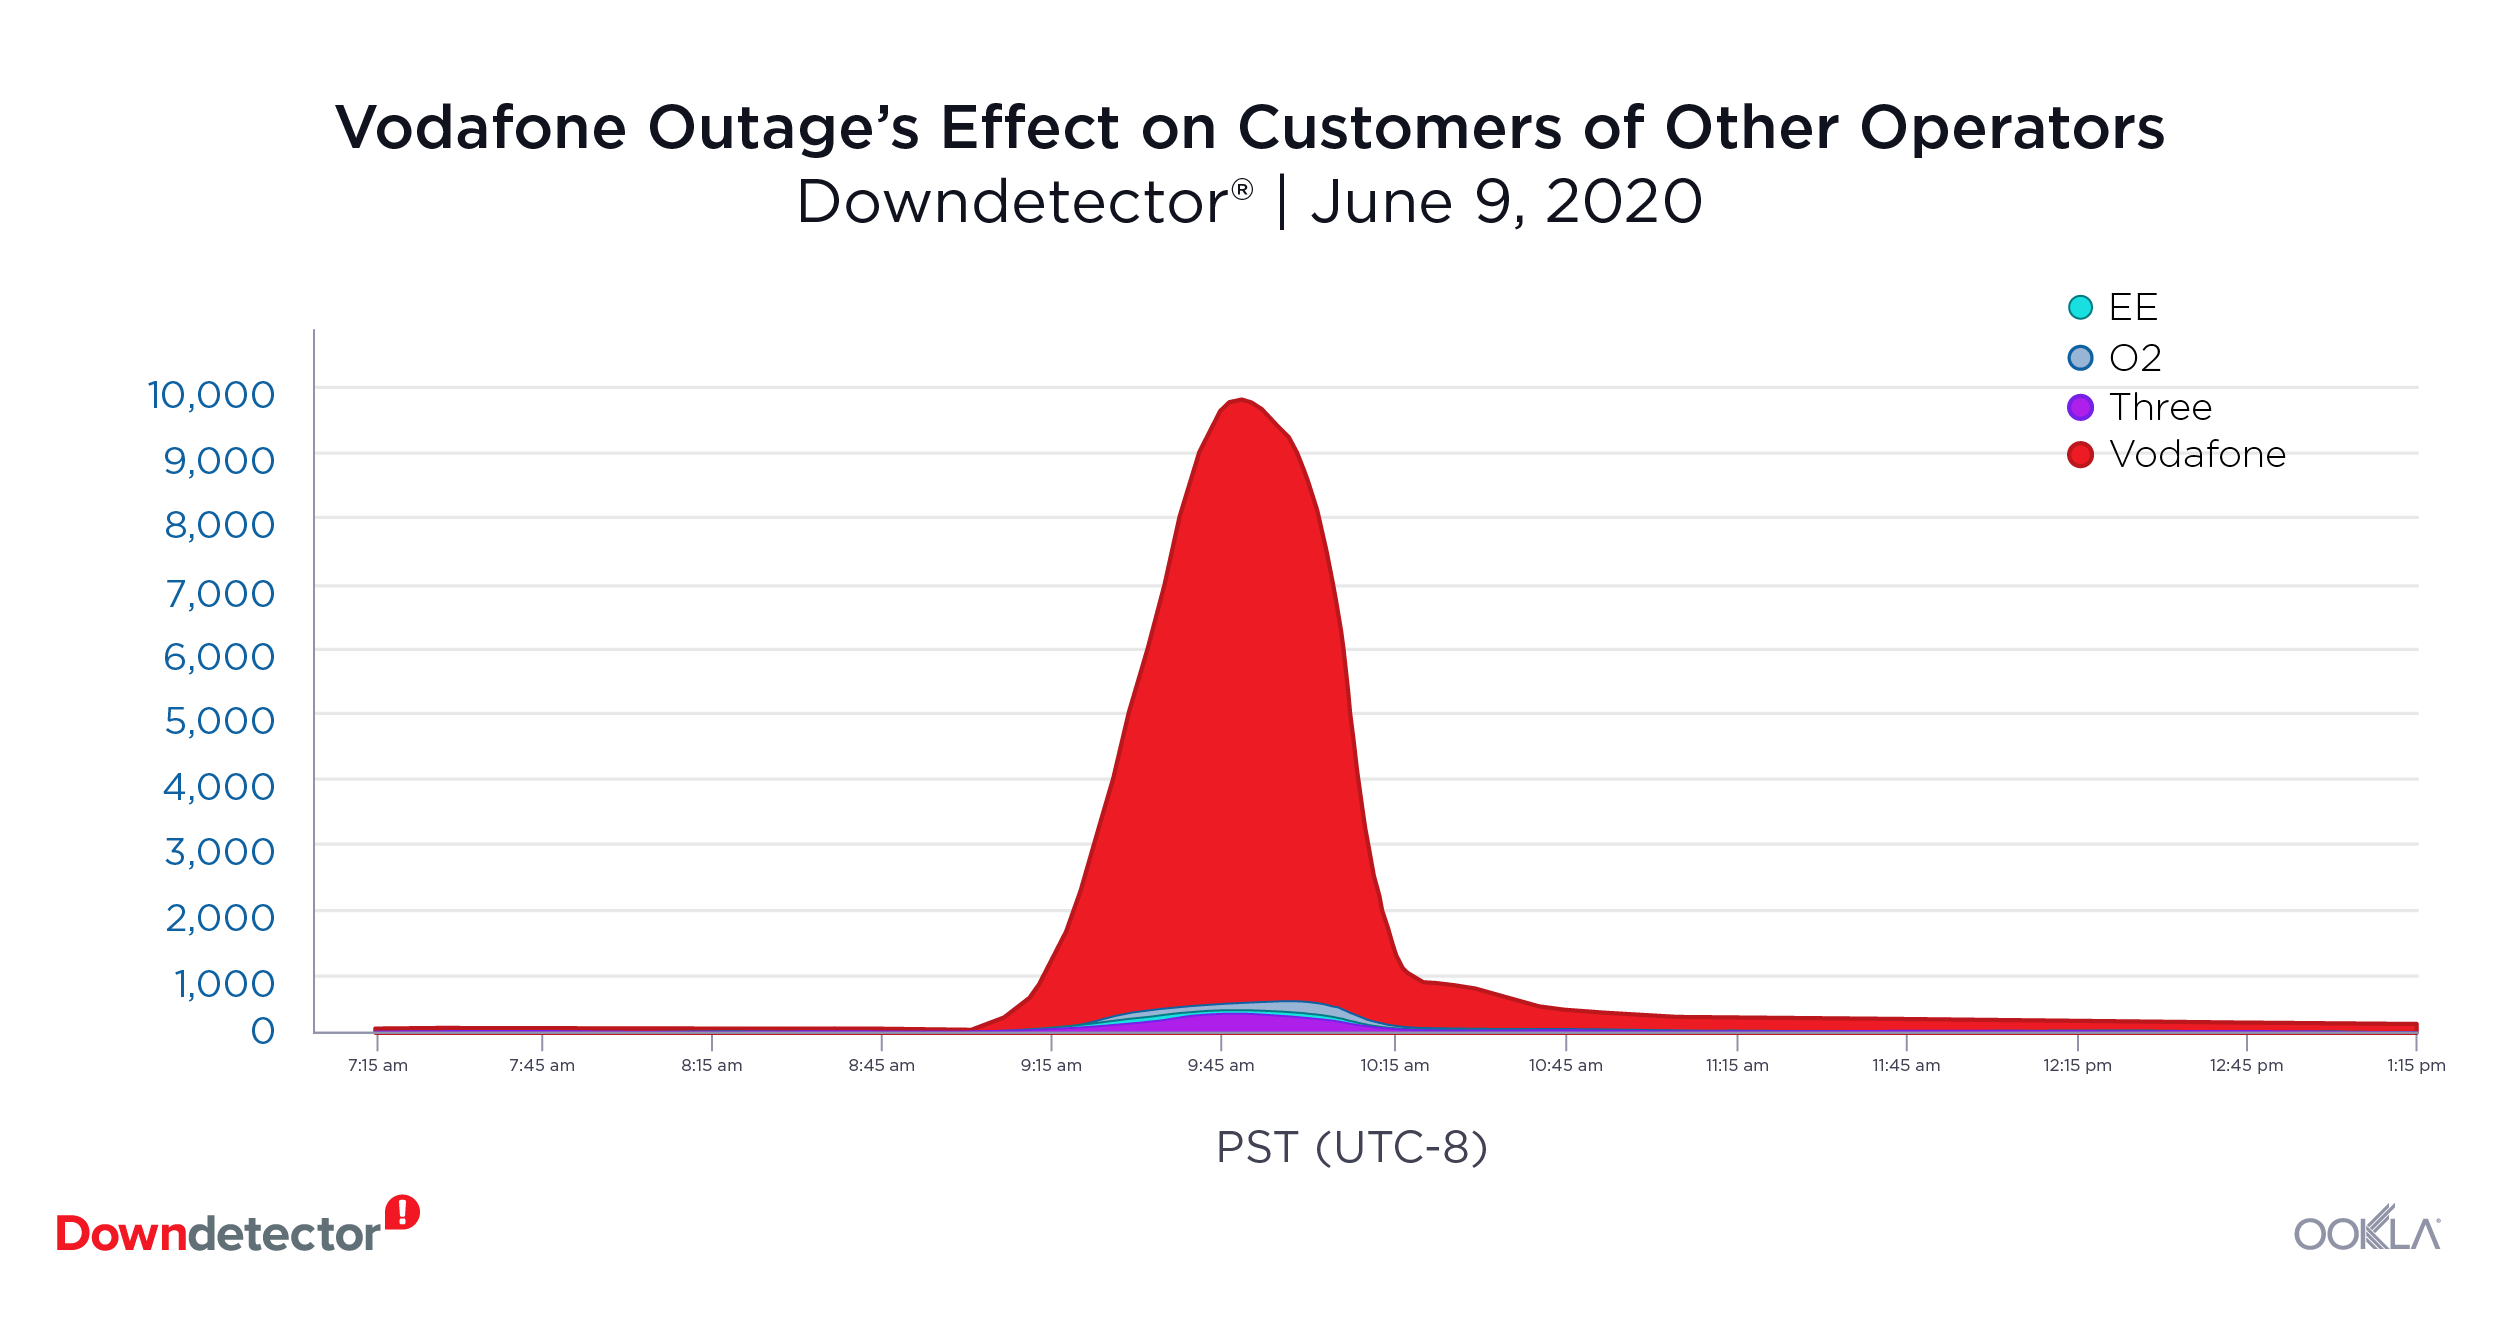
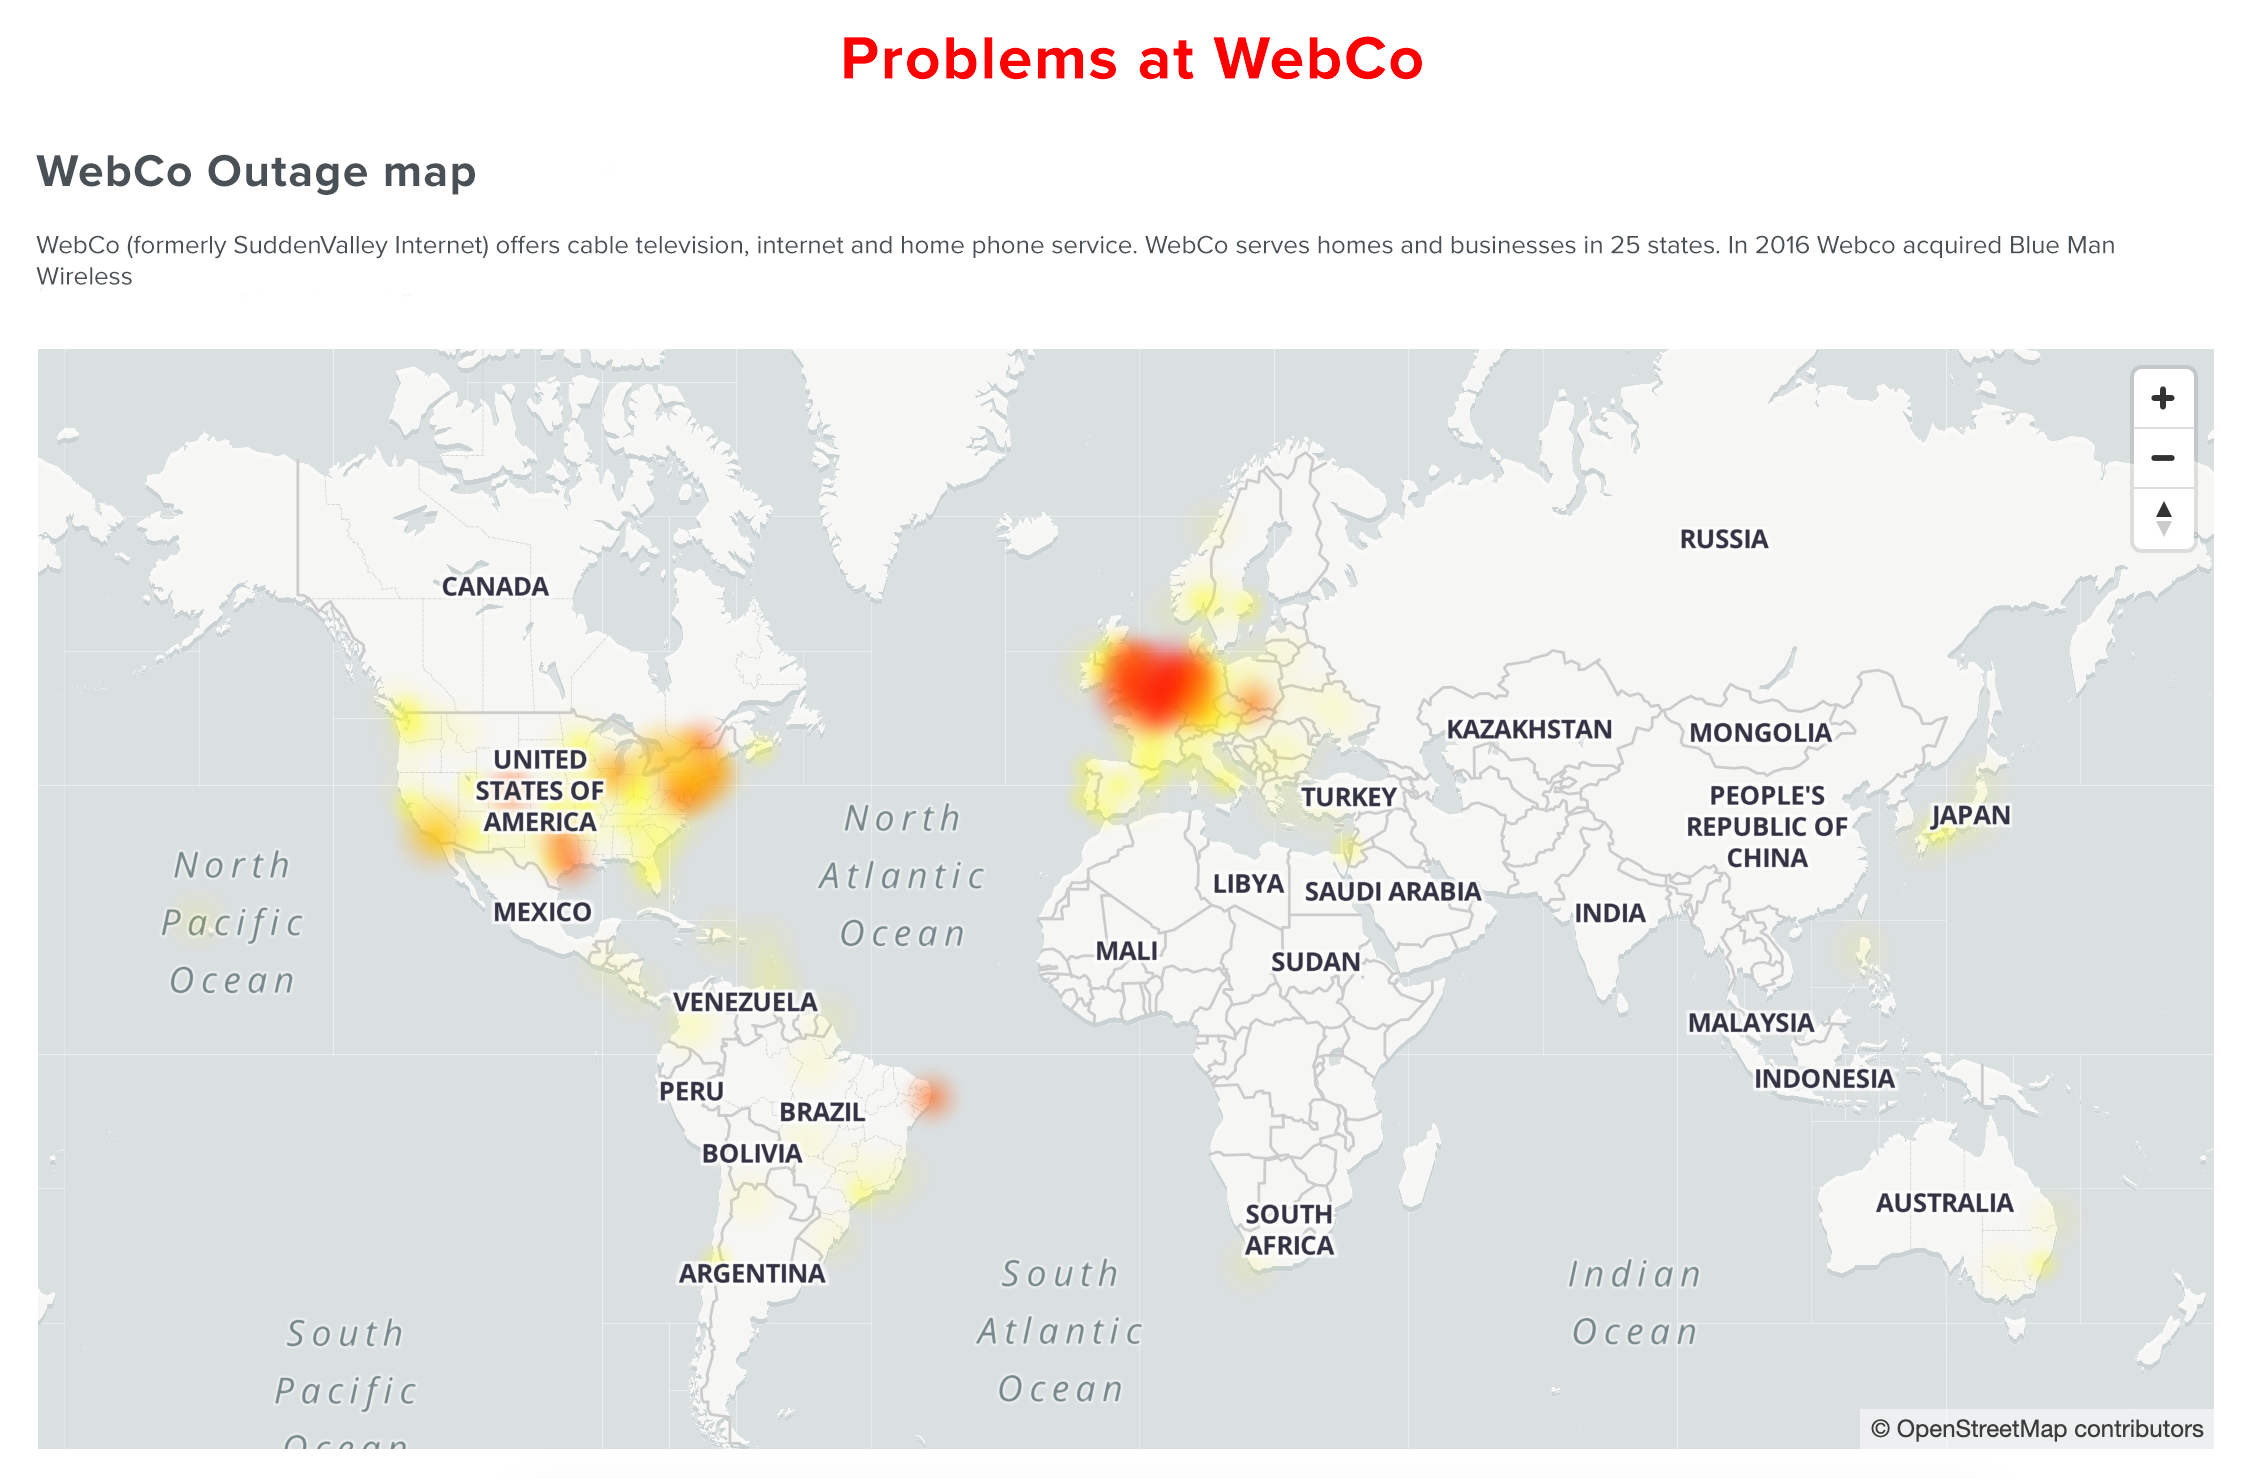
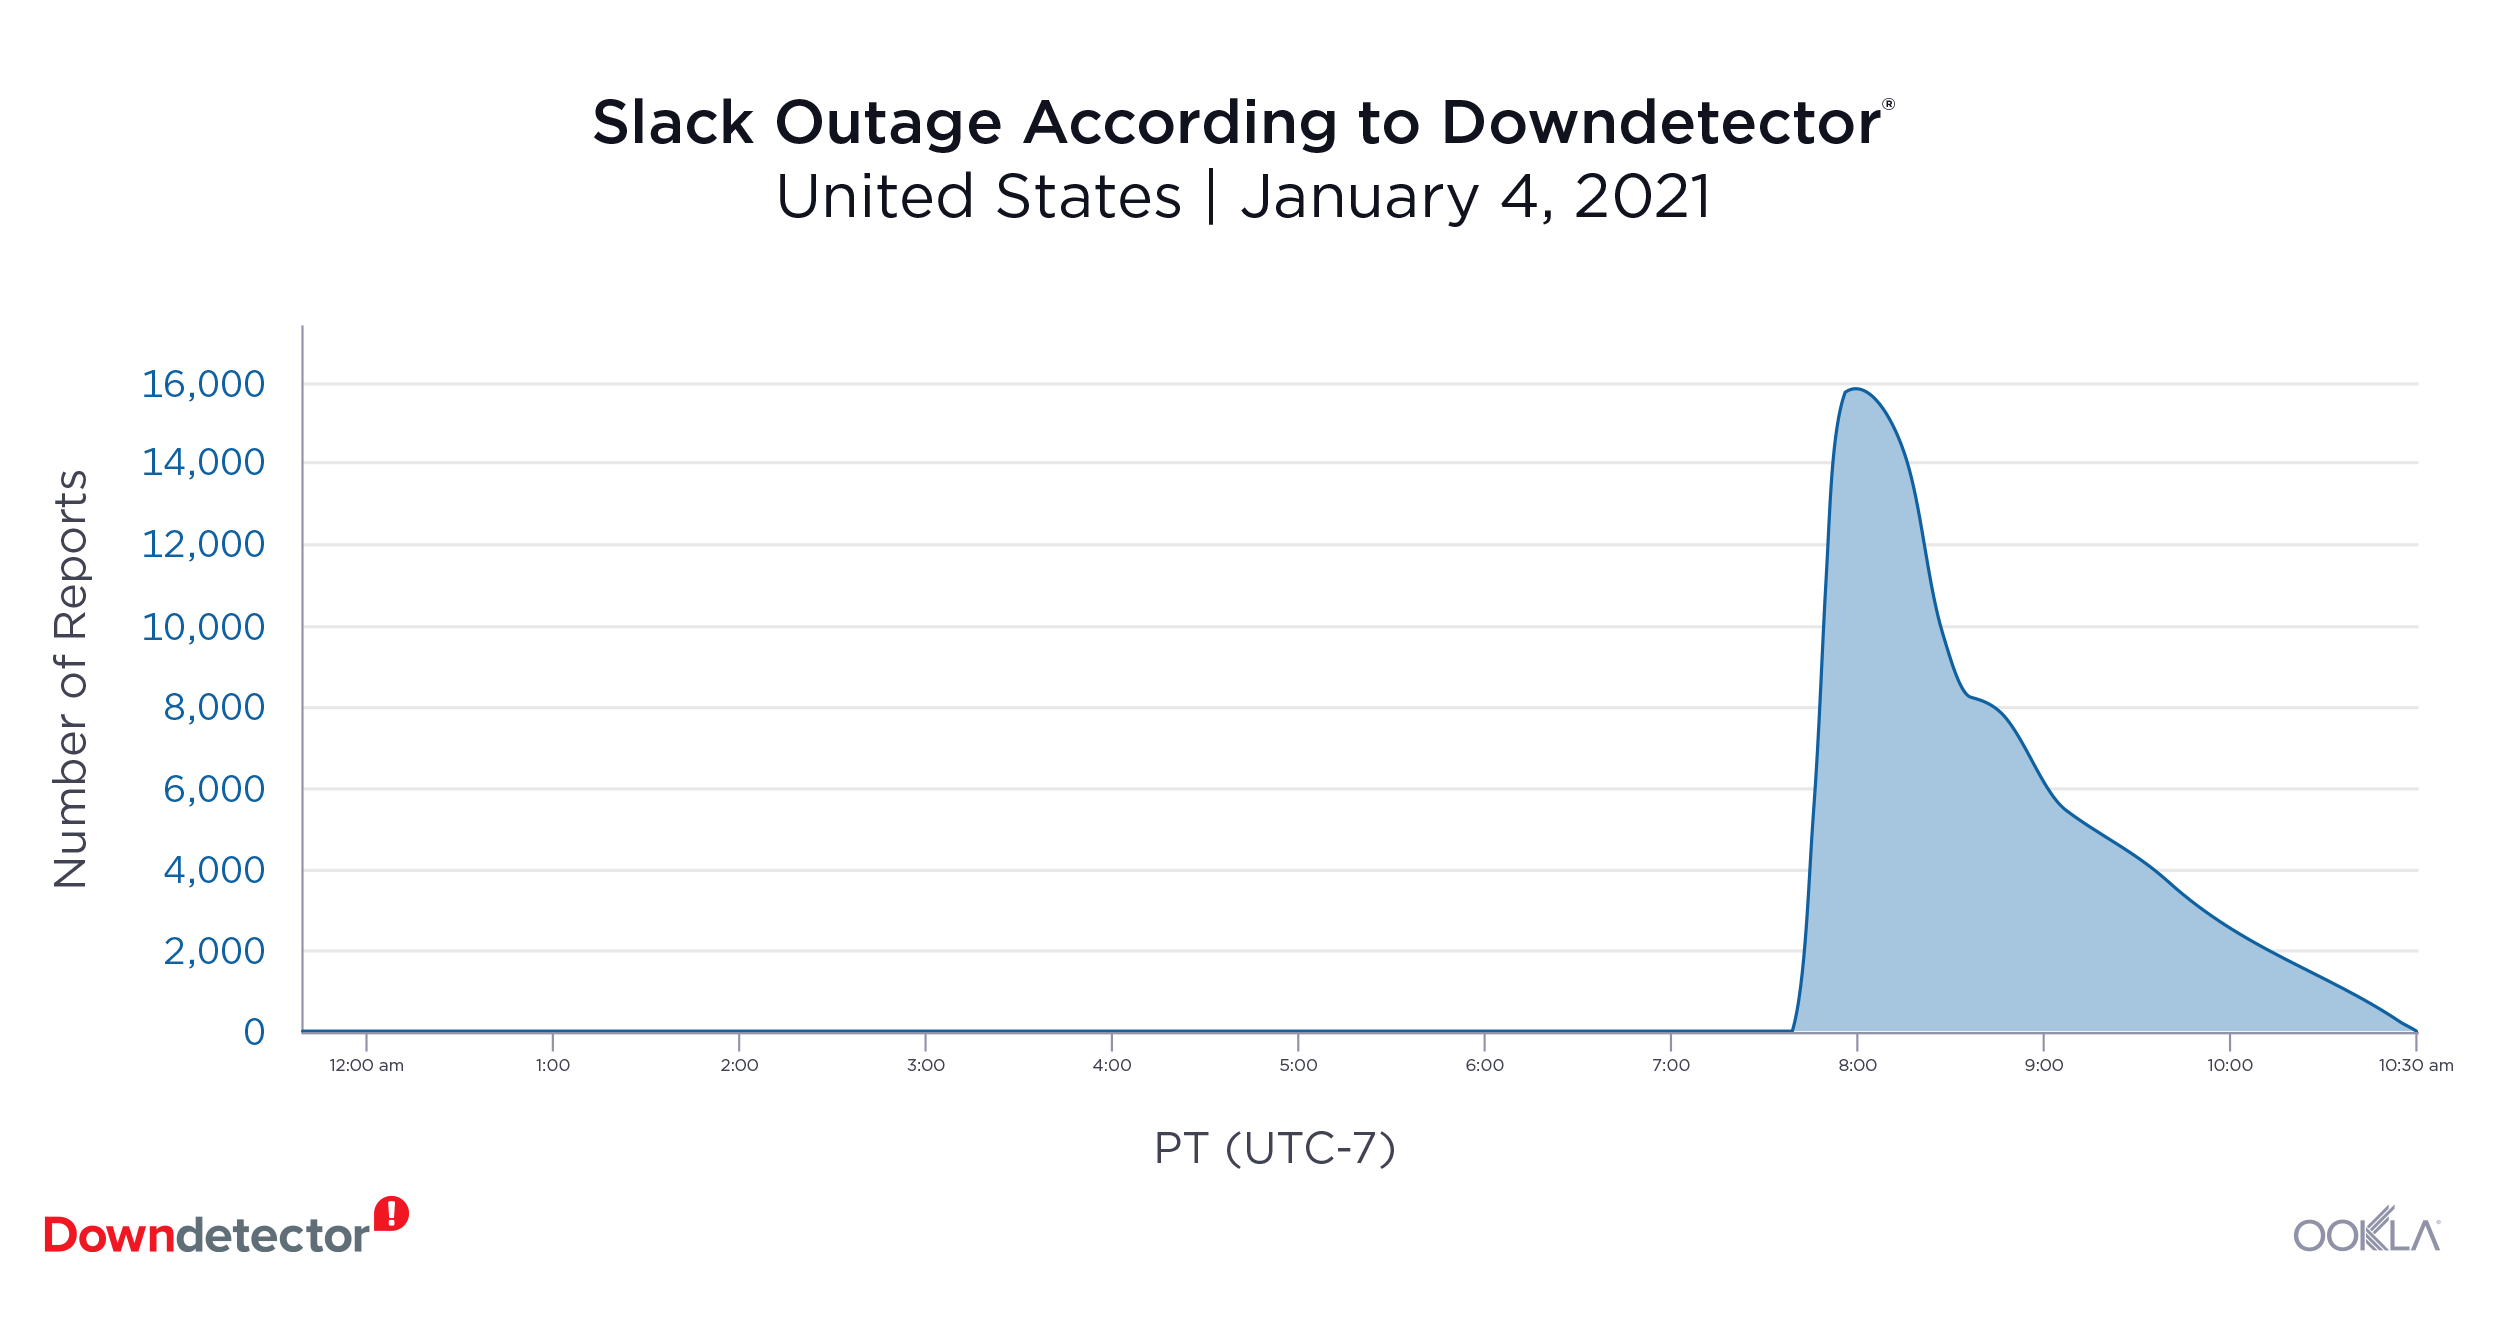
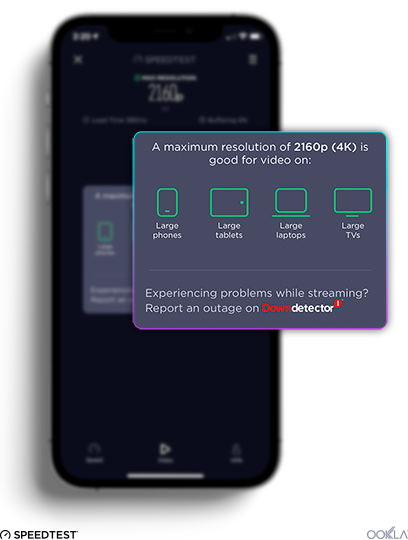
Is the service even working?

Like taking a deep breath, make sure to check Downdetector before assuming that your personal setup has failed if a class blinks out. Many online services will be tested in ways never before considered as everyone heads back to school, and outages will likely happen. Possible points of failure include the video conference software and your internet service provider, so use the Downdetector homepage (on your phone if needed) to check what’s down — before you start turning everything off and on again.

Check Downdetector before you assume the error is on your end.

dd-screen-2

This year will be an adjustment as much as an adventure. We hope these tips can help you make the most of your virtual learning experience. For additional help with your remote setup, read this article.

Ookla retains ownership of this article including all of the intellectual property rights, data, content graphs and analysis. This article may not be quoted, reproduced, distributed or published for any commercial purpose without prior consent. Members of the press and others using the findings in this article for non-commercial purposes are welcome to publicly share and link to report information with attribution to Ookla.

| October 27, 2020

How Downdetector Works

When a webpage isn’t loading or you’re having problems logging into your favorite service, you can turn to Downdetector® to see what’s happening. The world’s most popular source for user-generated status information, Downdetector tracks over 6,000 services across 45 countries. Each Downdetector company status page displays details about where other people have reported issues with a service. It also displays tweets and comments from a community of other users trying to troubleshoot the problem. Often, Downdetector users are aware of potential problems long before the service provider itself has reported an issue. In other cases, users may believe they’re experiencing an issue with an application, only to discover the source of the issue is actually with their internet service provider.

How Downdetector collects reports about a problem

Problem-messaging-1

In addition to problem reports submitted directly on Downdetector status pages, a site or service’s status information is gathered from user interactions with a variety of sources across the web, including search engines like Google and social media platforms like Twitter. This provides a holistic view of a perceived service interruption.

The most telling way users report a problem with an online service is through the service’s status page on Downdetector’s website. By clicking the “I have a problem with [Service]” button, a user can easily report an issue, plus indicate what type of problem they are experiencing from a list of common issues.

Downdetector also gathers data about the status of a service through Twitter. Each monitored company is configured with a list of inclusion words that are used to identify tweets that may be relevant to the status of that company’s online service. A tweet is scored on the basis of relevance to the monitored company and the sentiment of the content to determine whether it should be counted as a problem report.

Downdetector also looks at other key indicators from across the web to determine if an extraordinary volume of users is having issues with a monitored company or service.

How Downdetector attributes outage reports to a location

outage-map

Downdetector users can quickly see if other users in their area are experiencing an issue with a service — or if the potential problem is more widespread. When a user submits a problem report on Downdetector, the report is attributed to the location and country. In the case that a user in one country submits a report on the Downdetector site for another country, the system determines whether or not that service is monitored on the site associated with the user’s geolocated country. If it is, the problem report is attributed to the service for the user’s actual location. If the service is not monitored in that country, the information is collected and stored but not attributed as a report against the service for the other location.

Final criteria for an outage determination

Downdetector applies a rigorous data methodology to determine whether a sufficient volume of users is experiencing an issue and then assigns a status based on these problem indicators. A handful of isolated problem reports is not a likely indicator of an outage or other service issue. Downdetector only reports an issue if a significant number of users are impacted. To that end, Downdetector calculates a baseline volume of typical problem reports for each service monitored, based on the average number of reports for that given time of day over the last year. Downdetector’s incident detection system compares the current number of problem reports to this baseline and only reports an issue if the current volume significantly exceeds the typical volume of reports.

It is common for users to want to generate multiple reports when they are experiencing problems, especially over an extended service interruption. To prevent a single user from skewing incident detection evaluations, Downdetector only accepts a user’s first report for a specific company each day.

Service interruptions are frustrating and inconvenient. Downdetector provides a convenient way for users to check on a service’s status and see if they’re experiencing a widespread issue and see what the community is saying about a service. For companies, Downdetector’s user-generated data offers a holistic view of what users are reporting and determines the root cause of user-perceived outages. To get real-time information on your favorite services, visit your country’s Downdetector website or follow Downdetector on Twitter or Facebook.

Ookla retains ownership of this article including all of the intellectual property rights, data, content graphs and analysis. This article may not be quoted, reproduced, distributed or published for any commercial purpose without prior consent. Members of the press and others using the findings in this article for non-commercial purposes are welcome to publicly share and link to report information with attribution to Ookla.

| January 4, 2021

Slack Starts the New Year Late


2021 started with a sigh today as workers across the globe rushed back to their desks only to find that Slack was down. Users flocked to Downdetector® to report problems with Slack across the globe just after 7:00 a.m. Pacific. Issues were reported in Asia (Japan), Australia, Europe (Finland, France, Germany, Italy, the Netherlands, Poland, Russia, Spain, Sweden and the United Kingdom), North America (United States and Canada) and South America (Brazil). The most frequently reported issue was the inability to connect at all and the majority of reports came from the U.S.

Downdetector_Slack_Outage_1020

Although the spike has passed and the outage seems to be resolving itself, the service is not fully operational yet. Now might be a good time to take a breath and catch up on all that post-holiday email. The little red notification will be back on your desktop soon enough.

Downdetector data can help your team resolve service issues faster and improve customer experience when an outage occurs, which becomes all the more important during periods of high usage. Contact us here to learn how your network operations center can get faster outage detection.

Ookla retains ownership of this article including all of the intellectual property rights, data, content graphs and analysis. This article may not be quoted, reproduced, distributed or published for any commercial purpose without prior consent. Members of the press and others using the findings in this article for non-commercial purposes are welcome to publicly share and link to report information with attribution to Ookla.

| January 12, 2021

2020 Recap: How the Internet Held Up During a Global Pandemic


There was major concern last year that the internet might fail under the pressure of increased use as COVID-19 drove unparalleled waves of remote work and schooling. We watched internet performance carefully using data from Speedtest Intelligence® as conditions changed in different areas of the world. Now we’re back to assess what happened during the year as a whole.

A note on the methodology: 5G launches drove up mean internet speeds on mobile in many countries. For this reason we’ve simplified our view to include only median speeds, which are less subject to being skewed by especially fast 5G tests.

Mobile speeds dipped in many G20 countries in the spring of 2020

Mobile-Broadband-Speeds-in-G20-Countries_0121

Median download speeds over mobile in many G20 countries dropped at some point during 2020. Countries that saw month-to-month declines during the spring include: Australia, Canada, France, India, Italy, Saudi Arabia, South Korea, Spain and Turkey. China saw a decline in mobile speed in February while Japan suffered a drop in June and July. Argentina, Brazil, Indonesia, Russia and the United Kingdom showed only very minor decreases, while speeds in Germany, Mexico, South Africa and the United States remained unchanged or increased.

Despite the drops, almost all G20 countries saw higher median download speeds over mobile in December 2020 than they had in January 2020. Median download speed over mobile increased 76.3% in China during that time. Germany saw a 62.8% increase, the United States 56.9%, South Korea 55.5% and Saudi Arabia 48%. Turkey saw a 0.7% decrease in median download speed over mobile during the same period.

Despite interim dips, fixed broadband improved in all G20 countries during 2020

Fixed-Broadband-Speeds-in-G20-Countries_0121

There were notable dips in median download speeds over fixed broadband in many countries during the spring of 2020. G20 countries that saw these declines on a monthly basis include: Argentina, Canada, France, India, Indonesia, Italy, Japan, South Korea, Spain, Turkey and the United States. Brazil, China, Germany and Russia notably showed only increases in month-to-month median download speed over fixed broadband during this time. Other countries showed only very minor decreases.

Perhaps most important, all G20 countries saw higher median download speeds over fixed broadband in December 2020 than they had in January 2020. Median download speed over fixed broadband increased 51.9% in Brazil during that time. France saw a 48.3% increase, Japan 46.5%, Saudi Arabia 43.7% and South Africa 40%. South Korea saw the smallest increase in median download speed over fixed broadband over the same period at 8.1%.

We are impressed, on the whole, with how well the internet held up to the massive scale of increased use during the past year. Of course, month-by-month, country-level views are averages that might not reveal problems with specific mobile operators or internet service providers on individual days. If you want to assess how your internet connection is performing right now, take a Speedtest®. And if you are unable to connect to a specific service on the internet, check Downdetector® to see the status of that service.

Ookla retains ownership of this article including all of the intellectual property rights, data, content graphs and analysis. This article may not be quoted, reproduced, distributed or published for any commercial purpose without prior consent. Members of the press and others using the findings in this article for non-commercial purposes are welcome to publicly share and link to report information with attribution to Ookla.

| February 8, 2021

Introducing Video Testing from Speedtest


Video. Can you imagine the internet without it? Truth is that most of us spend much of our online time consuming video of one sort or another. Given how much time we all spend streaming video, the ability to directly measure video experience is an important tool for network management. We’re excited to announce that Ookla® Speedtest® has a new video test that can help you measure the quality of your streaming experience before you queue up your next video. Video testing is free and currently available on Speedtest for iOS with more platforms coming soon.


Why you need a dedicated video test

Speedtest has been measuring overall network bandwidth to provide reliable internet performance data for over a decade. While network speed certainly impacts your video experience, providers around the world sometimes limit the resolution or prioritize video traffic differently than other traffic. This means that video can perform very differently than the rest of the things you do online, no matter how fast the download speed of your network.

Enter video testing from Speedtest, which plays an actual video to specifically measure the performance of video streaming on your network at any time. An accurate video measurement requires an actual video to be played, because video traffic cannot be simulated across a network.

Get actionable results

Streamed video content is typically delivered via adaptive bitrate technology, which adjusts the quality of the video stream based on network conditions. A video test measures this adaptive bitrate to tell you the maximum resolution, load time and buffer you should be able to expect given current network conditions. It’s a great way to assess whether now is a good time to settle in for that video you’ve been waiting for or if you’ll be stuck buffering for the duration.

A video test will also tell you which devices work best at that performance level. This can help you decide whether to try to stream on your largest TV or if you should use your phone instead.


If the video test determines your network cannot successfully stream the maximum resolution supported by your device, you most likely have a network problem. Taking a Speedtest will let you know whether you’re getting lower than expected network bandwidth needed to stream your video. If your video test results reveal that you are frequently not able to stream well, you can use your video test history to advocate for yourself when talking to your provider.

Where to find video testing in the Speedtest iOS app

Video testing is already part of the Speedtest app on iOS and will be available on more platforms coming soon. The test is conveniently accessed from a tab at the bottom of the app. Just tap the video icon in the menu bar at the bottom of the app to get started.


Along with the new video test, we’ve also moved some other things around in the Speedtest app to provide a better organized user experience.

  • Network and device information, server selection, and Speedtest settings preferences are available in the sliding drawer at the bottom of the speed tab.


  • Your results history (including video test results), app settings, privacy policy and terms of use, and support resources are available in the hamburger menu in the upper corner of the app.


Try video testing on Speedtest for iOS today by opening the Speedtest app on your phone (or downloading it from the Apple App Store if you don’t already have it).


If the video test finds that the video streaming quality meets or exceeds the resolution supported by your device and you are still unable to stream your video, you will have the option to continue on to Ookla’s Downdetector® to see what online services are currently experiencing any issues.

Ookla retains ownership of this article including all of the intellectual property rights, data, content graphs and analysis. This article may not be quoted, reproduced, distributed or published for any commercial purpose without prior consent. Members of the press and others using the findings in this article for non-commercial purposes are welcome to publicly share and link to report information with attribution to Ookla.

| February 11, 2021

Emerging 5G Market Keeps Canada in the Global Top 10 for Mobile Speeds


5G may still feel like an emerging technology in Canada as it’s less than a year old and is only available in limited cities. However, operators are actively working to expand coverage, and the country’s 5G speeds are already impressive. This article explores how much of an improvement 5G represents over 4G, which provinces and cities are seeing the most benefit and how individual operators are performing over 5G.

5G is 205% faster than 4G in Canada

Comparing Median 5G and 4G Performance in Canada
Speedtest Intelligence® | Q4 2020
5G Download (Mbps) 4G Download (Mbps) % Change
Canada 169.46 55.50 205.3%

Mobile speeds in Canada are strong, with the country consistently ranking in the top ten globally for mobile download speed over the past year according to the Speedtest Global Index™. 5G can only improve overall mobile speeds in Canada, and data from Speedtest Intelligence® reveals Canada’s median download speed over 5G was 205.3% faster than that over 4G during Q4 2020.

Bell was the fastest operator for 5G in Canada

5G-performance_canada_operator_0221_en

As reported in our Canada Market Analysis, Bell was the fastest operator for 5G in Canada in Q4 2020 with a median download speed of 228.99 Mbps. TELUS was a close second and Rogers third.

Rogers had the highest time spent on 5G in Canada

5G-time-spent_canada_operator_0221

We calculated the proportion of time that users with 5G-capable devices spent on 5G in Canada and found that Rogers had the highest 5G Time Spent during Q4 2020 at 27.0%. TELUS had the second highest 5G Time Spent in Canada at 21.0% and Bell was third at 12.7%. Time Spent includes time spent on both 5G and 5G roaming.

Over the past several months Canadian operators have continued to expand their 5G footprints, bringing 5G network capabilities to users across many new cities and towns. All major operators have now launched non-standalone 5G deployments leveraging FDD FR1 spectrum assets across low, mid and high bands.

Equipped with 2.5 GHz spectrum to spare, Rogers launched a 5G network in various cities a year ago, now reaching over 160 communities across Canada. With the addition of newly acquired 600 MHz licenses, the operator is looking to deliver even broader coverage and capacity. Recently, Rogers announced the rollout of their standalone 5G core network, which will eventually allow the operator to deliver even more benefits of this technology to users, including ultra low latency and network slicing.

TELUS and Bell utilized AWS-3 spectrum allocation for their initial 5G launch back in June. The operators have been working in close partnership with Ericsson and Nokia to improve network efficiency and user experience.

Canada’s upcoming spectrum auction will unlock a significant amount of bandwidth in the 3.5 GHz range, which should deliver on the promise of greater speeds. It’s worth noting that the current generation of flagship devices powered by Qualcomm Snapdragon X60 5G Modem-RF System are capable of FDD+TDD 5G aggregation, which streamlines the process of adding the soon to be available 3.5 GHz channels on top of the existent FDD 5G coverage layer. This should provide a stepping stone to standalone 5G, and much greater capacity across the 5G footprint.

British Columbia has the most cities with 5G deployments

Ookla_Canada_5G_Deployment_Map_0221-1

According to the Ookla 5G MapTM, which shows the location of 5G deployments across the globe, British Columbia showed the largest number of cities with commercially available 5G deployments in Canada, as of February 2, 2021. Ontario was second and Alberta third (we included Lloydminster in Alberta’s count).

Québec and Alberta had the fastest 5G download speed

5G-performance_canada_province_0221_en

Data from Speedtest Intelligence reveals Québec and Alberta had the fastest median download speeds over 5G during Q4 2020 among Canadian provinces with sufficient 5G samples. The confidence intervals in the chart show that most provinces have comparable 5G performance.

Alberta showed the highest time spent on 5G

5G-time-spent_canada_province_0221

Alberta had the highest percentage of 5G Time Spent among Canadian provinces with sufficient samples during Q4 2020. Users with 5G-capable devices in British Columbia spent the second highest proportion of time on 5G in Canada at 19.0%, and Ontario showed the third highest 5G Time Spent. Québec had the lowest 5G Time Spent on this list during Q4 2020.

Montréal had the fastest 5G download speed

5G-performance_canada_municipalities_0221

Analysis of median 5G download speed in Canada’s largest municipalities found that Montréal was the fastest during Q4 2020. Calgary, Edmonton and Ottawa formed the group of next fastest cities, followed by Greater Toronto and Greater Vancouver. The confidence intervals in the above chart indicates that the performance among these two groups of cities was too close to definitively rank them.

We’ll be very excited to see how Canada expands on this performance, given the country’s already impressive speeds and expanding 5G footprint. Inquire about Speedtest Intelligence for detailed information about city-level performance by provider or take a Speedtest to see how your network compares.

Ookla retains ownership of this article including all of the intellectual property rights, data, content graphs and analysis. This article may not be quoted, reproduced, distributed or published for any commercial purpose without prior consent. Members of the press and others using the findings in this article for non-commercial purposes are welcome to publicly share and link to report information with attribution to Ookla.