Climate change is placing new demands on operators and regulators to harden telecoms infrastructure against severe weather events
Storm Darragh caused widespread mobile network outages across Ireland in recent days, impacting all operators. The storm resulted in the most extensive damage to the country’s electricity infrastructure in a decade, leaving nearly 400,000 premises without power at its peak.
This led to significant disruptions to mobile site uptime, prompting the swift deployment of mobile generators across affected areas and a seismic shift in mobile network usage patterns, with increased demand in locations where power cuts or other disruptions rendered fixed broadband unusable.
Mobile networks came under strain during Storm Darragh, pulling down performance nationwide
Analysis of Speedtest Intelligence® data reveals the substantial impact of the storm on mobile network performance in Ireland. A marked and sustained decline in download and upload speeds, as well as increased latency and jitter, was observed across all operators nationally. The deterioration escalated rapidly on Friday night (6th December) as the storm made landfall, peaking on Saturday (7th December) and is only slowly returning to the pre-storm performance baseline as power outages persist through this week in the worst-affected areas.
Consistency Deteriorated Across All Mobile Operators in Ireland During Storm Darragh
Speedtest Intelligence® | December 2024
Median download speeds on Saturday were nearly 70% lower than the 7-day average preceding the storm across all operators and technologies, while median latency increased by nearly 17%. Consistency—a measure of the percentage of an operator’s samples meeting or exceeding minimum download and upload thresholds—dropped to some of its lowest one-day levels recorded in Ireland in recent years. Around 40% of all samples failed to meet the minimum thresholds across 4G (5 Mbps download, 1 Mbps upload) and 5G (25 Mbps download, 3 Mbps upload) on Saturday.
This performance analysis is based on the national picture, highlighting that the impact was significant enough to lower the overall country-wide performance profile. A closer examination of the worst-affected areas along the western seaboard revealed even more pronounced declines in performance outcomes in the aftermath of the storm.
Latency Performance Deteriorated Across All Mobile Operators in Ireland During Storm Darragh
Speedtest Intelligence® | December 2024
The volume of Speedtests initiated by Irish users increased significantly above typical levels over the weekend, serving as a proxy for the connectivity challenges. This surge also reflects the impact of a shift in usage patterns, with households resorting to tethering mobile connections when fixed broadband became unavailable and thereby increasing further the strain on a depleted mobile site grid.
Download Speed Performance Deteriorated Across All Operators in Ireland During Storm Darragh
Upload Speed Performance Deteriorated Across All Mobile Operators in Ireland During Storm Darragh
Speedtest Intelligence® | December 2024
10th Percentile Download Speed Performance is Recovering As Power Outages Recede and Network Load Normalises
Speedtest Intelligence® | December 2024
Battery backup is needed for future resilience but costs remain a barrier
Lead-acid and lithium-ion batteries are widely deployed across mobile sites in Ireland and other countries, providing short-term resilience in the event of power outages. The fact that only a small proportion of deployed backup batteries provide sufficient capacity to last for multiple hours means that operators rely heavily on stationary and mobile generators during prolonged power outages.
Ireland is no exception to this trend. The UK’s Ofcom reported recently that “around 20% of all mobile sites have some backup functionality at the RAN [in the UK] for more than 15 minutes, with around 5% of sites able to withstand a six-hour power loss (excluding battery backup for transmission traffic)”. It has consulted on revised ‘Resilience Guidance’ for the UK’s telecoms operators, published a call for input (CFI) on power backup for mobile networks and is now working with the government to determine if additional resilience measures are needed.
Mobile operators in Ireland and elsewhere proactively ensure that generators are refuelled in advance of adverse weather events like Storm Darragh and leverage strategic fuel dumps across the country to enable rapid refuelling where needed. The high upfront cost of battery backup and the high operating cost of generators, however, prohibits universal deployment in the current capital environment, with dedicated solutions needed for each operator, even at shared sites—necessitating targeted policy support and new solutions to improve network resilience as the frequency and severity of these weather events increases.
Network resilience lessons from around the world
The policy success of Nordic countries such as Norway and Finland, where local regulators NKOM and Traficom have intervened with legislative instruments to stipulate a minimum number of hours of continuity of mobile service post-power outage, demonstrates that there are viable solutions to harden mobile network infrastructure. Similar efforts have been observed in Australia, where the government subsidised a ‘Mobile Network Hardening’ programme to retrofit 467 cell sites with 12 hours power backup capability.
Ofcom’s aforementioned consultations have not yet led to the proposal of any specific measures relating to the provision of battery backup solutions in the UK. The regulator’s preliminary assessment of the feasibility of any such measures concluded that the exorbitant costs involved in providing a minimum of one hour of power resilience at every cell site in the country would not be proportionate to the potential economic benefit accrued—with cost projections in the region of £0.9-1.8 billion.
Nonetheless, Ofcom has expressed hope that the continued reduction in the cost of battery backup solutions will make interventions viable in the future. Progress in developing new business models to monetise battery backup solutions is also likely to improve their allure over time for operators, with new use cases emerging in grid frequency restoration.
Finland’s Elisa has been a global leader in this space through the success of its ‘Distributed Energy Storage’ solution, which provides energy to the grid at peak times and charges from the grid in off-peak times. The operator claims to have reduced the payback period of its mobile site battery installations to 3-5 years.
Ookla retains ownership of this article including all of the intellectual property rights, data, content graphs and analysis. This article may not be quoted, reproduced, distributed or published for any commercial purpose without prior consent. Members of the press and others using the findings in this article for non-commercial purposes are welcome to publicly share and link to report information with attribution to Ookla.
Vodafone’s entry into a saturated mobile telecom market in Oman in 2022 has significantly reshaped the competitive landscape long dominated by Ooredoo and Omantel. Within two years, Vodafone managed to capture 12% of the market in terms of subscribers. This article examines Vodafone’s network, service, and marketing strategies to assess how the operator attracted subscribers from incumbent operators and to what extent their network experience has changed since migrating.
Key Takeaways:
Vodafone Oman focused on offering 5G services and adopted an asset-light business model to compete with incumbent players. Vodafone differentiated itself through pricing, tariff plans, and extensive digital engagement to capture a significant share of the market. Vodafone leads the market with a median 4G download speed of 66.40 Mbps in Q3 2024, but it trails in 5G with a speed of 111.21 Mbps.
Vodafone has been the primary beneficiary of customer churn. Between September 2022 and June 2024, Vodafone’s Speedtest 4G and 5G user bases expanded by 12.2% and 36.0%, respectively. The majority of new users came from Omantel, indicating Vodafone’s appeal to this customer base.
Churners from Omanel and Ooredoo had mixed network experience after changing operators. Users who left Omantel experienced an improvement in their average download speeds for both 4G and 5G. However, churned 4G users from Ooredoo experienced a speed increase following the transition to a different network, while those on 5G saw their download speed decrease.
Vodafone Oman focused on offering 5G services and adopted an asset-light business model to compete with incumbent players
In March 2022, a local consortium, Oman Future Telecommunications (OFT), partnered with Vodafone to launch a new operator as part of a 15-year non-equity agreement offering 4G, 5G, and VoLTE services. Vodafone adopted an asset-light business model, facilitating services’ rapid deployment and minimizing capital expenditure. For example, it leased tower capacity from Oman Tower Company (OTC) for its 5G network and used Ooredoo’s network for 4G services. The company also leased fiber lines from wholesale infrastructure provider Oman Broadband (OB) to connect its sites.
Vodafone’s introductory packages significantly undercut its competitors. They featured 77GB of data, 777 local voice minutes, and 777 local SMS for RO9 (USD $23.3), valid for over 2 months and a half. The company then introduced the ‘Vodafone Red’ tariff plans, with bundles of domestic/international voice minutes, SMS, and data, lower per-GB rates, and dedicated allowances for social and streaming media services. It leveraged Vodafone’s extensive global network to offer appealing international roaming packages valid within the Gulf region and across Vodafone’s worldwide footprint.
Vodafone also prioritized digital channels to increase customer engagement. For example, it launched the My Vodafone App for service delivery and support to streamline the onboarding process, including using eSIMs. The company has also actively engaged with customers on social media, addressing concerns and running exclusive promotions while collaborating with local influencers to boost brand awareness.
In addition to its competitive pricing and digital-first approach, Vodafone invested in its network infrastructure. The company doubled the number of its 5G sites from 750 in 2021 to 1,500 in March 2023, resulting in a 120% increase in coverage and a 175% revenue jump. This expansion allowed Vodafone to capture 10% of the market share within two years of launch, aiming to reach 30% by 2032. This is a remarkable achievement considering the high-level mobile penetration (134% of the population in June 2024, according to the Telecommunication Regulatory Authority (TRA)) and the presence of 2 mobile network operators and two mobile virtual network operators (FRiENDi Mobile and Renna).
Vodafone Mobile Market Share
Source: TRA Oman | Q2 2022 – Q2 2024
Vodafone Mobile Market Share
Vodafone is leading in 4G but trailing in 5G median download speeds
According to Speedtest Intelligence® data, Vodafone has been leading the market in 4G download speed, reaching 66.40 Mbps in Q3 2024, 20% faster than the next fastest. This surpasses Omantel’s and Ooredoo’s peak speeds of 52.23 Mbps and 51.04 Mbps, respectively, which have been trending closely together. Vodafone has dominated 4G upload speeds, fluctuating around 15 Mbps, while Omantel and Ooredoo hovered around 11-12 Mbps.
4G Network Performance, by Operator, Oman
Source: Speedtest Intelligence® | Q2 2022 – Q3 2024
4G Network Performance, by Operator, Oman
The picture for 5G performance is more nuanced. Omantel’s download speed has risen since Q2 2022, peaking at 249.19 Mbps in Q4 2023 before a slight dip to 231.23 Mbps by Q3 2024. Ooredoo’s speed has steadily declined since Q2 2022 to a low of 111.56 Mbps in Q3 2023 before improving to reach 138.92 Mbps in Q3 2024. Vodafone’s 5G download speed began at a high of 160.73 Mbps in Q4 2022 but has trended downward since then, falling below Ooredoo to 111.21 Mbps in Q3 2024.
Vodafone initially led 5G upload speeds, peaking at 59.3 Mbps in Q3 2022. However, upload speeds dropped sharply as the customer base grew before stabilizing at 20.98 Mbps in Q3 2024. This could suggest a strategic decision to prioritize download speeds. Meanwhile, Omantel and Ooredoo have maintained lower, more stable upload speeds, generally below 20 Mbps.
5G Network Performance, by Operator, Oman
Source: Speedtest Intelligence® | Q2 2022 – Q3 2024
5G Network Performance, by Operator, Oman
Vodafone has been the primary beneficiary of customer churn
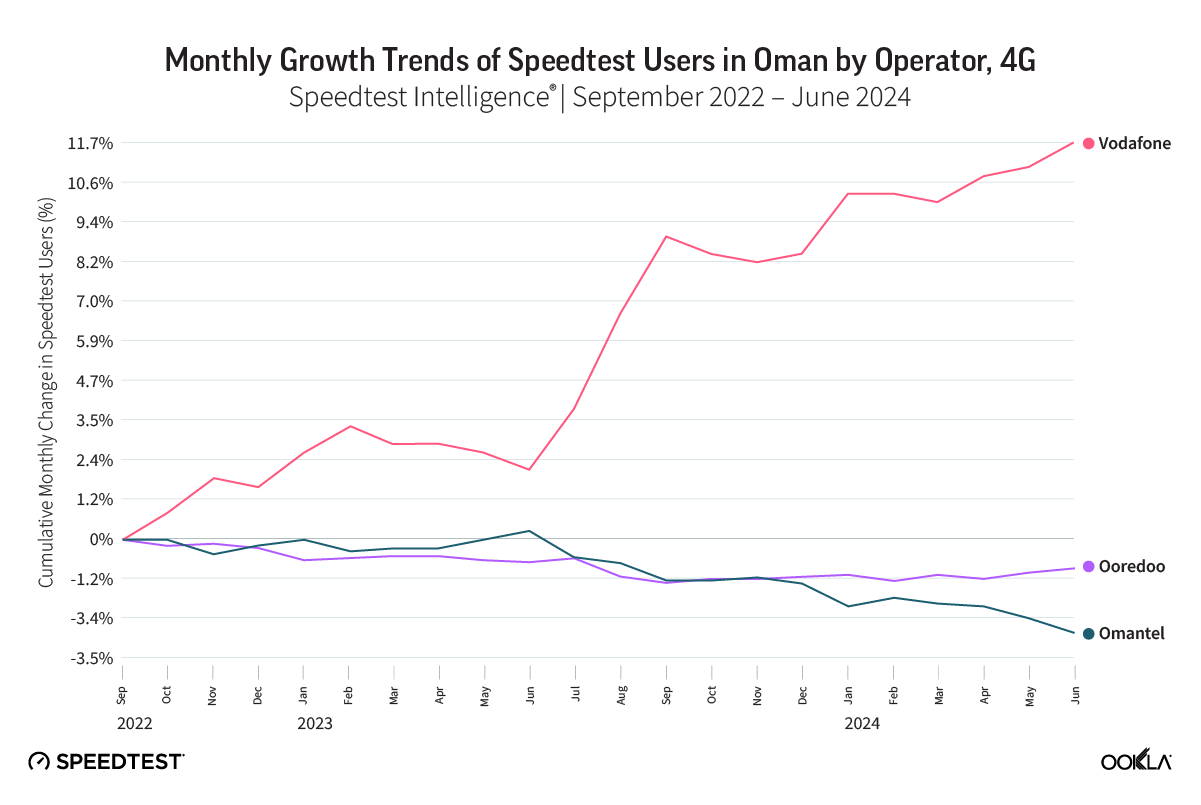
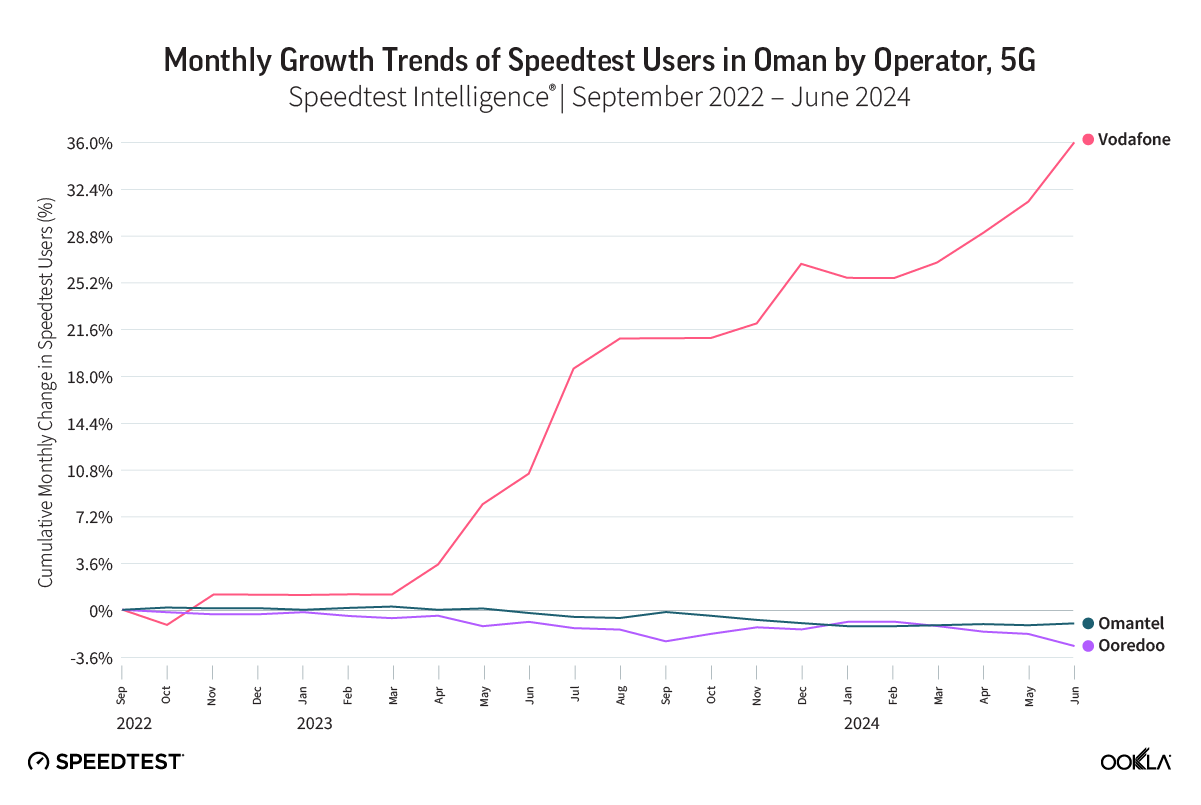
Speedtest Intelligence can help monitor changes in mobile subscriptions over time, enabling us to capture user preferences and market share shifts. The chart below shows the cumulative monthly percentage change in Speedtest users between September 2022 and June 2024. A positive trend indicates that a mobile operator acquired more users during that period, while a negative trend signifies that many customers were transferred to other operators. We use the cumulative monthly change in users as a proxy for subscriber churn.
Oman has a high level of mobile penetration, which means Vodafone’s growth potential in attracting subscribers from other operators. This is confirmed by our data as Vodafone stands out with an accelerated upward trend, indicating an increased shift of users from its competitors over time, and more so for 5G than 4G. Vodafone saw a 36% cumulative growth in 5G Speedtest users, while Omantel’s Speedtest user base decreased by just over 1%, and Ooredoo’s Speedtest base shrunk by 2.8%.
Vodafone also saw an acceleration in 4G customer acquisition, with its 4G Speedtest base expanding by 12.2%, while Ooredoo briefly gained users in June 2023 before eventually contracting by 2.9%. Omantel has consistently lost ground, decreasing by 0.9% by June 2024.
“>
“>
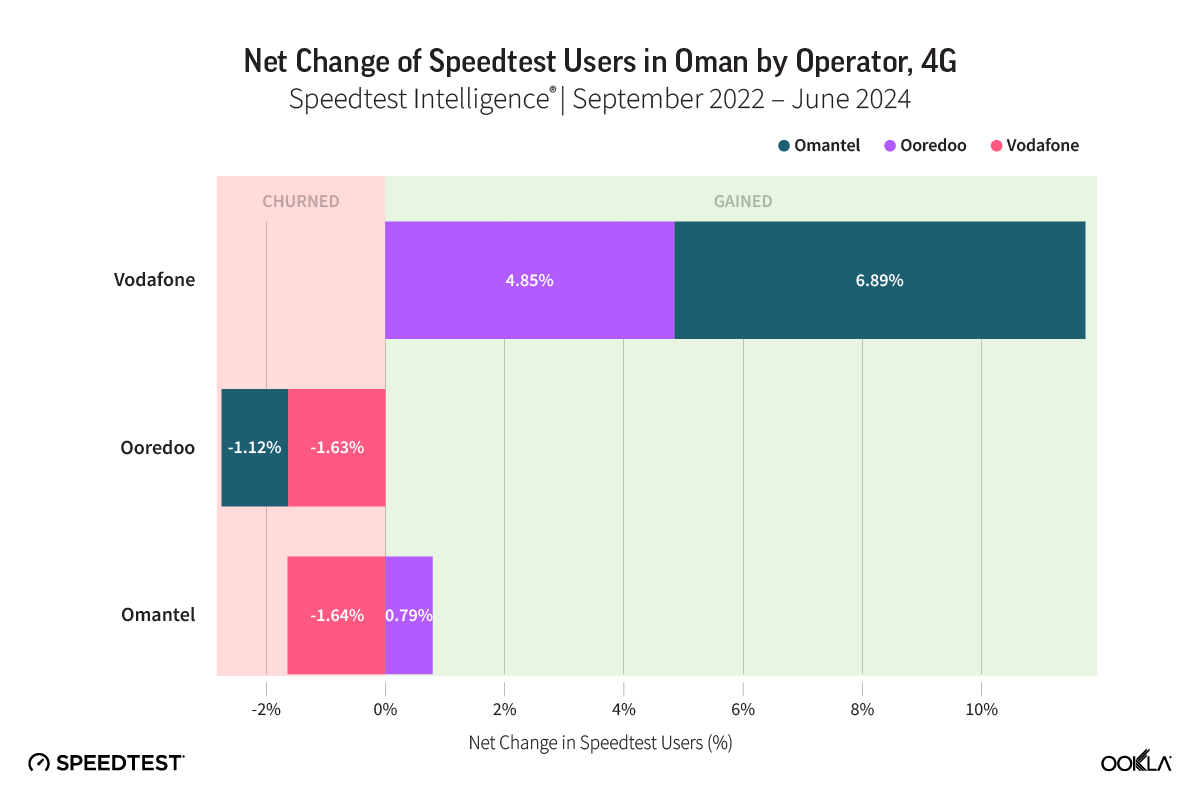
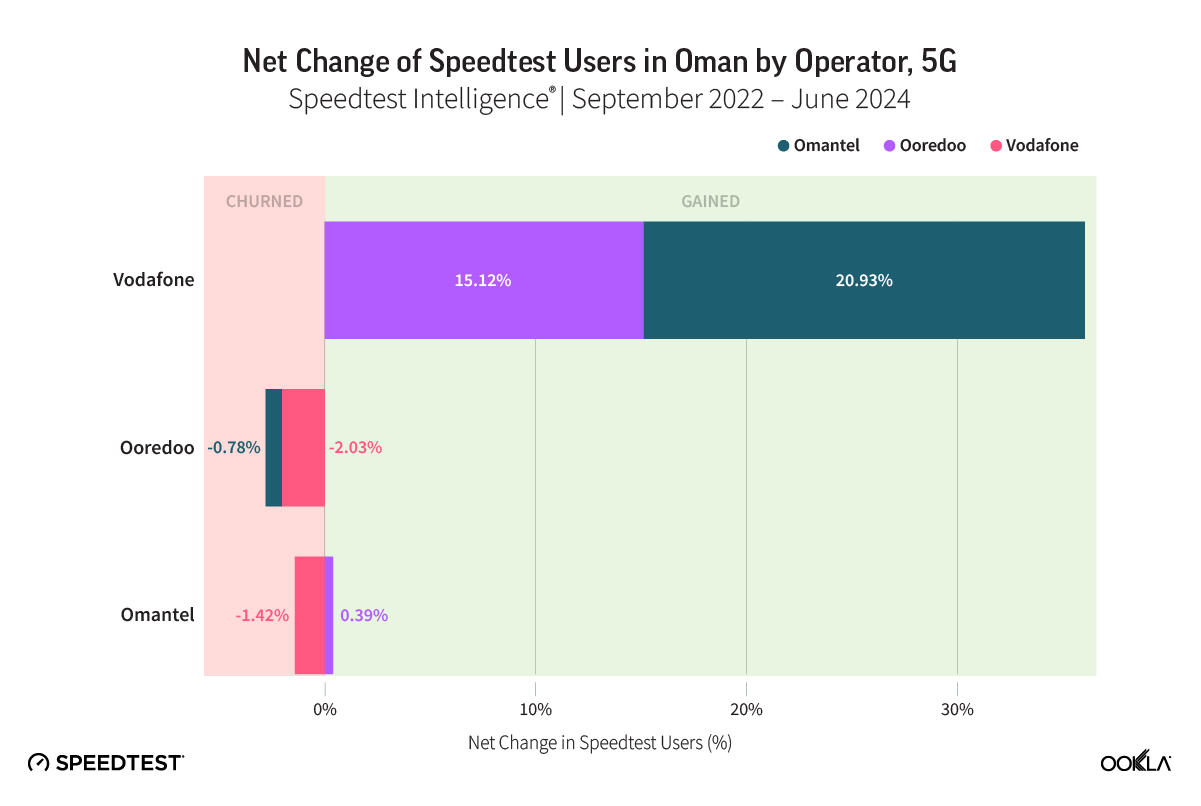
The following two charts show the breakdown of the Speedtest net additions and net losses per operator, which can be considered as a proxy for customers’ net additions and net additions, respectively, as a result of churn.
Vodafone experienced the most significant gain in both 4G and 5G users. Its 4G Speedtest base increased by 4.8% from Ooredoo and 7.4% from Omantel. Ooredoo lost 1.6% of Speedtest users to Vodafone and 1.2% to Omantel. The latter gained 0.85% from Ooredoo, losing 1.7% of its base to Vodafone. A similar trend is seen for 5G Speedtest users, with Vodafone’s users expanding the most from both operators. Over the same period, Ooredoo lost the most, and Omantel witnessed a shift of customers to Vodafone (-1.4%) and gains from Ooredoo (0.4%).
“>
“>
The maps below depict the spatial distribution of 4G and 5G Speedtest users who migrated to another operator over the same period. Blue and green depict areas of low churn concentration, and orange and red show locations with high customer attrition levels. Such heatmaps can be valuable for targeted marketing initiatives and network improvement measures to mitigate churn.
While the capital city and northern region witnessed the highest potential 4G churn, other towns in the south, such as Salalah, saw a similar phenomenon, albeit less intense. 5G churning is focused on and around the capital and Salah.
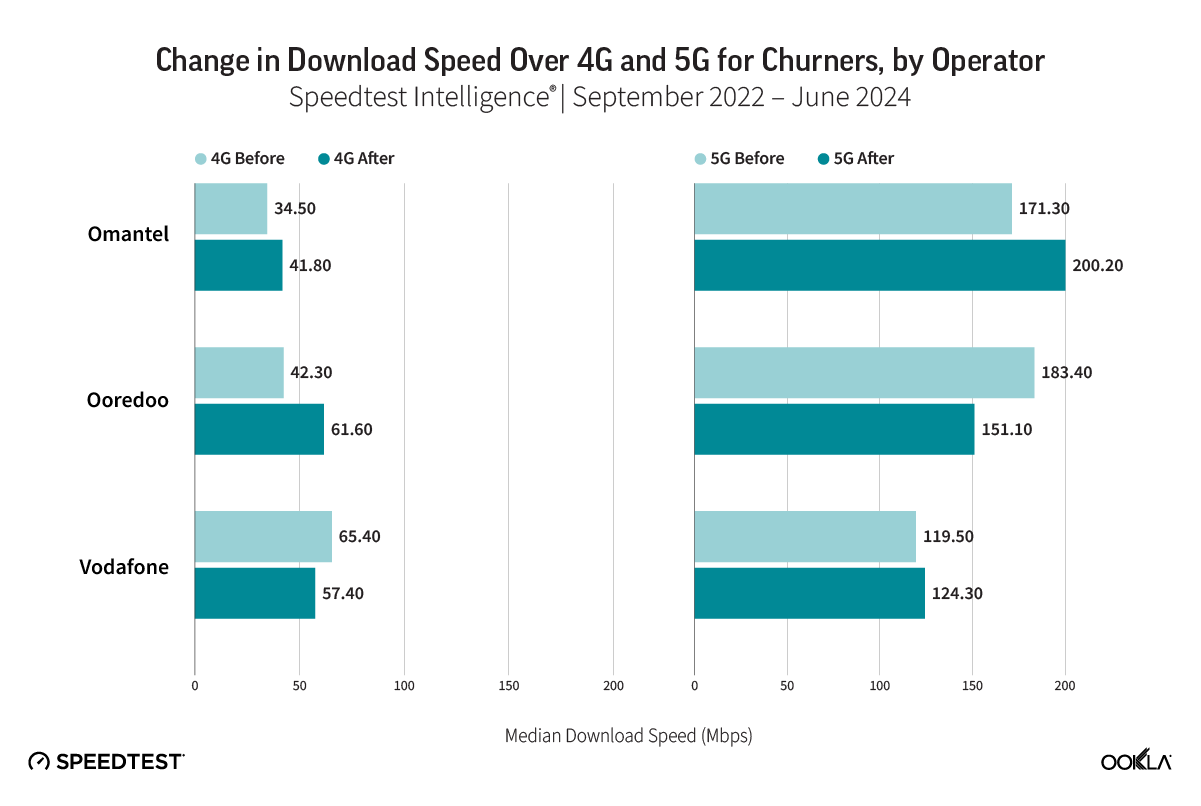
Churners from Omanel and Ooredoo had mixed network experience after changing operators
Speedtest Intelligence data provides insights into potential drivers of churn by examining network metrics such as download and upload speed before and after migration. The charts show the change in download upload speeds for customers who churned. Customers who moved from Omantel and Ooredoo to Vodafone experienced an improvement in 4G download speeds, respectively. Omantel customers migrating to other operators saw similar 5G improvements, but those moving from Ooredoo experienced a speed decrease to 115.1 Mbps. Those churning from Vodafone saw a slight download speed drop over 4G to 57.4 Mbps and a slight increase over 5G to 124.3 Mbps.
The potential gain in upload speed for subscribers moving operators is less pronounced, as the three operators offer similar performance. In summary, most Omantel churners improved their 4G and 5G download speeds after switching to Vodafone. Those moving from Ooredoo would have improved their 4G but degraded their 5G download speed, suggesting other factors motivated churn, such as pricing, data allowance, or customer service. According to our data, users who churned were particularly dissatisfied with a customer rating of 2.3 for 4G users on a 1 to 5 scale, and a rating of 1.5 for 5G users.
Vodafone Oman has made significant strides in establishing itself as an innovative player in the country’s telecom market. It has managed to gain a 10% market share within two years of launch in a saturated market. While its robust network performance and emphasis on 5G technology have undoubtedly contributed to attracting customers from competitors, it is the company’s distinctive marketing strategies, competitive pricing, and digital-first approach that have solidified its appeal. Vodafone’s success in Oman serves as a blueprint for other telecom operators aiming to differentiate themselves in a crowded marketplace in the Middle East. However, to remain competitive, Vodafone should focus on continually innovating its service offerings, enhancing its customer services, and evolving its strategy not only to attract but also to retain a loyal customer base.
We will continue to monitor the Omani telecom market as it continues to evolve. For more information about Speedtest Intelligence data and insights, please contact us.
Ookla retains ownership of this article including all of the intellectual property rights, data, content graphs and analysis. This article may not be quoted, reproduced, distributed or published for any commercial purpose without prior consent. Members of the press and others using the findings in this article for non-commercial purposes are welcome to publicly share and link to report information with attribution to Ookla.
Nordic countries have consolidated their lead in 5G Availability and network sunsets, underscoring the emergence of a two-speed Europe in 5G deployment
Home to two of the world’s largest radio vendors, Ericsson and Nokia, and characterised by markedly higher operator profitability than much of the rest of Europe, the Nordic region remains a key bright spot in Europe’s struggle for competitiveness against the Middle East, North America and Asia in 5G. Nordic countries have distinguished themselves in the 5G cycle through the timely release of mid-band spectrum assets, the development of innovative government policies to enable widespread rollout beyond core urban centres and a unique appetite for network sharing.
Combined with other favourable factors—such as some of the highest urbanisation rates in Europe (resulting in a smaller-than-average share of the population living in rural areas), flat topography (particularly in Denmark and Finland) and high average revenue per user (ARPU)—the Nordic countries have positioned themselves as European leaders in 5G Availability, rivaling global frontrunners like the United States, Qatar and South Korea.
Such is the importance of network quality to consumer sentiment in the Nordics that recent months have seen a flurry of operators eager to highlight major 5G coverage milestones as they complete their multi-year nationwide network refresh and expansion programmes.
At the end of 2024, Telia in Norway announced it was the first in the country to reach “close to 99% of the population” with 5G, while DNA in Finland declared that its 5G network had “reached all municipalities in mainland Finland with population coverage close to 100%“. Similar announcements came from Sweden, where Tele2 and Telenor, collaborating through the Net4Mobility joint venture, reported covering “over 90% of Sweden’s population with 5G”.
Intensive low-band deployment makes the Nordic 5G strategythe envy of Europe
Analysis of Speedtest Intelligence® data confirms that Nordic operators have much to celebrate. In Q4 2024, Nordic countries claimed three of the top five positions in Europe for 5G Availability—the percentage of users with 5G-capable devices spending most of their time connected to 5G networks. Furthermore, all four Nordic countries ranked within the top ten. Denmark retained its position as Europe’s leader, achieving an impressive 5G Availability of 83.4%, narrowly surpassing Switzerland, which remains the only other European country to exceed the 80% milestone to date.
Two-Speed Europe: Nordic Countries Take the Lead in 5G Availability
Speedtest Intelligence® | 5G Availability (%) in Q4 2024
Spectrum configuration decisions are a critical pillar of mobile network design and play a direct role in shaping coverage outcomes. Many European countries, including Ireland (61.9%) and the Netherlands (60.5%), have achieved high levels of 5G Availability by extensively utilising Dynamic Spectrum Sharing (DSS)—a technology that allows 4G and 5G networks to share the same frequency bands simultaneously (most commonly in the 1800 MHz and 2100 MHz bands)—to rapidly and cost-effectively expand 5G coverage atop the existing site footprint.
However, this reliance on DSS to fill coverage maps can negatively impact 5G performance and is intended as a temporary measure until more traffic transitions to newer 5G networks. This helps explain why the level of 5G coverage available is not always a reliable predictor of overall performance outcomes across Europe—for example, Ireland boasts above-average 5G Availability but has consistently ranked last in Europe for median mobile download speed.
The Nordic 5G Model: Early Low-Band Spectrum Access at Competitive Prices
Source: EU4Digital
The Nordic countries stand out for achieving high levels of 5G Availability without relying disproportionately on DSS technology. Operators in all four Nordic countries benefited from the early allocation of dedicated low-band spectrum for 5G in the 700 MHz band (first assigned in Finland in 2016 and most recently in Norway in 2019) and relatively low spectrum acquisition costs (e.g., €0.218 MHz/pop in Finland versus €0.701 MHz/pop in France). This combination has enabled extensive 5G deployments across the region, delivering deeper indoor and rural 5G access compared to much of Europe, thanks to the favourable propagation characteristics of the 700 MHz band.
Higher levels of 5G Availability in the Nordics have facilitated a greater shift of traffic from 4G to 5G networks compared to other parts of Europe. For example, Finnish regulator Traficom reported that nearly a quarter of all smartphone traffic in Finland originated on 5G networks during the first half of 2024, significantly surpassing other countries that track similar metrics, such as Spain and Portugal, where the 5G traffic share (even including FWA) remained well below 20% during the same period.
Nordic countries have consistently prioritised 5G access as a cornerstone of ambitious national digital transformation strategies. For example, the Norwegian government has introduced a range of policy measures aimed at achieving its goal of becoming the “world’s most digitalised country by 2030”. Recognising the critical role of high-speed mobile networks in driving economic competitiveness, the Nordic prime ministers signed a Letter of Intent (LOI) in 2018, declaring that the region should become the “first and most integrated 5G region in the world” and establish a “common Nordic 5G space”.
Sweden has closed the 5G Availability Gap with its Nordic Peers after a Slow Start
Speedtest Intelligence® | Q4 2023 – Q4 2024
To achieve this vision, Nordic countries adopted a whole-of-government approach, introducing a suite of financial and policy tools aimed at supporting the 5G rollout. In particular, Nordic telecoms regulators have been European leaders in the development of progressive ‘carrot-and-stick’ policies to accelerate 5G deployments and have leveraged spectrum assignments to steer operator behaviour:
Denmark incentivised 5G rollout through multi-band auctions in 2019 by attaching regional coverage obligations to low-band spectrum (700 MHz), requiring Danish operators to serve specific underserved addresses with minimum download speeds of 30 Mbps and upload speeds of 3 Mbps by April 2022. To encourage participation, these spectrum lots were auctioned under conditions of limited competition and without a minimum price, meaning operators could bid for additional coverage commitments in exchange for reductions in their licence costs. This innovative approach rewarded Danish operators for expanding 5G access in targeted areas with limited network access.
Finland implemented similar coverage obligations in its 2016 auction of the 700 MHz band, requiring operators to provide coverage to 99% of the population within four years. However, it allowed coverage from other frequency bands already in use at the time (800 MHz, 1800 MHz, and 2.6 GHz) to be included in meeting the target.
Sweden assigned two lots of 10 MHz in its 2018 auction of the 700 MHz band with coverage obligations, requiring operators to address prioritised areas with insufficient mobile coverage, ensuring minimum download speeds of 10 Mbps. Licence holders were required to deploy new mobile sites and invest up to €30 million to meet phased coverage targets, including 25% of the prioritised areas by the end of 2021 and 100% by the end of 2024.
Favourable Demographics and Topography Enable High 5G Availability Across Every Region in Denmark
Speedtest Intelligence® | 5G Availability (%) in Q4 2024
Denmark’s coverage obligations have delivered tangible results. Helped by the highest urbanisation rate, smallest rural population and flattest terrain among the Nordic countries, Denmark’s four operators have collectively achieved 5G Availability of at least 70% in each of the country’s regions (regioner), despite lower-than-average ARPU, according to Speedtest Intelligence data for Q4 2024.
Despite Lower Urbanisation Rates than its Nordic Peers, Norway Excels in 5G Availability
Speedtest Intelligence® | 5G Availability (%) in Q4 2024
Similarly, the most rural regions of northern Sweden (e.g., Norrbotten) and Norway (e.g., Finnmark), characterised by sparse populations, vast forests and a challenging Arctic climate, exhibit higher levels of 5G Availability than many more densely populated areas in Europe. Financial support of €140 million from the European Investment Bank (EIB) to Tele2, which also benefits Telenor through their Net4Mobility joint venture, has been instrumental in supporting 5G deployments in these rural areas of Sweden.
Rural Sweden Exhibits Higher Levels of 5G Availability than typical in Europe
Speedtest Intelligence® | 5G Availability (%) in Q4 2024
Similar financial instruments are aiding 5G deployments in rural Norway. In the first half of 2024, the Nordic Investment Bank (NIB) provided a 15-year €85 million loan to Lyse AS, the owner of Norway’s third mobile operator, Ice, to finance the upgrade of over 2,800 mobile sites and the development of more than 3,500 new ones, aiming to extend Ice’s 5G coverage to 99.5% of the population over the next three years.
Network sharing accelerates Nordic 5G rollouts in rural areas
Higher levels of inter-operator collaboration on mobile infrastructure buildouts in the Nordics compared to other European countries have been key to improving the economics of delivering 5G coverage in rural areas. Extensive network sharing agreements between at least two operators exist in Denmark (e.g., the TT Network joint venture between Telia and Telenor), Finland (e.g., the Finnish Shared Network joint venture between DNA and Telia in Northern and Eastern Finland) and Sweden (e.g., the Net4Mobility joint venture between Tele2 and Telenor).
Deep Network Sharing among Nordic Operators Drives Symmetry in 5G Availability
Speedtest Intelligence® | 5G Availability (%) in Q4 2024
The extensive depth of network sharing has contributed to balanced 5G coverage outcomes among operators in the Nordics, resulting in a greater-than-usual symmetry in 5G Availability within these countries. Sweden exemplifies this, with nearly identical 5G Availability levels (72.5%) observed for Tele2 and Telenor, according to Speedtest Intelligence data for Q4 2024. In contrast, smaller operators that have historically relied on national roaming agreements (e.g., Ice in Norway) or are not part of major sharing arrangements (e.g., 3 in Sweden) continue to exhibit lower 5G Availability, leading to greater coverage imbalances with market leaders.
Alongside a strong appetite for network sharing, Nordic operators have also embraced the shutdown of legacy networks more rapidly than other parts of Europe. Speedtest Intelligence data for Q4 2024 shows that operators in Finland and Norway have already completed the full sunset of 3G, with Denmark expected to follow suit once 3 finalises its 3G sunset in the coming months.
Low-Band Deployment and Early Network Sunsets Minimise Nordic Subscriber Time on 2G and 3G
Speedtest Intelligence® | Q4 2024
The proportion of Nordic mobile subscribers spending the majority of their time without network access was highest in Finland (1.9%) in Q4 2024, significantly above Norway (0.8%), the regional leader. Despite progress in phasing out 3G networks, several Nordic operators are postponing their 2G shutdowns to facilitate smoother migration for legacy users. Telia in Sweden, for example, recently announced a two-year delay to its 2G switch-off, now planned for 2025, to minimise disruptions in sectors like agriculture, which rely on 2G for essential equipment such as milking robots and irrigation systems.
Ookla retains ownership of this article including all of the intellectual property rights, data, content graphs and analysis. This article may not be quoted, reproduced, distributed or published for any commercial purpose without prior consent. Members of the press and others using the findings in this article for non-commercial purposes are welcome to publicly share and link to report information with attribution to Ookla.
South Carolina is the only state where rural residents’ access to broadband outperforms those of urban residents
Millions of Americans still don’t have access to affordable broadband service and this divide is even greater for those who live in rural areas of the United States. However, South Carolina stands apart from the other 49 states for its strength in delivering broadband to its rural residents.
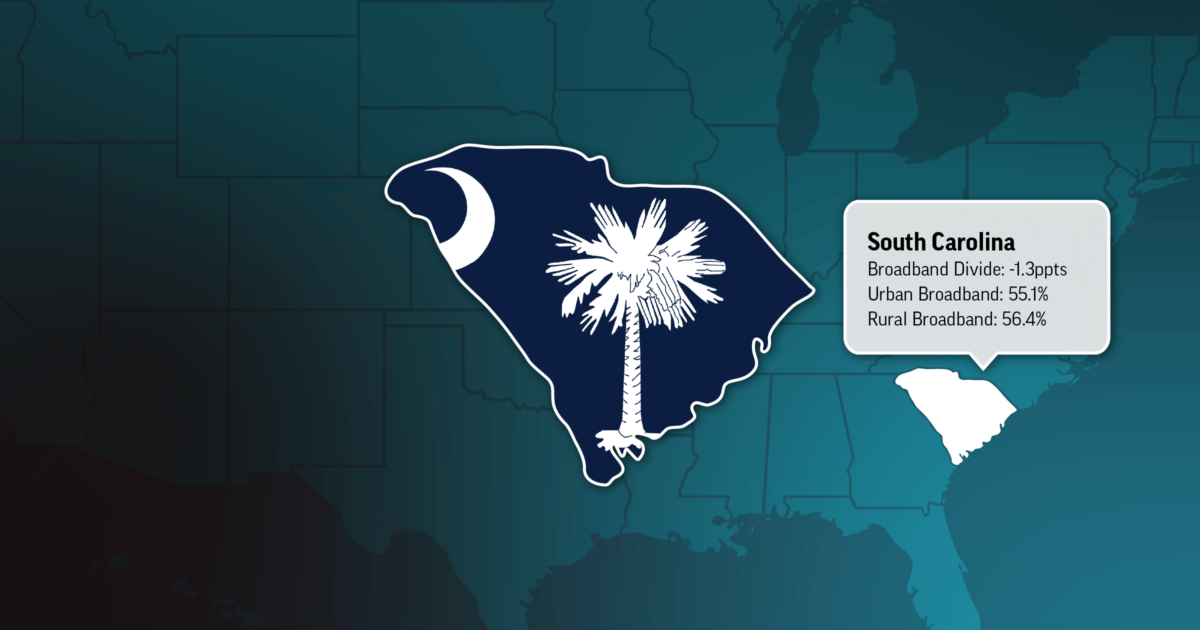
According to Ookla® Speedtest® data compiled in the first half of 2024, 56.4% of Speedtest users in rural areas of South Carolina experienced the FCC’s minimum standard for fixed broadband speeds of 100 Mbps downstream and 20 Mbps upstream compared to 55.1% of Speedtest users in urban areas of the state. Currently, South Carolina is the only U.S. state with a higher percentage of rural Speedtest users getting the minimum standard for broadband than Speedtest users in urban areas of the state.
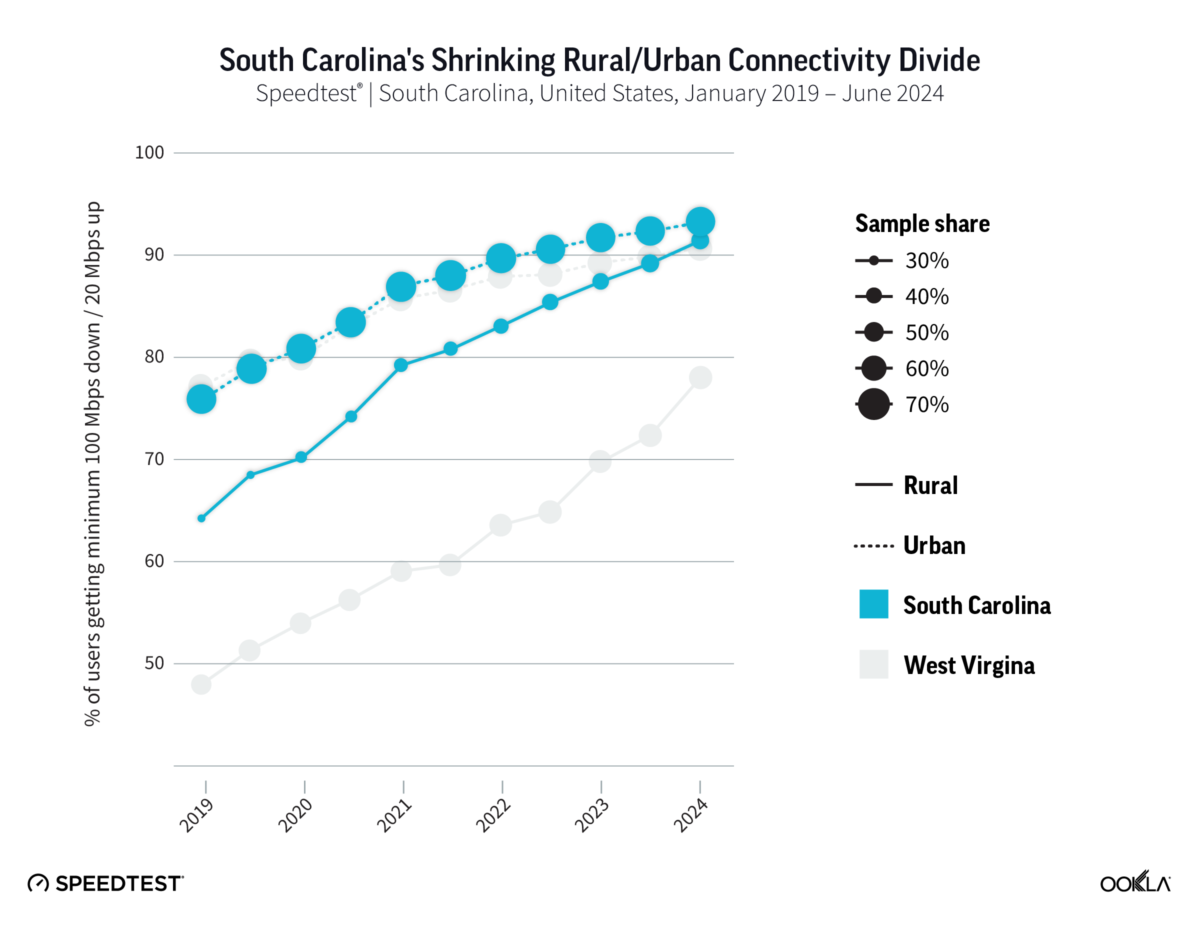
Although some states, such as Connecticut and North Dakota, out-performed South Carolina by having a higher percentage of total Speedtest users in their state experiencing the FCC’s minimum standard for fixed broadband speeds, South Carolina is the only state where rural residents’ access to broadband outperforms those of urban residents.
In the above chart we compared South Carolina’s closing of the urban/rural broadband gap with that of West Virginia to better depict the results of South Carolina’s work.
South Carolina’s broadband advantage
South Carolina was early to recognize that the best way to get broadband to underserved communities in the state was to first create accurate, reliable maps of the state’s broadband network performance.
That vision was in large part due to the efforts of Congressman Jim Clyburn (D-South Carolina). In an interview with Ookla, Clyburn said that his commitment to keeping rural health care centers open and the realization that they needed broadband connectivity to interface with larger teaching hospitals was what laid the foundation for him to become a rural broadband champion.
“I am very committed to creating rural connected health centers,” Cyburn said. “For this to happen, we need broadband.”
To create more reliable broadband maps, Clyburn enlisted the help of entrepreneur Jim Stritzinger, the former founder and CEO of Revolution D, who today serves as South Carolina’s Broadband Director at the Office of Regulatory Staff.
Back in 2019, Stritzinger, an electrical engineer by training, had studied the FCC’s original broadband coverage maps and realized that much of the agency’s data was based upon assertions by broadband providers, some of which were claiming to deliver 100 Mbps download speeds over their copper-based DSL service.
Instead of relying upon self-reported, advertised network speeds by internet service providers (ISPs), Stritzinger decided to develop a new mapping methodology which focused on the best deployed technology (i.e., fiber, cable, DSL) in each census block. Once the best available technology was defined, he then utilized advanced analytics to calculate likely available download and upload speeds in the same areas.
Congressman Clyburn enlisted Ookla and its Ookla for Good™ program to help with the effort and it was decided that Stritzinger would use Ookla Speedtest Intelligence®data to ensure the integrity of the mapping methodology by comparing calculated values with actual consumers’ network performance results as seen in Ookla Speedtest Intelligence data. The project kicked off in the summer of 2019.
“I built a brand-new set of South Carolina maps that ignored advertised speeds and instead used likely available speeds based upon the best deployed technology and available Ookla data,” Stritzinger said. “The results were game-changing.”
The Solution
Today, in his role as Director of the South Carolina Broadband Office (SCBBO) and with a full-time staff of six, Stritzinger’s team continues to innovate with Ookla. In early 2023, the SCBBO partnered with Ookla and IBM to develop a state-of-the-art Construction Dashboard.
“The SCBBO came to us with this idea — to take real-time Ookla Speedtest data — and to focus on the areas with state and federal investments. With this data, the hypothesis was that we could show the areas turn green on a map once construction completes and enough users were activated. Speedtests provide independent, third-party verification of consumer activity and they also provide engineering evidence that networks are meeting federal 100/20 standards,” said Lindsey Sample, IBM’s State of New York Technology Sales Leader. Sample worked closely with the SCBBO in her prior role as IBM’s South Carolina Data and AI Technical and Sales Specialist.
“Now that it is fully operational, the SCBBO’s Construction Dashboard is an amazing storytelling tool that brings to life, on a weekly basis and in a visual format, the impact of this government funding and the positive impact on real citizens that this work has in closing the digital divide,” Sample said.
By using the Construction Dashboard, the SCBBO can immediately determine if the state and federal broadband investments are meeting construction milestones.
“This allows us to check on the funding to make sure construction progress is occurring,” Stritzinger said, adding “the Construction Dashboard is critical for the SCBBO because we don’t release any broadband funds until projects are construction-complete and network performance is verified.”
Other states are following South Carolina’s lead and have started using Ookla’s Speedtest data to track network deployment progress and subscriber adoption. For example, Vermont is also working with Ookla and IBM to create a similar service.
Stritzinger and his team can also track the progress of federal broadband projects such as those funded by the U.S. Department of Agriculture (ReConnect) and the Federal Communication Commission’s Rural Digital Opportunity Fund (RDOF) as well as state-funded projects and even privately funded ventures.
One funding project that is garnering a lot of attention right now is the Broadband Equity Access and Deployment (BEAD) fund, which is being managed by the National Telecommunications and Information Administration (NTIA). BEAD made $42.5 billion in funding available for U.S. states and territories and the program requires states and territories to provide plans for connecting 100% of locations. The NTIA on Dec. 5, 2024, released its Draft Performance Measures for BEAD Last-Mile Networks outlining anticipated standards for speed, latency and reliability.
Ookla Speedtest results are already used by hundreds of internet service providers (ISPs) for reporting network performance for other federal broadband programs such as the Connect America Fund, RDOF and others.
If the state does not need the full $551 million to connect all residents and businesses, it will work with state leadership to develop a plan for BEAD non-deployment funds. The SCBBO hopes to continue to build South Carolina’s broadband infrastructure and turn South Carolina into an “internet powerhouse” that will attract more industry.
For Congressman Clyburn, closing South Carolina’s digital divide is a big win. “I’m very proud of this accomplishment for South Carolina.”
Clyburn’s advice to other leaders that are trying to deliver broadband to rural areas of their state: “Innovate, innovate, innovate.”
Ookla retains ownership of this article including all of the intellectual property rights, data, content graphs and analysis. This article may not be quoted, reproduced, distributed or published for any commercial purpose without prior consent. Members of the press and others using the findings in this article for non-commercial purposes are welcome to publicly share and link to report information with attribution to Ookla.
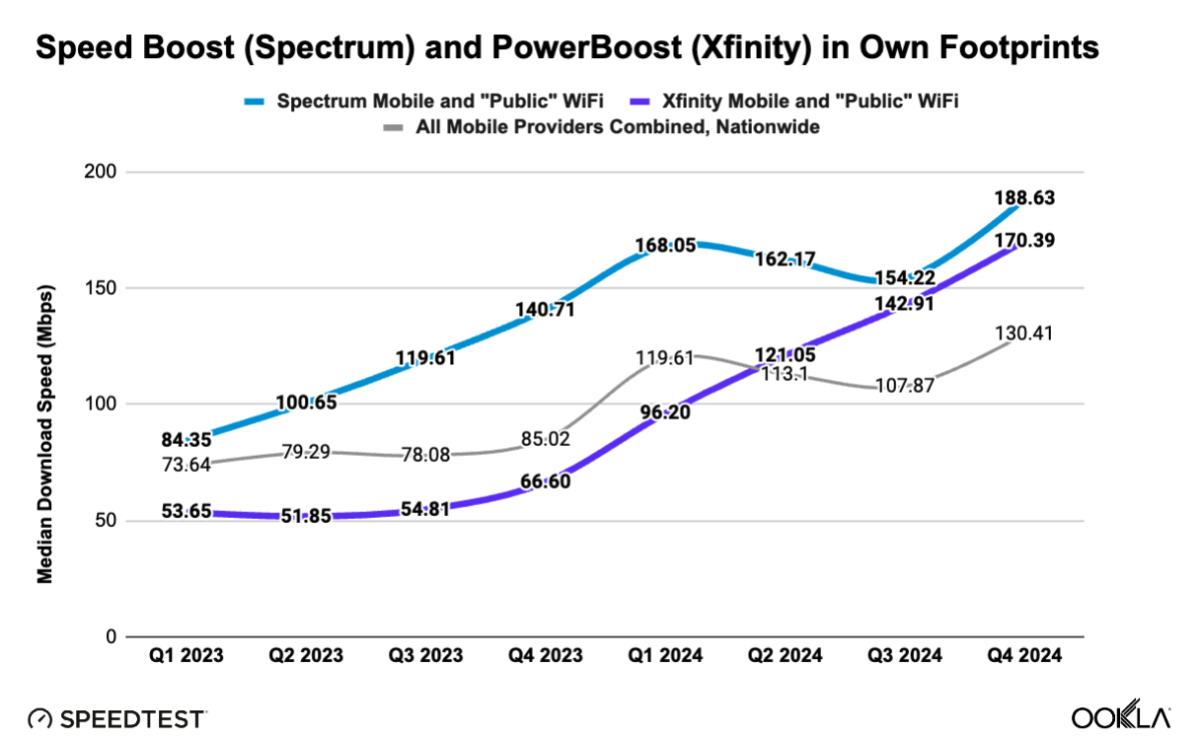
Customers of the two biggest cable mobile virtual network operators (MVNO) in the U.S. – Charter’s Spectrum Mobile and Comcast’s Xfinity Mobile – are both enjoying an impressive upward trajectory in their overall network performance. In their respective service areas over the past two years, Spectrum Mobile and Xfinity Mobile users’ download speeds increased by more than 100 Mbps. The performance lift is largely thanks to Wi-Fi offloading capabilities through Spectrum Mobile’s Speed Boost and Xfinity Mobile’s PowerBoost.
Charter began augmenting speeds for its Spectrum Mobile customers leveraging their home Charter Wi-Fi in spring 2022 and, in the fall the same year offered speeds up to 1 Gigabit per second (Gbps). Likewise, Comcast was aggressive in tapping into its installed base of customer hotspots, and in 2023, Charter and Comcast offered their combined footprints to each other’s MVNO customers. That is, Charter’s Spectrum Mobile customers have access to the network of Comcast Wi-Fi hotspots within the Comcast service area – and visa-versa for Xfinity Mobile customers in the Charter service area.
Comcast said it operates more than 23 million Wi-Fi hotspots in its footprint. Charter says it has 43 million Wi-Fi access points in its and its partners’ networks, the latter including the Comcast figure. Both cable companies say that between their own Wi-Fi networks and those of partners, with minimal overlap, they provide near-nationwide (population) coverage.
Then, in April 2024, Comcast took the lid off with WiFi Boost offering speeds up to 1 Gbps, and just last week have rebranded the feature to PowerBoost. These steps by Charter and Comcast to converge the mobile and Wi-Fi networks are meaningfully boosting their customer experience in home and out-and-about.
We examined the last eight quarters (Q1 2023 – Q4 20241) of Speedtest IntelligenceⓇ data for the median download speed performance of Speedtest users for customers of Spectrum Mobile, Xfinity Mobile, U.S. mobile providers as a group, and Verizon; the latter is the host mobile network for both MVNOs. We analyzed the Spectrum Mobile and Xfinity Mobile results within their two respective geographic service areas of Charter and Comcast, where “public” Wi-Fi is available to enhance available speeds of their mobile customers. (“Public,” in our usage here, means access points managed by Charter and Comcast, available to Spectrum Mobile and Xfinity Mobile customers.) We do not have knowledge about the wholesale network relationships or any performance implications as part of their agreements.
Spectrum Mobile – They Have Separation
Charter’s earlier start in promoting Speed Boost had its Spectrum Mobile users consistently clocking higher overall download speeds in its service area than Comcast did for Xfinity Mobile users in its service area. (Charter and Comcast service areas do not overlap.)
During these past two years, Spectrum Mobile customers saw their median download speeds increase by more than double from 84.35 Mbps to 188.63 Mbps – a 104.28 Mbps increase. The pause in its quarterly climb in Q2 and Q3 2024 is explained, at least partly, by the underlying host mobile network slowing down.
Xfinity Mobile – Up and Up
Xfinity Mobile, on the other hand, was not affected the same way. Its later introduction of WiFi Boost, compared to Spectrum Mobile’s Speed Boost, was still providing gains during this period. Speed Boost, however, had already realized the speed gains from Wi-Fi (also explaining why Spectrum Mobile was faster than Xfinity Mobile), thus being more sensitive to the mobile network performance. Interestingly, the Xfinity Mobile and Spectrum Mobile speeds became closer to one another in the second half of 2024, as WiFi Boost (now PowerBoost)was catching up.
Xfinity Mobile users, comparing year-on-year Q4 2023 to Q4 2024, saw their download speeds increase more than 2.5 times from 66.60 Mbps to 170.39 Mbps.
Quarter-on-quarter, Xfinity Mobile Speedtest users experienced a relentless climb in their download speed performance starting from Q3 2023 at 54.81 Mbps:
• Q4 2023 up 11.79 Mbps to 66.60 Mbps • Q1 2024 up 29.60 Mbps to 96.20 Mbps • Q2 2024 up 24.85 Mbps to 121.05 Mbps • Q3 2024 up 21.86 Mbps to 142.91 Mbps • Q4 2024 up 27.48 Mbps to 170.39 Mbps
The Verizon network provides the Spectrum Mobile and Xfinity Mobile customer experience, when not on Wi-Fi. During this same two-year period, nationwide Verizon’s overall median download speeds increased from 66.81 Mbps in Q1 2023 to 97.45 Mbps in Q4 2024 – up 30.64 Mbps. Increased network capacity from Verizon’s ongoing C-Band spectrum deployment is a rising tide that floats the boat for Verizon’s customers, as well as for Spectrum Mobile and Xfinity Mobile customers.
To Xfinity, Spectrum and Beyond
Hardware is a key component to faster speeds, and PowerBoost benefits from a new access point with Wi-Fi 6E technology that triples the available bandwidth versus the prior generation. Comcast began offering its 6E-capable xFi Advanced Gateway in 2022.
Comcast also is making improvements to its underlying network. The company is currently upgrading from DOCSIS 3.1 to DOCSIS 4.0, doubling downstream capacity and quadrupling upstream capacity. In September 2024 the cable company said it had deployed DOCSIS 4.0 to parts of 10 markets and 1 million homes.
And, as older handsets are replaced with newer and faster ones, the technology ecosystem as a whole comes together to deliver an ever-better customer experience.
And just as technology advancements mentioned above have provided the foundation for the performance gains these past two years, more is on the way.
The XB10 gateway, coming in 2025, will be Comcast’s fastest and most powerful device yet – supporting WiFi 7 and DOCSIS 4.0 – and will deliver multi-gigabit symmetrical speeds over WiFi, with the unprecedented capacity to connect to 300 devices simultaneously. The XB10 also includes AI technology that will help ensure a consistent experience. Comcast WiFi
Implicit in the march of technology is not just the network foundation, but also the consumer adoption. New access points require new cabling, and newer devices offer improved capabilities, and often paying for the “right” bundled service offering is needed. For example:
For Spectrum Speed Boost, you need Spectrum Internet, Spectrum Mobile and Advanced WiFi. Spectrum Speed Boost
It’s not a secret that the vast majority of mobile device data traffic is actually served by Wi-Fi, rather than the mobile network. Comcast President Michael Cavanagh noted in a recent call with investors, “My final thought on broadband is the importance of bundling with mobile, with 90% of Xfinity Mobile smartphone traffic traveling over our Wi-Fi network.”
Noteworthy is Cavanagh’s mention of “bundling,” which, in the context of the foregoing analysis, is the combining of networks in a way to best benefit the customer experience. Comcast and Charter are proving this to be the case.
This approach of combining the networks is part of a strategic narrative happening in the U.S. telecoms industry called network “convergence.” Were it not for AI, convergence could have been the industry’s top buzzword in 2024. And, like with AI, there will be plenty more said about convergence in 2025.
Ookla retains ownership of this article including all of the intellectual property rights, data, content graphs and analysis. This article may not be quoted, reproduced, distributed or published for any commercial purpose without prior consent. Members of the press and others using the findings in this article for non-commercial purposes are welcome to publicly share and link to report information with attribution to Ookla.
As wildfires become more prevalent, wireless operators are becoming more adept at handling these types of natural disasters by quickly deploying cell sites on wheels (COWs) and other assets to try to maintain connectivity and minimize the downtime to the networks. In addition, operators are focusing their efforts on maintaining connectivity for first responders and emergency workers.
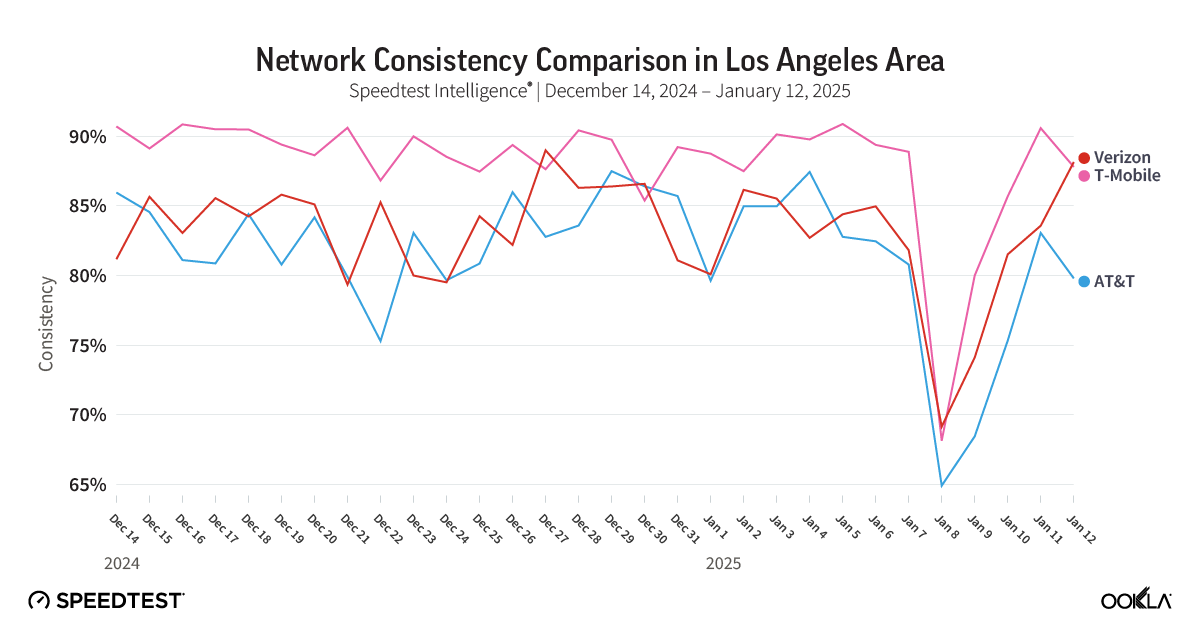
The recent devastating wildfires that were first detected in the Los Angeles area on January 6 —including the Palisades, Eaton, Kenneth and Hurst fires — have not resulted in widespread wireless network outages. In fact, analysis of Speedtest Intelligence ® data reveals that users experienced a performance decline on January 8 but by January 9 the network performance was back on the upswing and by January 12 the networks were operating at nearly the same level they were prior to January 6.
In the chart above, the consistency percentage measures what percentage of a provider’s samples equals or exceeds both a download and upload threshold of 5/1.
This minimal impact to the wireless networks was also noted by Federal Communications Commission Chairwoman Jessica Rosenworcel: “While communications impacts are minimal so far, the FCC will continue to monitor how these sets of wildfires are affecting residents’ ability to receive the information they need to stay safe. Should conditions change, the agency stands ready to support in any way it can, including any requests to deploy FCC staff to help with any communications network recovery.”
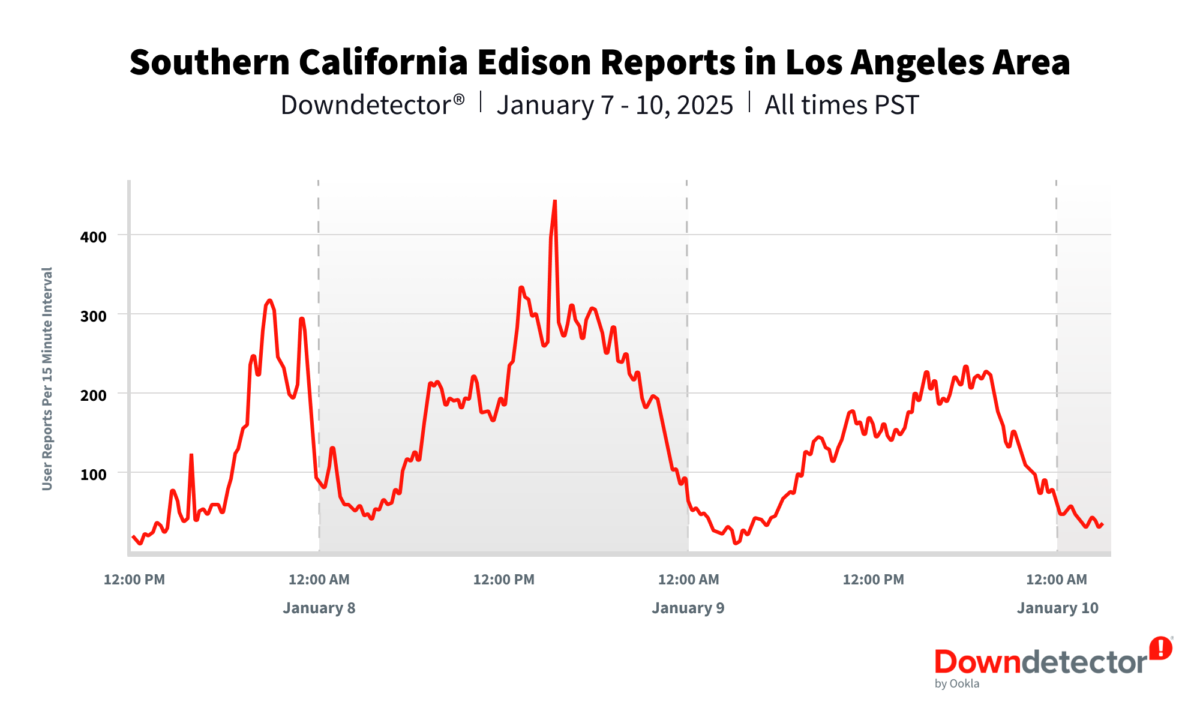
Power outages
One of the biggest obstacles wireless operators had to deal with has been the loss of power to their cell sites. Reports of Southern California Edison’s power outages started to flood into Downdetector around 3 pm. PST on January 7 and peaked after noon PST on January 8 with more than 400 user reports per 15-minute intervals.
Drones and satellites
Verizon revealed on January 10 that its engineers were deploying portable generators to cell sites in its network that were impacted by the commercial power loss. In addition, it said that in areas where fiber was burned it had deployed temporary satellite assets to provide added connectivity.
The operator also said that it was using a fleet of more than 550 mobile assets, including drones and nearly 300 satellite-based assets to help provide connectivity where its traditional infrastructure was compromised.
T-Mobile also is working to refuel portable generators to keep its cell sites online and the operator also said it was working with SpaceX’s Starlink to temporarily provide its direct-to-cell satellite service which will allow users in impacted areas to receive wireless emergency alerts and send texts.
AT&T, meanwhile, said it has deployed its FirstNet Response Operations Group to help support firefighters and other first responders on the front lines with connectivity.
Ookla will continue to monitor the network performance during the California wildfires and will provide updates if we detect any changes.
Ookla retains ownership of this article including all of the intellectual property rights, data, content graphs and analysis. This article may not be quoted, reproduced, distributed or published for any commercial purpose without prior consent. Members of the press and others using the findings in this article for non-commercial purposes are welcome to publicly share and link to report information with attribution to Ookla.
Every day, millions of people rely on Speedtest® to get the most accurate, trusted view of their real-world internet performance. Whether streaming 4K content out and about, looking for a reliable connection to work remotely, or managing a smart home hub of devices, people need to know if their connection can keep up with their needs.
But end users aren’t the only ones that benefit from accurate, real-world connectivity testing information. Businesses, universities, healthcare facilities, and even the leading Internet service providers (ISPs) all use Speedtest to optimize their own networks.
At Ookla®, we sit at the intersection between the service providers tasked with designing and optimizing networks and the consumers that make use of those networks every day. Our insights not only help people choose a mobile or Wi-Fi service provider, we help organizations of every type optimize the networks and services they provide.
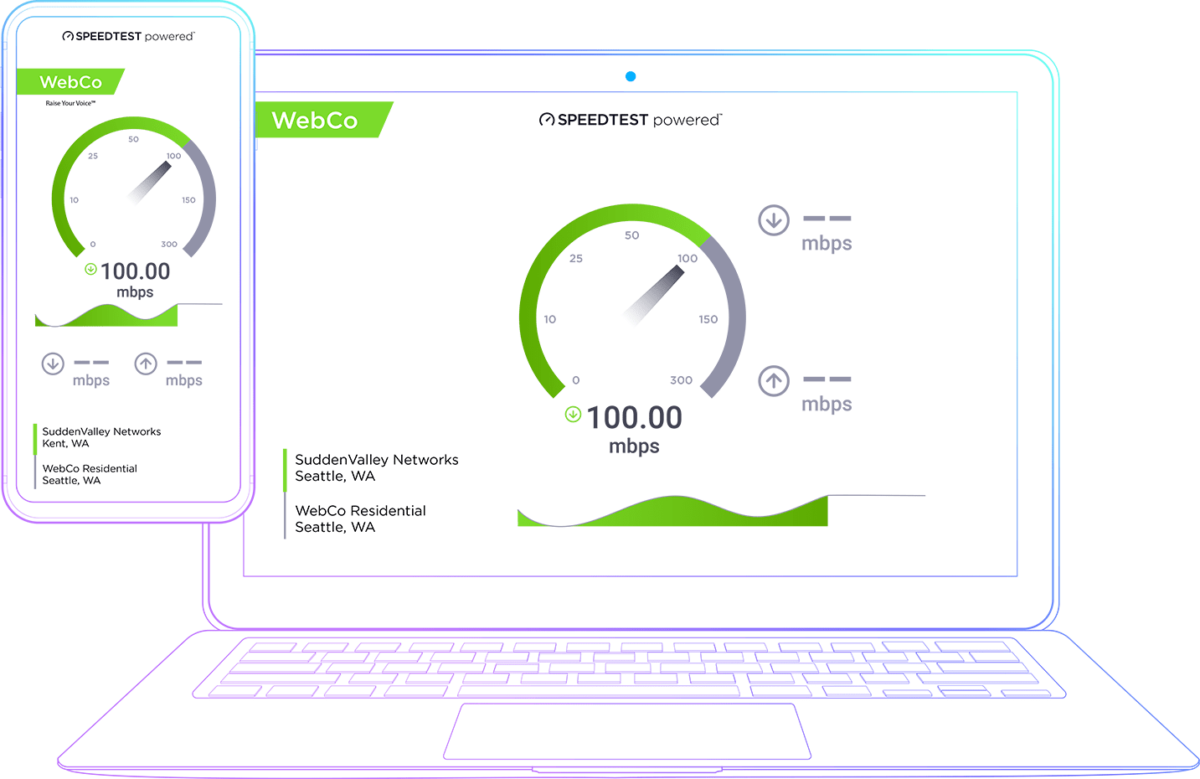
Speedtest Powered™ bridges the gap between these two worlds. As part of the enterprise side of Speedtest that most users never see, it encompasses three solutions — Speedtest Custom, Speedtest SDK, and Speedtest Embedded. These tools allow organizations to leverage the trusted testing capabilities that have made Speedtest the global standard for internet performance measurement while maintaining their unique brand identity. Enterprises rely on these solutions to solve connectivity challenges and deliver reliable service across every network touchpoint.
Let’s take a look at how different enterprises are putting these tools to work!
Real-World Data Making a Real-World Impact
From education to aviation, organizations are integrating Speedtest capabilities directly into their systems to solve critical connectivity challenges. Here’s how they’re putting Speedtest Powered tools to work:
Enhanced Customer Experience for Airline In-Flight Connectivity
Many airlines offer in-flight Wi-Fi as a way for passengers to work or just consume some entertainment during their journey. Some even offer upgraded experiences with faster speeds or longer durations at an additional cost. To ensure the highest level of customer experience, airlines use Speedtest Embedded to consistently monitor Wi-Fi performance across their entire fleet. This solution enables real-time performance tracking and SLA verification, ensuring passengers receive the connectivity they expect (and at many times, pay for) at 35,000 feet. Airline IT teams can quickly identify and address connectivity issues, while flight crews have immediate visibility into network performance.
Remote Testing Solutions for Schools and Enhanced Work-from-Home Efficiency
A school district in a major city integrated Speedtest SDK into their student devices to support remote learning initiatives. With this capability, IT teams can monitor student connectivity without requiring manual testing, ensuring educational continuity and compliance with federal remote learning programs. The solution also helps the school district quickly identify and address connectivity challenges, enhancing both student success and operational efficiency. Similarly, enterprises use Speedtest Embedded to monitor connectivity performance across their remote workforce, enabling both automatic and on-demand testing to their private servers to ensure reliable work-from-home experiences.
Healthcare Innovation
A major healthcare system integrated Speedtest solutions across their operations to ensure reliable connectivity for critical medical services and remote staff. By implementing Speedtest Custom in their facilities, medical teams can verify network performance for bandwidth-intensive tasks like medical image transfers. Healthcare providers also use Speedtest Embedded to monitor connectivity for remote employees, ensuring their IT infrastructure supports seamless operations whether staff are on-site or working from home. This approach helps maintain operational efficiency while supporting the high-performance network demands of modern healthcare delivery.
5G Network Optimization
A major 5G provider integrated Speedtest SDK into their customer-facing mobile app to gain comprehensive insights into network performance. The solution enables periodic measurements across consumer devices while allowing both customers and support teams to run on-demand tests. This allows the provider to collect over 200 data points — including device information, Wi-Fi details, connection metrics, and location data — helping optimize their 5G network deployment and identify areas needing coverage improvements.
Customer Care Evolution
Relaying experiential information to a customer care rep can be challenging for invisible mediums like cellular and Wi-Fi services. Terms like “slow,” “stuttery,” “sometimes not great,” are instantly cleared up with a simple Speedtest. A leading ISP integrated Speedtest Custom into their support workflow, empowering customers to verify their connection speeds while providing valuable data to internal support teams. This has reduced the need for on-site technician visits and enhanced customer satisfaction through more efficient problem diagnosis and troubleshooting.
Telecom Compliance and Optimization
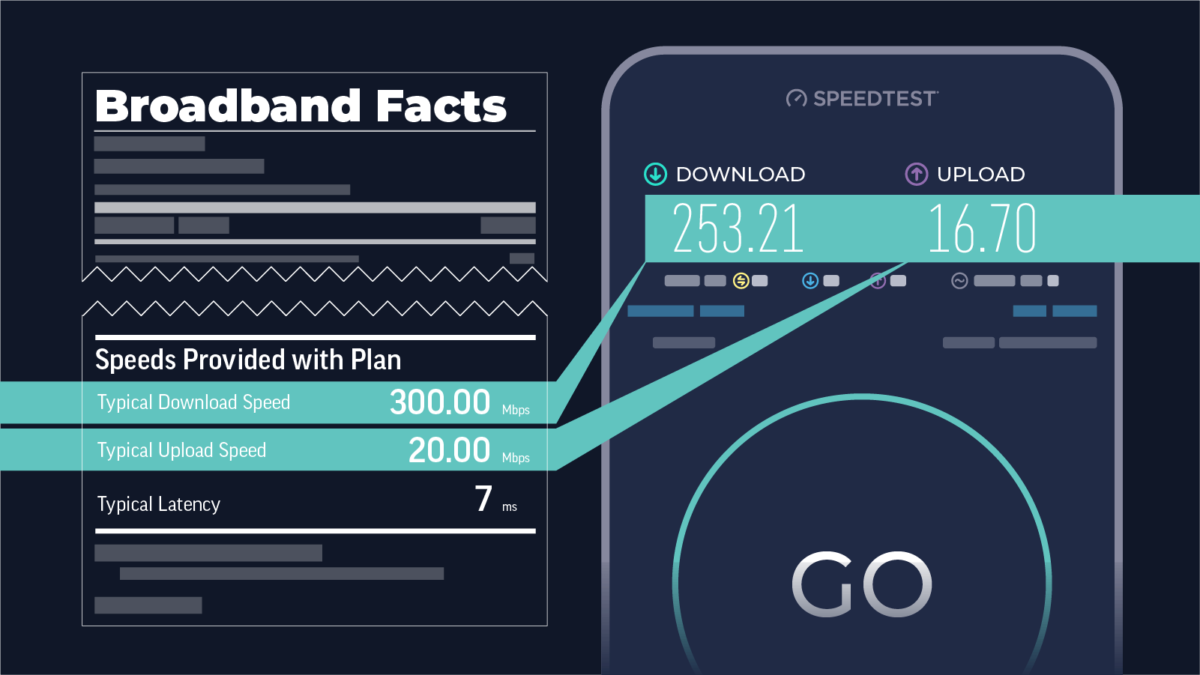
A mobile operator in Europe integrated Speedtest SDK into their mobile and web platforms to meet new regulatory requirements for subscriber speed reporting. The solution enabled users to test and report their speeds while providing the operator with comprehensive network performance insights. This breadth and depth of data — including device types, connection quality, and location information — helps the operator optimize their network, diagnose customer issues efficiently, and provide stakeholders with actionable information while meeting regulatory requirements.
Conclusion
Speedtest isn’t just the tool millions use to check their home internet speeds — it’s also powering network measurement and optimization behind the scenes across multiple industries.
Through Speedtest Powered solutions — Speedtest Custom, SDK, and Embedded — organizations can integrate trusted performance testing directly into their platforms while maintaining brand consistency. The result? Better data, better insights, and better customer experiences.
Ready to bring the power of Speedtest to your organization? Visit our product page for a deeper look into our solutions, or reach out to learn more!
Ookla retains ownership of this article including all of the intellectual property rights, data, content graphs and analysis. This article may not be quoted, reproduced, distributed or published for any commercial purpose without prior consent. Members of the press and others using the findings in this article for non-commercial purposes are welcome to publicly share and link to report information with attribution to Ookla.
Spain continues to lead Europe in fiber rollout, but lagging mobile performance undermines country’s overall telecoms competitiveness
The dynamism of Spain’s telecoms market stood out among its European peers last year, with a flurry of mergers reshaping the market’s structure and strong investment in next-generation networks, supported by targeted government initiatives, improving outcomes for Spanish consumers. However, while increased fiber and 5G penetration have driven notable year-on-year improvements in overall network performance, Spain’s international competitiveness in telecoms remains highly imbalanced between its fixed and mobile infrastructure.
The country’s credentials as Europe’s preeminent fiber leader remain intact. In 2024, Spain ranked among the top three in the EU for fiber-to-the-premises (FTTP) coverage (95.2%) and the share of fixed broadband subscriptions providing download speeds above 100 Mbps (93.5%), according to the latest edition of the European Commission’s ‘State of the Digital Decade’ report. This continues to position the country significantly ahead of some of the bloc’s largest economies, most notably Germany, which still lags in FTTP coverage (28.8%) due to a slow shift away from cable networks.
Analysis of Speedtest Intelligence® data reveals that median fixed download speeds in Spain increased from 173.32 Mbps to 210.46 Mbps between 2023 and 2024. This trend of improvement was mirrored across other fixed network performance metrics, with upload speeds increasing in the same period from 129.62 Mbps to 155.53 Mbps. In Q3 2024, DIGI achieved a median fixed download speed of 321.21 Mbps in the Spanish market, followed by Jazztel (273.18 Mbps), Orange (262.78 Mbps), Yoigo (255.74 Mbps) and Movistar (180.30 Mbps).
Spain Leads Europe in Fiber Deployment and Adoption, Boasting the Highest Coverage Among the EU's Top 10 Economies
European Commission | DESI 2018 – 2024
Having achieved exceptionally high levels of FTTP penetration across urban, suburban and rural areas—placing Spain among the top three in the European Commission’s DESI 2024 Index for FTTP coverage in sparsely populated rural areas—the focus in Spain is shifting toward enhancing quality of experience (QoE) in core use cases such as gaming and video streaming. Despite boasting higher FTTP coverage and take-up rates, Spain ranks below countries like France in Ookla’s Speedtest Global Index™. This disparity highlights the influence of factors such as Wi-Fi technology—France has a higher penetration of Wi-Fi 6 and 7 in ISP-provided CPE—and tariff provisioned speeds, with a larger share of fiber customers in France subscribing to multi-gigabit plans, on fixed broadband performance.
DIGI’s strong fixed download speed performance in Spain, detailed in Ookla’s Speedtest Connectivity Report for 1H 2024, is underpinned by similar favourable factors. Notably, it was first to market in Spain with a 10 Gbps service, fully leveraging its XGS-PON fiber infrastructure. With highly competitive pricing—starting at just €20 per month for 1 Gbps and €25 per month for 10 Gbps, including Wi-Fi 6 CPE as standard—DIGI has quickly secured a significant share of multi-gigabit capable connections in the Spanish market.
Autonomous Communities in Northern Spain Lead in Fixed Download Speed Performance
Speedtest Intelligence® | 2024
In addition to highlighting the importance of modern CPE and higher tariff-provisioned speeds, DIGI’s business last year exemplified the accelerating consolidation trends in Spain’s highly overbuilt and fragmented fiber market. The acquisition of DIGI’s fiber infrastructure by a Macquarie-led consortium, which solidified wholesale specialist Onivia’s status as the largest of the ‘neutral’ FTTP networks in Spain, dovetailed with developments such as Telefónica’s BlueVia wholesale spin-off, the emergence of MásOrange and Zegona-controlled Vodafone’s ‘FiberCo’ tie-ups with both Telefónica and MásOrange.
As observed in other European markets with significant fiber overbuild, such as the alt-net model in the UK, consolidation is a slow and challenging process. However, Spanish operators continue to pursue it to enhance the economics of their fiber investments in highly overbuilt urban areas, unlocking scale and resources to capture future growth in rural areas where overlapping infrastructure is less common. This begins with small local operators—of which there are hundreds—being absorbed by ‘local consolidators’. These are then integrated into the infrastructure portfolios of regional consolidators, ultimately leading to acquisition by one of the largest traditional players.
Fiber Overbuild from Smaller Players like DIGI Drives Market Share Shift from Incumbents
Analysis of CNMC Market Data | 2022 – 2024
This gradual process of consolidation is reshaping the fiber business model in Spain, as traditional operators separate their infrastructure and service units to support the growth of wholesale offerings. The coming year will provide some insight into whether a consolidated third player can successfully compete and coexist alongside the vertically integrated Telefónica and MásOrange in the long-term.
MásOrange is vying for network leadership in Spain, founded on a significant spectrum advantage
The winds of consolidation have swept through the Spanish mobile market too, culminating last year in the European Commission’s approval of a 50:50 joint venture between MásMóvil and Orange. The merger has pole-vaulted the newly formed ‘MásOrange’ into a leading position in the market, both in subscription and spectrum share. To secure regulatory approval from Brussels, the merging entity committed to divesting 60 MHz of spectrum, including 20 MHz in the 3.5 GHz band, to facilitate the entry of DIGI as a fully-fledged independent mobile operator, effectively restoring the Spanish market to a four-player structure and ‘exerting a strong competitive constraint on the joint venture’.
In addition to diversifying its portfolio of brands through the merger—with Orange and Yoigo catering to the premium segment, Jazztel and MásMóvil focusing on value for money and regional brands like Euskaltel and Telecable serving local needs—MásOrange hopes its consolidated spectrum assets will enable it to achieve network leadership in the Spanish mobile market.
Movistar Revenues Stable YoY in Q3 2024 while Vodafone and MásOrange Face Declines
Analysis of CNMC Market Data | 2022 – 2024
The merged entity’s consolidated network will be primarily based on Orange’s infrastructure, complemented by MásMóvil’s existing site portfolio and the deployment of new greenfield sites. The integration of MásMóvil’s network, which relies entirely on mid- and high-band spectrum and has historically depended on a national roaming agreement with Orange, creates a natural synergy for the merged entity. It enables the integrated network to leverage MásMóvil’s capacity and density in urban areas alongside Orange’s extensive coverage and nationwide reach.
MásOrange is particularly focused on vying to unseat Movistar’s dominance in the premium segment, a position it has long upheld thanks to its emphasis on superior network quality. Movistar emerged as the fastest mobile operator in the Spanish market in Ookla’s Speedtest Connectivity Report for 1H 2024, delivering the highest median download speeds of 82.68 Mbps. This placed Movistar significantly ahead of Orange (56.42 Mbps) and Yoigo (36.73 Mbps).
The merged entity’s spectrum advantage is heavily weighted toward mid- and high-bands, which are typically utilised for 5G deployments in urban and suburban areas. According to data published by MásOrange, it holds 37% of all mid- and high-band assets in the Spanish market—compared to 28% and 26% for its closest competitor, Telefónica—giving it a unique opportunity to enhance 5G speed performance and gain a competitive edge.
Movistar has maintained its strong 5G speed performance with a 100 MHz allocation in the 3.5 GHz band, but this is now overshadowed by MasOrange’s expanded allocation of 170 MHz. Capital investment by the merged entity in upgrading the 5G RAN to support advanced carrier aggregation (CA) capabilities and the standalone (SA) architecture will enable it to fully realise the performance benefits of wider channel bandwidth through the extensive deployment of its 3.5 GHz spectrum across its consolidated mobile site grid.
Seville Leads in 5G Download Speed Among Spain's Largest Cities, but Operator Performance Varies Widely
Speedtest Intelligence® | Q3 2024
To establish network leadership in coverage, however, MásOrange will need to move beyond its spectrum advantage and focus on increasing the number of physical sites in rural areas within its integrated network. In Q3 2024, Vodafone and Movistar recorded 4G Availability of 95.1% and 93.4% respectively in the Spanish market, followed by Orange at 92.7% and Yoigo at 91.5%.
In parallel to MásOrange’s network consolidation journey, DIGI is building out its own infrastructure to gradually wean itself off dependence on a national roaming and RAN sharing agreement with Telefónica (which DIGI selected over MásOrange, despite both being options under the merger conditions), starting with urban and suburban areas. The European Commission designed the spectrum divestment remedies to position DIGI to replicate the competitive pressure previously exerted by MásMóvil. The goal is for DIGI to carry a similar share of its total mobile data traffic on its own network in the coming years, at least matching the 40-60% on-net share that MásMóvil achieved pre-merger.
Spain's Rural Provinces Trail in 5G Availability, Highlighting the Importance of Government Support through UNICO
Speedtest Intelligence® | Overall 5G Availability (%) in 2024
More broadly, it is hoped that the substantial long-term investment commitments from DIGI and MásOrange, driven by the consolidation activity, combined with government support through programmes such as Unico, will bolster Spain’s international competitiveness in mobile performance in the coming years. The country has significant catching up to do, ranking 57th in the Speedtest Global Index at the end of 2024 and trailing most of its European peers across a suite of network performance metrics, including download speed, consistency and coverage.
La consolidación cambia las telecomunicaciones españolas en 2025
España sigue a la cabeza en despliegue de fibra en Europa, pero el rezagado desempeño móvil reduce la competitividad del país
El dinamismo del mercado español de telecomunicaciones destacó el año pasado frente al de otros mercados europeos, por fusiones que modificaron la estructura del sector y una fuerte inversión en redes de próxima generación, respaldadas por iniciativas gubernamentales, que supusieron mejoras para los consumidores españoles. Si bien la mayor penetración de la fibra y el 5G han impulsado año tras año notables avances en el rendimiento general de la red, la competitividad internacional de España en telecomunicaciones sigue estando muy desequilibrada entre su infraestructura fija y móvil.
Las credenciales del país como líder europeo en fibra permanecen intactas. En 2024, según la última edición del informe ‘Estado de la Década Digital’ de la Comisión Europea, España se situó entre los tres primeros países de la UE en cobertura de fibra hasta las instalaciones (FTTP), con un 95,21%, y en porcentaje de suscripciones de banda ancha fija con velocidades de descarga superiores a 100 Mbps (93,54%). Esto posicionó al país significativamente por delante de algunas de las economías más grandes del bloque, en particular Alemania, todavía rezagada en cobertura FTTP (28,80%).
Según Speedtest Intelligence la velocidad mediana de descarga fija en España aumentó de 173,32 Mbps a 210,46 Mbps entre 2023 y 2024. Esta tendencia de mejora se reflejó en otras métricas de rendimiento de la red fija, con velocidades medianas de carga que se incrementaron de 129.62 Mbps a 155.53 Mbps en el mismo período. En el tercer trimestre de 2024, DIGI alcanzó una velocidad mediana de descarga fija de 321,21 Mbps, por delante de Jazztel (273,18 Mbps), Orange (262,78 Mbps), Yoigo (255,74 Mbps) y Movistar (180,30 Mbps).
España lidera Europa en despliegue y adopción de fibra, con la mayor cobertura entre las 10 principales economías de la UE
Comisión Europea | DESI 2018-2024
Habiendo alcanzado niveles excepcionalmente altos de penetración de FTTP en áreas urbanas, suburbanas y rurales (que posicionan a España entre los tres primeros del índice DESI 2024 de la Comisión Europea sobre cobertura FTTP en zonas rurales escasamente pobladas), España está cambiando el foco hacia la mejora de la calidad de la experiencia (QoE) para casos de uso como los vídeojuegos y el streaming. A pesar de contar con más cobertura y tasas de aceptación FTTP, España está por debajo de países como Francia en el Índice Global de Speedtest de Ookla.
Este desequilibrio pone de relieve la influencia en el rendimiento de la banda ancha fija de factores como la tecnología Wi-Fi (Francia tiene una mayor penetración de Wi-Fi 6 y 7 en los router proporcionados por los operadores) y las velocidades ofrecidas en la tarifa (con una mayor proporción de clientes de fibra suscritos a planes multi-gigabit en Francia).
El sólido rendimiento de la velocidad de descarga fija de DIGI en España, detallado en Informe de Conectividad de Speedtest, está respaldado por factores favorables similares. Fue el primero en comercializar en España un servicio de 10 Gbps, aprovechando al máximo su infraestructura de fibra XGS-PON. Con precios altamente competitivos (desde sólo 20€ al mes por 1 Gbps y 25€ por 10 Gbps y router Wi-Fi 6 incluido), DIGI se ha asegurado rápidamente una cuota importante de conexiones con capacidad multigigabit en el mercado español.
Las comunidades autónomas del norte de España, líderes en rendimiento de velocidad de descarga fija
Speedtest Intelligence® | 2024
Además de evidenciar la importancia de un router moderno y velocidades más altas, el negocio de DIGI ejemplificó el año pasado la acelerada tendencia de consolidación en el fragmentado y sobredimensionado mercado español de fibra. La adquisición de la infraestructura de fibra de DIGI por parte de un consorcio liderado por Macquarie, que consolidó el estatus de Onivia como la mayor red FTTP ‘neutra’ en España, coincidió con otros acontecimientos como la escisión de BlueVia de Telefónica, la aparición de MásOrange y las alianzas de ‘FibreCo’ de Vodafone con Telefónica y MásOrange.
Como se observa en otros mercados europeos con un importante despliegue de fibra (como Reino Unido), la consolidación es un proceso lento y desafiante. Sin embargo, los operadores españoles continúan persiguiéndola para mejorar la rentabilidad de sus inversiones en fibra en áreas urbanas altamente edificadas, liberando recursos para aprovechar el crecimiento futuro en áreas rurales donde la superposición de infraestructura es menos común. Esto comienza con la absorción de pequeños operadores locales (de los que hay cientos) por “consolidadores locales”. Luego, éstos se integran en las carteras de infraestructura de los consolidadores regionales, lo que en última instancia conduce a la adquisición por parte de uno de los actores tradicionales más grandes.
El despliegue de fibra por parte de actores más pequeños como DIGI impulsa el cambio en la cuota de mercado de los operadores tradicionales
Análisis de datos de CNMC | 2022-2024
Esta consolidación gradual está modificando el negocio de la fibra en España, mientras que los operadores tradicionales separan sus unidades de infraestructura y servicios para apoyar el crecimiento de la oferta mayorista. Este año se podrá saber si un tercer actor consolidado puede competir y coexistir con éxito a largo plazo con Telefónica y MásOrange.
MásOrange compite por el liderazgo de la red en España, apoyándose en una importante ventaja de espectro
La consolidación también ha afectado al mercado móvil español. A finales del año pasado, la Comisión Europea aprobó la creación de una empresa conjunta entre MásMóvil y Orange. La fusión ha llevado a la recién formada MásOrange a una posición de liderazgo, tanto en suscripción como en cuota de espectro. Para obtener la aprobación de Bruselas, la entidad se comprometió a vender 60 MHz de espectro, incluidos 20 MHz en la banda de 3,5 GHz, para facilitar la entrada de DIGI como un operador móvil independiente de pleno derecho, convirtiendo así el mercado español en una estructura de cuatro actores.
Además de diversificar su cartera de marcas a través de la fusión (con Orange y Yoigo en el segmento premium, Jazztel y MásMóvil centrándose en la relación calidad-precio y Euskaltel y Telecable atendiendo las necesidades locales), MásOrange espera que sus activos de espectro le permitan alcanzar el liderazgo en el mercado móvil español.
Los ingresos de Movistar se mantienen estables interanualmente en el 3T de 2024 mientras que Vodafone y MásOrange afrontan caídas
Análisis de datos de mercado de CNMC | 2022-2024
La red de la entidad se basará principalmente en la infraestructura de Orange, complementada con la cartera de sites existentes de MásMóvil y el despliegue de nuevos. La integración de la red de MásMóvil, que depende íntegramente del espectro de banda media y alta e históricamente ha dependido de un acuerdo de roaming nacional con Orange, crea una sinergia para la entidad: aprovechar la capacidad y densidad de MásMóvil en áreas urbanas junto con la amplia cobertura y alcance nacional de Orange.
MásOrange está centrado en desbancar a Movistar en el segmento premium, que ha liderado durante mucho tiempo gracias a su foco en la calidad superior de la red. Movistar emergió como el operador móvil más rápido del mercado español en el Informe de Conectividad Speedtest de Ookla para el primer semestre de 2024, al ofrecer la velocidad de descarga media más alta de 82,68 Mbps. Esto sitúa a Movistar muy por delante de Orange (56,42 Mbps) y Yoigo (36,73 Mbps).
La ventaja espectral de MásOrange se inclina hacia las bandas medias y altas, normalmente utilizadas para implementaciones 5G en áreas urbanas y suburbanas. De acuerdo con los datos publicados por la compañía, MásOrange cuenta con el 37% de todos los activos de banda media y alta de España (en comparación con el 28% y el 26% de su competidor más cercano, Telefónica), lo que le da una oportunidad única de mejorar el rendimiento de la velocidad 5G y adelantarse a sus competidores.
Movistar ha mantenido su liderazgo en velocidad 5G con una asignación de 100 MHz en la banda de 3,5 GHz, pero esto se ve ahora eclipsado por la asignación de MásOrange de 170 MHz. La inversión de ésta para actualizar la RAN 5G para que cuente con capacidades avanzadas de agregación de operadores y arquitectura independiente (SA), le permitirá aprovechar los beneficios de rendimiento de un ancho de banda mayor a través del amplio despliegue de su espectro de 3,5 GHz en toda su red móvil consolidada.
Sevilla lidera en velocidad de descarga 5G entre las principales ciudades de España, pero el rendimiento de los operadores varía ampliamente
Speedtest Intelligence® | Q3 2024
Sin embargo, para liderar en cobertura de red, MásOrange necesitará ir más allá de su ventaja de espectro y centrarse en incrementar el número de sites físicos en áreas rurales. En el tercer trimestre de 2024, Vodafone y Movistar registraron en el mercado español una disponibilidad 4G del 95,1% y 93,4% respectivamente, seguidas de Orange con un 92,7% y Yoigo con un 91,5%.
Paralelamente a la consolidación de la red de MásOrange, DIGI está construyendo su propia infraestructura para dejar de depender gradualmente de un acuerdo de roaming y del uso compartido de RAN con Telefónica, comenzando con zonas urbanas y suburbanas. La Comisión Europea diseñó los remedies de desinversión de espectro para que DIGI replique la presión competitiva ejercida anteriormente por MásMóvil. El objetivo es que DIGI transporte una proporción similar de su tráfico total de datos móviles en su propia red en los próximos años, al menos igualando la cuota on-net del 40-60% que MásMóvil lograba antes de la fusión.
Provincias rurales de España, a la zaga en disponibilidad de 5G, lo que destaca la importancia del apoyo gubernamental a través de UNICO.
Speedtest Intelligence® | Disponibilidad general 5G (%) en 2024
En términos generales, se espera que los compromisos de inversión a largo plazo de DIGI y MásOrange, impulsados por la consolidación, unidos al apoyo gubernamental con programas como Único, impulsen la competitividad internacional de España en rendimiento móvil en los próximos años. El país tiene mucho por hacer, ya que a finales de 2024 ocupa el puesto 57 en Índice Global de Speedtest, situándose por detrás de la mayoría de sus colegas europeos en rendimiento de red, incluidas velocidad de descarga, coherencia y cobertura.
Ookla retains ownership of this article including all of the intellectual property rights, data, content graphs and analysis. This article may not be quoted, reproduced, distributed or published for any commercial purpose without prior consent. Members of the press and others using the findings in this article for non-commercial purposes are welcome to publicly share and link to report information with attribution to Ookla.
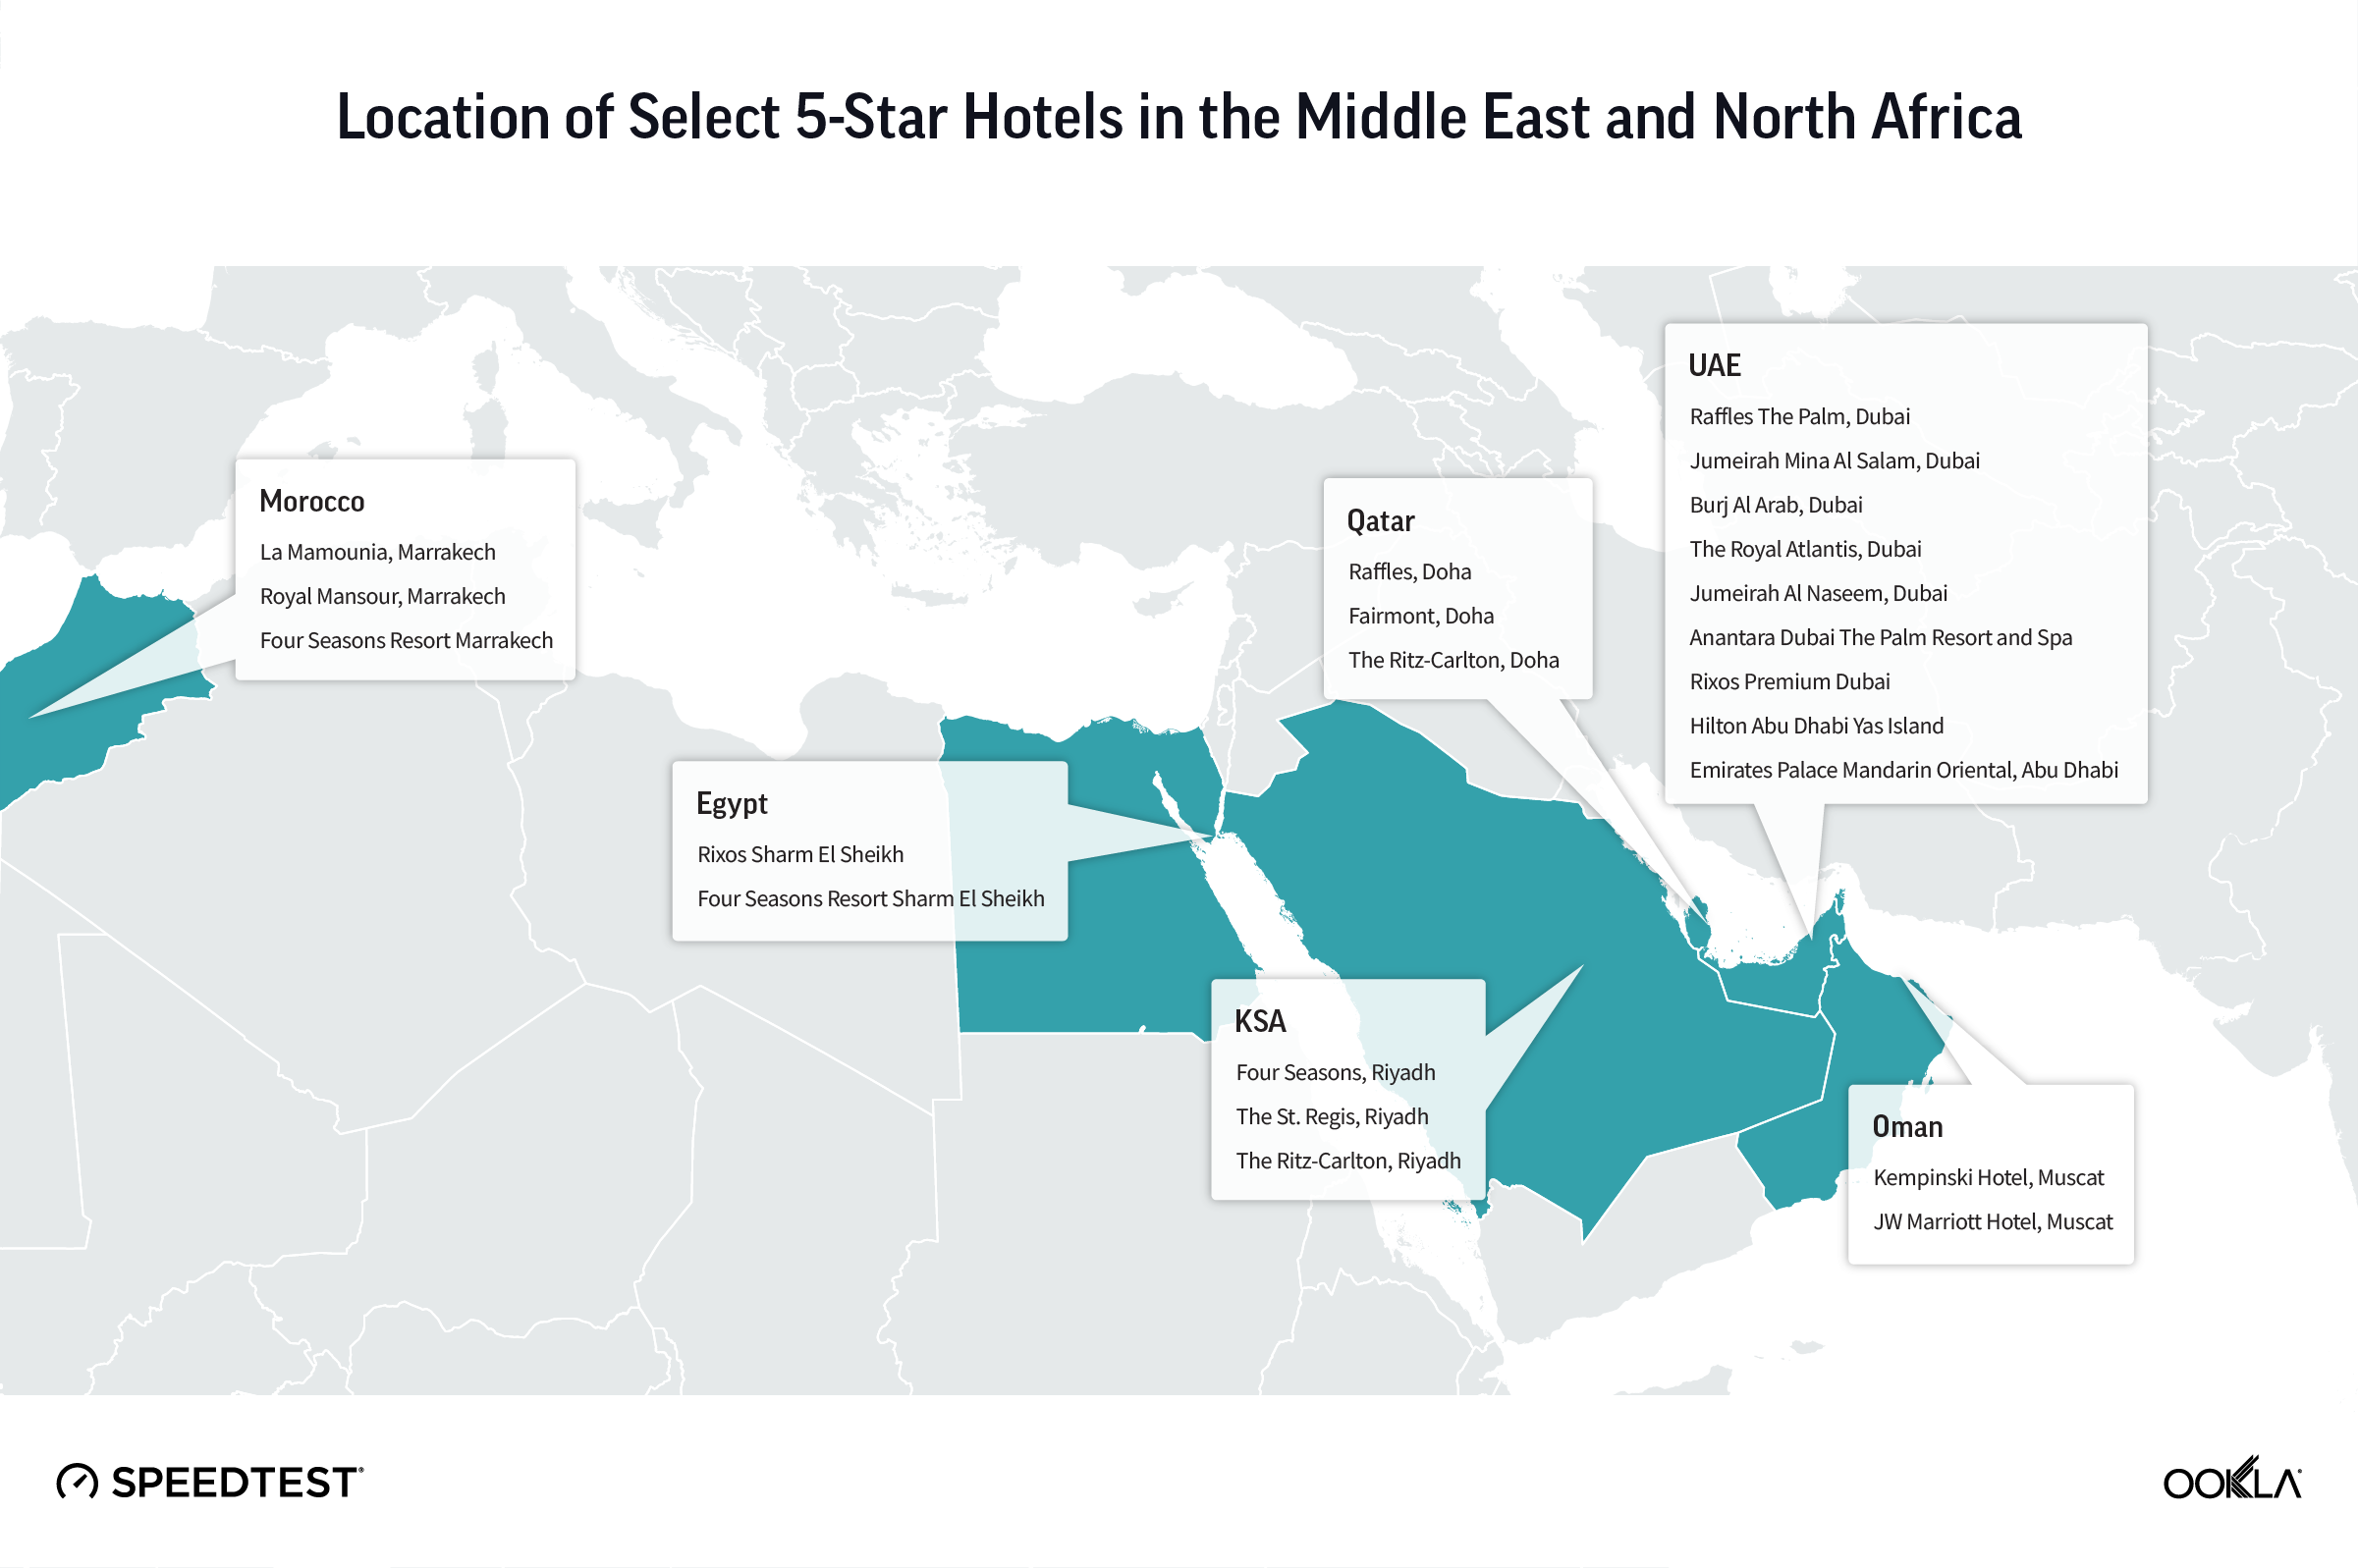
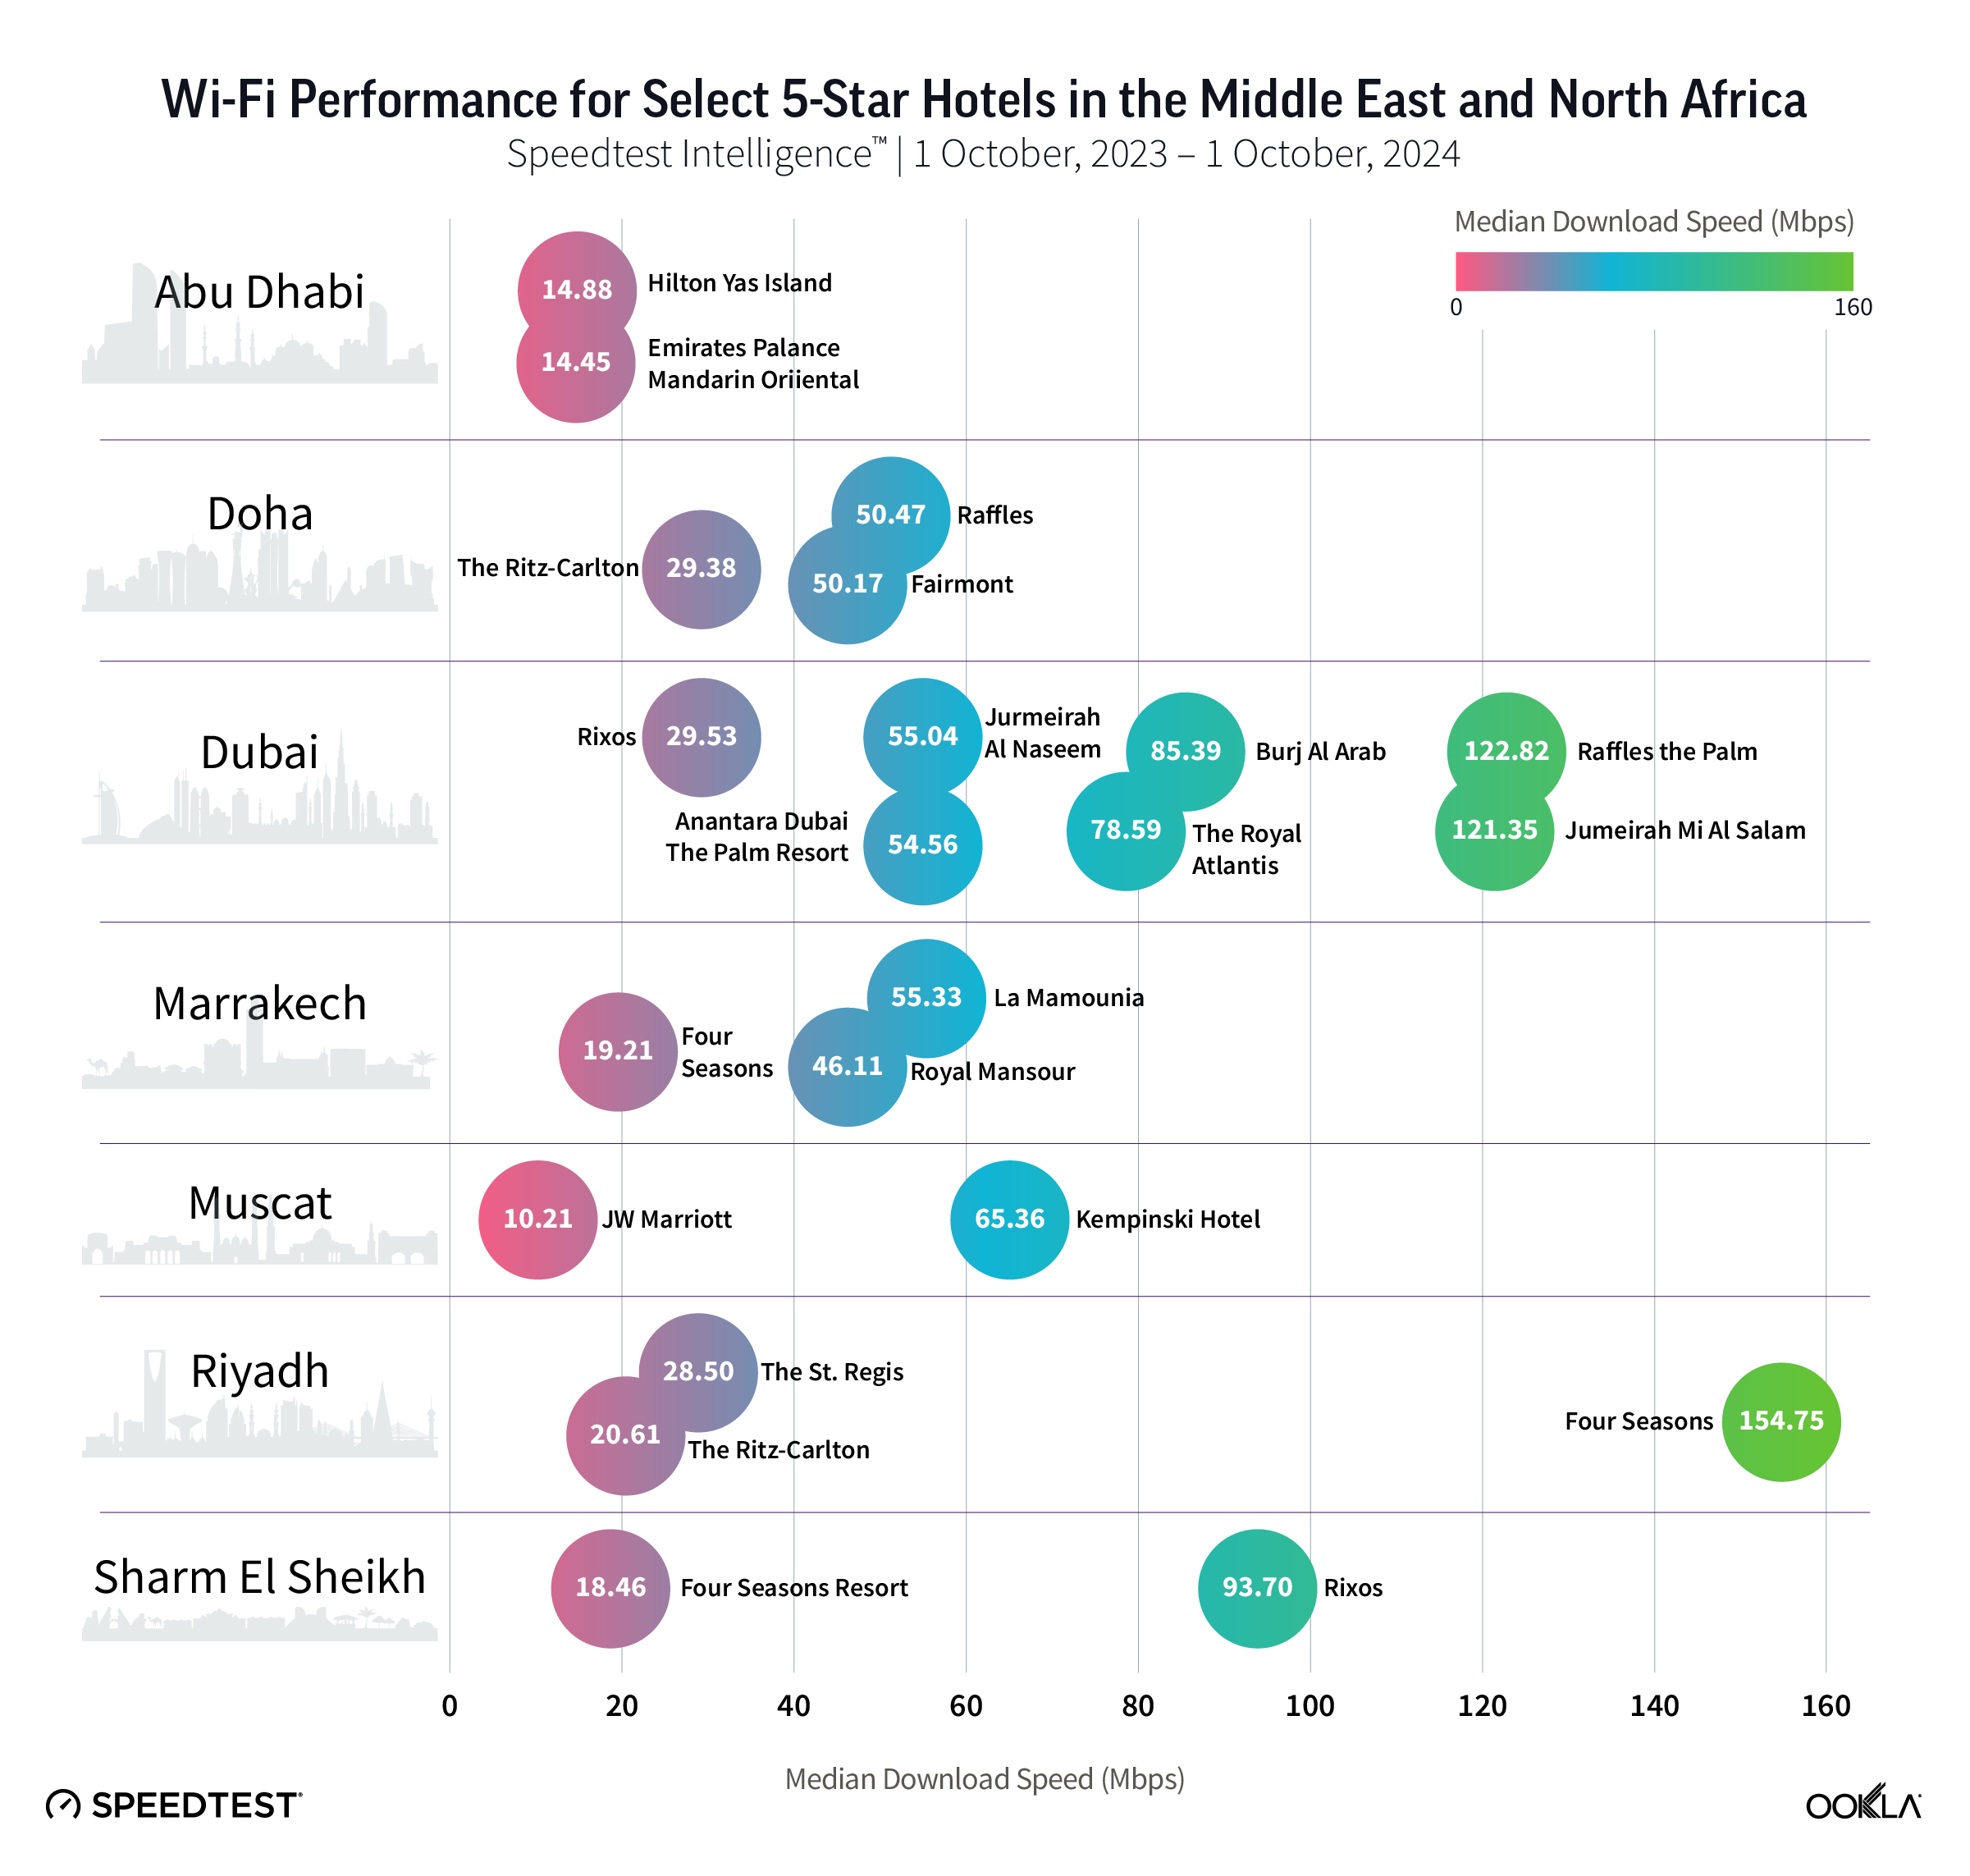
High-speed Wi-Fi has become essential for guest satisfaction in luxury hospitality to attract more tourists and business travelers, particularly in the Middle East and North Africa (MENA). Whether you’re a leisure traveler trying to find your next home away from home or a digital nomad looking for the ideal remote work location, this article offers insights into Wi-Fi performance in MENA’s luxury hospitality market. It also discusses how hotels can improve their Wi-Fi network and use it as a differentiator to attract and retain guests.
Key Takeaways:
Luxury hotels in Riyadh and Dubai offer some of the fastest Wi-Fi in MENA. Only three of the 22 properties and resorts reviewed achieved a median download speed of over 100 Mbps between October 2023 and October 2024. They include Four Seasons in Riyad, with a median speed of 154.75 Mbps, Raffles The Palm, and Jumeirah Mina Al Salam, both in Dubai, with 122.82 Mbps and 121.35 Mbps, respectively.
Just over half of the reviewed hotels provided Wi-Fi with a median download speed of at least 50 Mbps. 41% of the properties provided a speed between 50 Mbps and 100 Mbps; these include iconic hotels, such as Burj Al Arab and the Royal Atlantis in Dubai. The remaining 45% of hotels offered a speed below 50 Mbps, including those in the Gulf region, suggesting that the issue is with the Wi-Fi network and not with the capacity of the broadband connection.
Hotels should actively monitor and improve their Wi-Fi to remain competitive. Hotels can enhance Wi-Fi performance by increasing bandwidth, upgrading modern networking equipment, optimizing access point placement, performing regular maintenance, and gathering guest feedback to inform improvements.
Fast and reliable Wi-Fi is critical to the experience of tourists, business travelers, and remote workers
Fast and reliable Wi-Fi is essential for the hospitality industry, particularly in the MENA region, where tourists and business travelers expect seamless internet access to stream their favorite TV shows, have virtual meetings, and stay in touch. The COVID-19 pandemic accelerated this trend, making remote work the new normal. Some cities, such as Dubai and Abu Dhabi, rolled out the red carpet to digital nomads and professionals, offering special visas and incentives to attract them. Even holidaygoers and families require more bandwidth to enjoy premium video streaming services and connect multiple devices simultaneously.
As the luxury hospitality sector is booming in the region, the quality of Wi-Fi can be a decisive factor in travelers’ decision to select a property over another in a highly competitive market. According to a survey conducted in the USA, 74% of panelists believe that Wi-Fi quality is important to attract guests and maintain their loyalty. Poor Wi-Fi can negatively impact guest experiences, review scores, and occupancy rates.
Luxury hotels in Riyadh and Dubai have among the fastest Wi-Fi networks in MENA
Using Speedtest Intelligence® data, we analyzed Wi-Fi performance across 22 top-rated five-star hotels and resorts shortlisted based on desk research for the most popular properties and recent recommendations from Condé NastTraveler, Travel + Leisure, and Business Traveller Middle East. We also aimed to have representation from the Gulf region, Middle East, and North Africa.
The map below shows the city distribution of the hotels selected. The U.A.E. is most represented, with nine properties and resorts spread across Dubai and Abu Dhabi. Riyadh, Doha, and Marrakesh contributed three hotels each, followed by Muscat in Oman and Sharm El Sheikh in Egypt, with two hotels each.
We benchmarked median download speeds inside and around the properties over one year (October 2023 and October 2024). This period helps us gauge the performance and stability of the Wi-Fi network with different levels of hotel occupancy and guest profiles. We excluded hotels with low measurement sample counts and considered only the most common Wi-Fi network name in each hotel, which is usually freely accessible to guests. To this end, we excluded Wi-Fi networks set up specifically for special events like sporting competitions.
Data analysis revealed three groups of hotels based on Wi-Fi download speed:
Top performers include hotels with a median download speed exceeding 100Mbps. These speeds facilitate multiple 4K streams, ultra-fast downloads, and lag-free video conferencing, catering to the most demanding digital needs.
Good performers include hotels with a median download speed between 50Mbps and 100Mbps. These represent 41% of the properties reviewed. This group comprises iconic hotels such as Burj Al Arab and the Royal Atlantis in Dubai.
Performance laggards include hotels with a median download speed below 50 Mbps, representing more than 45% of the properties reviewed. This speed may be suitable for single high-definition to 4K streaming but struggles with more data-intensive activities at busy times.
Four Seasons in Riyadh, Raffles The Palm, and Jumeirah Mina Al Salam, both in Dubai, top the list with a median download speed of 154.75 Mbps, 122.82 Mbps, and 121.35 Mbps, respectively. The download speeds of good-performing hotels range from just over 50 Mbps for Rafflesand Fairmont, colocated in Doha’s Katara Towers, to 93.70 Mbps for Rixos Sharm El Sheikh. The other hotels in this category are located in Dubai, Muscat, and Marrakesh.
Every city has hotels in the laggards’ category, with speeds ranging from 10.21 Mbps to 46.11 Mbps. At the bottom of the list, we find two in Abu Dhabi, Hilton Yas Island and Emirates Palace Mandarin Oriental, with speeds of 14.88 Mbps and 14.45 Mbps, respectively, and JWMarriott Hotel Muscat, at 10.21 Mbps.
For reference, Netflix recommends a minimum of 15 Mbps for 4K video streaming. More specifically, in the hospitality industry, and based on a survey, 56% of hotel guests in the USA expected hotels to offer Wi-Fi speeds of at least 50 Mbps for the service to be acceptable. Speedtest results show that over half of the reviewed hotels in MENA meet or exceed that threshold.
While Gulf countries top the Speedtest Global Index, we note that many hotels in that region offer sub-50 Mbps, suggesting that the issue is with the Wi-Fi network and not with the capacity of the broadband connection. Conversely, hotels in Sharm El Sheikh and Marrakesh outperformed many of their peers in Gulf countries, suggesting a combination of good internet capacity and optimal Wi-Fi installation.
Deploying modern and well-configured Wi-Fi equipment helps to realize speed gains
The placement and configuration of Wi-Fi access points influence the speed and coverage guests can experience. Speedtest data shows that Wi-Fi 6 standard (802.11ax) and 5 GHz frequency spectrum, which privileges speed over coverage, are more commonly found in top-performing hotels than lower-performing ones.
Speed gains of Wi-Fi 6 over Wi-Fi 5 (802.11ac) and Wi-Fi 5 over Wi-Fi 4 (802.11n) are more significant at higher speed ranges (above 75 Mbps). Furthermore, tests that used the 5 GHz frequency consistently outperformed those over 2.4 GHz (which provides better coverage but with lower performance) across a wide range of speeds, with more substantial improvements at higher speeds.
Test Distribution by Wi-Fi Standard and Frequency Band for Different Hotels’ Performance Categories
Source: Speedtest Intelligence® | 1 October 2023 – 1 October 2024
Test Distribution by Wi-Fi Standard and Frequency Band for Different Hotels’ Performance Categories
Hotels should actively monitor and improve their Wi-Fi to remain competitive
Delivering high-speed and consistent Wi-Fi across different parts of a hotel is challenging because of the inherent design and structure of the property. The size and layout of the hotel play a crucial role; larger establishments with multiple floors and large common areas can create dead zones where the signal weakens or fails. Additionally, the materials used in construction—such as concrete, metal, and glass—can significantly attenuate Wi-Fi signals, leading to inconsistent connectivity in certain areas. Furthermore, the high density of guests during peak seasons can strain the network, resulting in slower speeds and dropped connections.
In addition to upgrading networking equipment, including routers and access points that support the latest Wi-Fi standards, hotels can improve network experience by adopting the following steps:
Increase bandwidth: Ensure sufficient internet bandwidth to accommodate the number of guests and their usage patterns.
Conduct a site survey to identify dead zones and areas with weak signals and interference. This will help in planning the placement of access points for optimal coverage.
Optimize placement of access points: Distribute access points throughout the hotel to ensure consistent coverage reduce congestion, and upgrade cables to take advantage of increased bandwidth.
Regular maintenance and updates: Update firmware and software for networking equipment to ensure security and performance.
Monitor network performance: Use monitoring tools to track performance metrics like speed and coverage to identify problems and inform future upgrades.
Gather guest feedback: Include questions about Wi-Fi quality in the checkout surveys to better understand their needs and make necessary adjustments.
As the luxury hospitality sector in the MENA region continues to flourish, hotels must recognize that high-speed and reliable Wi-Fi is no longer just a nice-to-have feature but a critical expectation of their guests. Investing in connectivity and optimizing Wi-Fi infrastructure will not only enhance guest experience and satisfaction but also help stand out in the competitive market in MENA.
By investing in providing seamless connectivity, hotels can attract a broader range of travelers—including digital nomads and business professionals—and foster loyalty among guests. This will also help local luxury hotels become sought-after destinations for luxury holidays and remote work.
Ookla can assist hospitality property managers in designing Wi-Fi networks, monitoring their performance, and optimizing them. Please contact us to learn more about Speedtest Intelligence and Ekahau.
Ookla retains ownership of this article including all of the intellectual property rights, data, content graphs and analysis. This article may not be quoted, reproduced, distributed or published for any commercial purpose without prior consent. Members of the press and others using the findings in this article for non-commercial purposes are welcome to publicly share and link to report information with attribution to Ookla.
More than 80% of Canadians have access to fixed broadband networks, but for rural Canadians that figure drops to just 60%. Yet, this gap between who has broadband access and who doesn’t is closing in rural areas at a rate nearly three times faster than in urban areas. Canada is narrowing its rural broadband divide thanks to a clearly articulated and well-funded connectivity strategy to ensure high-speed internet access for all.
Using Speedtest Intelligence® data, this report identifies Canada’s Provinces and Territories that are delivering the minimum standard for fixed broadband speeds, as established by the Canadian Radio-television and Telecommunications Commission (CRTC). Based on data from the 1H 2024 (and compared to 1H 2023), it also analyzes performance in other geographic splits, including Urban-vs-Rural and the Remoteness Index.
Key Takeaways
As many as 2 million more Canadians enjoyed broadband speeds in the first half of 2024 compared to the first half of 2023.
Rural Canadian Speedtest users saw a 23% increase in those with broadband speeds in 1H 2024over 1H 2023.
Satellite internet service plays a key role in closing the broadband divide for Canada’s vast geography. In the U.S., regulators were ambivalent about allowing satellite internet to qualify for government broadband funding (this attitude has recently begun to change in favor). Canada knew many years ago that satellite internet was critical.
Broadband in the Spotlight
While the COVID-19 pandemic shined a light on the digital divide, the government of Canada has long been investing in broadband deployments to close the gap. In 2014 it established the Connecting Canadians program (CCP), allocating C$305M to improve connectivity for 300,000 underserved households.
The Connect to Innovate (CTI) program was launched in December 2016 with C$500M (and C$85M added to CTI in 2019) to expand high-speed Internet in communities underserved by the private sector. The CTI aimed to improve access for over 380,000 homes.
Deepening its investments in 2020, perhaps in response to COVID-19 lockdowns, the Canadian government launched the C$3.225B Universal Broadband Fund (UBF).
UBF
Universal Broadband Fund (2020)
$3.225B
CTI
Connect To Innovate (2016)
$585M
CCP
Connecting Canadians Program (2014)
$305M
With over C$4B from these programs alone, the CRTC has a goal of connecting 98% of Canadians to high-speed internet (broadband) delivering at least 50 Mbps download (DL) and 10 Mbps upload (UL) speeds (50/10 Mbps) by 2026, and 100% by 2030.
Conquer Divide
Canada’s population of 41 million is concentrated in a handful of large, urban metropolitan areas near the U.S. border. However, despite the country’s large land mass, it is highly urbanized. Approximately two-thirds, or 27 million, of Canadians live within 100 kilometers of the U.S. border —about the distance from the border to Winnipeg —yet this is only 4% of Canada’s land mass.
Imagine a line across lower Canada, 100 km north of Canada’s southern border – crossing Winnipeg in the middle of the population distribution map. In the area below the line and above the border with the U.S., 82.2% of Speedtest users are getting the CRTC’s minimum standard for fixed broadband speeds (50/10 Mbps). For Speedtest users north of the 100 km line, 76.3% met (or exceeded) the standard. Just a 5.9 percentage points gap.
However, the 100 km line is rather blunt and unsophisticated (and imaginary). Instead let’s look at the Urban-vs-Rural division as well as a more-granular designation based on the Remoteness Index.
Compared with the 100 km line’s gap, the Urban-vs-Rural digital divide aligns more closely with expectations of a larger disparity between these geographic areas. Specifically, 83.8% of Urban users meet the 50/10 Mbps standard, compared to 60.0% of Rural users resulting in a 23.8 percentage point gap.
The good news is the gap has closed from the prior year with Rural users seeing a 23% improvement compared to 5% for Urban users. To emphasize this further, in the first half of 2023 fewer than 50% of Rural users were able to get broadband speeds of 50/10 Mbps. This indicates that efforts to address this gap (i.e., UBF) were targeting the right places.
Continuing across the table, median download and upload speeds are roughly three times faster among urban than rural Speedtest users (DL 251.62 Mbps vs 90.76 Mbps and UL 64.82 Mbps vs 18.88 Mbps, respectively). Comparing the rural median speeds to the 50/10 Mbps threshold shows that half of Speedtest users in rural Canada enjoy download speeds that are 40.76 Mbps (i.e., 90.76 minus 50) and upload speeds that are 8.88 Mbps (i.e., 18.88 minus 10) faster than the target. (This is not to say that an individual Speedtest user experiences both upload and download speeds over the threshold, which is required for the target.)
The difference in Urban and Rural latency literally demonstrates the difference in physical distances (which not only means farther, but also more hops or switching; even buffering time based on the capacity of the data transport) .
The Remoteness Index presents a similar picture in finer geographic slices. (As one would expect, since the underlying data is the same.) Not surprisingly, the percentage of Speedtest users that meet the 50/10 Mbps threshold decreases as their location moves from least remote to most remote. Here too, speed and latency degrade at each step of remoteness, correlating with those meeting the 50/10 Mbps threshold percentages.
The percentage change from the prior year tells a similar story of greater improvement in the more remote geographies, but with some nuance. While we might expect Most Remote to demonstrate even more improvement and be greater than More Remote, deployment challenges and associated costs to deliver telecommunications infrastructure in the most remote geographies can be exponentially prohibitive. Thus, this extreme lack of population density coupled with difficult topography explain why government programs like CTI are needed, and why other solutions like satellite are viable.
The Provinces and The Territories
In the above analysis, broadband speeds were assessed using an imaginary 100 km demarcation, illustrating the concentration of population along Canada’s southern border. Before examining broadband performance and the digital divide among Canada’s provinces and territories, here are additional facts about Canada’s relative sparseness of people in its vast geography.
Landmass: The combined land area of the territories (Yukon, Northwest, Nunavut) is larger than the land area of India, the world’s 7th largest (and most populous) country
Population: The population of the territories is equivalent to the total number of births across Canada every four months.
The territories hold just 0.3% of Canada’s population on 39% of its land. Canada is often compared to the U.S., but Australia is a better comparison, with both Canada and Australia ranking among the least densely populated countries in the world.
Now let’s examine the 50/10 Mbps threshold in the provinces and territories.
Province / Territory
% Meeting 50/10 Mbps 1H 2024
Change from 1H 2023
Urban-Rural Gap 1H 2024, %pts
Newfoundland and Labrador
81.7
6%
22.5
British Columbia
79.8
4%
21.9
New Brunswick
78.1
2%
14.0
Nova Scotia
77.8
9%
8.2
Québec
76.5
8%
9.8
Ontario
76.0
8%
33.9
Alberta
75.7
5%
30.0
Manitoba
71.7
11%
20.8
Prince Edward Island
71.2
14%
18.5
Saskatchewan
64.7
17%
33.0
Northwest Territories
57.3
8%
-7.1
Yukon Territory
53.2
14%
6.7
Nunavut
36.2
94%
Not meaningful
In this table, by geography, percentage of Speedtest users achieving the CRTC broadband speed targets in 1H 2024, compared with the same period in prior year, and the digital divide.
Following the logic of the Remoteness Index, the territories have the fewest Speedtest users meeting the 50/10 Mbps threshold. The percentage changes in the territories from 2023 do not follow the same pattern seen in the Urban-vs-Rural chart and Remoteness Index because these geographies are a mix of these geographic definitions (as it is in the provinces). Similarly, the Urban-vs-Rural gap result is confounded by sparse population. In Nunavut, more than half of the population is defined as rural.
On the top of the table, Newfoundland and Labrador, New Brunswick, and Nova Scotia may be unexpected leaders in meeting the 50/10 Mbps threshold. New Brunswick and Nova Scotia have relatively higher population density among the provinces and territories which (economically) encourages the deployment of telecommunications infrastructure. This appears to play out in the Urban-vs-Rural gap as well, ranking among the lowest gaps in the provinces.
The exceptional performance of Newfoundland and Labrador (81.7% meeting 50/10 Mbps) can partly be attributed to the vast majority of its population residing on the island of Newfoundland, and half of them, in turn, residing on the Avalon peninsula (see the population distribution map above and St. John’s in the east). This concentration of population underscores the fundamental reality of economics in telecommunications deployment. And in the opposite direction, the Urban-vs-Rural gap (22.5%pts) also makes this same point for the need for the funding programs like UBF to address the digital divide.
Breaking Down the Digital Divide
Percentage of Urban and Rural Speedtest users in each Province/Territory with broadband speeds of at least 50/10 Mbps, 1H 2024, Nunavut: Urban n too small; Rural 43.6%
Look, Up in the Sky
As addressed in the discussion about Most Remote, because of Canada’s topographical challenges, fiber and electricity are cost prohibitive in many deployment cases. In 2019, Canada added C$85M to its CTI program because it recognized that it needed support for low-Earth orbit (LEO) satellites to reach its connectivity goals (50/10 Mbps connectivity to 95% of Canadians by 2026, and the hardest-to-reach Canadians by 2030).
Briefly looking across Canada for Speedtest users of satellite internet services during the first half of 2024, over half saw download speeds of 72.90 Mbps or greater, and upload speeds of 12.47 or greater. Moreover, in the territory of Nunavut the speeds were basically identical (75.16 Mbps and 12.50 Mbps, respectively), which makes sense since Nunavut is equally Urban or Rural (or More Remote or Less Remote) to an orbiting satellite a few hundred miles overhead. Clearly LEO is a viable solution technically and economically.
Whether fiber or satellite, broadband connectivity means nothing without power. The cost of electricity in the north can be ten times more expensive than in southern cities. In some cases, diesel fuel burned for both heat and electricity is flown, shipped by sea, or by tanker over frozen lakes and rivers in the winter. As with broadband, the Canadian government has a plan to invest in Rural and Northern Communities to make available affordable and clean energy.
Another barrier to fully-connected communities that affects Urban as well as the Most Remote is digital literacy (though the latter faces compounding factors). Here again the Canadian government is addressing the issue with initiatives such as its Digital Literacy Exchange Program.
No matter the geographic lens – Urban-vs-Rural, Remoteness Index, or Provinces and Territories – the goal is to get to 100% in 2030. But even 100% broadband connectivity from a purely technical perspective, would not be 100% in spirit without other programs and initiatives like these. Communication is achieved when the signal is received, not just sent.
Recently, Ookla also looked at the broadband and digital divide in the U.S. – How the 50 U.S. States Stack up in Broadband Speed Performance: 1H 2024 | Ookla®. We look forward to providing more updates on the U.S. and Canada’s progress to provide high-speed internet connectivity for all. For more information about Speedtest Intelligence data and insights, please get in touch.
Le Rétrécissement de la Fracture Numérique au Canada
Plus de 80 % des Canadiens ont accès à des réseaux fixes à large bande, mais pour les Canadiens des régions rurales, ce chiffre tombe à seulement 60 %. Pourtant, cet écart entre ceux qui ont accès à la large bande et ceux qui n’en ont pas se rétrécit dans les régions rurales à un rythme près de trois fois plus rapide que dans les zones urbaines. Le Canada réduit la fracture numérique dans les régions rurales grâce à une stratégie de connectivité clairement articulée et bien financée pour assurer l’accès à l’Internet haute vitesse pour tous.
À l’aide des données de Speedtest Intelligence®, le présent rapport identifie les provinces et les territoires du Canada qui fournissent la norme minimale pour les vitesses à large bande fixes, telle qu’établie par le Conseil de la Radiodiffusion et des Télécommunications Canadiennes (CRTC). Sur la base des données du 1er semestre 2024 (et par rapport au 1er semestre 2023), il analyse également les performances dans d’autres catégories géographiques, y compris les catégories urbaine et rurale ainsi que l’indice d’éloignement (Remoteness Index).
Principaux points à retenir
Pas moins de 2 millions de Canadiens supplémentaires ont bénéficié de l’accès à Internet haute vitesse au premier semestre 2024 par rapport au premier semestre 2023.
Les utilisateurs ruraux canadiens de Speedtest ont vu une augmentation de 23 % de ceux qui ont accès à Internet haute vitesse au cours du premier semestre 2024par rapport au premier semestre 2023.
Le service Internet par satellite constitue un levier essentiel pour réduire la fracture numérique et améliorer l’accès à la large bande sur l’immense territoire canadien. Aux États-Unis, les organismes de réglementation étaient ambivalents quant à autoriser le financement par le gouvernement de l’Internet par satellite (cette attitude a récemment commencé à changer). Le Canada savait il y a de nombreuses années que l’Internet par satellite était essentiel.
La large bande sous les feux de la rampe
Alors que la pandémie de COVID-19 a mise en lumière la fracture numérique, le gouvernement du Canada investit depuis longtemps dans le déploiement de la large bande pour réduire cet écart. En 2014, il a mis sur pied le programme Un Canada branché, allouant 305 millions de dollars canadiens pour améliorer la connectivité de 300 000 ménages mal desservis.
Le programme Brancher pour innover a été lancé en décembre 2016 avec 500 millions de dollars canadiens (85 millions de dollars canadiens supplémentaires alloués en 2019) pour étendre l’accès a l’Internet à haut débit dans les communautés mal desservies par le secteur privé. Ce programme visait à améliorer l’accès à plus de 380 000 foyers.
Renforçant ses investissements en 2020, peut-être en réponse aux confinement lié au COVID-19, le gouvernement canadien a lancé le Fonds universel pour la large bande, doté de 3,225 milliards de dollars canadiens.
UBF
Fonds universel pour la large bande (2020)
3,225 milliards de dollars
CTI
Brancher pour innover (2016)
585 M$
CCP
Programme « Un Canada branché » (2014)
305 M$
Avec plus de 4 milliards de dollars canadiens provenant de ces programmes uniquement, le CRTC a pour objectif de connecter 98 % des Canadiens à l’Internet haute vitesse (large bande) offrant des vitesses d’au moins 50 Mbps en téléchargement (DL) et 10 Mbps en téléversement (UL) (50/10 Mbps) d’ici 2026, et 100 % d’ici 2030.
Vaincre la fracture
La population de 41 millions d’habitants du Canada est concentrée dans une poignée de métropoles près de la frontière américaine. Malgré l’immensité du pays, le Canada est fortement urbanisé. Environ les deux tiers, soit 27 millions, des Canadiens vivent à moins de 100 kilomètres de la frontière américaine, soit environ la distance entre la frontière et Winnipeg; mais cette zone ne représente que 4 % de la superficie du Canada.
Imaginez une ligne traversant le Canada, à 100 km au nord de sa frontière méridionale, et traversant Winnipeg au milieu de la carte de répartition de la population. Dans la zone située sous la ligne de démarcation et au-dessus de la frontière avec les États-Unis, 82,2 % des utilisateurs de Speedtest obtiennent la norme minimale du CRTC pour les vitesses des services à large bande fixe (50/10 Mbps). Pour les utilisateurs du Speedtest au nord de la ligne des 100 km, 76,3 % respectent (ou dépassent) la norme. Soit un écart de seulement 5,9 points.
Cependant, la ligne des 100 km reste une mesure assez simpliste, peu sophistiquée et, de surcroît, imaginaire. Examinons plutôt la division entre les zones urbaines et rurales, ainsi qu’une classification plus détaillée basée sur l’indice d’éloignement.
Comparée à celle définie par la ligne des 100 km, la fracture numérique entre les zones urbaines et rurales correspond davantage aux attentes, reflétant une disparité plus marquée entre ces zones géographiques. Plus précisément, 83,8 % des utilisateurs urbains respectent la norme de 50/10 Mbps, comparativement à 60,0 % des utilisateurs ruraux, ce qui donne un écart de 23,8 points.
La bonne nouvelle est que l’écart s’est réduit par rapport à l’année précédente, les utilisateurs ruraux ayant constaté une amélioration de 23 %, contre 5 % pour les utilisateurs urbains. Pour souligner davantage ce point, au cours du premier semestre de 2023, moins de 50 % des utilisateurs ruraux ont pu obtenir des vitesses à large bande de 50/10 Mbps. Cela indique que les efforts déployés pour combler cette lacune (c’est-à-dire le Fonds universel pour la large bande) ont été utilisés à bonne fin.
Si l’on poursuit la lecture du tableau, les vitesses médianes de téléchargement et de téléversement sont environ trois fois plus élevées chez les utilisateurs urbains que chez les utilisateurs ruraux de Speedtest (DL 251,62 Mbps contre 90,76 Mbps et UL 64,82 Mbps contre 18,88 Mbps, respectivement). La comparaison des vitesses médianes en milieu rural avec le seuil de 50/10 Mbps montre que la moitié des utilisateurs de Speedtest dans les régions rurales du Canada bénéficient de vitesses de téléchargement de 40,76 Mbps (c.-à-d. 90,76 moins 50) et de vitesses de téléversement de 8,88 Mbps (c.-à-d. 18,88 moins 10) plus rapides que l’objectif fixé. (Cela ne signifie pas pour autant qu’un utilisateur individuel de Speedtest bénéficie à la fois de vitesses de téléchargement et de téléversement dépassant le seuil requis, ce qui est nécessaire pour atteindre l’objectif.)
La différence entre les temps de latence en milieu urbain et en milieu rural illustre littéralement la différence entre les distances physiques (ce qui signifie non seulement des distances plus grandes, mais aussi un plus grand nombre de sauts de traffic).
L’indice d’éloignement présente une image similaire dans des tranches géographiques plus fines. (Comme on pouvait s’y attendre, puisque les données sous-jacentes sont les mêmes.) Il n’est pas surprenant de constater que le pourcentage d’utilisateurs Speedtest qui atteignent le seuil de 50/10 Mbps diminue au fur et à mesure que cette indice augmente. Ici aussi, la vitesse et la latence se dégradent avec l’augmentation de l’indice, en corrélation avec le pourcentage d’utilisateurs atteignant de seuil de 50/10 Mbps.
La variation (en pourcentage) par rapport à l’année précédente offre des similarités, avec une amélioration dans les zones géographiques les plus éloignées, mais avec tout en apportant une certaine nuance. On pourrait s’attendre à ce que les régions les plus éloignées s’améliorent, mais les difficultés de déploiement et les coûts associés à la mise en place d’une infrastructure de télécommunications dans les zones géographiques les plus reculées peuvent être exponentiellement prohibitifs. Ainsi, ce manque extrême de densité de population, associé à une topographie difficile, explique pourquoi des programmes gouvernementaux sont nécessaires et pourquoi d’autres solutions comme l’accès par satellite sont viables.
Les provinces et les territoires
Dans l’analyse ci-dessus, les vitesses à large bande ont été évaluées à l’aide d’une démarcation imaginaire de 100 km, illustrant la concentration de la population le long de la frontière sud du Canada. Avant d’examiner les performances de la large bande et la fracture numérique parmi les provinces et territoires du Canada, voici quelques faits supplémentaires concernant la relative faiblesse de la densité de population dans l’immensité géographique du pays.
Masse continentale : La superficie terrestre combinée des territoires (Yukon, Nord-Ouest, Nunavut) est plus grande que la superficie de l’Inde, le 7e pays le plus grand (et le plus peuplé) du monde
Population : La population des territoires équivaut au nombre total de naissances au Canada tous les quatre mois.
Les territoires ne représentent que 0,3 % de la population du Canada mais 39 % de son territoire. Le Canada est souvent comparé aux États-Unis, mais l’Australie est une meilleure comparaison; le Canada et l’Australie se classant parmi les pays les moins densément peuplés du monde.
Examinons maintenant le seuil de 50/10 Mbps dans les provinces et les territoires.
Province / Territoire
% Atteignant l’objectif 50/10 Mbps 1H 2024
Changement par rapport à 1H 2023
Écart entre les zones urbaines et rurales 1H 2024, %pts
Terre-Neuve-et-Labrador
81,7
6 %
22,5
Colombie-Britannique
79,8
4 %
21,9
Nouveau-Brunswick
78,1
2 %
14,0
Nouvelle-Écosse
77,8
9 %
8,2
Québec
76,5
8 %
9,8
Ontario
76,0
8 %
33,9
Alberta
75,7
5 %
30,0
Manitoba
71,7
11 %
20,8
Île-du-Prince-Édouard
71,2
14 %
18,5
Saskatchewan
64,7
17 %
33,0
Territoires du Nord-Ouest
57,3
8 %
-7,1
Territoire du Yukon
53,2
14 %
6,7
Nunavut
36,2
94 %
Pas significatif
Pourcentage d’utilisateurs de Speedtest atteignant les objectifs de vitesse de large bande du CRTC au premier semestre 2024 par région par rapport à la même période de l’année précédente.
Suivant la logique de l’indice d’éloignement, les territoires ont le moins d’utilisateurs Speedtest répondant au seuil de 50/10 Mbps. Les variations en pourcentage dans les territoires à partir de 2023 ne suivent pas la même tendance que celle observée dans le graphique urbain/rural et l’indice d’éloignement, car ces géographies sont un mélange de ces définitions géographiques (comme c’est le cas dans les provinces). De même, le résultat de l’écart entre les zones urbaines et les zones rurales est faussé par la faible densité de population. Au Nunavut, plus de la moitié de la population est définie comme rurale.
En haut du tableau, Terre-Neuve-et-Labrador, le Nouveau-Brunswick et la Nouvelle-Écosse pourraient être des chefs de file inattendus dans la réalisation du seuil de 50/10 Mbps. Le Nouveau-Brunswick et la Nouvelle-Écosse ont une densité de population relativement plus élevée parmi les provinces et les territoires, ce qui encourage (économiquement) le déploiement de l’infrastructure de télécommunications. Cela semble également se jouer dans l’écart entre les régions urbaines et rurales, qui se classe parmi les écarts les plus faibles dans les provinces.
La performance exceptionnelle de Terre-Neuve-et-Labrador (81,7 % atteignant 50/10 Mbps) peut en partie être attribuée au fait que la grande majorité de sa population réside sur l’île du Terre Neuve, dont la moitié vit sur la péninsule d’Avalon (voir la carte de répartition de la population ci-dessus et la ville de St. John’s à l’est). Cette concentration de population souligne la réalité fondamentale de l’économie dans le déploiement des télécommunications. Et dans la direction opposée, l’écart entre les zones urbaines et rurales (22,5 % de points) souligne également la nécessité de programmes de financement pour combler la fracture numérique.
Briser la fracture numérique
Pourcentage d’utilisateurs de Speedtest fixe en milieu urbain et rural dans chaque province et territoire ayant accès à des vitesses à large bande de 50/10 Mbps, 1H 2024, Nunavut: Urbain n trop petit; Rural 43.6%
Regardez vers les étoiles
Comme mentionné précédemment, en raison des défis topographiques du Canada, la fibre et l’électricité peuvent avoir des coûts de déploiement prohibitifs dans de nombreux cas. En 2019, le Canada a ajouté 85 millions de dollars canadiens à son programme Brancher pour innover (CTI), car il a reconnu qu’il avait besoin de satellites en orbite basse (LEO) pour atteindre ses objectifs en matière de connectivité (connectivité de 50/10 Mbps pour 95 % des Canadiens d’ici 2026, et pour les Canadiens les plus difficiles à atteindre d’ici 2030).
En examinant brièvement les utilisateurs de Speedtest des services Internet par satellite à travers le Canada durant la première moitié de 2024, plus de la moitié ont enregistré des vitesses de téléchargement de 72,90 Mbps ou supérieures, ainsi que des vitesses de téléversement de 12,47 Mbps ou supérieures. De plus, dans le territoire du Nunavut, les vitesses étaient pratiquement identiques (75,16 Mbps et 12,50 Mbps, respectivement), ce qui est logique, puisque le Nunavut est à la fois urbain et rural (ou plus éloigné et moins éloigné) pour un satellite en orbite à quelques centaines de kilomètres au-dessus. Il est clair que le LEO est une solution viable techniquement et économiquement.
Qu’il s’agisse de fibre ou de satellite, la connectivité à large bande ne signifie rien sans électricité. Le coût de l’électricité dans le nord peut être dix fois plus élevé que dans les villes du sud. Dans certains cas, le carburant diesel utilisé pour le chauffage et l’électricité est transporté par avion, par bateau ou par camion-citerne sur des lacs et des rivières gelés en hiver. Comme pour la large bande, le gouvernement canadien a un plan pour investir dans les collectivités rurales et nordiques afin de rendre disponible une énergie propre et abordable.
Un autre obstacle à des communautés pleinement connectées, qui touche tant les zones urbaines que les régions les plus éloignées, est la maîtrise des outils numériques (bien que ces dernières fassent face à des facteurs aggravants). Là encore, le gouvernement canadien s’attaque au problème avec des initiatives comme son Programme d’échange en matière de littératie numérique.
Peu importe la perspective géographique – urbain par rapport à rural, indice d’éloignement ou provinces et territoires – l’objectif est d’atteindre 100 % en 2030. Mais même une connectivité à large bande à 100 %, d’un point de vue purement technique, ne serait pas à 100 % dans l’esprit sans d’autres programmes et initiatives comme ceux-ci. La communication est réalisée lorsque le signal est reçu, pas seulement envoyé.
Récemment, Ookla a également examiné la fracture numérique et l’accès à la large bande aux États-Unis. – Comment les 50 États américains se positionnent en matière de vitesse de la large bande : 1H 2024 | Ookla®. Nous sommes impatients de fournir d’autres mises à jour sur les progrès réalisés par les États-Unis et le Canada pour fournir une connectivité Internet haute vitesse pour tous. Pour plus d’informations sur les données et les analyses de Speedtest Intelligence, veuillez prendre contact.
Ookla retains ownership of this article including all of the intellectual property rights, data, content graphs and analysis. This article may not be quoted, reproduced, distributed or published for any commercial purpose without prior consent. Members of the press and others using the findings in this article for non-commercial purposes are welcome to publicly share and link to report information with attribution to Ookla.