More than a million Canadians could be left out in the cold
In the head spinning geopolitical trade news, among many items was the canceling and uncanceling of Starlink in Ontario, Canada. In response to President Trump’s proposed tariffs on Canada, Ontario Premier Doug Ford stated on social media platform X that he planned to cancel the province’s contract with Starlink, which is owned by Elon Musk, who is working closely with Trump on a number of initiatives. However, within 24 hours of making that statement, Trump had delayed his planned tariffs and Ford said he would pause his retaliatory measures.
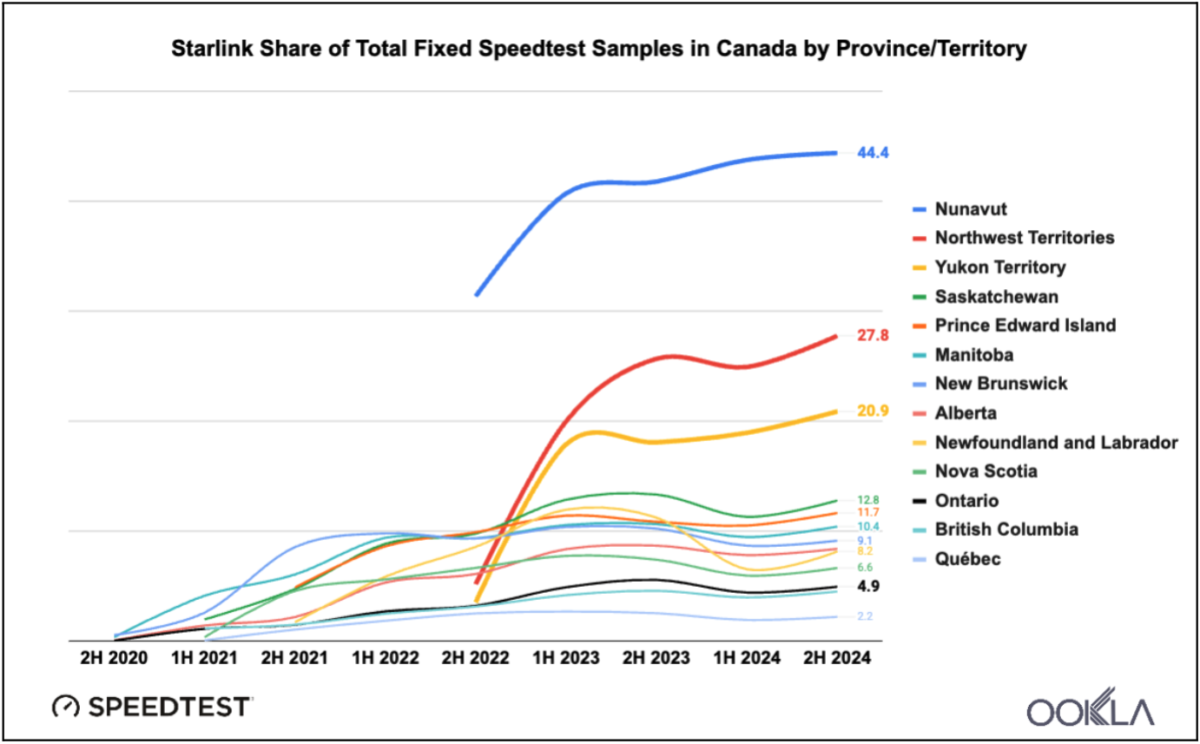
In Ontario and other provinces with relatively denser urbanization in their south, consumers have many options for broadband internet service. But in rural and remote areas of provinces and in much of The Territories, cancelling Starlink could result in the loss of internet connectivity entirely. Looking at Speedtest Intelligence data of Starlink users in Canada, we can estimate what might be at stake. We compared Starlink Speedtest user tests to the total number of fixed Speedtest user tests to estimate adoption trends among each Province and Territory from 2020 through 2024.
New Brunswick, Manitoba, Alberta and Ontario were the first to see traces of Starlink Speedtest users in 2020. Soon after in the first half of 2021, British Columbia, Nova Scotia, Quebec, and Saskatchewan appeared, with Prince Edward Island and Newfoundland and Labrador lighting up in the second half of 2021 as well. Then the rest of Canada came in the back half of 2022 with the territories – Northwest Territories, Nunavut and Yukon – leaping into the picture.
Take off to the Great White North
A pattern emerges among the provinces and territories with the service launch of an adoption followed by a relative stabilization in the share of Starlink Speedtest user samples of the total fixed internet Speedtest samples.
Quite obviously the rates of adoption differ. As one would intuitively expect, the more-rural and less-population-dense areas see the steepest adoption curves. Nunavut in particular (population 37 thousand, whom all could fit inside the Rogers Center – home of the Toronto Blue Jays – yet similar in area to Mexico) rockets to the top of the chart and settles into the low-to-mid-40%s of Starlink Speedtest user sample share. Northwest Territories and Yukon, launching in the same time frame as Nunavut, also follow the more-rural-less-population-dense logic, reaching 27.8% and 20.9% share in 2H 2024.
Vertical scale notwithstanding, the pattern is this: a relatively quick market adoption with stabilization after a year roughly. Share stabilization could be due to the Starlink service fulfilling latent market demand or the satellite constellation’s capacity limits being reached (halting further sales of the service, like around Edmonton currently, for example, per starlink.com/map), or a combination of the two.
Ontario (the protagonist), British Columbia, and Quebec have the lowest percentage of rural populations in Canada, and that is reflected in their lower samples shares – 4.9%, 4.5% and 2.2%, respectively.
Bringing it back together – what is at stake? Imagine that Starlink Speedtest user share is projectable to the population of Canada. That calculates to roughly 2 million Canadians who could feel the effects of such a cancellation. While many of those affected could switch to another internet service provider, for some in Canada – Nunavut especially – satellite connectivity is sometimes the only means of accessing the internet. Some portion of these people would be casualties in a trade war.
Ookla retains ownership of this article including all of the intellectual property rights, data, content graphs and analysis. This article may not be quoted, reproduced, distributed or published for any commercial purpose without prior consent. Members of the press and others using the findings in this article for non-commercial purposes are welcome to publicly share and link to report information with attribution to Ookla.
Having reached much of their 5G coverage and capacity goals in the urban and suburban areas of the U.S. in 2023, the big-three national U.S. wireless operators have turned their attention toward expanding their 5G networks into rural markets. This strategy is intended to help operators acquire new subscribers, particularly as growth in the urban and suburban markets has slowed.
But the big three U.S. wireless operators have taken very different approaches when it comes to expanding their 5G networks into less-densely populated areas. Of course, much of their strategies have been dictated by their spectrum holdings – particularly how much mid-band spectrum they were able to acquire.
Key Takeaways
T-Mobile has the largest percentage of 5G users spending the majority of their time on its 5G network in both urban and rural markets.
Nevada and Illinois are the only two states to make the Top 10 list for T-Mobile, AT&T and Verizon when it comes to high urban 5G availability indicating that these states, and their large cities of Chicago and Las Vegas, have been a 5G focus for all three operators.
5G service is scarce in remote Wyoming, which makes the Top 5 list for T-Mobile, AT&T and Verizon for having the lowest rural 5G availability. This isn’t particularly surprising as Wyoming ranks 49th in population density among all 50 states.
For this analysis, we used Ookla®’s 5G Availability metric, which shows how likely a user, on average, is to have 5G service available. 5G Availability is impacted by 5G network coverage, but also the network policies of each mobile provider, which determine the conditions under which users access its 5G network. For example, some providers may prioritize 4G-LTE for less data intensive tasks. Ookla Speedtest® data provides a consumer-centric view of 5G Availability — recording the percentage of 5G active users connected to 5G a majority of the time, based on when the 5G icon is displayed on the device.
T-Mobile leads the way
T-Mobile has been the most vocal about its rural market expansion targets. During the company’s Analyst Day in 2021 T-Mobile executives said they estimated the company had about 13% share of households in small markets and rural America and they set a goal of reaching 20% by the end of 2025. The operator also has said it is committed to providing coverage to 90% of America’s rural population by 2026.
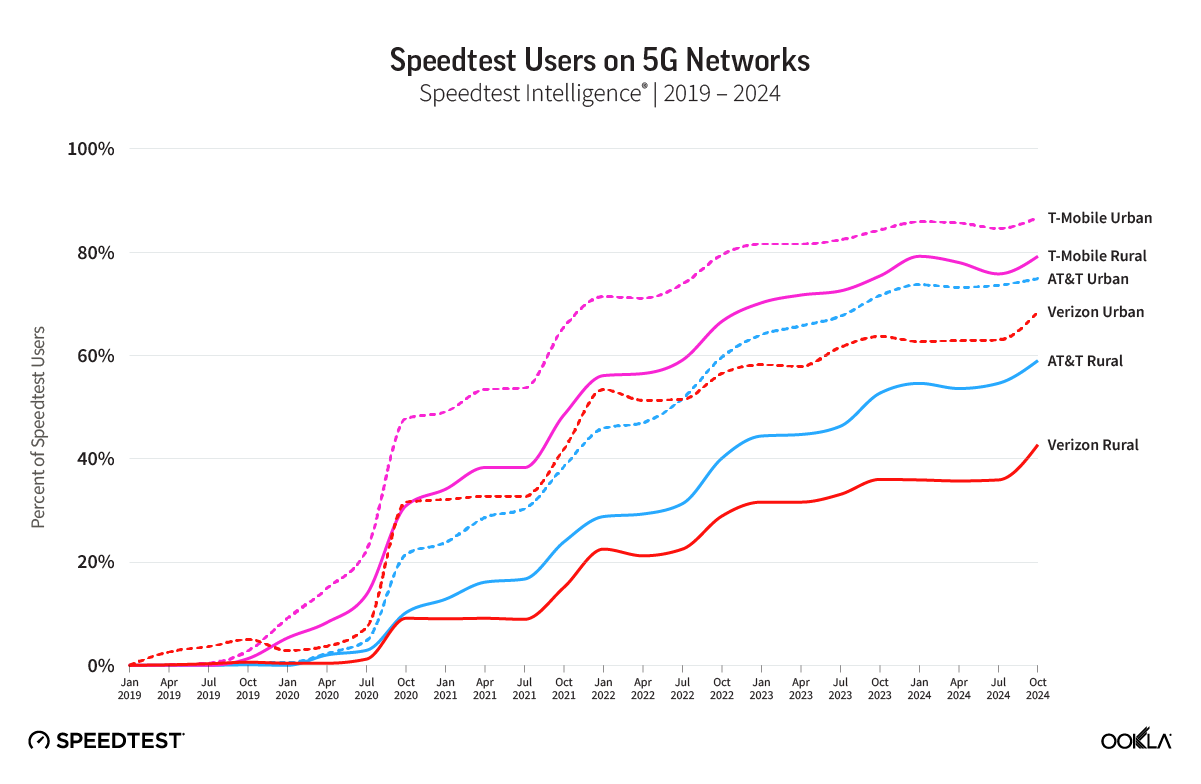
We compared Speedtest® users on 5G networks from the top three nationwide operators from 2019 to 2024. Our analysis shows T-Mobile’s growth and its lead in the number of 5G users spending the majority of their time on its 5G network in both urban and rural markets followed by AT&T and Verizon.
To determine urban vs. rural areas we used US Census Bureau’s urban-rural classifications. The Census Bureau’s urban areas represent densely developed territory, and encompass residential, commercial, and other non-residential urban land uses. Rural encompasses all population, housing, and territory not included within an urban area.
T-Mobile’s lead here is not particularly surprising. In our Speedtest®Connectivity report for the second half of 2024, T-Mobile recorded the highest 5G Availability score in the U.S. with 89.4% of its users accessing its 5G network the majority of the time.
Speedtest® users on 5G networks from 2019 until 2024
Speedtest®users on 5G networks from 2019 (when the first 5G markets came online) until Q4 2024.
T-Mobile: The Back Story
T-Mobile first started to deploy 5G in 2019 in its low-band 600 MHz spectrum, which it calls its Extended Range 5G. In September 2023 T-Mobile said its Extended Range 5G covered 323 million people and today the operator says the Extended Range 5G covers 98% of the U.S.
In 2020, not long after T-Mobile closed on its acquisition of Sprint, the company started deploying 5G in the 2.5 GHz spectrum. When T-Mobile purchased Sprint it acquired 150 MHz of Sprint’s 2.5 GHz spectrum in the top 100 markets. One condition for getting the approval from the Federal Communications Commission (FCC) for T-Mobile’s merger with Sprint was that the company was required to deploy 5G service to 97% of the U.S. population within three years and 99% of the population within six years.
When combining that 2.5 GHz spectrum with T-Mobile’s existing mid-band spectrum, the company gained control of 319 MHz of sub-6 GHz spectrum. Today T-Mobile refers to its 5G in the mid-band spectrum as its Ultra Capacity 5G and it now covers more than 300 million people in the U.S. with it.
T-Mobile’s 5G expansion is far from over, however. In May 2024 T-Mobile announced plans to purchase around 30% of regional operator USCellular’s spectrum holdings and all of its 4.5 million customers and retail stores for $4.4 billion. The deal is expected to close later this year.
Mike Sievert, T-Mobile CEO, discussed the company’s expansion into rural markets during its Q3 2024 earnings call. In that call, Sievert told investors that T-Mobile grew its share of customers in both top 100 and smaller markets and rural areas. He also said that the company believes it has lots of room to grow in underpenetrated areas.
Delving deeper into the data
We took a deeper look at our 5G Availability data to determine the percentage of users in each state with 5G-capable devices that are spending most of the time connected to 5G networks. The remainder of the users are those that have accessed the 5G network but spent the majority of their time connected to LTE. We specifically looked at Ookla Speedtest Intelligence® data from Q4 2024 to see which states recorded the largest share of users spending a majority of their time on 5G in both urban and rural areas. Once again, we used US Census Bureau data for our urban-rural classifications.
Top 5 States with the Highest Rural 5G Availability from T-Mobile (2H2024)
State
% of Users on T-Mobile 5G
Florida
83.58
Connecticut
80.62
Illinois
80.49
Delaware
80.39
Georgia
80.18
Top 5 States with the Highest Urban 5G Availability from T-Mobile (2H2024)
State
% of Users on T-Mobile 5G
Illinois
91.86
Nevada
91.78
Oklahoma
91.77
Florida
91.57
North Dakota
91.30
AT&T benefits from FirstNet for rural expansion
AT&T’s rural expansion has primarily focused on its building of FirstNet, the nationwide public safety network for first responders that uses Band 14, which is a 10 MHz block of spectrum in the 758–768 MHz and 788–798 MHz ranges.
In 2017 the U.S. Department of Commerce awarded AT&T the FirstNet contract and essentially gave the operator access to Band 14 700 MHz low-band spectrum so it could build a nationwide wireless network specifically for first responders.
But one of the key components to this agreement was that Congress wanted to ensure first responders even in remote areas of the country could have access to the network so it required that AT&T expand the FirstNet into rural areas that previously had little to no wireless coverage.
AT&T finished its buildout of FirstNet’s Band 14 700 MHz network in April 2023. That buildout entailed putting 700 MHz FirstNet radios on thousands of AT&T cell towers across the country, as well as deploying more than 1,000 new FirstNet cell towers in locations earmarked by state and public-safety officials.
AT&T’s FirstNet buildout was part of the company’s “One Touch” strategy, which referred to the company’s upgrading of multiple technologies — 4G LTE, 5G and FirstNet— at a single cell site during a single visit and essentially “touching” each site once in order to provide those upgrades and avoiding repeated visits.
Although initially FirstNet supported 4G LTE connections, in 2021 AT&T upgraded its FirstNet core to support 5G and in February 2024 the FirstNet Authority agreed to invest $8 billion over 10 years to enhance FirstNet’s 5G coverage and upgrade the network, giving it a dedicated 5G core.
AT&T said in October 2024 that the FirstNet network supports more than 6.4 million connections and 29,000 public safety agencies.
Besides its reliance on FirstNet, AT&T also has deployed 5G across its low-band spectrum and is building out its mid-band 5G network. The operator spent roughly $37 billion on mid-band spectrum licenses in the FCC’s C-band and 3.45 GHz auctions.
Top 5 States with the Highest Rural 5G Availability from AT&T (2H2024)
State
% of Users on AT&T 5G
Texas
78.17
Florida
75.24
Alabama
74.77
Louisiana
74.76
California
72.81
Top 5 States with the Highest Urban 5G Availability from AT&T (2H2024)
State
% of Users on AT&T 5G
California
92.47
Florida
91.1
Nevada
90.92
Texas
89.91
Louisana
89.45
Verizon relies on C-band and acquisitions
Unlike AT&T and T-Mobile, Verizon didn’t have a slew of low-band spectrum for its 5G deployment so the company deployed a technology called Dynamic Spectrum Sharing (DSS), which allowed it to run 5G on the same spectrum bands as LTE, effectively letting 4G and 5G users take turns using the same chunk of spectrum via 1 millisecond increments. AT&T also used DSS in some of its low-band spectrum.
Besides its efforts with DSS, Verizon deployed 5G in its C-band spectrum, which it acquired in a spectrum auction in 2021 for $52 billion. The company has an average of about 161 MHz of mid-band spectrum across the U.S.
But to cover rural America, Verizon primarily got access to spectrum through several acquisitions and effectively purchased many of its roaming partners. In 2020 Verizon purchased Bluegrass Cellular, which operated in 34 counties in Kentucky, and Chat Mobility, a wireless operator in Iowa. It also purchased Blue Mobility, a small wireless carrier that operated in New York and Pennsylvania. In 2021 Verizon acquired the assets of Montana-based Triangle Mobile and Chariton Valley Communications Corp., which operated a 4G network in Missouri.
However, all of these acquisitions primarily just expanded Verizon’s already strong 4G LTE network into more rural areas and didn’t help it expand its 5G network.
Because of this, most of Verizon’s rural 5G coverage hinges on its C-band deployment.
In its Q2 2024 earnings CEO Hans Vestberg said the company was expanding its C-band 5G network in suburban and rural areas. The company also revealed in October 2024 that it will spend around $1 billion to purchase a combination of 850 MHz, AWS and PCS spectrum licenses from UScellular. Although it’s unclear where those licenses are located, it’s likely that Verizon will use this spectrum to supplement its suburban and rural 5G coverage.
Top 5 States with the Highest Rural 5G Availability from Verizon (2H 2024)
State
% of Users on Verizon 5G
Ohio
56.07
Arkansas
44.51
Texas
43.09
New Jersey
41.8
Delaware
40.56
Top 5 States with the Highest Urban 5G Availability from Verizon (2H 2024)
State
% of Users on Verizon 5G
Ohio
73.86
California
67.76
Nebraska
67.45
Arkansas
66.26
Arizona
66.01
5G service is scarce in rural Wyoming
The state of Wyoming has the distinction of being the only state to have the lowest 5G Availability for all three operators: T-Mobile, Verizon and AT&T. Of course, Wyoming is known for its low population density. Wyoming is the 10th largest state in the U.S., spanning 97,813 square miles but its population is concentrated in just a few cities: Cheyenne, Casper, Laramie and Gillette.
Based on Speedtest Intelligence® data, T-Mobile clearly has made the most inroads when it comes to customers having access to its 5G network. Verizon, meanwhile, with just 9.8% of users on its 5G network still has quite a bit of catching up to do.
Rural 5G Availability in Wyoming (2H 2024)
Operator
% of Users on the 5G Network
T-Mobile
59.29
AT&T
29.73
Verizon
9.8
Nevada, Illinois benefit from 5G focus
On the opposite end of the spectrum, Nevada and Illinois both appear to have benefited from a strong 5G focus from all three operators in their urban areas. Of course, Nevada is home to Las Vegas which hosts hundreds of high-profile conventions and sporting events, making it a perfect venue for showing off the latest in wireless technology. AT&T announced in 2019 that Las Vegas was one of the cities where it would be deploying low-band 5G. Likewise, Verizon in August 2023 announced that Las Vegas was its first market where it was able to use a full 160 MHz of its C-band spectrum to triple the available bandwidth for its 5G Ultra Wideband network. And T-Mobile touted its 5G coverage in Las Vegas in advance of the Formula 1 Las Vegas Grand Prix and the Super Bowl at Allegiant Stadium in February 2024.
Chicago is also a key market for wireless players with its Magnificent Mile and United Center events venue. AT&T made Chicago a priority by deploying 5G in its mid-band spectrum in the city in late 2020. And similar to Las Vegas, Chicago also benefitted from Verizon’s C-band 5G deployment.
Urban 5G Availability in Nevada (2H 2024)
Operator
% of Users on the 5G Network
T-Mobile
91.86
AT&T
90.92
Verizon
63.38
Urban 5G Availability in Illinois (2H 2024)
Operator
% of Users on the 5G Network
T-Mobile
91.78
AT&T
85.27
Verizon
62.5
Promise for more rural 5G is on its way
Although some states boast fairly strong 5G availability in rural areas, there are more efforts underway to improve rural 5G coverage throughout the U.S. In particular, the Federal Communications Commission (FCC) recently established the 5G Fund for Rural America which will enable it to distribute up to $9 billion to wireless service providers to bring 5G service to more than 14 million rural homes and businesses.
The FCC has been collecting mobile coverage data to identify and target rural areas that may not otherwise receive 5G coverage if not otherwise subsidized. In August 2024 the FCC adopted final rules for the 5G Fund but the agency didn’t set up a timeline for the program. It’s set to be a reverse auction in which operators bid to serve areas with the lowest level of government support.
We will continue to monitor the status of urban and rural 5G coverage in the U.S. and track improvements that operators are making to their 5G networks. For more information about Speedtest Intelligence data and insights, please get in touch.
Ookla retains ownership of this article including all of the intellectual property rights, data, content graphs and analysis. This article may not be quoted, reproduced, distributed or published for any commercial purpose without prior consent. Members of the press and others using the findings in this article for non-commercial purposes are welcome to publicly share and link to report information with attribution to Ookla.
Roaming is a significant revenue stream for Gulf operators, especially as the region is becoming an important tourist destination. Travelers increasingly expect network experiences abroad to match or exceed what they have at home. This article uses Ookla’s Speedtest Intelligence® data to assess the mobile experience of inbound roamers visiting select Gulf countries – Kuwait, Qatar, Saudi Arabia, and the U.A.E. – in 2024, comparing their experience across different destinations and their respective home networks.
Key Takeaways:
Travelers to Qatar, the U.A.E., and Kuwait enjoy top speeds over 5G. Median download speeds over 5G reached 381.05 Mbps in Qatar, 374.60 Mbps in the UAE, and 240.37 Mbps in Kuwait in 2024.
Generally, travelers experience slower mobile speeds when roaming in the Gulf region than on their home networks. However, exceptions include Russian travelers in the U.A.E., Pakistani tourists in Saudi Arabia, and Saudis and Indonesians in Qatar who experience notable speed improvements.
Visitors from outside the Gulf typically experience slower speeds than those from within it. This could be due to more favorable agreements between regional operators to keep fees low and encourage usage when traveling within the region. In contrast, high roaming charges and speed caps for travelers from Europe, Asia, or the United States would constrain usage and speed.
The Gulf region is rapidly becoming a popular global tourist destination, creating opportunities to increase roaming revenue
The Gulf Cooperation Council (GCC) region is experiencing a tourism boom, rapidly becoming a popular global tourist destination. According to Fitch Ratings, the tourism sector contributed around USD 130 billion to GCC’s GDP in 2023, with projections to surpass USD 340 billion by 2030, equating to 10% of total GDP. This growth is fueled by the GCC’s ambitious goals to diversify their economies beyond oil and enhance their global standing.
Unlike Europe and other parts of the Middle East, the Gulf region recovered quickly from COVID-19. In 2023, passenger traffic at its airports exceeded pre-pandemic levels by 8%. The region’s appeal is not just its warm weather, beaches, and shopping; it also offers modern amenities and top-notch services for both business travelers and vacationers. The straightforward entry visa process and the introduction of a unified tourist visa further facilitate travel.
Mobile connectivity through roaming is important for the travel experience. It allows travelers to stay connected with family and friends, use mapping and navigation tools, locate attractions, read restaurants’ reviews, and share experiences on social media. With 5G, roamers can access high-speed internet, stream HD videos, and make lag-free video calls. However, 5G roaming is still in its nascent stages, and not all hosting operators provide access to its full capability.
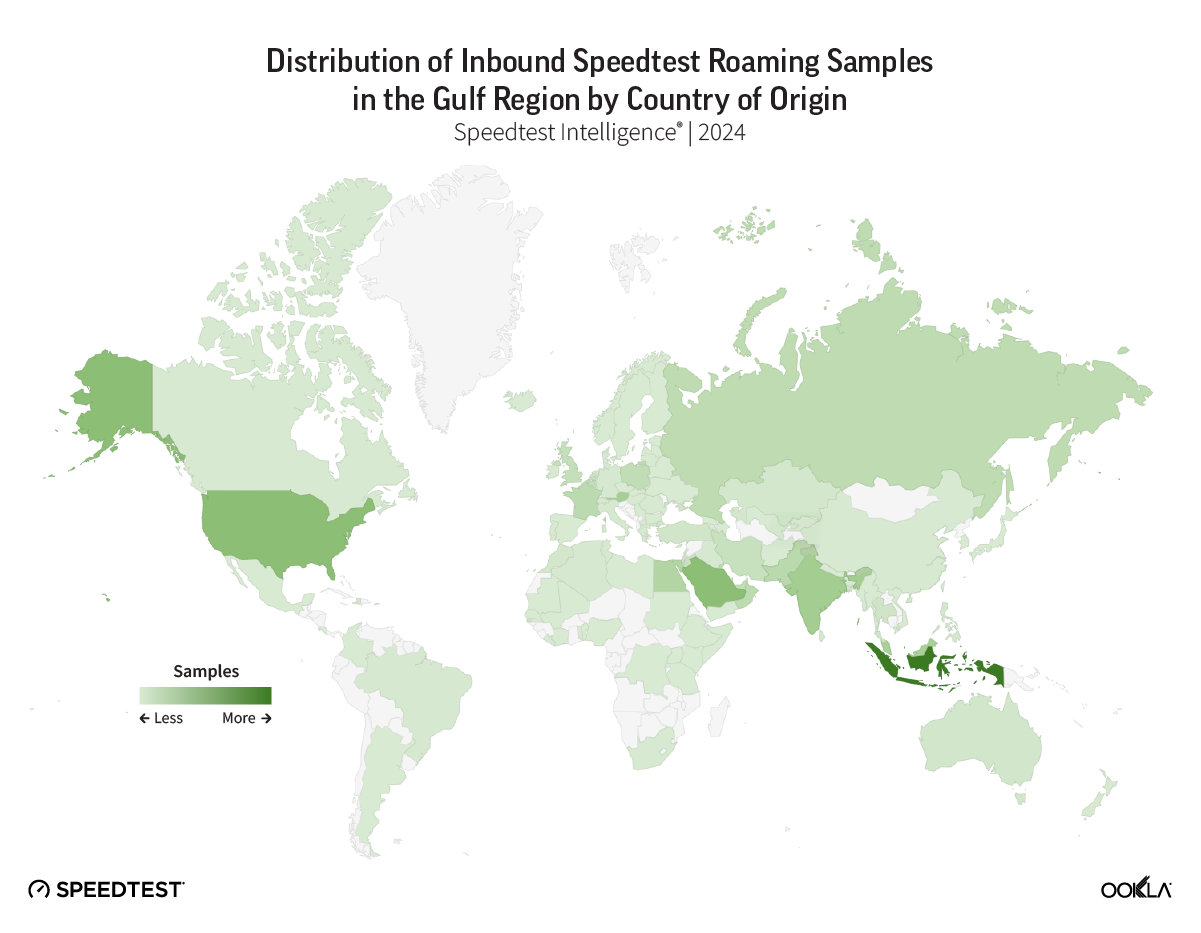
Most inbound roamers originate from Asian countries, the Gulf region, and the U.S.A.
We used Ookla’s Speedtest Intelligence® to assess the mobile network performance for inbound mobile roamers to Gulf countries during 2024, comparing it with their home network performance. Based on Speedtest samples, the U.A.E. and Saudi Arabia are the top roaming destinations for international travelers, followed by Kuwait and Qatar. Bahrain and Oman saw fewer roamers.
Indonesia accounted for 14.4% of total inbound roamers in 2024, with most heading to Saudi Arabia. The latter received the second-highest number of inbound roamers, behind the U.A.E., likely linked to the Hajj and Omra pilgrimages. Saudi Arabian visitors were also prominent within the region (8.0% of total samples), with the U.A.E., Bahrain, and Qatar being favored destinations.
Outside the Gulf, the U.S.A. had the most travelers to the GCC who activated roaming services and ran speed tests (7.9%), followed by India and Austria at 5.6% and 5.3%, respectively. Other Asian regions, such as Malaysia, Hong Kong, and Pakistan, also contributed strongly to the roaming cohort. Egypt is the largest non-GCC Arab country, contributing to the visitor pool (4.2%).
Our findings also reveal that among the top 10 countries contributing to roamers in the Gulf region, Austria, Saudi Arabia, and Hong Kong had the highest proportion of 5G users. On the other hand, travelers from Pakistan, India, and Egypt were the least likely to use 5G while roaming.
5G Share of Inbound Roamers Speedtest Sample, Top-10 Countries of Origin
Speedtest Intelligence® | 2024
5G Share of Inbound Roamers Speedtest Sample, Top-10 Countries of Origin
The following sections provide additional insights into network performance for international roamers visiting the U.A.E., Saudi Arabia, Kuwait, and Qatar in 2024. For each country of origin and destination, we include the median download speed for roamers during travel and compare it with the median download speed on their home networks.
Saudi Arabian and Russian Roamers Enjoy Top 5G Speeds in the U.A.E.
Over 37% of the Speedtest sample roaming in the U.A.E. came from India, Saudi Arabia, Austria, Russia, and Hong Kong. Network experiences varied significantly between these countries. Saudi Arabian and Russian travelers experienced the fastest download speeds for all technologies and 5G. Saudi visitors had comparable roaming experiences to their home countries. At the same time, Russian tourists saw more than a threefold increase in median download speeds in the U.A.E compared to their home networks. On the other hand, travelers from Austria, India, and Hong Kong experienced comparatively lower performance.
Network Performance By Technology for Roamers in the U.A.E and Comparison with Home Network for All Technologies
Speedtest Intelligence | 2024
Network Performance By Technology for Roamers in the U.A.E and Comparison with Home Network for All Technologies
French and American Tourists Enjoy Excellent 5G Performance in Saudi Arabia
Most travelers to Saudi Arabia are religious pilgrims, with a significant number from Indonesia and Malaysia comprising 38.7% of total inbound roamers in 2024, as captured in Speedtest data, reported the best mobile experience and 5G download speeds when visiting Saudi Arabia. Median download speeds reached 78.46 Mbps for all technologies and 153.66 Mbps for 5G among American visitors, while French tourists experienced speeds of 49.33 Mbps and 153.79 Mbps.
Saudi operators delivered a more moderate performance to travelers from Malaysia, Pakistan, and Egypt, with median download speeds below 50 Mbps across all technologies. However, there were notable improvements over 5G for users from Malaysia and Pakistan, with speeds reaching 90.97 Mbps and 112.68 Mbps, respectively. Interestingly, Indonesian operators appear to enforce a uniform speed cap of 10 Mbps across all networks in Saudi Arabia, suggesting a restriction from the home operator rather than the host network.
Generally, inbound roamers experience similar or worse network conditions in Saudi Arabia compared to their home networks, with Indonesians feeling the most restricted due to the speed cap. Pakistanis are the only exception among the top six countries in Speedtest samples, with median download speed increasing from 19.38 Mbps at home to 27.22 Mbps when roaming.
Network Performance By Technology for Roamers in Saudi Arabia and Comparison with Home Network for All Technologies
Speedtest Intelligence | 2024
Network Performance By Technology for Roamers in Saudi Arabia and Comparison with Home Network for All Technologies
Inbound roamers from Saudi Arabia enjoy the fastest 5G network speeds in Kuwait
Saudi visitors enjoyed fast 5G speeds at 240.37 Mbps, though ‘all technologies’ speeds were around 40% lower than their 5G speeds and about 30% less than what they would have experienced back in the Kingdom. The other major tourist groups in Kuwait saw a decline in median download speeds compared to their home countries, most notably those from the United States.
Network Performance By Technology for Roamers in Kuwait and Comparison with Home Network for All Technologies
Speedtest Intelligence | 2024
Network Performance By Technology for Roamers in Kuwait and Comparison with Home Network for All Technologies
Qatar offers exceptionally fast 5G speeds to its inbound roamers from Saudi Arabia and Kuwait
Many travelers to Qatar come from Saudi Arabia and the U.S.A., representing an aggregate of 36.2% of total roamers. There is also a huge difference in speeds experienced by roamers, with those coming from neighboring countries enjoying the best performance. Saudi and Kuwaiti visitors experience a median download speed of 381.0 Mbps and 227.1 Mbps over 5G, respectively. By contrast, those from Austria would have experienced a much more modest speed of around 36 Mbps on both ‘all technologies’ and 5G.
Comparing the network experience of visitors in Qatar to their home networks, travelers from Indonesia and Saudi Arabia saw significant improvements, with roaming-to-home download speed ratios of 1.7 and 1.5, respectively. On the other hand, those from Kuwait, the U.S.A., and Austria likely experienced a decline in network performance.
Network Performance By Technology for Roamers in Qatar and Comparison with Home Network for All Technologies
Speedtest Intelligence | 2024
Network Performance By Technology for Roamers in Qatar and Comparison with Home Network for All Technologies
Operators generally offer good mobile roaming experience in the Gulf region, but there is room to make it more accessible
This analysis shows that Gulf operators provide excellent mobile experiences to roaming customers. Kuwait, Qatar, and the U.A.E. tend to offer top speeds for all technologies and 5G, especially for tourists coming from within the region.
Performance differences between countries and operators can stem from technical and commercial factors. Roamers’ experience can degrade if home operators impose data speed and usage limitations to manage costs, prevent bill shocks, or favor certain operators for roaming. Host operators can also restrict roamers’ full-capacity access to avoid network congestion.
To ensure optimal visitor experiences and maximize potential revenue from increased traffic, some guest and host operators should review roaming agreements, offer speed-tiered tariffs, and alleviate speed caps. Domestic operators can also address roaming charge concerns by offering local SIMs. For instance, tourists arriving in the UAE receive a free local SIM at Dubai airport. Maintaining roaming high charges and applying speed or data caps might push users towards eSIM options, where operators have less control over their experience.
Ookla provides unique insights into inbound and outbound roamers’ experiences and conducts country-level and operator-level benchmarks. If you want to learn more about Speedtest Intelligence, please contact us.
Ookla retains ownership of this article including all of the intellectual property rights, data, content graphs and analysis. This article may not be quoted, reproduced, distributed or published for any commercial purpose without prior consent. Members of the press and others using the findings in this article for non-commercial purposes are welcome to publicly share and link to report information with attribution to Ookla.
Reliable connectivity powers critical services everywhere, forming the backbone of essential daily operations for businesses and consumers worldwide. From emergency response systems to retail payment processing, connectivity has become indispensable infrastructure for organizations and individuals.
But maintaining consistent connectivity across a range of consumer and enterprise use cases is no easy feat. Emergency responders need reliable communications during disasters. Schools must connect remote students in areas with limited coverage. Retailers require dependable payment processing across thousands of locations. And mobile operators need accurate data to guide infrastructure expansion.
Understanding and solving these connectivity challenges requires detailed insights into network performance, coverage, and user patterns. That’s where Ookla’s Cell Analytics comes in, providing the insights organizations need to make smart decisions about coverage, optimize their networks, and ensure reliable connectivity where it matters most.
Let’s take a look at some real-world examples of how innovative organizations are using these capabilities to solve critical business challenges and deliver better experiences to their users.
Bridging the Digital Divide in Education
When remote learning became essential, a major metropolitan school district faced a critical challenge: ensuring all students had reliable internet access. Using Cell Analytics, the district’s IT team mapped connectivity performance against remote learning requirements across their community.
This data-driven approach allowed the district to strategically deploy school buses equipped with Wi-Fi in low-connectivity neighborhoods, guide students to optimal study locations with better coverage, and target neighborhoods for additional funding and resources. The district also used these insights to identify areas requiring private LTE networks and coordinate with state officials on broadband prioritization initiatives.
A Major Convenience Store Chain: Ensuring Connectivity for POS Systems
A major convenience store and gas station chain with over 6,000 locations across the United States faced an increasingly common challenge among retailers: ensuring reliable connectivity for point of sale (POS) systems in all of their stores. While their primary operations run on wired internet, maintaining consistent connectivity requires dependable cellular backup.
Using Cell Analytics, the company analyzed coverage from all major carriers at each store location, helping determine the optimal mobile operator for their mobile POS systems at every location. This allowed them to ensure business continuity even during primary network outages, protecting both revenue and customer experience.
Crowdsourced Data for Emergency Response Planning and Recovery
When disasters strike, cellular connectivity becomes a lifeline. Emergency management teams are using Cell Analytics to map coverage strengths and weaknesses across potential disaster zones, with a particular focus on evacuation routes. By precisely identifying areas where carriers provide inadequate service — or where no major mobile operators offer coverage at all — stakeholders can direct funding toward critical improvements before emergencies occur.
The Cell Analytics platform helps emergency planners identify optimal locations for new wireless infrastructure, track changes in network availability over time, and validate coverage along critical routes. Combined with controlled drive testing data that measures call quality and other key metrics, these insights ensure reliable connectivity for first responders and enable more efficient coordination of multi-agency response efforts. As communities work to leverage billions in available funding for improving emergency communications infrastructure, this data can be invaluable for making smarter decisions for improving network performance.
Mobile Network Operators: Data-Driven Network Improvements
Network operators use Cell Analytics to bring sophisticated insights to their network planning and optimization. With mobile data consumption growing exponentially and 5G networks expanding rapidly, operators face increasing pressure to optimize coverage and capacity efficiently.
The Cell Analytics platform empowers operators to evaluate network performance, quality, and availability while quickly identifying areas for improvement. For instance, it highlights locations where high user density coincides with coverage gaps and pinpoints opportunities to expand capacity at existing macro cell sites.
Operators can use this information to strategically prioritize network optimization and align marketing efforts with coverage and demand. With a clearer understanding of performance metrics, they can enhance service quality, improve efficiency, and reduce operational costs.
Tower and Infrastructure: Smarter Real Estate and Engineering Investments
Infrastructure providers are revolutionizing their approach to real estate decisions using Cell Analytics. Modern tower companies need precise data about actual usage and coverage gaps to make informed investment decisions – data that directly impacts the success of multi-million dollar infrastructure investments.
The Cell Analytics platform enables tower companies to evaluate potential land acquisitions based on detailed coverage needs and user density data. These insights help identify prime locations for new towers or rooftop installations in high-usage areas. Companies can also make more informed decisions about lease agreements by analyzing actual usage patterns and coverage requirements, ultimately reducing operational expenses. Learn more about Ookla’s solutions for Infrastructure and Tower Providers on our website.
Conclusion
Mobile connectivity powers more of our world every day — from emergency services to education to basic retail operations and much more. Cell Analytics helps organizations understand and optimize the networks that support these critical connections, enabling enterprises to turn network data into actionable solutions that improve how we live, work, and communicate.
As our reliance on mobile networks continues to grow, the ability for enterprises to make smart decisions about coverage and connectivity becomes increasingly vital. The real-world examples we’ve explored show how Cell Analytics can help solve today’s connectivity challenges while preparing for tomorrow’s demands.
Ready to explore how Cell Analytics can transform your operations? Visit our product page or reach out to learn more about implementing these solutions in your organization.
Ookla retains ownership of this article including all of the intellectual property rights, data, content graphs and analysis. This article may not be quoted, reproduced, distributed or published for any commercial purpose without prior consent. Members of the press and others using the findings in this article for non-commercial purposes are welcome to publicly share and link to report information with attribution to Ookla.
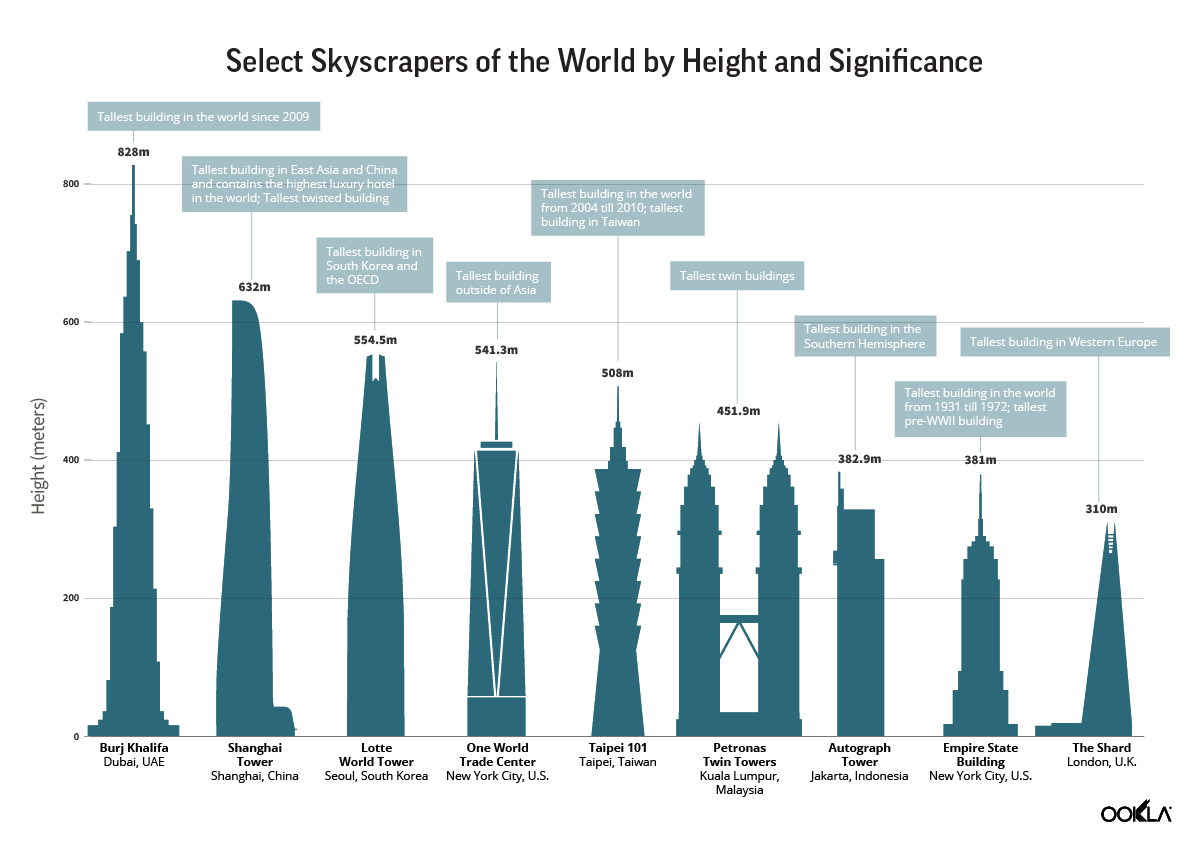
Skyscrapers are not just architectural achievements; they also test the limits of telecommunications and connectivity systems. These structures highlight both the obstacles and innovations required for seamless connectivity in high-rise environments. This report, using data from Cell Analytics™, benchmarks the 5G indoor coverage experience in nine of the world’s most iconic buildings by analyzing the average Reference Signal Received Power (RSRP) and Reference Signal Received Quality (RSRQ), providing critical insights into the signal strength and quality that subscribers experience within these architectural marvels.
Icons That Shape Skylines
Modern skyscrapers are more than just towering structures—they shape city skylines, serve as commercial and cultural hubs, and play a crucial role in defining a nation’s global presence. Their impact also goes beyond aesthetics. They contribute significantly to a city’s economy by attracting businesses, investors, and tourists. For example, the Burj Khalifa in Dubai has helped position the city as a global business and tourism hub, drawing millions of visitors each year. Similarly, the Empire State Building in New York remains a historic landmark and one of the most visited tourist attractions in the world.
Using Ookla® Cell Analytics™ data, we analyzed nine of the most iconic buildings in the world, recognized for their unique architectural designs, global influence, and economic and cultural significance.
Most skyscrapers provide strong signal strength but coverage gaps still exist
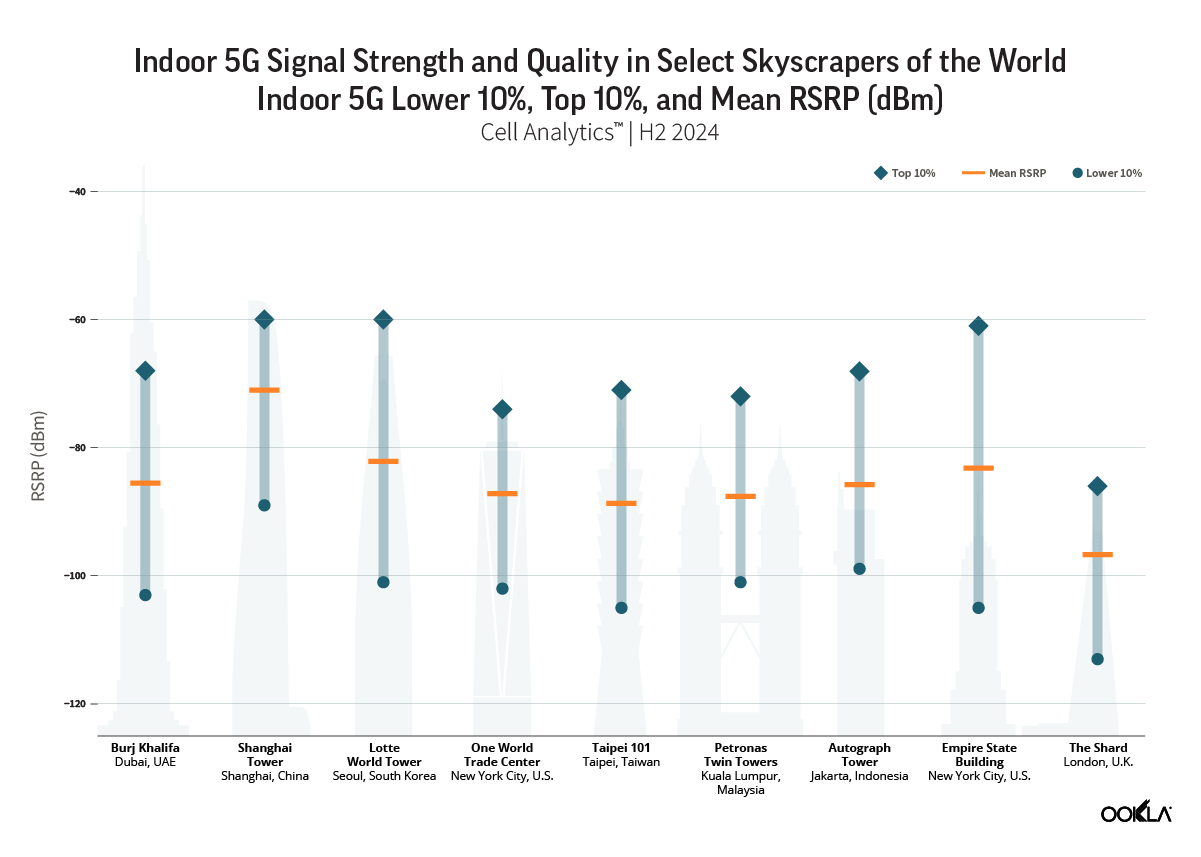
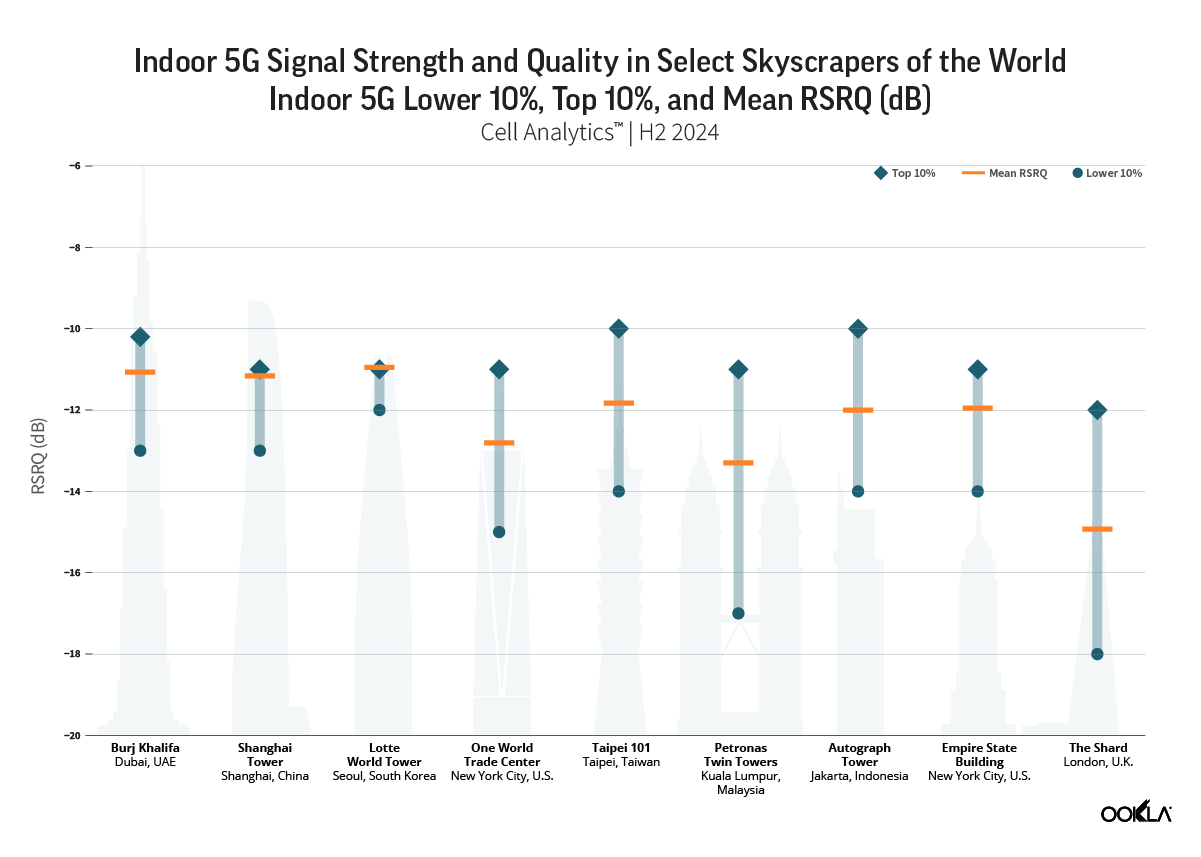
Drilling down into data at the individual building from the second half of 2024, we evaluated subscribers’ 5G indoor experience by measuring the average Reference Signal Received Power (RSRP) and Reference Signal Received Quality (RSRQ). RSRP represents the network signal strength received by a mobile phone. An RSRP value that exceeds -90 dBm indicates superior coverage. If the signal strength is between -90 dBm and -100 dBm, then network coverage is considered good. Below this range, expect slower download speeds and potential network disconnections. RSRQ is a metric used to evaluate the quality of the reference signal received by a device. A value of -10 dB or higher indicates excellent network quality while a value between -10 dB and -15 dB is considered good. An RSRQ value lower than -15 dB is poor or indicates no signal at all.
“>
“>
Overall, the 5G indoor coverage across the nine skyscrapers reveals that most buildings provide superior 5G signal strength, as well as excellent network quality. However, some still face challenges in ensuring consistent connectivity. Shanghai Tower recorded the strongest 5G signal among all buildings, with a weighted average RSRP of -71.04 dBm of all samples detected inside the building. This suggests a well-optimized indoor network, likely supported by China’s extensive 5G infrastructure. As China is one of the major leaders in 5G deployment, major urban centers like Shanghai benefit from advanced indoor network solutions, such as small cells and distributed antenna systems (DAS), ensuring strong coverage even in high-rise environments.
Burj Khalifa in UAE, and the Empire State Building New York City, showed strong 5G coverage, with average RSRP values of -85.53 dBm and -83.19 dBm, respectively. Both buildings also reported very good signal quality, with an average RSRQ of -11.07 dB and -11.95 dB respectively. The Empire State Building, completed in 1931, has undergone modernization efforts to enhance its telecommunications infrastructure. Similarly, the Burj Khalifa benefits from Dubai’s extensive 5G rollout, with the UAE ranking among the top countries in 5G performance.
The Shard in London reported the weakest 5G coverage among the selected buildings, with an average RSRP of -96.69 dBm. The Shard’s glass-heavy design may contribute to this weaker performance, as glass can reflect and absorb mobile signals. The building also reported a much weaker signal strength in the lower 10% with RSRP value of -113 dBM, indicating that in certain areas of the building, users are experiencing poor 5G coverage and quality.
Taipei 101 and the Petronas Twin Towers in Kuala Lumpur, showed good average 5G RSRP but experienced weaker signals in certain areas. The lower 10% RSRP values for both buildings were below -100 dBm (-105.00 dBm for Taipei 101 and -101.00 dBm for Petronas Twin Towers), suggesting that parts of these buildings may suffer from inconsistent coverage. Taipei 101 was designed to withstand earthquakes and typhoons, incorporating thick concrete and reinforced steel, which can interfere with mobile signals. While the Petronas Twin Towers currently lack a dedicated indoor 5G coverage solution.
One World Trade Center in New York City and Autograph Tower in Jakarta had similar 5G characteristics, with very good average RSRP around -85 dBm or better, but the reported lower 10% values suggest potential dead zones or weaker coverage in some areas.
From lobby to observation deck
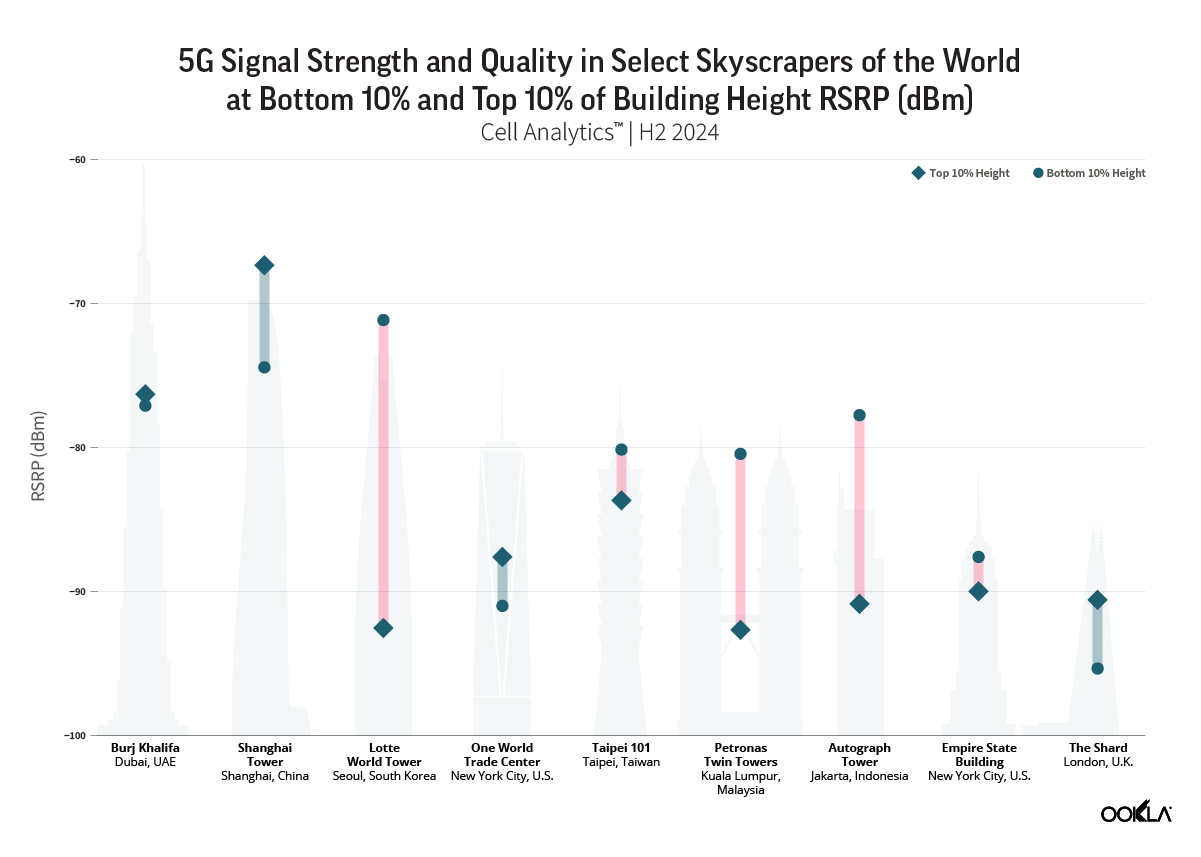
Using Cell Analytics data, we compared the 5G the average RSRP and RSRQ at two different height levels in each skyscraper: Bottom 10% of the building height, which represents coverage on the lower floors, based on samples collected closest to the ground floor, and Top 10% of the building height, which represents the highest levels, based on samples collected at the floors nearest to the top of the building.
“>
“>
Several skyscrapers showed minimal differences in 5G signal strength and quality between the lowest and highest floors. Burj Khalifa, One World Trade Center, Taipei 101, and the Empire State Building all had RSRP variations of 3 dBm or less between measurements taken at the bottom and top levels. The Burj Khalifa, the tallest building in the world at 828 meters, reported a slight improvement from -77.09 dBm at the lower floors to -76.30 dBm at the top.
Burj Khalifa, Taipei 101, and the Empire State Building also reported consistent 5G RSRQ between their lower and top floors, indicating stable 5G network quality. All four buildings have high-altitude observation decks, where strong 5G coverage is essential for tourists, businesses, and building operations.
In contrast, some skyscrapers exhibited noticeably larger differences between the lower and top floors RSRP and RSRQ, with weaker 5G signals at their higher levels. Petronas Twin Towers, Lotte World Tower, and Autograph Tower all showed a significant decline in signal strength as elevation increased. Petronas Twin Towers recorded a relatively strong -80.44 dBm at nearer to ground levels, but this dropped to -92.67 dBm at the top. This is mainly due to the lack of a dedicated indoor 5G coverage solution, with most 5G signals coming from outdoor cell towers. Similarly, the RSRP at Lotte World Tower fell from -71.14 dBm at the lower floors to -92.54 dBm for samples at the highest point. This suggests that while the lower sections of these buildings benefit from stronger 5G coverage, the network infrastructure at the upper floors may not be as robust.
Reliable 5G coverage in skyscrapers requires targeted network solutions
Skyscrapers play a key role in modern cities as business hubs, residential spaces, and major tourist attractions, making strong indoor 5G coverage essential. Tourists visiting observation decks, businesses operating in high-rise offices, and residents in skyscraper apartments all require seamless connectivity for work, communication, and entertainment. However, the primary challenge lies in delivering consistent performance and quality across various indoor settings, where issues may be confined to certain floors or sections. Modern building materials, such as low-emissivity (Low-E) glass, can significantly impact 5G signal attenuation by blocking or reflecting radio frequencies, especially in high-frequency bands like mmWave.
These challenges highlight the need for dedicated indoor solutions such as small cell deployments, distributed antenna systems (DAS), and enhanced in-building network infrastructure. An alternative to deploying in-building 5G systems is to selectively offload usage to Wi-Fi provided these systems are designed, optimized, and operated to deliver an equivalent quality of experience – this can be done using Ekahau.
As 5G continues to evolve, telecom providers and building developers must work together to improve indoor network quality, ensuring that users at all levels of a skyscraper experience fast, stable, and uninterrupted connectivity. For operators, 5G indoor deployments are a strategic avenue to monetize their investments through advances such as massive IoT (IoT), enhanced mobile broadband (eMBB), and fixed wireless access (FWA), which will all play an important role in transformation across sectors such as industrial automation, retail applications, and smart cities.
Ookla can assist operators in identifying buildings or indoor venues with coverage or capacity issues using crowdsourced data and diagnosis. Powered by millions of signal measurements collected daily by Speedtest®, Cell Analytics provides intelligence about wireless service quality, RF measurements, data usage, user density, cell site locations, and much more. To find out more about Cell Analytics, please get in touch.
Ookla retains ownership of this article including all of the intellectual property rights, data, content graphs and analysis. This article may not be quoted, reproduced, distributed or published for any commercial purpose without prior consent. Members of the press and others using the findings in this article for non-commercial purposes are welcome to publicly share and link to report information with attribution to Ookla.
Check out the full report available now with the complete results for all 50 states.
Affordable, reliable, high-speed broadband is considered a necessity in the U.S. because it enables people to access online classes, secure health care assistance, register for basic government services, handle their banking needs and participate in many other essential services.
It’s also critical to the economic viability of every state because it supports remote workers, enables businesses to operate more efficiently and attracts new enterprises to an area.
But many states have struggled to make broadband service available to 100% of their residents primarily because service providers are focused on providing it to areas where it’s most profitable. Using Ookla’s Speedtest Intelligence® data, this report identifies the states that are currently delivering the minimum standard for fixed broadband speeds as established by the Federal Communications Commission (FCC) to the highest percentage of Speedtest users. It also singles out the states that need the most improvement when it comes to delivering the minimum standard for broadband to their residents.
Key takeaways
Connecticut, North Dakota, Delaware and six other states are the top performing states because they have the highest percentage of Speedtest users that meet the FCC’s minimum standard for fixed broadband speeds of 100 Mbps downstream and 20 Mbps upstream. While comparing small, densely populated states with larger, sparsely populated states may seem unfair, we thought it was important to note the current performance of each state so we can track their progress in future reports.
New Mexico, Arizona and Minnesota saw the biggest improvement in the percentage of Speedtest users getting the FCC’s minimum standard for fixed broadband speeds (100 Mbps down/20 Mbps up) between the first half of 2023 and the first half of 2024.
Washington, Alaska, Illinois and Oregon have the most prominent digital divide of all the 50 states. These four states have the biggest gap between the percentage of rural Speedtest users vs. the percentage of urban Speedtest users that get FCC’s minimum standard of broadband speeds of 100 Mbps downstream/20 Mbps upstream.
Not surprisingly, less than 40% of the Speedtest users of Alaska, Montana and Wyoming (which are three of the least densely populated states in the U.S.), are receiving the minimum broadband speeds of 100 Mbps downstream/20 Mbps upstream.
Broadband in the spotlight
The COVID-19 pandemic put a spotlight on the importance of having broadband access and the role it played in allowing people to continue working and receiving access to healthcare as well as keeping students in school. The American Rescue Plan Act of 2021 provided $3.2 billion to help low-income households in the U.S. pay for broadband access during the COVID-19 pandemic.
This sudden focus on broadband accessibility, also prompted Congress to pass the Infrastructure Investment and Jobs Act of 2021 which set aside $42.5 billion for the Broadband, Equity, Access and Deployment (BEAD) program and provided funding for every state to expand its broadband services. The National Telecommunications and Information Administration (NTIA) runs the BEAD program and the funding is being used for planning, infrastructure, and adoption programs in all 50 states, Washington, DC and several U.S. territories.
BEAD initially provided $100 million to every state with the remainder of the funding to be divided among the 50 states based upon their unserved and underserved populations. As of September 18, 2024, 44 eligible entities have been approved for both the Volume 1 and Volume 2 phases of BEAD. Volume 1 of the state’s proposal details the list of locations that are eligible for BEAD funding as well as a description of how certain entities can dispute the eligibility status of the various locations. Volume 2 includes each state’s description of how it plans to select ISPs and its overall broadband objectives. Once approved for both phases, states can then get access to the money that has been allocated for them.
To help manage these federal funds every state and territory established a broadband office that is tasked with determining the extent of their broadband coverage problems and draft broadband strategies that will resolve the problem.
The FCC in March 2024 decided to revise its current definition of broadband as 100 Mbps downstream and 20 Mbps upstream, which is a substantial upgrade from its previous benchmark of 25 Mbps download and 3 Mbps upload speed that was first established in 2015.
This is the first time in nearly a decade that the FCC raised the speed requirement. Although this new benchmark is being used throughout the U.S., many households still lack basic broadband services.
Top performing states
Using Ookla’s Speedtest Intelligence® data collected in the first half of 2024 we were able to compare the median download and upload speeds in all 50 states and identify the states that currently doing the best job of delivering the FCC’s minimum standard for fixed broadband speeds (100 Mbps downstream/20 Mbps upstream) to the highest percentage of Speedtest users.
At least 60% or more of the Speedtest users in Connecticut, North Dakota, Delaware, Maryland, New Hampshire, North Dakota, Rhode Island, Tennessee, Utah and Virginia are getting the FCC’s minimum standard for fixed broadband speeds of 100 Mbps downstream and 20 Mbps upstream. In Connecticut, which is the top state, 65.8% of Speedtest users are receiving the minimum broadband standard. But at just 65.8% that indicates that there is much more work ahead for states.
Interestingly, all nine of the states in this list have received final approval for both phases of BEAD funding. However, it’s unlikely that BEAD funding approval played any role in these nine states leading the rest of the country in delivering the minimum standard for broadband because BEAD funding isn’t expected to start impacting broadband deployment projects until 2025 at the earliest, with some states having to wait longer depending on their proposal status with NTIA.
Top performing U.S. states with over 60% of Speedtest users achieving broadband speeds
Rank
State
Percentage of Speedtest users achieving broadband speeds
BEAD funding approval
1
Connecticut
65.8
Yes
2
North Dakota
65.5
Yes
3
Maryland
63.7
Yes
4
Delaware
63.3
Yes
5
Rhode Island
62.7
Yes
6
Tennessee
62.2
Yes
7
Utah
61.8
Yes
8
New Hampshire
60.5
Yes
9
Virginia
60.1
Yes
Source: Ookla Speedtest data. *Note NTIA approval of BEAD funding is changing rapidly. While BEAD funds haven’t likely played a role in broadband deployments yet, they will in the future.
Southwestern US sees big improvements in broadband
New Mexico, Arizona and Minnesota saw the biggest improvement in the percentage of their residents getting the FCC’s minimum standard for fixed broadband speeds (100 Mbps down/20 Mbps up) between the first half of 2023 and the first half of 2024.
New Mexico leads the rest of the states with its gains in broadband in the past year. Ookla data indicates that New Mexico saw a 50% increase in the percentage of its population with access to the FCC’s minimum broadband speeds of 100 Mbps/20 Mbps. Arizona also saw a 45% jump in the percent of its population with access to the FCC’s minimum broadband speeds of 100 Mbps/20 Mbps.
Arizona, and specifically, the city of Mesa, AZ, has been a hotbed of activity for fiber deployments. In 2022 Google Fiber decided to deploy fiber to Mesa, AZ after the city council approved plans to bring a data center to the area. In addition, AT&T also announced plans to bring its fiber service to Mesa in 2023. These new fiber entrants are competing with existing broadband providers Cox Communications and Lumen.
U.S. states with largest year-on-year increase in Speedtest users achieving broadband speeds
Rank
State
Increase in Speedtest users obtaining broadband speeds (1H 2023 vs 1H 2024)
BEAD funding approval
1
New Mexico
50%
Yes
2
Arizona
45%
Yes
3
Nevada
37%
Yes
4
Minnesota
38%
No
5
Colorado
35%
Yes
6
Washington
35%
Yes
7
Oregon
32%
Yes
8
Wyoming
32%
Yes
9
Maine
30%
Yes
10
Utah
29%
Yes
Source: Ookla Speedtest data. *Note NTIA approval of BEAD funding is changing rapidly. While BEAD funds haven’t likely played a role in broadband deployments yet, they will in the future.
Sparse population equals inferior broadband
Not surprisingly, the most sparsely populated states in the U.S. tend to also have the smallest percentage of their population receiving the FCC’s minimum broadband speeds. Building broadband networks in rural states is incredibly expensive, and in some areas the terrain can make it nearly impossible. For example, in Alaska, where the ground may be frozen for many months out of the year, it’s difficult to dig trenches to install fiber.
Ookla’s Speedtest data collected in the first half of 2024 found that less than 40% of the residents of Alaska, Montana and Wyoming (which are three of the most sparsely populated states in the U.S.), receive the minimum broadband speeds of 100 Mbps downstream/20 Mbps upstream.
The digital divide is still evident in many states
A big part of the impetus behind the federal government’s BEAD program is to finally close the gap between those with and without access to broadband, or what is commonly referred to as the digital divide.
But there are still many states that have a prominent gap between the number of rural and urban residents that have access to the FCC’s minimum standard of broadband speeds of 100 Mbps downstream/20 Mbps upstream.
Using the Census Bureau’s urban-rural classification and Ookla data compiled in the 1H of 2024, Washington, Alaska, Illinois and Oregon have the biggest digital divide compared to the other 50 states. For example, while 61.1% of urban Speedtest users in Washington state receive broadband speeds of 100 Mbps/20 Mbps, only 28.7% of its rural Speedtest users receive those same speeds.
Breaking Down the Digital Divide
Percentage of urban and rural Speedtest users in each state with access to broadband speeds of 100/20 Mbps.
Broadband speeds are improving but more work is needed
U.S. broadband networks offer faster and more reliable connectivity to more people today than they did just a few years ago, however there’s still a large percentage of the U.S. population without adequate access to broadband connectivity.
Thanks to new funding such as the BEAD program, there are many efforts underway to improve modern broadband networks. We expect to see these advancements in 2025 as more states start to put their BEAD funding into action.
We will provide semi-annual updates on the broadband speed performance of providers in the 50 states and also to track the improvements that states are making to bridge the digital divide. For more information about Speedtest Intelligence data and insights, please get in touch.
Ookla retains ownership of this article including all of the intellectual property rights, data, content graphs and analysis. This article may not be quoted, reproduced, distributed or published for any commercial purpose without prior consent. Members of the press and others using the findings in this article for non-commercial purposes are welcome to publicly share and link to report information with attribution to Ookla.
Recent satellite launches have improved Starlink’s performance in Europe, bolstering its credentials as a competitive broadband solution.
While Europe may not represent the largest market for satellite solutions compared to other large landmass regions with lower fiber density and a greater share of the population living in rural areas, low Earth orbit (LEO) constellations have emerged as an important part of the connectivity toolkit in the region.
SpaceX’s Starlink has secured a leading position in the LEO market, both in Europe and globally. With a network of more than 7,000 satellites worldwide, it remains the most capable in terms of coverage and capacity, providing broadband access throughout most of Europe.
As Starlink adoption on the continent has surged, even in unexpected places like London—where network capacity has been exhausted and the service is sold out—SpaceX has moved swiftly to bolster its constellation. The company ramped up investments to increase the density of its ground stations and launched a blitz of new satellites in the latter half of last year.
This article explores how SpaceX’s investments are contributing to Starlink’s performance in Europe as the service scales up amid intensifying competition from the rapid expansion of fiber-to-the-home (FTTH) infrastructure across the continent.
Key Takeaways:
Significant improvements in latency translate into better quality of experience (QoE) for Starlink users across Europe. The latency disparity between Starlink and the aggregate terrestrial fixed broadband market has narrowed substantially across Europe over the past two years. In Q4 2024, Starlink users in Western Europe experienced the lowest median latencies on the continent, with the United Kingdom (41 ms), Belgium (46 ms) and Luxembourg (46 ms) leading the way. Improvements in latency have boosted Starlink’s QoE performance for video streaming, web browsing and gaming, as evidenced by outcomes such as shorter video start times and reduced game latency.
Starlink’s download speeds are recovering in most countries as SpaceX continues to scale capacity with recent satellite launches. In Q4 2024, most European countries experienced an improvement in Starlink download speeds, likely driven by the continued expansion of the satellite constellation. The sharp increase in operational satellites at the end of October last year appears to have contributed to higher speeds across multiple countries, with some regions seeing particularly notable gains. Southern European countries such as Croatia (~70%) and Greece (~65%) recorded substantial quarter-on-quarter download speed increases between the third and fourth quarters of last year, now ranking among the fastest Starlink connections in Europe.
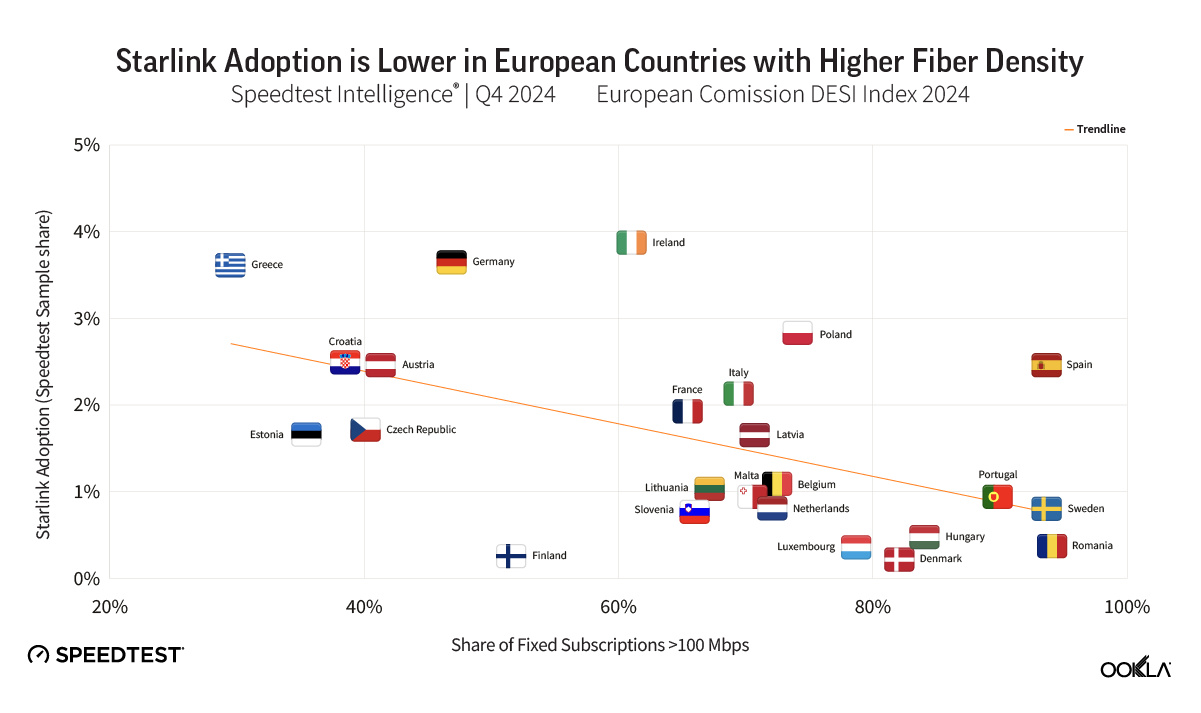
Starlink adoption is more highly concentrated in countries with lower levels of fiber penetration and a larger proportion of the population living in rural areas. Central and Southern European countries such as Germany, Greece, Italy and Croatia have below-average FTTH coverage compared to the EU average and exhibit higher levels of Starlink adoption, likely due to the LEO solution being relatively more competitive (either on performance or price) in these regions. At the same time, while Starlink continues to provide higher speeds than the aggregate terrestrial fixed broadband market in some countries—including Greece, the Czech Republic, Italy, and Croatia—the number of such markets is steadily decreasing. Significant fiber investments across Europe have improved fixed broadband speeds over the past two years, increasingly challenging Starlink’s competitiveness.
A Surge in Satellite Launches Expanded the Starlink Constellation in Late 2024
Source: SatelliteMap.space
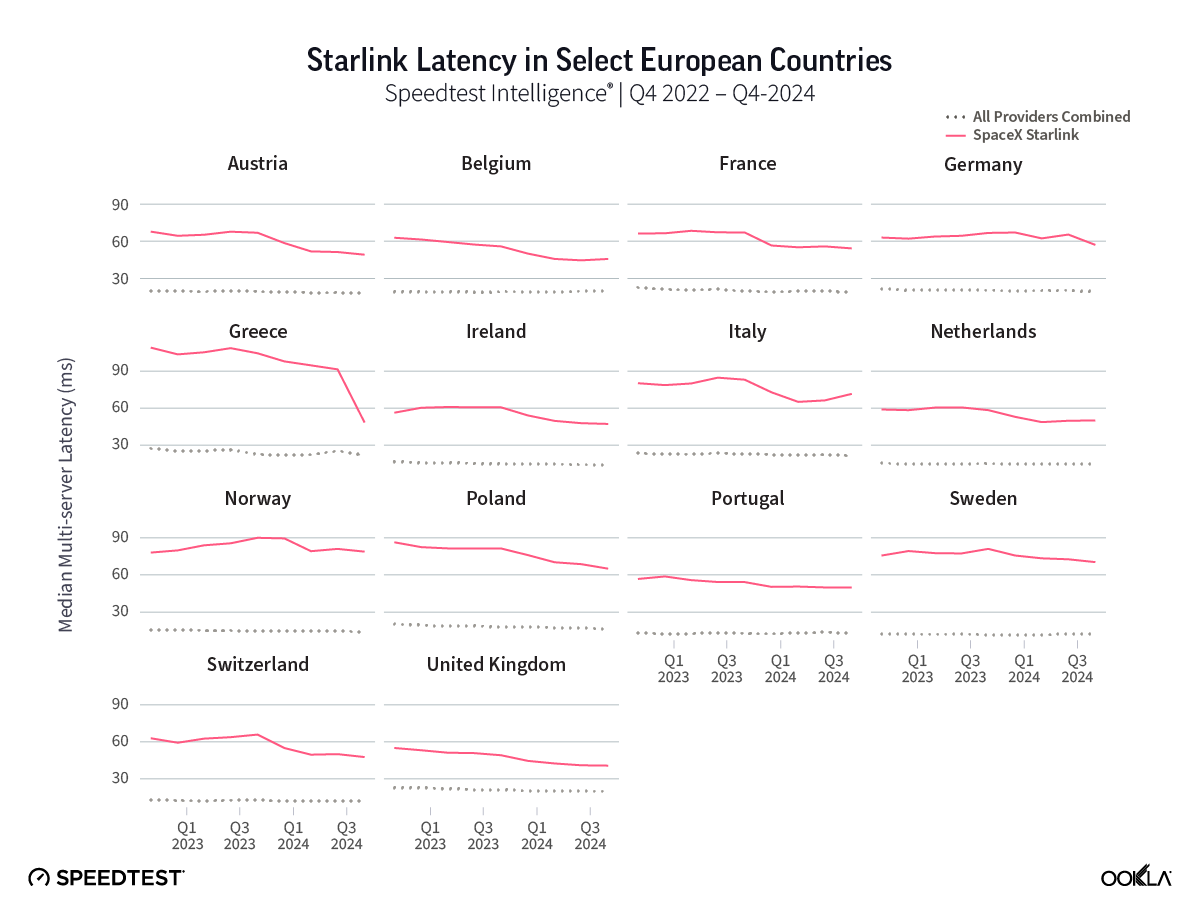
Starlink latency improvements continue at pace across Europe
The physics of transmitting data across vast distances between Earth and space has long challenged satellite operators in their efforts to compete with terrestrial fixed broadband services in Europe on latency. Starlink’s LEO system has been a game-changer, significantly improving latency performance compared to traditional satellite systems that rely on mid-Earth or geostationary orbits.
Over the last two years, SpaceX has been focused on building on this advantage and narrowing the disparity between the performance of its service and what is available from terrestrial fixed operators. To achieve this, it has sought to reduce the distance and number of hops data travels across its network. This has involved massively expanding its satellite constellation over Europe—boosting inter-satellite links for more direct routing—and increasing ground station density to optimize connections to the terrestrial internet.
While the latencies observed in the aggregate fixed broadband market remain materially lower than those of Starlink across Europe, there has been remarkable progress in improving its competitiveness. Speedtest Intelligence® data reveals a consistent trend of double-digit declines in median latency across over a dozen European countries between Q4 2023 and Q4 2024.
During the period between Q4 2023 and Q4 2024, countries in Central and Southern Europe recorded significant improvements in Starlink’s median latency performance. Greece saw its median latency decline by 54%, while Switzerland and Austria saw declines of 28% and 27% respectively. These improvements are contributing to Western Europe’s strong overall performance in latency on Starlink connections, with several countries now approaching the 40 ms mark for the first time. The United Kingdom led the continent with a median latency of 41ms in Q4 2024, followed by Belgium (46 ms), Luxembourg (46 ms) and Ireland (47 ms).
This rapid pace of improvement in latency comes from a high baseline but is at least twice as fast as the underlying rate of improvement in the aggregate fixed broadband market across most European countries. A notable exception is Spain, where Starlink’s median latency of 54 ms showed only a 4% reduction over the year, matching the modest improvement seen in the rest of the country’s fixed broadband market. This limited improvement may reflect orbit-related factors, as neighboring Portugal also experienced a relatively small 8% reduction in Starlink latency compared to the larger improvements observed in most other European countries.
Across Starlink’s European footprint, latency outcomes continue to vary significantly by country. In Southern Europe, Cyprus (144 ms) and Malta (106 ms) recorded some of the continent’s highest latency in Q4 2024, while Nordic countries like Finland (89 ms) and Norway (79 ms)—despite often leading in Ookla’s terrestrial benchmarks—also lagged behind.
These regional disparities in latency performance highlight the immense technical challenge of delivering uniform service across Europe. Higher-latitude Nordic countries often rely on Starlink’s polar-orbit satellites for coverage in the far north, which can impact performance. Meanwhile, Cyprus and Malta’s higher latency may stem from a limited ground station presence, increasing reliance on inter-satellite links for connectivity.
Shifts in download speeds indicate Starlink is balancing capacity and demand in Europe
Unlike latency, which has seen significant and sustained improvements across most European countries over the past two years in Speedtest Intelligence data, Starlink’s download speed performance has faced growing pressure as the service scaled and network usage increased.
Between Q4 2022 and Q4 2023, Central European countries saw some of the steepest declines in median download speeds. In Germany, speeds fell by 31%—from 94.37 Mbps to 65.44 Mbps—while Switzerland recorded a 24% drop, going from 136.03 Mbps to 103.88 Mbps. Combined with the backdrop of improving median download speeds in terrestrial fixed broadband—driven by accelerating FTTH deployment and adoption—Starlink’s competitiveness on speed eroded over this period in many parts of Europe.
For the first time in Q4 2024, there were signs that the successive speed declines observed in previous quarters may have stabilized, with early indications of a potential recovery. However, given quarter-to-quarter variability, it remains to be seen whether this trend will hold in the coming year.
Nonetheless, the timing of these improvements dovetails with the reported jump in the number of Starlink satellites in service from late October last year, likely reflecting the additional capacity afforded by an expanded constellation above Europe.
Starlink Download Speeds Improved in Most European Countries in Q4 2024 Following Constellation Expansion
Speedtest Intelligence® | Q4 2022 — Q4 2024
While most European countries recorded a material quarter-on-quarter boost in Starlink’s median download speeds in Q4 2024, the most pronounced gains were concentrated in Southern Europe. The significant improvements in countries like Croatia (~70%) and Greece (~65%) have propelled them to be among the top in Europe in terms of median download speed on Starlink, joining other neighbors in nearby countries like Hungary and Romania.
Even the previously mentioned examples, Germany and Switzerland, for the first time in almost two years, saw a quarter-on-quarter speed increase in Q4 2024, rising by 18% and 11% respectively. The overall movements have left countries in Central and Southern Europe trailing in Starlink’s median download speed, with Cyprus (36.52 Mbps) and Malta (53.85 Mbps) ranking similarly as poorly as in latency, but others—most notably the Nordics—performing relatively better on median download speed than latency.
Despite the decrease in the number of countries where Starlink delivers higher median download speeds than the aggregate terrestrial fixed broadband market over time, principally a result of rising FTTH adoption driving improved fixed performance, several countries still stand out.
Starlink is Competitive with Fixed Operators in Southern Europe on Download Speed
Speedtest Intelligence® | Q4 2024
For example, in Q4 2024, median download speeds on Starlink were faster in Greece, Croatia, Italy, Austria, the Czech Republic and Estonia than the aggregate terrestrial fixed broadband speeds in these markets, all of which feature FTTH coverage below the EU average.
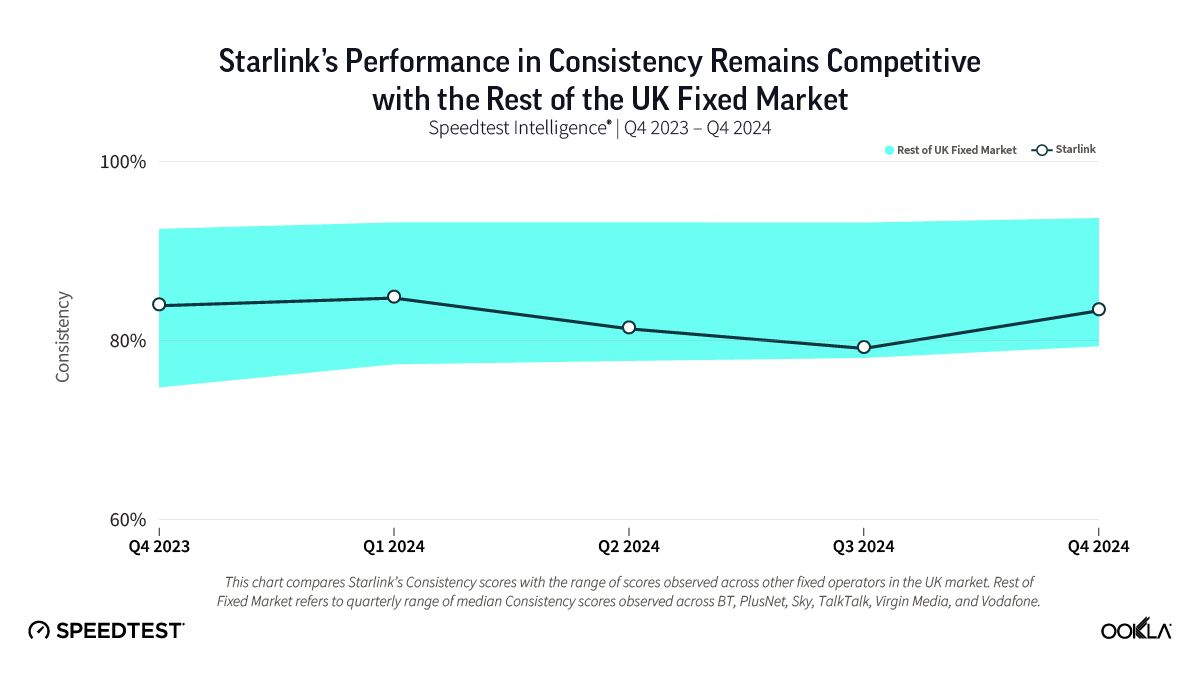
In the many countries where Starlink is not ahead of the rest of the fixed market on download speed performance—which is the majority of European countries—it remains competitive on other related metrics, including consistency, which measures the proportion of Speedtest samples exceeding minimum thresholds of 25 Mbps for download and 3 Mbps for upload.
In the United Kingdom, for example, Starlink’s consistency performance remained within the range of the rest of the fixed market over the last year, behind operators like Virgin Media and Vodafone but ahead of TalkTalk and PlusNet. In QoE measures such as Game Score™ (a 0-100 weighted sum incorporating multiple video performance factors), it has steadily closed the gap with the broader UK fixed market, narrowing from over 5 points in Q4 2023 to less than 3 points in Q4 2024.
This improvement in video QoE on Starlink connections has been observed across many European countries over the past year, driven by reductions in adaptive start time and failure rates—resulting in Starlink users spending less time waiting for videos to load and experiencing fewer playback issues—as well as enjoying an increase in average video bitrate.
Starlink adoption continues to be shaped by regional demographics and the varying availability of high-speed broadband
The relative penetration of Starlink across Europe (based on analysis of share of Speedtest samples) remains highly varied by country and region, shaped largely by demographics and the profile of available fixed broadband technologies in each market. Highly urbanized countries with a small share of the population living in rural areas, such as the Nordics and the Benelux region, exhibit lower levels of Starlink adoption.
Higher-than-average fiber availability and take-up in these countries (corresponding to a larger share of fixed subscriptions providing download speeds of at least 100 Mbps), combined with the performance declines at higher latitudes closer to polar orbits, mean that Starlink may not be a competitive broadband access solution for a large proportion of the population. Other factors, such as high levels of fixed wireless access (FWA) penetration—offering higher performance at lower prices than Starlink—in countries such as Finland may also contribute to dampening the appeal of LEO services there.
Starlink Adoption is Highest in Southeastern Europe, Moderate in Central and Western Europe and Lowest in Fiber-Rich Nordic and Benelux Regions
Speedtest Intelligence® | Starlink Share (%) of Total Fixed Speedtest Samples in Q4 2024
A corollary is seen in parts of Central and Southern Europe, where Starlink is relatively more competitive as a fixed broadband solution and measured take-up of alternatives like FWA is below the EU average. This is driven by higher Starlink speeds compared to other parts of Europe—particularly in Greece and Croatia—along with the lower-than-average availability of fixed networks offering very high-capacity coverage (as defined by the European Commission for FTTH and DOCSIS 3.1). As a result, Starlink is relatively more competitive in these markets and, in some cases, outperforms terrestrial fixed operators.
The higher proportion of Starlink users in Germany among Europe’s largest economies is likely a consequence of its outdated fixed broadband mix. With some of the lowest FTTH coverage in the EU and higher fixed broadband prices than elsewhere, Starlink adoption may be higher in Germany and present an attractive alternative there despite providing lower speeds than in other parts of the continent.
Notwithstanding these structural patterns, however, not all instances of Starlink adoption fall neatly into line across Europe. As noted earlier with the example of London, some outliers are driven by specific use cases. For instance, London’s relatively high Starlink usage has been partly linked to its utility beyond home broadband and in providing connectivity for events, supporting card terminals and similar applications.
The LEO space race is heating up above Europe
SpaceX’s ambitions for Starlink in Europe extend well beyond traditional broadband. Over the coming year, the company plans to enter the direct-to-device (D2D) market—widely seen as the next frontier in the LEO space race—by connecting unmodified consumer handsets. This effort is being powered by the launch of SpaceX’s Gen2 satellites, of which the company ultimately hopes to deploy tens of thousands.
The company’s success in transforming the economics of large-scale satellite launches has inspired others to make similar moves. Amazon, for example, plans to deploy over a thousand satellites by mid-2026 through its Project Kuiper initiative, which will focus on mid-latitude coverage (lacking the polar-orbits boasted by Starlink). AST SpaceMobile, meanwhile, is targeting the D2D market and already has five satellites in operation. It aims to expand its constellation to more than 240 satellites.
We look forward to monitoring the satellite market as it expands into the D2D space in the coming months, and will return to check up on how Starlink is performing in other regions beyond Europe. For more information about Speedtest Intelligence data and insights, please contact us.
Ookla retains ownership of this article including all of the intellectual property rights, data, content graphs and analysis. This article may not be quoted, reproduced, distributed or published for any commercial purpose without prior consent. Members of the press and others using the findings in this article for non-commercial purposes are welcome to publicly share and link to report information with attribution to Ookla.
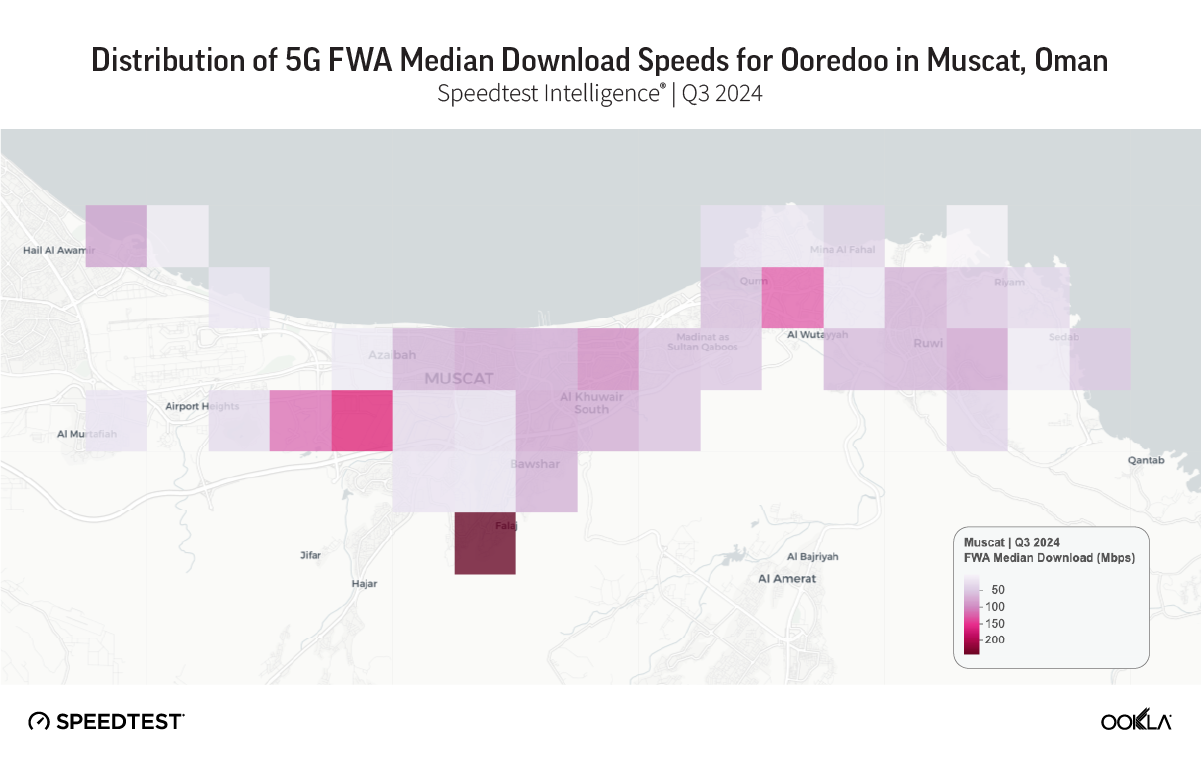
5G fixed wireless access (FWA) has positively impacted the Gulf region’s broadband landscape. It became popular because it provides consumers and enterprises with affordable, flexible, alternative high-broadband services to fiber. In this article, we identify the drivers for 5G FWA adoption in the Gulf region, use the example of Ooredo in Oman to examine the performance of FWA services, and discuss how local ISPs could improve the positioning of FWA to drive further adoption.
Key Takeaways:
The main drivers of 5G FWA’s take-up in the Gulf region are performance, affordability, reach, and convenience. These characteristics helped to make the service more accessible to a broader population segment. Moreover, the shift from data-capped plans to unlimited data offerings has made 5G FWA more appealing to consumers and businesses.
The evolution of 5G technology is helping FWA cater to the needs of high-demand users. For example, in Q3 2024,Ooredoo (Oman) achieved a 90-percentile download speed of 83 Mbps, narrowing the gap with the most affordable fiber package that starts at an advertised speed of 100 Mbps.
Gulf operators could address the negative perceptions associated with 5G FWA by continuously optimizing networks, offering flexible contract terms, affordable pricing, and popular over-the-top (OTT) bundles.
The Gulf region is one of the global leaders in the deployment and adoption of FWA services
Some of the earliest adopters of 4G/5G FWA have been Gulf-based operators. They have been integrating it into their fixed broadband portfolios with 4G since 2021. While FWA has traditionally been considered secondary to fiber, its significance has grown with the advent of 5G as a cheaper alternative to fiber, particularly in areas of low coverage.
Operators’ emphasis on 5G FWA services is primarily influenced by their market share in the fixed broadband market and the extent of their fiber network coverage. Market incumbents initially focused on expanding their fiber services as part of transitioning from legacy technologies like DSL, viewing 5G FWA as a secondary offering. In larger countries, where fiber deployment and adoption have been slower, like Oman, all operators recognized the potential for 5G FWA to bridge the high-speed broadband divide. Hence, they have been offering FWA while actively promoting fiber.
5G FWA created an opportunity for market challengers to address the limitations of both legacy and fiber technologies, including:
Poor performance on legacy technologies: 5G FWA represents a significant upgrade in performance for DSL and 4G FWA users.
Coverage gap: 5G FWA offers an advantage in terms of reach. Mobile operators have used it to enter the fixed market, and converged operators have deployed FWA to extend broadband services to remote or hard-to-reach locations quickly.
Installation complexity: Self-installed indoor customer premises equipment (CPE) is typically provided free as part of an annual subscription.
Contract length and cost: Operators have positioned 5G FWA as lower-priced packages, offering more contract flexibility than fiber plans, which usually lock customers in a contract for two years.
Ooredoo Oman used 5G FWA to complement its fiber strategy
We use Oman as an example to analyze the market context that favored the launch of 5G FWA and discuss the operator’s business strategy. We also use Speedtest Intelligence® to assess network performance between Q3 2023 and Q3 2024 and identify the locations within the Omani capital, Muscat, where customers would have experienced the fastest median download speeds during Q3 2024.
Omantel and Ooredoo launched 5G FWA in Oman before introducing mobile 5G in April 2021. Omantel was the first to launch 5G fixed-wireless access (FWA) services in December 2019, followed by Ooredoo in May 2020. According to the Telecommunications Regulatory Authority (TRA), 5G broadband subscriptions increased from 37,000 in June 2021 to 212,204 in June 2024, a nearly 6-fold increase in three years. During this period, fiber subscriptions increased by almost 48% to 307,635.
Ooredoo has been expanding its 5G coverage to serve more customers. Its 5G FWA coverage increased from 46.8% at the end of 2021 to 87.6% in June 2024, increasing its fixed 5G base by 27% by the end of 2023 compared to 2022. While 5G has driven fixed broadband growth for Ooredoo, the operator has also pursued a fiber expansion strategy by relying on a national wholesale fiber infrastructure provider, Oman BroadBand (OBB).
At launch, Ooredoo introduced speed-tiered FWA tariffs ranging from 30 Mbit/s to 200 Mbit/s with varying monthly data allowances. It continues to segregate 4G from 5G plans and segment them by speed, contract length, and number of content packages included. In 2024, the price of FWA packages dropped to an OMR25–OMR35 ($65–$91) range per month, with faster speed, higher data allowances, and more content.
4G/5G FWA performance improved with some fluctuations. The median download speed was 18.74 Mbps in Q2 2022 and gradually increased to 43.78 Mbps by Q3 2024. This steady growth suggests that Ooredoo has improved its network infrastructure and, as a result, its user experience.
5G FWA underperforms wired broadband service according to Speedtest Intelligence data, but the performance gap is shrinking. For reference, the median download speed measured for Ooredoo’s wired broadband users reached 64.22 Mbps in Q3 2024. Considering that this figure represents mainly fiber performance, FWA can provide a decent alternative for those who cannot subscribe to fiber services.
Ooredoo’s performance is reflected in the significant upward trend in the 90th percentile speeds. It started at 33.66 Mbps in Q2 2022 and peaked at 83.37 Mbps by Q3 2024. This increase indicates that while the median speeds were relatively modest, the top-performing users experienced substantial improvements in their download speeds.
Median and 90th percentile 5G FWA Download Speeds, Ooredoo Oman
Median and 90th percentile 5G FWA Download Speeds, Ooredoo Oman
When we look at the distribution of median download speeds around the capital city of Muscat, we note that central neighborhoods, such as Madinat Al Irfane and Ghala, and coastal areas, such as Qurm, enjoy a speed of at least 100 Mbps. Meanwhile, residents west of Falaj enjoyed a median speed of at least 200 Mbps.
ISPs can adopt different strategies to enhance 5G FWA adoption in the Gulf region
Operators could adjust the way they position 5G FWA propositions to address the concerns and negative perceptions that hindered their adoption in the past, including:
Provide high-quality CPEs. Operators have regularly refreshed the CPEs with new models that provide better reception (for example, by using MIMO technology), support better Wi-Fi capacity (for example, by using Wi-Fi 6 standard), and indoor coverage (by offering mesh devices).
Position it as a more affordable alternative to fiber. Over the last two years, the price of 5G FWA has decreased considerably, and all operators in the Gulf have waived the upfront one-time payment for the CPE while shifting to unlimited data usage by default (at least in the first year).
Bundle FWA services with content subscriptions to help differentiate from fiber offerings with flexible content, such as video streaming and gaming. For instance, some operators offer a selection of these with their FWA plans, which adds significant value for customers and helps position it as a comprehensive home entertainment solution.
Operators’ strategic deployment of 5G FWA, affordability, and ability to quickly extend high-speed internet access to areas with limited fiber coverage helped popularize the Gulf region service. As network coverage expands, FWA will likely play an increasingly important role in the region’s broadband market, offering a viable alternative to traditional fiber connections and helping bridge the digital divide in underserved areas.
Challenger FWA operators, such as Ooredoo Oman, are investing in optimizing their network performance to maintain their competitiveness. The recent 5.5G trials in the region will also set a new basis for competition as the latest technology promises to offer even faster download speeds, lower latency, and enable differentiated quality of service and dedicated resources through network slicing. These enhancements will help to improve customer satisfaction and drive the growth of FWA services in the region.We will continue to monitor the evolution of 5G FWA and its adoption in the region. For more information about Speedtest Intelligence data and insights, please contact us.
Ookla retains ownership of this article including all of the intellectual property rights, data, content graphs and analysis. This article may not be quoted, reproduced, distributed or published for any commercial purpose without prior consent. Members of the press and others using the findings in this article for non-commercial purposes are welcome to publicly share and link to report information with attribution to Ookla.
Record power outages have crippled mobile network infrastructure, underscoring the need for network hardening as severe weather events become more frequent.
The UK and Ireland are in recovery mode after Storm Éowyn wreaked havoc on electricity and telecoms infrastructure in recent days. With record wind gusts exceeding 180 km/h recorded in Ireland and a ‘major incident’ declared on the Isle of Man, the storm has been historic in both its strength and the extent of the damage caused across the islands.
Key Takeaways:
Storm Éowyn triggered a rapid, severe and sustained decline in mobile performance across all operators in Ireland and parts of the UK, particularly Northern Ireland and Scotland, on a scale not seen before. On the day the storm made landfall (24th January), median mobile download speeds in Ireland (10.04 Mbps) were 78% lower than the preceding 7-day average of 47.43 Mbps, while median latency was 23% higher at 47.6 ms. In Scotland and Northern Ireland, mobile download speeds at the 10th percentile—a critical metric reflecting the poorest network performance—dropped significantly on the same day, falling by 63% to 2.19 Mbps and by 74% to 1.31 Mbps, respectively, compared to the 7-day average.
Network disruptions drove a dramatic deterioration in quality of experience (QoE) in bread-and-butter consumer applications. Consistency—an important metric indicating the proportion of Speedtest samples meeting minimum download and upload speed thresholds—dropped sharply on the day of the storm, falling by over 20 percentage points to 60.3% in Northern Ireland and by nearly 40 percentage points to 52.3% in Ireland compared to the preceding 7-day average. On the day following the storm (25th January), as power restoration efforts were still in their early stages, Video Score—a key indicator of QoE in gaming activities—remained significantly suppressed, falling by over 23 points compared to the preceding 7-day average in Northern Ireland.
The unprecedented scale of impact on telecoms infrastructure serves as the latest and most high-profile call to action for hardening networks against increasingly frequent and severe storms in the UK and Ireland. Record daily consumer-initiated Speedtest volumes and a 62% surge in Speedtests conducted on Starlink connections in Ireland on the storm day, compared to the preceding 7-day average, highlight the severity of the telecoms infrastructure disruptions as consumers scrambled to troubleshoot issues and turned to alternative connectivity solutions like satellite.
Ireland’s state electricity supplier, ESB Networks, reported “unprecedented” power outages affecting over 725,000 premises (equivalent to as much as one-third of all homes in the country), with restoration times expected to exceed a week in the hardest-hit areas. The extensive damage to the electricity grid has had severe knock-on effects on both fixed and mobile network infrastructure, with well over a thousand mobile sites taken offline due to disruptions to mains power and downed trees causing damage to overhead fibre cabling along roads.
The impacts have been significant across operators. In Ireland, Eir reported that fixed broadband faults were affecting 160,000 premises, with more than 900 mobile sites knocked offline, while Vodafone said more than 10% of its mobile site footprint was affected. Similarly, in the UK, there were elevated reports of network outages across telecoms operators on Downdetector, with the largest concentration of disruptions in the worst hit areas in Scotland and Northern Ireland.
This storm, the most severe to date, follows a series of disruptive weather events across the UK and Ireland during recent winter months. In December, Ookla published detailed research on the impact of Storm Darragh, highlighting the unique challenges posed by widespread, prolonged power outages on mobile networks. These challenges included a dual strain: increased network load as fixed broadband outages shifted traffic to mobile infrastructure and a diminished mobile site grid due to power outages at mobile sites. Together, these factors significantly degrade mobile network performance, reducing overall network availability and pushing more subscribers into the cell edge.
Mobile users in Ireland see marked declines across all performance metrics, with network impacts continuing
Analysis of Speedtest Intelligence® data highlights the significant impact of Storm Éowyn on mobile network performance in Ireland. Download and upload speeds saw sharp and sustained declines, accompanied by increased latency and jitter across all operators nationwide. The deterioration started early on Friday morning, 24th January, as the storm made landfall. While some recovery was observed the following day (25th January), all performance metrics remain materially below pre-storm levels nationally.
Despite the absence of active network sharing in Ireland—limited to cooperation on passive infrastructure, which relies on a common mains power supply at shared sites—the storm’s impacts were felt similarly across operators. Notably, the performance profile across operators during the storm closely mirrored pre-storm trends. For instance, Three maintained its lead in download speed and demonstrated a faster recovery on this metric compared to other operators.
Storm Éowyn Blows Down Mobile Performance in Ireland Across All Metrics and Operators
Speedtest Intelligence® | January 2025
In addition to a decline in metrics like Consistency—designed to measure the proportion of Speedtest samples reflecting a consistent quality of experience (QoE)—the storm-induced network disruptions led to a substantial increase in failed or partially completed Speedtest sessions across all operators on the day of the storm. Similarly, the severe decline in 10th percentile performance—where aggregate download speeds plummeted by over 87%, from a 7-day average of 3.97 Mbps to just 0.51 Mbps—highlights the extent of performance degradation experienced by Irish mobile users at the bottom end.
Storm Éowyn Triggers Sharp Deterioration in Consistency Across All Operators
Speedtest Intelligence® | January 2025
On the day of the storm, Consistency dropped to a low of 38% at 09:00 on Friday nationally and remained below 55% in the evening. While there was an improvement the following day (25th January), reaching a high of 66% at 16:00, the overall profile remains significantly below the pre-storm baseline.
Storm Éowyn Triggers Sharp, Sustained Decline in Consistency Across Ireland
Speedtest Intelligence® | January 2025
It is notable that the limited penetration of battery backup solutions in Ireland’s mobile site grid—typically providing only four to eight hours of power where available—stands in sharp contrast to regions like the Nordics and Australia, which have implemented comprehensive policy measures to harden telecoms infrastructure, as highlighted in a recent Ookla article. This shortfall has resulted in a disproportionate reliance on stationary and mobile generators in the Irish context.
While mobile generators have high operating costs, which limit their feasibility for prolonged or widespread deployment across the mobile site grid in Ireland, they offer operators valuable deployment flexibility. Mobile operators can proactively position generators at key sites based on forecasted storm tracks and leverage distributed fuel dumps across the country to enable rapid refueling during post-storm operations.
Analysis of Speedtest Intelligence data underlines the impact of these efforts on service continuity and restoration. On the morning of the storm, Eir publicly reported deploying mobile generators to key sites in County Cork—one of the worst-affected areas—to restore mobile services ahead of mains power being restored. This proactive approach (which all operators adopted) is reflected in a sharp recovery of Eir’s Consistency score in Cork, which rebounded from as low as 59% on the day of the storm to as high as 95% the following day. This rate of recovery outpaced other operators in the county for this metric, highlighting the important role of rapid power restoration using generator solutions.
Mobile network disruptions extend to Scotland and Northern Ireland
While Ireland experienced some of the most severe and widespread impacts of Storm Éowyn, it was not alone. In Northern Ireland, power outages affecting 30% of premises at their peak were reported by NIE Networks, the primary energy provider in the region. Similarly, in Scotland, over 100,000 homes were left without power, with restoration efforts expected to continue for several days. These widespread power outages have impacted mobile site uptime in both regions.
Storm Éowyn's Impact on Consistency was more pronounced in Northern Ireland than Scotland
Speedtest Intelligence® | January 2025
Speedtest Intelligence data indicates a decline in mobile performance across multiple metrics among operators in Northern Ireland and Scotland, with Northern Ireland experiencing the greatest impact. Mobile download speeds at the 10th percentile plummeted on the day of the storm, falling 63% to 2.19 Mbps in Scotland and 74% to 1.31 Mbps in Northern Ireland relative to the seven-day average before the storm.
Storm Éowyn Pulls Down Mobile Performance Across Several Metrics in Scotland and Northern Ireland
Speedtest Intelligence® | January 2025
Similar to Ireland, the penetration of battery backup solutions installed at mobile sites in the UK remains limited. In its latest annual ‘Connected Nations‘ report, Ofcom noted that only around 20% of all mobile sites in the UK have some backup functionality at the RAN for more than 15 minutes, while only around 5% of sites are able to withstand a six-hour power loss (excluding battery backup for transmission traffic). It has consulted on revised ‘Resilience Guidance’ for the UK’s telecoms operators, published a call for input (CFI) on power backup for mobile networks and is now working with the government to determine if additional resilience measures are needed.
Ookla retains ownership of this article including all of the intellectual property rights, data, content graphs and analysis. This article may not be quoted, reproduced, distributed or published for any commercial purpose without prior consent. Members of the press and others using the findings in this article for non-commercial purposes are welcome to publicly share and link to report information with attribution to Ookla.
The Gulf region and Turkey have experienced a surge in air passenger traffic. The growth is expected to remain robust in key hubs such as Dubai, Doha, and Istanbul. As airports prepare to accommodate this influx of travelers, reliable and high-performance cellular networks have become increasingly important in shaping the overall passenger experience. This article benchmarks the network performance of the busiest airports in the Gulf region and Turkey, in terms of download and upload speeds, as well as latency, based on Speedtest Intelligence® data. It also provides recommendations on where travelers may get the best online experience.
Key Takeaways:
Zayed International Airport (AUH) achieves top-tier mobile download speeds of over 450 Mbps. Istanbul Airport (IST) excels in upload speed at 58.40 Mbps, making it particularly suitable for travelers who need to share content efficiently. On the other end, King Abdulaziz International Airport (JED) in Jeddah consistently underperforms across all metrics, with the highest latency and lowest upload speed.
Istanbul Airport significantly leads in 5G performance thanks to a dedicated 5G indoor network: IST achieved the highest download and upload speeds at 861.98 Mbps and 101.96 Mbps, respectively. Gulf-based airports showed a high contrast in median 5G download speeds, with those in Qatar and the UAE offering the fastest speeds at over 500 Mbps.
Most airports provided a median download speed of at least 200 Mbps, enabling an excellent online experience for passengers
While Turkey has long been a magnet for tourists, the Gulf region has emerged as one of the world’s premier travel hubs, attracting hundreds of millions of passengers annually. As a result, airport operators in the region face a pressing need to deliver seamless web browsing, lag-free online gaming, and high-quality streaming experiences to enhance the overall passenger experience and set a new standard for airport facilities. We used Speedtest Intelligence to analyze cellular network performance in the busiest airports in the Gulf region and Turkey.
Total Passengers In Selected Busiest Airports In The Gulf Region And Turkey
Wikipedia | 2024
Total Passengers In Selected Busiest Airports In The Gulf Region And Turkey
Download speed is the most important metric for content consumption and online experience. Zayed International Airport (AUH) had a median download speed of 453.18 Mbps. It was closely followed by Hamad International Airport (DOH), with a speed of 426.43 Mbps. King Khalid International Airport (RUH) and Istanbul International Airport (IST) also delivered excellent download speed performances at 329.04 Mbps and 314.84 Mbps, respectively.
In contrast, Sabiha Gökçen Airport (SAW) and Muscat International Airport (MCT) delivered sub-100Mbps speeds of 78.67 Mbps and 95.95 Mbps, respectively. Airports based in Dubai and Kuwait fall into the mid-range, with download speeds of around 250 Mbps.
Upload speed is important as it determines how efficiently users can upload documents, photos, and videos. IST stands out with a median upload speed of 58.40 Mbps, surpassing all other airports. RUH in Riyadh, DOH in Doha, and SAW in Istanbul follow with upload speeds of 32.83 Mbps, 30.10 Mbps, and 29.10 Mbps, respectively. King Abdul Aziz International Airport (JED) in Jeddah falls short, delivering the lowest upload speed of just 16.11 Mbps, while DXB pulls slightly ahead with 18.99 Mbps.
Latency measures the delay in transferring data and affects real-time services such as video calls, online gaming, and media streaming. Most airports offer a sub-40 ms latency, which ensures acceptable responsiveness for users. IST and Kuwait International Airport (KWT) have somewhat better conditions, with a delay of under 32 ms. JED stood out again as a poor performer with a latency of 89.98 ms, suggesting a significant impact on real-time applications such as gaming and video conferencing.
All Technologies Network Performance, Select Airports in the Gulf and Turkey
Speedtest Intelligence® | 2024
All Technologies Network Performance, Select Airports in the Gulf and Turkey
Istanbul Airport significantly leads the region in 5G performance thanks to a dedicated 5G indoor network
As 5G adoption increases, consumers and businesses expect the same level of coverage and performance wherever they go. Yet, the characteristics of ‘outdoor’ 5G, which typically operates in mid-band frequencies of 1.8 GHz to 3.5 GHz, pose a challenge for indoor coverage, as these frequencies struggle to penetrate walls and windows, particularly those built of glass and steel. Furthermore, telecom operators have prioritized outdoor coverage because it requires less CAPEX and OPEX per subscriber than indoor coverage and has a better return on investment. In addition, the traffic patterns in the airport are highly variable, which means that the network must be capable of accommodating different connectivity levels.
The introduction of 5G in Turkey lags significantly behind as 700 MHz, 3.5 GHz, and 26 GHz frequencies will be auctioned in 2025, with commercial launch expected in 2026. However, Istanbul International Airport (IST) deployed a dedicated indoor 5G network that serves only users within the airport’s premises. This deployment gives it performance advantages compared to public 5G networks. Speedtest Intelligence data shows that IST secured the top spot for 5G median download and upload speeds at 861.98 Mbps and 101.96 Mbps, respectively.
Airports in Abu Dhabi (AUH) and Doha (DOH) also have high 5G download speeds, at 678.11 Mbps and 657.56 Mbps, respectively. All other Gulf-based airports provided a median download speed of at least 107 Mbps, enabling users to stream multiple 4K videos over 5G.
Gulf airports lagged significantly behind IST in upload speeds, with four locations’ speeds ranging from around 30 Mbps to 45 Mbps. The other four Gulf-based airports underperformed, with MCT and JED at the bottom of the list with a median upload speed of 15.09 Mbps and 17.84 Mbps, respectively, despite deployingsolutions to improve indoor network coverage and capacity.
Most airports offer a relatively low 5G latency, around 30 ms to 36 ms, suggesting good service responsiveness. The only exception is JED, with a median latency of 86.59 ms, likely degrading the customer experience of real-time services such as video streaming.
5G Network Performance, Select Airports in the Gulf and Turkey
Speedtest Intelligence® | 2024
5G Network Performance, Select Airports in the Gulf and Turkey
As the results show, airports in the Gulf region and Turkey generally have excellent mobile network performance inside and around these facilities. These achievements were realized thanks to the deployment of 5G and investment in solutions to improve indoor coverage and capacity.
The tourism boom in Turkey and the Gulf region is set to continue and will drive infrastructure investment and economic growth
According to GlobalData, the number of international arrivals into the GCC (Gulf Cooperation Council) reached 73.64 million travelers in 2023. The U.A.E. leads the GCC in terms of tourist numbers with 28.2 million visitors in the city during H1 2024, while Saudi Arabia received 27.4 million visitors (including pilgrims) with the ambition to grow to 150 million by 2030. The tourism sector in Qatar is also a promising destination, with 3 million visitors in 2023, benefiting from the successful hosting of the World Cup in 2022. Oman welcomed 3.4 million tourists in 2023 and plans to attract 11.7 million by 2040.
These countries have invested heavily in infrastructure, including transport, to address the growing influx of tourists and translate into economic growth. They have also built new airports and upgraded existing ones to cater to the rise in air passenger traffic, which is expected to surge to 449 million in 2024, more than double its 2019 level.
The new Istanbul airport was inaugurated in 2018 to make Turkey’s capital one of the world’s largest financial and economic centers. It had an initial capacity of 90 million passengers annually, making it a major gateway for international visitors and contributing to the country’s economy. According to the Ministry of Culture and Tourism, the number of tourist arrivals in the country increased by 7% to 47.3 million during the first 10 months of 2024 compared to the same period the previous year. It plans to expand its capacity to 120 million passengers in 2025.
As the Gulf region and Turkey continue to experience a surge in air passenger traffic, it is essential to meet their expectations for fast and reliable connectivity to enhance their overall experience and gain a competitive edge over other airports. By doing so, they can unlock new growth opportunities, improve customer loyalty, and strengthen their position as major global travel hubs.We will continue to monitor network performance in key locations where people spend their time and how it impacts their online experience. If you are interested in Speedtest Intelligence, please contact us.
Ookla retains ownership of this article including all of the intellectual property rights, data, content graphs and analysis. This article may not be quoted, reproduced, distributed or published for any commercial purpose without prior consent. Members of the press and others using the findings in this article for non-commercial purposes are welcome to publicly share and link to report information with attribution to Ookla.