| November 5, 2025

MTN Opcos Generally Outperformed Airtel, Orange, and Vodacom in SSA During H1 2025

More operators in Sub-Saharan Africa (SSA) are introducing 5G, as they continue to expand their 4G networks. For telecom service providers, it is crucial to gauge how these investments affect mobile customer experience and support their operational and financial objectives. Using Ookla Speedtest Intelligence® data and operators’ reports, we analyzed the mobile network and operational performance of operating companies (opcos) and joint ventures of four main groups in the region – Airtel Africa, Orange, MTN, and Vodacom – across the 8 countries. These countries account for 55% of the region’s mobile cellular connections, according to GSMA Intelligence. They include:

  • East Africa: Kenya, Tanzania, Uganda
  • Southern Africa: Democratic Republic of Congo (DRC), Botswana, and South Africa
  • West Africa: Cote d’Ivoire and Nigeria
Map of Select Opcos and Joint Ventures for Airtel, Orange, MTN, and Vodacom in Sub-Saharan Africa

Key Takeaways

  • The groups’ opcos in South Africa and Botswana led SSA with a median mobile download speed of over 50 Mbps. Speedtest Intelligence data shows that MTN South Africa delivered the fastest median download speeds for All Technologies across the analyzed operators, at 74.76 Mbps in H1 2025. It was followed by MTN’s joint venture, Mascom, and Orange in Botswana, with a download speed of over 56 Mbps.
  • MTN South Africa led the region in median download speed, while Vodacom ranked fourth among surveyed operators, but the latter came first for 5G in South Africa. MTN significantly outperformed in both median download and upload speeds of 74.76 Mbps and 13.65 Mbps, respectively, in H1 2025, while Vodacom recorded 52.31 Mbps and 7.88 Mbps, respectively. However, Vodacom took the top spot with 5G median download and upload speeds of 174.9 Mbps and 11.86 Mbps, respectively. This advantage is linked to the use of a wider bandwidth of spectrum bands and a network strategy that prioritizes network densification in urban centres.
  • MTN took the top spot in Nigeria and Uganda, way ahead of Airtel in terms of median download and upload speeds. MTN Uganda is the top performer among the surveyed opcos in East Africa, while MTN Nigeria outperformed other operators in West Africa in 5G download speed.
  • Mascom and Orange in Botswana were among the best-performing operators. The country has been a pioneer in 5G, with Mascom getting a slight edge in median download and upload speeds over Orange, at 65.34 Mbps and 18.35 Mbps, respectively. In Côte d’Ivoire, where the same two groups compete, Orange secured the top spot with a median download speed of 35.25 Mbps.
  • MTN operations in Uganda, Nigeria, and Botswana were also the only operators with a 5G median download speed above 200 Mbps. The second group of operators includes Orange (Botswana), Safaricom (Kenya), Airtel (Nigeria and Uganda), Vodacom, and MTN (South Africa). These operators achieved median download speeds ranging from around 160 Mbps to 186 Mbps. In contrast, Airtel (Tanzania and Kenya) and Vodacom (Tanzania) had lower median download speeds, ranging between 60 Mbps and 130 Mbps.
  • Safaricom commanded a significant lead over Airtel in median download speed for All Technologies in Kenya, while in Tanzania, Airtel comfortably outperformed Vodacom in 5G. Safaricom comes in on top by a long shot in Kenya for median download and upload speeds for All Technologies; more than 2.4x higher than those of Airtel at 43 Mbps and 15.11 Mbps, respectively, the highest gap between two opcos in any reviewed market. The gap in 5G performance is even bigger, with Safaricom’s download and upload speeds around three times those of Airtel.
  • In the DRC, which hosts opcos from three groups, Orange outperformed in download speed, and Airtel had the highest upload speed. However, compared to the other groups’ opcos, the lack of 5G services and relatively limited 4G performance in the country weighed on the ranking of all DRC operators, with Airtel and Vodacom trailing at the bottom of the opco list.

The groups’ opcos in South Africa and Botswana led SSA in terms of  median mobile download speeds

Speedtest Intelligence data shows that the median download speed of the 19 selected operators from the four groups ranged from 14.8 Mbps for Vodacom (DRC) to 74.76 Mbps for MTN (South Africa) in H1 2025, while the median upload speed varied between 6.15 Mbps in Airtel (Kenya) and 18.35 Mbps for Mascom (Botswana), a joint venture of MTN.

We also used Speedtest Intelligence data to assess how frequently mobile users connect to 4G and/or 5G networks (referred to as Network Availability). A high propensity to connect to 4G and/or 5G suggests a high level of network reach and users’ readiness to use 4G/5G services (i.e., owning a smartphone and subscribing to a 4G/5G data package). Generally, the more time users spend connected to 5G, the more likely they are to experience better performance.

All Technologies and 5G Median Download and Upload Speeds, Select Operators and Countries in Sub-Saharan Africa
Source: Speedtest Intelligence® | H1 2025
All Technologies and 5G Median Download and Upload Speeds, Select Operators and Countries in Sub-Saharan Africa

The four groups’ operators in Côte d’Ivoire and the DRC have not yet widely launched 5G services. Deployment of 5G generally leads to a boost in mobile performance, with operators in South Africa, Botswana, Uganda, and Kenya leading the region. Sparse 5G coverage likely limited the 5G performance uplift for operators like Airtel (Kenya, Nigeria, and Tanzania) and Vodacom (Tanzania). These operators underperformed in terms of median download and upload speeds. 

On the other hand, MTN (Cote d’Ivoire) and operators in DRC, which have not commercialized 5G, tended to underperform others, with a median download speed not exceeding 25 Mbps in H1 2025. The few exceptions include Orange (Côte d’Ivoire), which achieved competitive performance levels despite not having launched 5G.

Comparing the 5G performance of the same operators shows that MTN’s opcos and joint ventures top the list. MTN operations in Uganda, Nigeria, and Botswana were the only operators with a 5G median download speed above 200 Mbps. The second group of operators, which includes Orange (Botswana), Safaricom (Kenya), Airtel (Nigeria and Uganda), Vodacom, and MTN (South Africa), achieved a median speed between around 160 Mbps and 186 Mbps. Airtel (Tanzania, Kenya) and Vodacom (Tanzania) trail the list with a median download speed between 60 Mbps and 130 Mbps.

In terms of regional differences, operators in Southern Africa tend to perform better than those in Eastern Africa, with median download speeds above 45 Mbps. Operators in Eastern Africa also deliver better network download speeds than those in Western Africa, where the top speed reached 35.25 Mbps for Orange (Côte d’Ivoire) in H1 2025.

Median Download per Region, Select Operators and Countries in Sub-Saharan Africa
Source: Speedtest Intelligence® | H1 2025
Median Download per Region, Select Operators and Countries in Sub-Saharan Africa

Sub-Saharan Africa continues to be an attractive market for telecommunications groups despite some headwinds

Africa remains appealing to telecom groups because of a combination of a young and rapidly growing population and demand for digital and financial services. Despite positive economic prospects, the groups reported headwinds in the form of currency devaluation and inflation impacting revenue, high and fluctuating energy costs, subdued economic growth affecting demand, and regulatory interventions, such as a reduction in mobile termination rates in Uganda (affecting MTN and Airtel). Tariff adjustments helped some operators, such as Airtel in Nigeria, to accelerate revenue growth to offset the effect of currency devaluation.

For the rest of the article, we analyze the markets by sub-region:

Safaricom significantly outperformed Airtel in both download and upload speeds for 5G and All Technologies

Kenya is a vital market for both Airtel and Vodacom with a thriving digital and financial services ecosystem. According to the Communications Authority of Kenya (CA), there were 76.2 million mobile subscribers in March 2025, translating into a population penetration rate of 145.3%. Thanks to operator customer win-back campaigns, the number has grown by 4.8 million SIMs since December 2024. The market is advanced in terms of data usage, thanks to the 42.3 million smartphone users. There were 57.1 million mobile data users, out of which the great majority, or 36.3 million, used 4G, while over 1.1 million connected to 5G. The Kenyan market is led by Safaricom (part of Vodacom), which has long maintained its dominant position. Safaricom held a 62.9% share, while Airtel Kenya is the second player, with a market share of 32.7%.

Armed with an extended 4G network and a growing 5G network, Safaricom has shifted its focus from connectivity to enabling digital services. To this end, it announced an investment of US$500 million in AI infrastructure across East Africa over the next three years (2025-2028), with Kenya as the focal market. On the other hand,  Airtel announced in June 2024 that it would invest more than $77 million to deploy 480 new 4G and 5G sites, which will reach 1,000 by the end of the year and increase the population’s coverage from 89% to 94%.

According to Speedtest data, Safaricom’s 4G Availability —the percentage of time users spend connected to 4G — and 5G Availability —the percentage of time users with 5G-capable devices spend connected to 5G only — is slightly lower than that of Airtel. In terms of performance, Safaricom comes out on top by a long shot for median download and upload speeds that are more than 2.4x higher than those of Airtel, at 43 Mbps and 15.11 Mbps, respectively, the highest gap between the two opcos in any reviewed market.

The gap in 5G performance between the two operators is even more pronounced. Safaricom’s median speed reached 183.26 Mbps, and its upload speed attained 27.12 Mbps, around three times the speeds achieved by Airtel in H1 2025.

4G/5G Network Availability, Airtel and Safaricom, Kenya
Source: Speedtest Intelligence® | H1 2025
4G/5G Network Availability, Airtel and Safaricom, Kenya

All technologies and 5G Performance, Airtel and Safaricom, Kenya
Source: Speedtest Intelligence® | H1 2025
All technologies and 5G Performance, Airtel and Safaricom, Kenya

Vodacom commands a slight lead in median download speed in Tanzania and enjoys a higher 5G Availability than Airtel

Tanzania is a high-growth market with 91.7 million active mobile subscribers as of June 2025 (excluding M2M), according to the Tanzania Communications Regulatory Authority (TCRA). Of these, 53.8 million are active mobile data subscribers.  Vodacom controls nearly one-third of mobile subscribers (32.1%), followed by Yas (formerly Tigo) with 28.1%. Airtel is the third largest operator, commanding a 22.4% market share.

Vodacom’s 4G population coverage reached 72.5% in FY 2025. It acquired Smile Communications in early 2024 for around US$28.18 million, giving it access to essential spectrum resources (20MHz of 800MHz and 20MHz of 2600MHz bands), and enabling it to expand its 4G coverage and accelerate the rollout of 5G technology. On the other hand, Airtel Tanzania has actively engaged in government tenders through the Universal Communications Service Access Fund (UCSAF). As a result of these efforts, 81% of the total population in Tanzania is covered by Airtel’s 4G network.

4G is the most popular technology to access the internet as it is used by nearly 24 million users. According to TCRA, 4G population coverage reached 92% in June 2025, supported by 13,736 base stations. On the other hand, 5G remains a niche service as coverage reached 26%, provided by 1,038 base stations. 5G is used by 1.3 million mobile subscribers, representing 2.4% of the mobile data user base and 1.4% of total mobile subscribers. 

Speedtest Intelligence data reveals that both operators have a fairly similar level of 4G Availability, but   Vodacom pulls ahead in terms of 5G Availability, with 26.4% compared to 2.8% for Airtel. This contrast in 5G Availability did not translate into a significant lead for Vodacom in network performance, as Vodacom recorded a median download speed of 21.42 Mbps for all technologies compared to Airtel’s 19.58 Mbps.

In contrast, Airtel comfortably leads in 5G with a median download and upload speeds of 130.35 Mbps and 18.7 Mbps, respectively. By comparison, Vodacom achieved a 5G median download speed of 89.09 Mbps and a median upload speed of 12.11 Mbps.

4G/5G Network Availability, Airtel and Vodacom, Tanzania
Source: Speedtest Intelligence® | H1 2025
4G/5G Network Availability, Airtel and Vodacom, Tanzania

All technologies and 5G Performance, Airtel and Vodacom, Tanzania
Source: Speedtest Intelligence® | H1 2025
All technologies and 5G Performance, Airtel and Vodacom, Tanzania

MTN Uganda is the top performer among the surveyed opcos in East Africa

Uganda’s mobile telecom operator market is dominated by MTN and Airtel. According to the Uganda Communications Commission (UCC), there were 44.6 million mobile subscribers as of March 2025, 43.2 million of whom were 90-day active, and 18.4 million were smartphone users. MTN controlled nearly half of the market with 22 million subscribers in 2024 and invested US$110 million in 2024 to improve its network, including nearly 50% expansion of its fiber backhaul network. In addition, it signed an agreement with Airtel Africa to share its infrastructure in Uganda in March 2025. Following this initial agreement, both groups are exploring similar network-sharing opportunities in other markets, including the Republic of the Congo, Rwanda, and Zambia.

According to Speedtest Intelligence data, 5G Availability reached 59.3% for Airtel and 42.8% for MTN in H1 2025, while 4G Availability for both operators attained around 90%. Despite Airtel’s users likely spending more time on 5G, it underperformed MTN on both median download and upload speeds for all technologies in H1 2025. MTN Uganda is the top performer among the surveyed opcos in East Africa in terms of median download speeds, and ranked fifth overall.

While the speed differential between the two operators for 5G is less significant, MTN leads the surveyed group of operators with a median download speed of 235.22 Mbps, ahead of Airtel’s 160.21 Mbps. MTN also has one of the highest upload speeds, at 27 Mbps.

4G/5G Network Availability, Airtel and MTN, Uganda
Source: Speedtest Intelligence® | H1 2025
4G/5G Network Availability, Airtel and MTN, Uganda

All technologies and 5G Performance, Airtel and MTN, Uganda
Source: Speedtest Intelligence® | H1 2025
All technologies and 5G Performance, Airtel and MTN, Uganda

Orange leads in DRC Congo download speeds, but 5G’s absence disadvantages local operators regionally.

The Democratic Republic of Congo (DRC) is the largest country in SSA by land mass. According to the country’s regulator, Autorité de Régulation de la Poste et des Télécommunications du Congo (ARPTC), there were 63.7 million active mobile subscribers and 33.65 million mobile internet users in Q1 2025. Vodacom leads the market with 36.9% of subscribers. It is closely followed by Airtel, which holds the second position with 29.8% of active subscribers, and Orange, in third with 27.2%. While Vodacom leads in the number of subscribers, Airtel commands the largest share of internet revenues, capturing 41.8% of the segment’s total value, equivalent to US$120 million in Q1 2025. This suggests that Airtel’s subscriber base generates a higher ARPU from data services than its competitors.

Vodacom reported that 4G population coverage was only 39.8% in FY 2025 (ending in March 2025). In 2025, it announced a partnership with Orange to build, own, and operate 2,000 solar-powered rural mobile base stations in the country. Airtel also secured a US$70 million loan from the International Finance Corporation (IFC) in March 2025, part of a larger financing arrangement worth US$100 million that includes its operations in Rwanda and DRC. This follows a US$200 million facility approved by the IFC in 2024 to improve mobile connectivity and accelerate the rollout of 4G and 5G.

Data shows that Orange has a slight edge for 4G Availability compared to Airtel and Vodacom, which translates into better median download speeds at 24.22 Mbps in H1 2025. However, Airtel’s customers enjoy better upload speeds than its competitors. When compared to other opcos in the region, the absence of 5G services and relatively limited 4G performance weighed on the ranking of DRC operators, with Airtel and Vodacom trailing at the bottom of the download speed list.

4G Network Availability, Airtel, Orange, and Vodacom, DRC
Source: Speedtest Intelligence® | H1 2025
4G Network Availability, Airtel, Orange, and Vodacom, DRC

All technologies Performance, Airtel, Orange, and Vodacom, DRC
Source: Speedtest Intelligence® | H1 2025
All technologies Performance, Airtel, Orange, and Vodacom, DRC

Botswana is a duopoly and a 5G pioneer in Africa, with Mascom and Orange among the best-performing operators in the region

Botswana is a relatively small mobile market with 4.4 million subscribers as of March 2024, according to the Botswana Telecommunications Regulatory Authority (BOCRA).. According to BOCRA in March 2024, Mascom and Orange split the market roughly equally, with market shares of 43% and 42%, respectively. Botswana has been a 5G pioneer in Africa, with Mascom and Orange launching the service in February and November 2022, respectively. However, there is little recent data on reported 5G coverage – Orange announced population coverage for 5G at launch, while Mascom announced 100 5G sites in 2023.

Based on Speedtest data, Mascom users appear to have much higher 5G Availability than Orange. Mascom also has an edge in terms of median download and upload speeds for All Technologies, at 65.34 Mbps and 18.35 Mbps, respectively. That said, Orange is faring better than expected, with median download and upload speeds of 56.26 Mbps and 13.28 Mbps, respectively. In fact, both operators are among the best-performing ones in our group, only superseded by MTN in South Africa.

Mascom is one of the top-three fastest 5G operators in the list of analyzed operators, with a median download speed of 206.26 Mbps and a median upload speed of 21.45 Mbps. Orange also fared well by regional standards.

4G/5G Network Availability, Mascom and Orange, Botswana
Source: Speedtest Intelligence® | H1 2025
4G/5G Network Availability, Mascom and Orange, Botswana

All technologies and 5G Performance, Mascom and Orange, Botswana
Source: Speedtest Intelligence® | H1 2025
All technologies and 5G Performance, Mascom and Orange, Botswana

MTN South Africa came first for median download speed in the region, while Vodacom secured fourth place among surveyed operators 

South Africa is the continent’s most technologically advanced and competitive telecom market. Despite economic and sociopolitical challenges, the market for data and enterprise services remains attractive. According to the Independent Communications Authority of South Africa (ICASA), it had 116.8 million mobile subscribers as of September 2024, 82.7 million of whom were smartphone users. Vodacom leads the market with a 39.1% share of subscribers, followed by MTN with 30.7% at the end of 2024, according to GSMA Intelligence data. 

MTN and other operators introduced 5G services in Q3 2020  with the initial deployment of 100 5G sites using the emergency spectrum granted by the telecom regulator ICASA. The much-anticipated spectrum auction was finally completed in March 2022, with spectrum bands across 700 MHz, 800 MHz, 2.6 GHz, and 3.5 GHz bands awarded. According to ICASA, the population coverage of 5G reached 46.6% at the end of 2024, up from 20.2% in 2022, while that of 4G exceeded 82%.

Vodacom plans to invest around US$1.1 billion during the 2025/2026 financial year to expand its 5G coverage and extend coverage in rural areas as part of its Vision 2030 strategy to bridge the digital divide. MTN also announced a series of investments across different regions, including US$12 million for the Eastern Cape, US$16 million for Gauteng, and US$23 million for KwaZulu-Natal to deploy new base stations, modernize existing sites, and improve battery backup and security.

According to Speedtest data, Vodacom has slightly higher 4G Availability but lower 5G Availability at 94.8% and 37.8%, respectively. However, the two operators demonstrate contrasting network performance. MTN commands a significant lead over Vodacom in both median download and upload speeds at 74.76 Mbps and 13.65 Mbps, respectively. That said, both operators are in the top four of the list of surveyed operators in SSA.

If we consider 5G performance, Vodacom takes the top spot with median download and upload speeds of 174.9 Mbps and 11.86 Mbps, respectively. MTN is following very closely behind, with corresponding speeds of 164.2 Mbps and 21.68 Mbps, respectively. This is linked to the use of a wider channel bandwidth of 80 MHz in the 2600 MHz spectrum band (compared to MTN’s 40 MHz bandwidth in the same band) and 60 MHz in the 3600 MHz band (compared to MTN’s 40 MHz), and its network strategy to prioritize network densification in urban centres.

4G/5G Network Availability, MTN and Vodacom, South Africa
Source: Speedtest Intelligence® | H1 2025
4G/5G Network Availability, MTN and Vodacom, South Africa

All technologies and 5G Performance, MTN and Vodacom, South Africa
Source: Speedtest Intelligence® | H1 2025
All technologies and 5G Performance, MTN and Vodacom, South Africa

Orange secured the top spot in Côte d’Ivoire and is the top performer among the surveyed opcos in West Africa

According to the local telecom regulator, Autorité de Regulation des Telecommunications de Côte d’Ivoire (ARTCI), there were 58.7 million mobile subscribers in Côte d’Ivoire at the end of 2024. Orange controls the lion’s share of subscribers, with a 51.8% share, while MTN attracted 27.9% of the user base. 

5G rollout was supposed to coincide with the African Football Championship (CAN) in January 2024, covering Abidjan and several major cities. Orange completed network upgrades in preparation for the launch of 5G in Abidjan and continues to expand fiber and mobile coverage in rural areas. We understand that MTN has not yet launched 5G but confirmed its plan to invest over US$300 million in ‘digital infrastructure’ in Côte d’Ivoire over the next three years (2025–2027). According to Speedtest data, the number of 5G tests peaked in January 2024 at the start of the African Football Championship (CAN) but then subsided, suggesting that 5G services were launched on a trial basis. ARTCI has considered using network sharing to expedite 5G deployment, similar to the model adopted in Malaysia, but there have been no updates on this plan so far in 2025.

According to Speedtest data, Orange is ahead of MTN in terms of 4G Availability at 92.7% and performance, with a median download speed advantage for All Technologies at 35.25 Mbps, while upload speeds are similar. As a result, Orange takes the top spot in download speeds among the reviewed opcos in West Africa.

4G Network Availability, Orange and MTN, Côte d’Ivoire
Source: Speedtest Intelligence® | H1 2025
4G Network Availability, Orange and MTN, Côte d’Ivoire

All technologies Performance, Orange and MTN, Côte d’Ivoire
Source: Speedtest Intelligence® | H1 2025
All technologies Performance, Orange and MTN, Côte d’Ivoire

MTN outperformed Airtel in both download and upload speeds in Nigeria, and is the second fastest 5G operator among surveyed opcos

Nigeria is the largest mobile market in Africa by subscribers, with more than 169.3 million mobile customers in July 2025. According to the Nigerian Communications Commission (NCC), MTN and Airtel continued to dominate the market, with 52.7% and 33.4% market share in July 2025, respectively.

Nigeria faces economic challenges, including currency depreciation, high inflation, and a shortage of hard currency. Operational challenges such as fuel shortages, infrastructure vandalism, and regional unrest also impede infrastructure expansion and maintenance. Amidst these hurdles, MTN Group announced in 2023 its ambition to invest US$3.5 billion in Nigeria over the next five years (2023–2028). It also signed an agreement with Airtel to share network infrastructure in Nigeria to realize efficiencies, increase coverage, and improve the quality of service.

MTN was the first operator to launch 5G in Nigeria, followed by Airtel and ISP Mafab Communications in June and January 2023, respectively. According to the NCC, by July 2025, 5G represented only 3.2% of the total 169.3 million active mobile subscribers.

According to Speedtest Intelligence data, MTN’s 5G Availability reached 15.8% in H1 2025, while that of Airtel was 4.6%, according to Ookla’s data. MTN also had a slight lead in 4G Availability, recording 91.2% compared to Airtel’s 89.9%. MTN’s Availability advantage translated into high median download and upload speeds, more than twice the speeds attained by Airtel. 

While MTN’s median download speed for All Technologies is midway between the best and worst-performing operators on our list of opcos, Airtel (Nigeria) is the second-lowest in the group at 17.44 Mbps, only ahead of Vodacom (DRC). Airtel Nigeria’s median upload speed also trails most other surveyed operators.

The 5G performance gap between the two operators is smaller. MTN still leads with a median download speed of 226.59 Mbps compared to Airtel’s 182.6 Mbps in H1 2025. In fact, MTN Nigeria is the fastest 5G operator among the list of surveyed operators in West Africa based on median download speed. 

4G/5G Network Availability, Airtel and Vodacom, Nigeria
Source: Speedtest Intelligence® | H1 2025
4G/5G Network Availability, Airtel and Vodacom, Nigeria

All technologies and 5G Performance, Airtel and Vodacom, Nigeria
Source: Speedtest Intelligence® | H1 2025
All technologies and 5G Performance, Airtel and Vodacom, Nigeria

In conclusion, the telecommunications landscape in SSA is characterized by significant regional disparities and competitive dynamics among major groups. MTN continues to dominate in terms of median download speeds across multiple countries, showcasing its robust infrastructure and investment in network expansion. Vodacom, while leading in subscriber numbers in certain markets, faces challenges in speed performance, particularly in regions lacking 5G services. The ongoing investments by these operators, particularly in 4G and 5G infrastructure, should help them meet the growing demand for digital services, while the quality of connectivity should give them a competitive edge to grow their market shares and monetize their investments.

Despite facing economic headwinds, the potential for growth remains strong, driven by a youthful population and increasing smartphone penetration. As these telecom groups navigate the complexities of their markets, their strategies will be crucial in shaping the future of telecommunications in the region.

We will continue to monitor mobile networks’ performance across Africa, benchmark countries, and operators, and explore how various factors affect it. For more information about Speedtest Intelligence data and insights, please contact us.

Ookla retains ownership of this article including all of the intellectual property rights, data, content graphs and analysis. This article may not be quoted, reproduced, distributed or published for any commercial purpose without prior consent. Members of the press and others using the findings in this article for non-commercial purposes are welcome to publicly share and link to report information with attribution to Ookla.


| July 29, 2024

Nearly 5M reports of Web troubles to Downdetector during CrowdStrike glitch

Airline websites saw fifty times the average number of user reports on July 19, with Delta Airlines and Ryanair (a low-cost airline in Europe), having the largest number of reports in this sector, according to Downdetector.com. 

A routine software update performed by cybersecurity firm CrowdStrike on July 19 caused what some believe to be the largest tech outage in IT history. Microsoft reported that the outage impacted around 8.5 million Microsoft Windows devices causing the devices to display the blue screen of death.

The outage resulted in major airlines being forced to ground their flights, TV news stations going off the air, hospitals canceling medical procedures, and banks being unable to transfer customers’ funds. 

Downdetector by Ookla, which monitors real-time performance for thousands of popular web services globally, had a front row seat to the July 19 outage. Nearly 5 million reports were made to Downdetector.com on the status of different websites, which was more than three times the average number of users that typically visit the Downdetector site every day. 

All major sectors of the economy see spike in outage reports

Downdetector reported surges in outage reports across a variety of sectors, from emergency services, which saw the largest increase over its daily average, at 68x, to airlines, retail, banking, and even dating services.

Not surprisingly, Microsoft bore the brunt of user reported outages. Microsoft witnessed a 42x increase over its daily average, while Microsoft 365, its cloud-based productivity suite, saw user reports increase 18x. Microsoft Azure was also impacted, with user reported outages up 21x.

Beyond software providers, transport, airlines, ride sharing and even e-commerce and delivery services saw large spikes in outage reports. Tesla saw an increase of 12x over its daily average, while user reported outages for Uber were up 57x, and Uber Eats experienced a 41x increase. Amazon witnessed a 14x increase in outage reports, while DHL and Fedex saw 6x and 4x increases respectively.

Verticals Impacted by CrowdStrike IT Outage
Increase in Outage Reports | Downdetector® | July 2024

Airline sites hit with 50% rise in reports 

As was widely reported in the news, the airline industry was significantly impacted by the Crowdstrike-induced outage. OAG, a provider of digital flight information, reported that the world’s 20 largest airlines canceled nearly 10,000 flights between July 19 and July 21.

Delta Airlines was by far the most impacted of the large global airlines, having canceled 5,300 flights since the outage started. The airline is now under federal investigation for how it’s handling the delays and cancellations. 

Not surprisingly, Downdetector’s data on the various airline websites shows that the airline category of websites experienced more than 50 times the average number of user reports on July 19, with Delta Airlines and Ryanair (a low-cost airline covering Europe), leading this sector. In fact, Delta alone experienced a 92x increase in user reports on July 19 compared to its typical daily average and United Airlines saw a 57x increase. Delta was still experiencing more than 6x the average daily number of user reports four days after the outage on July 23. 

Airlines Impacted by CrowdStrike IT Outage
Number of Outage Reports | Downdetector® | July 2024

Digital banks and financial companies also struggled to serve their customers during the outage. Visa received more than 64,000 user reports on July 19 compared to its typical daily average of just 1,500 and online bank TDBank also saw its user reports increase to more than 56,000 on the 19th compared to its typical daily average of 240 reports. 

Although most company websites have rebounded from the Crowdstrike debacle, the outage showcased just how vulnerable today’s websites are to software glitches and updates and how important tools like Downdetector.com are to providing real-time analysis. 

Downdetector.com leverages more than 25 million monthly reports from individual users to make sure you have reliable information about the status of services that are important to you. For more, please read this blog post.

Editor’s Note: This article was updated August 6 from 5 million users to 5 million reports to better reflect how Downdetector tracks the number of outage reports submitted.

Ookla retains ownership of this article including all of the intellectual property rights, data, content graphs and analysis. This article may not be quoted, reproduced, distributed or published for any commercial purpose without prior consent. Members of the press and others using the findings in this article for non-commercial purposes are welcome to publicly share and link to report information with attribution to Ookla.

| January 12, 2024

Bahrain’s 5G Gaming Performance and Investments are Aligned with its Aspirations to Become a Regional Hub

Bahrain took the lead in 5G gaming performance across the Gulf Cooperation Council (GCC) and the Middle East during the first half of 2023, based on Ookla Speedtest Intelligence® data. This article examines the gaming performance on Bahrain’s 5G networks, evaluates their suitability for multi-player on-device and cloud gaming services, and discusses local initiatives to position Bahrain as the regional gaming hub.

Key takeaways

  • Bahrain’s 5G Game Score™ was the highest in the Middle East at 87.64 out of 100 during Q1-Q2 2023. This exceptional network performance helps to deliver a good gaming experience. With ultra-fast 5G speeds (413.69 Mbps) and low latency (72 ms), most casual gamers can expect a top-notch multi-player gaming experience.
  • Bahrain’s pro-gaming policies and initiatives helped to attract international companies and foster a burgeoning local gaming ecosystem. The vibrant start-up landscape, bolstered by supportive business-friendly policies, funding, and access to tech-savvy talent, helped to attract international gaming studios and emerge local ones.
  • Bahrain faces competition from its neighbors to become a regional gaming hub. However, it can leverage its advanced networking infrastructure and reputation as a technology incubator to attract companies and entrepreneurs who want to trial new ideas and technologies for gaming and transform them into ventures that serve the region.

Bahrain leads the Middle East in terms of 5G Game Score and latency

The cellular infrastructure is critical for the growth of mobile gaming. Advanced network systems that offer speed, reliability, and low latency are pivotal to seamless gaming experiences and thus, the gaming industry. The growing popularity of mobile devices and portable gaming also pushes the boundaries of what mobile games can do. 

Recognizing this, Ookla has devised a new metric, Game Score, to measure the gaming experience. This score considers various network parameters that impact gaming, including download and upload speeds, latency, and jitter. Game Score is based on Ookla’s consumer-initiated Speedtest Intelligence results for download and upload speeds, as well as Consumer QoE’s™ latency and jitter measurements taken on actual game servers. 

Each component is scored on a scale of 0-100 and then combined in a weighted average to produce a Game Score. A higher score signifies a better gaming experience for the user. You can find more details about the Game Score methodology here.

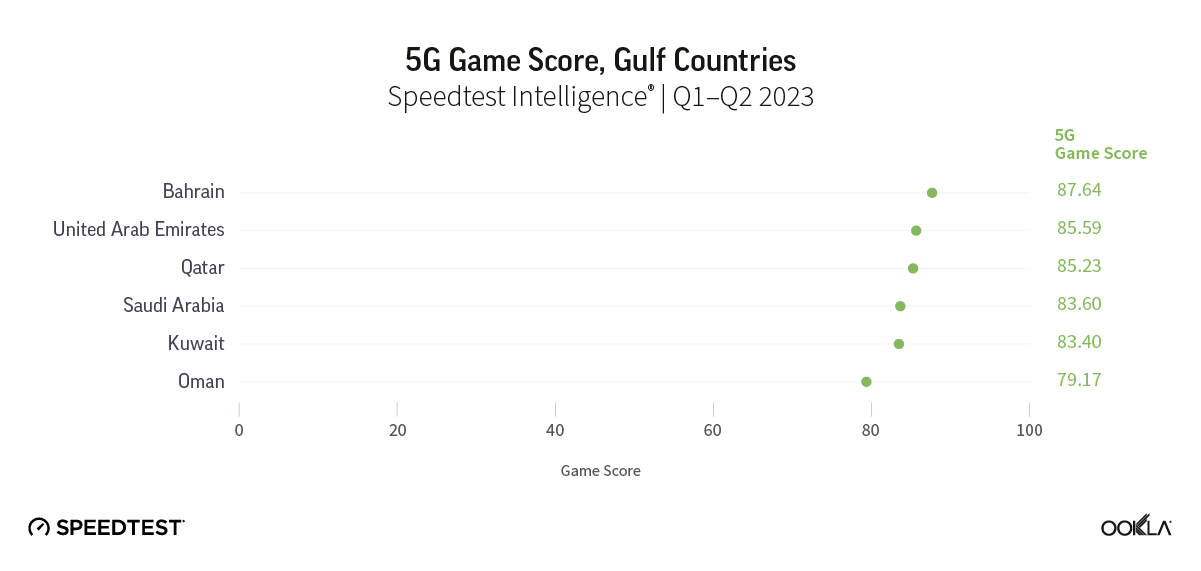
In a recent article, we presented the Game Scores for the six GCC countries. Bahrain led the Middle East region during the first half of 2023 with the highest 5G Game Score at 87.64. The U.A.E. and Qatar trailed closely with scores of 85.59 and 85.23, respectively, reflecting the high-quality mobile network performance in these markets that provides excellent gaming experiences. Saudi Arabia, Kuwait, and Oman received lower Game Scores.

Chart of 5G Game Score, Gulf Countries

Gamers in Bahrain can enjoy a great multi-player gaming experience over 5G

Looking more closely at two main components of the Game Score – download speed and game latency – we can assess how well Bahrain’s 5G network supports multi-player gaming services.

  • Download speed is crucial for ensuring uninterrupted gameplay and maintaining high-quality streaming. High download speeds are also important for downloading digitally distributed games and updates. Download speed requirements for online mobile gaming vary depending on the game type (for example, cloud gaming needs higher bandwidth than a game played on a smartphone) and the gamer profile (for example, competitive gamers will require higher bandwidth than casual players)
  • Game latency is a measure of latency to popular gaming server locations. It impacts the speed at which a gamer’s response is reflected in gameplay and is particularly important for games where quick reactions are crucial. Low latency also means smoother and lag-free gaming.

For this analysis, we consider two types of multi-player games to account for variations in network requirements and user expectations. The table below outlines the minimum requirements for casual gamers (who make up the majority of gamers) for download speed and latency for on-device and cloud games.

List of Network Requirements for Mobile Games

Ookla’s data shows that Bahrain significantly exceeds the speed requirement for both game types, with a median download speed of 413.69 Mbps during Q1-Q2 2023. This implies that gamers should not face delays in downloading games, loading games, or applying patches.

Bahrain has also the lowest latency in the Gulf region at 72 ms and should provide smooth gameplay for most casual games. Yet, some multiplayer shooters, racing, fighting, and multiplayer online battle arena (MOBA) games might experience some lag, particularly if streamed from a cloud server outside the country. There’s room for operators to enhance conditions for multiplayer games, especially for competitive gamers.

It should be noted that the gaming experience can be affected by other factors besides 5G network quality. The location of the game server, for example, can influence latency. If the game server is outside the country or region then the quality of international connectivity matters more. Since Bahrain has a small land mass and a high population density, game servers, and international gateways are likely to be close to gamers. This partially explains why its game-related metrics are better than those of other countries in the region.

Chart of Median Download Speed and Latency in Bahrain vs. Minimum Requirements for Games

Bahrain made the digital sector, including gaming, central to its economic expansion. The government and various regulatory authorities have fostered a favorable business environment to attract investments from global technology companies. Operators have also supported the country’s ambition to become the regional ICT hub by developing advanced digital infrastructure and nurturing local talent.

Following the COVID-19 pandemic, Bahrain prioritized ICT as a key sector for economic growth and diversification, setting targets to achieve 100% broadband coverage and increase the number of start-ups by 20% by the end of 2026. According to the Telecommunications Regulatory Authority (TRA), mobile broadband penetration of the population reached 146.0%, and fixed broadband penetration of households reached 69% in Q3 2023. 

Bahrain was among the first countries in the Middle East to launch 5G in 2019. The three mobile operators, Batelco, stc, and Zain, have invested in its expansion, achieving 100% 5G commercial network coverage. Operators are also upgrading their 5G infrastructure to improve throughput and reduce latency by deploying 5G Standalone (SA) and 5G Advanced (5.5G). For example, stc tested 5G SA in May 2022 and 5G network slicing in October 2023. Batelco deployed a cloud-native 5G core and tested 5G SA in April 2022. Zain trialed 5G SA in 2022 and implemented 5G carrier aggregation using a mid-band frequency.

Furthermore, Batelco’s parent company, Beyon, announced an investment of over $250 million to support the country’s digital transformation. This includes the development of the country’s biggest data center. In 2022, stc announced that it plans the region’s largest technology park, which includes a new data center. These new facilities will supplement existing data centers and strengthen the country’s position as a regional digital infrastructure center.

The country’s extensive and high-quality network infrastructure underpinned its ‘Cloud First Policy’ which encouraged public and private organizations to migrate to the cloud. This strategy has proven successful in attracting major hyperscalers like AWS which established three ‘regional availability zones’ in 2019 in Bahrain.

Pro-graming policies and initiatives helped attract international companies and develop a local gaming ecosystem

This influx of international cloud service providers has caught the attention of game publishers eager to cater to their fans in the region. Take Epic Games, the publisher of Fortnite, as an example. They set up a local server over AWS infrastructure to boost game response times and stimulate interest in e-sports. They expected latency to improve between 20% and 50% for players in the Gulf region and India. Similarly, Riot Games set up a local server in Bahrain for its game Valorant.

Bahrain has a vibrant start-up landscape in the Middle East region bolstered by supportive government policies, funding schemes, and a pool of young, tech-savvy talent. As part of the Bahrain Economic Vision 2030, the government established Tamkeen, an agency designed to promote private sector development and digital services adoption. Tamkeen has been involved in initiatives such as setting up a training program for video game development and the creation of the ‘D11 Gaming Hub’, designed to strengthen the e-sports ecosystem in Bahrain.

Thanks to these efforts, Bahrain attracted foreign gaming studios, like The Stories Studio, to establish a local office. It has also nurtured a burgeoning local game production industry, with award-winning gaming studios, such as Juego Studios and Regnum Studio, and a host of start-ups offering a range of products, solutions, and services for the gaming industry. Bahrain also aspires to be a leading e-sports competition destination in the Middle East, having already hosted global events like the BLAST Pro Series Global Final, NVTC Tournament, and GIRLGAMER Festival.

Operators have also taken proactive steps to capitalize on the growing demand for gaming in recognition of its potential to diversify revenue, increase customer engagement, and differentiate their services. For example:

  • Batelco introduced a mobile gaming portal in 2022.
  • stc launched the ‘stc play’ app, hosted multiple e-sport tournaments, and bundled gaming packages with its mobile data and home services.
  • Zain introduced a mobile game pass with a dedicated data allowance for popular games. It also partnered with the Bahraini Esports Federation and gaming platform provider Playhera to organize e-sports tournaments. Most recently, it launched the ‘Zain Esports Lab’ in collaboration with Tamkeen to host e-sports leagues, provide training to gamers, and offer professional opportunities for e-sports enthusiasts.

Bahrain harbors grand ambitions to strengthen its standing as a regional gaming hub

As part of the Telecommunications, ICT, and Digital Economy Sector Strategy 2022-2026, the Bahraini government aims to consolidate its reputation as a regional innovation center while continuing to lure large technology companies. Part of this strategy revolves around making the country an even more attractive destination for gaming companies to cater to the rapidly expanding base of casual gamers, e-sports enthusiasts, and professional players across the Middle East.

In November 2023, the TRA also unveiled the Sixth National Telecommunication Plan (NTP6). The plan outlines the government’s strategic three-year approach and general policies for the telecommunications sector. Bahrain’s objective is to continue to lead the way in ICT and telecommunications infrastructure development within the GCC region and aspire to be among the global top 10 in this sector.

BCG reported that the Middle East boasts the highest gaming penetration in the world, with over 60% of the population identifying as gaming enthusiasts. The audience for live-streaming games is projected to surpass 200 million in 2025, making the Middle East one of the fastest-growing regions for gaming, outpacing even China.

The GCC region is particularly ripe for growth in terms of active gamers and e-sports participants, thanks to its youthful demographic, substantial disposable income, access to affordable high-speed connectivity, and the ongoing development of gaming infrastructure. The market is bound to expand as gaming becomes more mainstream and as more female users and older demographics engage in gaming.

Statista predicts that the gaming industry in Bahrain (including in-game ads and live streaming) will generate over $38 million in 2023 and grow to over $53 million by 2027. Mobile games constitute the largest segment, with a market value nearing $12 million in 2023, expected to grow to more than $18 million by 2027. This is driven by the increasing number of players, expected to reach nearly 400,000 users by 2027. 

These figures show that the domestic gaming market in Bahrain is relatively small because of the limited population. That is why the opportunity lies in serving the larger and growing gaming audience in the Middle East and fostering a local gaming ecosystem that can scale up to serve the region.

However, Bahrain faces stiff competition from its neighbors seeking to diversify their economies through digital services. For example, Saudi Arabia invested in major gaming studios such as Capcom and Activision Blizzard via the Public Investment Fund (PIF), its sovereign fund, and has a national gaming and e-sports strategy. U.A.E. encourages global gaming producers to establish a local presence and hosts major game tournaments and events.

Bahrain should leverage its unique advantages, such as its advanced connectivity infrastructure, skilled workforce, and favorable business environment. Its track record as a technology incubator can also position it as an ideal place to test new ideas, technologies, monetization models, and regulations to support innovative gaming services.

Ookla retains ownership of this article including all of the intellectual property rights, data, content graphs and analysis. This article may not be quoted, reproduced, distributed or published for any commercial purpose without prior consent. Members of the press and others using the findings in this article for non-commercial purposes are welcome to publicly share and link to report information with attribution to Ookla.

| December 18, 2024

Canada’s Narrowing Broadband Divide | Le Rétrécissement de la Fracture Numérique au Canada

French/Français

More than 80% of Canadians have access to fixed broadband networks, but for rural Canadians that figure drops to just 60%. Yet, this gap between who has broadband access and who doesn’t is closing in rural areas at a rate nearly three times faster than in urban areas. Canada is narrowing its rural broadband divide thanks to a clearly articulated and well-funded connectivity strategy to ensure high-speed internet access for all.

Using Speedtest Intelligence® data, this report identifies Canada’s Provinces and Territories that are delivering the minimum standard for fixed broadband speeds, as established by the Canadian Radio-television and Telecommunications Commission (CRTC). Based on data from the 1H 2024 (and compared to 1H 2023), it also analyzes performance in other geographic splits, including Urban-vs-Rural and the Remoteness Index

Key Takeaways

  • As many as 2 million more Canadians enjoyed broadband speeds in the first half of  2024 compared to the first half of 2023.
  • Rural Canadian Speedtest users saw a 23% increase in those with broadband speeds in 1H 2024 over 1H 2023.
  • Satellite internet service plays a key role in closing the broadband divide for Canada’s vast geography. In the U.S., regulators were ambivalent about allowing satellite internet to qualify for government broadband funding (this attitude has recently begun to change in favor). Canada knew many years ago that satellite internet was critical.

Broadband in the Spotlight

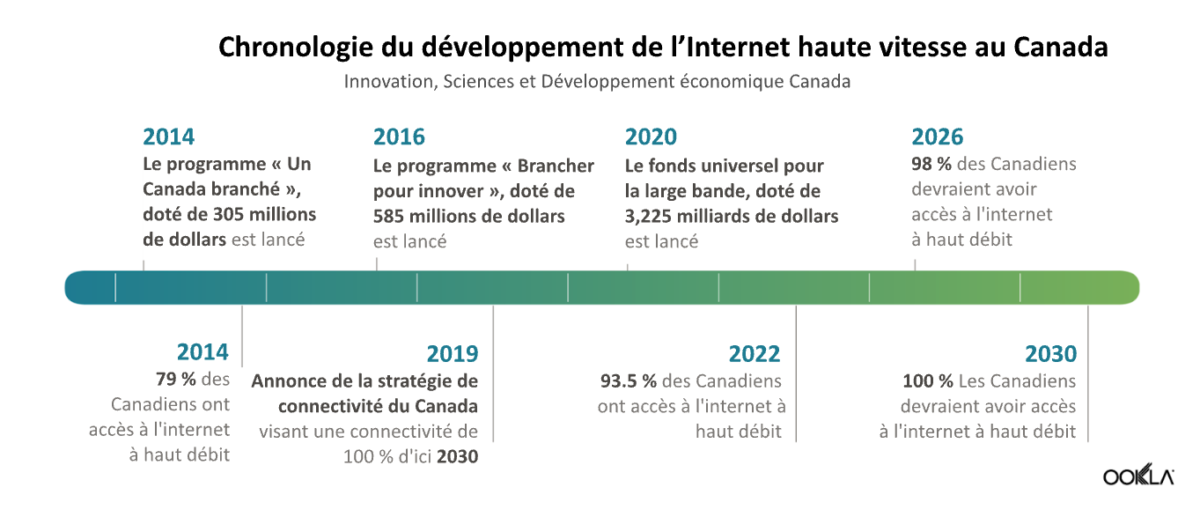
While the COVID-19 pandemic shined a light on the digital divide, the government of Canada has long been investing in broadband deployments to close the gap. In 2014 it established the Connecting Canadians program (CCP), allocating C$305M to improve connectivity for 300,000 underserved households. 

The Connect to Innovate (CTI) program was launched in December 2016 with C$500M (and C$85M added to CTI in 2019) to expand high-speed Internet in communities underserved by the private sector. The CTI aimed to improve access for over 380,000 homes. 

Deepening its investments in 2020, perhaps in response to COVID-19 lockdowns, the Canadian government launched the C$3.225B Universal Broadband Fund (UBF). 

UBFUniversal Broadband Fund (2020)  $3.225B
CTIConnect To Innovate (2016)    $585M
CCPConnecting Canadians Program (2014)    $305M

With over C$4B from these programs alone, the CRTC has a goal of connecting 98% of Canadians to high-speed internet (broadband) delivering at least 50 Mbps download (DL) and 10 Mbps upload (UL) speeds (50/10 Mbps) by 2026, and 100% by 2030.

Conquer Divide

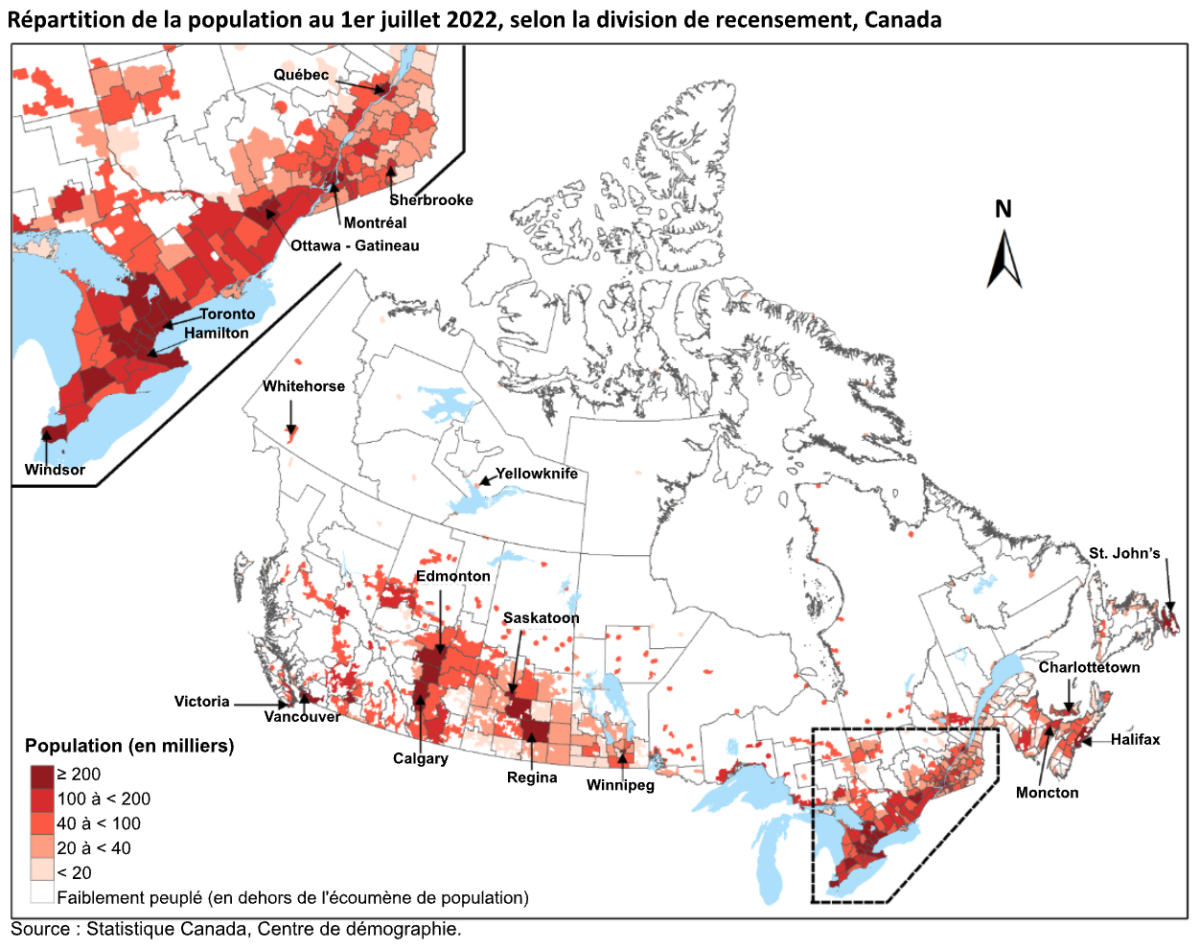
Canada’s population of 41 million is concentrated in a handful of large, urban metropolitan areas near the U.S. border. However, despite the country’s large land mass, it is highly urbanized. Approximately two-thirds, or 27 million, of Canadians live within 100 kilometers of the U.S. border —about the distance  from the border to Winnipeg —yet this is only 4% of Canada’s land mass. 

Imagine a line across lower Canada, 100 km north of Canada’s southern border – crossing Winnipeg in the middle of the population distribution map. In the area below the line and above the border with the U.S., 82.2% of Speedtest users are getting the CRTC’s minimum standard for fixed broadband speeds (50/10 Mbps). For Speedtest users north of the 100 km line, 76.3% met (or exceeded) the standard. Just a 5.9 percentage points gap.

However, the 100 km line is rather blunt and unsophisticated (and imaginary). Instead let’s look at the Urban-vs-Rural division as well as a more-granular designation based on the Remoteness Index. 

1H 2024% Meeting 50/10 Mbps 1H 2024Change from 1H 2023Median DL Speed MbpsMedian UL Speed MbpsLatency* ms
Urban83.8  5%251.6264.8220
Rural60.023%  90.7618.8837

Source: Ookla Speedtest data, 1H 2024 and 1H 2023; *multi-server latency

Compared with the 100 km line’s gap, the Urban-vs-Rural digital divide aligns more closely with expectations of a larger disparity between these geographic areas. Specifically, 83.8% of Urban users meet the 50/10 Mbps standard, compared to 60.0% of Rural users resulting in a 23.8 percentage point gap. 

The good news is the gap has closed from the prior year with Rural users seeing a 23% improvement compared to 5% for Urban users. To emphasize this further, in the first half of 2023 fewer than 50% of Rural users were able to get broadband speeds of 50/10 Mbps. This indicates that efforts to address this gap (i.e., UBF) were targeting the right places. 

Continuing across the table, median download and upload speeds are roughly three times faster among urban than rural Speedtest users (DL 251.62 Mbps vs 90.76 Mbps and UL 64.82 Mbps vs 18.88 Mbps, respectively). Comparing the rural median speeds to the 50/10 Mbps threshold shows that half of Speedtest users in rural Canada enjoy download speeds that are 40.76 Mbps (i.e., 90.76 minus 50) and upload speeds that are 8.88 Mbps (i.e., 18.88 minus 10) faster than the target. (This is not to say that an individual Speedtest user experiences both upload and download speeds over the threshold, which is required for the target.)

The difference in Urban and Rural latency literally demonstrates the difference in physical distances (which not only means farther, but also more hops or switching; even buffering time based on the capacity of the data transport) .

1H 2024% Meeting 50/10 Mbps 1H 2024Change from 1H 2023Median DL Speed MbpsMedian UL Speed MbpsLatency*ms
Least Remote83.8  5%256.1558.2518
Less Remote73.813%160.6355.6927
Moderately Remote68.016%125.4626.4341
More Remote62.219%  99.4119.5951
Most Remote55.820%  76.5316.4168

Source: Ookla Speedtest data, 1H 2024 and 1H 2023; *multi-server latency

The Remoteness Index presents a similar picture in finer geographic slices. (As one would expect, since the underlying data is the same.) Not surprisingly, the percentage of Speedtest users that meet the 50/10 Mbps threshold decreases as their location moves from least remote to most remote. Here too, speed and latency degrade at each step of remoteness, correlating with those meeting the 50/10 Mbps threshold percentages. 

The percentage change from the prior year tells a similar story of greater improvement in the more remote geographies, but with some nuance. While we might expect Most Remote to demonstrate even more improvement and be greater than More Remote, deployment challenges and associated costs to deliver telecommunications infrastructure in the most remote geographies can be exponentially prohibitive. Thus, this extreme lack of population density coupled with difficult topography explain why government programs like CTI are needed, and why other solutions like satellite are viable.

The Provinces and The Territories

In the above analysis, broadband speeds were assessed using an imaginary 100 km demarcation, illustrating the concentration of population along Canada’s southern border. Before examining broadband performance and the digital divide among Canada’s provinces and territories, here are additional facts about Canada’s relative sparseness of people in its vast geography. 

  • Landmass: The combined land area of the territories (Yukon, Northwest, Nunavut) is larger than the land area of India, the world’s 7th largest (and most populous) country
  • Population: The population of the territories is equivalent to the total number of births across Canada every four months.

The territories hold just 0.3% of Canada’s population on 39% of its land. Canada is often compared to the U.S., but Australia is a better comparison, with both Canada and Australia ranking among the least densely populated countries in the world.

Now let’s examine the 50/10 Mbps threshold in the provinces and territories.

Province / Territory% Meeting 50/10 Mbps 1H 2024Change from 1H 2023Urban-Rural Gap 1H 2024, %pts
Newfoundland and Labrador81.7    6%22.5
British Columbia79.8    4%21.9
New Brunswick78.1    2%14.0
Nova Scotia77.8    9%  8.2
Québec76.5    8%  9.8
Ontario76.0    8%33.9
Alberta75.7    5%30.0
Manitoba71.7  11%20.8
Prince Edward Island71.2  14%18.5
Saskatchewan64.7  17%33.0
Northwest Territories57.3    8%-7.1
Yukon Territory53.2  14%  6.7
Nunavut36.2  94%Not meaningful

In this table, by geography, percentage of Speedtest users achieving the CRTC broadband speed targets in 1H 2024, compared with the same period in prior year, and the digital divide.

Following the logic of the Remoteness Index, the territories have the fewest Speedtest users meeting the 50/10 Mbps threshold. The percentage changes in the territories from 2023 do not follow the same pattern seen in the Urban-vs-Rural chart and Remoteness Index because these geographies are a mix of these geographic definitions (as it is in the provinces). Similarly, the Urban-vs-Rural gap result is confounded by sparse population. In Nunavut, more than half of the population is defined as rural.

On the top of the table, Newfoundland and Labrador, New Brunswick, and Nova Scotia may be unexpected leaders in meeting the 50/10 Mbps threshold. New Brunswick and Nova Scotia have relatively higher population density among the provinces and territories which (economically) encourages the deployment of telecommunications infrastructure. This appears to play out in the Urban-vs-Rural gap as well, ranking among the lowest gaps in the provinces.

The exceptional performance of Newfoundland and Labrador (81.7% meeting 50/10 Mbps) can partly be attributed to the vast majority of its population residing on the island of Newfoundland, and half of them, in turn, residing on the Avalon peninsula (see the population distribution map above and St. John’s in the east). This concentration of population underscores the fundamental reality of economics in telecommunications deployment. And in the opposite direction, the Urban-vs-Rural gap (22.5%pts) also makes this same point for the need for the funding programs like UBF to address the digital divide.

Breaking Down the Digital Divide
Percentage of Urban and Rural Speedtest users in each Province/Territory with broadband speeds of at least 50/10 Mbps, 1H 2024, Nunavut: Urban n too small; Rural 43.6%

Look, Up in the Sky

As addressed in the discussion about Most Remote, because of Canada’s topographical challenges, fiber and electricity are cost prohibitive in many deployment cases. In 2019, Canada added C$85M to its CTI program because it recognized that it needed support for low-Earth orbit (LEO) satellites to reach its connectivity goals (50/10 Mbps connectivity to 95% of Canadians by 2026, and the hardest-to-reach Canadians by 2030). 

Briefly looking across Canada for Speedtest users of satellite internet services during the first half of  2024, over half saw download speeds of 72.90 Mbps or greater, and upload speeds of 12.47 or greater. Moreover, in the territory of Nunavut the speeds were basically identical (75.16 Mbps and 12.50 Mbps, respectively), which makes sense since Nunavut is equally Urban or Rural (or More Remote or Less Remote) to an orbiting satellite a few hundred miles overhead. Clearly LEO is a viable solution technically and economically.

Whether fiber or satellite, broadband connectivity means nothing without power. The cost of electricity in the north can be ten times more expensive than in southern cities. In some cases, diesel fuel burned for both heat and electricity is flown, shipped by sea, or by tanker over frozen lakes and rivers in the winter. As with broadband, the Canadian government has a plan to invest in Rural and Northern Communities to make available affordable and clean energy.

Another barrier to fully-connected communities that affects Urban as well as the Most Remote is digital literacy (though the latter faces compounding factors). Here again the Canadian government is addressing the issue with initiatives such as its Digital Literacy Exchange Program.

No matter the geographic lens – Urban-vs-Rural, Remoteness Index, or Provinces and Territories – the goal is to get to 100% in 2030. But even 100% broadband connectivity from a purely technical perspective, would not be 100% in spirit without other programs and initiatives like these. Communication is achieved when the signal is received, not just sent.

Recently, Ookla also looked at the broadband and digital divide in the U.S. – How the 50 U.S. States Stack up in Broadband Speed Performance: 1H 2024 | Ookla®. We look forward to providing more updates on the U.S. and Canada’s progress to provide high-speed internet connectivity for all. For more information about Speedtest Intelligence data and insights, please get in touch.


Le Rétrécissement de la Fracture Numérique au Canada

Plus de 80 % des Canadiens ont accès à des réseaux fixes à large bande, mais pour les Canadiens des régions rurales, ce chiffre tombe à seulement 60 %. Pourtant, cet écart entre ceux qui ont accès à la large bande et ceux qui n’en ont pas se rétrécit dans les régions rurales à un rythme près de trois fois plus rapide que dans les zones urbaines. Le Canada réduit la fracture numérique dans les régions rurales grâce à une stratégie de connectivité clairement articulée et bien financée pour assurer l’accès à l’Internet haute vitesse pour tous.

À l’aide des données de Speedtest Intelligence®, le présent rapport identifie les provinces et les territoires du Canada qui fournissent la norme minimale pour les vitesses à large bande fixes, telle qu’établie par le Conseil de la Radiodiffusion et des Télécommunications Canadiennes (CRTC). Sur la base des données du 1er semestre 2024 (et par rapport au 1er semestre 2023), il analyse également les performances dans d’autres catégories géographiques, y compris les catégories urbaine et rurale ainsi que l’indice d’éloignement (Remoteness Index).

Principaux points à retenir

  • Pas moins de 2 millions de Canadiens supplémentaires ont bénéficié de l’accès à Internet haute vitesse au premier semestre 2024 par rapport au premier semestre 2023.
  • Les utilisateurs ruraux canadiens de Speedtest ont vu une augmentation de 23 % de ceux qui ont accès à Internet haute vitesse au cours du premier semestre 2024 par rapport au premier semestre 2023.
  • Le service Internet par satellite constitue un levier essentiel pour réduire la fracture numérique et améliorer l’accès à la large bande sur l’immense territoire canadien. Aux États-Unis, les organismes de réglementation étaient ambivalents quant à autoriser le financement par le gouvernement de l’Internet par satellite (cette attitude a récemment commencé à changer). Le Canada savait il y a de nombreuses années que l’Internet par satellite était essentiel.

La large bande sous les feux de la rampe

Alors que la pandémie de COVID-19 a mise en lumière la fracture numérique, le gouvernement du Canada investit depuis longtemps dans le déploiement de la large bande pour réduire cet écart. En 2014, il a mis sur pied le programme Un Canada branché, allouant 305 millions de dollars canadiens pour améliorer la connectivité de 300 000 ménages mal desservis.

Le programme Brancher pour innover a été lancé en décembre 2016 avec 500 millions de dollars canadiens (85 millions de dollars canadiens supplémentaires alloués en 2019) pour étendre l’accès a l’Internet à haut débit dans les communautés mal desservies par le secteur privé. Ce programme visait à améliorer l’accès à plus de 380 000 foyers.

Renforçant ses investissements en 2020, peut-être en réponse aux confinement lié au
COVID-19, le gouvernement canadien a lancé le Fonds universel pour la large bande,
doté de 3,225 milliards de dollars canadiens.

UBFFonds universel pour la large bande (2020)3,225 milliards de dollars
CTIBrancher pour innover (2016)585 M$
CCPProgramme « Un Canada branché » (2014)305 M$

Avec plus de 4 milliards de dollars canadiens provenant de ces programmes uniquement, le CRTC a pour objectif de connecter 98 % des Canadiens à l’Internet haute vitesse (large bande) offrant des vitesses d’au moins 50 Mbps en téléchargement (DL) et 10 Mbps en téléversement (UL) (50/10 Mbps) d’ici 2026, et 100 % d’ici 2030.

Vaincre la fracture

La population de 41 millions d’habitants du Canada est concentrée dans une poignée de métropoles près de la frontière américaine. Malgré l’immensité du pays, le Canada est fortement urbanisé. Environ les deux tiers, soit 27 millions, des Canadiens vivent à moins de 100 kilomètres de la frontière américaine, soit environ la distance entre la frontière et Winnipeg; mais cette zone ne représente que 4 % de la superficie du Canada.

Imaginez une ligne traversant le Canada, à 100 km au nord de sa frontière méridionale, et traversant Winnipeg au milieu de la carte de répartition de la population. Dans la zone située sous la ligne de démarcation et au-dessus de la frontière avec les États-Unis, 82,2 % des utilisateurs de Speedtest obtiennent la norme minimale du CRTC pour les vitesses des services à large bande fixe (50/10 Mbps). Pour les utilisateurs du Speedtest au nord de la ligne des 100 km, 76,3 % respectent (ou dépassent) la norme. Soit un écart de seulement 5,9 points.

Cependant, la ligne des 100 km reste une mesure assez simpliste, peu sophistiquée et, de surcroît, imaginaire. Examinons plutôt la division entre les zones urbaines et rurales, ainsi qu’une classification plus détaillée basée sur l’indice d’éloignement.

1H 2024% Répondant à l’objectif de 50/10 Mbps1H 2024Variation à partir du 1er semestre 2023Vitesse DL médiane MbpsVitesse médiane de téléversement (Mbps)Latence*ms
Urbain83,85 %251,6264,8220
Zones rurales60,023 %90,7618,8837

Source : Données Ookla Speedtest, 1H 2024 et 1H 2023 ; *latence multi-serveurs

Comparée à celle définie par la ligne des 100 km, la fracture numérique entre les zones urbaines et rurales correspond davantage aux attentes, reflétant une disparité plus marquée entre ces zones géographiques. Plus précisément, 83,8 % des utilisateurs urbains respectent la norme de 50/10 Mbps, comparativement à 60,0 % des utilisateurs ruraux, ce qui donne un écart de 23,8 points.

La bonne nouvelle est que l’écart s’est réduit par rapport à l’année précédente, les utilisateurs ruraux ayant constaté une amélioration de 23 %, contre 5 % pour les utilisateurs urbains. Pour souligner davantage ce point, au cours du premier semestre de 2023, moins de 50 % des utilisateurs ruraux ont pu obtenir des vitesses à large bande de 50/10 Mbps. Cela indique que les efforts déployés pour combler cette lacune (c’est-à-dire le Fonds universel pour la large bande) ont été utilisés à bonne fin.

Si l’on poursuit la lecture du tableau, les vitesses médianes de téléchargement et de téléversement sont environ trois fois plus élevées chez les utilisateurs urbains que chez les utilisateurs ruraux de Speedtest (DL 251,62 Mbps contre 90,76 Mbps et UL 64,82 Mbps contre 18,88 Mbps, respectivement). La comparaison des vitesses médianes en milieu rural avec le seuil de 50/10 Mbps montre que la moitié des utilisateurs de Speedtest dans les régions rurales du Canada bénéficient de vitesses de téléchargement de 40,76 Mbps (c.-à-d. 90,76 moins 50) et de vitesses de téléversement de 8,88 Mbps (c.-à-d. 18,88 moins 10) plus rapides que l’objectif fixé. (Cela ne signifie pas pour autant qu’un utilisateur individuel de Speedtest bénéficie à la fois de vitesses de téléchargement et de téléversement dépassant le seuil requis, ce qui est nécessaire pour atteindre l’objectif.)

La différence entre les temps de latence en milieu urbain et en milieu rural illustre littéralement la différence entre les distances physiques (ce qui signifie non seulement des distances plus grandes, mais aussi un plus grand nombre de sauts de traffic).

1H 2024% Répondant à l’objectif de 50/10 Mbps1H 2024Variation à partir du 1er semestre 2023Vitesse DL Médiane MbpsVitesse médiane de téléversement (Mbps)Latence*ms
Le moins éloigné83,85 %256,1558,2518
Moins éloigné73,813 %160,6355,6927
Moyennement éloigné68,016 %125,4626,4341
Plus éloigné62,219 %99,4119,5951
Le plus éloigné55,820 %76,5316,4168

Source : Données Ookla Speedtest, 1H 2024 et 1H 2023 ; *latence multi-serveurs

L’indice d’éloignement présente une image similaire dans des tranches géographiques plus fines. (Comme on pouvait s’y attendre, puisque les données sous-jacentes sont les mêmes.) Il n’est pas surprenant de constater que le pourcentage d’utilisateurs Speedtest qui atteignent le seuil de 50/10 Mbps diminue au fur et à mesure que cette indice augmente. Ici aussi, la vitesse et la latence se dégradent avec l’augmentation de l’indice, en corrélation avec le pourcentage d’utilisateurs atteignant de seuil de 50/10 Mbps.

La variation (en pourcentage) par rapport à l’année précédente offre des similarités, avec une amélioration dans les zones géographiques les plus éloignées, mais avec tout en apportant une certaine nuance. On pourrait s’attendre à ce que les régions les plus éloignées s’améliorent, mais les difficultés de déploiement et les coûts associés à la mise en place d’une infrastructure de télécommunications dans les zones géographiques les plus reculées peuvent être exponentiellement prohibitifs. Ainsi, ce manque extrême de densité de population, associé à une topographie difficile, explique pourquoi des programmes gouvernementaux sont nécessaires et pourquoi d’autres solutions comme l’accès par satellite sont viables.

Les provinces et les territoires

Dans l’analyse ci-dessus, les vitesses à large bande ont été évaluées à l’aide d’une démarcation imaginaire de 100 km, illustrant la concentration de la population le long de la frontière sud du Canada. Avant d’examiner les performances de la large bande et la fracture numérique parmi les provinces et territoires du Canada, voici quelques faits supplémentaires concernant la relative faiblesse de la densité de population dans l’immensité géographique du pays.

  • Masse continentale : La superficie terrestre combinée des territoires (Yukon, Nord-Ouest, Nunavut) est plus grande que la superficie de l’Inde, le 7e pays le plus grand (et le plus peuplé) du monde
  • Population : La population des territoires équivaut au nombre total de naissances au Canada tous les quatre mois.

Les territoires ne représentent que 0,3 % de la population du Canada mais 39 % de son territoire. Le Canada est souvent comparé aux États-Unis, mais l’Australie est une meilleure comparaison; le Canada et l’Australie se classant parmi les pays les moins densément peuplés du monde.

Examinons maintenant le seuil de 50/10 Mbps dans les provinces et les territoires.

Province / Territoire% Atteignant l’objectif 50/10 Mbps 1H 2024Changement par rapport à 1H 2023Écart entre les zones urbaines et rurales 1H 2024, %pts
Terre-Neuve-et-Labrador81,76 %22,5
Colombie-Britannique79,84 %21,9
Nouveau-Brunswick78,12 %14,0
Nouvelle-Écosse77,89 %8,2
Québec76,58 %9,8
Ontario76,08 %33,9
Alberta75,75 %30,0
Manitoba71,711 %20,8
Île-du-Prince-Édouard71,214 %18,5
Saskatchewan64,717 %33,0
Territoires du Nord-Ouest57,38 %-7,1
Territoire du Yukon53,214 %6,7
Nunavut36,294 %Pas significatif

Pourcentage d’utilisateurs de Speedtest atteignant les objectifs de vitesse de large bande du CRTC au premier semestre 2024 par région par rapport à la même période de l’année précédente.

Suivant la logique de l’indice d’éloignement, les territoires ont le moins d’utilisateurs Speedtest répondant au seuil de 50/10 Mbps. Les variations en pourcentage dans les territoires à partir de 2023 ne suivent pas la même tendance que celle observée dans le graphique urbain/rural et l’indice d’éloignement, car ces géographies sont un mélange de ces définitions géographiques (comme c’est le cas dans les provinces). De même, le résultat de l’écart entre les zones urbaines et les zones rurales est faussé par la faible densité de population. Au Nunavut, plus de la moitié de la population est définie comme rurale.

En haut du tableau, Terre-Neuve-et-Labrador, le Nouveau-Brunswick et la Nouvelle-Écosse pourraient être des chefs de file inattendus dans la réalisation du seuil de 50/10 Mbps. Le Nouveau-Brunswick et la Nouvelle-Écosse ont une densité de population relativement plus élevée parmi les provinces et les territoires, ce qui encourage (économiquement) le déploiement de l’infrastructure de télécommunications. Cela semble également se jouer dans l’écart entre les régions urbaines et rurales, qui se classe parmi les écarts les plus faibles dans les provinces.

La performance exceptionnelle de Terre-Neuve-et-Labrador (81,7 % atteignant 50/10 Mbps) peut en partie être attribuée au fait que la grande majorité de sa population réside sur l’île du Terre Neuve, dont la moitié vit sur la péninsule d’Avalon (voir la carte de répartition de la population ci-dessus et la ville de St. John’s à l’est). Cette concentration de population souligne la réalité fondamentale de l’économie dans le déploiement des télécommunications. Et dans la direction opposée, l’écart entre les zones urbaines et rurales (22,5 % de points) souligne également la nécessité de programmes de financement pour combler la fracture numérique.

Briser la fracture numérique
Pourcentage d’utilisateurs de Speedtest fixe en milieu urbain et rural dans chaque province et territoire ayant accès à des vitesses à large bande de 50/10 Mbps, 1H 2024, Nunavut: Urbain n trop petit; Rural 43.6%

Regardez vers les étoiles

Comme mentionné précédemment, en raison des défis topographiques du Canada, la fibre et l’électricité peuvent avoir des coûts de déploiement prohibitifs dans de nombreux cas. En 2019, le Canada a ajouté 85 millions de dollars canadiens à son programme Brancher pour innover (CTI), car il a reconnu qu’il avait besoin de satellites en orbite basse (LEO) pour atteindre ses objectifs en matière de connectivité (connectivité de 50/10 Mbps pour 95 % des Canadiens d’ici 2026, et pour les Canadiens les plus difficiles à atteindre d’ici 2030).

En examinant brièvement les utilisateurs de Speedtest des services Internet par satellite à travers le Canada durant la première moitié de 2024, plus de la moitié ont enregistré des vitesses de téléchargement de 72,90 Mbps ou supérieures, ainsi que des vitesses de téléversement de 12,47 Mbps ou supérieures. De plus, dans le territoire du Nunavut, les vitesses étaient pratiquement identiques (75,16 Mbps et 12,50 Mbps, respectivement), ce qui est logique, puisque le Nunavut est à la fois urbain et rural (ou plus éloigné et moins éloigné) pour un satellite en orbite à quelques centaines de kilomètres au-dessus. Il est clair que le LEO est une solution viable techniquement et économiquement.

Qu’il s’agisse de fibre ou de satellite, la connectivité à large bande ne signifie rien sans électricité. Le coût de l’électricité dans le nord peut être dix fois plus élevé que dans les villes du sud. Dans certains cas, le carburant diesel utilisé pour le chauffage et l’électricité est transporté par avion, par bateau ou par camion-citerne sur des lacs et des rivières gelés en hiver. Comme pour la large bande, le gouvernement canadien a un plan pour investir dans
les collectivités rurales et nordiques afin de rendre disponible une énergie propre et abordable.

Un autre obstacle à des communautés pleinement connectées, qui touche tant les zones urbaines que les régions les plus éloignées, est la maîtrise des outils numériques (bien que ces dernières fassent face à des facteurs aggravants). Là encore, le gouvernement canadien s’attaque au problème avec des initiatives comme son Programme d’échange en matière de littératie numérique.

Peu importe la perspective géographique – urbain par rapport à rural, indice d’éloignement ou provinces et territoires – l’objectif est d’atteindre 100 % en 2030. Mais même une connectivité à large bande à 100 %, d’un point de vue purement technique, ne serait pas à 100 % dans l’esprit sans d’autres programmes et initiatives comme ceux-ci. La communication est réalisée lorsque le signal est reçu, pas seulement envoyé.

Récemment, Ookla a également examiné la fracture numérique et l’accès à la large bande aux États-Unis. – Comment les 50 États américains se positionnent en matière de vitesse de la large bande : 1H 2024 | Ookla®. Nous sommes impatients de fournir d’autres mises à jour sur les progrès réalisés par les États-Unis et le Canada pour fournir une connectivité Internet haute vitesse pour tous. Pour plus d’informations sur les données et les analyses de Speedtest Intelligence, veuillez prendre contact.

Ookla retains ownership of this article including all of the intellectual property rights, data, content graphs and analysis. This article may not be quoted, reproduced, distributed or published for any commercial purpose without prior consent. Members of the press and others using the findings in this article for non-commercial purposes are welcome to publicly share and link to report information with attribution to Ookla.
| October 1, 2024

How the 50 U.S. States Stack up in Broadband Speed Performance: 1H 2024

Check out the full report available now with the complete results for all 50 states.

Affordable, reliable, high-speed broadband is considered a necessity in the U.S. because it enables people to access online classes, secure health care assistance, register for basic government services, handle their banking needs and participate in many other essential services.  

It’s also critical to the economic viability of every state because it supports remote workers, enables businesses to operate more efficiently and attracts new enterprises to an area. 

But many states have struggled to make broadband service available to 100% of their residents primarily because service providers are focused on providing it to areas where it’s most profitable. Using Ookla’s Speedtest Intelligence® data, this report identifies the states that are currently delivering the minimum standard for fixed broadband speeds as established by the Federal Communications Commission (FCC) to the highest percentage of Speedtest users. It also singles out the states that need the most improvement when it comes to delivering the minimum standard for broadband to their residents. 

Key takeaways 

  • Connecticut, North Dakota, Delaware and six other states are the top performing states because they have the highest percentage of Speedtest users that meet the FCC’s minimum standard for fixed broadband speeds of 100 Mbps downstream and 20 Mbps upstream. While comparing small, densely populated states with larger, sparsely populated states may seem unfair, we thought it was important to note the current performance of each state so we can track their progress in future reports.  
  • New Mexico, Arizona and Minnesota saw the biggest improvement in the percentage of Speedtest users getting the FCC’s minimum standard for fixed broadband speeds (100 Mbps down/20 Mbps up) between the first half of 2023 and the first half of 2024.  
  • Washington, Alaska, Illinois and Oregon have the most prominent digital divide of all the 50 states. These four states have the biggest gap between the percentage of rural Speedtest users vs. the percentage of urban Speedtest users that get FCC’s minimum standard of broadband speeds of 100 Mbps downstream/20 Mbps upstream. 
  • Not surprisingly, less than 40% of the Speedtest users of Alaska, Montana and Wyoming (which are three of the least densely populated states in the U.S.), are receiving the minimum broadband speeds of 100 Mbps downstream/20 Mbps upstream.

Broadband in the spotlight

The COVID-19 pandemic put a spotlight on the importance of having broadband access and the role it played in allowing people to continue working and receiving access to healthcare as well as keeping students in school.  The American Rescue Plan Act of 2021 provided $3.2 billion to help low-income households in the U.S. pay for broadband access during the COVID-19 pandemic. 

This sudden focus on broadband accessibility, also prompted Congress to pass the Infrastructure Investment and Jobs Act of 2021 which set aside $42.5 billion for the Broadband, Equity, Access and Deployment (BEAD) program and provided funding for every state to expand its broadband services. The National Telecommunications and Information Administration (NTIA) runs the BEAD program and the funding is being used for planning, infrastructure, and adoption programs in all 50 states, Washington, DC and several U.S. territories. 

BEAD initially provided $100 million to every state with the remainder of the funding to be divided among the 50 states based upon their unserved and underserved populations. As of September 18, 2024, 44 eligible entities have been approved for both the Volume 1 and Volume 2 phases of BEAD. Volume 1 of the state’s proposal details the list of locations that are eligible for BEAD funding as well as a description of how certain entities can dispute the eligibility status of the various locations. Volume 2 includes each state’s description of how it plans to select ISPs and its overall broadband objectives. Once approved for both phases, states can then get access to the money that has been allocated for them.  

To help manage these federal funds every state and territory established a broadband office that is tasked with determining the extent of their broadband coverage problems and draft broadband strategies that will resolve the problem. 

The FCC in March 2024 decided to revise its current definition of broadband as 100 Mbps downstream and 20 Mbps upstream, which is a substantial upgrade from its previous benchmark of 25 Mbps download and 3 Mbps upload speed that was first established in 2015.

This is the first time in nearly a decade that the FCC raised the speed requirement. Although this new benchmark is being used throughout the U.S., many households still lack basic broadband services. 

Top performing states

Using Ookla’s Speedtest Intelligence® data collected in the first half of 2024 we were able to compare the median download and upload speeds in all 50 states and identify the states that currently doing the best job of delivering the FCC’s minimum standard for fixed broadband speeds (100 Mbps downstream/20 Mbps upstream) to the highest percentage of Speedtest users.  

At least 60% or more of the Speedtest users in Connecticut, North Dakota, Delaware, Maryland, New Hampshire, North Dakota, Rhode Island, Tennessee, Utah and Virginia are getting the FCC’s minimum standard for fixed broadband speeds of 100 Mbps downstream and 20 Mbps upstream.  In Connecticut, which is the top state, 65.8% of Speedtest users are receiving the minimum broadband standard. But at just 65.8% that indicates that there is much more work ahead for states. 

Interestingly, all nine of the states in this list have received final approval for both phases of BEAD funding. However, it’s unlikely that BEAD funding approval played any role in these nine states leading the rest of the country in delivering the minimum standard for broadband because BEAD funding isn’t expected to start impacting broadband deployment projects until 2025 at the earliest, with some states having to wait longer depending on their proposal status with NTIA.

Top performing U.S. states with over 60% of Speedtest users achieving broadband speeds

RankStatePercentage of Speedtest users achieving broadband speedsBEAD funding approval
1Connecticut65.8Yes
2North Dakota65.5Yes
3Maryland63.7Yes
4Delaware63.3Yes
5Rhode Island62.7Yes
6Tennessee62.2Yes
7Utah61.8Yes
8New Hampshire60.5Yes
9Virginia60.1Yes
Source: Ookla Speedtest data.
*Note NTIA approval of BEAD funding is changing rapidly. While BEAD funds haven’t likely played a role in broadband deployments yet, they will in the future.

Southwestern US sees big improvements in broadband 

New Mexico, Arizona and Minnesota saw the biggest improvement in the percentage of their residents getting the FCC’s minimum standard for fixed broadband speeds (100 Mbps down/20 Mbps up) between the first half of 2023 and the first half of 2024.  

New Mexico leads the rest of the states with its gains in broadband in the past year. Ookla data indicates that New Mexico saw a 50% increase in the percentage of its population with access to the FCC’s minimum broadband speeds of 100 Mbps/20 Mbps. Arizona also saw a 45% jump in the percent of  its population with access to the FCC’s minimum broadband speeds of 100 Mbps/20 Mbps. 

Arizona, and specifically, the city of Mesa, AZ, has been a hotbed of activity for fiber deployments. In 2022 Google Fiber decided to deploy fiber to Mesa, AZ after the city council approved plans to bring a data center to the area. In addition, AT&T also announced plans to bring its fiber service to Mesa in 2023. These new fiber entrants are competing with existing broadband providers Cox Communications and Lumen. 

U.S. states with largest year-on-year increase in Speedtest users achieving broadband speeds

RankStateIncrease in Speedtest users obtaining broadband speeds (1H 2023 vs 1H 2024)BEAD funding approval
1New Mexico50%Yes
2Arizona45%Yes
3Nevada37%Yes
4Minnesota38%No
5Colorado35%Yes
6Washington35%Yes
7Oregon32%Yes
8Wyoming32%Yes
9Maine30%Yes
10Utah29%Yes
Source: Ookla Speedtest data.
*Note NTIA approval of BEAD funding is changing rapidly. While BEAD funds haven’t likely played a role in broadband deployments yet, they will in the future.

Sparse population equals inferior broadband

Not surprisingly, the most sparsely populated states in the U.S. tend to also have the smallest percentage of their population receiving the FCC’s minimum broadband speeds. Building broadband networks in rural states is incredibly expensive, and in some areas the terrain can make it nearly impossible. For example, in Alaska, where the ground may be frozen for many months out of the year, it’s difficult to dig trenches to install fiber. 

Ookla’s Speedtest data collected in the first half of 2024 found that less than 40% of the residents of Alaska, Montana and Wyoming (which are three of the most sparsely populated states in the U.S.), receive the minimum broadband speeds of 100 Mbps downstream/20 Mbps upstream.

The digital divide is still evident in many states

A big part of the impetus behind the federal government’s BEAD program is to finally close the gap between those with and without access to broadband, or what is commonly referred to as the digital divide.

But there are still many states that have a prominent gap between the number of rural and urban residents that have access to the FCC’s minimum standard of broadband speeds of 100 Mbps downstream/20 Mbps upstream.

Using the Census Bureau’s urban-rural classification and Ookla data compiled in the 1H of 2024, Washington, Alaska, Illinois and Oregon have the biggest digital divide compared to the other 50 states. For example, while 61.1% of urban Speedtest users in Washington state receive broadband speeds of 100 Mbps/20 Mbps, only 28.7% of its rural Speedtest users receive those same speeds.  

Breaking Down the Digital Divide
Percentage of urban and rural Speedtest users in each state with access to broadband speeds of 100/20 Mbps.

Broadband speeds are improving but more work is needed

U.S. broadband networks offer faster and more reliable connectivity to more people today than they did just a few years ago, however there’s still a large percentage of the U.S. population without adequate access to broadband connectivity.  

Thanks to new funding such as the BEAD program, there are many efforts underway to improve modern broadband networks. We expect to see these advancements in 2025 as more states start to put their BEAD funding into action. 

We will provide semi-annual updates on the broadband speed performance of providers in the 50 states and also to track the improvements that states are making to bridge the digital divide. For more information about Speedtest Intelligence data and insights, please get in touch.

Ookla retains ownership of this article including all of the intellectual property rights, data, content graphs and analysis. This article may not be quoted, reproduced, distributed or published for any commercial purpose without prior consent. Members of the press and others using the findings in this article for non-commercial purposes are welcome to publicly share and link to report information with attribution to Ookla.
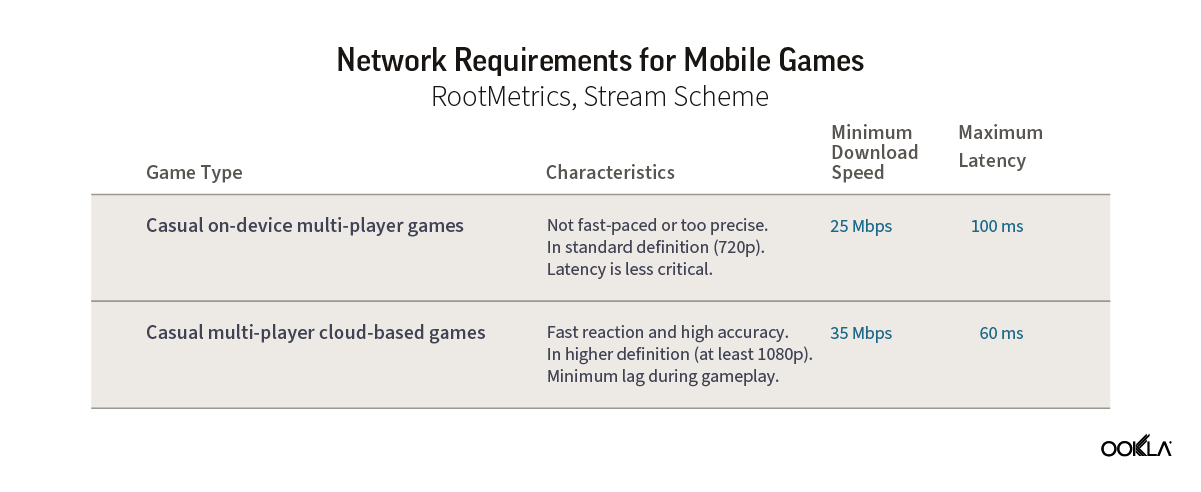
| April 26, 2022

The Case for Private Networks in India

The recent recommendation from the Telecom Regulatory Authority of India (TRAI) around providing an enabling framework for enterprises to build their own private networks is in line with other 5G markets, where governments are looking to drive the digitization of key industries. However, Indian operators see this as limiting their return on investment in the 5G spectrum. Looking at the example of private networks across Europe, and Germany in particular, we believe that Indian telcos shouldn’t see TRAI’s proposal as a threat. Rather, they should use the buzz around the spectrum for verticals as a way to get enterprises interested in digitalization.

The overall financial health of the Indian telecom industry remains fragile. Furthermore, operators’ ability to invest in upgrading their network is negatively impacted by low average revenue per user (ARPU) levels and high regulatory costs. As a result, India’s mobile performance is affected. According to the Speedtest Global Index™, in March 2022 India ranked 120 (out of 142 countries) with a 13.67 Mbps median mobile download speed vs. the global average of 29.96 Mbps. The 5G network rollout will require intensive capital  investment and allowing enterprises to have access to dedicated spectrum can potentially limit operators’ 5G-addressable revenue.

The case for 5G in manufacturing

On the consumer side, 5G will boost Indian mobile performance, as we have postulated in our recent article, new 5G launches in Asia Pacific point to a potential 10x increase in median download speeds (5G vs 4G-LTE). However, 5G will also deliver socioeconomic benefits in India, on account of a number of 5G use cases that could enable new applications across all sectors. According to GSMA Intelligence, 5G is expected to contribute around $455 billion to the Indian economy over the next 20 years, accounting for more than 0.6% of GDP by 2040. One of the sectors that stands to benefit from 5G is the manufacturing sector, representing 20% of the total benefit. Retail, ICT and agricultural sectors should also benefit.

The Indian government has already zeroed in on making India’s manufacturing sector more competitive on a global scene. As such, the “Make in India” goal is to make India self-reliant and also to increase the share of the manufacturing sector to 25% of GDP “in the coming years.”

As of now, this is a distant goal. China is still the world’s manufacturing superpower, accounting for 29% of global manufacturing output in 2020, followed by Japan (17%) and Germany (5%). All of these countries have embarked on digitization strategies.

In addition, manufacturing companies look to optimize and control production processes, improve safety, and reduce costs in order to maximize the return on investment. The COVID-19 pandemic has exacerbated existing challenges and pain points for manufacturers, highlighting the need to improve supply-chain resilience and boost production speed and flexibility. However, even before the pandemic, the manufacturing sector was undergoing digital transformation – the so-called fourth industrial revolution or Industry 4.0, referring to the use of technologies such as machine learning, edge computing, IoT, digital twins, and new networks to aid automation and enable data exchange.

According to Ericsson, typical revenue increases when manufacturers digitize their processes come from increased throughput and quality (2–3%), while typical cost savings originate from improved capital efficiency (5–10%) and decreased manufacturing costs (4–8%). A proportion of manufacturers will need dedicated network resources to meet their transformation goals and ensure data isolation and security. According to the GSMA Intelligence Enterprise in Focus 2020 survey, 22% of manufacturers require location-specific coverage (e.g. factory, campus).

Historically, Wi-Fi has been the connectivity choice for private networks. However, mobile technologies such as 4G/LTE and 5G are better suited to Operational Technologies’ network requirements of high volume, high reliability, mobility, and always-on operations. 5G and 5G Standalone in particular offers the most benefits related to eMBB, massive IoT, and critical IoT. Additionally, enterprises decided to deploy proprietary networks to have more control over their networks; the increased security offered by isolating their data from public networks is an attractive benefit.

Private networks aren’t new 

A number of countries are looking to private networks to address Industry 4.0 objectives and awarding spectrum for vertical use e.g. Germany, Japan and France. According to GSA data, as of February 2022 there were 656 organizations deploying LTE or 5G private mobile networks. GSA’s data points to the manufacturing sector as a strong adopter of private mobile networks, with 111 identified companies involved in known pilots or deployments, which is up from 51 at the start of 2021.

Dedicated spectrum available for private mobile networks has already been allocated in France, the United States, Germany, Japan, and the United Kingdom. Germany is considered to be a poster child for Industry 4.0. Afterall, the term “Industry 4.0” was coined at Hannover Messe over a decade ago. It is therefore only natural to look to Germany and its approach to private networks. In Germany, the national regulatory authority (BnetzA) is promoting industrial policy and reserved 100 MHz in the 3,700-3,800 MHz for local networks, noting that the spectrum can be used in particular for Industry 4.0. “By awarding spectrum for local 5G networks, we are creating scope for innovation for enterprises,” stated Jochen Homann, Bundesnetzagentur President. As of April 15, 2022, the Federal Network Agency (BNetzA) received a total of 208 applications for the allocation of frequencies for local 5G networks and granted the same amount.

We have commented on how the private networks landscape is developing in Europe here. Simply assigning spectrum to verticals isn’t enough to drive market adoption. In an upcoming analysis, we will discuss how the French government has prioritized 5G as an avenue to drive digital transformation of the economy via a number of funds. According to the GSA, there were a total of 66 private networks all together in France, Germany, and Japan, despite enterprises being able to acquire spectrum since 2019.

Despite the 208 applications that BNetzA received, the GSA has counted 45 private networks in Germany, with a majority distributed between three verticals: manufacturing (14), power and water utilities (11), and devices testing and lab as a service (seven).

It is important to note that globally, as per the latest GSA data, only 21% of networks were 5G only, and mostly composed of test networks. Until the 5G device ecosystem matures, the majority of private networks will remain 4G/LTE, though using equipment that is 5G ready. Only after the availability of industrial-feature-rich 5G release 16 chipsets, which will happen in the next few years, will the 5G deployments move beyond trials and proof of concept into full scale deployments. Germany is an outlier here: 5G and 5G SA are making headways in Germany. Audi, KUKA, Volkswagen, and Siemens take an active role in testing and deploying 5G SA private networks utilizing localized spectrum in the 3500 MHz band (n78).

The many routes to market

TRAI has proposed an enabling framework for enterprises to build their own private networks via a range of deployment scenarios, including spectrum leasing and dedicated spectrum. The Cellular Operators Association of India (COAI) representing major telecom companies such as Bharti Airtel Ltd, Reliance Jio Infocomm Ltd, and Vodafone Idea Ltd. opposed this, stating that TRAI should: “Disallow private enterprise networks for the financial viability and orderly growth of the telecom industry, which is more than capable of delivering  these services to businesses”.

Yes and no. Operators can utilize various deployment models, from public dedicated networks through hybrid networks (network slicing, public/private campus, private RAN with public core) to private networks. Within these various models, network slicing and edge computing add the benefits of QoS, privacy, security, and specific SLAs.

When it comes to private networks, the typical rules of engagement no longer apply, and with network virtualization continuing, the ecosystem of vendors has expanded beyond traditional telco players. Just recently Cisco entered this crowded market that already consists of operators, hyperscalers, startups, and equipment vendors. Amazon’s introduction of AWS Private 5G network is a good example of the growing “coopetition” trend. In some cases, AWS would work with operators to provide 5G core and edge computing capabilities, while in some others, it could compete to offer end-to-end solutions. Nokia is looking to address the enterprise demand in India via working with network operators, but also by working directly with enterprises, as Ricky Corker, Chief Customer Experience Officer, Nokia recently stated.

We can draw lessons by looking at the approach that European operators took when addressing the enterprise opportunity. Deutsche Telekom has been offering campus network solutions for enterprises since 2019, and now operates more than ten such local networks based on 5G non-standalone technology or LTE across Germany. In January 2022, the operator expanded its offering to include location-specific 5G mobile networks for companies based on 5G Standalone Technology (5G SA), powered by the Ericsson Private 5G portfolio. The operator can also position itself as a systems integrator (SI) for 5G private networks for Industry 4.0 by utilizing T-Systems’ credentials and its deal with AWS.

Similarly, Vodafone takes an active role in deploying private networks, and distinguishes three degrees of industrial control depending on a private network setup.

In the first scenario, a dedicated mobile private network (MPN) brings total control to the enterprise because everything stays on site. There is no interoperability with public networks. This is particularly well suited for mission- or business-critical applications that don’t need to interface with the public internet.

The second option is a hybrid private network, which is a blend of public and private infrastructure. It enables interoperability with public networks for those devices and users which move outside the private network, while at the same time giving the end user a choice regarding where the data is stored.

The third option, a virtual private network, uses a dedicated slice of a public 5G network. End-user control over the setup is reduced, but compared to the public network it has a dedicated network resource, and allows for greater data isolation, security and privacy, and further SLA customization (availability and reliability). According to Marc Sauter, head of mobile private networks for Vodafone’s business division, network slicing hinges on future releases of the 5G standard, available from next year. “That is when virtual private networks will be more relevant, and a new market will open up with smaller customers.” Vodafone is also very vocal about the importance of the ecosystem, and working on innovation. In its innovation hub in Milan, Vodafone works with developers and startups, and large companies can play around with 5G use cases.

Leveraging existing credentials and forming partnerships to go beyond core competencies can open up new markets for operators. Partners’ ecosystem is key, and to be successful,  operators need to partner across the ecosystem. As enterprises’ needs vary, having a broad portfolio of vendors that can address various verticals, technological, and coverage needs will only stimulate the growth of the market.

Indian telcos have already embarked on this journey. Airtel has partnered with Tech Mahindra for a joint 5G innovation lab to develop “Make in India” use cases for the local and global markets, including customized enterprise-grade private networks. These services will combine Airtel’s integrated connectivity portfolio of 5G ready mobile network, fiber, SDWAN, and IoT along with Tech Mahindra’s SI capabilities.Meanwhile, Vodafone Idea (Vi) joined forces with A5G Networks to enable industry 4.0 and smart mobile edge computing in India. They have jointly set up a pilot private network in Mumbai using existing 4G spectrum.

Rather than seeing spectrum for verticals as a threat, operators can use it as a way to get enterprises, in particular manufacturing companies, interested in digitalization. According to the FICCI-EFESO survey, 36% of organizations will implement “Use of Industry 4.0 technologies for predicting failures in machines, products and processes” in the next 1-2 years, while 22% have already done so. The opportunity is there for the taking.

To learn more about how Ookla® has worked with operators and industries to help plan for 5G growth, contact us.

Ookla retains ownership of this article including all of the intellectual property rights, data, content graphs and analysis. This article may not be quoted, reproduced, distributed or published for any commercial purpose without prior consent. Members of the press and others using the findings in this article for non-commercial purposes are welcome to publicly share and link to report information with attribution to Ookla.
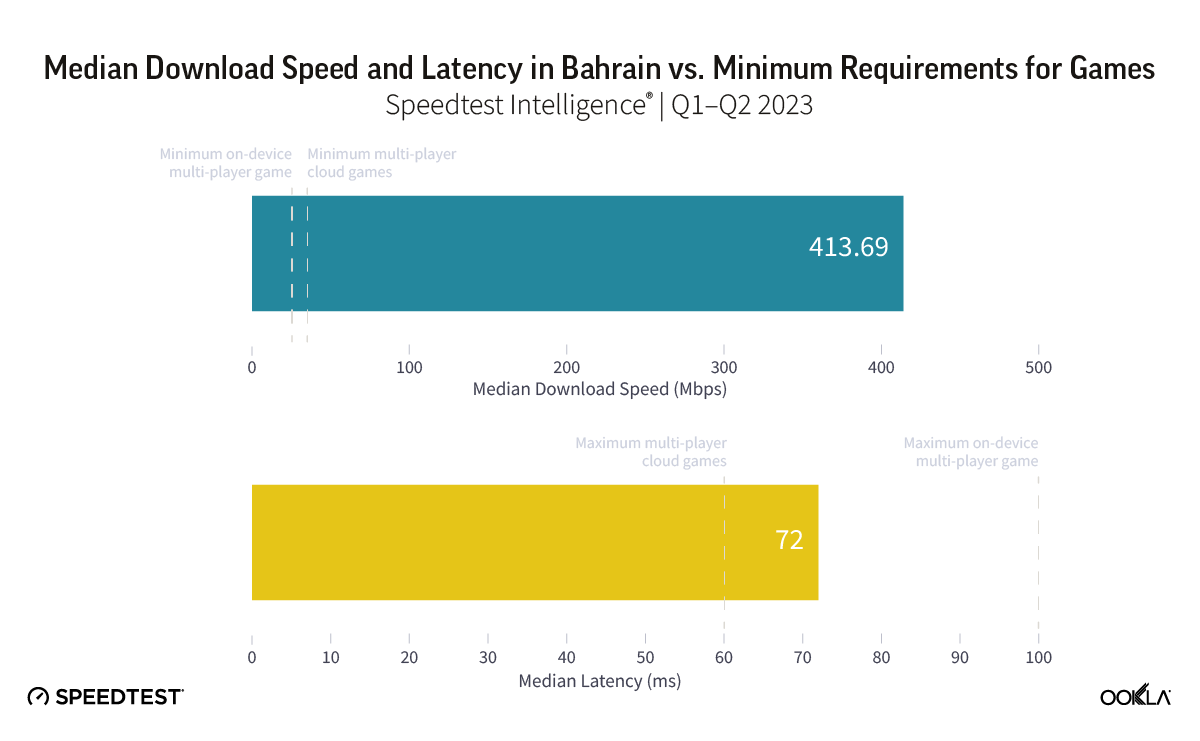
| July 31, 2025

Rethinking Indoor Connectivity: Why It Matters More Than Ever

Mobile networks have seen major upgrades in recent years—from 5G rollouts to expanded spectrum to denser infrastructure—but indoor coverage is still a major weak spot. Whether in office towers, schools, hospitals, or transportation hubs, buildings often block or weaken cellular signals, creating a frustrating experience for users and a missed opportunity for mobile network operators (MNOs). In many cases, indoor coverage gaps pose more than an inconvenience; they create real risks for public safety and limit economic potential for property owners.

This problem is nothing new, but in many developed markets, it’s actually getting worse. Our earlier research explored how a combination of higher frequency 5G spectrum (which struggles to penetrate buildings), newer construction materials like low-emissivity (low-E) glass, and the sunsetting of legacy 2G and 3G networks has deepened indoor coverage challenges. Meanwhile, mobile data usage continues to concentrate indoors, and networks built to prioritize outdoor coverage often don’t deliver the performance users now expect inside buildings.

In this article, we’ll break down the key challenges facing in-building mobile coverage, explore solutions, and show how Ookla’s data can help improve outcomes for consumers, operators, and property owners. For a deeper dive into these topics, watch our recent webinar on-demand, “Reimagining In-Building Cellular: Closing the Coverage Gap.”

The Data Gap: What Regulators Miss About Indoor Coverage

Accurate data is the foundation of good policy. But when it comes to indoor connectivity, many public maps and benchmarks focus on outdoor or predicted coverage and ignore what users actually experience once they step inside. 

Higher-frequency 5G spectrum, signal-blocking materials like low-E glass, and the shutdown of legacy networks have all made reliable in-building coverage harder to achieve in many developed markets.

Data from Ookla’s Cell Analytics platform highlights the scale of the problem. In cities like London and Paris, building-level data reveals large clusters of poor indoor performance, even in areas that draw large numbers of people and appear well-served on public maps. In many cases, users experience degraded 5G coverage and fallback to low-band spectrum that offers limited capacity, leading to a poorer quality of experience. This disconnect between perception and reality underscores several important points:

  • Traditional coverage maps often present an overly optimistic view of network performance—especially indoors—based on computer-modeled predictions rather than reflecting the actual signal conditions enjoyed by end users.
  • Crowdsourced data reveals large pockets of poor in-building coverage in major global cities.
  • These blind spots can lead to misaligned investments and missed opportunities to improve service where it’s most needed.
  • Without building-level insights, policymakers and operators lack the visibility required to close the indoor coverage gap.

Better indoor outcomes start with a more accurate understanding of what users actually experience. Without that understanding, it’s difficult to allocate funding or resources where they’ll make a difference.

Why Indoor Coverage is a Public Safety Issue

Dropped calls and dead zones inside buildings are more than a nuisance—they can be dangerous. In emergencies, people expect to reach help from anywhere, but many buildings still lack the coverage needed for reliable 911 (or equivalent) service. And as emergency response operations increasingly rely on mobile networks and broadband applications, buildings without reliable service could put lives at risk.

When people in distress cannot quickly reach emergency services, every second counts. A one-minute delay in dispatching help can increase cardiac arrest mortality rates by 1–2% and raise fire damage by up to 20%. FCC modeling during the E911 modernization effort found that improving vertical (z-axis) location accuracy—made possible partly through better indoor mobile coverage—could save thousands of lives each year,

Here’s why indoor connectivity matters for public safety—and what’s standing in the way:

  • Indoor coverage gaps can delay or prevent emergency calls. People expect to have mobile service everywhere—but many buildings don’t deliver it when it matters most.
  • First responders increasingly depend on mobile broadband—like apps, video, and real-time data—which all require strong indoor cellular coverage to work reliably.
  • Buildings that lack coverage can disrupt first responder communication and coordination.
  • Fire and building codes in many areas require indoor coverage for public safety radios (not general mobile service), but enforcement varies widelyBetter indoor coverage also helps 911 responders find people faster—especially in multi-story buildings. Today’s emergency systems use more advanced location technology, like device-based hybrid (DBH) methods, which combine GPS, Wi-Fi, and barometric sensors. These signals can now estimate not just your location on a map, but also what floor you’re on. As of April 2025, the FCC requires carriers to provide this vertical accuracy—within about 10 feet (or one floor)—for 80% of wireless 911 calls.

That level of precision can save critical time. If first responders know exactly where to go, they can reach people faster—often shaving a full minute off response times. In serious emergencies like cardiac arrests, where every second matters, that minute could save a life.

In-building coverage should be treated with the same urgency as other public safety infrastructure. Lives may depend on the ability to communicate from inside a building—whether by call, text, or other mobile tools.

New Models for Indoor Connectivity: The Rise of Shared Infrastructure

A new funding model is taking hold across the industry, with more venue owners now willing to foot the bill for in-building deployments as part of broader efforts to improve tenant experiences and stay competitive. With operators focused on outdoor network coverage and typically investing in custom in-building solutions only for the highest-profile venues (like stadiums), many building owners are realizing they’ll need to take the lead if they want better indoor coverage.

One solution gaining traction is the neutral host model, where a single shared infrastructure supports multiple mobile operators within a building. Instead of each carrier deploying its own system, a neutral host handles the design, installation, and operation—reducing cost and complexity for everyone involved. Key benefits of shared deployments include:

  • Neutral hosts design, build, and operate infrastructure that supports multiple MNOs through a single system.
  • Shared systems eliminate the inefficiencies (physical equipment and cost duplications) of carrier-by-carrier installations.
  • The model is particularly effective in transit systems, stadiums, airports, and other high-traffic venues where all operators need coverage and there are significant space constraints
  • Participation often hinges on securing an anchor tenant—an MNO willing to be the first onboard.

Neutral host systems reduce complexity while improving results for everyone involved. As demand grows, expect shared infrastructure to become the norm, not the exception.

The Building Owner Equation: What’s the ROI?

Even when building owners recognize the value of strong indoor connectivity, calculating the return on investment isn’t always straightforward. While features like upgraded lobbies or new HVAC systems have clear costs and resale value, cellular deployments can feel abstract by comparison.

Still, connectivity is increasingly a requirement for tenants—not a perk. With hybrid work schedules, hot-desking, and mobile-first workflows, workers now expect reliable coverage throughout the building—from shared lounges to meeting rooms to wherever they can take a call or join a video meeting. If a space can’t support consistent connectivity across both cellular and Wi-Fi, it becomes harder to attract and retain tenants.

As connectivity becomes a baseline expectation in modern workspaces, building owners face growing pressure to deliver. Here’s what that means in practice:

  • Tenants expect strong indoor coverage (both cellular and Wi-Fi) as part of a modern workspace.
  • Poor connectivity can influence leasing decisions and renewal rates.
  • Owners of mid-sized or lower-profile buildings are often underserved by MNOs—and may need to take the lead on providing connectivity.
  • Without benchmarks or transparency, it’s hard to know where a building stands—or how to improve.

Reliable connectivity increasingly factors into occupancy, retention, and tenant satisfaction. For owners, strong mobile coverage is becoming a basic competitive differentiator.

Policy Can Make or Break Progress

Technology alone won’t fix the indoor coverage problem. Regulation and planning play a critical role—and some countries are showing what works. Leading global markets like Singapore, South Korea, and Hong Kong have implemented policies that require mobile-ready infrastructure in new buildings as a condition of zoning approval. This ensures operators have access to deploy equipment without facing prohibitive delays or costs.

South Korea offers one of the most comprehensive policy approaches to indoor mobile coverage anywhere in the world. New building codes require in-building mobile infrastructure—like risers, conduit, power, and equipment rooms—for a wide range of structures, including high-rise buildings (16 floors or taller), large buildings over 1,000 square meters, any building with underground levels, apartment complexes with 500 or more units, and all subway stations.

The Korean government also sets clear coverage requirements. Every mobile operator must provide service at all subway stations and high-speed rail hubs using mid-band 3.5 GHz spectrum. To make sure performance matches expectations, public scorecards put serious weight on indoor results: about half of the testing in South Korea’s national 5G Quality Evaluation takes place inside buildings like malls, hospitals, and campuses. Carriers that underperform can face financial penalties and public callouts. Together, these policies ensure strong indoor coverage is built in from the start—and that operators are held accountable for delivering it.

That kind of clear policy framework offers a model for other markets to follow. For countries like the U.S. and those across Europe, there are several clear policy opportunities to help close the indoor coverage gap:

  • Require cellular-ready infrastructure (ducting, risers, equipment space) in building codes.
  • Expedite permitting for indoor mobile deployments in public buildings like schools and hospitals.
  • Encourage government facilities to adopt 5G and in-building solutions as part of national strategy.
  • Develop transparent coverage certification or ratings to drive competition and investment.
  • Support more flexible use of spectrum for shared or private indoor deployments.

The bottom line is that indoor coverage can’t be an afterthought in policy. Clear requirements and streamlined permitting are essential for creating long-term change.

How Ookla Is Helping Improve Indoor Connectivity

Ookla supports better in-building connectivity through a powerful set of tools that deliver actionable, real-world insights. These solutions help operators, regulators, and property owners understand performance at the building level—revealing where indoor coverage falls short and where investment is most needed. Here’s how each group is using Ookla’s data to drive better outcomes:

  • Operators use Cell Analytics and Speedtest Intelligence® to identify coverage gaps, prioritize in-building upgrades, optimize spectrum deployment, and validate improvements.
  • Regulators and policymakers rely on Ookla data to support evidence-based planning, improve public reporting, and track progress over time.
  • Building owners use Speedtest results and building-level insights to assess tenant experiences, benchmark performance, and guide connectivity investments.

Ookla’s insights into indoor connectivity continue to play a key role in helping the industry move beyond outdated assumptions and improve mobile performance where people really need it.

Looking Ahead: Closing the Indoor Coverage Gap

Indoor coverage is no longer a secondary concern. As more mobile activity happens inside buildings, strong indoor performance is now essential—for everything from emergency response to tenant satisfaction. Yet this critical area still suffers from outdated assumptions, inconsistent data, and underinvestment.

Fixing the problem requires a coordinated approach—one that brings together network operators, property owners, infrastructure providers, policymakers, and data partners. \With better visibility through tools like Cell Analytics and Speedtest Intelligence, there’s a real opportunity to target improvements where indoor connectivity continues to fall short.

To explore these topics in more detail, watch our full webinar on-demand. And stay tuned—more in-building connectivity research and insights are coming soon!

Ookla retains ownership of this article including all of the intellectual property rights, data, content graphs and analysis. This article may not be quoted, reproduced, distributed or published for any commercial purpose without prior consent. Members of the press and others using the findings in this article for non-commercial purposes are welcome to publicly share and link to report information with attribution to Ookla.
| July 22, 2025

The Caribbean States of 5G

Paradise Found, Signal Lost: a Patchwork of 5G Network Oases and Deserts

The deployment of 5G networks in the Caribbean remains limited and fragmented, concentrated in the region’s more economically developed islands and territories. Currently, 5G mobile services are commercially available in Puerto Rico, the U.S. Virgin Islands, Bermuda (included in the Caribbean for the purposes of this analysis), Aruba, the Cayman Islands, and parts of the Dominican Republic. In the French Antilles, initial 5G deployments are now live in Martinique, Guadeloupe, Saint Martin, and Saint-Barthélemy. Other nations are in various stages of spectrum allocation and trials, signaling a gradual, if uneven, trend toward broader 5G availability.

Key Takeaways:

  • A Multi-Tiered Landscape: 5G deployment in the Caribbean is fragmented, potentially contributing toward a digital divide between a handful of economically advanced, tourism-dependent, or geopolitically connected islands and the rest of the region.
  • ROI Over Ubiquity: Unlike national-scale rollouts in Puerto Rico and countries outside of the region, the rest of Caribbean 5G is driven by targeted return on investment. High per-capita income, competitive pressure, and dense tourist zones are the key predictors of deployment, not universal service goals.
  • The Performance Paradox: Early 5G performance metrics reveal a recurring theme: newly launched, empty networks deliver exceptional speeds (some over 400 Mbps median download speeds), while more mature markets trade some of that raw speed for much higher and more consistent network availability for users.

Caribbean 5G Patterns of Progress

Across the Caribbean, the pace and strategy for 5G deployments vary dramatically. With the possible exception of Puerto Rico, the primary driver for deployment is not universal service but a clear path to return on investment. This has created a multi-tiered landscape defined by economic strength, strategic priorities, and regulatory readiness.

  • High GDP. Dominican Republic, Puerto Rico
  • High Income. Bermuda, Cayman Islands
  • Uncle Sam. Puerto Rico, U.S. Virgin Islands
  • The French Connection. Guadeloupe, Martinique, Saint Martin, (Saint-Barthélemy shows signs of 5G testing, as does French Guyana which is not included in the Caribbean)
  • Outlier. Aruba
  • Planners. The Bahamas, British Virgin Islands, Jamaica

A key competitive dynamic fueling 5G deployment is when incumbents Digicel and Flow are forced to respond to a new competitor, as seen in Bermuda and the Caymans. This is also evident in markets not dominated by this duopoly, such as Aruba, Puerto Rico, the U.S. Virgin Islands, and the French Antilles. Meanwhile, many of the remaining Caribbean countries continue to prioritize their existing 4G LTE networks, where opportunities to expand coverage and improve capacity are more immediate.

Network Availability

(Please note, these charts are interactive. Hover the cursor over a line or bar to feature the subject. Deselect items from the legend to see the remaining subjects in detail.)

Caribbean Mobile Network Availability by Country
Speedtest Intelligence®, All Devices and 5G Devices, 1H 2025

Puerto Rico and the U.S. Virgin Islands lead in 5G Availability for the first half of 2025 – 73.8% and 63.6% respectively – comparing favorably to the U.S. at 63.7%. They have benefited significantly from being part of T-Mobile U.S.’s aggressive 5G expansion and from AT&T’s 5G buildout before its operations were sold to Liberty Latin America in late 2020.

Bermuda (31.2%) and the Cayman Islands (6.2%) are well-suited for 5G. Their high residential incomes and demanding business sectors create strong demand for high-performance connectivity, which attracted a competitive third player in Paradise Mobile to accelerate 5G deployments.

Aruba (20.2%) exemplifies a tourism-first strategy, catering to high-spending international visitors who expect superior mobile service. Its small, flat terrain and concentrated infrastructure along the southern and western coasts lower the costs of 5G deployment. The rollout is also distinguished by being led by SETAR, the privatized national telecom owned by the Aruban government.

The Dominican Republic (8.5%) represents a large-scale Caribbean economy, similar to Puerto Rico, making an attractive business case for 5G capital expenditure. Rollouts have logically started in dense urban centers and key tourist corridors where population and economic activity justify the investment.

In the French Antilles, new commercial 5G services launched in early 2025 across Saint Martin (3.0%), Martinique (1.3%), and Guadeloupe (0.3%). These markets benefit from the technical expertise of French telecom subsidiaries like Orange Caraïbe and SFR Caraïbe. In Saint Martin, local operator Dauphin Telecom also launched 5G, contributing to its early Availability edge over the other two islands. Digicel, in partnership with Free (Iliad Group), also has a presence but has not yet launched 5G.

Two Perspectives on 5G Availability

By examining network technology availability from the perspective of all devices, we gain insight into the breadth of 5G deployments and the adoption of 5G-capable devices. However, looking from the perspective of only 5G-capable devices tells us how often those users can actually connect to a 5G network. The former is a network-centric view of all devices; the latter is a device-centric view of the 5G network.

LocationYear of 5G LaunchAll Devices 5G Availability (%)5G Devices 5G Availablity (%)Point Change% change
Puerto Rico201973.887.413.618%
U.S. Virgin Islands202063.675.511.919%
Dominican Republic20218.534.726.2307%
Bermuda202331.282.151.0164%
Aruba202420.259.839.6196%
Cayman Islands20246.215.69.4152%
Saint Martin20253.023.520.5687%
Martinique20251.36.65.2397%
Guadeloupe20250.31.51.2458%

As the earliest market to launch 5G, Availability leader Puerto Rico sees its 5G devices connected to a 5G network (Claro, Liberty Mobile, T-Mobile) the vast majority of the time (87.4%)—a figure that surpasses even the mainland United States (74.1%). The U.S. Virgin Islands follow closely in Puerto Rico’s wake with similarly high results.

Despite a relatively early 5G launch, the Dominican Republic lags in adoption, with just 34.7% 5G Availability for 5G devices. Though its economy is similar in scale to Puerto Rico’s, its population is roughly triple while its per-capita income is one-third, appearing to limit the business case for broader 5G deployment and device uptake.

Bermuda shows the biggest percentage point (ppt) difference between these two perspectives (51.0 ppt). This is attributed to a favorable deployment environment (small, flat, wealthy populous) and a competitive three-player 5G market featuring One, Digicel, and the newly-launched Paradise Mobile.

From a small base, Saint Martin shows the biggest percentage increase between the two metrics (687%), ahead of Martinique (397%) and Guadeloupe (458%). Saint Martin’s competitive three-player market, where two of the three operators (Orange and Dauphin) have launched 5G, appears to be a key driver.

5G Network Speeds — Mixed Bag

5G versus 4G Speeds
Speedtest Intelligence®, All Providers, 1H 2025

With one notable exception (the U.S. Virgin Islands), 5G download and upload speeds unsurprisingly surpass those of 4G. We looked at countries based upon the length of time their 5G networks have been operational.

As a group with recently launched 5G networks, Guadeloupe, Martinique, and Saint Martin exhibit high median download and upload speeds. This is expected; their low 5G Availability percentages indicate these networks are carrying very little traffic. With just a few customers on the network, it is essentially a wide-open road.

Taking Aruba and the Cayman Islands as a pair that launched 5G in the same year (2024), Aruba’s higher rate of 5G devices on 5G than the Caymans (59.8% vs 15.6%) suggests more network traffic. This likely explains a slower median download speed for Aruba than the Caymans (144.70 Mbps vs 224.17 Mbps), taking the networks as equivalent on the whole (ie, site density and spectrum aside) in delivering the end-user experience. Conversely, Arubans (and tourists in Aruba) appear to leave the uplink more lightly utilized than Caymanians (and their tourists), leading all Caribbean countries with a median 5G download speed of 52.39 Mbps. 

The Dominican Republic’s lower 5G adoption has a silver lining for those who have upgraded: a relatively unloaded network delivering a fast median download speed of 367.78 Mbps. Compare this to Puerto Rico, the most mature 5G market, which posts a still-respectable 129.23 Mbps under a much heavier load.

Bermuda’s competitive market presents another example where significant 5G device adoption is loading the 5G networks, keeping the median 5G download speed (86.27 Mbps) only modestly above its 4G median (60.55 Mbps).

Finally, the U.S. Virgin Islands stand apart. Despite a similar mobile market structure and 5G maturity to Puerto Rico, its much smaller scale may have limited commensurate capital investment, which would be consistent with performance results. In the USVI, T-Mobile’s competitors deliver faster 4G LTE speeds than T-Mobile’s 5G service.

Where Will 5G Launch Next?

The pattern of existing rollouts provides a model for predicting the next wave of 5G in the Caribbean. The most likely candidates are countries that fit the established “high-income” or “tourism-first” profiles but may currently be stalled by regulatory hurdles.

At the front of the line are The Bahamas (Nassau, in particular) and Barbados. Both boast strong tourism economies and high GDP per capita, and their network operators have declared their infrastructure “5G-ready.” Commercial launches are primarily contingent on final spectrum allocation from government regulators. Smaller, tourism-dense islands like Sint Maarten, which mirror the Aruba model, are also strong contenders pending local regulatory action.

Competitive dynamics will also trigger expansion. In Trinidad and Tobago, a market already served by 5G for fixed wireless, a pivot to mobile 5G is the logical next step, likely to be driven by one operator seeking an edge over its rivals. This dynamic is also pushing expansion across borders, as seen with Bermuda’s Paradise Mobile, which, after launching 5G at home, is already planning entry into the Cayman Islands 5G fray.

For many other Caribbean nations, however, expanding and fortifying existing 4G LTE networks remains a more pressing and pragmatic priority than investing in 5G. The high costs, challenging terrain, and risk from natural disasters present formidable barriers. This reality is creating a widening digital divide between the 5G pioneers and the rest of the region. The evolution of 5G in the Caribbean will continue to be a story of calculated investments, with future progress hinging on regulatory decisions, competitive strategy, and the emergence of new technologies that could lower the cost barrier for smaller markets.


Individual mobile network operator performance in the Caribbean will appear with the Speedtest Connectivity reports in the coming weeks and months (not available for all countries). See also this recent report on Caribbean Broadband Competition Picks Up. To find out more about Speedtest Intelligence® data and insights, please contact us here.

Ookla retains ownership of this article including all of the intellectual property rights, data, content graphs and analysis. This article may not be quoted, reproduced, distributed or published for any commercial purpose without prior consent. Members of the press and others using the findings in this article for non-commercial purposes are welcome to publicly share and link to report information with attribution to Ookla.
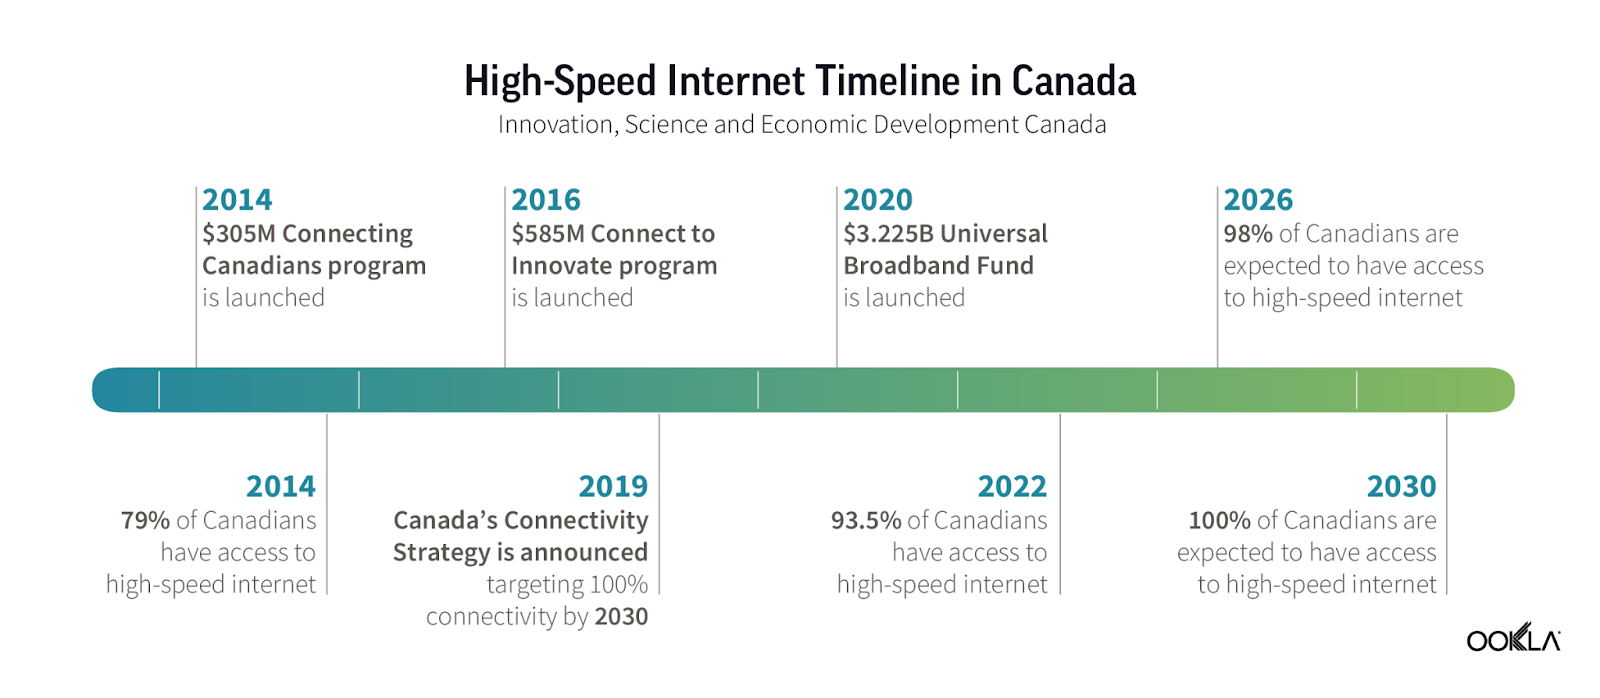
| July 10, 2025

Caribbean Broadband Competition Picks Up

Guadeloupe Gallops, Martinique Marches, Starlink Spreads

Across the Caribbean, internet connectivity is faster, more consistent, and there are more service providers options available for consumers than in the past. Although there are vast differences top-to-bottom across countries, fiber growth continues to drive leaps in performance and, where fiber has yet to reach, satellite service is a viable solution in countries where it is available. 

Key Takeaways

  • More countries are posting download speeds over 100 Mbps. There is a healthy uplift year-on-year, going from just four countries with median download speeds in excess of 100 Mbps in Q2 2024, to 10 countries in Q2 2025. Median download speeds are up 25% from a year ago on average across all countries.
  • Consistency is improving where it needs it most. The 10 lowest-ranked countries improved by an average of 14.2% compared to a 2.5% improvement in the 10 highest ranked in terms of reliably delivering speeds of a minimum 25 Mbps download speed AND 3 Mbps upload speed.
  • Starlink speed and consistency rivals the fixed service providers. Starlink records as-good-as or better consistency in seven of its 11 markets where service is available.

(Please note, these charts are interactive. Hover the cursor over a line or bar to feature the subject. Deselect items from the legend to see the remaining subjects in detail.)

Top ISP Broadband Performance Across Caribbean Markets
Speedtest Intelligence® | Q1 2024 – Q2 2025

Middle ISP Broadband Performance Across Caribbean Markets
Speedtest Intelligence® | Q1 2024 – Q2 2025

Bottom ISP Broadband Performance Across Caribbean Markets
Speedtest Intelligence® | Q1 2024 – Q2 2025

The trend among fixed Internet service provider (ISP) median download speeds across the Caribbean is one of strong and widespread performance improvement over the last year and a half, increasing from just four to ten countries exceeding 100 Megabits per second (Mbps).

  • Guadeloupe is the clear standout, starting as a leader (120.67 Mbps) and more than doubling its speed to 246.32 Mbps by Q2 2025. It shows both the highest overall speed and the largest absolute growth.
  • Martinique and Puerto Rico also demonstrated very strong, consistent growth to round out the top tier.
  • While most countries improved, Sint Maarten is a notable example of rapid progress. It began with one of the lowest speeds (25.21 Mbps) and effectively doubled it to 51.22 Mbps.

Overall, median upload speeds also show a general trend of improvement, but progress is far more variable compared to download speeds, with a handful of leaders pulling away from the pack.

  • Martinique again stands out, as it more than tripled its upload speed from a modest 30.43 Mbps to an impressive 93.33 Mbps, the most significant growth in the region.
  • Two countries surpassed the 100 Mbps mark: Guadeloupe (114.38 Mbps) and the Cayman Islands (107.00 Mbps), establishing them as the clear leaders in upload performance thanks to strong fiber deployments.
  • A large group of countries experienced only slow, incremental growth, remaining below 40 Mbps. Locations like Puerto Rico, the Dominican Republic, and the Bahamas saw very little change in performance over the six-quarter period due to limited fiber expansion.

Unlike the speed metrics, there is no single regional trend for latency. Some countries have stable performance, some are improving dramatically, while a notable number are seeing latency get worse.

  • Trinidad and Tobago is the consistent and undisputed leader, maintaining an excellent latency of just 13-15 ms. Joining Trinidad and Tobago in a country club of best latency performers are Caribbean Netherlands, Puerto Rico, Bermuda (included in region for purposes of this article), Curaçao, Cayman Islands, The Bahamas and Jamaica have consistently low latencies.
  • Haiti improved most, cutting its latency from 95 ms to 71 ms, while the Cayman Islands also saw a solid drop from 49 ms to a very competitive 27 ms.
  • A handful of countries are stuck in the 80-100 ms doldrums range — Antigua and Barbuda, Aruba, Barbados, Dominica, Saint Martin, Saint Lucia, Sint Maarten.

Spotlight on Guadeloupe and Martinique Speeds

Guadeloupe and Martinique Speeds by Fixed Provider
Speedtest Intelligence® | Q2 2025, Mbps

Taking a closer look at the top median download countries of Guadeloupe and Martinique and their fixed service providers, we can see these are strongly competitive markets for fiber services. 

In Guadeloupe, CANALBOX is the performance leader, delivering the fastest median download (354.37 Mbps) and upload (276.44 Mbps) speeds.

Interestingly, SFR performs differently in each market.

  • In Martinique, SFR leads with relatively balanced download (263.10 Mbps) and upload (180.40 Mbps) speeds.
  • In Guadeloupe, while its download speed is very competitive (295.26 Mbps), its upload speed is drastically lower (46.22 Mbps), making it a highly asymmetric service.

The top performer in one country isn’t the No. 1 provider in the other. CANALBOX wins in Guadeloupe but is the slowest of the three providers in Martinique, while SFR wins in Martinique but is not the top performer in Guadeloupe. There can be distinct network infrastructure and market strategies in each country.

Consistency – More Countries are Delivering Reliable Download and Upload Speeds

Ookla uses the network Consistency metric to gauge how prevalent acceptable broadband speeds are across a network, based on the percentage of Speedtest samples exceeding a threshold of 25 Mbps download and 3 Mbps upload performance. 

Consistency (%), Q2 Year-to-Year
Speedtest Intelligence® | Q2 2025 and Q2 2024

The consistency of the region’s broadband networks saw widespread improvement from Q2 2024 to Q2 2025, meaning a higher percentage of users achieved a baseline speed of at least 25 Mbps download and 3 Mbps upload.

  • A top tier of locations deliver a highly consistent experience. Trinidad and Tobago (86.3%), Bermuda (86.1%), and Puerto Rico (85.5%) lead the region, providing the benchmark-level service to over 85% of users.
  • Significant gains were seen in countries that started with lower scores. Sint Maarten (+10.6 points) and the Dominican Republic (+8.8 points) made the largest gains, but still with more upside remaining for improving the baseline user experience.
  • Virtually every country improved its consistency score year-over-year. Even those not improving, like Dominica and Grenada, only saw very minor declines of less than one percentage point.
  • Despite broad improvements, a significant country digital divide remains. While the leaders push past 85% consistency, several countries like Haiti (66.2%) and SintMaarten (65.0%) are still working to provide that baseline service to a majority of their users. Cuba, with a score below 10%, remains a severe outlier.

Starlink Brings More Competition

Starlink Performance, Median Download Speed and Consistency
Speedtest Intelligence® | Q2 2025

A little over a year ago, Ookla examined the Caribbean region and, at the time, Starlink was available in just five countries. Now it has more than doubled that number to 11 countries where it is available (including parts of some where it is sold out). Based on Q2 2025 data, Starlink’s performance compared to the overall fixed broadband market varied depending on the country, excelling in some, trailing in others, and competitive in all.

  • Starlink provides a substantial median download speed advantage in several markets. The most dramatic case is the U.S. Virgin Islands, where Starlink’s median speed of 151.61 Mbps is over 50 Mbps faster than the country’s overall average. It also offers a significant performance boost in locations like Saint Martin and the Bahamas*.
  • In some of the region’s more developed high-speed markets, Puerto Rico and Trinidad and Tobago, Starlink’s speeds are nearly identical to those of the top fixed providers, offering a comparable experience.
  • In countries with exceptionally fast fiber providers, Starlink lags considerably. Guadeloupe’s overall median speed of 246.32 Mbps is nearly double Starlink’s speed in the country. Similarly, Martinique’s fixed broadband market is much faster than Starlink.

In terms of delivering a consistent, baseline-usable internet connection, Starlink shows a distinct advantage in many Caribbean nations, though it does not outperform the most reliable fixed networks in the region.

  • Starlink shows an advantage in the U.S. Virgin Islands and Saint Martin, offering a double-digit or near double-digit percentage point lead over the average for all providers.
  • Starlink’s consistency is identical to Jamaica as a whole, the scores are exactly the same (78.0%), while in Puerto Rico, they are also very close, making them comparable choices.
  • In Trinidad and Tobago, the market’s consistency score (86.3%) is substantially higher than Starlink’s (77.8%), and more consistent as well in the Dominican Republic and Haiti.

Starlink’s impact in the Caribbean varies. It presents a viable, high-speed option where fixed networks are less developed or slower, yet it generally doesn’t outperform the most advanced fiber networks in the area.

Starlink seems to offer a significant improvement in consistency for islands where the overall fixed market hasn’t achieved high reliability. Conversely, in countries with the strongest fixed networks, local providers offer a more consistent experience.

*The Bahamas and Nassau offer an example for looking more closely at the map and at the numbers

In the prior section we saw that Starlink performed well in the Bahamas for its download speed and its consistency, beating the country scores. However, Nassau, with about 70% of the country’s population, is relatively distinct from the rest of the country’s archipelago. This population density has encouraged fiber deployment, in particular from ALIVFibr.

Nassau (New Providence):

Q2 2025 Speedtest IntelligenceMedian Download Speed (Mbps)Consistency (%)
ALIVFibr243.3395.1
Starlink  94.42 80.8

Space X is everywhere, as the country (and region) has many islands with nice views of the sky. Clearly fiber offers superior performance when it is available, as in Nassau, but Starlink can be the great option almost everywhere else. This can be true of much of the Caribbean.

The past year-and-a-half has witnessed maturation of these rival technologies across many countries in the region. While country comparisons are interesting, it is also important to dig deep for the full story, whether by technology or geography, or both. We’ll continue to monitor progress and provide updates on the state of broadband connectivity across the Caribbean. For more information about Ookla’s data and insights, please get in touch.


Ookla retains ownership of this article including all of the intellectual property rights, data, content graphs and analysis. This article may not be quoted, reproduced, distributed or published for any commercial purpose without prior consent. Members of the press and others using the findings in this article for non-commercial purposes are welcome to publicly share and link to report information with attribution to Ookla.
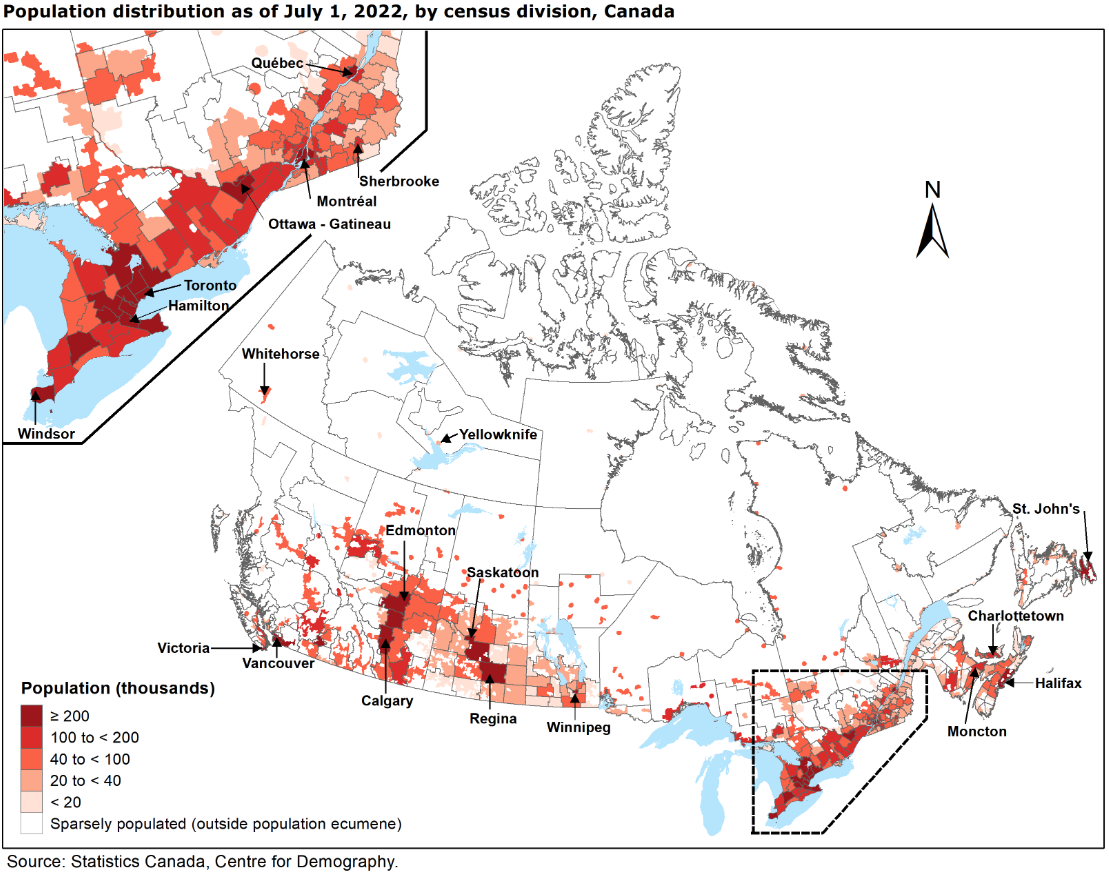
| September 29, 2025

When Networks Fail: Lessons from Recent Outages on Building True Digital Resilience

Network outages used to be contained problems—a cell tower lost power, customers in that area lost service, and technicians restored connectivity within hours. The digital environment has since changed dramatically, with failures now spreading quickly across interconnected systems that society depends on. The April 2024 power grid collapse across Spain and Portugal left tens of millions without mobile service for up to 24 hours. The CrowdStrike incident in July grounded flights, shut down hospitals, and silenced news broadcasts globally. Google Cloud Platform outages cascaded through services like Spotify, taking entire digital ecosystems offline. What changed is not just the scale of these failures, but also how quickly problems spread across interconnected systems essential to economic and social activity.

The root cause lies in digital transformation itself. Organizations have gained tremendous capabilities through cloud services, managed providers, and interconnected networks, but they’ve also created new vulnerabilities. A single software update can now ripple through thousands of companies. A power outage in one region can disable mobile networks across multiple countries. Supply chain dependencies stretch across continents, making it nearly impossible for any single organization to control all the factors that affect their service reliability. Network resilience has shifted from an operational concern to a strategic necessity, as its absence poses systemic risks to entire economies.

In this article, we’ll examine how recent major outages reveal the true nature of network vulnerabilities, explore frameworks that leading operators and policymakers use to build resilience, and show how data from events like the Iberian blackout can guide better preparation strategies. For a deeper look at these topics with real-world examples, watch our recent webinar on-demand, “Navigating Disruption: Best Practices for Resilient Digital Infrastructure.”

What Network Resilience Really Means

Most network operators measure success with basic statistics: how often their networks stay running and how quickly they fix problems when something breaks. Traditional network monitoring focuses on straightforward metrics like uptime (network availability), availability percentages (how often networks stay up), and mean time to repair (how fast problems are solved), but these measurements can miss the bigger picture during major outages.

During major incidents, understanding the true impact requires multiple perspectives that basic statistics like uptime or network availability alone can’t provide. Multiple data sources paint different pictures of the same event, and each tells a key part of the story:

  • Consumer reporting platforms like Downdetector® by Ookla® capture user-reported issues but depend on users having working connections to report problems. For a more detailed perspective on how outages impact organizations—and what’s truly at stake when services fail—see our white paper, The Cost of Downtime: A Guide to Proactive Outage Management
  • Background network scanning can reveal infrastructure failures but often provides retrospective rather than real-time insights
  • Operator dashboards track internal systems but often lack visibility into interdependent infrastructure like power grids
  • Government monitoring focuses on critical services like emergency communications, hospitals, or public safety systems, but may not capture broader economic impacts

The Iberian power grid collapse demonstrated these measurement challenges perfectly. Initial consumer reports spiked dramatically, then collapsed to near zero, not because service was restored, but because users lost the ability to report outages entirely. One operator in Portugal, MEO, maintained service longer than its competitors, an early sign of what resilience looks like in practice.

Analyzing Resilience: From Detection to to Communication to Learning

Major outages often unfold faster than anyone expects, and the difference between a temporary disruption and a systemic crisis lies in how effectively resilience is analyzed. In our recent webinar on network resilience, a practical framework was discussed that breaks resilience into five stages, each one critical to keeping disruptions from escalating:

  • Detect: Spot the first signs of trouble across multiple data sources, from outage reports to operator dashboards
  • Attribute: Identify the real root cause, whether it’s an internal software bug, an underwater cable cut, or a regional power failure
  • Communicate: Share timely, accurate information with stakeholders and the public to reduce confusion
  • Remediate: Act quickly to contain damage, restore critical services, and prevent cascading failures
  • Learn: Capture lessons from the event and feed them back into playbooks, exercises, and long-term resilience planning

This framework underscores that resilience is not only about preventing outages; it’s also about building the capacity to respond, adapt, and improve when disruptions inevitably occur.

Power Dependencies: The Hidden Single Point of Failure

Power grids and mobile networks may look like separate systems, but major outages reveal how tightly connected they are. People often expect their phones to keep working in a crisis, yet service can disappear quickly once the electricity that powers cell sites and core facilities is lost.

Mobile networks are built with distributed architecture and multiple layers of redundancy, yet the April 2024 grid collapse exposed a fundamental vulnerability: dependence on external power. When regional electricity failed, mobile site failures moved in near-perfect lockstep with the power grid collapse, leaving over half of subscribers without service in affected areas.

The outage revealed dramatic differences in operator preparedness strategies and their real-world impacts:

  • Battery deployment depth: Portuguese operator MEO’s extensive battery investments created a “flattened outage curve”—service degradation began later and peaked lower than competitors, buying critical time for restoration efforts
  • Core network protection: MEO maintained core network stability throughout the crisis, preventing a total service collapse that would have affected all subscribers simultaneously by investing in multi-day power autonomy
  • Geographic redundancy: One competitor with centralized core infrastructure and a lack of geo-redundancy and power resilience saw its entire subscriber base go offline when its main facility in Lisbon lost power
  • Backup power at cell sites: MEO’s six-hour battery capacity at most mobile sites provided meaningful service continuity, while some competitors with minimal backup power saw more immediate failures

During the crisis, roaming traffic on MEO’s network increased threefold as subscribers from failed networks automatically switched to available alternatives. MEO’s battery investments prevented total network collapse and provided backup connectivity for competitors’ customers during the extended outage.

Cascade Effects: How Failures Multiply Across Digital Infrastructure

Apps and services may seem independent, but they often share hidden connections through common cloud platforms, authentication systems, or payment providers. Single points of failure in shared infrastructure can trigger cascading outages that extend far beyond the original problem. Cloud platform outages demonstrate how interconnected modern digital services have become, with failures at major providers like Google Cloud Platform and CloudFlare affecting thousands of downstream applications and services.

Recent cloud incidents reveal several common failure patterns that amplify initial problems:

  • Management system failures: Many big cloud outages don’t come from the servers themselves going dark, but from the control systems that keep everything running. When those fail, it can knock out multiple services at once across different regions
  • When one outage triggers others: Services like Spotify and Snapchat, which rely on Google Cloud infrastructure, become unavailable during Google’s outages, even though their own systems function properly
  • Misidentifying the cause: Initial incident reports often misidentify root causes, leading to delayed or misdirected response efforts until proper analysis reveals the true source

These interconnected failures show how cloud outages can rapidly spread beyond their original source. When critical shared infrastructure fails, the impact can multiply across all the services that depend on it.

Crisis Response: Building Effective First-Hour Playbooks

The difference between manageable incidents and prolonged outages often comes down to what happens in the first hour after problems begin. MEO’s response to the Portugal power grid failure demonstrates how preparation and automated systems enable rapid crisis management even during unprecedented events.

Effective incident response relies on several key components that must be tested and refined before emergencies occur:

  • Automated alerting and dashboards: MEO declared crisis status within 23 minutes of initial power grid failure because monitoring systems provided immediate impact assessment across fixed and mobile networks
  • Regular disaster recovery exercises: Although the power grid scenario hadn’t been specifically tested, frequent tabletop and live exercises prepared response teams for rapid decision-making under pressure
  • Prioritizing critical infrastructure: Maintaining stable core infrastructure prevented a total service collapse, allowing network-level management even as individual sites lost power
  • Site-by-site damage assessment: Automated systems tracked how much backup power remained at each site, enabling strategic resource allocation during extended outages

MEO’s systematic approach during an unprecedented crisis shows that regular disaster exercises prepare teams for rapid decision-making when events turn out worse than expected. Even without testing the exact power grid failure scenario, MEO’s established processes enabled coordinated resource management under extreme pressure.

Policy Interventions That Drive Real Results

Effective resilience policies require more than regulatory requirements; they need funding mechanisms, technical standards, and international coordination to address the cross-border nature of modern digital infrastructure. Several countries have developed comprehensive approaches that combine multiple policy tools to improve network resilience outcomes, including Australia, Estonia, Finland, Colombia, and Japan.

Australia tackled resilience with a funding-first approach, using public investment to encourage operators to harden networks and explore new technologies:

  • Direct infrastructure funding: Government programs support operators in deploying redundant infrastructure and network hardening measures that might otherwise be economically challenging
  • Research and development support: Separate funding streams promote innovation in resilience technologies, from satellite backup systems to advanced battery technologies
  • Geographic diversity requirements: Policies encourage infrastructure deployment in multiple regions to reduce single points of failure

In countries like Estonia, Finland, and Colombia, regulators have taken a mandate-driven approach, setting technical requirements operators must meet:

  • Independent power source requirements: Regulations specify minimum battery backup duration and geographic coverage for critical network components
  • Emergency power unit standards: Technical specifications ensure backup systems can actually maintain service during extended outages
  • Essential component resilience: Regulatory standards in all three countries require critical network infrastructure to withstand specific types of disruptions (like extended power loss, physical damage, or cyber incidents)

Japan has focused on disaster preparedness, investing in satellite-based backup systems and supporting technologies suited to a country prone to earthquakes and severe weather:

  • Satellite backup integration: Policies encourage operators to deploy satellite connectivity as a safeguard during large-scale disasters like earthquakes
  • Targeted technology investment: Policymakers support research into backup solutions such as low Earth orbit (LEO) satellites, drones, and ships acting as base stations and alternative power systems to ensure continuity in disaster-prone regions

These examples show that there’s no single blueprint for resilience. Funding, mandates, and targeted technology programs can all play a role. What matters is aligning policy tools with national vulnerabilities, while recognizing that outages rarely stop at borders. The strongest results come when technical standards, public investment, and innovation work together to keep networks running through disruption.

Supply Chain Resilience: Managing Dependencies You Don’t Control

Supply chain resilience has become a pressing challenge as organizations move away from running every system in-house. With digital transformation, much of that control has shifted to cloud platforms, managed service providers, and software vendors. The change brings flexibility and scale, but it also creates a web of dependencies that are hard to map in normal times and nearly impossible to control during a major outage.

Effective supply chain risk management requires systematic ways to understand and manage the dependencies created by cloud providers, managed services, and third-party software vendors:

  • Due diligence frameworks: Organizations must assess cybersecurity practices, business continuity plans, and resilience capabilities of critical suppliers before committing to rely on them
  • Contractual accountability measures: Service level agreements (SLAs) need specific resilience metrics and clear remediation requirements, not just general availability targets
  • Ongoing measurement and monitoring: Organizations should regularly assess supplier performance against agreed standards, including tests of backup procedures and incident response capabilities
  • Cascading requirements: Suppliers should demonstrate that they hold their own critical vendors to the same resilience standards, extending accountability throughout the supply chain

During the CrowdStrike incident, affected organizations couldn’t simply point to their software vendor; instead, they had to manage customer impacts even though the root cause was completely outside their control. Modern supply chain resilience requires organizations to plan for failures in dependencies they cannot directly control while maintaining clear accountability for service delivery.

Building Networks That Bend Without Breaking

Network resilience has evolved from an operational concern to a strategic imperative that affects entire economies and societies. Recent major outages, whether caused by power grid failures or software incidents, show that traditional approaches centered on individual network components often fail to capture the systemic nature of modern digital infrastructure. 

Building true resilience means preparing for failures across every layer of dependency, including power grids, software supply chains, and international infrastructure connections. The most effective strategies combine technical investments, policy frameworks, and organizational preparation. MEO’s performance during the Iberian power crisis illustrates how battery deployment and core network protection can reduce impacts, while national policies that pair funding, standards, and international coordination address challenges no single operator can solve alone.

Future resilience will depend on recognizing that no organization controls every factor affecting service reliability. Networks that bend without breaking require preparation, investment, and coordination, and recent events show these efforts can sharply reduce the human and economic costs when disruptions inevitably occur.

To explore the economic and operational stakes of major disruptions, read our white paper, The Cost of Downtime: A Guide to Proactive Outage Management. And for strategies organizations are using to improve resilience, watch our on-demand webinar, Navigating Disruption: Best Practices for Resilient Digital Infrastructure.

Ookla retains ownership of this article including all of the intellectual property rights, data, content graphs and analysis. This article may not be quoted, reproduced, distributed or published for any commercial purpose without prior consent. Members of the press and others using the findings in this article for non-commercial purposes are welcome to publicly share and link to report information with attribution to Ookla.