| February 13, 2023

mmWave Clocks Gigabit Speeds in the U.S. but Lacks Maturity Elsewhere

In this article, we will look at the real-life performance of mmWave in the United States, reflect on its progress so far across the globe, and discuss what the future holds.

Key takeaways

  • mmWave received additional spectrum as part of Release 17, in addition to the spectrum already allocated by Rel-15 and WRC-19. 5G connectivity using mmWave substantially improves 5G performance (increasing theoretical speeds to up to 5 Gbps). At the same time, it comes with a challenge because of its limited range, which can be easily blocked or obscured, necessitating a high degree of network densification, which comes with additional Capex. 
  • After initial enthusiasm, operators’ appetite for the mmWave band spectrum has been lackluster, with only two auctions taking place in 2022. However, we see a renewed interest, which could lead to more spectrum allocations and network launches. 
  • Due to the limited rollout of mmWave 5G networks, the device ecosystem has lagged behind other 5G spectrum bands. While support for mmWave spectrum bands across smartphones is skewed heavily towards the  U.S., an increase in spectrum launches and networks combined with a declining ASP should lead to a growing adoption worldwide. 
  • Ookla® Q4 2022 data from the U.S. shows mmWave is achieving mind blowing speeds — almost 1.6 Gbps median 5G download speed — 26 times faster than the median 5G speed on low-band, almost seven times faster than the C-band, and four times than mid-band. 
  • RootMetrics® tested mmWave performance simulating congested network environments and concluded that even in such conditions, mmWave spectrum could achieve four times faster throughput than mid- and low-band spectrum.

mmWave spectrum allocation and commercialization 

Oftentimes, consumers complain about 5G speeds, sold on the promise of ultra-fast mobile networks. Such speeds can only be delivered utilizing the mmWave spectrum band. Up until and including 4G LTE, operators have been deploying networks in the sub-6 GHz spectrum. It was only with Release 15 that the telecom standards body 3GPP extended the spectrum ranges available for mobile networks. Frequency bands for 5G New Radio (NR) are separated into two frequency ranges: 

  • Frequency Range 1 (FR1) refers to sub-6 GHz frequency bands, traditionally used by previous network generations, which have been further extended to cover potential new spectrum offerings from 410 MHz to 7125 MHz.
  • Frequency Range 2 (FR2) refers to frequencies above 24 GHz.
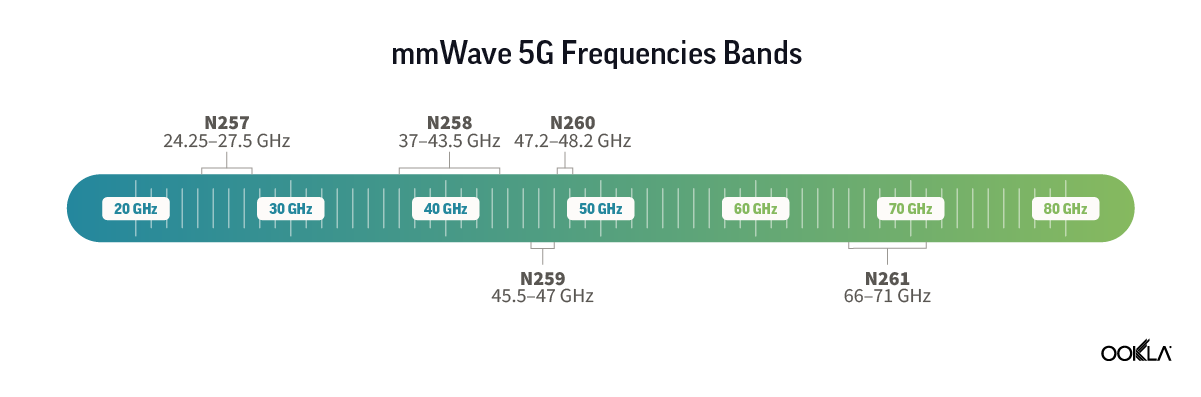
Chart of mmWave 5G frequency bands

Furthermore, in November 2019, delegates of the World Radiocommunication Conference (WRC-19) identified additional radio frequency bands for IMT-2020 (the name ITU uses for 5G standards). These frequency bands are 24.25-27.5 GHz, 37-43.5 GHz, 45.5-47 GHz, 47.2-48.2, and 66-71 GHz. 3GPP’s recently completed Release 17 has further expanded the mmWave spectrum frequency range from 24.25-52.6 GHz up to 71 GHz, including support for the global 60 GHz unlicensed band.

So far, mmWave spectrum allocation has been lackluster across Europe, following initial enthusiasm in the U.S., Japan, and South Korea. According to Global Mobile Suppliers Association (GSA), 26 countries have licensed mmWave worldwide. In 2022, only two auctions took place in India and Spain in the 26 GHz frequency band. The Indian auction itself was a subject of intense debate and lobbying against its allocation in the 28 GHz band by the satellite providers. The regulator auctioned the 26 GHz band to minimize overlaps and interference issues.
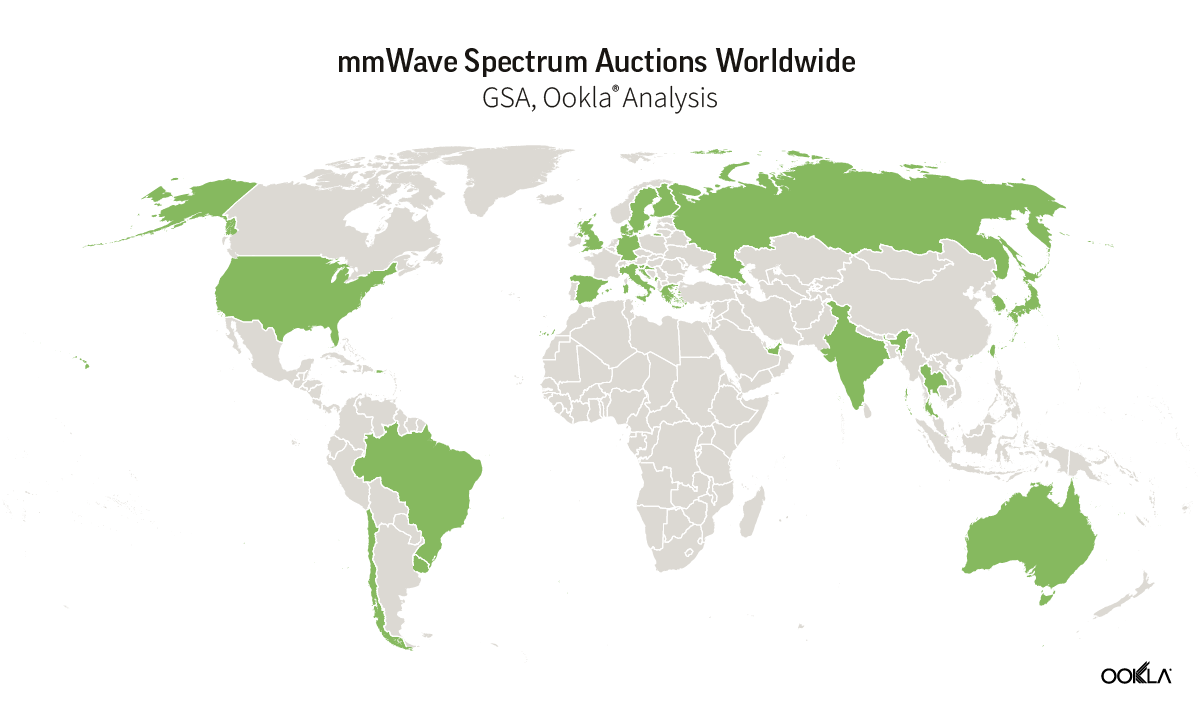
Map of mmWave spectrum auctions worldwide

However, the momentum for mmWave spectrum allocations is growing, especially in Europe. While 14 countries in Europe have licensed mmWave so far, more are planning to do so e.g., Hungary, Austria, and the United Kingdom, which should lead to more deployments and create economies of scale that the mmWave device ecosystem currently lacks. 

Beyond consumers, mmWave can address the needs of enterprise applications that require higher bandwidth and lower latency, such as factory robots or AGVs. For example, Italian manufacturer Exor International partnered with Intel, TIM, and JMA Wireless to build an end-to-end smart factory in Verona to showcase the benefits that Industry 4.0 brings to manufacturing utilizing sub-6 GHz and 26 GHz spectrum. It is worth noting that several regulators have created an encouraging environment for enterprises to deploy their own dedicated networks by allocating spectrum for vertical use across mid- and high-frequency bands. So far, ten countries have set aside mmWave spectrum for enterprises, including Australia, Denmark, Germany, Greece, Japan, Hong Kong, Finland, Sweden, South Korea, and the U.K. Japanese Fujitsu deployed a private 5G network combining 4.7 GHz SA and 28 GHz. 

The growing pains of the mmWave device ecosystem 

The South Korean example offers a cautionary tale regarding 5G mmWave readiness.

In 2018, three operators — SK, KT, and LG U+ — spent 620 billion Won ($435 million) on a five-year license for the 28 GHz spectrum. As part of the license conditions, operators had to deploy 15,000 base stations by the end of 2021. Following an audit by the Ministry of Science and IT (MSIT), KT and LGU+ had their licenses revoked, and SK Telecom was reduced by six months. One key challenge operators pointed to was the need for a mature mmWave devices ecosystem in the market.

Looking at the latest GSA data, this is indeed the case. Across the commercially available 5G devices that GSA has identified spectrum support information, most devices (85.7%) support the sub-6GHz band and only 8.9% mmWave spectrum.
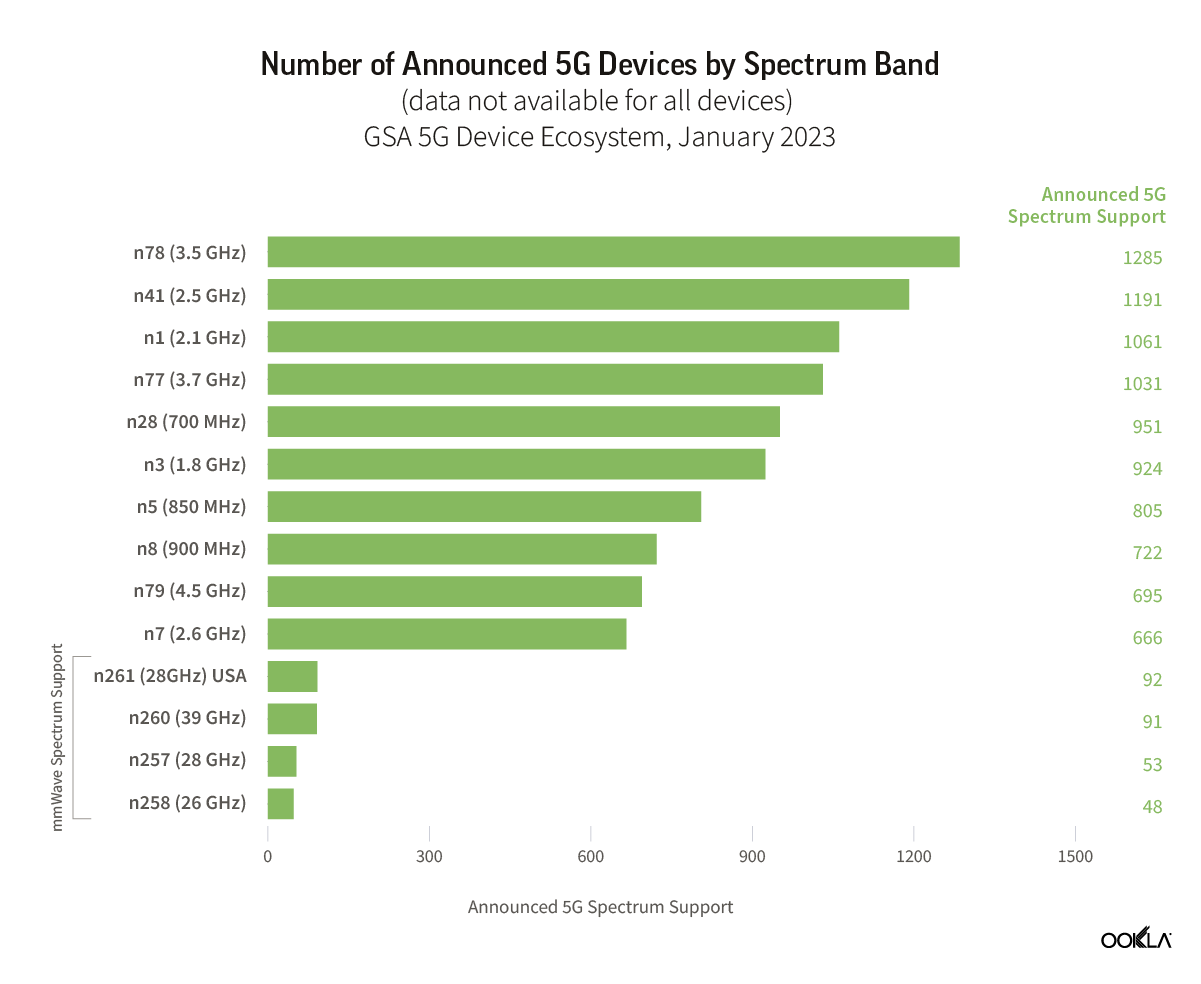
Chart of number of announced 5G devices by spectrum band

However, mmWave device availability differs depending on the geography with smartphone availability heavily skewed to the U.S. For instance, all ‌iPhone 12‌-14 models in the U.S. support both mmWave and sub–6 GHz 5G connectivity; this was not the case in South Korea. Across Android-based smartphones, the story is similar. The Pixel 6 Pro includes mmWave 5G support only in the U.S., Australia, and Japan. There is also a price difference across devices that offer support for mmWave. For example, Google Pixel 6 is available in two versions in the U.S. — an unlocked version with sub-6 GHz 5G for $599 and another with mmWave 5G for $699. The latter is offered via operators such as Verizon and AT&T. The price difference is likely due to the mmWave requirement for specialized radio hardware and antennas. Yet, on average, the price delta between sub-6 GHz and mmWave smartphones is narrowing down to $10- $20, Counterpoint Research shows. 

Furthermore, Counterpoint sees consumer awareness and adoption growing in the U.S. According to its U.S. smartphone users survey, 60% of users checked before purchasing whether a 5G Smartphone has 5G mmWave capability, while 43% of users in the future plan to subscribe to 5G mmWave services and smartphones. Beyond the U.S., Counterpoint sees one billion cumulative 5G mmWave smartphone shipments between 2019 and 2026, with mmWave smartphone penetration reaching 26% by 2026, compared to 13% in 2022.

mmWave supports FWA 

Fixed Wireless Access (FWA) is often considered one of the most successful 5G use cases as we recently pointed out. Some operators leverage mmWave to offer FWA services, for example, in April 2022, US Cellular launched 5G Home Internet using mmWave spectrum (28 GHz and 39 GHz) in partnership with Qualcomm and Inseego across ten cities. In Italy, Fastweb collaborated with Qualcomm to commercialize 5G SA mmWave services in March 2022, following a partnership to deliver 5G FWA to 400 cities. Vendors are vying to address this opportunity too. Recently, Mavenir launched an FWA solution that supports massive MIMO and 5G mmWave for 4G, 5G NSA, and 5G SA deployments. This FWA platform has been deployed by several customers, such as 360 Communications, RINA Wireless, Triangle Communications in the U.S., and Quickline in the U.K. 

mmWave delivers on the promise of gigabit speeds 

The U.S. is a global leader in using mmWave spectrum, with AT&T, T-Mobile, and Verizon using mmWave to offer mobile service, while US Cellular deploys it for FWA. Speedtest Intelligence® data shows that 5G connectivity using mmWave can reach staggering speeds of up to 1.6 Gbps. Comparing 5G performance across spectrum bands across mobile operators in the U.S. used for 5G services low-, mid-, C-band, and high-band (mmWave) it is clear that mmWave delivers superior performance. Our data shows that users on 5G mmWave achieved speeds that are 4.29 times faster than mid-band, 6.86 times faster than C-band, and a staggering 26.1 times faster than a low band.
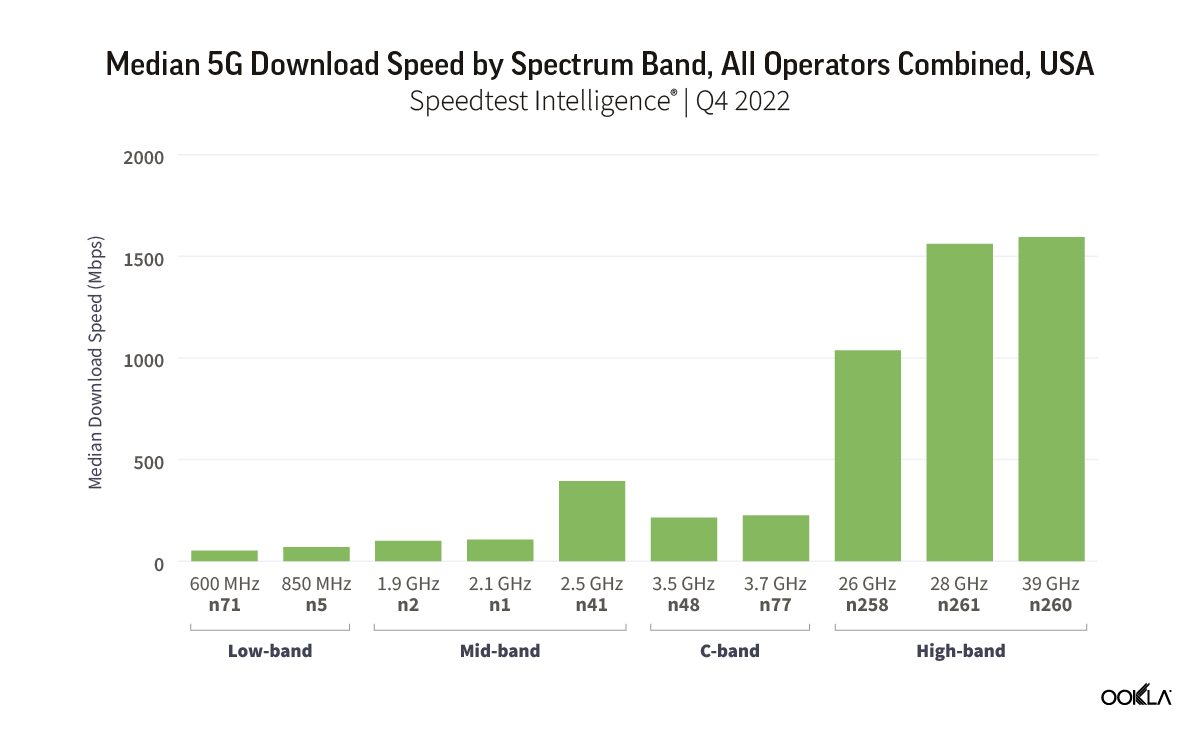
Chart of median 5G download speed by spectrum band in the US

Due to its high throughput, mmWave is particularly useful for streaming and gaming. For example, at CES 2023, Razer unveiled its new Razer Edge, the first Android handheld gaming tablet on the market. The device can play games locally on the device or stream them remotely via 5G. The Razer Edge 5G became available from Verizon on January 26. 

Mmwave also offers the advantage of lower latency — anything over 20 ms will give gamers a headache, according to Qualcomm

mmWave helps with network congestion too 

Speaking at the Citi 2023 Communications, Media & Entertainment conference, Kyle Malady — Verizon’s Executive VP, President of Global Networks & Technology, noted that the operator has deployed over 40,000 mmWave nodes, which support its 5G services in dense, urban environments. He also stated, “And now that millimeter wave technology turns into a tool for RF engineers to use in hotspots that they have and C-Band.” 

A RootMetrics study supports this, based on several tests conducted in December 2021 to simulate the performance of the 5G spectrum in a congested environment. While, unsurprisingly, the results showed speeds in congested environments were slower on all bands than when congestion wasn’t present, there was a difference when it came to bands in use: mmWave 5G delivered a median download speed of 231.40 Mbps, which was over four times faster than the speeds recorded on either mid-band or low-band 5G, both of which were below 50 Mbps (44.80 Mbps on mid-band and 49.50 Mbps on low-band). To put mmWave’s capacity boost in a different perspective, its speed of 231.40 Mbps with congestion was nearly as fast as the 256.80 Mbps recorded on mid-band 5G without congestion. RootMetrics’ study showed that mmWave provides speeds 4-5 times faster than those of mid- and low-band in congested circumstances, delivering on its promise of providing greater capacity and faster speeds under heavy network load. 
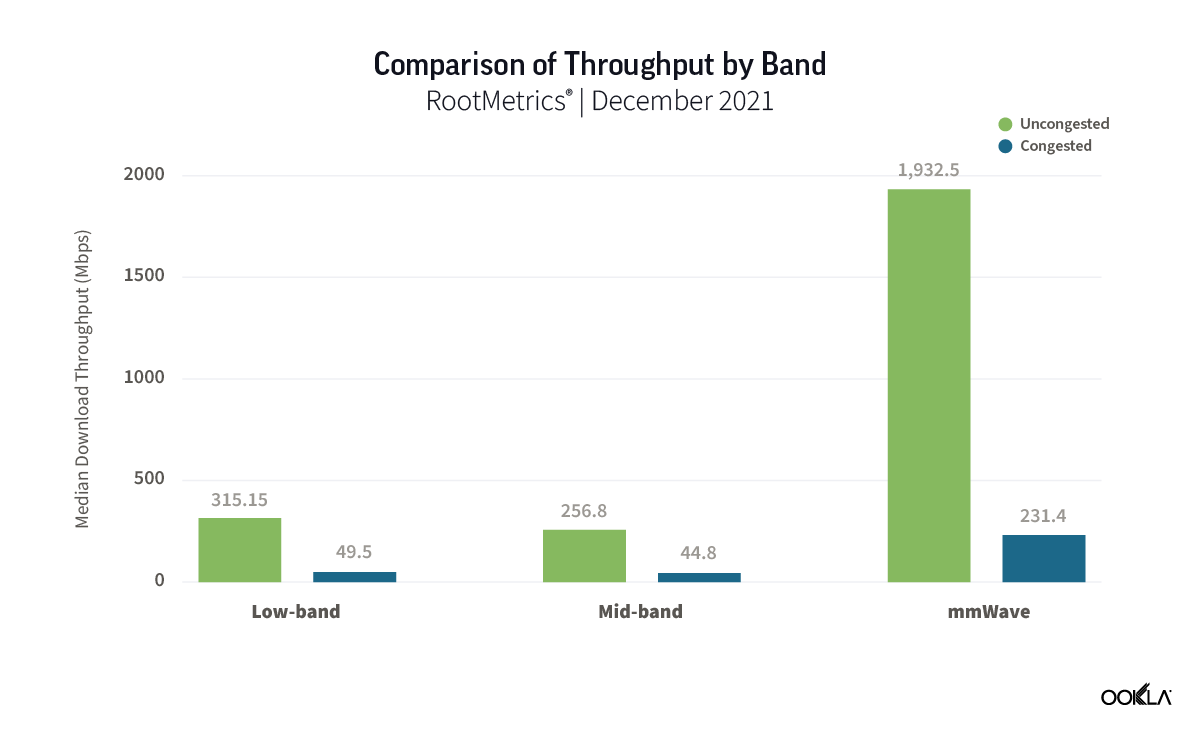
Chart of comparison of throughput by band

Millimeter wave also lends additional capacity in dense areas such as stadiums. Poor performance during events such as concerts stems from the networks needing to deal with extra demand and becoming congested. Constraints on the spectrum allocated to 5G today can impact performance more in places like stadiums than in other areas because many users are concentrated in a small space and share the same limited spectrum. To illustrate how mmWave enables better network performance, we can look to Ookla Wind® walk testing data, which can show the benefits of mmWave in terms of 5G bandwidth. Since each carrier is 100 MHz wide, a test showed that a stadium used four carriers aggregated 80% of the time, which resulted in 400 MHz of 5G bandwidth. In turn, this helped to achieve higher 5G capacity and lower latency. 
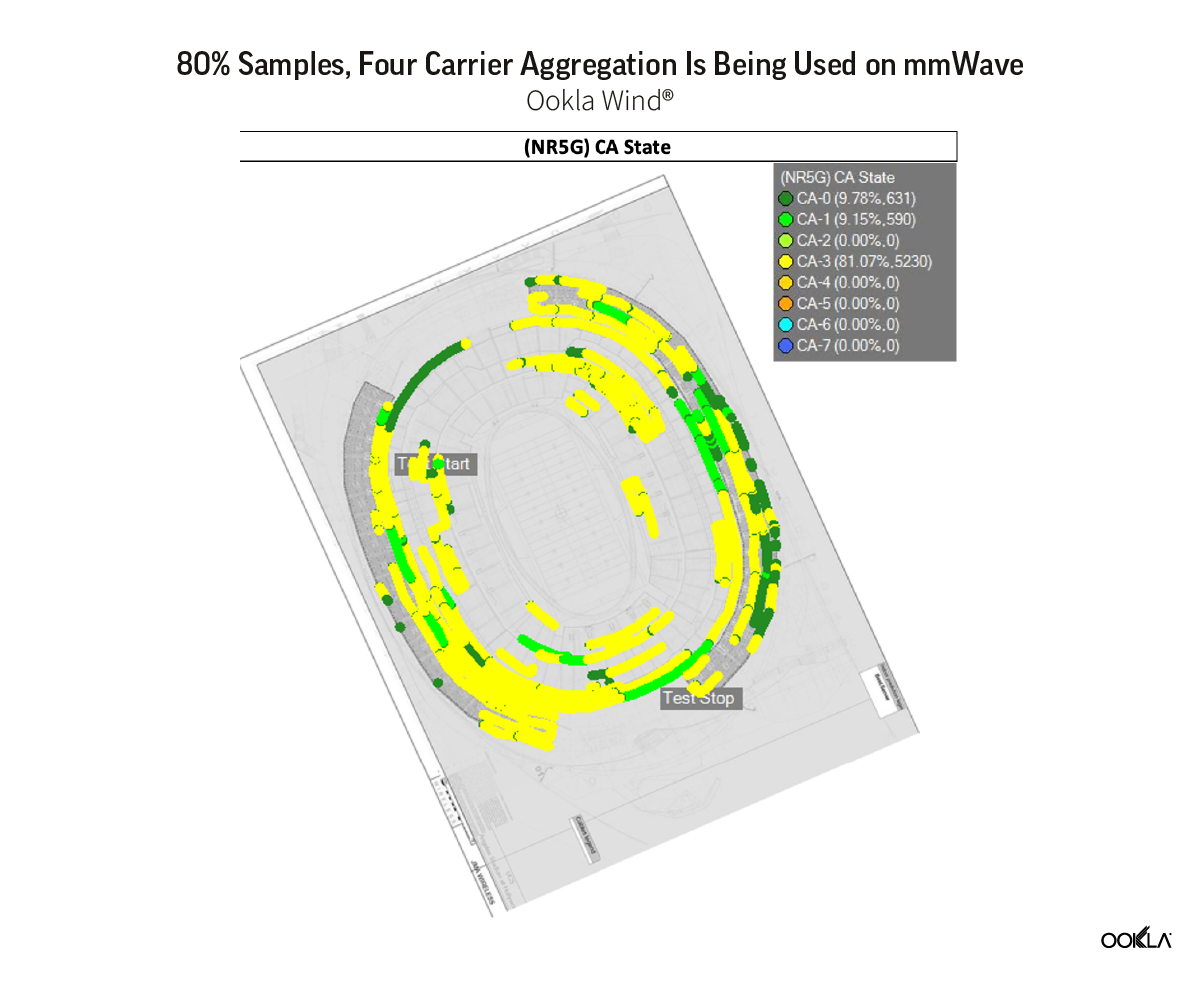
Illustration of 80% samples, four Carrier Aggregation is being used on mmWave

Another benefit of mmWave that the Wind test showed is that with the mmWave 5G NSA network, most of the user data traffic is carried by mmWave spectrum only (contrary to other 5G bands in NSA). This reduces the load on the LTE network. This, in turn, allows legacy users with non-5G capable devices to use an LTE network that is less congested because it doesn’t have to support 5G devices as well. 

We will examine the relationship between spectrum and 5G performance in future articles. Subscribe to Ookla Research to stay up to date on our analyses. 

Ookla retains ownership of this article including all of the intellectual property rights, data, content graphs and analysis. This article may not be quoted, reproduced, distributed or published for any commercial purpose without prior consent. Members of the press and others using the findings in this article for non-commercial purposes are welcome to publicly share and link to report information with attribution to Ookla.

| September 24, 2025

Level Up: Cable Providers Are Improving Uplink Speeds 

Charter, Comcast, Rogers, others show off step-change performance improvements

Cable is in a pitched battle for broadband subscribers in the U.S.. It has been losing. On one side of cable, fixed wireless access (FWA) from mobile providers, with its “good enough” value proposition, has captured the bulk of broadband customers growth the past three years. On cable’s other flank, fiber-to-the-home (FTTH) outperforms cable, according to Ookla’s Speedtest® Connectivity Report for the United States in H1 2025, and fiber providers are holding their ground on subscribers. 

What’s cable to do? Fight back. Cable operators are deploying newer cable technology and reallocating frequency bands to differentiate their performance from FWA and close the gap with fiber, particularly in uplink speed and latency. The jargon of these efforts includes terms like DOCSIS 3.1, DOCSIS 4.0, mid-splits, and high-splits.

Key takeaways

  • The upgrades are real and consumers can tell. Speedtest Intelligence® data confirms that major cable operators are actively upgrading their networks. The fingerprint of these upgrades is a clear, often multi-step, increase in median upload speeds, which is visible in market-by-market data from 2024 to 2025.
  • Divergent strategies in the U.S. Operators are taking different paths. Comcast is pursuing a broad, nationwide rising tide mid-split upgrade to prepare its entire footprint for DOCSIS 4.0, with upload speed improvement everywhere. Charter is executing targeted, high-impact “surgical strikes” with high-split upgrades in specific markets yielding dramatic speed leaps. 
  • In Canada Rogers showcases two systems. The legacy Shaw network in Western Canada was already upgraded, while Rogers is now actively bringing its Eastern Canada footprint up to that same high standard, creating a harmonized, next-generation network.
  • The path forward. These mid-split and high-split upgrades are not the final destination but the crucial foundation. They re-engineer the network’s capacity, paving the way for the symmetrical, multi-gigabit speeds promised by DOCSIS 4.0.

Methodology

Using Ookla’s Speedtest® Intelligence data, we analyzed the performance of U.S. and Canadian cable providers, looking for evidence of these deployments. In particular, we  focused on changes in median uplink speed, year-over-year, from Q2 2024 to Q2 2025 across each provider’s larger markets. This analysis revealed a shift in upstream capacity that is a result of  of migrating from  a legacy “sub-split” architecture to the more advanced “mid-split” or “high-split” configurations that are part of the DOCSIS 3.1 cable standard and prepare the network for the DOCSIS 4.0 standard.

What are DOCSIS and Splits?

Data Over Cable Service Interface Specification (DOCSIS) is a telecommunications standard for high-bandwidth data transfer across cable television systems. The technology was initially optimized for downlink traffic to deliver television programming. With the rise of cable broadband, uplink capabilities were introduced to support interactivity.

Splits refers to how much spectrum is allocated to upstream traffic (splitting the spectrum between uplink and downlink). The sub-split upstream path is 37 MHz wide; mid-split upstream path is more than double that at 80 MHz wide; and high-split upstream path is nearly 200 MHz wide. There are technology and investment trade-offs between a mid-split and high-split deployment strategy, but fundamentally a wider path provides faster upload speeds, foreshadowing the results of this analysis.

Today, competitive pressure from fiber for faster, symmetrical speeds and lower latency is pushing cable technology forward. At the same time, consumer demand for high-performance gaming, seamless video conferencing, and content creator streaming is pulling the technology to evolve.


United States

Comcast (Xfinity)

The Speedtest user data provides a clear picture of a nationwide network upgrade and a successful rollout of mid-split architecture across Comcast’s footprint. Unlike the market-by-market approach seen with other providers, our data for Comcast suggests a sweeping, uniform upgrade program that has boosted median upload performance for customers across the country. This is a foundational step that directly supports Comcast’s DOCSIS 4.0 strategy and is a key element of its Project Genesis network initiative.

The nationwide mid-split upgrade

In Q2 2024, nearly every city examined showed a median upload speed in the ~23-24 Mbps range, the signature of a network operating on a narrow frequency band of a legacy sub-split architecture.

By Q2 2025, the picture had completely changed. Almost every market showed a jump in median upload speed to the ~40-42 Mbps range, an increase of roughly 75-80%. This is the fingerprint of a mid-split upgrade, which expands the upstream spectrum. This upgrade not only provides an immediate boost to upload speeds for DOCSIS 3.1 customers, but also reconfigures the network for DOCSIS 4.0 technology.

Here is a sample of representative markets demonstrating this consistent upgrade:

CityQ2 2024 Upload (Mbps)Q2 2025 Upload (Mbps)Change
Chicago, IL23.5440.06+70%
Denver, CO23.8342.03+76%
Houston, TX23.7641.40+74%
Seattle, WA23.9843.56+82%
Washington, DC23.6340.54+72%
San Francisco, CA23.4138.43+64%

A first glimpse of Comcast DOCSIS 4.0?

While the mid-split upgrade is impressive in its breadth, the data for one city stands out:

  • Colorado Springs, CO: 36.42 Mbps -> 63.86 Mbps

Colorado Springs’ Q2 2024 starting point was already higher than others, suggesting it was an early recipient of the mid-split. The subsequent jump to nearly 64 Mbps by Q2 2025 deviates from the ~40 Mbps norm seen elsewhere and could be early evidence of Comcast’s DOCSIS 4.0 deployment. In late 2023, Comcast announced Colorado Springs as one of its first three launch markets for “X-Class” symmetrical multi-gigabit speeds, along with select areas of Atlanta and Philadelphia. The higher median upload speed in Colorado Springs indicates that a growing number of customers adopting DOCSIS 4.0, lifting the city-wide median beyond what a mid-split upgrade alone can provide.

The other X-Class initial launch markets, Atlanta (41.40 Mbps) and Philadelphia (40.09 Mbps), still fall in line with the standard mid-split results for now, which is expected given the limited “select areas” footprint of the DOCSIS 4.0 rollout in these markets, per Comcast’s press release.

Comcast is preparing its entire network to compete head-on with fiber and FWA by lifting all boats with a mid-split and then by launching a new class of multi-gig symmetrical service.


Charter (Spectrum)

Speedtest Intelligence data from Q2 2024 to Q2 2025 reveals a targeted and significant deployment of high-split network upgrades in specific markets, aligning with Charter’s publicly stated network evolution plans.

Upgraded markets: the high-split transformation

In several key metropolitan areas, the jump in median upload speed between 2024 and 2025 was a transformative leap, often by a factor of 5x to 9x. This is the definitive signature of a high-split upgrade, which reallocates spectrum to create a much larger pathway for upstream traffic.

CityQ2 2024 Upload (Mbps)Q2 2025 Upload (Mbps)Change
Arlington, TX20.51152.07+641%
Dallas, TX17.27158.42+817%
Fort Worth, TX20.67174.06+742%
Frisco, TX23.43200.35+755%
Irving, TX21.05177.65+744%
McKinney, TX21.88202.14+824%
Plano, TX21.38107.81+404%
Lexington, KY21.33148.78+597%
Louisville, KY16.86144.31+756%
Reno, NV109.32224.08+105%

The data for the Dallas/Fort Worth metroplex and the Kentucky markets align directly with Charter’s announcements listing them as completed high-split markets. 

Reno, one of the earliest markets to be upgraded, already showed an upload speed over 100 Mbps in Q2 2024. In fact, examining the Speedtest data just prior to our Q2 2024 benchmark, we see that the upgrade came at the same time resulting in a 6x increase from February to June.

Markets awaiting upgrade

The majority of cities in the dataset, including Los Angeles (21.70 Mbps) and New York (21.06 Mbps), showed modest changes, suggesting they still operate on a legacy sub-split architecture. During Charter’s latest earnings call, President and CEO Chris Winfrey stated that “Step 1” of their upgrade plan was complete in approximately 15% of their footprint. This 15% figure suggests that the markets identified in our data with improved speeds are these “Step 1” locations. With 85% of Charter’s footprint remaining and upload speeds potentially ~7x faster, that’s a lot of upside.


Cox

The Speedtest Intelligence data for Cox Communications indicate a slightly more complex story than Charter’s, but with Cox not yet a public company (Charter merger is targeted for mid-2026), there isn’t a lot of publicly available information on the company’s deployment plans.. There appears to be a multi-stage upgrade strategy underway across their national footprint. Some markets are receiving initial mid-split upgrades, others are seeing those mid-splits mature, and a select few are now being pushed even further into high-split territory in preparation for DOCSIS 4.0.

Unlike the binary “upgraded or not” picture we saw with Charter, the changes in median upload speed for Cox reveals three distinct phases of network enhancement.

Phase 1: Initial mid-split deployment (sub-split to mid-split)

In some markets, there is a jump from the legacy sub-split baseline of ~10-15 Mbps, often doubling the median upload speed. This can represent the first step in modernizing the network by expanding the upstream spectrum.

  • Gainesville, FL: 16.47 Mbps -> 34.97 Mbps (+112%)
  • New Orleans, LA: 11.51 Mbps -> 23.76 Mbps (+106%)

These markets may be in the process of being upgraded, providing customers with a noticeable, though not yet final, improvement in upstream performance.

Phase 2: Mid-split maturation

The Speedtest Intelligence data for Cox indicates a multi-stage upgrade strategy with three phases of network enhancement.

  • Phase 1: Initial mid-split deployment. Some markets show a jump from a legacy sub-split baseline, often doubling the median upload speed. For example, Gainesville, FL, increased from 16.47 Mbps to 34.97 Mbps (+112%).
  • Phase 2: Mid-split maturation. Many cities, particularly in Arizona, California, and Nevada, were likely already operating with mid-split architecture in Q2 2024. By Q2 2025, these speeds saw a general uplift, with Phoenix, AZ, moving from 53.71 Mbps to 58.11 Mbps.
  • Phase 3: High-split jump. In several markets, there was a large jump from an already-upgraded mid-split baseline to speeds approaching or exceeding 100 Mbps. This is the clear signature of a high-split upgrade, a prerequisite for Cox’s DOCSIS 4.0 path.
CityQ2 2024 Upload (Mbps)Q2 2025 Upload (Mbps)Change
Buckeye, AZ63.22108.19+71%
Queen Creek, AZ79.80101.71+27%
San Tan Valley, AZ56.9099.30+74%
Goodyear, AZ57.7896.30+67%
Enterprise, NV75.1296.19+28%
North Las Vegas, NV57.8983.96+45%

Cox’s phased approach allows the company to manage its capital expenditures while improving its customer experience along its DOCSIS roadmap.


Altice (Optimum)

Instead of pursuing a comprehensive DOCSIS 4.0 upgrade, Altice is executing a dual-pronged strategy: maximizing its existing DOCSIS 3.1 network while simultaneously building out fiber-to-the-home (FTTH).

Speedtest Intelligence data for Optimum markets shows a network in a steady state. From Texas to New Jersey, median upload speeds remained consistently in the 25-35 Mbps range, with no significant jumps that would indicate mid-split or high-split upgrades. For example, New York, NY, moved from 25.14 Mbps to 29.13 Mbps.

In fact, in its 2Q 2025 earnings report, Altice stated, “Mid-split upgrades on DOCSIS 3.1 network continue, and are expected to enable multi-gig speeds to a portion of HFC passings in 2026.” The company’s goal is to offer multi-gigabit speeds across 65% of its total service area by the end of 2028, using this combination of upgraded cable and new fiber.

Altice is making a calculated decision to invest capital in building new, future-proof fiber in targeted areas, while making more modest, incremental upgrades to their existing cable plant.


Mediacom Communications (Xtream)

Regional provider Mediacom’s network appeared to be operating on a traditional low-split architecture as of Q2 2025. In Q2 2024, median upload speeds were consistently in the ~30-47 Mbps range. By Q2 2025, these speeds saw only minor changes, with Des Moines moving from 39.3 Mbps to 47.7 Mbps. There was no tell-tale jump to 60+ Mbps that would indicate a mid-split deployment.

This data suggests that while Mediacom has announced DOCSIS 4.0 trials, the foundational mid-split or high-split upgrades had not yet been deployed at scale. 

However, in May 2025, Mediacom talked about deploying high-splits in Des Moines. While too early to move the city-wide median in Speedtest data, a number of faster upload speed samples are beginning to appear in the data, signaling that a broader rollout may be imminent.


Canada

Rogers

The Rogers Speedtest data reveals a tale of two networks: the legacy network in Eastern Canada that is being upgraded to the new standard, and the mature, already long-upgraded network in Western Canada (the former Shaw network).

Eastern Canada: the upgrade program

Cities in Rogers’ legacy Eastern Canada footprint show the clear signs of a network in the midst of an upgrade cycle, comparing data for Q2 2024 with Q2 2025:

  • Toronto, ON: 40.01 Mbps – 48.91 Mbps
  • Ottawa, ON: 37.54 Mbps – 51.67 Mbps
  • Mississauga, ON: 44.31 Mbps – 58.06 Mbps
  • Brampton, ON: 47.68 Mbps – 69.69 Mbps
  • Markham, ON: 45.91 Mbps – 75.96 Mbps

These Ontario markets in Q2 2024 demonstrated median upload speeds in the 35-50 Mbps range. While this is better than a legacy sub-split, it may indicate a mid-split deployment that is still in its early stages. The substantial and consistent growth across all these cities by Q2 2025 is the evidence of Rogers bringing its Eastern network up to the capabilities of the West.

Western Canada: the Shaw legacy

In cities that were part of the Shaw network prior to the acquisition, the Q2 2024 data shows a network that was already highly advanced.

  • Calgary, AB: 96.16 Mbps – 137.29 Mbps
  • Winnipeg, MB: 101.07 Mbps – 138.06 Mbps
  • Edmonton, AB: 96.71 Mbps – 125.68 Mbps
  • Vancouver, BC: 87.69 Mbps – 105.91 Mbps

Speedtest data for Q2 2024 for cities like Calgary, Edmonton, and Vancouver already reflected a post-upgrade network, indicating a very mature mid-split network. Shaw was proactive with its network enhancements well before the Rogers acquisition was finalized. According to Shaw’s Principal Network Engineer in October 2021, the company began its mid-split upgrade program back in 2017. By late 2021, more than 90% of that work was already finished, with the entire project slated for completion by early 2022. 

Looking back to this time period in Calgary, Shaw more than tripled the median upload speed in one year:

  • Q2 2021: 19.93 Mbps
  • Q4 2021: 47.97 Mbps
  • Q2 2022: 70.99 Mbps

Calgary stands out as a top performer, which makes sense as it was the former headquarters for Shaw as well as the location for Rogers’ successful DOCSIS 4.0 trial that achieved 1 Gbps upload speeds.

The Rogers data provides an interesting textbook case of a post-merger network integration and upgrade strategy. That is, bringing its Eastern Canada plant up to the mid-split standard already established by Shaw in Western Canada. And, a future strategy directly informed by its technology partnership with Comcast. Rogers is establishing a nationwide mid-split foundation, which is the necessary prerequisite for DOCSIS 4.0 and symmetrical multi-gigabit speeds.


Cogeco

Operating in Ontario and Quebec, Cogeco is employing a market-by-market mid-split upgrade strategy. In Q2 2024, every city examined showed a median upload speed capped at approximately 30-34 Mbps, indicative of a low-split architecture. By Q2 2025, several cities showed a significant jump while others remained unchanged. Upgraded markets include:

  • Oakville: 34.5 Mbps – 70.6 Mbps (+104%)
  • Burlington: 34.2 Mbps – 59.9 Mbps (+75%)

This data provides an example of a phased network evolution. The cities with ~60-70 Mbps upload speeds are where Cogeco has performed the mid-split upgrade, creating the upstream capacity needed to eventually offer the performance of DOCSIS 4.0.


Videotron

Videotron’s performance in Québec and Ottawa reveals a different story. In Q2 2024, median upload speeds were between 34 Mbps and 47 Mbps. By Q2 2025, those speeds saw only a minor increase, with medians sitting between 42 Mbps and 49 Mbps.

The data suggests Videotron operated a high-performing DOCSIS 3.1 network on a traditional low-split architecture as of Q2 2025. This makes Videotron a possible “before” snapshot—a baseline of what a highly optimized low-split DOCSIS 3.1 network looks like just prior to initiating the mid-split or high-split evolution.


Summing uplink

The evidence from Speedtest Intelligence is that the cable industry in the U.S. and Canada is not standing still. Faced with fierce competition, operators are making significant commitments to evolve their cable networks. However, they are not all following the same blueprint.

The data reveals a strategic divergence. On one path, operators like Comcast and Charter are going all-in on DOCSIS, betting that multi-billion-dollar upgrades can extend the life of their networks for another decade and allow them to compete head-on with fiber. Yet even they differ in tactics, with Comcast pursuing a broad, foundational upgrade while Charter executes targeted, high-impact deployments.

On another path, operators like Altice in the U.S. and another operator in Mexico (examined in this research, though not presented here) are hedging their bets. They are choosing to invest capital in building new, future-proof fiber networks while performing more modest, incremental upgrades to their existing cable plants. This two-tiered approach suggests a financial calculation that, in some areas, a full DOCSIS 4.0 upgrade is less attractive than a long-term fiber overbuild.

These upgrades represent the most significant architectural change to the cable network in over a decade. They are the essential groundwork for DOCSIS 4.0, which promises to finally deliver the symmetrical, multi-gigabit speeds needed to achieve performance parity with fiber. The question is not if cable will respond to its competitors, but how effectively and how quickly. Can DOCSIS technologies truly compete with the speed of light?


Ookla retains ownership of this article including all of the intellectual property rights, data, content graphs and analysis. This article may not be quoted, reproduced, distributed or published for any commercial purpose without prior consent. Members of the press and others using the findings in this article for non-commercial purposes are welcome to publicly share and link to report information with attribution to Ookla.

| July 28, 2021

Introducing the Speedtest Mobile SDK

We are excited to announce that the Speedtest SDK™ is now available for both iOS and Android applications. The new Speedtest Mobile SDK allows providers to integrate Speedtest® into their mobile applications with a fully custom user interface. With Speedtest results delivered directly into your application, you can immediately surface network performance insights to your customer care team, network operations center and other key stakeholders.

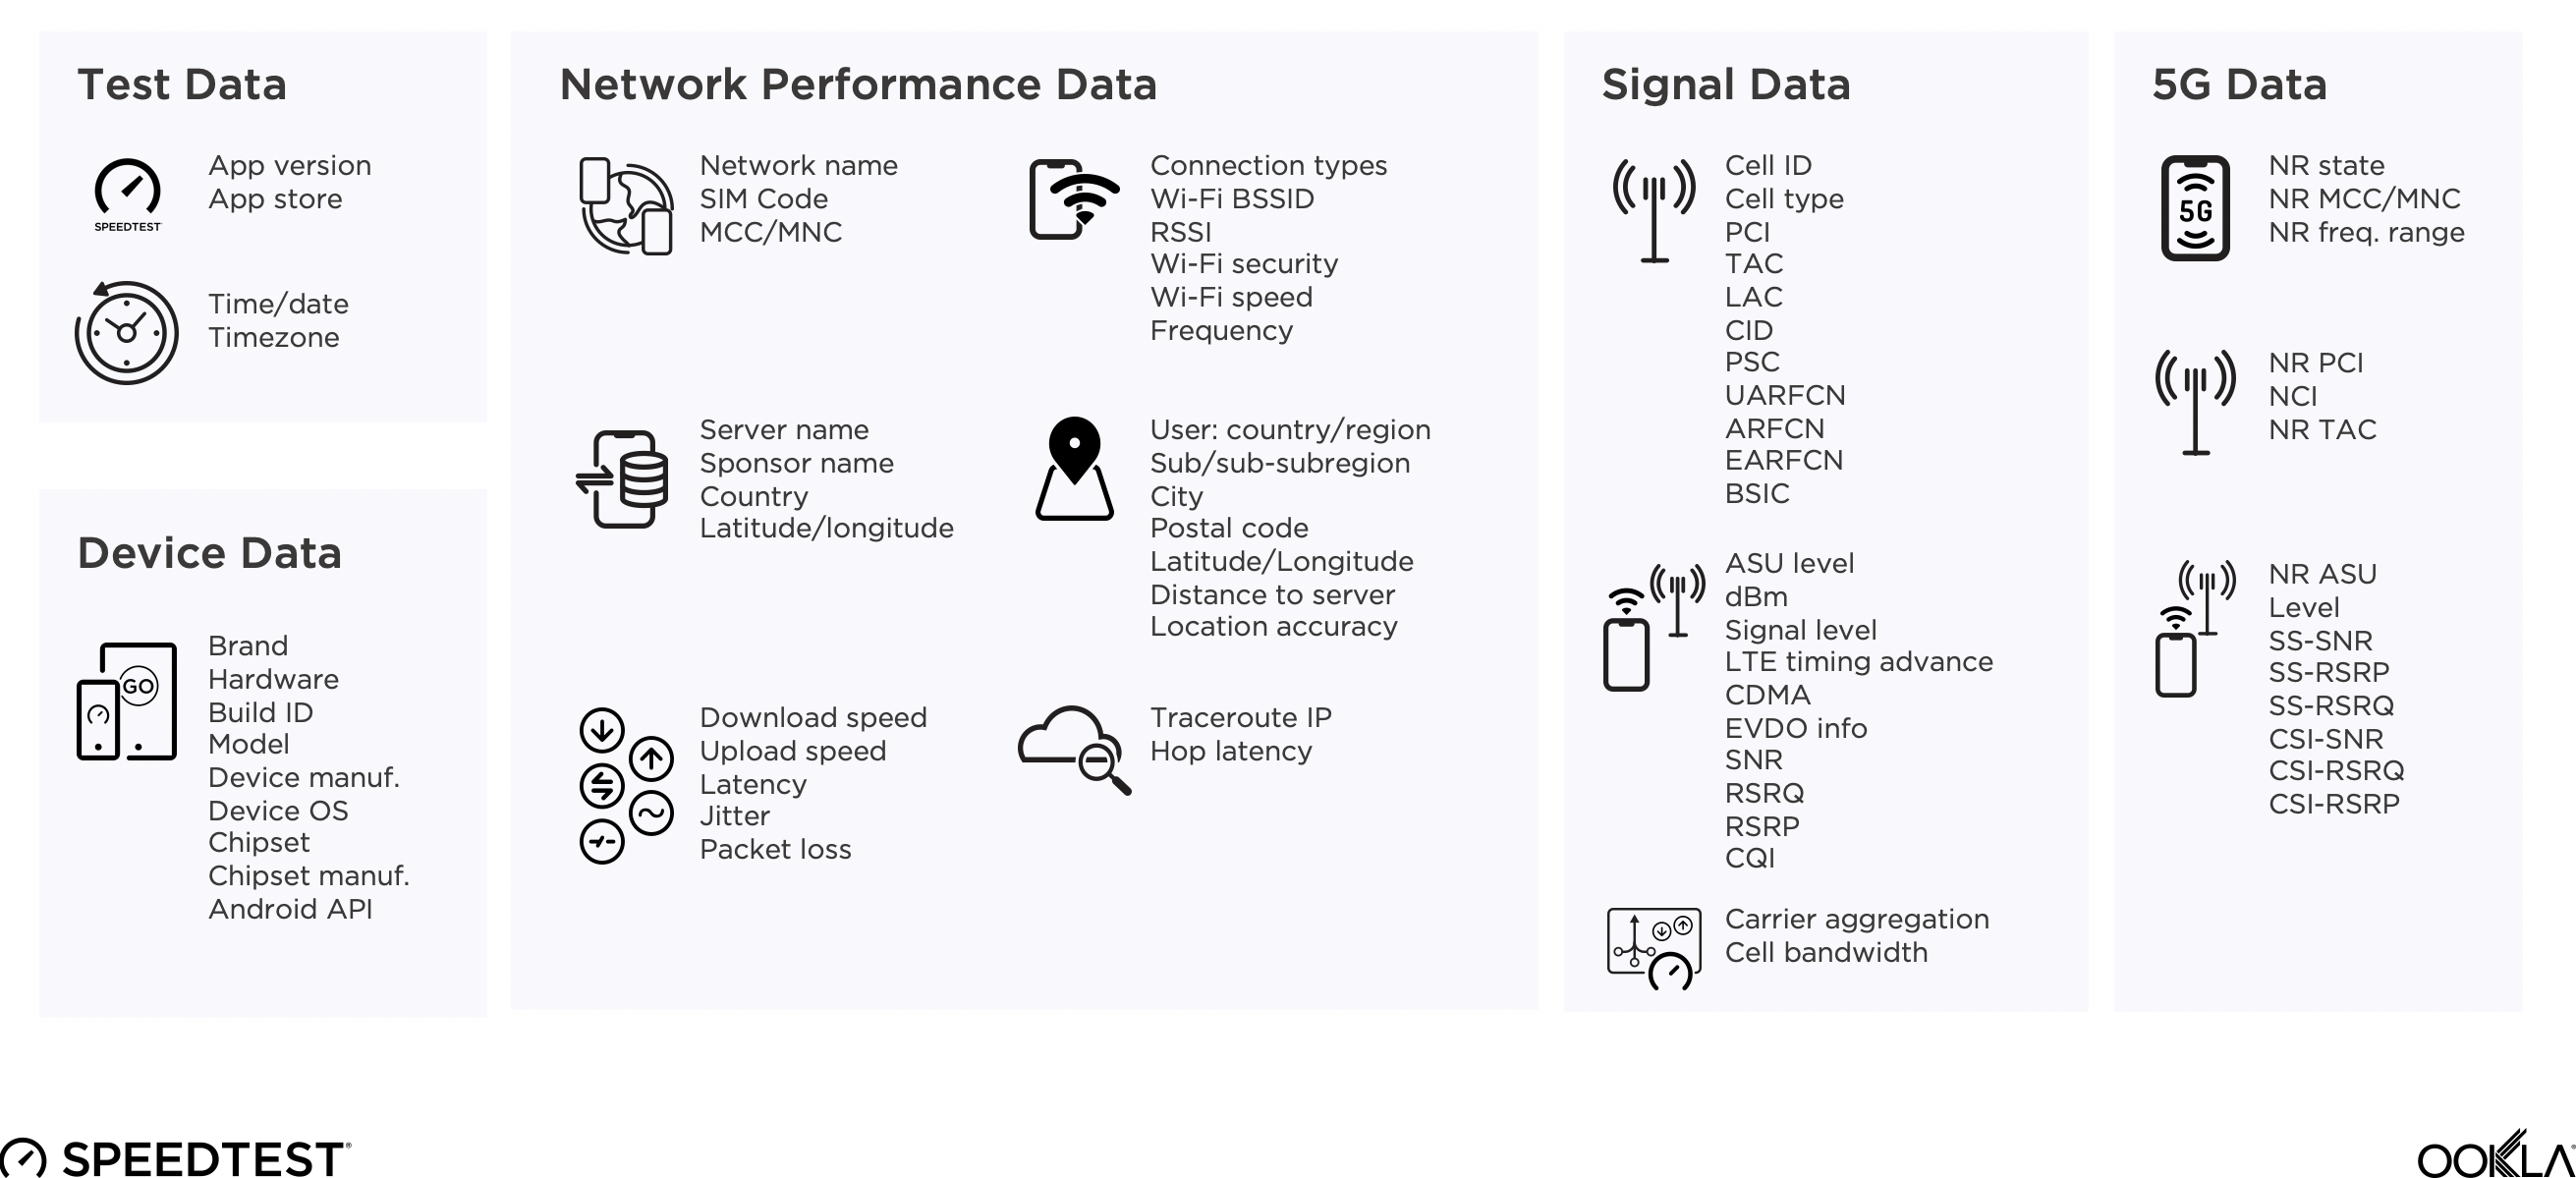
Joining the Speedtest Web SDK in our suite of Speedtest Powered™ solutions, the Mobile SDK provides even more rich insights about mobile network conditions, signal metrics, device information and other data. With Speedtest integrated directly into your mobile applications, you can more easily diagnose customer issues and make network improvements.

A world-class consumer testing experience

Speedtest is the name consumers across the globe trust when they need to better understand the performance and quality of their internet connections. Daily, Speedtest is used over 10 million times for unbiased network performance data, and over 35 billion tests have been taken with Speedtest to date.

Our industry-leading methodology makes Speedtest the most reliable tool for measuring internet performance and providing network diagnostics. The Speedtest Mobile SDK allows providers to integrate this same robust, accurate testing experience into their mobile applications.

Seamless integration, highly configurable testing

The Speedtest Mobile SDK allows you to install Speedtest as the testing solution into your Android or iOS app. It integrates seamlessly into your custom UI and offers configuration over test stages, signal scan triggers and data delivery.

The Speedtest Mobile SDK measures over 200 potential test and performance data elements to help you understand and improve your network. The Android SDK includes background signal scans, which provide additional data about LTE and 5G signal level and quality. All data elements can be delivered via extract, CSV file, JSON or real-time feeds.

mobile-sdk-image-1

Get actionable insight into network performance

Enterprises can use the Speedtest Mobile SDK to better understand the network performance experience of their remote staff and customers. The Speedtest data collected within your app can help you:

  • Troubleshoot individual problems
  • Identify problem hotspots and potential solutions
  • Improve a customer’s call with customer care
  • Save money on field support costs
  • Prevent customer churn on a case-by-case basis

On a larger scale, Speedtest data can help you analyze trends in network performance so that you can plan and validate network improvements – helping you build a better network for the long-term satisfaction of your customers.

Inquire about the Speedtest Mobile SDK today to learn how you can join leading network operators around the world in integrating Speedtest into your mobile applications.

Ookla retains ownership of this article including all of the intellectual property rights, data, content graphs and analysis. This article may not be quoted, reproduced, distributed or published for any commercial purpose without prior consent. Members of the press and others using the findings in this article for non-commercial purposes are welcome to publicly share and link to report information with attribution to Ookla.

| September 18, 2025

Boost Mobile: What the U.S. is Losing

The operator’s network covers a number of major U.S. cities and offers speeds slightly slower than what other 5G providers supply.

EchoStar, the company behind Boost Mobile, is planning to decommission portions of its wireless network following its recent deals with AT&T and SpaceX. Here’s a look at some of the capabilities of that network before it passes into history.

Key Takeaways:

  • Based on Ookla Speedtest Intelligence® data, EchoStar’s Boost Mobile network provided 5G median download speeds that were slightly slower than those of its rivals, including AT&T, Verizon and T-Mobile.
  • In Ookla RootMetrics® drive tests, Boost phones connected to the company’s wireless network around 83% of the time in U.S. metropolitan areas. In locations where they did not connect to the Boost Mobile network, they primarily connected to AT&T’s network.
  • Boost phones used EchoStar’s 600 MHz spectrum 86.8% of the time when they weren’t roaming, making that band the company’s most-used spectrum band.
  • Boost phones connected to at least 50 MHz of overall spectrum capacity in roughly half of all tests. In comparison, Boost’s rivals have deployed much more overall spectrum.

Boost Mobile Speeds are Below the U.S. Average

Dish Network – what is today EchoStar – purchased 9 million Boost Mobile customers in 2019 as part of a deal with T-Mobile and the U.S. Department of Justice.

Under that agreement, EchoStar was required to build a nationwide wireless network. The goal was to have EchoStar replace Sprint as the fourth nationwide wireless provider in the U.S.

In the years since that deal, EchoStar built a network covering roughly 80% of the U.S. population. EchoStar’s network also uses innovative open Radio Access Network (O-RAN) configurations and novel vendors including Amazon Web Services (AWS).

But now that effort is done.

“The Dish Mobile experiment is over,” wrote the financial analysts at TD Cowen in a recent note to investors following EchoStar’s deals with AT&T and SpaceX. “Its grand ambitions are dead,” agreed Recon Analytics analyst Roger Entner.

According to Ookla’s Speedtest Intelligence data – which stems from Speedtest user results – Boost’s network provided upload and download speeds slightly slower than those of its rivals. And Boost’s multi-server latency measurements were slightly higher. These findings are in line with what Ookla Research reported in May of this year.

Boost Mobile's 5G Median Download, Upload and Multi-Server Latency
From Speedtest Intelligence, August 2024 – August 2025

And what of Boost Mobile’s network coverage? Data from Ookla’s Speedtest Insights® – which relies on both foreground and background network tests – paints a picture of Boost’s network reach:

The above map shows Boost’s median 5G signal strength. Median signal strength reflects the power of an operator’s radio signal received by the device from the cell tower. Higher signal levels generally indicate the device is closer to a tower and increase the potential for good speed and the ability to make voice and video calls without dropping – which is all subject to network capacity and quality.

However, this map doesn’t highlight the differences between Boost’s own network and those of its roaming partners. Instead, it’s a representation of the experience Boost Mobile customers receive.

Boost’s network reach – and its reliance on its roaming partners – is covered in the next section.

AT&T is Boost’s Primary Roaming Partner

RootMetrics is another arm of Ookla that conducts controlled testing of mobile networks across the entire U.S. twice a year, as well as globally. These tests stretch from interstate thoroughfares to city-level drive tests to walking tests, both inside and outside. These tests can provide a deeper, more technical look into an operator’s wireless network operations.

RootMetrics tested Boost’s network in 125 U.S. metropolitan areas in the first half of 2025, and 28 in the second half of 2025 (prior to EchoStar’s announcements with AT&T and SpaceX). RootMetrics also tested Boost’s network along 50 rural state routes in the first half of 2025 and 11 in the second half of 2025.

The parameters of Boost’s roaming relationships with AT&T and T-Mobile emerged as a key finding in the data. In order to supplement its own network coverage, Boost inked roaming deals with both AT&T and T-Mobile.

According to test results, Boost relies heavily on AT&T’s network, often connecting to it in U.S. metropolitan areas and using it the majority of the time along rural state routes.

Boost Mobile Roaming
Percent of RootMetrics 2025 testing results in 28 U.S. metropolitan areas and 11 rural state routes

These results aren’t necessarily surprising. Boost first constructed its network in large U.S. cities and then expanded out from those locations. As a result, it generally does not cover rural routes outside major U.S. cities.

Further, based on 2H 2025 testing results, Boost had not yet launched its network in some major cities in California. As a result, it roamed extensively onto AT&T’s network in those markets.

Some markets with Boost service sported a relatively high percentage of roaming onto AT&T’s network, including Denver (tests there connected to AT&T’s network 12% of the time) and Phoenix (tests there connected to AT&T’s network 16% of the time). In other markets, like Las Vegas and St. Louis, Boost tests connected to Boost’s network 99% of the time.

Overall, Boost’s network stretches across roughly 24,000 cell sites. That’s around a third of the number of cell sites deployed by the other nationwide U.S. operators. 

Boost Mainly Uses Lowband 600 MHz Spectrum

A final element in this evaluation of Boost’s progress involves the company’s use of its spectrum holdings.

Boost constructed its network across three spectrum bands: Band n71 (600 MHz), Band n66 (AWS) and Band n70 (AWS-4). EchoStar owns licenses in other spectrum bands – including 3.5 GHz CBRS and 3.45 GHz – but it hasn’t deployed the radio equipment necessary to put those bands into action.

Again, testing data provides insights into how Boost makes use of its spectrum holdings.

Boost Mobile Spectrum Usage
RootMetrics 2H 2025 testing in 28 U.S. metropolitan areas

The reason this adds up to more than 100% is because modern smartphones can connect to multiple spectrum bands at the same time, and aggregate them.

Regardless, these findings are noteworthy because they help show the “workhorse” spectrum bands in an operator’s network. And it’s not surprising that 600 MHz plays a primary role in Boost’s network; due to the physics of wireless communications, signals in lowband spectrum like 600 MHz propagate farther than signals in higher frequencies. Thus, 600 MHz helped Boost meet the FCC’s network-buildout requirements.

Spectrum “depth” is another way to measure Boost’s spectrum usage. The amount of spectrum in use in an operator’s network often directly relates to the speeds that operator can provide.

Around 43% of Boost tests connected with 50 MHz of overall spectrum capacity. Around 16% of tests connected with a total of 60 MHz of spectrum.

Boost Mobile Spectrum Depth
RootMetrics 2H 2025 testing in 28 U.S. metropolitan areas

To put that into perspective, other nationwide U.S. wireless operators have deployed far more overall spectrum. For example, more than half of AT&T’s tests connected with more than 80 MHz of spectrum. For T-Mobile, that figure is 210 MHz.

One final measurement of Boost’s network involves carrier aggregation. In 2H 2025 tests, Boost made extensive use of carrier aggregation technology. For example, more than half of all Boost tests connected to between three and four aggregated channels. In comparison, more than half of Verizon’s tests used two-channel carrier aggregation in 2H 2025, while more than half of T-Mobile’s tests used four-channel carrier aggregation.

Carrier aggregation is a key wireless technology that combines multiple separate frequency bands into a single, wider channel to significantly increase network speed, capacity and coverage.

What’s Next?

EchoStar recently agreed to sell its AWS-4 and H-Block spectrum licenses to SpaceX for $17 billion. Separately, it said it will sell its 3.45 GHz and 600 MHz spectrum licenses to AT&T for $23 billion. 

AT&T officials have suggested the operator will be able to activate the 3.45 GHz spectrum with a software upgrade, and that the operator may use the spectrum to fortify its fixed wireless services. But AT&T will need to deploy new radios to put the 600 MHz spectrum into action.

It’s possible that, instead of putting the 600 MHz into its own network, AT&T might sell that spectrum in order to obtain more 3.45 GHz spectrum.

As of June 30, 2025, Boost counted a total of 7.357 million wireless customers. It’s likely that EchoStar will manage those Boost Mobile customers using its existing core network while shifting them onto AT&T’s physical radio access wireless network. That would allow EchoStar to dismantle its own physical wireless network.

EchoStar also plans to allow its Boost customers to roam onto SpaceX’s Starlink satellite network. However, SpaceX must first deploy new satellites that support AWS-4 and H-Block spectrum. And it will take several years for new phones to arrive in the market with support for satellite connections in those bands.

It’s also likely that EchoStar will sell its remaining spectrum holdings, such as its AWS and CBRS licenses, to a company like Verizon.

To find out more about Speedtest Intelligence® data and insights, visit our website.

Ookla retains ownership of this article including all of the intellectual property rights, data, content graphs and analysis. This article may not be quoted, reproduced, distributed or published for any commercial purpose without prior consent. Members of the press and others using the findings in this article for non-commercial purposes are welcome to publicly share and link to report information with attribution to Ookla.

| July 12, 2021

Introducing Video Testing for Android


In February, we announced video testing from Speedtest® for iOS, and millions of internet speed enthusiasts have since used this free video test to measure the quality of their streaming experience. Today we are excited to announce that video testing is now available for Android users.

How the video test works

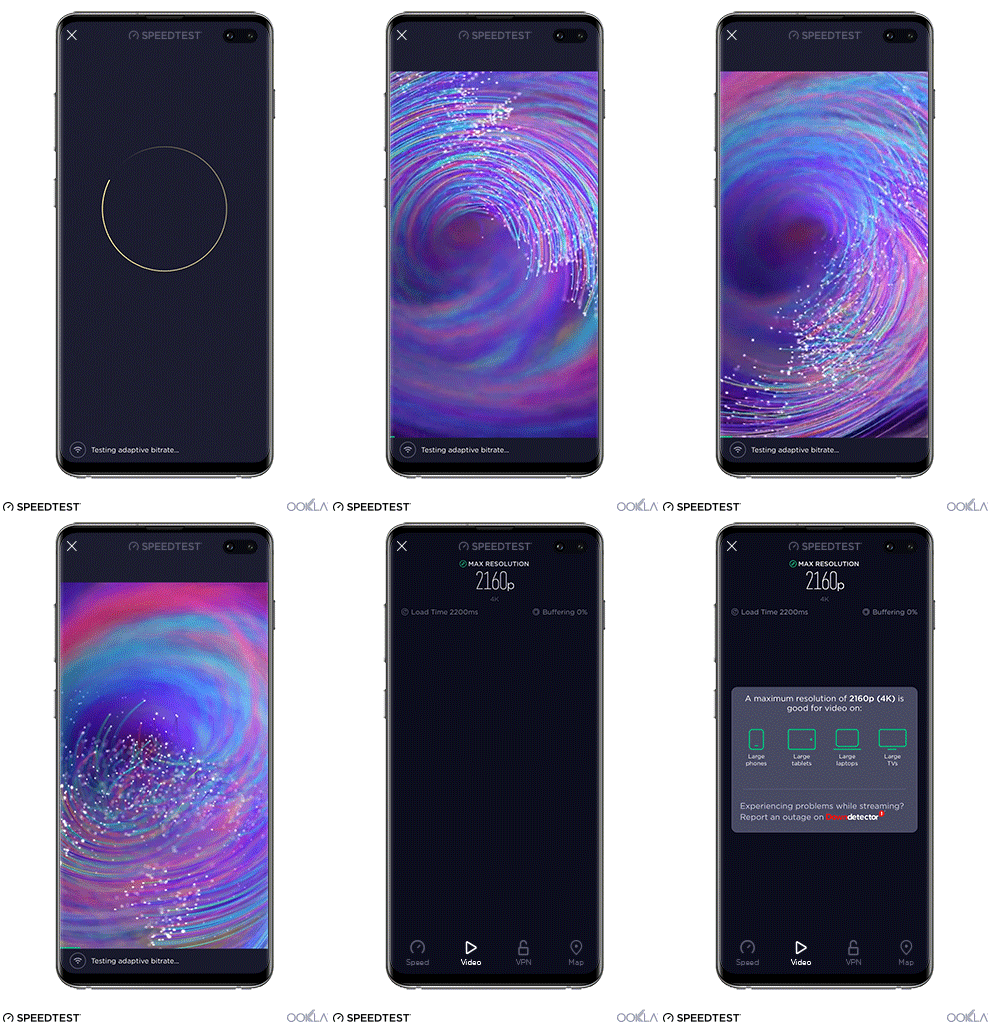
The video test begins by playing a short video using adaptive bitrate streaming. This will measure the typical video streaming experience on your device.


Next, a series of very short videos will be played at increasing video resolutions until the test fails to complete in a reasonable amount of time or reaches a resolution of 4K. This process assesses the maximum video capability of your network — which may exceed the capabilities of your device.


When the test is complete you will get actionable results including maximum resolution, load time, buffering percentage and suggested devices to stream video on at that performance level.

Optimize your online video experience

Taking a video test will give you valuable information to help you optimize your video streaming experience. Here are some examples of what you can do with Speedtest video testing:

  • Find out whether your network is giving you the expected video quality playback
  • Get recommendations for which devices will work best for video on your network
  • Compare historical streaming experiences to your current network performance with test result history
  • Investigate potential outages of the services you are trying to use with Ookla’s Downdetector® if you find that you are unable to stream your video even when the test finds that your video streaming quality meets or exceeds the resolution supported by your device

Where to find video testing in the Speedtest Android app

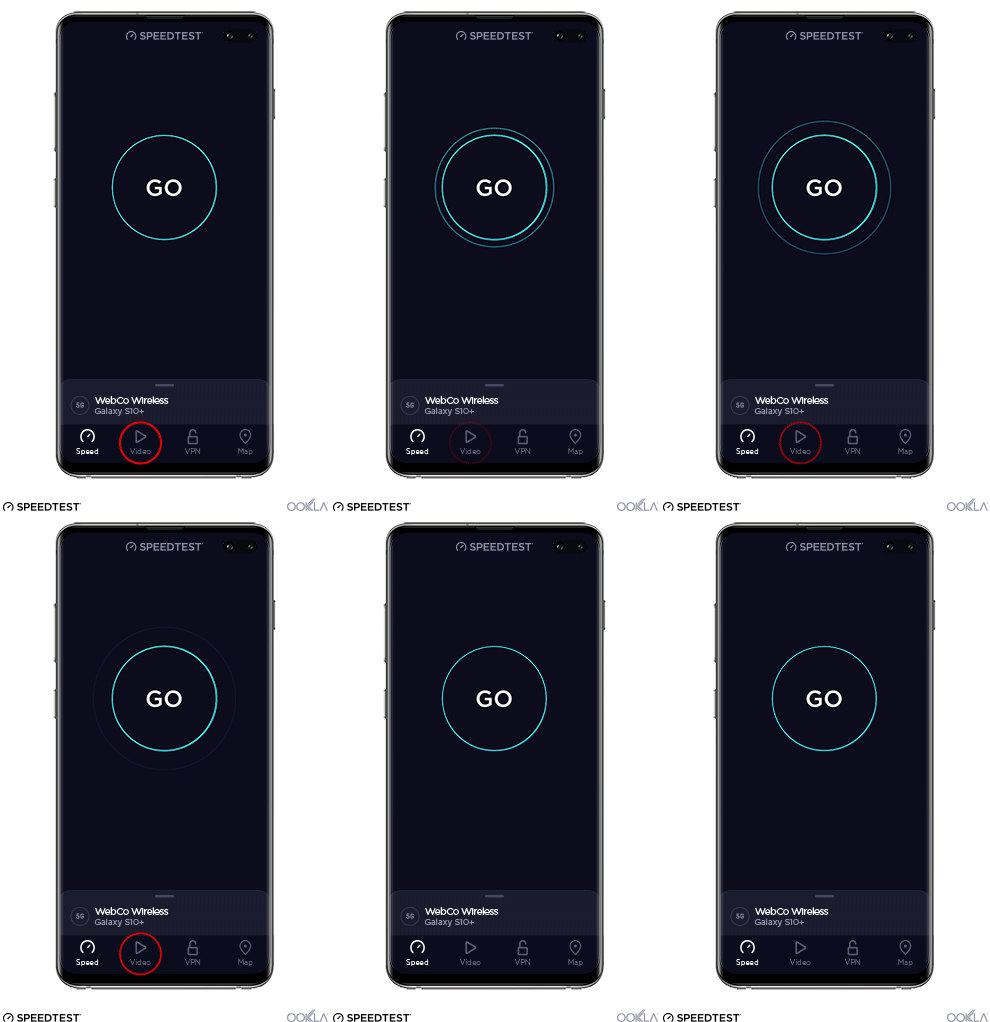
You can now test your network’s video streaming capability in the Speedtest for Android app. Simply open the app and tap on “video” from the menu bar at the bottom of the screen. This will initiate the video test and within one minute you’ll have actionable results and recommendations to optimize your online video experience.


Take a video test today today by opening the Speedtest app on your Android device. If you don’t already have the app, you can download it from the Google Play Store.


Ookla retains ownership of this article including all of the intellectual property rights, data, content graphs and analysis. This article may not be quoted, reproduced, distributed or published for any commercial purpose without prior consent. Members of the press and others using the findings in this article for non-commercial purposes are welcome to publicly share and link to report information with attribution to Ookla.

| June 24, 2024

5G in the U.S. – Additional Mid-band Spectrum Driving Performance Gains

5G performance in the United States continues to improve as more mid-band spectrum becomes available. In March, T-Mobile gained access to additional 2.5 GHz spectrum it won at auction 108 in 2022, and we’re already beginning to see the impact of this, adding extra capacity to its 5G network and boosting performance in rural U.S. locations in particular. In just one month, T-Mobile’s median download performance across the U.S. increased by 29.64 Mbps. Its recent agreement to acquire the bulk of US Cellular’s wireless operations and a portion of its spectrum holdings will help it further reinforce its competitive lead. Verizon and AT&T have both benefited from the early vacation of C-band spectrum by satellite providers, the licenses for which were acquired through Auction 107 in February 2021. AT&T acquired additional 3.45 GHz licenses, former U.S. Department of Defense spectrum, made available through Auction 110 which concluded in January 2022. All three major carriers have since been upgrading their sites to support their new spectrum frequencies. This update reviews the latest Speedtest Intelligence® data to highlight the impact of deployments in new spectrum bands for U.S. 5G users.

Key takeaways

  • Recent trends highlight the importance of additional mid-band spectrum for 5G. Speedtest Intelligence data shows a clear correlation between the release of additional mid-band spectrum, 5G performance, and consumer sentiment for 5G networks, with all three national wireless providers benefitting over the past 6 months. This sends a clear message to the FCC and other regulators, of the benefits of allocating additional spectrum for cellular use, as advocated for by industry bodies such as the CTIA, CCA and GSMA.
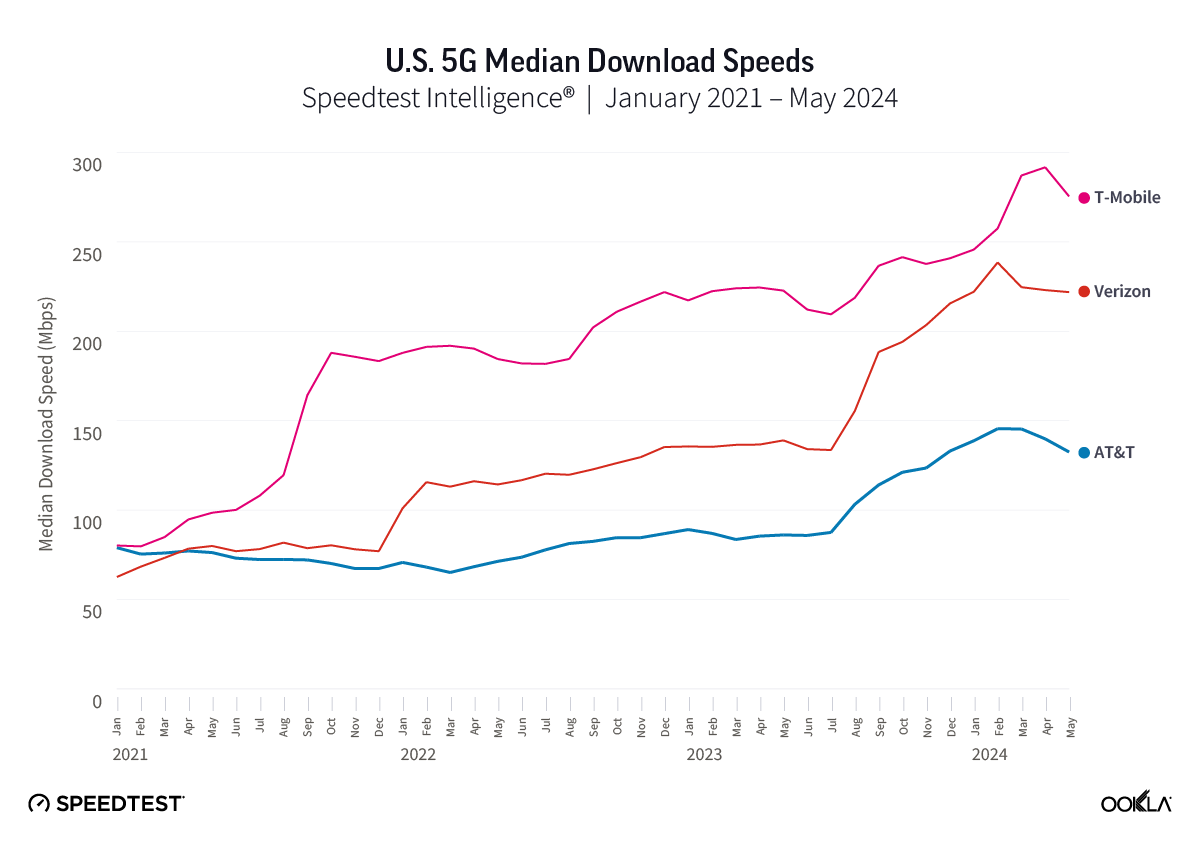
  • T-Mobile intent on holding its lead. While C-band spectrum allowed Verizon in particular to play catch-up during Q4 2023, T-Mobile has continued to build on its performance advantage and innovate, moving to a 5G Standalone (SA) architecture, testing six carrier aggregation, while also benefiting from deploying in additional mid-band spectrum starting in March. T-Mobile recorded a median 5G download speed of 287.14 Mbps as of March 2024, an increase of 29.64 Mbps in a single month, which helped it extend its lead over Verizon, which recorded 224.67 Mbps, and AT&T with 145.36 Mbps. Additional spectral capacity will also help fuel further growth of 5G Fixed-Wireless Access (FWA) services, as wireless operators have had to be selective in signing up new fixed customers in order to manage capacity.
  • Additional mid-band spectrum helping close the gap on regional disparities within the U.S. While the U.S. ranks highly on 5G performance, 5G Service, and 5G Availability metrics versus other leading 5G markets globally, there have remained wide disparities in 5G performance between U.S. states, and between urban and rural locations. Recent mid-band spectrum deployments are starting to shift the needle for a number of states and rural communities.
  • 5G upload and latency performance need more attention. To date, capacity gains from additional spectrum are being directed almost universally to boost 5G download performance, in part because 5G-NR TDD radios are being used in both 2.5 GHz and 3.5 GHz bands. While latency remains relatively static, we do see a consistent improvement from T-Mobile, a trend which will be important if the carrier is to differentiate itself on latency-critical applications in the future.

T-Mobile continues to maintain its national lead on 5G performance

Speedtest Intelligence data for the U.S., covering the last three years, clearly shows how instrumental additional mid-band spectrum has been for all major US carriers. Four points in time stand out very clearly when we look at median download speeds across the market:

  • T-Mobile’s deployment of 5G in both 600 MHz and 2.5 GHz spectrum during 2021 (acquired through the merger with Sprint), giving it a significant early advantage, as AT&T and Verizon focussed more heavily on mmWave spectrum.
  • Verizon performance picked up in January 2022, after it began C-band deployments, which had been delayed due to concerns of interference at airports from the FAA. 
  • The early vacation of the remaining C-band spectrum by incumbent satellite operators in August 2023, giving AT&T and Verizon full access to the spectrum frequencies they acquired at auction in 2021.
  • T-Mobile’s recent deployment following the release of additional 2.5 GHz spectrum as part of Auction 108, beginning in March 2024.

Chart fo U.S. 5G Median Download Speeds | January 2021 - May 2024

T-Mobile had capitalized on its early advantage, building out 5G in 600 MHz spectrum to cover 200 million Points of Presence (PoPs) as of 2020, following that up with wide deployment in its mid-band 2.5 GHz spectrum holdings. Despite performance boosts for AT&T and Verizon from additional C-band spectrum in Q4 2023, T-Mobile still led the pack with a median 5G download speed of 275.50 Mbps as of May 2024, 23% faster than next placed Verizon. Its lead had narrowed since August, with Verizon’s C-band spectrum helping it increase median 5G performance from 133.56 Mbps in June to 215.57 Mbps in December. AT&T also saw performance pick up in the second half of 2023, and at the turn of the year, these trends pointed towards a much more competitive 5G market during 2024, while also driving increased capacity for wireless provider’s 5G FWA services.

T-Mobile has continued to innovate in order to drive performance gains across its 5G network. In addition to deploying a 5G Standalone architecture, it is pushing the envelope on carrier aggregation, most recently completing a test with Ericsson and Qualcomm of six carrier aggregation, stitching together two channels of each of its 2.5 GHz, PCS, and AWS spectrum to achieve download speeds in excess of 3.6 Gbps. Furthermore, having finally gained access to additional 2.5 GHz spectrum it won during auction 108 in 2022, but had not been cleared to use, T-Mobile has rapidly been enabling the new spectrum across its footprint. This has allowed it to extend its lead in the market, recording a median 5G download speed of 287.14 Mbps in March 2024. As cellular providers ramp up their home broadband offerings via 5G fixed wireless access (FWA), as we recently highlighted, they will need to balance fixed net additions carefully in order to ensure cellular performance does not suffer, and will require additional high capacity spectrum over time to meet demand.

Driving improved quality of experience and consumer sentiment

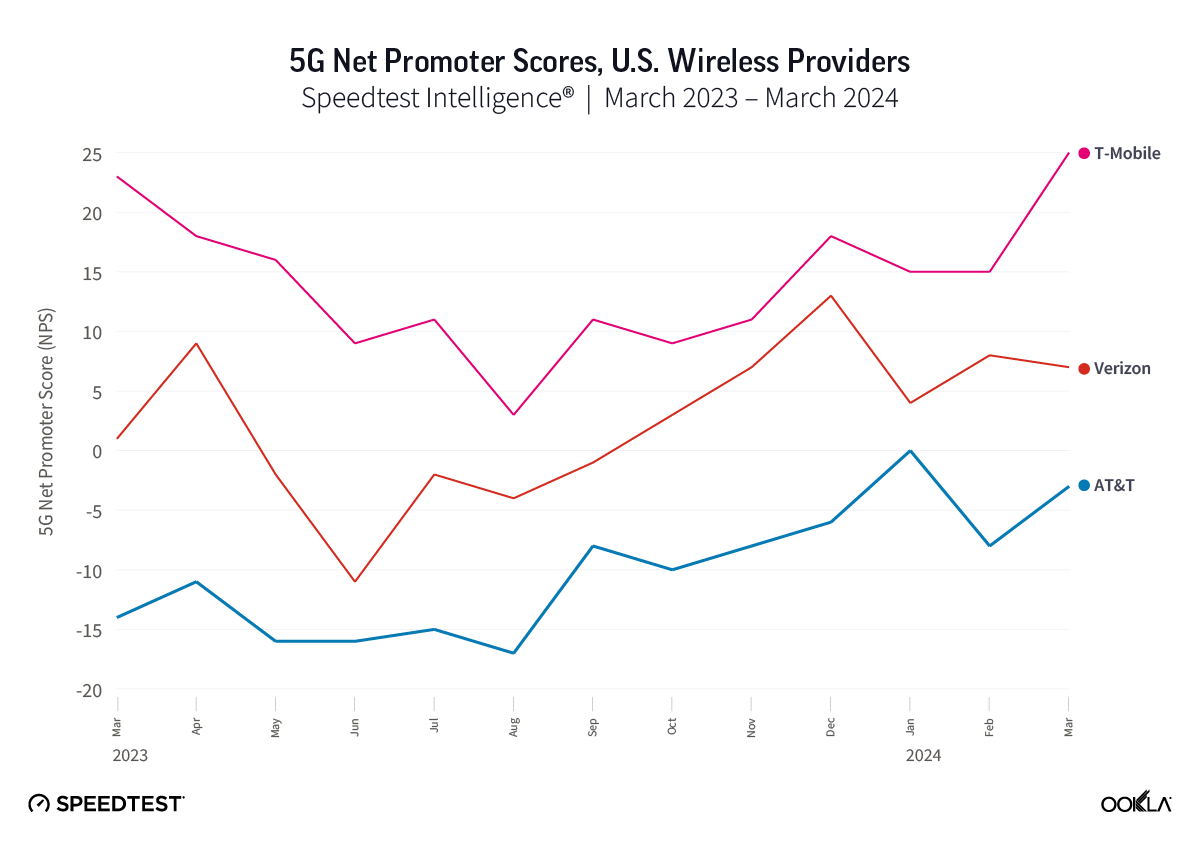
The uplift in 5G performance is driving improved consumer sentiment, as measured by net promoter score (NPS). NPS is a key performance indicator of customer experience, categorizing users into Detractors (score 0-6), Passives (score 7-8), and Promoters (score 9-10), with the NPS representing the percentage of Promoters minus the percent of Detractors, displayed in the range from -100 to 100. Reviewing Speedtest Intelligence data shows that U.S. cellular providers returned either flat or declines in 5G NPS over the period March to August 2023. From September onwards, we see a strong uplift in 5G NPS in particular for Verizon and AT&T following their C-band deployments. T-Mobile on the other hand, has seen a sizable increase in 5G NPS in March, corresponding to its deployment in additional mid-band spectrum.

Chart of 5G Net Promoter Scores, U.S. Wireless Providers

Key to this growth in 5G NPS for all three cellular providers, is the impact that increases in 5G performance are impacting the quality of experience for end users for key use cases such as video streaming and mobile gaming. Both measures, as highlighted by Ookla’s 5G Game Score™ and 5G Video Score™ metrics have seen strong increases over the course of the past year.

5G Video & Gaming Quality of Experience
Speedtest Intelligence® | Q1 2023 – Q1 2024

Positioning the U.S. strongly internationally

Performance gains from all national cellular providers have enabled the U.S. to climb the ranks when compared to its peers internationally. Over the course of just one year, it has moved from 20th place on Ookla’s Speedtest Global Index, to reach 11th as of February 2024. This has been driven by increased availability of mid-band spectrum for 5G use, as advocated for by the CTIA, which recently released a report claiming that the U.S. could benefit from an additional $200 billion in economic growth over the next 10 years through allocating additional mid-band spectrum for 5G.

U.S. providers are also continuing to expand the reach of 5G networks across the market. 5G Service, the share of known operator locations where 5G was present (of total locations with cellular service) climbed from 68.4% in Q3 2023 to 76.7% in Q1 2024. Deployment of 5G in low band spectrum is also critical to ensuring high 5G Availability – the share of 5G users that spend a majority of their time connected to 5G networks. The U.S. still tracks as one of the leading markets globally for 5G Availability, despite its comparatively large landmass, although that metric remained level quarter-on-quarter.

5G Service and 5G Availability – U.S. vs Other Leading 5G Markets
Speedtest Intelligence® | Q1 2024

Closing disparities in 5G performance between U.S. states & rural locations 

While national median speeds continue to advance, there remain some significant disparities in 5G performance at an individual state level. The Midwestern States fare best, with Illinois, Kansas, North Dakota, and Minnesota all within the top-5 performing states nationally, with median 5G download speeds above 225 Mbps during Q4 2023. At the other end of the scale are U.S. states with the highest shares of rural populations, including Vermont, Maine, Mississippi, and West Virginia, which had median download speeds below 100 Mbps. 

5G Median Download Speed by U.S. State (Mbps)
Speedtest Intelligence® | Q4 2023

Differing allocations of spectrum, channel bandwidths, device capabilities, and carrier aggregation options all impact the observed performance of each service provider across the locations they serve. While each network operator has its own 5G deployment strategy, the deployment of mid-band spectrum for capacity in urban locations, complemented with sub-1 GHz spectrum to enable wider and better 5G coverage, is the common approach. While performance gaps will remain as a result of these deployment strategies, recent mid-band spectrum deployments, including in C-band and 2.5 GHz, are beginning to help close the performance gap for some states. 

We examined T-Mobile’s recent performance, comparing data between February and March, as it deploys 5G in its additional 2.5 GHz spectrum. The results show performance has increased across a wide range of U.S. states, with its median 5G performance increasing by more than 10 Mbps within 35 States and the District of Columbia. Among the ten states with the lowest median 5G download speed (based on data for all providers), T-Mobile showed the most significant performance uplifts in West Virginia (+79.73 Mbps), Wyoming (+66.61 Mbps), and New Hampshire (+48.50 Mbps).

T-Mobile’s 2.5 GHz Dividend – Uplift in 5G Median Download Speeds (Top 15 Improving States)
Speedtest Intelligence® | March vs February 2024

Speedtest Intelligence data also illustrates the gap between rural and urban U.S. locations, which has widened over the last three years as mid-band deployments have tended to focus on more urban locations. That is beginning to change, with both T-Mobile and Verizon keen to highlight the impact of their recent spectrum deployments on rural 5G performance. While AT&T only saw a minor increase in median 5G download speeds in rural locations, both T-Mobile and Verizon have targeted significant increases in performance through mid-band spectrum deployments.

Mid-band spectrum driving improvements in urban & rural 5G performance
Speedtest Intelligence® | Q1 2021 – Q1 2024

All eyes on download throughput – upload & latency require attention

Additional spectrum has fueled surges in download performance thanks to the deployment of 5G in mid-band spectrum, but upload and latency metrics have not improved to the same degree. All three cellular providers maintained relatively static median upload speeds across the two year period we examined (Q1 2022 to Q1 2024). 5G latency performance was a mixed picture, with T-Mobile the only provider to consistently improve, reducing its latency from 55 ms in Q1 2022 to 46 ms in Q1 2024. Both Verizon and AT&T saw latency grow over the same period.

5G Median Upload and Latency Performance, (by provider, U.S.)
Speedtest Intelligence® | Q1 2022 – Q1 2024

It’s very clear that U.S. cellular providers are prioritizing improvements in download performance. This will likely continue in 2024, as T-Mobile, AT&T, and Verizon each seek to gain the upper hand, using any 5G network advantages to capture a larger share of competitive churn. Over time however, we expect the relative importance of upload and latency performance to grow, as 5G download performance begins to exhibit diminishing marginal returns, and increasing importance is given to improving the experience of latency-sensitive use cases such as video calling, mobile gaming, and augmented reality.

2024 is set to drive renewed competitive pressure between all of the service providers in the U.S., with the continuing deployment of 5G in mid-band spectrum, T-Mobile’s acquisition of US Cellular’s assets, and made all the more interesting given the DISH wildcard. We’ll continue to monitor and report on 5G performance trends in the U.S., and their impact on Speedtest users. To learn more about Ookla Speedtest Intelligence, please get in touch.

Ookla retains ownership of this article including all of the intellectual property rights, data, content graphs and analysis. This article may not be quoted, reproduced, distributed or published for any commercial purpose without prior consent. Members of the press and others using the findings in this article for non-commercial purposes are welcome to publicly share and link to report information with attribution to Ookla.

| September 7, 2025

A Deep Dive into Apple’s C1 Modem Performance Across Leading Global Markets

On the eve of Apple’s Sept. 9 launch event where the company is expected to debut a new generation of iPhone devices, we compared the C1’s performance in the iPhone 16e to the iPhone 16.

Editor’s note: This article was revised on September 10 to include updated details of the new C1X and N1 chips from Apple following the launch of the new iPhone 17 generation of smartphones.

Apple introduced the iPhone 16e, its first smartphone featuring its new Apple-designed C1 modem, last February. After just a few weeks on the market, we analyzed the performance of the new device in the U.S. market and compared it to the performance of the iPhone 16, which has a similar design and screen size. 

Fast-forward six months and we are expanding our analysis of Apple’s C1 modem performance in the iPhone 16e, in advance of the company’s highly anticipated debut of its next generation of iPhone devices, including the iPhone Air featuring an upgraded C1X modem, which Apple claims will be up to twice as fast as the C1 found in the iPhone 16e. 

Using Ookla Speedtest Intelligence® data for Q2 and Q3 2025, we analyzed the performance of the iPhone 16e and compared it to the performance of the iPhone 16 on 5G, across a range of markets where we’ve seen significant uptake of the newer device. We compared the performance of these two devices because the iPhone 16 and the iPhone 16e have a similar design and the same 6.1” screen, with the inclusion of the C1 modem in the iPhone 16e being a key difference. 

Key Takeaways

  • The iPhone 16e with the Apple C1 modem performs similarly to the iPhone 16 with the Qualcomm modem in the vast majority of markets we examined. Based on median download speeds, the iPhone 16 saw its widest winning margin in Saudi Arabia, recording 353.49 Mbps to the 16e’s 295.01 Mbps. At the other end of the scale, in Spain the 16e led with a median of 139.88 Mbps, to the iPhone 16’s 110.38 Mbps.
  • The iPhone 16 with Qualcomm modem performs better on more capable mobile networks that have a 5G standalone (SA) footprint supporting higher carrier aggregation combinations and uplink MIMO technology. The iPhone 16e with the C1 modem is not able to achieve the same frontier of performance in these markets due to its technical limitations. Key examples of networks facilitating stronger performance for the iPhone 16 include those in Saudi Arabia, China, India and the U.S..
  • In the U.S., T-Mobile users experienced better performance on the iPhone 16, which supports four-carrier aggregation, than iPhone 16e users with the Apple C1 modem, which supports a maximum of three-carrier aggregation. Median download speed for the iPhone 16 on T-Mobile’s network was 317.64 Mbps, compared to 252.80 Mbps on the iPhone 16e. Ookla RootMetrics® controlled testing in the US during 1H 2025 showed that T-Mobile’s network used four-carrier aggregation across 65.4% of locations tested, giving the iPhone 16 a distinct advantage on its network.
  • The fact that the iPhone 16e performs comparatively, or even ahead in some markets, vs the iPhone 16, indicates that some networks are a bottleneck for Qualcomm’s more advanced modem. We expect the iPhone 16’s performance  to outpace the 16e over time as more networks incorporate higher levels of carrier aggregation on 5G SA, as well as advanced MIMO with 5G Advanced, across both downlink and uplink.
  • The iPhone 16e performs strongly on other key performance metrics. Across the markets analyzed, it tended to record better download speeds among the 10th percentile of users (those with the lowest overall download speeds), and across 10th, median and 90th percentiles for upload speeds. At the lower 10th percentile it’s likely that more users are connected solely to low-band spectrum (sub-GHz) which offers better coverage but slower speeds. This may indicate that the C1 is better optimized for robustness and continuity, squeezing out higher throughput when coverage is marginal.

iPhone 16e’s popularity differs around the globe

United States | India | Saudi Arabia | Japan | France

There are five models in Apple’s iPhone 16 generation of smartphones — the iPhone 16, the iPhone 16 Plus, the iPhone 16 Pro, iPhone 16 Pro Max and the more recently launched iPhone 16e. Based on a segmentation of each model using Speedtest data from Q2 – Q3 2025, we see strong variation in the number of Speedtest users of the iPhone 16e vs. Speedtest users of the rest of the iPhone 16 generation.

Japan stands out as the most popular market for the iPhone 16e, with 11.3% of samples from the 16 lineup, followed chiefly by European markets. Adoption of the iPhone 16e depends on a range of factors, including the level of subsidies within a market and to which devices they are directed, level of price sensitivity among consumers, as well as launch timing, and consumer preferences for different form factors and device features.

The combination of these factors likely explains the relatively higher 16e penetration observed in Japan. Beyond the historic appetite for lower-cost, compact iPhones like the SE (to which the 16e is a spiritual successor) and a subsidy structure that favors entry variants, the recent weakness of the yen has made the Pro and Pro Max models more expensive in local terms, prompting elastic buyers (like students and families) to shift down the line-up.

iPhone 16e – share of total iPhone 16 generation samples
Speedtest Intelligence® | Q2-Q3 2025 (to date)

iPhone 16 beats the 16e in markets with more capable 5G networks

The iPhone 16 surpasses the iPhone 16e in median download speed in 12 of the 21 markets we analyzed. Some notable markets where the iPhone 16 performed the strongest  — Saudi Arabia and China — are known for having some of the most advanced mobile networks. China has widely deployed standalone 5G (SA) and also 5G Advanced.

Median Download Speed, iPhone 16 (Qualcomm modem) vs iPhone 16e (Apple C1 modem)
Speedtest Intelligence® | Q2-Q3 2025 (to date)

iPhone 16e delivers better performance to the 10th percentile 

The iPhone 16e stands out for its performance with the 10th percentile of users (those who experience the weakest performance), typically observed at the cell edge or during times of congestion. In 15 of the 21 markets we examined, the iPhone 16e performs better in 10th percentile download speeds than the iPhone 16. It’s likely that a greater share of these Speedtest samples were taken by users connected solely to low-band 5G spectrum, which in the absence of mid-band spectrum, will negate some of the advantages the iPhone 16 achieves through higher levels of carrier aggregation.

10th Percentile Download Speed, iPhone 16 (Qualcomm modem) vs iPhone 16e (Apple C1 modem)
Speedtest Intelligence® | Q2-Q3 2025 (to date)

Upload speed a winner for iPhone 16e 

The iPhone 16e outperforms the iPhone 16 in median upload speed in 15 of the 21 markets we examined. Canada is perhaps the most dramatic example where iPhone 16e median upload speeds of 23.91 Mbps are more than double the iPhone 16’s median upload speed of 11.57 Mbps. 

However, once again we saw the iPhone 16 perform strongly in median upload speed in countries with advanced 5G networks such as Saudi Arabia and China.  Although in the US market the iPhone 16e outperformed the iPhone 16 in upload speeds, when we drilled down further (see the US section of this report), we found that upload performance varied between the different operators.

Median Upload Speed, iPhone 16 (Qualcomm modem) vs iPhone 16e (Apple C1 modem)
Speedtest Intelligence® | Q2-Q3 2025 (to date)

United States

iPhone 16 beats the iPhone 16e in download speeds at T-Mobile and Verizon

The iPhone 16 performs better than the iPhone 16e in median download speed for T-Mobile and Verizon customers. This is a slight change from our March 2025 analysis when the iPhone 16e performed better for Verizon customers than the iPhone 16. Because the iPhone 16 supports mmWave spectrum and mmWave is part of Verizon’s 5G Ultra Wideband service, it’s likely that this is a contributing factor in the iPhone 16’s better performance on the Verizon network.

U.S. median download speed, iPhone 16 (Qualcomm modem) vs iPhone 16e (Apple C1 modem)
Speedtest Intelligence® | Q2-Q3 2025 (to date)
The iPhone 16 outperforms iPhone 16e in median download speed for T-Mobile and Verizon.

However, Verizon users on the iPhone 16 only clocked a median download speed of 172.12 Mbps, which is significantly lower than iPhone 16 users on T-Mobile’s network that logged a median download speed of 317.64 Mbps.

As we noted in our March analysis, the stronger performance of the iPhone 16 relative to the 16e, is likely due to T-Mobile being the only US carrier with a nationwide commercialized 5G standalone network (SA) and its deployment of advanced features such as carrier aggregation (CA) on the 5G SA architecture. 

Ookla RootMetrics® data, based on controlled testing across the US shows that T-Mobile used four-carrier aggregation across more than 65% of its network during 1H 2025, up from just over 53% in 2H 2024 – this trend is likely to continue, and will further strengthen performance for the iPhone 16 over time. At the same time, AT&T has ramped up its use of two-carrier aggregation, which both devices can take advantage of, while Verizon has expanded its use of two-carrier aggregation, and has started to incorporate three-carrier aggregation. Performance also depends on the bandwidth being aggregated – in the case of AT&T, with 2 carriers, it utilized 120 MHz on average. For Verizon, with 3 carriers it utilized 170 MHz, while T-Mobile, with 4 carriers, hit 217 MHz.

Carrier Aggregation Use across US Mobile Networks
RootMetrics | 1H 2025

Qualcomm’s mid-tier modems support 4CA downlink carrier aggregation and its more recent top-of-the line X80 and X85 modems support 6CA downlink carrier aggregation (providing up to 400 MHz of sub-6GHz bandwidth). By contrast, the C1 supports just 3x downlink carrier aggregation (providing up to 160 MHz of sub-6GHz bandwidth). Qualcomm’s mid-tier, X80 and X85 modems also support uplink carrier aggregation and uplink MIMO and the Apple C1 does not.

iPhone 16e stronger in upload speeds at AT&T and Verizon

When comparing the median upload speeds of the iPhone 16 and 16e across US providers there’s a much different story than when comparing median download speeds. On Verizon’s and AT&T’s networks the iPhone 16e outperforms the iPhone 16 in upload speeds. Verizon iPhone 16e users experienced median upload speeds of 11.51 Mbps compared to Verizon iPhone 16 users that logged median upload speeds of 9.67 Mbps. Likewise, AT&T iPhone 16e users experienced median upload speeds of 8.47 Mbps compared to iPhone 16 users with median upload speeds of 7.09 Mbps.

Instead of seeing the iPhone 16 outperform the iPhone 16e at T-Mobile, the two devices are nearly equal in median UL performance with 16e users seeing median upload speeds of 11.79 Mbps compared to iPhone 16 users with 11.70 Mbps. These results are very similar to what we uncovered in our March 2025 report where we saw clear differences in the iPhone 16e and the iPhone 16 performance for AT&T and Verizon users but nearly equal performance for T-Mobile users. 

U.S. median upload speed, iPhone 16 (Qualcomm modem) vs iPhone 16e (Apple C1 modem)
Speedtest Intelligence® | Q2-Q3 2025 (to date)
iPhone 16e achieves better median upload speeds than the iPhone 16 across AT&T and Verizon and the two devices are nearly equal in performance on T-Mobile’s network.

iPhone 16e surpasses the iPhone 16 among the 10th percentile

One area where the iPhone 16e shines is among users in the 10th percentile (those with the lowest overall download speeds), with iPhone 16e users on all three networks experiencing better performance than iPhone 16 users.

The results were most apparent with AT&T and T-Mobile customers. AT&T iPhone 16 customers in the 10th percentile experienced download speeds of 13.22 Mbps compared to iPhone 16e users that logged download speeds of 21.63 Mbps. Likewise, T-Mobile 10th percentile customers with the iPhone 16e clocked download speeds of 37.64 Mbps compared to their counterparts with the iPhone 16 that had download speeds of 30.20 Mbps. Verizon’s 10th percentile users on both the iPhone 16 and the iPhone 16e had nearly the same download speeds of 26.45 Mbps and 26.82 Mbps, respectively. 

These results are very similar to what we first uncovered in our March 2025 report. Studying performance at the 10th percentile is important because it often provides a more insightful assessment of a network’s impact on user quality of experience, highlighting performance in poorer RF locations, which is often missed if focusing solely on other metrics such as the median performance. 

India

Jio’s 5G SA network takes full advantage of the iPhone 16’s advanced features 

In the Indian market the iPhone 16e outperforms the iPhone 16 on Vi’s network. However, similar to T-Mobile in the US,  Airtel and Jio’s more capable 5G networks, highlight the impact of higher levels of carrier aggregation for the iPhone 16, allowing them to join more spectrum bands for more bandwidth overall. This is apparent for the median user on Jio’s network. Jio operates a 5G SA network and uses a multi-band strategy using 700 MHz spectrum for its low-band 5G and 3.5 GHz for its mid-band 5G. Jio also operates some mmWave spectrum in the 26 GHz for its 5G SA deployment and  incorporates massive MIMO and carrier aggregation features to optimize its mid-band and low-band 5G coverage. 

At the upper 90th percentile, for users achieving the top 10% of speeds, Jio continues to see a lead for the iPhone 16, and Airtel follows suit —highlighting that in certain locations on its network, it is able to aggregate additional spectrum bands to support faster performance. Vi on the other hand shows very similar performance between both devices, at both the median and 90th percentile.

India – median download speed, iPhone 16 (Qualcomm modem) vs iPhone 16e (Apple C1 modem)
Speedtest Intelligence® | Q2-Q3 2025 (to date)

Saudi Arabia

More advanced Saudi Arabian networks drive improved performance for iPhone 16

Saudi Arabia exhibited the largest lead for the iPhone 16 over the iPhone 16e, based on median download speed. Within the market, stc and Zain, which have both implemented 5G Advanced, show significant leads for the iPhone 16, pointing to higher levels of carrier aggregation. For stc, in particular, this gap increased at the 90th percentile, with the iPhone 16 over 200 Mbps faster than the iPhone 16e. The Saudi Arabian regulator, the CST, has been very proactive in licensing additional spectrum to the network operators, with both stc and Mobily recently acquiring an additional 100 MHz in the 3.8 GHz band , to add to existing 100 MHz assignments in the 3.5 GHz band.

Saudi Arabia – download speeds, iPhone 16 (Qualcomm modem) vs iPhone 16e (Apple C1 modem)
Speedtest Intelligence® | Q2-Q3 2025 (to date)

Despite the lead for the iPhone 16 on download speeds, the iPhone 16e fared better on median upload speeds, with stc and Mobily seeing the largest differences. This was also apparent at the 90th percentile, with all three mobile operators seeing faster upload performance for the 16e.

Saudi Arabia – upload speeds, iPhone 16 (Qualcomm modem) vs iPhone 16e (Apple C1 modem)
Speedtest Intelligence® | Q2-Q3 2025 (to date)

Japan

iPhone 16e consistently delivers in download performance

Japan topped our list of markets with the most iPhone 16e use, based on Speedtest samples, with over 10% of total samples for the entire iPhone 16 range. The relative success of the iPhone 16e in Japan reflects demand for small form factor devices in the market – the iPhone SE (3rd generation) was equally popular in the market upon its launch in 2022. 

The iPhone 16e leads the iPhone 16 in median download performance across three of Japan’s mobile operators. iPhone 16e users on DoCoMo’s network experienced the greatest difference in performance clocking in with a median download speed of 135.56 Mbps compared to iPhone 16 users with download speeds of 111.04 Mbps. The same trend was observed for median upload speeds, with all four mobile operators seeing stronger performance for the iPhone 16e versus the iPhone 16.

Japan – median speeds, iPhone 16 (Qualcomm modem) vs iPhone 16e (Apple C1 modem)
Speedtest Intelligence® | Q2-Q3 2025 (to date)

Three of the four operators have fully deployed 5G SA networks and the fourth operator, Rakuten, operates a fully virtualized cloud-native 5G network, and is in the process of upgrading it to 5G SA. All three 5G SA networks use carrier aggregation and DoCoMo was one of the first to offer sub-6GHz carrier aggregation for its 5G network. 

However, the Japanese government has pushed mobile operators to give a priority to expanding 5G coverage beyond the urban areas and has even implemented certain coverage goals (97% of the country by the end of fiscal 2025 and 99% of the country by fiscal 2030). Because of this the Japanese operators have been more focused on prioritizing the expansion of 5G coverage over amplifying headline network speeds.

This focus on coverage has positively impacted the lower 10th percentile of download and upload speeds in Japan. SoftBank in particular shows strong performance at the 10th percentile for download speeds, with the iPhone 16e delivering 34.59 Mbps, and the iPhone 16, 19.34 Mbps. On 10th percentile upload speeds, Rakuten edges ahead with 7.12 Mbps for the iPhone 16e, and 3.78 for the iPhone 16.

Japan – 10th percentile speeds, iPhone 16 (Qualcomm modem) vs iPhone 16e (Apple C1 modem)
Speedtest Intelligence® | Q2-Q3 2025 (to date)

France

Median performance parity for the iPhone 16e and 16, but outcomes differ on SA-rich Free

There is relative performance parity at the median for download speed across the iPhone 16e and 16 in France, suggesting the day-to-day experience is similar for most users irrespective of modem. The notable exception to this pattern is on Free’s network, where the iPhone 16e delivered median speeds that were as much as 11% below the iPhone 16. Similar to other global leaders, Free’s footprint has leaned heavily on 700 MHz 5G and has been first with national SA (3.5 GHz) coverage.

iPhone 16e tops iPhone 16 across every operator at the 10th percentile

Similar to the prevailing global trend, the iPhone 16e performs notably better at the 10th percentile of download speeds in France, with a material lead over the iPhone 16 across all operators except SFR. Nationally, speeds were on average 22% higher on the lower end for the 16e, with a difference over 30% compared to the iPhone 16 on Free and Orange’s networks. This suggests the C1 modem is squeezing out more throughput at the cell edge from low-band SA or NSA where one or two layers is active. 

France – 10th percentile & median download speeds, iPhone 16 (Qualcomm modem) vs iPhone 16e (Apple C1 modem)
Speedtest Intelligence® | Q2-Q3 2025 (to date)

The iPhone 16 wins the peaks on three of four French networks based on 90th percentile download speeds, consistent with a broader, more mature carrier aggregation feature mix compared to the 16e driving better frontier performance. Narrower carrier aggregation combinations or a tendency to enter SA more readily (thus losing the “extra lanes” provided by non-standalone that combines 4G and 5G spectrum) where LTE anchor capacity is lost may be playing a role in pulling down the 16e’s headline speeds across Free, Orange, and SFR.

France – 90th percentile download speeds, iPhone 16 (Qualcomm modem) vs iPhone 16e (Apple C1 modem)
Speedtest Intelligence® | Q2-Q3 2025 (to date)

Apple carefully managing performance across its smartphone range

Based upon six months of Speedtest data, it’s clear that Apple’s decision to diversify its modem selection within its iPhone device lineup is resulting in slightly different performance between the iPhone 16e and the iPhone 16 on different operator networks. 

But if Apple is looking for consistency across all its devices, then it’s likely that these differences that we have noted in this report will play a role in Apple’s choice of modems for future devices. Its upgraded C1X, available in the new iPhone Air, hints at an expanded feature-set, likely greater levels of carrier aggregation and MIMO, to support its “up to 2x faster” claim. This also indicates that it will have opted for an upgraded Qualcomm modem to support the rest of the iPhone 17 line up.

Apple has also developed its own Bluetooth and Wi-Fi chipset – the N1 – to use instead of the Broadcom chipsets it has used in its iPhone 16 generation of devices. The N1 will support Wi-Fi 7, alongside Bluetooth 6 and Thread, helping Apple gain more control over performance and battery usage.  

Similar to our continued monitoring of the C1 modem, we will be watching Apple’s introduction of the C1X and N1, to uncover how these new chips impact user experience across cellular and Wi-Fi networks.

Ookla analyst Luke Kehoe and editorial director Sue Marek contributed to this piece. 

To find out more about Speedtest Intelligence® data and insights, visit our website.

Ookla retains ownership of this article including all of the intellectual property rights, data, content graphs and analysis. This article may not be quoted, reproduced, distributed or published for any commercial purpose without prior consent. Members of the press and others using the findings in this article for non-commercial purposes are welcome to publicly share and link to report information with attribution to Ookla.

| July 22, 2024

Fiber In The Philippines Is Improving And Catching Up With Its Regional Peers

Fixed broadband speeds in the Philippines are gradually improving. This is attributed to the combined efforts of ISPs and government agencies to expand coverage and promote the transition from legacy fixed-line technologies to faster fiber connections. However, the distribution of fixed network infrastructure across the country is uneven, and there is still room for further improvement and adoption.

Key Takeaways

  • Fixed performance in the Philippines is improving but still lags behind some neighbors. While the Philippines’ fixed broadband network performance continues to improve quarter over quarter, Ookla® Speedtest Intelligence® shows the Philippines’ speed of 94.42 Mbps in Q2 2024 was behind some of its Southeast Asian peers’ median download speeds, such as Singapore (284.93 Mbps), Thailand (231.01 Mbps), Vietnam (135.00 Mbps), and Malaysia (132.72 Mbps).
  • The five fastest regions in the Philippines were in Luzon Island, highlighting the unequal distribution of fixed network infrastructure. In Q2 2024, Luzon Island had the regions with the top five fastest fixed performance in the Philippines, all reporting download and upload speeds surpassing 90 Mbps. Calabarzon had the fastest fixed median download speed of 99.55 Mbps, while the Eastern Visayas region had the lowest median fixed download speed of 38.43 Mbps.
  • An increase of Starlink’s low-Earth orbit satellite-based connection is an interesting development and may make this satellite service a viable home broadband alternative. Speedtest samples for Starlink in the Philippines have significantly increased over the past year. However, Starlink’s performance lags behind that of fixed broadband, with median download speeds half of fixed download speeds for all operators, at 48.14 Mbps compared to 94.42 Mbps. Upload speeds were also significantly lower, at 12.63 Mbps compared to 94.13 Mbps reported by all fixed broadband operators.

Philippines’ fixed performance continues to trail behind neighboring counterparts

Broadband subscriptions in Southeast Asia substantially surged during the pandemic, reflecting the increased demand for connectivity. Although 92% of the total broadband subscriptions are mobile, there are efforts in the region to bolster fixed broadband access. Government initiatives in the region have led to improvements in fixed broadband performance. However, there is still a disparity in broadband performance among regional counterparts. 

Looking at performance in Q2 2024 in select Southeast Asian markets, Singapore and Thailand maintained a significant performance lead compared to other countries in the region, achieving median fixed broadband download speeds in excess of 200 Mbps during Q2 2024. Malaysia and Vietnam demonstrated similar performance, both achieving median fixed download speeds of 132.72 Mbps and 135.00 Mbps, respectively, surpassing the Philippines’ speed of 94.42 Mbps in Q2 2024. Of the remaining selected markets, Brunei had a speed of 77.50 Mbps, trailing behind the Philippines, while Indonesia, which shares geographical similarities with the Philippines as both are archipelagos composed of thousands of islands, reported the slowest fixed-line market, recording a median download speed of 31.42 Mbps during the same period.

Fixed Median Download Speed Across Select Southeast Asian Countries
Speedtest Intelligence® | Q2 2024

Mobile internet is the primary means of access in the Philippines, with only 33% of households having fixed broadband, which is significantly lower than the ASEAN average of 41%. Additionally, the annual charge for fixed broadband accounts for 11% of the per capita gross national income (GNI), which is twice as much as the ASEAN average, making it unaffordable for some of the lower-income population. 

Accelerated fiber deployments result in a 50% improvement in broadband speeds

The Philippines was the fastest growing economy across Southeast Asia in 2023. With the improving GDP, there is more disposable income for people to afford connectivity solutions and increased demand for better broadband connectivity in the country. As a result, the fixed broadband market in the Philippines has undergone significant transformations in recent years, marked by a notable shift towards fiber networks and the implementation of 5G fixed wireless access. Both governmental initiatives and efforts by leading ISPs have resulted in substantial investments aimed at expanding and modernizing infrastructure throughout the archipelago.

According to GlobalData in 2022, DSL lines accounted for 37% of total fixed broadband subscriptions in the Philippines. This is expected to gradually decrease and be replaced by fiber, with projections indicating that fiber will constitute over 36% of all fixed broadband lines by 2027.

One key government project aimed at enhancing internet infrastructure is the National Broadband Plan (NBP). Through the Department of Information and Communications Technology (DICT), the Philippine government has rolled out the NBP, which seeks to bridge the digital divide by establishing a nationwide fiber broadband network and wireless technology to provide faster and more affordable internet access to all Filipinos. 

As part of NBF, the government recently launched the first phase of its National Fiber Backbone (NFP) project. Targeted to be completed by 2026, the NFB project aims to enhance connectivity and government operational efficiency while extending internet access in Regions I, III, and NCR. 

Besides government-led initiatives, ISPs such as Converge ICT, Globe Telecom, and PLDT are investing in and expanding their networks and upgrading their technologies. These efforts aim to offer faster internet speeds to their customers and enhance internet connectivity in both urban and rural areas. 

PLDT started deploying fiber in 2015 and as of the end of 2023 it reached 17.3 million households with fiber.. Similarly, Converge ICT, the incumbent fixed broadband player, added 900,000 new homes to its fiber footprint in 2023 and ended the year with nearly 16 million homes passed.

Network performance in the Philippines has improved over the past two years. Ookla Speedtest Intelligence® data indicates a steady increase in median fixed download and upload speeds across the Philippines for all fixed providers combined between Q2 2022 and Q2 2024. During this period, the median fixed download speed rose by 51% from 62.51 Mbps to 94.42 Mbps. Since most ISPs offer symmetric speeds, the median fixed upload speed also showed an upward trend, increasing from 58.65 Mbps in Q2 2022 to 94.13 Mbps in Q2 2024.

Median Fixed DL and UL Performance in the Philippines
Speedtest Intelligence® | Q2 2022 – Q2 2024

Regions in Luzon Island dominates fixed broadband performance, underscoring disparities across the country

Despite various efforts to enhance fixed performance throughout the Philippines, there are persistent regional disparities in median download and upload speeds due to the uneven distribution of fixed network infrastructure. Based on Speedtest Intelligence® data from Q2 2024, Luzon Island stands out for its fixed internet performance, with the five fastest regions situated on the island, recording download and upload speeds surpassing 90 Mbps. Given Luzon’s economic significance and high population density, it is where the majority of the country’s investment in high-speed broadband infrastructure is concentrated, especially in the capital, Metro Manila, as well as nearby provinces, and central Luzon.

Calabarzon, the region with the largest population of 16 million, had the fastest fixed median download speed of 99.55 Mbps in Q2 2024. The region has the second-highest percentage of households with access to fixed broadband network, at 23.4%, after Metro Manila (NCR), which had the highest share, at 26.4%. At the other end of the scale, the Eastern Visayas region (Region VIII), occupying the eastern section of Visayas Island, scored the lowest median fixed download speed at 38.43 Mbps.

Fixed Wireless Access and satellite broadband as an alternative to bridge the digital gap 

The Philippines’ geographical layout, consisting of over 7,000 islands, is challenging for fiber deployment. Due to the archipelago’s structure, ISPs may be reluctant to invest in fiber deployment as accessing remote parts can be difficult. In many low-density and low ARPU areas, fixed networks are neither cost-effective nor logistically viable. To this end, Fixed Wireless Access (FWA) and Satellite Communication (SatCom) are becoming attractive options for tapping into these underserved and remote populations.

FWA provides the fastest and most flexible broadband option in areas where fixed broadband is unavailable, especially since the Philippines is a predominantly mobile market. 4G FWA has been available in the Philippines for some time and MNOs use FWA to increase broadband adoption in areas with low fixed broadband coverage. As 5G coverage expands nationwide, it brings significant performance improvements, positioning FWA as a strong competitor to the existing fixed alternatives, such as fiber-to-the-home (FTTH).

The Philippines was the first country in Southeast Asia to experience commercial 5G FWA connectivity. In 2019, Globe launched its first commercially available 5G FWA service called Globe At Home AirFiber 5G. This service offers speeds of up to 100 Mbps and generous data allocations of up to 2 terabytes (TB), starting at around P1,899 (USD$36) per month. Smart Communications launched its prepaid Home Wi-Fi 5G called Smart Bro Home Wi-Fi 5G at the end of 2021.

At its peak, an estimated 4.3 million users in the Philippines access broadband through FWA. Interestingly, the FWA growth rate has declined in the last two years, as reported by ABI Research. In early 2023, Globe Telecom reported a subscriber base of 1.2 million for its fixed wireless services, a decrease from 2.4 million the previous year. Likewise, PLDT reported a 45% decline in FWA subscriptions at the end of 2023 compared to the beginning of the year. This decrease in FWA numbers was partly due to the increased availability of fiber broadband access nationwide. Both providers noted a rise in fixed fiber broadband subscriptions, which is understandable given that fiber provides more reliable connectivity than FWA.

There has also been a significant increase in satellite-based connectivity to provide internet access in areas not covered by traditional terrestrial networks. Based on Speedtest samples, Starlink’s LEO service is providing the majority of satellite internet connectivity in the country. Starlink service in the Philippines launched in early 2023. Based on the comparison between Q2 2024 and Q2 2023, there has been a substantial increase in Starlink Speedtest samples in the Philippines, growing by 228.5% over the past year, and this number is expected to increase further. According ABI Research, the Philippines is projected to become the largest Southeast Asian market for satellite broadband, with 909,000 subscriptions by 2028.

Speedtest Intelligence data indicates that Starlink underperformed compared to all fixed broadband operators combined. Starlink’s Q2 2024 median download speeds were almost half of the median fixed download for all operators, at 48.14 Mbps compared to 94.42 Mbps. Starlink’s median fixed upload speeds, at 12.63 Mbps, significantly lagged behind the 94.13 Mbps provided by fixed broadband operators, which provides symmetrical upload and download speeds.

Multi-server latency tends to be higher for satellite providers, with the significant distances between satellites and receivers resulting in long delays. For Q2 2024, Starlink’s multi-server latency was double that of all fixed operators combined, at 50 ms compared to 25 ms for the latter. 

Starlink Performance Against All ISPs Combined
Speedtest Intelligence® | Q2 2024

Besides Starlink’s performance challenges, the equipment and subscription costs are higher than terrestrial broadband options, making it inaccessible for some users. However, it provides a viable alternative, especially in locations without access to fixed broadband or with slower DSL connections.

It’s clear that the regulatory bodies and ISPs in the Philippines are committed to advancing broadband connectivity by implementing various strategies aimed at deploying fiber, promoting its adoption, and offering wireless broadband as an alternative to increase competition. These efforts have led to notable improvements in fiber accessibility and fixed broadband speed over the past two years. However, a significant gap in fixed broadband performance remains compared to some neighboring countries in the region. 

Establishing a closer private-public partnership is imperative to meet the increasing demand for better fixed broadband and narrow the gap with neighboring countries. This, in turn, will drive the development of robust fiber networks and promote greater availability of higher-speed broadband services while encouraging existing customers to upgrade to faster speeds. We’ll continue to monitor the progress of the Philippines’s fixed broadband market and provide updates on the state of fixed broadband connectivity across other Southeast Asian markets. If you are interested in Ookla’s solutions and services for network intelligence and management, get in touch.

Ookla retains ownership of this article including all of the intellectual property rights, data, content graphs and analysis. This article may not be quoted, reproduced, distributed or published for any commercial purpose without prior consent. Members of the press and others using the findings in this article for non-commercial purposes are welcome to publicly share and link to report information with attribution to Ookla.

| March 19, 2025

Fiber-Rich, Wi-Fi Poor: Spain Exemplifies the Scourge of Outdated Wi-Fi | Rica en fibra y pobre en Wi-Fi: España ejemplifica la ‘enfermedad’ del Wi-Fi obsoleto

Spanish/Español

Spain leads Europe in fiber deployment but is now paying the price for neglecting modern Wi-Fi CPE, undermining its global competitiveness in fixed broadband performance. 

Spain’s remarkable transformation from a telecoms laggard a decade ago to a global leader in fiber availability has been dizzying in both scale and speed. Widely hailed as a model of best practice, this transformation has played a key role in vaulting the country to the forefront of Europe in economic growth over the last two years, supporting the attraction of inward investment in precision manufacturing, renewables, and a growing digital nomad community.

If deploying fiber to as many doorsteps as possible were a sprint, Spain would have won hands down. But the real race—the marathon of extending gigabit coverage throughout the entire home, beyond merely the doorstep—requires modernizing Wi-Fi customer premises equipment (CPE). Here, Spain is falling behind, eroding its global competitiveness in fixed broadband performance and limiting Spanish ISPs’ ability to differentiate in a market saturated with multiple overlapping fiber builds.

This chasm between the highly capable fiber connections reaching most Spanish homes and the outdated Wi-Fi equipment delivering that connectivity to end devices exemplifies the paradox of ‘old’ fiber markets like Spain. As an early mover in fiber, Spain migrated from copper before modern Wi-Fi 6 and Wi-Fi 7 CPE—designed to fully leverage fiber’s multi-gigabit potential—became widely available.

Key Takeaways

  • Spain features one of the oldest and least capable Wi-Fi footprints in Europe: By the end of 2024, two-thirds of all Wi-Fi connections in Spain still relied on legacy standards (Wi-Fi 4 and Wi-Fi 5) based on Speedtest Intelligence® data, leaving the country notably behind peers with lower fiber penetration, including neighboring France, the United Kingdom, and all Nordic countries. This deep entrenchment of legacy Wi-Fi standards is artificially constraining the performance of Spain’s full-fiber connections, contributing to its underperformance in the Speedtest Global Index™ compared to countries with less extensive fiber deployment.
  • The capabilities of Spain’s Wi-Fi footprint vary significantly across different ISPs: DIGI has distinguished itself  by offering modern CPE with Wi-Fi 6 as standard across its subscriber base, benefiting from its position as a newer entrant without a legacy customer base. This has driven its strong lead in Wi-Fi 6 penetration in Spain—nearly half of all Speedtest samples on DIGI connections in January used Wi-Fi 6 or 7, compared to less than a quarter on Movistar and Vodafone—enhancing its overall fixed broadband performance. By comparison, ISPs that were slow to introduce modern CPE, such as Movistar, or restricted access to subscribers opting for premium equipment rental add-ons, like Vodafone, retain a much larger share of users on legacy Wi-Fi standards.
  • Modern CPE with Wi-Fi 6 and 7 deliver significant performance gains across all ISPs: The gap between advertised fiber speeds to the doorstep (typically achievable via wired Ethernet) and actual Wi-Fi performance is smallest in homes where Wi-Fi 6 and 7 CPE have been deployed. At the end of 2024, median download speeds on Wi-Fi 6 in Spain reached 419.13 Mbps, exceeding Wi-Fi 5 speeds by more than 54% and surpassing Wi-Fi 4 performance by an order of magnitude. Meanwhile, median latency on Wi-Fi 7 connections (19 ms) was notably improved compared to outcomes on earlier Wi-Fi standards. 

Spain is a victim of its own success, having deployed fiber far and wide before the arrival of Wi-Fi 6 and 7

Spain typifies the legacy Wi-Fi challenges now confronting Europe’s early fiber adopters—countries that moved aggressively to deploy full-fiber networks using GPON (Gigabit Passive Optical Network) technology. The market incumbent, Telefónica, began large-scale fiber deployment in the early 2010s, accelerating from 2015. By the end of the decade, Spain had leapfrogged most countries in fiber coverage and the migration from copper-based DSL, with a groundswell of investment driving multiple overlapping fiber builds across many areas.

The scale of Spain’s success in fiber deployment is often under-appreciated. The European Commission’s latest DESI Index reported that over 95% of Spanish households were passed by a full-fiber network—well above the EU average of 64%. This has placed Spain within striking distance of the Commission’s Digital Decade 2030 target of achieving full-fiber coverage across all member states by the end of the decade.

Spain Continues to Lead Europe in Fiber Deployment
European Commission | DESI 2018 – 2024

Spain’s initial fiber rollouts in the early 2010s coincided with Wi-Fi 4 being the de facto standard for many ISP-supplied CPE. Based on a 2009 standard, Wi-Fi 4 offers theoretical maximum download speeds of up to 600 Mbps. By the peak of fiber deployment in the latter half of the decade, Wi-Fi 5 had become the state-of-the-art standard, delivering peak speeds of 3.5 Gbps and gradually becoming dominant. For instance, in 2016, Telefónica’s Movistar fiber CPE featured a dual-band Wi-Fi 5 model, which was considered high-end at the time.

By the time Wi-Fi 6—the first standard truly designed for multi-gigabit fiber based on XGS-PON (the latest optical networking technology enabling symmetrical speeds of up to 10 Gbps)—became available, Spanish ISPs had already deployed tens of millions of legacy CPE. Analysis of Speedtest Intelligence data reveals that Wi-Fi 4 and Wi-Fi 5 CPE have remained deeply entrenched in Spain’s fiber base, collectively accounting for over 75% of all fixed connections by December 2024, based on Speedtest sample share. 

Competitive dynamics play a key role in shaping Wi-Fi outcomes across countries and ISPs

The long tail of legacy Wi-Fi CPE in Spain stands in stark contrast to other fiber-rich countries like neighboring France, another European leader in fiber deployment—though it lagged behind Spain until recent years. By December 2024, Wi-Fi 6 accounted for nearly a third of all Wi-Fi connections in France, compared to less than a quarter in Spain.

Beyond France’s later fiber deployment timeline compared to Spain, broader competitive dynamics and consumer behavior have likely influenced the differences in Wi-Fi adoption between the two countries. While Spain’s fixed market is highly competitive, it has been led by a few large converged players that have traditionally prioritized convergence and bundling over investing in cutting-edge CPE.

For the most part, Spanish ISPs have traditionally competed on price, content, and speed tiers, with Wi-Fi CPE upgrades not seen as a key differentiator. In France, by contrast, the entry of market disruptor Iliad’s Free at the start of the last decade intensified competition not just on price but also on innovation in the ‘internet box.’ For over a decade, Free set the market pace by integrating cutting-edge technology into its Freebox gateways, from built-in media servers to high-end Wi-Fi.

Wi-Fi 6 Penetration Continues to Rise Slowly in Spain
Speedtest Intelligence® | January 2025

This sparked a ‘box war’ in France, where rival ISPs faced competitive pressure to regularly update their CPE to avoid being outpaced. For example, when Free introduced a Wi-Fi 6-capable Freebox for new subscribers, Orange (Livebox 6) and Bouygues (Bbox Wi-Fi 6) quickly followed suit with their own offerings, treating hardware as a key competitive feature to attract subscribers.

Additionally, French ISPs typically included these newer CPE solutions at no extra cost in standard fiber tariffs. When Orange launched the Livebox 6 in 2022 with Wi-Fi 6E support—leveraging additional spectrum in the 6 GHz band to boost theoretical maximum speeds to 9.6 Gbps—it made the device available to all new fiber customers on eligible tariffs. Free took a similar approach earlier with its mid-range Freebox Pop, adding Wi-Fi 6 support in 2021 for new sign-ups without increasing the base subscription fee.

The absence of a Free-equivalent disruptor in Spain until the later arrival of DIGI, combined with a longstanding focus on bundling and content rather than CPE hardware and multi-gigabit tariffs for competitive differentiation, has likely been a key factor in dampening the adoption of Wi-Fi 6 and 7 in Spain.

DIGI's Emphasis on Modern CPE Drives Leadership in Wi-Fi 6 Penetration
Speedtest Intelligence® | January 2025

  • Telefónica’s Movistar: Movistar introduced its first Wi-Fi 6 CPE (Smart Wi-Fi 6) in mid-2022. The ISP initially sought to monetize the device, charging a one-time installation fee for existing customers while bundling it with a new high-speed multi-gigabit tariff. By January, Wi-Fi 6 accounted for as much as 19% of Movistar’s customer base, based on Speedtest sample share.

    The ISP leveraged its presence at MWC 2025 in Barcelona to unveil plans for a Wi-Fi 7 CPE solution, designed to harness the higher-speed multi-gigabit tariffs enabled by its XGS-PON upgrades and expansion. As it phases out legacy hardware, the ISP is accelerating the migration of subscribers from Wi-Fi 4 and 5 CPE, with Speedtest Intelligence data revealing a progressive decline in Wi-Fi 4 penetration since August last year in Movistar’s base.

    At the start of this year, it announced that all new Movistar fixed subscribers, regardless of tariff tier, would receive its Smart Wi-Fi 6 solution as standard, replacing the previous ‘HGU’ Wi-Fi 5-based offering and replicating the strategy of DIGI.

Movistar is Making Progress in Driving Down Wi-Fi 4 Usage
Speedtest Intelligence® | January 2025

  • Orange: Orange was among the first major ISPs in Spain to introduce Wi-Fi 6 CPE, bringing its Livebox 6 and later Livebox 7 solutions from France to the Spanish market starting in 2021, later extending them to sub-brands like Jazztel. The ISP provided this CPE free of charge to new customers across all tariffs, regardless of speed tier. Like Movistar, it initially charged existing subscribers a (monthly, in this case) fee to upgrade to the new hardware. This relatively early and widespread deployment has given Orange a lead in Wi-Fi 6 adoption over Movistar, with as much as 35% of connections on the ISP using the standard by January, based on Speedtest sample share.

    The ISP has since introduced the ‘Livebox Wi-Fi 7’ CPE solution, bundled with a new suite of 10 Gbps converged fiber tariffs. Leveraging Orange’s XGS-PON footprint, it offers among the highest advertised provisioned speeds in the Spanish market.
  • Vodafone: Vodafone introduced its ‘Wi-Fi 6 Station’ in Spain around mid-2021, making it one of the earliest Wi-Fi 6 solutions in the market. However, the ISP positioned it as a premium add-on rather than a standard feature. While new customers could access the Wi-Fi 6 Station, it was initially bundled with Vodafone’s ‘Super Wi-Fi 6’ service, which required a monthly rental fee unless they were on the top Gigabit plan.

    As a result, customers who did not opt in and pay extra continued to receive the older Wi-Fi 5-based CPE by default (similar to many other ISPs). This approach, combined with the legacy composition of Vodafone’s HFC (hybrid fiber-coaxial) base,  has left the ISP’s Wi-Fi 6 adoption lagging behind competitors, with fewer than 14% of its connections using the standard by January based on Speedtest sample share. 

DIGI is the only Spanish ISP where Wi-Fi 6 penetration surpasses Wi-Fi 5
Speedtest Intelligence® | January 2025

  • DIGI: Unlike other ISPs managing a diverse base of legacy customers across various access technologies and CPE generations, DIGI’s relatively recent entry into the Spanish market has given it a significant competitive advantage, allowing it to build a subscriber base largely equipped with newer Wi-Fi CPE. 

    In early 2022, the ISP introduced a Wi-Fi 6 CPE solution for all its fiber subscribers at no additional cost, ensuring that even customers on DIGI’s basic tariffs received the latest Wi-Fi hardware. This approach has driven rapid Wi-Fi 6 adoption, with penetration surpassing 46% by January. DIGI remains the only Spanish ISP where Wi-Fi 6 represents a larger share of its connection base than Wi-Fi 5, contributing to its lead in fixed download speed performance in the market.

    Building on this, last year, DIGI became the first Spanish ISP to launch a Wi-Fi 7 CPE solution in partnership with ZTE, initially bundling the hardware with its premium ‘Pro-DIGI’ tariffs, which leverage XGS-PON to offer advertised symmetrical speeds of up to 10 Gbps. However, adoption remains limited, with Wi-Fi 7 accounting for less than 1% of Speedtest samples on DIGI in January.

Newer Wi-Fi standards enhance performance across all metrics and Spanish ISPs

Despite the wide variation in Wi-Fi standard adoption among Spanish ISPs, the common feature is that newer CPE models drive significant performance improvements across all metrics. Most notably, Wi-Fi 6 and 7 are playing a key role in narrowing the performance gap between advertised fiber speeds—typically achievable via wired Ethernet—and real-world wireless performance in Spanish homes.

Wi-Fi 6 and Wi-Fi 7 Drive Substantial Performance Gains Across All ISPs and Metrics
Speedtest Intelligence® | January 2025

At the end of 2024, median download speeds on Wi-Fi 7 in Spain reached 664.25 Mbps, surpassing Wi-Fi 6 by 58% and more than doubling speeds on Wi-Fi 5. Median upload speeds on Wi-Fi 7, enhanced by features like Multi-Link Operation (MLO), which enables simultaneous transmissions across multiple spectrum bands, reached 449.69 Mbps—28% higher than Wi-Fi 6 and 51% above Wi-Fi 5. Wi-Fi 7 also delivered marked latency improvements, with a median latency of 19 ms, up to 12% lower than Wi-Fi 6.

Wi-Fi 7 is Key to Unlocking the Full Potential of Multi-Gigabit Fiber Tariffs
Speedtest Intelligence® | January 2025

The proliferation of multi-gigabit tariffs with XGS-PON, which has progressed more slowly in Spain than in other fiber-rich markets like France but is now accelerating thanks to moves by ISPs like DIGI and Orange, underlines the need for CPE capable of fully utilizing provisioned speeds and spreading gigabit performance throughout the home. Speedtest Intelligence data reveals that early Wi-Fi 7 CPE deployments are the first to achieve median download speeds exceeding 1 Gbps at the 90th percentile in Spain, showcasing how Wi-Fi 7’s technical advances like wider channel bandwidth and higher modulation are emerging as key differentiators for the technology in the premium segment.

Newer Wi-Fi Generations Drive Latency Improvements
Speedtest Intelligence® | January 2025

Driving adoption of newer Wi-Fi standards requires fresh strategies but create new revenue opportunities for ISPs

As advanced fiber markets like Spain mature, the focus is shifting from simply delivering gigabit speeds to the doorstep to ensuring seamless whole-home performance that meets the diverse demands of emerging connected devices. As a result, investments in enhancing the Wi-Fi experience through ISP-supplied CPE will be key to differentiating multi-gigabit tariffs beyond price and ensuring the full potential of fiber connections can be realised.

Spain must accelerate the modernization of its Wi-Fi base to fully capitalize on substantial investments in XGS-PON, deliver meaningful improvements in quality of experience (QoE) for consumers, and catch up with leading markets in the Nordics. Spanish ISPs can take cues from neighboring countries like France, where CPE upgrades are bundled with tariff speed upgrades, and targeted swap-and-replace programs systematically identify and phase out legacy Wi-Fi hardware to drive adoption of next-generation Wi-Fi 6 and 7 equipment. Recent moves by ISPs like Telefónica’s Movistar to sunset legacy CPE and provide Wi-Fi 6 solutions as standard are evidence of progress in this respect.

Leading European ISPs that have prioritized consumer awareness of Wi-Fi standards and their impact on fiber performance—while modernizing their Wi-Fi CPE base to support monetizable offerings like minimum speed guarantees in every room—are seeing tangible benefits. This strategy not only enhances the overall fixed broadband experience but also unlocks new revenue streams through service differentiation.


Rica en fibra y pobre en Wi-Fi: España ejemplifica la ‘enfermedad’ del Wi-Fi obsoleto

España lidera Europa en despliegue de fibra, pero está pagando el precio de descuidar la modernización de equipos Wi-Fi, lo que socava su competitividad global en rendimiento de banda ancha fija.

La notable transformación de España, que hace una década pasó de ser un país rezagado en telecomunicaciones a convertirse en líder mundial en disponibilidad de fibra, ha sido vertiginosa tanto en escala como en velocidad. Aclamada ampliamente como modelo de buenas prácticas, esta transformación ha desempeñado un papel clave para que el país se sitúe a la vanguardia de Europa en crecimiento económico durante los dos últimos años, apoyando la atracción de inversión en fabricación de precisión, energías renovables y una creciente comunidad de nómadas digitales.

Si el despliegue de fibra en el mayor número posible de hogares fuera una carrera de velocidad, España habría ganado sin duda alguna. Pero la verdadera carrera -la maratón de extender la cobertura gigabit a todo el hogar, más allá de la puerta- requiere modernizar los equipos Wi-Fi de las instalaciones del cliente (CPE). En este aspecto, España se está quedando rezagada, lo que merma su competitividad global en rendimiento de banda ancha fija y limita la capacidad de los proveedores de servicios de internet (ISP) españoles para diferenciarse en un mercado saturado con múltiples despliegues de fibra que se solapan. 

Este abismo entre las conexiones de fibra de alta capacidad que llegan a la mayoría de los hogares españoles y los anticuados equipos Wi-Fi que suministran esa conectividad a los dispositivos finales ejemplifica la paradoja de los “antiguos” mercados de fibra como España. Como pionera en fibra, España migró desde el cobre antes de que los modernos CPE Wi-Fi 6 y Wi-Fi 7 -diseñados para aprovechar al máximo el potencial multi-gigabit de la fibra- estuvieran ampliamente disponibles.

Aspectos Clave:

  • España cuenta con una de las huellas Wi-Fi más antiguas y menos capaces de Europa. A finales de 2024, dos tercios de todas las conexiones Wi-Fi en España todavía dependían de estándares heredados (Wi-Fi 4 y Wi-Fi 5), dejando al país notablemente por detrás de sus iguales con menor penetración de fibra, incluyendo la vecina Francia, el Reino Unido y todos los países nórdicos. Este profundo arraigo de los estándares Wi-Fi heredados está limitando artificialmente el rendimiento de las conexiones de fibra de España, contribuyendo a su bajo rendimiento en el Speedtest Global Index™ en comparación con países con un despliegue de fibra menos extenso.
  • Las capacidades de la huella Wi-Fi de España varían significativamente entre los distintos ISP. DIGI se ha distinguido por ofrecer CPE modernos con Wi-Fi 6 como estándar a toda su base de abonados, beneficiándose de su posición como nuevo operador sin una base de clientes heredada. Esto ha impulsado su fuerte liderazgo en la penetración de Wi-Fi 6 en España -casi la mitad de todas las muestras de Speedtest en conexiones de DIGI en enero utilizaban Wi-Fi 6 o 7, frente a menos de una cuarta parte en Movistar y Vodafone-, mejorando su rendimiento global de banda ancha fija. En comparación, los ISP que tardaron en introducir CPE modernos, como Movistar, o que restringieron el acceso a los abonados que optaron por complementos de alquiler de equipos premium, como Vodafone, conservan una cuota mucho mayor de usuarios con estándares Wi-Fi heredados.
  • Los CPE modernos con Wi-Fi 6 y 7 ofrecen importantes mejoras de rendimiento en todos los proveedores. La diferencia entre las velocidades de fibra anunciadas hasta la puerta de casa (normalmente alcanzables a través de Ethernet por cable) y el rendimiento Wi-Fi real es menor en los hogares en los que se han desplegado CPE Wi-Fi 6 y 7. A finales de 2024, las velocidades medianas de descarga en Wi-Fi 6 en España alcanzaron los 419,13 Mbps, superando las velocidades de Wi-Fi 5 en más de un 54% y el rendimiento de Wi-Fi 4 en un orden de magnitud. Mientras tanto, la latencia mediana de las conexiones Wi-Fi 7 (19 ms) mejoró notablemente en comparación con los resultados de los estándares Wi-Fi anteriores.

España, víctima de su propio éxito: desplegó fibra por todas partes antes de la llegada de Wi-Fi 6 y 7

España es un ejemplo típico de los retos que plantea el Wi-Fi heredado a los que fueron los primeros en adoptar la fibra óptica en Europa, países que se lanzaron a desplegar redes de fibra completa con tecnología GPON (Gigabit Passive Optical Network, red óptica pasiva Gigabit). En este sentido, Telefónica inició el despliegue de fibra a gran escala a principios de la década de 2010 y lo aceleró a partir de 2015. A finales de la década, España se había adelantado a la mayoría de los países en cobertura de fibra y en la migración desde la DSL basada en cobre, con una inversión que impulsó múltiples despliegues de fibra superpuestos en muchas zonas. 

A menudo se subestima la magnitud del éxito de España en el despliegue de fibra. El último índice DESI de la Comisión Europea indica que más del 95% de los hogares españoles contaban con una red de fibra óptica, lo que sitúa al país muy por encima de la media de la UE (64%). Esto ha colocado a España a una distancia asombrosa del objetivo de la Comisión para la Década Digital 2030 de lograr una cobertura total de fibra en todos los Estados miembros al final de la década.

España sigue liderando Europa en despliegue de fibra
Comisión Europea | DESI 2018-2024

Los despliegues iniciales de fibra en España a principios de 2010 coincidieron con el hecho de que el Wi-Fi 4 era el estándar de facto para muchos CPE suministrados por los operadores. De acuerdo con una norma de 2009, el Wi-Fi 4 ofrece velocidades máximas teóricas de descarga de hasta 600 Mbps. En el punto álgido del despliegue de fibra en la segunda mitad de la década, el Wi-Fi 5 se había convertido en el estándar de vanguardia, ofreciendo velocidades máximas de 3,5 Gbps y convirtiéndose gradualmente en dominante. Por ejemplo, en 2016, el CPE de fibra de Movistar contaba con un modelo Wi-Fi 5 de doble banda, considerado de gama alta en aquel momento.

Para cuando el Wi-Fi 6 (el primer estándar realmente diseñado para fibra multi-gigabit basado en XGS-PON -la última tecnología de redes ópticas que permite velocidades simétricas de hasta 10 Gbps-) estuvo disponible, los ISP españoles ya habían desplegado decenas de millones de CPE heredados. El análisis de los datos de Speedtest Intelligence revela que los CPE Wi-Fi 4 y Wi-Fi 5 han permanecido profundamente arraigados a la base de fibra de España, representando colectivamente más del 75% de todas las conexiones fijas en diciembre de 2024, según la cuota de muestras de Speedtest. 

La dinámica competitiva desempeña un papel clave en la configuración de los resultados de Wi-Fi de los distintos países e ISP

La gran cantidad de CPE Wi-Fi heredados en España contrasta fuertemente con otros países ricos en fibra, como la vecina Francia, otro líder europeo en despliegue de fibra a pesar de que ha ido a la zaga de España hasta hace pocos años. En diciembre de 2024, el Wi-Fi 6 representaba casi un tercio de todas las conexiones Wi-Fi en Francia, frente a menos de una cuarta parte en España.

Más allá del calendario de despliegue de fibra más tardío de Francia en comparación con el de España, es probable que la dinámica competitiva y el comportamiento de los consumidores hayan influido en las diferencias de adopción del Wi-Fi entre ambos países. Aunque el mercado fijo español es muy competitivo, ha estado liderado por unos pocos grandes operadores convergentes que tradicionalmente han dado prioridad al precio de los paquetes y a los contenidos frente a la inversión en CPE de vanguardia.

En su mayor parte, los ISP españoles han competido tradicionalmente en precio, contenido y niveles de velocidad, sin que las mejoras del CPE Wi-Fi se considerasen un diferenciador clave. En Francia, por el contrario, la entrada en el mercado de Free, de Iliad, a principios de la década pasada, intensificó la competencia no sólo en precios, sino también en innovación en la “caja de Internet”. Durante más de una década, Free marcó el ritmo del mercado integrando tecnología punta en sus pasarelas Freebox, desde servidores multimedia incorporados hasta Wi-Fi de alta gama.

La penetración del Wi-Fi 6 sigue creciendo lentamente en España
Speedtest Intelligence® | Enero 2025

Esto desencadenó una “guerra de cajas” en Francia, donde los operadores rivales se enfrentaron a la presión competitiva de actualizar periódicamente sus CPE para evitar ser superados. Por ejemplo, cuando Free introdujo un Freebox Wi-Fi 6 para nuevos abonados, Orange (Livebox 6) y Bouygues (Bbox Wi-Fi 6) no tardaron en lanzar sus propias ofertas, considerando el hardware como una característica competitiva clave para atraer abonados. 

Además, los ISP franceses solían incluir estas nuevas soluciones CPE sin coste adicional en las tarifas de fibra estándar. Cuando Orange lanzó el Livebox 6 en 2022 con soporte Wi-Fi 6E -aprovechando el espectro adicional en la banda de 6 GHz para aumentar las velocidades máximas teóricas a 9,6 Gbps- puso el dispositivo a disposición de todos los nuevos clientes de fibra con tarifas elegibles. Free ya había adoptado un enfoque similar con su Freebox Pop de gama media, añadiendo la compatibilidad con Wi-Fi 6 en 2021 para los nuevos suscriptores sin aumentar la cuota de suscripción básica.

La ausencia de un disruptor equivalente a Free en España hasta la posterior llegada de DIGI, combinada con un enfoque centrado desde hace tiempo en la paquetización y los contenidos más que en el hardware (CPE) y en las tarifas multi-gigabit para la diferenciación competitiva, ha sido probablemente un factor clave para frenar la adopción de Wi-Fi 6 y 7 en España.

Foco de DIGI en CPE modernos promueve liderazgo en la adopción de Wi-Fi 6
Speedtest Intelligence® | Enero 2025

  • Telefónica: Movistar introdujo su primer CPE Wi-Fi 6 (Smart Wi-Fi 6) a mediados de 2022. Inicialmente, el operador trató de rentabilizar el dispositivo cobrando una cuota única de instalación a los clientes y combinándolo con una nueva tarifa multi-gigabit de alta velocidad. En enero, el Wi-Fi 6 representaba hasta el 19% de la base de clientes de Movistar, según la cuota de muestreo de Speedtest. 

    El operador aprovechó su presencia en el MWC 2025 de Barcelona para desvelar sus planes para una solución CPE Wi-Fi 7, diseñada para aprovechar las tarifas multi-gigabit de mayor velocidad habilitadas por sus actualizaciones y ampliaciones XGS-PON. A medida que va eliminando hardware heredado, el operador está acelerando la migración de abonados desde CPE Wi-Fi 4 y 5. A este respecto, los datos de Speedtest Intelligence revelan un descenso progresivo de la penetración de Wi-Fi 4 desde agosto del año pasado en la base de Movistar. 

    A principios de este año, Movistar anunció que todos sus nuevos abonados de telefonía fija, independientemente del nivel de tarifa, recibirán su solución CPE ‘Smart Wi-Fi 6’, para sustituir la anterior oferta basada en Wi-Fi 5 ‘HGU’, replicando, así, la estrategia de DIGI.

Movistar avanza en la reducción del uso de Wi-Fi 4
Speedtest Intelligence® | Enero 2025

  • Orange: Orange fue uno de los primeros grandes operadores en España en introducir un CPE Wi-Fi 6, al traer sus soluciones Livebox 6 y más tarde Livebox 7 de Francia al mercado español a partir de 2021, y extenderlas más tarde a submarcas como Jazztel. El ISP proporcionó este CPE de forma gratuita a los nuevos clientes en todas las tarifas, independientemente del nivel de velocidad. Al igual que Movistar, cobró inicialmente a los abonados existentes una cuota (mensual, en este caso) para actualizar al nuevo hardware. Este despliegue relativamente temprano y generalizado ha dado a Orange una ventaja en la adopción de Wi-Fi 6 sobre Movistar, con hasta un 35% de sus conexiones utilizando el estándar en enero, según la cuota de muestra de Speedtest.

    Desde entonces, el operador ha introducido la solución CPE ‘Livebox Wi-Fi 7’, incluida en un nuevo paquete de tarifas de fibra convergente de 10 Gbps. Aprovechando la huella XGS-PON de Orange, ofrece las velocidades más altas anunciadas en el mercado español.
  • Vodafone: Vodafone introdujo su ‘Wi-Fi 6 Station’ en España a mediados de 2021, lo que la convierte en una de las primeras soluciones Wi-Fi 6 del mercado. Sin embargo, el proveedor la posicionó como un complemento premium más que como una característica estándar. Aunque los nuevos clientes podían acceder al router Wi-Fi 6, en un principio estaba vinculado al servicio ‘Súper Wi-Fi 6’, que exigía una cuota mensual de alquiler a menos que estuvieran en el plan gigabit superior. 

    En consecuencia, los clientes que no optaban por este servicio ni pagaban una cuota adicional seguían recibiendo por defecto el antiguo CPE basado en Wi-Fi 5 (al igual que en el caso de muchos otros operadores). Este enfoque, combinado con la composición heredada de la base HFC (fibra híbrida coaxial) de Vodafone, ha dejado la adopción de Wi-Fi 6 por parte del operador por detrás de sus competidores, con menos del 14% de sus conexiones utilizando este estándar en enero según la cuota de muestreo de Speedtest. 

DIGI es el único ISP español en el que la penetración de Wi-Fi 6 supera la de Wi-Fi 5
Speedtest Intelligence® | Enero 2025

  • DIGI: A diferencia de otros ISP que gestionan una base diversa de clientes heredados a través de diversas tecnologías de acceso y generaciones de CPE, la entrada relativamente reciente de DIGI en el mercado español le ha dado una ventaja competitiva significativa, lo que le ha permitido construir una base de suscriptores en gran parte equipada con CPE Wi-Fi más nuevos. 

    A principios de 2022, el operador introdujo una solución Wi-Fi 6 CPE para todos sus abonados de fibra sin coste adicional, garantizando que incluso los clientes de las tarifas básicas de DIGI recibieran el hardware Wi-Fi más reciente. Este enfoque ha impulsado la rápida adopción del Wi-Fi 6, con una penetración superior al 46% en enero. DIGI sigue siendo el único proveedor español en el que el Wi-Fi 6 representa una cuota mayor de su base de conexiones que Wi-Fi 5, lo que contribuye a su liderazgo en rendimiento de velocidad de descarga fija en el mercado

    Sobre esta base, el año pasado DIGI se convirtió en el primer operador español en lanzar una solución CPE Wi-Fi 7 en colaboración con ZTE, e incluyó inicialmente el hardware con sus tarifas premium ‘Pro-DIGI’, que aprovechan XGS-PON para ofrecer velocidades simétricas anunciadas de hasta 10 Gbps. Sin embargo, la adopción sigue siendo limitada, y el Wi-Fi 7 representó menos del 1% de las muestras de Speedtest en DIGI en enero.

Los nuevos estándares Wi-Fi mejoran el rendimiento en todas las métricas e ISP españoles

A pesar de la amplia variación en la adopción de estándares Wi-Fi entre los ISP españoles, un resultado común es que los nuevos modelos de CPE impulsan mejoras en el rendimiento significativas en todas las métricas. En particular, Wi-Fi 6 y Wi-Fi 7 desempeñan un papel clave en la reducción de la diferencia entre las velocidades de fibra anunciadas -que normalmente se consiguen a través de Ethernet por cable- y el rendimiento inalámbrico real en los hogares españoles.

Wi-Fi 6 y Wi-Fi 7 impulsan mejoras sustanciales en todos los ISP y métricas
Speedtest Intelligence® | Enero 2025

A finales de 2024, las velocidades medianas de descarga en Wi-Fi 7 en España alcanzaron los 664,25 Mbps, superando las de Wi-Fi 6 en un 58% y duplicando con creces las velocidades de Wi-Fi 5. Por su parte, las velocidades medianas de carga en Wi-Fi 7, mejoradas por características como la Operación Multienlace (MLO), que permite transmisiones simultáneas a través de múltiples bandas de espectro, alcanzaron los 449,69 Mbps, un 28% más que en Wi-Fi 6 y un 51% por encima de Wi-Fi 5. El Wi-Fi 7 también ofreció notables mejoras de latencia, con una latencia mediana de 19 ms, hasta un 12% inferior a la de Wi-Fi 6.

Wi-Fi 7 es clave para aprovechar el potencial de las tarifas de fibra multi gigabit
Speedtest Intelligence® | Enero 2025

La proliferación de tarifas multi-gigabit con XGS-PON, que ha progresado más lentamente en España que en otros mercados ricos en fibra, como Francia, pero que ahora se está acelerando gracias a los movimientos de operadores como DIGI y Orange, subraya la necesidad de CPE capaces de utilizar plenamente las velocidades provisionadas y extender el rendimiento gigabit por todo el hogar. Los datos de Speedtest Intelligence revelan que los primeros despliegues de CPE Wi-Fi 7 son los primeros en alcanzar velocidades medias de descarga superiores a 1 Gbps en el percentil 90 en España, lo que demuestra cómo los avances técnicos de Wi-Fi 7, como un mayor ancho de banda de canal y una modulación más alta, se están convirtiendo en diferenciadores clave de la tecnología en el segmento premium.

Las nuevas generaciones de Wi-Fi promueven mejoras en la latencia
Speedtest Intelligence® | Enero 2025

Impulsar la adopción de los nuevos estándares Wi-Fi requiere nuevas estrategias, pero crea nuevas oportunidades de ingresos para los ISP

A medida que los mercados avanzados de fibra (como el español) maduran, la atención pasa de centrarse simplemente en ofrecer velocidades gigabit hasta la puerta de casa a garantizar un rendimiento sin fisuras en todo el hogar, que satisfaga las diversas demandas de los dispositivos conectados emergentes. Como resultado, las inversiones para mejorar la experiencia Wi-Fi a través del CPE suministrado por el ISP serán clave para diferenciar las tarifas multi-gigabit más allá del precio y garantizar que se pueda aprovechar todo el potencial de las conexiones de fibra. 

España debe acelerar la modernización de su base Wi-Fi para capitalizar plenamente las importantes inversiones en XGS-PON, ofrecer mejoras significativas en la calidad de la experiencia (QoE) para los consumidores y alcanzar a los mercados líderes de los países nórdicos. Los operadores españoles pueden seguir el ejemplo de países vecinos como Francia, donde las actualizaciones de CPE se incluyen en las actualizaciones de velocidad de las tarifas, y los programas de intercambio y sustitución identifican y eliminan sistemáticamente el hardware Wi-Fi heredado para impulsar la adopción de equipos Wi-Fi 6 y 7 de nueva generación. Los recientes movimientos de ISP como Movistar para eliminar el CPE heredado y ofrecer soluciones Wi-Fi 6 de serie son una prueba de los avances en este sentido.

Los principales ISP europeos que han dado prioridad a la concienciación de los consumidores sobre los estándares Wi-Fi y su impacto en el rendimiento de la fibra, al tiempo que han modernizado su base de CPE Wi-Fi para dar soporte a ofertas rentables como las garantías de velocidad mínima en cada habitación, están viendo beneficios tangibles. Esta estrategia no sólo mejora la experiencia general de la banda ancha fija, sino que también desbloquea nuevas fuentes de ingresos a través de la diferenciación del servicio.

Ookla retains ownership of this article including all of the intellectual property rights, data, content graphs and analysis. This article may not be quoted, reproduced, distributed or published for any commercial purpose without prior consent. Members of the press and others using the findings in this article for non-commercial purposes are welcome to publicly share and link to report information with attribution to Ookla.

| November 6, 2025

Why Satellite Broadband Is Becoming a Bigger Part of U.S. Rural Connectivity Plans

Expanding broadband isn’t just about laying more fiber. It’s about finding practical ways to reach the rugged, rural, and hard-to-serve places where traditional infrastructure projects are slow or cost-prohibitive. That challenge is at the heart of the National Telecommunications and Information Administration’s BEAD program, which is fueling one of the largest broadband infrastructure efforts in U.S. history. Fiber networks remain at the center of those plans, but the high cost and complexity of reaching remote regions means fiber alone won’t connect everyone quickly or affordably.

Because fiber and fixed wireless can’t cover every corner of the country, states are increasingly turning to satellite broadband to reach the most challenging locations. Low-Earth orbit (LEO) providers like Starlink and Amazon Kuiper are being factored into BEAD strategies as practical solutions for areas where traditional infrastructure isn’t financially or logistically viable. States like Maine and Hawaii have already used satellite service to reach homes in remote and geographically complex areas where fiber or fixed wireless deployments would be slow or cost-prohibitive.

For states looking to connect their most difficult-to-serve communities, understanding how satellite fits into the rural broadband mix is becoming essential. Watch our recent webinar where we’re joined by broadband leaders from Maine and Hawaii for a discussion on performance trends, policy implications, and the evolving role of satellite broadband.

Satellites Are Playing a Bigger Role in BEAD Allocations

Extending broadband into rural, sparsely populated, and geographically challenging areas has always required tradeoffs between cost, timelines, and technology. Fiber may deliver the strongest long-term performance, but extending it to extremely rural or geographically isolated areas can cost hundreds of thousands of dollars per location and take years to complete. In Alaska, for example, Quintillion Subsea is receiving more than $113,000 per address to extend fiber—underscoring just how expensive these builds can be. Those realities have forced states to look at a wider mix of technologies, and satellite connectivity has quickly become part of that conversation.

BEAD allocations are already reflecting this shift. While fiber remains the dominant technology, satellite internet’s growing share shows that states aren’t treating it as a niche option; many are planning for it as a complementary piece of their buildout strategies—particularly in places where fiber or fixed wireless is too expensive or complex to deploy.

  • Fiber is receiving bulk of BEAD funds: Fiber accounts for the majority of BEAD allocations, but satellite internet has carved out a meaningful share of initial awards across several states.
  • Starlink and Kuiper entering the picture: Starlink currently represents about 3% of BEAD funding awarded so far, with Amazon Kuiper just under 1%.
  • Rising confidence in satellite internet: The share of BEAD dollars directed to satellite internet signals increasing trust in the technology as a practical option for reaching rural and hard-to-serve communities.

Even a small share of BEAD funding can cover areas where fiber builds would have stalled or taken years. Satellite connectivity is moving from a fallback option to a planned part of many states’ broadband strategies.

Real-World Deployments Show How States Are Using Satellites

The shift toward satellite connectivity is happening now. States are already using LEO satellite service to close stubborn coverage gaps that traditional infrastructure can’t reach quickly or affordably. Maine and Hawaii offer two clear examples of how the technology is being put to work today.

These states face some of the toughest connectivity challenges in the country—from remote islands and mountainous terrain to areas where no infrastructure exists at all. Instead of waiting for long fiber construction timelines, both turned to satellite as a fast bridge to reliable service. In the webinar, we got a closer look at how Maine and Hawaii are using satellite:

  • “Working Internet ASAP” connecting unserved homes: Maine’s Working Internet ASAP program provided more than 8,800 unserved locations with free Starlink kits and installation, focusing on households with no service options of any kind.
  • Hawaii blending fiber and satellite: Hawaii’s approach combines fiber and satellite internet to reach rural areas, where cutting through lava rock or laying undersea cables would be prohibitively expensive.
  • Early deployments tied to BEAD: Both states are aligning their satellite connectivity efforts with BEAD planning so those initial builds can transition smoothly into long-term programs.

The early adoption of satellite internet reflects both a shift in policy and a leap in performance, moving the technology from a last-resort option to an intentional part of state broadband strategies.

Strengths and Limits of LEO Satellite Technology

LEO satellite connectivity has advanced quickly in the past decade. The technology is now capable of delivering broadband speeds to places that were once all but unreachable. Locations that would have required massive fiber investments or been written off entirely can now be connected far more quickly. That shift is reshaping how states and providers think about rural deployment strategies.

Massive increases in spectral efficiency, falling launch costs, and cheaper user equipment have made satellite internet both faster and more widely available. Several technical and economic factors are driving this expansion, while also shaping where the technology is most effective.

  • Localized congestion remains a factor: Network slowdowns can occur in high-traffic areas, as seen in Pershing County, Nevada during the Burning Man festival.
  • Spectrum reuse driving capacity gains: Satellites now use more focused “spot beams” that cover smaller geographic areas. Dividing coverage into smaller zones allows providers to reuse the same frequencies in different places, which increases total network capacity without needing additional spectrum.
  • Lower costs enabling large constellations: Falling launch and build costs have made it financially feasible to deploy thousands of satellites, dramatically expanding the scale and reach of satellite internet networks.
  • Wider coverage, but limited density: Satellites can now cover nearly every corner of the country, but overall capacity remains best suited for low-density regions. Heavy usage in concentrated areas can still strain the network, and in some locations providers have introduced usage tiers or surcharges to manage excess demand.

Satellite connectivity plays a critical role in reaching rural and remote communities where fiber or fixed wireless is impractical or too expensive. It works best as one piece of a broader broadband strategy that blends multiple technologies to reach every corner of a state.

Reliability, Compliance, and Performance Monitoring

When states invest millions to bring broadband to rural communities, delivering a signal isn’t enough. Those connections need to support everyday needs like work, school, telehealth, and emergency services with consistent speeds, low latency, and reliable uptime (the amount of time a connection is available and working as expected), giving users a dependable experience day in and day out. To make sure that happens, states are moving beyond one-time performance checks at installation—where service is validated only on day one—and putting systems in place to measure how well connections perform over time.

Starlink’s latency in the U.S. averages around 40 milliseconds, well below BEAD’s 100 ms requirement—a strong indicator that the technology can meet performance targets. But environmental factors can still affect individual sites. Snow, ice, or tree cover can interfere with line-of-sight and impact connection quality, though professional setups help minimize those disruptions. States are starting to define how they’ll verify performance, ensure service meets funding benchmarks, and build accountability into satellite deployments.

  • Independent verification tools: Speedtest and other third-party platforms can help verify that real-world performance matches program requirements.
  • Strong reliability signals in Maine: The state has reported minimal complaints from satellite internet users, a good indicator of reliable service in hard-to-serve areas.
  • Hawaii adapting regulatory frameworks: Hawaii is modifying existing regulatory frameworks to ensure providers meet performance expectations under BEAD-funded deployments.
  • Enforcement mechanisms still developing: Oversight and accountability frameworks are expected to mature as satellite deployments scale.

Satellites can bring broadband to rural communities quickly, but speed alone isn’t the goal. States are putting new systems in place to make sure that connectivity remains consistent, reliable, and measurable over time.

Competition and Capacity Will Shape What Comes Next

Satellite connectivity is moving into a new phase—one defined less by proving it works and more by deciding how to use it at scale. As states plan their long-term broadband strategies, they’ll be weighing technical tradeoffs, provider options, and capacity constraints in ways they haven’t had to before.

Amazon Kuiper’s upcoming commercial launch will introduce real competition for Starlink, giving states more than one major provider to consider for BEAD-funded deployments. Starlink relies on Ku band spectrum, which is generally less sensitive to weather interference, while Kuiper will use Ka band spectrum, which can support stronger uplink capacity but may be more vulnerable to signal loss in heavy rain.

The combination of band choice and network architecture will shape how each service performs and where it fits best. As competition heats up, several factors will shape how states evaluate satellite providers under BEAD.

  • Kuiper entering the market: Amazon Kuiper’s commercial launch will bring new competitive pressure to Starlink’s early lead, giving states more leverage and flexibility in future deployments.
  • Band differences shaping performance: Ku-band (used by Starlink) is less sensitive to weather, while Ka-band (planned for Kuiper) can support stronger uplink performance but may be more vulnerable to interference. These tradeoffs will influence where each provider’s technology is best suited.
  • Scaling capacity as a key challenge: Expanding network capacity as more users come online will be critical to maintaining performance, particularly in rural areas with seasonal demand spikes or high-density events.

As satellite competition ramps up, states will need to balance cost, coverage, and long-term performance when deciding how these technologies fit into their broadband strategies. The choices they make in the coming years—about providers, technologies, and capacity planning—will shape how quickly and reliably rural communities get connected.

Conclusion

Satellite broadband is no longer a fringe technology. It’s being deployed today in some of the toughest connectivity environments in the U.S., and BEAD allocations show it’s becoming part of state-level planning in a meaningful way. Maine and Hawaii are proving what’s possible when satellites are used strategically, while performance improvements make the technology more viable every year.

As competition increases and deployment strategies mature, satellites are poised to play an integral role in helping close the digital divide, complementing fiber and fixed wireless to deliver broader, faster, and more resilient connectivity. 

To learn more about the emergence of satellite internet, watch our full webinar on demand, “Satellite Internet Uncovered: Performance Trends and Policy Implications.” 

Ookla retains ownership of this article including all of the intellectual property rights, data, content graphs and analysis. This article may not be quoted, reproduced, distributed or published for any commercial purpose without prior consent. Members of the press and others using the findings in this article for non-commercial purposes are welcome to publicly share and link to report information with attribution to Ookla.