| December 2, 2024

Too Big to Fail? The Largest Outages in 2024 According to Downdetector

Our reliance on technology is so total that for many it feels like the world is ending when a popular site or service on the internet is inaccessible, and 2024 saw many outages that reminded us how much one such interruption can disrupt the daily lives of millions. We analyzed Downdetector® data from Q1-Q3 2024 to see where that pain of disconnection was felt most acutely. Read on to revisit the largest outages of 2024 at a global level and sorted by region.

Note that while some companies experienced more than one large outage during this time period, we’ve listed only the largest incident per company in each chart.

The world’s biggest outages this year

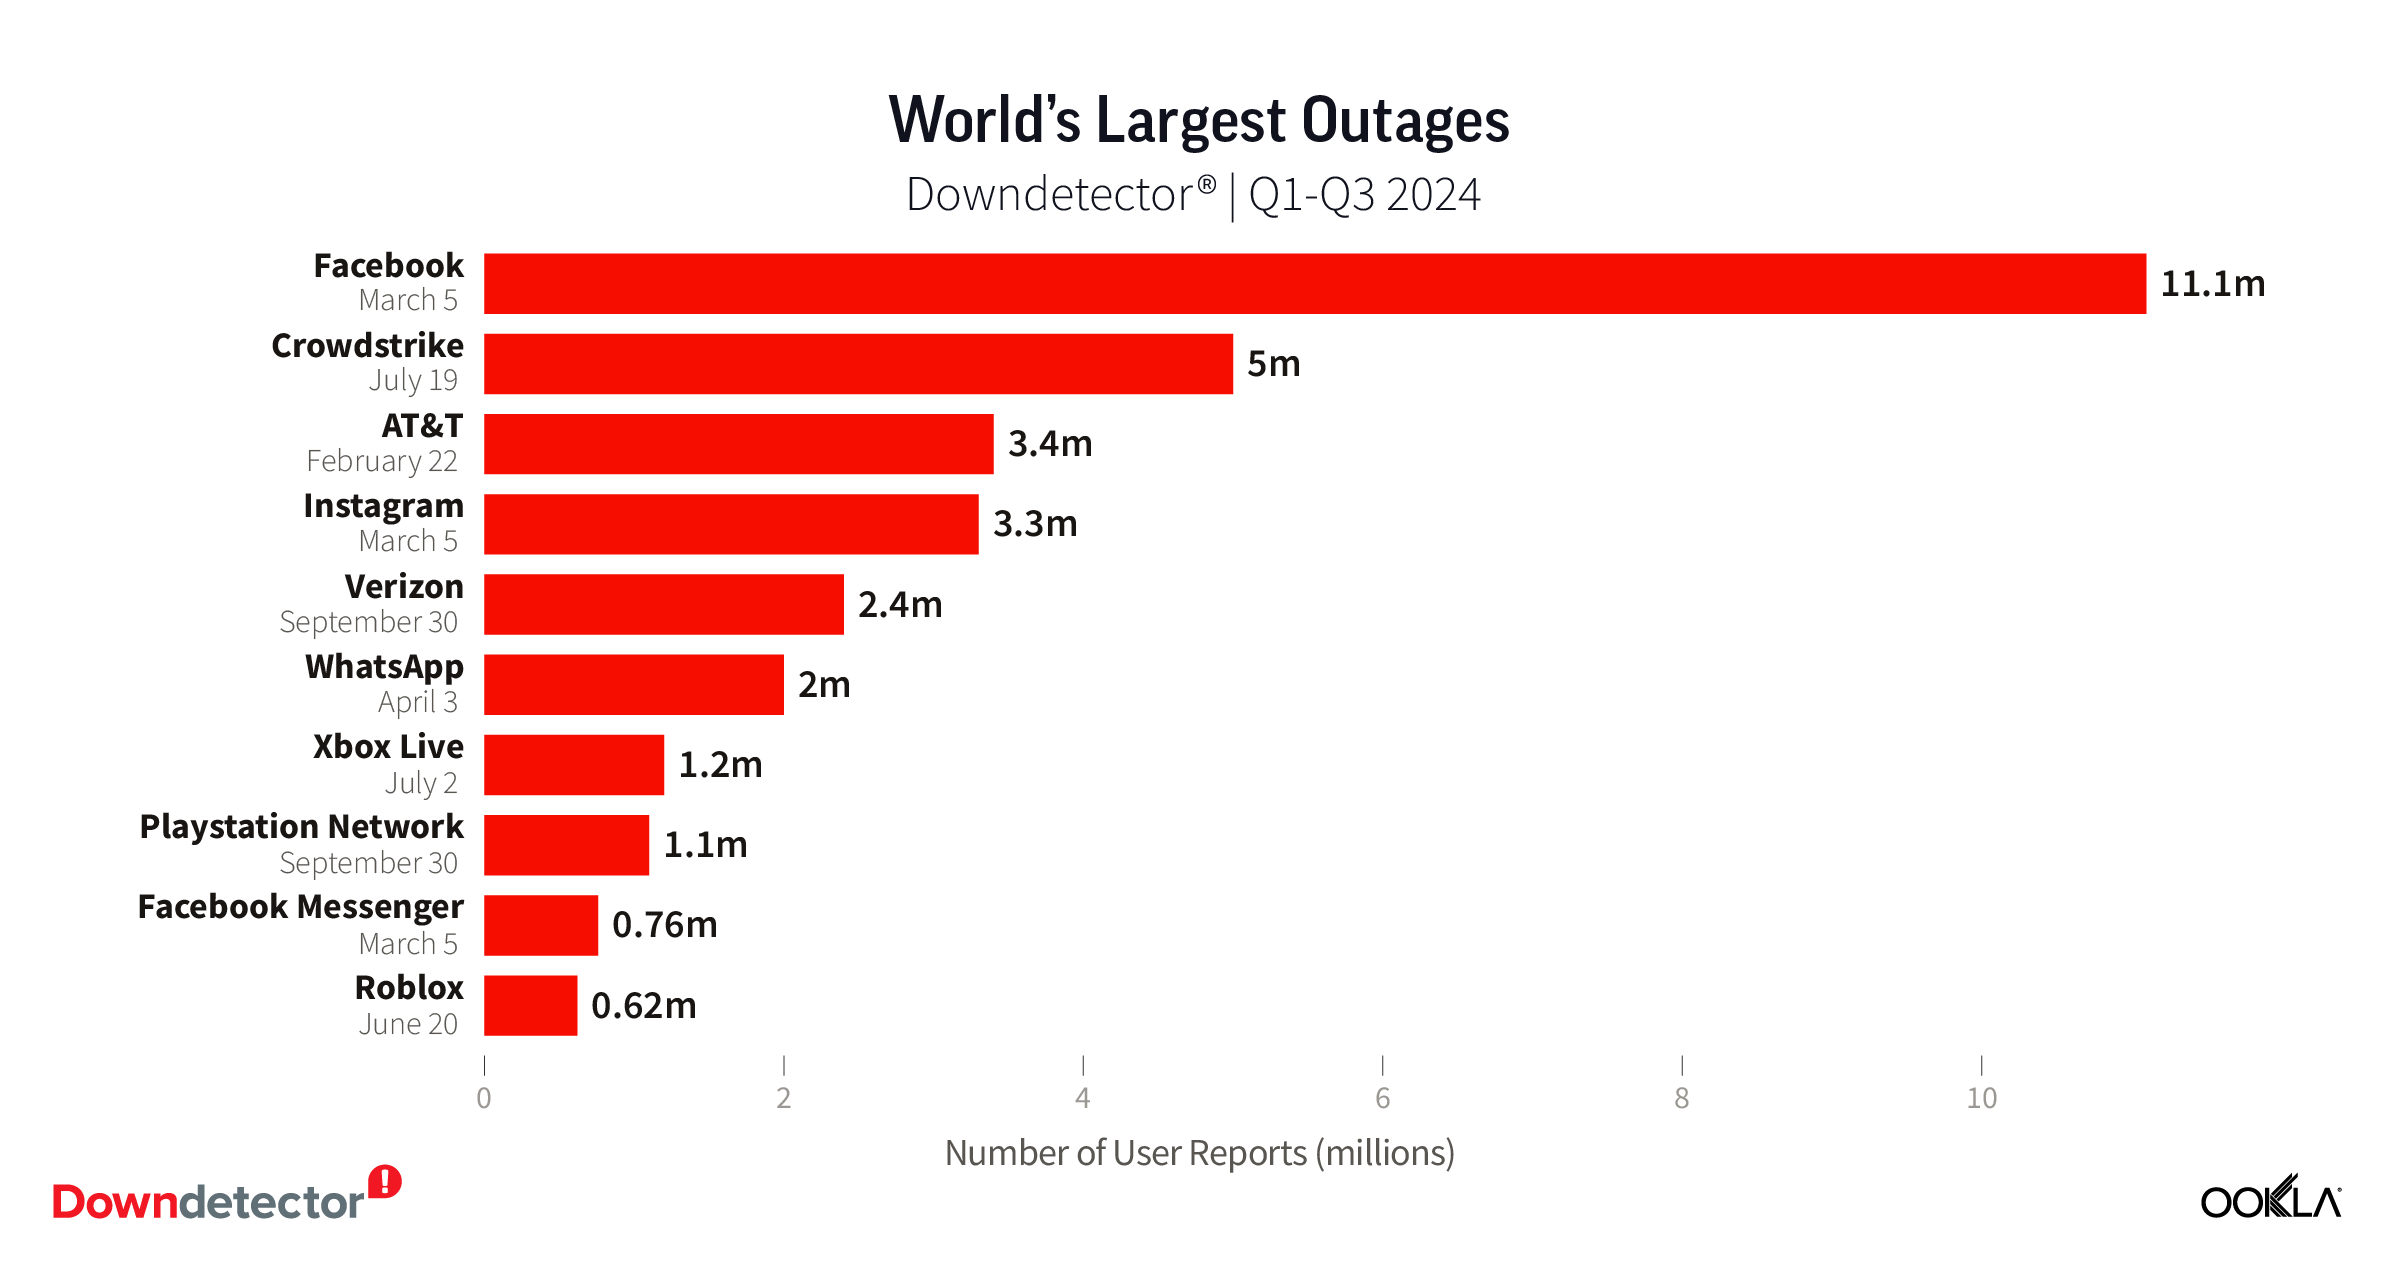
Chart of World's Largest Outage i, Downdetector, Q1-Q3 2024

Users of social media sites, internet providers, and gaming sites and services suffered the most disruptions this year according to Downdetector data on the world’s biggest outages. Facebook had the largest outage on our list. On March 5, over 11.1 million people across the world reported issues with the popular social media site.

The second largest global outage may be the most memorable. While CrowdStrike is not a service most people think of, we saw nearly 5 million reports to services that rely on it (or rely on Microsoft which relies on Crowdstrike), including emergency services, airlines, and ride sharing apps when a routine software update went bad on July 19.

AT&T suffered the third largest outage in the world, according to Downdetector data, when an equipment configuration error caused customers across the entire United States to lose network access for over 12 hours.

Biggest outages in each region

Asia Pacific region hit by global outages

Chart of Largest Outage in Asia-Pacific Region, Downdetector, Q1-Q3 2024

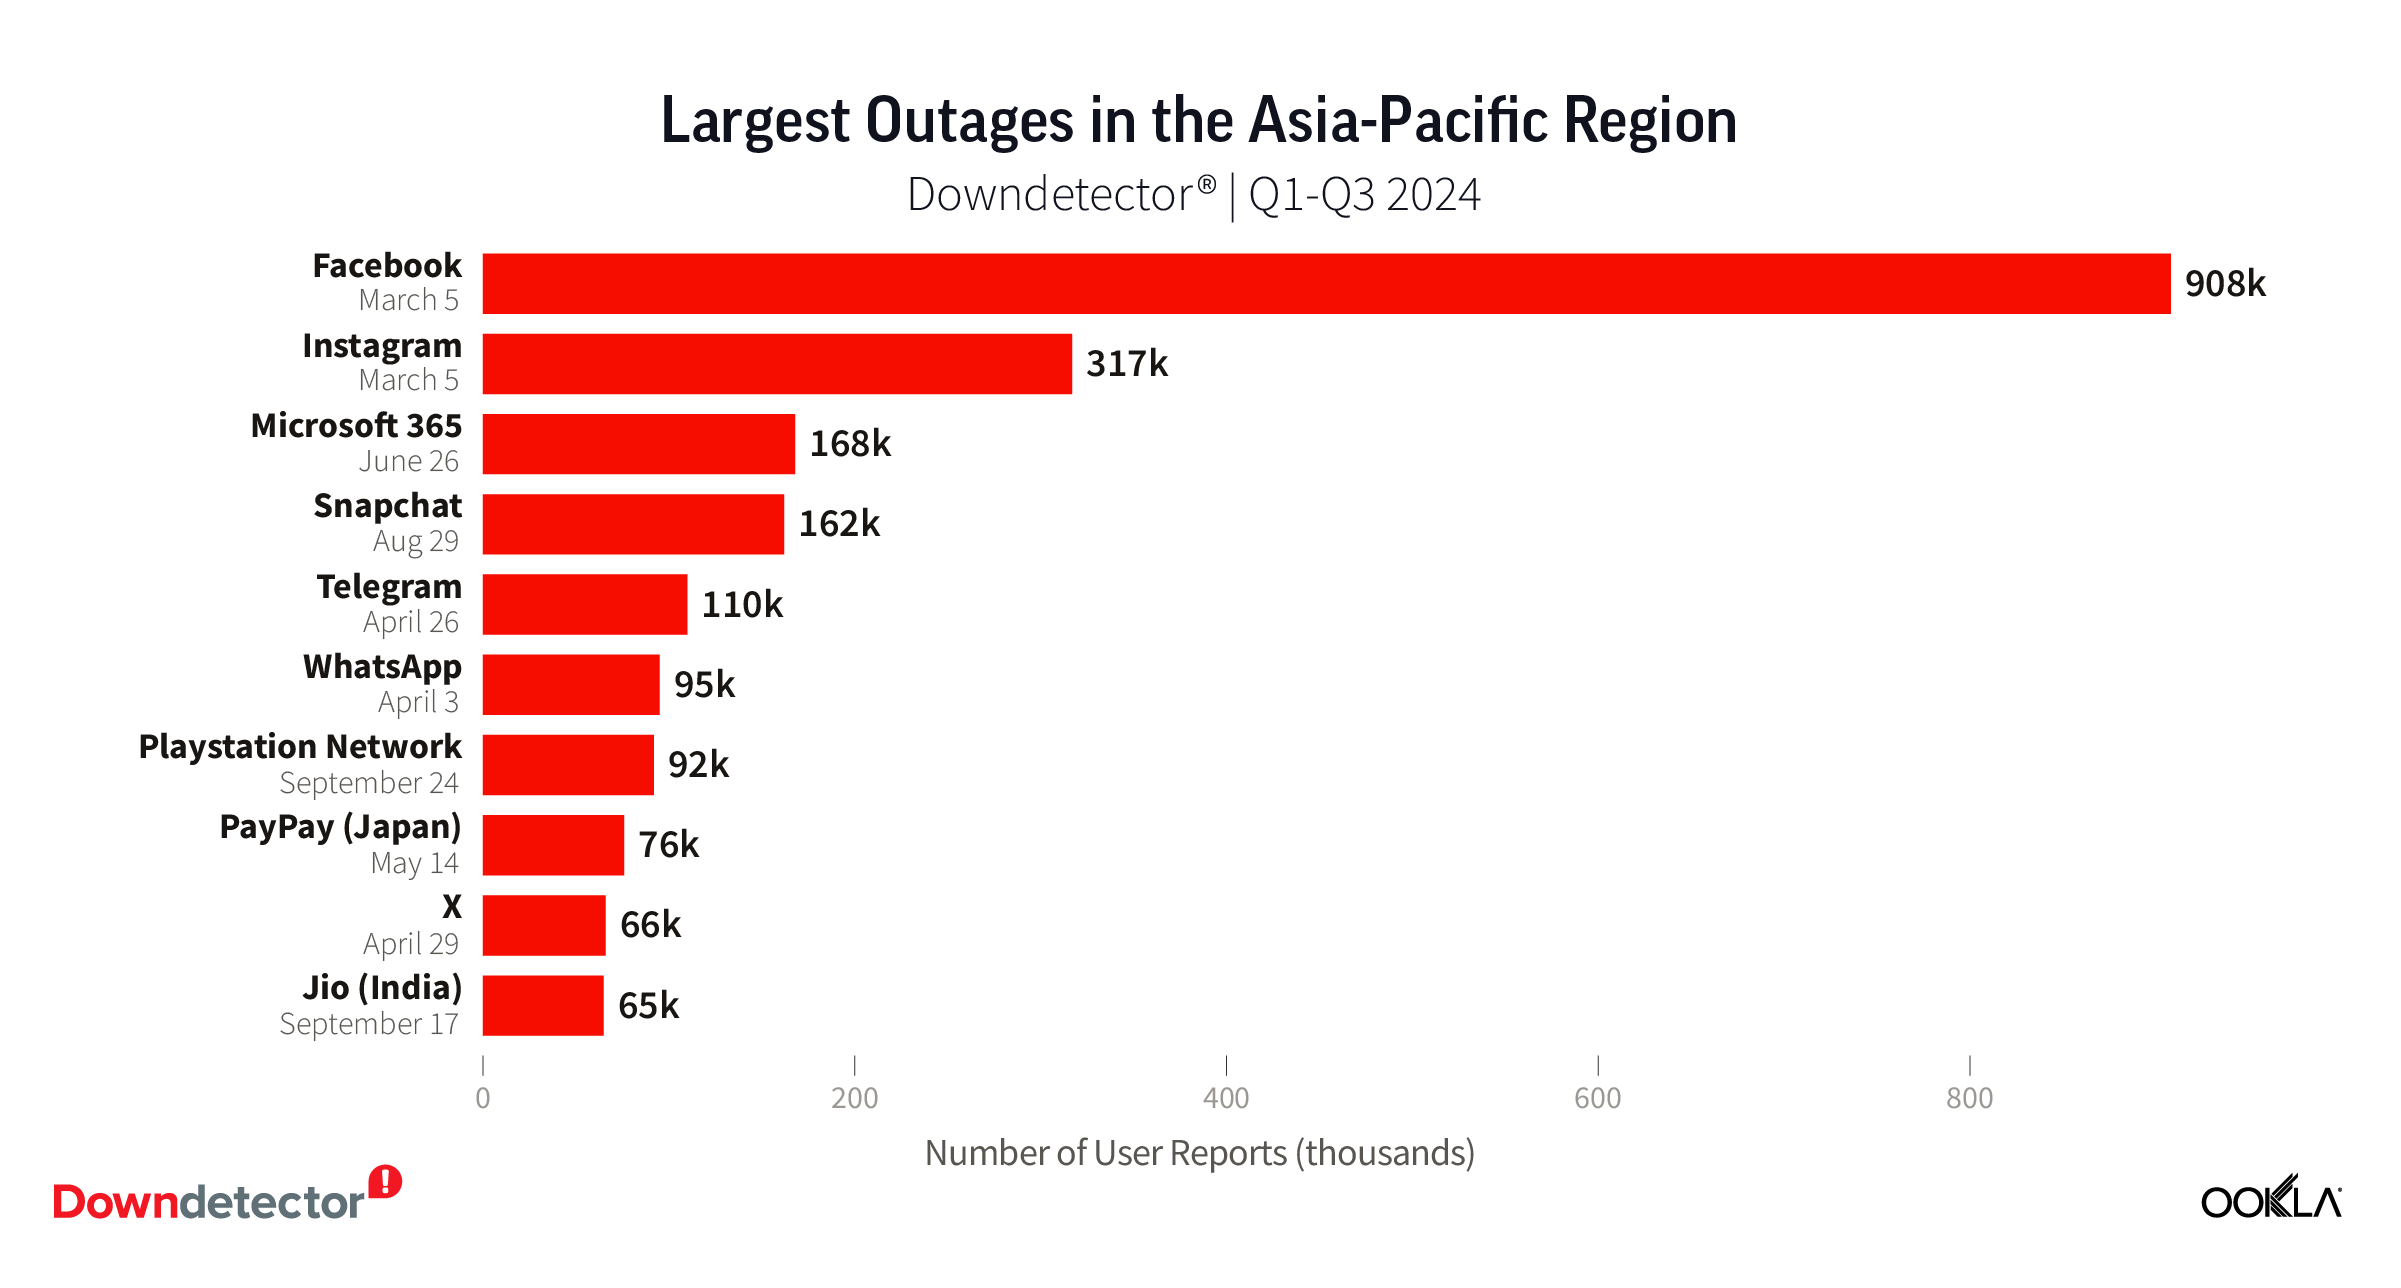
The March 5 Facebook outage also topped the list of outages in the Asia-Pacific region, instigating over 908k user reports to Downdetector and taking Instagram down with it as the second largest outage. The third largest outage happened on June 26 when over 168k Microsoft 365 users in the Asia-Pacific region reported service disruptions on the service. Japan was especially hard hit with over 139k user reports from that country alone.

People in the Asia-Pacific region were also affected by local outages, with over 76k users reporting issues with Japanese payment system PayPay in May, and 65k users in India reported issues with Jio during a September service disruption.

Europe struggles with social media sites

Chart of Largest Outage in Europe, Downdetector, Q1-Q3 2024

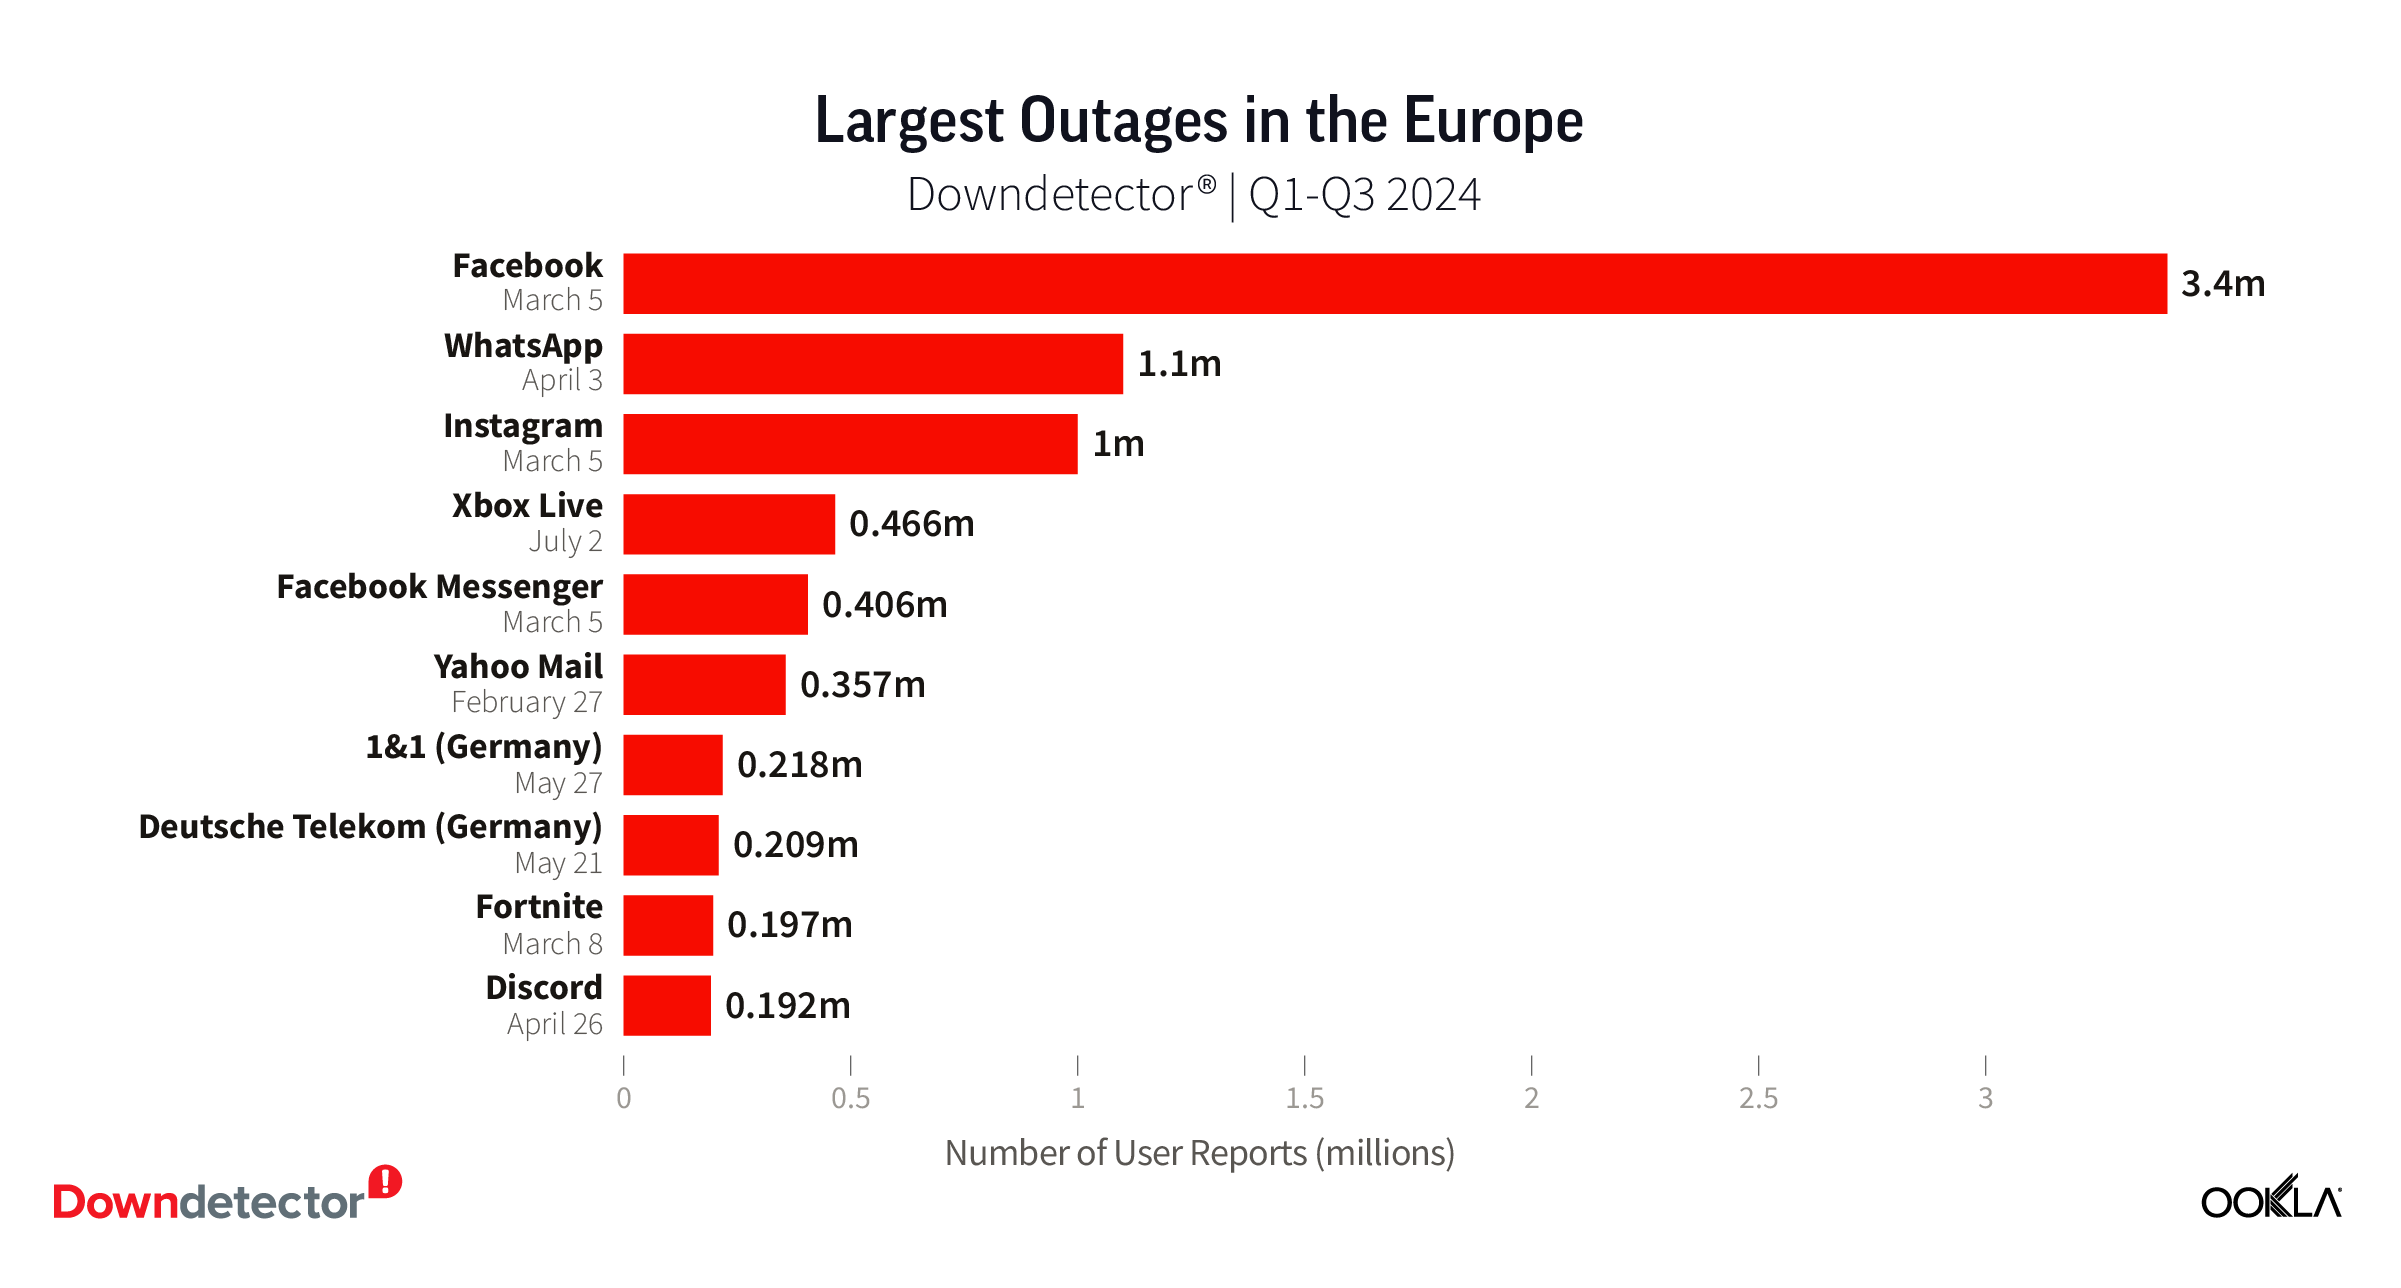
Social media sites were the main source of disconnection in Europe according to data from Downdetector. Over 3.4 million European users reported issues with Facebook during the March 5 outage, making that the largest outage in Europe during Q1-Q3 2024. WhatsApp users suffered the second largest outage in Europe with over 1.1 million people reporting issues during an outage in early April.

Two German companies also showed up on our list of largest outages in Europe with over 218k reports of issues with 1&1 and over 209k reports of issues with Deutsche Telekom when the two companies experienced service disruptions almost a week apart in late May.

Latin America feels pain from global social outages

Chart of Largest Outage in Latin America, Downdetector, Q1-Q3 2024

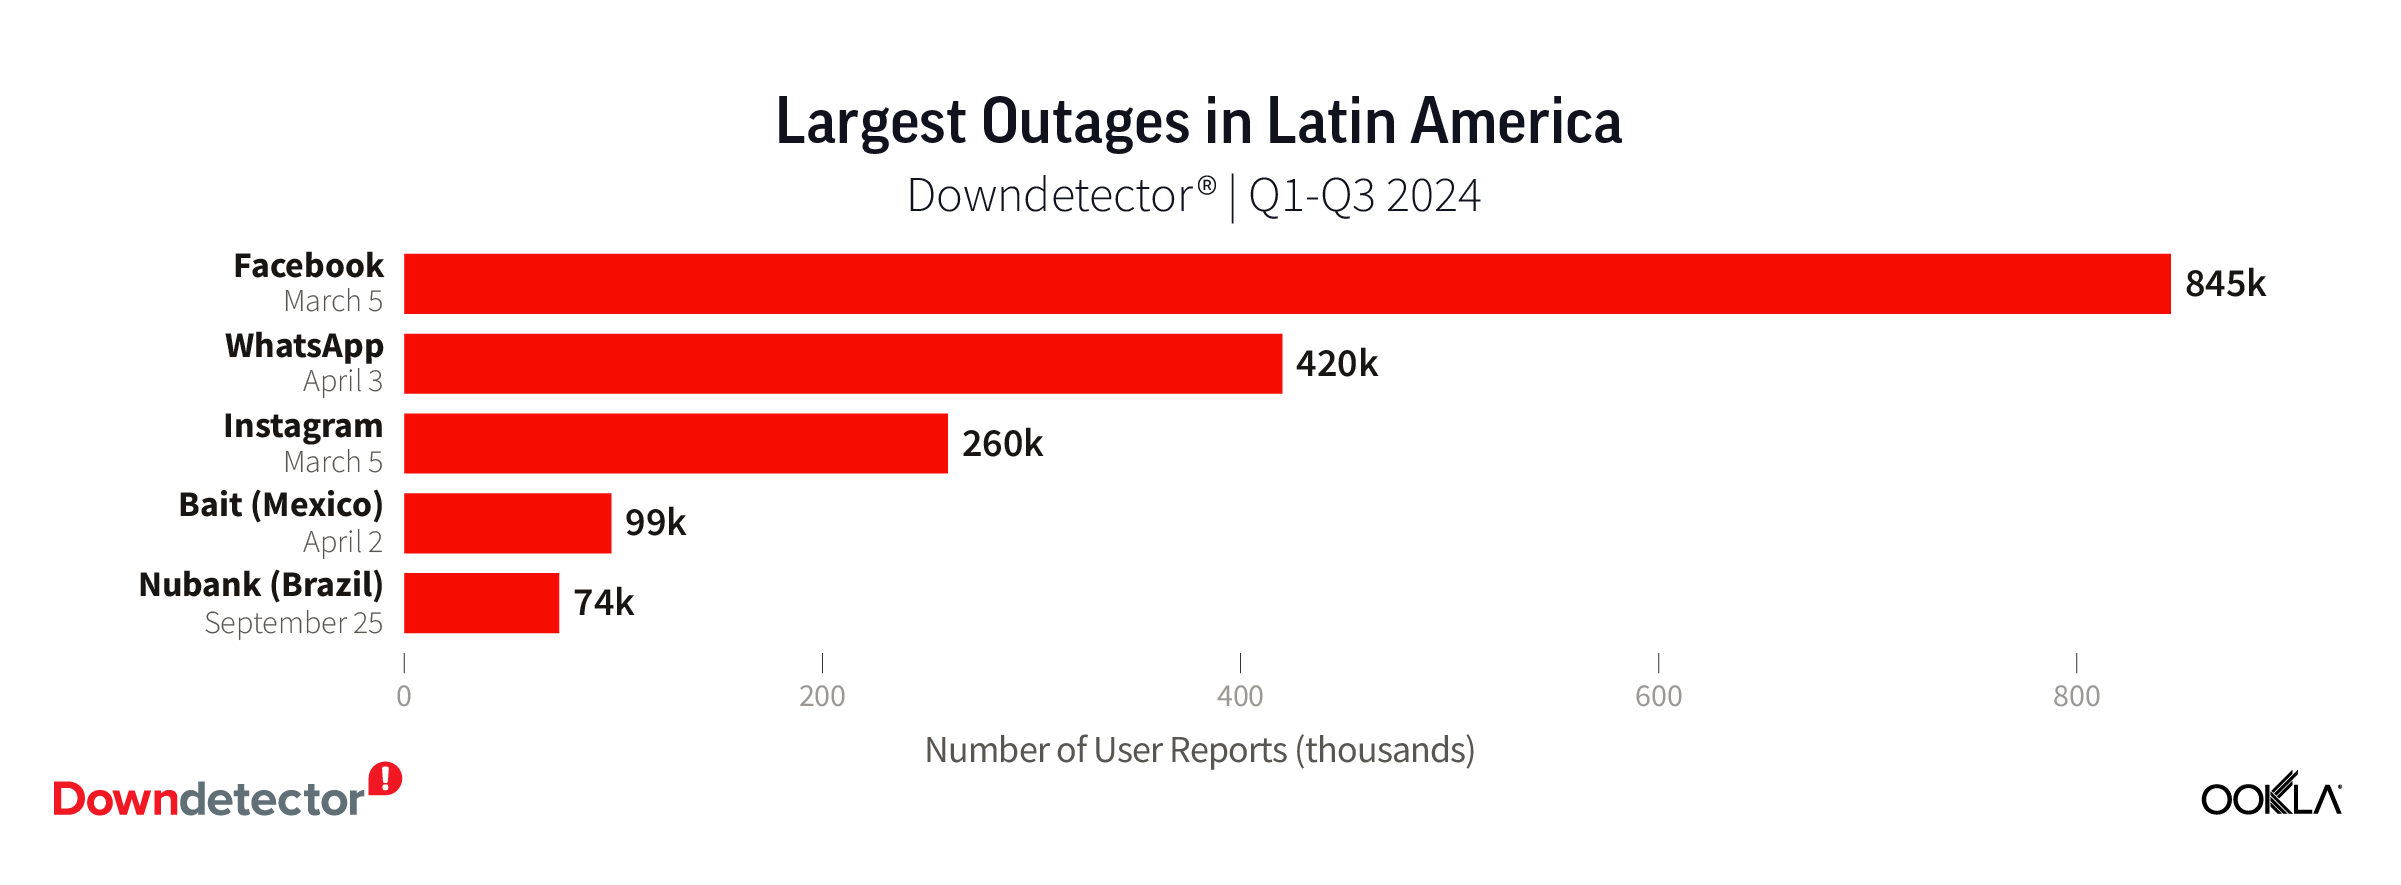
Latin America’s top three outages mirrored those in Europe with social media sites causing the most pain for users according to data from Downdetector. The March 5 Facebook outage was felt profoundly with almost 850k user reports on Downdetector in Latin America for issues related to Facebook and over 260k related to Instagram. WhatsApp had the second largest outage in the region with almost 420k user reports during the two hours the service was down on April 3.

Bait, a Mexican Mobile Virtual Network Operator (MVNO) owned by Walmart, suffered an outage on April 2 where almost 99k users reported issues to Downdetector. And on September 24, over 74k users reported issues with Brazilian fintech bank Nubank.

Middle East and Africa experience mix of local and global outages

Chart of Largest Outage in the Middle East and Africa, Downdetector, Q1-Q3 2024

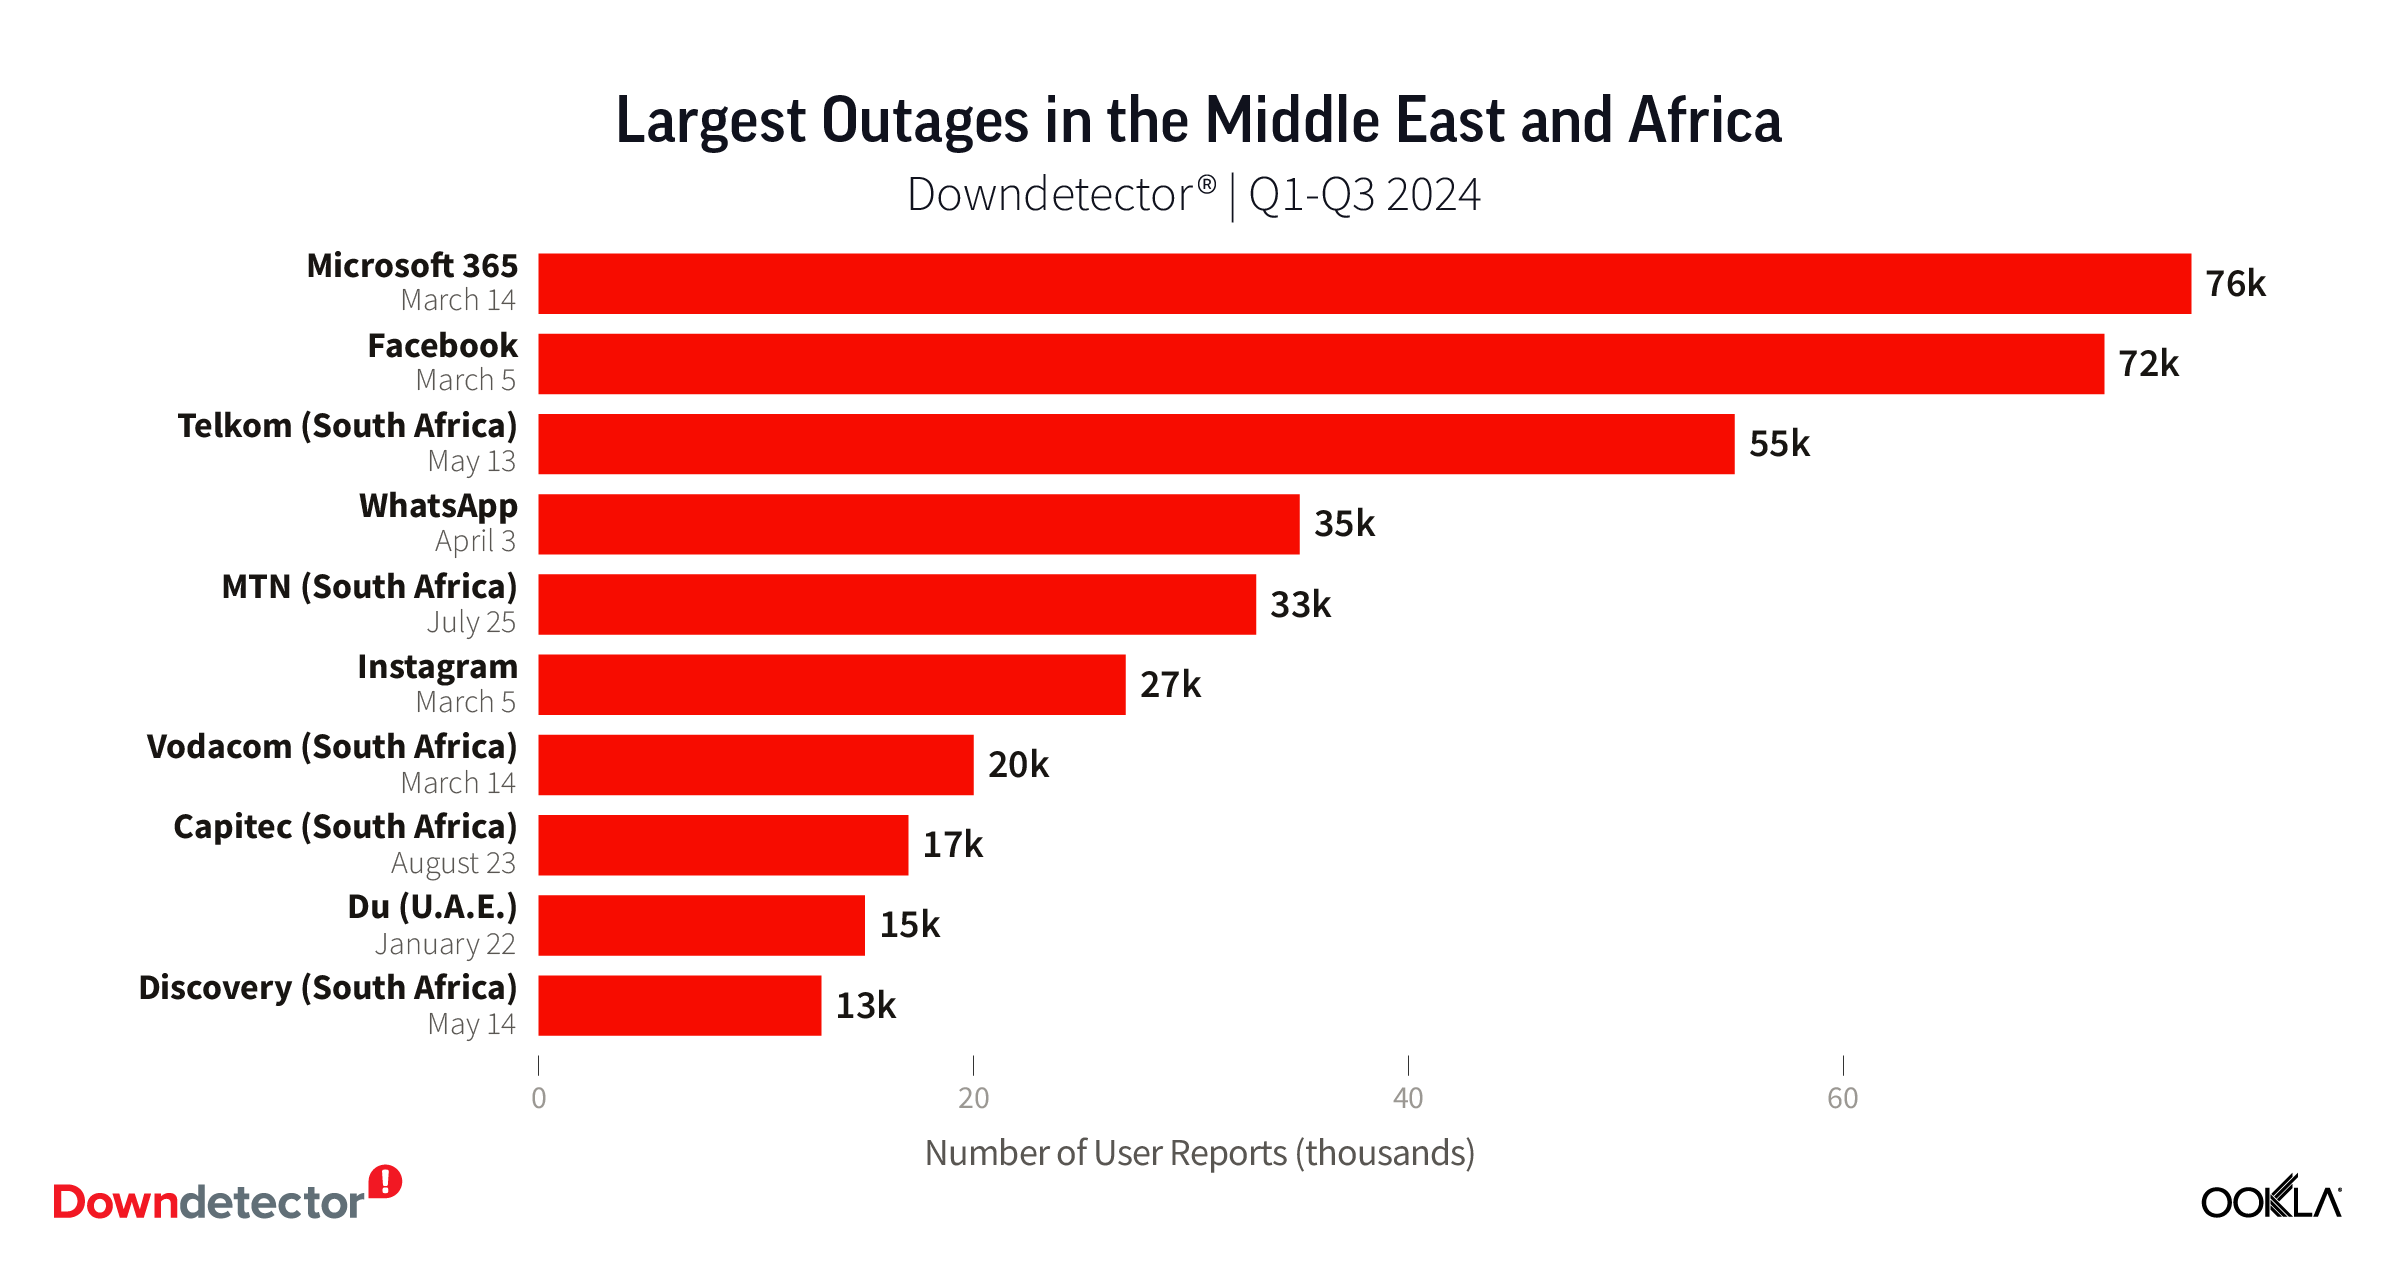
Outage patterns in the Middle East and Africa differed from those in other regions with users reporting about as many issues with local sites and services as global ones. The two largest outages, Microsoft 365 on March 14 and Facebook on March 5, were part of global events.

The third largest outage in the region was with South African telecommunications provider Telkom. Almost 55k users across Africa reported issues to Downdetector when Telkom experienced an outage on May 13. MTN, Vodacom, and du are other telecom providers that made our list of top outages in the Middle East and Africa during Q1-Q3 2024.

United States and Canada

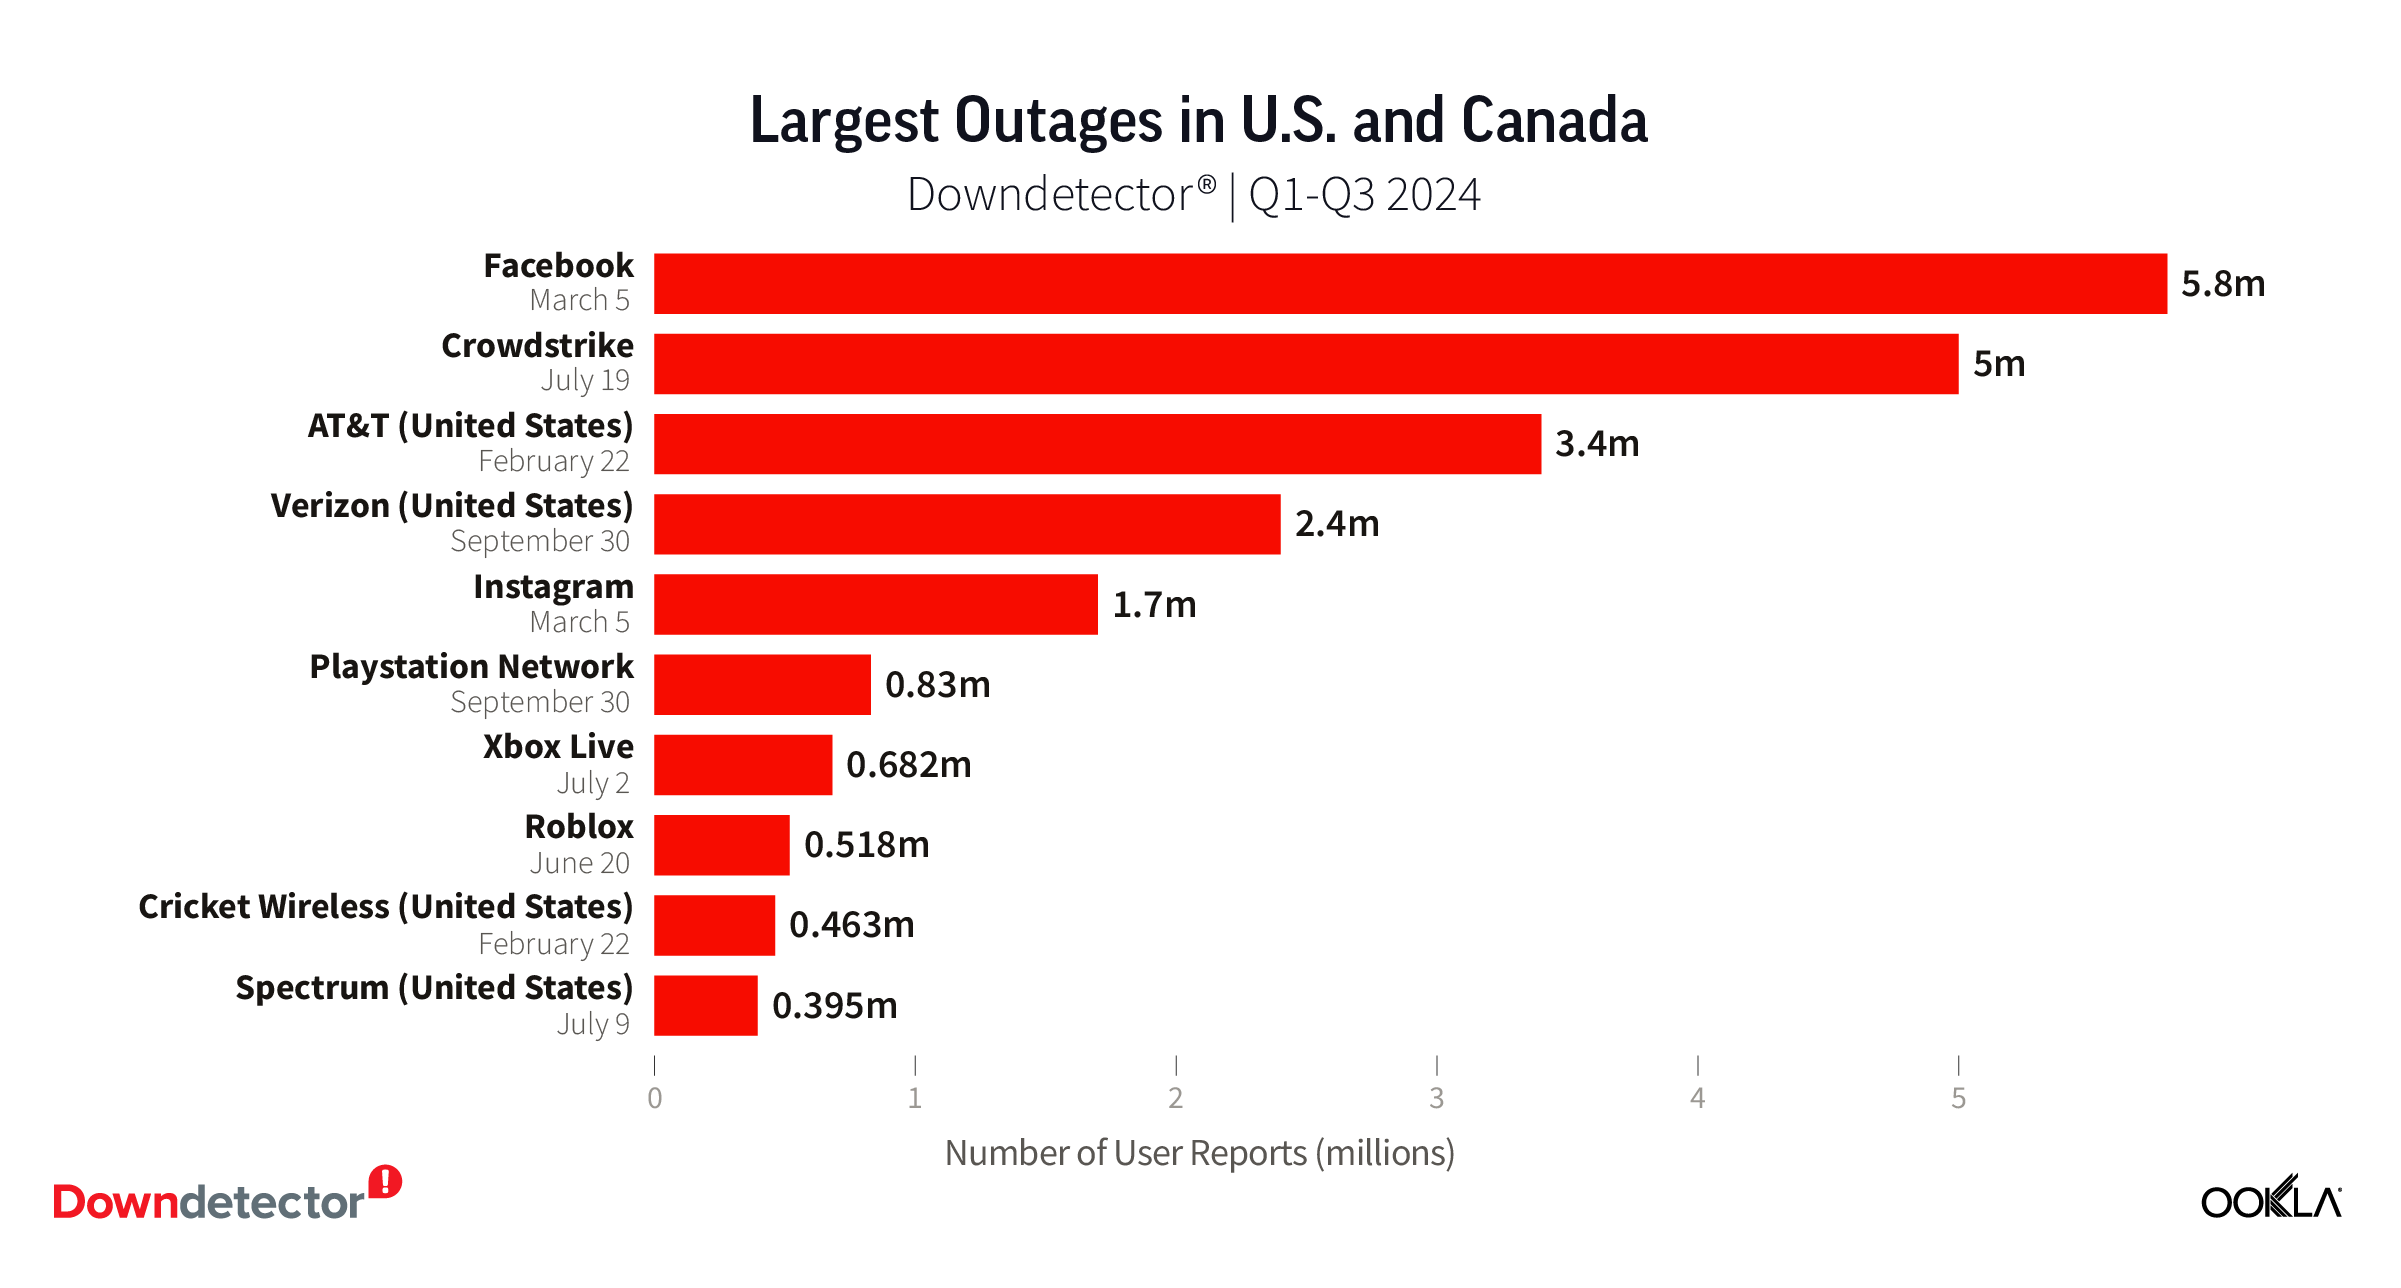
Chart of Largest Outage in U.S. and Canada, Downdetector, Q1-Q3 2024

As we saw with much of the rest of the world, Facebook topped the list of outages in the U.S. according to Downdetector with over 5.8 million users reporting issues with the service during its outage on March 5. The Crowdstrike and AT&T outages also hit the U.S. hard with almost 5 million and over 3.4 million user reports, respectively. Gaming sites and services and telecom providers filled out the rest of the list in the U.S.

Downdetector is your source for information about service disruptions, monitoring real-time performance for thousands of popular web services globally. Find Downdetector on the web or in the free Speedtest app for Android or iOS. We’ve recently introduced push notifications so you can learn about outages as soon as they happen. Businesses looking for early alerting on service issues may be interested in Downdetector ExplorerTM.

Ookla retains ownership of this article including all of the intellectual property rights, data, content graphs and analysis. This article may not be quoted, reproduced, distributed or published for any commercial purpose without prior consent. Members of the press and others using the findings in this article for non-commercial purposes are welcome to publicly share and link to report information with attribution to Ookla.

| November 12, 2024

More Fast, Free Airport Wi-Fi Just in Time for the Holidays

Airports in the United States have seen record-breaking numbers of travelers this year, and the always-busy Thanksgiving weekend could put even more stress on airport services. Including free Wi-Fi. We took a careful look at recent performance at the 50 largest airports by passenger volume in the U.S. as part of our ongoing series to help you plan ahead. Speeds have slipped at some of the top airports, but two more airports have free Wi-Fi download speeds over 150 Mbps than last year. Read on for details.

10 airports have free fixed broadband Wi-Fi over 150 Mbps

Fixed Broadband Internet Download Speeds Over Free Wi-Fi at U.S. Airports
Speedtest Intelligence® | Q3 2024
A map showing fixed broadband speeds in selected airports in the United States.

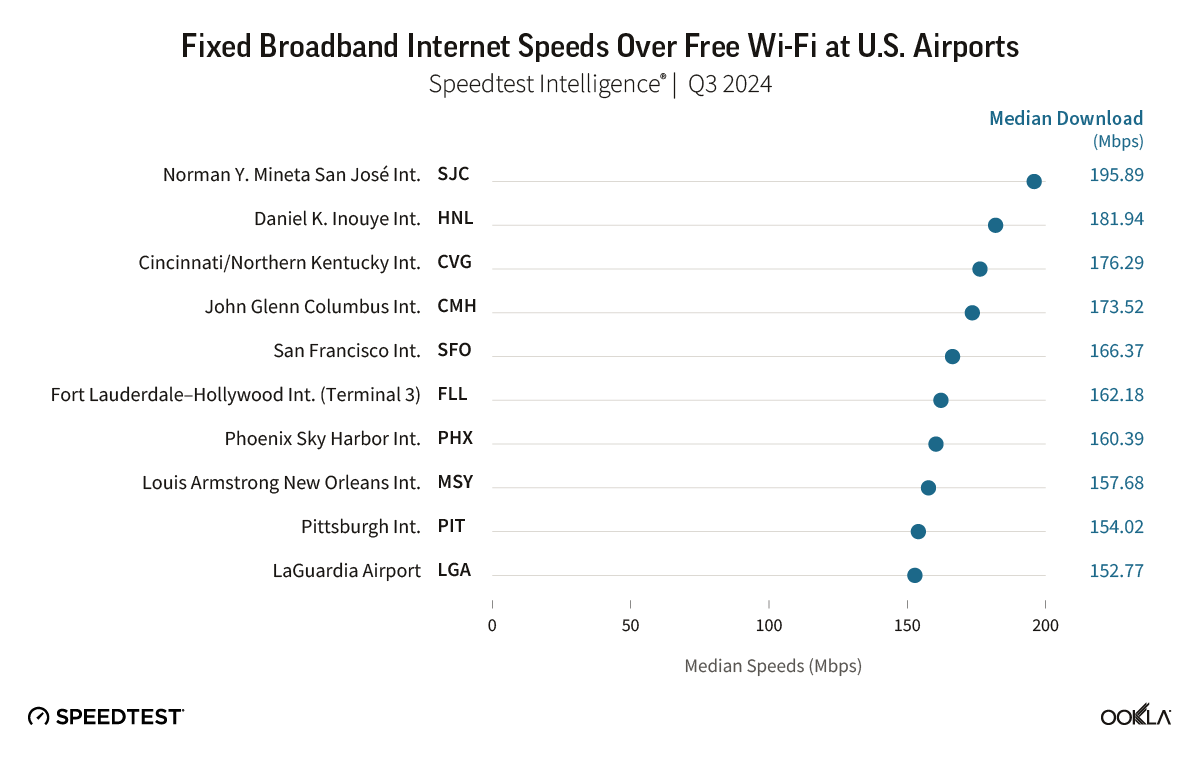
Chart of Fixed Broadband Internet Speeds Over Free Wi-Fi at U.S. Airports

Speedtest Intelligence® shows Norman Y. Mineta San José International Airport, Daniel K. Inouye International Airport, and Cincinnati/Northern Kentucky International Airport were once again home to some of the fastest free airport Wi-Fi among the country’s busiest airports, with median download speeds of 195.89 Mbps (down from 259.37 Mbps last year), 181.94 Mbps (down from 187.58 Mbps), and 176.29 Mbps (down from 210.09 Mbps), respectively, during Q3 2024.  

Rounding out the top 10 were:

  • John Glenn Columbus International Airport (173.52 Mbps),
  • San Francisco International Airport (166.37 Mbps), 
  • Fort Lauderdale–Hollywood International Airport (162.18 Mbps in Terminal 3), 
  • Phoenix Sky Harbor International Airport (160.39 Mbps), 
  • Fort Lauderdale–Hollywood International Airport (158.38 Mbps), 
  • Louis Armstrong New Orleans International Airport (157.68 Mbps), 
  • Pittsburgh International Airport (154.02 Mbps), and LaGuardia Airport (152.77 Mbps). 

Keep in mind that 150 Mbps is more than fast enough for 4K streaming and multi-player gaming

Ekahau®, our Wi-Fi solution, helps airports and other large-scale businesses ensure the networks you depend on are meeting your needs. Unfortunately, some airports are still not meeting the Wi-Fi optimization challenge. Specifically, two airports (William P. Hobby Airport and George Bush Intercontinental Airport) showed median download speeds over Wi-Fi of less than 25 Mbps. However, we are heartened that this is down from five last year with Raleigh-Durham International Airport, Philadelphia International Airport (Free PHL Airport WiFi-24), and Logan International Airport graduating by improving their speeds.

There was one change to our airport list this year, which is based on passenger volume: Kahului Airport was removed and John Glenn Columbus International Airport added. We have not included Kansas City International Airport, San Francisco Bay Oakland International Airport, San Antonio International Airport, or San Diego International Airport because there were insufficient samples.

Fort Lauderdale-Hollywood International Airport splits their free airport Wi-Fi among four separate SSIDs for different terminals, which we have listed separately in these results. While terminals 2 and 3 have a slight edge, the performance does not vary widely enough between them to intentionally hang out in the wrong terminal just to get a minor bump in speed, but if you’re in Philadelphia you definitely want to choose “Free PHL Airport WiFi” when possible, rather than “Free PHL Airport WiFi-24” if your device supports 5 GHz.

Mobile performance at 24 airports beats 150 Mbps

Mobile Internet Download Speeds at U.S. Airports
Speedtest Intelligence® | Q3 2024

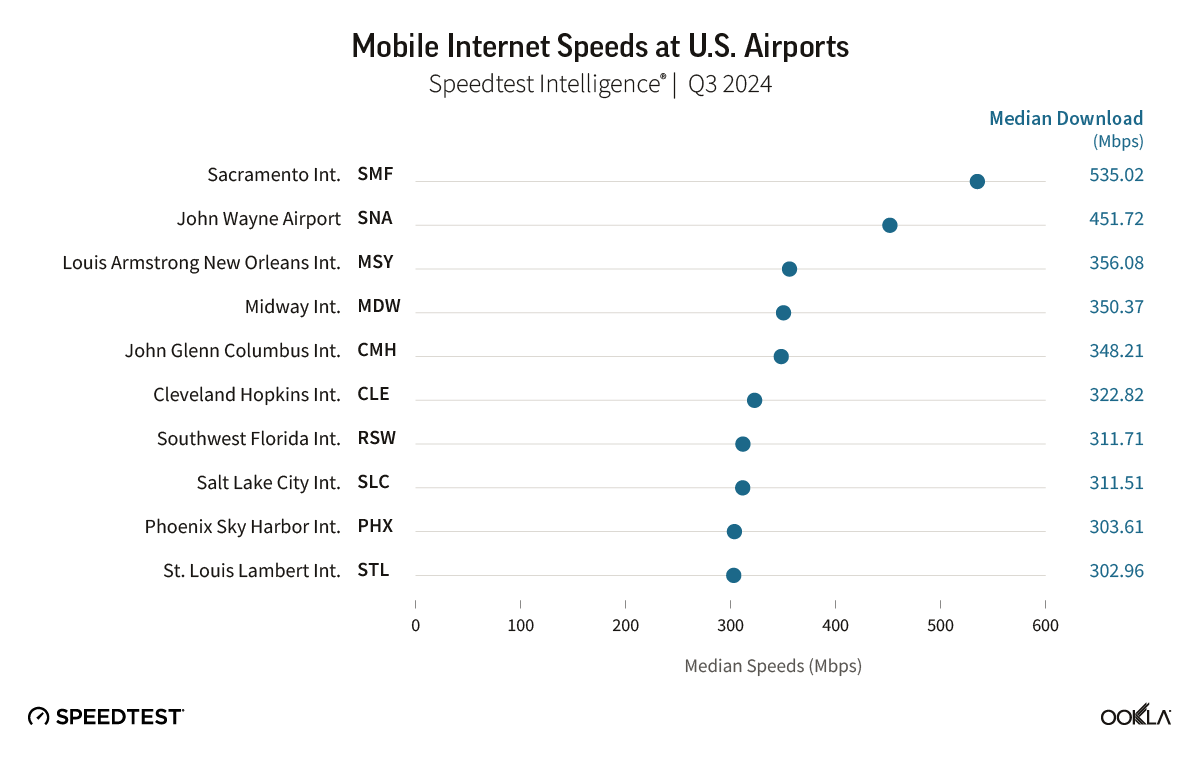
Chart of Mobile Internet Speeds at U.S. Airports

Speedtest Intelligence® shows Sacramento International Airport and John Wayne Airport were the fastest airports on our list for mobile download speed during Q4 2024 at 535.02 Mbps and 451.72 Mbps, respectively. In all, 24 airports in our study had median download speeds over 150 Mbps, up from 18 in 2023. Fifteen of the airports showed median download speeds over 200 Mbps in 2024. 

We’re happy to report that no airport on our list showed median mobile download speeds of less than 25 Mbps.

Wi-Fi or mobile? The airports where it makes a difference

Where Wi-Fi wins

Wi-Fi is the fastest choice at 10 airports where download speed over mobile network service is significantly slower than the free airport Wi-Fi. Details on how much faster the Wi-Fi is than mobile are as follows:

  • 102% at Hartsfield–Jackson Atlanta International Airport, 
  • 90% at Orlando International Airport, 
  • 82% at San Francisco International Airport, 
  • 77% at Dallas/Fort Worth International Airport, 
  • 70% at Seattle-Tacoma International Airport, 
  • 42% at Baltimore/Washington International Airport, 
  • 28% at John F. Kennedy International Airport, 
  • 25% at Harry Reid International Airport, and 
  • 10% at Daniel K. Inouye International Airport. 

It’s important to note that many of these differences are smaller than last year as mobile speeds are catching up to Wi-Fi capabilities.

Places to choose mobile service instead

Twenty-nine airports had faster download speeds over mobile than over free airport Wi-Fi during Q3 2024. Special mention goes to the following airports with massive improvements:

  • Southwest Florida International Airport showed mobile service 635% faster than airport Wi-Fi,
  • Mobile at Tampa International Airport was 528% faster than Wi-Fi, and 
  • Mobile was 341% faster than airport Wi-Fi at Sacramento International Airport. 

Mobile service was 4X faster than airport Wi-Fi at:

  • Salt Lake City International Airport, Logan International Airport, and 
  • Cleveland Hopkins International Airport. 

Mobile was 3X faster than airport Wi-Fi at: 

  • Philadelphia International Airport, 
  • Indianapolis International Airport, 
  • John Wayne Airport, 
  • Denver International Airport, 
  • Detroit Metropolitan Airport, and 
  • George Bush Intercontinental Airport. 

Mobile service was 2X faster at: 

  • Raleigh-Durham International Airport, 
  • Midway International Airport, 
  • Portland International Airport, 
  • St. Louis Lambert International Airport, 
  • Austin–Bergstrom International Airport, 
  • William P. Hobby Airport, 
  • Minneapolis–Saint Paul International Airport, 
  • Los Angeles International Airport, 
  • Louis Armstrong New Orleans International Airport, 
  • Phoenix Sky Harbor International Airport, 
  • John Glenn Columbus International Airport, 
  • Ronald Reagan Washington National Airport, and 
  • Miami International Airport. 

And mobile service was 1X faster than airport Wi-Fi at: 

  • Charlotte Douglas International Airport, 
  • Washington Dulles International Airport, 
  • LaGuardia Airport, and 
  • Nashville International Airport.

All in all, it looks like your airport internet will probably be faster than the security line, and in many airports, faster than your mobile service. Set yourself up for success by downloading a few of your favorite shows along with the Speedtest apps for Android and iOS before you leave the house. And while you’re waiting for that flight, help out travelers next year by taking a Speedtest at the airport to share your experience. 

Ookla retains ownership of this article including all of the intellectual property rights, data, content graphs and analysis. This article may not be quoted, reproduced, distributed or published for any commercial purpose without prior consent. Members of the press and others using the findings in this article for non-commercial purposes are welcome to publicly share and link to report information with attribution to Ookla.

| October 3, 2024

Millions Impacted by Verizon Outage: Key Insights from Downdetector’s Real-Time Data

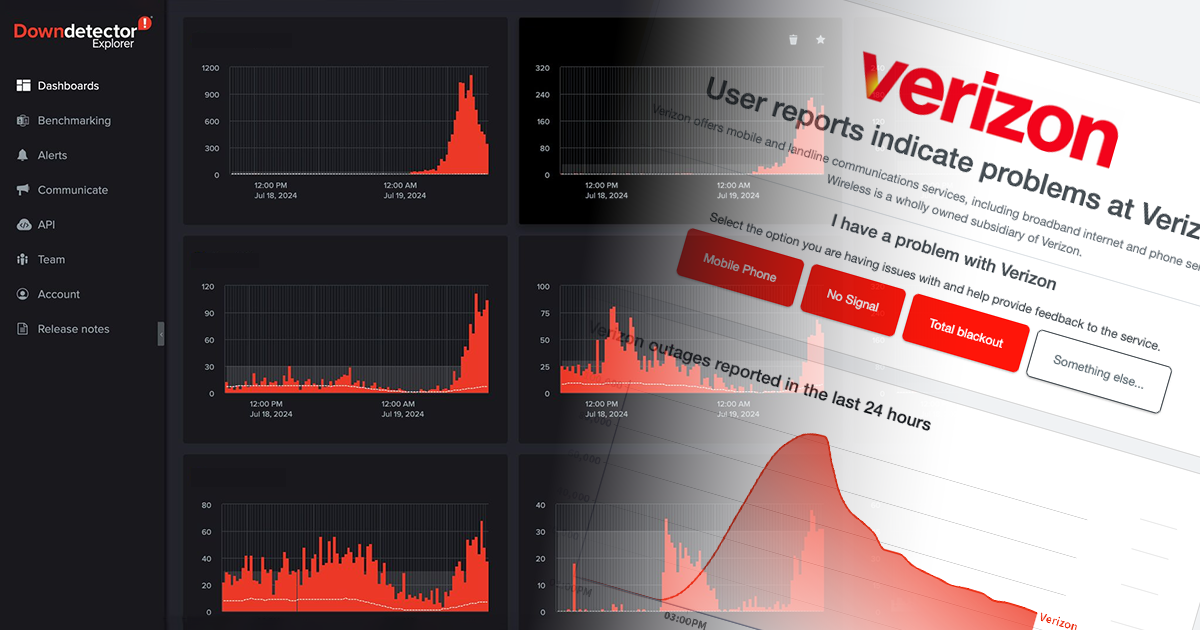
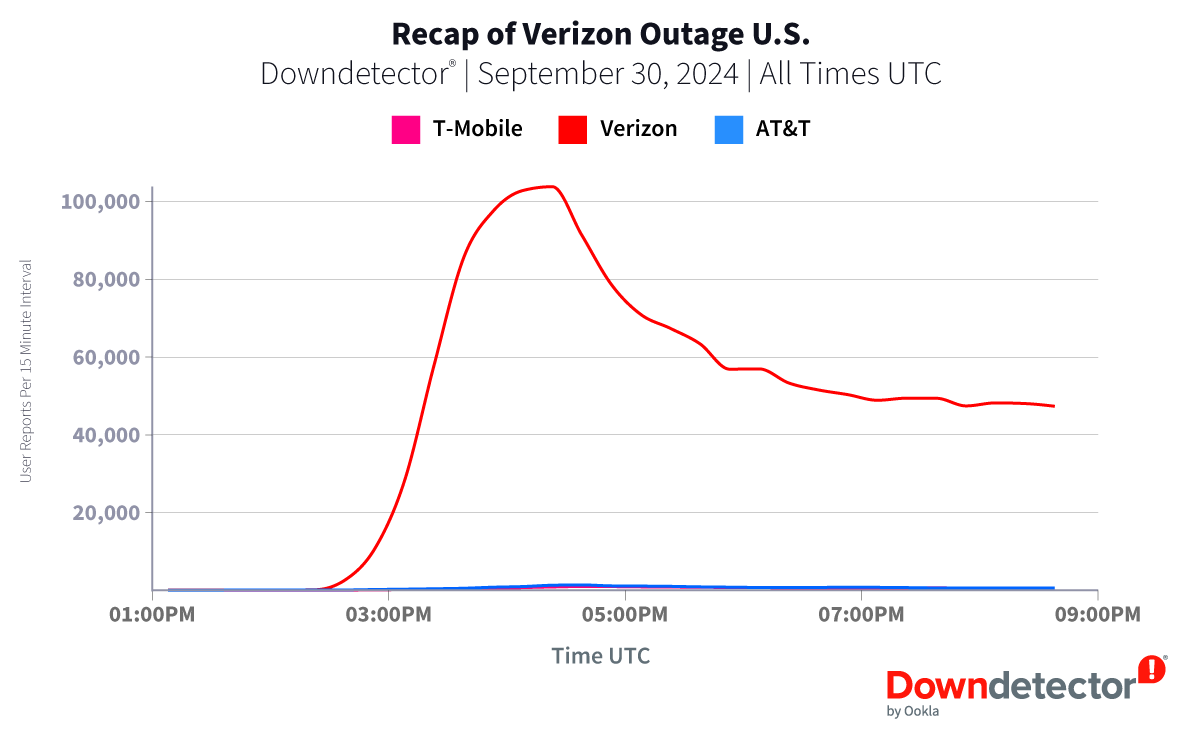
On September 30th, a significant outage impacted Verizon services across the U.S., with reports pouring into Downdetector throughout the day. Users reported a range of issues, including phones stuck in SOS mode and the inability to make or receive calls and texts, leading to over 1.7 million reports in Downdetector.

The first alerts of this issue came in as early as 9:30 AM EDT. For businesses, receiving timely notifications like these is crucial; early awareness enables proactive resolution of potential issues before they escalate into major disruptions. 

Here’s a summary of how user reports flooded into Downdetector, providing key real-time insights into the outage as it unfolded.

9:30 AM EDT — Initial Reports Appear in Downdetector

Reports of a Verizon outage began surfacing on Downdetector, as subscribers noticed their phones were stuck in SOS mode. By 9:30 AM approximately 1,000 users had reported issues. While this situation had yet to be acknowledged by the press or Verizon, Downdetector Explorer customers received early warning signs of a potential service disruption.

11:23 AM EDT — Outage Number Peaks

Downdetector monitors and reports numbers in 15 minute increments. Over 100,000 incidents were submitted between 11:15-11:30 AM,  bringing the total number of reports to over 400,000 at this point. Verizon would continue to receive reports throughout the course of the entire day as users were continuously impacted.

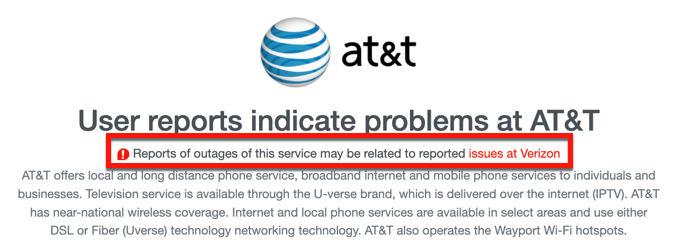
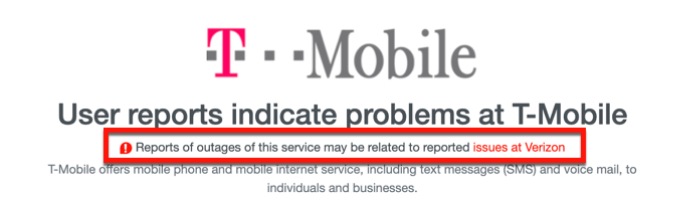
Despite Verizon being the source of the service disruption, customers of AT&T and T-Mobile also began reporting issues. These reports were likely a result of AT&T and T-Mobile users attempting to contact Verizon subscribers rather than an issue with AT&T and T-Mobile’s services. In order to ensure all reports were accurately captured, Downdetector displayed banners reporting that reports of service outages for AT&T and T-Mobile may be related to issues at Verizon. 

11:48 AM EDT — Verizon Acknowledges the Outage

More than two hours after the first reports appeared, Verizon confirmed the outage on X, assuring users that they were aware of the situation and working to resolve it.

7:18 PM EDT — Resolution Announced

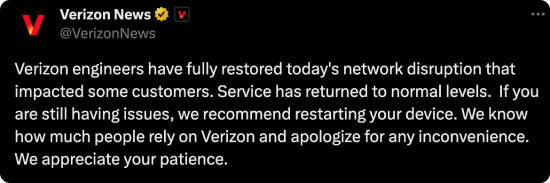
After nearly 10 hours and over 1.7 million reports, Verizon announced that the outage had been resolved, though as of the time of publication, there has not been an official statement on what caused the outage.

Downdetector has proven to be an invaluable tool for real-time outage reporting, identifying issues faster than official communications from service providers. If you’re interested in learning how Downdetector can help you identify and prevent disruptions from becoming major outages reach out to us.

Ookla retains ownership of this article including all of the intellectual property rights, data, content graphs and analysis. This article may not be quoted, reproduced, distributed or published for any commercial purpose without prior consent. Members of the press and others using the findings in this article for non-commercial purposes are welcome to publicly share and link to report information with attribution to Ookla.

| December 19, 2024

Global Broadband Development: Using Ookla Data to Bridge the Digital Divide

The global digital divide continues to widen. While nearly a quarter of consumer broadband subscribers in developed markets now use gigabit plans – projected to reach 50% by 2029 – developing countries often struggle to keep pace. This emerging “digital divide 2.0” represents not only a gap in access to basic connectivity, but also in the quality of broadband infrastructure. With pioneering countries like Singapore implementing nationwide 10-gigabit strategies, advanced markets are rapidly deploying high-speed fiber networks, whereas emerging markets often struggle to maintain even basic connectivity standards.

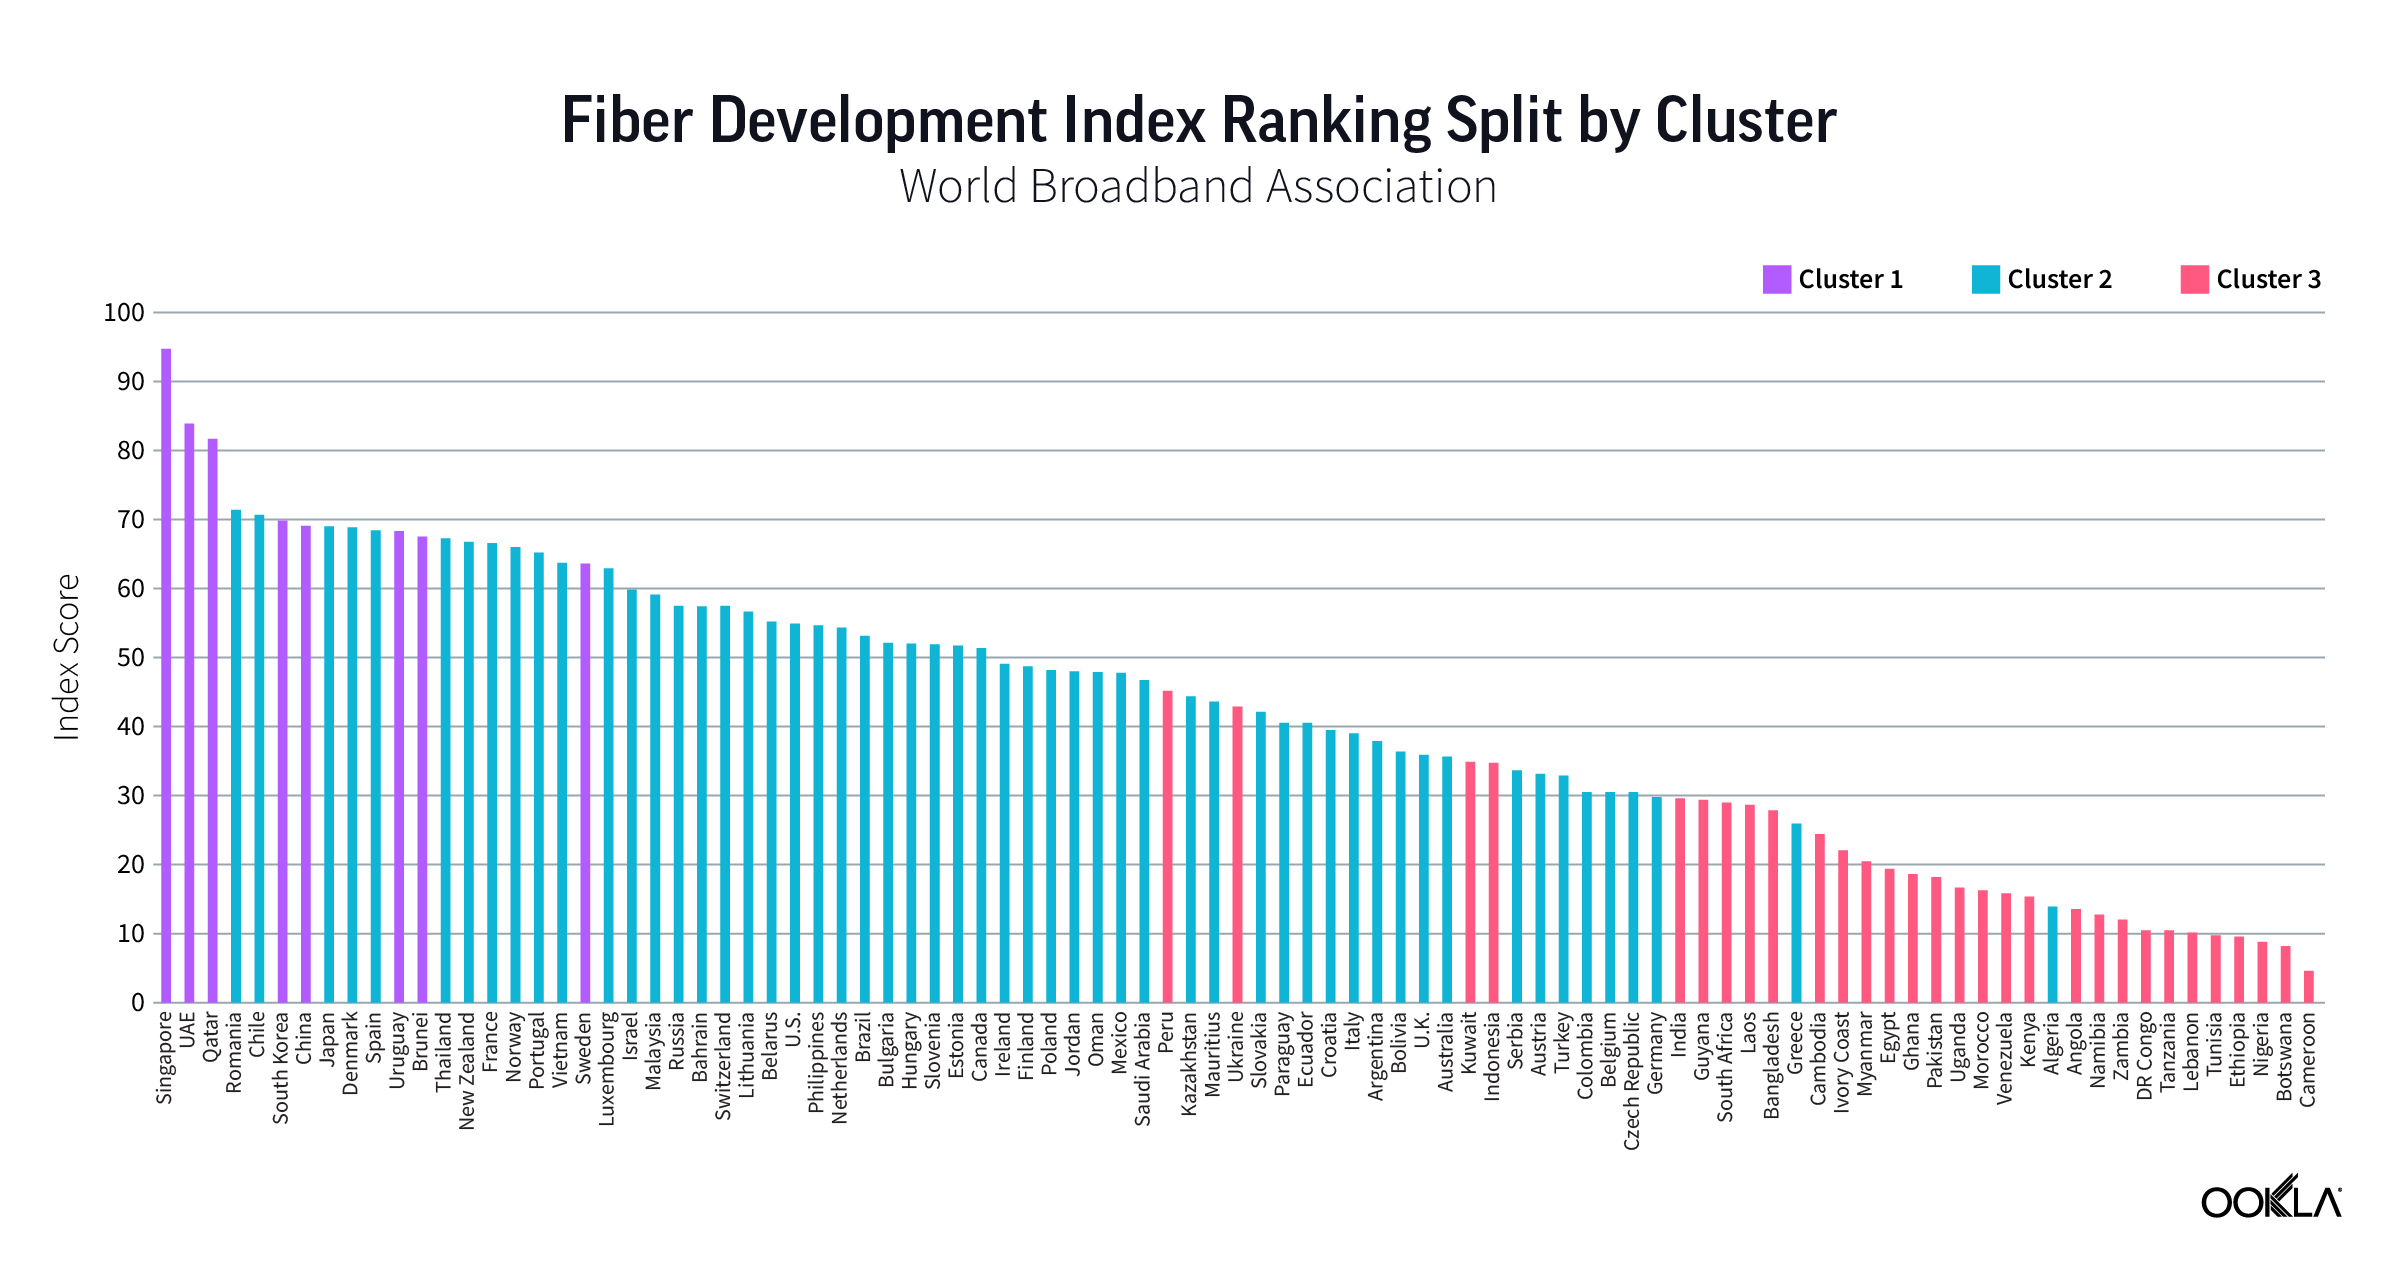
To better understand these disparities, comprehensive network data can offer valuable insights into connectivity performance. The Fiber Development Index (FDI) – a collaboration between Ookla, the World Broadband Association (WBBA), and Omdia – benchmarks fiber development across 93 countries by analyzing infrastructure development, market trends, and quality of experience measurements. Using median download and upload speeds, latency, and jitter data from Speedtest Intelligence, the FDI provides crucial insights into actual broadband performance and availability worldwide.

In this article, we’ll examine the current state of global broadband development, explore what sets market leaders apart, and analyze some key challenges facing U.S. broadband expansion. For deeper insights into these topics, including expert analysis from Ookla, the WBBA, and Omdia, watch our full webinar!

Global Broadband Trends

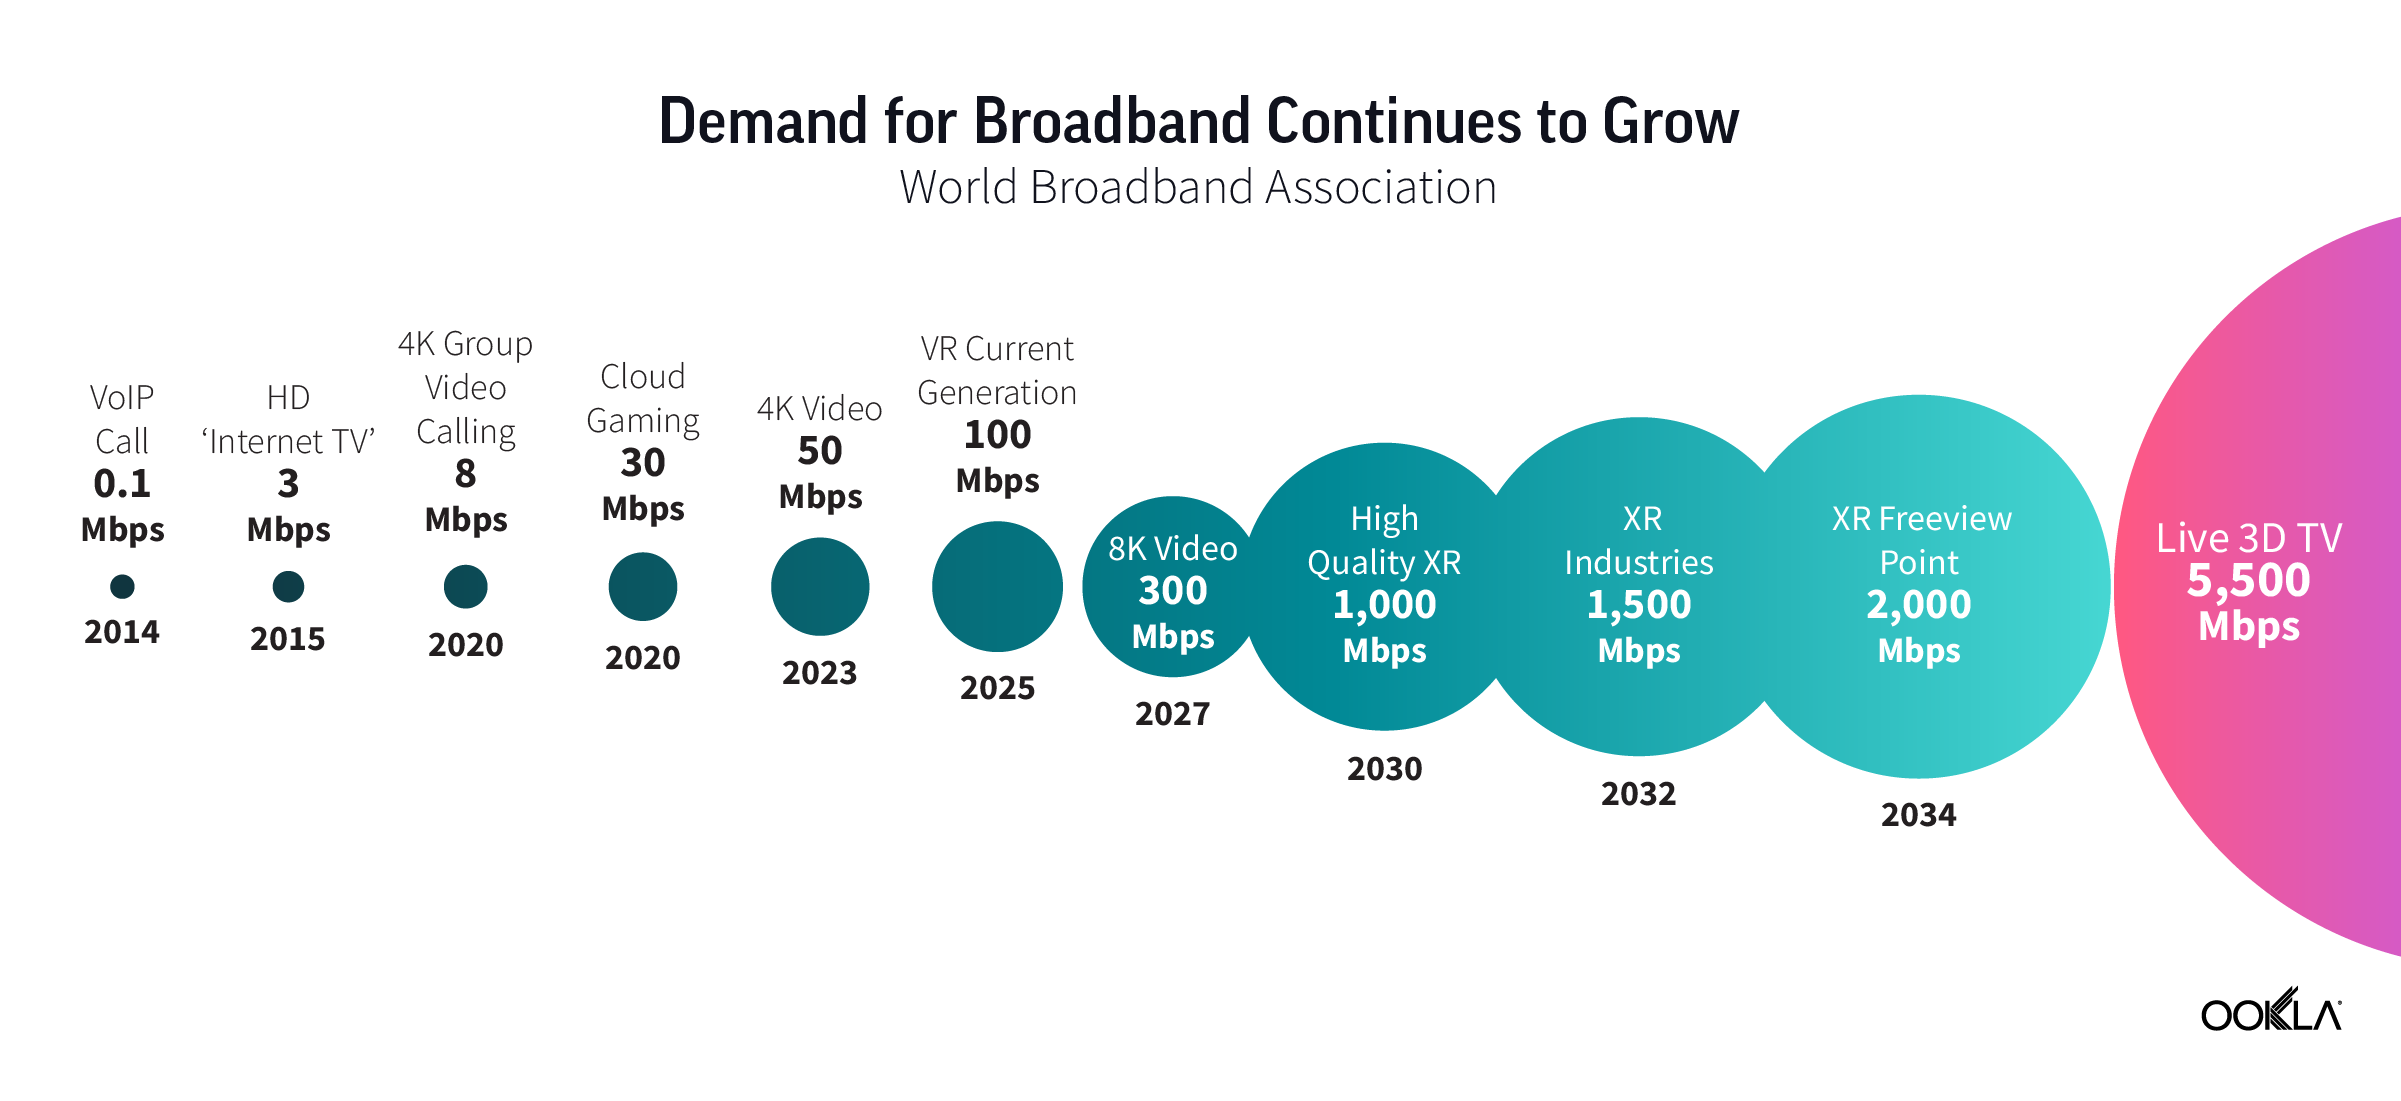
The demand for high-speed broadband continues to surge, with fixed broadband growing at a remarkable rate. Between 2020 and 2023, fixed broadband saw 20% growth compared to just 5% for mobile broadband, and similar growth is projected over the next few years. Three key factors drive this increased demand for gigabit and multi-gigabit connectivity:

  • Connected devices: The number of connected devices per household typically doubles every five years, with projections showing an average of a staggering 45 devices per household by 2030.
  • High-bandwidth applications: Modern applications demand increasingly higher speeds, from 50 Mbps for 4K video to 300 Mbps for 8K content, with next-generation XR applications requiring speeds up to 1 Gbps.
  • Cloud shift: Usage patterns are rapidly evolving from primarily saving files locally to accessing cloud-based services for storage and computing, a transition accelerated by XR and AI applications.

Looking ahead to 2028-2029, about half of all fixed broadband connections worldwide are expected to be gigabit-capable. This shift to fiber networks, which enable both higher speeds and improved latency, is necessary to support these evolving demands.

Fiber Development Index (FDI) Findings

The Fiber Development Index provides unprecedented visibility into global broadband development, analyzing 93 countries across multiple metrics including investment patterns (infrastructure funding, market incentives, regulatory policies) and real-world performance data. 

To enable meaningful comparisons between markets at different stages of development, the FDI organizes countries into three distinct clusters:

  • Cluster One – Advanced Markets: These highly developed fiber broadband markets – such as Singapore, the UAE, and Qatar – demonstrate the impact of strong government support and clear national strategies. Singapore highlights cluster one success stories, with its nationwide fiber initiative.
  • Cluster Two – Transitioning Markets: Markets with developed broadband infrastructure actively expanding their fiber adoption. France, Chile, Switzerland, Australia, and the Netherlands have all improved their FDI rankings through expanded fiber coverage and improved performance metrics.
  • Cluster Three – Emerging Markets: Regions with low overall broadband penetration often face fundamental connectivity challenges. However, success stories like Peru, which jumped 11 spots in the FDI rankings, show how targeted investment and regulatory improvements can accelerate development.

This clustering approach shows that successful fiber deployment isn’t only about current performance; it’s also about the trajectory of improvement and the policies enabling that growth. For example, while Switzerland and Hungary show similar fiber penetration rates, Switzerland’s higher FDI ranking reflects its continued investment in core networks – illustrating how infrastructure commitment can shape a country’s development path.

Solutions and Best Practices

Understanding what drives success in leading markets can help guide countries working to close their own digital divides. From Singapore’s comprehensive strategy for fiber deployment to Peru’s improvements in regulatory policy and infrastructure investment, successful countries share a few key characteristics in their regulatory approaches and usage of data-driven decision making:

  • Effective Regulatory Framework: Leading markets implement detailed national broadband plans with specific targets and timelines. They streamline municipal approvals, promote infrastructure sharing, and provide financial incentives through universal service funds.
  • Data-Driven Planning: Speedtest Intelligence metrics provide granular data on network performance – including speeds, latency, and jitter, among other KPIs – revealing where networks are underperforming against FCC broadband speed standards. These insights help operators target infrastructure investments for maximum impact.
  • Market-Specific Strategies: Success looks different across markets. For example, while Singapore pursues its nationwide 10-gigabit fiber service, other countries are focused on expanding basic fiber coverage. Speedtest Intelligence metrics can help countries set realistic goals based on their current development stage.

U.S. Broadband Progress

To see how these global trends and challenges play out in a specific market, the U.S. presents a unique example of broadband development, with significant variations across states in both coverage and performance. In early 2024, the FCC raised its minimum broadband speed standard from 25/3 Mbps (25 download/3 upload) to 100/20 Mbps (100 download/20 upload), setting a higher bar for adequate connectivity. 

Speedtest Intelligence data from the first half of 2024 reveals how service providers, regulators, and state governments are both making progress and facing persistent challenges in meeting these new standards.

  • State Leadership: New Jersey leads the nation with 66.4% of Speedtest users achieving FCC minimum standards of 100 Mbps download speed and 20 Mbps upload speed, followed by Connecticut, North Dakota, and Maryland.
  • Urban-Rural Divide: The gap between rural and urban connectivity access varies dramatically by state. Washington state in particular shows a stark urban-rural divide, with 61.1% of urban residents having access to the FCC’s minimum broadband standards, compared to just 28.7% of rural residents. Delaware demonstrates more equity, with 69.2% of urban residents and 66.8% of rural residents having access to these same standards.
  • Infrastructure Challenges: Geographic and terrain factors significantly impact deployment costs and feasibility. States like Alaska face unique challenges with frozen ground and vast distances between population centers, making traditional fiber deployment particularly complex and expensive. Data-driven approaches can help identify where alternative solutions might be more practical.

Breaking Down the Digital Divide
Percentage of urban and rural Speedtest users in each state with access to broadband speeds of 100/20 Mbps.

To learn more about connectivity performance in U.S. states, check out our recent analyst report looking at broadband speeds across the 50 states. 

Future Outlook 

The path toward closing the digital divide requires a multi-faceted approach that combines strategic infrastructure investments, supportive regulatory policies, and data-driven decision making. While fiber remains the gold standard for future-proof connectivity, a hybrid approach incorporating fixed wireless access and satellite technology may offer interim solutions for challenging deployments.

Looking ahead, the industry faces several key developments:

  • Accelerating Gigabit Adoption: The shift from basic broadband to gigabit connectivity will continue, with projections showing 50% of connections reaching gigabit speeds by 2029.
  • Investment Priorities: BEAD funding and similar initiatives worldwide will shape deployment strategies, particularly in underserved areas.
  • Technology Integration: Markets will likely adopt hybrid approaches, using a mix of fiber, fixed wireless, and satellite technology to ensure complete coverage. 

Understanding this evolving landscape requires comprehensive network intelligence. Ookla’s complementary datasets – combining Speedtest’s crowdsourced performance metrics, RootMetrics’ controlled drive testing data, and Downdetector’s service outage monitoring – provide stakeholders with the complete picture needed to make informed decisions about broadband development.

For a deeper dive into global broadband development, including detailed analysis of the Fiber Development Index and expert insights from WBBA and Omdia, watch our full webinar on demand!


Ookla retains ownership of this article including all of the intellectual property rights, data, content graphs and analysis. This article may not be quoted, reproduced, distributed or published for any commercial purpose without prior consent. Members of the press and others using the findings in this article for non-commercial purposes are welcome to publicly share and link to report information with attribution to Ookla.

| January 21, 2025

Vodafone's digital-first strategy and innovative service offerings caused a shift in Oman's telecom market

Vodafone’s entry into a saturated mobile telecom market in Oman in 2022 has significantly reshaped the competitive landscape long dominated by Ooredoo and Omantel. Within two years, Vodafone managed to capture 12% of the market in terms of subscribers. This article examines Vodafone’s network, service, and marketing strategies to assess how the operator attracted subscribers from incumbent operators and to what extent their network experience has changed since migrating.

Key Takeaways:

  • Vodafone Oman focused on offering 5G services and adopted an asset-light business model to compete with incumbent players. Vodafone differentiated itself through pricing, tariff plans, and extensive digital engagement to capture a significant share of the market. Vodafone leads the market with a median 4G download speed of 66.40 Mbps in Q3 2024, but it trails in 5G with a speed of 111.21 Mbps.
  • Vodafone has been the primary beneficiary of customer churn. Between September 2022 and June 2024, Vodafone’s Speedtest 4G and 5G user bases expanded by 12.2% and 36.0%, respectively. The majority of new users came from Omantel, indicating Vodafone’s appeal to this customer base.
  • Churners from Omanel and Ooredoo had mixed network experience after changing operators. Users who left Omantel experienced an improvement in their average download speeds for both 4G and 5G. However, churned 4G users from Ooredoo experienced a speed increase following the transition to a different network, while those on 5G saw their download speed decrease.

Vodafone Oman focused on offering 5G services and adopted an asset-light business model to compete with incumbent players

In March 2022, a local consortium, Oman Future Telecommunications (OFT), partnered with Vodafone to launch a new operator as part of a 15-year non-equity agreement offering 4G, 5G, and VoLTE services. Vodafone adopted an asset-light business model, facilitating services’ rapid deployment and minimizing capital expenditure. For example, it leased tower capacity from Oman Tower Company (OTC) for its 5G network and used Ooredoo’s network for 4G services. The company also leased fiber lines from wholesale infrastructure provider Oman Broadband (OB) to connect its sites.

Vodafone’s introductory packages significantly undercut its competitors. They featured 77GB of data, 777 local voice minutes, and 777 local SMS for RO9 (USD $23.3), valid for over 2 months and a half. The company then introduced the ‘Vodafone Red’ tariff plans, with bundles of domestic/international voice minutes, SMS, and data, lower per-GB rates, and dedicated allowances for social and streaming media services. It leveraged Vodafone’s extensive global network to offer appealing international roaming packages valid within the Gulf region and across Vodafone’s worldwide footprint.

Vodafone also prioritized digital channels to increase customer engagement. For example, it launched the My Vodafone App for service delivery and support to streamline the onboarding process, including using eSIMs. The company has also actively engaged with customers on social media, addressing concerns and running exclusive promotions while collaborating with local influencers to boost brand awareness.

In addition to its competitive pricing and digital-first approach, Vodafone invested in its network infrastructure. The company doubled the number of its 5G sites from 750 in 2021  to 1,500 in March 2023, resulting in a 120% increase in coverage and a 175% revenue jump. This expansion allowed Vodafone to capture 10% of the market share within two years of launch, aiming to reach 30% by 2032. This is a remarkable achievement considering the high-level mobile penetration (134% of the population in June 2024, according to the Telecommunication Regulatory Authority (TRA)) and the presence of 2 mobile network operators and two mobile virtual network operators (FRiENDi Mobile and Renna). 

Vodafone Mobile Market Share
Source: TRA Oman | Q2 2022 – Q2 2024
Vodafone Mobile Market Share

Vodafone is leading in 4G but trailing in 5G median download speeds

According to Speedtest Intelligence® data, Vodafone has been leading the market in 4G download speed, reaching 66.40 Mbps in Q3 2024, 20% faster than the next fastest. This surpasses Omantel’s and Ooredoo’s peak speeds of 52.23 Mbps and 51.04 Mbps, respectively, which have been trending closely together.  Vodafone has dominated 4G upload speeds, fluctuating around 15 Mbps, while Omantel and Ooredoo hovered around 11-12 Mbps.

4G Network Performance, by Operator, Oman
Source: Speedtest Intelligence® | Q2 2022 – Q3 2024
4G Network Performance, by Operator, Oman

The picture for 5G performance is more nuanced. Omantel’s download speed has risen since Q2 2022, peaking at 249.19 Mbps in Q4 2023 before a slight dip to 231.23 Mbps by  Q3 2024. Ooredoo’s speed has steadily declined since Q2 2022 to a low of 111.56 Mbps in Q3 2023 before improving to reach 138.92 Mbps in Q3 2024. Vodafone’s 5G download speed began at a high of 160.73 Mbps in Q4 2022 but has trended downward since then,  falling below Ooredoo to 111.21 Mbps in Q3 2024. 

Vodafone initially led 5G upload speeds, peaking at 59.3 Mbps in Q3 2022. However, upload speeds dropped sharply as the customer base grew before stabilizing at 20.98 Mbps in Q3 2024. This could suggest a strategic decision to prioritize download speeds. Meanwhile, Omantel and Ooredoo have maintained lower, more stable upload speeds, generally below 20 Mbps.

5G Network Performance, by Operator, Oman
Source: Speedtest Intelligence® | Q2 2022 – Q3 2024
5G Network Performance, by Operator, Oman

Vodafone has been the primary beneficiary of customer churn

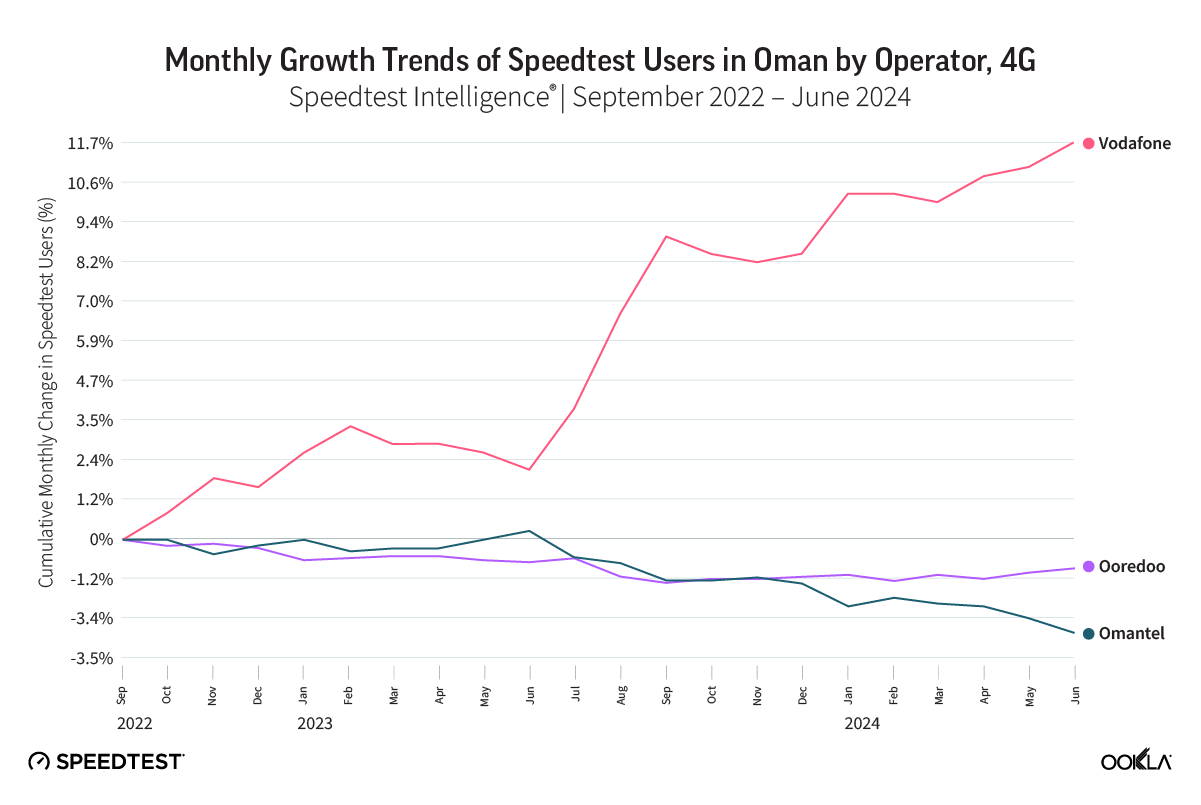
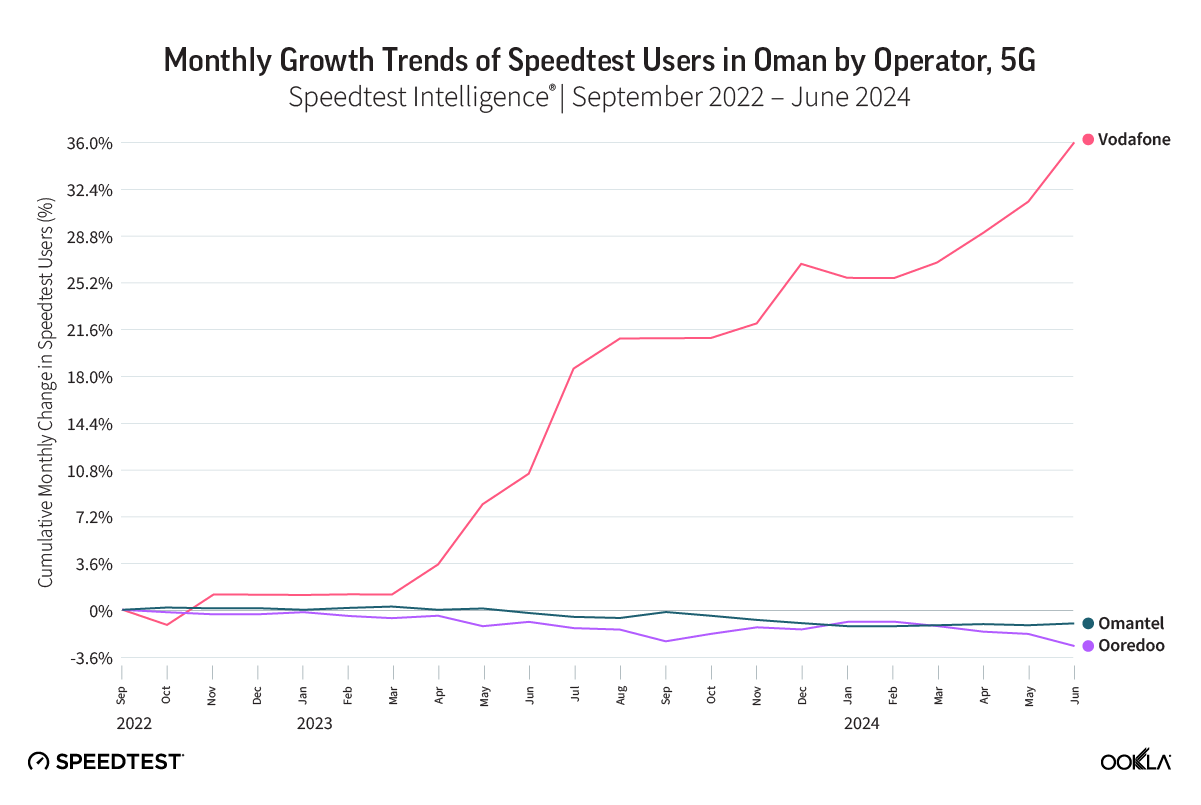
Speedtest Intelligence can help monitor changes in mobile subscriptions over time, enabling us to capture user preferences and market share shifts. The chart below shows the cumulative monthly percentage change in Speedtest users between September 2022 and June 2024. A positive trend indicates that a mobile operator acquired more users during that period, while a negative trend signifies that many customers were transferred to other operators. We use the cumulative monthly change in users as a proxy for subscriber churn.

Oman has a high level of mobile penetration, which means Vodafone’s growth potential in attracting subscribers from other operators. This is confirmed by our data as Vodafone stands out with an accelerated upward trend, indicating an increased shift of users from its competitors over time, and more so for 5G than 4G. Vodafone saw a 36% cumulative growth in 5G Speedtest users, while Omantel’s Speedtest user base decreased by just over 1%, and Ooredoo’s Speedtest base shrunk by 2.8%.

Vodafone also saw an acceleration in 4G customer acquisition, with its  4G Speedtest base expanding by 12.2%, while Ooredoo briefly gained users in June 2023 before eventually contracting by 2.9%. Omantel has consistently lost ground, decreasing by 0.9% by June 2024.

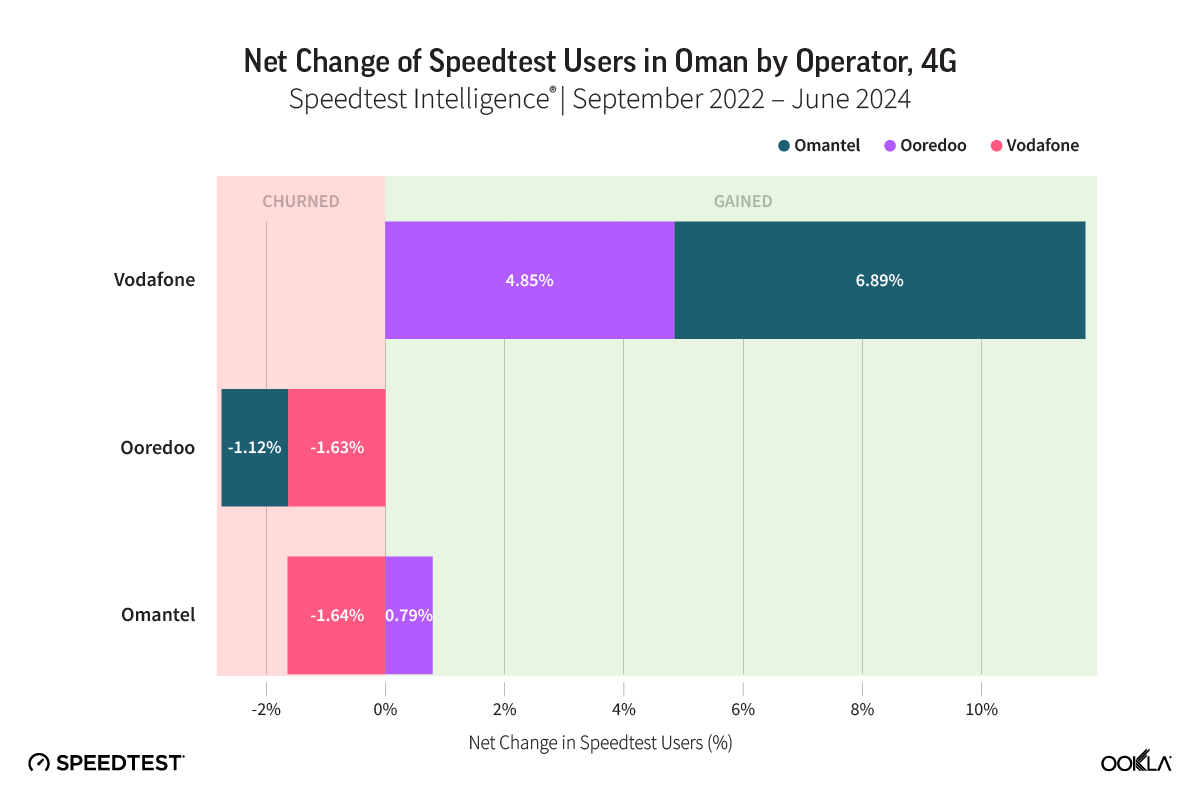
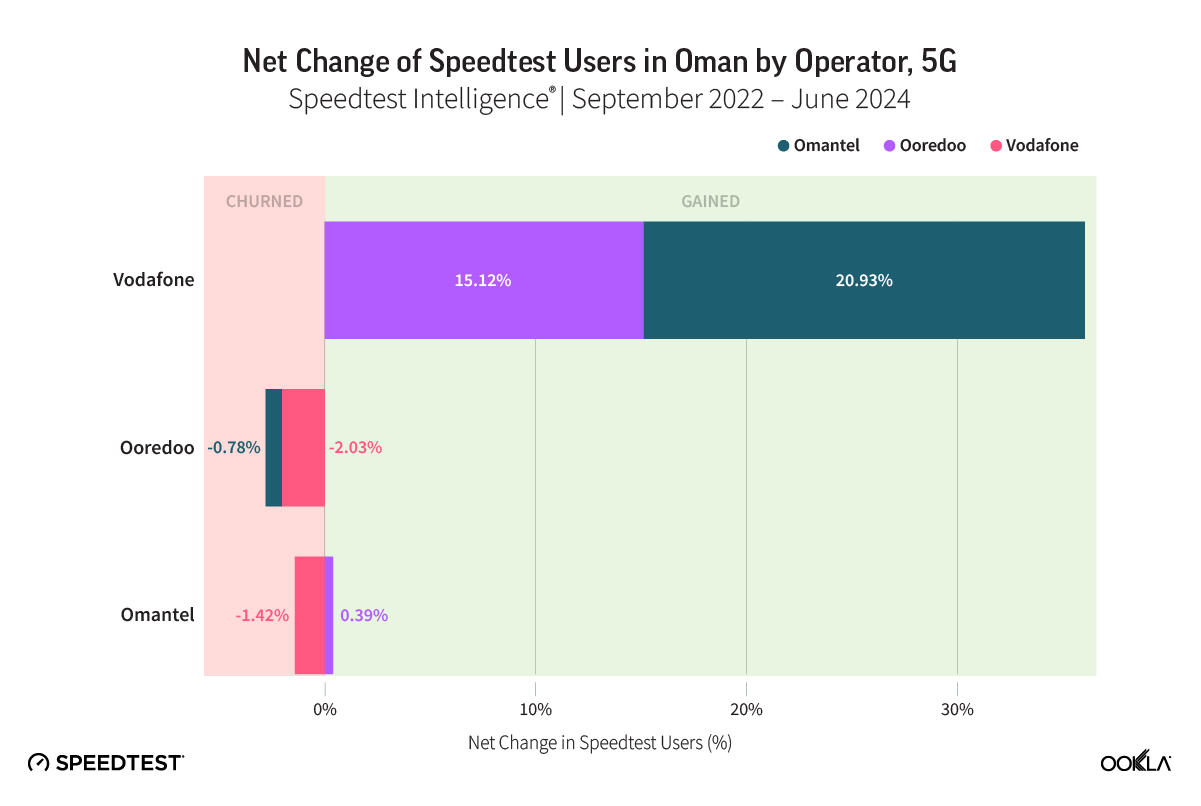
The following two charts show the breakdown of the Speedtest net additions and net losses per operator, which can be considered as a proxy for customers’ net additions and net additions, respectively, as a result of churn. 

Vodafone experienced the most significant gain in both 4G and 5G users. Its 4G Speedtest base increased by 4.8% from Ooredoo and 7.4% from Omantel. Ooredoo lost 1.6% of Speedtest users to Vodafone and 1.2% to Omantel. The latter gained 0.85% from Ooredoo, losing 1.7% of its base to Vodafone. A similar trend is seen for 5G Speedtest users, with Vodafone’s users expanding the most from both operators. Over the same period, Ooredoo lost the most, and Omantel witnessed a shift of customers to Vodafone (-1.4%) and gains from Ooredoo (0.4%).

The maps below depict the spatial distribution of 4G and 5G Speedtest users who migrated to another operator over the same period. Blue and green depict areas of low churn concentration, and orange and red show locations with high customer attrition levels. Such heatmaps can be valuable for targeted marketing initiatives and network improvement measures to mitigate churn. 

While the capital city and northern region witnessed the highest potential 4G churn, other towns in the south, such as Salalah, saw a similar phenomenon, albeit less intense. 5G churning is focused on and around the capital and Salah.

Map of Churned Users Distribution in Oman by Technology

Churners from Omanel and Ooredoo had mixed network experience after changing operators

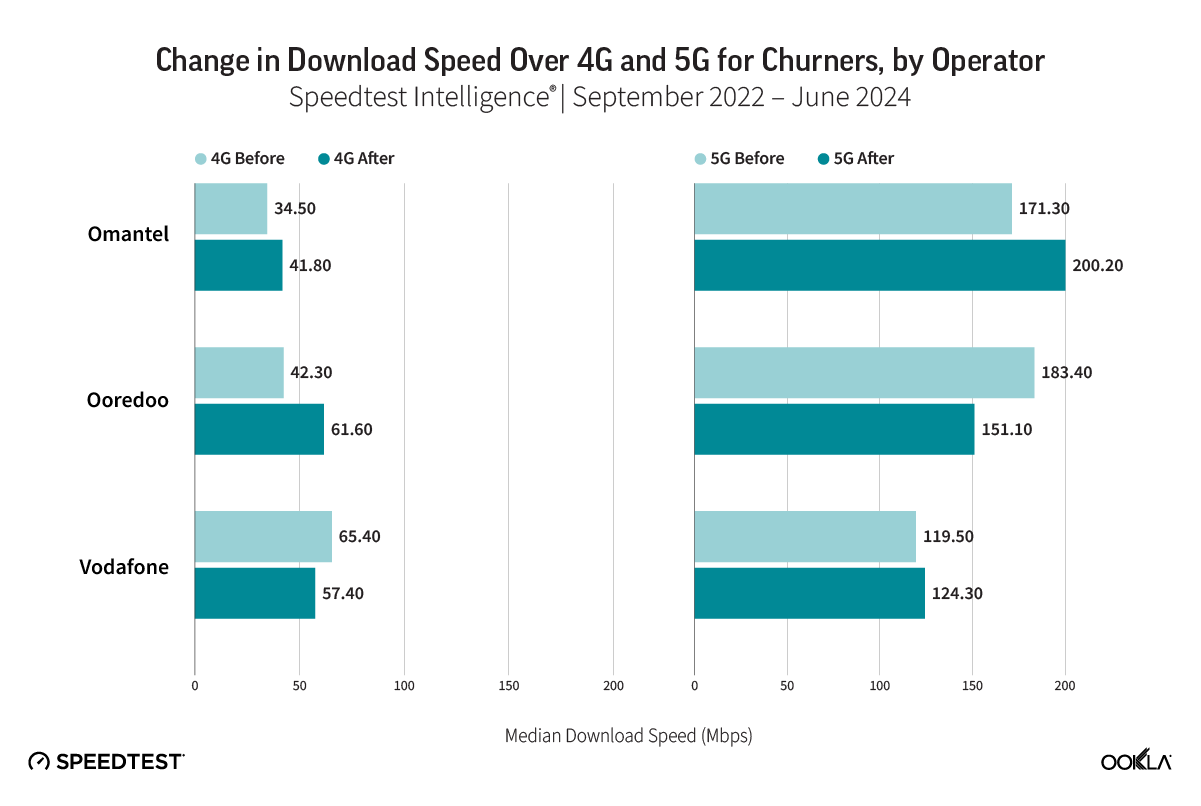
Speedtest Intelligence data provides insights into potential drivers of churn by examining network metrics such as download and upload speed before and after migration. The charts show the change in download upload speeds for customers who churned. Customers who moved from Omantel and Ooredoo to Vodafone experienced an improvement in 4G download speeds, respectively. Omantel customers migrating to other operators saw similar 5G improvements, but those moving from Ooredoo experienced a speed decrease to 115.1 Mbps. Those churning from Vodafone saw a slight download speed drop over 4G to 57.4 Mbps and a slight increase over 5G to 124.3 Mbps.

Chart of Change in Download Speed Over 4G and 5G for Churners, by Operator

The potential gain in upload speed for subscribers moving operators is less pronounced, as the three operators offer similar performance. In summary, most Omantel churners improved their 4G and 5G download speeds after switching to Vodafone. Those moving from Ooredoo would have improved their 4G but degraded their 5G download speed, suggesting other factors motivated churn, such as pricing, data allowance, or customer service. According to our data, users who churned were particularly dissatisfied with a customer rating of 2.3 for 4G users on a 1 to 5 scale, and a rating of 1.5 for 5G users.

Vodafone Oman has made significant strides in establishing itself as an innovative player in the country’s telecom market. It has managed to gain a 10% market share within two years of launch in a saturated market. While its robust network performance and emphasis on 5G technology have undoubtedly contributed to attracting customers from competitors, it is the company’s distinctive marketing strategies, competitive pricing, and digital-first approach that have solidified its appeal. Vodafone’s success in Oman serves as a blueprint for other telecom operators aiming to differentiate themselves in a crowded marketplace in the Middle East. However, to remain competitive, Vodafone should focus on continually innovating its service offerings, enhancing its customer services, and evolving its strategy not only to attract but also to retain a loyal customer base.

We will continue to monitor the Omani telecom market as it continues to evolve. For more information about Speedtest Intelligence data and insights, please contact us.

Ookla retains ownership of this article including all of the intellectual property rights, data, content graphs and analysis. This article may not be quoted, reproduced, distributed or published for any commercial purpose without prior consent. Members of the press and others using the findings in this article for non-commercial purposes are welcome to publicly share and link to report information with attribution to Ookla.

| December 20, 2024

Meta Outage Impacts Services Across Facebook, Instagram, and WhatsApp Globally

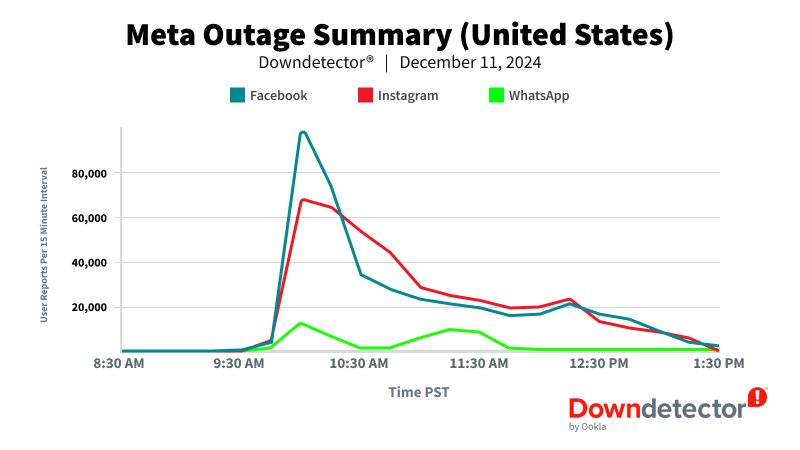
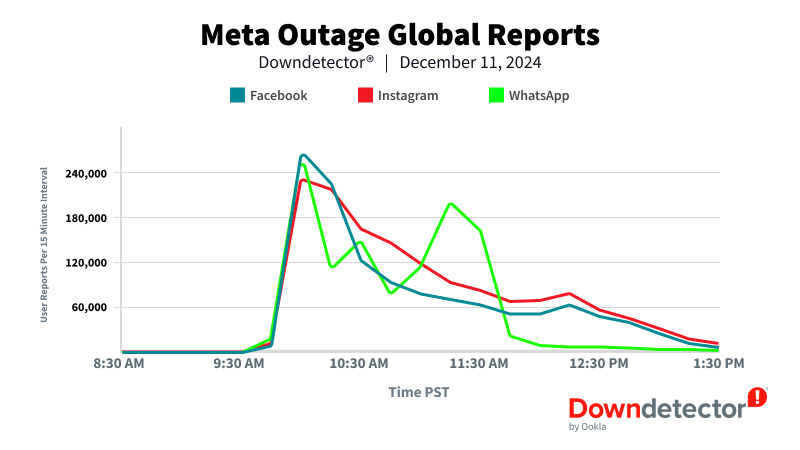
On December 11th, 2024, a significant outage affected Meta services, disrupting Facebook, WhatsApp, Instagram, and Messenger users worldwide. Reports of the outage flooded into Downdetector, with the platform providing real-time insights as the event unfolded. The scale of the disruption underscored the critical role Downdetector plays in tracking and identifying service issues for businesses and consumers alike.

Here’s a timeline of how the outage progressed, based on data captured in Downdetector.

9:45 AM PST — Initial Reports Appear in Downdetector

Reports of a Meta service disruption began to surface, with users globally reporting issues on Facebook, WhatsApp, and Instagram. Users received error messages when attempting to access the services.

10:00-10:15 AM PST — Outage Number Peaks

With the outage peaking across the world during this time, using Downdetector data we compared the reporting numbers on Meta’s services across the Americas. In the United States, Facebook reported the highest number of disruptions, with nearly 100,000 user-submitted incidents during this 15 minute window.

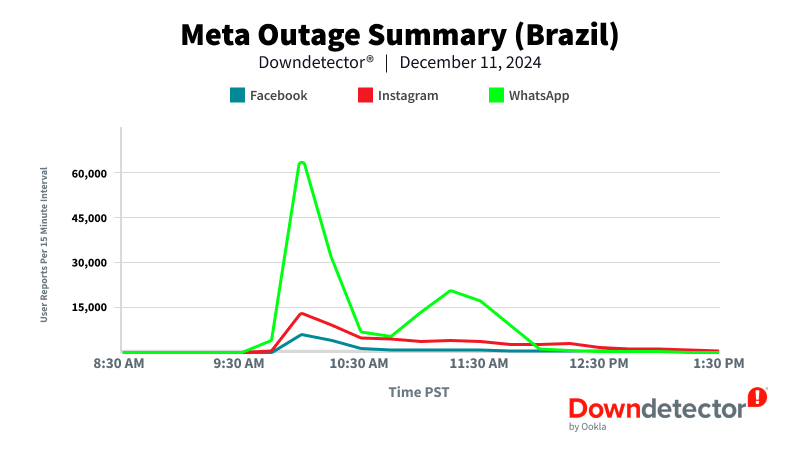
Meanwhile, in Brazil, WhatsApp saw the most significant impact, with 66,000 reports in the same timeframe.

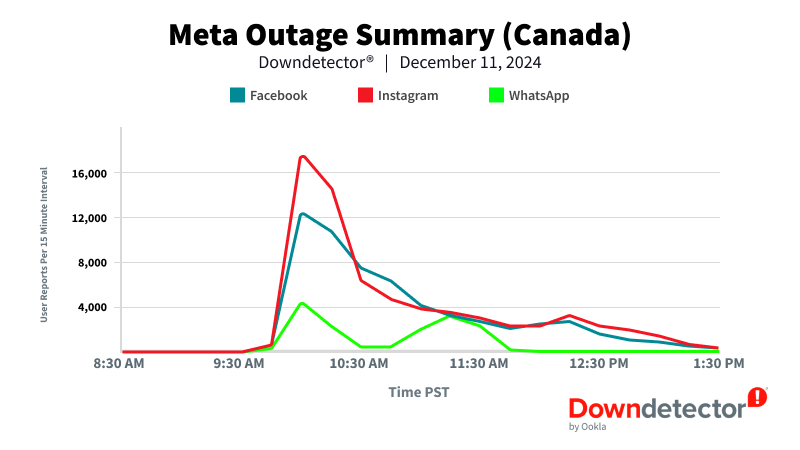
In Canada, Instagram peaked with the most reports with 17,000 reports during this time.

These figures highlight the global reach of the outage and shows how the popularity of Meta’s services vary by region, with different platforms experiencing peak number of reports in different countries.

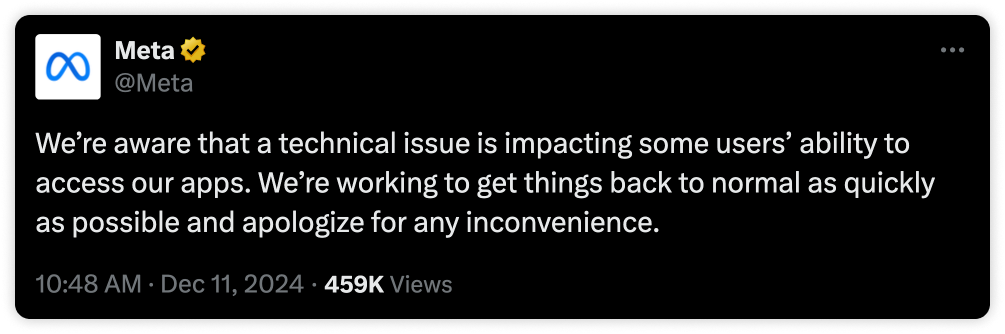
10:48 AM PST — Meta Acknowledges the Outage

Over an hour after Downdetector users were first notified of a potential disruption, Meta addressed the issue on X, assuring users that they were aware of the outage and were actively working to resolve it.

11:30 AM PST — Reports Exceed 3 Million Globally

As Meta worked on resolving the issue, users were still impacted and reports continued to flood into Downdetector. As of 11:30 AM PST the total number of reports exceeded 3 million globally.

12:00 PM PST — Speedtest Counts Peak

During the outage, many users turned to Speedtest to troubleshoot their internet connections, unsure if the issue stemmed from their provider or Meta’s services. As a result, Speedtest Intelligence® recorded a sharp increase in test counts throughout the outage. Starting at 10:00 AM PST, test activity began to rise, peaking at over 110,000 tests on fixed providers in Brazil alone by 12:00 PM PST.

This surge demonstrates a clear correlation between Speedtest and Downdetector, as users rely on both platforms as essential tools for diagnosing connectivity and service issues.

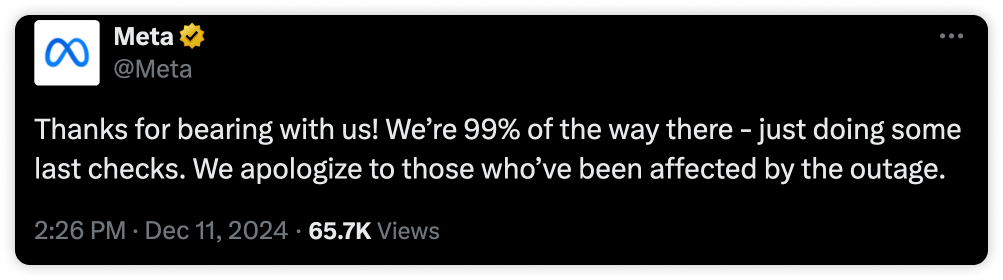
2:26 PM PST — Resolution Announced

After 5 hours and nearly 4 million reports across Facebook, WhatsApp, and Instagram globally, Meta announced that 99% of the outage had been resolved, with services returning to normal. As of this time, the exact cause of the disruption has not been disclosed.

Downdetector has proven to be an invaluable tool for real-time outage reporting, identifying issues faster than official communications from service providers. If you’re interested in learning how Downdetector can help you identify and prevent disruptions from becoming major outages contact us here.

Ookla retains ownership of this article including all of the intellectual property rights, data, content graphs and analysis. This article may not be quoted, reproduced, distributed or published for any commercial purpose without prior consent. Members of the press and others using the findings in this article for non-commercial purposes are welcome to publicly share and link to report information with attribution to Ookla.

| June 17, 2024

Your Guide to Airport Wi-Fi and Mobile Performance at 50+ Global Airports in 2024

Airports around the world have been packed with travelers this year, which puts extra stress on the Wi-Fi. With summer travel already well in swing in the northern hemisphere, we’re back with fresh data for our series on airport Wi-Fi performance to help you plan for connectivity at all your connections. You’ll find information about Wi-Fi on free networks provided by the individual airports as well as mobile speeds at some of the busiest airports in the world during Q1 2024. Read on for a look at internet performance at over 50 of the world’s busiest airports with data on download speed, upload speed, and latency.

Key takeaways

  • The seven fastest airports for downloads over Wi-Fi were in the United States: San Francisco International Airport, Newark Liberty International Airport, John F. Kennedy International Airport, Phoenix Sky Harbor International Airport, Seattle–Tacoma International Airport, Dallas Fort Worth International Airport, and Harry Reid International Airport.
  • Six U.S. airports had the fastest uploads over Wi-Fi: San Francisco International Airport, Phoenix Sky Harbor International Airport, Newark Liberty International Airport, Seattle–Tacoma International Airport, Dallas Fort Worth International Airport, and John F. Kennedy International Airport.
  • The fastest mobile download speeds on our list were at Hamad International Airport in Doha, Qatar, Shanghai Hongqiao International Airport in China, and Phoenix Sky Harbor International Airport in the U.S.
  • Eight of the 10 airports with the fastest mobile upload speeds were in China.

9 airports have 100+ Mbps Wi-Fi download speeds

Speedtest Intelligence® showed seven of the nine airports with median Wi-Fi download speeds over 100 Mbps were in the U.S.:

  • San Francisco International Airport (173.55 Mbps),
  • Newark Liberty International Airport (166.51 Mbps),
  • John F. Kennedy International Airport (151.59 Mbps),
  • Phoenix Sky Harbor International Airport (151.28 Mbps),
  • Seattle–Tacoma International Airport (137.31 Mbps),
  • Dallas Fort Worth International Airport (119.92 Mbps), and
  • Harry Reid International Airport (107.84 Mbps).

Charles de Gaulle Airport in Paris, France and China’s Hangzhou Xiaoshan International Airport rounded out the list with median download speeds of 107.13 Mbps and 101.01 Mbps, respectively. Hartsfield–Jackson Atlanta International Airport and Sea–Tac had the lowest median multi-server latency on Wi-Fi of any of the airports surveyed during Q1 2024.

Hover on the pins on the map below to see full details for download and upload speeds as well as latency at all the airports analyzed.

Fixed Broadband Internet Speeds Over Free Wi-Fi at Global Airports
Speedtest Intelligence® | Q1 2024
A map showing fixed broadband speeds in selected global airports.

At Ookla®, we’re dedicated to making sure the networks you depend on are always at their best. With Ekahau®, our Wi-Fi solution, we know firsthand just how challenging it can be to optimize Wi-Fi at airports, especially when you have up to 900 people waiting at each boarding gate during the busiest travel times. While the speeds achieved by these top airports are impressive, we saw two smaller U.S. airports with median Wi-Fi download speeds over 200 Mbps during our U.S.-only analysis of airport Wi-Fi in the fall.

Six airports on our list use multiple SSIDs for their Wi-Fi networks for different terminals or to take advantage of the coverage advantages of 2.4 GHz and the speed advantages of 5 GHz frequencies. We have included data for all the SSIDs with sufficient samples in the map and reported in the text on the best result when using multiple SSIDs results in dramatically different speeds.

Eighteen airports on our list had median Wi-Fi download speeds of less than 25 Mbps. Mexico City International Airport in Mexico had the lowest median Wi-Fi download speed at 5.11 Mbps, followed by:

  • Tan Son Nhat International Airport in Vietnam (7.07 Mbps),
  • Beijing Capital International Airport in China (9.45 Mbps),
  • Cairo International Airport in Egypt (10.62 Mbps), and
  • Tokyo Haneda Airport in Japan (11.37 Mbps).

You may struggle with everything from video chatting to streaming at any airport with a download speed below 25 Mbps. Latency is also a factor in performance so if your airport is one of the three with a median Wi-Fi latency over 60 ms, a mobile hotspot may be a better option for a stable connection.

Wi-Fi 6 has arrived

Our analysis shows at least 15 airports on our list were using the new Wi-Fi 6 standard in their Wi-Fi setup. Wi-Fi 6 uses Multi-User Multiple Input, Multiple Output (MU-MIMO) and Orthogonal Frequency Division Multiple Access (OFDMA) to increase performance and throughput, especially when serving multiple devices. This offers a real advantage at a large public location like an airport. In order to get maximum benefit from Wi-Fi 6, consumers would need to be using Wi-Fi 6-compatible devices. Speedtest data shows a fairly even split between airports that saw faster download speeds on Wi-Fi 6 and airports where Wi-Fi 6 results were comparable to those on other earlier Wi-Fi generations.

As you know, international travel can be complicated. Even if the airport offers free Wi-Fi, you may encounter other barriers to access. For example, a local number is required in Cairo to receive the access code to connect to the airport Wi-Fi. And while we’d love to include other large airports like Nigeria’s Murtala Muhammed International Airport in future Wi-Fi analyses, they currently do not offer free Wi-Fi so we have included mobile data below.

11 airports show mobile speeds over 200 Mbps

Speedtest® data shows mobile speeds massively outpaced Wi-Fi, with 14 airports showing faster median downloads over mobile than the fastest airport for Wi-Fi. Hamad International Airport in Qatar had the fastest median download speed over mobile on our list at 442.49 Mbps during Q1 2024, followed by:

  • Shanghai Hongqiao International Airport (341.19 Mbps),
  • Phoenix Sky Harbor International Airport (295.94 Mbps),
  • Shanghai Pudong International Airport (264.71 Mbps),
  • Chongqing Jiangbei International Airport (258.42 Mbps), and
  • Istanbul Airport (255.51 Mbps).

Mobile Network Speeds at Global Airports
Speedtest Intelligence® | Q1 2024

Fastest mobile speeds at airports in Africa and South America

Jomo Kenyatta International Airport in Kenya had the fastest mobile download speeds of the four African airports we analyzed at 88.12 Mbps during Q1 2024. São Paulo/Guarulhos International Airport in Brazil was the faster of the two Latin American airports analyzed with a median download speed of 55.44 Mbps.

Airports with slow mobile speeds

Mobile can’t fix everything, because six airports came in with a median mobile download speed below 25 Mbps. Mexico City International Airport was again at the bottom with 8.75 Mbps, followed by:

  • Josep Tarradellas Barcelona–El Prat Airport (15.21 Mbps),
  • Orlando International Airport (15.84 Mbps),
  • Adolfo Suárez Madrid–Barajas Airport (20.37 Mbps),
  • Chhatrapati Shivaji Maharaj International Airport (20.96 Mbps), and
  • Indira Gandhi International Airport (21.80 Mbps).

Latency on mobile was generally higher than that on Wi-Fi with 46 airports showing a Wi-Fi latency lower than the lowest latency on mobile, 27.51 ms at China’s Shanghai Hongqiao International Airport. As noted above, latency is an important factor in performance, so it might be worth investigating the airport Wi-Fi by running a Speedtest if your mobile performance seems to lag.

Airport Wi-Fi or mobile? Connecting on your next trip

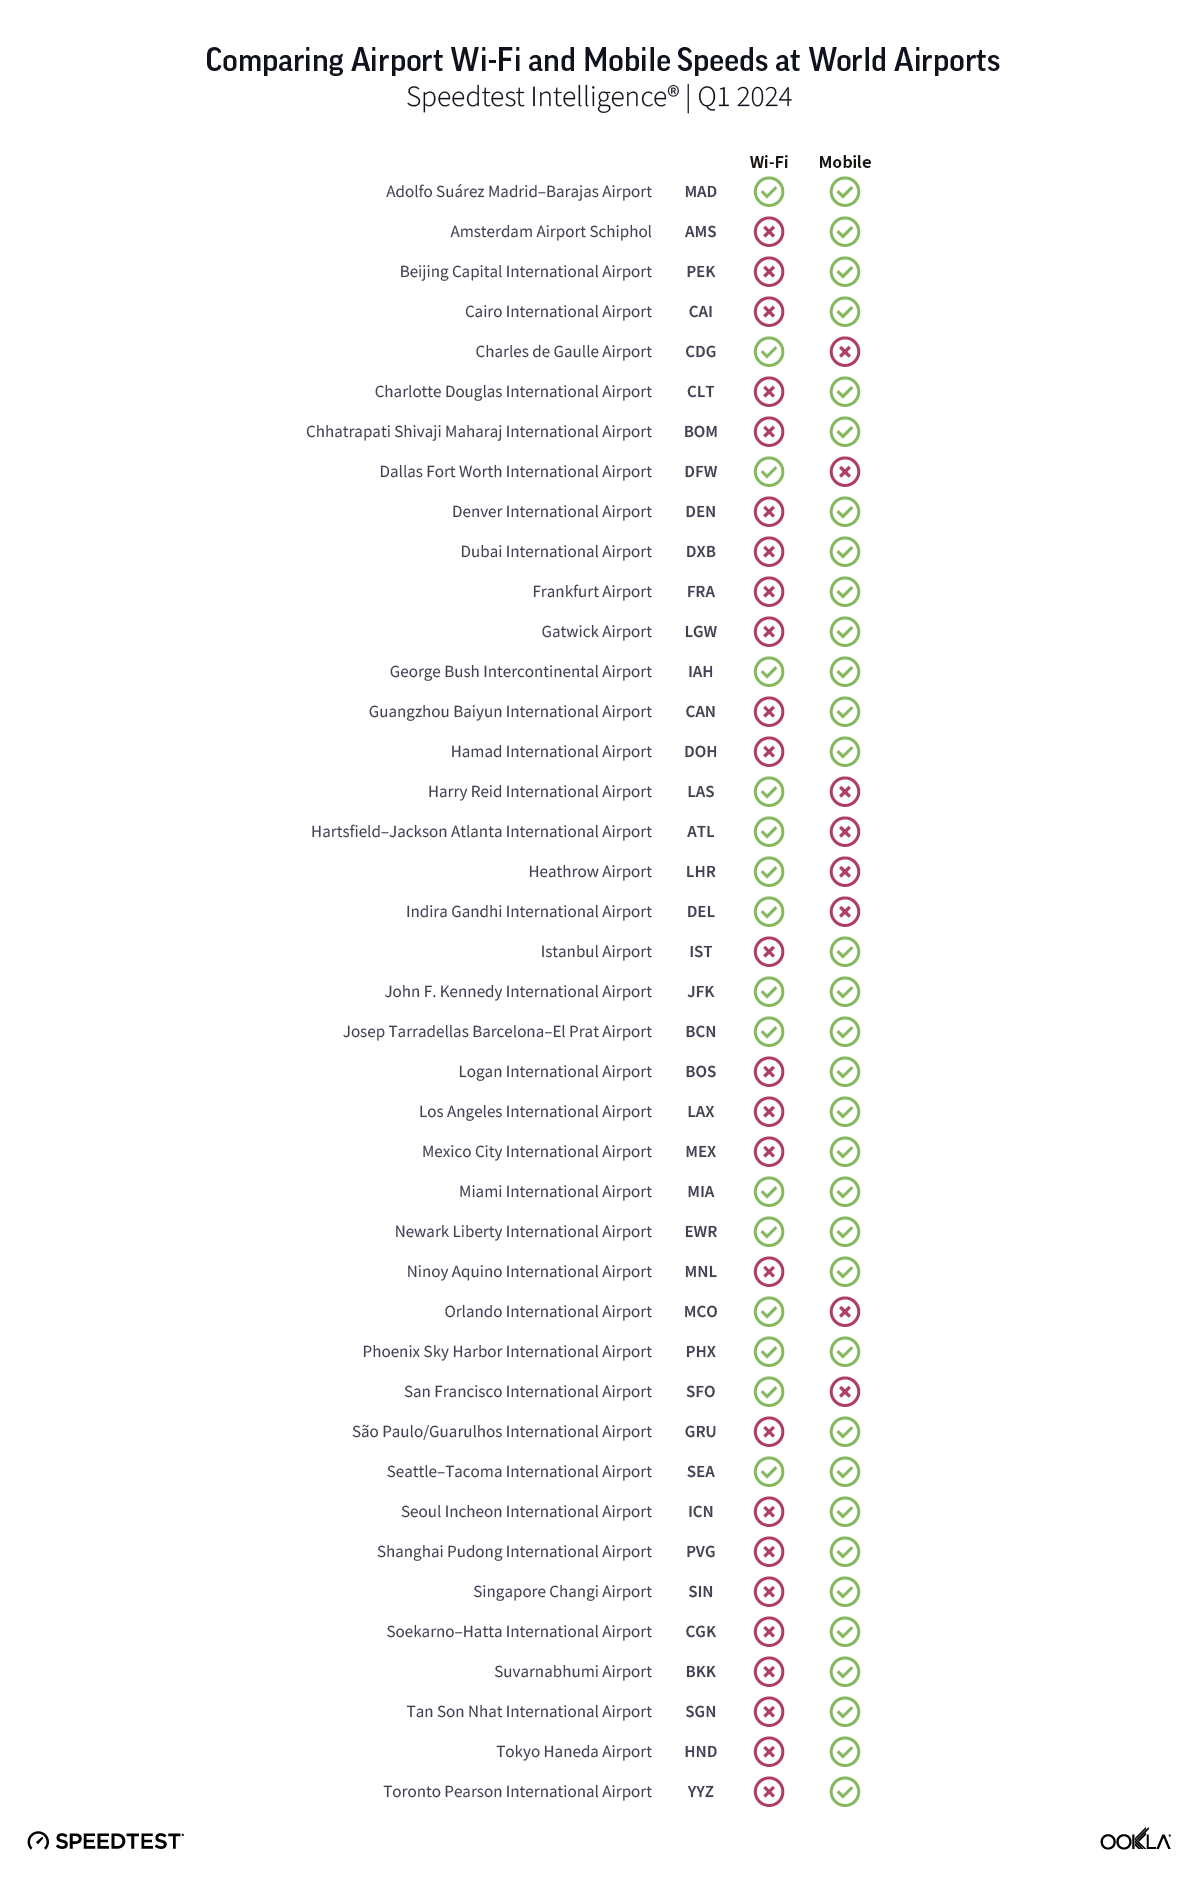
We created a quick guide to help you decide whether to try out the Wi-Fi or simply use the local mobile network if you have access. Use it to compare free airport Wi-Fi performance against mobile performance for the 52 airports we have both Wi-Fi and mobile data for during Q1 2024. Twenty-six airports had faster mobile internet than airport Wi-Fi. Eight airports had faster Wi-Fi than mobile, and seven airports showed only a slight distinction between Wi-Fi and mobile or download speeds over 100 Mbps on both, so we gave both the green check marks. We were able to include more airports in the mobile analysis because there were more mobile samples to analyze at those airports than there were samples over Wi-Fi.

Chart of Comparing Airport Wi-Fi and Mobile Speeds at World Airports

The averages reported here are based on real-world data, so your experience may differ, especially on a busy travel day. Take a Speedtest® at the airport to see how your performance compares. Cheers to safe travels and rapid connections wherever you’re flying.

Ookla retains ownership of this article including all of the intellectual property rights, data, content graphs and analysis. This article may not be quoted, reproduced, distributed or published for any commercial purpose without prior consent. Members of the press and others using the findings in this article for non-commercial purposes are welcome to publicly share and link to report information with attribution to Ookla.

| November 17, 2024

iPhone 16 5G Performance: How Does Apple's Latest and Greatest Compare to Previous iPhones and Samsung Galaxy Flagships?

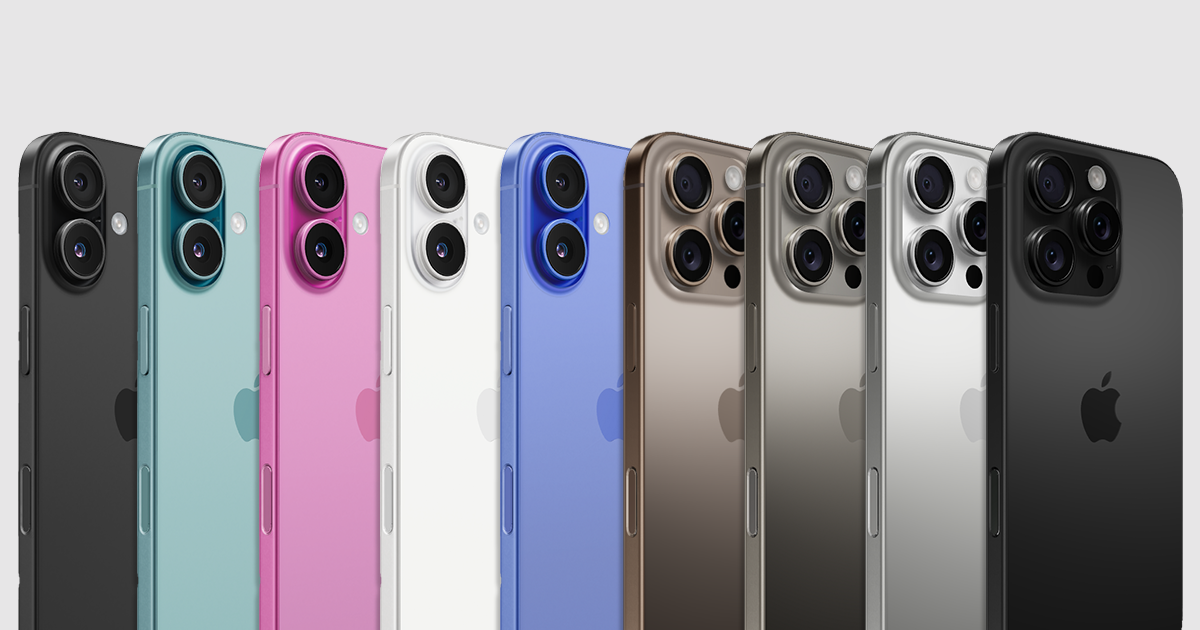
The latest iPhone 16 family of smartphones launched on September 20, and with Black Friday approaching, many potential buyers are considering upgrading to a new iPhone model. But a key question remains: Is it worth it? To help answer that question, we’ve analyzed how the iPhone 16 family of devices measures up against its predecessors in terms of 5G speed and latency during its first several weeks on the market. 

Looking at Speedtest® data from 11 select countries around the world from September 20 – October 20, 2024, we examined whether the iPhone 16 lineup — comprising the iPhone 16, 16 Plus, 16 Pro, and 16 Pro Max models — outpaced Apple’s earlier iPhone 14 and 15 families for 5G speed and latency performance. We’ve also compared the 5G speeds and latency of iPhone models with Samsung’s most recent offering, the Galaxy S24 family, including the S24, S24+, and S24 Ultra.

It’s important to note that device performance metrics can vary significantly from one country to another. Factors such as the performance of networks themselves in each country, government and mobile operator investments in 5G infrastructure, spectrum allocations, and the extent of 5G network deployment all contribute to speeds and variations across countries. 

Key takeaways:

  • The Apple iPhone 16 lineup showed a statistically significant lead for median 5G download speeds in five out of 11 countries in this study. 
  • At the slower end of the scale, the Apple iPhone 14 offered the slowest median 5G download speeds in 7 out of 11 countries. It’s worth noting, however, that speed differences between the devices were relatively minor in some of the countries analyzed (see the charts below for details). 
  • The Samsung Galaxy S24 family recorded the lowest (and, therefore, best) median 5G multi-server latency in 8 countries, whereas the iPhone 16 lineup led for 5G latency in one market. 
  • The Galaxy S24 family led on median 5G upload speeds in 8 of 11 countries, while iPhone 14 and 15 devices typically showed the slowest upload speeds. 

To learn more about what speeds mean in real-world terms, check out our article looking at how much speed users need for a variety of daily mobile activities.

Take me straight to the data!

Asia Pacific | Europe | Latin America | North America 

New chipsets and modems in the iPhone 16 lineup 

When investing in an expensive new smartphone, consumers naturally want to know if the upgrade will be worth it. While the iPhone 16 lineup includes various new upgrades and features, let’s look at the components that impact connectivity performance, specifically the chipsets and modems across our study’s devices:

  • iPhone 16 base model and 16 Plus use the Apple A18 system on a chip (SoC), while the Pro and Pro Max models feature the A18 Pro, with all iPhone 16 devices incorporating the Snapdragon X75 5G modem.
  • iPhone 15 base models use the A16 Bionic chipset and Pro models run on the A17 Pro, and both are paired with the Snapdragon X70 5G modem
  • iPhone 14 and 14 Plus models are equipped with an A15 chipset, and the iPhone 14 Pro and Pro Max feature the A16 Bionic chip. All iPhone 14 devices use a Snapdragon X65 5G modem
  • Samsung Galaxy S24 devices also utilize the Snapdragon X75 5G modem

Do you own one of these devices? See how your speeds compare by taking a quick Speedtest

Digging into the data: Where does the Apple iPhone 16 lead its earlier iPhone and Samsung counterparts around the world?  

Early findings from Speedtest Intelligence® show that the latest iPhone 16 family outperformed its predecessors in terms of 5G performance across several of the markets we analyzed. While the performance differences between device families were minimal in some countries, iPhone 16 models demonstrated major speed advantages over previous generation Apple and Samsung devices in markets like Canada, France, Taiwan, and the United States.

Does that mean users in those locations should upgrade immediately? Not necessarily. The decision to upgrade depends on factors other than network performance, from price to new features and plenty of other things. However, our initial data on the 5G capabilities of the iPhone 16 series is encouraging in its early days of release.

Read on to see our complete analysis of all 11 countries in this study or select a region below to dig into more localized results.

Asia Pacific | Europe | Latin America | North America 

Asia Pacific 

iPhone 16 shows modest lead in 5G speeds in India

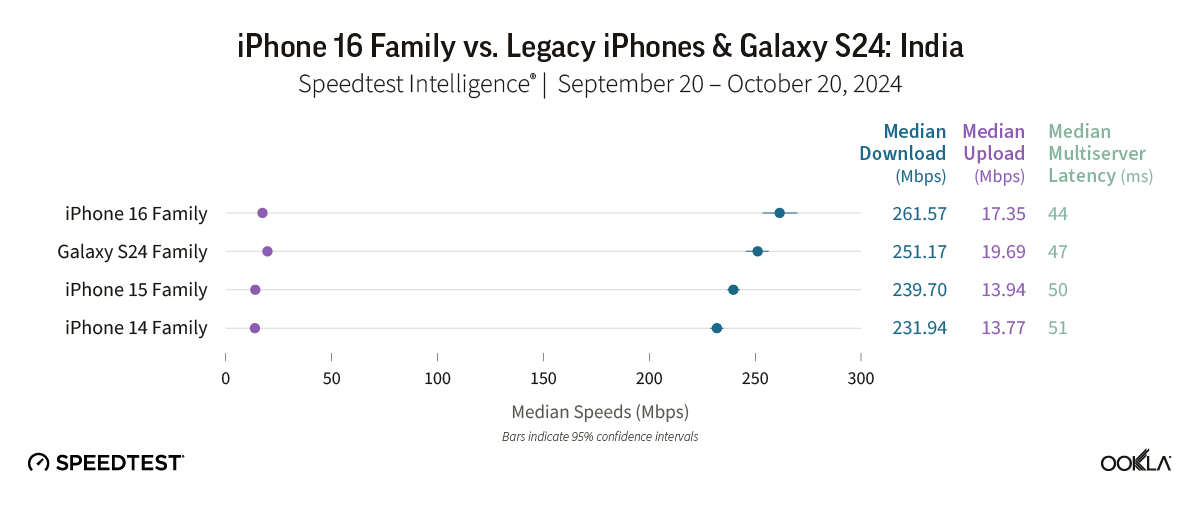
In India, all device families posted strong 5G results, with speeds ranging from 231.94 to 261.57 Mbps. The iPhone 16 lineup posted a median 5G download speed of 261.57 Mbps and the lowest median 5G multi-server latency at 44 ms. The Galaxy S24 family followed closely at 251.17 Mbps for downloads and claimed the top spot for 5G upload speeds at 19.69 Mbps. The iPhone 15 and 14 families trailed but still delivered solid speeds above 230 Mbps, with median 5G upload speeds of roughly 14 Mbps each.

Bottom line: Current iPhone 14 users might be tempted by the 30 Mbps advantage seen with the iPhone 16 lineup in this study. While 5G speeds were excellent across all device families in India, early adopters who want the latest and greatest might find the iPhone 16’s performance edge helps justify that upgrade itch.

Galaxy S24 family leads the Philippines for 5G speeds, while iPhone 16’s show modest advantage over previous iPhones

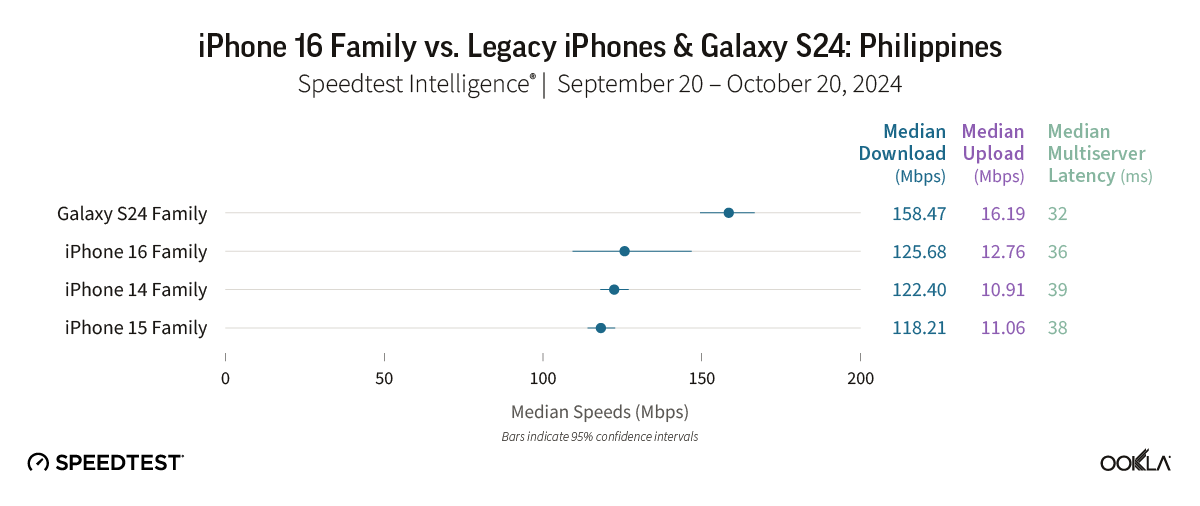
Speedtest Intelligence data revealed the Galaxy S24 family leading the Philippines market with a median 5G download speed of 158.47 Mbps and the lowest median 5G multi-server latency at 32 ms. The iPhone 16 lineup showed relatively minor improvement over its predecessors, posting a median 5G download speed of 125.68 Mbps, a tick above the iPhone 15 and 14 families (both registered speeds of about 120 Mbps).  

Bottom line: While the iPhone 16 showed slight improvements over previous iPhone generations, the Galaxy S24 family offered the strongest 5G performance in the Philippines, with a roughly 33 Mbps advantage in 5G download speeds.

iPhone 16 lineup leads Taiwan for 5G speed, with impressive performance across all devices

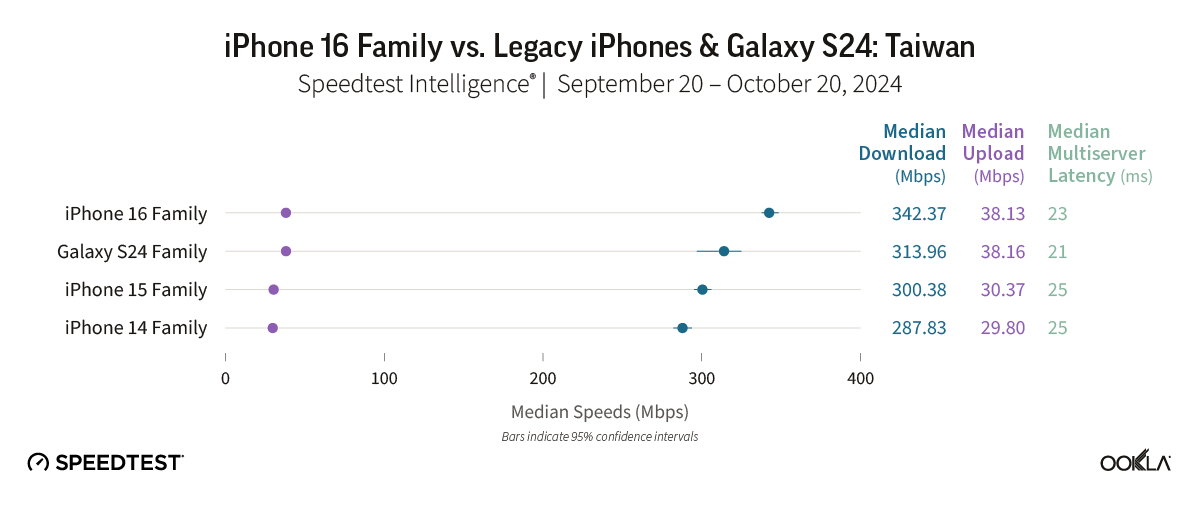
5G speeds were excellent across the board in Taiwan, with median 5G download speeds ranging from 287.83 to 342.37 Mbps. The iPhone 16 lineup led the market with a median 5G download speed of 342.37 Mbps. The Galaxy S24 family followed at 313.96 Mbps and matched the iPhone 16’s 5G upload performance at around 38 Mbps. The iPhone 15 and 14 families trailed the 16 lineup but still impressed with speeds above 287 Mbps.

Bottom line: The iPhone 16 lineup led Taiwan’s impressive 5G speed landscape by roughly 30 Mbps. However, with all device families delivering median 5G download speeds of at least 287 Mbps, users should experience excellent 5G performance regardless of which phone they choose, making the decision to upgrade a bit tricky and potentially more about the new model’s features than about speed.

Europe 

For users in Belgium, the iPhone 16 is worth a look

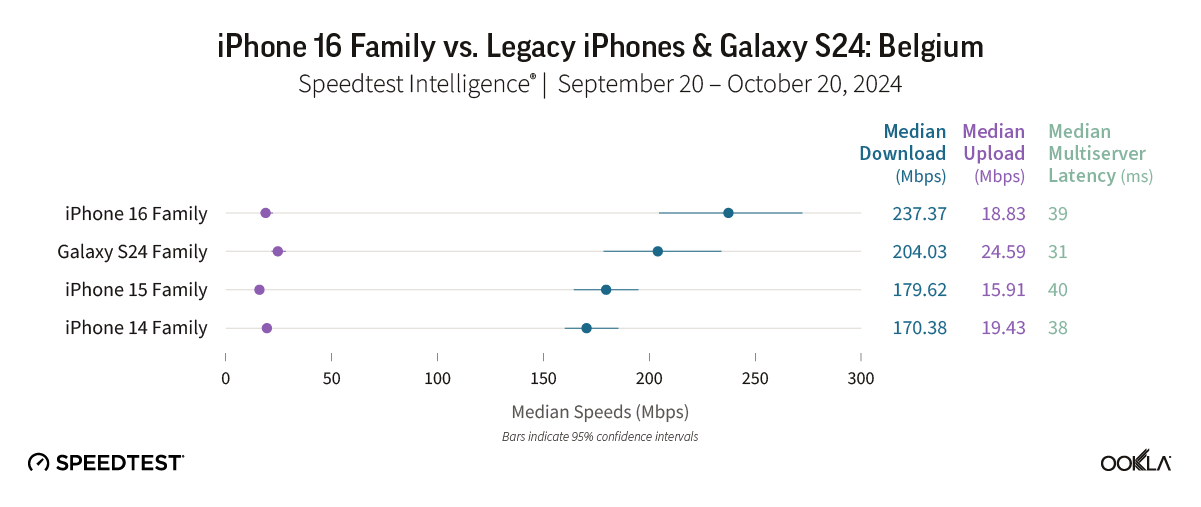
Speeds in Belgium were strong across the board, with the iPhone 16 lineup clocking a median 5G download speed of 237.37 Mbps. The iPhone 14 and 15 lineups trailed, posting median 5G download speeds of a little over 170 Mbps each. Latency was also impressive in general, with all four device families registering median 5G multi-server latency of 40 ms or better.

Bottom line: The iPhone 16 family’s current speed advantages over its predecessors in Belgium suggest an upgrade might be worth considering for users focused on 5G performance. That said, all devices in the market delivered good speeds that should provide users with quick downloads and strong connectivity overall. 

Upgrading to an iPhone 16 may be appealing for France users

In France, the iPhone 16 lineup led the way for 5G speed with a median 5G download speed of 279.29 Mbps, offering a speed advantage of nearly 60 Mbps compared to older iPhones. The Galaxy S24 family placed second at 242.34 Mbps and posted the lowest median 5G multi-server latency at 38 ms.

Bottom line: With the iPhone 16 lineup clocking 5G download speeds significantly faster than both previous iPhone generations and the latest Samsung devices, users seeking faster speeds may want to consider a new iPhone.

German users could see 5G speed gains with an iPhone 16 

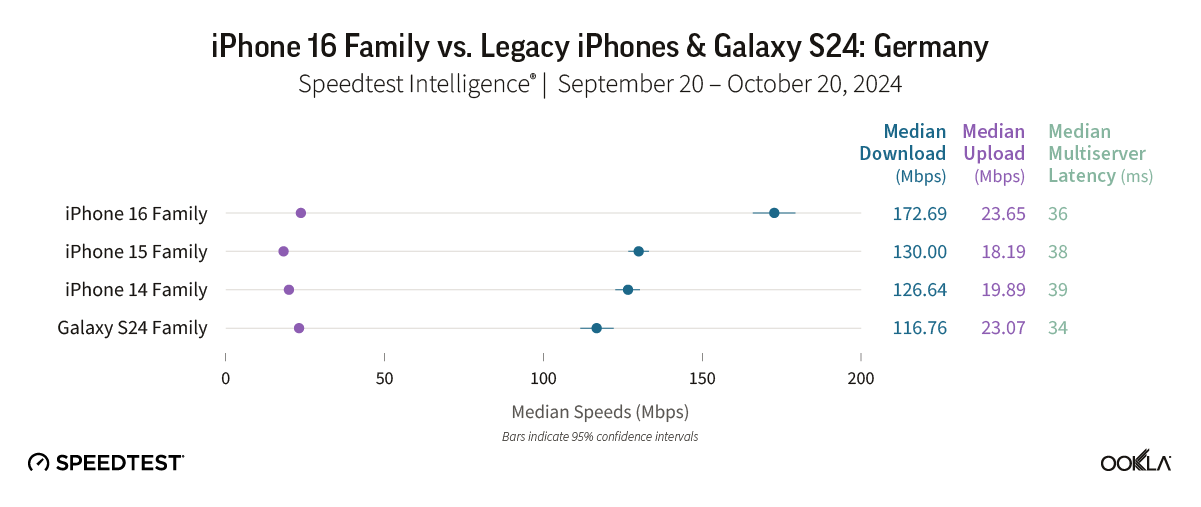
The iPhone 16 lineup led the pack in Germany with a median 5G download speed of 172.69 Mbps, more than 40 Mbps faster than iPhone 14 and 15 models, which delivered speeds of roughly 130 Mbps each. Meanwhile, the Galaxy S24 series trailed in download speed, but it registered the lowest median 5G multi-server latency in the market at 34 ms.

Bottom line: If you’re using an older iPhone in Germany, the iPhone 16’s speed advantage over previous models – and Galaxy S24 devices – could make it an appealing upgrade option.

Latin America

No compelling reason to upgrade just yet in Brazil

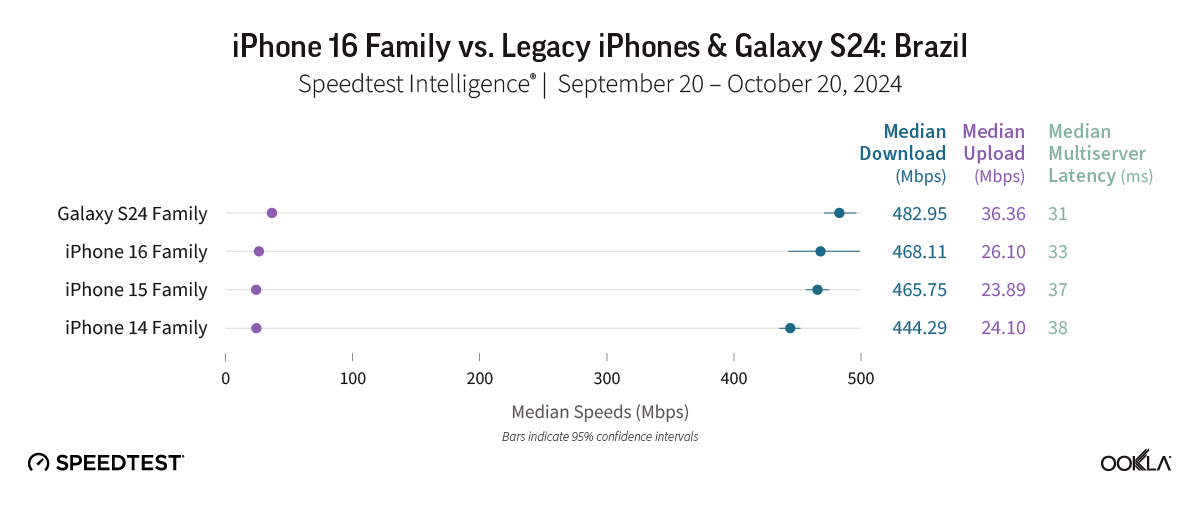
All devices in our study showed outstanding 5G speeds in Brazil, with speeds ranging from the iPhone 14’s median 5G download speed of 444.29 Mbps to the Galaxy S24’s 482.95 Mbps. The iPhone 16 and 15 families posted similar speeds of 468.11 Mbps and 465.75 Mbps, respectively.

Bottom line: Brazil was home to the fastest 5G speed on an iPhone in our 11-country study, with even the “slowest” speed in the market outpacing the top performers in other markets by over 100 Mbps. With all device lineups performing exceptionally well, the decision to upgrade in Brazil might come down to features rather than speed.

Galaxy S24 outpaces the iPhone 16 lineup for 5G speed in Colombia

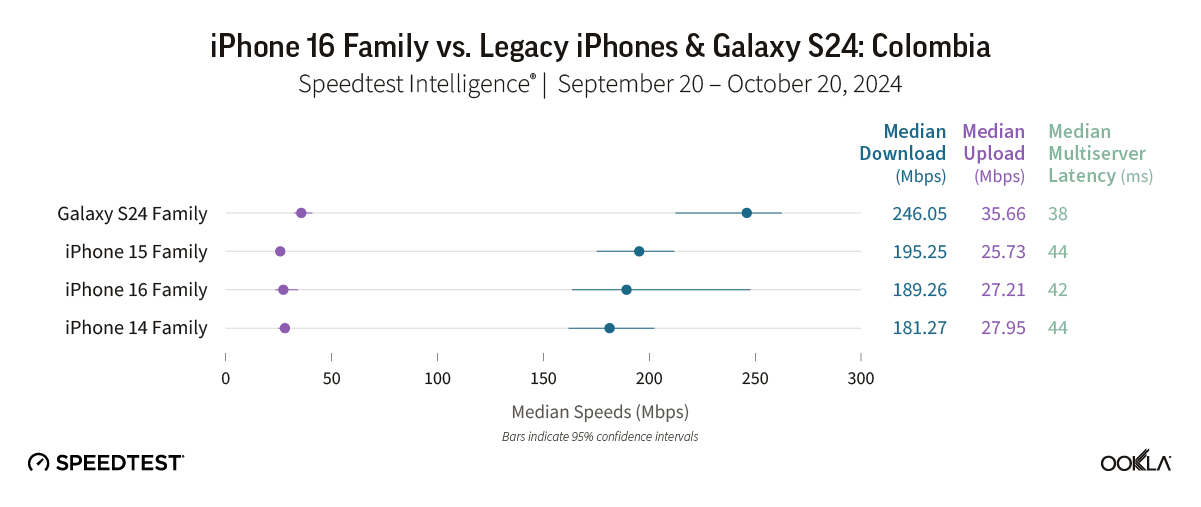
The Samsung Galaxy S24 family had a performance edge in Colombia, with its median 5G download speed of 246.05 Mbps coming in about 50 Mbps faster than its iPhone competitors. Its median 5G upload speed of 35.66 Mbps also led the market. All three iPhone lineups posted median 5G download speeds ranging from 181.27 Mbps to 195.25 Mbps.

Bottom line: The Galaxy S24 series led for 5G performance in Colombia, but when deciding whether to get a new device, raw speed isn’t always everything. Apple enthusiasts might consider the iPhone 16’s complete feature set and strong 5G speeds (even though they trailed those of the Galaxy S24 family), while current S24 users in Colombia will likely stand pat with the knowledge that their devices offer strong 5G performance in the market.

North America

iPhone 16 lineup in Canada faster than its predecessors

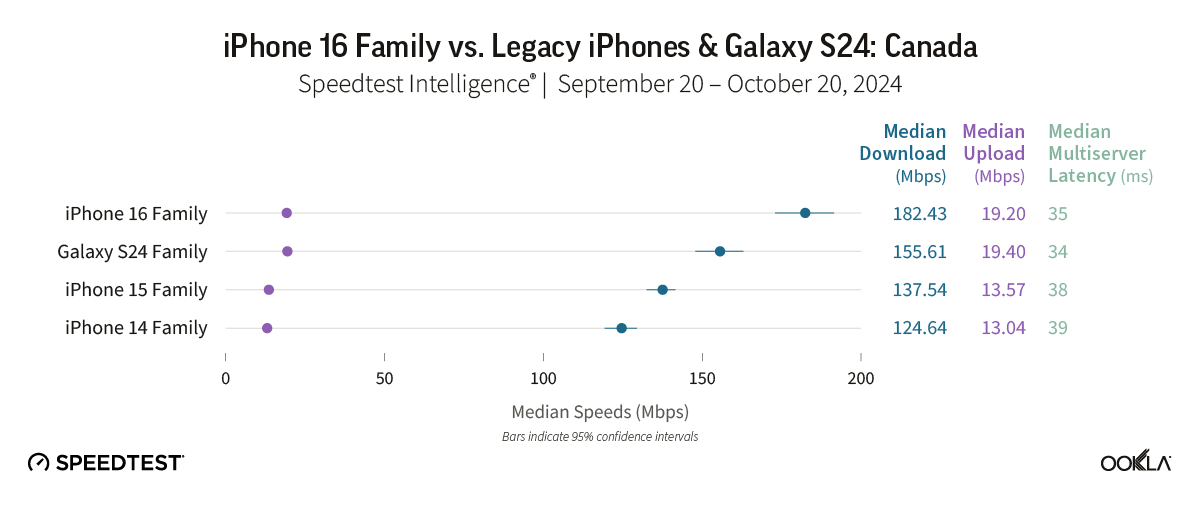
The iPhone 16 lineup showcased strong performance in Canada with a median 5G download speed of 182.43 Mbps, about 45 Mbps faster than those of earlier iPhone models. The Galaxy S24 family placed second at 155.61 Mbps and achieved the lowest median 5G multi-server latency at 34 ms, while iPhone 14 and 15 models trailed with still-strong speeds of 124.64 Mbps and 137.54 Mbps, respectively.

Bottom line: For Canadians looking for top-notch 5G performance, the iPhone 16 lineup makes a strong case with its lead in speed over older iPhone models. While all device families in Canada delivered good 5G speeds, for users who want both top performance and the latest features, the iPhone 16’s speed advantage might help justify that upgrade you’ve been considering.

No clear speed advantage in Mexico for the new iPhone 16 

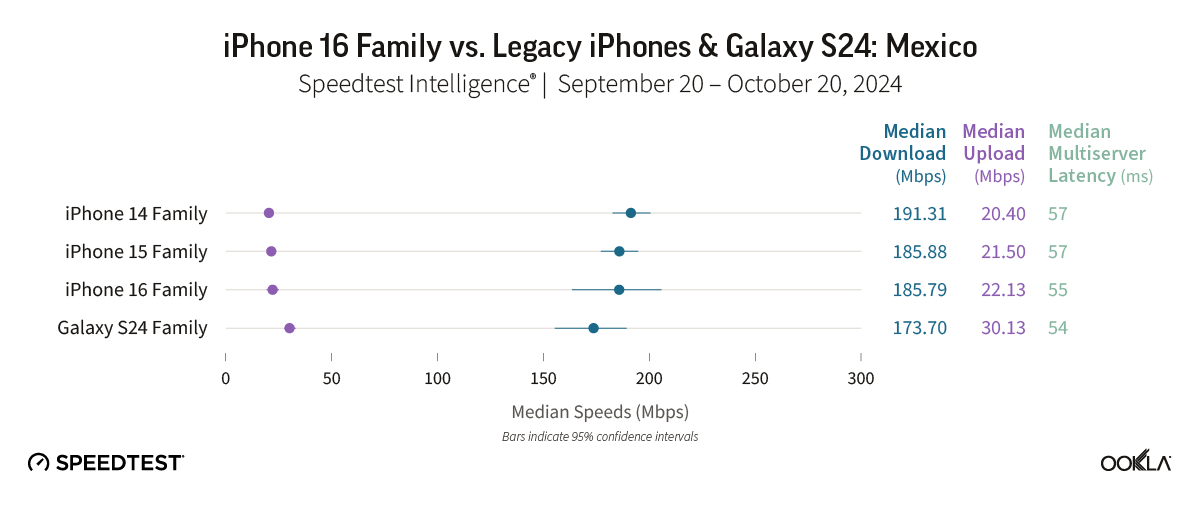
The latest iPhone devices showed remarkably close 5G speeds in Mexico, with speeds varying by just a few megabits per second across the different iPhone families. While the iPhone 14 family had a median 5G download speed of 191.31 Mbps, the iPhone 15 and 16 lineups performed similarly well, clocking in at 185.88 Mbps and 185.79 Mbps, respectively. The Galaxy S24 family followed at 173.70 Mbps.

Bottom line: Users in Mexico considering an iPhone upgrade might want to weigh factors beyond 5G performance, as our data shows minimal speed differences between recent iPhone generations. The choice to upgrade likely depends more on desired features and other device capabilities than network performance alone. 

iPhone 16 offers a strong choice in the United States

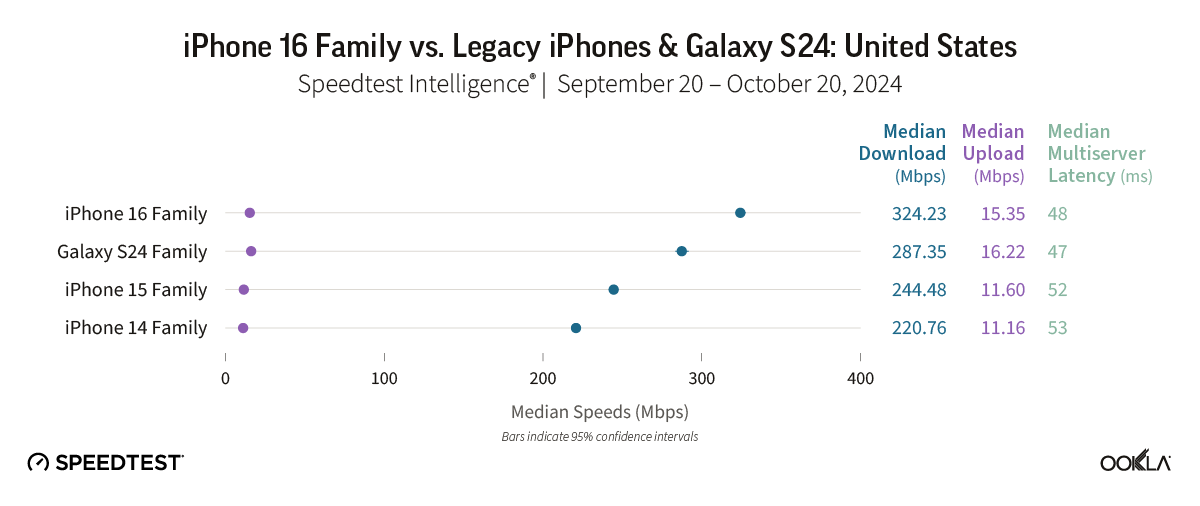
In the United States, our results showed the iPhone 16 lineup reaching a median 5G download speed of 324.23 Mbps, well ahead of both the Galaxy S24 family at 287.35 Mbps and older iPhones at 244.48 Mbps (iPhone 15) and 220.76 Mbps (iPhone 14). All device families provided solid latency performance below 53 ms.

Bottom line: While all devices in our study provided good speeds in the U.S., the iPhone 16’s standout performance is hard to ignore and makes a strong case for upgrading, particularly for users seeking the fastest 5G.

Ookla will continue monitoring how devices are performing 

We’ll continue to check in on device performance as new models enter the market, so stay tuned for further insights into mobile and fixed broadband performance in countries around the world. 

If you’ve recently made the switch to a new iPhone, make sure you’re getting the speeds you need (and pay for) by downloading the Speedtest app for iOS or Android.

Ookla retains ownership of this article including all of the intellectual property rights, data, content graphs and analysis. This article may not be quoted, reproduced, distributed or published for any commercial purpose without prior consent. Members of the press and others using the findings in this article for non-commercial purposes are welcome to publicly share and link to report information with attribution to Ookla.

| October 28, 2025

AT&T’s New FWA Strategy is Playing Out in Houston

Fortified with additional spectrum from EchoStar, AT&T is battling Comcast and other internet providers in Houston with its fixed wireless access (FWA) service.

Like Verizon and T-Mobile, AT&T is now putting more emphasis onto its FWA business. As part of that effort, AT&T agreed in August to purchase $23 billion worth of spectrum from EchoStar, including an average of 30 MHz of nationwide 3.45 GHz midband spectrum.

And AT&T can activate that spectrum relatively quickly – the operator can add EchoStar’s spectrum into its network through a software upgrade to its existing 5G equipment.

AT&T’s FWA strategy is crystalizing in Houston, Texas, where AT&T also operates an extensive fiber network. AT&T’s efforts there may pose a competitive threat to other fixed internet operators in the Houston market, including Xfinity provider Comcast, Ezee Fiber, and others.

Key takeaways:

  • Houston is a prime battleground for cable, fiber, and FWA. According to Ookla Speedtest Intelligence® data, AT&T’s median FWA download speed in Houston was 106.40 Mbps in September 2025, and its median upload speed during that period was 7.41 Mbps. That’s slower than the fiber offerings from AT&T and the cable offerings from Comcast in the city.
  • AT&T’s midband spectrum holdings (C-band and 3.45 GHz) in Houston stand to grow from 120 MHz to 150 MHz, a 25% increase, thanks to the addition of EchoStar’s 3.45 GHz spectrum licenses. More spectrum typically results in additional network capacity and faster speeds.
  • AT&T is using FWA to expand beyond the reaches of its fiber network in Houston, thereby competing with other fixed internet providers in Houston suburbs like Conroe and League City.

AT&T has reignited its FWA business

AT&T is no stranger to FWA. In 2015, AT&T agreed to offer internet connections in 1.1 million rural locations across 18 states as part of the U.S. government’s CAF II program. AT&T used 4G LTE-based FWA to reach some of those locations, offering speeds of at least 10 Mbps down and 1 Mbps up (which met the FCC’s broadband benchmarks at that time).

More recently, AT&T has re-engaged with FWA in a significant way via its 5G network. The company launched its 5G-powered Internet Air FWA product in August 2023, and has seen significant customer growth since.

AT&T Quarterly FWA Net Customer Additions
Operator reports | 2023-2025

However, AT&T has not pursued the FWA market as aggressively as its rivals. AT&T in the second quarter of 2025 passed the 1 million FWA customer milestone, while T-Mobile counted around 7.3 million FWA customers and Verizon said it had around 5.1 million FWA customers. Importantly, FWA speeds across all three providers have been increasing, according to Ookla findings.

Collectively, the FWA services from AT&T, T-Mobile, and Verizon have had a major impact on cable operators in the U.S. T-Mobile, Verizon, and AT&T added a combined 3.7 million FWA customers during 2024, while the nation’s top cable companies collectively lost roughly 1 million broadband subscribers.

AT&T officials have said the operator plans to use FWA in three situations:

  1. Outside of AT&T’s fiber footprint, thereby extending the reach of its converged fixed wireless / smartphone service.
  2. Inside its legacy copper network footprint. AT&T is working to decommission its copper network, and it will offer fixed wireless services to customers who will not receive a fiber alternative.
  3. In its planned fiber footprint. AT&T currently covers around 30 million U.S. locations with fiber, but it hopes to expand that to a total of 60 million locations by the end of 2030. The company plans to use FWA as an interim anchor while it builds fiber to those remaining locations.

That overall strategy aligns with AT&T’s efforts to sign up customers to multiple services – those customers are the most valuable, according to AT&T, in that they have the lowest churn profiles and highest lifetime values. In the third quarter of 2025, AT&T said that more than 41% of its fiber customers also subscribed to its mobile service, and more than half of its Internet Air FWA subscribers also subscribed to AT&T’s mobile service.

Houston is an FWA battleground

Sunit Patel, the CFO of U.S. cell tower operator Crown Castle, described Houston as an ideal location for fixed wireless services, particularly at the boundary between suburban and rural areas. “That’s usually … a good area where fixed wireless will work well,” he said at a recent investor conference.

Houston is also one of the fastest growing cities in the U.S., making it a prime market for internet service providers on the hunt for more customers. According to Rice University’s Kinder Institute for Urban Research, the Houston metro area added over 1.5 million new residents between 2010 and 2023, second only to the Dallas-Fort Worth metro area in terms of overall growth. During that same time period, the Chicago metro area lost about 210,000 residents, Los Angeles’ population dipped by about 40,000 people, and the New York metro area added about 580,000 residents.

According to Speedtest Intelligence, AT&T’s FWA median download speeds trail those of fiber and cable providers in Houston. AT&T Internet Air median download speeds reached 106.40 Mbps in September, while its median upload speeds hit 7.42 Mbps. Meanwhile, Comcast’s median cable download speeds in Houston clocked in at 292.81 Mbps and its median upload speeds were 41.49 Mbps in September (Comcast has been working to improve its upload speeds in Houston and elsewhere, according to recent Ookla findings). AT&T’s median fiber download speeds in the city were 366.56 Mbps and its median upload speeds were 306.90 Mbps. And Ezee Fiber’s median download speeds reached 545.39 Mbps and its median upload speeds were 464.46 Mbps. It’s worth noting that many internet service providers offer different tiers of service, with faster plans available at a higher price.

According to Speedtest Insights®, AT&T’s fixed wireless business is spread throughout the greater Houston metro area:

Map of AT&T FWA Median Download Speeds in Houston, TX

This is likely due to the inherent limits of FWA on a 5G network. FWA is deployed in areas with excess 5G network capacity to prevent overloading. Dense accumulations of FWA customers might overload portions of that 5G network, affecting both FWA and smartphone customers.

This is much different from a fiber network design, which typically has plenty of capacity. As a result, fiber operators tend to load as many customers as possible onto their networks, regardless of user density. The more, the better. After all, each foot of an underground fiber network costs a median of $18.25 to build, according to the Fiber Broadband Association.

AT&T’s deployment of FWA on the fringes of its fiber network can be seen in Houston suburbs like Conroe and League City, according to Speedtest Insights. These are cities where AT&T’s fiber network does not fully reach – but where it is offering FWA connections. They are also locations where other providers – including Comcast, Ezee Fiber, and others – currently offer internet connections.

AT&T can leverage EchoStar’s spectrum to expand its FWA business

Although 5G operators can use any spectrum band for FWA, midband spectrum like 3.45 GHz (used by AT&T), C-band (used by AT&T, Verizon, and T-Mobile), and 2.5 GHz (used by T-Mobile) form the backbone of today’s 5G-powered FWA services in the U.S. Such spectrum is considered appropriate for covering wide geographic areas as well as providing speedy, high-capacity connections.

AT&T has been slowly growing its midband spectrum holdings. The operator spent around $23.4 billion in the FCC’s C-band auction in 2021. A year later, the operator bought $9 billion worth of 3.45 GHz spectrum in another FCC auction.

Now, AT&T plans to acquire more midband 3.45 GHz spectrum – and 20 MHz of lowband 600 MHz spectrum – from EchoStar, in a deal that still requires regulatory approval. AT&T currently doesn’t use 600 MHz spectrum in its network, which means the company will need to install new hardware on its cell towers in order to deploy that spectrum.

However, AT&T will be able to quickly add EchoStar’s 3.45 GHz spectrum to its existing network via a software upgrade. Meaning, AT&T won’t need to update each of its cell towers with new hardware – an expensive and time-consuming process – in order to put EchoStar’s 3.45 GHz spectrum licenses into use. AT&T officials said that, via a spectrum-leasing agreement with EchoStar, AT&T can add EchoStar’s midband spectrum to AT&T cell sites covering nearly two-thirds of the U.S. population by mid-November 2025.

Since network speeds and capacity are directly related to the amount of spectrum an operator has, the financial analysts at New Street Research estimate that EchoStar’s spectrum will allow AT&T’s network to support an additional 900,000 consumer FWA subscribers on a nationwide basis.

In Houston, AT&T stands to gain 30 MHz worth of EchoStar’s 3.45 GHz spectrum licenses, according to Spectrum Omega. That spectrum would be added to the 80 MHz of C-band and 40 MHz of 3.45 GHz spectrum that AT&T already owns in the market, giving it a total of 150 MHz of midband spectrum in Houston.

According to recent Ookla RootMetrics® drive test data from Houston, AT&T has been leaning heavily on its C-band and 3.45 GHz holdings to supply 5G connections to its smartphone customers in Houston.

AT&T Spectrum Band Utilization Percentages
RootMetrics® Houston drive test results | 2H 2025

Spectrum “depth” is another way to measure AT&T’s spectrum usage. The amount of spectrum in use in an operator’s network often directly relates to the speeds that operator can provide. AT&T used 120 MHz of midband spectrum (C-band and 3.45 GHz, via two-carrier aggregation) in 37.3% of RootMetrics’ tests in Houston in the second half of 2025. The operator used 80 MHz of midband spectrum (C-band) in another 46% of tests. This indicates that AT&T still has some additional spectrum to put into action inside its network for its smartphone and FWA customers.

Fiber, cable and FWA can be applied to the digital divide

A final element in a review of the greater Houston area involves the locations that are still not yet covered by the likes of AT&T, Comcast and others. For decades, various U.S. government programs have sought to bridge this digital divide in Texas and elsewhere.

For example, AT&T’s participation in the FCC’s CAF II program included almost 180,000 locations in rural parts of Texas. Similarly, Charter Communications pledged to cover a wide swath of East Texas via the FCC’s Rural Digital Opportunity Fund (RDOF) rural broadband program.

Today, the Texas Broadband Development Office (BDO) rates most of the counties immediately in and around Houston as 90-100% served by broadband. But counties that are further afield rank lower. For example, Liberty County (just east of Conroe) is listed as 66.4% served by broadband. The FCC’s broadband benchmark was changed to 100 Mbps downloads and 20 Mbps uploads in 2024.

The U.S. government’s newest broadband funding program, the Broadband Equity Access and Deployment Program (BEAD), was recently reworked to put more focus on technologies like fixed wireless and low Earth orbit (LEO) satellites. That’s because those technologies are often cheaper and faster to deploy than fiber.

Texas’ BEAD funding map highlights areas around Houston that the state aims to cover with broadband. The state recently allocated around half of its $1.3 billion in BEAD grants to fiber providers, with the remainder split relatively evenly between fixed wireless and satellite providers. AT&T received $32 million in grants to cover 6,651 locations in Texas with fiber. Comcast didn’t receive any BEAD grants for Texas. 

On a nationwide basis, AT&T has so far received $718.8 million in BEAD grants to cover 141,900 rural locations with broadband. AT&T intends to use fiber to meet those obligations. Comcast, meanwhile, has received $1.36 billion in grants to cover 226,900 rural locations across the U.S. with broadband. Comcast has pledged to meet around 69% of its BEAD obligations with fiber, and the remainder with cable.

According to the financial analysts at New Street Research, U.S. state regulators have so far allocated just 9% of BEAD grants to fixed wireless providers. The bulk (85%) of grants were awarded to fiber operators. Satellite providers like SpaceX and Amazon received 4% of the funding, while cable operators received 2%.

Ookla retains ownership of this article including all of the intellectual property rights, data, content graphs and analysis. This article may not be quoted, reproduced, distributed or published for any commercial purpose without prior consent. Members of the press and others using the findings in this article for non-commercial purposes are welcome to publicly share and link to report information with attribution to Ookla.

| October 22, 2025

Revealing the Cascading Impacts of the AWS Outage

Single points of logical failure topple even the most hardened cloud infrastructure, crippling today’s highly concentrated internet ecosystem.

Editor’s note: This article was updated on October 22 following a 48-hour review period related to the AWS outage, reflecting an upward revision of the total Downdetector user report volume from 16M+ to 17M+.

An Amazon Web Services (AWS) disruption on October 20, 2025, centered on its “US‑EAST‑1” cloud region triggered a wave of failures across consumer apps, finance, government portals and parts of Amazon’s own services. Downdetector® recorded 17M+ user reports (+970% increase on average daily baseline) and disruptions at over 3,500 companies across more than 60 countries, placing this among the largest internet outages on record for Downdetector.

Key Takeaways:

  • This outage had exceptional global reach and deep cross-sector impact. Downdetector captured 17M+ outage reports globally across 60+ countries, with the US (>6.3M) and UK (>1.5M) leading outage volumes. Services with the most reports included Snapchat (~3M), Roblox (~716k) and Amazon retail (~698k), and spanned everything from banking to gaming services.
  • Rapid cascade and phased restoration. The first outage spikes appeared around 06:50–07:00 UTC. AWS identified DNS resolution issues affecting DynamoDB endpoints in US‑EAST‑1 and reported mitigation by 09:24 UTC, with full normalization later in the day as downstream services cleared backlogs on a phased basis. Outage reports underwent a second surge in the late afternoon (UTC) as U.S. users awoke to disruptions. 
  • Not a one-off event. The outage echoes recent systemic failures, including Meta’s 2021 BGP/DNS issue, Fastly and Akamai CDN outages, the 2024 CrowdStrike update failure, the 2025 Cloudflare-AWS interconnect incident and the recent Google Cloud outage, revealing single points of failure in shared infrastructure.
  • Wake-up call for critical infrastructure. The lesson is concentration risk (or overreliance on a single point of failure). The service layer is now tightly coupled to a handful of cloud regions and managed services. The way forward is not zero failure but contained failure, achieved through multi-region designs, dependency diversity, and disciplined incident readiness, with regulatory oversight that moves toward treating the cloud as systemic components of national and economic resilience.

The “blast radius” reached far beyond Virginia, where the affected AWS US-EAST-1 is located

Downdetector captured 17M+ global user reports from 00:00 UTC on Oct 20 to 09:15 UTC on Oct 21, with 3,500+ of the companies Downdetector tracks seeing elevated disruptions and 19 still ongoing the following morning. Country volumes were led by the US (6.3M+), UK (1.5M+), Germany (774k), Netherlands (737k) and Brazil (589k). 

The heaviest‑hit services by report count included Snapchat (~3M), AWS itself (~2.5M), Roblox (~716k), Amazon retail (~698k), Reddit (~397k), Ring (~357k) and Instructure (~265k). The UK alone generated more than 1.5M reports, far exceeding a typical day’s ~1M global baseline across all markets, highlighting both the unique intensity and breadth of this event.

Analysis of sectoral outcomes in Downdetector reports reveal impacts spanned social/gaming (Snapchat, Fortnite, Roblox), finance (e.g., UK banks like Lloyds and Halifax), public services (HMRC), smart home (Ring, Alexa), and education/work tools (Instructure, Zoom). Outage peaks and troughs varied by time zone, with European volumes rising first as workplaces came online and a second lift as North America woke up later in the day:

  • ~06:49 UTC (Oct 20): First user reports and AWS status signals line up. Downdetector registered sharp spikes shortly after 06:56 UTC on US‑EAST‑1‑linked services. Within two hours of outage commencement, over 4M outage reports were submitted. 
  • ~09:24 UTC: AWS says the core fault, involving DNS resolution issues for regional DynamoDB endpoints in US‑EAST‑1, was mitigated.
  • Remainder of the day: Dependent services recovered at different speeds as retries, queues and caches drained. Major outlets tracked staged restoration through the afternoon and evening local time, with Downdetector reports surging past 6M in the U.S. as users came online.

This pattern, reflecting a relatively short underlying cloud incident based on a common denominator (AWS US-EAST-1 concentration) with longer downstream normalization, is customary when a foundational component (in this case DNS to a regional database endpoint) sits behind many higher‑level services and microservices.

Regional concentration and tight coupling of managed services amplified outage impact

The affected US‑EAST‑1 is AWS’s oldest and most heavily used hub. Regional concentration means even global apps often anchor identity, state or metadata flows there. When a regional dependency fails as was the case in this event, impacts propagate worldwide because many “global” stacks route through Virginia at some point.

Modern apps chain together managed services like storage, queues, and serverless functions. If DNS cannot reliably resolve a critical endpoint (for example, the DynamoDB API involved here), errors cascade through upstream APIs and cause visible failures in apps users do not associate with AWS. That is precisely what Downdetector recorded across Snapchat, Roblox, Signal, Ring, HMRC, and others.

Another complicating factor in this outage was authentication. Problems with DynamoDB also hit IAM (authentication), which handles sign in and permissions. Early on, some teams could not log in to the AWS console. Where teams cannot sign in to the tools that change settings, move traffic, or restart services, it is very difficult to apply fixes, so recovery slows even after core systems start to come back.

Even after the provider (AWS in this case) fully mitigated the issue, retries, timeouts and message backlogs took time to clear. Teams often throttle restarts to protect back ends, so user-visible recovery lags the provider’s green status. The afternoon and evening recovery curve observed in Downdetector reports, first in Europe and then in the U.S., matches this pattern.

Companies should plan for region failure and practise graceful slowdowns during outages

For companies dependent on these platforms, a practical response to an outage of this magnitude begins with designing for failure and assuming a whole cloud region can go down. This means not relying on a single region (e.g., US-EAST-1) for critical systems and instead running services across multiple regions (known as active-active) or keeping a lightweight standby (“pilot light”) that can be promoted quickly. For highly mission-critical services, the use of a multi-cloud setup can improve availability during provider-wide incidents, but this is not practical for many companies due to the costs of duplication and additional complexity.

Similarly, companies should plan for graceful slowdowns, not just total outages. This means using circuit breakers and feature flags to turn off non-essential features (like media uploads or recommendations) so that core flows such as sign-in, search, or checkout stay up. Practicing the act of “failing safely” is important, often achieved through running game days that simulate DNS, database, and authentication outages. Investing in measuring time to detect, time to fail over, and understanding how clear customer communications are is also important.

In real incidents like this, it is important that companies compare their own telemetry with public signals (e.g., Downdetector) to understand if the issue is provider-wide. When the facts are established, early communication with customers via status pages or in-app notifications is critical to reduce support load and protect trust.

Policymakers should treat cloud infrastructure as systemic components of national digital resilience

This outage again shows that cloud platforms are systemic infrastructure, characterized by a massive blast radius when a single point of logical failure emerges. It highlights the limitations of investing in enhancing physical resilience and redundancy alone (e.g., multi-day backup power on-site) if there is a fault elsewhere in the infrastructure stack on which everything else depends and from which failures cascade. Improving outcomes requires dismantling these single points of failure through diversification across each layer.

At a policy level, governments are starting to recognise this systemic risk and are beginning to adopt a more muscular approach to oversight. The EU’s flagship Digital Operational Resilience Act (DORA) introduces EU-level oversight of critical ICT third-party providers, while the UK’s Critical Third Parties regime does the same for finance.

Together, these policy developments aim to create a stronger toolkit, based on dependency mapping, stress tests, incident reporting discipline, and minimum post-event transparency, that will likely (and should) in time extend beyond financial services to other essential sectors (e.g., health, transport, and government). Importantly, proponents argue that adoption of these approaches would improve societal resilience without unduly micromanaging architectural choices.

For businesses, Downdetector provides access to dashboards that deliver early alerts, enable outage correlation, and allow for direct communication with users, ensuring a proactive approach to incident management. Learn how you can leverage Downdetector to be better prepared for outages, or reach out to schedule a demo.

Ookla retains ownership of this article including all of the intellectual property rights, data, content graphs and analysis. This article may not be quoted, reproduced, distributed or published for any commercial purpose without prior consent. Members of the press and others using the findings in this article for non-commercial purposes are welcome to publicly share and link to report information with attribution to Ookla.