| October 7, 2021

Improving Customer Experience During a Network Outage: A Tale of Two Operators


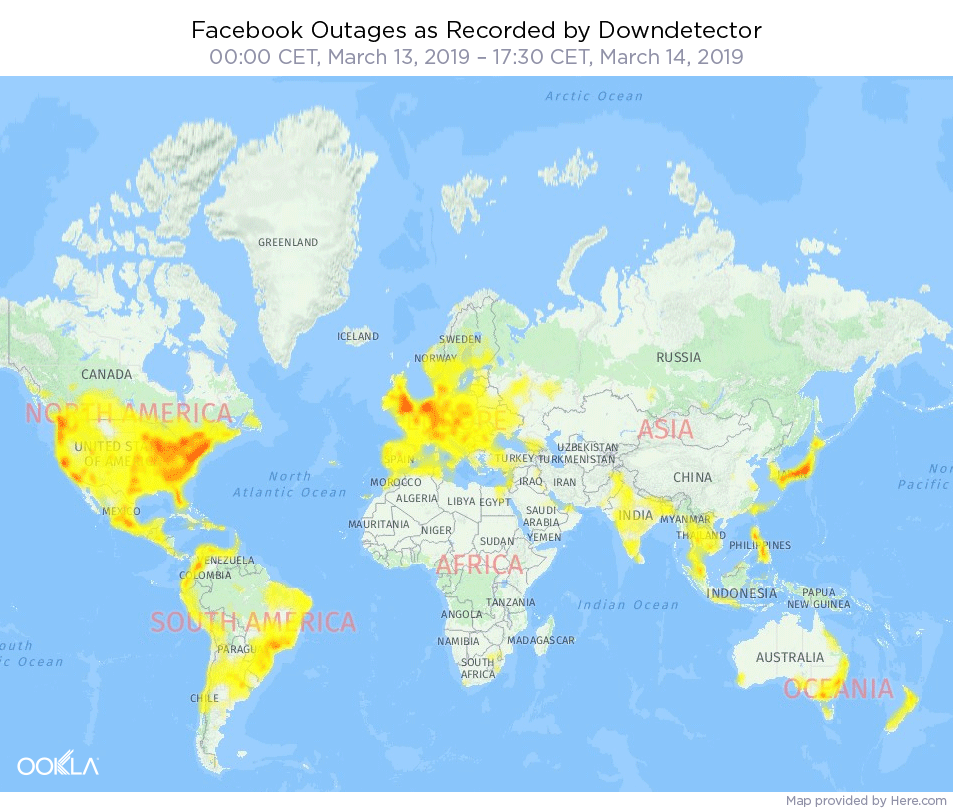
Network outages are inevitable. According to a study done by Heavy Reading, mobile network operators experience five outages per year on average — and according to consumer-reported information from Downdetector®, some operators experience many more service issues. During an outage, it’s critical that operators provide their customers with a clear path to a satisfying resolution. As we saw Monday, when Facebook’s outage impacted the perceived availability of many network operators around the world, it’s especially important to be able to manage the customer experience when an OTT service provider goes down.

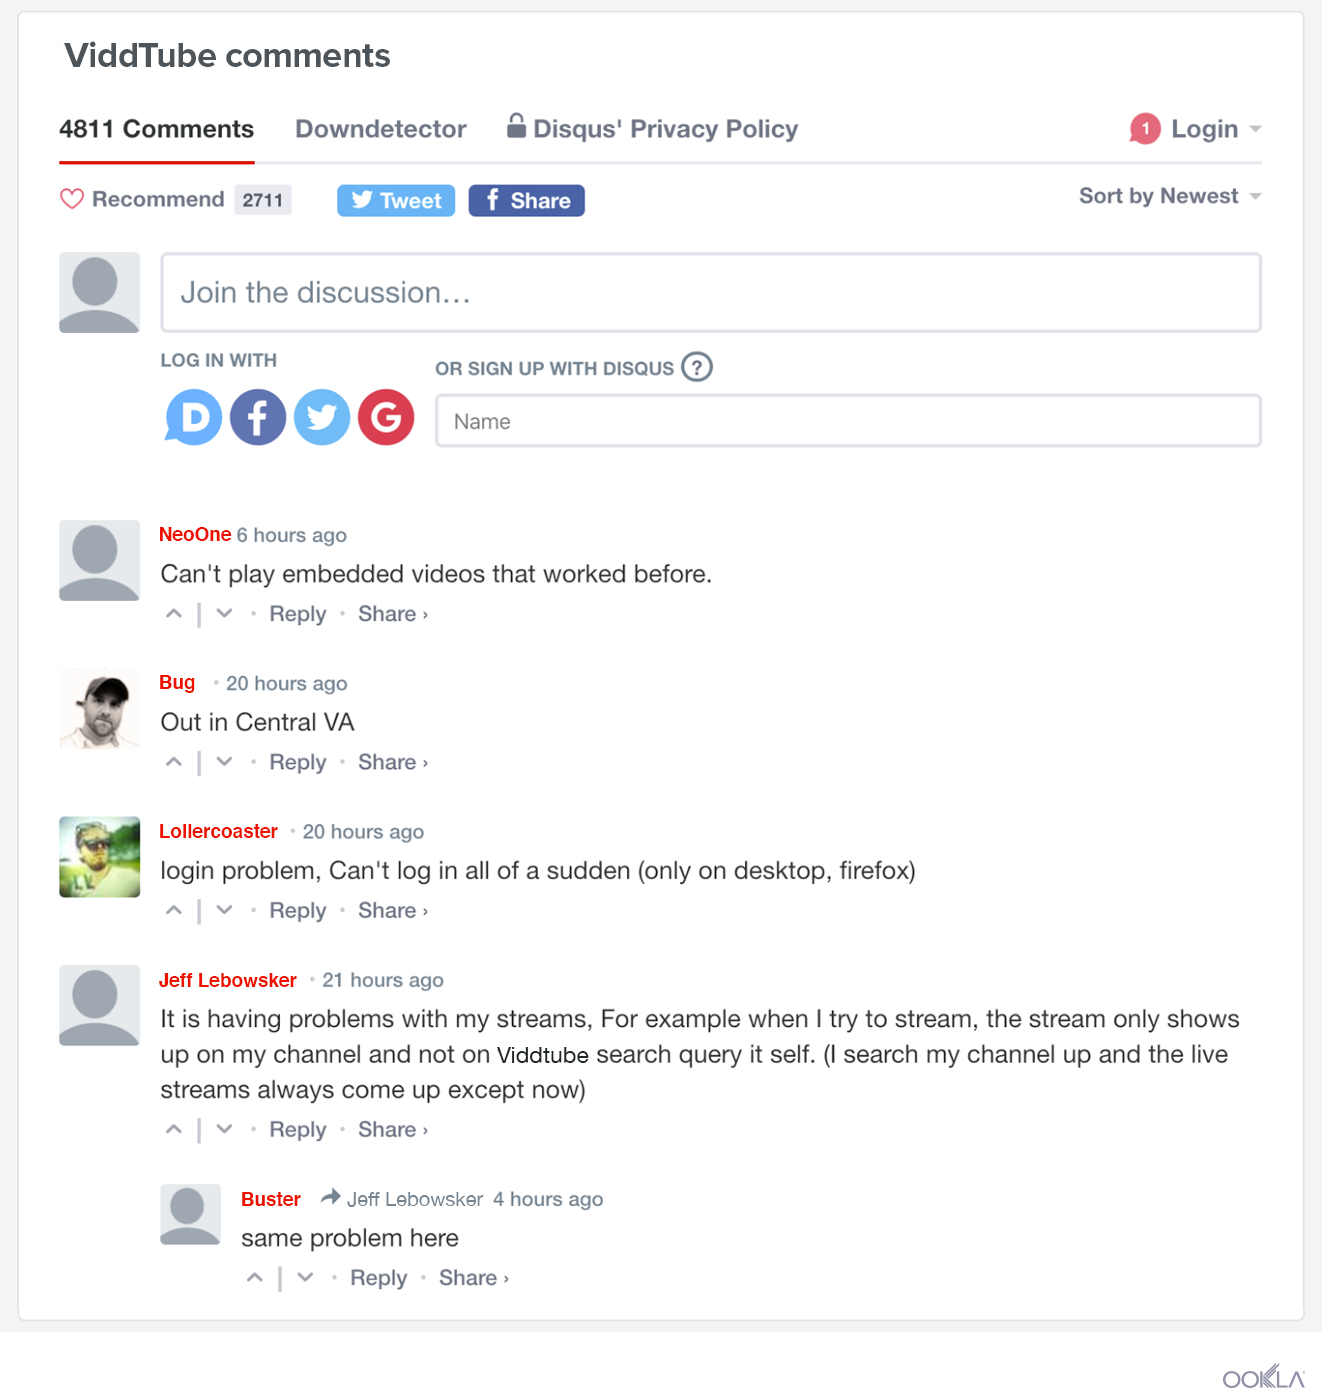
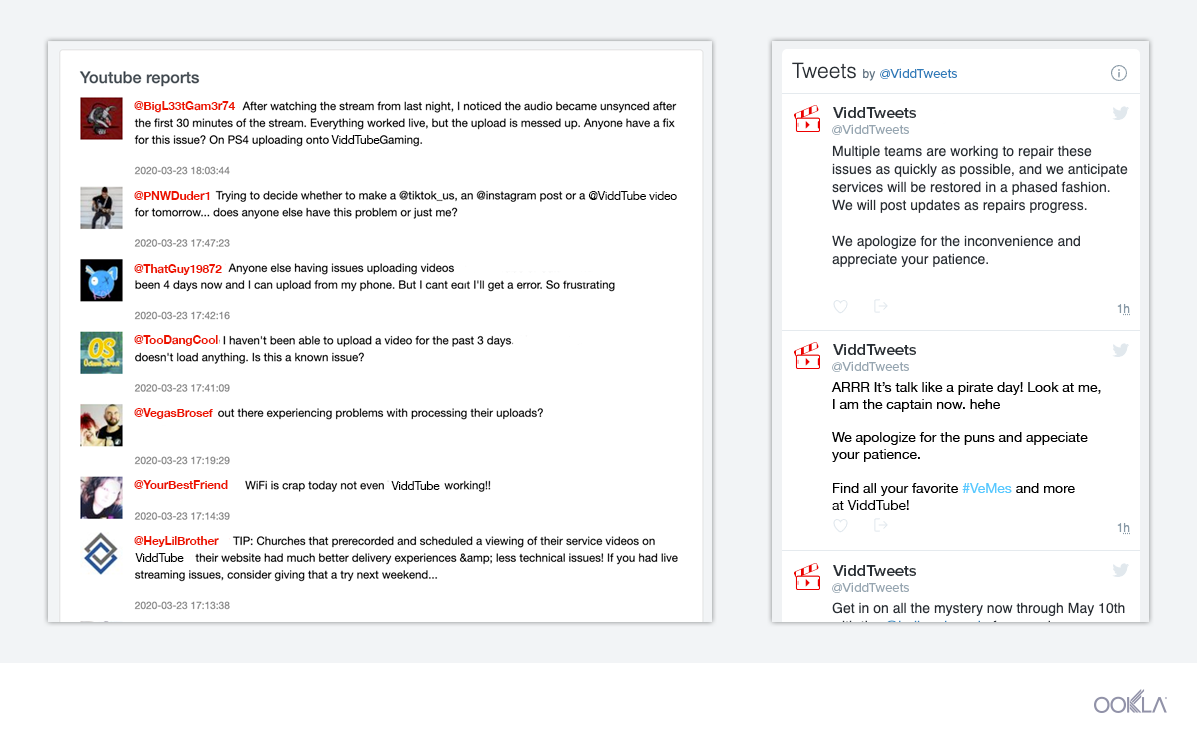
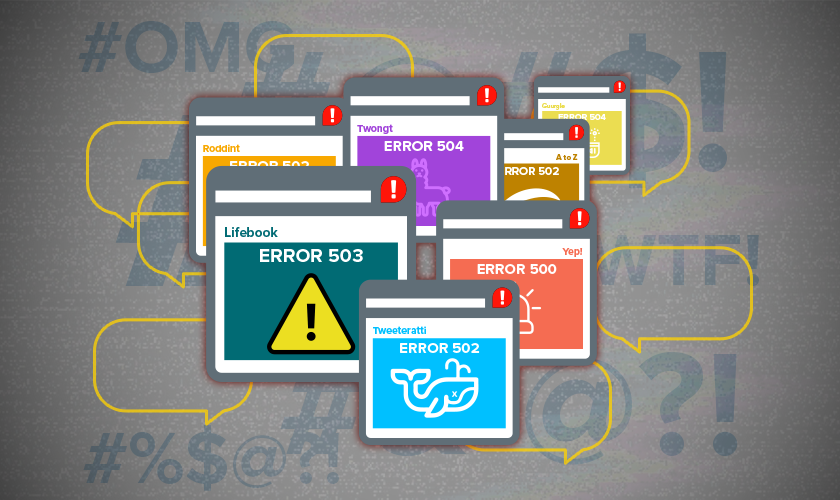
Since most consumers don’t want to sit on hold with a busy call center — or simply can’t make the call if the outage has impacted their voice services — it’s crucial to provide digital support. Without a clear path to resolve their issues, customers will often turn to external platforms, such as Downdetector and Twitter, to voice their frustrations. When customers turn to external platforms, operators may find themselves trending for the wrong reasons.

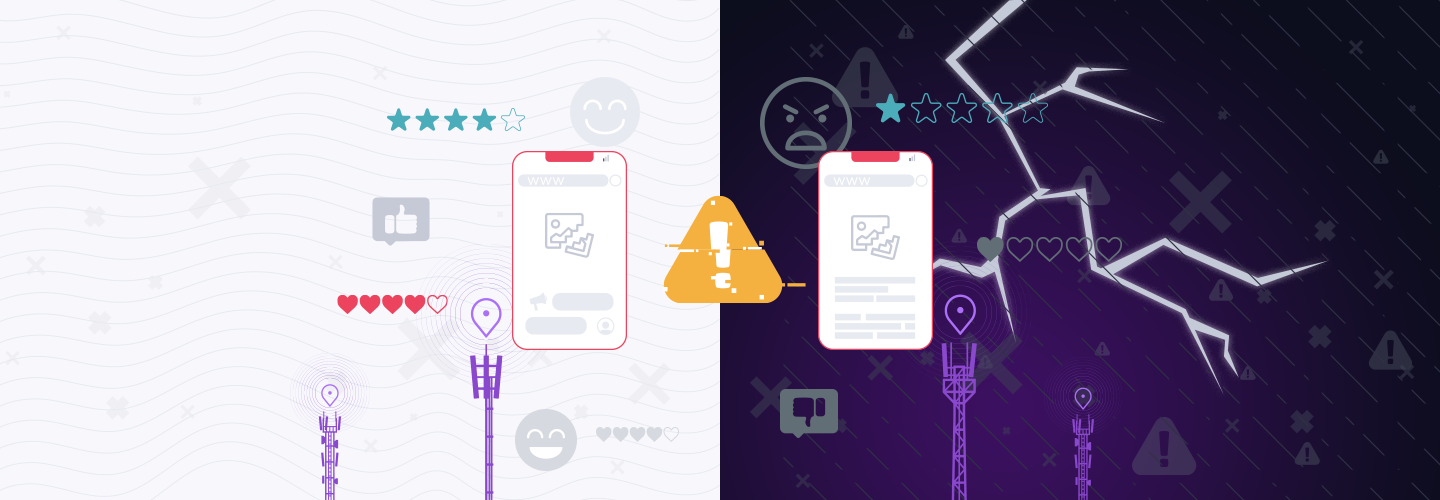
Consumers respond best to timely, contextual communication around problems with their mobile network. Do you have the tools to proactively communicate network status, known issues and impending improvements to your subscribers? In this article we will take a closer look at two leading mobile network operators who have very different paths for digital customer engagement during an outage. When major outages occurred for each network earlier this year, they faced vastly different customer responses, as measured by Downdetector.

Using consumer-reported outage information for early alerting

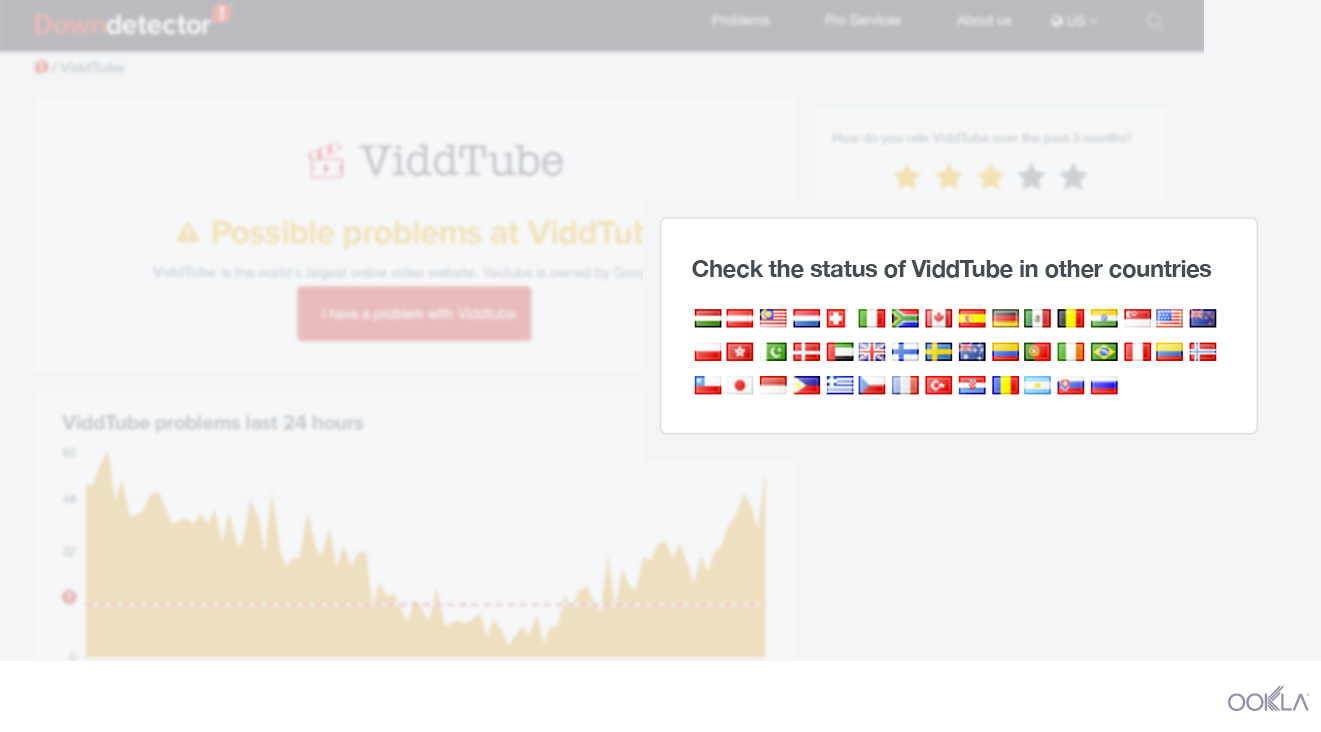
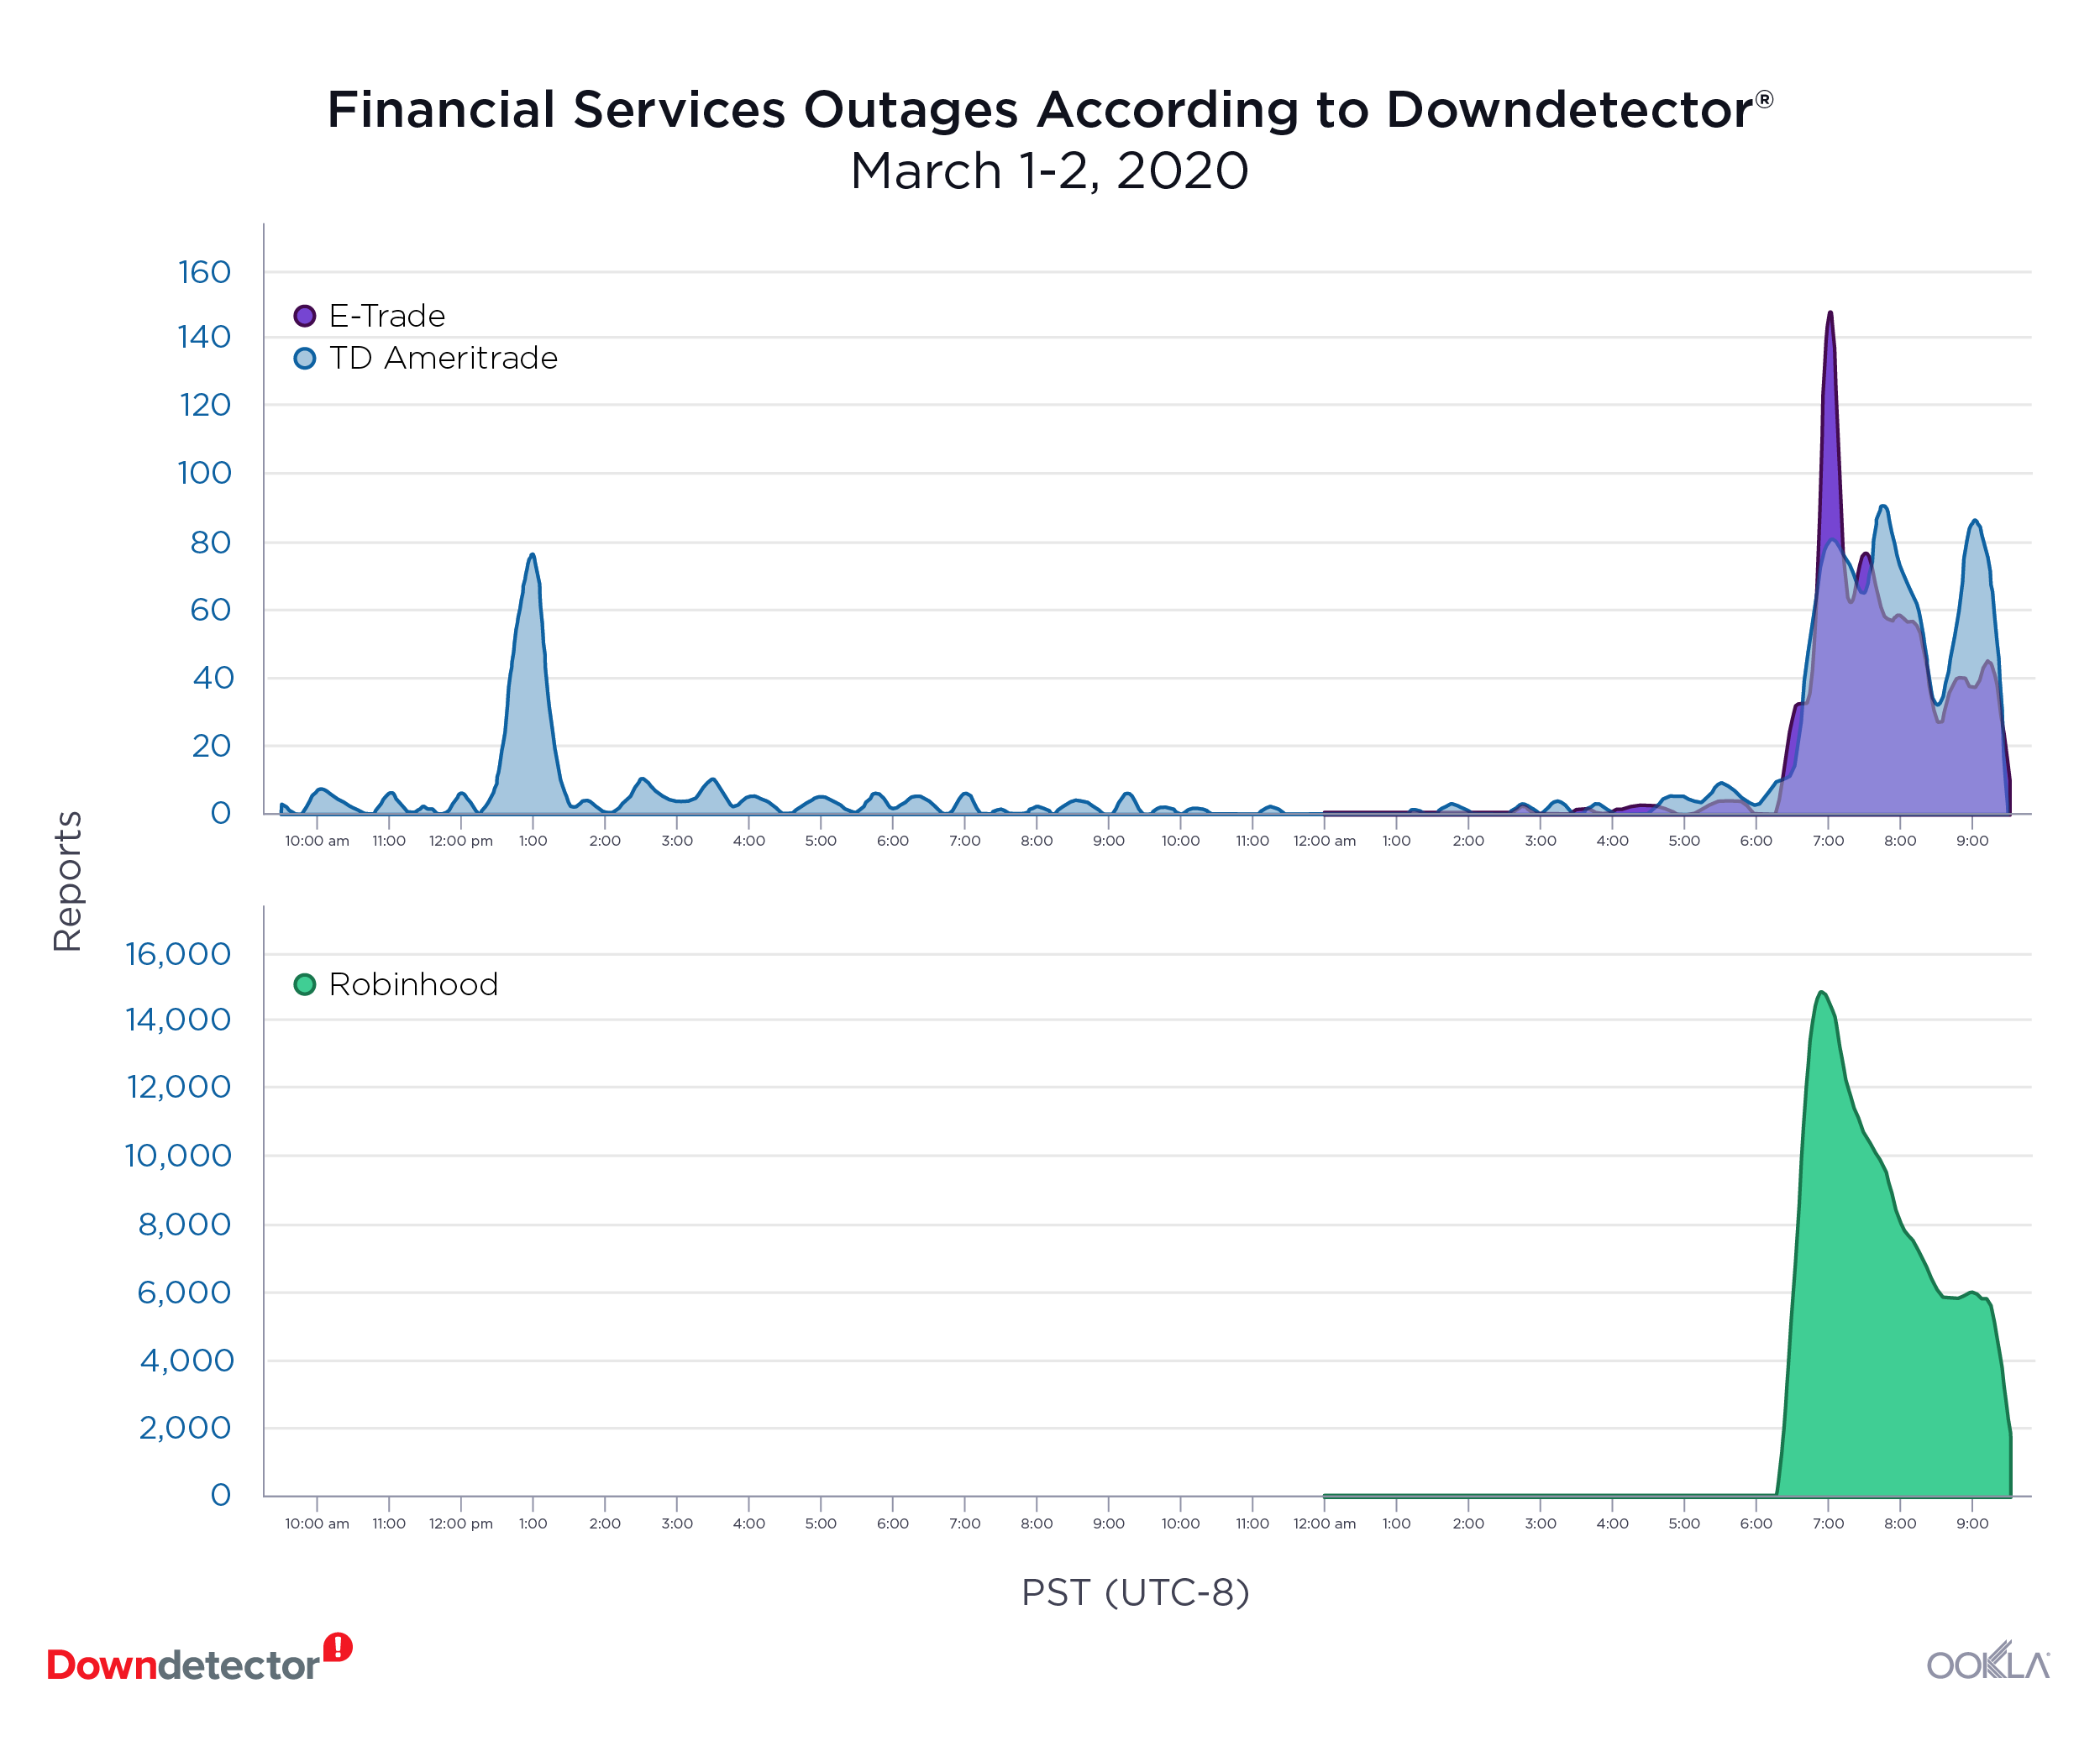
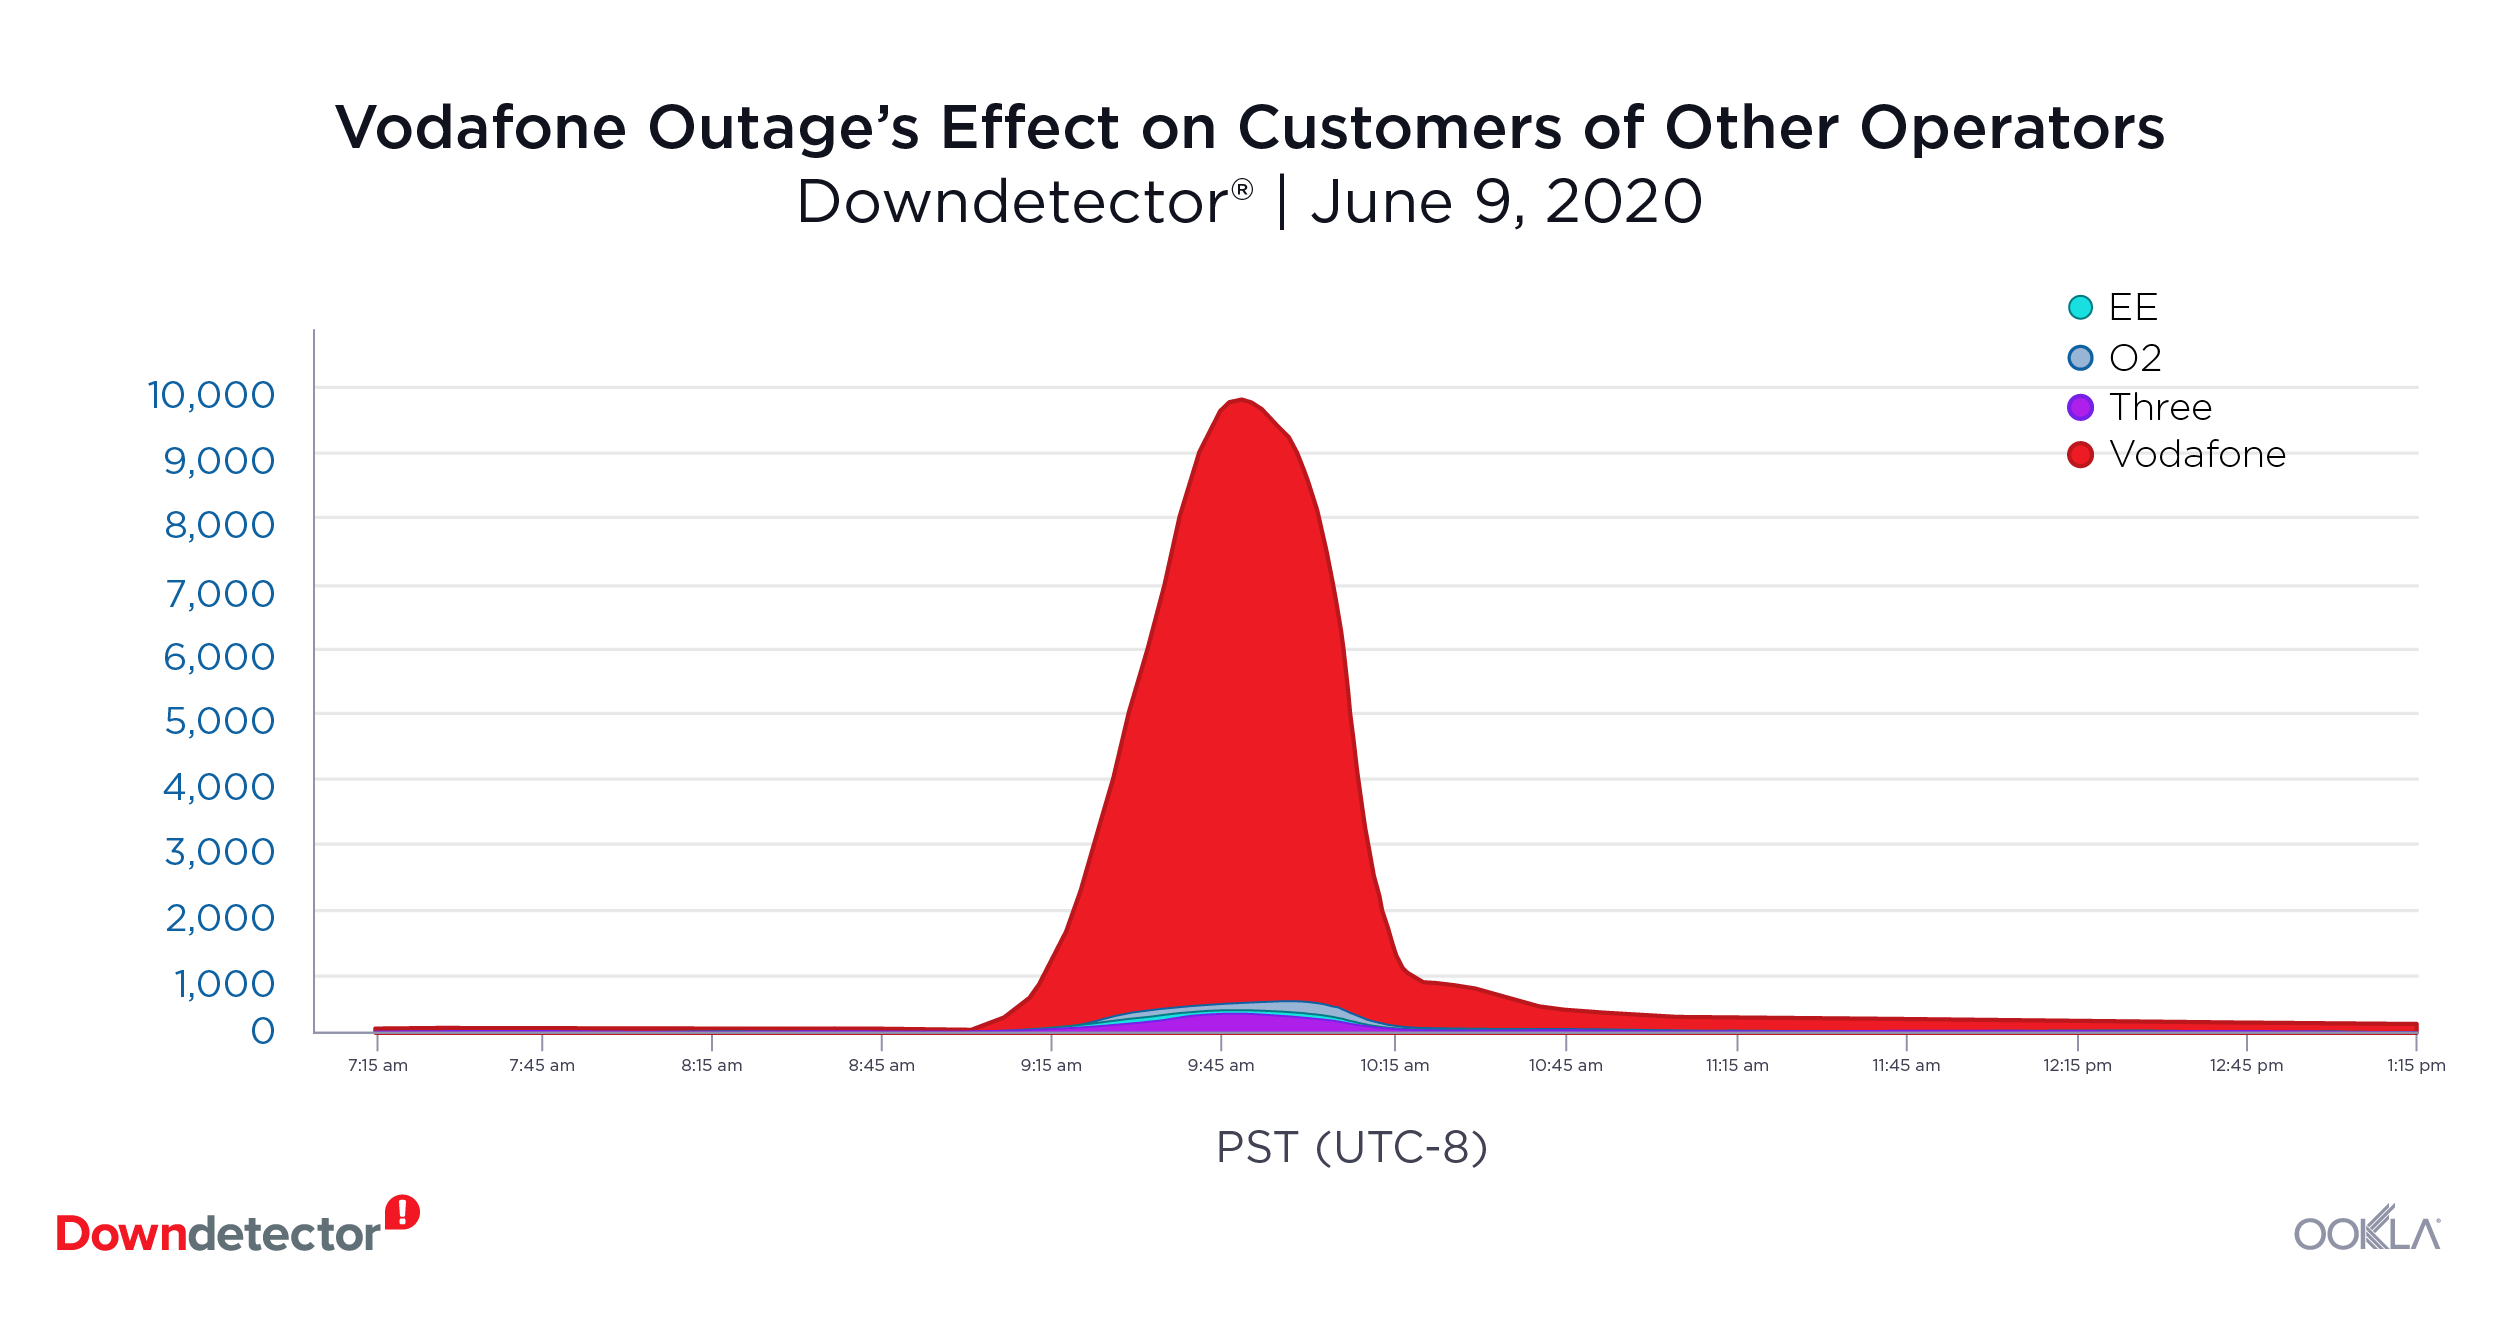
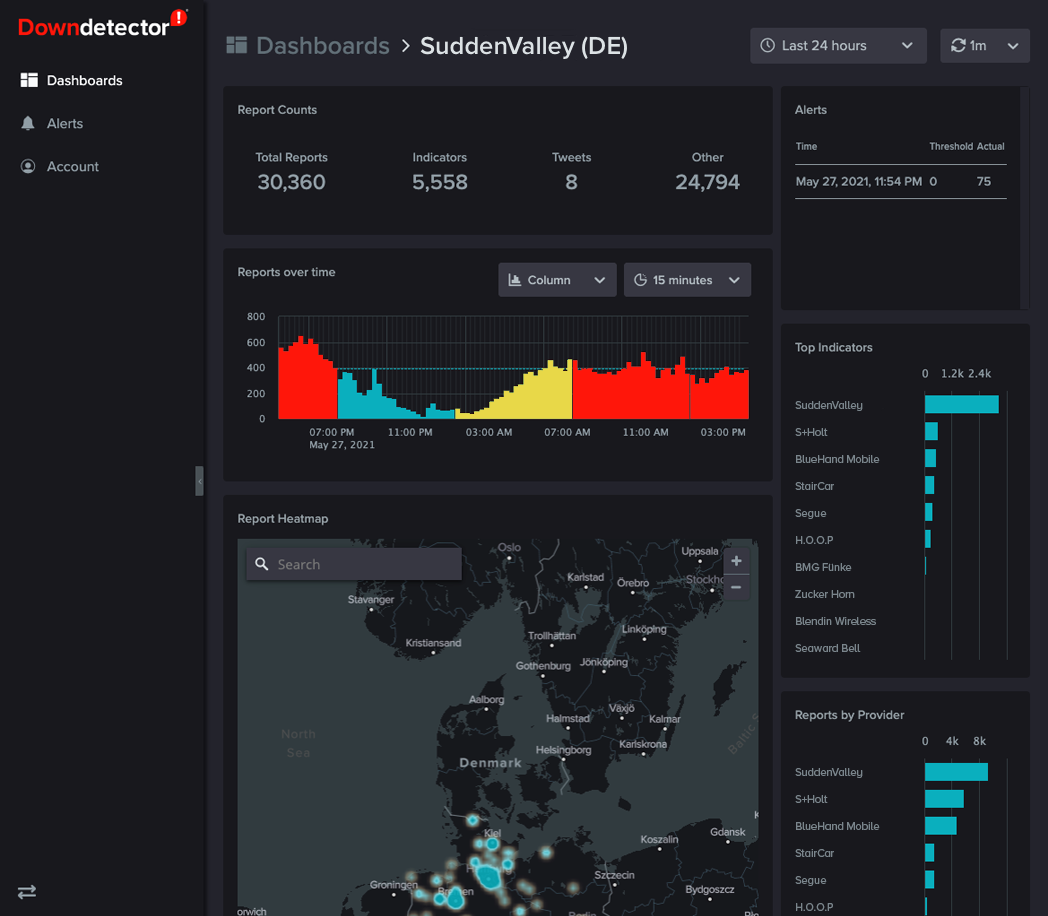
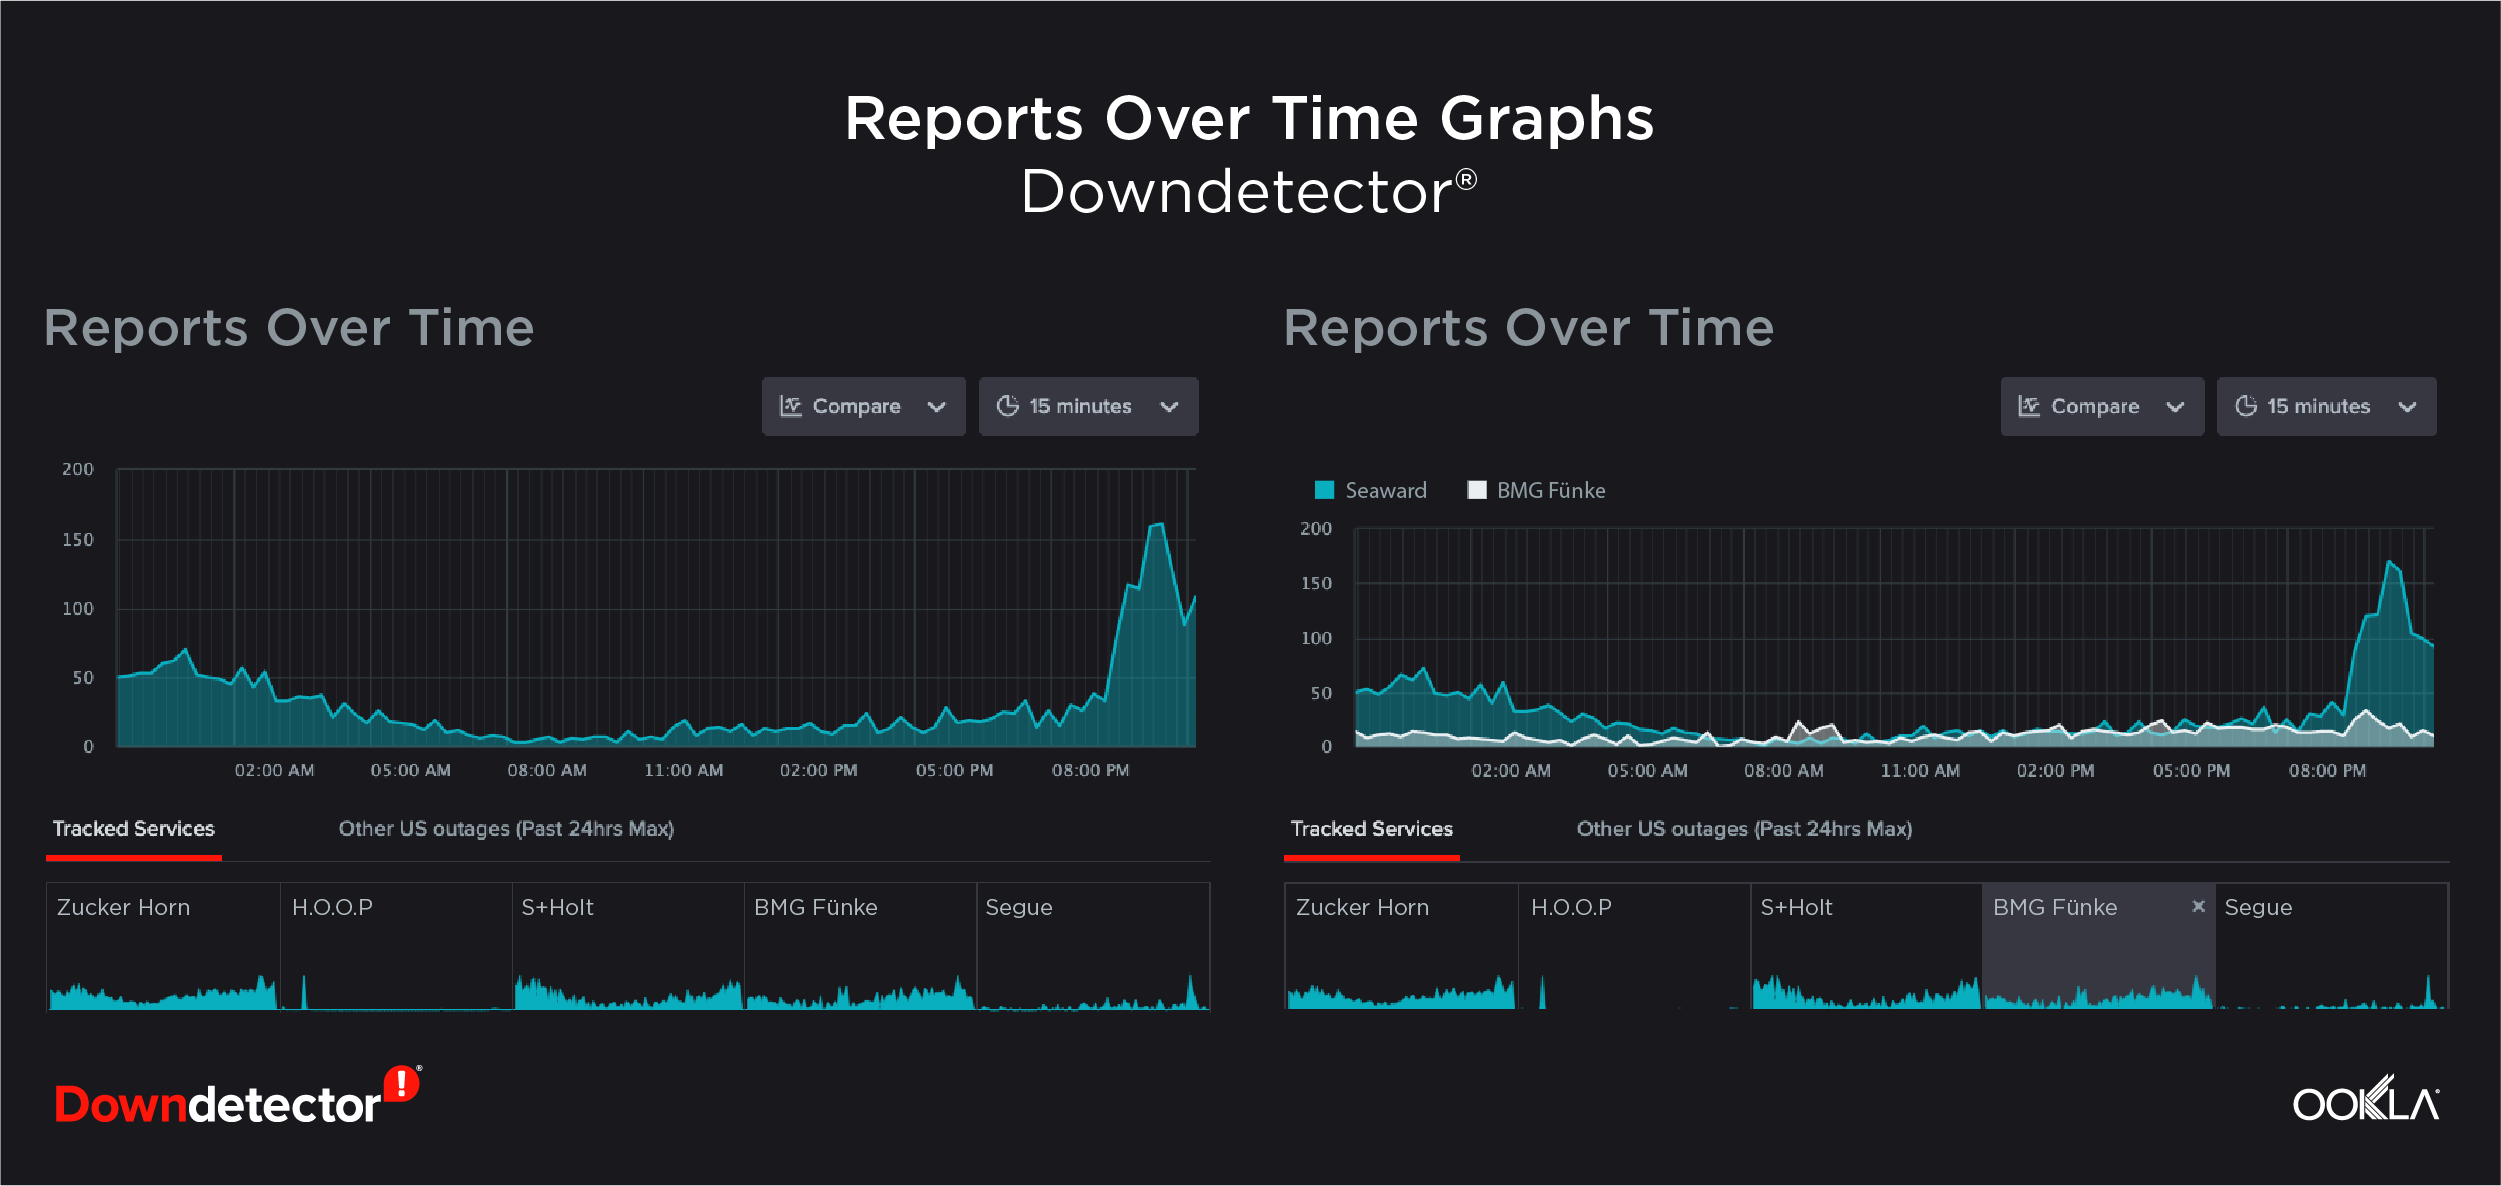
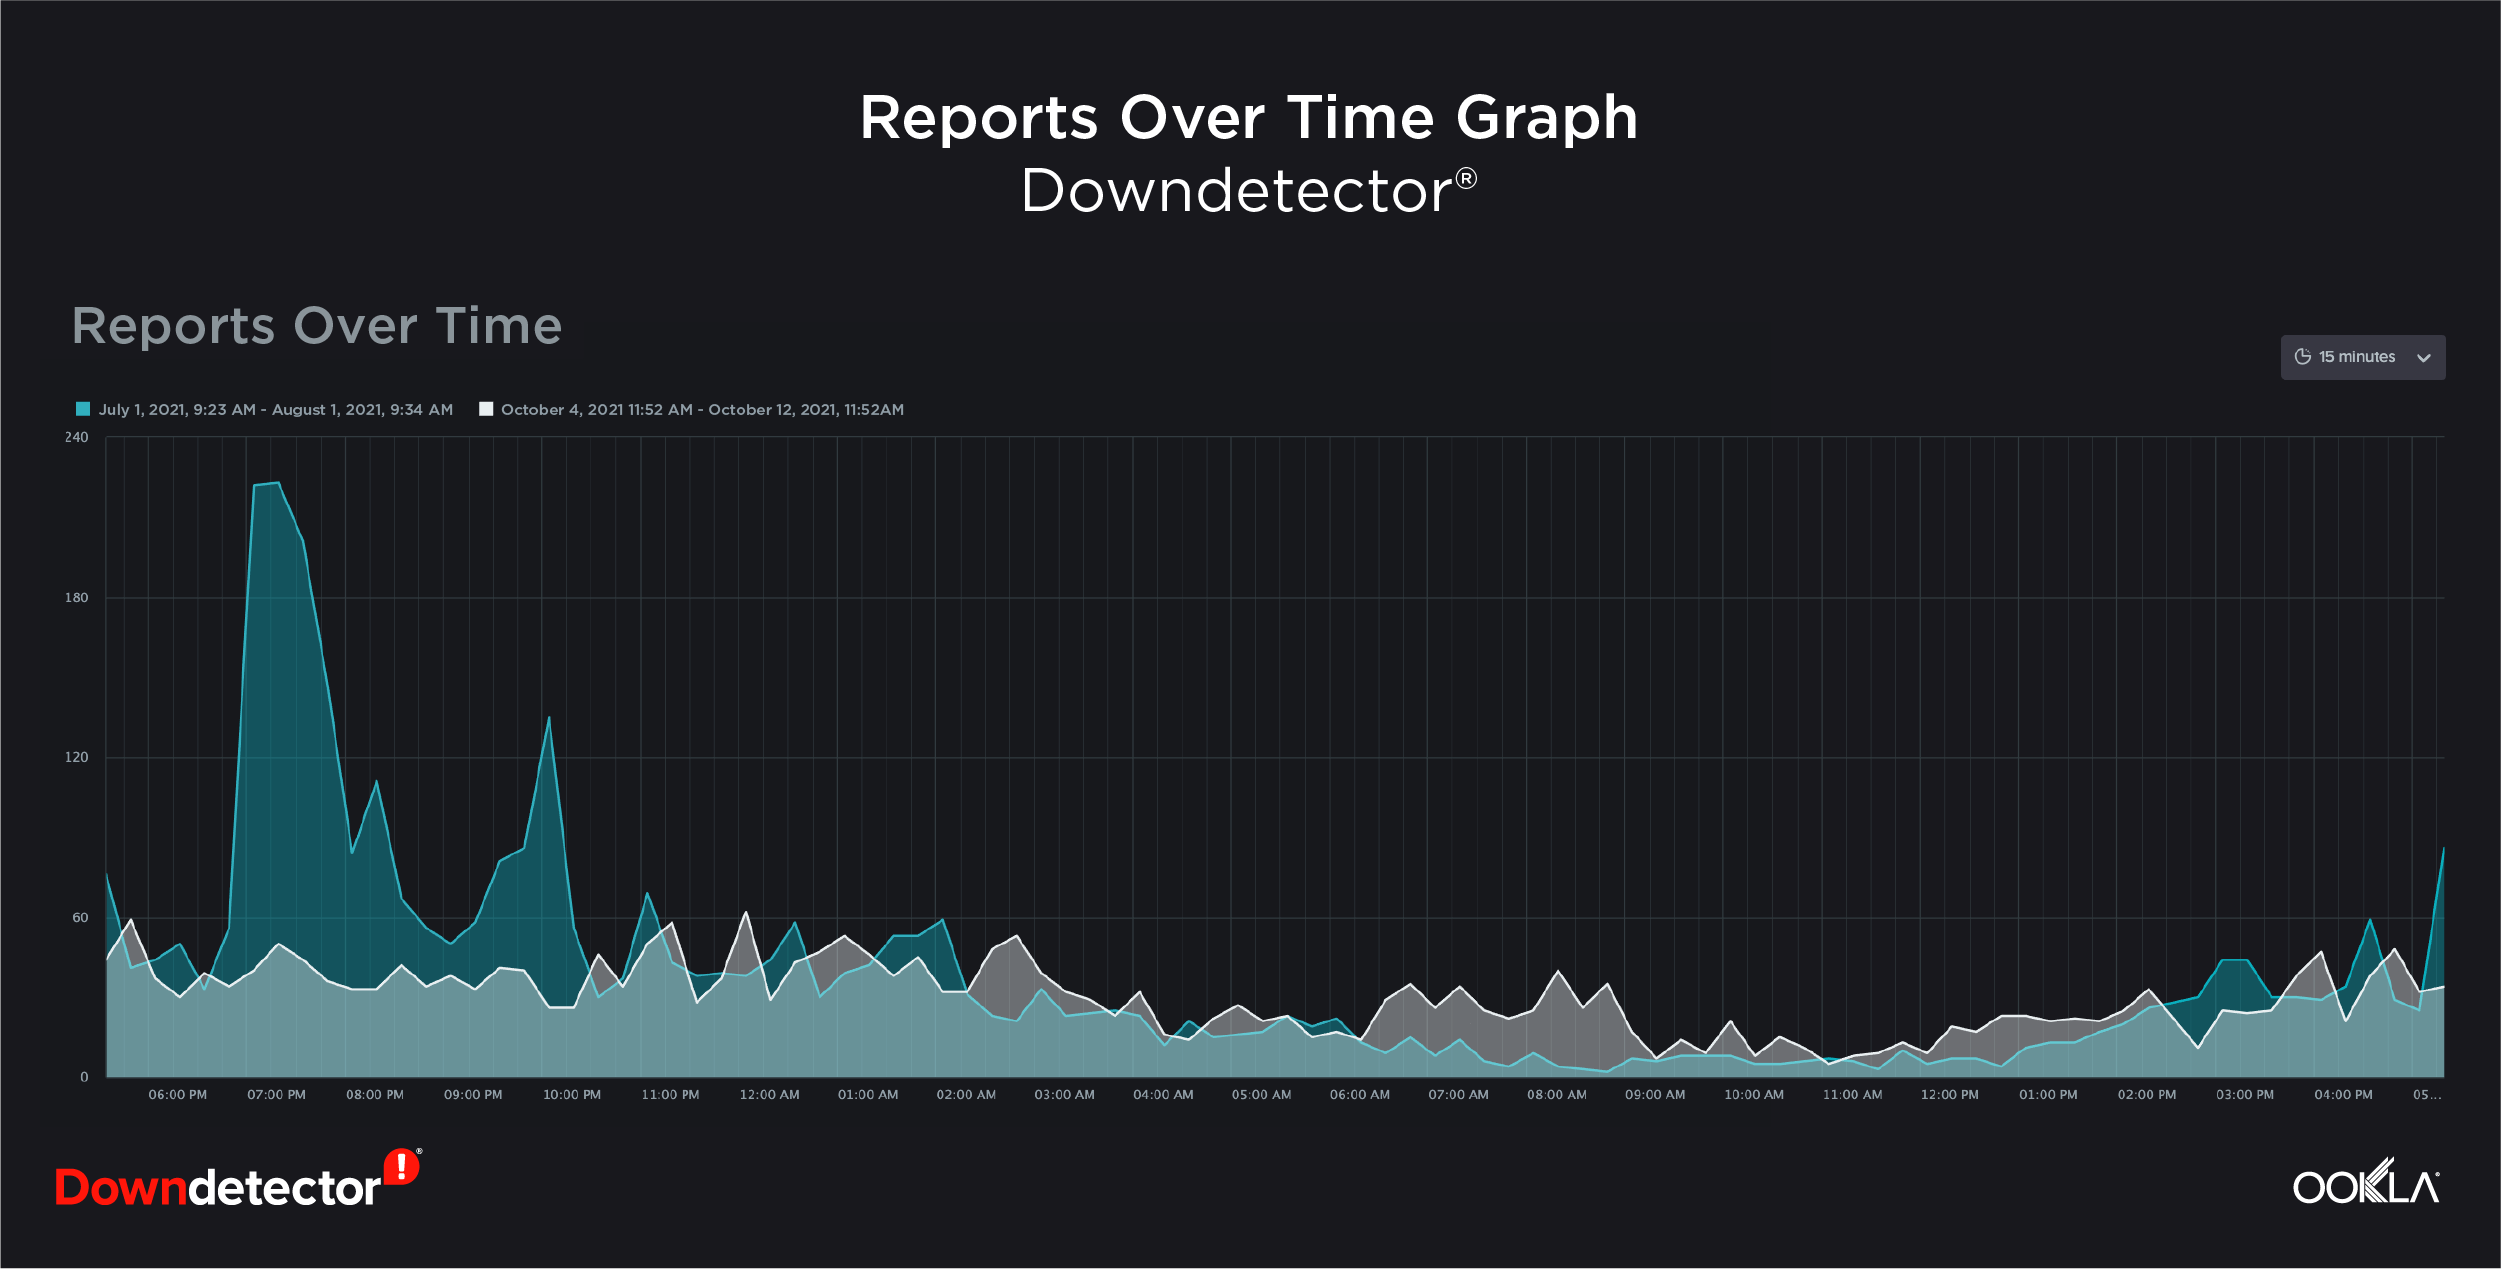
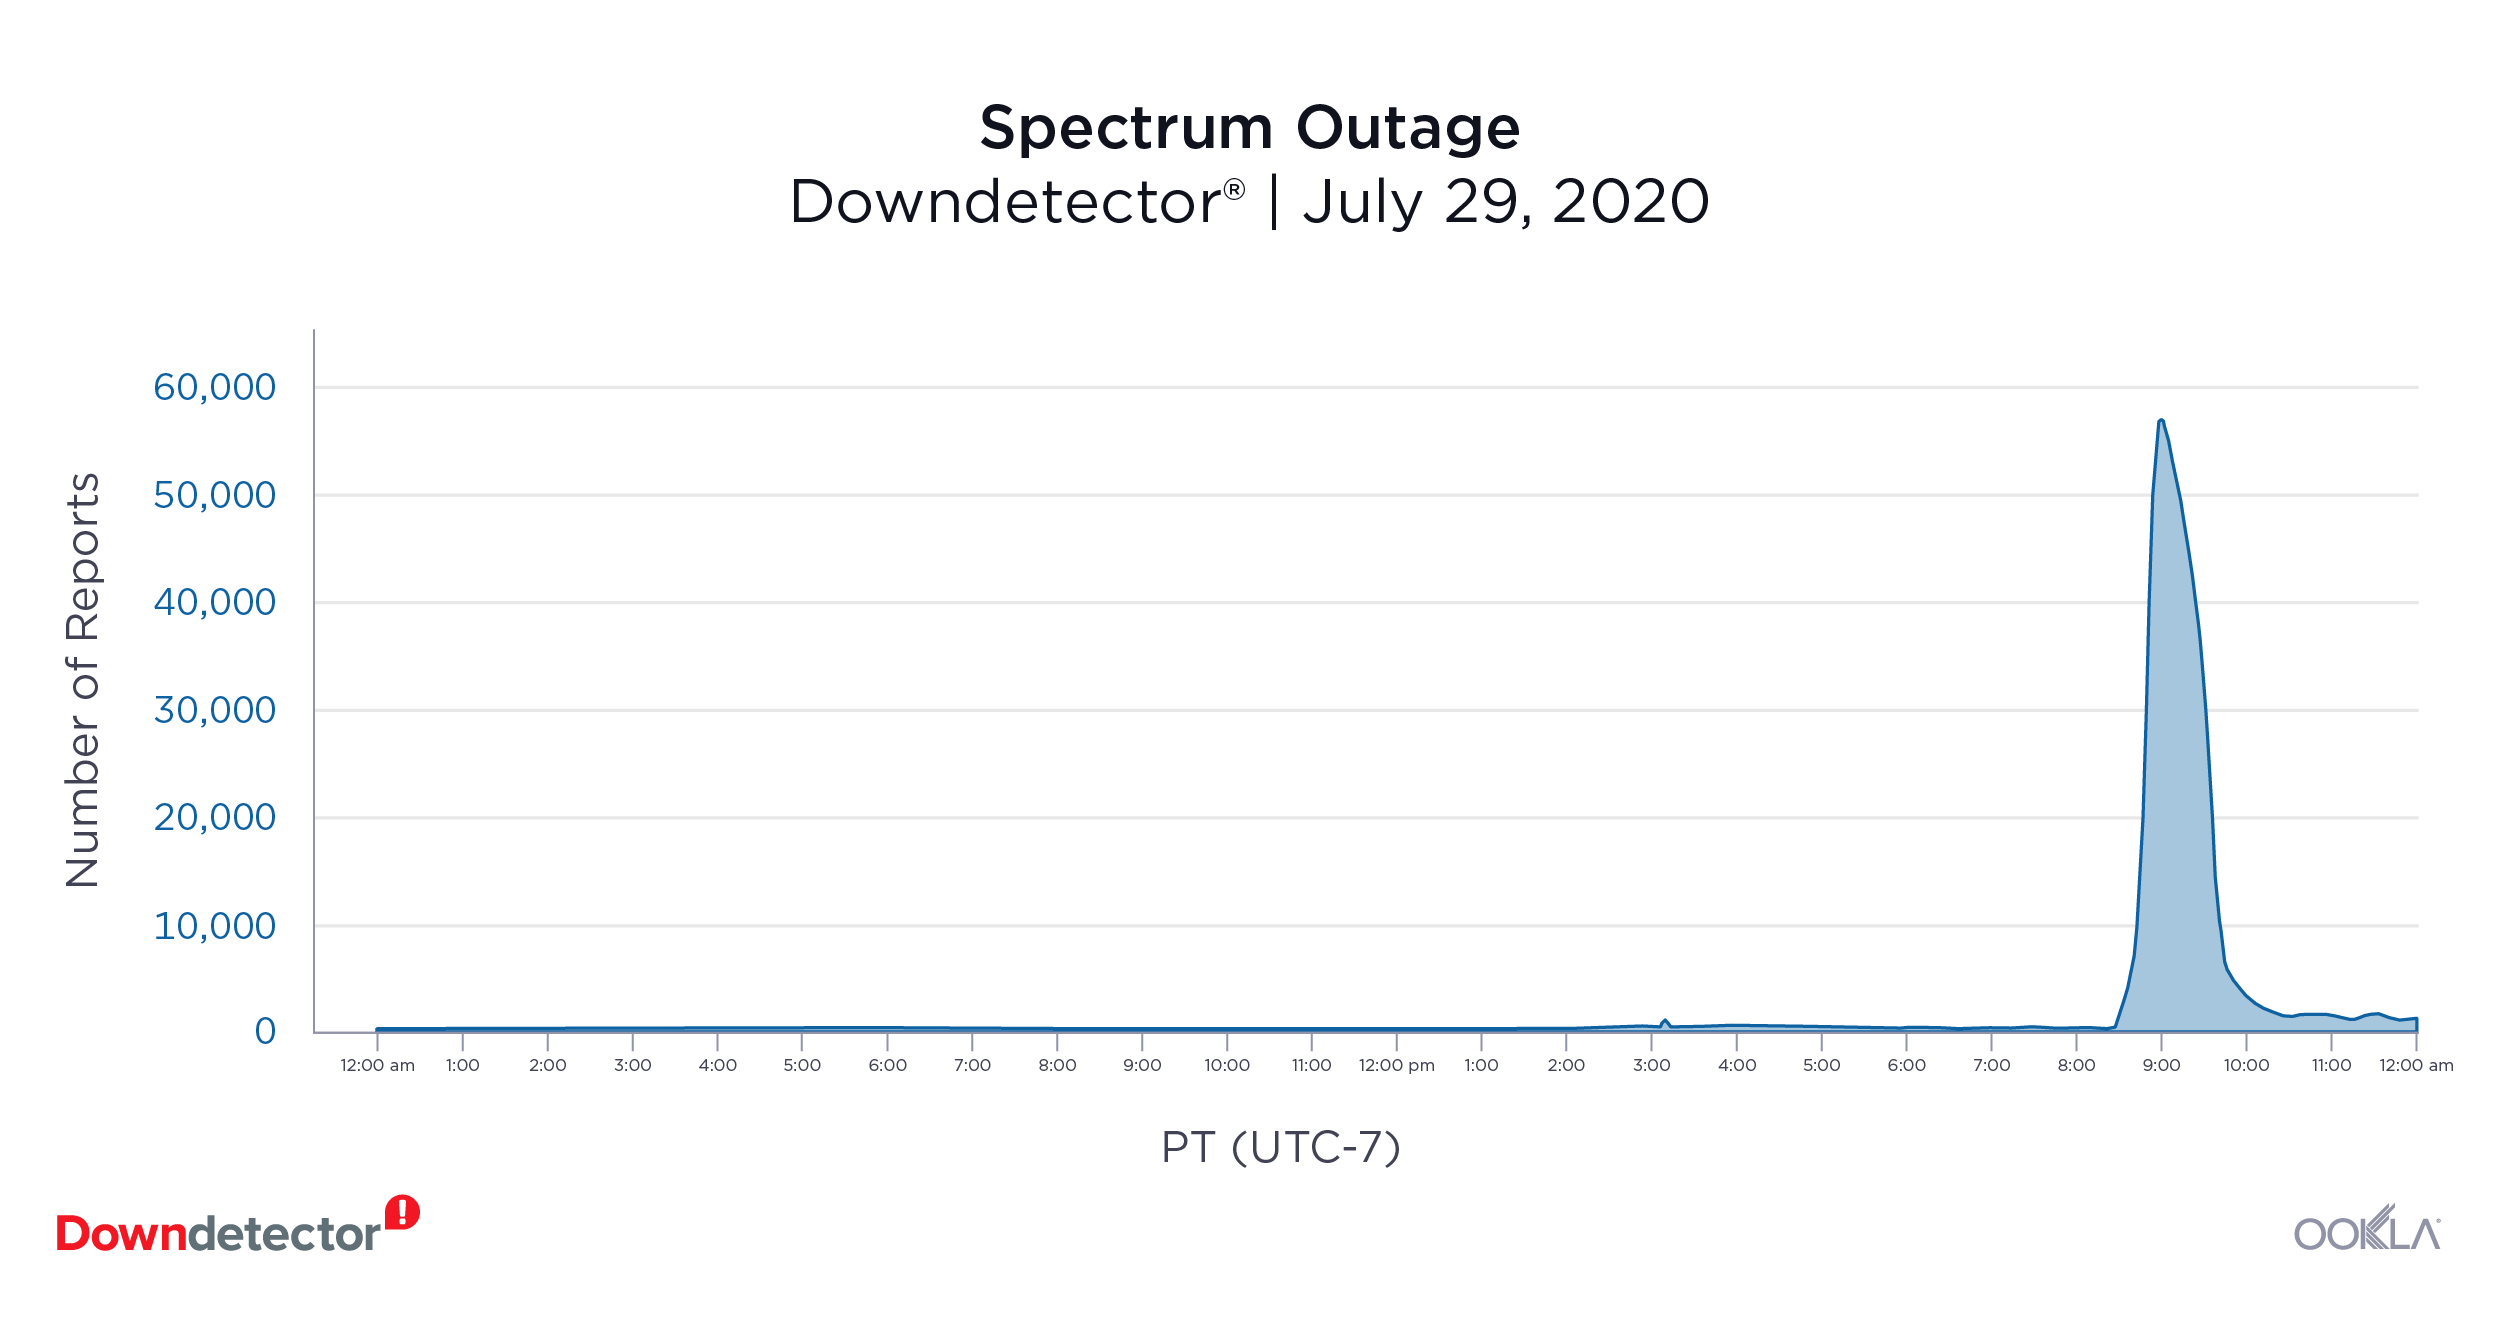
According to data from Downdetector, the world’s most popular platform for user-reported service status information, Operator A experienced elevated problem reports on March 10, 2021.

downdetector_a_problem-reports_0921

downdetector_a_top-indicators_0921

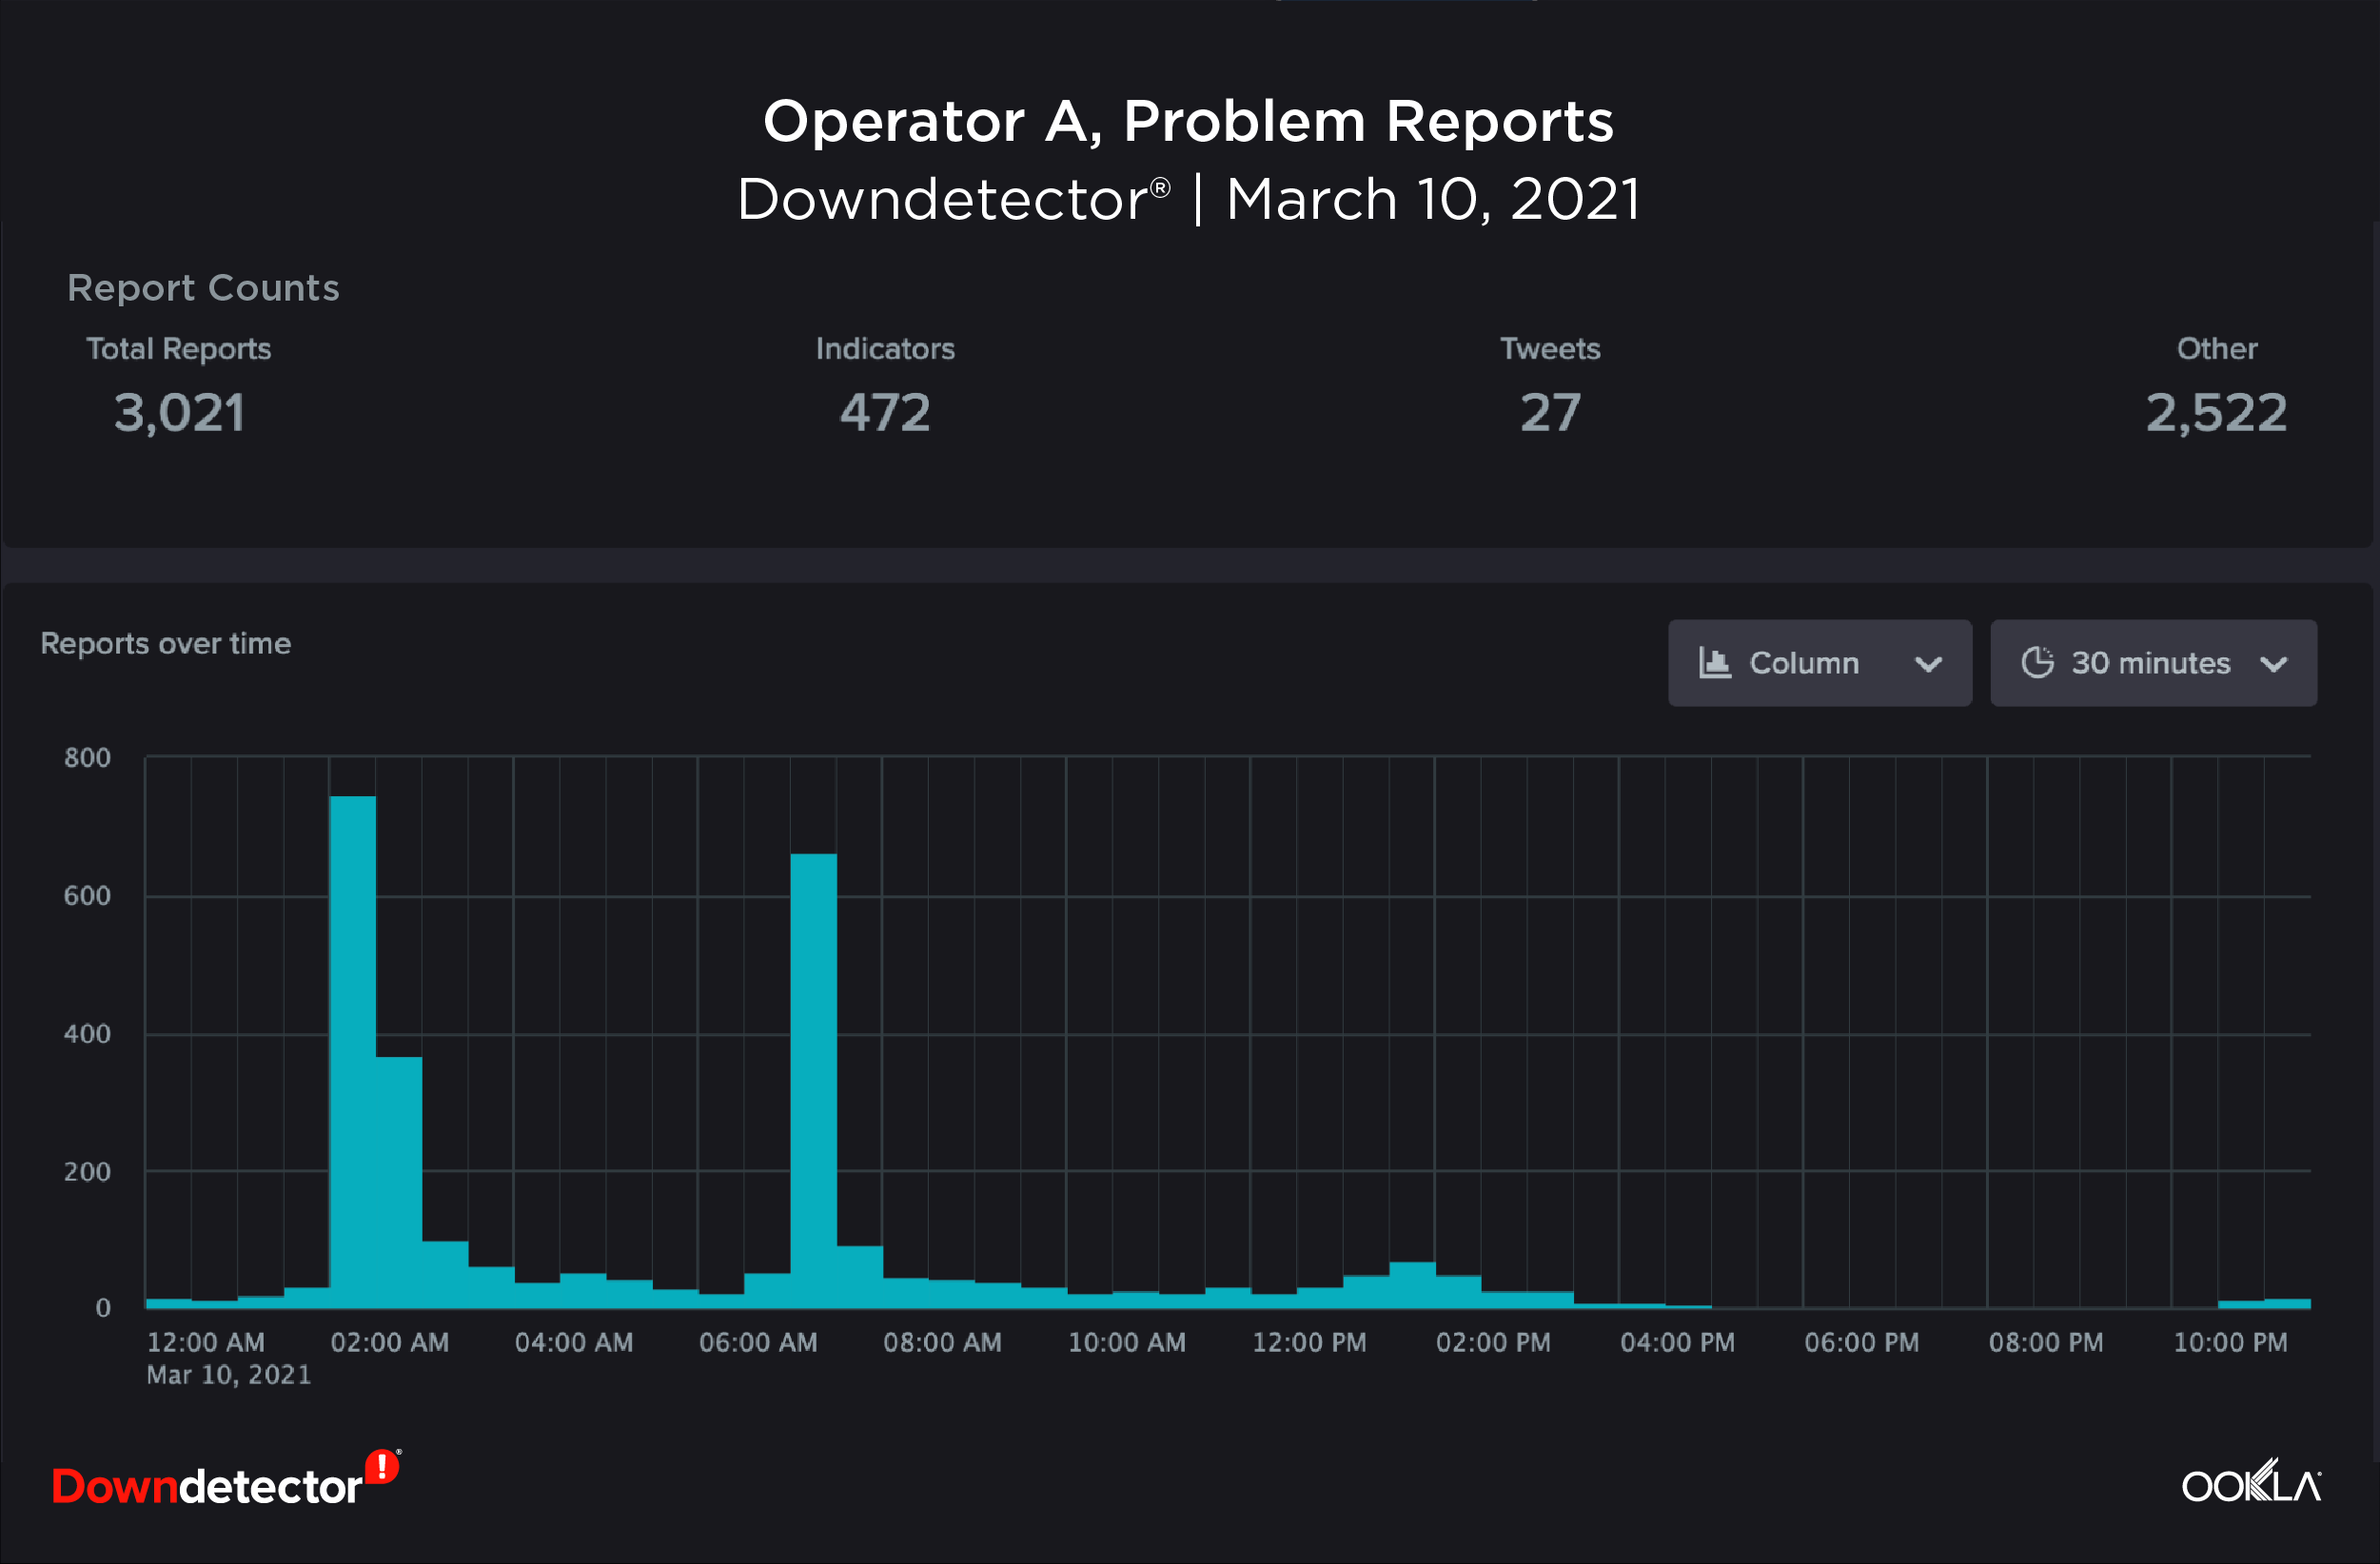
We can see that during this 24-hour period Operator A had a total of 3,021 problem reports. In the report counts chart we can see that there were only 27 customer tweets related to Operator A’s incident.

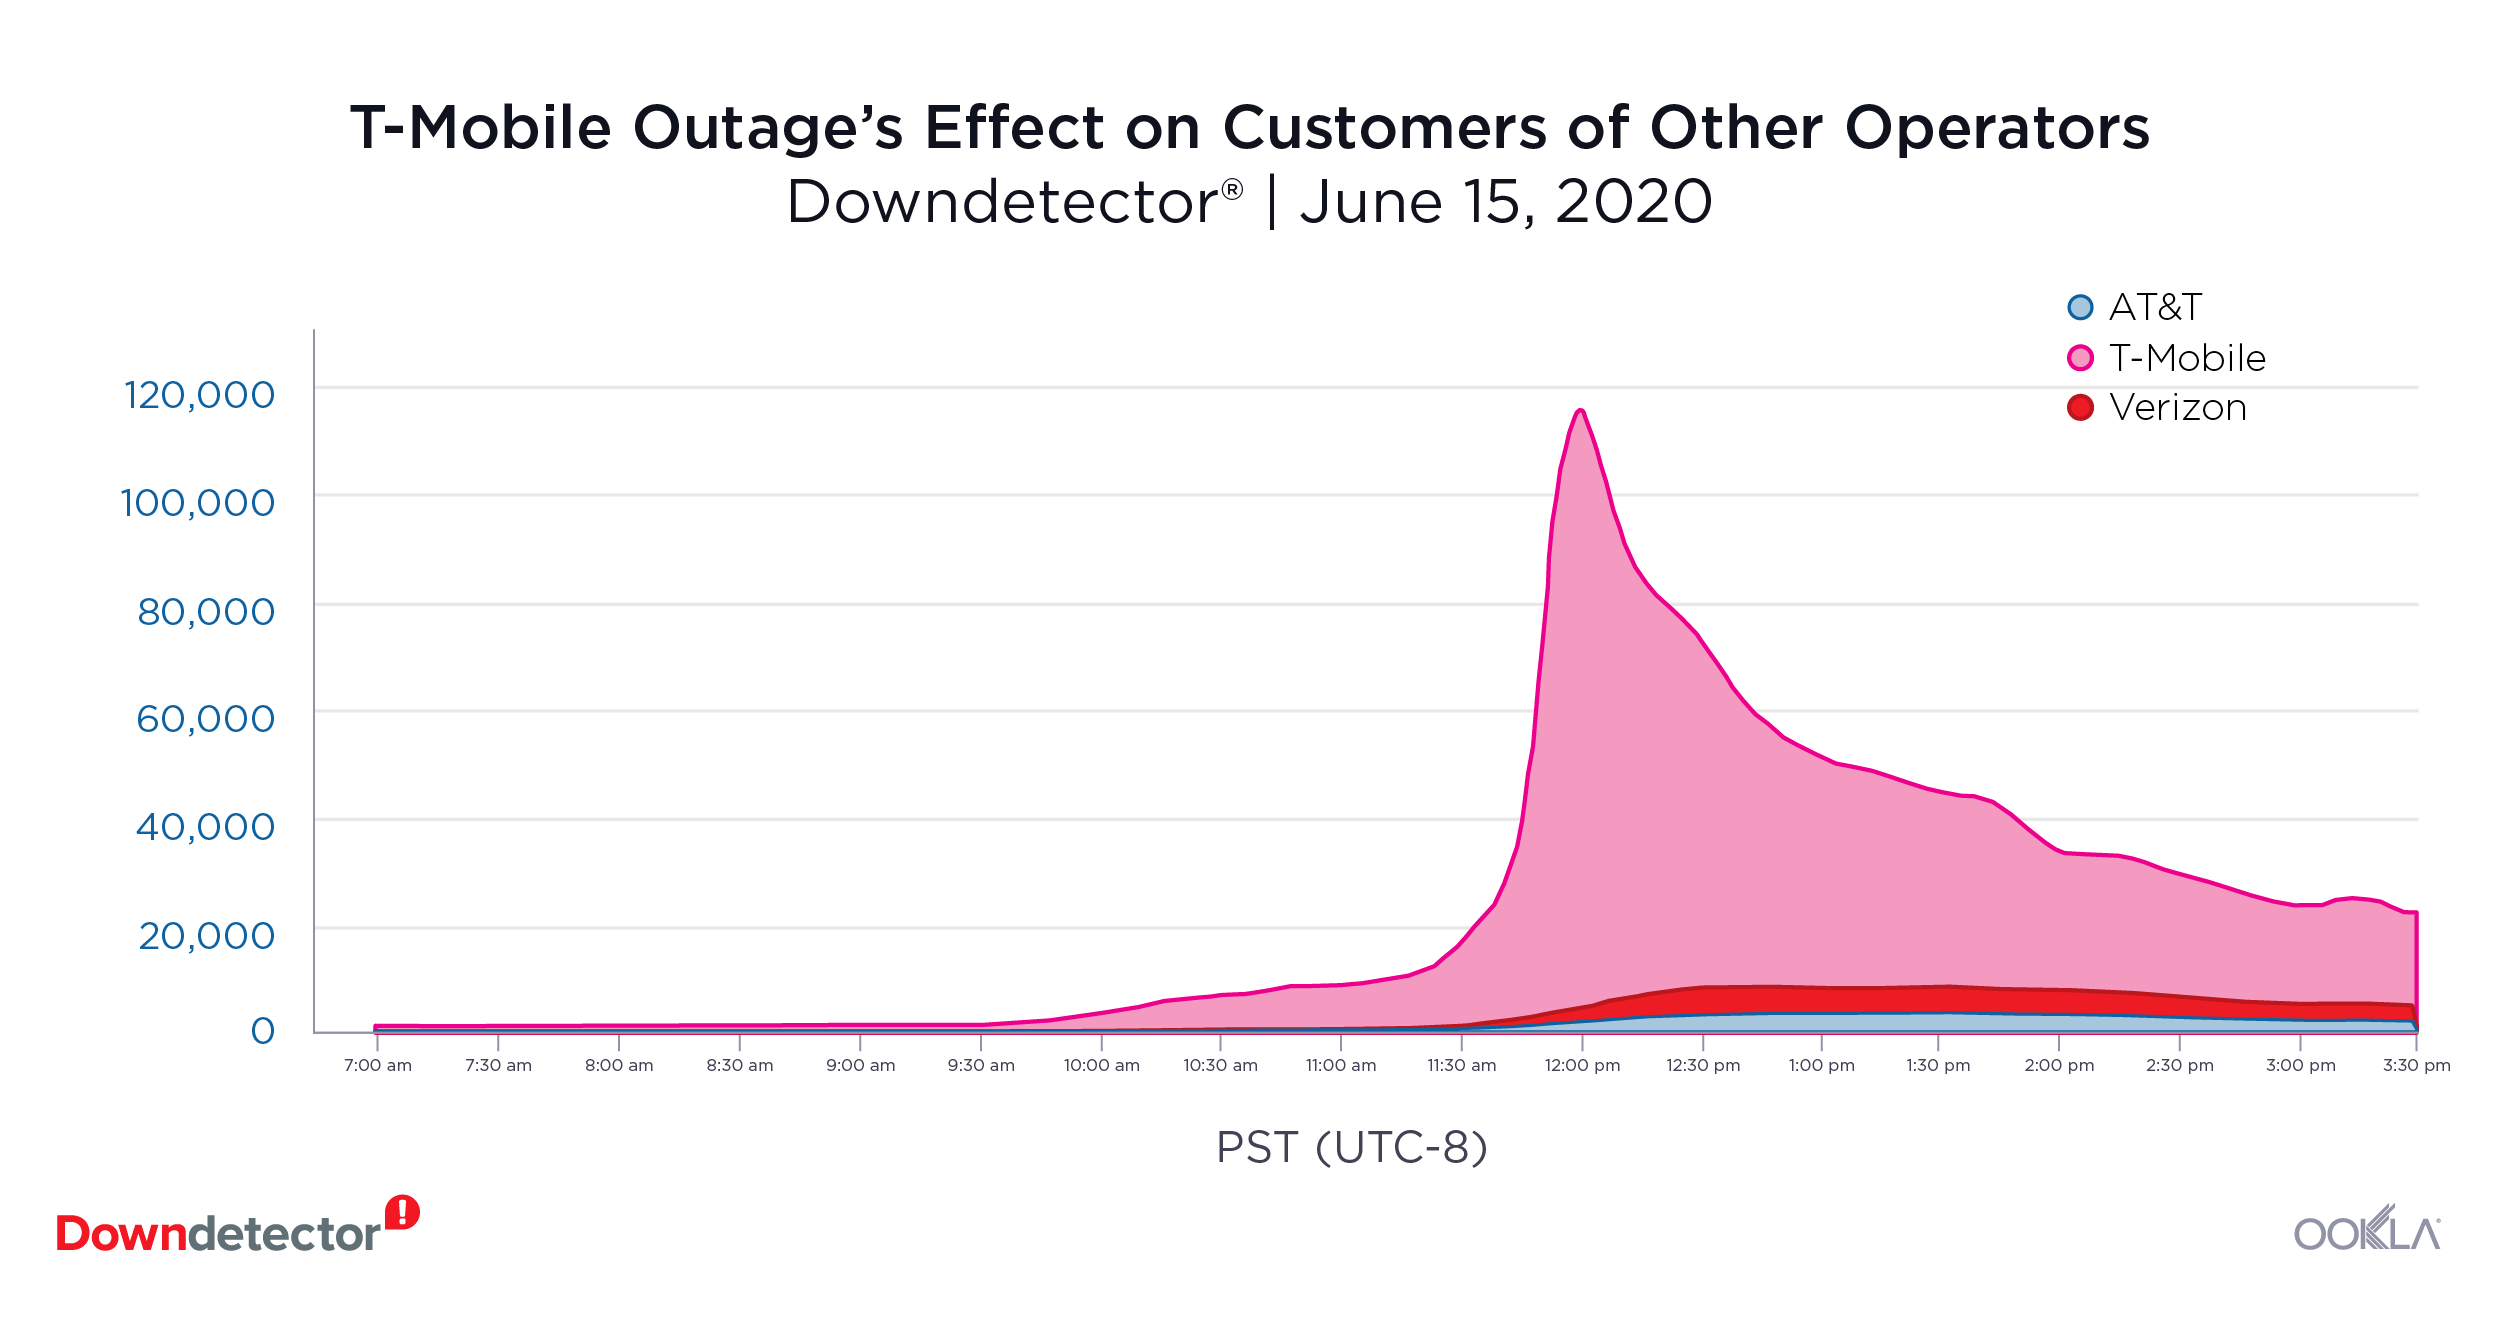
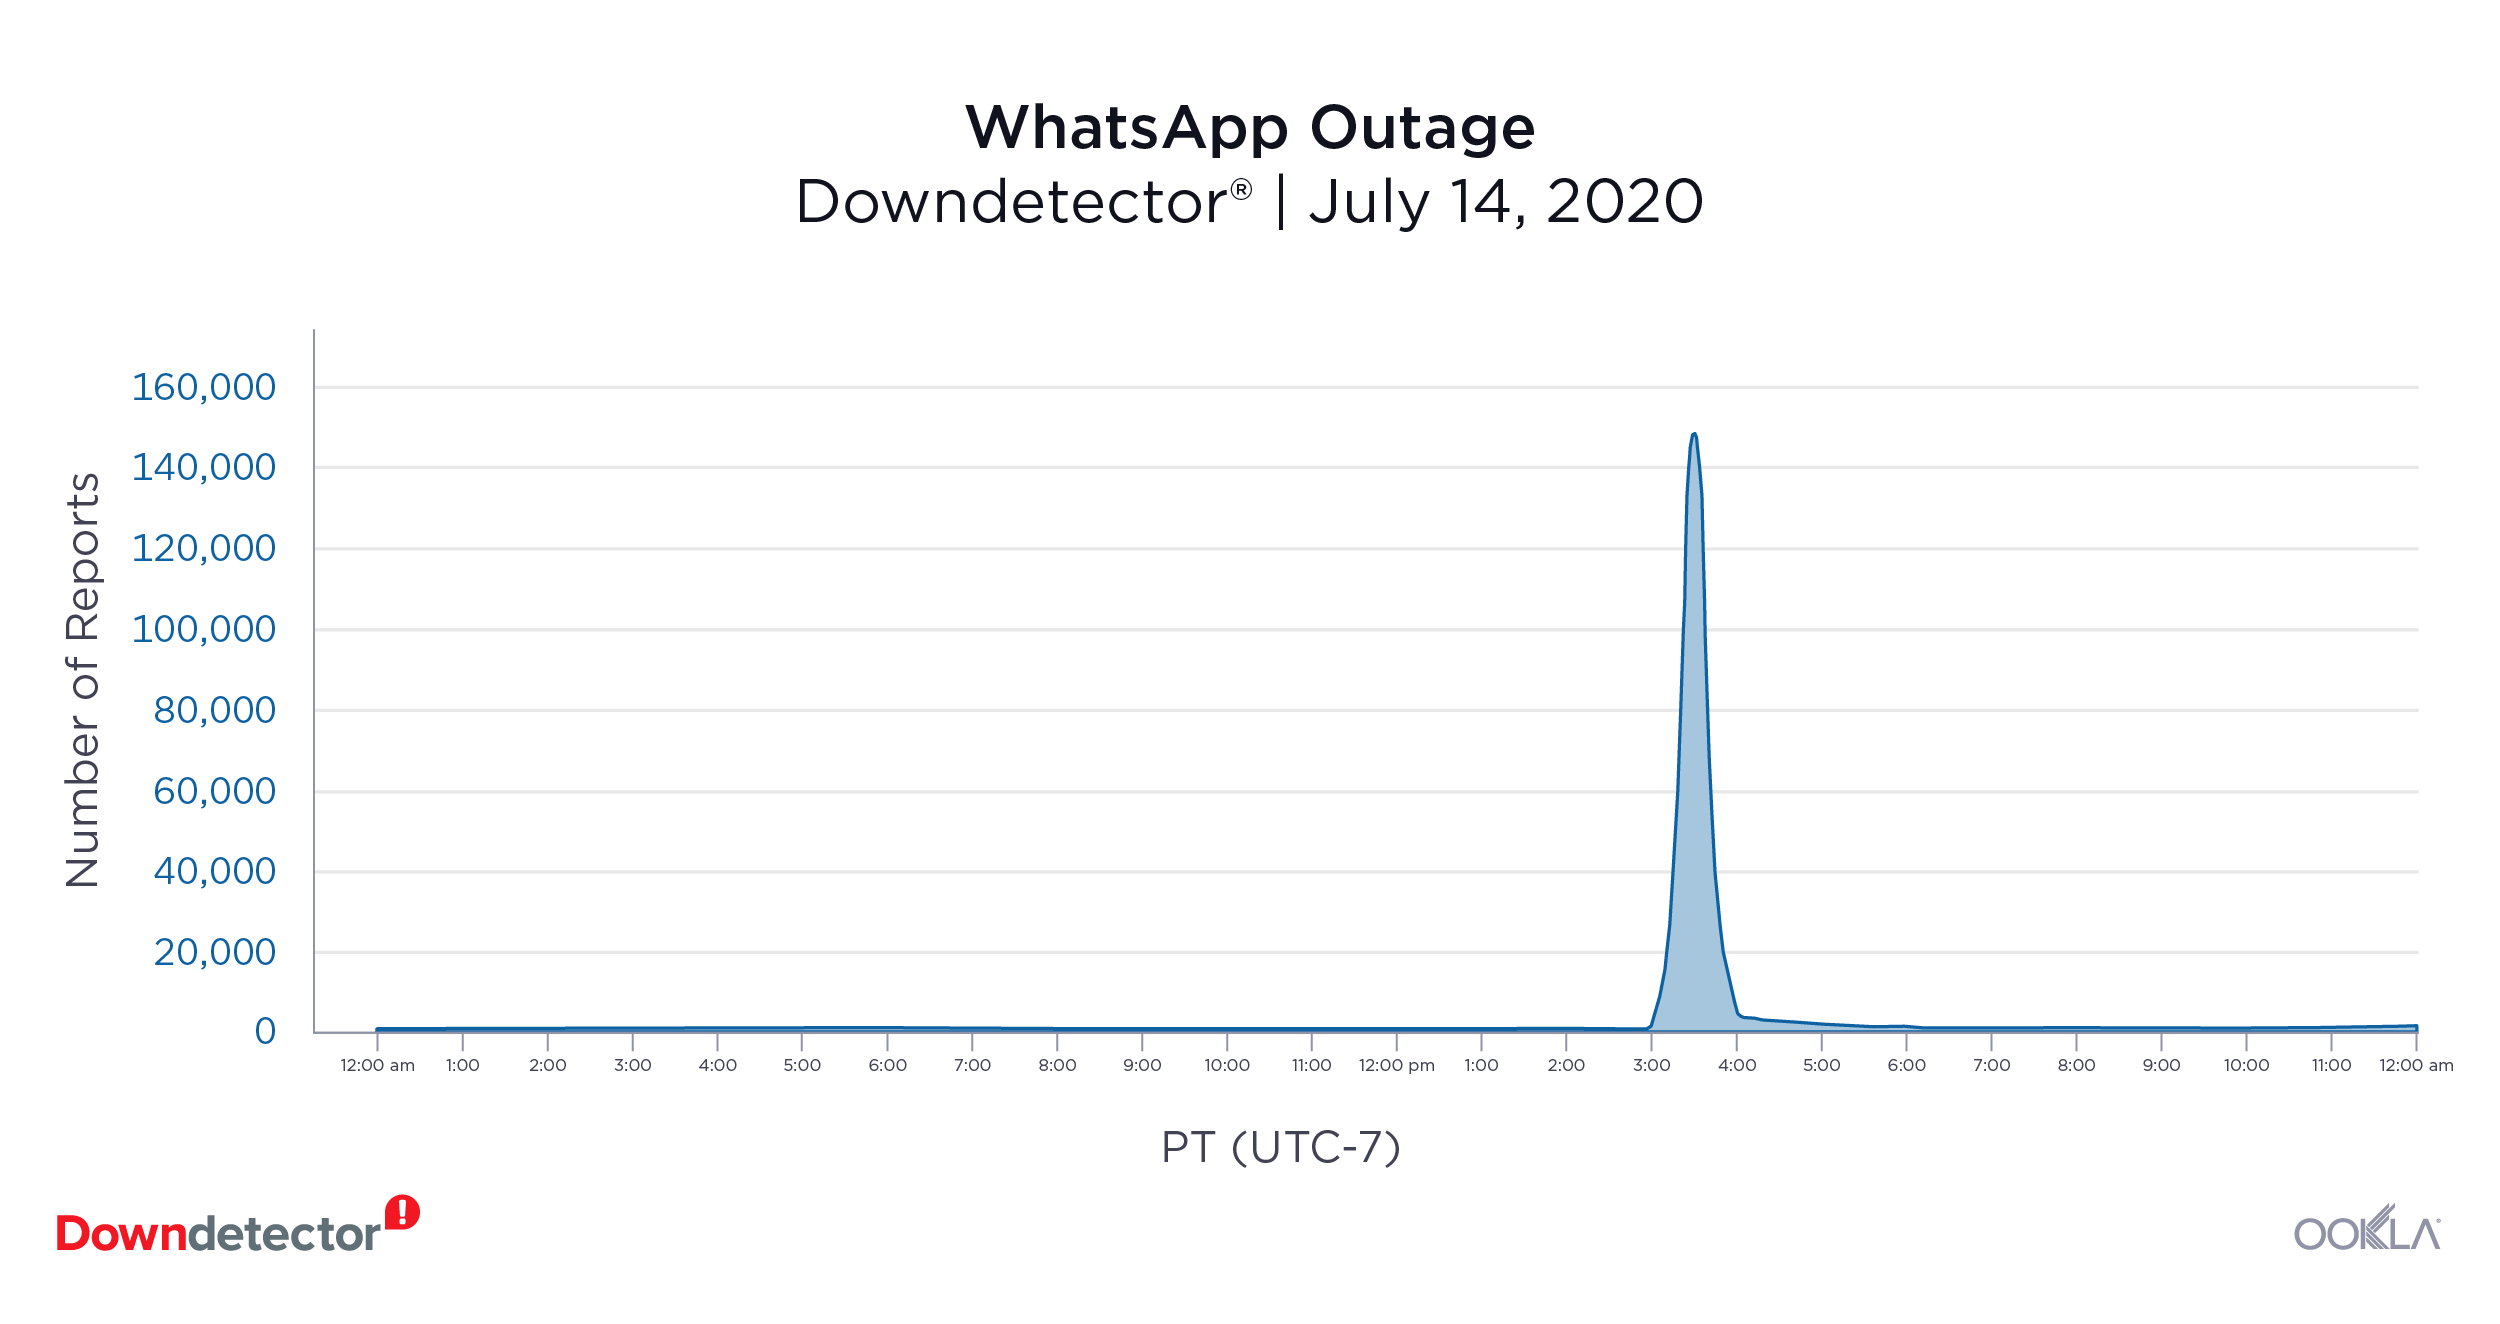
Compare this with an outage experienced by Operator B on June 18, 2021.

downdetector_b_problem-reports_0921

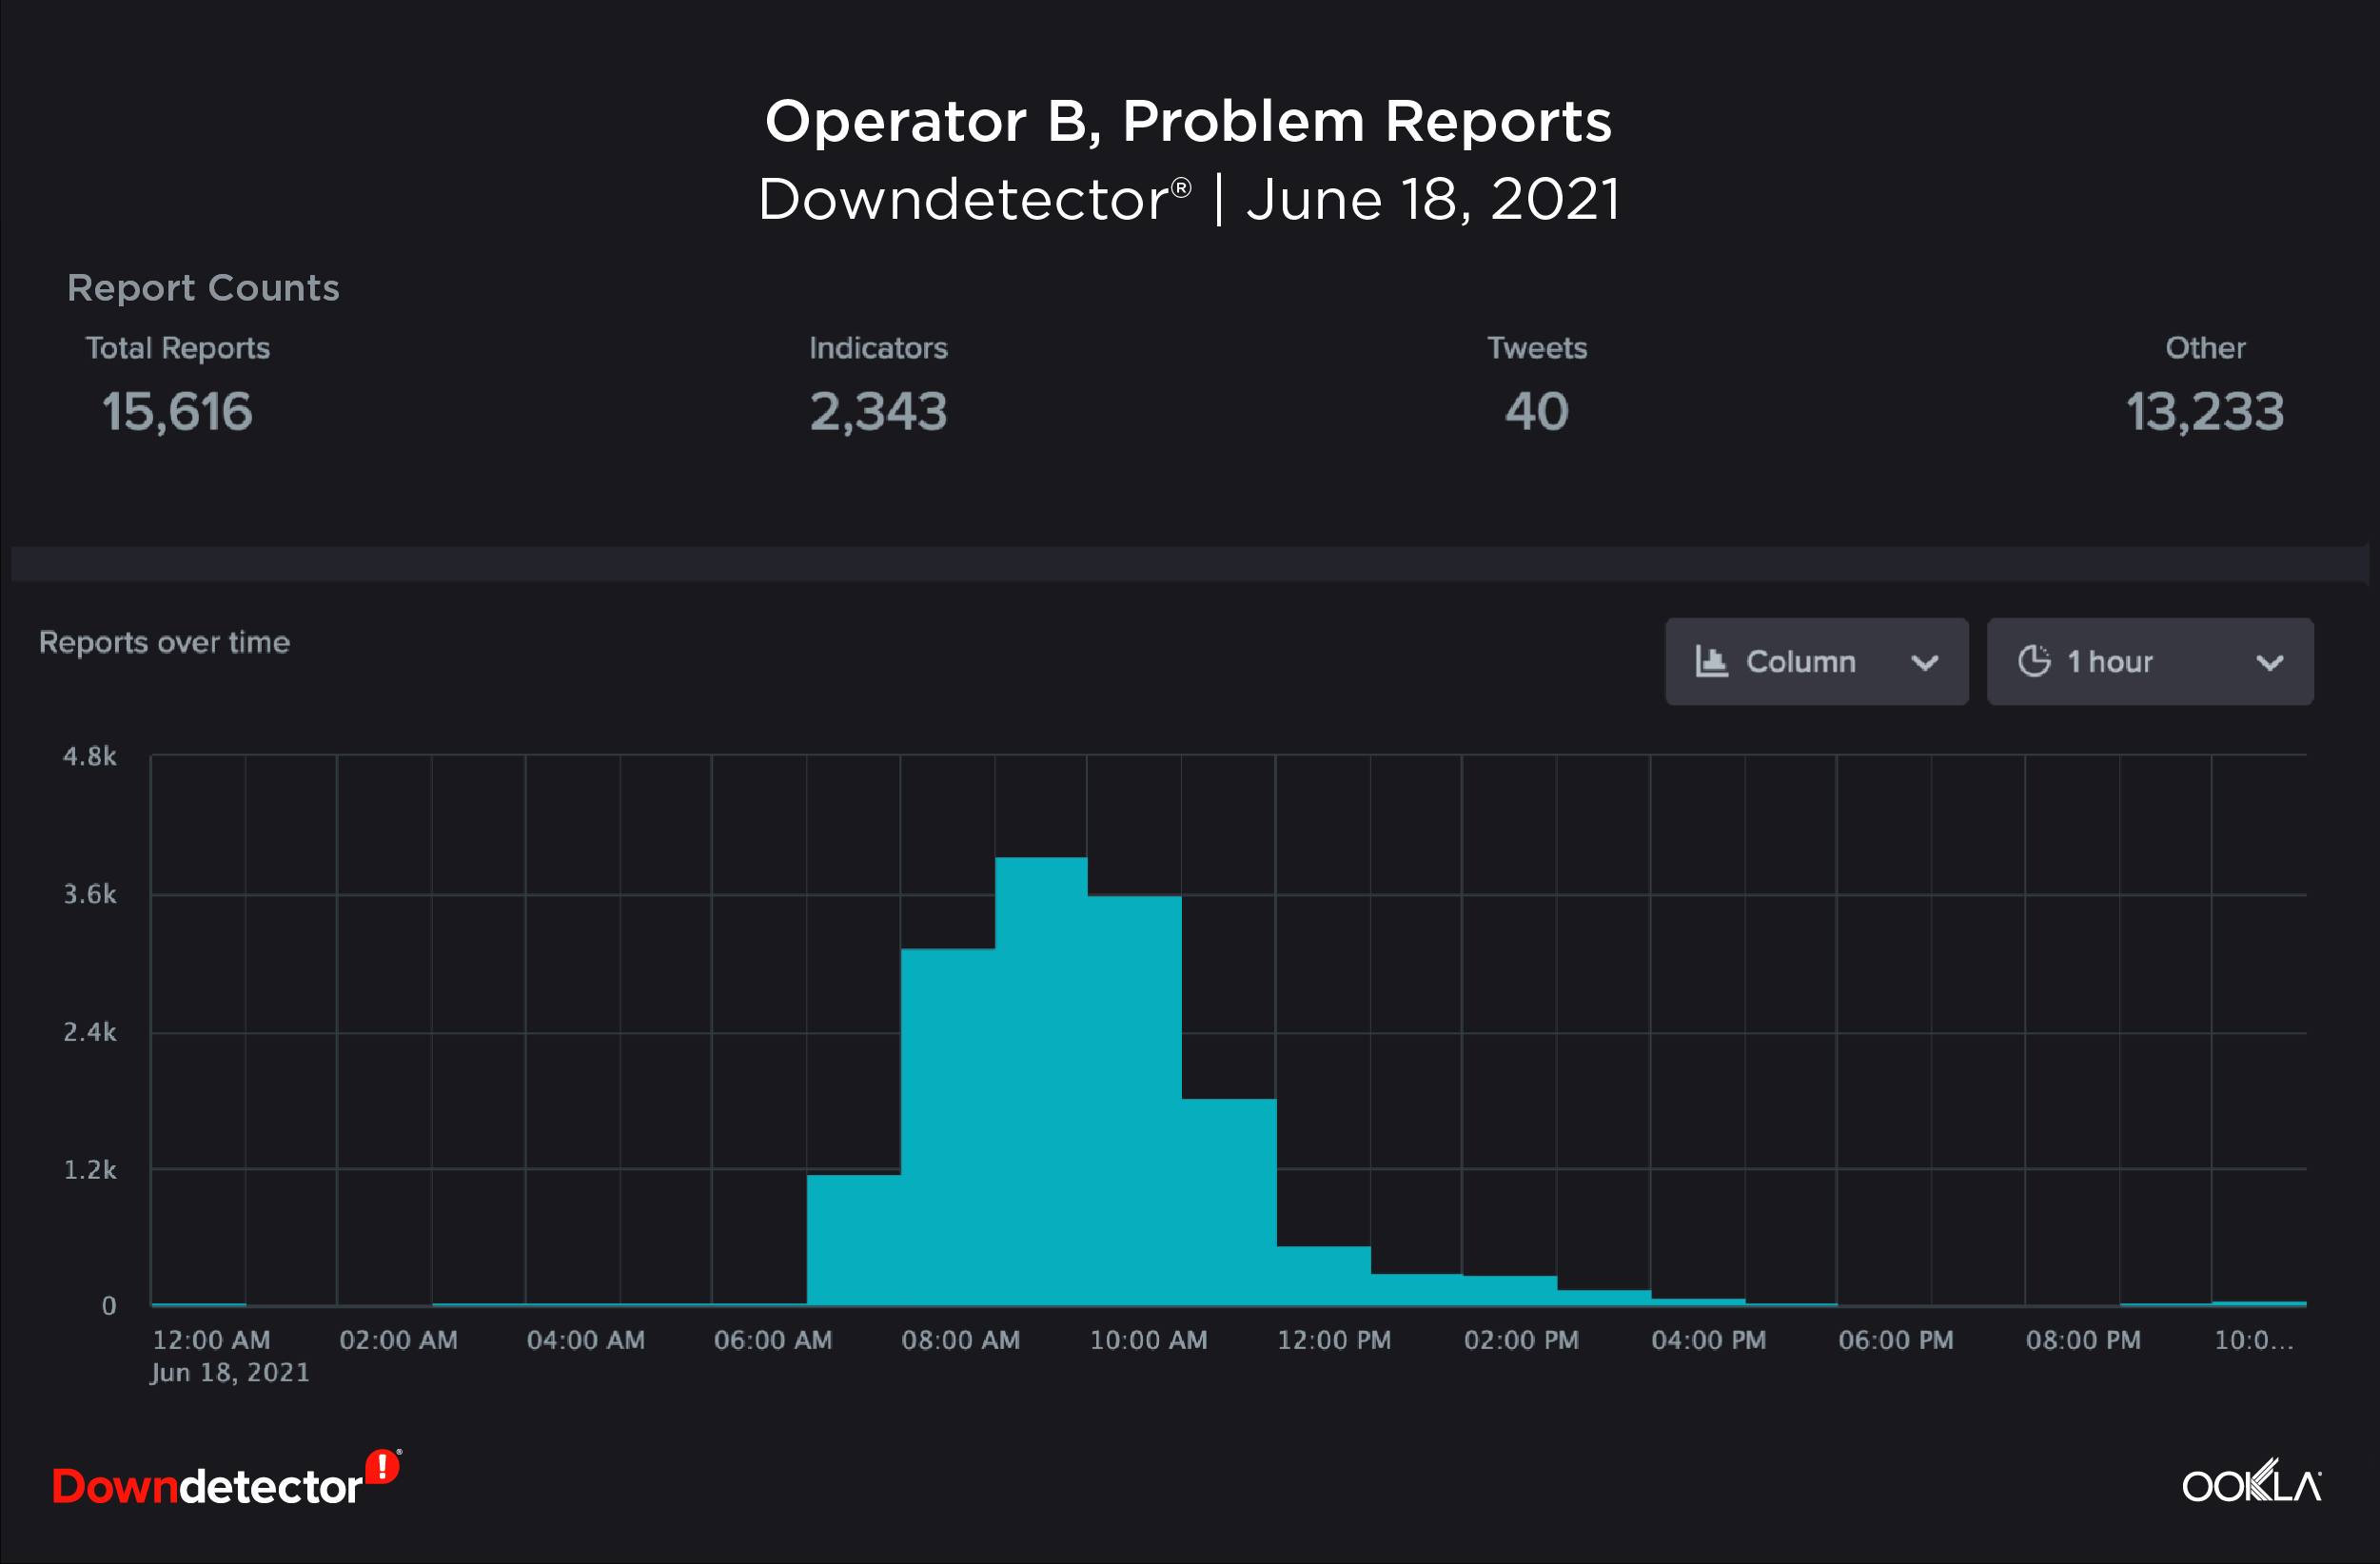
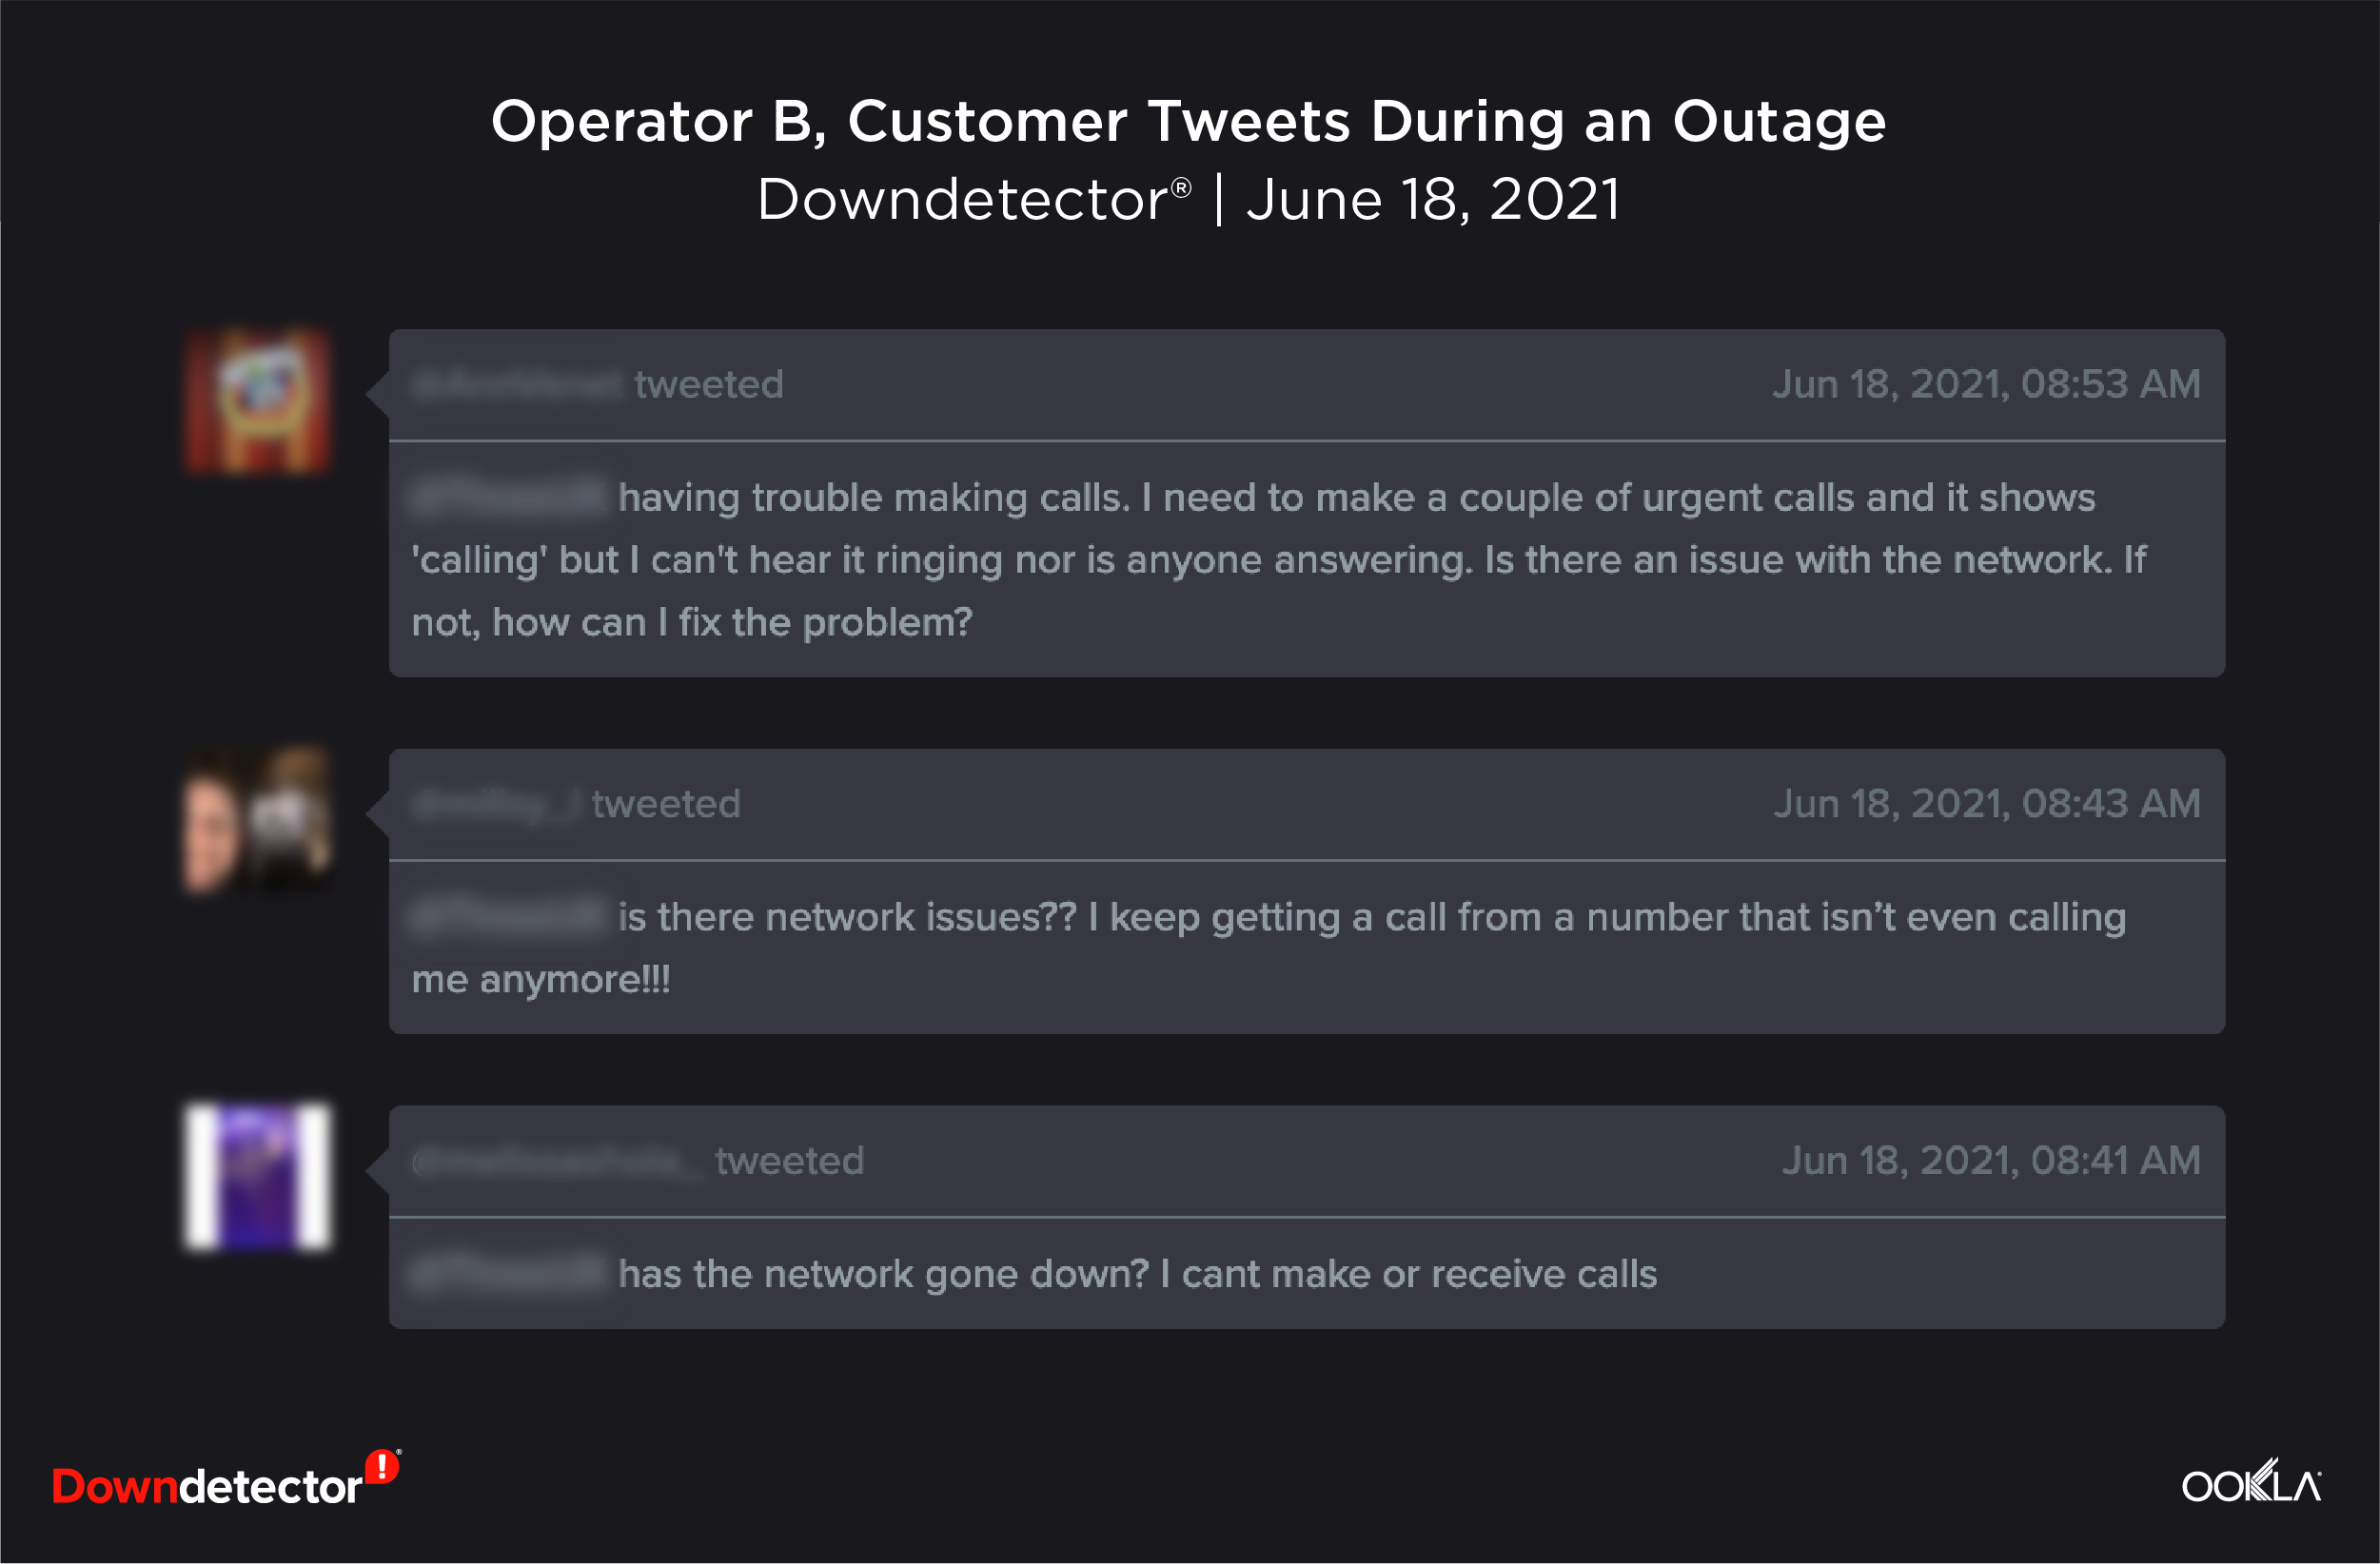
We can see that Operator B received over 15,000 more problem reports than Operator A did during their March outage — despite having 10 million fewer customers. Operator B also had significantly more tweets detected in comparison to Operator A, most of which showed negative consumer sentiment surrounding the incident.

downdetector_b_tweets_0921-1

How did Operator A have significantly fewer problem reports on Downdetector during their outage, despite having millions more customers than Operator B — as well as more positive consumer sentiment surrounding the outage? The likely answer comes down to Operator A’s digital customer experience. Operator A provides a clear path for customers to check their network status and report their problems — without dialing in to the call center.

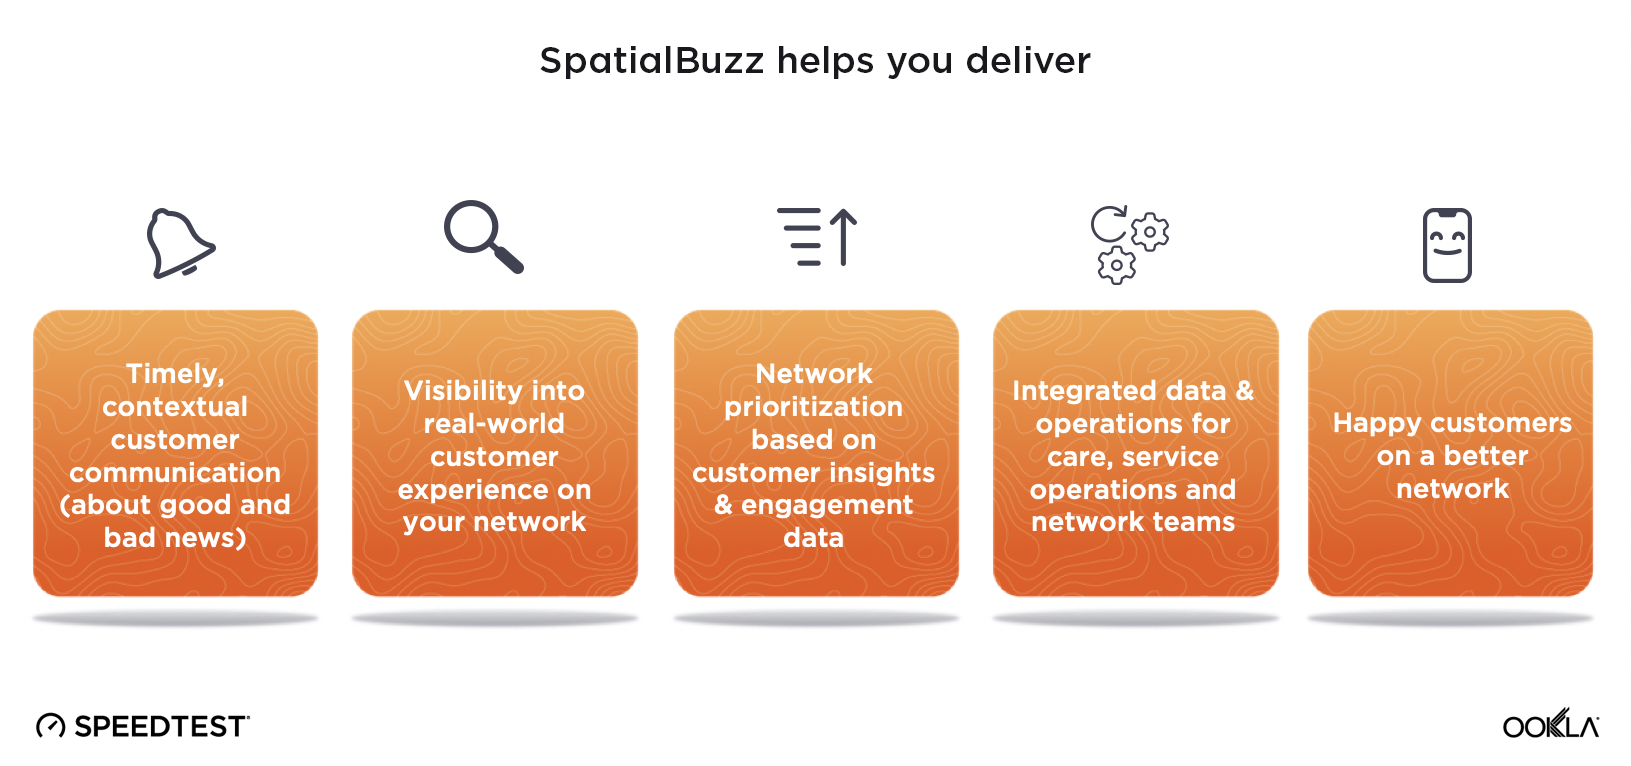
By leveraging Ookla Spatialbuzz™, Operator A empowered their customers with self-serve tools to check their network status, report issues and opt in to network updates. Spatialbuzz is a customer-driven network improvement platform that helps mobile operators to deliver the best customer experience possible — and use customer network data to make improvements in the areas with the most impacted customers.

By providing customers with these tools, Operator A was able to reduce the number of customers turning to external platforms to voice their frustrations. On the other hand, Operator B’s customers had no easy way to provide feedback or receive communication based on network conditions — leading to a spike in dissatisfied customers filing problem reports on Downdetector and complaining on social media platforms.

The power of Spatialbuzz and Downdetector

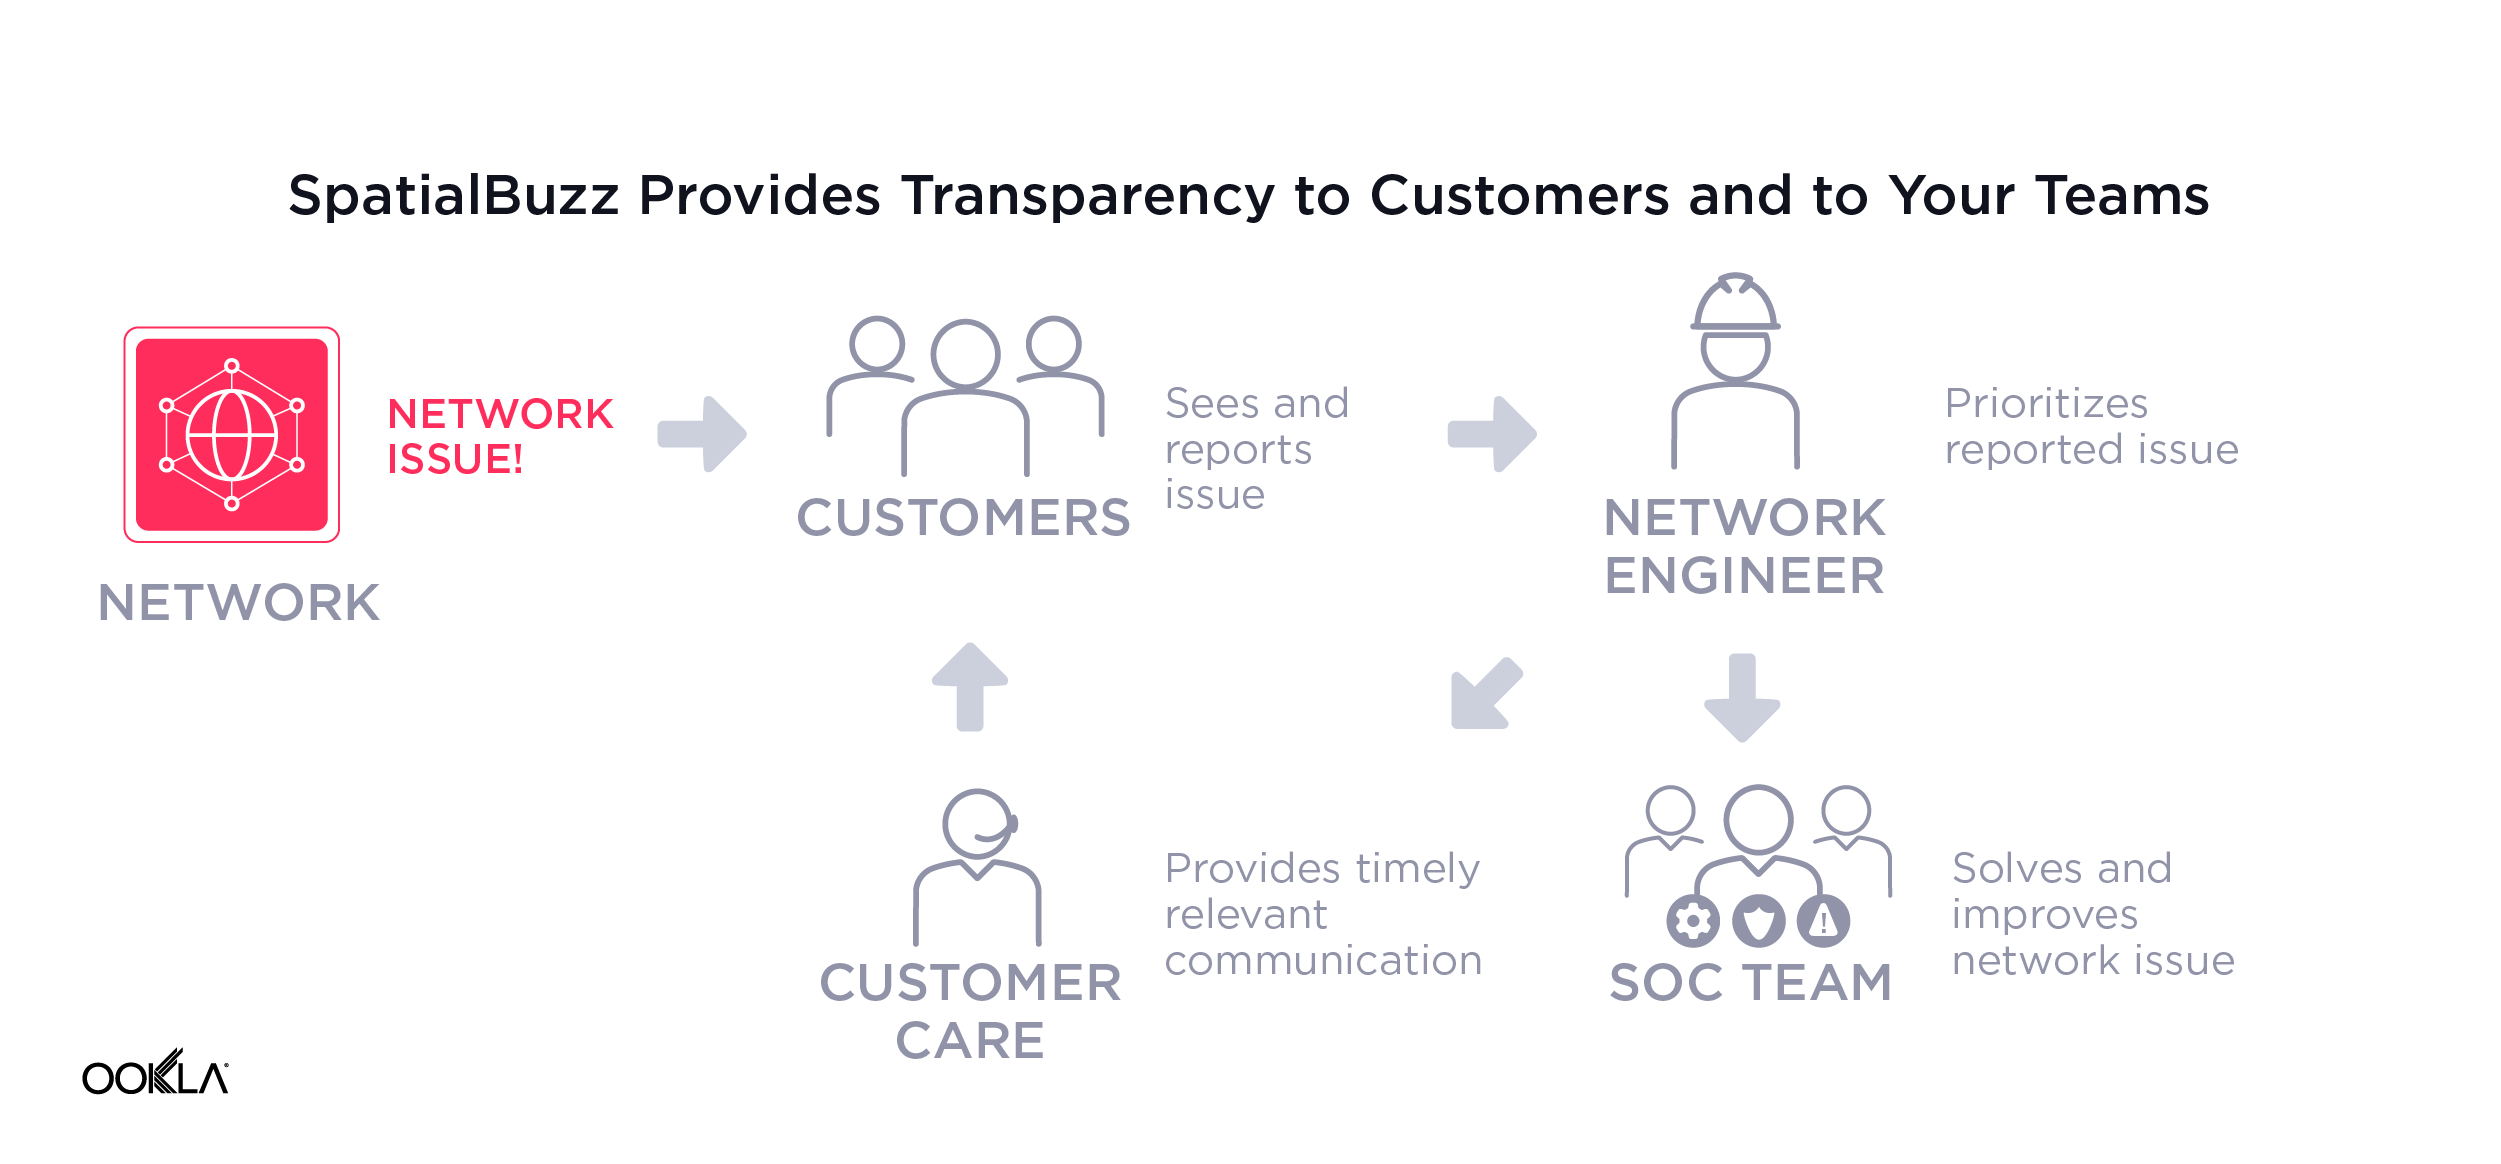
With Downdetector and Spatialbuzz, network operations center (NOC) and service operations center (SOC) teams can get information about critical incidents as soon as customers report an issue. This information can help them prioritize network issues and decrease mean time to resolution (MTTR).

downdetector_a_dashboard_0921

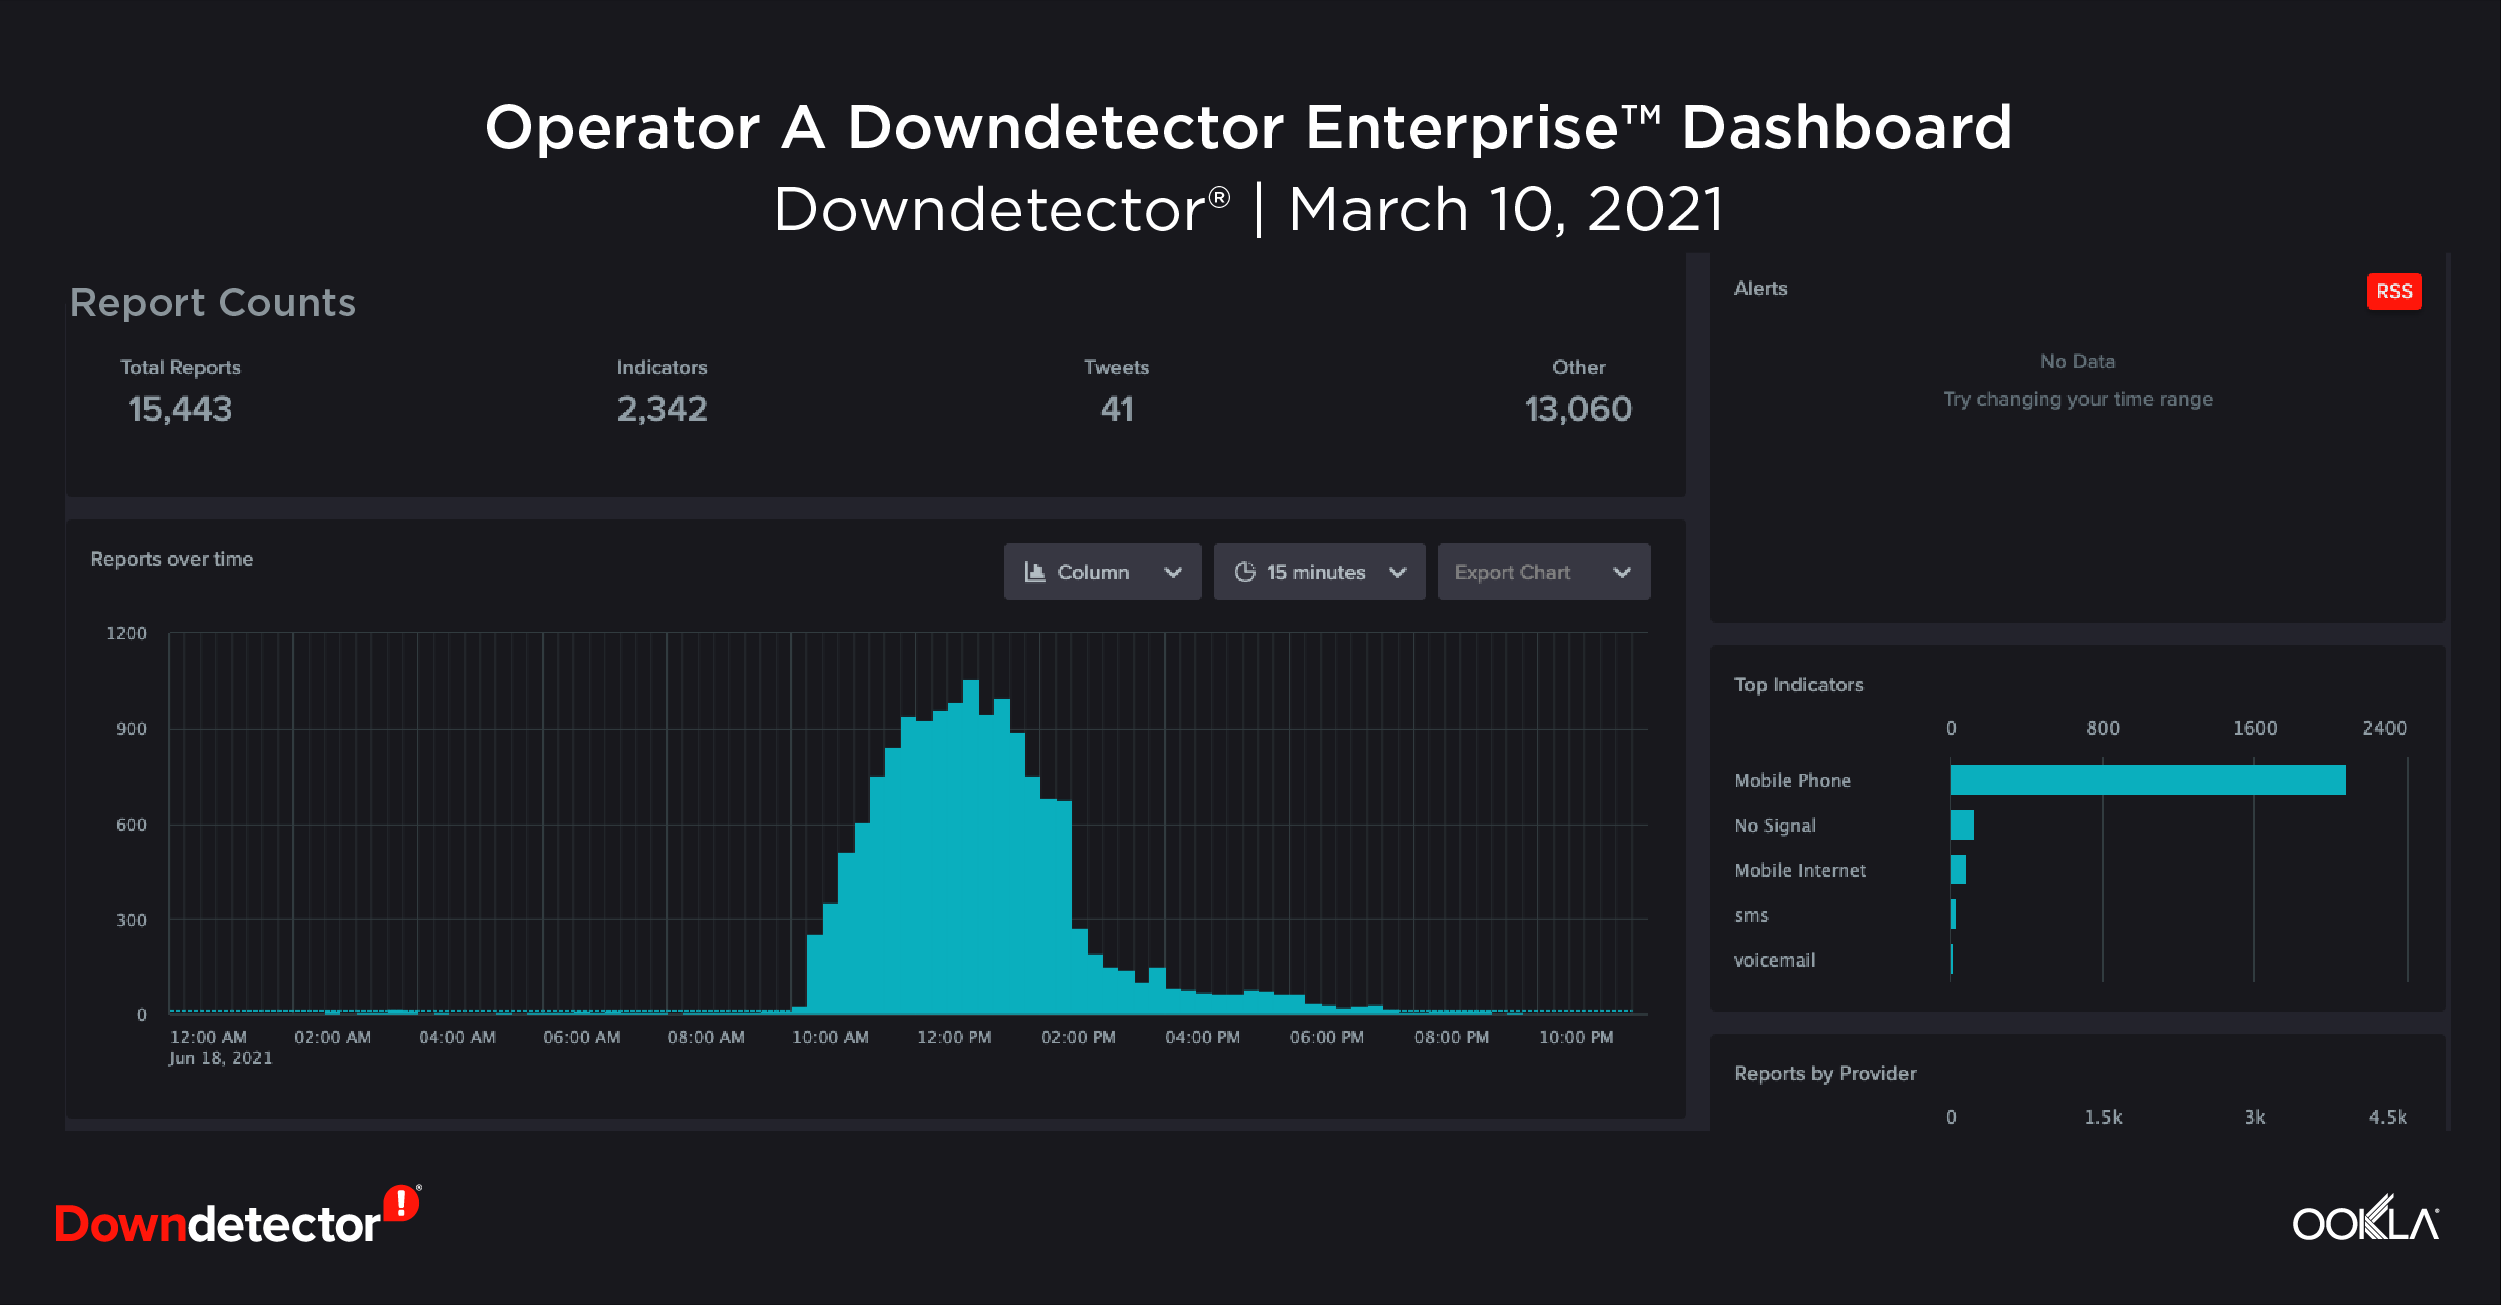
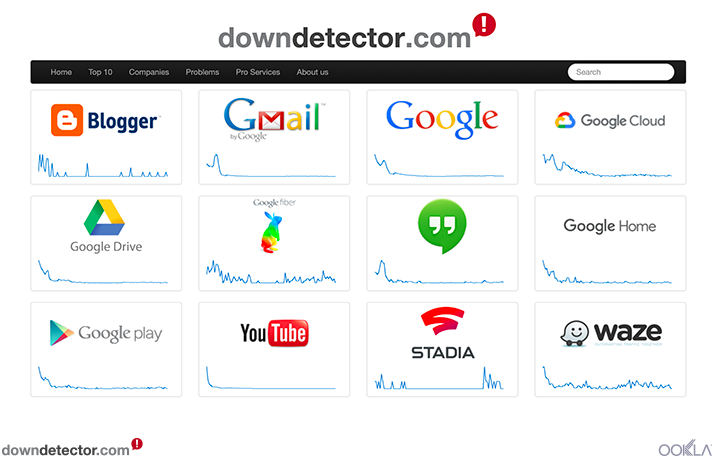
Downdetector Enterprise™ provides NOC teams with immediate alerts when customers are impacted and they can use the Downdetector Enterprise Dashboard to view the scale, duration and problem indicators of the incident. Downdetector also helps diagnose external issues with information about over-the-top (OTT) services such as Facebook, WhatsApp, SnapChat and others. For example, NOC teams can quickly see if customers are experiencing a problem with their own network or if an OTT service is experiencing issues. The Downdetector Communicate feature allows operators to place a banner message on their Downdetector company page to inform consumers of any known issues with their network or an OTT service.

Spatialbuzz provides operators with a single source of truth that connects incidents to customer experience. Spatialbuzz directly integrates with an operator’s website, mobile app, customer care and other applications. By combining real-time customer engagement tools with real-world device measurements, Spatialbuzz gives operators the intelligence they need to prioritize network issues using consumer-initiated data — and to increase customer satisfaction by closing the loop on service issues.

ookla_spatialbuzz_network-status-checker_0921-1
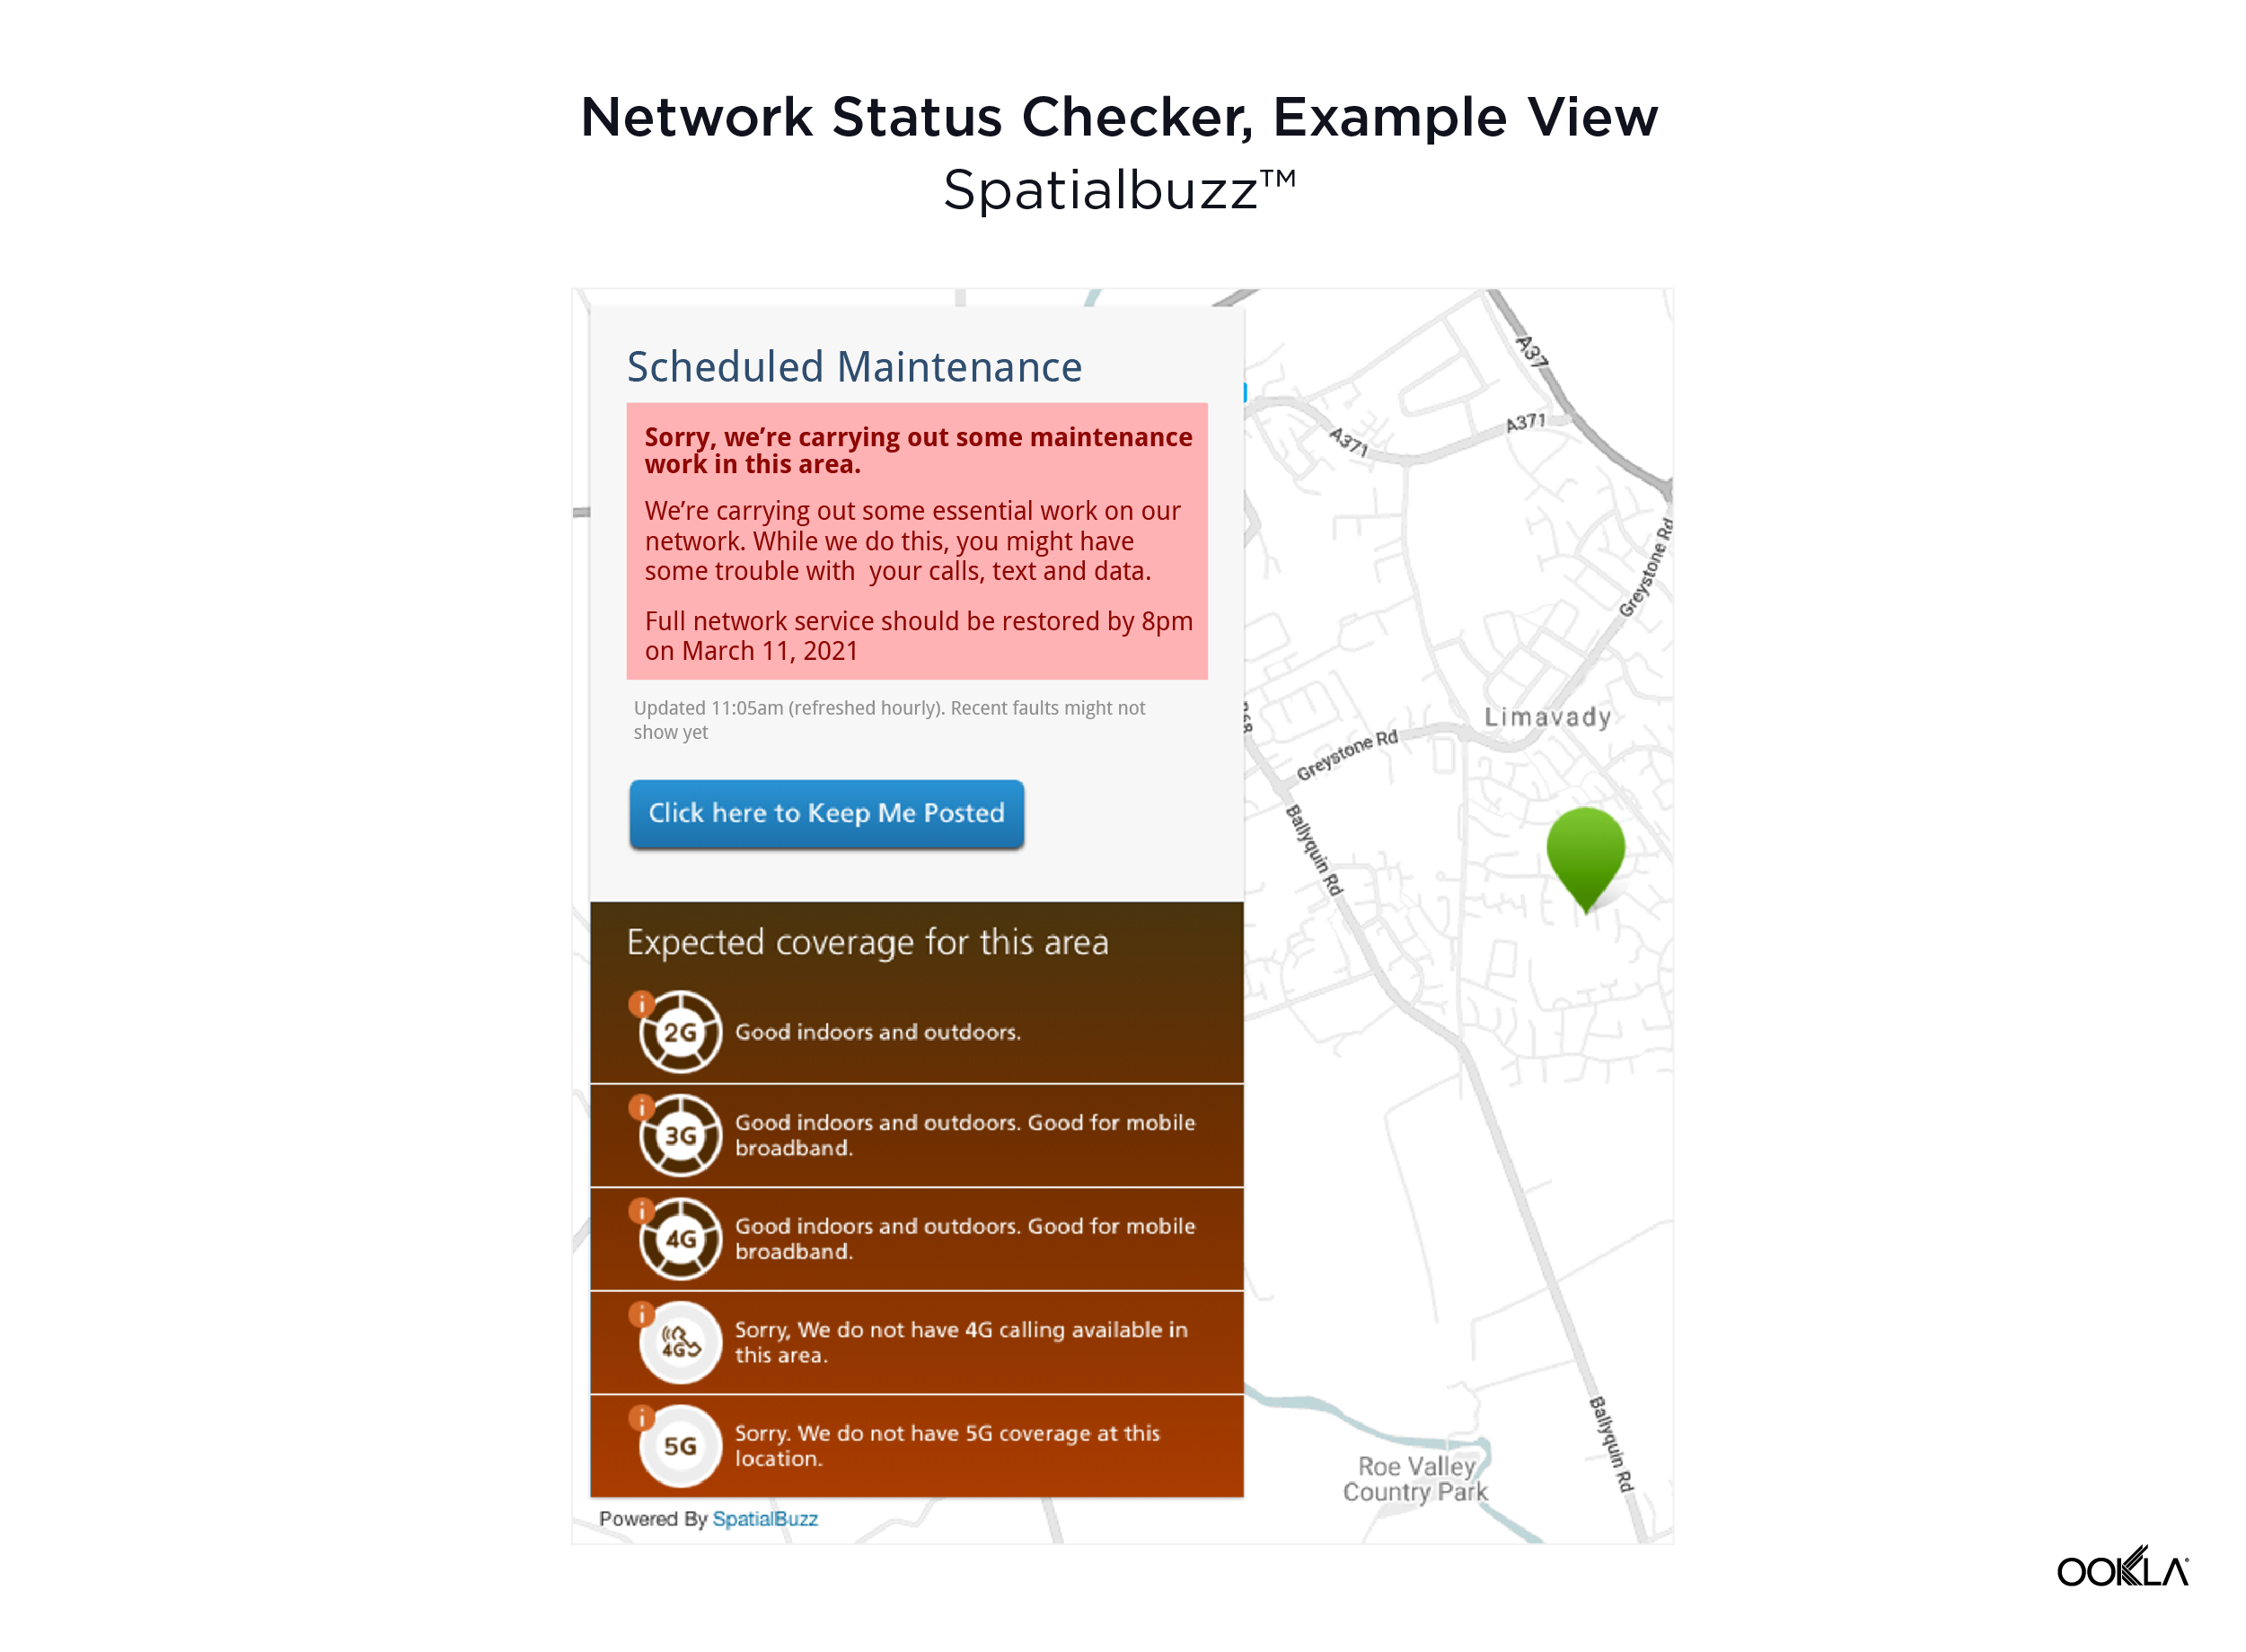
Above you can see just how easy it is for a customer to check their network status and report issues with their service on an internal platform. After reporting the issue, customers can opt in to receive updates about the issue they’re experiencing. If there’s already a known issue, customers will immediately receive contextual communication about it.

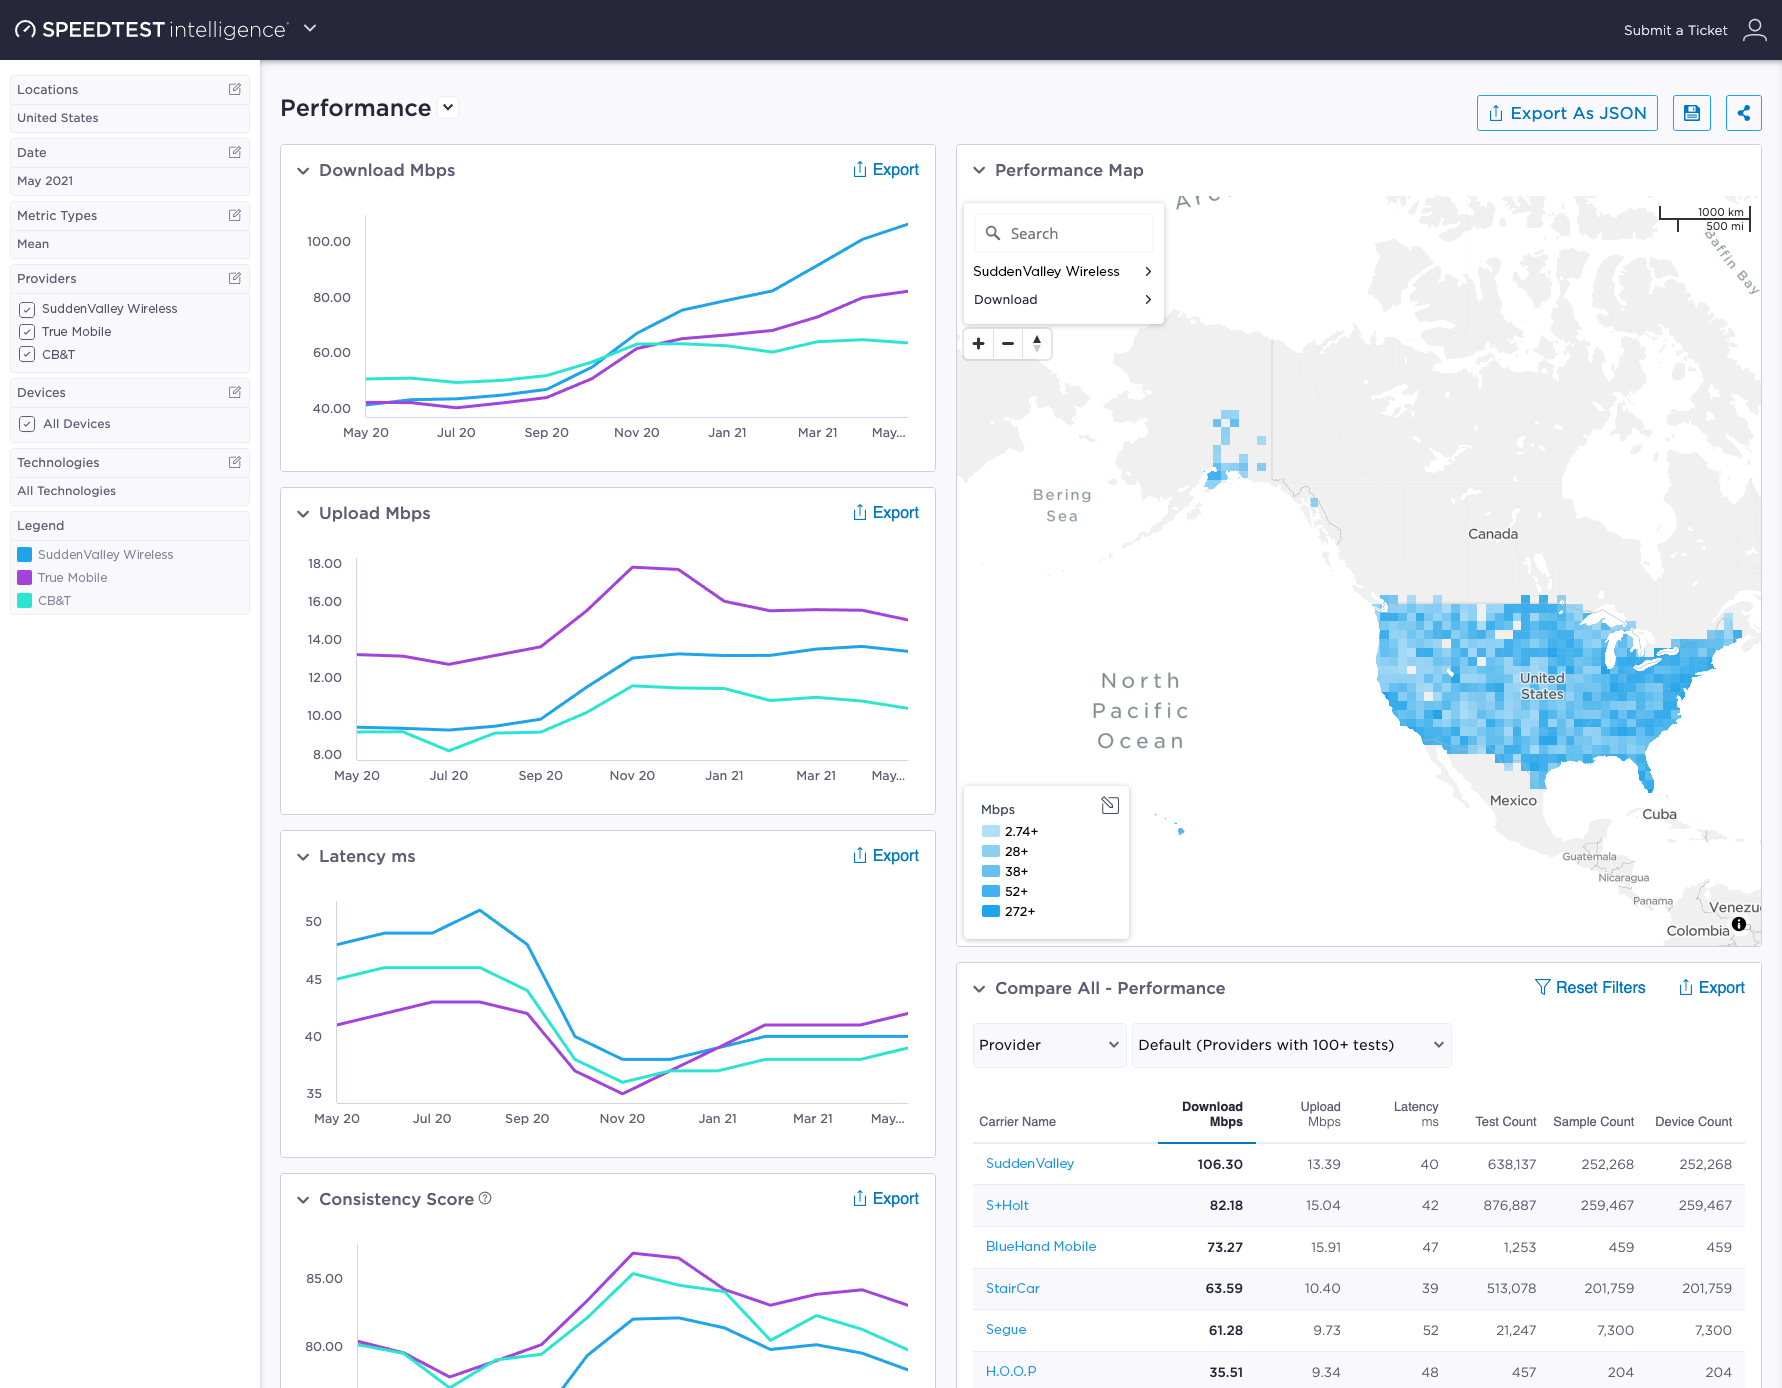
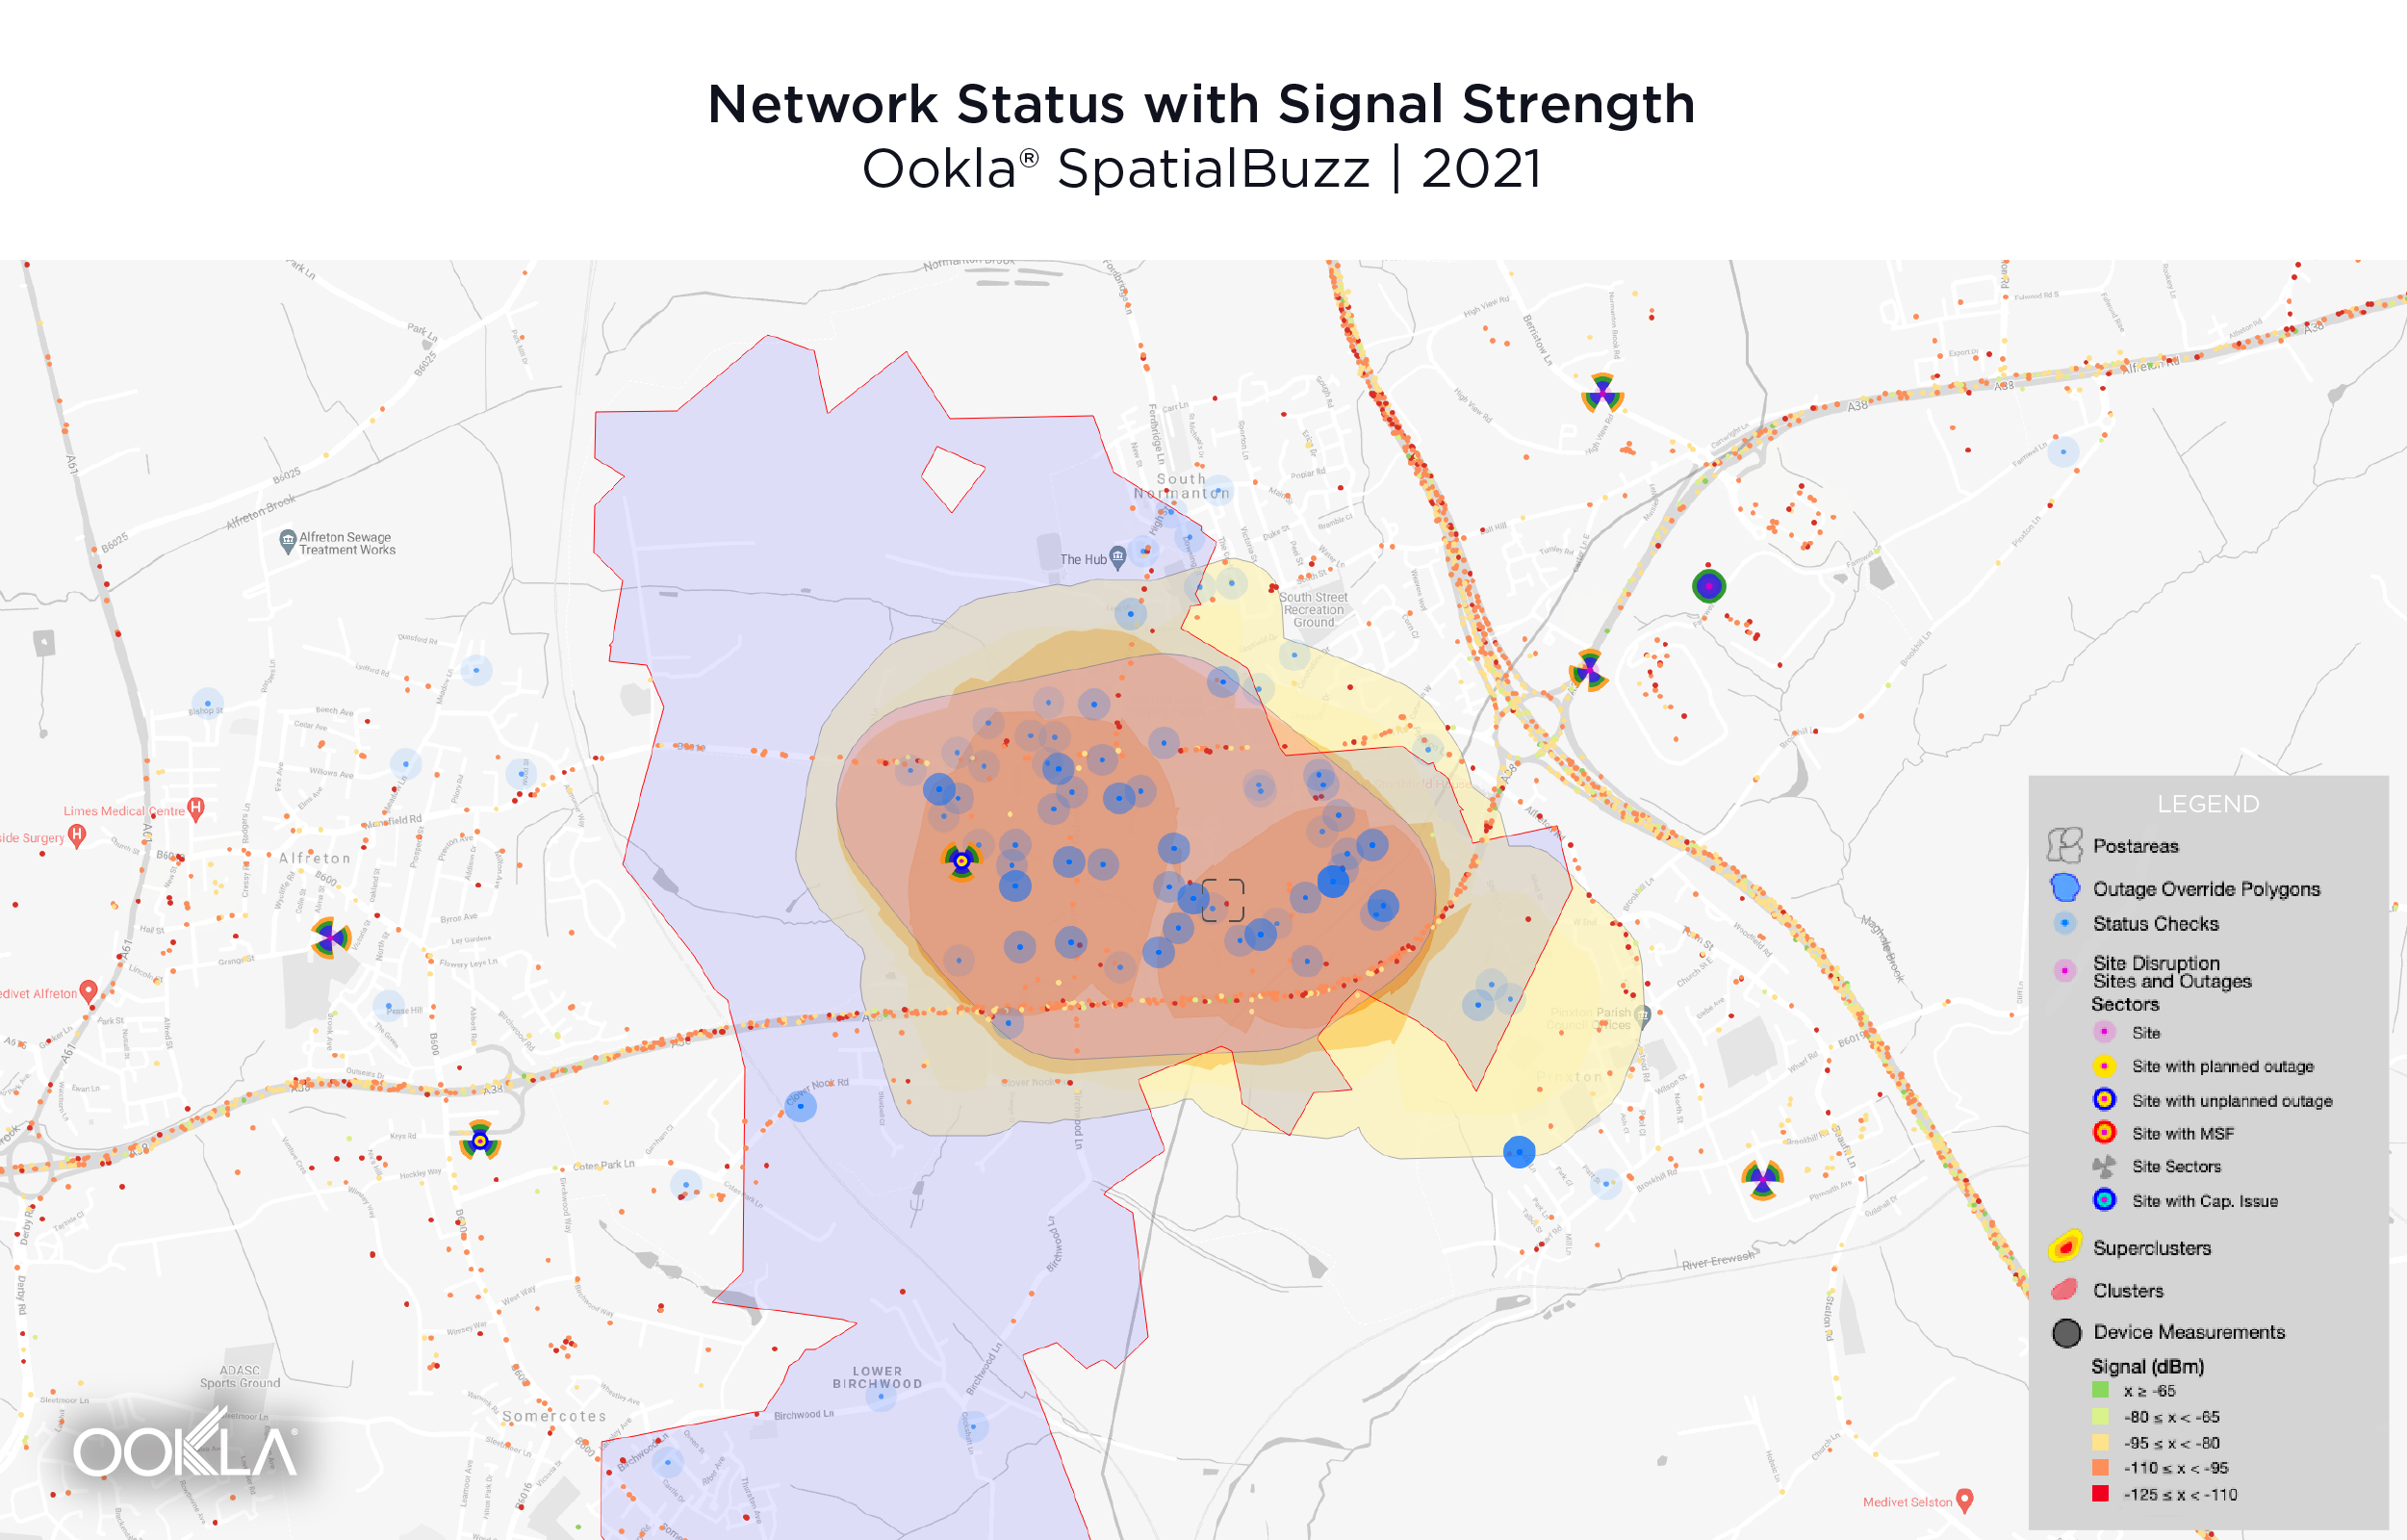
On the back end, Spatialbuzz makes it easy for NOC, SOC and engineering teams to quickly prioritize network issues based on customer impact. Below, you can see an example of the analytics provided by Spatialbuzz. From this view, network engineers can quickly prioritize network improvements in areas with widespread customer dissatisfaction, then provide transparent communication about network status, known issues and improvements to customers.

ookla_spatialbuzz_analysis_0921-1

While Operator A and Operator B both faced outages this year, Operator A used Spatialbuzz to provide a meaningful customer engagement during their outage. Using Spatialbuzz led to significantly less negative customer perception on Downdetector and Twitter. Outages are inevitable. Learn how Spatialbuzz and Downdetector can help you detect and resolve them while proactively communicating with customers and providing a clear path to resolution through digital engagement.

Ookla retains ownership of this article including all of the intellectual property rights, data, content graphs and analysis. This article may not be quoted, reproduced, distributed or published for any commercial purpose without prior consent. Members of the press and others using the findings in this article for non-commercial purposes are welcome to publicly share and link to report information with attribution to Ookla.

| June 23, 2021

Creating a Better Customer Experience: How Ookla Helps Leading Mobile Network Operators Successfully Engage Customers


Winning and sustaining a customer’s business is a top priority for every mobile network operator. You could have the fastest network available in your market or the widest coverage, but still lose customers to competitors that provide better digital engagement or a more seamless customer experience. We know your team works day and night to make sure your network is operating, optimized and providing an experience that meets your customers’ expectations. Your team looks for coverage gaps where it makes sense to expand LTE or add 5G services. Your team constantly benchmarks your network against competitors to make sure you provide the best performance in key locations.

But despite all of your hard work, customer satisfaction with many telecommunications companies remains notoriously low and customer satisfaction doesn’t always align with network performance, as shown in the chart below. Customers often don’t feel like their problems are being addressed, they aren’t receiving transparent communications from their providers or they can’t even log problems due to service outages. Over time, these factors can add up to a lot of lost revenue, sunk costs and time and resources spent on issues and improvements that may not even increase customer satisfaction.

ookla_mobile-ranking_chart_0621

For the past 15 years, Ookla® has provided you with the tools to improve your network, including Speedtest Intelligence®, Cell Analytics™ and Downdetector®. Now, with the addition of our innovative SpatialBuzz solution, we can help you engage directly with your customers to identify, prioritize and diagnose customer dissatisfaction areas in real time for speedy resolution. Most importantly, SpatialBuzz allows you to close the customer feedback loop with meaningful, timely communications so that customers can see how hard you are working to improve their network experience.

Ookla is excited to offer you tools to improve your network performance and create a better experience for your customers. Click here to learn how top-rated mobile network operators are utilizing SpatialBuzz or inquire directly about any of our products.

Ookla products help you improve your network

Speedtest Intelligence is the leading source of information for networks worldwide

intelligence-screenshot

With over 200 data points on billions of consumer-initiated tests and coverage scans, ISPs, mobile operators, governments and regulatory bodies trust Speedtest Intelligence as an official source of record for the state of worldwide markets. Speedtest Intelligence offers up-to-date insights into global fixed broadband and mobile networks based on over 10 million consumer-initiated tests taken every day with Speedtest® and hundreds of millions of daily network coverage scans.

You may have used Speedtest Intelligence to benchmark your network against competitors, investigate your overall performance or pinpoint geographic trouble spots. With the addition of Consumer Sentiment data, you can now better understand the relationship between network performance and customer satisfaction.

Consumer Sentiment data in Speedtest Intelligence helps you better understand your customers’ experience on your network

You know that customer satisfaction plays a major role in retention, but custom research can be expensive. Consumer Sentiment data allows you to gauge customers’ overall satisfaction using the Speedtest Intelligence Portal. We aggregate one-question surveys presented at the end of a Speedtest experience, these responses are aggregated, analyzed and transformed into valuable insights.

Cell Analytics provides unparalleled intelligence about your network

ookla_cell_analytics

While benchmarking your overall network and customer experience is essential, knowing when and where exactly to invest more resources into your network is mission critical as you expand and improve your network. Cell Analytics provides unrivaled intelligence about wireless service quality, RF measurements, data usage, user density (both indoors and outdoors), cell site locations and much more, packaged in an easy-to-use interface. Cell Analytics uses the granularity of Speedtest network testing and gives you the performance, coverage and signal measurements you need to improve your network.

Unlike data collected by traditional methods such as drive testing and walk testing, Cell Analytics data is collected in real-world measurements where consumers are actually connected to networks — on streets, inside vehicles, at home, at work and other locations — with high location accuracy and 3D modeling. Combined with data on cell site locations, tools to prioritize optimization and deployment efforts, and competitor comparisons, Cell Analytics provides a comprehensive platform for mobile network operators to understand their networks and identify the areas that need improvement.

Downdetector Enterprise™ is the leading network outage monitoring tool

DD-dashboard
Network outages can be costly and time consuming to fix. Hundreds of millions of users worldwide use Downdetector to report issues with their mobile network operators, ISPs, communication apps and other online services. Downdetector Enterprise uses this consumer-reported information to provide early alerting on service issues — often before internal monitoring tools detect a problem is even happening. With customizable alerts for your NOC and SOC teams, Downdetector makes sure you get information about critical incidents as soon as customers start to report an issue. Geolocation information provides insights into exactly where customers are experiencing network problems, and problem indicators let you know which aspects of your service (e.g., voice calls, text messaging, mobile billing app) are causing issues.

SpatialBuzz is the next frontier of customer engagement

ookla_spatialbuzz-1_0621-2
Ookla has provided you with the tools to benchmark your network and customer satisfaction with Speedtest Intelligence, map and optimize your network with Cell Analytics and quickly identify network issues with Downdector. Now, we also offer a tool that marries the best of our offerings and directly connects you to your customers to deepen their network experience through more transparent, frictionless customer communication via existing web and mobile apps, AND provides the real-world data you need to prioritize network improvements by utilizing real-time customer experience data.

SpatialBuzz gives you the tools to engage directly with your customers, prioritize issues with your network using consumer-initiated data and increase your customer satisfaction by closing the loop on issues they encounter. SpatialBuzz is a one-stop solution that helps you deliver the best customer experience possible, even during outages or service issues.

spatialbuzz-1

Think of your network like this: You wouldn’t invest millions opening a world-class restaurant with the best chefs making the best foods and not staff it with waiters to make sure diners have an incredible experience or correct issues with the food, right? Unfortunately, many network providers have overlooked meaningful customer engagement on their digital transformation journeys. SpatialBuzz gives customers a better channel to communicate back to your network team, which allows you to provide world-class service. Customers want to check their network, find out about improvements, report problems with minimum fuss and see you working for them. To love you, they have to love the network. That’s where SpatialBuzz comes in.

spatialbuzz-2

SpatialBuzz aligns Digital, Customer Care, Service Operations and Network Teams to deliver an excellent customer experience. SpatialBuzz also empowers customers to report issues and check network coverage and status — seamlessly integrated into existing iOS, Android or web apps. It connects agents with coverage maps and data about network statuses, and SpatialBuzz can even automate network messages about known problems in geospatial locations. SpatiaBuzz also helps network and operations teams prioritize issues by customer impact; data shows that 2-3% of network faults create 80% of significant customer dissatisfaction. SpatialBuzz lets you proactively respond to these customers, seamlessly engages them and their issues and prioritizes your network response which saves time and money you might otherwise be spending elsewhere.

ookla_spatialbuzz-2_0621

Companies that have deployed SpatialBuzz have experienced, on average:

  • 40% reductions in customer calls
  • 15% faster call resolution
  • 80% lift in digital engagement
  • 1-9 hours earlier problem detection
  • Millions of dollars in cost savings
  • Improved customer loyalty with timely, proactive and transparent communications
  • Better problem prioritization
  • Bridged organizational gaps between customer care and network engineering teams

SpatialBuzz is the next frontier in creating a better network experience for your customers. When customers feel like they are being heard, seeing problems being fixed and are part of the closing the loop on issues, they will be more satisfied with your network offerings and they will help drive your company’s sustained revenue. SpatialBuzz is here to help you bolster your bottom line, so please don’t hesitate to reach out today and learn more.

Leading network operators are the ones that successfully engage their customers about their network

Ookla can provide you with all the tools you need to improve your network, pinpoint issues and increase customer satisfaction. We’re thrilled to offer you a suite of tools that holistically improves your network — and we’re thrilled to help you close the network–customer experience gap with SpatialBuzz.

If you’re interested in learning more about SpatialBuzz or any of Ookla’s enterprise offerings, reach out to us and inquire more about what we can do to help you improve your network.

Ookla retains ownership of this article including all of the intellectual property rights, data, content graphs and analysis. This article may not be quoted, reproduced, distributed or published for any commercial purpose without prior consent. Members of the press and others using the findings in this article for non-commercial purposes are welcome to publicly share and link to report information with attribution to Ookla.

| October 15, 2021

How Banks and Financial Services Companies can Detect Outages Faster [Webinar]

The shift from in-person to online banking has been under way for years, but the pandemic has cemented digital banking as the new normal for most consumers. As a result, it’s critical to effectively communicate and resolve issues when customers experience a disruption in your service. Diagnosing the issue and detecting problems with external services can be challenging for technical operations and IT management teams — especially when internal monitoring tools don’t detect any problems. That’s where Downdetector® comes in.

Over 25 million consumers report problems each month with online banking, financial services companies, internet service providers and other websites and services. Downdetector can alert you when customers are reporting issues with your services — often long before internal monitoring tools send out the alarm. By monitoring your company, external services like content delivery networks (CDNs) and web hosting platforms, internal productivity tools and your customers’ sentiment surrounding emergent problems, your team can troubleshoot issues faster, decrease mean time to recovery (MTTR) and provide your customers with better, more contextual support.

The upcoming Downdetector webinar on Oct. 28 will show you how some of the world’s leading banks and financial service providers are using Downdetector Enterprise to detect and resolve issues faster, as well as manage the customer experience during an issue.

Read on to discover three ways Downdetector Enterprise can help banks and financial service providers detect issues faster and improve the customer experience during an incident.


Conduct competitive benchmarking and monitor external services your company relies on

After an incident occurs, business intelligence and incident management teams are often pressed to answer the questions: “Did our competitors experience similar problems?” and “Was the issue a problem with our services or an external service our company relies on, such as a downstream payment processor?”

Downdetector Enterprise makes it easy for teams to answer these questions with competitive intelligence and analysis of the services your company relies on.

downdetector_enterprise_compare_1021

Teams can get visibility into competitors’ problem reports on Downdetector, which offers quick insight into whether or not competitors are facing similar issues. If internal monitoring tools aren’t indicating that there’s an issue, this view can also help you diagnose if an external service, such as a CDN, is experiencing similar patterns in elevated problem reports, you can infer that it might be an issue with the CDN impacting customers.

Access real-time and historical data to validate internal monitoring

Banks and financial service companies often look to Downdetector’s real-time and historical data to validate whether findings in internal monitoring tools have impacted customer experience — or fill in the gaps when internal monitoring tools don’t detect a known problem.

For example, during the Facebook outage Oct. 4, 2021, a Fortune 500 bank turned to Downdetector Enterprise when problem reports escalated — but their internal monitoring systems hadn’t detected any problems. They were able to use data from Downdetector Enterprise to see that Facebook was experiencing issues. From there, they were able to determine that problem reports weren’t due to an internal problem, and then communicate to their customer base that issues were likely related to Facebook’s outage.

downdetector_enterprise_reports-over-time-historical_1021

However, if the incident is determined to be internal, business intelligence teams can use Downdetector Enterprise to analyze historical outage information to spot any patterns. Historical data can also be used for reporting and compliance purposes, such as communication with a regulatory body after customers have reported an incident. The Downdetector API makes it easy to integrate and surface this data directly in your existing tools.

Directly communicate with customers who report an issue on Downdetector

Companies that don’t provide timely, contextual communication during an incident are likely to see dissatisfied customers flooding social media and customer support channels looking for answers. Downdetector allows companies to provide direct communication to customers reporting issues with specific aspects of your service, such as mobile banking or payments.

downdetector_enterprise_communicate_1021

This additional communication channel is available even if your website or other services go down — and typically helps lower call center and digital support ticket volume.

Ready to see how leading U.S. and European banks have improved their incident management and customer experience using customer-reported data? Join the upcoming webinar; all registrants will receive a link to the recorded presentation.


Ookla retains ownership of this article including all of the intellectual property rights, data, content graphs and analysis. This article may not be quoted, reproduced, distributed or published for any commercial purpose without prior consent. Members of the press and others using the findings in this article for non-commercial purposes are welcome to publicly share and link to report information with attribution to Ookla.

| November 5, 2020

Unable to Connect — The Most Significant Online Service Outages in Q3 2020

“Is it down?” frustrated users asked themselves during the multiple online service outages in Q3 2020. The fourth installment of our online service outage tracking series used Downdetector® data from Q3 2020 and focused on the following online service categories: cloud services, collaboration platforms, financial services, gaming, internet service providers and social media.

Cloud services

Cloudflare (July 17, 2020): 14,198 reports at peak

Downdetector_Cloudflare_Outage_1020

On July 17, a major disruption in Cloudflare’s service broke the internet, taking multiple online services down with it. Users rushed to Downdetector to log issues with multiple services that rely on Cloudflare for content delivery, including 4chan, DoorDash and Zendesk. At the peak of the outage, there were 14,198 reports of issues with the service in the U.S.

Azure (September 28, 2020): 2,846 reports at peak

Azure, Microsoft’s cloud service, was affected by September 28’s Microsoft-wide outage (see next category). Users from Germany, India, Japan and the U.S. stated they had issues with the cloud service. That day, there were 2,846 reports of issues at the peak of the outage in the U.S.

Collaboration platforms

Office 365 (September 28,2020): 20,437 reports at peak

Downdetector_Office365_Outage_1020

Microsoft’s suite of online collaboration services including Outlook, Sharepoint, OneDrive and Skype went down on September 28 (along with Azure, see above). Logs of issues with the services started coming into Downdetector at 3 p.m Pacific. Most users stated being unable to log in or connect to the server. At the peak, there were 20,437 reported issues in the U.S. Users from Japan and India also logged problems with the service that day.

Zoom (August 24, 2020): 17,874 reports at peak

On August 24, users were upset to find that they were unable to connect with their coworkers, friends and family through Zoom. Most users stated problems with logging in and joining a conference. There were 17,874 reports of issues in the U.S. at the peak of the outage. Users in the U.K. and Canada also had issues with the video conferencing service that day.

Google Drive (September 24, 2020): 14,715 reports at peak

Users in the U.S., Philippines and Indonesia were unable to collaborate on projects, upload files or access their documents stored in Google Drive on September 24. At the peak of the outage in the U.S., there were 14,715 reported issues. Users of Google products YouTube and Gmail also logged issues in Brazil, Germany, India, Japan, Mexico and the U.K.

Slack (September 29, 2020): 1,396 reports at peak

Slack received 1,396 logs of issues at the peak of the outage reports on September 29. Users in the U.S. had problems with sending messages, videos and images to their peers — and some were unable to connect to the platform at all.

Financial services

TD Ameritrade (August 18, 2020): 7,814 reports at peak

Downdetector_TD-Ameritrade_Outage_1020

The online stock investment tool reportedly went down on August 18. Users were unable to log into their account or buy and sell stocks. At the peak of the outage, there were 7,814 reports of issues in the U.S. There were two other notable outages that month — August 17 with 5,816 reports at peak and August 31 with 6,893 reports at peak.

Gaming

Steam (August 5, 2020): 69,255 reports at peak

Downdetector_Steam_Outage_1020

Users from Brazil, Germany, Japan, the U.K and the U.S. submitted issues with Steam on August 5. Most users stated problems when trying to log into the platform and play with other users. At the peak of the outage in the U.S, there were 69,255 reports of issues with the gaming platform.

Fall Guys (September 2, 2020): 2,890 reports at peak

The Fall Guys status page on Downdetector showed there were problems with the popular online game on September 2. Users in Brazil, the U.K. and the U.S. were struggling to play the game online. That day, 97% of reports stated problems with the server connection.

Internet service providers

Spectrum (July 29, 2020): 56,318 reports at peak

Downdetector_Spectrum_Outage_1020

Spectrum users from the both coasts of the United States flooded Downdetector with logs of issues with the service when they started experiencing problems with their internet connections. Complaints with the service started surging at around 5 p.m. Pacific and lasted for about an hour. At the peak of the outage there were 56,318 reports of issues.

CenturyLink (August 30, 2020): 11,543 reports at peak

CenturyLink customers on the East Coast of the U.S. had problems with their internet service on August 30 starting around 2 a.m. Pacific and ending around 8 a.m. Pacific. There were 11,543 reports of issues at the peak of the outage.

Social Media

WhatsApp (July 14, 2020): 148,573 reports at peak

Downdetector_WhatsApp_Outage_1020-1

A multi-country outage affected WhatsApp on July 14. Users from all over the world stated problems with sending and receiving messages on the Facebook-owned app. The country with the most issues submitted was Germany with 148,573 reports of issues at the peak of the outage. Users in Brazil, India, the Netherlands, Mexico, Spain and the U.K. were also affected by the outage.

Facebook (September 17, 2020): 30,918 reports at peak

Facebook users from multiple countries experienced problems with the social media platform on September 17. More than half of the logs were labeled as “total blackout” — users were unable to access the platform or any of its features. There were 30,918 reports of issues at the peak of the outage in the U.S. Users in Italy, Poland and the U.K. also had problems with Facebook that day.

Want to know when an online service is down? Keep up with outages by visiting Downdetector.

Ookla retains ownership of this article including all of the intellectual property rights, data, content graphs and analysis. This article may not be quoted, reproduced, distributed or published for any commercial purpose without prior consent. Members of the press and others using the findings in this article for non-commercial purposes are welcome to publicly share and link to report information with attribution to Ookla.

| March 25, 2020

How to Use Downdetector to Report and Understand the Scale of an Outage

We’ve all been there — refreshing a page, closing and re-opening a program, checking our internet connection hoping the online service we’re using isn’t down. Before checking Twitter for a “#down” to see if it’s just you, know that you can turn to Downdetector® for a reliable and up-to-date assessment of web and online service outages. Downdetector tracks outages based on consumer feedback and can save you precious time when trying to verify a site’s status.

If you’ve ever typed “Is [service] down?” into a search engine, you may be familiar with Downdetector’s status page. This article will walk you through the features of a Downdetector status page so you can quickly and easily find what you need during an outage.

Headline info: Is the site or service down and how broken is it?

Detail-Page-Top
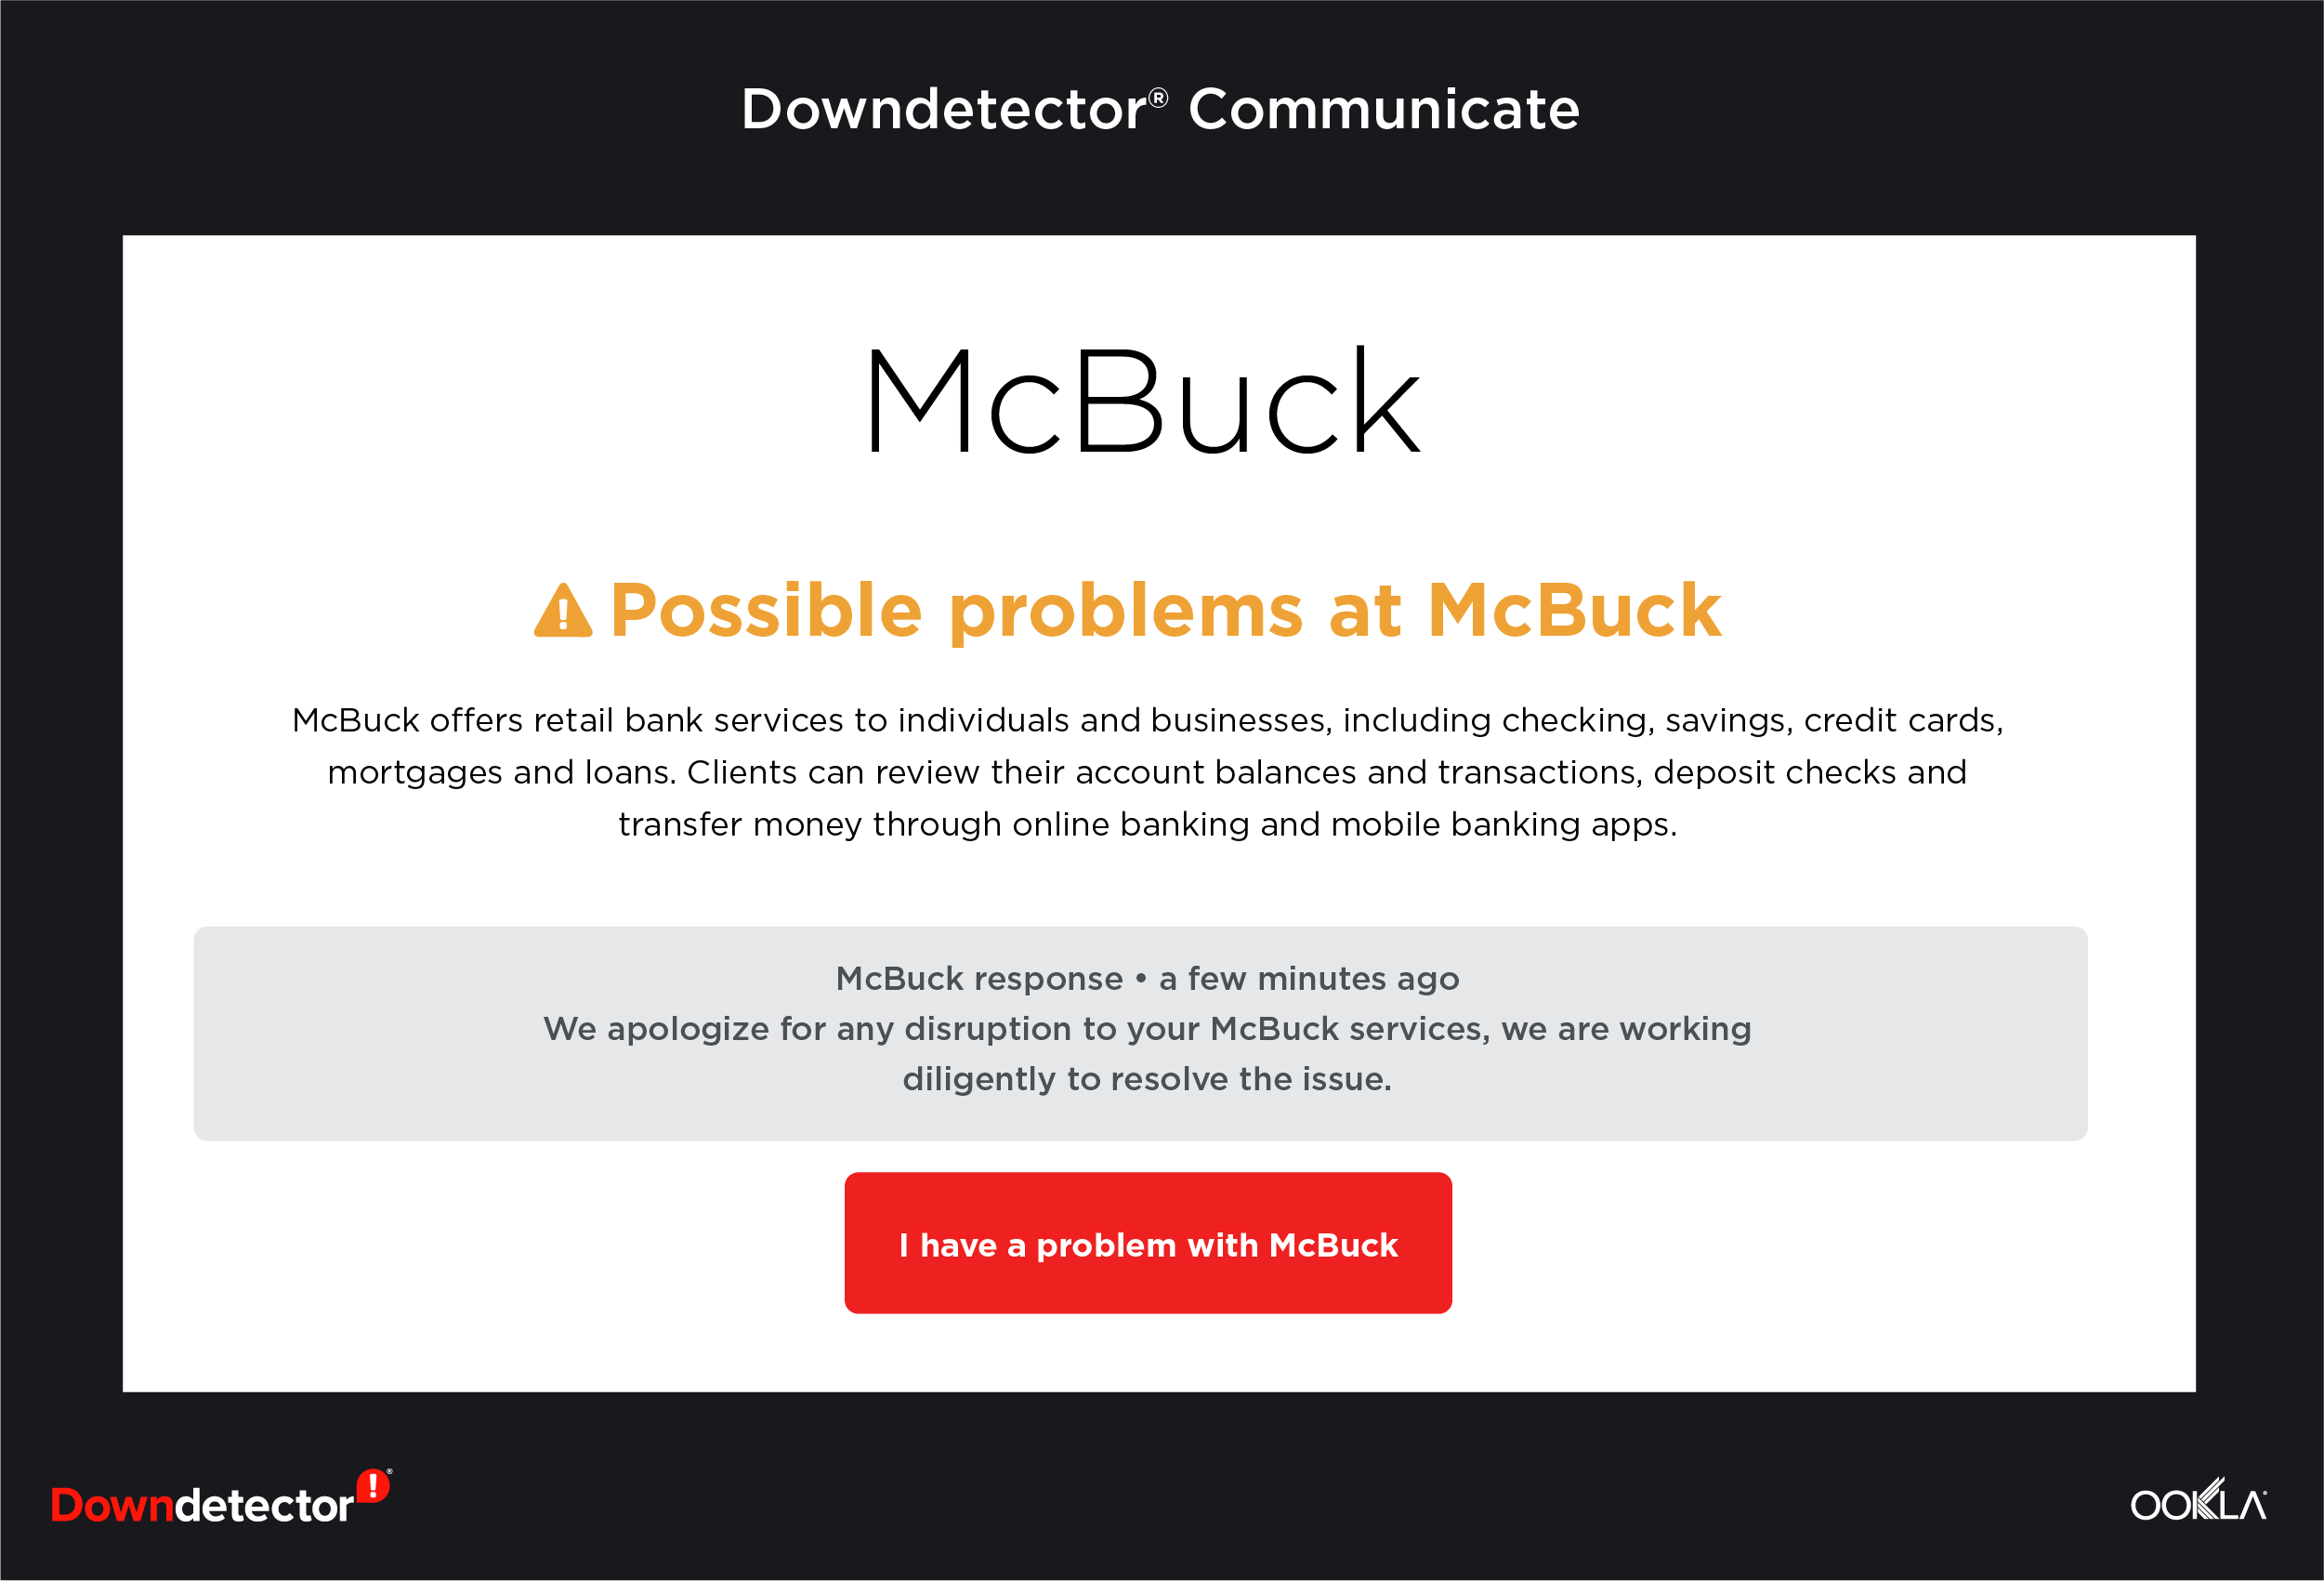
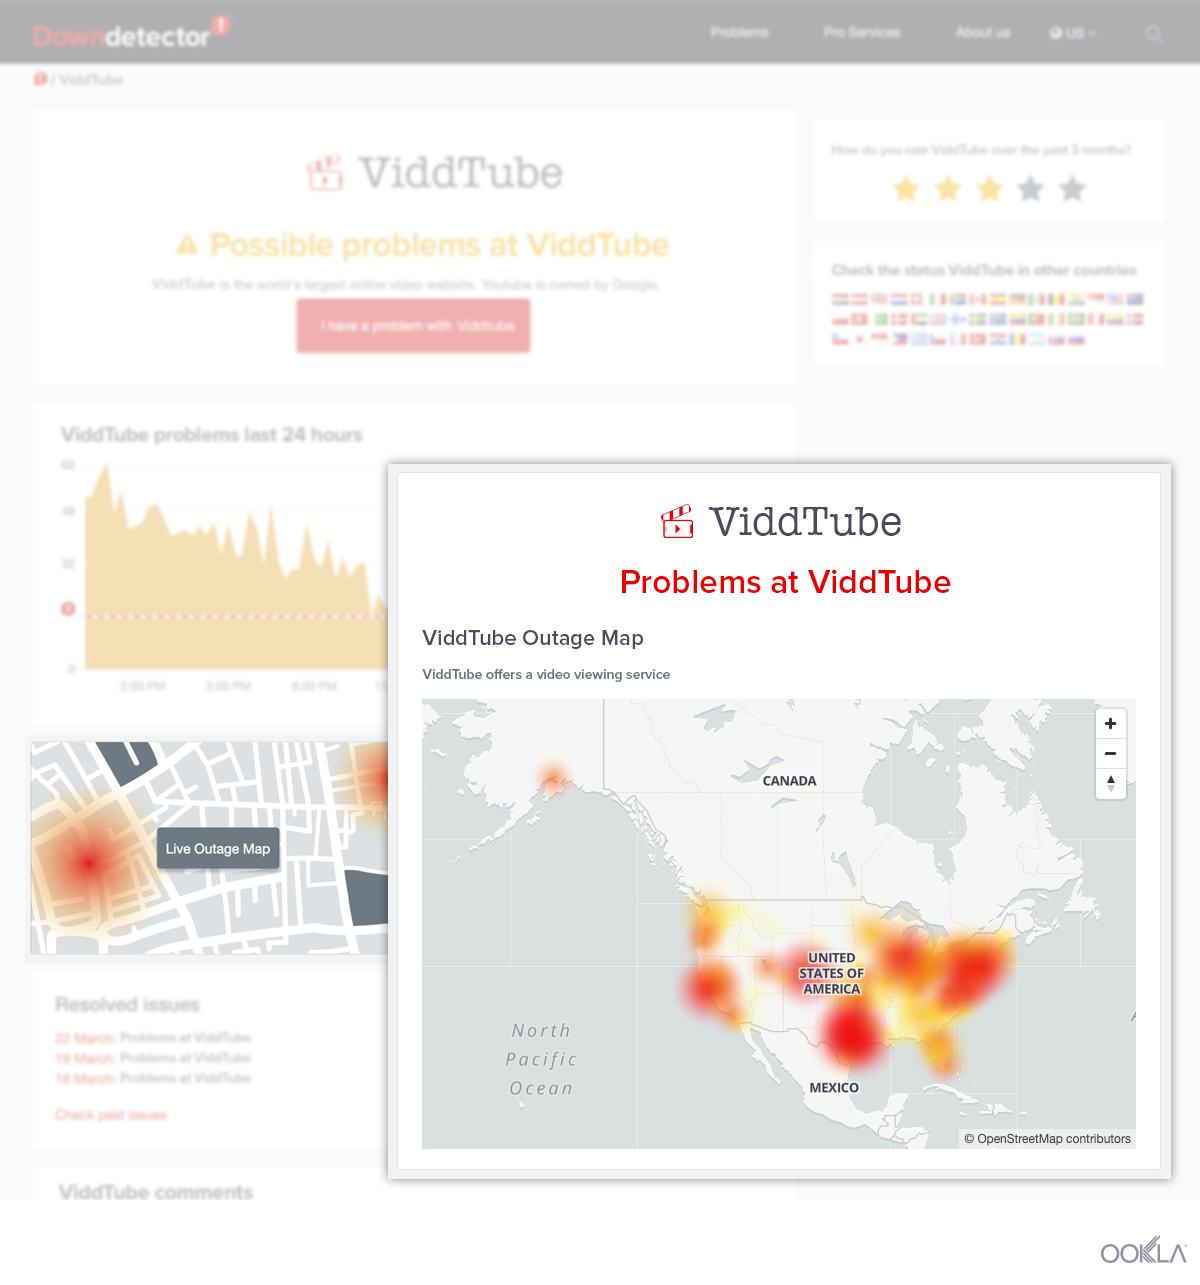
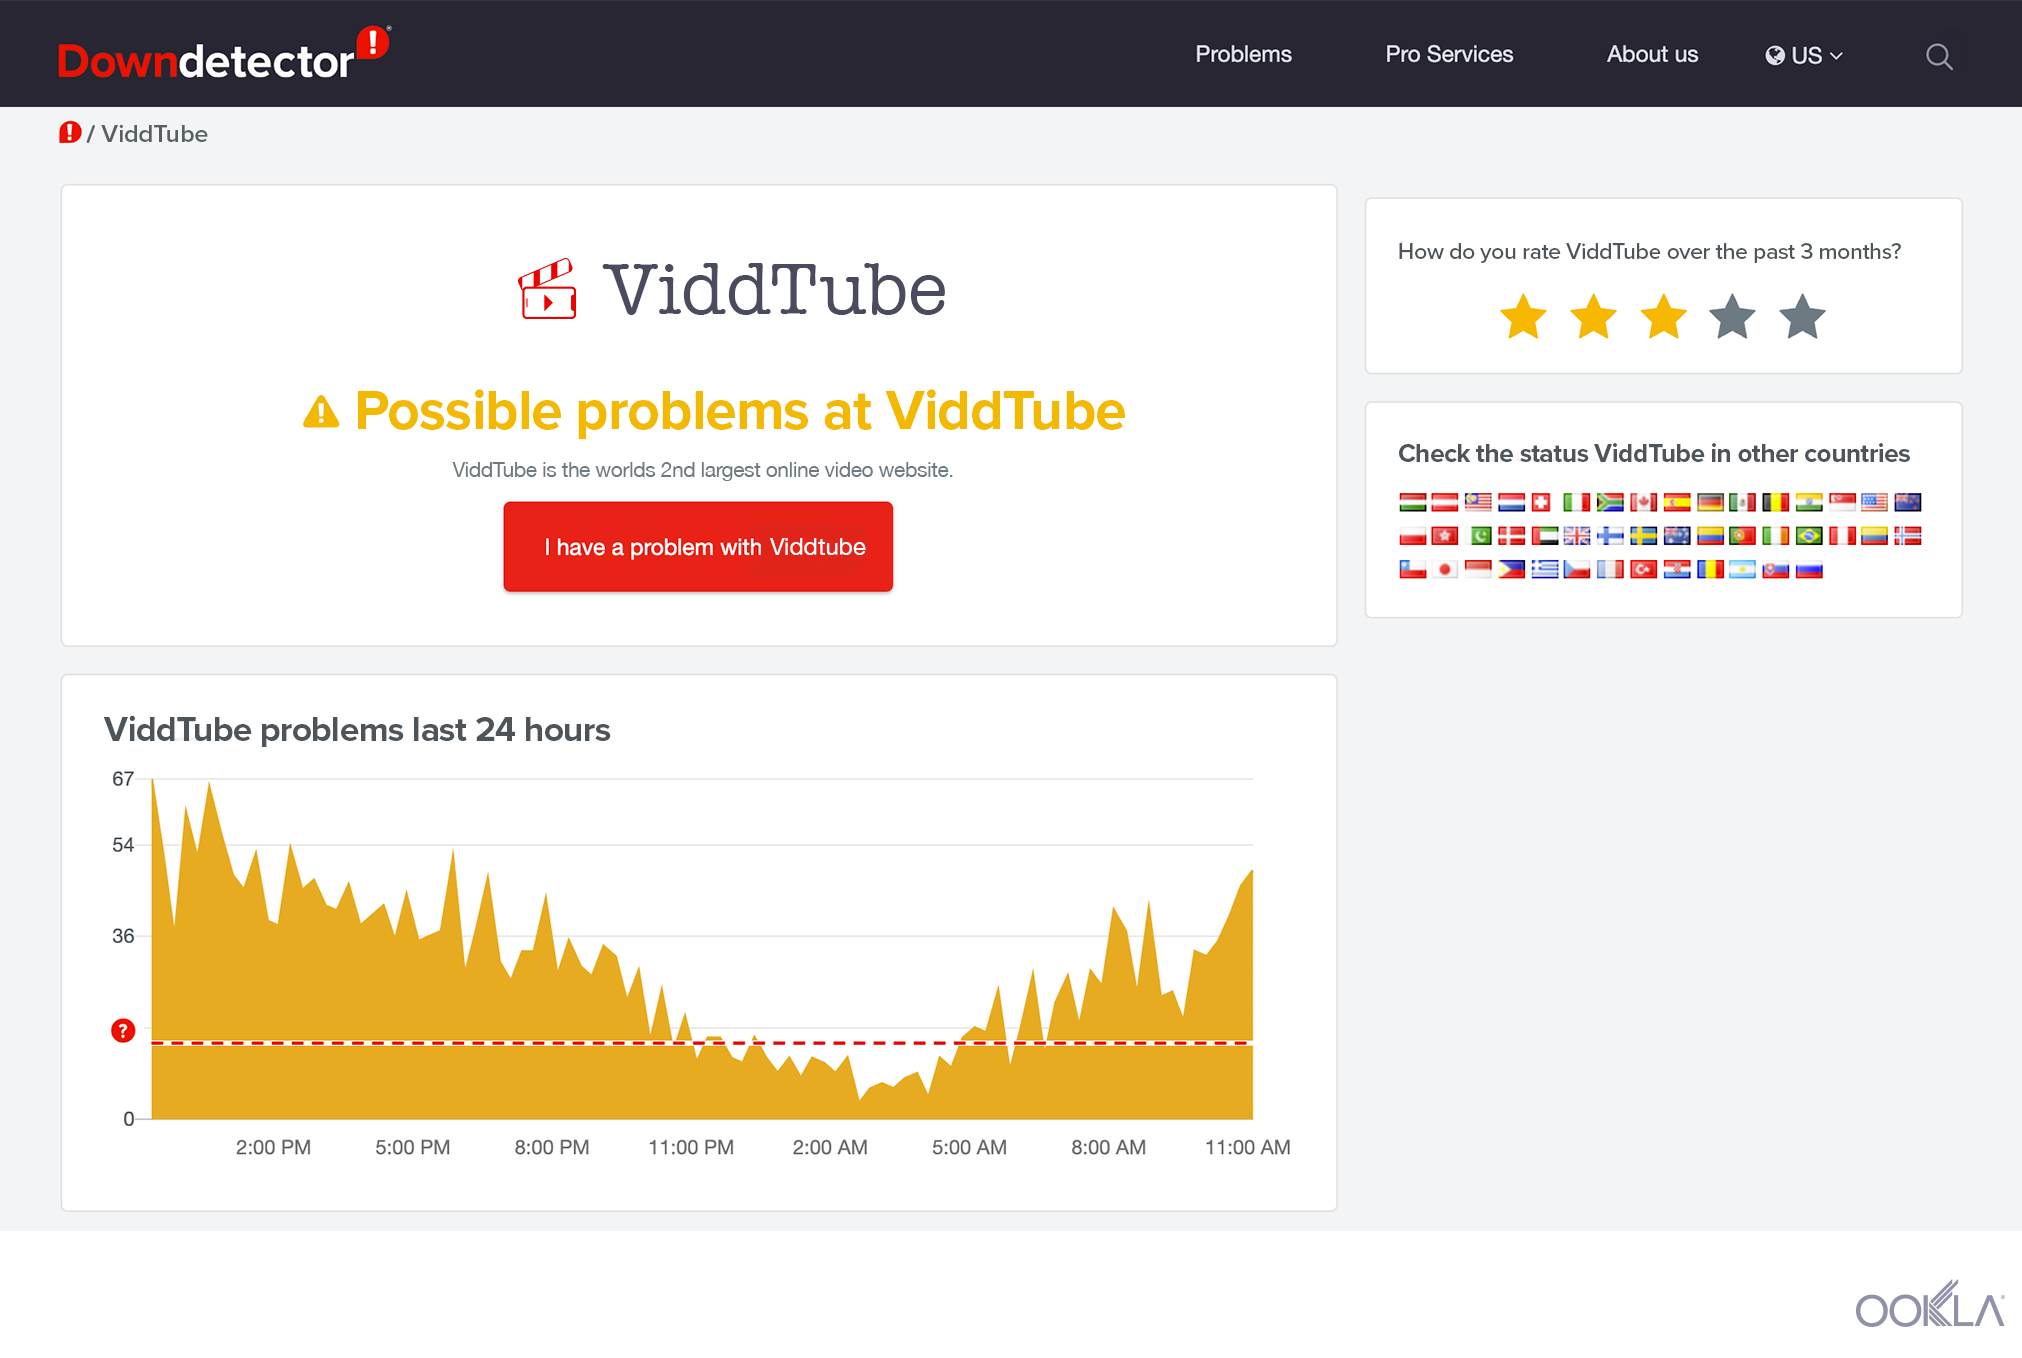
At the top of the status page, you’ll find the logo of the service and its status. There are three colors Downdetector uses to classify the status of an online service or site: blue for “No problems,” yellow for “Some problems” and red for “Problems.” Some companies’ status pages will even have a message from the service itself acknowledging that there is a problem and ensuring their customers that they are working on resolving the issue.

If you are currently experiencing problems with an online service, we encourage you to click or tap on the “I have problems with [service]” at the top of the page under the status. A window will pop up and ask you to specify what is not working. In most cases, there will be pre-selected options for you to choose from (website, logging in, etc). You also have the option of typing out the problem if it is not listed.

Under the first section, there is a graph that shows the number of outage reports in the last 24 hours for that service. If you hover over the graph, you can see how many reports were submitted at a specific time. You’ll also see if there was a peak in outage reports in the last 24 hours.

The geography of an outage

dd-outage-map

The status page also includes a link to a live outage map. When you click on the “Live Outage Map” button, you will be redirected to a map that shows where in the world problems with that service have been reported. The map will be specific to the service and will only show the areas where the service is available. This feature is useful if you’d like to find out if the outage is just where you live or if the service is down across the globe.

Find out what exactly is going wrong

reported-problems-1
Next is the “Most reported problems” section. This section helps you understand if other users are having the same problem or if there are multiple issues with the service during the outage. It’s based on consumer feedback from the window at the top of the page that asked you what problem you were experiencing.

Is it down often?

resolved-issues-1
To find out when was the last time an outage was reported, navigate to the “Resolved issues” section. The three latest outages will be listed by date. Clicking each date will take you to the status overview of the service of that day. Click “Check past issues” to see a list of reported outages from the last year.

Rate their service

rating-box-1
Next to the status of the service at the top of the page on the right sidebar, you can rate the service from 1 to 5 stars. This is also where you can find links to the online service’s official social media, status page and their website, if available.

It’s not just you! Find a community on Downdetector

Comments-1

Downdetector offers a space toward the bottom of each status page where you can interact with other users reporting outages. This Disqus comment forum is a good place to research the finer details of an outage or share your frustrations with others who are also struggling with the service. If you are using an ad-blocker, you might have to turn it off to see the comments and participate in the discussion.

For the Twitterati

dd-reports-tweets-3
We feature two important sections for those of you used to getting your information from Twitter. On the right hand side of the page, you can see the service’s official Twitter stream, if available, in case they have tweeted an ETA of when the service will be back up. And at the bottom of the status page, you’ll see a feed of tweets from users that tag the service reporting an outage.

Track outages globally

Downdetector tracks outages of online services and sites from over 45 countries. Depending on your location, Downdetector’s homepage will feature sites and online services that are available in your country. For example, Vodafone if you’re in Germany and Telmex if you’re in Mexico.

On a status page, you may change your preferred country or check the status of a service in a different country by navigating to the “Check the status of [service] in other countries” on the right side bar and click on the flag of the country you’re looking for. Once you click on one of the flags, the language of the site will change according to the country you selected.

status-box
If your browser is having problems and you can’t navigate to Downdetector.com, you can always check our Twitter account or our Facebook page for reported outages.

Outages can be disruptive and frustrating. Downdetector offers reliable data based on user reports and gives users an opportunity to connect with others experiencing the same problem to share information. Bookmark Downdetector to stay on top of outages as they’re happening.

We are always adding more services to Downdetector so you know when outages happen. Is there a site or service you’d like us to track? Send us an email at info@downdetector.com.

Ookla retains ownership of this article including all of the intellectual property rights, data, content graphs and analysis. This article may not be quoted, reproduced, distributed or published for any commercial purpose without prior consent. Members of the press and others using the findings in this article for non-commercial purposes are welcome to publicly share and link to report information with attribution to Ookla.

| March 14, 2019

Facebook Had The Largest Detected Outage In History Yesterday

If you own a Facebook, Instagram or WhatsApp account, it’s more than likely you were one of the millions of people affected yesterday by the largest global service outage we have recorded to date. Downdetector, an Ookla company, data shows this massive outage began on Wednesday, March 13th, at 8:15 AM PST (4:15 PM CET, 11:15 AM EST), when problem reports from users around the world relaying issues with all three services started pouring in. The outage lasted for nearly 12 hours before the volume of reports demonstrated a significant drop, which indicated that the outage had been mostly resolved.

“By duration, this is by far the largest outage we have seen since the launch of Downdetector in 2012,” said Tom Sanders, co-founder of Downdetector. “Our systems processed about 7.5 million problem reports from end users over the course of this incident. Never before have we seen such a large scale outage.” Downdetector is the world’s largest user centric outage detection network. Based on the automated aggregation and validation of problem reports by end users, Downdetector monitors over 5,000 services in 32 countries.

The heatmap below shows the areas where most people reported problems with Facebook over the past day and a half (12:00 AM CET 3/13 to 5:30 PM CET 3/14). Red indicates areas where Downdetctor received the largest number of reports from impacted users and little to no color indicate areas where there were very few or no reports. North America and Europe took the majority of the heat during the outage, though we also saw a significant number of reports throughout South America and the APAC region.

facebook outage map

Not only was the Facebook outage the largest to date, it far exceeds that of the second largest global outage experienced by YouTube in October 2018 with 200% more problem reports. The YouTube outage generated 2.7 million problem reports, followed by Snapchat in November 2017 with 1.8 million reports.

10 Largest Outages Recorded in Downdetector’s History
Rank Date of Outage Affected Services Downdetector Results (Millions)
1 Mar 13, 2019 Facebook, Instagram and WhatsApp 7.5
2 Oct 17, 2018 YouTube 2.7
3 Nov 6, 2017 Snapchat 1.8
4 May 3, 2017 WhatsApp 1.7
5 July 16, 2016 Pokemon Go 1.7
6 July 17, 2016 Pokemon Go 1.7
7 Nov 3, 2017 WhatsApp 1.2
8 Apr 12, 2018 Fortnite 1.0
9 Nov 30, 2017 WhatsApp 1.0
10 Oct 21, 2016 PlayStation Network 1.0

While consumers become more reliant on digital services like Facebook, Instagram and WhatsApp, we are witnessing a growing number of problems reported during outages. In a world where positive online experience (and fast internet speed) is highly valued, consumers have less tolerance for downtime and increased expectation for services to operate flawlessly at all times. This presents companies like Facebook with the challenge of not only providing consistent service, but also with quickly identifying and solving the root cause of issues that may arise to limit the time period when users are affected.

See the Facebook outage data for yourself at Downdetector’s Facebook status monitoring page.

Ookla retains ownership of this article including all of the intellectual property rights, data, content graphs and analysis. This article may not be quoted, reproduced, distributed or published for any commercial purpose without prior consent. Members of the press and others using the findings in this article for non-commercial purposes are welcome to publicly share and link to report information with attribution to Ookla.

| June 3, 2019

Too Big to Fail? Downdetector Shows a Tidal Wave of Outages When Popular Cloud Services Go Down

The rise and consolidation of cloud services is increasing the internet’s dependence on a few key service providers. Yesterday Downdetector™, an Ookla company, showed a major outage to Google and Google properties including YouTube, Gmail, Google Drive, the Google Play store, Google Hangouts, Nest and Google Cloud began on June 2, 2019 at 10:49 AM EDT (6:49 PM UTC). Overall we saw 463,054 reports for that list of services alone. The outage duration varied by service, lasting for one hour and 50 minutes on YouTube and about the same amount of time on Google Cloud before the volume dropped significantly, indicating that the outage had been mostly resolved.

google-properties-3

The fact that other web services that use Google Cloud, including Snapchat (1,967,700 Downdetector reports), Crunchyroll (72,690 reports), Discord (30,914 reports) and Vimeo (11,645 reports), were also affected points to a much bigger issue. The promise of Google Cloud was an increase in overall stability because cloud services are supposed to be best in class. Instead, we have created a few core cloud services that can bring down large portions of the internet. The recent failures of Facebook and Google Cloud have illustrated that these services have become “too big to fail.” When they do fail, it’s important to the internet as a whole that these services get back online as soon as possible.

Downdetector helps Ookla with outages

Of course, the last thing we want is to see a spike in outage reports for Speedtest on Downdetector, but it happens. When it does, as it did this morning, Downdetector plays a critical role in helping us reduce downtime by providing data on regions and services affected that can point to a root cause. Downdetector is also a place where we can communicate directly with consumers to let them know that we’ve seen the outage and our engineering team is on top of resolving it as soon as possible. This saves our customers frustration and it saves us money in support costs.

Learn more about how Downdetector can help you.

Ookla retains ownership of this article including all of the intellectual property rights, data, content graphs and analysis. This article may not be quoted, reproduced, distributed or published for any commercial purpose without prior consent. Members of the press and others using the findings in this article for non-commercial purposes are welcome to publicly share and link to report information with attribution to Ookla.

| March 2, 2020

Major Outages Seen in Financial Services Companies

The financial markets have had a very challenging week with various news headlines driving major drops to stock exchanges across the globe. Consumers who manage their own investments faced an additional frustration today as financial sites including TD Ameritrade, Robinhood and E*Trade showed major outages according to Downdetector.

Downdetector_Outage_E-trade_TD-Ameritrade_Robinhood_march1-2

TD Ameritrade had an initial spike on March 1 and a recurrence of outage reports early in the day on March 2 when all three companies showed problems right around the time of the NYSE’s opening bell. Robinhood showed the largest number of outages by far and the most consistent duration of reports. E*Trade showed a spike in problems early with a decline in reports as the morning wore on. TD Ameritrade had two peaks in outage reports very close together early on March 2 then appeared to recover partially just before a third spike. At this writing, Robinhood is continuing to show major outage reports.

Downdetector data can help your team resolve service issues faster and improve customer experience when an outage occurs, which becomes all the more important during periods of high usage. Contact us here to learn how your network operations center can get faster outage detection.

Ookla retains ownership of this article including all of the intellectual property rights, data, content graphs and analysis. This article may not be quoted, reproduced, distributed or published for any commercial purpose without prior consent. Members of the press and others using the findings in this article for non-commercial purposes are welcome to publicly share and link to report information with attribution to Ookla.

| June 16, 2020

June is Already a Tough Month for International Mobile Operators

On June 15, Downdetector® received numerous reports that T-Mobile was down in the United States. The peak of the outage reports on that day came in around 12:00 pm, PST. There were 113,980 reports during that peak. Soon after, users began reporting issues with AT&T and Verizon (and other smaller operators) as well, though in much smaller numbers (3,861 and 8,619 reports, respectively, at around 1:30 pm, PST).
Downdetector_Outage_T-mobile_effects_0620-2

The relative volume of reports by other operators shown in this chart suggests that, while the major outage was on T-Mobile’s network, customers of other operators may also have been impacted when they tried to contact T-Mobile customers and encountered errors. While we cannot definitively identify the root causes of yesterday’s issues reported by customers of all major U.S. mobile operators, it is valuable for operators to know when their customers are experiencing connectivity difficulties so they can respond appropriately. Even if the root issue does not exist within their network. Access to detailed information about all the outages in a particular ecosystem, as provided on Downdetector, can help consumers and customer support providers focus on where the actual problem lies.

We saw a similar effect in the United Kingdom on June 9 when Vodafone suffered an outage. Downdetector data indicated 9,686 reports from users during the peak at 4:45 GMT. At around the same time, EE users submitted 411 reports to Downdetector while we saw 519 reports from O2 customers and 322 reports from customers of Three in separate spikes throughout the same day.
Downdetector_Outage_Vodafone_effects_0620-1

This is a good reminder that if you’re encountering difficulty in connecting with your mobile operator, it’s worth checking Downdetector as well as trying other online services and apps to see where the real outage lies.

Ookla retains ownership of this article including all of the intellectual property rights, data, content graphs and analysis. This article may not be quoted, reproduced, distributed or published for any commercial purpose without prior consent. Members of the press and others using the findings in this article for non-commercial purposes are welcome to publicly share and link to report information with attribution to Ookla.

| July 17, 2020

Cloudflare Outage Takes Out the Internet

Users in the United States and Europe experienced what appeared to be an internet outage on Friday afternoon, Pacific Daylight Time. What turned out to be an issue at Cloudflare took down a large number of websites and online services across the internet. Downdetector® was also briefly impacted by Cloudfare’s outage, during which time users in the U.S. and Europe were unable to reach the site. Users reported having issues with the following:

  • 4chan
  • Amazon
  • Amazon Web Services
  • Arlo
  • AT&T
  • Bandwidth
  • Canva
  • Cash App
  • CenturyLink
  • Chime
  • Cloudflare
  • Coinbase
  • Comcast
  • Cox
  • Crunchyroll
  • Destiny
  • Discord
  • Doordash
  • Escape from Tarkov
  • Facebook
  • Frontier
  • Gmail
  • Google
  • Google Cloud
  • Grindr
  • Grubhub
  • League of Legends
  • Minecraft
  • Optimum / Cablevision
  • Path of Exile
  • Patreon
  • Peloton
  • Playstation Network
  • PlentyOfFish
  • Plex
  • Postmates
  • Quizlet
  • RCN
  • Reddit
  • Roblox
  • Shopify
  • Sling
  • Spectrum
  • Spotify
  • Sprint
  • Steam
  • Streamlabs
  • Suddenlink
  • T-Mobile
  • Twitch
  • Twitter
  • Uber Eats
  • Udemy
  • Valorant
  • Venmo
  • Verizon
  • Wattpad
  • Wave Broadband
  • Webs
  • WOW
  • WP Engine
  • Xbox Live
  • Youtube
  • Zendesk
  • Zoom

Cloudflare is a content delivery network (CDN) that is relied upon by many industry leaders to deliver portions of their websites. That means when Cloudflare goes down, even briefly as we saw today, large sections of the internet are affected.

Ookla retains ownership of this article including all of the intellectual property rights, data, content graphs and analysis. This article may not be quoted, reproduced, distributed or published for any commercial purpose without prior consent. Members of the press and others using the findings in this article for non-commercial purposes are welcome to publicly share and link to report information with attribution to Ookla.