| February 19, 2020

Why Europe Needs a New Competition Paradigm for the 5G Era (co-published with GSMA Intelligence)

This article is being co-published with GSMA Intelligence. As the exclusive global network performance data provider to the intelligence unit of the mobile industry trade group GSMA, Ookla® supports their extensive efforts to provide data-driven insights and context on the state of the mobile industry around the world. Speedtest® data is leveraged by GSMA Intelligence analysts and experts on an ongoing basis, including within the recent "Mobile Market Structure and Performance in Europe" report.

The mobile market in Europe has come to the end of its main phase of investments in fourth generation (4G) mobile networks and operators are now turning their attention to 5G. Services have already been launched in Switzerland and the UK, and more markets expected to launch in 2020, for example Germany and France.

Despite these positive steps, industry analysts do not expect a rapid roll-out of 5G in Europe. On the contrary, most expect 5G deployments in European markets to lag behind countries such as the US, China, Korea and Japan. The reason is that delivering 5G services will require large additional investments, and these will be a lot harder to justify in European markets that have recently delivered lower profit margins than in other parts of the world.

With this largely subdued investment climate, what can be done so that Europe doesn’t lose out on the 5G opportunity? One thing that could change this is competition dynamics. More concentrated market structures (for example with less players) can deliver economies of scale, a more efficient utilization of assets (such as sites and spectrum), and also enable large investments in 5G networks. However, concentrated markets can also raise flags with regulatory and competition authorities that may be concerned about consumer prices being higher.

Understanding the relationship between market structure and the quality, innovation and prices that consumers can expect is therefore crucial. A strong debate exists about the competition dynamics that will deliver best value for consumers in the 5G era. As arguments can be made in both directions, it is important to look at data from the recent past to help draw some lessons that can inform decisions going forward.

This is precisely what GSMA Intelligence did. In a recent study, they evaluate how market structures impacted consumers during the 4G era in Europe. They looked at data covering the period from 2011 to 2018, for 29 European countries. They combined coverage and other publicly available data from operators with network-quality measurement data from Ookla®, a global leader in mobile and broadband network intelligence, testing applications and technology.

Overall, the 4G era was a positive and expansive one for European mobile consumers everywhere. Already by 2016, 90% of consumers were covered by 4G networks. Since then, operators have delivered greater speeds and lower latencies (signal delay), resulting in a far superior consumer experience today. Download speeds increased on average from 2 Mbps in 2011 to 37 Mbps in 2018. The average price per MB also dropped sharply as mobile data became cheaper and users consumed ever-increasing volumes of data, with average monthly data usage increasing more than twelve-fold.

But while all European consumers experienced improvements during the 4G era, the study shows that European mobile users in three-player markets benefited the most from higher quality and innovation.

By the end of 2018, three-player markets were outperforming four-player markets by 4.5 Mbps in download speeds, and over half of that difference (around 3.5 Mbps) can be attributed to the role of market structure in three-player markets. In particular, operators in more concentrated markets were able to utilize assets more efficiently (especially spectrum) and generate higher returns that allowed them to invest more in their networks. This is an important insight when considering the best ways to unlock the full potential of 5G networks, including advanced applications that require very low latencies, high speeds and plenty of network capacity.

Did this come at the expense of higher prices? On the basis of the pricing data that GSMA Intelligence was able to analyse, it did not. In addition to general improvements in performance, prices also decreased across Europe in the 4G era, indicating more efficiency and better value for consumers over time. Implicit unit prices (i.e. revenue per MB and revenue per user) decreased similarly in both three- and four-player markets.

In other words, during the 4G era, a European consumer in a three-player market experienced on average a better quality mobile broadband service while paying similar prices per MB of data to a consumer in a four-player market.

Does this therefore mean that more consolidation in European markets is the only solution to deliver the right investments for 5G? Not necessarily.
An option that is often touted as an alternative to full consolidation is increased network sharing. GSMA Intelligence’s analysis showed that in the 4G era, progressively deeper levels of network integration delivered improved performance, although they came short of full integration in terms of network quality. Network sharing could therefore also help promote faster deployments of high-performing 5G networks in Europe over the coming years.

Ultimately, every case and country needs to be considered on the basis of its own merits and situation. What works in one country does not necessarily work in another and operator incentives and consumer attitudes to products and services will differ from market to market.

But there is one key lesson from the 4G era that does apply to all countries equally: to support the delivery of high performing 5G networks, policymakers should fully consider all aspects of consumer welfare when assessing the relative advantages of more concentrated markets in merger control, antitrust policy and spectrum management.

Read the full report here.

Ookla retains ownership of this article including all of the intellectual property rights, data, content graphs and analysis. This article may not be quoted, reproduced, distributed or published for any commercial purpose without prior consent. Members of the press and others using the findings in this article for non-commercial purposes are welcome to publicly share and link to report information with attribution to Ookla.


| October 1, 2019

How 5G is Changing the Global Mobile Landscape

Five months ago, we started using the Ookla 5G MapTM to track 5G across the world. In the months since, 5G deployments have increased exponentially — where we saw 294 around the world in May, today there are more than that in Switzerland alone. Today we’re exploring where 5G is gaining the most traction, including an analysis of how much faster 5G is than 4G in various markets.

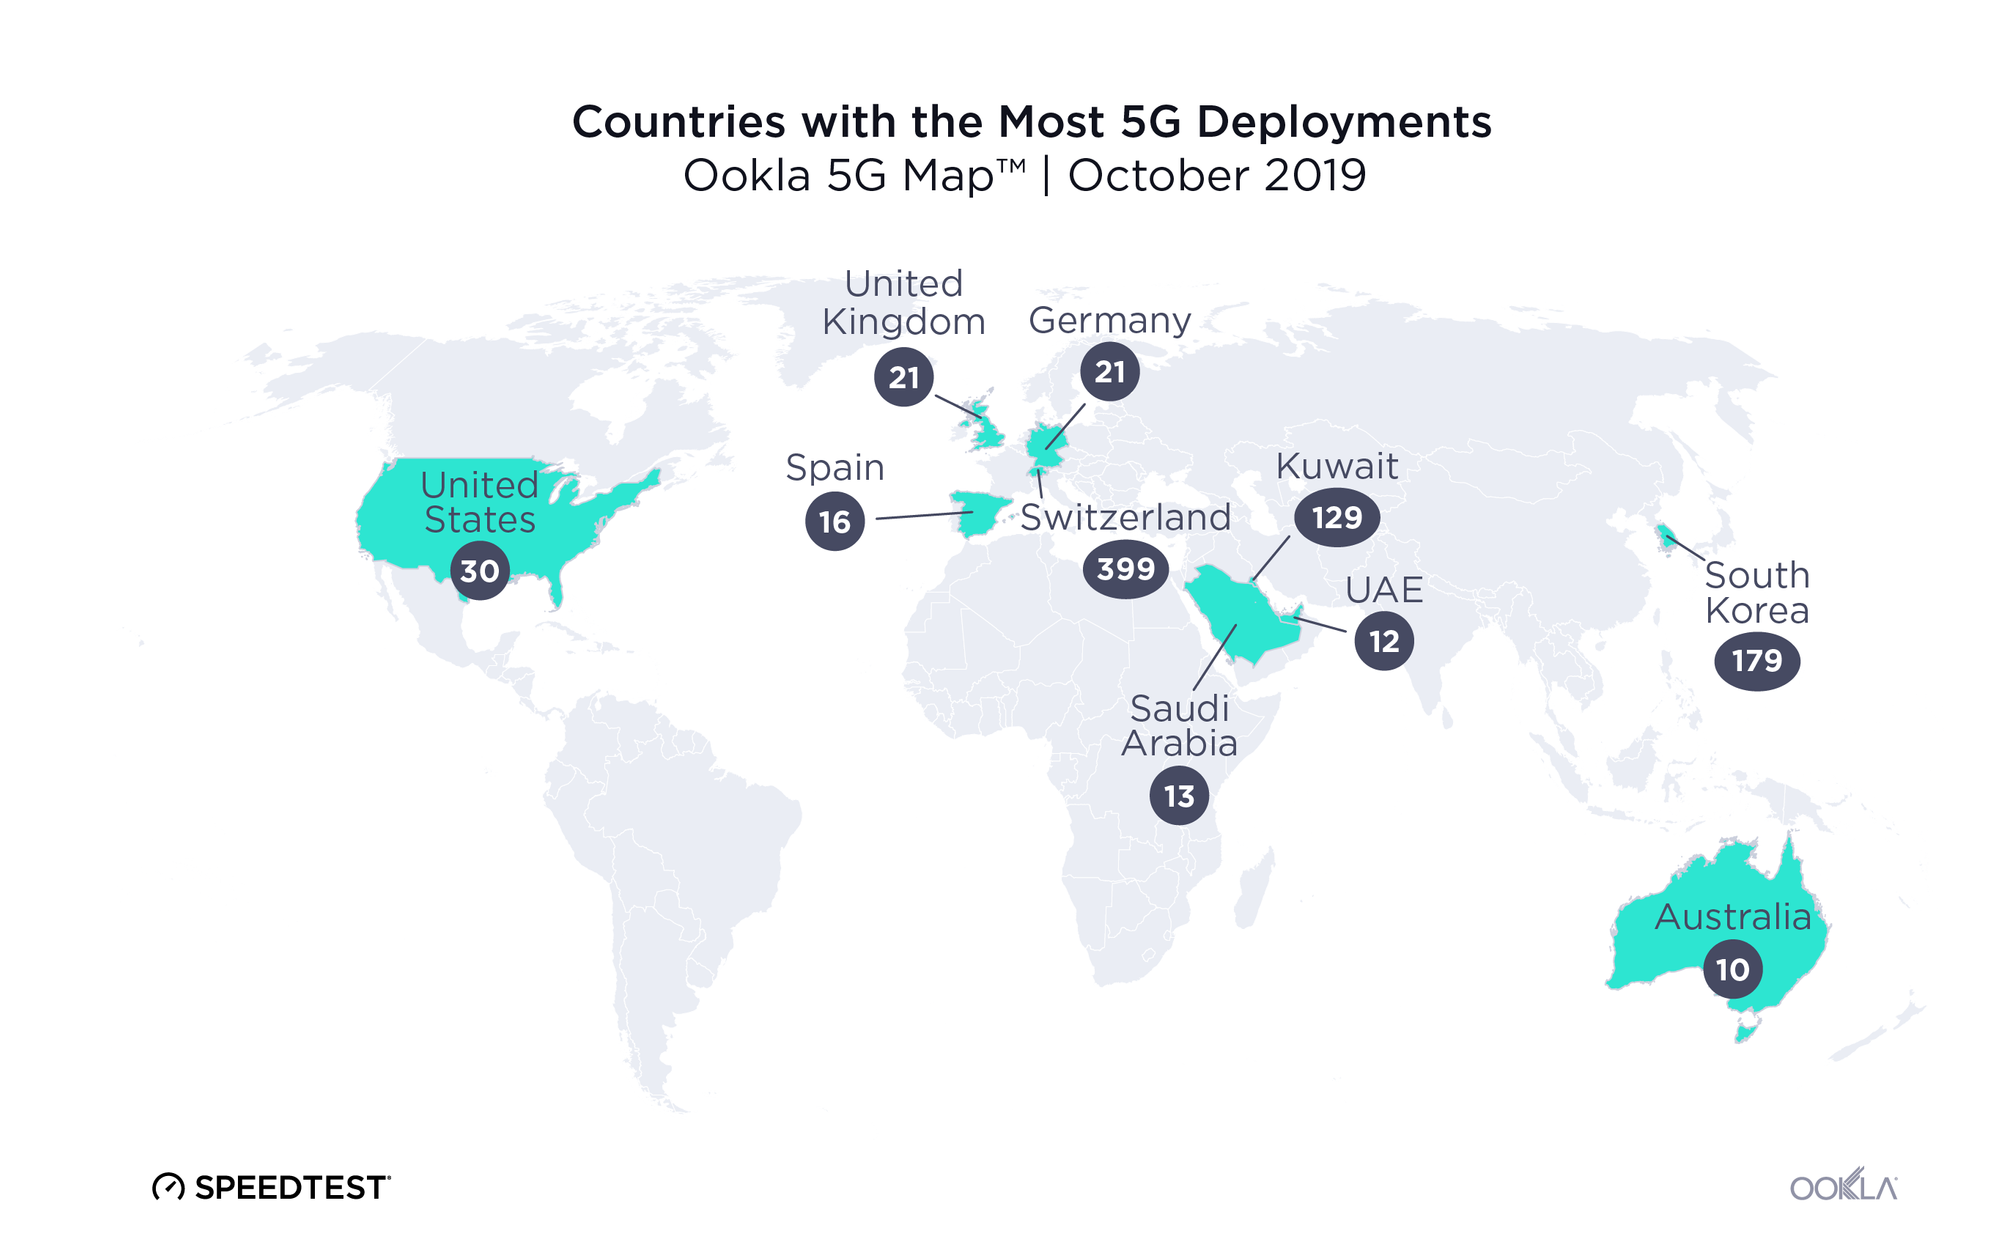
Countries with the most 5G deployments

The Ookla 5G Map reveals that Switzerland is winning the race of 5G expansion with more than twice as many commercially available deployments as second-place South Korea. Kuwait has the third largest number of 5G deployments in the world.

Ookla_Countries-with-the-most-5G-deployments-2

It’s interesting to note that of the world’s six largest economies, three do not have commercially available 5G at all (China, Japan and India). China does have 29 locations where 5G is in pre-release (with 5G network hardware in place but not yet accessible to consumers). Japan is expected to launch 5G in 2020 and 5G will likely be available in India in 2021.

The other three largest economies (the U.S., Germany and the U.K.) do feature among the 10 countries with the most commercially available 5G deployments, although they individually have many fewer deployments than Switzerland, South Korea and Kuwait.

5G downloads are at least 300% faster than 4G

In theory, 5G could eventually offer download speeds about 1300% faster than those on 4G. Real-world factors affect those numbers, though, so we examined data from Speedtest IntelligenceTM to see what consumers actually experienced in several key markets between June and August 2019.

Comparing Mean Speeds on 5G and 4G
Speedtest Results | June-August 2019
Country 4G Download (Mbps) 4G Upload (Mbps) 5G Download (Mbps) 5G Upload (Mbps) % Difference Download
Australia 60.59 16.37 258.18 33.25 326.1%
Bahrain 28.80 13.43 311.41 29.43 981.3%
Kuwait 34.02 18.36 352.93 23.24 937.4%
Qatar 62.27 17.57 303.57 36.78 387.5%
Saudi Arabia 42.11 16.50 395.04 33.75 838.1%
South Korea 64.79 14.66 393.07 30.33 506.7%
Switzerland 50.65 20.10 362.75 43.12 616.2%
United Arab Emirates 59.23 20.12 334.27 32.07 464.4%
United Kingdom 31.03 11.47 181.87 18.34 486.1%
United States 34.33 9.98 477.42 21.93 1290.7%

The mean download speed over 5G was fastest in the U.S. and also showed the largest percent difference when compared with mean download speed over 4G. Saudi Arabia had the second fastest mean download speed over 5G with South Korea coming in a close third. On the other end of the spectrum, the U.K. had the slowest mean download speed over 5G. Australia was the second slowest and Bahrain third slowest. Bahrain showed the second highest percent improvement when comparing 4G and 5G download speeds, though, and Kuwait was third. Australia showed the lowest percent increase between 4G and 5G download speeds and Qatar had the second lowest.

Mean upload speeds over 5G are less remarkable, though in almost every country we analyzed they represent a 50-120% improvement over those available on 4G. Kuwait was the exception, with only a 26.6% improvement in mean upload speed when using 5G rather than 4G. The U.S. and Bahrain were nearly tied for most improved with increases of 119.7% and 119.1%, respectively, when comparing mean upload speed on 5G to that on 4G. Switzerland had the fastest mean upload speed over 5G, Qatar was second and Saudi Arabia third. Mean upload speed over 5G was the slowest in the U.K., second slowest in the U.S. and third slowest in Kuwait.

5G Share of 4G/5G Speedtest Samples
June-August 2019
Country % 5G
South Korea 12.72%
Australia 1.31%
United Arab Emirates 0.65%
Kuwait 0.64%
Switzerland 0.59%
Qatar 0.43%
United Kingdom 0.30%
United States 0.20%
Bahrain 0.09%
Saudi Arabia 0.03%

The 5G share of the tests taken on either 4G or 5G differs widely among the countries on our list. South Korea was clearly on top with 5G accounting for nearly 13% of Speedtest 4G/5G samples. This is not surprising given that one South Korean mobile operator already has 1 million 5G subscribers. Australia had the second largest percentage of 5G tests and the U.A.E. third. Saudi Arabia had the smallest percentage of 5G results.

Ookla is your go-to resource for ongoing 5G analysis

Ookla will continue to analyze 5G speeds as operators across the globe make this significant improvement in their networks. We’re uniquely capable of measuring 5G speeds because Speedtest uses a client and server testing engine capable of measuring high-speed connections (up to 10 Gbps) that dynamically scales the number of connections to the server in order to saturate and accurately measure the client-side connection. This allows us to measure the full extent of real-world performance and overcome the effects of network bottlenecks such as TCP slow start and means we are unique in our ability to measure 5G.

In addition, Ookla has partnered with operators and device manufacturers all over the world to implement accurate in-app 5G detection — even as Android Pie, which powers the current generation of 5G devices, does not natively identify 5G connection types. Through this approach, we’re able to properly configure the parameters of a Speedtest and measure 5G tests.

Keep watching this space for future analyses or contact us to learn more about how our data can help you.

To get a broader understanding of how 5G is changing the mobile landscape, read our previous coverage here:

Ookla retains ownership of this article including all of the intellectual property rights, data, content graphs and analysis. This article may not be quoted, reproduced, distributed or published for any commercial purpose without prior consent. Members of the press and others using the findings in this article for non-commercial purposes are welcome to publicly share and link to report information with attribution to Ookla.

| October 14, 2019

Exploring Recent Trends in the Latin American Telecom Market


Leer en español | Leia em Português

The Latin American telecommunications market continues to be fascinating to watch as fixed broadband speeds increase and mobile operators ready their networks for 5G. In anticipation of Futurecom, we analyzed internet speeds and 4G Availability for Q2-Q3 2019 in Latin America’s major markets to see who’s leading the charge to the future.

Mobile and fixed speeds are increasing at the country level

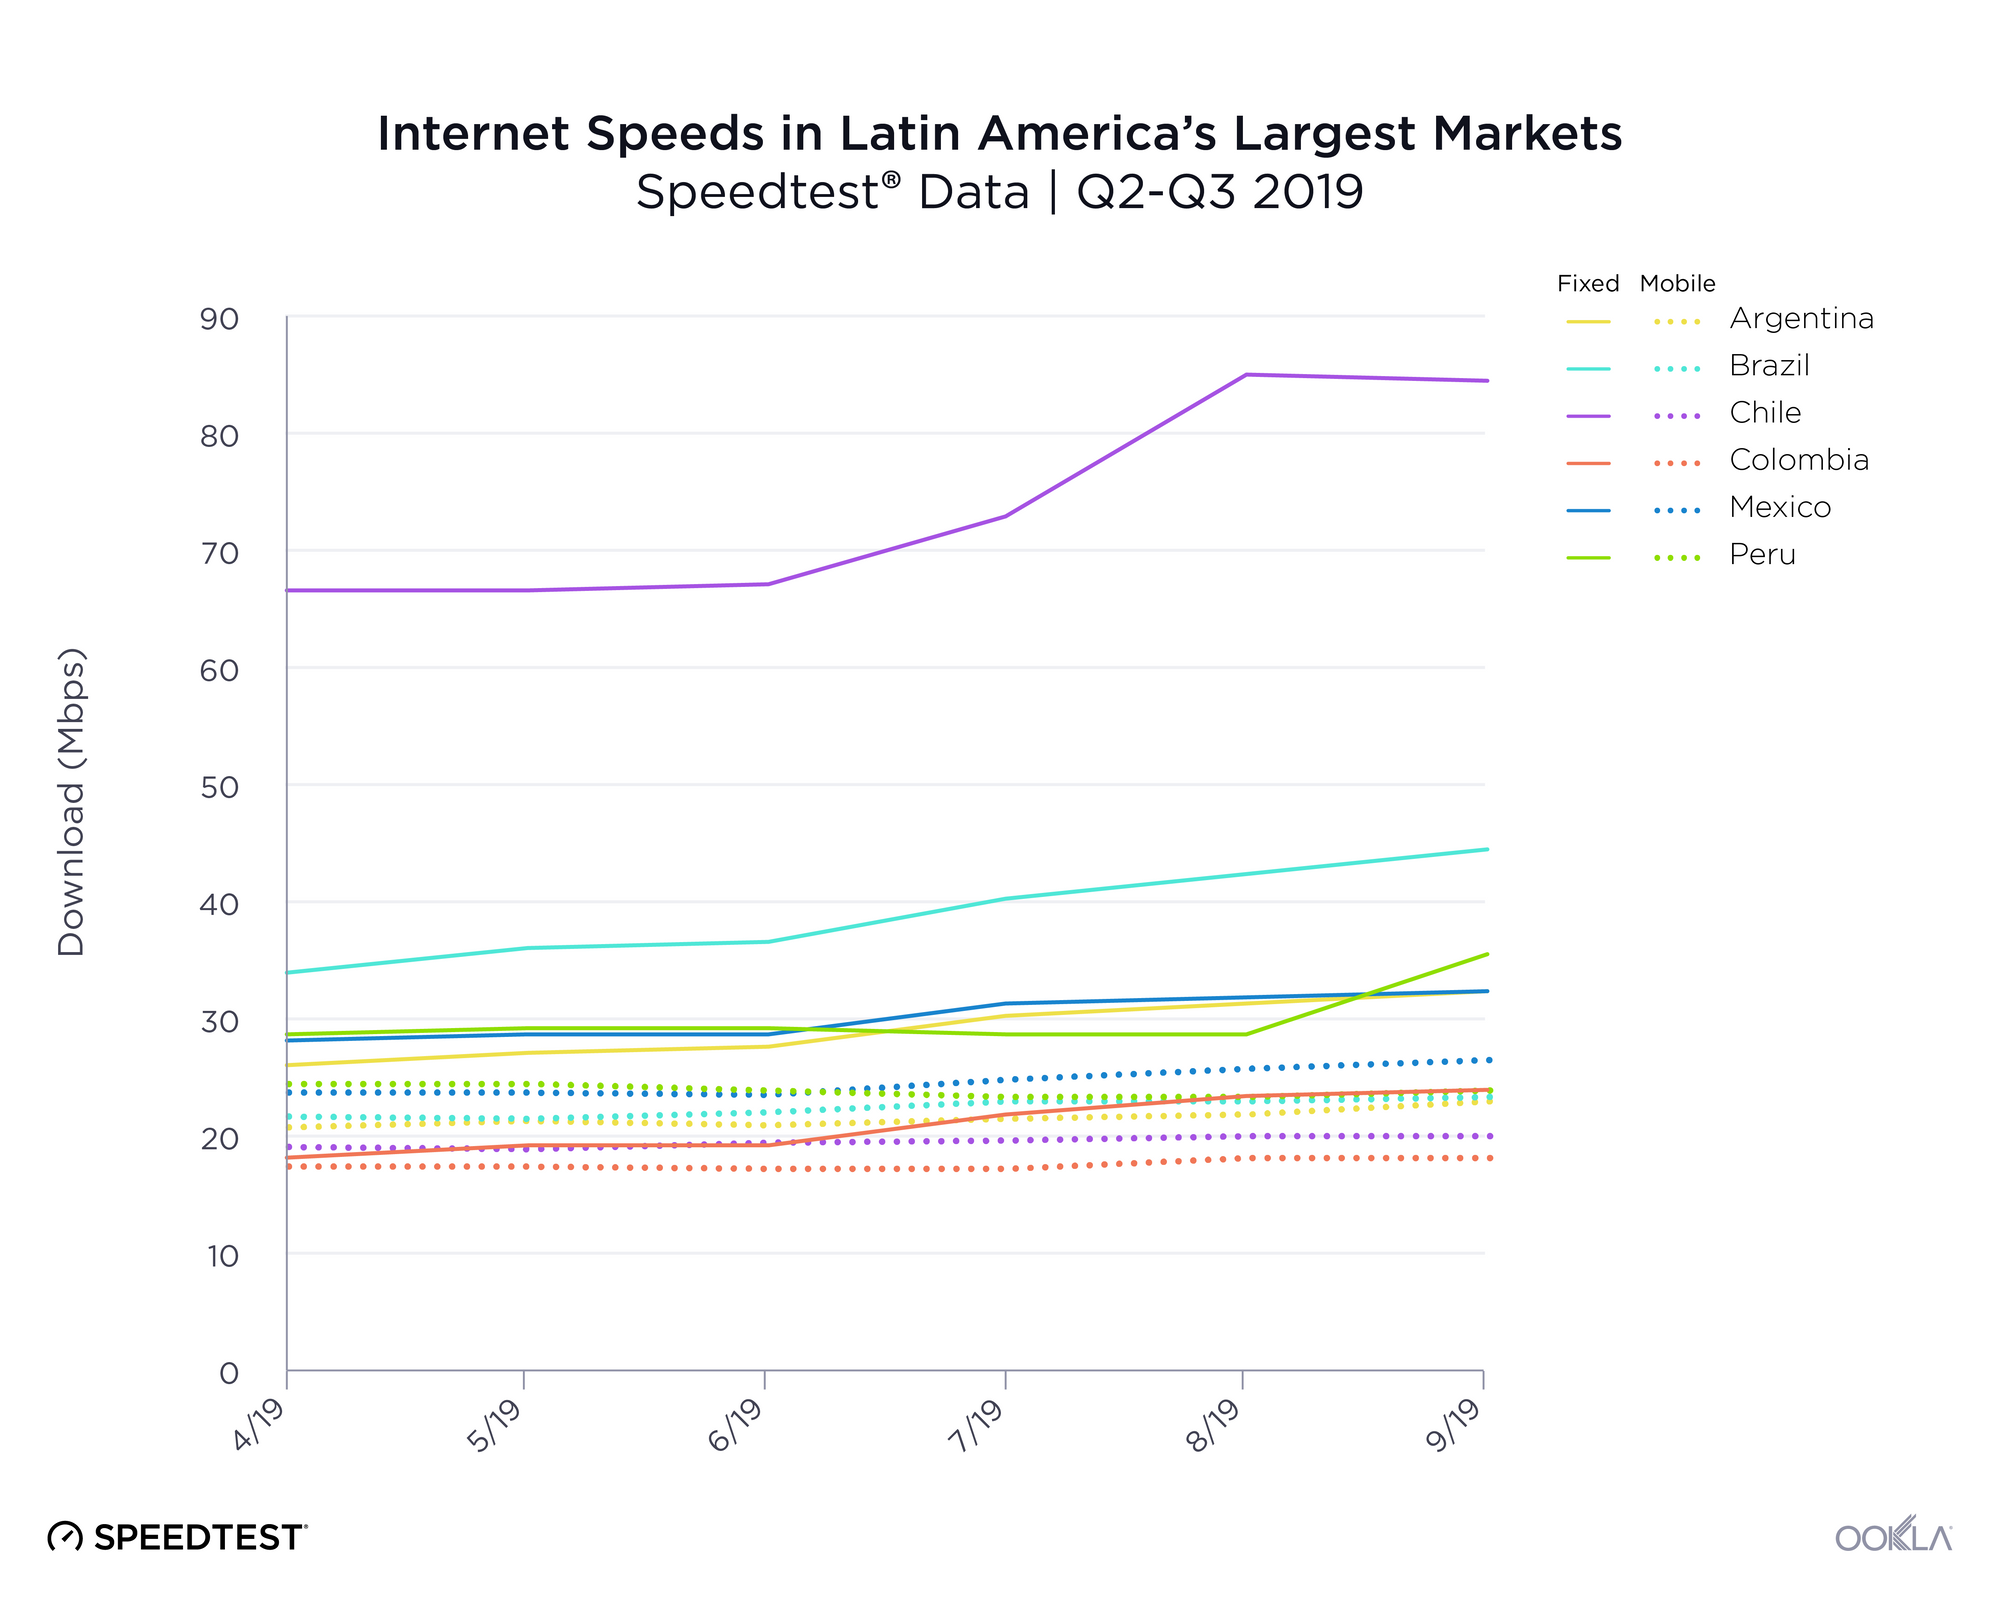
LatAm-Mobile-Fixed-Speeds-in-Largest-Markets

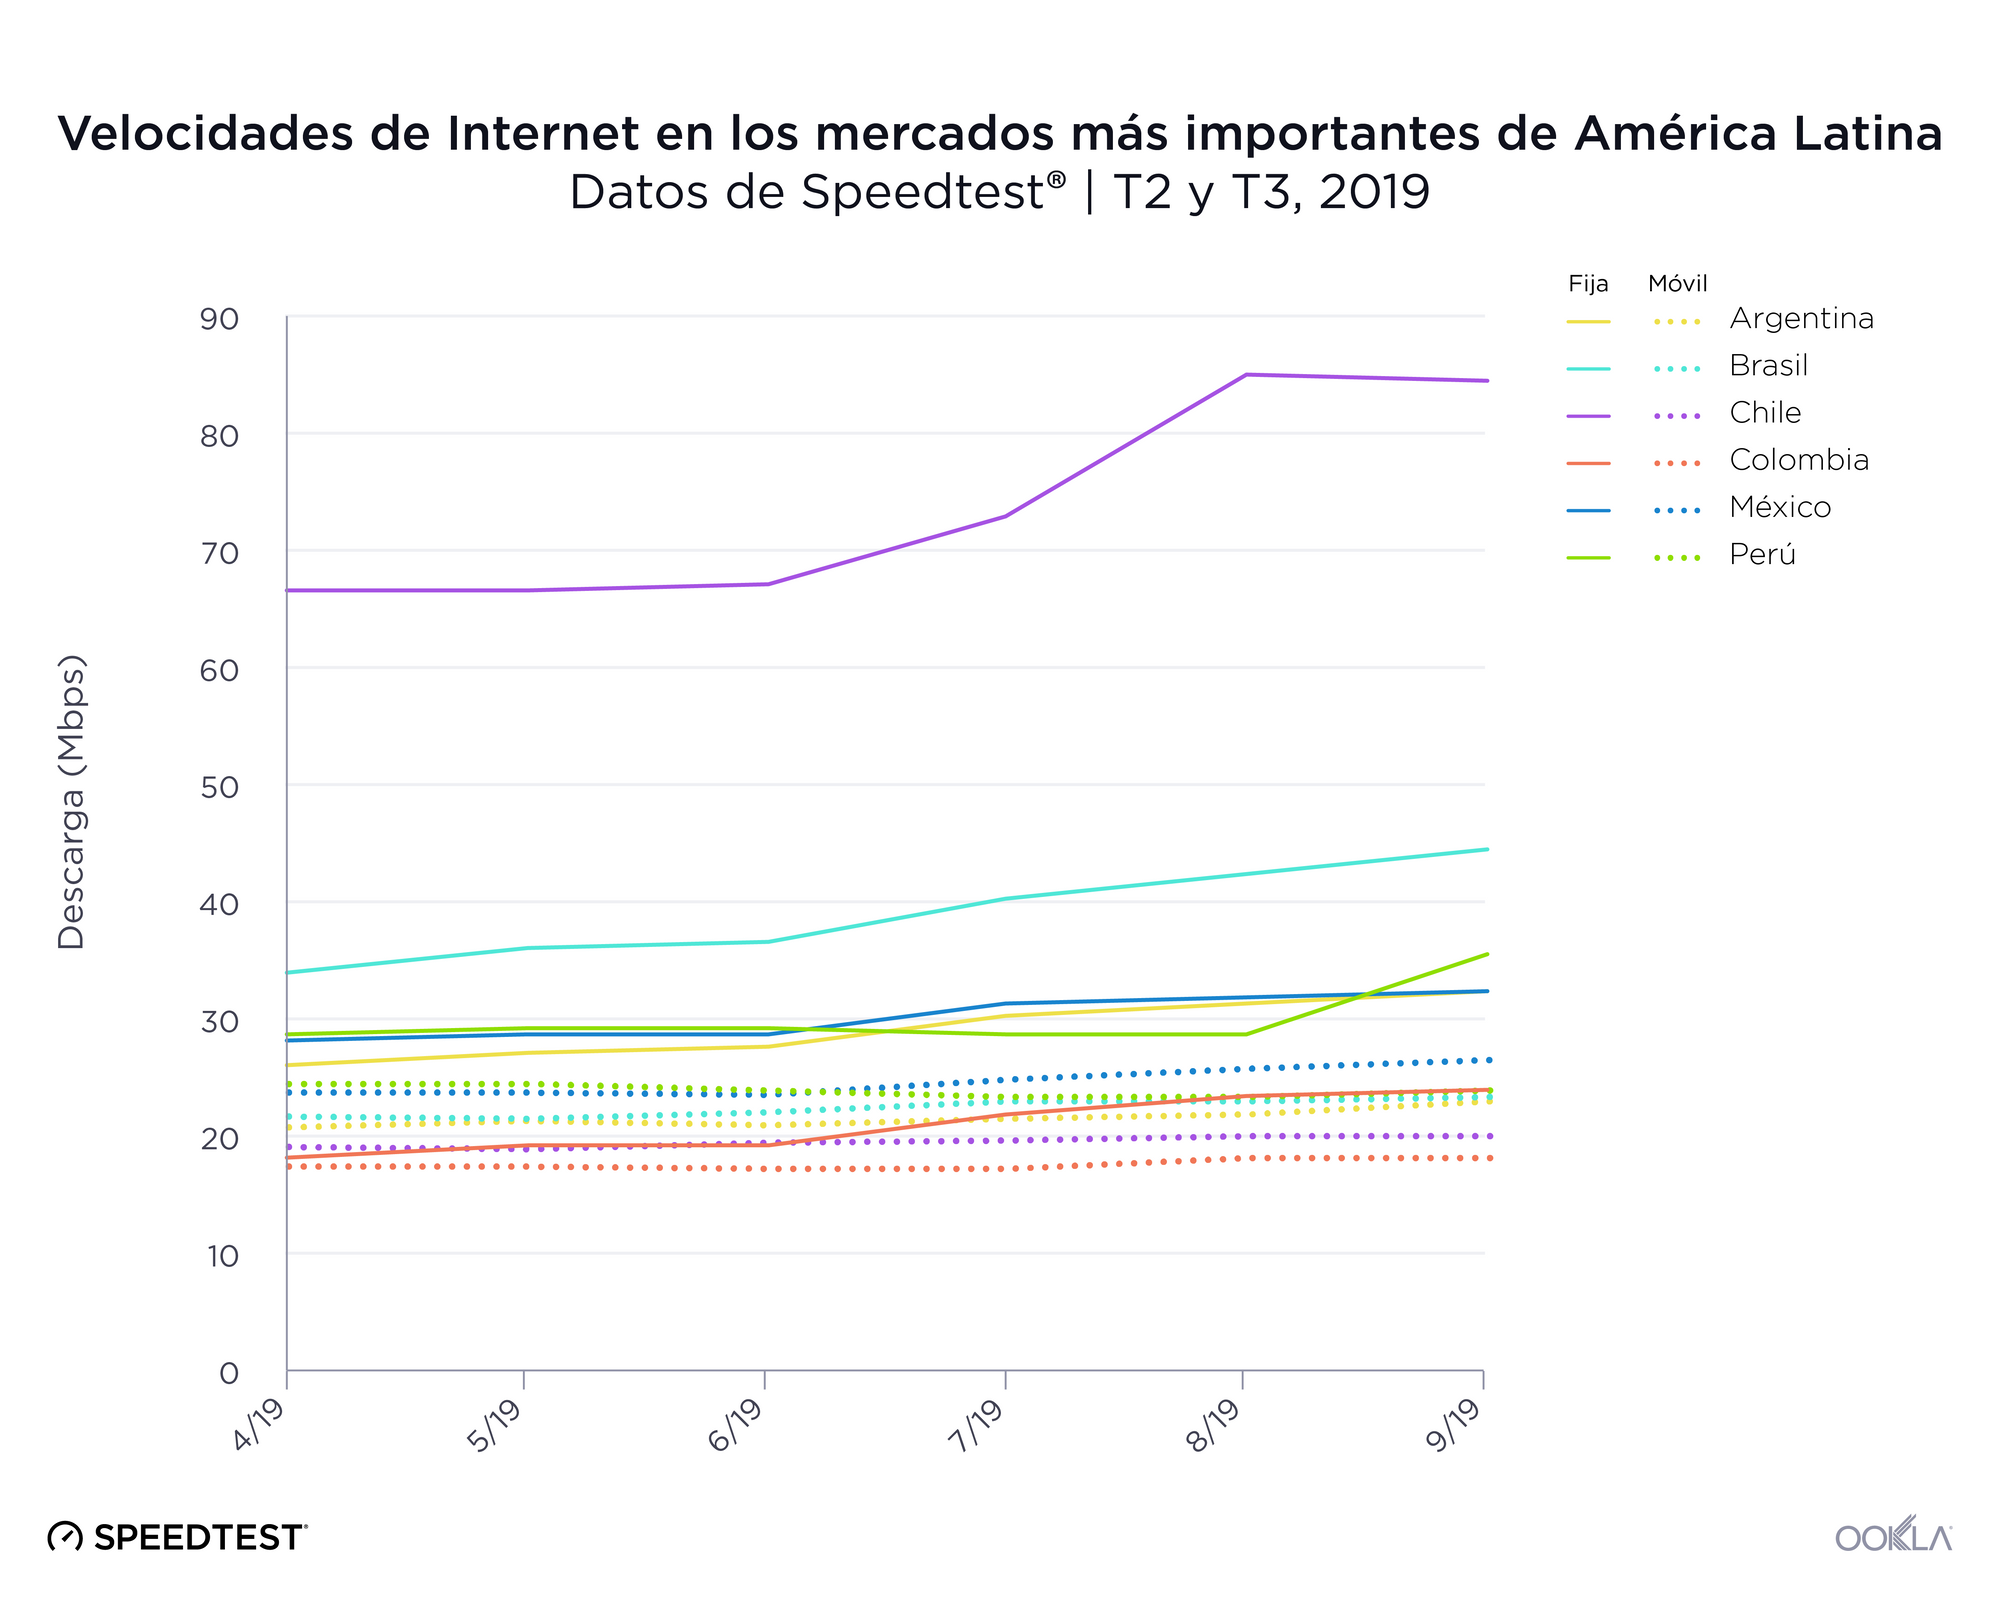
Fixed broadband speeds are on the rise in Latin America’s largest markets. Colombia’s mean download speed increased 30.6% during Q2-Q3 2019 while Mexico’s increased 15.6%. Chile had the fastest mean download speed over fixed broadband by far and showed a 26.7% increase in speed during the period. Brazil was the second fastest throughout the period. Peru, Mexico and Argentina were closely vying for third, but in the end Peru won out. Colombia had the slowest download speed over fixed broadband.

Mobile speeds were much more competitive in Latin America’s largest markets. Increases in mean download speeds were not nearly as impressive as they were with fixed broadband, though. Mexico saw the greatest increase during Q2-Q3 2019 at 12.0%. Argentina’s mobile download speed increased 11.0%, followed by Brazil (7.9%), Chile (5.1%) and Colombia (4.6%). Peru’s mean download speed over mobile decreased 2.2% during the period. Mexico had the fastest mobile speed, followed by Peru, Brazil, Argentina, Chile and, finally, Colombia.

4G Availability varies widely by country

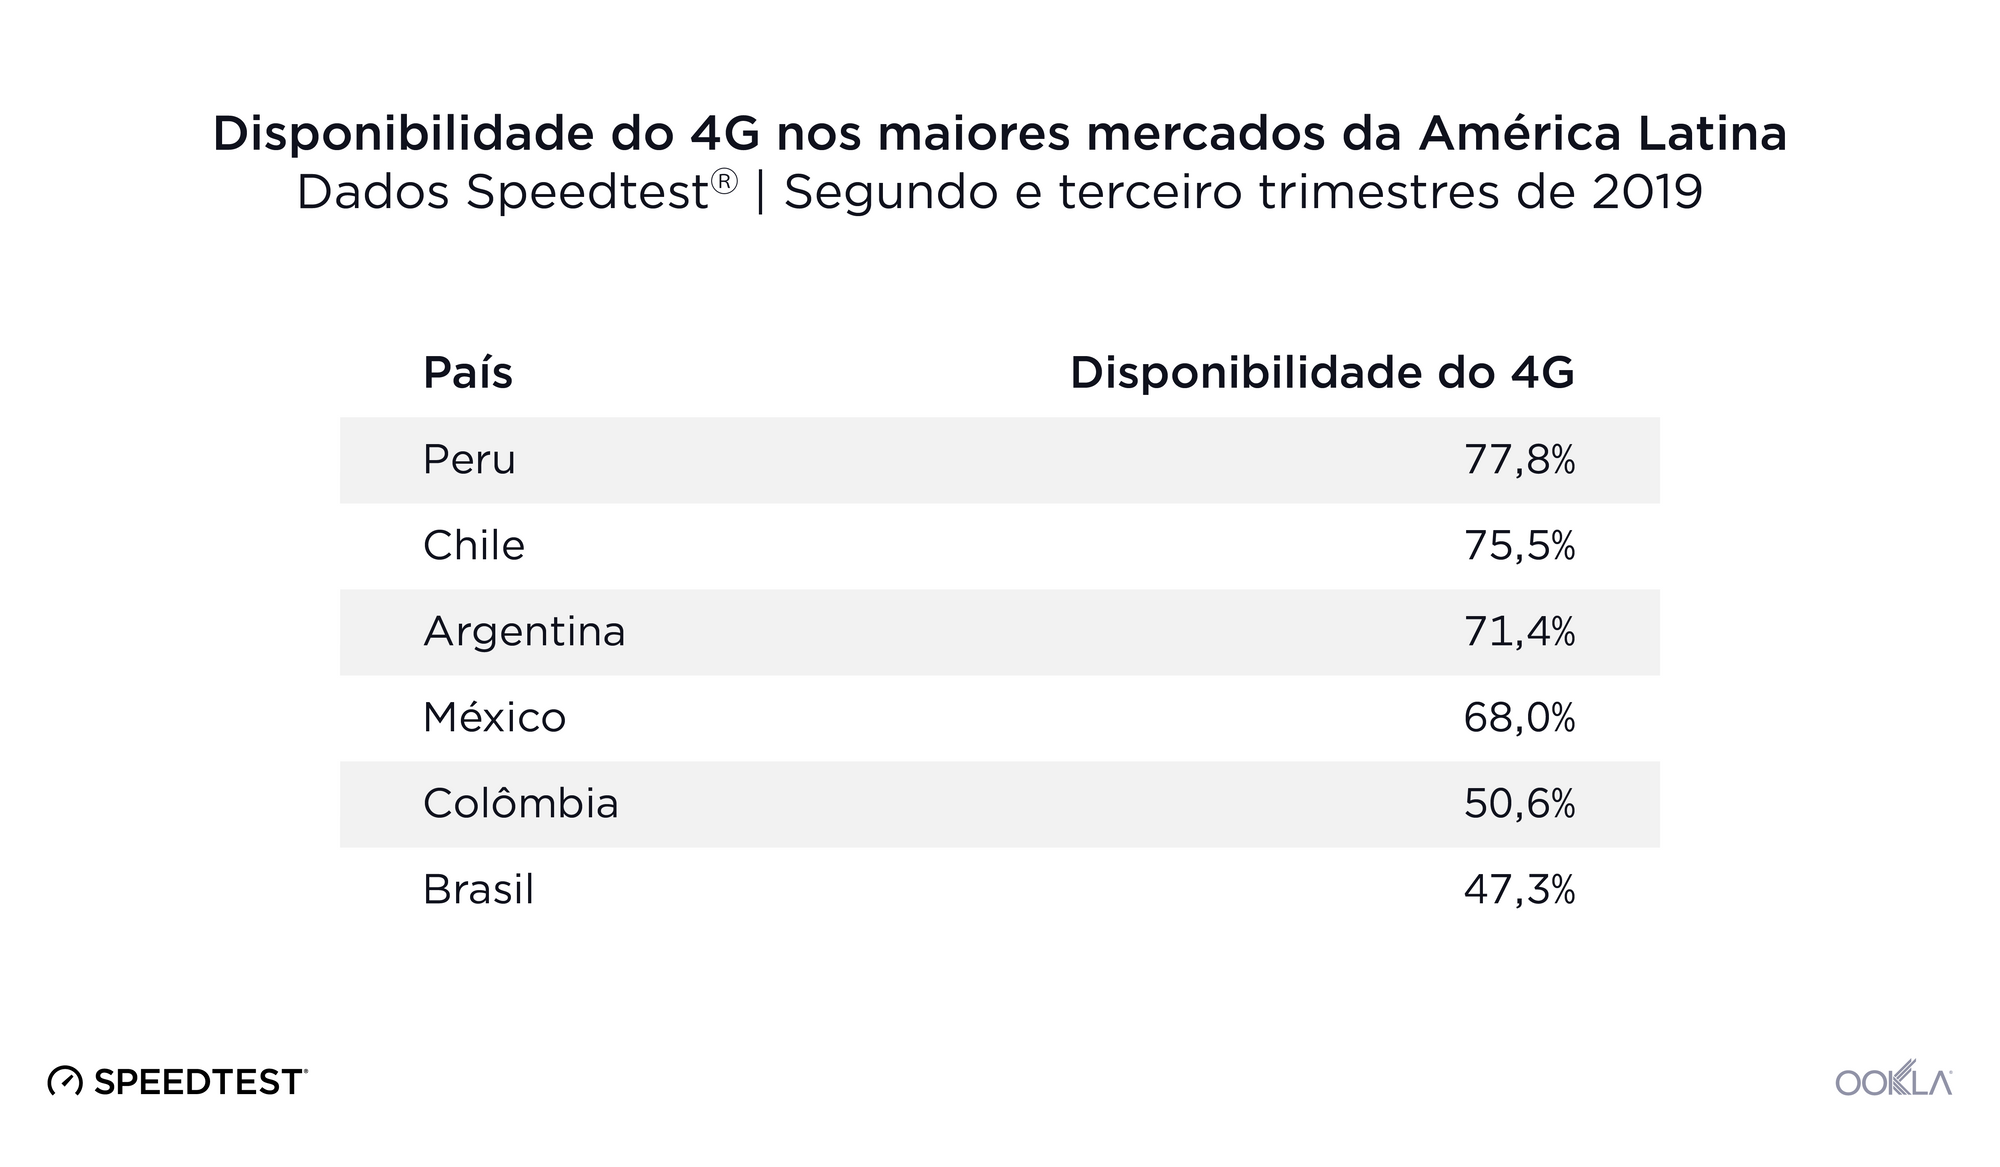
LatAm-4G-Availability-Q2-Q3

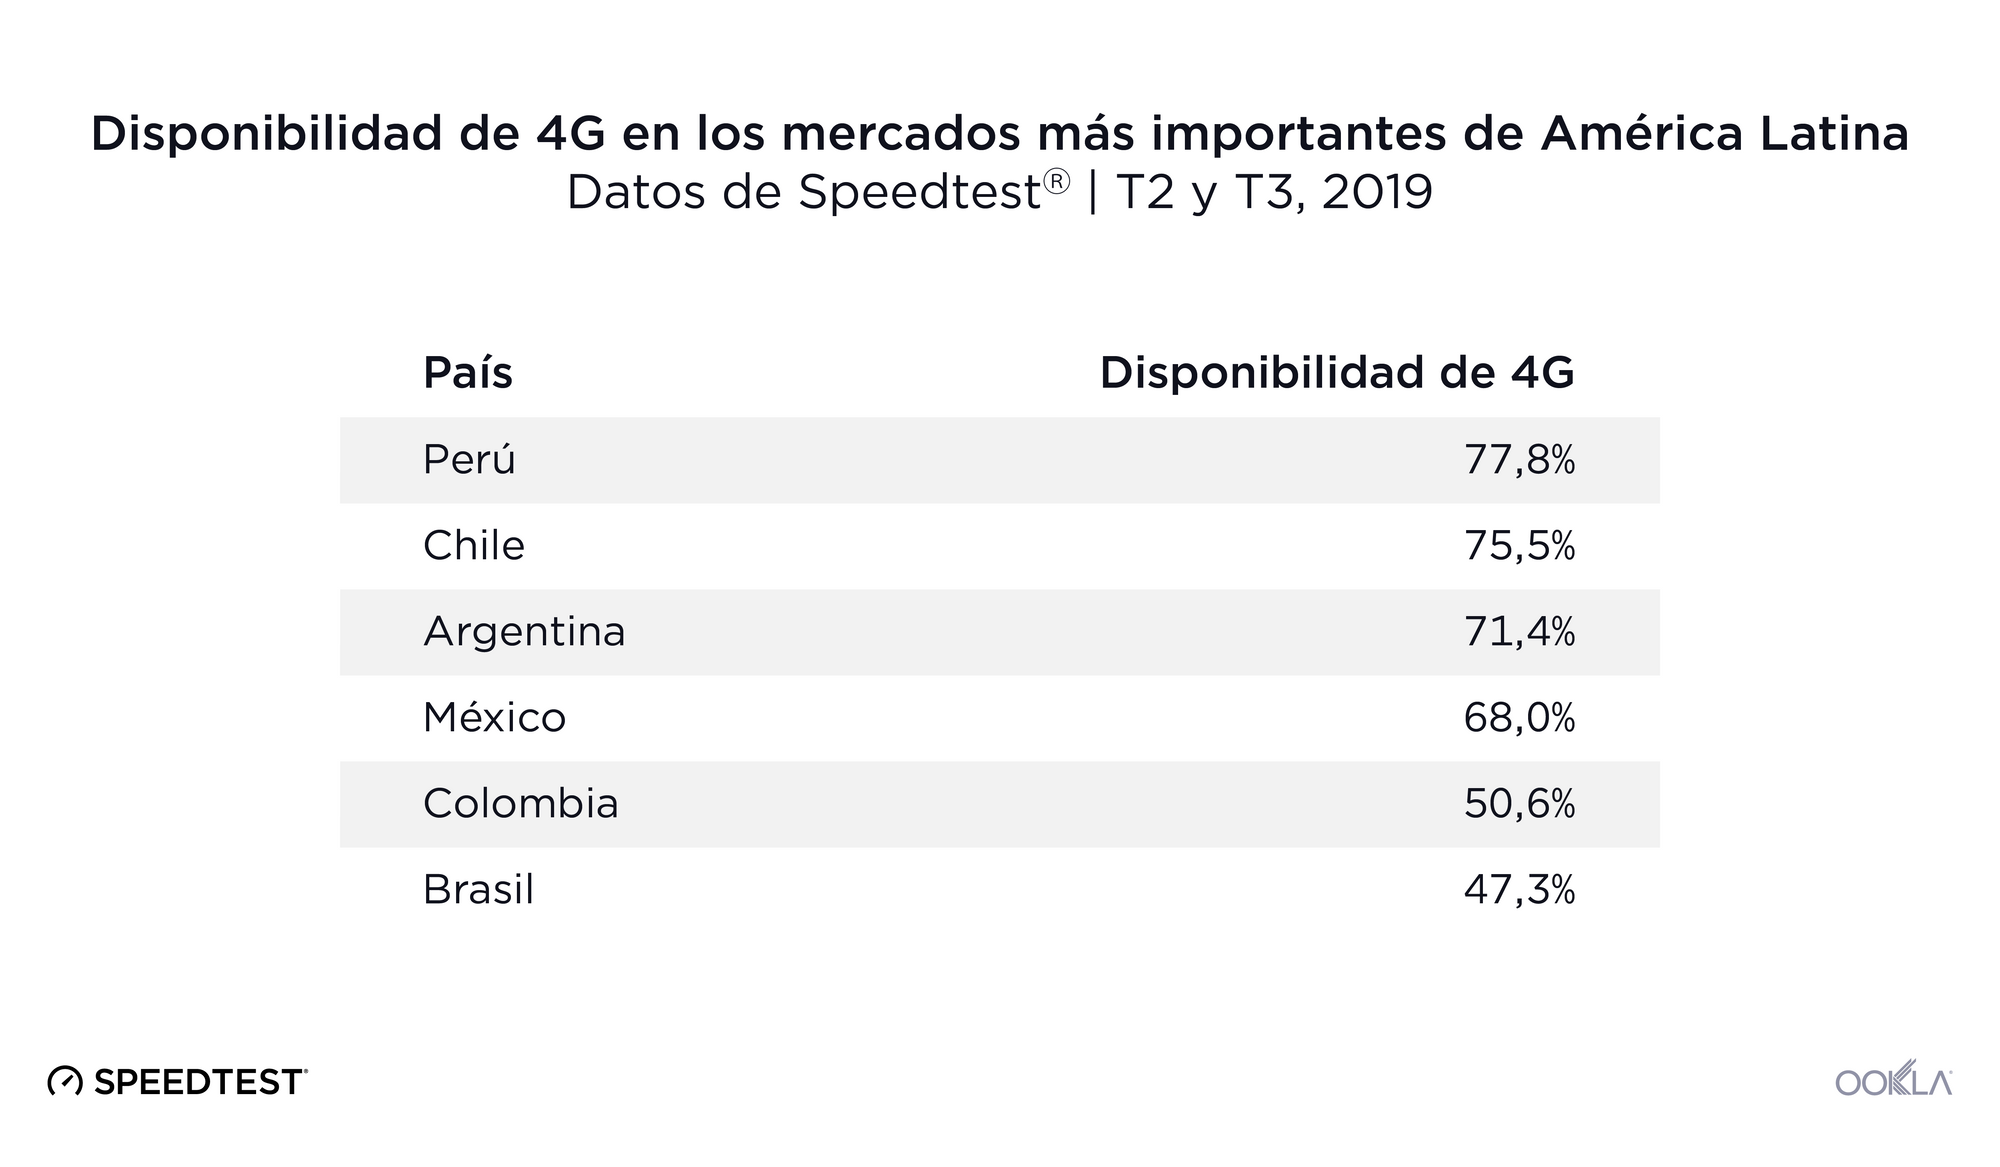
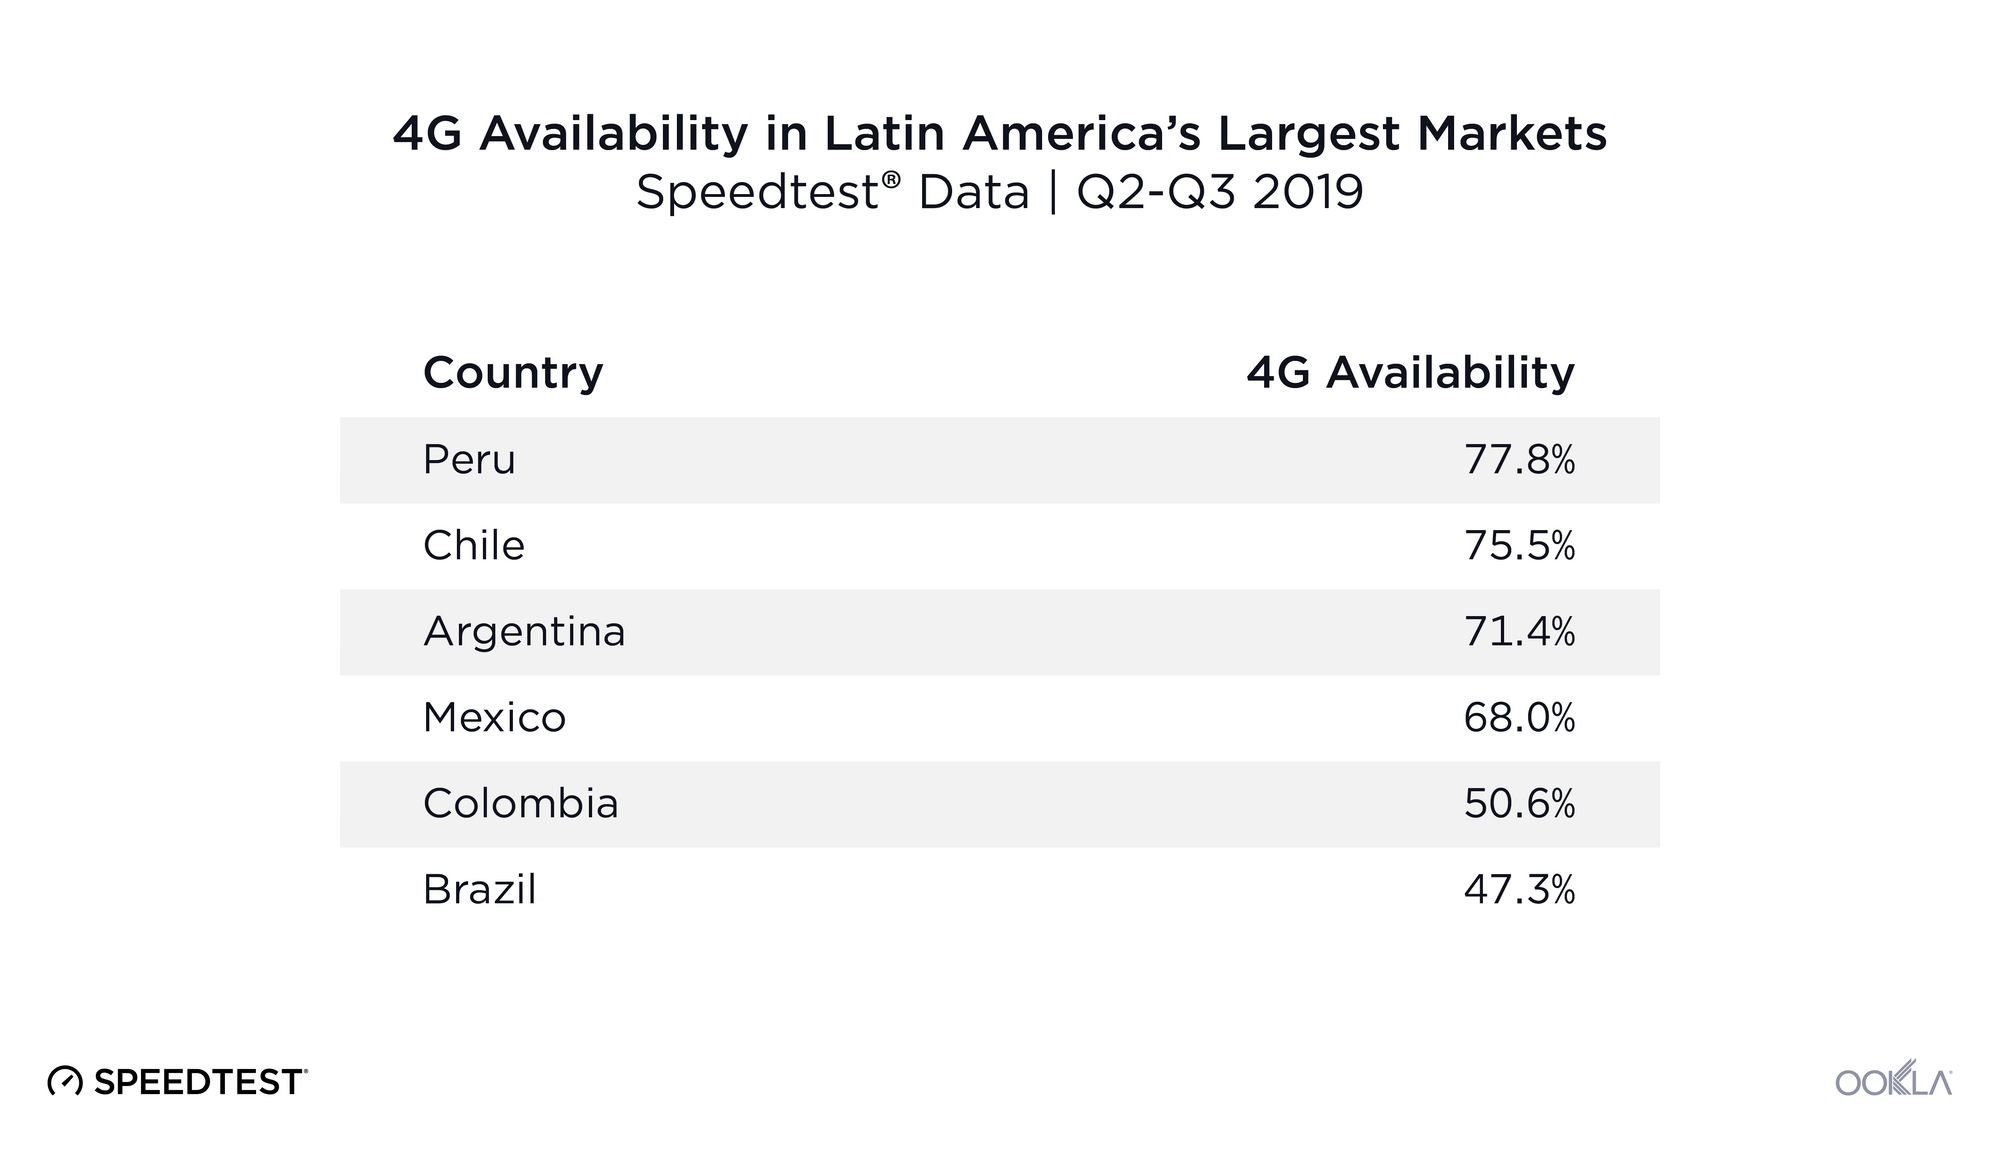
We looked at the percentage of surveyed locations where devices could access 4G LTE service in Latin America’s major markets during Q2-Q3 2019 and found that Peru was on top with 77.8% 4G Availability during the period. Chile came in second with 75.5% and Argentina third at 71.4%. Brazil had the lowest 4G Availability at 47.3% and Colombia had the second lowest at 50.6%.

City speeds vary by technology

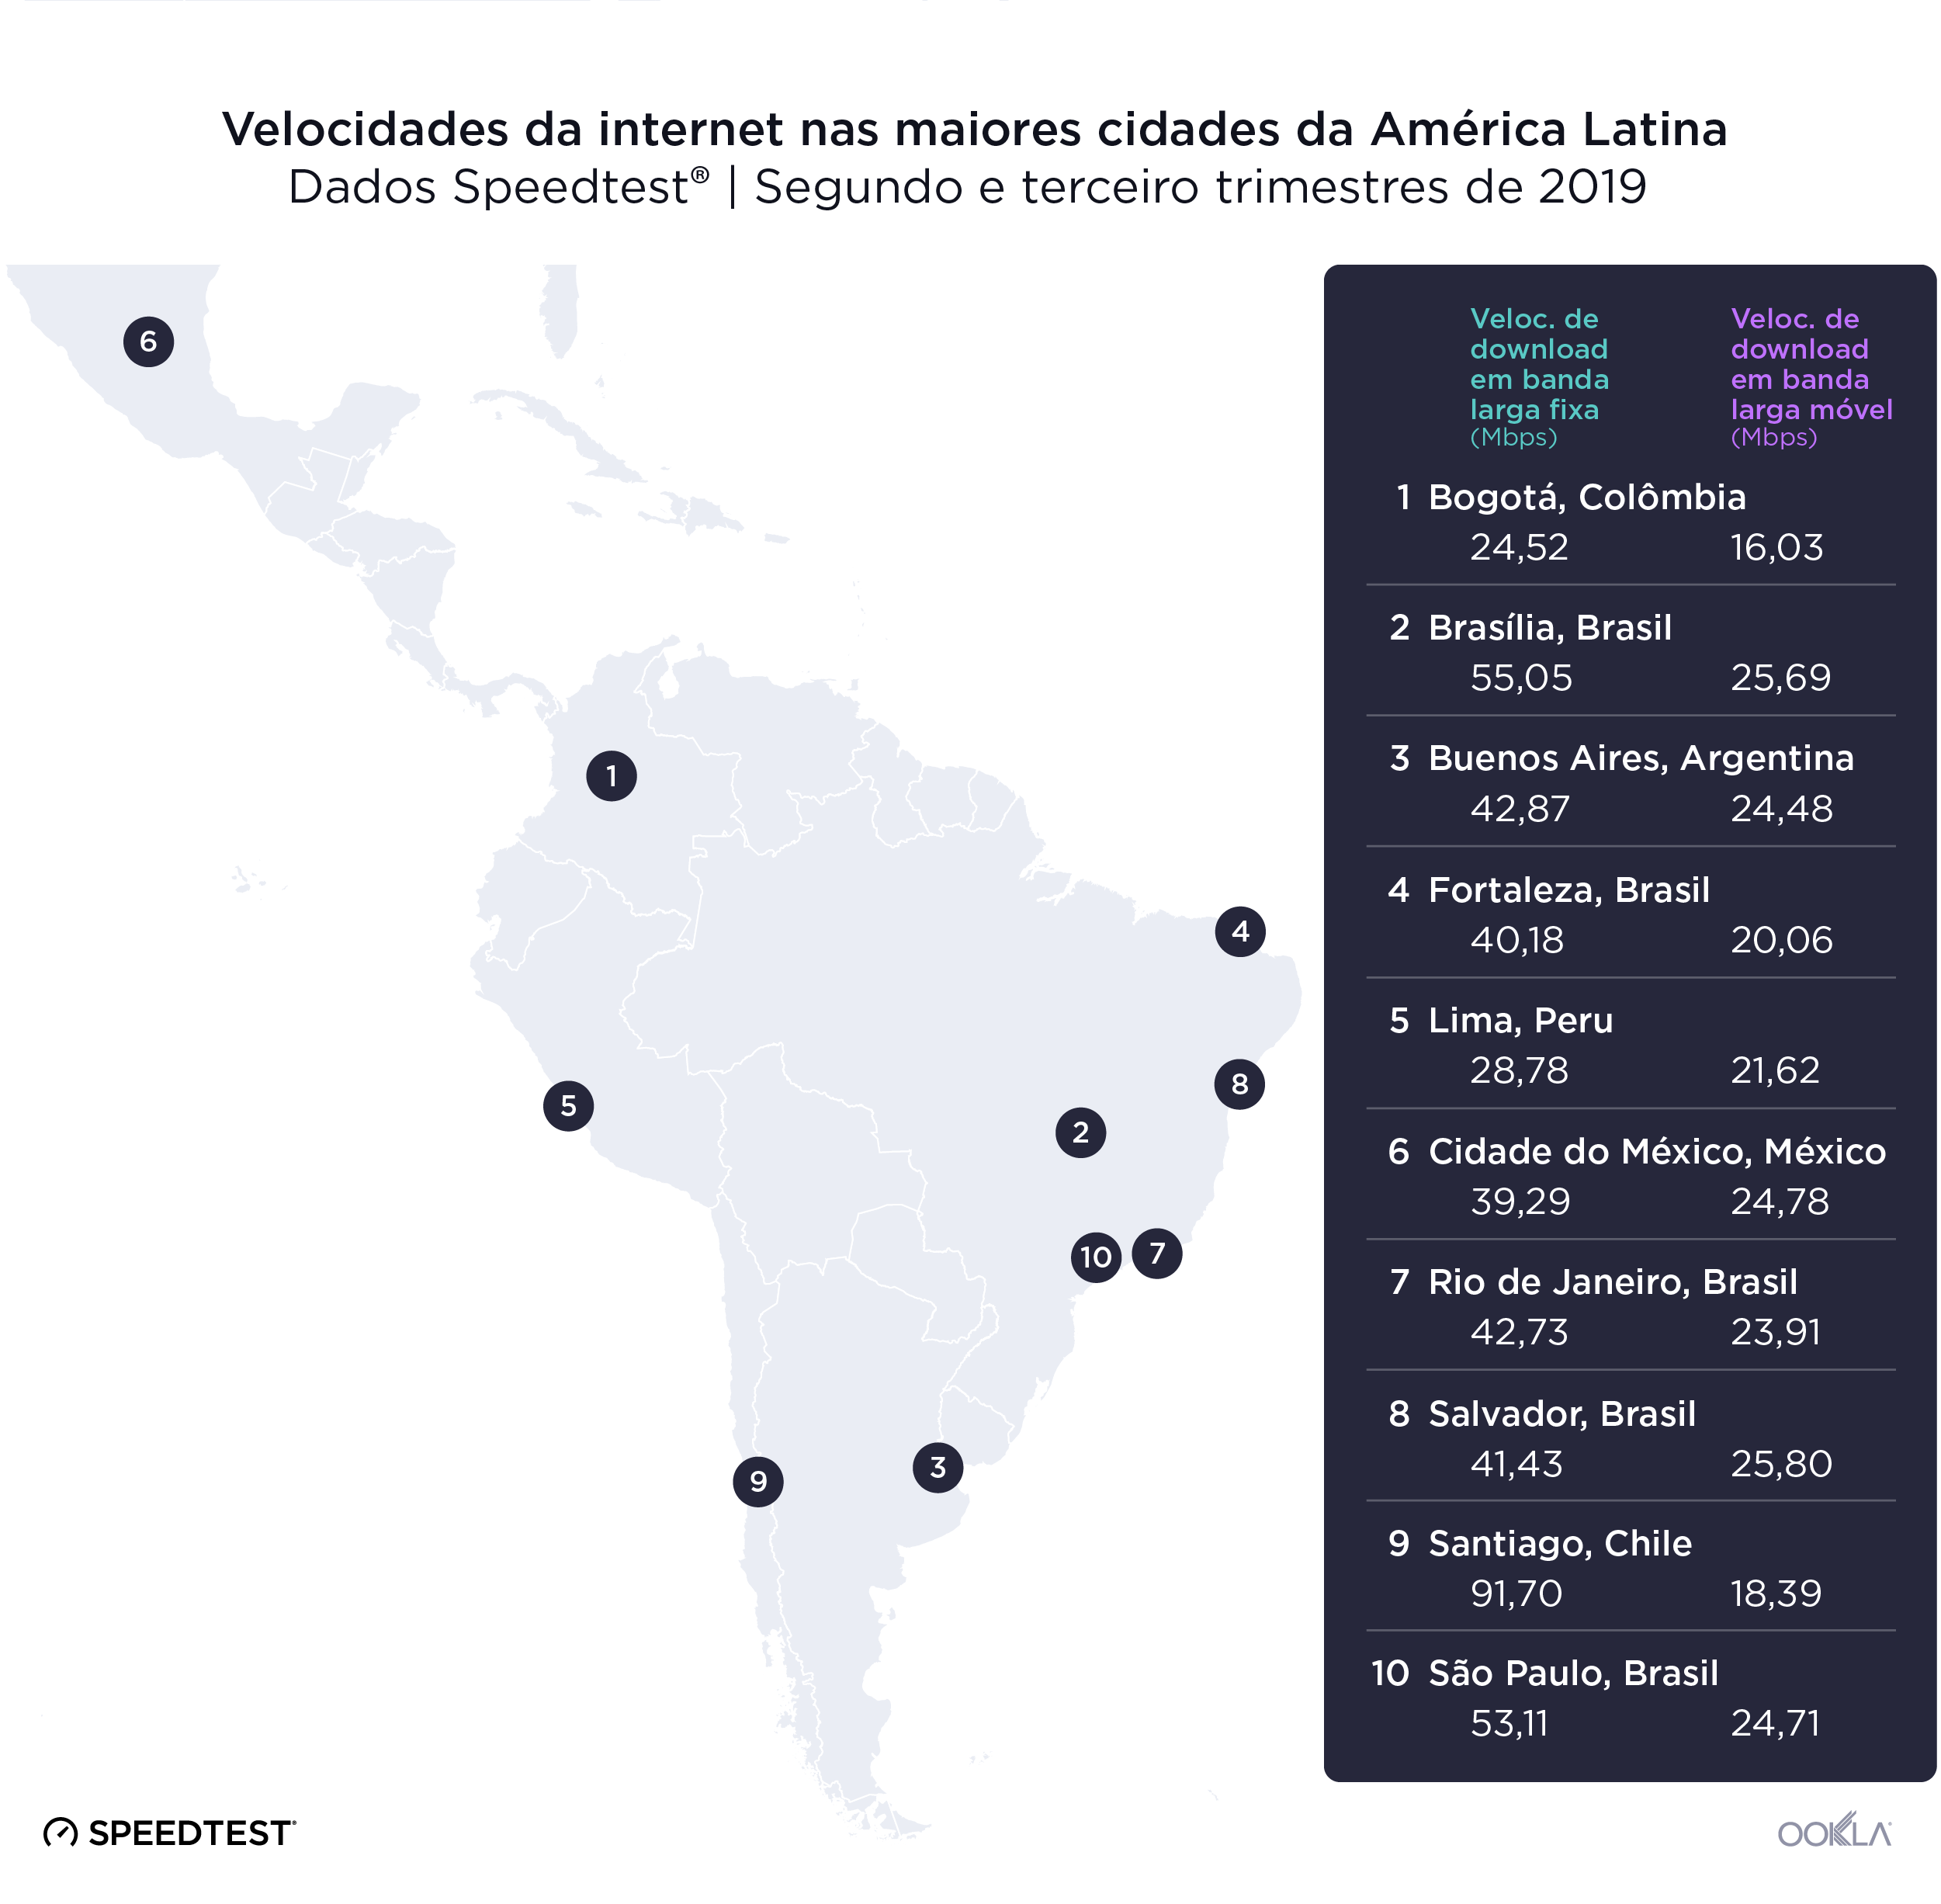
Ookla_Internet-Speeds-in-Latin-America-Largetst-Cities_1019_EN
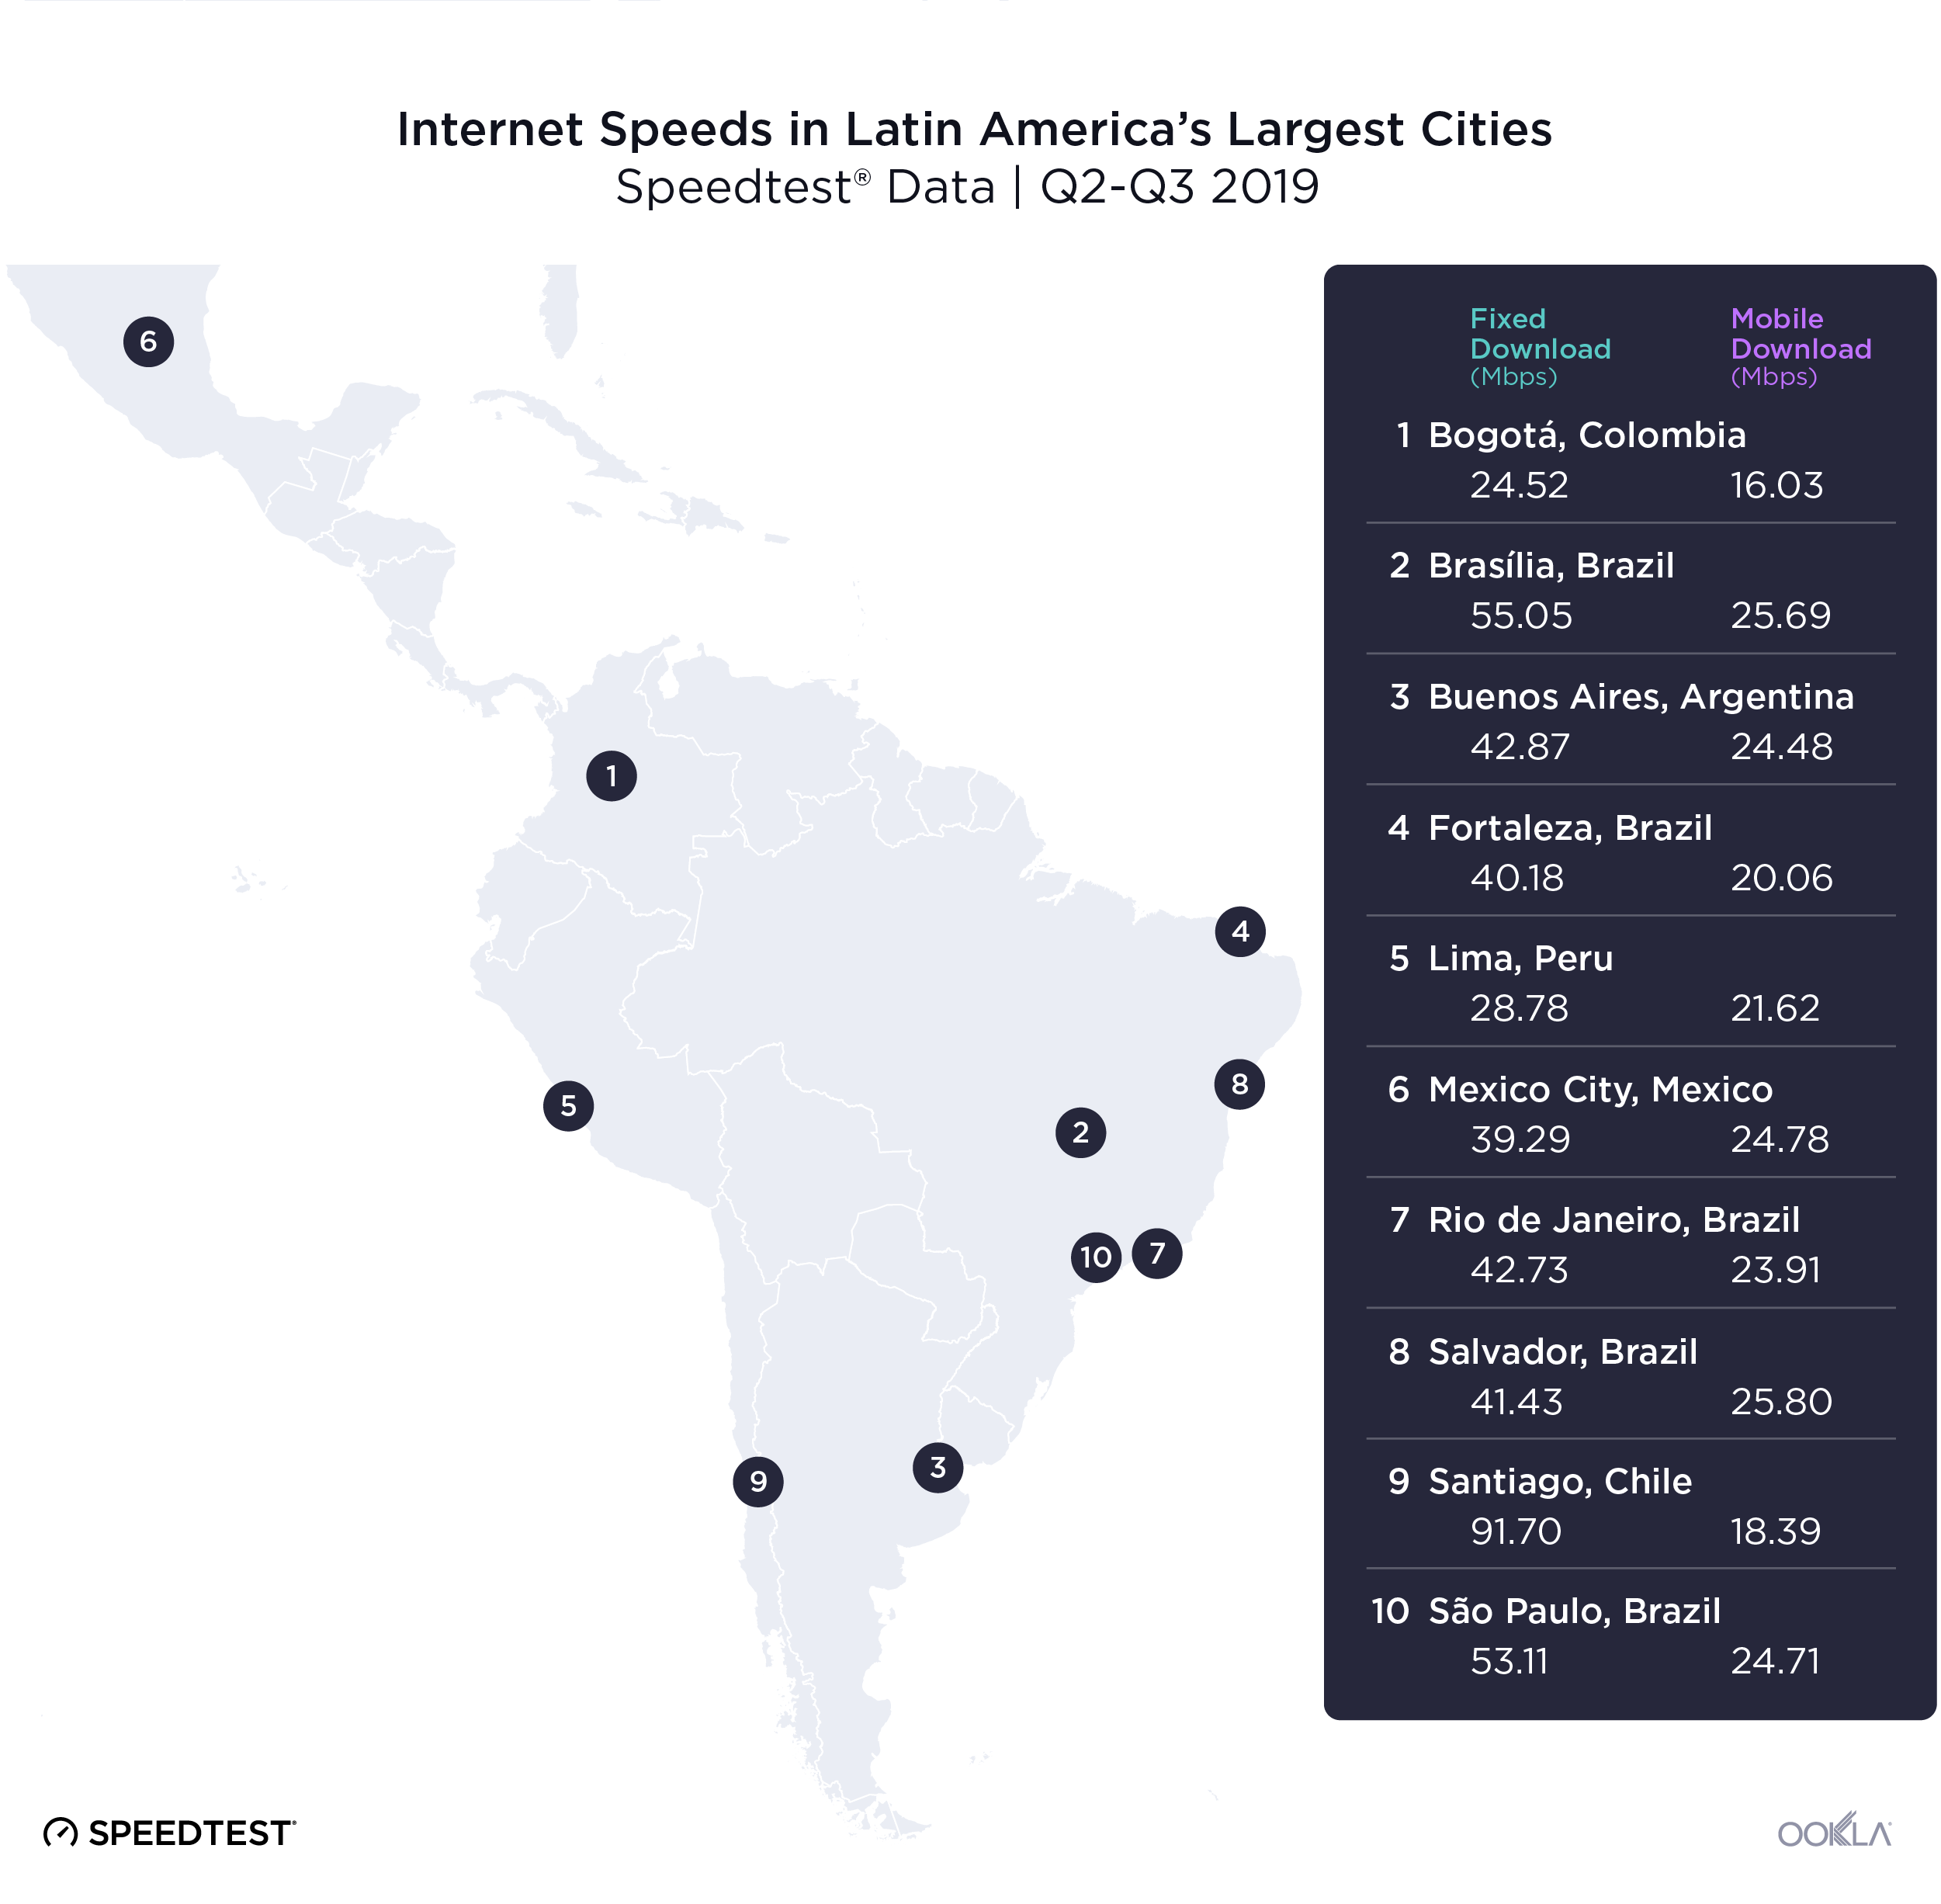
Fixed broadband speeds have increased dramatically in Latin America’s largest cities since we last examined them and these speeds have shifted the rankings significantly. Santiago, Chile had the fastest download speed over fixed broadband in Q2-Q3 2019, beating second-place Brasília, Brazil by 66.6%. São Paulo, Brazil came in a close third. Bogotá, Colombia had the slowest download speed over fixed broadband of the cities on our list. Lima, Peru was the second slowest city and Mexico City, Mexico third slowest.

Because of the political situation in Venezuela, we did not include Caracas in our analysis.

Mobile rankings have changed significantly since we last considered speeds in Latin America’s largest cities. Salvador, Brazil had the fastest mobile download speed on our list during this period. Brasília, Brazil was a close second and Mexico City, Mexico third fastest. Bogotá, Colombia also had the slowest mobile download speed on our list. Santiago, Chile was the second slowest city for mobile and Fortaleza, Brazil the third slowest.

Ookla will be at Futurecom! If you’d like to connect to learn more about the Latin American telecom market and how our data can help you, contact us.

Análisis de las tendencias recientes en el mercado de las telecomunicaciones de América Latina

El mercado de las telecomunicaciones de América Latina continúa siendo fascinante de analizar a medida que las velocidades de la banda ancha fija aumentan y los operadores de telefonía móvil preparan sus redes para la tecnología 5G. Mientras esperamos Futurecom, examinamos las velocidades de Internet y la disponibilidad de 4G en el segundo y tercer trimestre de 2019 en los principales mercados de América Latina para ver quién está a la vanguardia del cambio de cara al futuro.

Las velocidades fijas y móviles están aumentando en cada país

LatAm-Mobile-Fixed-Speeds-in-Largest-Markets_ES

Las velocidades de la banda ancha fija están en aumento en los mercados más importantes de América Latina. La velocidad media de descarga de Colombia aumentó un 30,6 % durante el segundo y tercer trimestre de 2019, mientras que la de México se incrementó en un 15,6 %. Chile tuvo la velocidad media de descarga por banda ancha más rápida por lejos y demostró un aumento del 26,7 % en la velocidad durante el período. Brasil fue el segundo más rápido en todo el período. Perú, México y Argentina le siguieron de cerca compitiendo por el tercer puesto, pero al final, ganó Perú. Colombia tuvo la velocidad de descarga por banda ancha fija más lenta.

Las velocidades móviles fueron mucho más competitivas en los mercados más importantes de América Latina. Sin embargo, los aumentos en las velocidades medias de descarga no fueron tan impresionantes como lo fueron los de la banda ancha fija. México tuvo el mayor aumento durante el segundo y tercer trimestre de 2019 con un 12 %. La velocidad de descarga móvil de Argentina aumentó un 11 %, seguida por Brasil (7,9 %), Chile (5,1 %) y Colombia (4,6 %). La velocidad media de descarga móvil de Perú disminuyó un 2,2 % durante el período. México tuvo la velocidad móvil más rápida, seguido por Perú, Brasil, Argentina, Chile y, por último, Colombia.

La disponibilidad de 4G varía ampliamente por país

LatAm-4G-Availability-Q2-Q3_ES

Examinamos el porcentaje de lugares encuestados en donde los dispositivos pudieran acceder al servicio 4G LTE en los principales mercados de América Latina durante el segundo y tercer trimestre de 2019 y concluimos que Perú quedó en la cima con un 77,8 % de disponibilidad de 4G durante el período. Chile quedó segundo con el 75,5 % y Argentina quedó en el tercer lugar con el 71,4 %. Brasil tuvo la menor disponibilidad de 4G con el 47,3 % y Colombia tuvo el segundo nivel más bajo, con el 50,6 %.

Las velocidades de las ciudades varían según la tecnología

Ookla_Internet-Speeds-in-Latin-America-Largetst-Cities_1019_ES

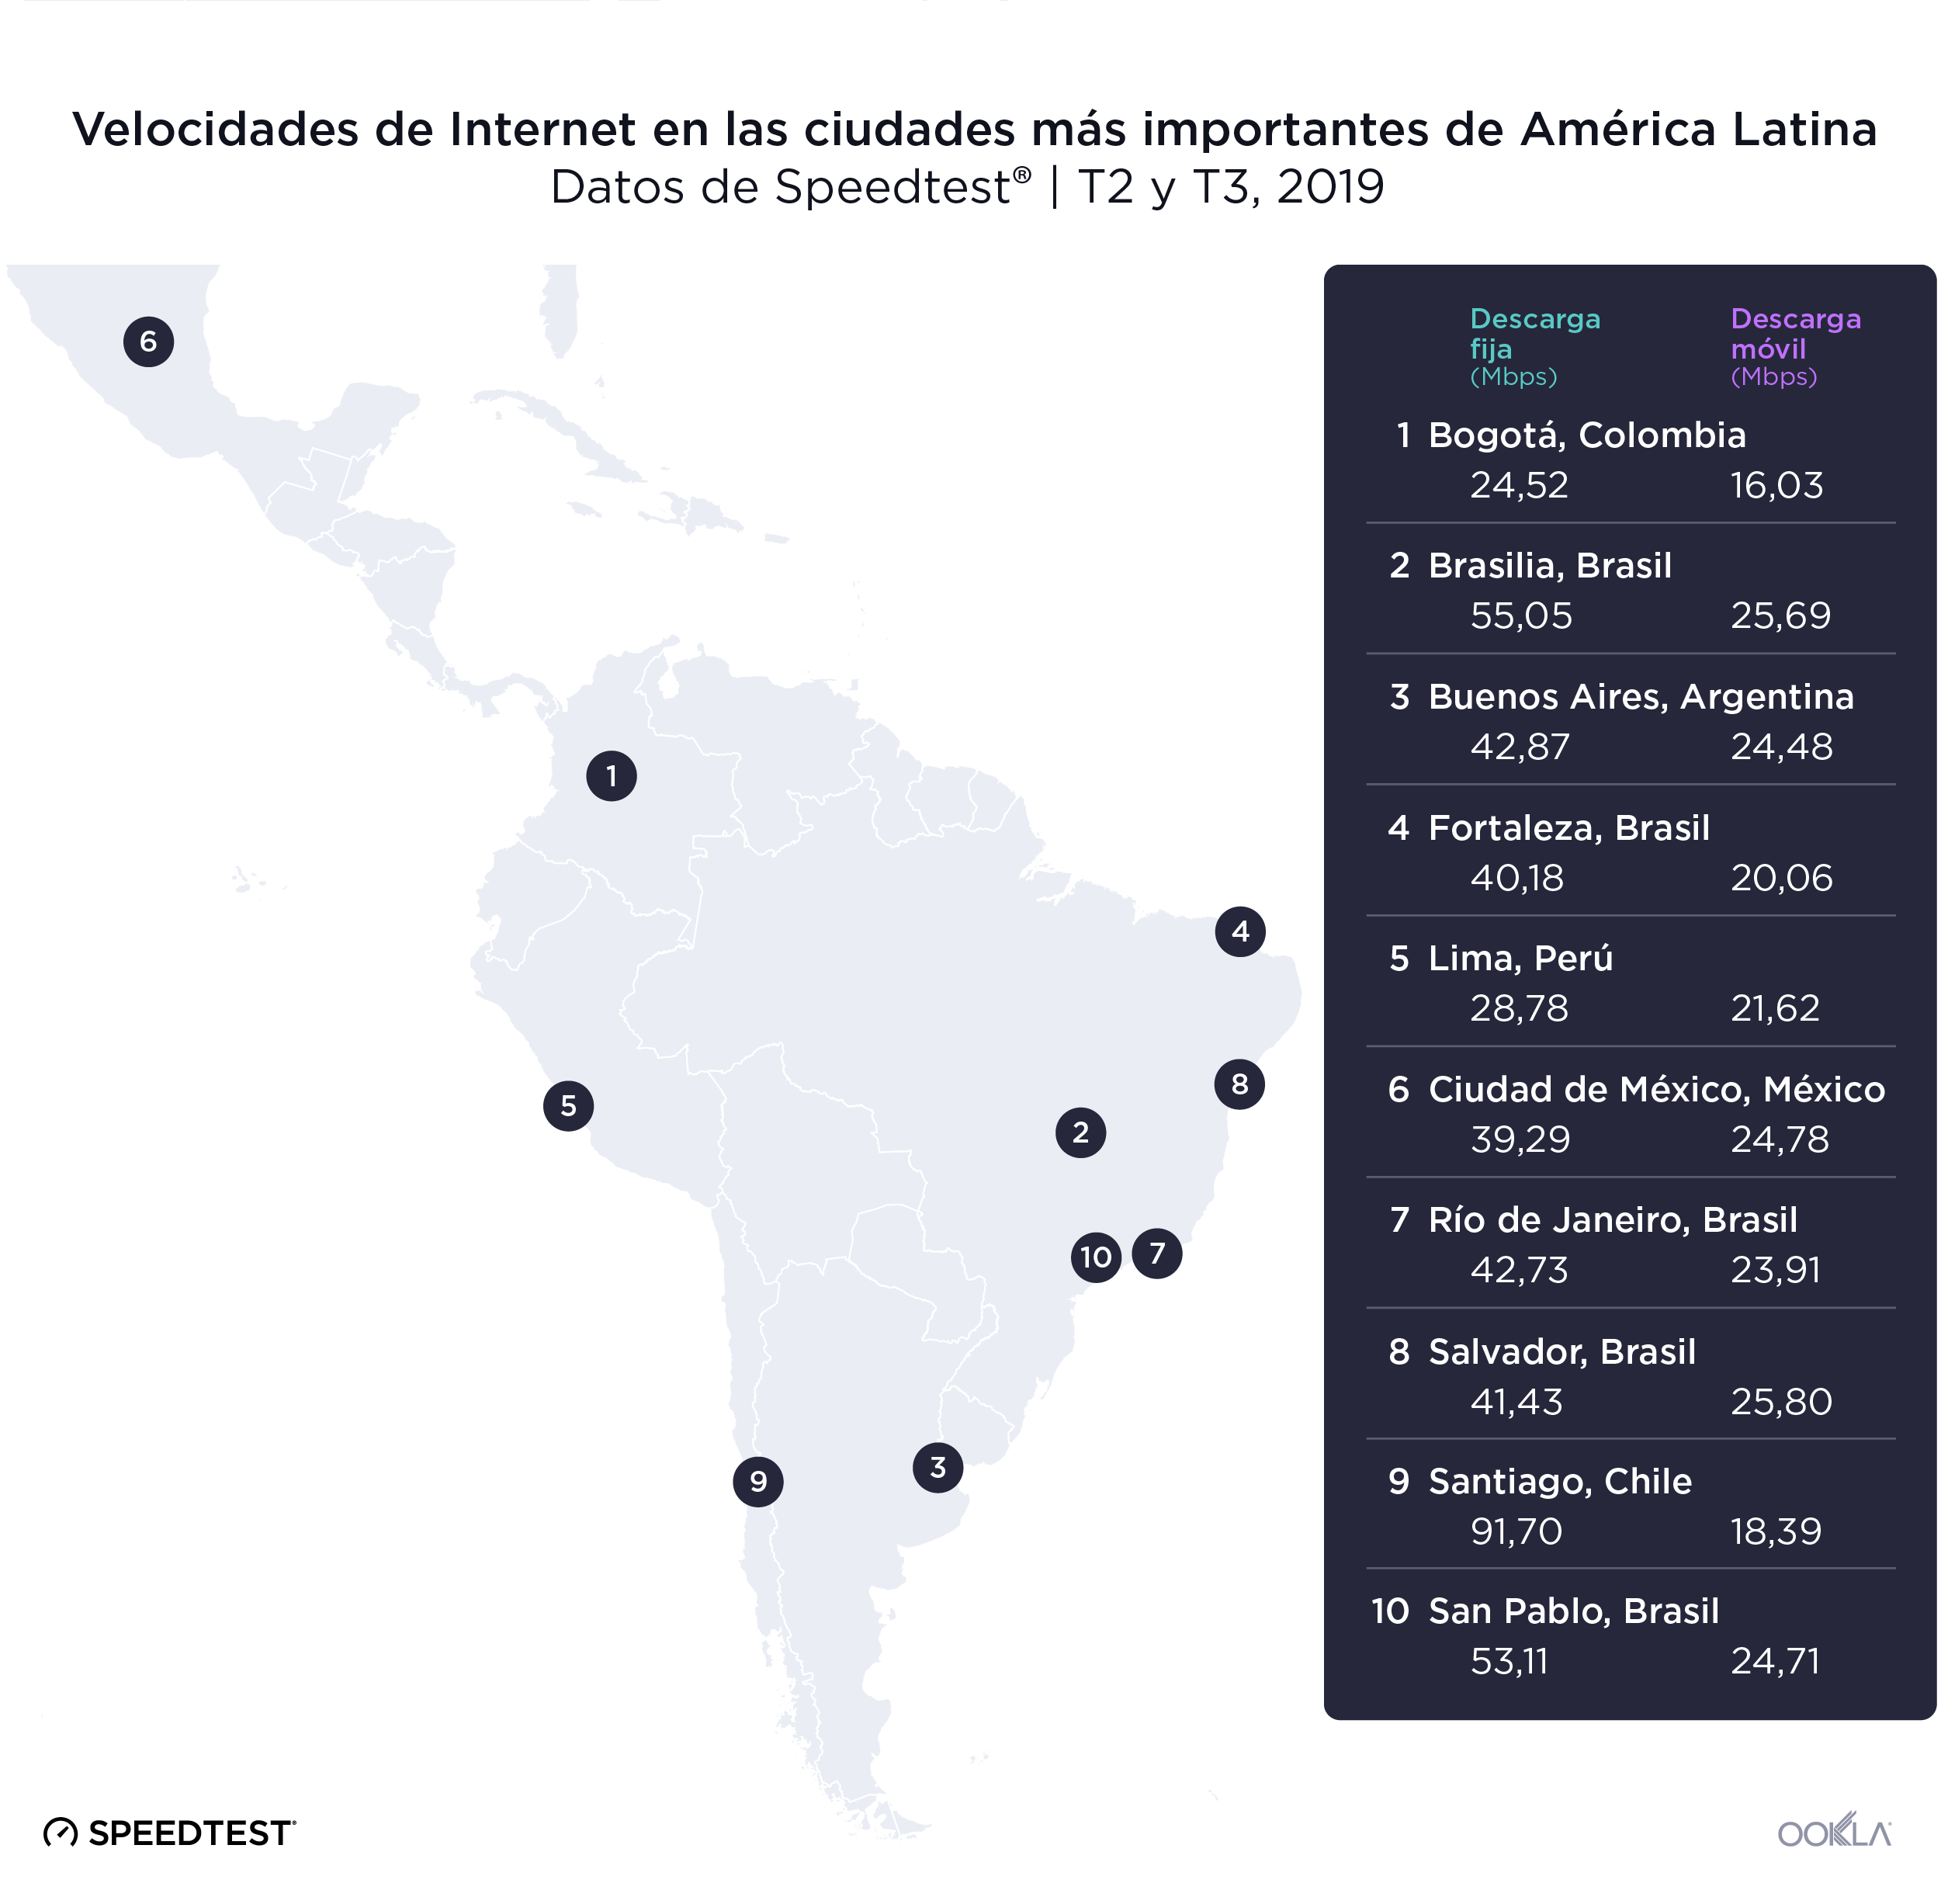
Las velocidades de la banda ancha fija han aumentado drásticamente en las ciudades más importantes de América Latina desde la última vez que las analizamos y estas velocidades han cambiado las clasificaciones de manera significativa. Santiago, Chile, tuvo la mayor velocidad de descarga en banda ancha fija en el segundo y tercer trimestre de 2019, y venció a Brasilia, Brasil, que se quedó con el segundo lugar por el 66.6%. San Pablo, Brasil, quedó en tercer lugar, cerca. Bogotá, Colombia tuvo la velocidad de descarga por banda ancha fija más lenta de las ciudades en nuestra lista. Lima, Perú, fue la segunda ciudad más lenta, y la Ciudad de México, México, la tercera.

Debido a la situación política de Venezuela, no incluimos a Caracas en nuestro análisis.

Las clasificaciones móviles ha cambiado de manera significativa desde la última vez que analizamos las velocidades en las ciudades más importantes de América Latina. Salvador, Brasil, tuvo la velocidad de descarga móvil más rápida en nuestra lista durante este período. Brasilia, Brasil, quedó en segundo lugar por poco, y la Ciudad de México, México, fue la tercera más rápida. Bogotá, Colombia, también tuvo la velocidad de descarga móvil más lenta en nuestra lista. Santiago, Chile, fue la segunda ciudad más lenta en velocidad móvil, y Fortaleza, Brasil, la tercera más lenta.

Ookla estará en Futurecom. Si desean ponerse en contacto para obtener más información sobre el mercado de las telecomunicaciones en América Latina y cómo nuestros datos pueden ayudarlos, comuníquense con nosotros.

Tendências recentes no mercado de telecomunicações da América Latina

O mercado de telecomunicações da América Latina continua fascinante graças ao aumento das velocidades de banda larga e a preparação das redes de operadoras de celular para o 5G. Nas vésperas da Futurecom, analisamos as velocidades da internet e a disponibilidade de redes 4G entre o segundo e o terceiro trimestres de 2019 nos principais mercados da América Latina, para ver quem está liderando essa empreitada em direção ao futuro.

As velocidades de redes fixas e móveis dos países estão aumentando

LatAm-Mobile-Fixed-Speeds-in-Largest-Markets_PT

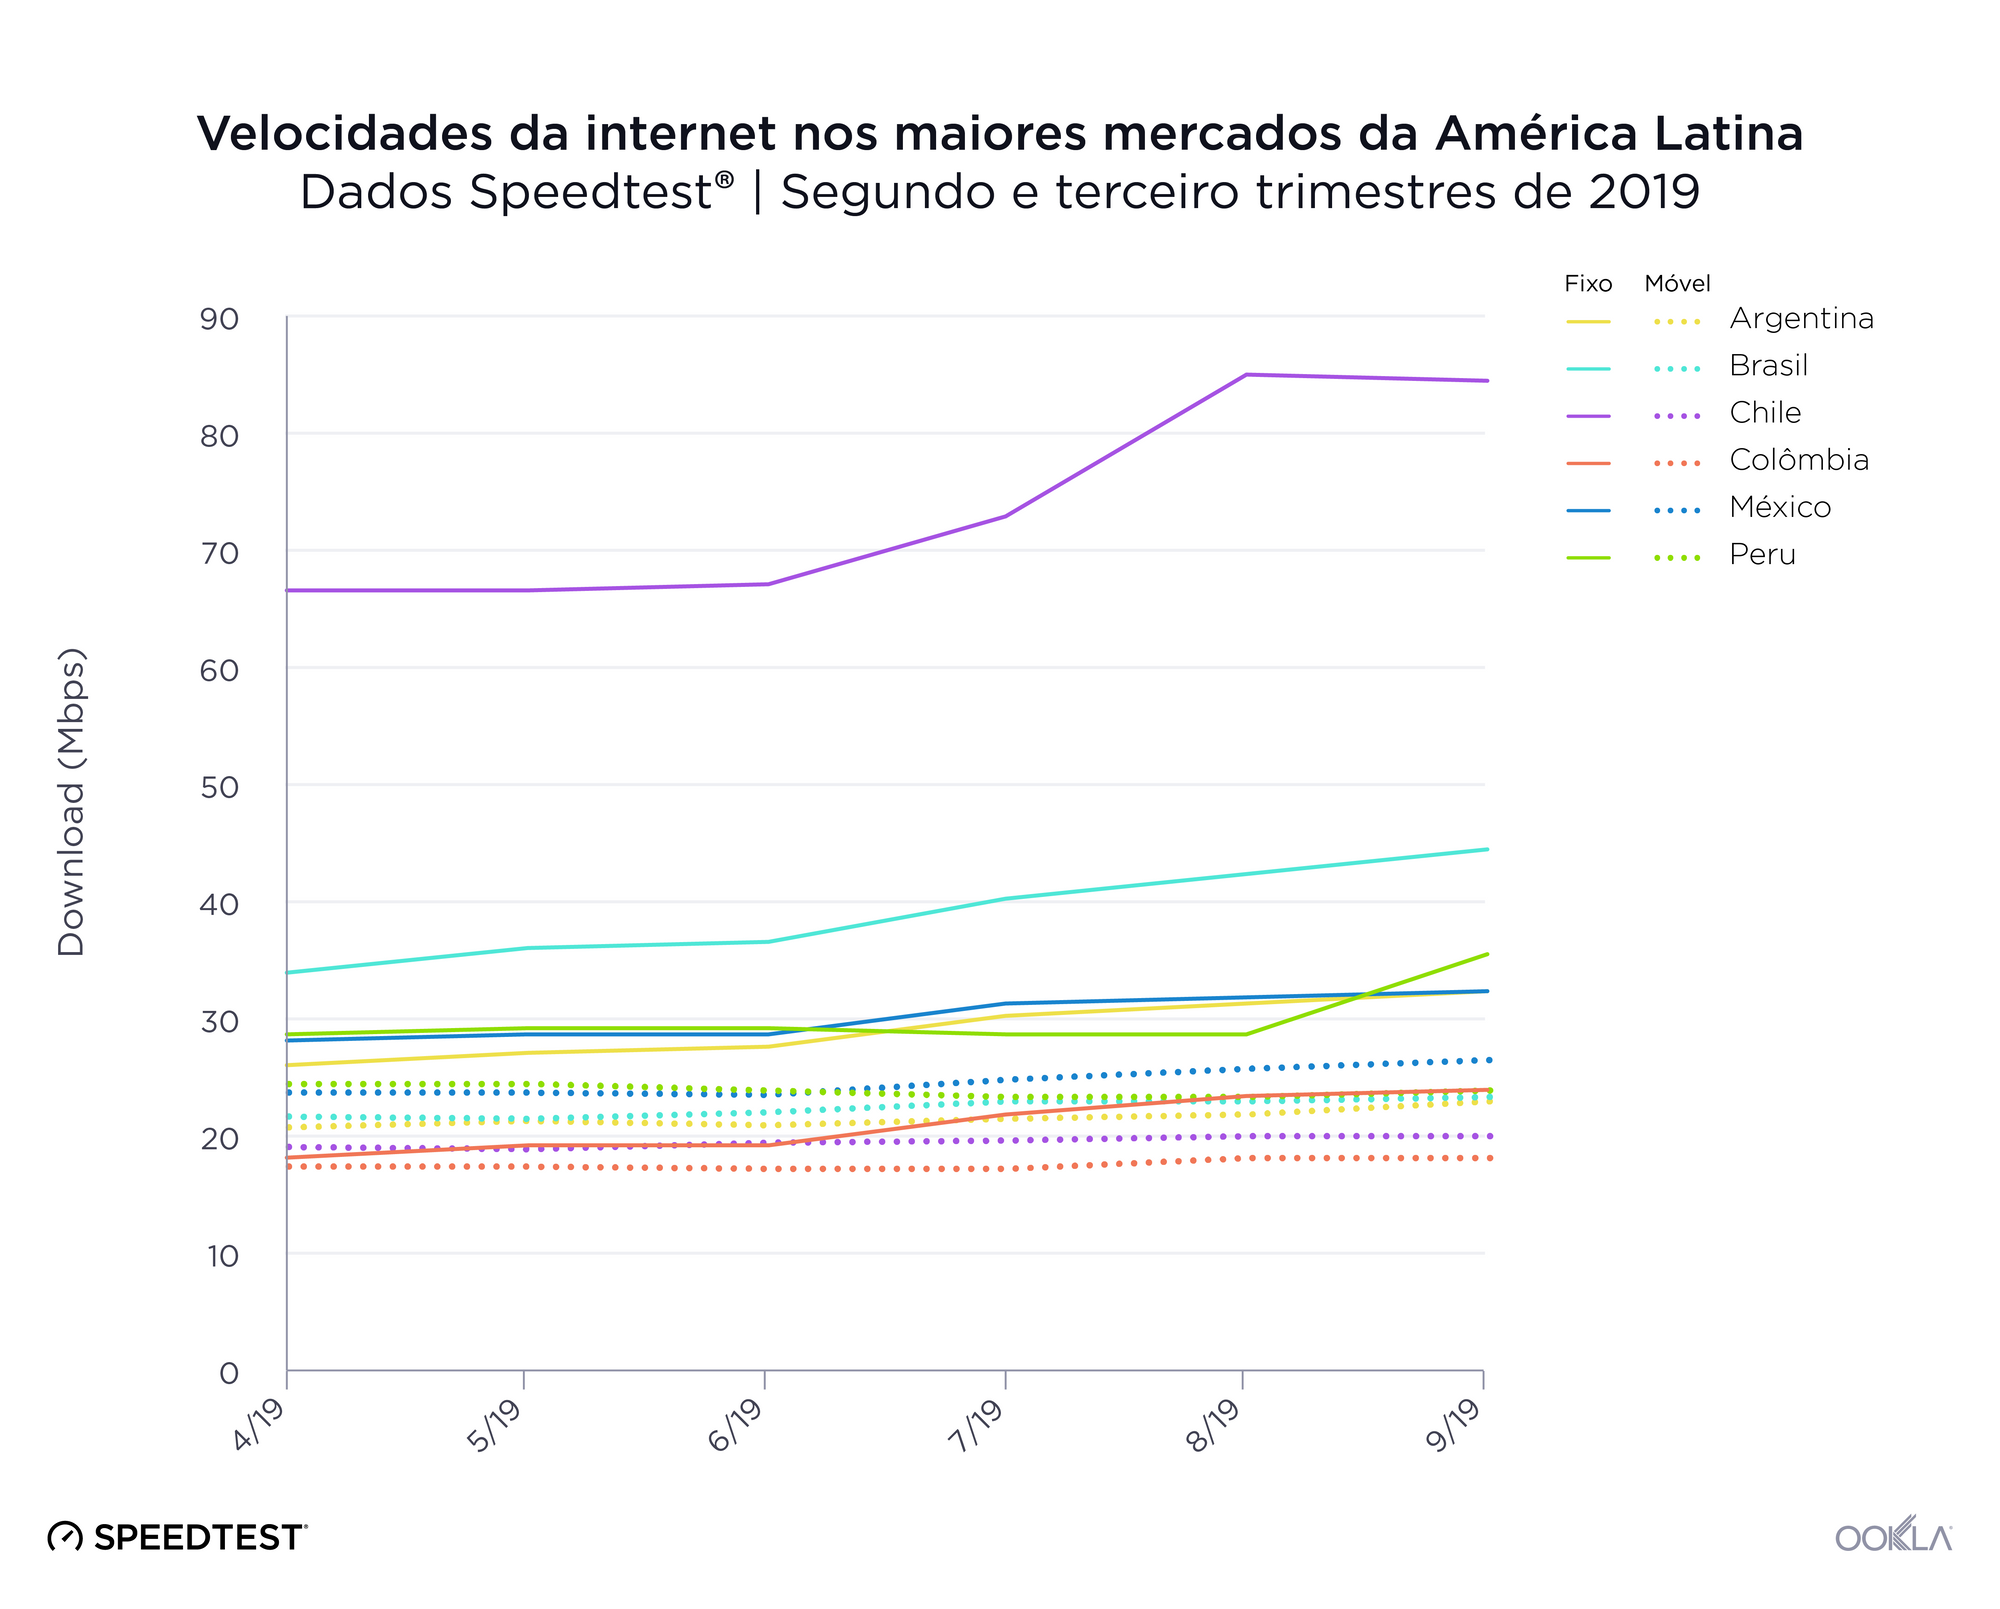
A velocidade da banda larga está aumentando nos maiores mercados da América Latina. A velocidade média de download da Colômbia aumentou 30,6% entre o segundo e o terceiro trimestres de 2019, enquanto no México ela aumentou 15,6%. O Chile teve, de longe, a maior velocidade média de download em banda larga fixa, com um aumento de 26,7% na velocidade durante o período. O Brasil foi o segundo mais rápido durante o período. Peru, México e Argentina disputaram acirradamente o terceiro lugar, mas o Peru acabou vencendo. A Colômbia teve a menor velocidade de download em banda larga fixa.

Houve um aumento na concorrência no setor de velocidades móveis nos maiores mercados da América Latina. No entanto, o aumento na velocidade média de download não foi tão impressionante quanto na banda larga fixa. O México teve o maior aumento entre o segundo e o terceiro trimestres de 2019, com 12%. A velocidade de download móvel da Argentina aumentou 11%, seguida pelo Brasil (7,9%), Chile (5,1%) e Colômbia (4,6%). A velocidade média de download do Peru em rede móvel diminuiu 2,2% durante o período. O México teve a maior velocidade móvel, seguido de Peru, Brasil, Argentina, Chile e, por fim, Colômbia.

Disponibilidade do 4G varia muito conforme o país

LatAm-4G-Availability-Q2-Q3_PT

Analisamos a porcentagem de dispositivos com acesso ao serviço 4G LTE nos maiores mercados da América Latina entre o segundo e o terceiro trimestres de 2019 e descobrimos que o Peru teve a maior disponibilidade do 4G no período, com 77,8%. O Chile ficou em segundo, com 75,5%, enquanto a Argentina ficou em terceiro com 71,4%. O Brasil teve a menor disponibilidade do 4G, com 47,3%, enquanto a Colômbia teve a segunda menor, com 50,6%.

Velocidades no meio urbano variam de acordo com a tecnologia

Ookla_Internet-Speeds-in-Latin-America-Largetst-Cities_1019_PT

A velocidade de banda larga fixa aumentou dramaticamente nas maiores cidades da América Latina desde a nossa última análise, o que alterou os rankings de maneira significativa. Santiago, no Chile, teve a maior velocidade de download em banda larga fixa entre o segundo e terceiro trimestres de 2019, acima do segundo lugar, Brasília, com 66,6%. São Paulo ficou em terceiro lugar, com uma porcentagem próxima. Bogotá, na Colômbia, teve a menor velocidade de download em banda larga fixa nas cidades da lista. Lima, no Peru, teve a segunda menor velocidade, com a Cidade do México, no México, em terceiro.

Devido à situação política da Venezuela, Caracas não foi incluída na análise.

Os rankings de rede móvel mudaram significativamente desde nossa última análise da velocidade nas maiores cidades da América Latina. Salvador teve a maior velocidade de download em rede móvel durante o período. Brasília ficou em segundo lugar por pouco, enquanto a Cidade do México, no México, ficou em terceiro. Bogotá, na Colômbia, também teve a menor velocidade de download em rede móvel na nossa lista. Santiago, no Chile, teve a segunda menor velocidade para redes móveis, seguida por Fortaleza, que teve a terceira menor velocidade.

A Ookla estará na Futurecom! Entre em contato conosco para saber mais sobre o mercado de telecomunicações da América Latina e como nossos dados podem ajudá-lo.

Ookla retains ownership of this article including all of the intellectual property rights, data, content graphs and analysis. This article may not be quoted, reproduced, distributed or published for any commercial purpose without prior consent. Members of the press and others using the findings in this article for non-commercial purposes are welcome to publicly share and link to report information with attribution to Ookla.
| February 27, 2020

Illustrating a Year of Mobile and Fixed Broadband Improvements Around the World (Poster Download)

Mobile and fixed broadband networks change so rapidly it’s easy to overlook how much providers around the world are improving performance and connectivity every year. In celebration of your efforts, we’ve created a downloadable poster that highlights some major industry achievements during 2019.

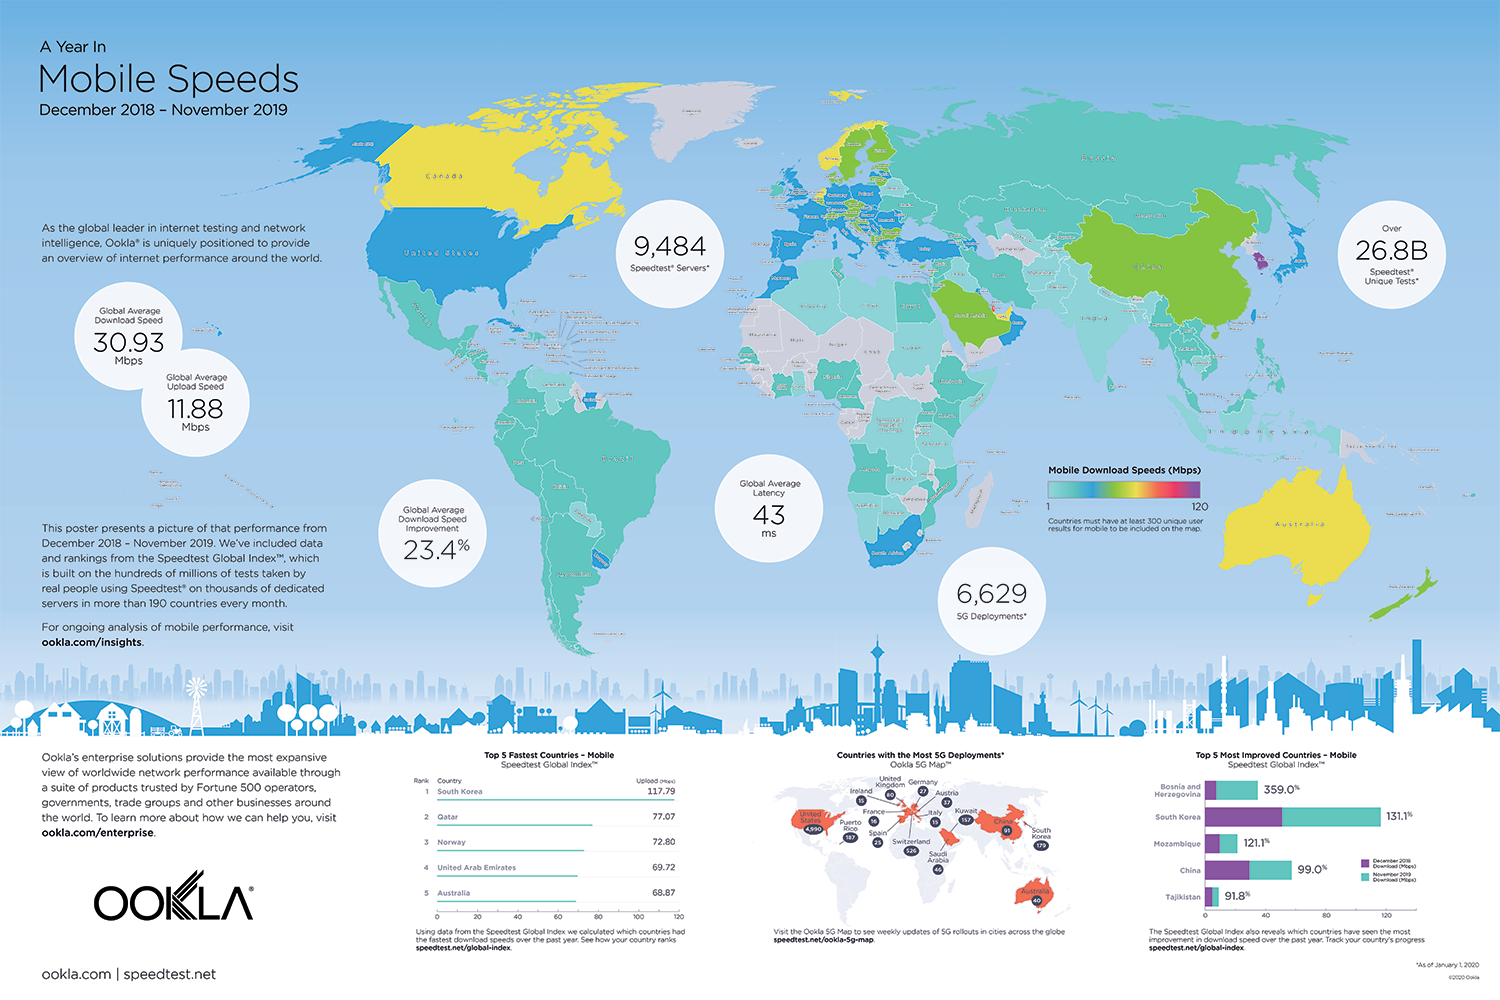
Mobile operators rolled out more than 6,600 5G deployments

Ookla_Mobile-Speeds-Poster_2020
5G was a key effort for many providers around the globe, with 6,629 deployments in 2019. We also saw download speeds increase in most countries. The poster highlights some specific achievements, like Bosnia and Herzegovina’s 359% increase in speed. Visit the Speedtest Global IndexTM to learn even more and to watch worldwide mobile performance continue to improve throughout 2020.

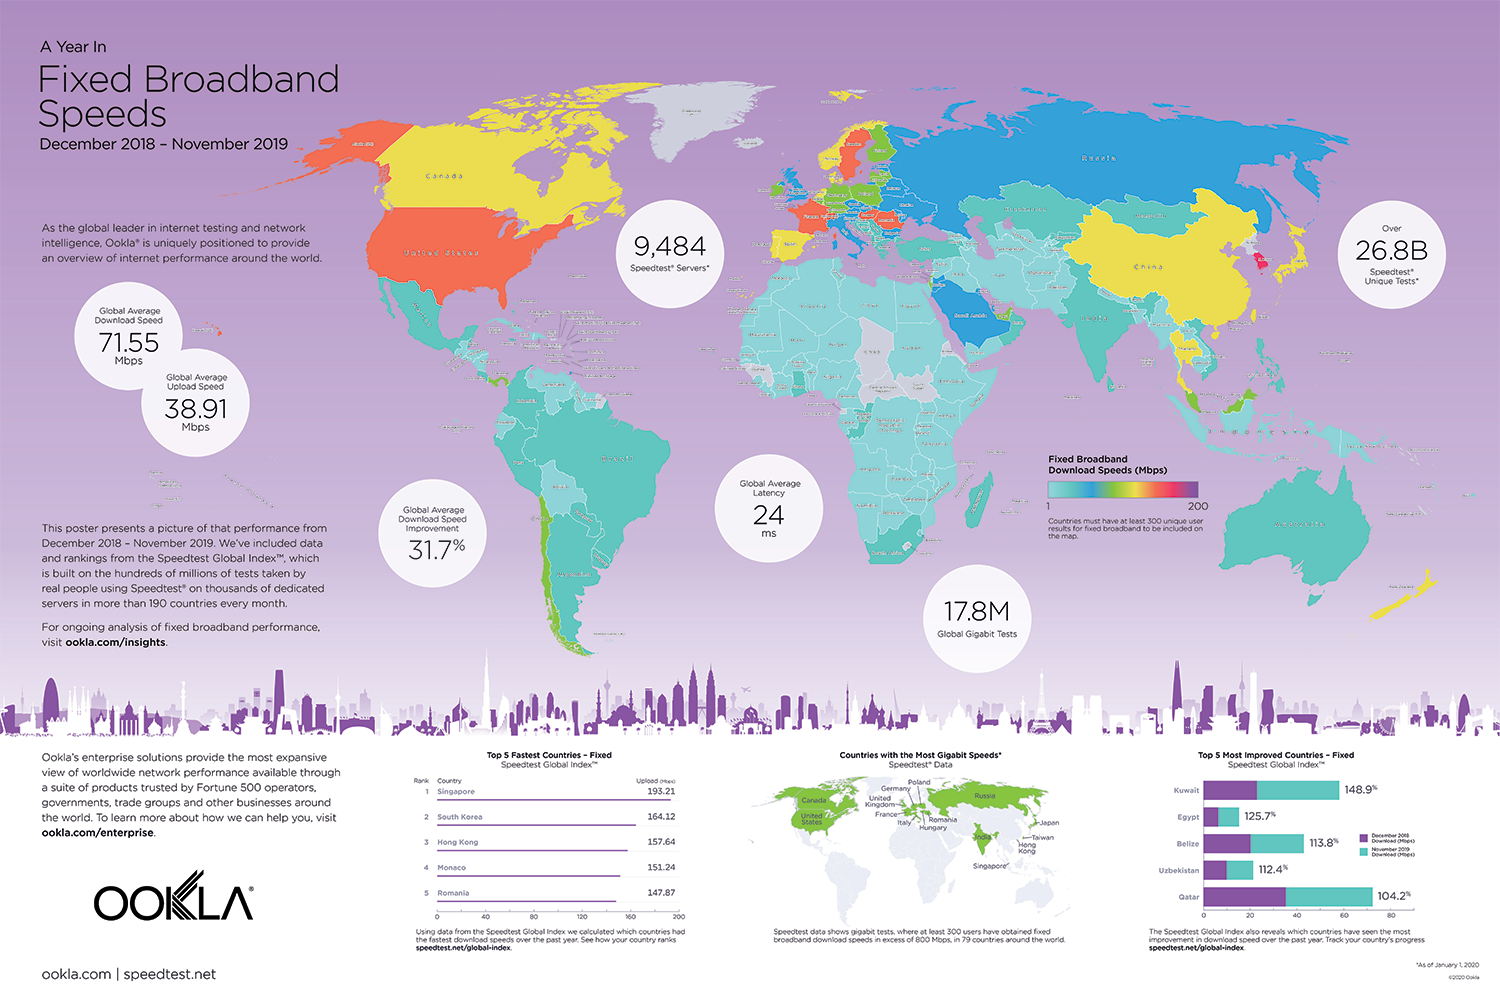
Global fixed broadband download speed increased 31.7%

Ookla_Fixed-Broadband-Speeds-Poster_2020
We saw gigabit-speed Speedtest® results increase exponentially in 2019, which helped drive a global jump in mean download speed over fixed broadband. Singapore was the country with the fastest mean download speed and Kuwait showed the most improvement last year. To stay up to date on performance in specific countries, refer to the Speedtest Global Index for monthly comparisons of internet speeds.

Download Ookla’s Year in Mobile and Fixed Broadband Speeds poster here to see the full picture of network performance, availability and quality around the world. It works as a desktop background or you can hang it on your wall. Congratulations on a banner year in mobile performance, and cheers to even more improvements in 2020!

We want to know what you think. Our team is interested in better understanding who you are and why you use Speedtest. Take this very brief survey to help us improve upcoming product features. Thank you!

Ookla retains ownership of this article including all of the intellectual property rights, data, content graphs and analysis. This article may not be quoted, reproduced, distributed or published for any commercial purpose without prior consent. Members of the press and others using the findings in this article for non-commercial purposes are welcome to publicly share and link to report information with attribution to Ookla.

| October 21, 2019

Exploring Recent Trends in the India Telecom Market

With the release of new fiber-to-the-home services and a strong push by providers to bring 4G to more parts of the country, we decided to check in and see how fixed broadband speed, mobile speed and 4G Availability have looked over the last two quarters in India.

Our analysis includes performance data from 21,096,823 consumer-initiated tests taken with Speedtest® and coverage data from over 2.5 billion coverage scans on 2,436,758 devices during Q2-Q3 2019.

For the first time ever we are also making available for download a detailed report on performance by operator including an in-depth look at peak time performance. Download the full report.

Mobile and fixed speeds are increasing at the country level

India-Mobile-Fixed-Speeds-in-Largest-Markets--1-
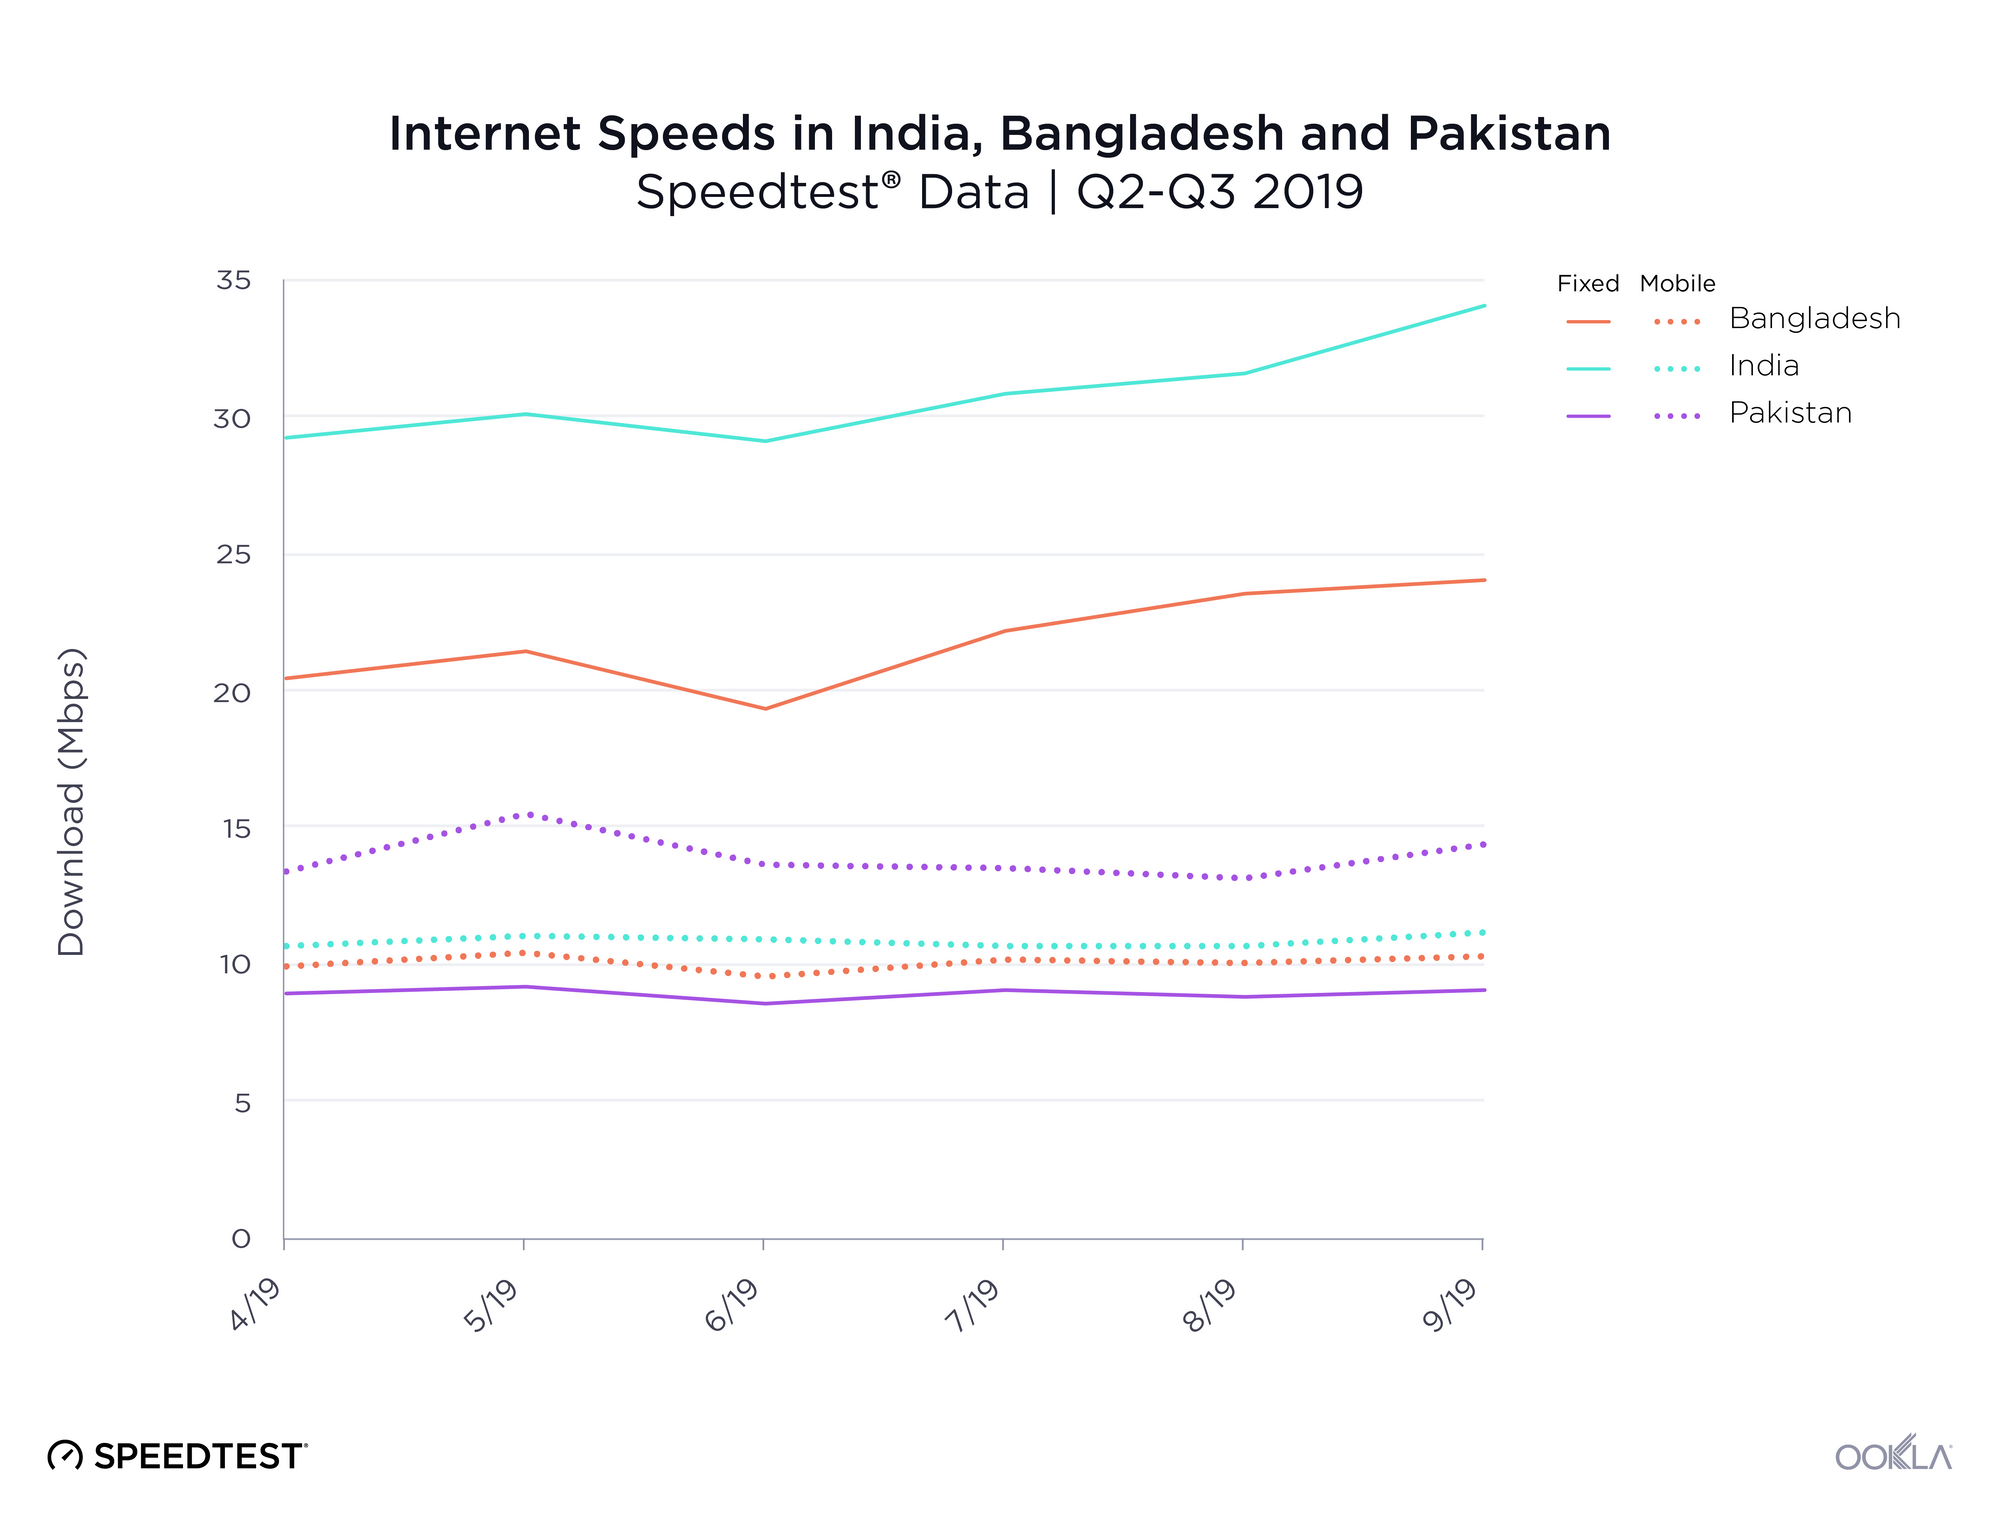
Mean fixed broadband download speeds in India rose 16.5% during Q2-Q3 2019 and topped 34.07 Mbps in September. Compared to Bangladesh, which saw a similar rate of improvement but lower speeds at 24.02 Mbps, and Pakistan, where speeds stayed relatively flat between 8.54 and 9.14 Mbps, India is the regional leader in mean download speed.

With Reliance Jio’s rollout of its new GigaFiber service in India in early September, we will likely continue to see country-wide speeds increase. (Download the full report to compare Jio’s monthly fixed download speeds before and after the launch of GigaFiber.)

However, mobile download speeds were relatively flat in India, fluctuating between 10.63 Mbps and 11.18 Mbps during Q2-Q3 2019. Regionally, India’s mobile performance is marginally faster than Bangladesh’s, which saw average speeds max out at 10.43 Mbps, and somewhat slower than Pakistan’s top speeds of 15.55 Mbps.

4G Availability continues to improve in India

India’s mobile providers are still trying to provide consistent 4G coverage across the country. We compared coverage data for over 231,274,713 samples from Speedtest Android users across Indian mobile operators in Q2-Q3 2019 to benchmark India’s 4G Availability against other markets in the region.

India-4G-Availability-by-Country

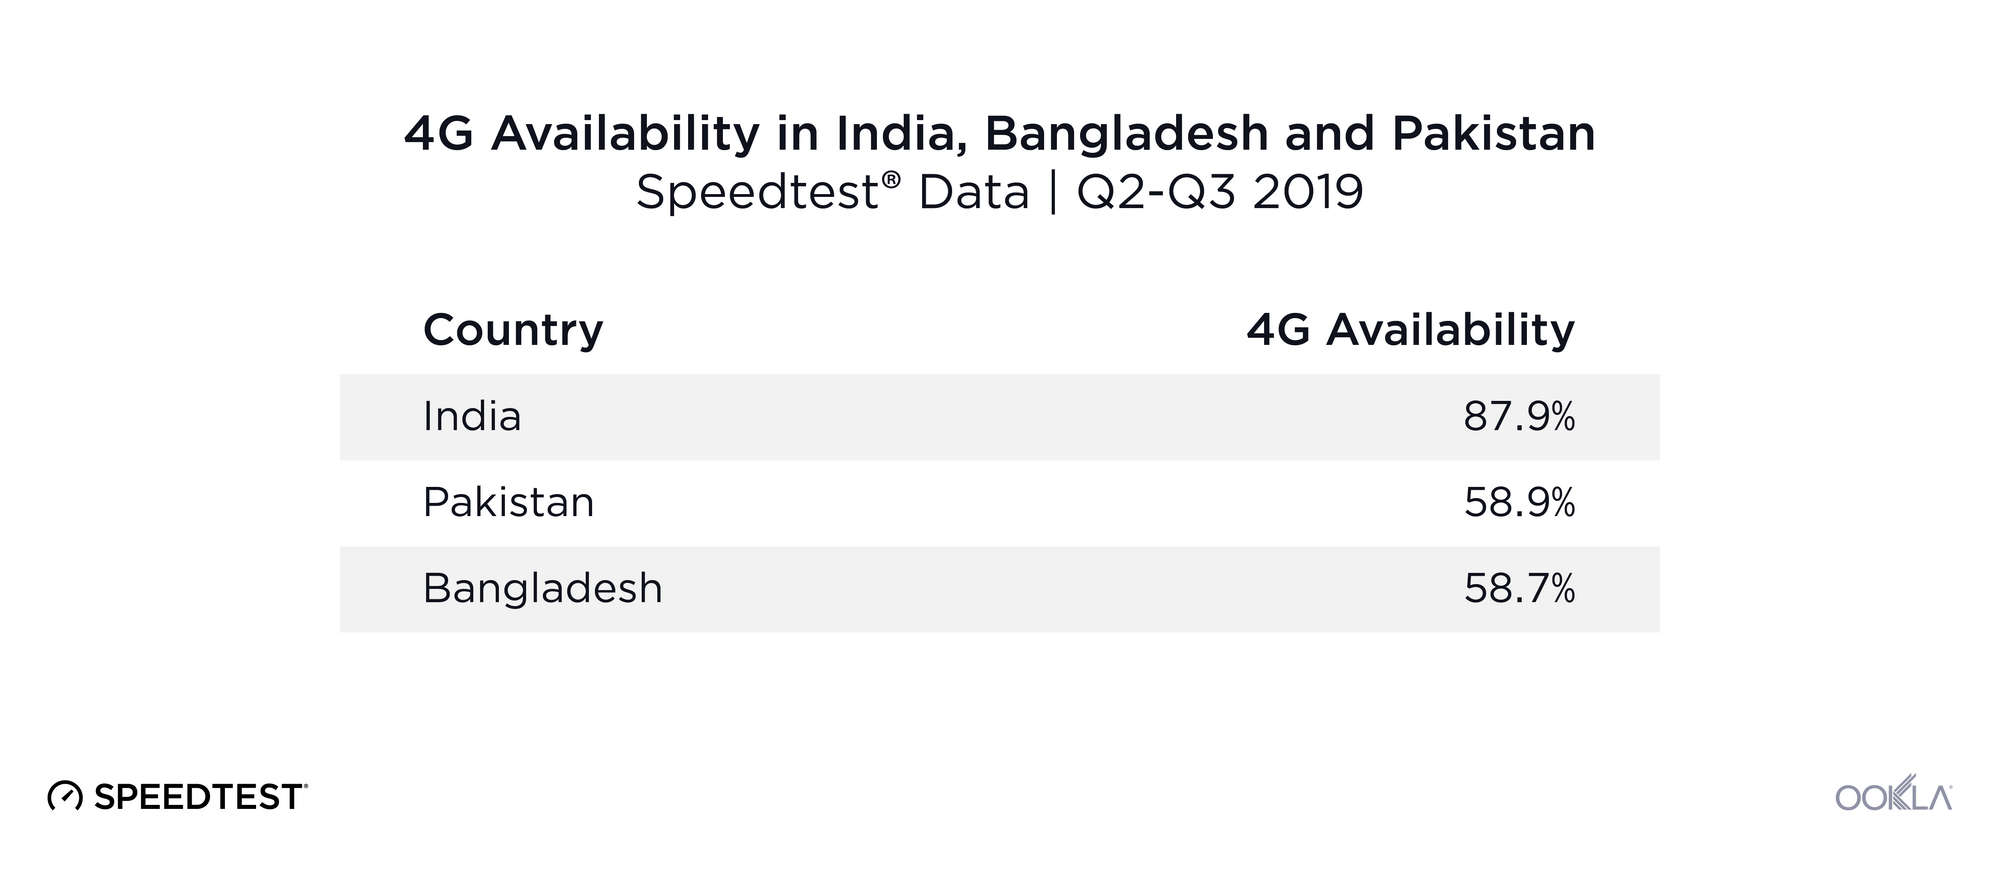
4G Availability is the percentage of an operator’s known locations where a device has access to LTE service (including roaming). India’s 4G Availability was relatively high at 87.9% across providers during Q2-Q3 2019. That means that Speedtest users had access to LTE service at 87.9% of surveyed locations. For comparison, 4G Availability was 58.9% in Pakistan and 58.7% in Bangladesh during the same period.

Fixed broadband speeds show wide disparities between India’s largest cities

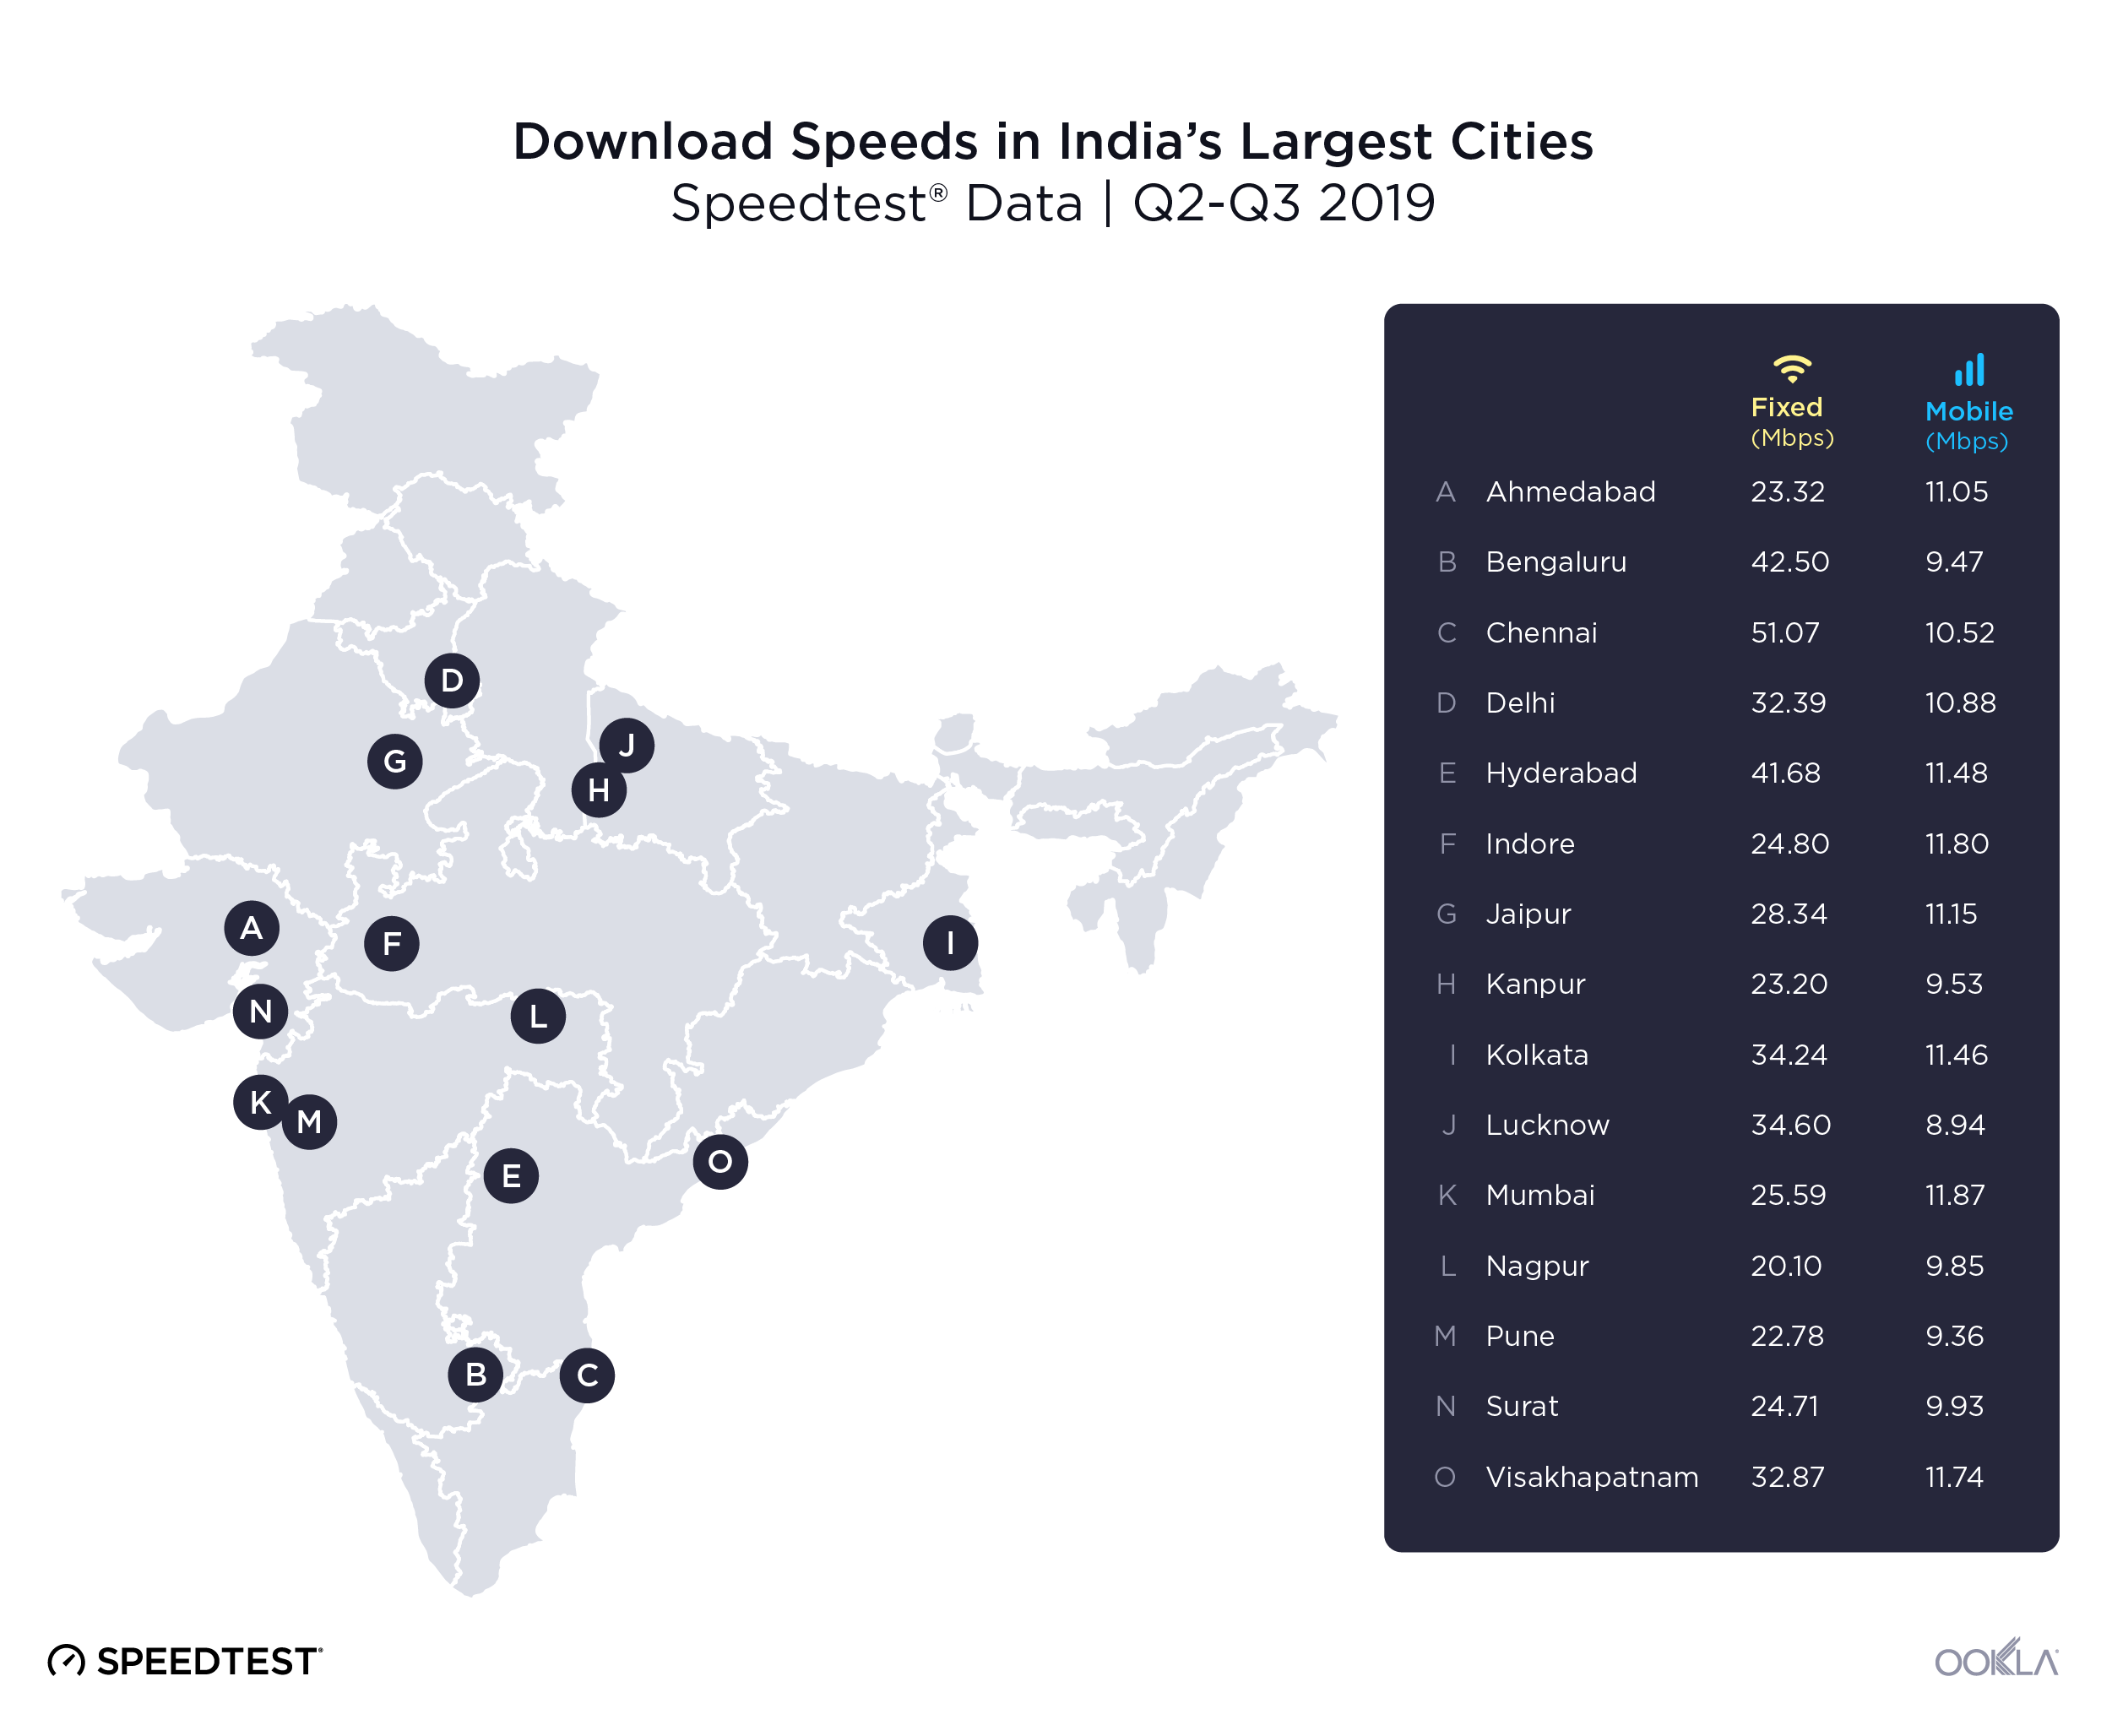
In a country as large as India, country-wide averages factor in many regional differences. To get a clearer picture of how consumers experience the internet across the country, we looked at fixed and mobile download speeds in the 15 largest cities in India during Q2-Q3 2019.

Ookla_Internet-Speeds-in-India---Largest-Cities-2

Chennai had by far the fastest mean download speed over fixed broadband (51.07 Mbps), followed by Bengaluru (42.50 Mbps) and Hyderabad (41.68 Mbps). The slowest download speeds on our list were measured in Nagpur (20.10 Mbps), followed by Pune (22.78 Mbps) and Kanpur (23.20 Mbps).

Mobile download speeds — which include all cellular technologies — showed somewhat less variation from city to city. Mumbai (11.87 Mbps), Indore (11.80 Mbps), Visakhapatnam (11.74 Mbps), Hyderabad (11.48) and Kolkata (11.46 Mbps) had the fastest mobile download speeds. The slowest mean download speed on our list was measured in Lucknow (8.94 Mbps).

Want to see which ISPs and mobile operators were fastest in each city, plus a breakdown of how operators perform at peak times of network congestion, based on signal metrics? Download the full report.

Ookla retains ownership of this article including all of the intellectual property rights, data, content graphs and analysis. This article may not be quoted, reproduced, distributed or published for any commercial purpose without prior consent. Members of the press and others using the findings in this article for non-commercial purposes are welcome to publicly share and link to report information with attribution to Ookla.

| August 10, 2017

How Norway Came to Have the Fastest Mobile Internet in the World

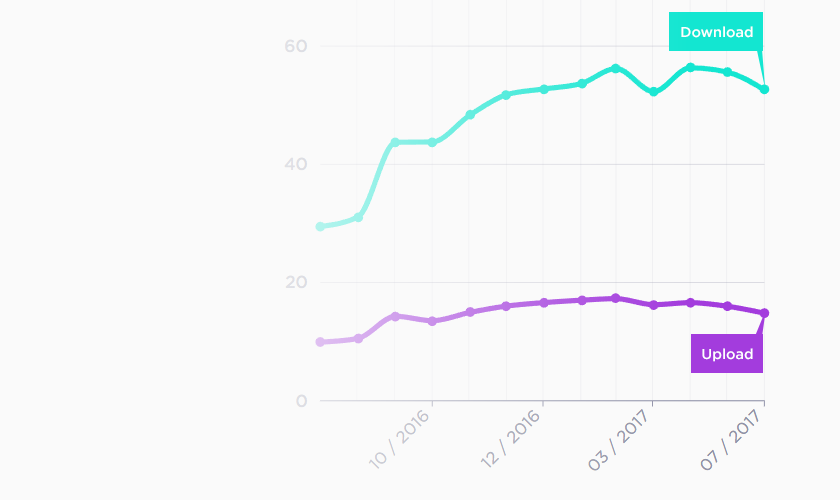
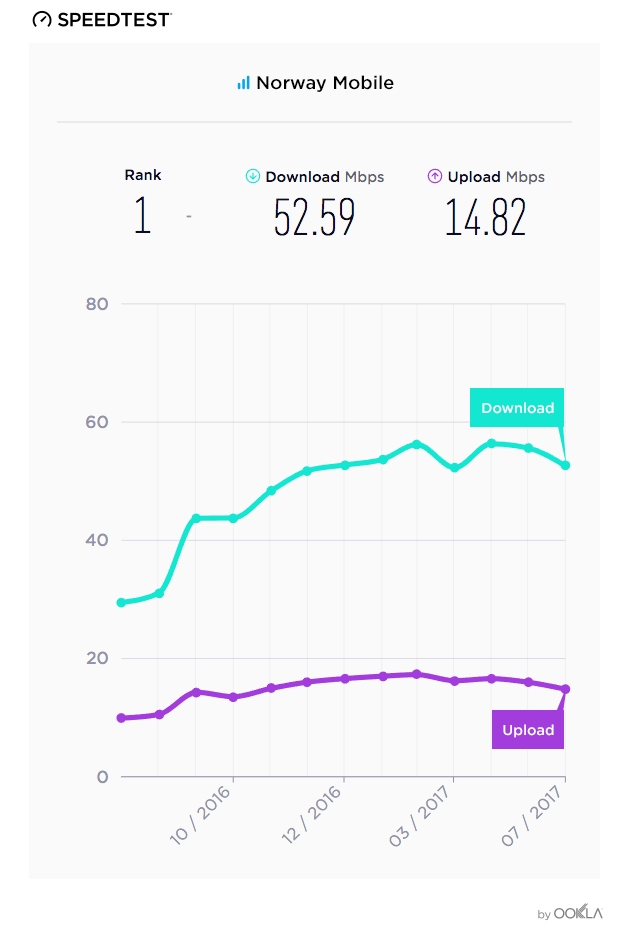
Thirteen months ago Norway did not have the fastest mobile internet speeds in the world. In fact, with an average download speed of 31.09 Mbps, the country ranked only 11th globally for mobile speeds in August 2016. By September 2016, however, the country’s average download speed had jumped 41% to 43.73 Mbps which ranked Norway #1 in the world for mobile download speed. This has continued to increase over the last year to 52.59 Mbps in July 2017 and Norway has maintained that first place ranking with a significant lead.

That’s an impressive 69% year-over-year gain for download speeds, and it begs the question: what caused the increase?

Telenor leads the way

On September 4, 2016, Telenor removed a cap on mobile speeds. According to Telenor’s Head of Mobile, Bjørn Ivar Moen, Telenor originally had rate limits on some plans to allow customers to choose from a range of subscription options.

Ultimately, though, Moen says “We knew we had the best and fastest mobile network in Norway and felt it was wrong not to give this advantage to our customers. We also felt comfortable that the network would handle max speed to all our customers due to the job done on capacity and coverage in the network all over Norway.”

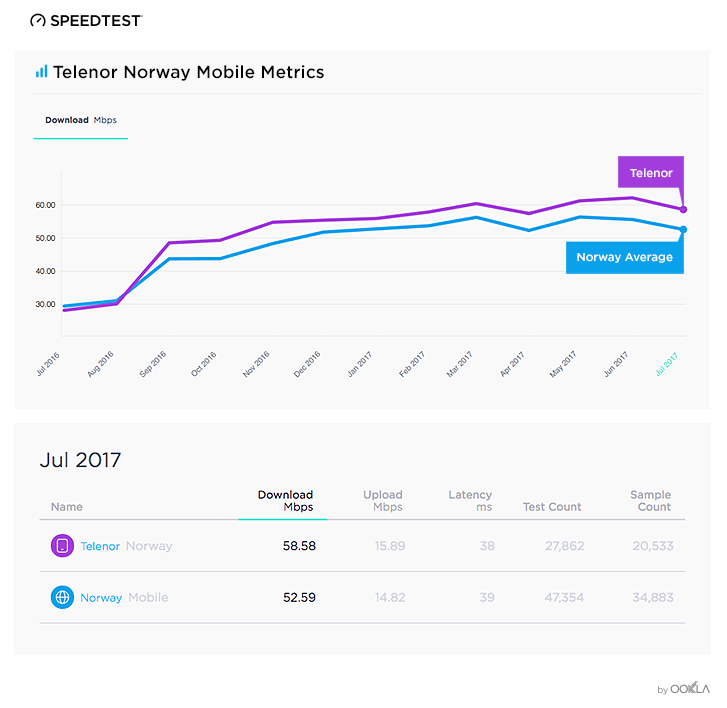
The graph below shows that Norway’s sudden climb to #1 on the Speedtest Global Index is directly related to that jump in Telenor’s mobile speeds.

Norway and Telenor

And customers are happy. According to Moen, customers reported that the ability “to use the network with real 4G+ speed and coverage was really felt as a difference in their daily use.” Moen also said Telenor has seen no negative effects from uncapping these speeds.

What about other mobile carriers?

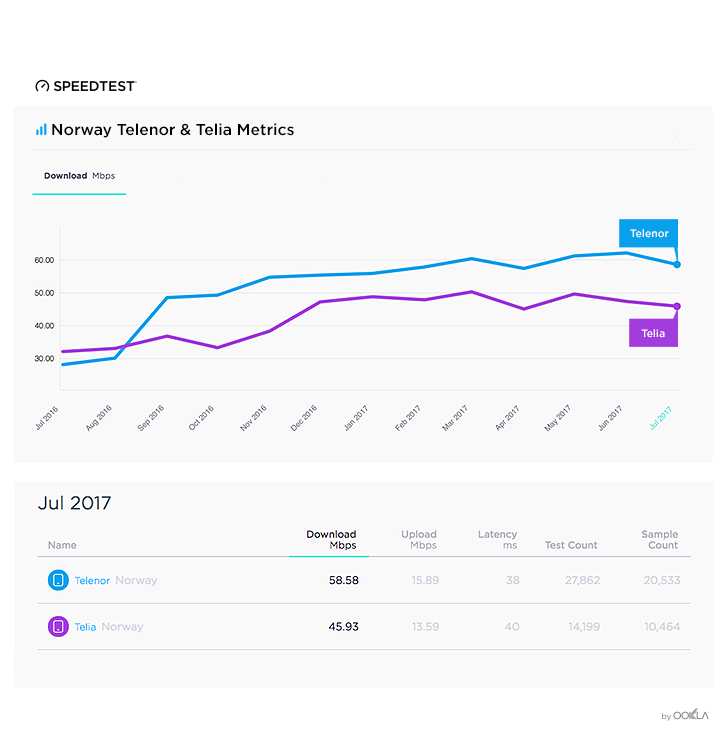
Being the fastest country in the world requires more than just one fast carrier. Though Telenor has offered the fastest mobile speeds in Norway ever since, second place Telia also increased their speeds significantly in 2016. Looking at download speeds on all devices, Telia’s mobile speed increased 42% from 33.34 Mbps in October 2016 to 47.24 Mbps in December 2016.

Telenor & Telia

The fast mobile speeds that Telenor and Telia are achieving are especially impressive considering the mountains and fjords of Norway, geographical challenges that carriers in other countries don’t necessarily have to face.

Broader benefits of fast speeds

The work these two carriers did to put Norway in first place in the world for mobile speeds for the last year benefits not just their customers but the country as a whole.

Having the fastest mobile speeds in the world creates a favorable climate for new digital solutions in all areas of society — from health care and transportation to entertainment services. We can’t wait to see what innovations develop as a result and how other carriers and markets follow suit.

Are there other stories like this?

Yes! There are many interesting stories like this happening behind the scenes all the time in the telecom market. Our new site, Speedtest Global Index, can help pinpoint increases and drops in internet speeds that signal market shifts on a country level. Check it out today.

Ookla retains ownership of this article including all of the intellectual property rights, data, content graphs and analysis. This article may not be quoted, reproduced, distributed or published for any commercial purpose without prior consent. Members of the press and others using the findings in this article for non-commercial purposes are welcome to publicly share and link to report information with attribution to Ookla.

| September 12, 2017

The Inside Story on U.K. Internet Speeds

You may have read in Speedtest Global Index that the United Kingdom has the 41st fastest mobile download speed and the 25th fastest fixed broadband speed in the world for the month of August. This is true, but the U.K.’s complex geography makes the story much more nuanced than that. This month we’ve gone beyond the country-level statistics available in the Speedtest Global Index to give you a peek at the deeper story.

Mobile speeds are relatively even

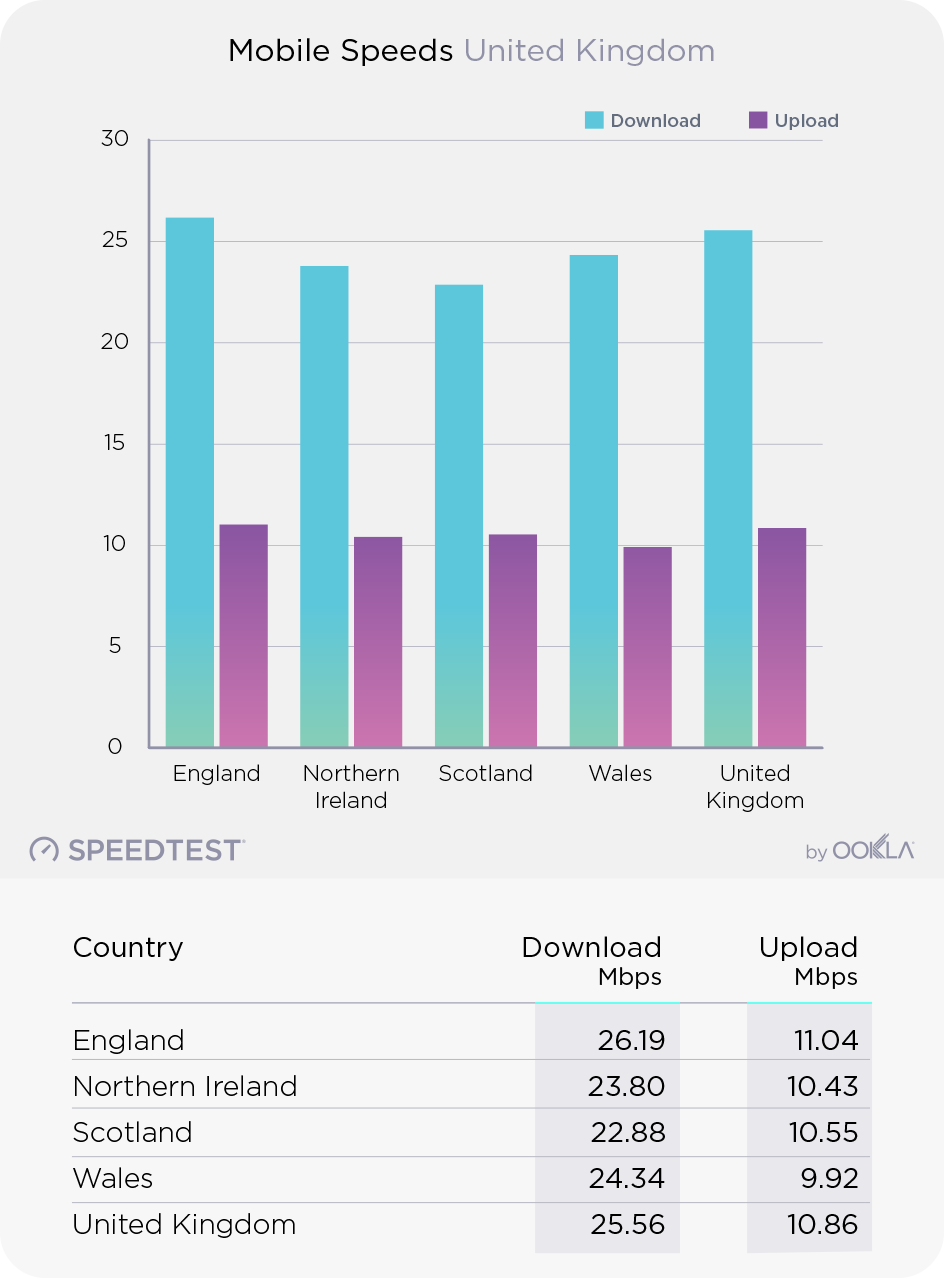
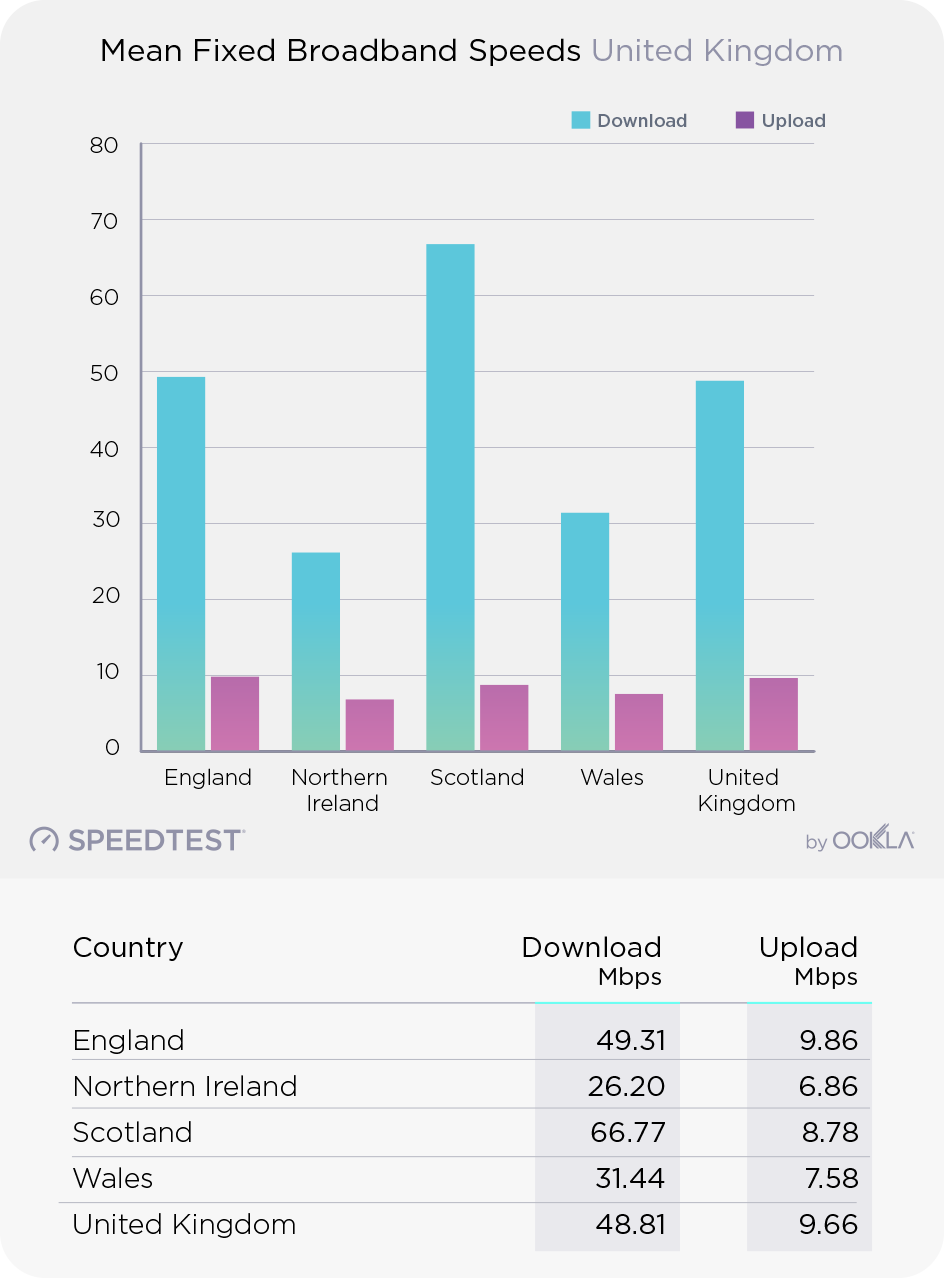
Average mobile speeds across the four countries of the U.K. didn’t actually vary that much during the month of August 2017. Downloads in England are 2.5% faster than the UK as a whole. In Scotland, they are 10.5% slower than the UK average, 6.9% slower in Northern Ireland and 4.8% slower in Wales. But even in Scotland, the download speed is decent. Mobile upload speeds don’t fluctuate, either from England’s 1.7% faster than U.K. average to Wales 8.7% slower than U.K. average.

Mobile Speeds United Kingdom

This does not mean that all mobile internet users in the U.K. connect at these speeds, even on a country-level. In June, Ofcom published a report saying that 56% of rural users in the U.K. were satisfied with their mobile service, compared with 72% of urban users.

Fixed broadband speeds vary… a lot

England’s mean download and upload speeds over fixed broadband are on par with those in the U.K. as a whole, but that’s where the story of relatively comparable internet speeds across the U.K. breaks down.

Scotland’s fixed broadband speed is a whopping 36.8% faster than the U.K. average. Download speeds in Wales and Northern Ireland, on the other hand, are 35.6% and 46.3% slower than the U.K. average. Northern Ireland’s average is slower than Ofcom’s 30 Mbps superfast designation and Wales’s average is not much better. Upload speeds in these two areas are 21.5% and 29.0% slower, respectively, than the U.K. average.

Fixed Mean Speeds United Kingdom

About those slow areas…

The government of Wales has been working on project Superfast Cymru to bring “access to high speed broadband to the majority of homes and businesses in Wales that cannot get it through the private sector’s own commercial programmes.” And the BBC reported in March 2017 that “Speeds of 24Mbps plus are now available in about nine out of every 10 homes and businesses in Wales.”

Northern Ireland has undertaken a similar endeavor with the Superfast Rollout Project and in December 2016, Ofcom’s Northern Ireland director wrote that superfast broadband was available to eight in 10 homes in Northern Ireland.

But these projects have been rolling out for awhile, and while nearly 650,000 Welsh premises newly had access courtesy of Superfast Cymru, download speeds in Wales only increased 12.8% over the last year. The Northern Ireland Broadband Improvement Project has been under way since February 2014 and the past year saw an increase of only 15.2% in download speeds. These compare with increases of 33.3% in England and 63.5% in Scotland during the same period.

So why are internet speeds still so different?

Subscription rates

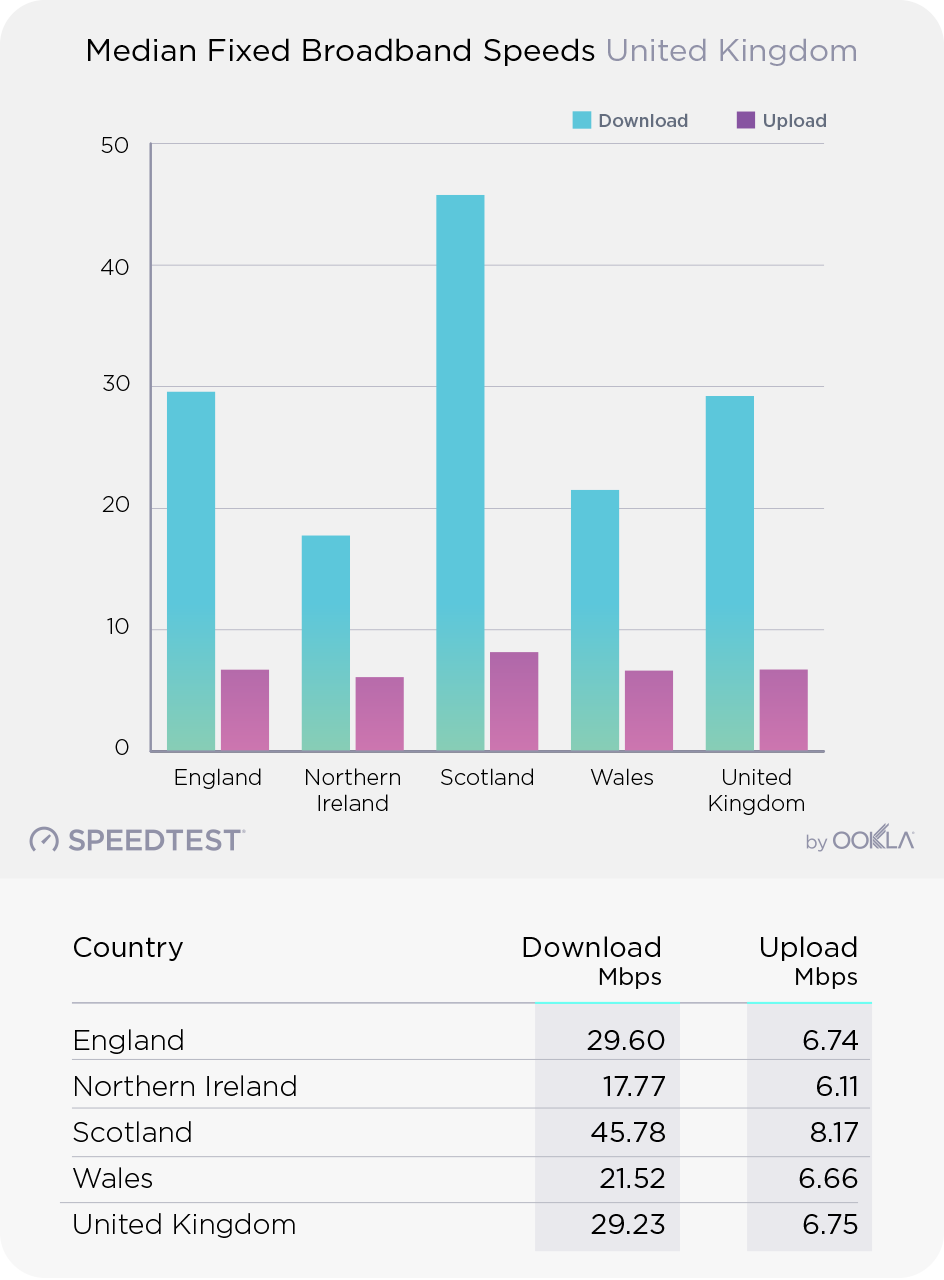
Access does not mean that people are subscribing to higher tier plans. For example, the House of Commons library reported that seven out of ten of the slowest council wards in the U.K. were in Wales. This is borne out when we look at median speeds rather than mean speeds:

MedianFixed Speeds United Kingdom
Because the median speeds are the most frequently occurring speeds, these numbers more accurately reflect what people are subscribing to, not what they could achieve in a given location.

Rural population

Extending fiber to rural areas can be expensive and not all providers are willing to invest in areas with smaller populations where the rate of return is likely to be lower.

Looking at rural population statistics from across the U.K., this could be one reason why service is slower in Northern Ireland and Wales. In Northern Ireland, 33.2% of people lived in areas with a population of 3,000 or less. Compare that with Scotland’s 18% or England where 17.6% of people lived in areas of 10,000 or less. In Wales that number is closer to 32%. Urban vs. rural designations in Wales are a bit more tricky, but the Government of Wales considers a combination of areas designated as “less sparse rural” and three subsets of “sparsest” areas to be rural; that combination of areas houses 20.5% of the Welsh population.

These numbers don’t necessarily mean that higher percentages of rural population leads to slower fixed broadband speeds, but there is a correlation.

Whatever the cause of the wide difference in fixed broadband speeds across countries of the U.K., it’s clear that Wales and Northern Ireland still have a lot of catching up to do, particularly if they want to take full advantage of the digital economy.

Ookla retains ownership of this article including all of the intellectual property rights, data, content graphs and analysis. This article may not be quoted, reproduced, distributed or published for any commercial purpose without prior consent. Members of the press and others using the findings in this article for non-commercial purposes are welcome to publicly share and link to report information with attribution to Ookla.
| September 26, 2018

These Small Countries are Leading Broadband Speeds

One of our missions at Ookla® is to improve internet speeds around the world by giving people direct access to the speed of their connection via our flagship product Speedtest®. We’re very proud of having inspired Telenor to boost mobile speeds in Norway, fueling the debate over Australia’s National Broadband Network and providing the independent data that has impacted technology policy in Scotland, to name a few.

Besides articles here on Speedtest Insights, one of the primary ways we publicly share this data is through the Speedtest Global Index. But some places that don’t qualify for the Global Index — either because they aren’t UN Member States or Permanent Observers or they don’t meet the monthly unique user counts (670 results for mobile and 3,333 for fixed broadband) — still have fantastic internet speed stories to tell…

Except where noted, all of the following stories are based on Speedtest Intelligence™ data from Q1-Q2 2018.

Rapid rises in Andorra’s fixed broadband speeds

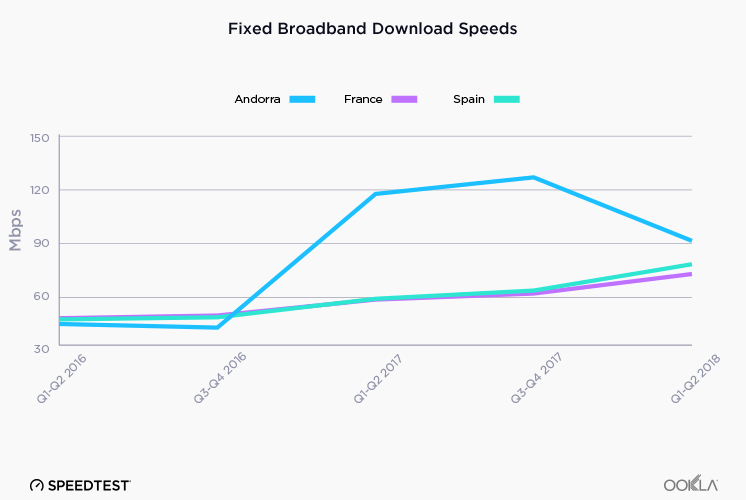
Two years ago, fixed broadband speeds in the Principality of Andorra were unremarkable and the country’s mean download speed lagged about 5 Mbps behind neighboring France and Spain. Then Andorra Telecom completed a renovation of its fiber optic network and download speeds shot up. They’ve since slowed a little, something that often happens as customers pile onto faster connections, but Andorra’s mean download speed of 89.39 Mbps in August 2018 beats Spain’s by 17.5% and France’s by 26.8%.

“Fixed Broadband Download Speeds” Subtitle: Andorra, France and Spain”

Jersey’s fixed broadband skyrockets practically overnight

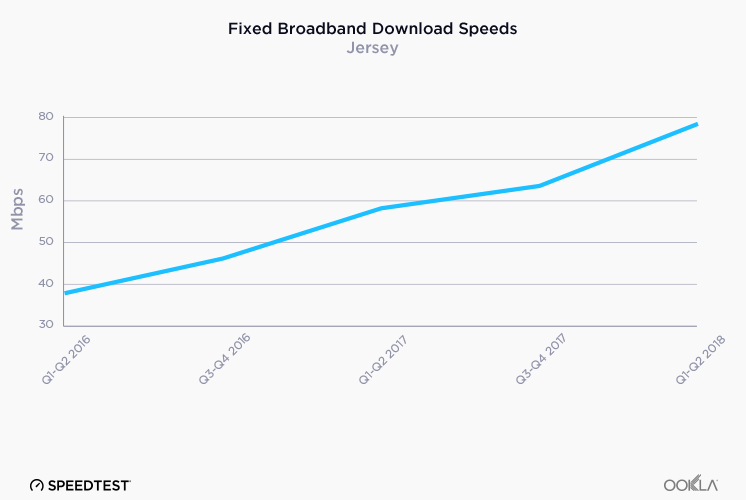
Fixed broadband speeds on the island of Jersey (the largest of the Channel Islands, situated in the English Channel) were on a steady upward trend, seeing a 106% increase between Q1-Q2 2016 and Q1-Q2 2018.

“Fixed Broadband Download Speeds” Subtitle: Jersey”

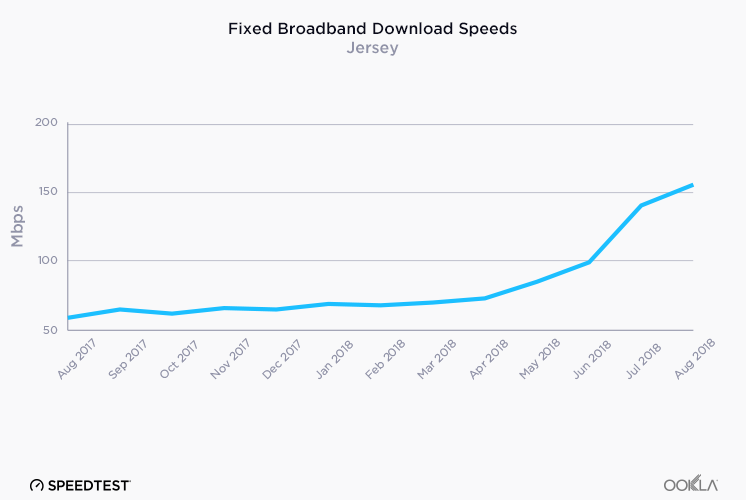
However, between June and August 2018 the download speed jumped a further 56.6% to reach a mean of 155.41 Mbps.

“Fixed Broadband Download Speeds” Subtitle: Jersey”

This jump coincides with a full-fiber rollout across the island.

Monaco makes a long-term bet on fixed broadband

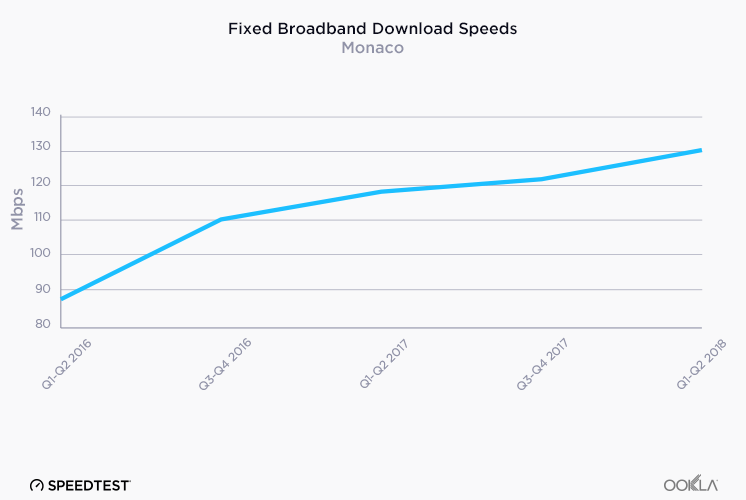
Monaco’s world-class fixed broadband speeds date to 2016 when Monaco Telecom made gigabit-level service available to all residences through Fiber-to-the-Home (FTTH). By Q1-Q2 2018 the mean download speed over fixed broadband in Monaco was 130.05 Mbps.

“Fixed Broadband Download Speeds” Subtitle: Monaco”

These smaller countries do have an advantage when it comes to things like fewer miles of fiber optic cable needed to actually serve every home. Still, there are lessons larger nations can learn from the successes of Andorra, Jersey and Monaco. One such area is future-proofing network upgrades by fully deploying the best available technology, which ensures that Internet Service Providers don’t have to manage a patchwork of cable types or dig up all the roads again in the near term.

It’s also important to note that these rapid broadband speeds make Andorra, Jersey and Monaco that much more attractive to a growing (and increasingly global) tech sector.

Is your company leading the way to faster internet speeds at a national level? Learn more about the network insights available from Speedtest Intelligence.

Editor’s note: This article was updated on October 1, 2018 to correct a scale issue on one of the charts.

Ookla retains ownership of this article including all of the intellectual property rights, data, content graphs and analysis. This article may not be quoted, reproduced, distributed or published for any commercial purpose without prior consent. Members of the press and others using the findings in this article for non-commercial purposes are welcome to publicly share and link to report information with attribution to Ookla.
| June 19, 2019

5G Drives South Korea to the Top of World Ranking for Mobile Speeds

한국어로 읽기

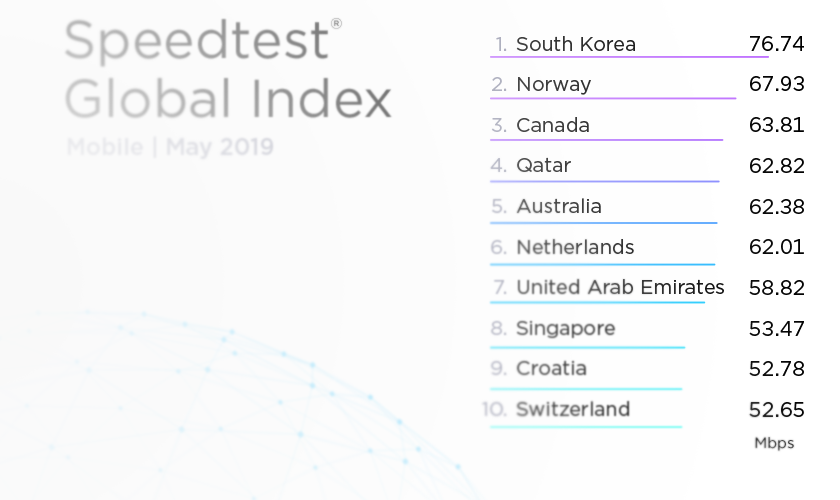
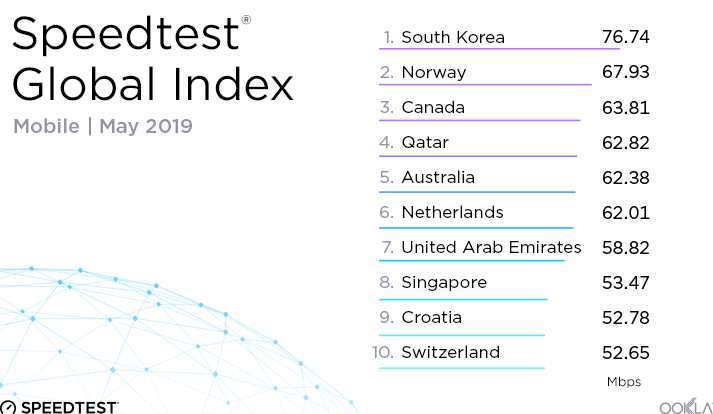
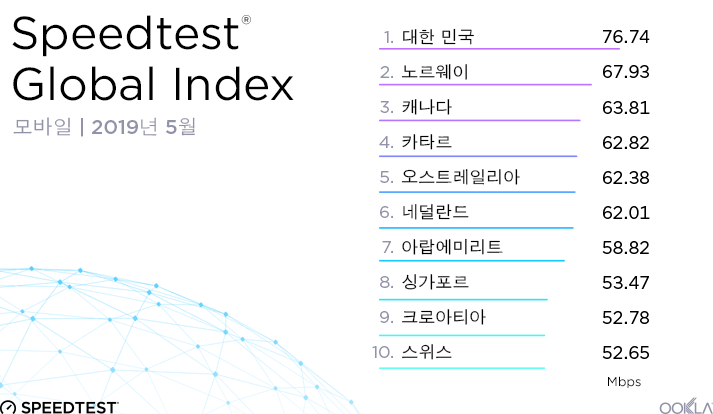
As of May 2019, South Korea ranks first in the world for mobile download speed according to the Speedtest Global IndexTM. Norway previously held the number one spot, but with a mean download speed of 76.74 Mbps in May 2019, South Korea was 13.0% faster. While Norway has moved to second place, Telenor Norway maintains Ookla’s award for Fastest Network. South Korea’s May 2019 download speed is also a 79.7% increase over that in May 2018, when the country ranked 14th in the world. The Speedtest Global Index compares country-level averages of results from all providers on a monthly basis using data generated by consumer-initiated tests taken with Speedtest®.

SK-global-index-graphic-4

5G adoption in South Korea is rapid

South Korean mobile operators launched 5G services on April 3, 2019. Since then over 1 million subscribers have signed up for 5G. As of today, the Ookla 5G MapTM is showing that 73 cities in South Korea have 5G available at some level. Follow @Ookla5GMap to track deployments as they are identified.

5G dramatically boosts speeds

According to data from Speedtest Intelligence® SK Telecom has the fastest mean download speed on 5G capable devices in South Korea during May 2019 at 165.37 Mbps. LG U+ was second at 159.42 Mbps and KT was third at 130.01 Mbps. This represents a dramatic increase compared to Speedtest data from March, before 5G was commercially available in South Korea, when SK Telecom showed a mean download speed of 68.93 Mbps, LG U+ was at 48.05 Mbps and KT was 45.65 Mbps.

Speedtest Intelligence is your key to seeing how 5G is shaping mobile speeds in South Korea and around the world. Learn more here.


대한민국을 모바일 속도 전 세계 1위로 올려놓은 5G

Speedtest Global IndexTM에 따르면, 2019년 5월에 대한민국이 모바일 다운로드 속도에서 세계 1위를 차지했습니다. 평균 다운로드 속도 76.74Mbps는 이전 1위였던 노르웨이를 무려 13%나 앞서는 수치입니다. 노르웨이가 2위로 내려앉았지만 Telenor Norway는 Ookla 가장 빠른 네트워크 어워드를 사수했습니다. 대한민국의 2019년 5월 다운로드 속도는 세계 14위를 기록했던 전년도 5월보다 79.7% 성장한 수치이기도 합니다. Speedtest Global Index는 소비자가 Speedtest®를 사용하여 시작한 테스트에서 얻은 데이터를 사용하여 모든 통신사의 국가별 평균 결과를 월 단위로 비교합니다.

SK-global-index-graphic-KR-1

대한민국의 놀라운 5G 보급 속도

대한민국의 모바일 통신사에서 5G 서비스를 출시한 2019년 4월 3일 이래로 1백만 명이 넘는 이용자가 5G 서비스에 가입했습니다. Ookla 5G MapTM을 통해 오늘 날짜로 대한민국의 73개 도시에 5G망이 어느 정도 수준으로 보급되어 있는지 확인할 수 있습니다. @Ookla5GMap을 팔로우하여 5G 보급 현황을 추적하십시오.

획기적으로 빨라진 속도를 제공하는 5G

Speedtest Intelligence®의 데이터에 따르면, 2019년 5월 대한민국에서 5G 호환 장치 기준 최고 평균 다운로드 속도는 SK텔레콤의 165.37Mbps입니다. 2위는 159.42Mbps의 LG U+, 3위는 130.01Mbps의 KT가 차지했습니다. 이는 5G가 대한민국에 보급되기 전인 3월 Speedtest 데이터와 비교했을 때 놀라울 정도로 크게 상승한 수치입니다. 당시 측정한 SK텔레콤의 평균 다운로드 속도는 68.93Mbps, LG U+는 48.05Mbps, KT는 45.65Mbps였습니다.

Speedtest Intelligence를 통해 5G가 대한민국과 전 세계의 모바일 속도에 어떠한 변화를 가져오고 있는지 확인할 수 있습니다. 여기에서 자세히 알아보십시오.

Ookla retains ownership of this article including all of the intellectual property rights, data, content graphs and analysis. This article may not be quoted, reproduced, distributed or published for any commercial purpose without prior consent. Members of the press and others using the findings in this article for non-commercial purposes are welcome to publicly share and link to report information with attribution to Ookla.
| September 19, 2017

Exploring the Internet in Antarctica

In our coverage of the fastest airports on each continent we left one out — Antarctica. Because, as much as we’d love to, we do not have a ton of data from Antarctica to tell you which airfield has the fastest Wi-Fi. But being off the beaten path is kind of the point of visiting Antarctica, isn’t it?


We’re actually delighted to be able to share any data from Antarctica with you at all. Normally we’d sift through data and aggregate it before it’s analyzed to make sure you’re getting a really reliable look at average speeds. Given that there’s nothing average about Antarctica, though, we’re sharing raw Speedtest data from July 2017 for tests taken on mobile Wi-Fi and cellular networks.

Mobile Wi-Fi

During that time we saw three tests over Wi-Fi at field stations (that also have air strips):

July 2017 Speedtest Results
Antarctica Field Stations
Location Download (Mbps) Upload (Mbps) Ping (ms) ISP
Base Presidente Eduardo Frei Montalva 1.32 0.67 598 Movistar
Showa Station 0.57 2.67 1313 ROIS
General Bernardo O’Higgins Base 1.03 0.07 739 Claro

These research stations are spread far and wide with one each on the Antarctic Peninsula, East Ongul Island, and King George Island.

Based on those tests, we’d say that there definitely is internet available on Antarctica, but in most cases the speeds are glacially slow. Which is what we’d expect from a continent served entirely by satellites. According to an AMA with a Utilities Mechanic at McMurdo Station, “The internet is fast enough to browse reddit, but they restrict the bandwidth to social media websites and youtube, because EVERYONE is trying to use these all the time and the science teams have higher priority access. Online gaming would only be possible in the really early hours of the morning, and even then the ping would be incredibly high.” His Speedtest result from January 2016 showed a download speed of 1.79 Mbps and an upload of 0.82 Mbps with a ping of 1969 ms.

Cellular tests

We also saw one test over cellular networks in July that occurred near Terleckijtoppen Peak and somewhat close to Tor Field Station. This was by far the fastest test result we saw in all of Antarctica during the time period we studied:

July 2017 Speedtest Results
Near Terleckijtoppen Peak, Antarctica
Latitude Longitude Download (Mbps) Upload (Mbps) Ping (ms) ISP
-71.822 10.3419 25.94 27.74 26 DNA

There is 4G on Antarctica. Argentina’s Movistar launched a 4G network at Marambio Base in January. We haven’t seen any tests over it yet, but we’d like to. If you’re living, working or traveling in a remote location on the planet (or off!) please take a Speedtest and share your results with us using the hashtag “#FarFlungSpeeds”.

This article was updated on September 19 to remove results we later determined to be geographically invalid.

Ookla retains ownership of this article including all of the intellectual property rights, data, content graphs and analysis. This article may not be quoted, reproduced, distributed or published for any commercial purpose without prior consent. Members of the press and others using the findings in this article for non-commercial purposes are welcome to publicly share and link to report information with attribution to Ookla.