| December 14, 2020

Exploring the Relationship Between Network Performance and NPS in Germany, Austria and Switzerland

Deutsche

While cultural ties bind the three countries in the DACH region (Germany, Austria and Switzerland), internet performance varies widely between them. Using data from Speedtest Intelligence®, we compared performance for mobile network operators (MNOs) and fixed broadband internet service providers (ISPs) across countries and at the provider level during Q3 2020. We also compared provider performance to Speedtest Consumer SentimentTM data on five-star ratings and Net Promoter Score (NPS) to understand how network performance impacts customer satisfaction.

Switzerland boasts the highest mobile and fixed broadband download speeds
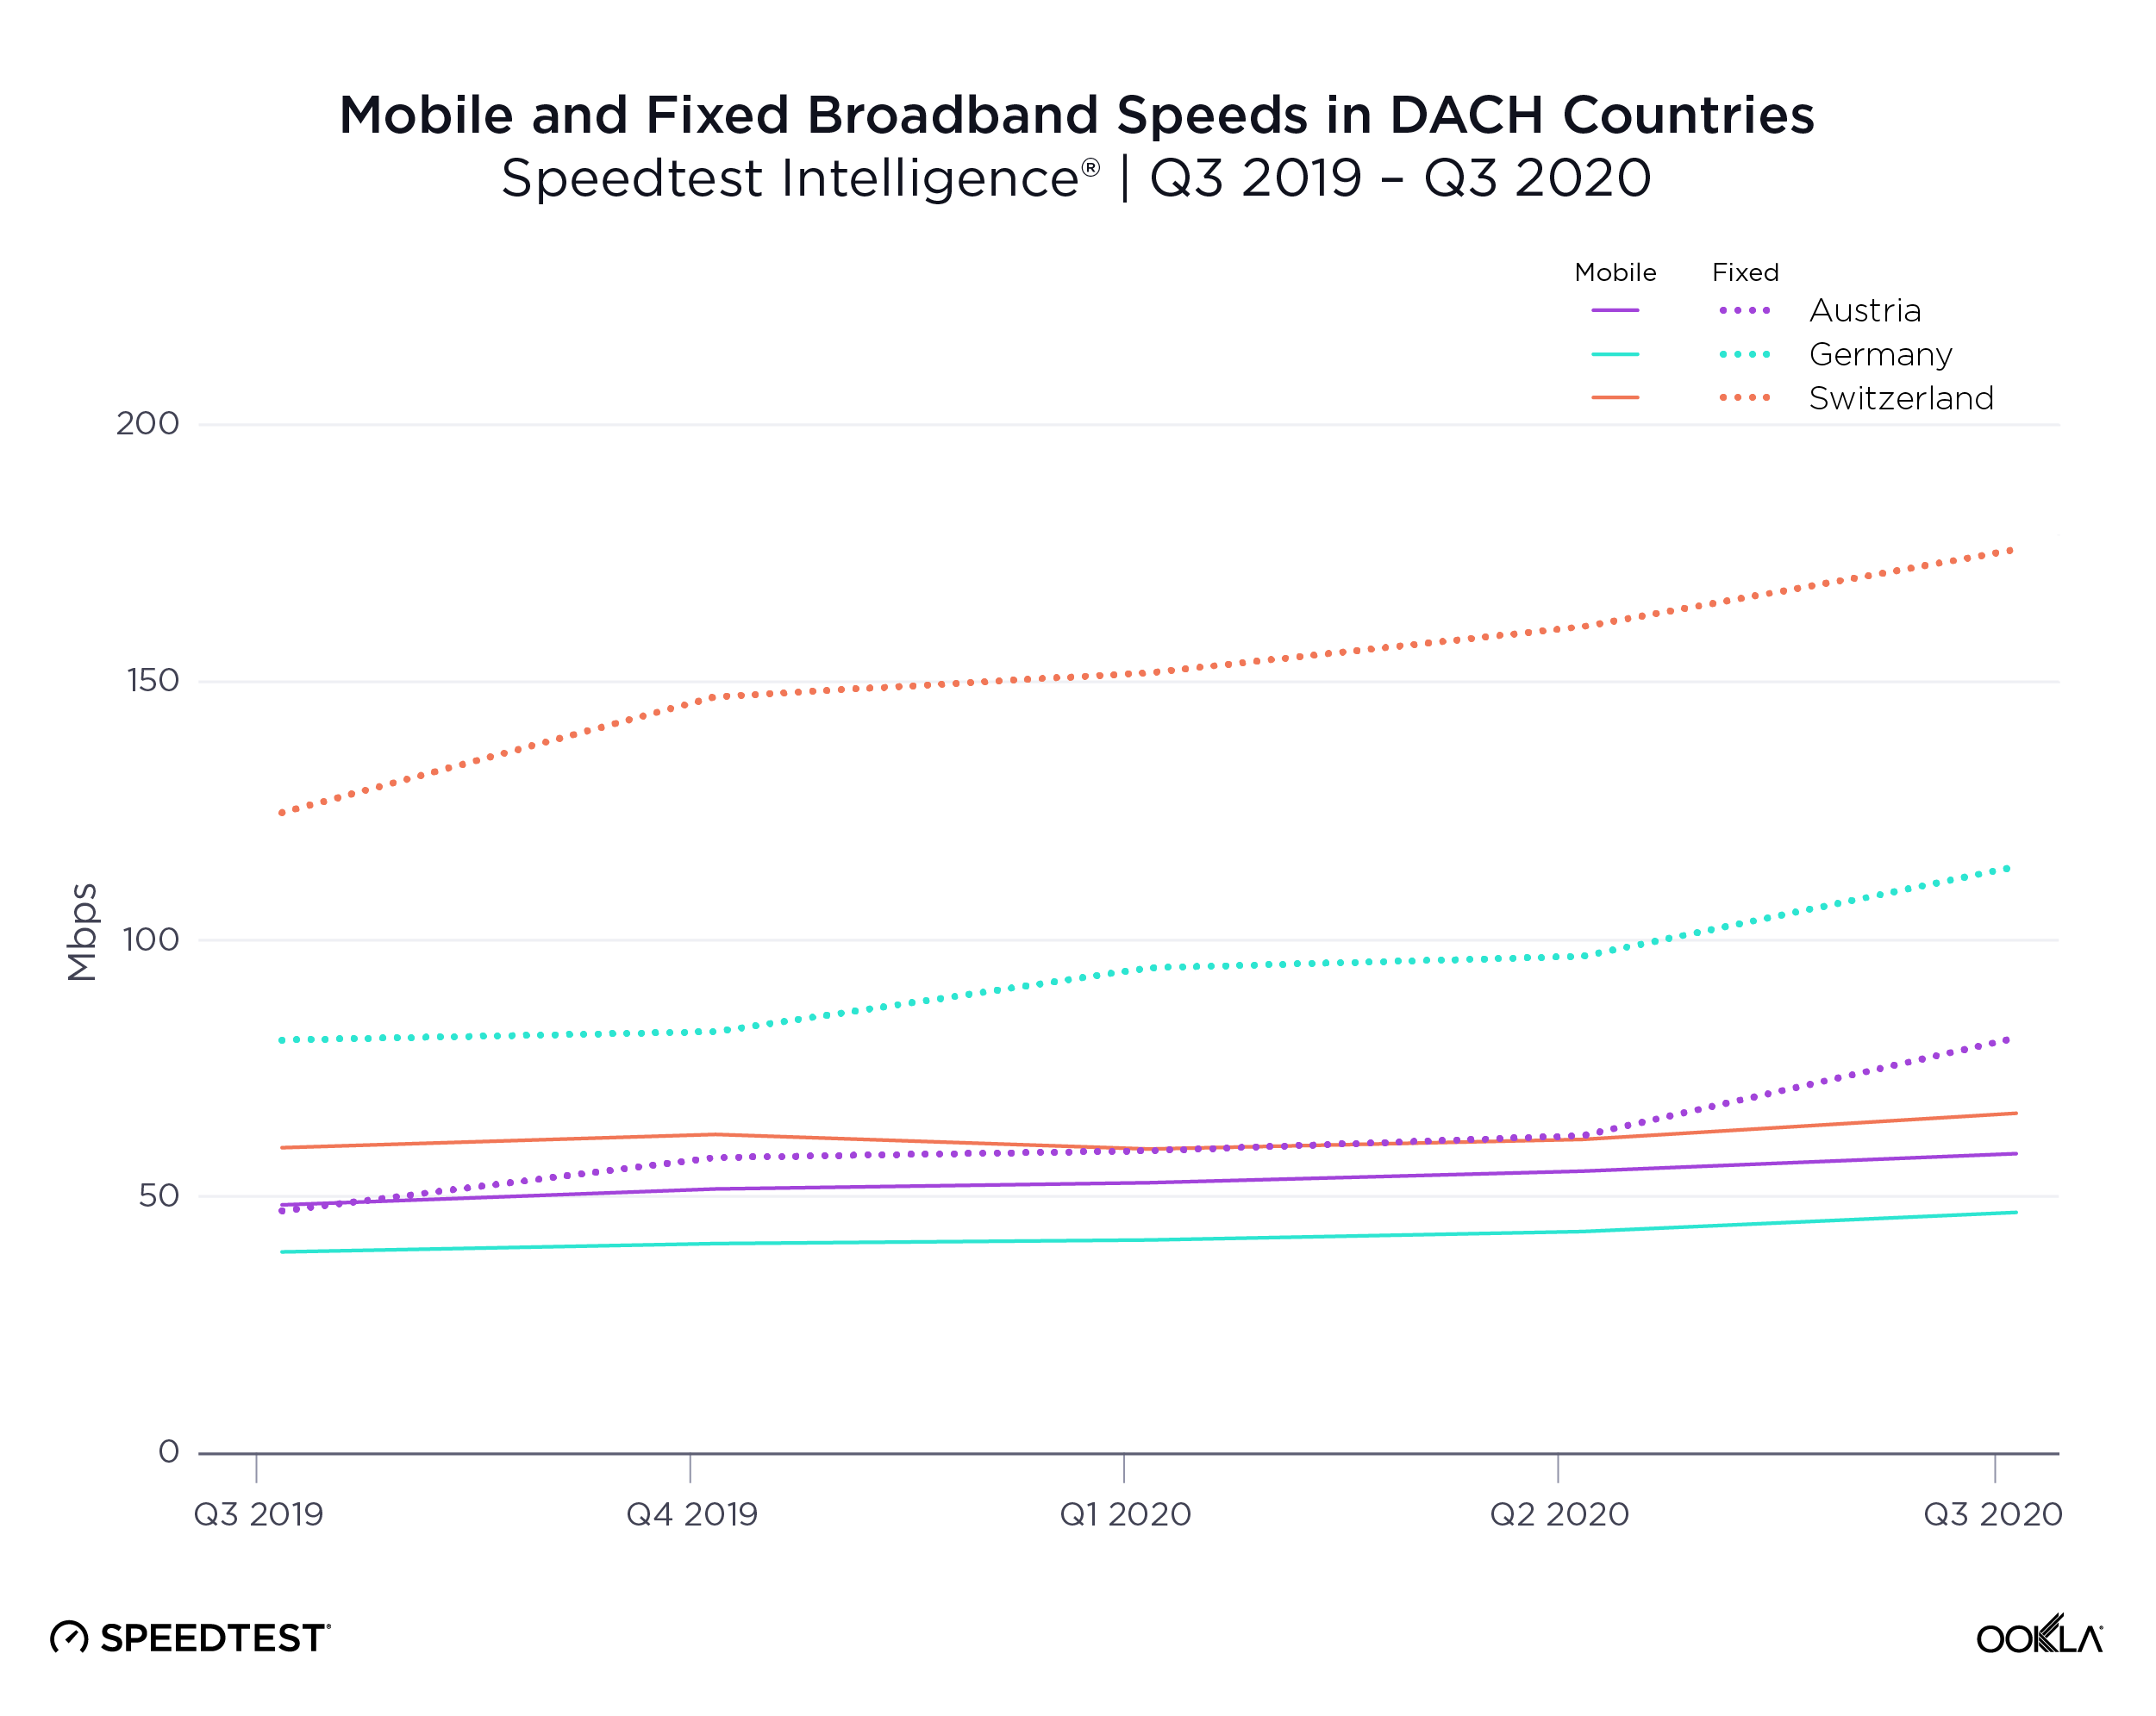
Speeds-Chart_Austria_Germany_Switzerland_1220_en-2

Switzerland outperformed Austria and Germany for mean mobile download speed with a mean download speed over mobile of 60.61 Mbps in Q3. Switzerland ranked 12th in the world on the Speedtest Global IndexTM as of September 2020. Austria, which had a mobile download speed of 52.76 Mbps in Q3 2020, ranked 20th in the world for mobile. Germany’s mobile download speed during Q3 2020 was 41.34 Mbps and the country ranked 35th. All three countries have invested heavily in 5G with Germany showing the largest number of cities with 5G deployments as of November 4, 2020, according to the Ookla 5G MapTM at 2,311. Switzerland had 554 and Austria 1,104. Interestingly, Switzerland actually saw a peak in mobile download speed during Q3 2020 after a decrease in Q1-Q2 2020.

On the fixed side, Switzerland fared even better with a mean download speed of 170.21 Mbps during Q3. Switzerland ranked 4th in the world for fixed broadband according to the Speedtest Global Index as of September 2020. Germany’s Q3 2020 download speed over fixed broadband was 108.57 Mbps and the country ranked 29th in the world. Austria had the lowest download speed over fixed broadband at 75.27 Mbps during Q3 2020 and ranked 50th for fixed broadband download speed. Switzerland was the only country of the three to show parity between download and upload speed over fixed broadband with a mean upload speed of 110.09 Mbps during Q3 2020. For comparison, Germany showed 25.84 Mbps and Austria was at 18.42 Mbps during the same period.

Fastest providers in Austria, Germany and Switzerland

We compared Q3 2020 internet performance for top providers in Austria, Germany and Switzerland using Speed ScoreTM. On mobile, these results consider only devices that use modern chipsets.

A1 (mobile) and Magenta (fixed broadband) are fastest in Austria

Internet Performance of Top Mobile Providers in Austria
Speedtest Intelligence® | Modern Chipsets in Q3 2020
Provider Speed Score
A1 61.55
3 43.55
Magenta Telekom 41.00

A1 had the fastest Speed Score among Austrian mobile operators at 61.55 during Q3 2020. Three showed the second fastest Speed Score, followed by Magenta Telekom.

Internet Performance of Top Fixed Providers in Austria
Speedtest Intelligence® | Q3 2020
Provider Speed Score
Magenta 81.21
3 26.39
A1 24.84

On the fixed broadband side at the national level, Magenta was the fastest provider in Austria during Q3 2020. Three was second, while A1 was third. While LIWEST, kabelplus and CableLink had higher Speed Scores than both 3 and A1, these regional providers are only available in select portions of the country.

Telekom (mobile) and Vodafone (fixed broadband) are fastest in Germany

Internet Performance of Top Mobile Providers in Germany
Speedtest Intelligence® | Modern Chipsets in Q3 2020
Provider Speed Score
Telekom 49.09
Vodafone 29.69
1&1 23.18
O2 22.65

Telekom was the fastest mobile operator in Germany during Q3 2020 with a Speed Score of 49.09, far above second-place Vodafone. 1&1 was third and O2 was fourth.

Internet Performance of Top Fixed Providers in Germany
Speedtest Intelligence® | Q3 2020
Provider Speed Score
Vodafone 103.57
Telekom 44.28
O2 38.38

Vodafone was the fastest fixed broadband provider in Germany during Q3 2020 with a Speed Score of 103.57. This was more than double that of second-place Telekom. O2 was third.

Switzerland’s fastest providers are Swisscom (mobile) and Salt (fixed broadband)

Internet Performance of Top Mobile Providers in Switzerland
Speedtest Intelligence® | Modern Chipsets in Q3 2020
Provider Speed Score
Swisscom 57.10
Sunrise 46.13
Salt 38.79

The fastest mobile operator in Switzerland during Q3 2020 was Swisscom with a Speed Score of 57.10. Sunrise was second and Salt third.

Internet Performance of Top Fixed Providers in Switzerland
Speedtest Intelligence® | Q3 2020
Provider Speed Score
Salt 290.89
UPC 150.45
Quickline 95.18
net+ 82.98
Sunrise 79.40
Swisscom 76.73

Salt was the fastest fixed broadband provider in Switzerland during Q3 2020 with a Speed Score of 290.89 — nearly twice as high as second-place UPC. Quickline was third, net+ was fourth, Sunrise fifth and Swisscom sixth.

We compared five-star ratings and NPS data to providers’ performance to understand how speeds impacted customer perceptions of German, Austrian and Swiss providers. Speedtest Consumer Sentiment data is gathered from single-question surveys presented to users at the end of a Speedtest®. This data set provides rich insights into customer satisfaction over time, as well as competitive benchmarking, by providing data on both Net Promoter Score (NPS) and customers’ overall satisfaction with their network providers.

Provider performance vs. ratings

Consumer Sentiment includes data on how users rate providers on a five-star scale. We compared ratings data from Austrian, German and Swiss providers in Q3 2020 with Speed Score to better understand the relationship between network performance and customers’ overall satisfaction with their network providers.

In Austria, A1 rated highest for mobile, kabelplus for fixed broadband

Internet Performance and Five-Star Ratings of Top Mobile Providers in Austria
Speedtest Intelligence® | Modern Chipsets in Q3 2020
Provider Speed Score Rating
A1 61.55 3.8
3 43.55 3.3
Magenta Telekom 41.00 3.4

Ratings aligned with performance in Austria during Q3 2020 with A1 coming first for ratings and Speed Score among Austrian mobile operators.

Internet Performance and Five-Star Ratings of Top Fixed Providers in Austria
Speedtest Intelligence® | Q3 2020
Provider Speed Score Rating
Magenta 81.21 3.2
3 26.39 3.0
A1 24.84 2.7

On fixed broadband, Magenta showed the highest rating among users in Austria during Q3 2020. Three was second and A1 was third for ratings on fixed broadband.

In Germany, Telekom highest rated for mobile, Telekom for fixed broadband

Internet Performance and Five-Star Ratings of Top Mobile Providers in Germany
Speedtest Intelligence® | Modern Chipsets in Q3 2020
Provider Speed Score Rating
Tekelom 49.09 3.9
Vodafone 29.69 3.1
1&1 23.18 3.0
O2 22.65 3.2

In Germany, the mobile operator with the highest rating, Telekom, was also the fastest provider during Q3 2020. The rest of the rankings did not follow the order of network performance, but the spread between rankings was relatively small.

Internet Performance and Five-Star Ratings of Top Fixed Providers in Germany
Speedtest Intelligence® | Q3 2020
Provider Speed Score Rating
Vodafone 103.57 2.9
Telekom 44.28 3.3
O2 38.38 3.1

On fixed broadband, the highest-rated provider in Germany during Q3 2020 was Telekom. Despite having a much higher Speed Score than competitors, Vodafone was rated lowest by consumers.

Swisscom rated highest for mobile in Switzerland, Salt for fixed broadband

Internet Performance and Five-Star Ratings of Top Mobile Providers in Switzerland
Speedtest Intelligence® | Modern Chipsets in Q3 2020

Provider Speed Score Rating
Swisscom 57.10 3.6
Sunrise 46.13 3.2
Salt 38.79 2.9

Swisscom was both the highest-rated mobile operator in Switzerland during Q3 2020 and the operator with the best Speed Score. The spread between highest- and lowest-rated mobile operators was very narrow at less than a star.

Internet Performance and Five-Star Ratings of Top Fixed Providers in Switzerland
Speedtest Intelligence® | Q3 2020
Provider Speed Score Rating
Salt 290.89 3.5
UPC 150.45 3.2
Quickline 95.18 3.5
net+ 82.98 3.5
Sunrise 79.40 3.4
Swisscom 76.73 3.5

On the fixed broadband side, Salt, net+, and Swisscom and Quickline tied for the highest rating in Switzerland during Q3 2020 despite a wide difference in Speed Score. The difference between the highest-rated provider and lowest-rated was again very small on fixed broadband.

Provider performance vs. NPS

Speedtest users are also asked how likely they are to recommend their provider to friends or family on a 0 to 10 scale. NPS ratings are categorized into Detractors (score 0-6), Passives (score 7-8), and Promoters (score 9-10). NPS is calculated as (% Promoters – % Detractors) x 100. Any NPS score above 0 indicates that a provider’s audience is more loyal than not. We compared the resulting Net Promoter Score (NPS) with Speed Score to see how performance relates to a user’s likelihood of recommending a provider.

A1 had highest NPS on mobile in Austria, kabelplus highest on fixed broadband

Internet Performance of Top Mobile Providers in Austria
Speedtest Intelligence® | Modern Chipsets in Q3 2020
Provider Speed Score NPS
A1 61.55 1.58
3 43.55 -39.67
Magenta Telekom 41.00 -20.18

A1 showed the highest NPS among mobile operators in Austria in Q3 2020, while Magenta Telekom and 3 showed negative NPS. This suggests that users were not to recommend these operators.

Internet Performance of Top Fixed Providers in Austria
Speedtest Intelligence® | Q3 2020
Provider Speed Score NPS
Magenta 81.21 -28.97
3 26.39 -36.00
A1 24.84 -51.63

Magenta had the highest NPS among fixed broadband providers in Austria in Q3 2020, followed by 3 and A1. No providers had positive NPS values.

Telekom had highest NPS on mobile and fixed broadband in Germany

Internet Performance of Top Mobile Providers in Germany
Speedtest Intelligence® | Modern Chipsets in Q3 2020
Provider Speed Score NPS
Tekelom 49.09 14.82
Vodafone 29.69 -37.74
1&1 23.18 -58.65
O2 22.65 -34.59

Not only did Telekom have the highest NPS on mobile in Germany during Q3 2020, it was also the only mobile operator with a positive NPS, indicating consumers were likely to recommend the operator. As we saw above, Telekom was also the fastest operator and the most highly rated.

Internet Performance of Top Fixed Providers in Germany
Speedtest Intelligence® | Q3 2020
Provider Speed Score NPS
Vodafone 103.57 -50.26
Telekom 44.28 -27.10
O2 38.38 -40.76

Telekom had the highest NPS among fixed broadband providers in Germany during Q3 2020. However, all fixed broadband providers showed negative NPS values.

Swisscom had highest NPS on mobile in Switzerland, Salt on fixed broadband

Internet Performance of Top Mobile Providers in Switzerland
Speedtest Intelligence® | Modern Chipsets in Q3 2020
Provider Speed Score NPS
Swisscom 57.10 -2.74
Sunrise 46.13 -24.66
Salt 38.79 -46.75

Along with having the highest Speed Score in Switzerland and earning the highest ratings from customers, Swisscom had the highest NPS on mobile in Switzerland during Q3 2020. That said, all Swiss mobile operators showed negative NPS values, suggesting that consumers were not likely to recommend these operators to friends or family.

Internet Performance of Top Fixed Providers in Switzerland
Speedtest Intelligence® | Q3 2020
Provider Speed Score NPS
Salt 290.89 -1.24
UPC 150.45 -23.70
Quickline 95.18 -18.29
net+ 82.98 -8.33
Sunrise 79.40 -10.93
Swisscom 76.73 -10.34

Salt, whose Speed Score was almost double that of its nearest competitor, had the highest NPS of any fixed broadband provider in Switzerland during Q3 2020. Among the other providers, speed rankings did not otherwise match the provider rankings for NPS in Switzerland, with second-fastest UPC showing the lowest NPS.

While the fastest speeds don’t always correlate to the highest ratings from customers, there is a clear relationship between the performance, quality and availability of networks and customer satisfaction. As more mobile operators in the DACH countries continue to deploy 5G — and high-speed fiber internet becomes more available in the region — it will be interesting to watch speeds continue to climb. We will continue to monitor both network metrics and Consumer Sentiment data for the region and to surface these insights so providers can understand how and where to improve their networks.


Untersuchung des Verhältnisses zwischen Netzwerkleistung und NPS in Deutschland, Österreich und der Schweiz

Die drei Länder der DACH-Region (Deutschland, Österreich und die Schweiz) sind zwar kulturell miteinander verbunden, aber die Leistungsfähigkeit des Internets ist sehr unterschiedlich. Mithilfe von Daten von Speedtest Intelligence® haben wir die Leistung von Mobilfunknetzbetreibern (MNOs) und Festnetz-Breitband-Internetdienstanbietern (ISPs) in verschiedenen Ländern und auf Anbieterebene im 3. Quartal 2020 verglichen. Wir haben auch die Leistung der Anbieter mit Speedtest Consumer Sentiment™-Daten zu Fünf-Sterne-Ratings und dem Net Promoter Score (NPS) verglichen, um zu verstehen, wie sich die Netzleistung auf die Kundenzufriedenheit auswirkt.

Die Schweiz verfügt über die höchsten Geschwindigkeiten beim Mobilfunk- und Festnetz-Breitband-Download
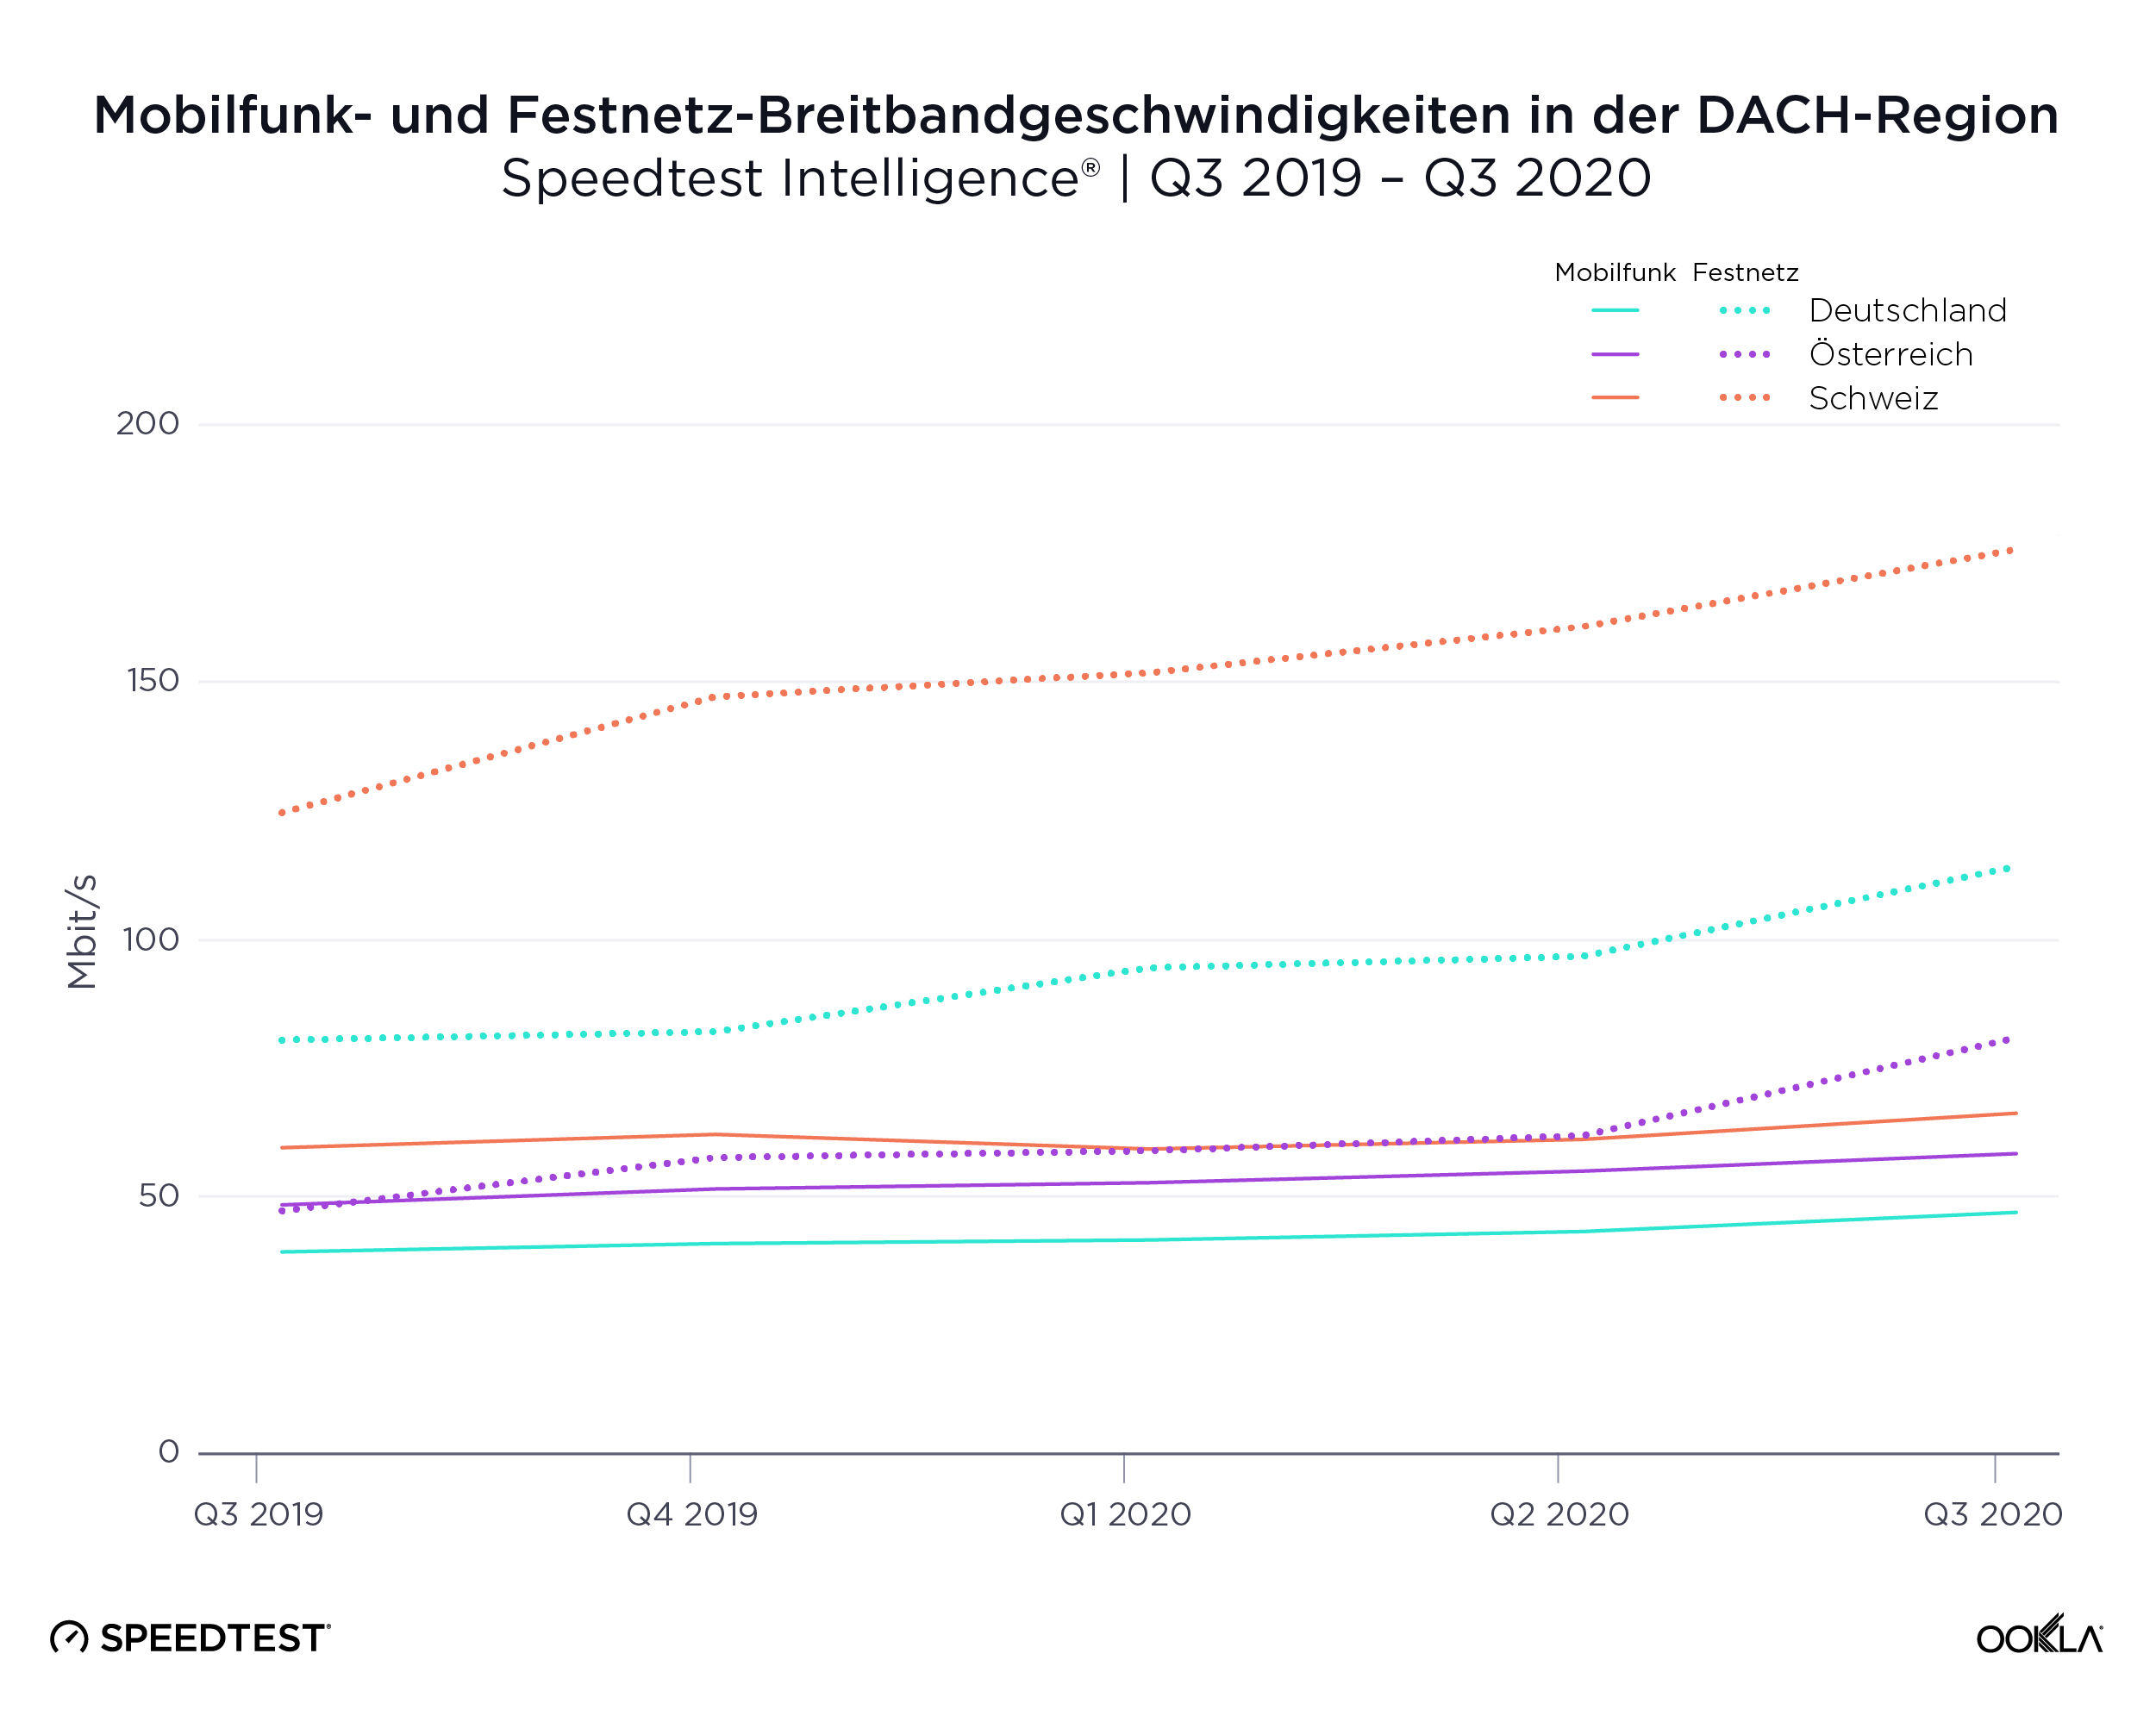
Speeds-Chart_Austria_Germany_Switzerland_1220_de-1

Die Schweiz übertraf Österreich und Deutschland in Bezug auf die durchschnittliche mobile Downloadgeschwindigkeit: Sie erreichte einen Durchschnittswert von 60,61 Mbit/s im dritten Quartal. Die Schweiz belegte im September 2020 weltweit Platz 12 im Speedtest Global IndexTM. Österreich schaffte es mit einer Downloadgeschwindigkeit von 52,76 Mbit/s im Mobilfunk im 3. Quartal 2020 weltweit auf Platz 20. Deutschland wies im 3. Quartal 2020 eine Mobilfunk-Downloadgeschwindigkeit von 41,34 Mbit/s auf und belegte Platz 35. Alle drei Länder haben in großem Umfang in 5G investiert, wobei Deutschland laut der Europäischen Kommission am 4. November 2020 die größte Anzahl von Städten mit 5G-Installationen aufwies. Laut der Ookla 5G MapTM belief sich die Zahl der Installationen auf 2.311. In der Schweiz waren es 554, in Österreich 1.104. Interessanterweise erlebte die Schweiz nach einem Rückgang im Q1-Q2 2020 in Q3 2020 sogar einen Höhepunkt der mobilen Downloadgeschwindigkeit.

Auf der Festnetzseite schnitt die Schweiz mit einer durchschnittlichen Downloadgeschwindigkeit von 170,21 Mbit/s im dritten Quartal noch besser ab. Laut dem Speedtest Global Index vom September 2020 belegte die Schweiz weltweit den 4. Platz im Bereich Festnetz-Breitband. Deutschlands Downloadgeschwindigkeit im 3. Quartal 2020 über Festnetz-Breitband betrug 108,57 Mbit/s und das Land belegte weltweit Platz 29. Österreich hatte im 3. Quartal 2020 mit 75,27 Mbit/s die niedrigste Downloadgeschwindigkeit über Festnetz-Breitband und belegte damit Platz 50. Die Schweiz war das einzige der drei Länder, das im 3. Quartal 2020 mit einer durchschnittlichen Upload-Geschwindigkeit von 110,09 Mbit/s einen gleichen Wert für die Download- und Upload-Geschwindigkeit über Festnetz-Breitband-Verbindungen aufwies. Zum Vergleich: Im selben Zeitraum beliefen sich die Werte in Deutschland auf 25,84 Mbit/s und in Österreich auf 18,42 Mbit/s.

Schnellste Anbieter in Österreich, Deutschland und der Schweiz

Wir verglichen die Internetleistung in Q3 2020 der Top-Anbieter in Österreich, Deutschland und der Schweiz mit Speed ScoreTM. Im Mobilfunkbereich werden hier nur Geräte berücksichtigt, die moderne Chipsätze verwenden.

A1 (Mobilfunk) und Magenta (Festnetz-Breitband) sind in Österreich am schnellsten

Internetleistung der Top-Mobilfunkanbieter in Österreich
Speedtest Intelligence® | Moderne Chipsätze in Q3 2020
Anbieter Speed Score
A1 61,55
3 43,55
Magenta Telekom 41,00

A1 hatte von allen Mobilfunkanbietern in Österreich in Q3 2020 mit 61,55 den schnellsten Speed Score. Three erreichte den zweitschnellsten Speed Score, gefolgt von Magenta Telekom.

Internetleistung der Top-Festnetz-Breitband-Anbieter in Österreich
Speedtest Intelligence® | Q3 2020
Anbieter Speed Score
Magenta 81,21
3 26,39
A1 24,84

Auf der Festnetz-Breitband-Seite auf nationaler Ebene war Magenta im 3. Quartal 2020 der schnellste Anbieter in Österreich. Three belegte den zweiten und A1 den dritten Platz. LIWEST, kabelplus und CableLink hatten zwar höhere Speed Scores als 3 und A1, aber diese regionalen Anbieter sind nur in Teilen Österreichs verfügbar.

Telekom (Mobilfunk) und Vodafone (Festnetz-Breitband) sind in Deutschland am schnellsten

Internetleistung der Top-Mobilfunkanbieter in Deutschland
Speedtest Intelligence® | Modern Chipsets in Q3 2020
Anbieter Speed Score
Telekom 49,09
Vodafone 29,69
1&1 23,18
O2 22,65

Telekom war in Q3 2020 der schnellste Mobilfunkanbieter in Deutschland und lag mit einem Speed Score von 49,09 weit vor dem Zweitplatzierten Vodafone. Platz 3 belegt 1&1 und O2 war auf dem vierten Platz.

Internetleistung der Top-Festnetz-Breitband-Anbieter in Deutschland
Speedtest Intelligence® | Q3 2020
Anbieter Speed Score
Vodafone 103,57
Telekom 44,28
O2 38,38

Vodafone war mit einem Speed Score von 103,57 der schnellste Festnetz-Breitband-Anbieter in Deutschland in Q3 2020. Der Speed Score war doppelt so hoch wie beim Zweitplatzierten, der Telekom. O2 belegte Platz 3.

Die schnellsten Anbieter in der Schweiz sind Swisscom (Mobilfunk) und Salt (Festnetz-Breitband)

Internetleistung der Top-Mobilfunkanbieter in der Schweiz
Speedtest Intelligence® | Modern Chipsets in Q3 2020
Anbieter Speed Score
Swisscom 57,10
Sunrise 46,13
Salt 38,79

Der schnellste Mobilfunkanbieter in der Schweiz in Q3 2020 war Swisscom mit einem Speed Score von 57,10. Sunrise war zweiter und Salt dritter.

Internetleistung der Top-Festnetz-Breitband-Anbieter in der Schweiz
Speedtest Intelligence® | Q3 2020
Anbieter Speed Score
Salt 290,89
UPC 150,45
Quickline 95,18
net+ 82,98
Sunrise 79,40
Swisscom 76,73

Salt war in Q3 2020 der schnellste Festnetz-Breitband-Anbieter in der Schweiz und erreichte einen Speed Score von 290,89, fast zweimal so viel wie der Zweitplatzierte UPC. Quickline belegte Platz 3, net+ Platz 4, Sunrise Platz 5 und Swisscom Platz 6.

Wir haben Fünf-Sterne-Ratings und NPS-Daten mit der Leistung der Anbieter verglichen, um zu verstehen, wie sich die Geschwindigkeit auf die Kundenwahrnehmung deutscher, österreichischer und schweizerischer Anbieter auswirkte. Speedtest Consumer Sentiment-Daten werden über Umfragen mit einer einzigen Frage gesammelt, die den Anwendern am Ende eines Speedtest® angezeigt werden. Dieser Datensatz bietet wertvolle Einblicke in die Kundenzufriedenheit im Laufe der Zeit sowie Wettbewerbsvergleiche, indem er Daten sowohl zum Net Promoter Score (NPS) als auch zur Gesamtzufriedenheit der Kunden mit ihren Netzbetreibern liefert.

Anbieterleistung vs. Bewertungen

Consumer Sentiment erfasst Daten darüber, wie Anwender Anbieter auf einer Skala von eins bis fünf bewerten. Wir haben Bewertungsdaten aus österreichischen, deutschen und schweizer Anbietern in Q3 2020 mit Speed Score verglichen, um die Beziehung zwischen Netzwerkleistung und der Zufriedenheit der Kunden insgesamt mit ihren Netzwerkanbietern zu analysieren.

In Österreich bekam A1 die besten Bewertungen für Mobilfunk und kabelplus schnitt am besten beim Festnetz-Breitband ab

Internetleistung und Fünf-Sterne-Bewertungen der Top-Mobilfunkanbieter in Österreich
Speedtest Intelligence® | Modern Chipsets in Q3 2020
Anbieter Speed Score Bewertung
A1 61,55 3,8
3 43,55 3,3
Magenta Telekom 41,00 3,4

Die Bewertungen deckten sich in Österreich im 3. Quartal 2020 mit der Leistung, wobei A1 bei den Bewertungen und beim Speed Score unter den österreichischen Mobilfunkbetreibern den ersten Platz belegt.

Internetleistung und Fünf-Sterne-Bewertungen der Top-Festnetz-Breitband-Anbieter in Österreich
Speedtest Intelligence® | Q3 2020
Anbieter Speed Score Bewertung
Magenta 81,21 3,2
3 26,39 3,0
A1 24,84 2,7

Im Festnetz-Breitband-Bereich erhielt Magenta die besten Anwenderbewertungen in Q3 2020. Three belegte bei den Bewertungen für Festnetz-Breitband den zweiten Platz und A1 den dritten.

In Deutschland schnitt die Telekom bei den Bewertungen für Mobilfunk und Festnetz-Breitband am besten ab

Internetleistung und Fünf-Sterne-Bewertungen der Top-Mobilfunkanbieter in Deutschland
Speedtest Intelligence® | Modern Chipsets in Q3 2020
Anbieter Speed Score Bewertung
Tekelom 49,09 3,9
Vodafone 29,69 3,1
1&1 23,18 3,0
O2 22,65 3,2

In Deutschland war der Mobilfunkbetreiber mit den besten Bewertungen, die Telekom, gleichzeitig auch der schnellste Anbieter in Q3 2020. Die weitere Platzverteilung entsprach nicht der Reihenfolge der Netzwerkleistung, aber die Spanne zwischen den Platzierungen war relativ gering.

Internetleistung und Fünf-Sterne-Bewertungen der Top-Festnetz-Breitband-Anbieter in Deutschland
Speedtest Intelligence® | Q3 2020
Anbieter Speed Score Bewertung
Vodafone 103,57 2,9
Telekom 44,28 3,3
O2 38,38 3,1

Im Bereich Festnetz-Breitband schnitt die Telekom in Deutschland bei den Bewertungen in Q3 2020 am besten ab. Obwohl der Speed Score von Vodafone deutlich höher war, als bei anderen Mitbewerbern, fielen die Bewertungen der Verbraucher hier am niedrigsten aus.

Swisscom erhielt die besten Bewertungen für den Mobilfunkbereich in der Schweiz und Salt schnitt am besten bei Festnetz-Breitband ab

Internetleistung und Fünf-Sterne-Bewertungen der Top-Mobilfunkanbieter in der Schweiz
Speedtest Intelligence® | Modern Chipsets in Q3 2020
Anbieter Speed Score Bewertung
Swisscom 57,10 3,6
Sunrise 46,13 3,2
Salt 38,79 2,9

Swiscom wurde in Q3 2020 als bester Mobilfunkbetreiber in der Schweiz bewertet und hatte auch den besten Speed Score. Die Differenz zwischen den am besten und am schlechtesten bewerteten Mobilfunkbetreibern war sehr knapp und betrug weniger als einen Stern.

Internetleistung und Fünf-Sterne-Bewertungen der Top-Festnetz-Breitband-Anbieter in der Schweiz
Speedtest Intelligence® | Q3 2020
Anbieter Speed Score Bewertung
Salt 290,89 3,5
UPC 150,45 3,2
Quickline 95,18 3,5
net+ 82,98 3,5
Sunrise 79,40 3,4
Swisscom 76,73 3,5

Im Bereich Festnetz-Breitband gab es bei den Bewertungen einen Gleichstand: Salt, net+, Swisscom und Quickline belegten in Q3 2020 alle den ersten Platz, obwohl es einen großen Unterschied beim Speed Score gab. Die Differenz zwischen dem am besten und dem am schlechtesten bewerteten Anbieter war auch hier im Bereich Festnetz-Breitband sehr gering.

Anbieterleistung vs. NPS

Die Anwender von Speedtest werden auch gefragt, wie wahrscheinlich sie ihren Anbieter ihren Freunden oder ihrer Familie weiterempfehlen würden (Skala von 0 bis 10). NPS-Bewertungen werden in Kritiker (Punktzahl 0-6), Passive (Punktzahl 7-8) und Befürworter (Punktzahl 9-10) eingeteilt. Der NPS wird berechnet aus (% Unterstützer – % Kritiker) x 100. Jeder NPS-Wert über 0 zeigt an, dass die Kunden eines Anbieters eher loyal sind. Wir haben den erzielten Net Promoter Score (NPS) mit dem Speed Score verglichen, um zu sehen, wie die Leistung mit der Wahrscheinlichkeit, dass ein Anwender, einen Anbieter weiterempfiehlt, zusammenhängt.

A1 erzielte den höchsten NPS im Bereich Mobilfunk in Österreich, kabelplus erhielt den besten Wert im Bereich Festnetz-Breitband

Internetleistung der Top-Mobilfunkanbieter in Österreich
Speedtest Intelligence® | Modern Chipsets in Q3 2020
Anbieter Speed Score NPS
A1 61,55 1,58
3 43,55 -39,67
Magenta Telekom 41,00 -20,18

A1 erzielte den höchsten NPS bei den Mobilfunkbetreibern in Österreich in Q3 2020, während Magenta Telekom und 3 negative NPS-Ergebnisse aufwiesen. Daraus lässt sich schließen, dass Anwender diese Betreiber nicht weiterempfehlen würden.

Internetleistung der Top-Festnetz-Breitband-Anbieter in Österreich
Speedtest Intelligence® | Q3 2020
Anbieter Speed Score NPS
Magenta 81,21 -28,97
3 26,39 -36,00
A1 24,84 -51,63

Magenta hatte unter den Festnetz-Breitband-Anbietern den höchsten NPS in Österreich in Q3 2020, gefolgt von 3 und A1. Keiner der Anbieter erzielte positive NPS-Werte.

Die Telekom erzielte den höchsten NPS im Bereich Mobilfunk und Festnetz-Breitband in Deutschland

Internetleistung der Top-Mobilfunkanbieter in Deutschland
Speedtest Intelligence® | Modern Chipsets in Q3 2020
Anbieter Speed Score NPS
Tekelom 49,09 14,82
Vodafone 29,69 -37,74
1&1 23,18 -58,65
O2 22,65 -34,59

Die Telekom erzielte nicht nur den höchsten NPS im Bereich Mobilfunk in Deutschland in Q3 2020, das Unternehmen war auch der einzige Mobilfunkbetreiber mit einem positiven NPS, was bedeutet, dass die Verbraucher den Betreiber wahrscheinlich weiterempfehlen würden. Wie wir bereits gesehen haben, war die Telekom auch der schnellste Anbieter und der am besten bewertete.

Internetleistung der Top-Festnetz-Breitband-Anbieter in Deutschland
Speedtest Intelligence® | Q3 2020
Anbieter Speed Score NPS
Vodafone 103,57 -50,26
Telekom 44,28 -27,10
O2 38,38 -40,76

Die Telekom verzeichnete den höchsten NPS unter den Anbietern von Festnetz-Breitband in Deutschland in Q3 2020. Alle Festnetz-Breitband-Anbieter erzielten jedoch negative NPS-Werte.

Swisscom holte den höchsten NPS im Mobilfunkbereich in der Schweiz ein, Salt im Festnetz-Breitband

Internetleistung der Top-Mobilfunkanbieter in der Schweiz
Speedtest Intelligence® | Modern Chipsets in Q3 2020
Anbieter Speed Score NPS
Swisscom 57,10 -2,74
Sunrise 46,13 -24,66
Salt 38,79 -46,75

Neben dem höchsten Speed Score in der Schweiz und den besten Bewertungen von Kunden erzielte Swisscom auch den höchsten NPS im Mobilfunkbereich in der Schweiz in Q3 2020. Dennoch wiesen alle schweizer Mobilfunkbetreiber negative NPS-Werte auf, was darauf hindeutet, dass die Verbraucher diese Betreiber wahrscheinlich nicht an Freunde oder Verwandte weiterempfehlen würden.

Internetleistung der Top-Festnetz-Breitband-Anbieter in der Schweiz
Speedtest Intelligence® | Q3 2020
Anbieter Speed Score NPS
Salt 290,89 -1,24
UPC 150,45 -23,70
Quickline 95,18 -18,29
net+ 82,98 -8,33
Sunrise 79,40 -10,93
Swisscom 76,73 -10,34

Salt, dessen Speed Score fast doppelt so hoch war wie der, des nächsten Mitbewerbers, hatte unter den Festnetz-Breitband-Anbietern in der Schweiz in Q3 2020 den höchsten NPS. Unter den anderen Anbietern entsprach die Geschwindigkeitsrangliste ansonsten nicht den NPS-Anbieterrankings in der Schweiz, wobei der zweitschnellste, UPC, den niedrigsten NPS aufweist.

Zwar entsprechen die schnellsten Geschwindigkeiten nicht immer den besten Kundenbewertungen, aber es besteht ein klarer Zusammenhang zwischen der Leistung, Qualität und Verfügbarkeit der Netze und der Kundenzufriedenheit. Da immer mehr Mobilfunkbetreiber in der DACH-Region zunehmend 5G bereitstellen – und das Hochgeschwindigkeits-Glasfaser-Internet in der Region immer besser verfügbar wird – ist es interessant zu beobachten, wie die Geschwindigkeiten weiter steigen. Wir werden weiterhin sowohl Netzwerkmetriken als auch die Verbraucherstimmung in der Region beobachten und diese Erkenntnisse aufbereiten, damit die Anbieter erkennen können, wie und wo Verbesserungsbedarf für ihre Netzwerke besteht.

Ookla retains ownership of this article including all of the intellectual property rights, data, content graphs and analysis. This article may not be quoted, reproduced, distributed or published for any commercial purpose without prior consent. Members of the press and others using the findings in this article for non-commercial purposes are welcome to publicly share and link to report information with attribution to Ookla.

| January 28, 2021

Illustrating the Worldwide Growth of 5G (Poster Download)


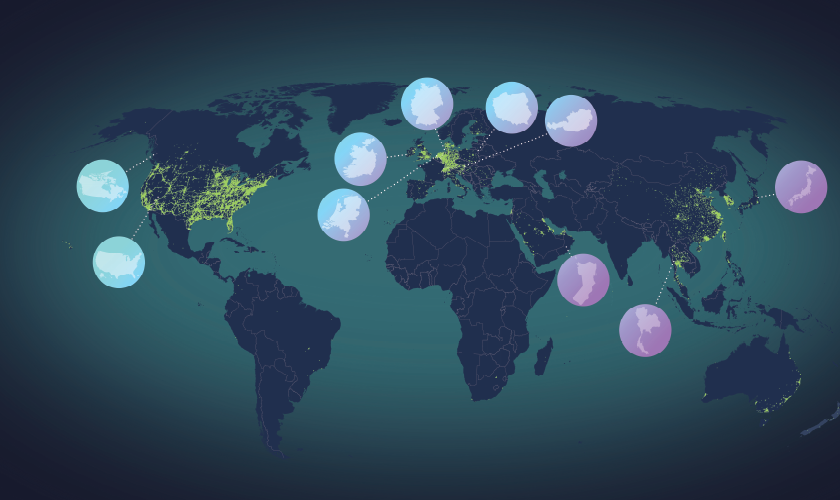
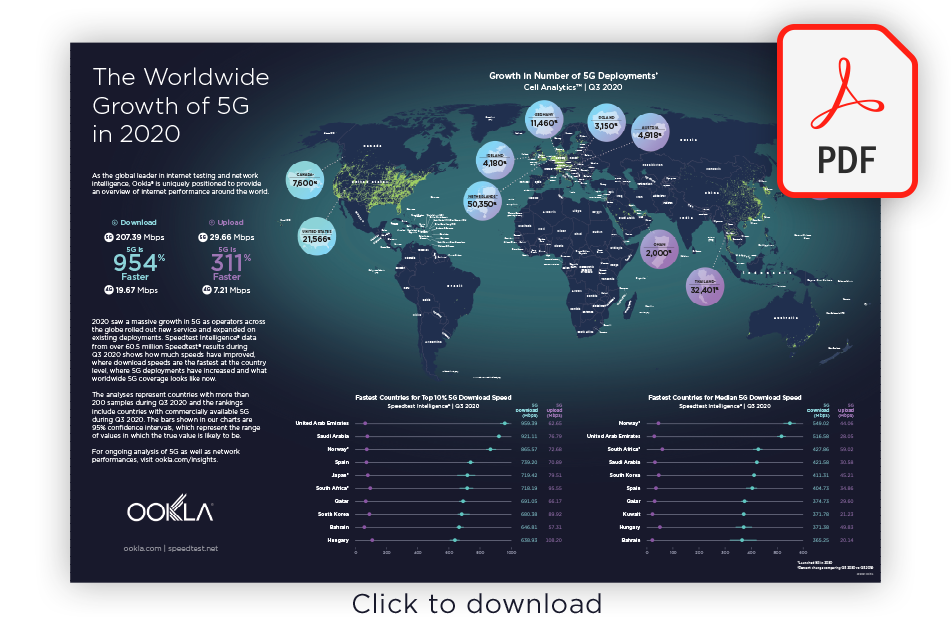
We’ve already written extensively about the massive increase in 5G in 2020. Still, the impact of 5G on network performance is easier to understand when you can see it illustrated at a global scale. We’ve used data from Speedtest Intelligence® to create a downloadable poster that celebrates the industry achievements of 2020.

pdf-download

This poster maps 5G coverage, highlights the countries with the fastest 5G and illustrates the countries with the most 5G deployments, all as of Q3 2020. Download the Worldwide Growth of 5G poster from Ookla® here to see the full picture of 5G performance, coverage and deployments. It works as a desktop background or you can hang it on your wall.

Congratulations on a banner year in 5G, and cheers to even more improvements in 2021!

Ookla retains ownership of this article including all of the intellectual property rights, data, content graphs and analysis. This article may not be quoted, reproduced, distributed or published for any commercial purpose without prior consent. Members of the press and others using the findings in this article for non-commercial purposes are welcome to publicly share and link to report information with attribution to Ookla.
| February 2, 2021

Using Crowdsourced Data for Competitive Network Intelligence in Latin America [Webinar]

Leer en español / Ler em Português

Mobile network operators in most markets worldwide are competing for the loyalty of a finite number of customers — and the winner is usually the network with the best coverage and performance. Competitive network intelligence drawn from hundreds of millions of real-world network measurements can show operators where competitors’ networks are outpacing their own.

In the upcoming Ookla® webinar, offered in both Portuguese and Spanish, we share how mobile operators in Latin America can monitor and benchmark their competitors’ performance and also prioritize network optimization in the areas most important to their customers. Read on to learn how crowdsourced data from Cell AnalyticsTM can give you an unprecedented view into competitor networks — and don’t miss the webinar.

pr-cta1
Wednesday, February 24 at 11 a.m. BRT

es-cta1
Thursday, February 25 at 9 a.m. CST (10 a.m. EST/PET/COT)

Track competitor launches, including new cell site deployments, frequencies and technologies

Cell Analytics gives operators an unprecedented view into competitor networks, including their cell site locations, most used frequencies and in-depth metrics about network performance, quality and coverage (including 5G). Using this information, you can prioritize your own new deployments and network improvements in areas where competitors have invested, as well as areas with a high density of users on all networks.

Assess network quality after reconfiguring a site or changing RAN vendors

When you reconfigure a cell site, change RAN providers, refarm old spectrum for new network technologies or make any other updates to your network, it’s important to measure the outcomes of these changes. Cell Analytics data can help you assess and compare the quality of your network (or competitors’ networks) before and after any changes are made.

Prioritize network optimizations based on user density and network congestion

In areas with high user density, not all operators are equipped to handle the demand of heavily traveled locations such as airports, large sporting venues, popular office parks and transit centers. Cell Analytics can help you identify locations — including tall buildings — where your competitors have better coverage and prioritize improvements based on network congestion and user density.

The webinar will show real-life use cases where operators in Latin America can use crowdsourced data can help prioritize network improvements. Don’t miss it. A recording will be provided for registrants who can’t tune in to the live presentation.

Cadastre-se para o webinar em Português
Regístrese para ver el seminario web en español


Cómo usar datos de colaboración abierta para la inteligencia de redes competitivas en Latinoamérica [Seminario web]

Los operadores de redes móviles en la mayor parte de los mercados del mundo compiten por la lealtad de un número finito de clientes —y el ganador suele ser la red con la mejor cobertura y el mejor rendimiento—. La inteligencia de redes competitivas obtenida de cientos de millones de mediciones de redes reales puede demostrar a los operadores en qué zonas las redes de la competencia superan a las suyas.

En el próximo seminario web de Ookla, disponible tanto en español como en portugués, le contamos cómo los operadores móviles en Latinoamérica pueden monitorear y comparar el rendimiento de sus competidores mientras priorizan la optimización de las redes que se encuentran en las zonas más importantes para sus clientes. Siga leyendo para saber cómo los datos de colaboración abierta obtenidos a través de Cell Analytics pueden brindarle una visualización sin precedentes de las redes de la competencia. Además, no se pierda nuestro seminario web.

es-cta1
Jueves 25 de febrero a las 9 a. m. CST (10 a. m. EST/PET/COT)

Rastree los lanzamientos de la competencia, incluidas las nuevas implementaciones de instalaciones celulares, frecuencias y tecnologías

Cell Analytics ofrece a los operadores una visualización sin precedentes de las redes de la competencia, incluidas las ubicaciones de sus instalaciones celulares y las frecuencias más usadas, así como métricas detalladas sobre el rendimiento, la calidad y la cobertura de la red (incluyendo las redes 5G). Con esta información, puede priorizar sus propias implementaciones nuevas y mejoras de red en zonas en las que ha invertido la competencia, así como en zonas con una alta densidad de usuarios en todas las redes.

Evalúe la calidad de la red luego de reconfigurar una instalación o cambiar de proveedor de RAN

Al reconfigurar una instalación celular, cambiar de proveedor de RAN, volver a agrupar el espectro antiguo para nuevas tecnologías de red o realizar cualquier otra actualización en su red, es importante que mida los resultados de estos cambios. Los datos de Cell Analytics pueden ayudarlo a evaluar y comparar la calidad de su red (o las redes de la competencia) antes y después de realizar cualquier cambio.

Priorice las optimizaciones de red en función de la densidad de usuarios y la congestión de las redes

En zonas con alta densidad de usuarios, no todos los operadores están equipados para manejar la demanda de ubicaciones muy transitadas, como aeropuertos, grandes centros deportivos, edificios de oficinas y centros de tránsito. Cell Analytics puede ayudarlo a identificar ubicaciones, incluyendo edificios altos, en las que sus competidores tienen una mejor cobertura y a priorizar las mejoras en función de la congestión de las redes y la densidad de usuarios.

En el seminario web le mostraremos casos de uso reales en los que operadores de Latinoamérica puede usar datos de colaboración abierta para priorizar mejoras en la red. No se lo pierda. Se proporcionará una grabación para aquellos inscritos que no puedan asistir a la presentación en vivo.

Regístrese para ver el seminario web en español


Uso de dados de crowdsourcing para inteligência competitiva de redes na América Latina [Webinar]

As operadoras de redes móveis na maioria dos mercados em todo o mundo estão competindo pela lealdade de um número finito de clientes — e, geralmente, o vencedor é aquele que oferece a melhor cobertura e o melhor desempenho. A inteligência competitiva de redes obtida a partir de centenas de milhões de medições de redes reais pode mostrar aos operadores os pontos em que as redes de concorrentes apresentam um desempenho melhor que as suas.

No webinar da Ookla que será realizado em breve e disponibilizado em Português e Espanhol, nós explicaremos como as operadoras móveis na América Latina podem monitorar e se destacar em relação ao desempenho da concorrência, além de como priorizar a otimização de redes nas áreas mais importantes para seus clientes. Continue lendo para saber como os dados obtidos a partir de crowdsourcing do Cell Analytics podem oferecer a você uma visão sem precedentes sobre as redes de concorrentes — e não perca o webinar.

pr-cta1
Quarta-feira, 24 de fevereiro às 11:00 BRT

Identifique as expansões da concorrência, incluindo 5G, novas implementações de estações rádio base, novas frequências e tecnologias

O Cell Analytics oferece às operadoras uma visão sem precedentes em relação às redes dos concorrentes, incluindo a localização de suas estações rádio base, frequências mais utilizadas e métricas aprofundadas referentes ao desempenho, à qualidade e à cobertura de suas redes (incluindo 5G). Utilizando essas informações, você poderá priorizar suas expansôes e melhorias de rede em áreas onde os concorrentes tenham investido, bem como em áreas com uma alta densidade de usuários de todas as redes.

Analise a qualidade da rede após a reconfiguração de estações ou da troca de fornecedores de RAN

Ao reconfigurar uma estação rádio base, trocar de fornecedores RAN, substituir tecnologias de rede antigas por mais atuais ou realizar qualquer atualização em sua rede, é importante medir os resultados de tais mudanças. Os dados do Cell Analytics podem ajudar a analisar e comparar a qualidade de sua rede (ou da rede dos concorrentes) antes e depois da realização de quaisquer alterações.

Priorize otimizações de rede com base na densidade de usuários e congestionamentos de rede

Em áreas com alta densidade de usuários, nem todas as operadoras possuem as ferramentas necessárias para atender à demanda de locais com alto fluxo de pessoas, como aeroportos, instalações esportivas de grande porte, grandes parques comerciais e centros de trânsito. O Cell Analytics pode ajudar a identificar os locais — incluindo edifícios — em que seus concorrentes oferecem melhor cobertura, e priorizar as melhorias com base no congestionamento da rede e na densidade de usuários.

Este webinar apresentará casos reais em que as operadoras da América Latina podem utilizar dados obtidos através de crowdsourcing para ajudar a priorizar as melhorias na rede. Não perca! Uma gravação será fornecida aos cadastrados que não puderem assistir a apresentação ao vivo.

Cadastre-se para o webinar em Português

Ookla retains ownership of this article including all of the intellectual property rights, data, content graphs and analysis. This article may not be quoted, reproduced, distributed or published for any commercial purpose without prior consent. Members of the press and others using the findings in this article for non-commercial purposes are welcome to publicly share and link to report information with attribution to Ookla.
| November 2, 2020

How to Improve In-Building Network Performance and Coverage with Crowdsourced Data (White Paper)

With much of the world still sheltering in place, most mobile network operators have been tasked with supporting additional demand from customers who are increasingly reliant on their networks for access to work, education and entertainment. RAN engineering teams are tasked with increasing capacity and improving service — while working within budgets that may be much tighter than in previous years.

In this white paper, you’ll learn how to use crowdsourced network performance data from Cell Analytics™ to prioritize the network improvements that have the most impact on your customers. By looking at where users are connecting but receiving poor service, you can discover and prioritize the best places to improve performance and coverage, benchmark your network metrics against competitors and monitor their 5G rollouts. Download the full white paper here.

Prioritizing locations with high user density but poor performance

Poor wireless service in a popular location like a shopping center, office park or transit center can impact a wireless customer’s satisfaction and an operator’s reputation. Cell Analytics helps you identify hotspots with a high concentration of users where your customers are experiencing poor performance and coverage.

Cell-Analytics_User-Density_Mumbai-1

The above image shows very high user density in Mumbai’s airport. In the white paper, we show how to prioritize optimization by user density and mobile data usage, then drill down into metrics like RSRQ (signal quality) and LTE most frequent band, to discover which band is showing the most issues for a given operator. From there, we can look at the operator’s LTE most frequent cell to pinpoint the exact cell site causing the issues, and make specific recommendations to improve their customers’ network experience at the airport — without spending excessive additional funds.

Discover where competitors have better in-building performance and coverage to prioritize infrastructure investments

Knowing where your competitors outperform your network can help you prioritize your investments and improvements. Beyond analyzing an existing network to find areas of competitive weakness or strength, operators can also monitor the status of 5G rollouts.

Cell-Analytics_5G-SS-RSRP_Hong-Kong2

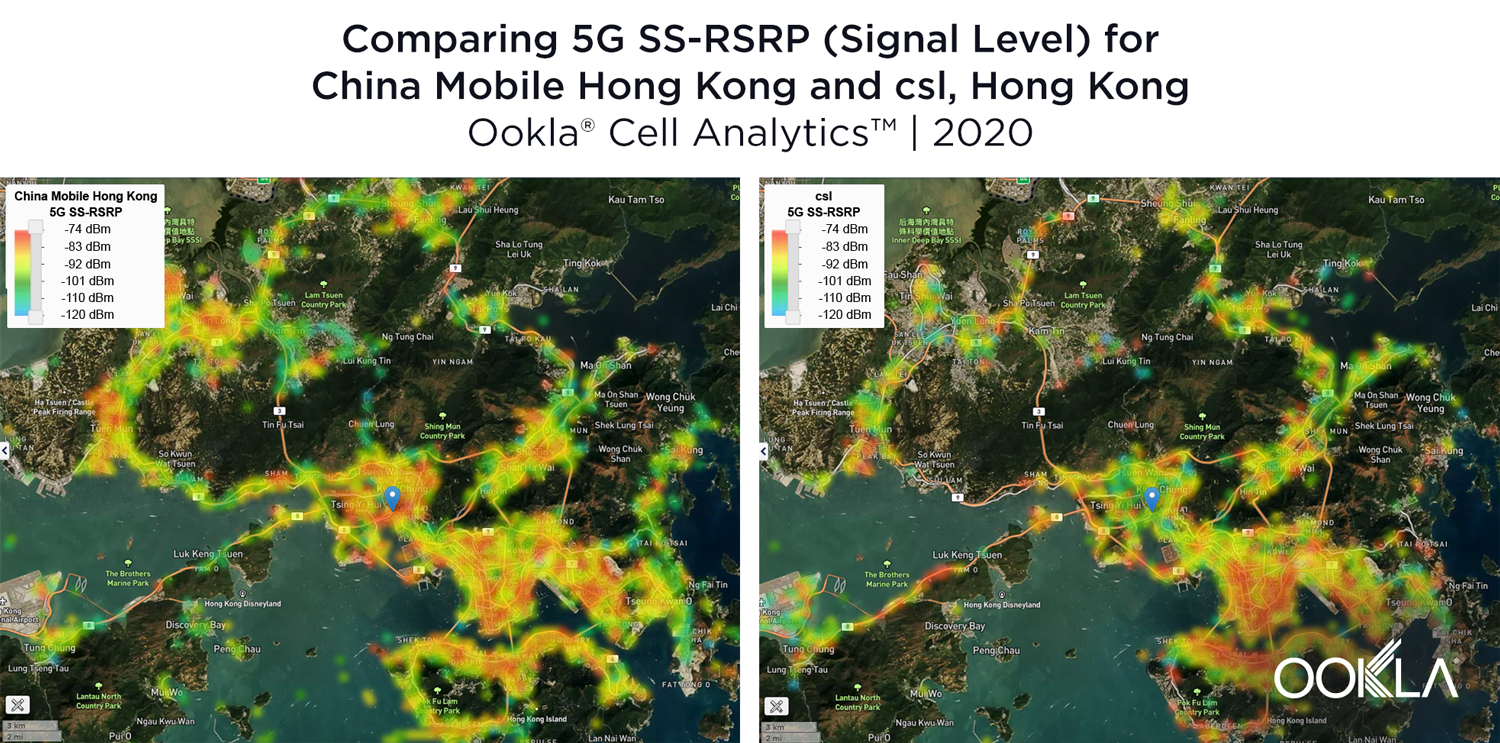
The above image compares 5G SS-RSRP (signal level) for two network operators in Hong Kong, showing variable coverage between providers. In the white paper we show how network operators can use this crowdsourced data to benchmark 5G network performance and coverage and to discover areas to prioritize for optimization.

Use 3D views to analyze performance in tall buildings, find problem cell sites and identify needed capacity expansion

Performance and quality of a network can vary dramatically in tall buildings. In densely populated cities with many tall buildings, detailed in-building analysis can show where performance is suffering by height, down to individual floor groups. A customer may have a variable experience on your network, depending on where they are located in a given building — which can make a critical difference in a populous office high-rise or on the ground floor of a hospital. Using the 3D “z-axis” view in Cell Analytics, you can see where optimization is needed to accommodate for variable performance in important buildings.

Cell-Analytics_3D-LTE-RSRP_Hong-Kong2

In the above image of Kwong Wah Hospital in Hong Kong, we can see that, while LTE signal level is sufficient for acceptable service within all levels of the building, RF quality gets progressively worse in the upper floors of the hospital. The white paper explores potential issues with nearby cells to help the operator find a solution that offers their customers good network quality, no matter where they are located within the hospital.

In this report, we walk through seven in-depth use cases where RAN engineering teams can use Cell Analytics data to prioritize engineering efforts and make no-cost or low-cost improvements to the network. The white paper also includes information on benchmarking 5G metrics and monitoring competitors’ new deployments.

Download the full whitepaper to learn how to use crowdsourced data to prioritize the network improvements that have the most impact on your customers.

Ookla retains ownership of this article including all of the intellectual property rights, data, content graphs and analysis. This article may not be quoted, reproduced, distributed or published for any commercial purpose without prior consent. Members of the press and others using the findings in this article for non-commercial purposes are welcome to publicly share and link to report information with attribution to Ookla.

| June 3, 2020

Efficiently Design and Optimize Your Network with Crowdsourced Data (Webinar)

Mobile network operators are currently faced with a double challenge. With much of the globe still under stay-at-home orders, consumers are increasingly reliant on the quality and availability of their networks — and worldwide, operators are facing both budget cutbacks and logistical limitations on traditional data collection methods like walk-testing and drive-testing. Now more than ever, network planners and engineers must prioritize their decisions to have the maximum impact on customer experience with the minimum associated cost.

In Ookla’s upcoming webinar, we’ll show three real-world use cases where European operators can make low-cost or no-cost changes to their existing networks — without drive testing. By identifying competitors’ cell site locations and finding areas of high density and usage where competitor networks perform better, operators can use the crowdsourced data in Cell Analytics™ to prioritize improvements to their networks.

Read on to discover three ways operators can make smarter design and optimization decisions, and don’t miss the webinar on Wednesday, June 17, 2020 at 7am PDT / 10am EDT / 4pm CEST.


1. Identify populated areas where competitor networks outperform yours

Powered by hundreds of millions of signal measurements collected daily by Speedtest®, Cell Analytics provides intelligence about wireless service quality, RF measurements, data usage, user density (both indoors and outdoors), cell site locations and much more. By looking at areas with the highest user density and data usage, you can identify areas where people need a strong connection — and see where competitors provide better wireless service.

webinar-screenshot_LTE_RSRQ_Barcelona

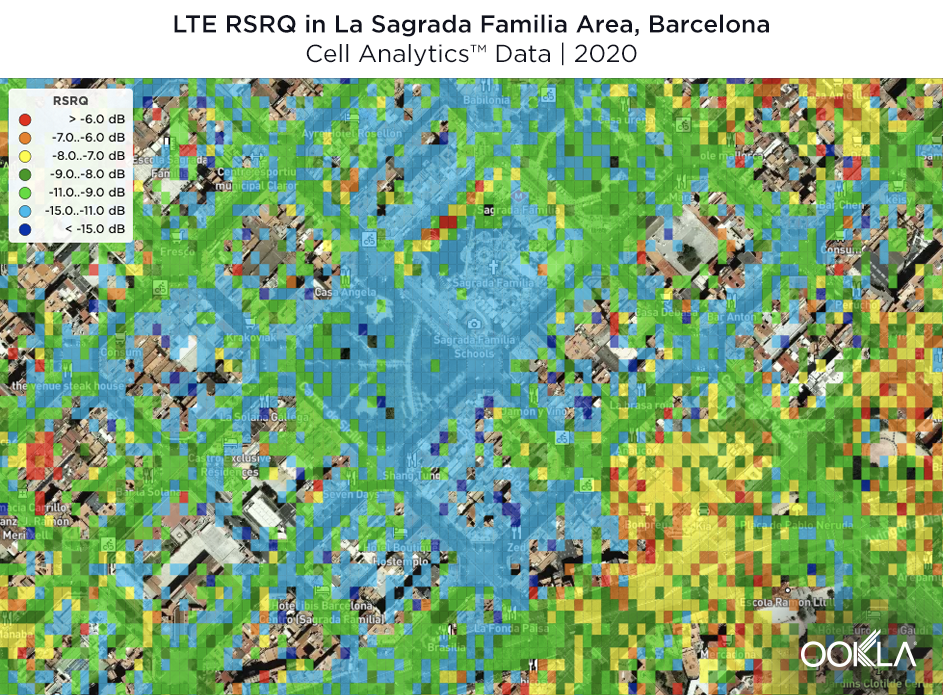
In the above example, we can see signal quality for a given operator both in and around one of Barcelona’s most popular locations, La Sagrada Familia cathedral. By looking at real-world measurements, you can discover the highest-priority places to invest in capacity expansion or relatively simple fixes like antenna downtilt or network parameter changes.

2. Identify competitor cell sites and monitor new cell site deployments

Without visibility into your competitors’ network performance, quality and availability, it can be difficult to benchmark your own network metrics. Crowdsourced data provides actionable intelligence to assess your network performance inside and outside of buildings and to compare your network to competitors’. Use the Cell Site Finder tool in Cell Analytics to discover the location of competitor cell sites, analyze your performance vs. competing networks and identify opportunities for potential collocation or new deployments.

webinar-screenshot_LTE_RSRP_London

In the above example, we have cross-referenced the location of various network operators’ cell sites with RSRP in two busy shopping locations near London’s Wembley Stadium. From this, we can see the location of all cell sites in the area and a precise view of the service they are delivering. By viewing the coverage of individual competitor sites, you can avoid costly errors that result from relying on RF prediction tools alone during new cell site design.

3. Identify ways to make low-cost improvements to your existing network

Once you’ve prioritized the areas where improvements are most needed, dig into our data to see why users might be experiencing poor network performance and low data quality. To troubleshoot the underlying issues, you can analyze serving cells and band usage in high resolution and then look at the relation between RF conditions and service indicators like throughput, latency and jitter.

webinar-screenshot_LTE_RSRQ_Dublin

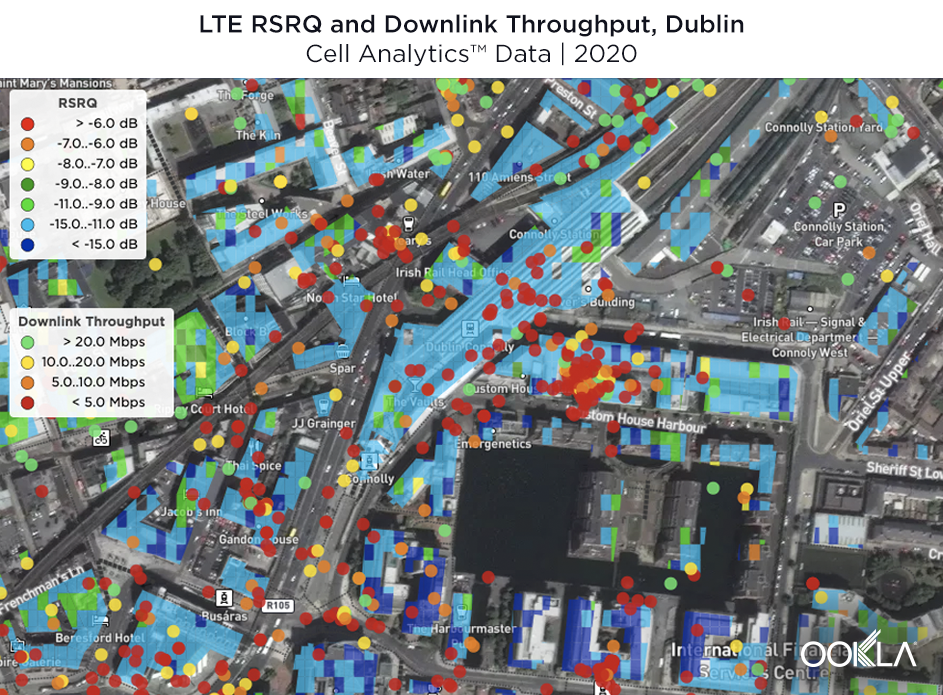
By comparing one operator’s RSRQ with downlink throughput in Dublin’s busiest railway station, we can pinpoint the exact sites that need adjustment to increase the quality of service for this operator. This type of data shows you where a relatively easy fix like antenna azimuth or downtilt changes might help.

To see in-depth recommendations for the operators in the above scenarios, don’t miss the webinar on June 17. If you cannot make the presentation, you can register to receive a video recording after the live event. We look forward to showing you how to leverage real-world data to make better network decisions and answering any questions you may have. Register now.

Ookla retains ownership of this article including all of the intellectual property rights, data, content graphs and analysis. This article may not be quoted, reproduced, distributed or published for any commercial purpose without prior consent. Members of the press and others using the findings in this article for non-commercial purposes are welcome to publicly share and link to report information with attribution to Ookla.

| December 3, 2020

Prioritizing Broadband Funding to Close the Digital Divide [Webinar]

Improving broadband access is a priority for legislators and policy makers, and the shift to working and learning from home has highlighted the deep digital divide across the United States — particularly in rural areas. Congress will likely allocate more dollars to ensure that every citizen has high-speed internet access in the coming year. Federal, state and local governments need accurate data on broadband availability and network performance in order to prioritize broadband development in underserved areas. With this information, government officials can ensure that they are maximizing their dollars and serving their constituents appropriately.

The upcoming Ookla® webinar on December 16 will share how network data from Ookla Speedtest® can give you deep insights into broadband availability and performance within your jurisdiction — and help you fund development efforts in the communities that need it most. Read on to learn more about prioritizing broadband funding.


Accurately determine where constituents can (or cannot) access adequate broadband

Policymakers have historically had to rely on fixed broadband deployment data from the FCC’s Form 477 to try to understand broadband access within their jurisdictions. This data is generally at least a year old by the time it reaches the hands of a policymaker — and in 2020, the government has delayed the latest update. It is crucial to look at the most robust, comprehensive and up-to-date data available on the networks to get a clear picture of broadband speeds and understand which communities aren’t being adequately served. Millions of users in the U.S. rely on Speedtest to test the performance of their networks — and the resulting data paints an accurate picture of where users can and cannot connect with internet that meets the FCC minimum thresholds of 25 Mbps download speed and 3 Mbps upload speed.

Use crowdsourced data on network speeds and availability to prioritize broadband funding

The webinar will show how Speedtest datasets can be filtered and analyzed to determine specific locations where constituents can’t access the speeds they need for remote learning and working from home. We will discuss why precise geolocation of network speed results is critical to understanding which communities need better broadband access — and how looking at ZIP codes alone may lead to underserved communities within those very ZIP codes.

Speedtest data can help policymakers eliminate costly data collection and analysis for areas that already have adequate service by pinpointing where internet service providers (ISPs) are actually delivering services that meet or exceed the current definition of broadband. Resources can instead be allocated to areas that show a clear need for broadband infrastructure investment.

The webinar on Wednesday, December 16 at 9 a.m. Pacific (12 p.m. Eastern) will show you how to analyze, filter and understand data from Speedtest to make informed spending decisions. Don’t miss it. A recording will be provided for registrants who can’t tune in to the live presentation. Register now.

Ookla retains ownership of this article including all of the intellectual property rights, data, content graphs and analysis. This article may not be quoted, reproduced, distributed or published for any commercial purpose without prior consent. Members of the press and others using the findings in this article for non-commercial purposes are welcome to publicly share and link to report information with attribution to Ookla.

| January 15, 2020

Power is Key to Mobile Network Recovery After Earthquakes in Puerto Rico

Mobile connectivity is crucial in the wake of a natural disaster as consumers seek to connect with loved ones and vital services. This is made all the more difficult by the fact that natural disasters can also wreak havoc on the infrastructure that supports that connectivity, including electrical power. In order to support recovery efforts, we used Speedtest® data from before and after the major recent earthquakes in Puerto Rico to see how mobile users were affected and where network connectivity currently stands.

While it was reported that power plants automatically shut off for safety following the quake on Monday, January 6 at 6:32 a.m. local time, we do not see the same effect to mobile networks during that time as we did when power plants were then reportedly damaged in the Tuesday, January 7 quake that struck at 4:24 a.m. local time. Not all power plants were yet fully online by the time of the quake on Saturday, January 11 at 8:54 a.m. Electricity is essential to power cellular networks and not all cell sites have on-site power generators. We explore the various impacts of these power outages below.

Signal measurements and test volumes dropped after Tuesday’s quake

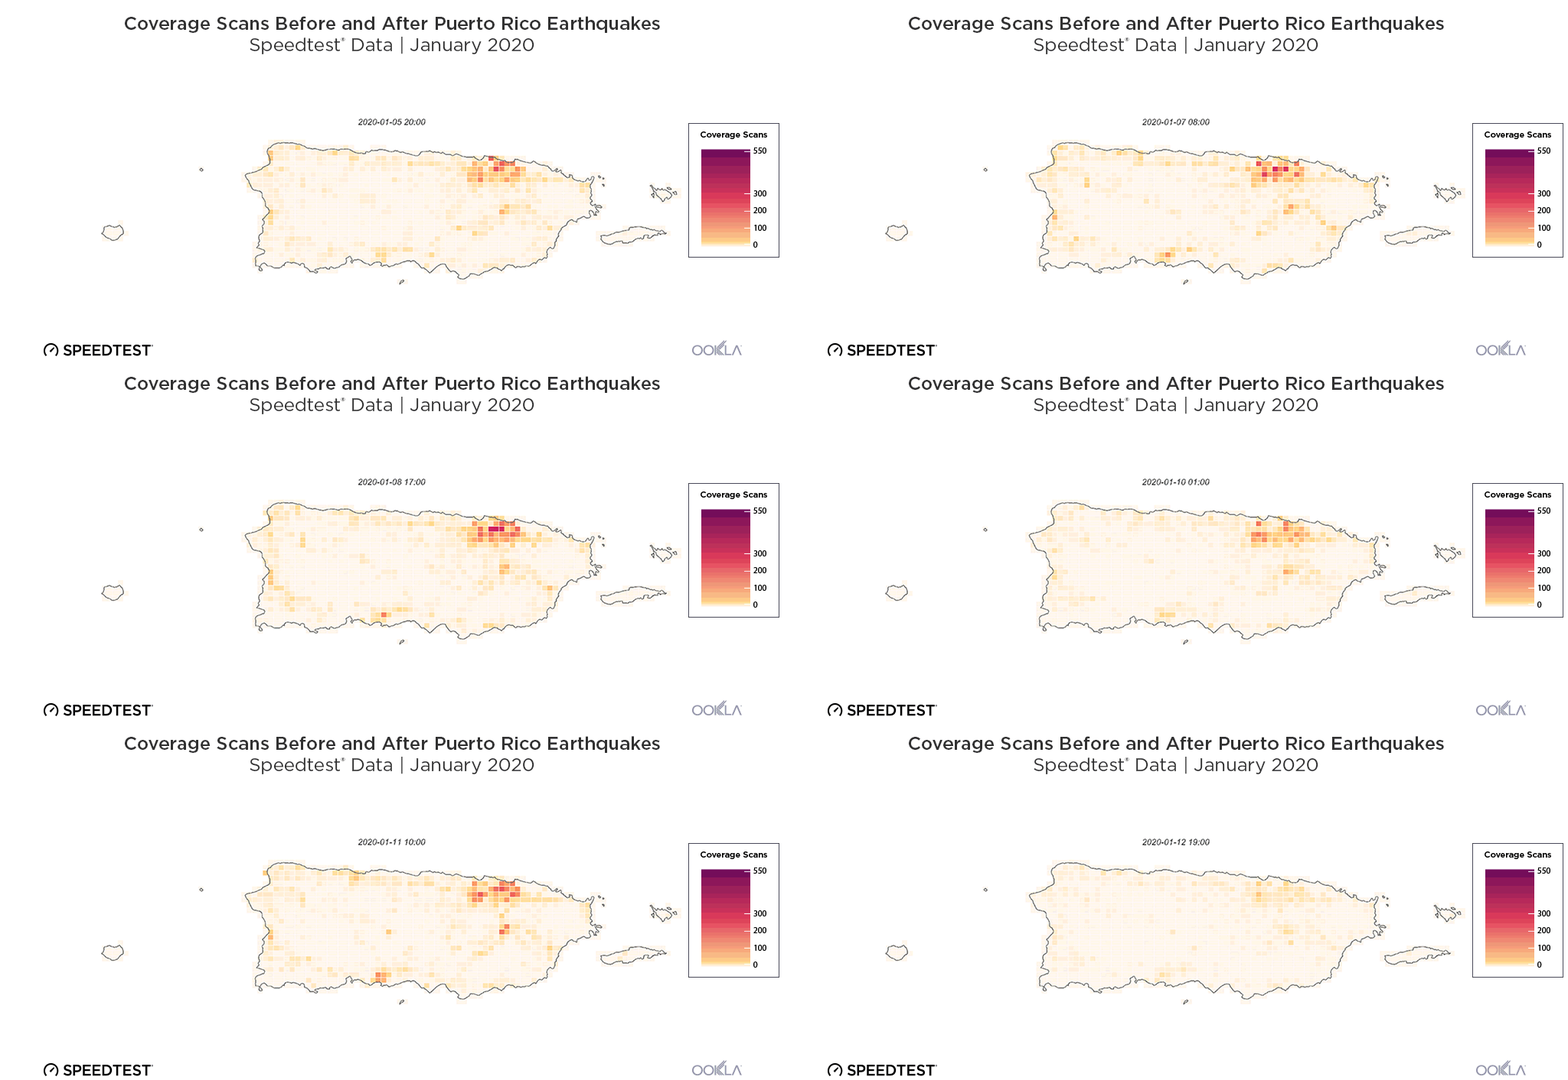
An hourly timelapse from the time before the first major earthquake on Monday, January 6, through the second (Tuesday, January 7) and third (Saturday, January 11) show the number of passive signal measurements from Android devices on the island of Puerto Rico.

Coverage scans timelapse

We see a similar pattern of scans throughout the period, but the volume of samples declines following each of the three quakes.

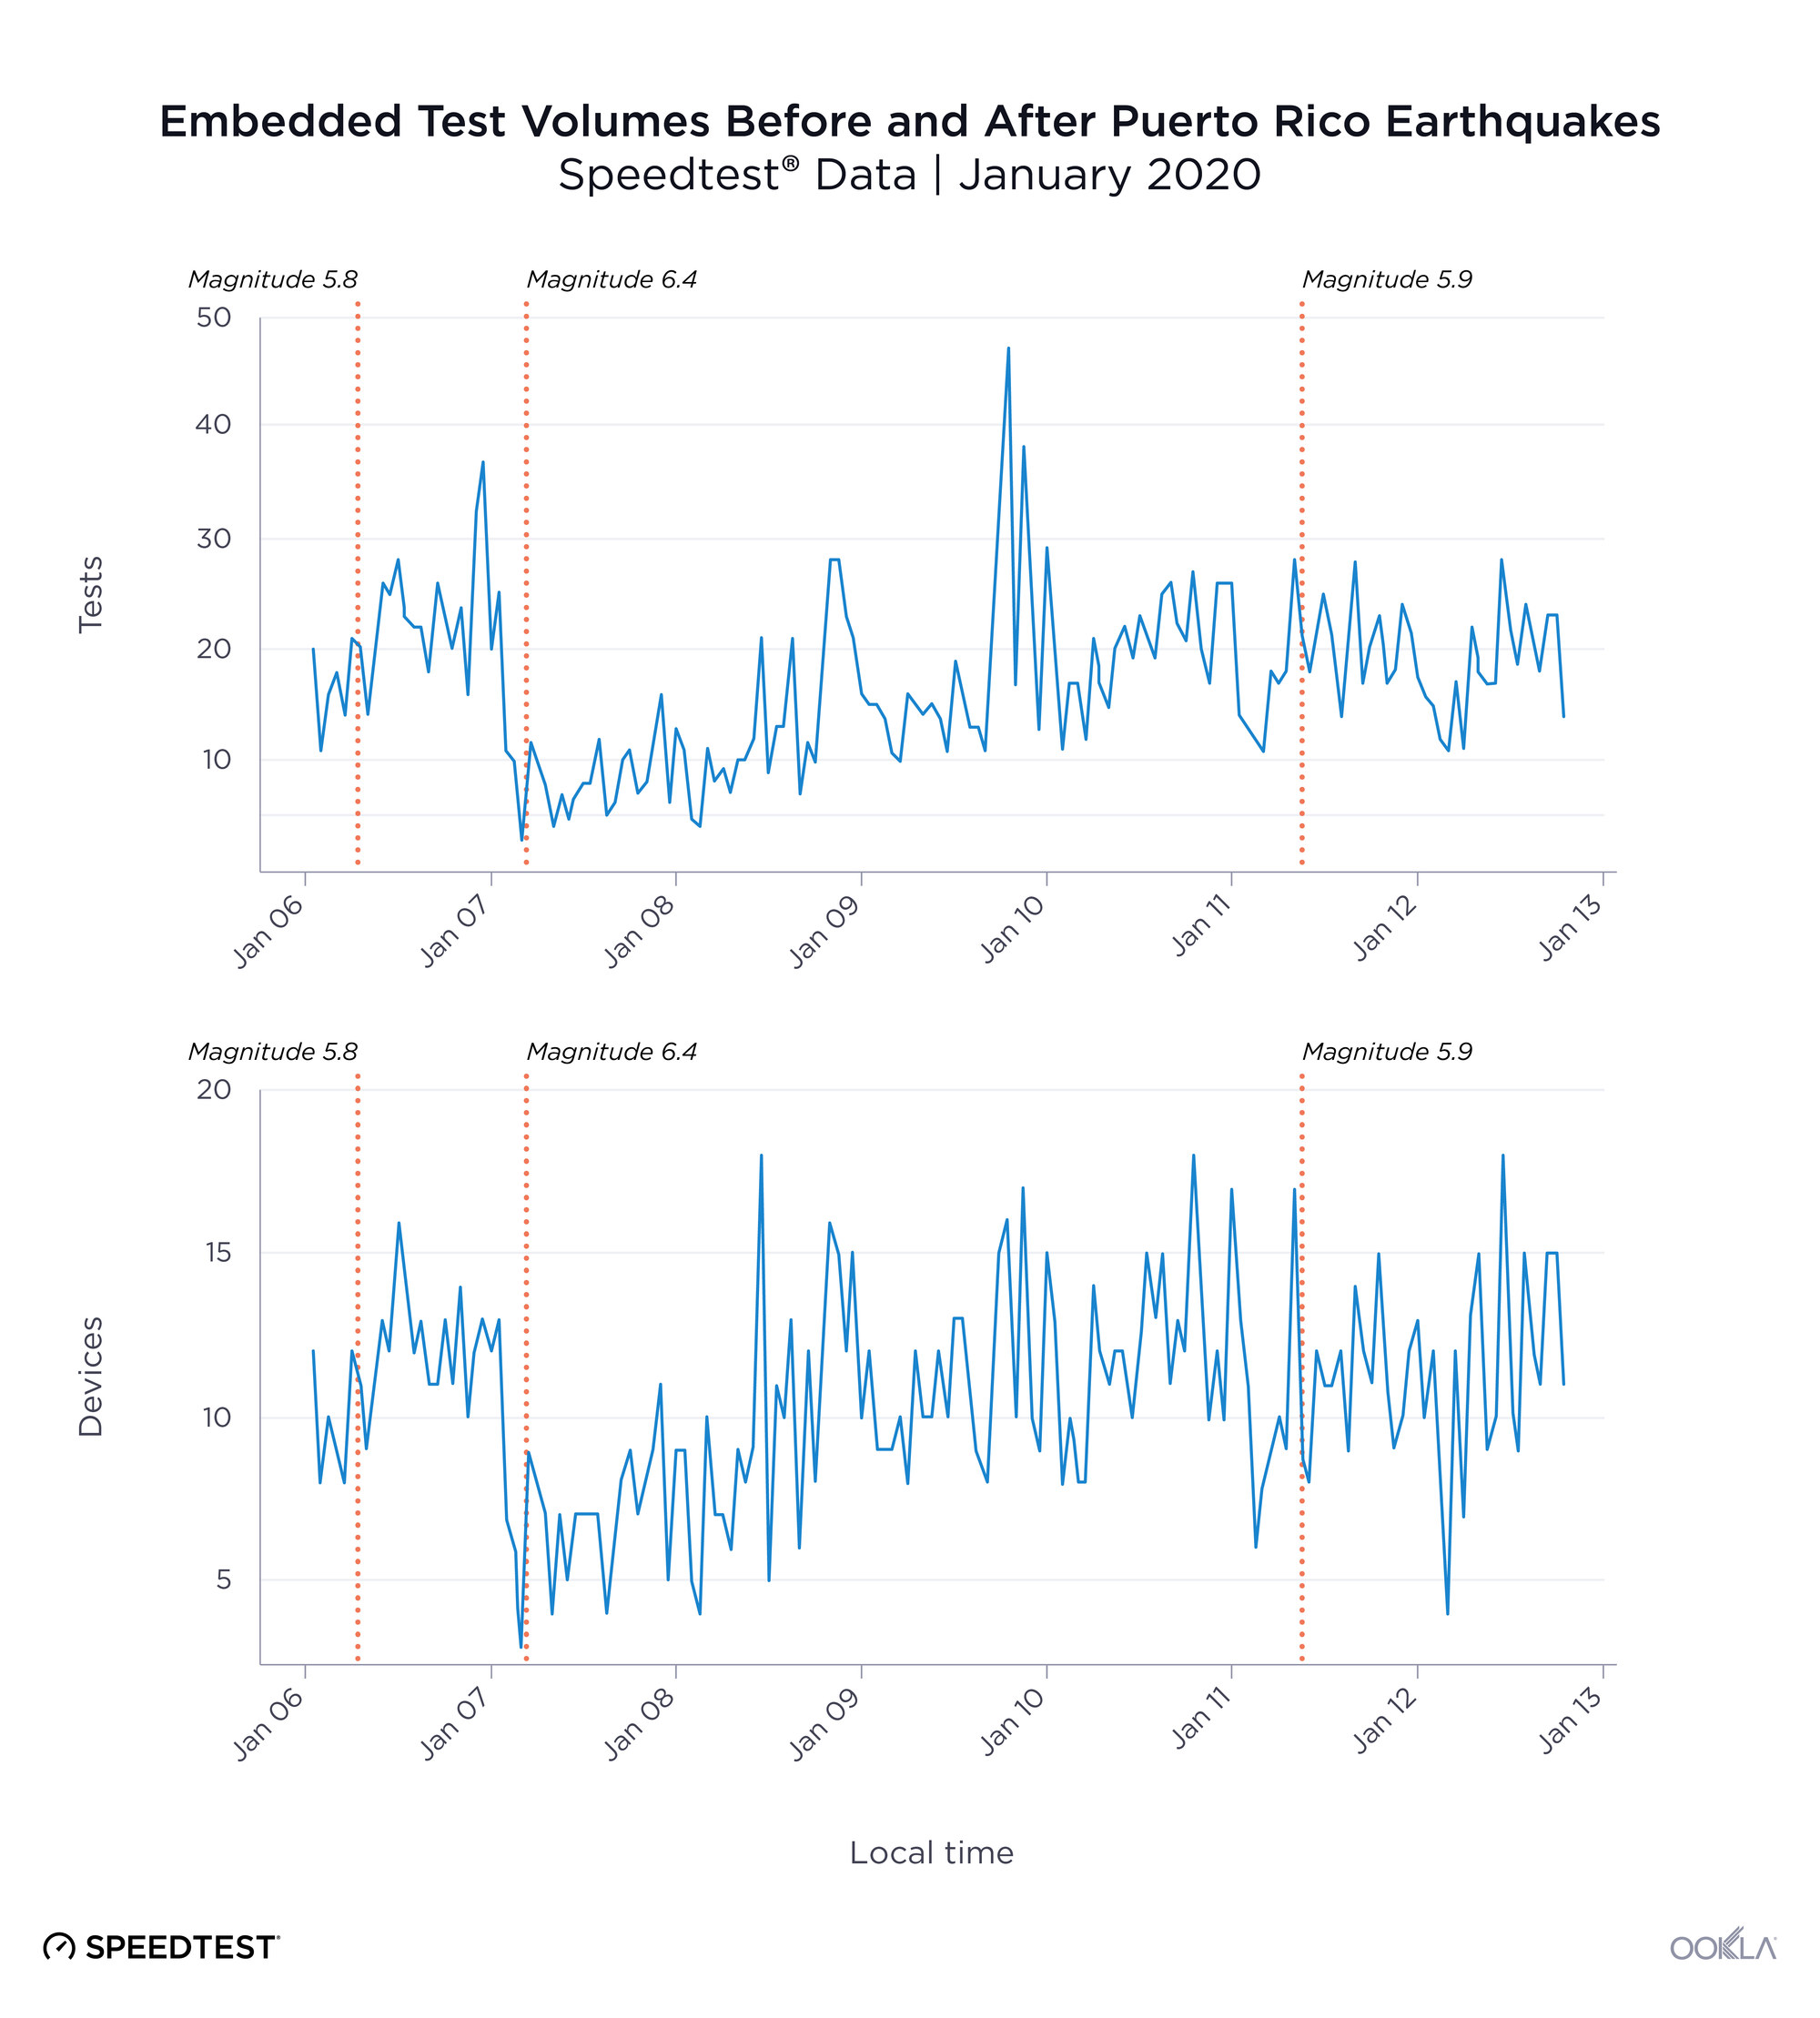
PR-Embedded-Volumes-Devices-Tests-4

Embedded tests also dropped off after the Tuesday, January 7 earthquake. These come from devices (including: routers, gateways, modems, test and measurement devices and IoT Devices) that use Speedtest PoweredTM to monitor connectivity by running a Speedtest, usually on a regular schedule. Except when the power is out.

No service status jumped after Tuesday’s quake

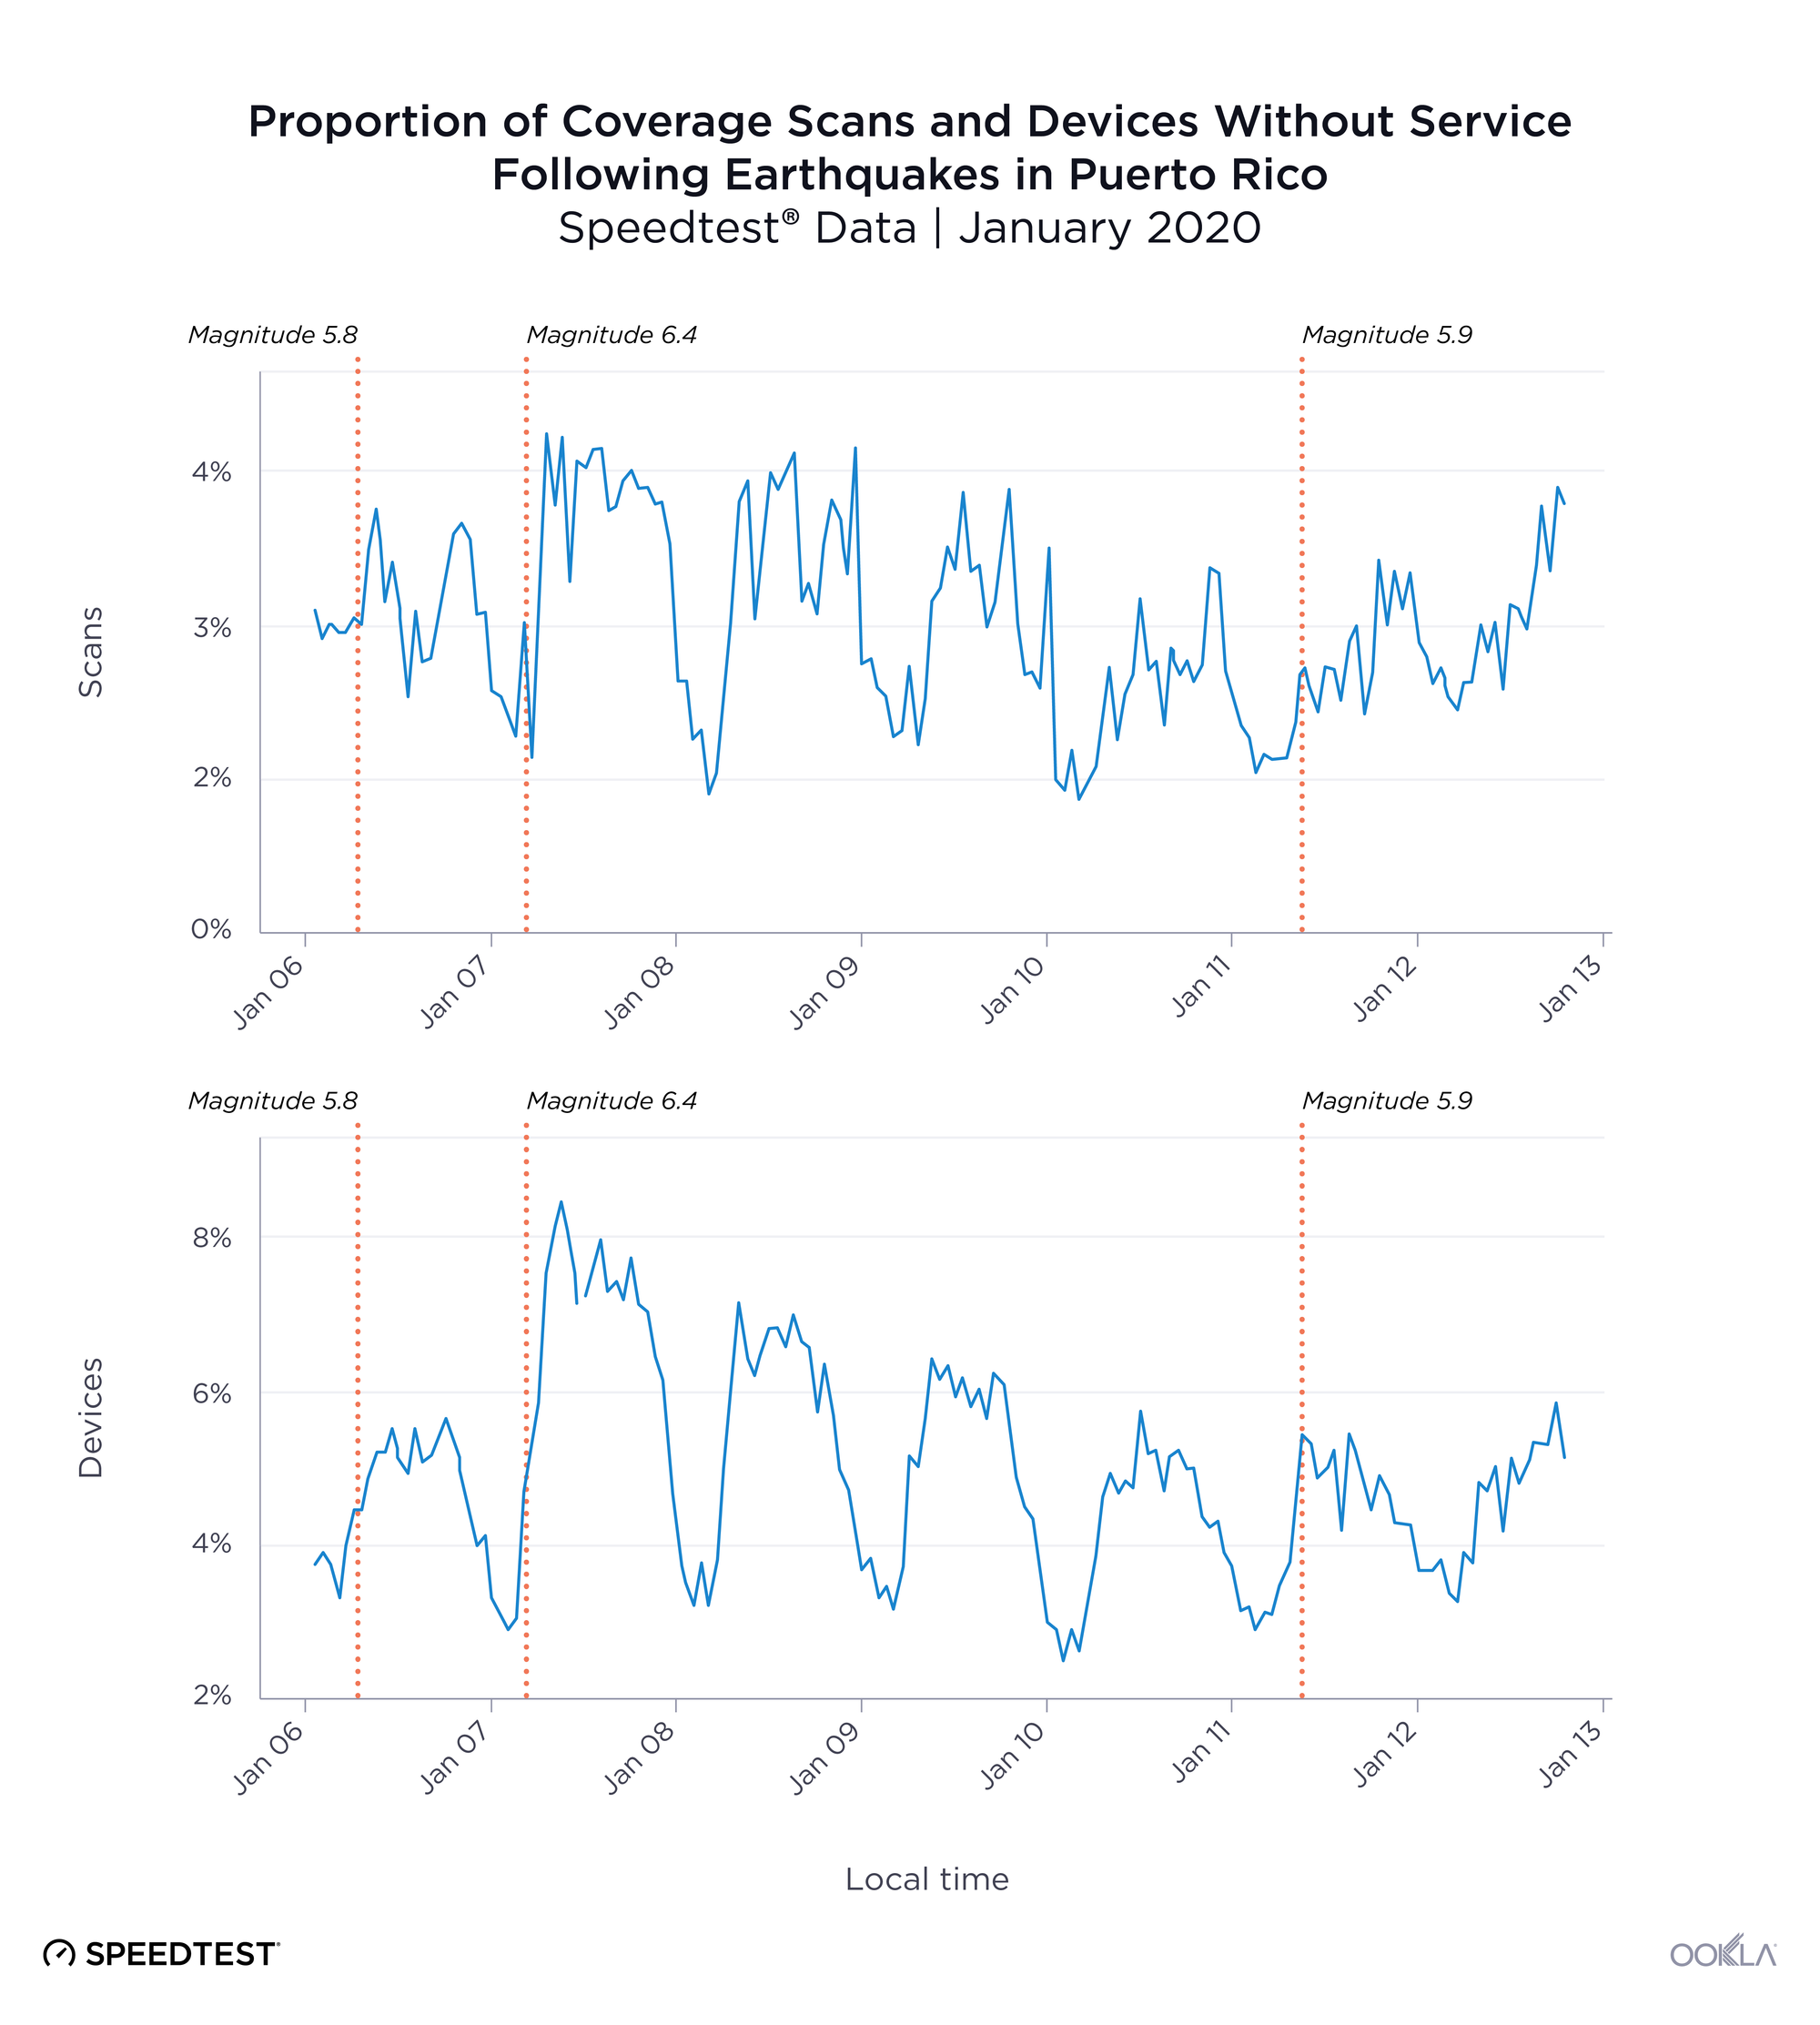
PR-No-Service-Scans-Devices

The proportion of scans and devices with no service in Puerto Rico show a large jump after the earthquake on Tuesday, January 7 compared with the time period following the Monday, January 6 quake. This shows that the real impact to mobile networks was a result of the quake on Tuesday, January 7, likely because of power outages, and that networks were slowly recovering in the days after.

It looks as though scans and devices with no service were trending upward following the quake on Saturday, January 11 as well, though full data was still trickling in as this article was being written.

Battery level fell when devices were disconnected from power

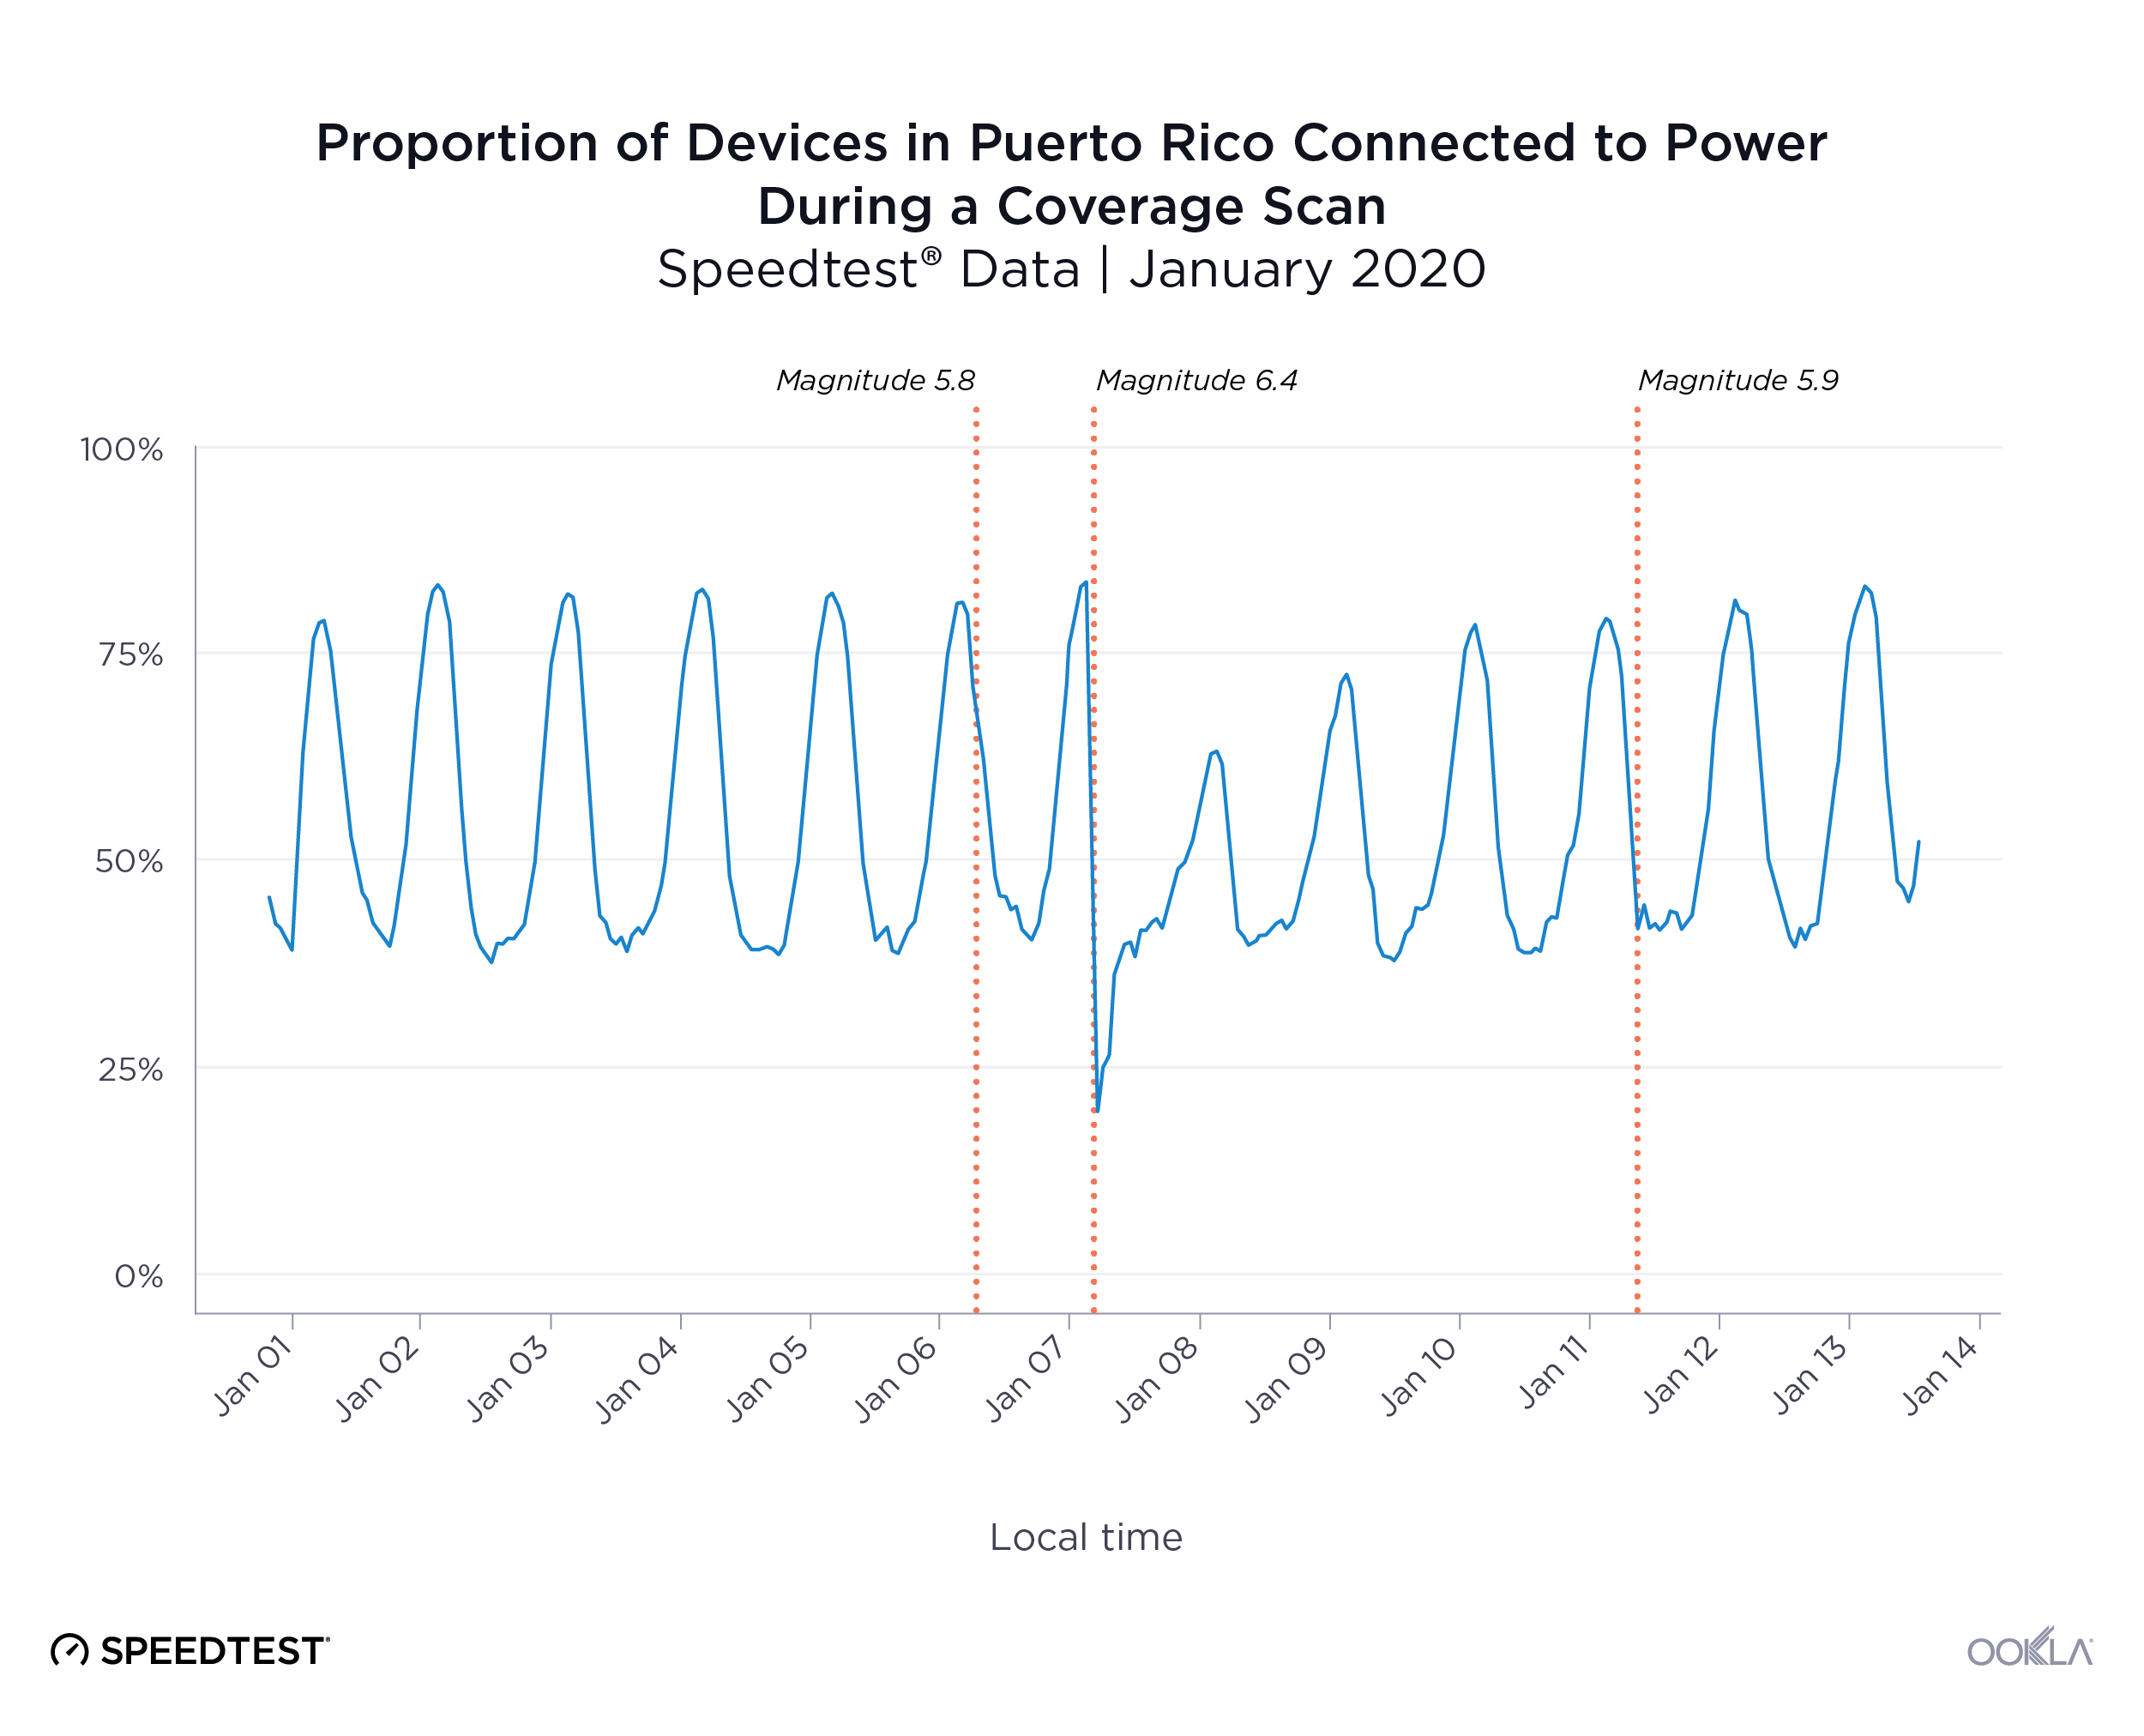
For signal to matter, a device needs to have battery or the ability to charge. We used Speedtest data to analyze the proportion of devices that were connected to power during a coverage scan during the month of January.
Proportion-of-Devices-Connected-Puerto-Rico_0120-4
Before and after the earthquake on Monday, January 6, we see a fairly consistent daily pattern where between 30% and 85% of devices are connected to power during a scan. Immediately following the quake on Tuesday, January 7, there is a sharp drop in devices connected to power. The pattern had still not fully recovered when the third major quake hit on the morning of Saturday, January 11. There also appeared to be a longer than average dip in devices connected to power immediately following Saturday’s quake, but the pattern looks to be normalizing in the days since.

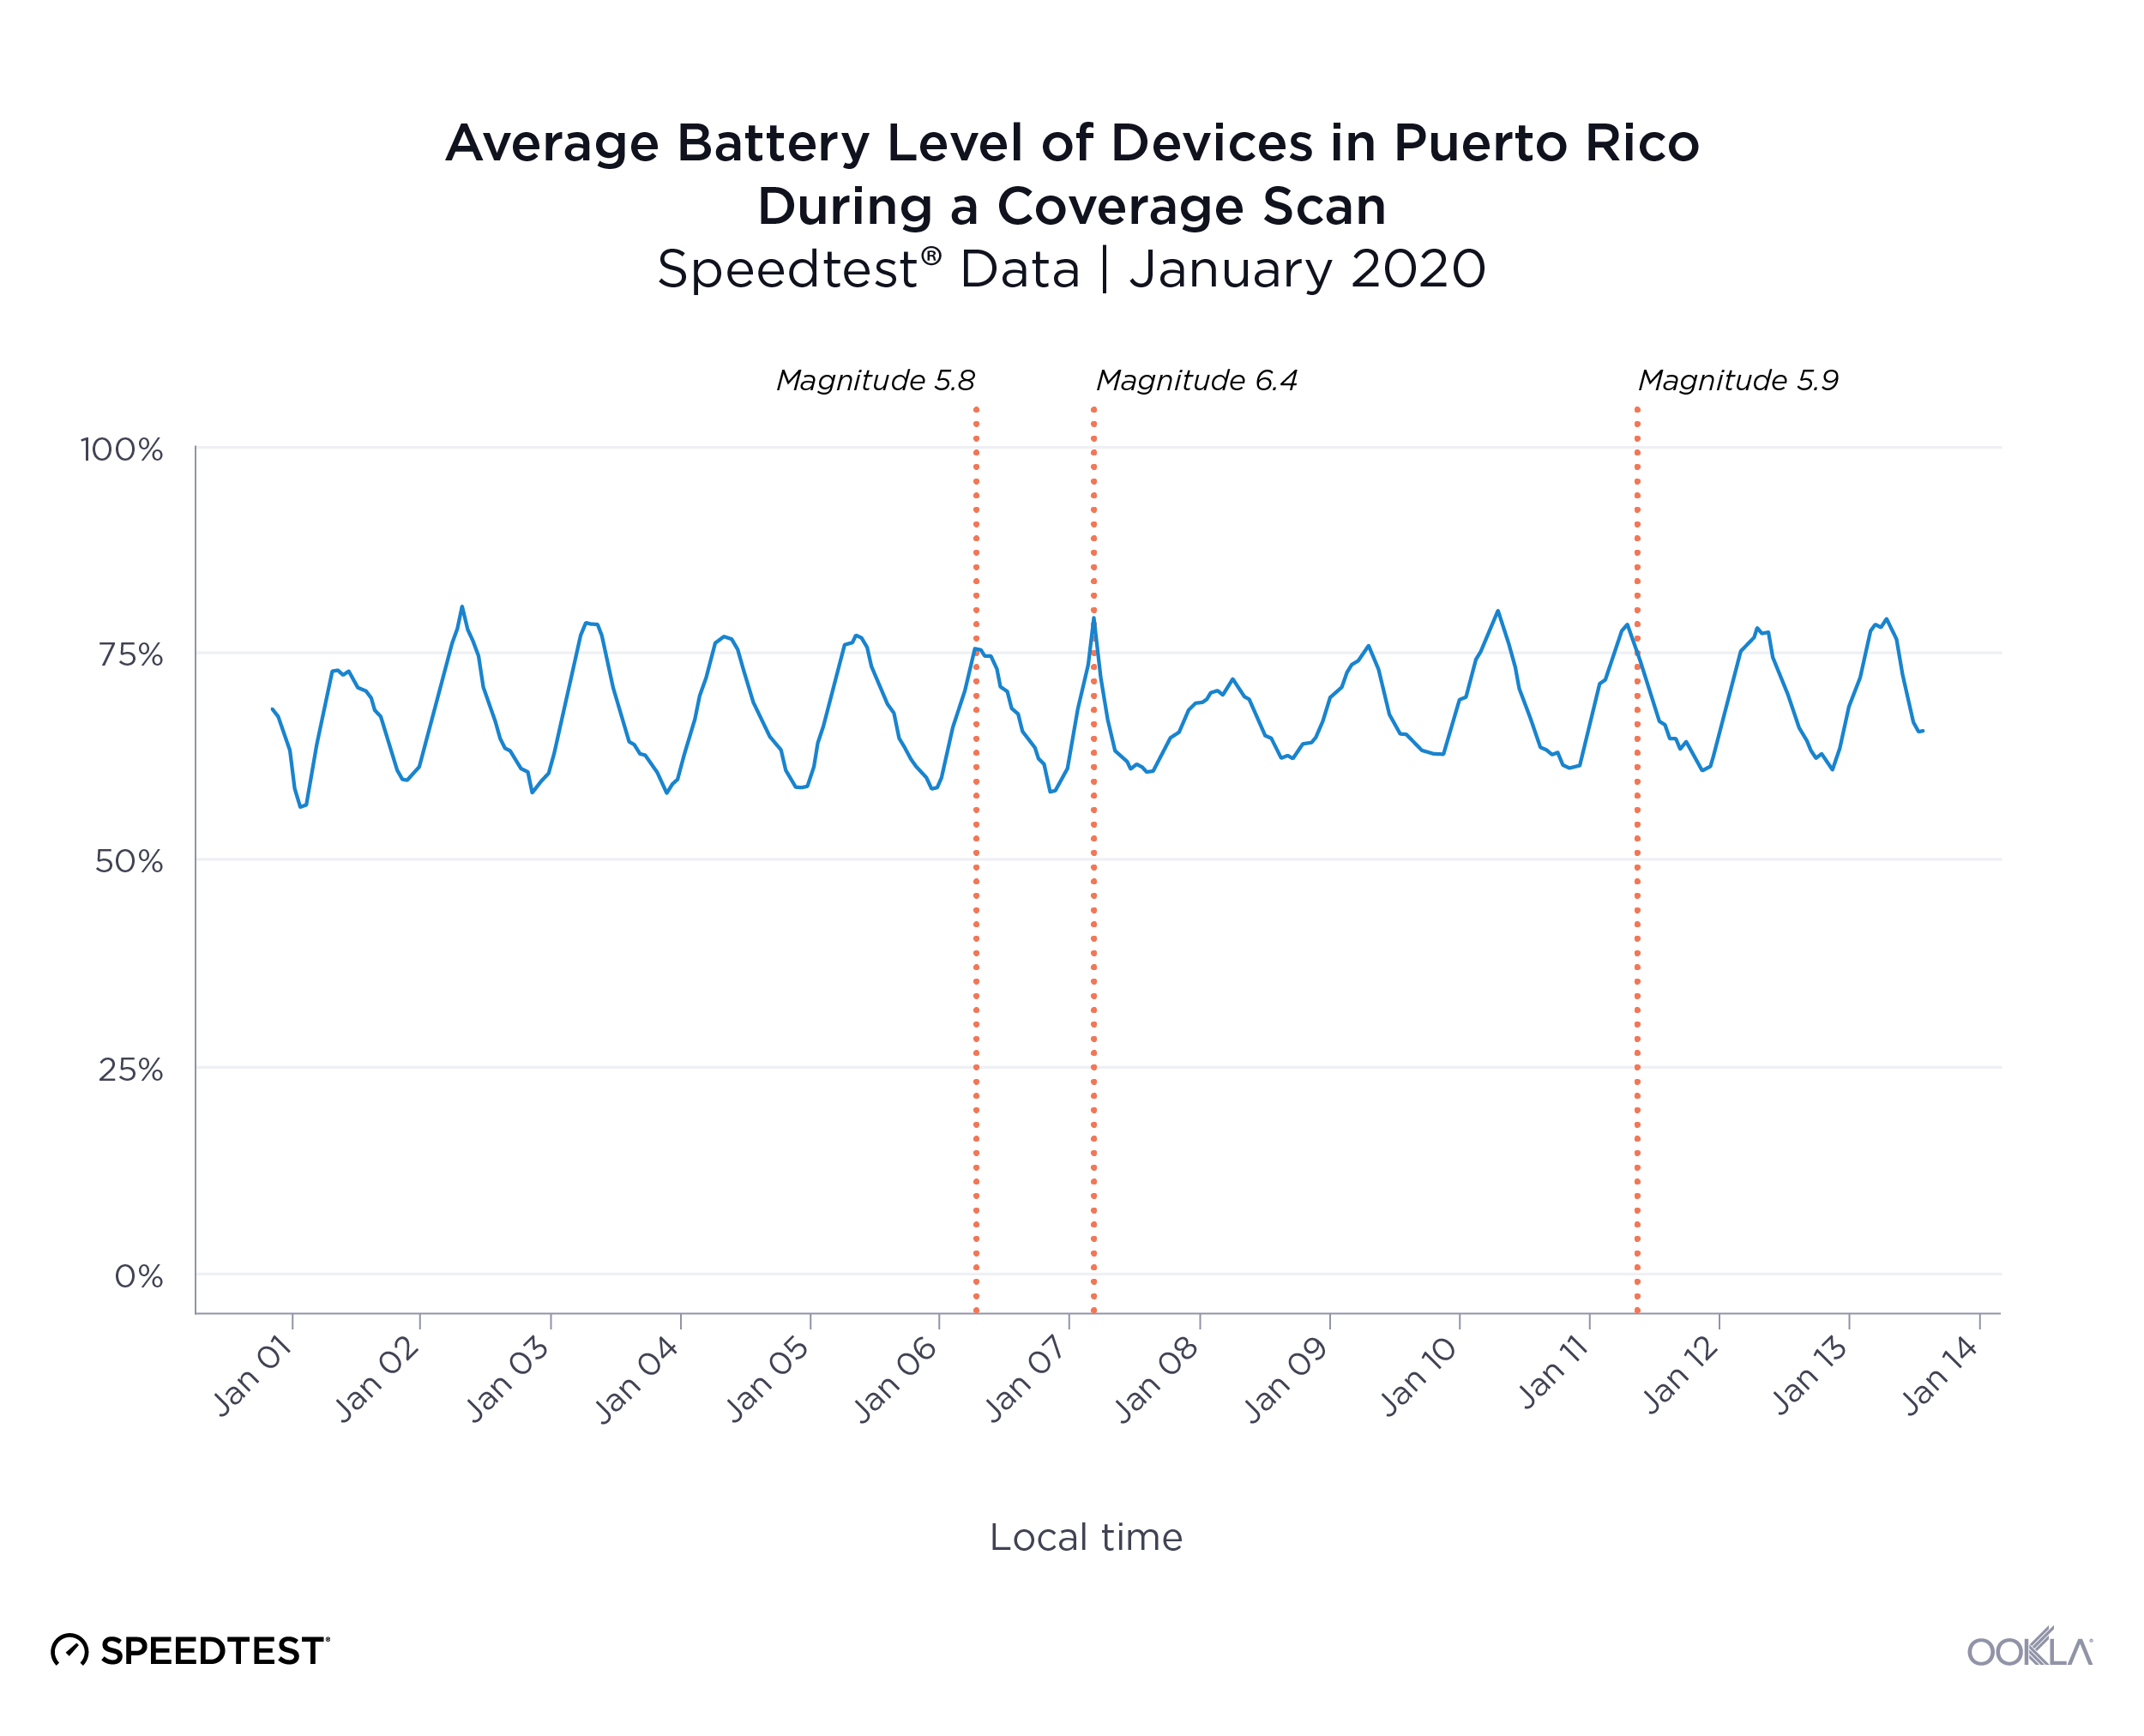
The disruption in devices connected to power after the January 7 quake then affected average battery life of unplugged devices. This drop in average battery level reflects devices that had been charging when the power went out. We can also see that the average battery level didn’t return to a normal cycle until Friday, January 10.

Average-Battery-Level-of-Devices-Puerto-Rico_0120-2

While these battery observations may appear straight-forward, they are important to highlight because they illuminate the cascading connectivity challenges that communities face in times of crisis.

Natural disasters can happen anywhere. In places like Puerto Rico, where the power grid is still suffering from the effects of Hurricane Maria, the effects of additional natural disasters on critical mobile networks can be especially challenging. Full power was expected to have been restored to the island on Sunday.

At Ookla, we share data pro bono in times of need that can help assist recovery in a number of ways. If you are an operator or regulator assisting with rebuild efforts in Puerto Rico that could use Ookla data to aid your immediate efforts, please inquire for more information.

Ookla retains ownership of this article including all of the intellectual property rights, data, content graphs and analysis. This article may not be quoted, reproduced, distributed or published for any commercial purpose without prior consent. Members of the press and others using the findings in this article for non-commercial purposes are welcome to publicly share and link to report information with attribution to Ookla.

| August 21, 2019

Examining Vodafone Idea Performance One Year After the Merger

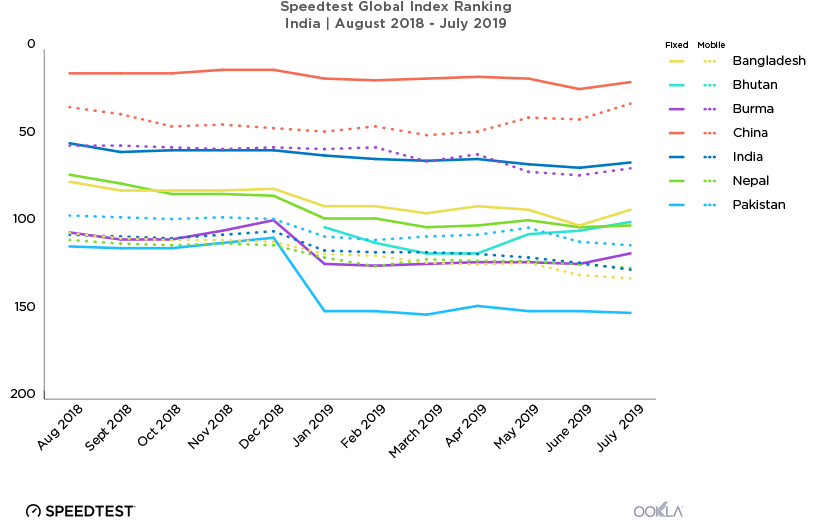
When Vodafone India merged with Idea Cellular, the company promised a better network and new technology that would result in improved performance. So has it? We analyzed Speedtest IntelligenceTM data from August 2018 – July 2019 to find out. Because Vodafone and Idea still maintain separate brands, we’ve considered their data separately, but the trends in their performance are similar.

How mobile speeds have changed in India

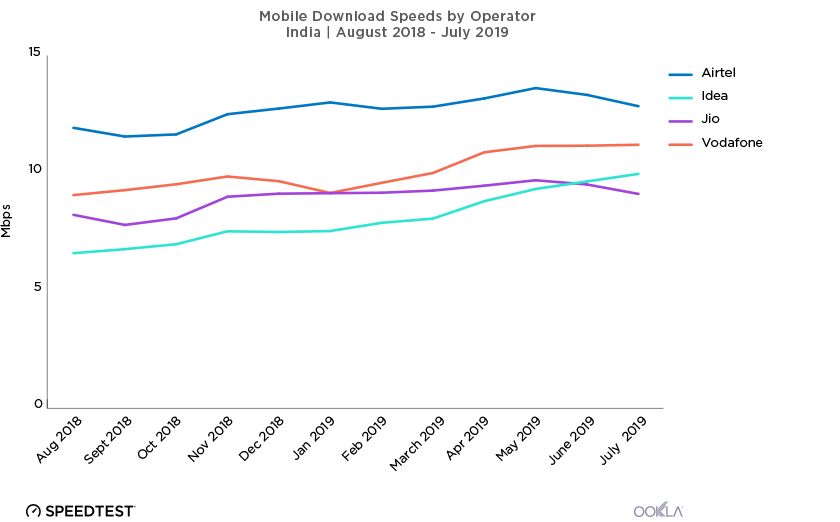
vodafone-graph-1

Speedtest results show that mobile download speeds in India improved on average for all the top mobile operators over the period of August 2018 – July 2019, with Airtel holding onto the title of fastest operator throughout these 12 months.

However, a month-by-month view reveals a more interesting story. After May 2019, mean mobile download speeds for both Airtel and Jio started a decline that continued through July 2019. Meanwhile, Vodafone saw a decline in mean mobile speed from November 2018 through January 2019, after which they recovered to significantly increase download speed to effect a year-over-year improvement of 23.6%. Mobile download speeds on Idea improved in every month except December 2018, for a year-over-year improvement of 51.2%. In comparison, Airtel’s download speed increased 7.7% during the same period and Jio’s download speed went up 10.8%.

Operators meeting the Acceptable Speed Ratio

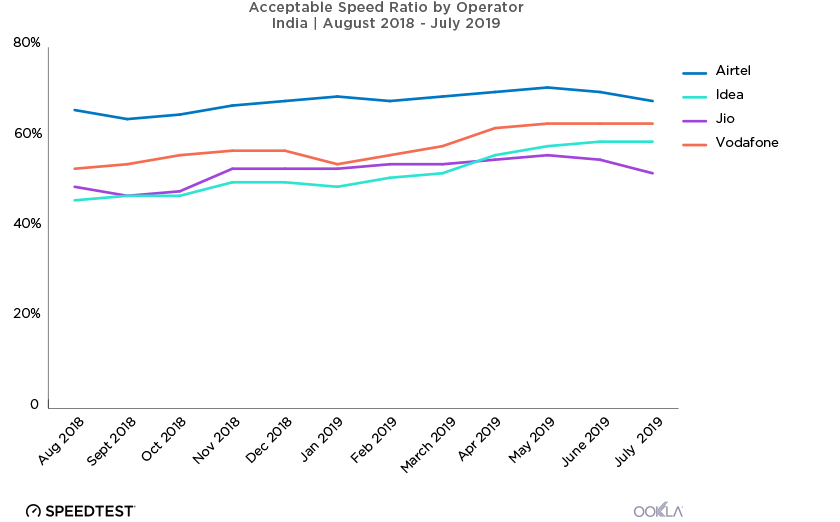
vodafone-graph-2

One measure of a mobile operator’s performance is how consistently they provide speeds at or above 5 Mbps, which is fast enough for consumers to reliably use mobile devices to stream HD video. We call this the Acceptable Speed Ratio (ASR).

Looking at mobile performance in India over the past year, Airtel had the highest ASR in every single month, with an ASR for the year of 70.4%. Despite a dip in January, Vodafone had the second highest ASR throughout the year with an average ASR of 60.3%. Jio held third place for ASR until April 2019, when they were overtaken by a steadily improving Idea. On average, though, Jio ranked third for ASR for the year at 54.5% while Idea’s ASR for the year was 52.5%.

How mobile and fixed broadband speeds compare in India

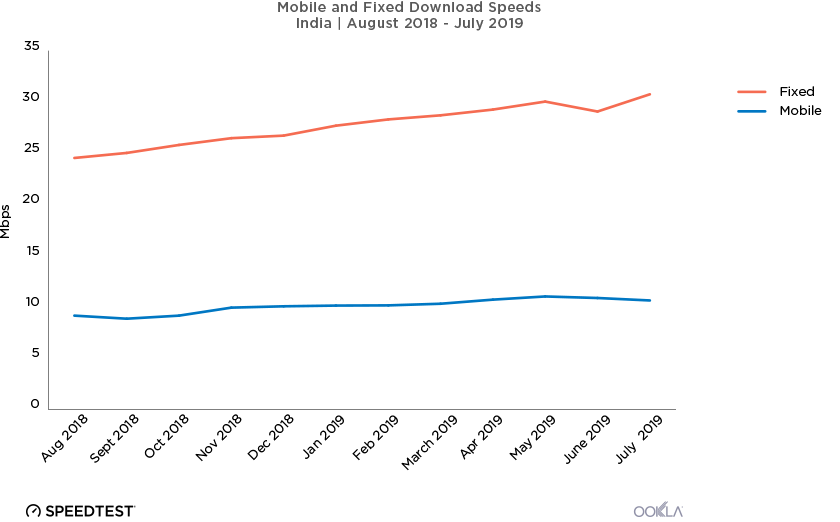
vodafone-graph-3

Looking at India as a whole, mean mobile download speed increased 16.2% in India last year. While this percentage alone may appear strong, it represents an improvement of less than 1.5 Mbps over 12 months. Also worrying, the country’s average mobile download speed declined after May 2019. 5G can’t come soon enough.

Meanwhile, India’s download speed over fixed broadband achieved a 25.3% increase during the past 12 months, a 6.21 Mbps improvement. Jio saw the largest increase in mean download speed over fixed broadband among top providers during the past 12 months with a 120.1% increase. BSNL increased 74.2%, GTPL 32.1%, Airtel 23.8%, YOU Broadband 13.9%, and ACT 12.0%. Hathway’s mean download speed over fixed broadband fell 0.2%. ACT was the fastest provider for each of the 12 months we examined.

India’s global ranking for mobile speeds is falling

vodafone-graph-4

Looking at the Speedtest Global IndexTM, India ranks poorly for mobile download speed when compared with neighboring countries and fell further behind throughout the past year. India ranked better for fixed broadband when compared to neighboring countries, though that rank, too, has slipped over the past 12 months. We’ll be interested to see if Jio’s plan to launch fiber-to-the-home (FTTH) in September improves the national average speed for fixed broadband.

Based on mobile download speed and ASR, Vodafone Idea customers are definitely benefitting from last year’s merger. Which is good, because the increase in mobile download speeds in India as a whole was nominal and not keeping pace with the rise in download speed over fixed broadband. Worse, India’s mobile download speed is not keeping up with a general global improvement. We hope continued investments by mobile operators will turn mobile speeds around even before 5G finally launches in India. We’ll continue to watch for increases in performance and to see how the coming FTTH expansion affects India’s fixed broadband speeds.

Ookla retains ownership of this article including all of the intellectual property rights, data, content graphs and analysis. This article may not be quoted, reproduced, distributed or published for any commercial purpose without prior consent. Members of the press and others using the findings in this article for non-commercial purposes are welcome to publicly share and link to report information with attribution to Ookla.

| January 28, 2020

Mobile Experience in the Caribbean: Where Roaming Doesn’t Sink Speeds


Winter’s on in the northern hemisphere, and travelers from all over are booking cruises to the Caribbean for a little sun. If a phone figures into that fabulous vacation, it’s important to know where mobile roaming speeds will slow down the fun. We examined Speedtest® data from Q4 2019 for five popular Caribbean destinations to see which country has the best roaming speed, how roaming affects latency and how country of origin affects results.

Roaming speeds excel in the French Antilles

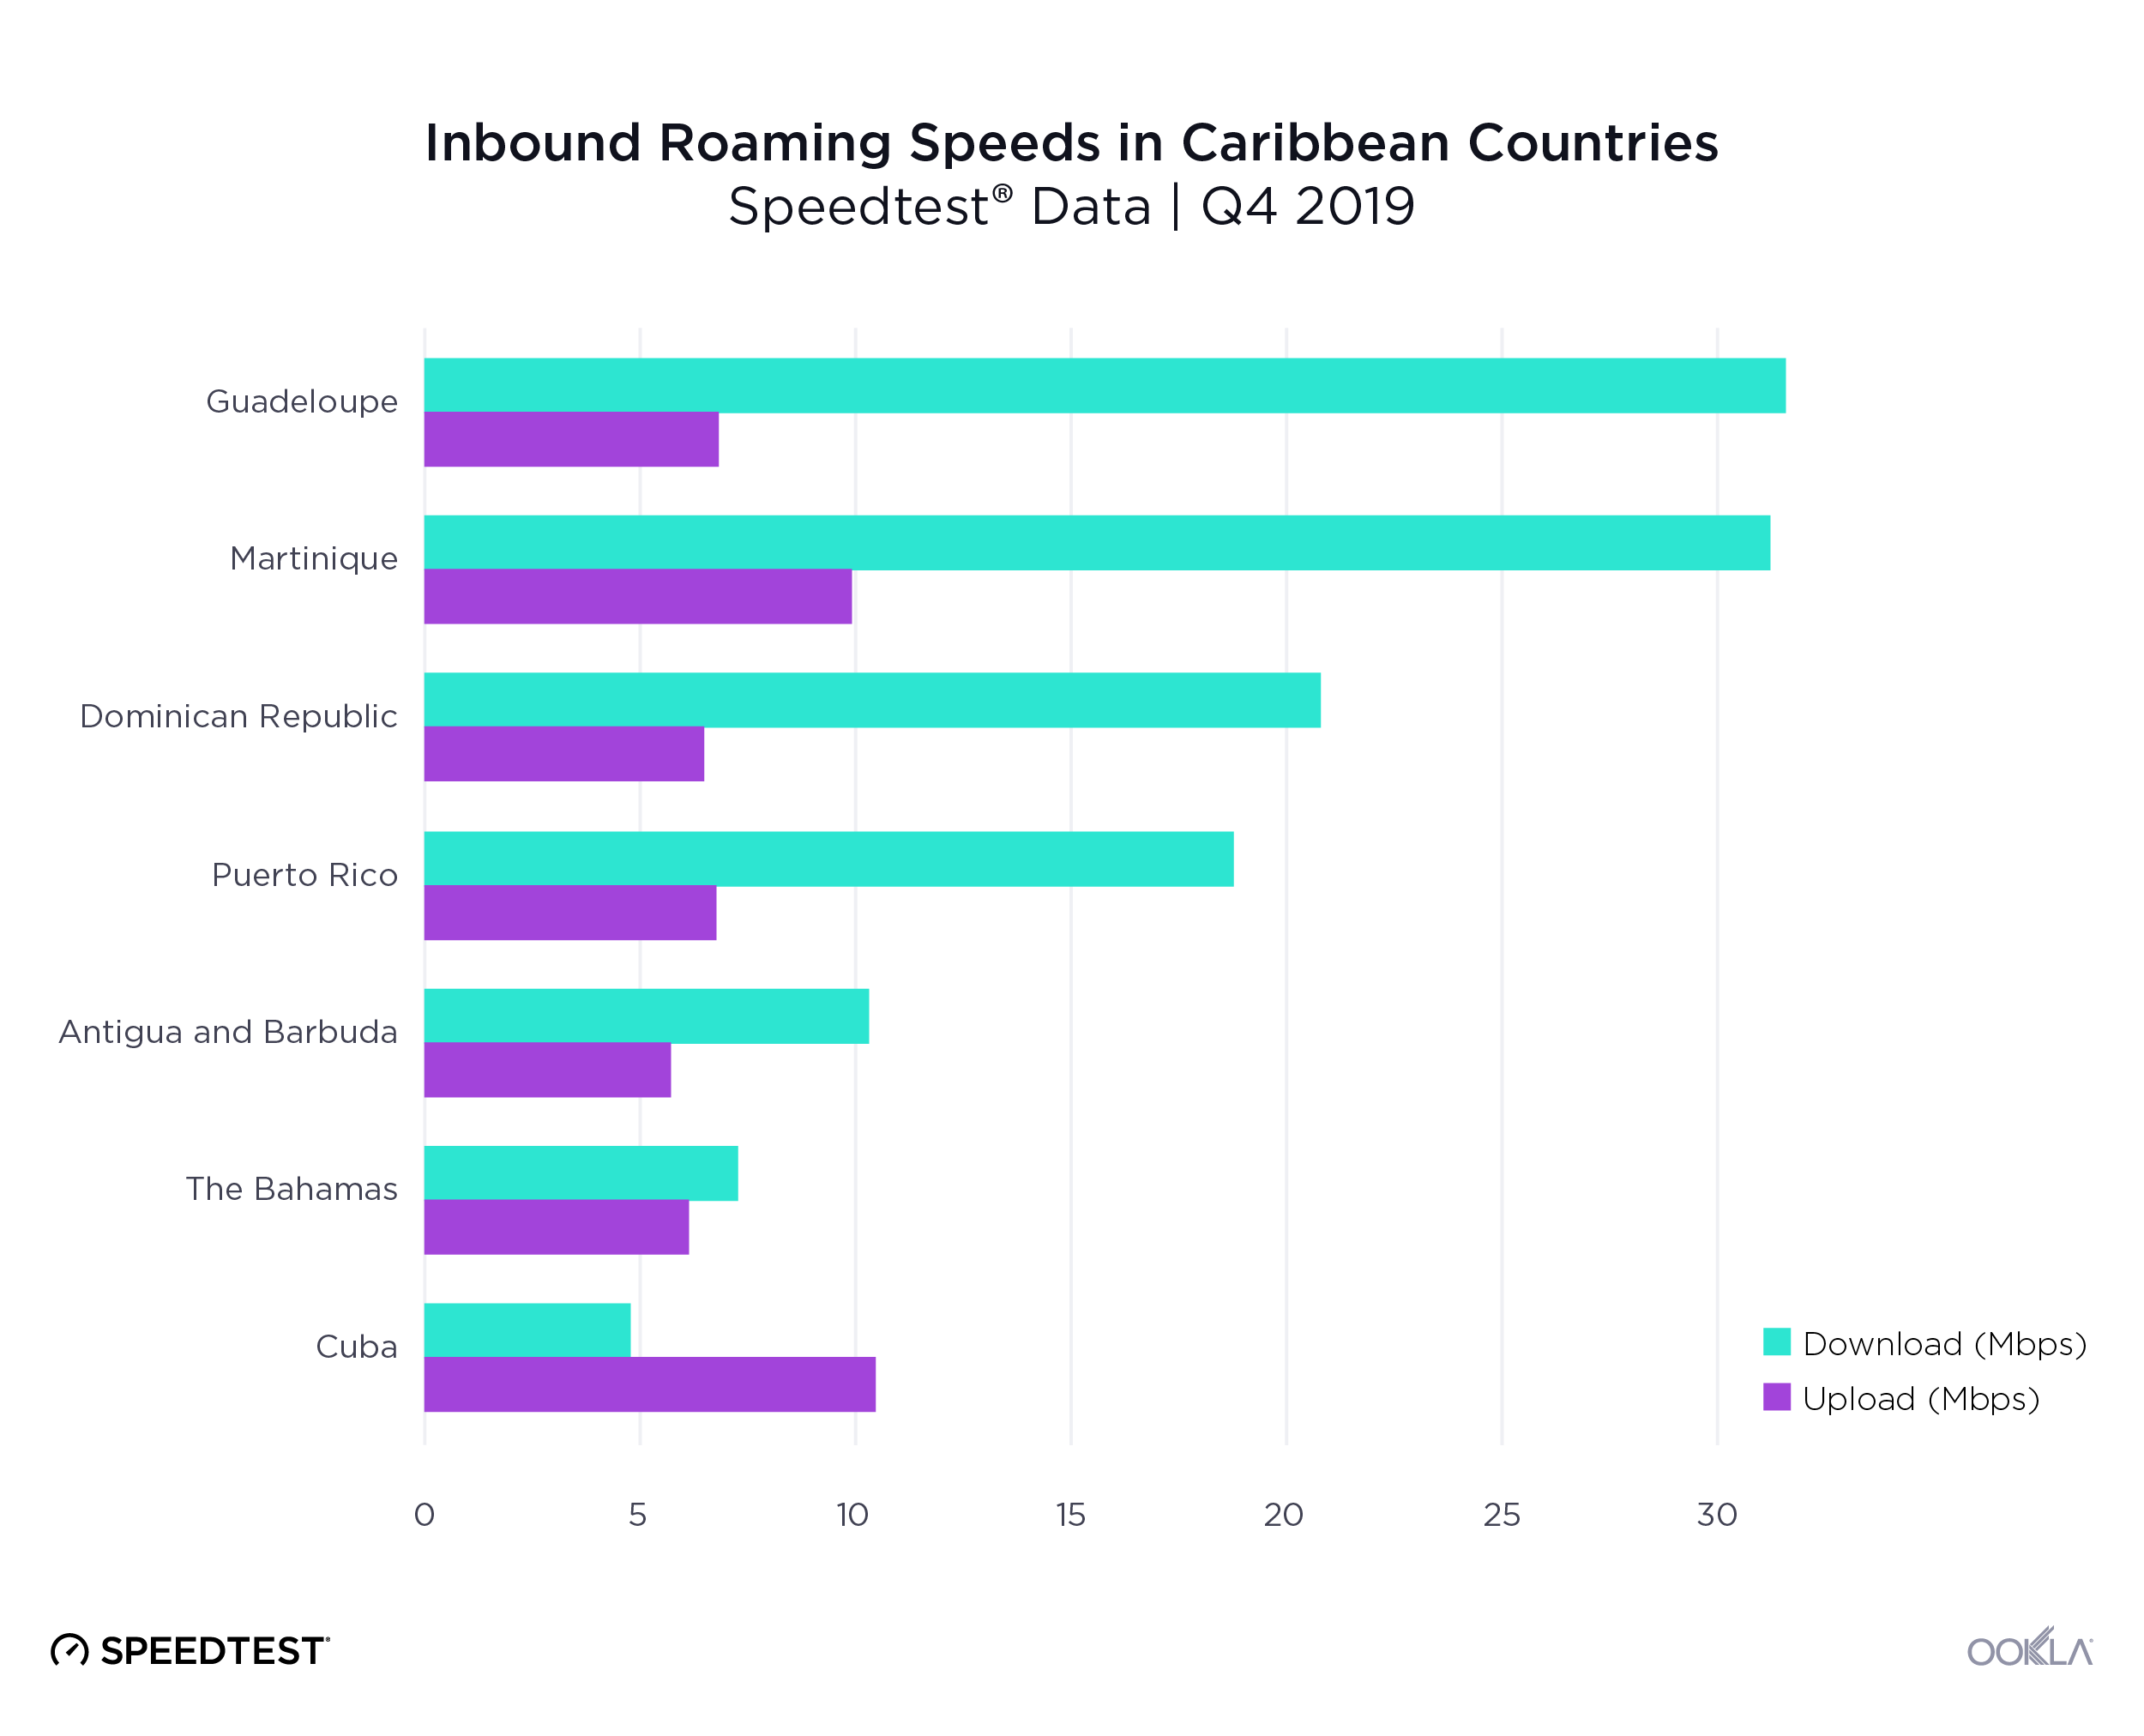
Roaming agreements are complex arrangements negotiated between individual mobile operators on a country-by-country basis. For travelers this means that mobile speeds can be very unpredictable abroad. Speedtest data showed Guadeloupe and Martinique had the fastest mean inbound roaming download speeds of all the countries on our list during Q4 2019.
Ookla-Inbound-Roaming-Speeds-Caribbean_0120
On the other hand, visitors to Cuba and The Bahamas saw the slowest mean download speeds while roaming during Q4 2019.

Local speed does not predict roaming speed

We expect to see slow roaming speeds in countries with slow mobile speeds overall, because roaming relies on in-country networks. However, when we look only at the percent difference between roaming and local speeds, we see that local speed was not the only indicator of roaming speed.

Comparing Inbound Roaming Speeds to Local Speeds in the Caribbean
Speedtest® Data | Q4 2019
Country Local Download (Mbps) % Decrease Download When Roaming Local Upload (Mbps) % Decrease Upload When Roaming
Cuba 28.45 82.9% 12.98 19.4%
Antigua and Barbuda 41.66 75.5% 13.18 56.4%
The Bahamas 23.21 68.8% 11.99 49.0%
Guadeloupe 46.33 31.6% 12.52 45.8%
Puerto Rico 27.46 31.3% 10.83 37.4%
Dominican Republic 26.58 21.8% 10.49 37.9%
Martinique 32.59 4.2% 10.37 4.1%

For example, Antigua and Barbuda’s mean local download speed was the second fastest on our list during Q4 2019, but that figure represents a 75.5% decrease in mean roaming download speed. The result is that Antigua and Barbuda ranked third to last for mean roaming download speed during Q4 2019. Cuba showed the largest decrease in mean download speed between roaming and local at 82.9%. Martinique showed the smallest decrease at 4.2%.

Roaming’s effect on latency

Latency is a major pain point for consumers who are roaming outside of their home country. Roaming signals are routed from the country a consumer is visiting to their country of origin and then back to where they physically are with their phones.

Comparing Inbound Roaming to Local Latency in Caribbean Countries
Speedtest® Data | Q4 2019
Country Roaming Latency (ms) Local Latency (ms) % Increase Latency When Roaming
Cuba 472 100 372.0%
Guadeloupe 289 80 261.3%
Martinique 289 99 191.9%
Dominican Republic 216 35 517.1%
Puerto Rico 174 52 234.6%
Antigua and Barbuda 149 28 432.1%
The Bahamas 149 32 365.6%

Latency while roaming was highest by far in Cuba during Q4 2019. Roaming latency represented a 372.0% increase over local latency, which was also higher in Cuba than any other country on this list. The high roaming latency in both Guadeloupe and Martinique is likely both because local latency is higher there and because the majority of samples we saw in those locations were roamers from France, so the signals for roamers had to cross an ocean, twice.

Antigua and Barbuda and The Bahamas were tied for the lowest latency we saw for consumers roaming in the Caribbean during Q4 2019. These two countries also had the lowest local latencies during this period.

Performance varies widely by roamer’s origin and destination

Mobile Roaming Speeds and Latency for U.S. Consumers in Three Caribbean Markets
Speedtest® Data | Q4 2019
Country Roaming Download (Mbps) % Decrease Download When Roaming Roaming Upload (Mbps) % Decrease Upload When Roaming Roaming Latency (ms) % Increase Latency When Roaming
Dominican Republic 21.43 19.4% 5.98 43.0% 144 311.4%
Puerto Rico 19.74 28.1% 6.43 40.6% 172 230.8%
The Bahamas 7.20 69.0% 6.20 48.3% 143 346.9%

Although Puerto Rico is a U.S. territory, visitors from the 50 states of the union had a faster mean download speed roaming in the Dominican Republic than they did in Puerto Rico during Q4 2019. Both were slower than the U.S. average download of 38.74 Mbps during that period.

Roaming download speed for U.S. visitors to The Bahamas were much slower than those seen in the other two locations and 19.4% slower than the mean download speed for residents of The Bahamas. Latency for U.S. roamers was also much higher in Puerto Rico than it was in either The Bahamas or the Dominican Republic. For comparison, mean latency in the U.S. was 47 ms during the same period.

Roaming upload speeds for U.S. visitors were much more similar between the three destinations than we saw on the download side. All were much slower than the mean upload speed in the U.S. of 11.19 Mbps during Q4 2019.

Mobile Roaming Speeds and Latency for French Consumers in Two Caribbean Markets
Speedtest® Data | Q4 2019
Country Roaming Download (Mbps) % Decrease Download When Roaming Roaming Upload (Mbps) % Decrease Upload When Roaming Roaming Latency (ms) % Increase Latency When Roaming
Guadeloupe 35.65 23.1% 7.53 39.9% 285 256.3%
Martinique 31.22 4.2% 9.94 4.1% 289 191.9%

French visitors to Guadeloupe and Martinique experienced similar speeds and latency roaming in both locations, despite the sharp difference in local speeds. Considering the mean download speed in France was 44.19 Mbps and upload was 10.94 Mbps during the same period, these roaming speeds require a bit of an adjustment, but not painfully so. Latency, on the other hand, will require users to pack their patience, as mean latency in France during this same period was 41 ms.

Guadeloupe, Martinique, the Dominican Republic and Puerto Rico are among the best Caribbean destinations if roaming performance is a factor in choosing a cruise. Either way, multi-island travelers should be prepared for a variety of mobile roaming experiences in a variety of countries and aboard ships where roaming uses the ship’s cellular or Wi-Fi network.

If you’re a mobile operator interested in improving roaming performance to make your country even more attractive to foreign visitors, learn more about how Speedtest IntelligenceTM can help you.

Ookla retains ownership of this article including all of the intellectual property rights, data, content graphs and analysis. This article may not be quoted, reproduced, distributed or published for any commercial purpose without prior consent. Members of the press and others using the findings in this article for non-commercial purposes are welcome to publicly share and link to report information with attribution to Ookla.

| September 17, 2019

What Happens to the Internet When Mobile Providers Go Down

You may have experienced the panic that happens when you realize you can’t get a connection on your phone. Most of us in these moments will try several ways of getting online before rushing to Downdetector® to see if our mobile operator is out of service or if it’s just us. Having access to data from both Downdetector and Speedtest® gives us unique insight into how network outages impact the internet as a whole, and in this article we’re exploring that impact in several key markets around the world.

The outages we explored

We looked specifically for recent outages that affected mobile networks in a variety of countries around the globe. The outages we explored were in Brazil (Vivo — 12,994 reports on August 22), Canada (Rogers and Freedom Mobile — 35,685 reports July 7-8), Italy (Iliad — 3,018 reports on June 21), India (Vodafone-Idea — 1,386 reports on July 17), the Netherlands (KPN Mobile, T-Mobile and Vodafone — 92,391 reports on June 24), Sweden (Tele2 — 7,275 reports June 17-19) and the United States (T-Mobile — 95,267 reports on September 6).

Working hypotheses

We had three hypotheses when we set out to do this analysis based on what we would expect to happen in a prolonged, near-total mobile outage:

  1. Mobile speeds would increase during an outage (for those who could connect) because there would be significantly less network congestion.
  2. Fixed broadband speeds would not change during an outage.
  3. The number of mobile Speedtest results would increase on the day of the outage as users tried to troubleshoot their connections.
  4. The number of fixed broadband Speedtest results would also increase on the day of the outage as people switched from mobile to fixed broadband to try and connect.

As with any real-world experiment there are many variables that can affect the results but for which we cannot control. Each of these outages varied in duration, cause and totality — factors which affect potential outcomes.

Mobile Outages Affect Download Speed in Different Ways

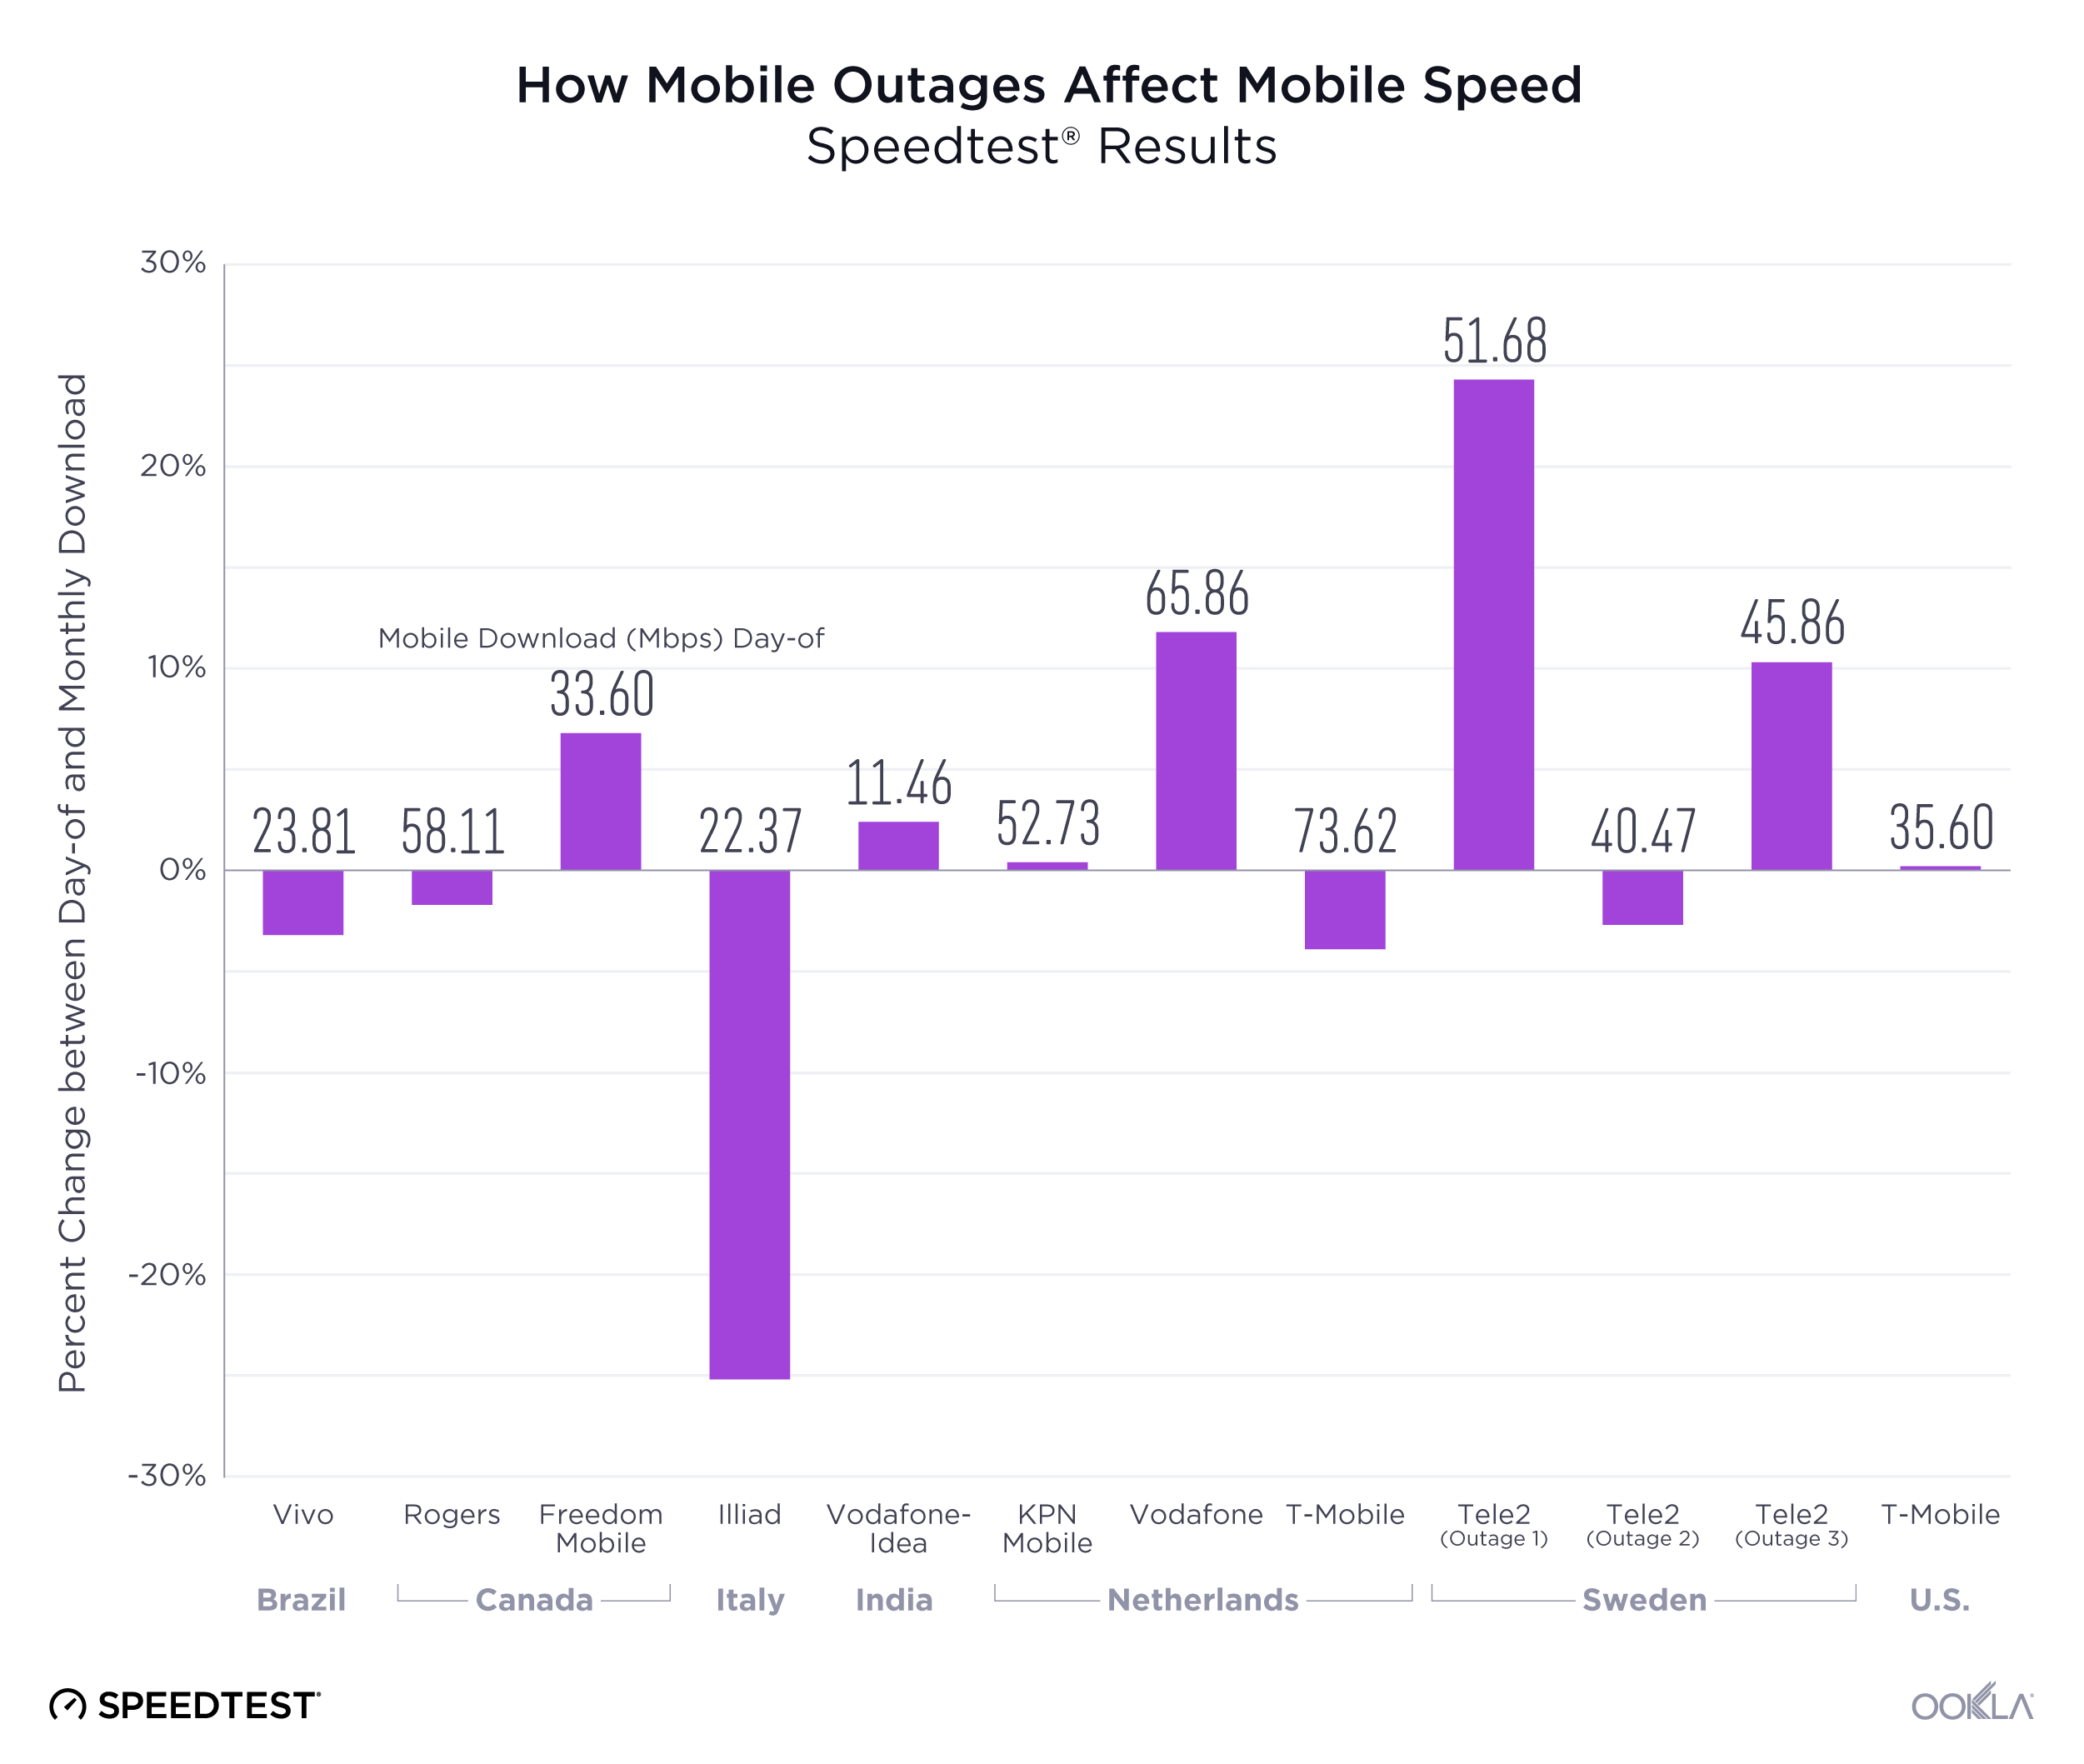
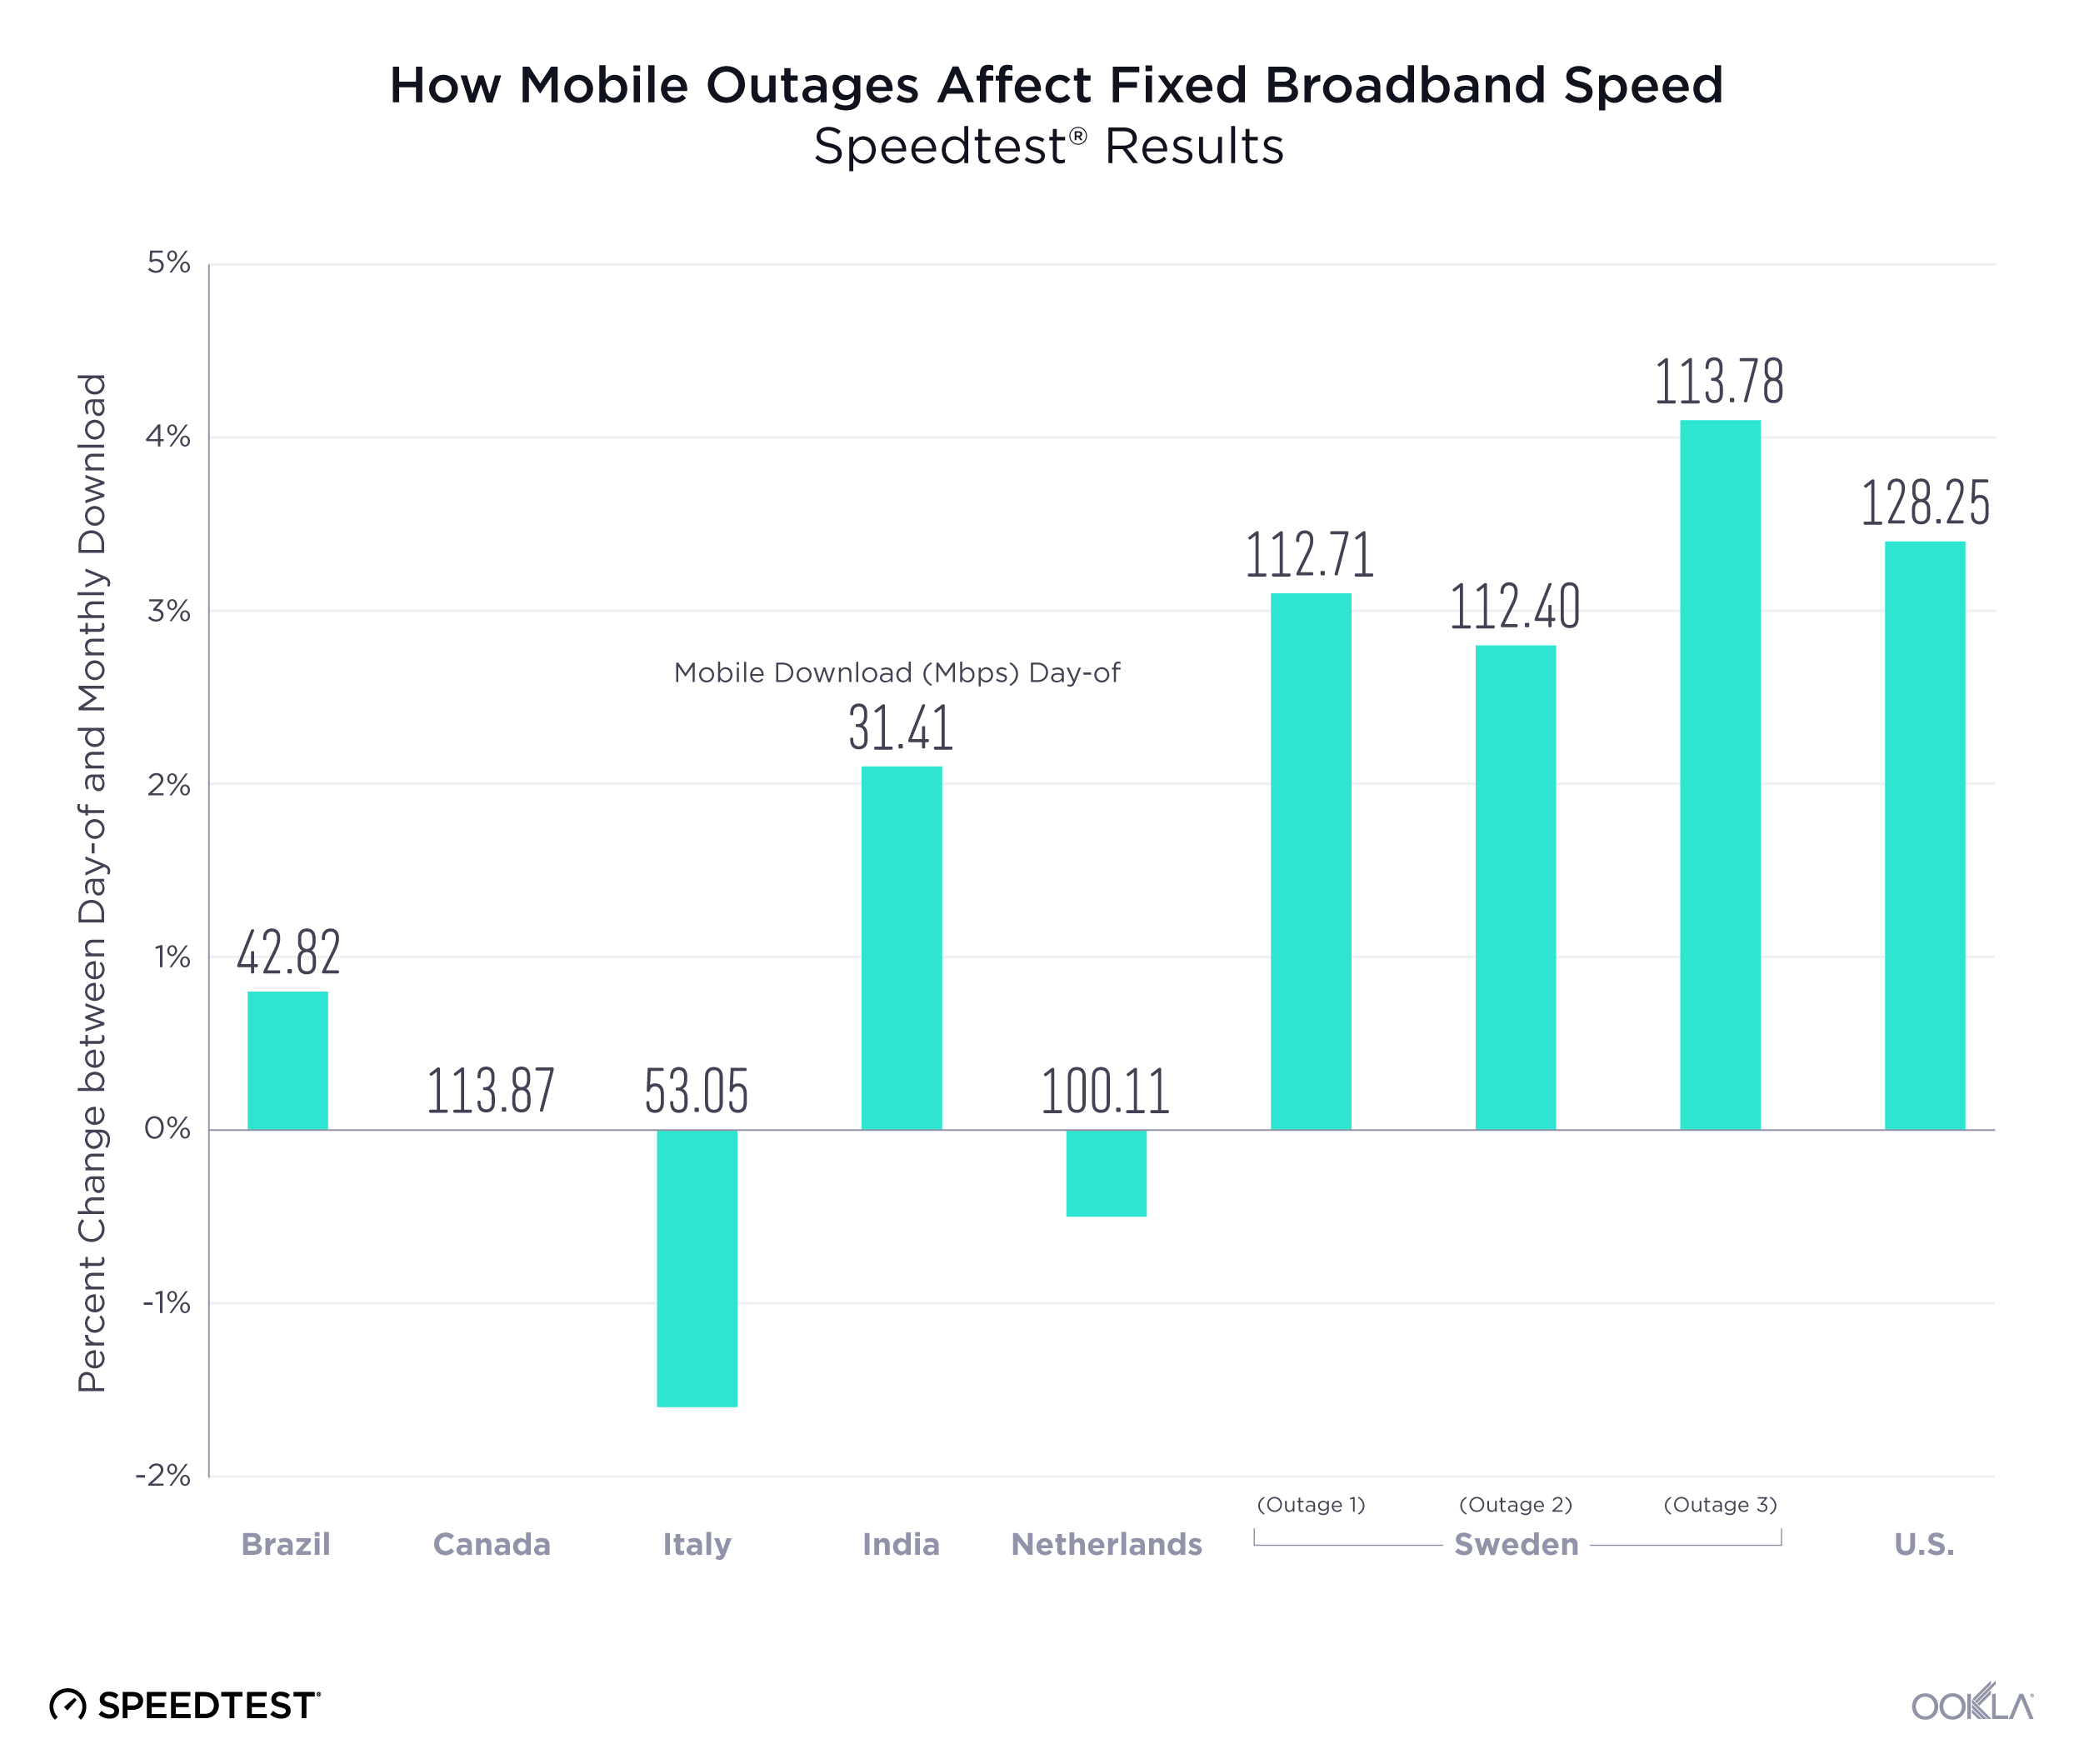
We compared each operator’s mean download speed over mobile on the day of the outage with their mean speed during that month to see if our hypothesis held. Results were mixed.

How Mobile Outages Affect Mobile Speed

In India and the U.S., mobile download speeds did increase very slightly for each provider on the day of the outage when compared with the monthly average. Both of these outages were localized within the country with the Indian outage centering around Ahmedabad and the U.S. outage falling on the East Coast.

On the other hand, mobile download speeds in Brazil and Italy were lower on the day of the outage than the monthly average. Significantly so in Italy. In both of these instances the mobile operator was experiencing a geographically widespread outage.

The outage in Canada revealed two different stories as download speed decreased slightly during the outage for Rogers customers and increased for customers of Freedom Mobile. Results were also mixed in the Netherlands with Vodafone customers seeing a significantly higher download speed, KPN Mobile customers seeing a slightly higher speed and T-Mobile customers seeing a decrease in download speed.

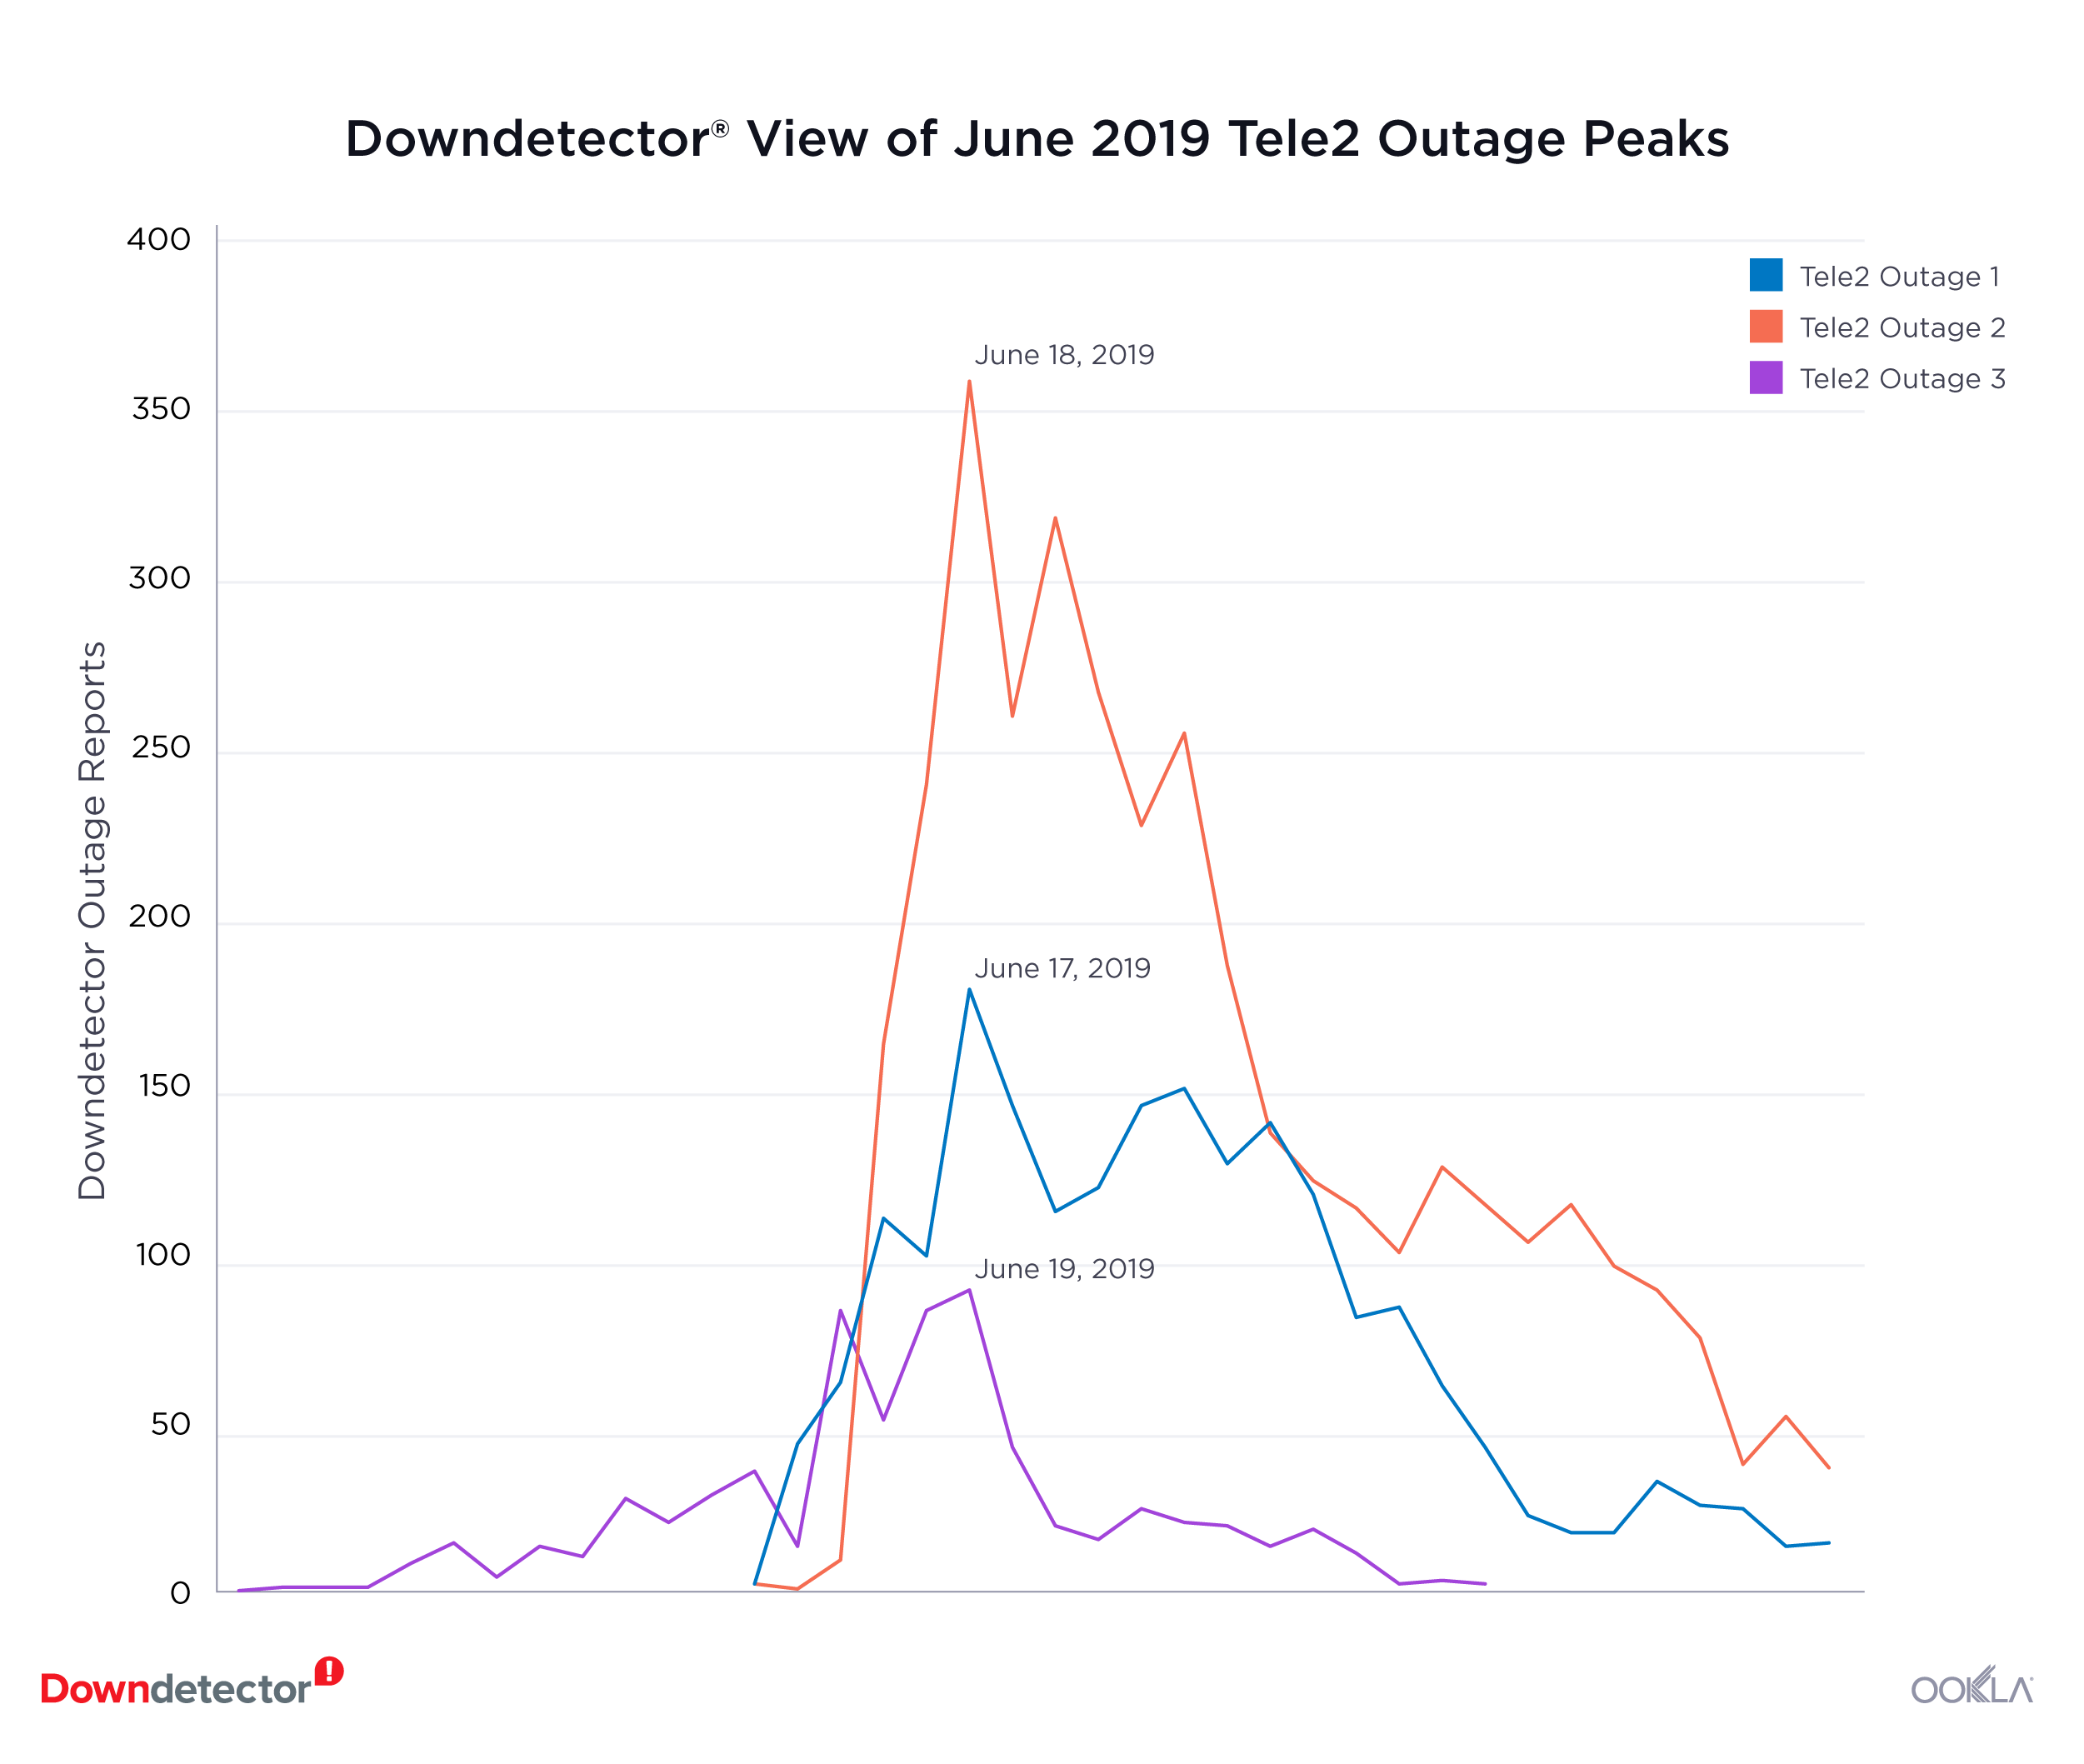
The outage in Sweden occurred in three waves over three separate days:

Downdetector view of June 2019 Tele2 Outage Peaks

We looked at each separately and found that mobile download speed on Tele2 increased during the smaller first and last waves. Meanwhile, mean download speed decreased during the largest middle outage.

Fixed broadband speeds show only slight variations

We measured download speed over fixed broadband at the country level both on the day(s) of the outages and compared that number with the average download speed for the appropriate month.

How Mobile Outages Affect Fixed Broadband Speed

Our hypothesis about fixed speeds not changing during mobile outages proved mostly true. Although download speed over fixed broadband did decrease in Italy and the Netherlands during their country-wide outages, the decrease was very small. In Canada there was virtually no difference in speed between the day of the outage and the monthly average.

Download speed over fixed broadband was faster during the outages in all other countries we examined. However, the differences were not large enough to rule out day-to-day fluctuations in speed.

Speedtest results usually increase during outages

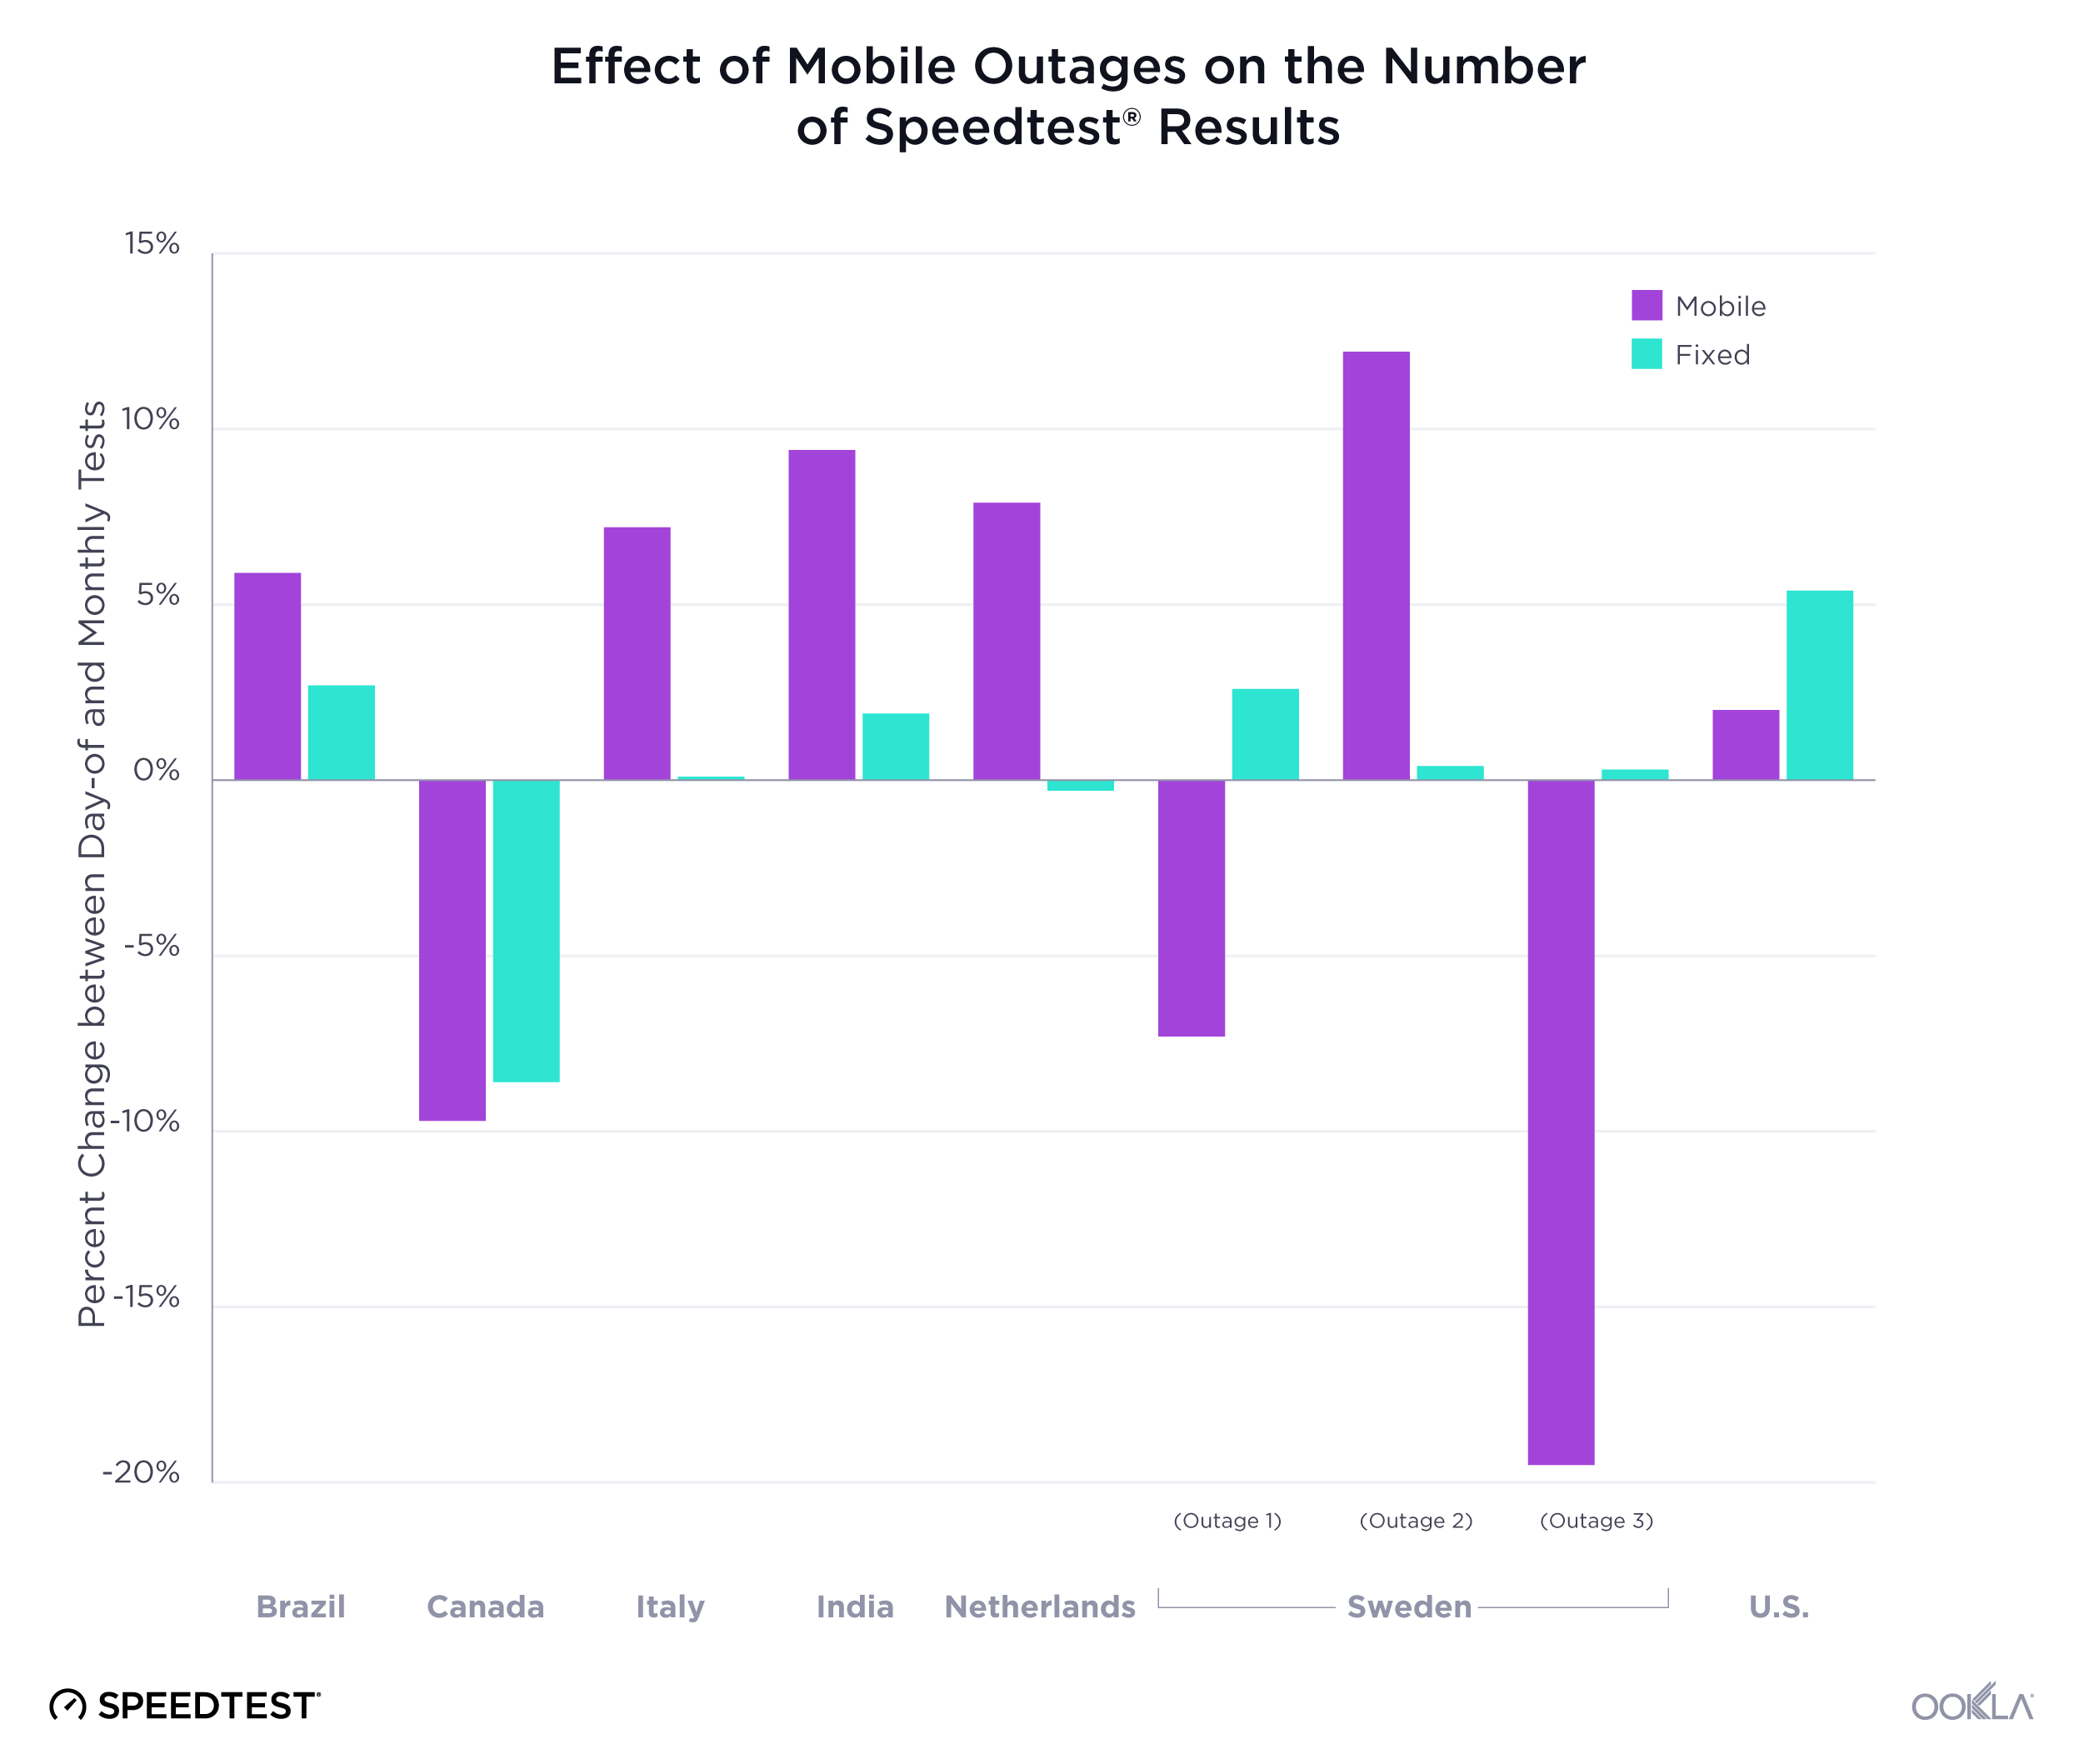
We also compared the number of Speedtest results over both mobile and fixed broadband during the outages with the daily averages in each country for the appropriate month.

Effect of Mobile Outages on Number of Speedtest Results

Our hypothesis that the number of mobile Speedtest results would increase on the day of an outage held mostly true. Exceptions were Canada and two days of the Swedish outage. Fixed broadband Speedtest results also mostly increased, except in Canada and the Netherlands, but for the most part only very minimally.

Contact us to learn how data from Downdetector and Speedtest can help you before, during and after an outage.

Ookla retains ownership of this article including all of the intellectual property rights, data, content graphs and analysis. This article may not be quoted, reproduced, distributed or published for any commercial purpose without prior consent. Members of the press and others using the findings in this article for non-commercial purposes are welcome to publicly share and link to report information with attribution to Ookla.