| May 28, 2025

Benchmarking Mobile Performance Across Mexican Cities

This city-level mobile performance benchmark, comparing ten of the largest Mexican cities with a selection of other major cities across Latin America, highlights the challenges facing the Mexican mobile market, with city-level performance lagging, and at risk of falling further behind regional peers.

Key Takeaways

  • 5G continues to underwhelm within Mexican cities. A lack of 5G momentum and a concentrated mobile market structure have negatively weighed on the Mexican mobile user experience. Mexican cities lag their more advanced Latin American counterparts across key metrics like median download speed, with the fastest Mexican city, Monterrey, recording 55.17 Mbps in Q1 2025, a far cry from the 250.71 Mbps recorded in Rio de Janeiro.
  • Year-on-year data indicates the market’s digital competitiveness is eroding. The trajectory for most Mexican cities appears to be one of marginal performance gains, which indicates other regional peers are likely to continue to leapfrog Mexico as attractive inward investment destinations, particularly in cases where mobile digital infrastructure forms a key enterprise requirement.
  • Mexico City and its satellite cities underperform within Mexico. There is wide variation in mobile network performance outcomes between Mexican cities. Mexico City, and surrounding satellite cities including Ciudad Nezahualcóyotl, Ecatepec de Morelos, as well as Puebla, all perform relatively poorly compared to their peers, with median speeds of approximately 30 Mbps and lower. This is compounded for users experiencing the worst 10% of network performance, where recorded speeds were 3 Mbps and lower.
  • Poor performance drags down web load times. User experienced web page load times exceeded a median of 2.4 seconds in three of the ten Mexican cities included in this analysis, well behind regional leader Buenos Aires, which clocked just 1.44 seconds. The varied outcomes across web page and video streaming performance highlight the challenges operators in the market face in ensuring consistent performance.

Mexican cities lag behind leading Latin American counterparts

Ookla’s Speedtest data recently played a key role in a World Bank study that exposed significant disparities in internet access across Brazilian cities. The research found that wealthier neighborhoods consistently experienced superior internet speeds, particularly on fixed networks. While mobile users across Brazil’s cities have benefited from 5G rollout, with the market placing 6th globally in the Speedtest Global Index based on median download speeds as of April 2025, Mexico, the second largest market by population in Latin America, languishes in 78th place. In this article, we benchmark mobile network performance outcomes across the ten largest Mexican cities, comparing them to a selection of other Latin American cities.

A majority of the population across Latin America resides in urban locations, which comprise 81.8% of the total population across Latin America and the Caribbean, according to World Bank data for 2023. Mexico marginally lags this regional average, at 81.6%, ahead of the EU at 75.7%, but behind other key competitors such as Argentina, Brazil, Chile, Colombia, and Uruguay.

Mexican cities ranked in the middle of the pack compared to regional rivals on median download speed, lagging far behind leading cities in Brazil, Uruguay and Argentina. The leading Mexican city, Monterrey, recorded a median of 55.17 Mbps in Q1 2025, compared to 250.71 Mbps in Rio de Janeiro. There was a wide variety of outcomes across Mexican cities, ranging from Monterrey’s high, to a low of 26.11 Mbps in Ecatepec. This is reinforced by performance for those users experiencing the lowest 10% of samples (the 10th percentile), with Mexico City and its satellite cities – Ecatepec, Ciudad Nezahualcoyotl, as well as Puebla seeing outcomes for these users of 3 Mbps and lower, and with only users in Santa Cruz de la Sierra in Bolivia faring worse.

It’s clear that users across Latin American cities value mobile network performance, as evidenced by the clear relationship between Q1 2025 download speeds and Net Promoter Score (NPS) data for Q1 2025. Among Mexican cities, this placed Monterrey first, with an NPS of +19.5, followed by Tijuana and Zapopan, and Guadalajara.

Latin American City Benchmark – Mobile Performance
Speedtest Intelligence, Q1 2025

Maps are the best way to clearly illustrate performance differences within cities. Our recent study with Dublin City Council, which aimed to pinpoint areas of poor performance across that city, highlighted how crucial it is for urban leaders to understand the spread of mobile internet outcomes throughout their jurisdictions. This understanding allows them to combine this data with other information, such as the locations of city-owned infrastructure, as they seek to drive improvement.

Comparing Mexico City to São Paulo visually demonstrates these performance differences. In São Paulo, based on Speedtest data for Q4 2024 – Q1 2025, a majority of locations have median download speeds exceeding 50 Mbps (colored dark green). Conversely, a significant portion of locations within Mexico City display median download speeds of 25 Mbps or less, as evidenced by the prevalence of orange and red tiles, especially along its eastern border with the State of Mexico.

Variation in mobile user experience highlights the impact of performance disparities

Key quality of experience (QoE) metrics such as web page load time, video start time, and the share of full HD samples, again show mixed outcomes for Mexican users across the nation’s cities. 

The Mexican cities of Puebla, Zapopan, and Guadalajara had the worst web page load times, alongside Panama City, with median load times exceeding 2.4 seconds. In contrast, Mexico City and its satellite cities performed much better, recording median page load times of 1.75 seconds or less.

Regarding video streaming, only Guatemala City achieved a majority of users recording a fast video start time (where over 50% of samples played in under 2 seconds). Notably, five of the ten Mexican cities in this study recorded 40% or lower for this metric.

Latin American City Benchmark – QoE Performance
Speedtest Intelligence, Q1 2025

5G is yet to deliver on its potential for Mexican cities

Mexican cities underperform based on mobile network speeds compared to other major cities in Latin America, especially given their relatively high adoption of 5G. As of Q4 2024, Mexico ranks third in Latin America for the share of 5G connections per market (9.4%), according to GSMA Intelligence, trailing only Chile (18.6%) and Brazil (25.7%).

However, our data reveals significant disparities in 5G Service within Mexican cities. 5G Service refers to the percentage of locations where an operator provides service and 5G users can access the network. This variation suggests an uneven 5G rollout across the country. Specifically, Mexican cities with the lowest median download speeds consistently show lower 5G Service percentages. For example, Ecatepec recorded only 4.5% 5G Service, while Mexico City stood at 18.5%. In contrast, leading cities like Monterrey achieved nearly 40% 5G Service, highlighting the stark differences in network coverage across the market.

Latin American City Benchmark – 5G Service in Mexican Cities
Speedtest Intelligence, Q1 2025

Mexican cities are disproportionately represented within the benchmark group of cities, among those with the smallest year-on-year improvements in median download speeds, comparing Q1 2024 to Q1 2025. Out of 24 cities included in our study, only Monterrey and Tijuana ranked in the top ten for the largest improvements. In contrast, six Mexican cities appeared in the bottom ten for performance gains.

Latin American City Benchmark – Annual Improvement in Median Download Speed
Speedtest Intelligence, Q1 2024 vs Q1 2025

Mexican cities face significant challenges in driving improved mobile network outcomes, despite 5G launching in the market in early 2022. High spectrum licence fees, which have led to a lack of operator interest, and even the handing back of allocated spectrum, highlight one of the key issues facing the development of 5G in the market. This continues to manifest through strong regional disparities in mobile performance between Mexican cities, in 5G Service across the market, and in the fact that Telcel continues to maintain a market share in excess of 50%. Couple this with the disbanding of the independent telecoms regulator, the IFT, by the government late last year, and it’s clear Mexico faces significant challenges in fostering the development of its mobile networks.

Ookla is attending the GSMA’s M360 Latin America, in Mexico City from 28-29th May. If you’re attending and would like to connect, please reach out to us.

Ookla retains ownership of this article including all of the intellectual property rights, data, content graphs and analysis. This article may not be quoted, reproduced, distributed or published for any commercial purpose without prior consent. Members of the press and others using the findings in this article for non-commercial purposes are welcome to publicly share and link to report information with attribution to Ookla.

| June 27, 2022

Dtac and True Merger Talks Point to a Need to Address Unequal Footing in Thailand's 5G

The planned merger between True Corporation (“True”) and Total Access Communication (“dtac”) in Thailand is currently awaiting regulatory approval. The announcement of the merger or “amalgamation” as the involved companies like to call it, wasn’t unexpected as rumors around dtac’s owner Telenor’s plans to exit Thailand circulated for a while. Besides, Telenor hopes to merge its Malaysian operations and it sold its operations in Myanmar in March 2022. On November 20, 2021, True and dtac entered a non-binding memorandum of understanding to pursue the “amalgamation.” In April 2022, the two companies received the approval from their shareholders for the merger and to create a new listed company — NewCo — despite not knowing what the conditions or measures of the deal will be. In June 2022, a legal subcommittee of NBTC concluded that the telecom regulator has the power to approve or dissolve the planned merger. In this article we will assess the impact of the proposed merger on the Thai telecommunications market by examining its current state.

Key takeaways

  • Thailand’s 5G performed well compared to its regional counterparts due to a timely 5G network roll out and dedicated 5G spectrum availability.
  • Based on mobile performance, Thailand is a market dominated by one player — AIS. It had a lead in terms of 4G performance and that lead has been extended further with 5G. The third operator in the market, dtac, is not competitive on 5G due to its limited spectrum holdings (dtac’s 5G performance is equivalent to AIS’ 4G).
  • The merged operator, NewCo, could provide more robust competition to AIS while also having the scale to invest in 5G. While this will turn Thailand into a two-player market, examples of mergers and acquisitions in other countries suggest a number of measures will be most likely put in place: spectrum divestment, more capacity allocated to MVNOs, converged and innovative offerings, all of which can potentially offset its negative impact.

Thailand’s 5G performs well compared to its regional counterparts

5G deployment in Thailand is comparable in terms of 5G speeds and 5G Availability with more developed countries in the region such as Singapore, even though the country previously lagged behind its peers in assigning 3G and LTE spectrum.

In our recent article, we concluded that the country’s regulator, The National Broadcasting and Telecommunications Commission (NBTC), has been instrumental in establishing Thailand as a leading 5G market in the region. In fact, Thailand was one of the first markets to launch 5G in the Asia-Pacific region, with AIS and TrueMove H both launching commercial 5G services in Q1 2020, shortly after the conclusion of the country’s 5G auction. The Thai government plays an active role in ensuring 5G can bring societal benefits, e.g., improving government services and extending healthcare access. Some of the campaigns include establishing a telemedicine center, setting up a 5G network for smart city management, developing a pilot project on digital farming in Songkhla Lake Basin, and using 5G connectivity for pandemic related measures as tourism was reopening in Phuket.  

In Q1 2022, Speedtest Intelligence® data put Thailand on par with its regional peers such as Australia and China and ahead of the Philippines, Japan, Singapore and New Zealand in terms of 5G Availability (the proportion of users on 5G-capable devices who spend a majority of their time on 5G networks). 

Chart of internet performance in Thailand compared to other regional countriesIn February 2020, NBTC assigned spectrum for 5G use across low (700 MHz), mid (2,600 MHz), and high (26 GHz) frequency bands. It also plans a further auction of mid-band spectrum in 2022 in the 3.5 GHz band, which was vacated in September 2021 by Thaicom, a satellite provider. All of the countries in the comparison above assigned spectrum in the mid-band frequency, which is the sweet spot for 5G in terms of coverage and capacity. In South Korea, which came first in terms of median 5G download speed, the government allocated a total of 2,680 MHz of spectrum including 280 MHz in the 3.5 GHz band and 2,400 MHz in the 28 GHz spectrum band. Korean provider KT is also using a standalone 5G network, a form of 5G that doesn’t rely on 4G LTE as the foundation of the 5G experience, which should provide faster speeds and lower latency than non-standalone (NSA) 5G networks. In fact, a few operators in the analyzed countries have launched 5G SA including China (all operators), Singapore (M1, Singtel, and Starhub), Australia (Telstra and Vodafone), Japan (Softbank), and Thailand (AIS).

Chart of 5G spectrum in key Asia-Pacific markets

AIS wins on 5G performance in Thailand, TrueMove H on 5G Availability

In Q1 2022, AIS came as the fastest operator in terms of 5G speeds, this was also the case in Q4 2021 as per our recent article. According to Speedtest Intelligence, AIS recorded a median 5G download speed of 261.19 Mbps and 5G upload speed of 40.57 Mbps during Q1 2022. AIS launched 5G NSA (non-standalone) in February 2020 using the 700 MHz, 2.6 GHz and 26 GHz bands, followed by 5G SA in July 2020 in cooperation with Huawei. AIS deployed 5G CA (New Radio Carrier Aggregation) by integrating its mid-band (2600 MHz) and low band (700 MHz) spectrum. This in turn gave a 1.7x boost to the operator’s data transmission capabilities. TrueMove H was second for 5G download speed, with a median of 197.79 Mbps and a 5G upload speed of 25.52 Mbps. The lack of mid-band spectrum limits dtac’s performance, which showed a median 5G download speed of 32.70 Mbps and 19.18 Mbps upload.

Chart of 5G performance among operators in Thailand

The ranking shifts when we compare 5G Availability – the percentage of users on 5G-capable devices that spend a majority of time with access to 5G networks. TrueMove H came first for 5G Availability at 37.9% during Q1 2022, a three percentage point improvement over Q4 2021. This was well above the rest of the Thai operators: AIS (18.7%), and dtac (7.9%). Based on our data AIS & TrueMove H had 5G Availability in all 77 provinces but TrueMove H 5G Availability was higher in most of the provinces as per Q1 2022. 

This disparity we see between TrueMove H and AIS is largely down to the fact that AIS requires users to subscribe to a 5G tariff, as opposed to TrueMove H which allows greater access to 5G-enabled devices on its network. TrueMove H’s 5G Availability remains the highest via a combination of coverage and 5G handsets. The operator’s initial focus was to roll out 5G to most densely populated areas such as the Bangkok metropolitan area, in which over 90% of population is covered by 5G, followed by key locations. At the time of 5G network launch, TrueMove H offered 30 models of 5G smartphone under promotional prices, True 5G VR4K vision and True5G VR Headset, IoT equipment as well as gadgets. AIS rolled out a 5G network out to all 77 provinces, covering 78% of the population in Q1 2022, with a year end target of 85% population coverage.

At the same time, Thai operators continue to grow the number of 5G users, expanding the addressable market beyond early adopters; for example TrueMove H saw its 5G user base increase to 2.6 million in Q1 2022, AIS had 2.8 million 5G package subscribers and 3 million 5G handset on AIS network in Q1 2022.

Songkhla tops the charts for median 5G download speed

Every operator takes a unique approach to regional strategy, so we looked closely at 5G performance in select regions during Q1 2022. Songkhla came top when it comes to median 5G download speed (253.44 Mbps), but ranked last in 5G Availability (8.9%), which points to low network congestion due to a lower number of users.

Chart comparing 5G performance by provinces in Thailand

We removed dtac from the operator level comparison due to the low sample size. AIS came top in almost all regions, apart from Khon Kaen. AIS’s fastest median 5G download speed (313.35 Mbps) was in Songkhla.

Bangkok has the highest 5G Availability

Chart comparing 5G availability by provinces in Thailand

In Q1 2022, Bangkok had the highest 5G Availability (30.1%), Songkhla ranked last in 5G Availability (8.9%). Ookla 5G Map®  shows 215 commercial 5G deployments in the Bangkok area. What’s more, because Bangkok is more affluent than the rest of the country, smartphone adoption, including 5G, is higher than in the rest of the country. Due to the pandemic, Thai operators have actually accelerated their 5G rollout, starting with hospitals in Bangkok. At the end of 2021, AIS reported that its 5G network covered more than 99% of the population in Bangkok compared to 76% across the whole country. At the end of Q1 2022, dtac’s 5G network covered 34 provinces, though we have excluded dtac from the above ranking due to low sample count. Dtac has been focusing on network expansion using the 700 MHz band, resulting in capacity and coverage uplift, yet it is still lagging behind competition in uptake. Dtac reported that it will prioritize 5G expansion by expanding coverage to all of Thailand’s 77 provinces within the Q3 2022.

4G Availability close enough, AIS in the lead for 4G speeds

The leaderboard for 4G LTE performance in Thailand looked very similar to the 5G one during Q1 2022. AIS was in the lead (31.16 Mbps for download/17.51 Mbps upload), followed by TrueMove H (23.38 Mbps for download/10.80 Mbps for upload), and dtac (13.57 Mbps for download/ 5.05 Mbps upload), there was a major difference, however, when 4G performance is considered separately to that on 5G. AIS’s median download speed on all technologies combined was almost eight times higher than dtac’s, but AIS’s median download speed on 4G was just double of dtac’s. Furthermore, there was no substantial difference in terms of 4G Availability –  the percentage of users on all devices who spend the majority of their time connected to 4G technology both roaming and on-network – across Thai mobile networks.

Chart of 4G performance among operators in Thailand

Consolidation wave across Asia-Pacific could stifle competition

Merger and acquisitions activity is heating up across the Asia-Pacific region with deals on the table across a number of countries including Thailand, Malaysia, Taiwan, and Indonesia. Thus far, only the merger between Indosat and Tri in Indonesia has received regulatory approval and been completed. This is true in Europe as well, as we discussed in our recent article, with recent examples including the agreed joint venture between MasMovil and Orange in Spain and Iliad’s recent bid for Vodafone Italy. 

A number of studies have attempted to assess the impact of mergers. For instance, in 2017 GSMA analyzed the impact of the 2012 Hutchison/Orange merger in Austria (a 4-to-3 merger) on quality using difference-in-differences (DD) and synthetic control methods. The study concluded that the merger in Austria had a positive and statistically significant effect on quality outcomes. The U.K. telecom regulator, Ofcom, in its Economic Discussion Paper on Market structure, investment and quality in the mobile industry analyzed a number of M&A activities. It concluded that the results of merger-specific analysis are mixed, as there is no evidence that mergers have generated improvements in network quality to the benefit of consumers. Instead, there is some evidence that both investment and average download speeds declined following some of these mergers. Closer to Thailand, Indosat Ooredoo and Hutchison 3 Indonesia (Tri) merged into Indosat Ooredoo Hutchison (IOH) to create a number two player in Indonesia with 26.3% market share as of Q1 2022. It was conditioned upon a number of factors, though, around improved geographic reach and network performance. 

However, there are rare examples of a market moving towards duopoly. In 2011, Philippines mobile market became a duopoly after PLDT acquired Digitel. The deal was studied by regulators for seven months, the main issue being the large amount of the country’s 3G spectrum that the merged operator would control. It eventually passed on condition that PLDT gave up the 10 MHz 3G license held by one of its subsidiaries. Almost a decade later, a third player entered the Philippines, which we will discuss in an upcoming article. 

The shape of the Thai mobile market  

If approved, M&A would bring more MVNOs to the market

With close to 100 million mobile connections, Thailand’s SIM penetration of the population is 140%, meaning that on average a mobile subscriber has 1.58 SIMs. The market is served by four operators: AIS, DTAC, TrueMove H and the government owned National Telecom (NT). NT was formed in January 2021 via a merger of Communications Authority of Thailand (CAT) Telecom and TOT (Telephone Organization of Thailand). 

AIS, whose backers include Singtel Group, led the market with 44.5% of all mobile subscriptions, equivalent to 44.6 million subscribers, at the end of March 2022. By contrast, TrueMove H held 33.4% of the market share (32.5 million subscribers), with dtac claiming a 19.8% market share with 19.9 million subscribers. According to industry estimates, NT had less than 3.5 million subscribers in Q1 2022, equating to 3.3% market share. Currently, MVNOs hold a miniscule market share of the Thai market, under 1% combined. NT is the sole operator hosting MVNOs in Thailand since MVNOs were introduced in 2009, despite the fact that all of operators licenses’ terms and conditions have a clause that a minimum 10% of their spectrum capacity should be allocated to MVNOs. Opening up the market to MVNOs is often one of the conditions for M&A to go ahead. 

Chart of mobile operators market share in Thailand

The topic of mergers is widely discussed in Thailand; there have been a number of concerns raised. Thai consumer advocates and academics voice their disapproval of the M&A, saying consumers will be at a disadvantage due to less competition in the market. For instance, the People’s Network Protecting Public Interest claimed that the market would become a de facto duopoly with foreseen price increases of 20-30% in the long term. NT Telecom, which is both a competitor and a minority stakeholder in dtac, disapproved of the True-dtac merger. 

The discussion as to who should approve the merger was put to rest when a legal subcommittee of the National Broadcasting and Telecommunications Commission (NBTC) concluded the telecom regulator has the power to approve or prohibit the planned merger. NBTC is still conducting studies on the impact of the merger, both short-term and long-term, as well setting up a number of independent committees to advise on the best course of action. Most recently, a panel that was tasked with determining whether the merger would have economic impact, M&A could reduce Thailand’s GDP growth by between 0.05% and 1.99%, and increase mobile prices by 2.03%-19.5% depending on the degree of collusion. Against this backdrop, it is hard to imagine that the merger would get a green light. 

If the merger goes ahead, the newly combined entity will become the number one player in Thailand with a 52.2% market share, ahead of the current market leader, AIS. However, it takes time for the companies to merge their operations and it is most likely that in the short term both companies will use their separate brands while working out the go to market proposition. Also the companies’ execs at a recent seminar were at pains to assure that there will be no price hikes if the merger goes ahead, instead because of the economies of scale there will be more investment into the market resulting in more innovation and better customer experience. 

If approved, M&A would change the spectrum landscape 

As it stands right now, AIS has the largest amount of 5G spectrum — a total of 1,330 MHz — across low-, mid-, and high-frequency bands. In May 2022, AIS added a further 10 MHz of bandwidth on the 700 MHz spectrum from NT due to the deal with NT Telecom. With this deal, AIS will increase its bandwidth to 40 MHz from August 2022 onward, which should improve its 5G coverage. 

AIS and TrueMove H deployed their initial 5G networks on the 2600 MHz spectrum, while dtac used frequencies in the 26 GHz band. All operators, except for NT, also deployed 5G in the 700 MHz spectrum band when it became available for use in early 2021, following the completion of broadcasting service migration. NT is yet to deploy 5G. 

Chart of 5G holdings in Thailand before TrueMove H and dtac merger

Thanks to the merger, dtac would have access to True’s mid-band spectrum, which should substantially improve its performance. Furthermore, there is another C-band spectrum auction planned in 2022 (3.4-3.7 GHz band). This should have a positive effect on the 5G download speeds as we have seen in the USA when since deployment in the C-band, Verizon’s 5G speeds have set it apart from AT&T.

Chart of 5G holdings in Thailand after TrueMove H and dtac merger

However, it is common practice that operators that undergo mergers have to divest part of their spectrum as an M&A condition. For example, this was the case when Hutchison 3G acquired Orange in Austria, Hutchison 3G bought Telefonica in Ireland and Telefonica merged with E-Plus in Germany. 

The benefits of scale are obvious 

Fixed Mobile Convergence (FMC) bundling is offered by most operators in Thailand due to competitive pressures coming from TrueMove H and AIS. The merger could enable convergent offerings from dtac too, which is solely a mobile player, and would allow it to offer better service in terms of coverage and further expand its market share. According to Analysys Mason, FMC penetration will continue to increase in Thailand, and if the merger is blocked, dtac’s competitive standing will be further disadvantaged. 

On the other hand, True Corporation has a portfolio of services:

  • TrueMove H — mobile operator, which also offers NB-IoT (Narrowband IoT).
  • TrueOnline — broadband internet and fixed-line. It is the largest fixed broadband provider with a 46.7% market share.
  • TrueVision — Pay TV, digital TV and content provider and an online game and influencer network; 3.5M subscribers.
  • True Digital Group — Digital media, data analytics, cybersecurity, IoT, integrated digital health, digital solutions and True Digital Academy.

The merged operator NewCo would remain at its core a telecommunication player but would extend its reach to support the digital transformation of Thailand, in line with Thailand 4.0 vision. The quoted benefits of the “amalgamation” include:

  • Improved 5G coverage with better network quality, reliability and speed.
  • More value-driven convergence or products and services thanks to access to a wider ecosystem of partners.
  • Utilization of consolidated infrastructure such as outlets to expand its outreach to deliver on Thailand 4.0 policy.
  • Greater opex and capex cost efficiencies when deploying 5G networks thanks to the benefit of scale. As a result improving the quality of telecom infrastructure and customer satisfaction.
  • Streamlined efficiencies will deliver better consumer experience and will enable NewCo to invest in future technologies and networks.
  • Positioning Thailand as a regional technology hub.

The NewCo will operate: 

  • Telecom services and the sale and distribution of mobile devices via subsidiaries dtac, TriNet, and TrueMove H — using the 700 MHz, 850 MHz (under agreement with NT), 900 MHz, 1800 MHz, 2100 MHz, and 2300 MHz (under agreement with NT) spectrum.
  • Broadband internet provider via TrueOnline.
  • Pay TV, digital TV, and content provider via TrueVisions.
  • Portfolio of digital services via True Digital Group, and new businesses through artificial intelligence, cloud technology, smart devices, smart cities, amongst others.
  • Venture capital investments, with the intention to raise VC funding of USD 100-200 million with partners to invest in promising digital startups.

The merged operator could provide more competition to AIS across all market segments, not only mobile. AIS Fiber, for instance, holds a 14% market share and differentiated its services with value added and bundling packages. NewCo would build on existing TrueOnline offering and could take a convergent offering to a new level, e.g. quadplay. 

While we await the final decision on the merger, it is clear that dtac is falling behind its competitors when it comes to 5G performance. The recently announced National 5G Alliance aims to further promote the role of 5G in enabling digital transformation. We will monitor Thai operators’ performance and wait for the results for the upcoming mid-band spectrum auction to see whether this will close the performance gap. In the meantime, you can compare mobile performance across operators and countries using Speedtest Intelligence

Ookla retains ownership of this article including all of the intellectual property rights, data, content graphs and analysis. This article may not be quoted, reproduced, distributed or published for any commercial purpose without prior consent. Members of the press and others using the findings in this article for non-commercial purposes are welcome to publicly share and link to report information with attribution to Ookla.

| May 5, 2021

Starlink: Bridging the Digital Divide or Shooting for the Stars?

Elon Musk has a vision to use Starlink satellites to deliver world-class internet speeds to the rural households that have been left behind by so many infrastructure projects over the years. It’s a noble goal, and one that’s become increasingly necessary given our reliance on the internet over the past year. It could also help bridge the glaring gaps in performance between cities and rural communities which the Biden administration is prioritizing in the American Jobs Plan. Starlink is still in beta phase, but we decided to use data from Speedtest Intelligence® to investigate Q1 2021 performance in the U.S. and Canada to see if the program is living up to expectations.

Starlink speeds are sometimes a vast improvement, sometimes not

ookla_united_states_median_download_starlink_map_0521-3
In the U.S. during Q1 2021, median download speeds from Starlink ranged from 40.36 Mbps in Columbia County, Oregon to 93.09 Mbps in Shasta County, California. These represented everything from a dramatic improvement over other fixed broadband providers (545.6% faster in Tehama County, California) to a disappointment (67.9% slower in Clay County, Missouri).

ookla_united_states_download_comparison_starlink_map_0521-3

Starlink shows a narrower range of performance in Canada

ookla_canada_median_download_starlink_map_0521-3

Starlink’s Q1 2021 median download speeds in Canadian provinces showed a smaller range than in the U.S. with a low of 53.61 Mbps in Ontario and a high of 80.57 Mbps in Saskatchewan. Percentage difference when compared to all other fixed broadband providers also showed a narrower range. In Saskatchewan and Manitoba, Starlink customers reported median download speeds 59.6% and 38.5% faster than those for all other fixed broadband providers combined. In Québec, median download speeds were nearly equal, with Starlink performing only 3.4% slower. In B.C., Alberta, Ontario and New Brunswick, on the other hand, Starlink’s median download speeds were 20.9%, 24.2%, 29.5% and 40.7% slower than other fixed broadband providers, respectively.

ookla_canada_download_comparison_starlink_map_0521-3

Starlink latency is up to 486% higher in U.S., 369% in Canada

A reasonable latency is critical to effective internet use. If your latency is too high, you might be the one on the video call with the tinny voice who’s answering questions when the conversation’s already moved on. If you’re a gamer, you already know that latency can cause your characters to stutter-step around at critical moments. Starlink plans to use low-Earth orbit satellites with laser links to radically decrease latency in rural areas. What we’re seeing so far, though, is that Starlink’s latency is higher than the alternatives, often much higher.

ookla_united_states_latency_comparison_starlink_map_0521-3

Starlink’s latency was higher in all but one of the U.S. counties surveyed during Q1 2021. The exception was Mariposa County, California where Starlink’s latency was 17.4% lower than that of all other providers combined. Median latency values on Starlink were observed from 31 ms (Kittitas County, Washington) all the way up to 88 ms (Otsego County, Michigan). For comparison, median latency values for all other providers combined ranged from 8 ms (Fairfax County, Virginia) to 47 ms (Daviess County, Kentucky).

ookla_canada_latency_comparison_starlink_map_0521-3

In Canada, Starlink’s latency was higher in all provinces surveyed during Q1 2021. With median latency values from 34 ms (B.C.) to 61 ms (Saskatchewan), Starlink’s latency was 209.1% to 369.2% higher than that of all other providers combined.

Starlink meets minimum tier for FCC’s Rural Development Opportunity Fund

In order to compete for the FCC’s Rural Digital Opportunity Fund (RDOF), providers must meet the minimum performance tier (25 Mbps download / 3 Mbps upload / 100 ms latency). We analyzed Speedtest® results for users with more than two tests during Q1 2021 to see whether Starlink could potentially qualify for this funding.

ookla_percentage_users_fcc_performance_tiers_0521

In both the U.S. and Canada, Starlink provided competitive or better service at the minimum (25/3/100) tier. In the U.S., 86.7% of Starlink users met this threshold, compared with 83.2% of those on all other fixed broadband providers. Although the FCC’s criteria don’t apply north of the border, 85.6% of Canadian Starlink users met the Minimum threshold, compared with 77.8% for all other providers. Starlink showed a smaller proportion of users meeting the baseline and above baseline tiers than all other providers combined.

Given this data, it’s safe to say Starlink could be a cost-effective solution that dramatically improves rural broadband access without having to lay thousands of miles of fiber.

Musk’s Starlink experiment is certainly fascinating and we applaud any effort to get better service for rural residents. That said, it’s clearly early days for the rapidly growing Starlink, and results from Q1 may not be indicative of future performance. We’ll be watching to see how performance improves as more satellites are launched and as more users join the service. If you’re on Starlink, take a Speedtest to share how your connection is performing.

Editor’s note: this article was updated on May 17 with a sentence clarifying how this data should be interpreted.

Ookla retains ownership of this article including all of the intellectual property rights, data, content graphs and analysis. This article may not be quoted, reproduced, distributed or published for any commercial purpose without prior consent. Members of the press and others using the findings in this article for non-commercial purposes are welcome to publicly share and link to report information with attribution to Ookla.

| February 15, 2023

Are 5G Networks Meeting Consumers’ Expectations?

Key messages

  • In-market 5G performance varies widely. Reviewing the top 10% and worst 10% of Ookla® Speedtest Intelligence® samples reveals significant variance in the consumer experience on today’s 5G networks, with 5G speeds peaking at over 1 Gbps for the top 10% of users in the U.A.E on average, but falling to below 20 Mbps for the lower 10% in Norway, the U.S., Japan, Germany, and Spain.
  • Median 5G performance is declining in many early launch 5G markets. While understandable as 5G adoption grows and users in more remote locations access 5G, declining median download speeds also point to investment and deployment challenges in some markets. At the same time, many of these markets are facing economic headwinds, placing more emphasis than ever on cost control. As a result, operators must carefully balance network investment priorities.
  • 5G Net Promoter Scores (NPS) significantly higher than 4G LTE in most markets, but waning. With the exception of Sweden and Qatar, all the early launch 5G markets in our analysis saw 5G NPS fall year-over-year. Operators’ 5G NPS still trade at a premium compared to 4G, and while performance is just one part of the equation, operators should take care to build on the positive sentiment that 5G has brought to date.

Despite impressive headline speeds, 5G performance varies a lot

Median 5G performance allows us to gauge the midpoint of user experience on 5G networks, however it doesn’t paint the full picture. While headline 5G speeds impress, Speedtest Intelligence data lays bare the ups and downs of 5G performance for consumers, even in early launch, advanced 5G markets. We recently looked at 5G network performance over high frequency (mmW) bands, painting a view of the true potential of 5G networks. However, if we look at performance on today’s 5G networks, looking beyond the median at the range of performance between users in the top 10% and those in the lower 10%, Speedtest Intelligence data reveals huge variance in the performance users experience.

Chart of psread of 5g performance, top 10% of samples versus median and lower 10%

The U.A.E. was the fastest 5G market in our analysis, based on median download performance of 545.53 Mbps in December 2022, followed by South Korea and Qatar. However, the top 10% of users in the U.A.E. recorded speeds of at least 1,266.49 Mbps on average, while the lowest 10% of users experienced speeds of 127.52 Mbps or slower on average. At the other end of the scale, Spain recorded a median 5G speed of 94.14 Mbps, but also demonstrated wide variance between the top 10% of samples at 537.95 Mbps or faster and the lowest 10% with 10.67 Mbps or less.

Based on many of the marketing messages around 5G, consumers are led to expect a big bang change in performance. However, with 5G operating over a greater range of spectrum bands than previous generations, including high frequency spectrum which has relatively poorer propagation, it’s understandable that 5G performance will vary more than previous generations of mobile network technology.

5G markets set to face performance challenges during 2023

While globally 5G speeds have remained stable, for many of the markets in our analysis, median 5G download speeds have fallen over the past year. The U.S. was the main outlier, recording the strongest uplift in 5G performance as T-Mobile continued to drive home its performance advantage in the market, while Verizon’s performance improved early in 2022 through its deployment of 5G in C-band spectrum. This trend is likely to continue in 2023 in the U.S., as more C-band spectrum is made available. However, the picture remains concerning for a number of other 5G markets, particularly those where median 5G speeds are at the lower end of the spectrum.

Chart of Year-over-Year change in median 5G download performance

In some markets, 5G was initially priced at a premium to 4G, with operators focused on driving incremental returns on the new network technology. However, operators have been increasingly opening up 5G access by removing incremental costs for consumers and adding prepaid plans too. As 5G adoption scales, it places more strain on the new networks. The challenge for many of these markets is that network performance is likely to degrade further unless network densification picks up. 

For network operators, this investment imperative is occuring amidst macroeconomic headwinds, which are driving up operating costs and putting pressure on consumer and enterprise spend. In addition, there remain challenges in deploying additional 5G cell sites in dense urban areas where demand is strongest, while in some markets EMF limits and other regulations can limit the deployment of high-capacity 5G sites.

Degrading 5G performance impacts consumer sentiment

Net Promoter Score (NPS) from Speedtest Intelligence paints a largely positive picture of current 5G networks. NPS is a key performance indicator of customer experience, categorizing users into Detractors (score 0-6), Passives (score 7-8), and Promoters (score 9-10), with the NPS representing the percentage of Promoters minus the percent of Detractors, displayed in the range from -100 to 100. Across the markets we analyzed, 5G users on average rated their network operator with NPS scores that were universally higher than those for 4G LTE users. However, consumer sentiment for users on 5G networks is beginning to shift, with NPS scores falling, coinciding with lower median 5G performance in many of the markets we analyzed.

Chart of 5G uplift in Net Promoter Scores vs. 4G LTE

Declining performance levels will be a factor driving NPS down for some 5G users. It’s also important to remember that as 5G scales in many of these early launch markets, the profile of 5G users is also changing from predominantly urban-based users, to more of a mix of urban, suburban, and rural users, which brings additional coverage and performance challenges for network operators. We plan to examine the relationship between 5G performance and spectrum in an up-coming content piece. Please get in touch if you’d like to learn more about Speedtest Intelligence data.

Ookla retains ownership of this article including all of the intellectual property rights, data, content graphs and analysis. This article may not be quoted, reproduced, distributed or published for any commercial purpose without prior consent. Members of the press and others using the findings in this article for non-commercial purposes are welcome to publicly share and link to report information with attribution to Ookla.

| February 28, 2023

Chile Writes the Blueprint for Fixed Network Improvement in Latin America

Key messages

  • From a median download speed of 50.23 Mbps in Q1-Q2 2020 to 205.96 Mbps in Q3-Q4 2022 – Chile punches up on fixed line performance. Chile has been the top performing fixed broadband market across Latin America, consistently outperforming other markets in the region. Over the last three years it has also closed the performance gap to other leading markets globally, and during 2022 consistently featured in the top five of Ookla®’s Speedtest Global Index™, where as of January it placed second.
  • Strong competition the primary driver. Chile’s strong fixed broadband performance — an anomaly in the region — is due primarily to strong competition among Chilean ISPs. Chile has six ISPs with more than 5% market share, all of which are heavily focused on migrating customers to fiber, and five of which recorded median download speeds in excess of 100 Mbps during Q4 2022.
  • Fixed-line investment focused on driving rapid migration to fiber. Strong competition has promoted heavy fixed-line network investment, with reported data indicating capital intensity ratios in excess of 20% in the market. This has translated into a rapid technology migration, shifting the market from a majority of connections via cable (HFC) at the end of 2019, to fiber now comprising almost two-thirds of connections. Furthermore, it has also seen the formation of a neutral network, On*Net, which offers wholesale fiber access to other ISPs.
  • Supporting economic growth in the market. Subject to rising inflation and a market overheated following government intervention post the COVID-19 pandemic, Chile’s economy is expected to contract in 2023 before returning to growth in 2024. Despite this, broadband adoption among businesses continues to advance at a rapid pace, a positive sign in helping support the market’s future growth potential. In addition, broadband performance across the entire market is strong, with median download speeds in all Chilean regions in excess of 100 Mbps as of Q4 2022.

Chile punches up on fixed-line performance

Chile has been a regional leader in fixed line performance in Latin America since 2016, and since then has continually widened its advantage over its regional peers. Over the past three years Chile has driven fixed-line performance increases, from a median download speed of 50.23 Mbps in Q1-Q2 2020 to 205.96 Mbps in Q3-Q4 2022. This makes Chile now a clear anomaly among Latin American markets, having closed the performance gap to the top-performing fixed-line markets worldwide during 2022.

chart of median fixed download performance, chile versus regional and international peers

Chile’s population is predominantly urban-based, with a rural population of just 12.2% in 2021 according to the World Bank. While connecting rural premises with advanced fixed access networks is more costly and less profitable than in urban environments, the urban nature of Chile is not markedly different compared to its peers in Latin America. Brazil has only a marginally greater rural share of population at 12.7%, while Argentina has a lower share, at only 7.8%.

Speedtest Intelligence® data shows that at a regional level within Chile, ISPs are supporting median download speeds in excess of 100 Mbps across all regions during Q4 2022. Santiago Metropolitan Region is the most populous region in Chile, and recorded a median download speed of 215.73, while the region with the largest rural share of population, Maule, recorded a median download of 189.36 Mbps. The lowest median speed was observed in Aysén, with 117.34 Mbps. This relative equity in fixed line performance across regions echoes a 2020 OECD country report on Chile, which highlighted that while economic disparities between Chile’s regions are above the OECD average, it has shown the largest reduction in regional economic inequality among OECD countries since 2008.

map of median fixed download speeds by region in chile

Hyper-competitive fixed broadband market

Of the top eight markets in the Speedtest Global Index, Chile had the greatest concentration of ISPs supporting high-speed broadband services. Speedtest data shows eight ISPs active in the Chilean market with more than 3% share of samples, and of these seven supported median download speeds in excess of 100 Mbps. According to the regulator Subtel, Telefonica led the market with 30.3% market share, ahead of second-placed VTR with 26.2%.

Telefonica also led the market in terms of fiber connections, with a market share of 45.7%, followed by Mundo with 25.0%, which in January 2023 announced that it had completed the migration of its customer base from HFC (hybrid fiber-coaxial cable) to fiber-to-the-home (FTTH). Other smaller ISPs are actively deploying fiber or looking for alternative solutions to boost their reach. Entel agreed to sell its fiber network to On*Net Fibra, a joint venture between KKR and Telefonica Chile to provide a neutral fiber network in Chile, in October 2022. This will allow Entel to continue provisioning new households over the larger OnNet network. We also see SpaceX’s Starlink active in the market, alongside Hughesnet, although satellite remains a very small but growing technology within the market.

chart of chile, fixed broadband connections market share by isp

Strong competition driving network investment

Strong competition in Chile’s fixed line market has helped drive network investment, with Chilean ISPs focused on expanding the number of homes passed and migrating to more advanced fiber access. The relatively late launch of 5G networks in the region has enabled operators to focus more heavily on fiber deployment, with a view to increasing fixed broadband adoption and also supporting 5G networks.  The first 5G networks in the market launched in December 2021.

While there is limited reported fixed-line financial data in the market, Telefonica Chile has reported capex historically. Its data shows strong early investment in the market, with capital intensity (capex as a share of revenues) well above 20% from 2015 onwards, peaking at 28.8% of revenues in 2018.

chart of telefonica chile, fixed capex and capital intensity

Telefonica Chile stopped reporting fixed revenues in 2020, however its fixed capex dipped significantly, highlighting the change in strategy from its parent group to deleverage its Latin American operation. This eventually led to KKR’s acquisition of a 60% share in InfraCom from Telefonica, creating On*Net Fibra, a neutral FTTH network joint-venture, which began offering wholesale services in July 2021. Rival ISP VTR confirms the overall trend of strong fixed-line investment in the country, reporting capital intensity in excess of 20% over the past three years. In addition, Mundo announced in early 2022 that it planned to invest $200 million expanding its fiber infrastructure in Chile, and the ISP is targeting 4.5 million homes passed, by the end of 2023.

Accelerating migration to fiber

As of 2019, a majority of Chilean broadband connections were supported by hybrid fiber-coaxial (HFC) services, with fiber the second most frequently used technology, followed by ADSL. The transformation of the Chilean fixed broadband market since then has been rapid, with the latest data for September 2022 showing that fiber makes up the majority of broadband connections, with HFC’s share declining strongly, and ADSL’s share dropping below that of wireless broadband connections.

chart of chile, fixed broadband connections market share by isp

This rapid tech migration has also led to Chile being among the strongest adopters of Wi-Fi 5 and 6 in Latin America, which support faster speeds within business and in the home. In Q4 2022, 71.3% of Chile’s Speedtest samples utilized Wi-Fi 5, with less than 20% utilizing Wi-Fi 4. By contrast, Brazil had 38.2% of samples utilizing Wi-Fi 4, and Argentina 53.4%. Adoption of the newer Wi-Fi 6 routers is slower in Chile compared to international peers, standing at 8.5% as of Q4 2022, however it still leads within Latin America by a significant margin. Within Chile GTD led the pack with 33.5% of samples utilizing Wi-Fi 6 during Q4 2022, followed by WOM with 25.9%, Entel with 21.9% and Telefonica del Sur with 19.4%. By contrast, Claro, Movistar, Mundo and VTR all returned less than 10% in Wi-Fi 6 samples, indicating there is plenty of scope to increase median fixed-line performance yet further in the market. Our analysis of the median download speeds shows a strong correlation with adoption of Wi-Fi routers utilizing 5 GHz spectrum (WiFi 5 and above).

chart of installed router base by wi-fi generation, chile versus regional and international peers

Driving increased fixed broadband adoption

The growth in fixed broadband adoption in Chile was disrupted significantly by the COVID-19 pandemic, and resultant move towards remote working and more people staying at home. Connections growth increased from 5.5% in 2019, to 10.7% in 2020 and 12.8% in 2021, as the importance of home internet connectivity grew.

chart of chile growth in fixed broadband connections by residential and business users

The initial acceleration in connection growth in 2020 was due to growth in residential fixed broadband adoption, with connections increasing by 13% in 2020 and 12% in 2021. Business fixed broadband connections declined in 2020 as the economy contracted, but rebounded strongly in 2021 on the back of government economic stimuli, increasing 19%, and a further 8% in the first three quarters of 2022, demonstrating the important role of broadband in supporting economic growth in the market.

Chile’s economy is forecast to contract in 2023, as inflation continues to impact the market, and fiscal stimuli following the COVID-19 pandemic are unwound. However, the Chilean Central Bank forecasts that the market will rebound in 2024, with growth ranging from 2.25% – 3.25%. A key component of Chile’s future growth will be the ability of businesses to secure fast and reliable internet connections. From an infrastructure point of view, Chile is very well served in this regard, with a very dynamic fixed infrastructure market, as demonstrated by its operators continuing to push on fiber rollout, the emergence of a neutral fiber network with broad coverage, and even the increasing role of satellite connectivity in the market. Such is the success of its Chilean operation, that Telefonica is using the market as a blueprint for its other operations across Latin America. We’ll continue to monitor the rapid progress of Chile’s fixed broadband market as it continues to vie with other leading markets internationally at the top of Ookla’s Global Index. To find out more about Speedtest Intelligence, please get in touch.

Ookla retains ownership of this article including all of the intellectual property rights, data, content graphs and analysis. This article may not be quoted, reproduced, distributed or published for any commercial purpose without prior consent. Members of the press and others using the findings in this article for non-commercial purposes are welcome to publicly share and link to report information with attribution to Ookla.

| October 31, 2017

LinkNYC Proves Public Wi-Fi Can be Free, Fast and Far-reaching

Two years ago, LinkNYC set out to provide New Yorkers with free Wi-Fi using a network of Links that offer “superfast, free public Wi-Fi, phone calls, device charging and a tablet for access to city services, maps and direction.” The experiment worked, and we’re here to report on how fast the network really is, whether it holds up to heavy use and which parts of the city are seeing the most benefit.

What is LinkNYC?

LinkNYC uses kiosks (“Links”) to provide internet connectivity to the five boroughs (Manhattan, Brooklyn, Queens, the Bronx, and Staten Island). The project resulted from a competition initiated by the New York City government to find a new use for the City’s payphones. Service at the first 500 Links was available by the end of 2015. One thousand, one hundred and sixty-four are active as of this writing with another 215 installed and awaiting final connection. The project aims to have 7,500 Links online by the end of 2023. Each link is connected to the LinkNYC fiber network and is capable of speeds up to 1 Gbps. The Links use 802.11ac Wave 2 access points with support for 4×4:4 MU-MIMO.

LinkNYC was created by CityBridge, a consortium of companies including Intersection (a portfolio company of Alphabet Inc.’s Sidewalk Labs), Qualcomm and CIVIQ Smartscapes. Beyond a $300 million capital investment from CityBridge, LinkNYC is funded through advertising revenues from ads shown on screens on the Links themselves and is projected to create more than $500 million in revenue for the City of New York.

How fast is fast?

Speedtest data reveals LinkNYC offered up a mean download speed of 158.98 Mbps and a mean upload of 123.01 Mbps in September 2017. This free network is faster by 74% and 165%, respectively, than New York City’s average download and upload speeds over mobile Wi-Fi. New York’s mobile Wi-Fi download and upload speeds for all networks combined are respectively 249% and 312% faster than those over cellular networks. That means LinkNYC users are seeing download speeds 511% faster than they would be if they were connecting on cellular networks. LinkNYC’s mean upload speed was 996% faster than cellular.

New York City Speedtest Results
September 2017
Connection Type Mean Download (Mbps) Mean Upload (Mbps)
LinkNYC Mobile Wi-Fi 158.98 123.01
Mobile Wi-Fi 90.89 46.27
Cellular 25.98 11.22

Even better, we can see that the speeds available on LinkNYC are improving rapidly. Though the Speedtest results fluctuate somewhat on a day-by-day basis, on January 1, 2017, the average download speed was 95.70 Mbps and the upload was 81.50 Mbps. On September 30, the daily average download speed peaked at 201.00 Mbps and the upload speed was 177.10 Mbps.

Sample Speeds by Day

These daily speeds likely reflect limitations of mobile devices, not those of the LinkNYC network.

One thing to note is that while the LinkNYC network is reportedly capable of 1 Gbps speeds, most mobile devices are not. The Speedtest results graphed above are likely limited by a world where the peak achievable speed for an iPhone 5 maxes out at around 100 Mbps and an iPhone 7 at around 560 Mbps.

To top it off, LinkNYC’s daily speeds are faster still than the averages for the U.S. as a whole. In September, we saw a mean download speed over mobile Wi-Fi of 66.25 Mbps in the U.S., while cellular came in at 23.98 Mbps. Mean upload speed over mobile Wi-Fi for the U.S. was 23.59 Mbps, while cellular was 8.38 Mbps.

Is it secure?

LinkNYC actually has two networks — one called “LinkNYC Free Wi-Fi” that’s open and available to all and “LinkNYC Private.” Hotspot 2.0-compatible devices are automatically prompted to join this second network which is protected using WPA2 encryption and Hotspot 2.0 technology which facilitates cellular-like roaming on capable devices. That means that once a phone joins the “LinkNYC Private” network, the phone’s connection to the network is handed off from access point to access point as a user moves throughout the city. Most carriers have offered Hotspot 2.0-capable phones since 2014 (T-Mobile has for much longer).

We can’t say for certain that the private network is secure, but the fact that it is encrypted likely makes it more secure than your average coffee shop connection. In light of the recently discovered global WPA2 vulnerability, we asked LinkNYC how vulnerable their network was. The response was: “The Link private network is not at risk. The combination of access point firmware and the network configuration assure the integrity of encrypted WPA2.”

Speeds over the two networks are similar with downloads over “LinkNYC Private” Hotspot 2.0 network just 9.4% faster than those on “LinkNYC Free Wi-Fi”. This could be due to the fact that newer phones are both more likely to offer faster speeds and to be Hotspot 2.0-ready as well as the fact that fewer users are accessing this second network.

LinkNYC Speedtest Results
January 1 – October 11, 2017
Connection Type Mean Download (Mbps) Mean Upload (Mbps)
LinkNYC Free Wi-Fi 131.84 100.97
LinkNYC Private 144.21 106.98

Do speeds hold up during peak periods?

Yes, yes they do. The graph below shows that even during periods with the highest volume of tests (from 3-4 p.m.), the LinkNYC network maintains peak download speeds. The slowest download speeds, seen from 5-6 a.m. and 8-9 a.m., still maintain an average download speed over 120 Mbps.

NUMBER OF TESTS BY DAY GRAPH

The far-reaching impact of LinkNYC

How many people are using it?

According to LinkNYC, the network sees 300,000 users per day. We saw 19,289 Speedtest tests taken with Speedtest over the LinkNYC network from 7,594 unique users from January 1, 2017 through October 11, 2017. This compares with the 2,436,040 Speedtest results from 322,851 users on all mobile Wi-Fi networks in New York City during the same period.

Where can you get it?

As described above, Links are rolling out rapidly. You can see the current map of available Links here, but we found that the map at today’s writing corresponds closely with the map of Speedtest results we’ve seen over the past year.

SPEEDTEST RESULTS ON AVAILABLE LINKS

Much of Manhattan is covered by Links, with the exception of Washington Heights north of the George Washington Bridge and lower Manhattan below Worth St. Links are sparser in the Bronx with nothing north of West Kingsbridge Road or east of Webster Ave. (north of 161st) and Third Ave. (south of 161st).

The alignment of Links along major thoroughfares becomes more obvious in Queens and Brooklyn. In this area, we see a large gap around Bushwick and Ridgewood with nothing south of 39th St. and Clarendon Rd. A whole swath of northeast Queens (bordered by Grand Central Parkway) also exists in a Link-free zone.

Meanwhile, in Staten Island you’ll find Links on sections of Hylan Blvd. and Richmond Rd. with a few scattered in between.

Links are required to have a range of at least 150 feet, although a spokesperson for LinkNYC reported a Speedtest result as fast as 80 Mbps at 400 feet. At either distance, people living in neighborhoods with a more sparse Link distribution may not have access near home.

PERFORMANCE MAP

The map above shows that speeds vary not by neighborhood but by distance from a Link.

Can I use it at home?

If you’re lucky enough to live near a Link, you actually can use it for your home internet; there’s nothing in the terms of service to say otherwise. But, unless you’re sitting within the unassisted range of a Link, we wouldn’t recommend it.

We were able to identify Speedtest results that were using extenders and/or repeaters to rebroadcast the service farther into a building, and those tests showed speeds 57% slower than New York’s 90.89 Mbps average for downloads over mobile Wi-Fi.

LinkNYC Speedtest Results
January 1–October 11, 2017
Connection Type Mean Download (Mbps) Mean Upload (Mbps)
Unsampled Results from Extenders and Repeaters 38.87 30.71
Overall LinkNYC Results 158.98 123.01

Approaches to municipal Wi-Fi

LinkNYC’s ad-based, public-private partnership is only one approach to municipal Wi-Fi. In Leiden, Netherlands, a non-profit organization set up an independent, community-based network run by volunteers. Venice offers free Wi-Fi to all residents and Longmont, Colorado offers free municipal Wi-Fi in several locations, mostly parks, as part of their Gig City initiative.

LinkNYC isn’t the first free Wi-Fi network, but it’s one of the largest. And, despite some bumps along the way, it’s successfully bringing fast, free public Wi-Fi to the masses. The project is so successful that CityBridge has just extended the same model to London as InLinkUK.

Are you enjoying free mobile Wi-Fi on either LinkNYC or InLinkUK? Take a Speedtest on Android or iOS so we can share details about the performance of these networks over the long haul. Select the CityBridge server when taking your test to get the most accurate results.

Ookla retains ownership of this article including all of the intellectual property rights, data, content graphs and analysis. This article may not be quoted, reproduced, distributed or published for any commercial purpose without prior consent. Members of the press and others using the findings in this article for non-commercial purposes are welcome to publicly share and link to report information with attribution to Ookla.

| December 20, 2021

Growing and Slowing: The State of 5G Worldwide in 2021


5G continues to offer new and exciting ways of rethinking everything from streaming video to performing remote surgery. However, not everyone shares equally in these possibilities as many countries do not have access to 5G and even those that do, do not experience the same level of performance from their 5G connections. We examined Speedtest Intelligence® data from Q3 2021 Speedtest® results to see how 5G speeds have changed, where download speeds are the fastest at the country and capital level, where 5G deployments have increased and what worldwide 5G Availability looked like in Q3 2021. We also looked at countries that don’t yet have 5G to understand where consumers are seeing improvements in 4G access.

5G slowed down at the global level

Median-Speeds-Worldwide_1221-01

It’s common to see new mobile access technologies slow down as adoption scales, particularly early on in the tech cycle. Over the past year from Q3 2020 to Q3 2021, the median global 5G download speed fell to 166.13 Mbps, down from 206.22 Mbps in Q3 2020. Median upload speed over 5G also slowed to 21.08 Mbps (from 29.52 Mbps) during the same period.

More users are logging on to existing 5G networks, and we’re also at the stage in the evolution of 5G where countries that have historically had slower speeds are starting to offer 5G. In addition, the widespread use of dynamic spectrum sharing that has been used to boost early 5G coverage weighs on 5G download speeds. While the dip in speeds looks like a letdown, it’s more of a compromise to enable broader access. With additional spectrum and further deployments slated for 2022, we anticipate speeds will begin to pick up again.

South Korea had the fastest 5G in the world

ookla_5g-download_performance_countries_1221-01-1

South Korea had the fastest median download speed over 5G during Q3 2021, leading a top 10 list that included Norway, United Arab Emirates, Saudi Arabia, Qatar, Kuwait, Sweden, China, Taiwan and New Zealand. Sweden, China, Taiwan and New Zealand were new to the top 10 in 2021 while South Africa (whose 5G was brand new last year), Spain and Hungary fell out of the top 10.

5G expanded to 13 additional countries

ookla_5G-map_1221-01

According to the Ookla® 5G Map, there were 5G deployments in 112 countries as of November 30, 2021. That’s up from 99 countries on the same date a year ago. The total number of deployments increased dramatically during the same time period with 85,602 deployments on November 30, 2021 compared to 17,428 on November 30, 2020, highlighting the degree to which 5G networks scaled during the year. Note that there are often multiple deployments in a given city.

Seoul and Oslo lead world capitals for 5G

ookla_5g-download_performance_capitals_1221-01

Speedtest Intelligence data from Q3 2021 shows a wide range of median 5G speeds among global capitals. Seoul, South Korea and Oslo, Norway were in the lead with 530.83 Mbps and 513.08 Mbps, respectively; Abu Dhabi, United Arab Emirates; Riyadh, Saudi Arabia and Doha Qatar followed. Brasilia, Brazil had the slowest median download speed over 5G on our list, followed by Warsaw, Poland; Cape Town, South Africa and Rome, Italy. Stockholm, Sweden and Oslo, Norway had some of the the fastest median upload speeds over 5G at 56.26 Mbps and 49.95 Mbps, respectively, while Cape Town had the slowest at 14.53 Mbps.

The U.S. had the highest 5G Availability

The presence of 5G is only one indicator in a market, because even in markets where 5G has launched, coverage and adoption can be pretty low. We analyzed 5G Availability to see what percent of users on 5G-capable devices spent the majority of their time on 5G, both roaming and on-network during Q3 2021.

ookla_5g-availability_countries_1221-01

The United States had the highest 5G Availability at 49.2%, followed by the Netherlands (45.1%), South Korea (43.8%), Kuwait (35.5%) and Qatar (34.8%). Brazil had the lowest 5G Availability on our list at 0.8%, followed by Sweden (1.5%), South Africa (2.7%), New Zealand (2.9%) and Hungary (3.6%).

Not all 5G networks are created equal

Ookla Speedtest Intelligence data shows a growing disparity in the performance of 5G networks worldwide, even among the pioneer markets who were among the first to launch the new technology. We see leading markets such as South Korea, Norway, the UAE and China pulling well ahead of key European markets, the U.S. and Japan on 5G download speeds, creating what increasingly looks like two tiers of 5G markets.

ookla_5g-download_performance_1221-01

Part of the reason for this divergence is access to key 5G spectrum bands, with Verizon and AT&T in the U.S. for example, soon to deploy their C-band spectrum holdings for 5G use. However, what really seems to separate these markets is the level of 5G network densification. The number of people per 5G base station ranges from 319 in South Korea and 1,531 in China, to 4,224 in the EU and 6,590 in the US, according to the European 5G Observatory’s International Scoreboard during October 2021.

Despite the noise around 6G, 5G still has a long way to run

Median 5G mobile download speeds across these markets are respectable relative to the International Telecommunication Union’s (ITU) IMT-2020 target of 100 Mbps for user experienced download data rates. However, 5G Speedtest® results in each market demonstrate significant variability, with the bottom 10th percentile only recording speeds in excess of the IMT-2020 target in South Korea and Norway, and falling significantly short in many other markets, with Spain, Italy and the U.S. below 20 Mbps.

The story gets worse for upload speeds, where no market’s median speed broke the IMT-2020 recommended 50 Mbps, and where the bottom 10th percentile lay in single digits across the board. Operators are clearly prioritizing download speeds over upload, which makes sense given the asymmetric nature of demand, with most consumer applications requiring higher download speeds. However, as operators increasingly look to target the enterprise market with 5G connectivity and consumer demand for services such as video calling and mobile gaming continues to rise, operators will need to boost upload speeds.

ookla_5g-upload_performance_1221-01-1

Demand for mobile internet bandwidth continues to grow, up 43% year-on-year in Q3 2021 according to Ericsson’s latest mobility report. Looking ahead to 2022, operators will need to increase the capacity of their 5G networks to tackle this growing demand while driving network speeds to new heights. We’ve seen the impact the deployment of new spectrum can have on congested networks during 2021, with Reliance Jio witnessing a bump in 4G LTE performance and consumer sentiment following its acquisition of additional spectrum in India.

Where 5G still fails to reach

Speedtest Intelligence showed 70 countries in the world where more than 20% of samples were from 2G and 3G connections (combined) during Q3 2021 and met our statistical threshold to be included. These are mostly countries where 5G is still aspirational for a majority of the population. As excited as we are about the expansion of 5G, we do not want to see these countries left behind. Not only are 2G and 3G decades old, they are only sufficient for basic voice and texting, social media and navigation apps. To deliver rich media experiences or video calling, users need access to 4G or higher. Having so many consumers on 2G and 3G also prevents mobile operators from refarming that spectrum to make 4G and 5G networks more efficient.

Countries That Still Rely Heavily on 2G and 3G Connections
Speedtest IntelligenceⓇ | Q3 2021
Country 2G & 3G Samples
Central African Republic 89.9%
Palestine 84.7%
Yemen 72.4%
Turkmenistan 71.8%
Micronesia 56.3%
Madagascar 55.0%
Belarus 53.2%
Rwanda 51.7%
Kiribati 48.4%
Equatorial Guinea 47.6%
Afghanistan 44.4%
South Sudan 43.4%
Guyana 42.3%
Guinea 37.0%
Angola 36.8%
Cape Verde 35.9%
Tajikistan 35.6%
Zimbabwe 34.7%
Benin 34.4%
Togo 33.8%
Ghana 33.0%
Sierra Leone 31.7%
Antigua and Barbuda 30.2%
Vanuatu 30.1%
Lesotho 30.0%
Syria 29.6%
Moldova 29.4%
Saint Kitts and Nevis 28.9%
Mozambique 28.8%
Sudan 28.4%
Palau 28.3%
Grenada 28.1%
Tanzania 27.6%
Uganda 27.5%
Niger 27.5%
Gabon 27.5%
Haiti 27.4%
Suriname 27.4%
Tonga 27.3%
Liberia 27.0%
Namibia 26.7%
Swaziland 26.5%
The Gambia 26.3%
Saint Vincent and the Grenadines 26.3%
Dominica 26.3%
Somalia 26.1%
Cook Islands 26.0%
Zambia 25.9%
Barbados 25.7%
Armenia 25.5%
Algeria 25.4%
Papua New Guinea 25.2%
Jamaica 24.5%
Venezuela 24.2%
Ethiopia 24.1%
Uzbekistan 24.0%
El Salvador 23.5%
Honduras 23.1%
Nigeria 23.0%
Solomon Islands 22.8%
Caribbean Netherlands 22.7%
Botswana 22.3%
Anguilla 21.7%
Mauritania 20.6%
Saint Lucia 20.5%
Bosnia and Herzegovina 20.3%
Burundi 20.3%
Ecuador 20.2%
Ukraine 20.1%
Trinidad and Tobago 20.0%

We were pleased to see the following countries come off the list from last year, having dropped below the 20% threshold: Azerbaijan, Bangladesh, Belize, Burkina Faso, Cameroon, Costa Rica, Côte d’Ivoire, DR Congo, Iraq, Kenya, Laos, Libya, Maldives, Mali, Mauritius, Mongolia, Nicaragua, Paraguay and Tunisia. While countries like Palestine, Suriname, Ethiopia, Haiti and Antigua and Barbuda are still on this list, they have improved the percentage of their samples on these outmoded technologies when compared to last year (dropping 10-15 points, respectively), 2G and 3G samples in Belarus increased 6.7 points when comparing Q3 2021 to Q3 2020.

We’re excited to see how performance levels will normalize as 5G expands to more and more countries and access improves. Keep track of how well your country is performing on Ookla’s Speedtest Global Index.

Ookla retains ownership of this article including all of the intellectual property rights, data, content graphs and analysis. This article may not be quoted, reproduced, distributed or published for any commercial purpose without prior consent. Members of the press and others using the findings in this article for non-commercial purposes are welcome to publicly share and link to report information with attribution to Ookla.

| June 17, 2024

ISPs Driving Transformation in Broadband Performance Across the Caribbean

ISPs in the Caribbean have helped drive a step-change in performance across the region over the past four years. Fiber is at the forefront of this change, helping drive performance gains in terms of throughput and latency in leading markets such as Trinidad and Tobago, Bermuda, and the Cayman Islands, while Starlink’s LEO service is gaining a foothold in a number of islands too. Outside the leading Caribbean markets, performance varies significantly, but even among those lagging the regional average are advancing rapidly.

Key takeaways

  • Growing availability of faster broadband across the Caribbean. The last four years have seen a transformation in broadband performance in the Caribbean. Across the markets in this analysis, network Consistency – the share of Speedtest samples exceeding a threshold of 25 Mbps download and 3 Mbps upload – increased from 45.3% in Q1 2020, to 73.3% as of Q1 2024.
  • Fiber adoption driving performance gains. Trinidad and Tobago, Bermuda, and the Cayman Islands led the Caribbean region on fixed broadband performance, recording median download speeds of 110.26 Mbps, 109.79 Mbps, and 104.88 Mbps, respectively during Q1 2024. Strong fiber performance from a number of ISPs, including Digicel+ (across a range of markets), Amplia (Trinidad and Tobago), as well as Flow, Logic, and C3 Pure Fiber (Cayman Islands), helped drive this, with all recording median download speeds approaching or above 100 Mbps.
  • Latency performance varies hugely across the Caribbean. Key for real-time applications such as online gaming and video calling, latency performance varied significantly across the region. Thanks to the availability of fiber to most broadband users, markets such as Trinidad and Tobago hit median latency lows of just 15 ms in Q1 2024, while at the other end of the scale, markets such as Aruba and Haiti struggled with median latency approaching 100 ms.
  • Markets behind the curve are quickly catching up. The majority of Caribbean markets currently below the regional average for fixed network Consistency are catching up fast, led by markets such as the Dominican Republic, Sint Maarten, and the British Virgin Islands, which all increased network Consistency by more than 25 percentage points over the last two years. 

Fixed network performance varies dramatically across the Caribbean

Ookla Speedtest Intelligence® data shows a wide disparity in median fixed broadband performance across Caribbean markets, ranging from lows of 2.72 Mbps and 25.21 Mbps in Cuba and Sint Maarten respectively, to highs of 110.26 Mbps and 109.79 Mbps in Trinidad and Tobago, and Bermuda respectively. Median upload performance mimicked this trend, with a low of 1.02 Mbps for Cuba and a high of 89.15 Mbps in the Cayman Islands.

Fixed Broadband Performance Across Caribbean Markets
Speedtest Intelligence® | Q1 2024

Latency performance showed even greater variance, with some markets being able to access high-speed international links, and with others relying on multiple hops of undersea cables. Eight of the markets we examined recorded median multi-server latency below 50ms, with Trinidad and Tobago leading with 15ms, followed closely by Curaçao with 16ms. At the other end of the scale, a cluster of nine markets recorded latency ranging from 71 ms to 95 ms, while Cuba was the only market with median latency greater than 100 ms, recording 133 ms in Q1 2024. This marks an improvement year-on-year, down from 164 ms in Q1 2023, with the Arimao submarine cable (connecting Cuba to Martinique), helping drive some improvement, however, the island’s aging telecoms infrastructure continues to hold it back.

Fiber is the natural next step for many Caribbean ISPs

A number of Caribbean ISPs, led by groups such as Digicel, are transitioning to fiber access across their fixed operations. The transition from legacy broadband access technology to more modern, faster connections such as fiber takes time. In addition to network rollout and the significant public works this entails, operators and regulators need to ensure users are given enough incentive and education on the benefits of technologies such as fiber, in order to help drive adoption. Digicel+ in Bermuda stands out as a clear leader in the region on median download performance, followed by Digicel+ in Trinidad and Tobago. Beyond Digicel+, Logic, and C3 Pure Fiber in the Cayman Islands, and Amplia in Trinidad and Tobago all offered median download speeds approaching 100 Mbps. 

ISP Fiber Performance, Caribbean Markets
Speedtest Intelligence® | Q1 2024

Drive for broadband expansion puts leading Caribbean markets on par with the U.S. and Canada

Caribbean ISPs have made great strides in advancing the rollout of broadband services over the last four years. Ookla uses the network Consistency metric to gauge how prevalent acceptable broadband speeds are across a network, based on the percentage of Speedtest samples exceeding a threshold of 25 Mbps download and 3 Mbps upload performance. Cuba was rooted to the foot of the table based on Consistency, with just 4.0% of samples exceeding the threshold. Of the remaining Caribbean markets in this analysis, network Consistency climbed from 45.3% in Q1 2020 to 73.3% in Q1 2024.

The majority of Caribbean nations in this analysis recorded Consistency above 70% as of Q1 2024, with leading Caribbean nations such as Bermuda, Trinidad and Tobago, the Cayman Islands, Puerto Rico, and Barbados posting Consistency values approaching those of more advanced fixed markets in the Americas, such as the U.S. (89.8%) and Canada (88.7%).

Fixed Broadband Consistency Across Caribbean Markets
Speedtest Intelligence® | Q1 2024

This positive trajectory looks set to continue for many markets at the lower end of the scale too, as they look to catch up with their peers. The vast majority of those Caribbean markets recording less than 75% Consistency in Q1 2024, had increased their Consistency significantly over the past two years, led by Haiti, Sint Maarten, the British Virgin Islands and the Dominican Republic.

Change in Fixed Network Consistency, Select Caribbean Markets
Speedtest Intelligence® | Q1 2022 vs Q1 2024

Leading Caribbean markets face slowing Consistency growth and competition from non-traditional fixed ISPs

We see a mixed picture for leading Caribbean nations on further increases in network Consistency as they begin to approach other leading markets globally. Despite strong fixed broadband performance in many Caribbean markets, increases in network Consistency have been relatively static in some, including Bermuda, Aruba, and Grenada, which all saw network Consistency increase by less than 3 percentage points in the last two years. This indicates a tranche of users in these markets remain below the 25 Mbps download and 3 Mbps upload performance thresholds used in our measure of Consistency.

While growth will naturally slow as markets approach nationwide availability of fixed broadband services exceeding 25 Mbps download and 3 Mbps upload, operators in these markets need to zero in on locations where performance lags the rest of the market and identify root causes. For regulators, the priority may lie in encouraging the sunsetting of legacy fixed technologies, and facilitating the rollout and adoption of faster technologies such as fiber.

Change in Fixed Network Consistency, Leading Caribbean Markets
Speedtest Intelligence® | Q1 2022 vs Q1 2024

LEO satellite broadband is emerging as a viable home broadband alternative

We are beginning to see some alternative fixed broadband technologies make inroads within the Caribbean, following on the heels of their success in North America. While we see some instances of GEO and MEO satellite internet use across the Caribbean, the majority of satellite internet within the region, based on Speedtest samples, is from Starlink’s LEO service. Over the course of the last year (comparing Q1 2024 with Q1 2023), samples from Starlink among the markets in this analysis grew by 85.8%, and it continues to expand its service availability across Caribbean markets. According to its website, Starlink operates across a range of Caribbean markets, and of those included in this analysis, it is available in the Bahamas, Barbados, the Dominican Republic, Haiti, Jamaica, Puerto Rico, Trinidad and Tobago, and the U.S. Virgin Islands.

Starlink performed on par with, or faster than, the median download speed in each market it operated within, recording significant leads in the U.S. Virgin Islands and the Bahamas. However, Starlink does tend to lag the rest of the market on upload speeds and latency. While the cost of Starlink equipment and its subscriptions are often higher than for terrestrial broadband options, which will put it out of reach of some broadband users, it offers a viable alternative, especially in locations where legacy fixed broadband access is still prevalent, and where users prefer faster download performance.

Starlink Performance, Median Download Speed, Mbps
Speedtest Intelligence® | Q1 2024

With a range of cellular providers launching 5G across the Caribbean, we may begin to see 5G fixed-wireless (FWA) access begin to take root, as it has done in the U.S. Given the wide range of performance across the Caribbean, 5G FWA could offer users an uplift in speeds versus traditional fixed networks, and it will give cellular providers the opportunity to upsell home internet services to their existing mobile customer bases. While it’s still early days for these rival technologies, we’ll continue to monitor their progress and provide updates on the state of fixed broadband connectivity across the Caribbean. For more information about Ookla’s data and insights, please get in touch.

Ookla retains ownership of this article including all of the intellectual property rights, data, content graphs and analysis. This article may not be quoted, reproduced, distributed or published for any commercial purpose without prior consent. Members of the press and others using the findings in this article for non-commercial purposes are welcome to publicly share and link to report information with attribution to Ookla.

| December 12, 2024

Evaluating Mobile Network Performance Across Developing Markets in Eurasia

Eurasia’s mobile telecommunications landscape reflects a transition region, balancing urban-focused growth with efforts to extend connectivity into rural areas. While urban centers in these countries see high 4G coverage and improving data speeds, rural areas often need to catch up, a gap that mirrors challenges in other developing regions of Asia and Central Europe.

Map of Select Eurasian Markets showing population numbers

This report benchmarks the performance of top mobile providers—those with a sample share of 3% or more—in seven neighboring markets. It compares the median download and upload speeds and latency across all technologies, focusing on national-level performance and results in the two major cities within each selected country.
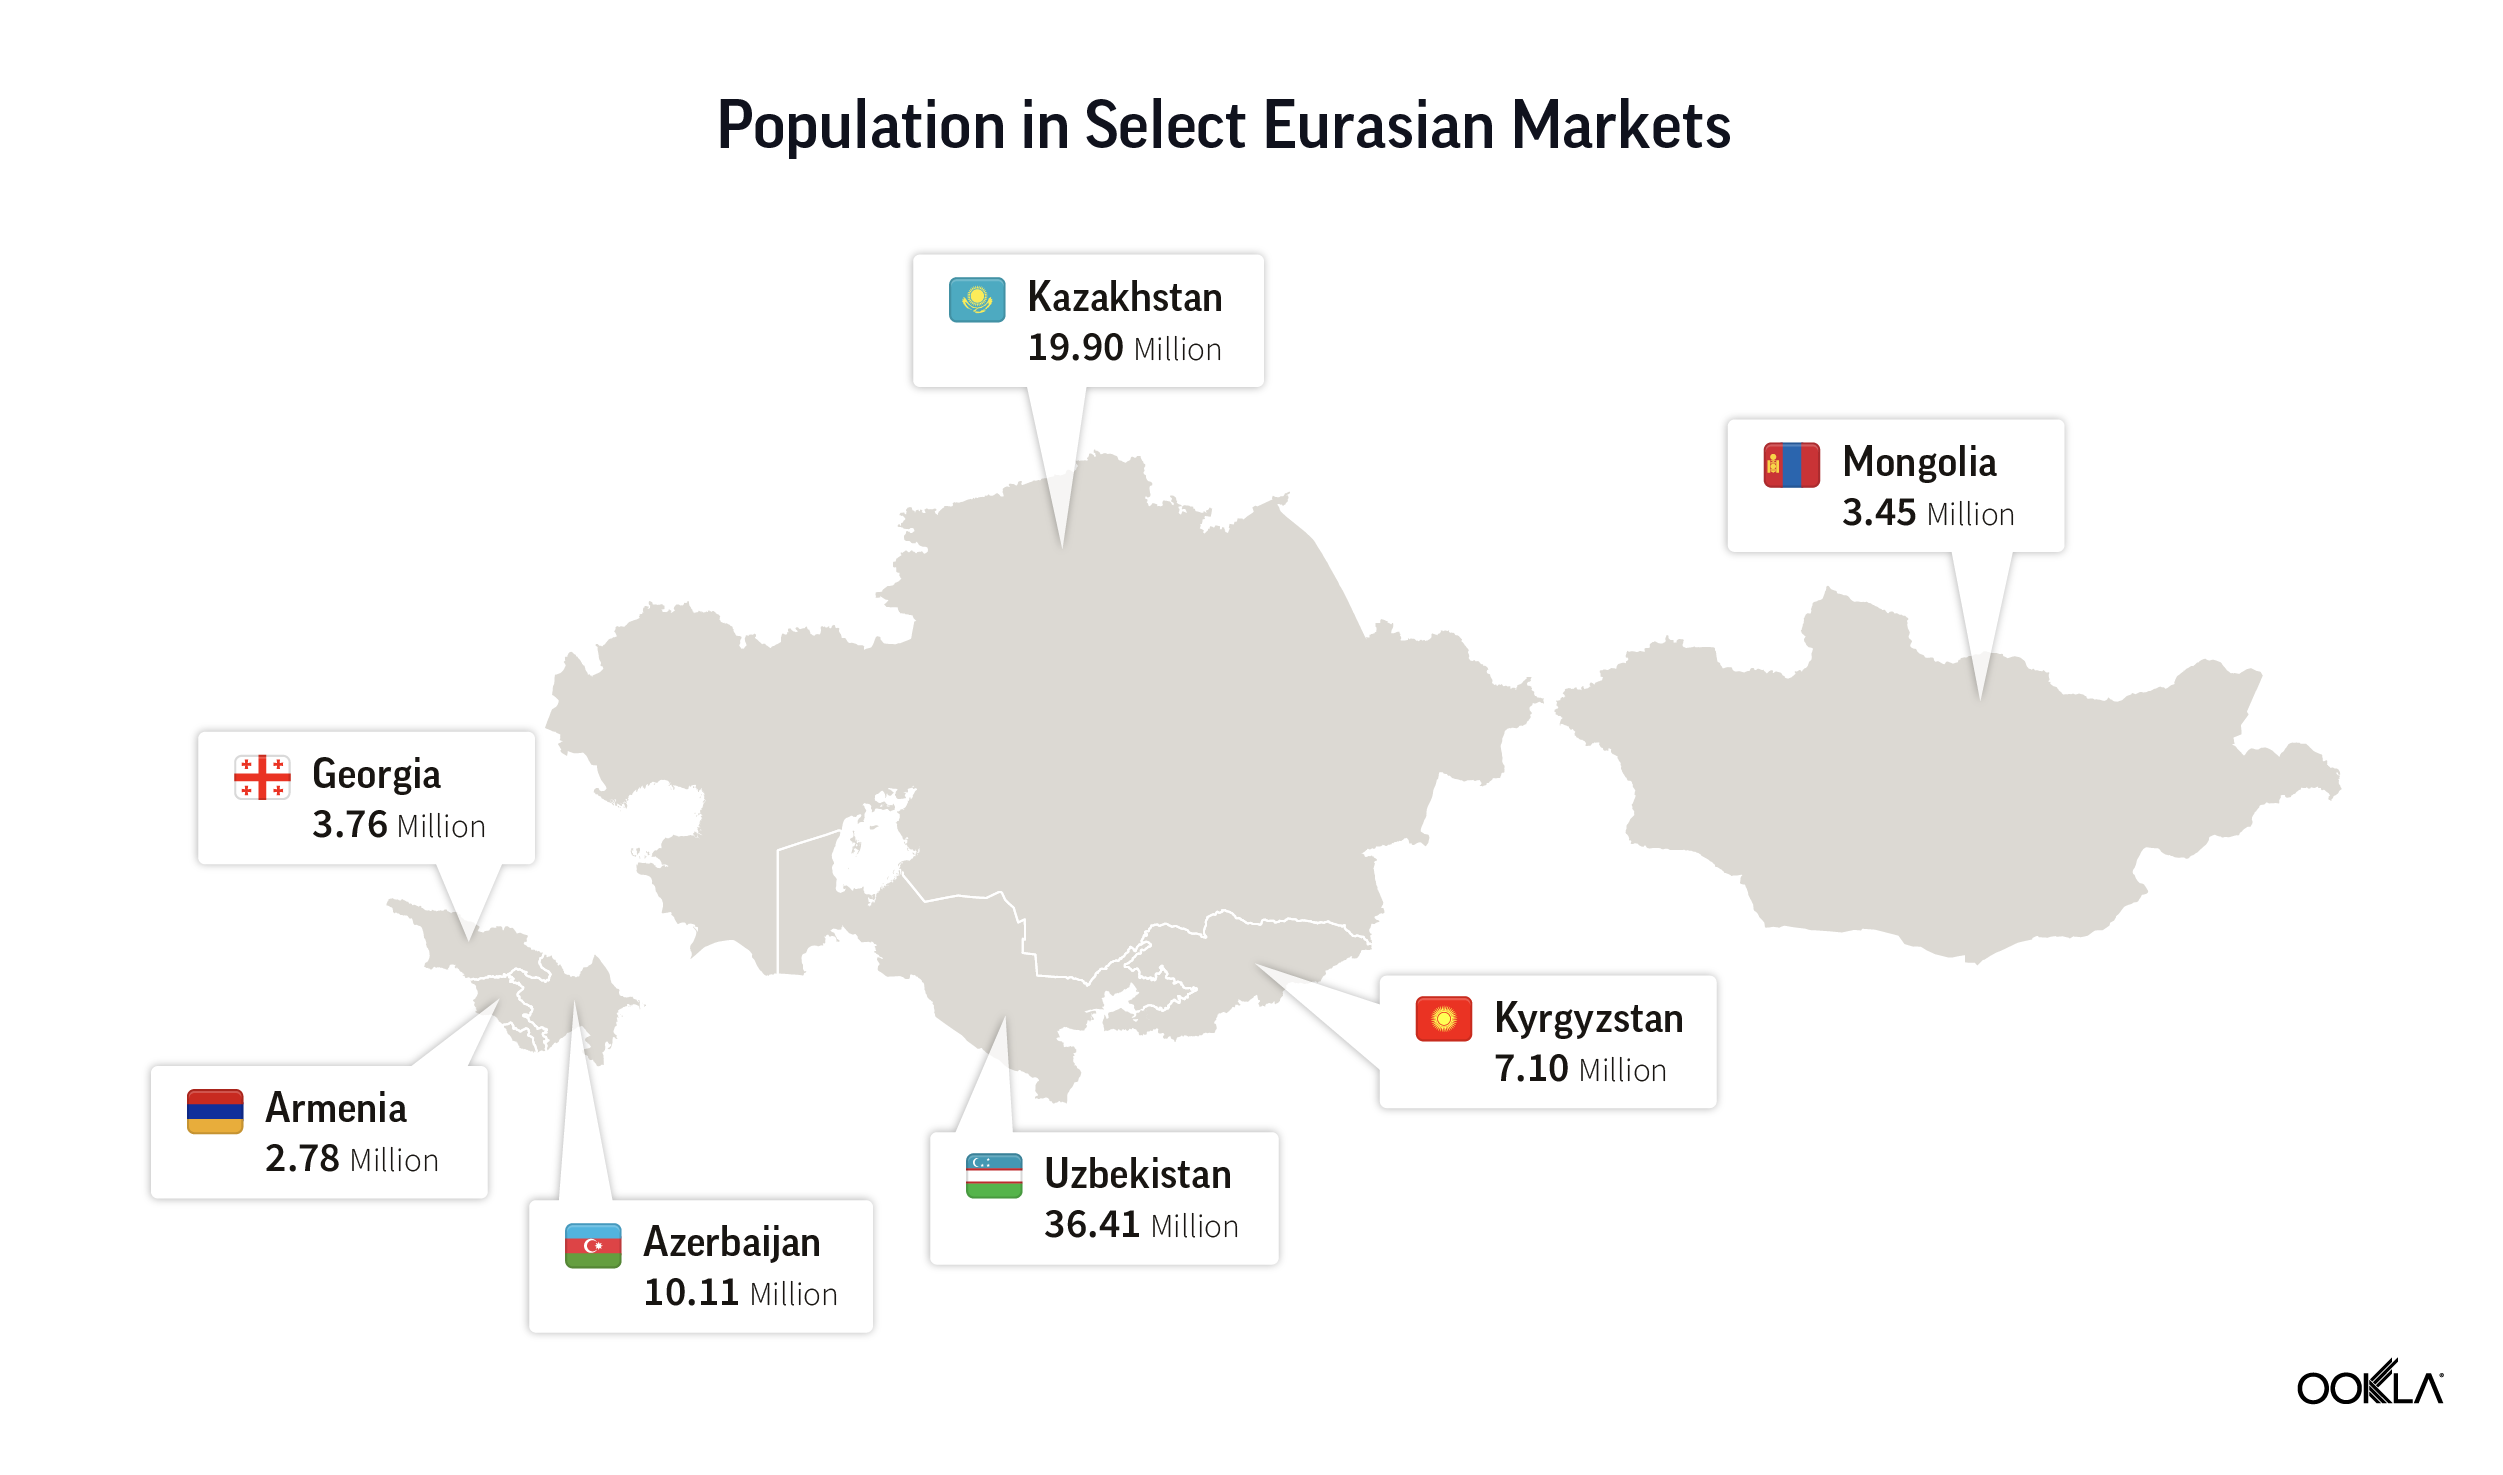
1. Armenia

2. Azerbaijan

3. Georgia

4. Kazakhstan

5. Kyrgyzstan

6. Mongolia

7. Uzbekistan

Video start time measures the seconds a user waits for a video to begin during the adaptive bitrate stage. Adaptive start failure rate shows the percentage of video samples that fail to start playback due to timeouts or other issues in this stage. Together, these metrics provide insights into the video streaming experience for users across different operators in each market.

With video content making up a large portion of global network traffic, it’s essential to understand the actual experience of customers when they watch videos over mobile connections. This report assesses video performance using Speedtest Intelligence video metrics, focusing on two key indicators: video start time and adaptive start failure rate. 

Markets in Eurasia showing continued performance improvements

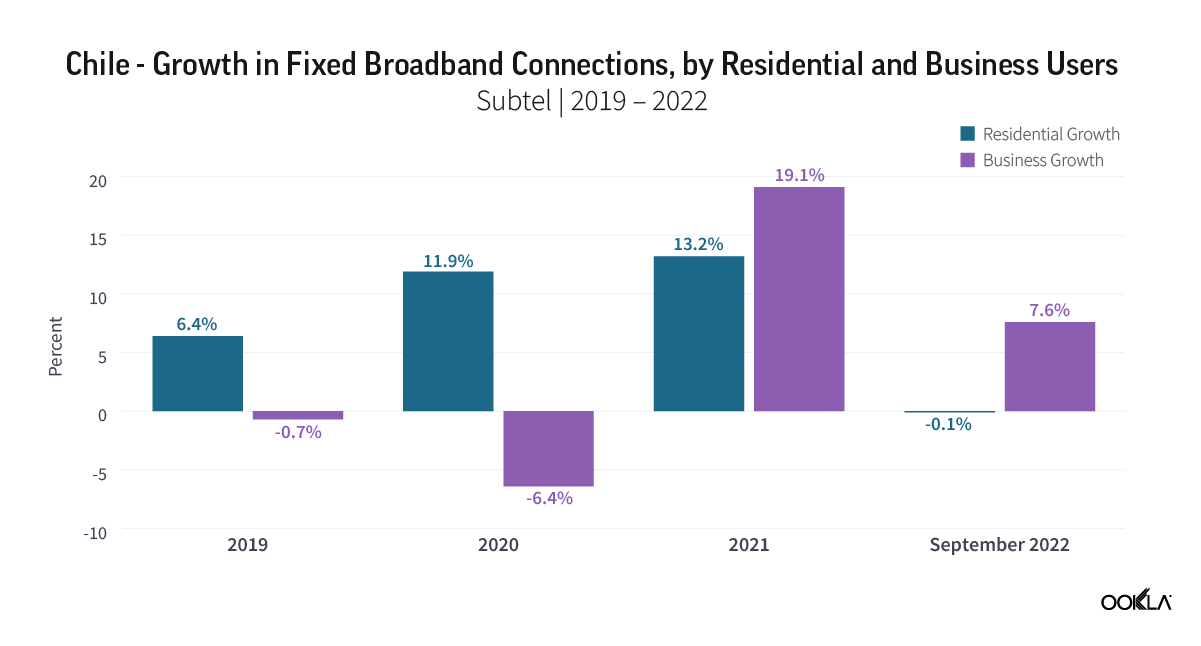
Speedtest Intelligence® quarterly data shows that the mobile median download and upload speeds for all technologies across all the selected markets, apart from Mongolia, have gradually improved between the period of Q4 2022 and Q3 2024.

Quarterly Performance Trend for Selected Eurasia Markets
Source: Speedtest Intelligence® | Q3 2022 – Q3 2024
Quarterly Network Performance, Select Eurasian Markets

Markets that have introduced 5G saw or are in the early stages of 5G deployment saw overall improvements in both median download and upload speeds. Azerbaijan tops median download speed in Q3 2024, increasing from 34.82 Mbps in Q4 2022 to 55.62 Mbps in Q3 2024, driven by consistent network upgrades. Kazakhstan also demonstrates strong improvement, rising from 22.44 Mbps to 46.63 Mbps during the same period, maintaining steady growth in urban and rural connectivity, and the expansion of 5G services. Kazakhstan became one of the first countries in Central Asia to commercially launch 5G, with Kcell and Tele2 leading the deployment of 5G base stations. After securing 100 MHz blocks in the 3.6–3.7 GHz and 3.7–3.8 GHz spectrum bands, both operators have actively expanded their networks across the country’s major cities. By June 2024, they had installed 1,144 base stations across 20 cities, with ongoing efforts to extend 5G coverage further.

Uzbekistan also showed notable progress, starting at 14.67 Mbps in Q4 2022 and reaching 38.96 Mbps by Q3 2024, reflecting increased investments in mobile infrastructure and early-stage 5G deployment by the operators. In Uzbekistan, the government and operators have made significant strides in enhancing mobile network performance. The Republican Telecommunications Management Center of Uzbekistan (RTMC), through its “Digital Uzbekistan 2030” initiative, has focused on improving digital connectivity nationwide. Alongside these efforts, operators have begun rolling out 5G networks, collectively driving progress in the country’s telecom sector and boosting overall network performance.

In contrast, Mongolia showed limited improvement in network performance, with median download speeds remaining around 17 Mbps over the same period. Despite a steady rise in 4G connections, increasing from 35.4% in Q4 2022 to 54.1% in Q3 2024 (GSMA Intelligence), the market continues to face challenges. As the least densely populated country in the world, with a significant portion of the population living a nomadic lifestyle, challenges include limited infrastructure investment and high network congestion in the main cities, which have hindered its growth compared to other countries in the region.

Overall, the improvement in performance across the region reflects ongoing investments in mobile networks, driven by rising consumer demand for faster internet and government efforts to expand connectivity. As operators deploy advanced technologies, including 5G rollouts in some markets, mobile performance is expected to continue improving, narrowing the performance gap with more developed regions.

Armenia

In Armenia, the primary mobile operators are Viva-MTS, Beeline, and Ucom. All three operators offer 4G coverage across major cities, with efforts underway through Armenia’s Public Services Regulatory Commission (PSRC) to expand 4G coverage of the three existing operators in 80% of the settlements within the next two years. Viva-MTS, the market leader, has made investments in network upgrades, focusing on increasing capacity in urban regions to address data traffic demand. Ucom has prioritized the modernization of its network to improve end-user performance and service availability, while at the same time introducing 5G services in selected cities.

Based on data from Speedtest Intelligence® during the first half of 2024, Viva-MTS and Ucom both recorded median download speeds that are nearly identical, each just above 34 Mbps. Viva-MTS also outpaced its rivals in upload speeds, achieving 14.77 Mbps, followed by Ucom at 12.14 Mbps and Telecom Armenia at 11.95 Mbps.

All Technologies Network Performance, Armenia
Speedtest Intelligence® | 1H 2024

When it comes to video quality of experience, Speedtest Intelligence reveals that Ucom had the fastest median adaptive start time for all mobile technologies combined in Armenia, at 1.38 seconds during 1H 2024, followed by Telecom Armenia CJSC at 1.55 seconds. Furthermore, Ucom reported a video start failure rate of just 2.9%, while Telecom Armenia CJSC and Viva-MTS experienced higher failure rates of 5.8% and 7.7%, respectively.

Video Experience By Mobile Operator, Armenia
Speedtest Intelligence® | 1H 2024

In Armenia’s main cities, Yerevan and Gyumri, Ucom leads in download speed, achieving the highest median download speed of 52.13 Mbps in Gyumri and 38.18 Mbps in the capital, Yerevan. Viva-MTS follows closely with 44.87 Mbps in Gyumri and 35.5 Mbps in Yerevan, while Telecom Armenia CJSC significantly lags behind in both cities, recording 25.74 Mbps in Gyumri and 21.11 Mbps in Yerevan.

For upload speeds, Viva-MTS leads in both cities, reaching 15.87 Mbps in Gyumri and 15.82 Mbps in Yerevan. Ucom performs slightly lower, with 12.63 Mbps in Gyumri and 14.65 Mbps in Yerevan, while Telecom.

All Technologies Mobile Operator's Performance In Major Cities, Armenia
Speedtest Intelligence® | 1H 2024

Azerbaijan

Azerbaijan’s mobile market is primarily served by three operators: Azercell, Bakcell, and Nar. Azercell, the largest operator, has actively expanded its 4G network, achieving a population coverage of 98.35% in urban and suburban areas. All three operators have initiated 5G services, with Azercell launching a 5G pilot zone in Baku’s Fountain Square, Bakcell introducing 5G trials in select locations, and Nar deploying 5G technology in Sumgait, marking the first 5G launch outside the capital. 

Bakcell leads in both median download and upload speeds during the first half of 2024, achieving 55.36 Mbps for downloads and 18.68 Mbps for uploads. Azercell follows with a download speed of 50.65 Mbps and an upload speed of 11.46 Mbps, while Nar lagged behind at 42.23 Mbps for downloads but performs comparatively better in uploads with 13.96 Mbps.

All Technologies Network Performance, Azerbaijan
Speedtest Intelligence® | 1H 2024

When it comes to video quality of experience, Speedtest Intelligence reveals that Bakcell provided the most reliable and fastest video streaming experience among the three operators. In terms of video adaptive start performance, Bakcell and Azercell show relatively similar adaptive start times, with 1.26 and 1.27 seconds, respectively, while Nar has a slightly slower start time at 1.35 seconds. 

Bakcell had the lowest video adaptive start failure rate at 3.7%, followed by Nar at 4.0%. Azercell showed the highest failure rate at 7.0%, suggesting that videos failed to start more often for its users compared to its competitors.

Video Experience By Mobile Operator, Azerbaijan
Speedtest Intelligence® | 1H 2024

In the capital city of Baku, Bakcell leads with a median download speed of 66.62 Mbps, outperforming Azercell’s download speed of 59.51 Mbps. In Ganja, Azercell slightly outperforms Bakcell in download speed at 53.24 Mbps compared to Bakcell’s 50.16 Mbps.

All Technologies Mobile Operator's Performance In Major Cities, Azerbaijan
Speedtest Intelligence® | 1H 2024

Georgia

In Georgia, Magti, Geocell (Silknet), and Cellfie (formerly Beeline) are the primary mobile network operators, driving competition in the telecom market. The market has been shaped by ongoing investments in network upgrades and a push towards next-generation connectivity. Data from Speedtest Intelligence® for the first half of 2024 highlights Geocell as the leader in median download speed, achieving a download speed of 50.20 Mbps. Magti followed with a median download speed of 40.50 Mbps and upload speed of 15.12 Mbps, maintaining a competitive position. Geocell also outperformed other operators in latency, recording the lowest median multi-server latency of 38 milliseconds, compared to Magti’s 40 ms.

Cellfie, formerly Beeline, lagged in both speed and latency metrics. However, its focus on network modernization and the targeted 5G rollouts may provide opportunities for improvement. The company has emphasized plans to enhance its infrastructure and leverage the benefits of 5G, which could help bridge the gap with its competitors.

All Technologies Network Performance, Georgia
Speedtest Intelligence® | 1H 2024

Magti reported the fastest video adaptive start time at 1.50 seconds, followed by Geocell at 1.75 seconds and Cellfie (formerly Beeline) at 2.02 seconds. Geocell achieved better reliability with the lowest video start failure rate of 3.1%, while Magti and Cellfie experienced higher failure rates of 5.1% and 6.1%, respectively

With 5G rollouts advancing in 2024, operators will look at leveraging higher bandwidth and lower latency to enhance user experiences and support the increasing use of video services in Georgia.

Video Experience By Mobile Operator, Georgia
Speedtest Intelligence® | 1H 2024

In the capital city of Tbilisi, Geocell achieved a median download speed of 57.5 Mbps, surpassing Magti’s 37.92 Mbps and Cellfie’s 25.11 Mbps. Both Geocell and Magti recorded almost similar upload speeds in the capital, at around 19 Mbps. In Batumi, Magti led with a median download speed of 33.08 Mbps, while Geocell followed at 23.31 Mbps.

All Technologies Mobile Operator's Performance In Major Cities, Georgia
Speedtest Intelligence® | 1H 2024

Kazakhstan

Kazakhstan’s mobile market is highly competitive, with the three main operators, Beeline, Kcell, and Tele2, driving much of the country’s telecommunications development, providing widespread mobile network coverage and achieving high penetration rates. The country was one of the first in Central Asia to commercially launch 5G, with Kcell and Tele2-Altel having been the primary drivers in the rollout of 5G technology within the market.

Tele2 was the fastest mobile provider in Kazakhstan, based on Speedtest Intelligence® data for all technologies combined during 1H2024, with a median download speed of 55.12 Mbps. Kcell followed with 48.70 Mbps, while Beeline lagged at 27.94 Mbps. Tele2 recorded a median upload speed of 17.16 Mbps and a latency of 39 ms.

All Technologies Network Performance, Kazakhstan
Speedtest Intelligence® | 1H 2024

When it comes to video quality of experience, Speedtest Intelligence reveals that Tele2 had the fastest median adaptive start time for all mobile technologies combined in Kazakhstan, at 2.03 seconds during 1H 2024. Kcell was close behind at 2.09 seconds. 

Video Experience By Mobile Operator, Kazakhstan
Speedtest Intelligence® | 1H 2024

In Astana, Tele2 demonstrated strong overall performance, leading in all three key metrics: a median download speed of 78.55 Mbps, upload speed of 24.89 Mbps, and multi-server latency of 31 ms. In Almaty, KCell had a slight edge in median download speed at 104.38 Mbps, closely followed by Tele2 at 102.99 Mbps, highlighting competitive performance between the two operators in the city. Beeline, which currently lacks 5G services, reported lower download speeds of 26.57 Mbps in Astana and 38.26 Mbps in Almaty.

All Technologies Mobile Operator's Performance In Major Cities, Kazakhstan
Speedtest Intelligence® | 1H 2024

Kyrgyzstan

Kyrgyzstan’s mobile telecommunications market is served by three main operators: MEGA, O!, and Beeline. The country’s mobile landscape reflects its geographic challenges, with mountainous terrain making rural connectivity a significant hurdle. Despite this, government support has enabled gradual progress. The State Communications Agency, which regulates the telecom sector, has actively worked on policies to encourage network investment and  bridging the urban-rural connectivity gap. The National Development Strategy of the Kyrgyz Republic 2018-2040 is one initiative that facilitates digital transformation to hasten the country’s economic development. Overall, Kyrgyzstan’s mobile network landscape shows steady growth, with operators competing on both speed and coverage.

Beeline edged the other operators in median download speed in Kyrgyzstan during the first half of 2024, achieving a median download speed of 34.99 Mbps, slightly  ahead of O! 33.18 Mbps, and MEGA at 30.29 Mbps. 

All Technologies Network Performance, Kyrgyzstan
Speedtest Intelligence® | 1H 2024

O! provided the best video experience in 1H 2024 among all the operators in the market, with median adaptive start time for all mobile technologies combined at 2.17 seconds and lowest adaptive start failure rate of 2.5%. O! was followed by Beeline with an adaptive start time of 2.48 seconds and MEGA with 2.64 seconds.

Video Experience By Mobile Operator, Kyrgyzstan
Speedtest Intelligence® | 1H 2024

In Kyrgyzstan’s main cities of Bishkek and Osh, Beeline reported a median download speed of 44.44 Mbps in Bishkek and 31.49 Mbps in Osh, a slight edge over both MEGA and O!. MEGA, however, led in upload speeds in Osh, with a speed of 18.3 Mbps.

All Technologies Mobile Operator's Performance In Major Cities, Kyrgyzstan
Speedtest Intelligence® | 1H 2024

Mongolia

There are five top operators in Mongolia; MobiCom, GMobile, Supernet, Unitel and Skytel, each aiming to expand 4G LTE coverage to meet the growing demand for mobile internet. The country’s challenging geography and low population density create barriers for network expansion, especially in rural areas, making urban-focused network performance crucial for operators.

Based on Speedtest Intelligence® data for all technologies combined during 1H2024, MobiCom leads with a median download speed at 17.92 Mbps, followed by GMobile at 15.33 Mbps, and SuperNet closely behind at 15.07 Mbps. MobiCom also led upload speeds, with 11.81 Mbps, ahead of Unitel and GMobile. When it comes to latency, GMobile and Skytel provide the lowest median latency at 42 ms and 43 ms.

All Technologies Network Performance, Mongolia
Speedtest Intelligence® | 1H 2024

MobiCom reported the fastest video adaptive start time at 1.74 seconds, followed by Unitel at 1.87 seconds and SuperNet) at 2.28 seconds. gmobile achieved better reliability with the lowest video start failure rate of 2.2%, followed by Unitel and Skytel, with failure rates of 4.5% and 7.7%, respectively.

Video Experience By Mobile Operator, Mongolia
Speedtest Intelligence® | 1H 2024

In the city of Erdenet, SuperNet leads with a substantial margin, achieving a median download speed of 35.69 Mbps. MobiCom follows with 16.24 Mbps, while other operators like GMobile (10.99 Mbps), Unitel (10.86 Mbps), and Skytel (13.26 Mbps) lag behind, indicating a considerable disparity in download performance across providers in this city. 

In Ulaanbaatar, the capital and most populous city, MobiCom shows the highest median download speed at 18.78 Mbps, followed by Unitel at 15.03 Mbps and GMobile at 13.87 Mbps. Skytel records the lowest performance in Ulaanbaatar with just 8.12 Mbps.

All Technologies Mobile Operator's Performance In Major Cities, Mongolia
Speedtest Intelligence® | 1H 2024

Uzbekistan

Uzbekistan has increased investments in mobile network infrastructure, supported by government incentives and growing competition among operators. In 2020, the country introduced the “Digital Uzbekistan 2030” strategy to accelerate digital transformation across industries. The Republican Telecommunications Management Center (RTMC), which oversees this initiative, has worked closely with operators to expand telecommunications infrastructure, improve service quality, and reduce the urban-rural connectivity gap. 

Uzbekistan’s mobile market is served by four major operators; Ucell, Uztelecom, Beeline Uzbekistan, and Mobiuz, with Ucell being the largest operator. Based on data from Speedtest Intelligence® during the first half of 2024, Ucell achieved the fastest median mobile download speed across all of the operators with a speed of 43.91 Mbps, followed by Uztelecom at 27.30 Mbps. Mobiuz followed closely with a reported speed of 26.79 Mbps. 

All Technologies Network Performance, Uzbekistan
Speedtest Intelligence® | 1H 2024

When it comes to video quality of experience, Speedtest Intelligence reveals that Beeline had the fastest median adaptive start time for all mobile technologies combined in Uzbekistan, at 1.8 seconds during 1H 2024, followed by Uztelecom at 1.99 seconds, and UCell at 2.12 seconds. Furthermore, Beeline reported a video start failure rate of 3.5%, while Uztelecom and Mobiuz experienced higher failure rates of 4.6% and 4.8%, respectively.

Video Experience By Mobile Operator, Uzbekistan
Speedtest Intelligence® | 1H 2024

In Uzbekistan’s two main cities, Samarkand and Tashkent, UCell led in median download speeds, achieving 83.12 Mbps in Samarkand and 83.36 Mbps in Tashkent. Uztelecom leads upload speed in Samarkand at 20.14 Mbps, while UCell ranks highest in Tashkent at 19.61 Mbps. UCell has the lowest latency in both cities, with 36 ms in Samarkand and 22 ms in Tashkent.

All Technologies Mobile Operator's Performance In Major Cities, Uzbekistan
Speedtest Intelligence® | 1H 2024

The mobile telecommunications landscape across Eurasia, particularly in Armenia, Azerbaijan, Georgia, Kazakhstan, Kyrgyzstan, Mongolia, and Uzbekistan, reveals varied network performance driven by differing levels of infrastructure investment, urban density, and regulatory initiatives.

Many operators in these countries face challenges, especially in rural and high-density urban areas where network congestion and limited infrastructure investment impact user experience. To address these gaps, several Eurasian governments are introducing policies to support 5G deployment, rural network expansion, and spectrum allocation, aiming to bridge connectivity disparities and support a growing digital economy. As these markets move towards 5G, continued regulatory support and investment in network infrastructure will be crucial to elevate service quality across the region, meeting the rising demand for fast and reliable mobile connectivity.

As operators in this region continue to modernize their networks, we are keeping a close eye on how the network deployments are progressing and the network performance end users experience. For more information about Speedtest Intelligence data and insights, please contact us.

Ookla retains ownership of this article including all of the intellectual property rights, data, content graphs and analysis. This article may not be quoted, reproduced, distributed or published for any commercial purpose without prior consent. Members of the press and others using the findings in this article for non-commercial purposes are welcome to publicly share and link to report information with attribution to Ookla.

| October 9, 2022

India's 5G Speeds Reach 500 Mbps

Ookla® recently commented on the outcome of the 5G spectrum auction and how Indian consumers are ready to upgrade to 5G networks. We now have data from Speedtest Intelligence® to show early 5G performance across select cities as well as an indication of the growth of the number of 5G-capable devices. 

Key messages:

  • 5G download speeds reach 500 Mbps on 5G test networks 
  • Almost 600 Mbps median download speed on Jio’s 5G network in Delhi 
  • Consumers are 5G ready 
  • iPhone users have most 5G-capable phones 

Airtel and Jio turned 5G on  

Prime Minister Narendra Modi launched 5G services in select Indian cities on Saturday, October 1 during India Mobile Congress 2022 in New Delhi. Operators took the opportunity to discuss their 5G plans at the event as well. Bharti Airtel’s chairman Sunil Bharti Mittal said 5G services would be available in eight cities: Delhi, Mumbai, Varanasi, Hyderabad, Siliguri, Chennai, Nagpur, and Bengaluru from the launch and will expand across India by March 2024. 

Reliance Jio, which shook up the Indian telecom industry when it launched 4G, also has ambitious 5G plans. Jio’s 5G beta trial “Jio True 5G for All” launched during Dussehra on October 5  in four Indian cities, including Delhi, Mumbai, Kolkata, and Varanasi. Jio has rolled out a 5G Standalone (5G SA) network, which doesn’t rely on its existing LTE network and which Jio justifies for using the “true 5G” name. Jio’s “welcome offer” is available to those that receive an invitation. Users can get unlimited 5G data with up to 1 Gbps speeds. Jio plans to gradually expand its 5G footprint to deliver the Jio 5G service across the entire country by December 2023. Jio also is looking to make the services “very affordable,” according to Reliance Jio chairman Akash Ambani during the IMC event. “it should be affordable for every Indian – right from devices to service.”

Despite financial woes, Vodafone India has also reiterated its commitment to the 5G roll-out but it has not yet provided specific timelines.

5G download speeds reach 500 Mbps on 5G test networks 

Speedtest Intelligence shows that operators have been testing their networks before the October 1 launch. We’ve already seen a wide range of 5G download speeds: from low double-digit (16.27 Mbps) to a mindblowing 809.94 Mbps, which points to the fact that the operators are still recalibrating their networks. We expect these speeds to be more stable moving forward as these networks will enter the commercial stage. 

5G download speed distribution among select cities in India

Jio’s 5G network showed almost 600 Mbps median download speed in Delhi 

We used Speedtest® data to compare median 5G download speeds across four cities both Jio and Airtel built their networks. In the capital city, Delhi, Airtel reached nearly 200 Mbps median download speed at 197.98 Mbps while Jio almost broke 600 Mbps (598.58 Mbps) since June 2022. 

In Kolkata, operators’ median download speeds varied the most since June 2022: Airtel’s median download speed was 33.83 Mbps while Jio had a much faster median download speed at 482.02 Mbps. 

In Mumbai, one of the most densely populated cities in India, Airtel fell behind Jio once again, reaching 271.07 Mbps median download speed compared to Jio’s 515.38 Mbps median download since June 2022.

In Varanasi, which is considered the Hindu spiritual capital of India, Jio and Airtel achieved closer parity, with Airtel achieving a 5G median download speed at 516.57 Mbps to Jio’s 485.22 Mbps median download speed since June 2022.

The future of mobile internet in India will be much faster than what 4G LTE is achieving

According to the Speedtest Global Index™, India ranked 117th in the world for mobile download speed at 13.52 Mbps in August 2022. These new 5G results show that 5G speeds are far superior than India’s existing network. 

While we need to approach these early results with caution, 5G devices are already showing they can achieve much faster speeds, at least under artificial controlled testing circumstances e.g., no network congestion and ideal network coverage.

chart of median 5g download speeds among select cities in India, top providers

When we cross reference operators’ 5G speeds versus the frequency band they are using, we see a cautionary tale. During the recent spectrum auction, Jio acquired the most spectrum, especially in the highly sought-after C-band spectrum, and Jio was the only operator that acquired the 700 MHz band. This gives Reliance Jio an advantage compared to providers who have acquired only C-band, especially since the low-band spectrum allows for better indoor signal penetration in urban areas and also better coverage in rural areas.

Using Speedtest Intelligence data we can see that Jio’s 5G performance differs depending on the spectrum band it uses. Jio’s 5G network using the C-band (n=78) results in performance ranging between 606.53 Mbps and 875.26 Mbps median download speed. While 5G networks using the lower – 700 MHz frequency band (n=28) so-called coverage band, gives speeds lower than100 Mbps median download speed, ranging between 78.69 Mbps and 95.13 Mbps. Airtel, on the other hand, achieved speeds from 365.48 Mbps to 716.85 Mbps deploying 5G utilizing only its C-band spectrum holding.

chart of median download speed by spectrum band among select cities in India

Consumers are 5G ready 

Earlier this year, we surveyed Indian consumers and found 89% of Indian smartphone users are ready to upgrade to 5G. Operators have an existing addressable base of devices that they can target from the start, and over the past year the number of 5G-capable devices has been on the rise. Among Speedtest users, Jio saw the largest increase in 5G-capable devices (67.4%), followed by Airtel (61.6%), and Vi India (56%). 

Chart of 5g-capable devices by providers, year on year growth

Using Speedtest Intelligence data we compared 5G-capable devices across different cities. Hyderabad was the one city where all operators have seen significant growth in terms of 5G-capable devices, with Jio even tripling its install base.

chart of 5g-capable devices in major cities by top providers, year on year growth

iPhone users have most 5G-capable phones 

In our survey, 51% of survey respondents already had smartphones supporting 5G. The top smartphone vendors in the market are Samsung (31%), followed by Xiaomi (23%), Realme, and Vivo. While only one in ten survey respondents had an iPhone, Apple smartphones tend to be more 5G capable. In fact, according to Speedtest Intelligence data, the iPhone 12 5G is the most popular 5G-capable device in the Indian market. Jio will launch an Android-based 5G phone in partnership with Google in 2023, repeating the go-to-market strategy it used when entering the 4G market. In the meantime, Jio is working with smartphone vendors to ensure that consumers can access its 5G SA network. 

These are still early days for 5G in India, with most of Jio’s and Airtel’s respective networks still in beta testing. We will continue to monitor 5G performance in India, see how operators scale networks, and assess the real-world performance as more consumers will get online with 5G devices. If you want to learn more, subscribe to Ookla Research™ to be the first to read our analyses.

Ookla retains ownership of this article including all of the intellectual property rights, data, content graphs and analysis. This article may not be quoted, reproduced, distributed or published for any commercial purpose without prior consent. Members of the press and others using the findings in this article for non-commercial purposes are welcome to publicly share and link to report information with attribution to Ookla.