Despite challenging terrain and low population density, the 49th state is making big strides when it comes to bridging the digital divide.
With its enormous size, diverse terrain, and frozen ground, Alaska is a massive logistical nightmare when it comes to delivering broadband to its residents. Much of the state is covered by permafrost, making it nearly impossible to dig a trench for fiber-optic cables and many communities are on islands, such as the Aleutian Chain, or separated by river deltas. Connecting these communities requires miles of subsea fiber-optic cables, which are expensive to install and difficult to repair.
Slow but steady progress
Alaska ranks last in Ookla’s 2H 2025 50 U.S. States Broadband Speed Performance Report that classifies the 50 U.S. states and the District of Columbia by the percentage of Speedtest users that achieve the Federal Communication Commission’s (FCC) minimum broadband speeds of 100 Mbps download and 20 Mbps upload speeds. In the second half of 2025 only 47.1% of Speedtest users in Alaska were able to get 100/20 Mbps speeds. However, the state has made a lot of progress. In the first half of 2024, just 35.4% of Speedtest users were able to get the FCC’s minimum speed threshold.
Alaska’s urban/rural divide has also changed over time. In the second half of 2024 the state delivered the FCC’s minimum standard for broadband to 38.7% of its urban population and to just 15.8% of its rural population. However, a year later it had increased that to 45.2% of its urban population and 24.9% of its rural population and effectively reduced its digital divide from 22.9 percentage points in the second half of 2024 to 20.4 percentage points in the second half of 2025.
$1.2B in BEAD funding
Alaska is set to receive approximately $1.2 billion in funding from the federal government’s Broadband Equity, Access and Deployment (BEAD) program. According to Alaska’s Broadband office, the state has awarded about $629 million for 29 broadband projects.
That initial award is intended to connect 44,734 underserved or unserved locations across Alaska. Because of the state’s unique geography, Alaska will use a mix of technologies to deliver broadband to those locations. Approximately 24,500 of the funded locations will receive high-speed fiber from 13 different providers including Matanuska Telecom Association, Alaska Communications and GCI Communication. In addition, 14,400 locations will be served with SpaceX’s Starlink low-Earth orbit (LEO) satellite service. The remaining 5,800 locations will be reached using fixed wireless and hybrid systems from Alaska Communications, SPITwSPOTs and Bristol Bay Telephone.
GCI’s commitment to bridging the digital divide
GCI has been provisionally awarded $120 million in funding from the BEAD program to expand high-speed service to 18 communities, including Anchorage, Eagle River, and several remote areas in Western Alaska. GCI has committed to delivering fiber to 3,200 locations in Alaska with its funding.
Part of GCI’s BEAD funding is going to Alaska Connect, a multi-billion dollar program with a goal to ensure every Alaskan has access to the FCC’s minimum broadband speeds of 100/20 Mbps.
GCI plays a key role in Alaska Connect and recently revealed that it has completed Phase 1 of the AIRRAQ Network, a multi-million dollar fiber and microwave network that the company is building in conjunction with the Bethel Native Corporation. The goal is to bring 2.5 Gbps speeds to some of the most remote villages in Alaska. Phase 1 of the program delivers fiber to five communities: Bethel, Platinum, Eek, Napaskiak, and Oscarville.
To complete Phase 1, engineers had to deploy fiber on frozen tundra and use specialized vehicles to avoid damaging the delicate summer tundra. Engineers also had to deploy large portions of cable along the floor of the Kuskokwim River and the Bering Sea.
Aleutians Fiber project reaches final phase
Besides the BEAD-funded Alaska Connect project, GCI is in the final stretch of its Aleutians Fiber project — an 800-mile subsea fiber project that was started in 2021. Unlike the AIRRAQ Network, the Aleutian Fiber project is a public-private partnership that gets its funding from a combination of grants and private funding. The grants include a $25 million grant awarded in 2021 from the USDA’s ReConnect Program, more than $70 million in funding from the NTIA’s Tribal Broadband Connectivity Program, and $50 million from GCI.
Aside from fiber and microwave, GCI also is updating its HFC to DOCSIS 4.0 so it can deliver multi-gig speeds to urban centers such as Anchorage and Fairbanks.
GCI isn’t the only broadband provider in Alaska to use its BEAD funding to improve its speeds and footprint. Matanuska Telecom Association (MTA), a telecom cooperative in Alaska that serves over 33,000 members, received $108.6 million in BEAD funding to deliver fiber to 10,000 locations in Alaska.
In addition, Alaska Communications is committed to delivering fiber to 5,100 locations and fixed wireless access (FWA) to 4,000 sites with its $123.3 million in BEAD funding.
GCI currently towers over its competitors in both median upload and download speeds and consistently delivers speeds that far surpass the FCC’s minimum requirement for broadband of 100 Mbps download speeds and 20 Mbps upload speeds. According to Ookla Speedtest Intelligence data, GCI’s median download speeds ranged from 378.55 Mbps in March 2025 to 431.98 Mbps in March 2026 and its median upload speeds ranged from 37.13 Mbps in March 2025 to 40.12 Mbps in March 2026.
Alaska Broadband Providers' Network Performance
Ookla Speedtest data |March 2025 – March 2026
Starlink fills the gap
Starlink is another broadband contender. According to ConnectedNation’s BEAD tracker, Starlink’s parent company SpaceX is slated to provide broadband service to 14,400 locations where regulators believe satellite will be more effective.
According to Speedtest data, Starlink increased the percentage of speedtest users in Alaska that are able to get the FCC’s minimum broadband speeds of 100/20 Mbps from 4.35% in the first half of 2025 to 15.9% in the second half of 2025. This increase reflects Starlink’s expansion of its satellite constellation and its investment in its network.
More of Starlink’s rural users are able to get the FCC’s minimum broadband speeds of 100/20 Mbps than its urban users. In the second half of 2025 16.8% of Starlink users in rural Alaska were able to get broadband speeds of 100/20 Mbps compared to just 12.3% of urban users.
According to Ookla Speedtest Intelligence data, Starlink’s median download speeds rose from 73.5 Mbps in March 2025 to 108.5 Mbps in March 2026, and its median upload speeds ranged from 10.7 Mbps in March 2025 to 17.1 Mbps in March 2026.
No longer out of reach
Although Alaska still faces the most challenging terrain in the country for delivering broadband connectivity to its residents, the needle is moving. A combination of BEAD funding, state initiatives, and private investment is beginning to improve the chances for thousands of Alaskans to get broadband connectivity.
While Alaska remains at the bottom of Ookla’s U.S. state broadband speed rankings as of the 2H of 2025, its numbers are on the rise, proving that remote life doesn’t necessarily mean digital isolation.
For more information about Speedtest Intelligence data and insights, subscribe to Ookla Research updates.
Ookla retains ownership of this article including all of the intellectual property rights, data, content graphs and analysis. This article may not be quoted, reproduced, distributed or published for any commercial purpose without prior consent. Members of the press and others using the findings in this article for non-commercial purposes are welcome to publicly share and link to report information with attribution to Ookla.
Sue Marek is Ookla’s editorial director and part of the company’s analyst team. She oversees the company’s thought leadership and editorial content. Sue is a journalist with more than 30 years of experience covering the telecom industry and her work has appeared in Fierce Network, Light Reading, and SDxCentral. She is a frequent speaker at industry events and has moderated panels at Mobile World Las Vegas, Connect(x), the Consumer Electronics Show, the Competitive Carriers’ Show and 5G North America. Sue has a B.S. in journalism from the University of Colorado.
High-speed Wi-Fi has become a necessity for guest satisfaction in the hospitality sector. Network capacity is tested most intensely in Mecca and Medina during the Hajj season. Millions of pilgrims are expected to arrive in Saudi Arabia in May 2026, so demand for reliable internet access in hotels will peak. Whether a pilgrim is video-calling family back home or streaming religious lectures, this article offers insights into Wi-Fi performance across key luxury hotels in the two Holy Cities using Speedtest Intelligence® data. It also explores how hoteliers can optimize their networks to handle peak-season demand.
Key Takeaways:
Only a few luxury hotels in Mecca and Medina offer very fast Wi-Fi. Three of the 16 properties reviewed achieved a median download speed of over 100 Mbps during the year ending in February 2026. Properties like Swissôtel Makkah and Fairmont Hotel topped the charts with median speeds of 152.17 Mbps and 148.87 Mbps, respectively.
Remaining hotels show a tiered performance gap ranging from high to lagging. The rest of the properties fall into three tiers: High Performers (50-100 Mbps), like Pullman ZamZam, Standard Performers (15-50 Mbps), which might struggle during peak hours, and Performance Laggards (< 15 Mbps), where heavy pilgrim traffic will likely cause buffering and dropped video calls, potentially leading to turning off the Wi-Fi and reverting to cellular connectivity.
High median speeds mask significant performance inconsistencies for individual guests. Data show that even at top-performing properties, the bottom 10% of user speeds frequently plummets below 15 Mbps. That means a sizeable number of visitors might experience connectivity issues despite the network’s overall high quality, potentially failing to meet the standards expected of a luxury hospitality establishment.
The fastest hotels use modern hardware and more efficient spectrum bands. Top-performing hotels rely on Wi-Fi 6 and the 5 GHz band, giving them major speed advantages over older standards. In contrast, hotels that continue to rely on outdated equipment and the 2.4 GHz spectrum band face bottlenecks that hinder their overall performance.
Wi-Fi is only as fast as its weakest link. If a hotel’s inbound ISP connection is inadequate, the Wi-Fi network is misconfigured, or the IT department implements aggressive speed caps to manage costs, then deploying new Wi-Fi 6 access points operating on the 5 GHz spectrum will not help. Instead, hotel operators should adopt a data-driven strategy to troubleshoot performance bottlenecks, prioritize remedies, invest in the right solutions, and validate them.
Hajj brings unique challenges for indoor connectivity
Hajj is one of the world’s largest annual religious gatherings, posing a unique challenge to telecom networks as visitors converge on Mecca and Medina. According to Saudi Arabia’s General Authority for Statistics, over 1.6 million pilgrims performed Hajj in 2025. Looking ahead, the Saudi Vision 2030 aims to eventually host 30 million pilgrims annually (including Hajj), a goal that requires continuous improvement of the country’s physical and digital infrastructure.
Saudi Arabia’s telecom regulator, the Communications, Space & Technology Commission (CST), reported that during Hajj 2025, mobile users consumed an average of about 1.26 GB of data per person per day at the holy sites—nearly three times the global average. This represents a significant jump from the Hajj 2024 season, which saw an average of 876 MB of daily internet usage per user.
To handle this surge in data usage, telecom operators and local authorities have invested heavily in infrastructure. To complement the near-universal 4G and 5G cellular coverage and enable traffic offloading during peak times, operators deployed more than 10,500 Wi-Fi access points across Mecca, Medina, and the sites of Mina, Arafat, and Muzdalifah.
Beyond access to roaming, pilgrims need Wi-Fi networks to keep in touch with family and relatives, and to document their journey. They also need connectivity to access digital services, such as the “Hajj Smart ID” and the “Holodoctor” telemedicine service. Consequently, returning to fast, reliable Wi-Fi at their hotel is important for pilgrims to support these daily digital activities and recharge after an exhausting day.
What pilgrims can expect at their hotels during this year’s Hajj season?
Based on an industry survey, 56% of hotel guests in the USA expected hotels to offer Wi-Fi speeds of at least 50 Mbps for the service to be acceptable, and nearly one-third believe hotels should offer 100 Mbps per room. In the broader MENA luxury hotel market, only about half of the reviewed hotels meet the 50 Mbps threshold, indicating that poor Wi-Fi is often a local network issue, rather than a broadband capacity issue.
As the luxury hospitality sector is booming in Saudi Arabia, the quality of Wi-Fi can be a decisive factor in pilgrims’ decisions to select a property over another in a highly competitive market. According to another survey conducted in the USA, 74% of panelists believe that Wi-Fi quality is important to attract guests and maintain their loyalty. That means that poor Wi-Fi can negatively impact guest experiences, review scores, and occupancy rates.
For this analysis, we used Speedtest Intelligence® to analyze Wi-Fi’s median download speed in selected 16 luxury hotels across Mecca (12) and Medina (four). The data was based on samples collected over 12 months from February 2025 to February 2026. This period helps us gauge the Wi-Fi network’s performance and stability across different levels of hotel occupancy and data usage profiles. We excluded hotels with low measurement sample counts and considered only the most common Wi-Fi network provided by each hotel, which is usually freely accessible to guests.
The data shows wide variance in Wi-Fi performance across hotels, which can be segmented into four distinct performance tiers:
Top performers (> 100 Mbps): These properties have excellent Wi-Fi speeds, easily supporting multiple devices and seamless video conferencing for thousands of guests simultaneously. All hotels in this tier are located in Mecca, specifically at the ultra-luxury Makkah Clock Royal Tower, including Swissôtel Makkah (152.17 Mbps), Fairmont Hotel (148.87 Mbps), and Swissôtel Al Maqam (124.47 Mbps).
High Performers (50 – 100 Mbps): These networks are robust and reliable, providing a seamless digital experience for pilgrims. They include Pullman ZamZam in Mecca (96.80 Mbps) and Anwar Al Madinah Mövenpick Hotel in Medina (78.42 Mbps).
Standard Performers (15 Mbps – 50 Mbps): These hotels provide sufficient connectivity for checking email, browsing, using apps, and high-definition video calling. They may, however, struggle during peak evening hours. They include Al Ghufran Safwah Hotel Makkah (37.92 Mbps), Pullman Zamzam Madina (29.69 Mbps), Hyatt Regency Makkah – Jabal Omar (23.02 Mbps), and Millennium Al Aqeeq Hotel (18.22 Mbps)
Performance Laggards (< 15 Mbps): Wi-Fi networks likely struggle under the constraints of thousands of pilgrims, leading to dropped video calls, sluggish browsing, and significant buffering. This category includes the largest number of hotels (seven), prominently Mecca-based properties, ranging from Hilton Makkah Convention Hotel (4.95 Mbps) to Anjum Hotel Makkah (10.51 Mbps).
Wi-Fi Median Download Speed, Select 5 Star Hotels, Mecca and Medina
Source: Speedtest Intelligence® | February 2025 – February 2026
Wi-Fi Median Download Speed, Select 5 Star Hotels, Mecca and Medina
Mecca handles far more pilgrims than Medina, and as a result, its hotels’ Wi-Fi networks are expected to deal with much more footfall and traffic than those in Medina during the Hajj pilgrimage. Despite the expected greater network stress, Mecca houses both the fastest premium hotel networks and the slowest. In Medina, network performance variations are not as extreme, with observed download speeds falling between 9.33 Mbps and 85.4 Mbps. However, networks there offer more responsive service with a consistently lower multi-server latency than those in Mecca.
Most hotels in this analysis operate as premium international luxury brands. Still, the performance difference between a 5-star Swissôtel (152.17 Mbps) and a 5-star Hilton Makkah Convention Hotel (4.95 Mbps) is massive. This shows that while luxury brands offer consistent levels of traditional hospitality, their local IT infrastructure investments and bandwidth are highly inconsistent and may fall below guests’ expectations.
Hotels with the highest guest density (based on the number of rooms and Speedtest samples) were expected to experience network congestion and slower speeds; however, that was not the case for most hotels in this analysis. The hotels that accommodated the largest crowds, such as the Swissôtel Makkah and Fairmont Hotel at the Makkah Clock Royal Tower, delivered the fastest connectivity. This indicates that these venues have invested in robust, enterprise-grade infrastructure designed to support massive traffic spikes. A notable outlier is Anjum Hotel in Mecca, which boasts more than 1,700 rooms, yet the median download speed did not exceed 11 Mbps. Similarly, hotels with fewer rooms (and generally lower sample counts) frequently struggled to achieve speeds above 15 Mbps, suggesting capacity limitations or in-building connectivity issues.
Wi-Fi Performance by Number of Rooms, Select 5 Star Hotels, Mecca and Medina
Source: Speedtest Intelligence® | February 2025 – February 2026
Wi-Fi Performance by Number of Rooms, Select 5 Star Hotels, Mecca and Medina
Median speeds hide the reality of inconsistent connectivity in hotels
Relying solely on median performance can obscure the true guest experience. Median speeds represent the middle ground, but they do not account for the dead zones, peak-hour slowdown periods that occur throughout a large hotel property. Depending on the season, the time of day, or a guest’s location within the building, network performance can fluctuate wildly and fall well below the standards expected from a luxury hospitality brand.
This becomes clear when comparing the median download speeds against the 10th percentile (P10) speeds, which represent the worst 10% of network samples, for the top five hotels that achieved medians above 50 Mbps. For example, Swissôtel Makkah and the Fairmont Hotel have high medians of 152.17 Mbps and 148.87 Mbps, respectively, but their P10 speeds crash to 9.47 Mbps and 9.82 Mbps. The gap is worse at the Anwar Al Madinah Mövenpick Hotel; despite being a “High Performer” with a median download speed of 78.42 Mbps, its P10 speed falls to a sluggish 3.86 Mbps.
Median and 10th Percentile Download Speeds, Selected 5 Star Hotels, Mecca and Medina
Source: Speedtest Intelligence® | February 2025 – February 2026
Median and 10th Percentile Download Speeds, Selected 5 Star Hotels, Mecca and Medina
These discrepancies indicate that even within the highest-performing networks, at least one in ten guests is stuck with speeds under 15 Mbps. Whether this is due to guests retreating to corner rooms where the signal degrades, or evening network congestion when thousands of pilgrims simultaneously return from the holy sites, the quality of connection is not uniform.
Inconsistent performance is more than an inconvenience; it is a failure to deliver on the luxury brand promise. High-speed Wi-Fi consistently tops the list of what travelers look for when booking. Beyond guest experience, Wi-Fi connectivity powers different systems of any high-end property, from digital keys and mobile check-ins to POS (Point of Sale) terminals. When the network fails under the weight of hundreds or thousands of pilgrims, key hotel processes might stop working, leaving the guests more frustrated.
Looking at the bigger picture, network reliability is a matter of national competition. International organizations, such as the OECD and the United Nations World Tourism Organization (UNWTO), have highlighted how digitalization and connectivity infrastructure are critical enablers of tourism competitiveness and how they can help attract high-spending tourists. For Saudi Arabia, providing seamless connectivity during the Hajj is about more than just keeping guest reviews positive. It is a requirement for the national tourism strategy that aims to compete globally.
Why do some hotels outperform others?
Beyond the physical architecture of the hotels and the size of the properties, differences in underlying network infrastructure explain the huge performance gaps between the hotels. Delivering reliable Wi-Fi during the Hajj season requires balancing capacity, modern technology standards, and good spectrum management.
Backhaul capacity: The total bandwidth purchased from the ISP sets the maximum speed a guest can experience, regardless of the access technology. For top-performing hotels to push past 100 Mbps when serving hundreds (or even thousands) of guests simultaneously means that they have invested in Gigabit fiber backhaul connections. In fact, a few leading properties have more than one backhaul connection to balance the traffic load and improve resilience. Conversely, properties achieving sub-15 Mbps speeds are likely constrained by insufficient bandwidth and legacy copper wiring, which limits their maximum achievable speeds.
Wi-Fi standard: The generation of wireless technology deployed in the hotel’s lobbies and rooms defines how well it can deliver high capacity from the backhaul connection to the many concurrent users. Modern standards not only increase throughput per connected device but also support more simultaneous devices with more stable connections in higher-density environments than legacy standards.
Performing properties tend to support more recent wireless standards, such as Wi-Fi 6 (802.11ax) and, to a lesser extent, Wi-Fi 5 (802.11ac). Among leading hotels, 77.8% of test samples used Wi-Fi 6 in this category, delivering a median download speed exceeding 155 Mbps, compared to 1.9% using Wi-Fi 4, which still delivered a respectable median download speed of 83.22 Mbps, suggesting an excellent Wi-Fi setup and fast backhaul connections.
Underperforming hotels tend to support Wi-Fi 4 (802.11n) and, to a lesser extent, Wi-Fi 5. Hotels in the ‘Standard Performers’ tier, where 70.5% of test samples rely on Wi-Fi 4 technology, appear to be bogged down by the use of legacy hardware, achieving a median download speed of sub-30 Mbps.
Furthermore, nearly 40% of test samples collected within hotels in the “Performance Laggards” category reported using the Wi-Fi 6 standard. Still, their median download speed did not exceed 10 Mbps, suggesting limited backhaul capacity or speed caps to support the large number of guests. Since these hotels have already deployed APs compatible with Wi-Fi 5 and Wi-Fi 6, they can rapidly improve their rankings by boosting inbound capacity and applying less restrictive bandwidth management policies.
Sample Distribution by Wi-Fi Standard per Hotels’ Performance Category
Source: Speedtest Intelligence® | February 2025 – February 2026
Sample Distribution by Wi-Fi Standard per Hotels’ Performance Category
Median Download Speed by Wi-Fi Standard per Hotels’ Performance Category
Source: Speedtest Intelligence® | February 2025 – February 2026
Median Download Speed by Wi-Fi Standard per Hotels’ Performance Category
Frequency bands: Hotel Wi-Fi networks typically broadcast on two primary bands: 2.4 GHz and 5 GHz. The legacy 2.4 GHz band provides excellent range and can penetrate thick hotel walls, but it operates on narrow channels that are highly susceptible to interference and congestion. On the other hand, the 5 GHz band offers much wider channels, providing faster data transfer rates and less interference, but it operates at a shorter range. To achieve the 100+ Mbps speeds, hotel networks should effectively utilize the 5 GHz spectrum.
The adoption of the 5 GHz band is high across all tiers, but its potential is most visible in the upper tiers. 5 GHz usage is near-ubiquitous at 96.8% among top-performing hotels, and it delivers a median download speed of 150.47 Mbps. This is nearly a 10-fold increase over the 2.4 GHz band in the same hotel category, demonstrating that when the network is properly provisioned, 5 GHz is key to a great guest experience. It is also worth noting that better-performing hotels may deploy more APs to ensure a stronger 5 GHz signal can reach guests’ devices.
Sample Distribution by Spectrum Band per Hotels’ Performance Category
Source: Speedtest Intelligence® | February 2025 – February 2026
Sample Distribution by Spectrum Band per Hotels’ Performance Category
Median Download Speed by Spectrum Band per Hotels’ Performance Category
Source: Speedtest Intelligence® | February 2025 – February 2026
Median Download Speed by Spectrum Band per Hotels’ Performance Category, Select 5 Start Hotels
What can hotel operators do to be better prepared for Hajj 2026?
Delivering fast and consistent Wi-Fi across different parts of a hotel is tough because of the hotel’s structure. The size and layout are important; larger buildings with many floors and large common areas can create dead zones where the signal weakens or drops. Also, the materials used in construction (such as concrete, metal, and glass) can attenuate Wi-Fi signals, leading to inconsistent connectivity in certain areas. Furthermore, the high density of guests during peak seasons can strain the network, resulting in slower speeds and dropped connections.
To be better prepared for Hajj 2026, hotel operators should consider purchasing additional bandwidth from their ISP to accommodate peak traffic. Implementing dynamic bandwidth management and traffic shaping also ensures essential applications remain functional under heavy load, while enforcing band steering to the 5 GHz preference frees up the 2.4 GHz band for legacy devices. Additionally, installing a redundant backhaul line enhances resilience and prevents single-point link saturation.
Network configuration and ongoing monitoring are also vital for long-term success. Operators should conduct site surveys to identify signal dead zones and interference, allowing for the strategic placement or relocation of access points equipped with high-capacity wired cables. Beyond hardware, IT departments must actively monitor performance metrics during peak days, keep equipment firmware updated for security, and utilize guest checkout surveys to gain insights for future necessary adjustments.
The path to optimized Wi-Fi maximizes both guest satisfaction and business success. While the unique layouts and dense construction of Mecca and Medina hotels present challenges, data from top-performing properties like the Swissôtel and Fairmont show that investing in robust backhaul and well-configured infrastructure pays off. Even incremental improvements, such as temporary bandwidth increases or targeted access point upgrades, can significantly boost review scores and occupancy rates without requiring a total network overhaul.
Ookla can assist hospitality property managers to design Wi-Fi networks, optimize performance, and validate quality. Please contact us to learn more about Speedtest Intelligence and the Speedtest Certified program.
Ookla retains ownership of this article including all of the intellectual property rights, data, content graphs and analysis. This article may not be quoted, reproduced, distributed or published for any commercial purpose without prior consent. Members of the press and others using the findings in this article for non-commercial purposes are welcome to publicly share and link to report information with attribution to Ookla.
Karim Yaici is the Lead Industry Analyst at Ookla covering the Middle East and Africa (MEA) region. Previously, he directed Analysys Mason's MEA research program, where he was responsible for telecoms forecasts, market reports, consumer surveys, and custom research.
Every day, millions of people rely on Speedtest® to get the most accurate, trusted view of their real-world internet performance. Whether streaming 4K content out and about, looking for a reliable connection to work remotely, or managing a smart home hub of devices, people need to know if their connection can keep up with their needs.
But end users aren’t the only ones that benefit from accurate, real-world connectivity testing information. Businesses, universities, healthcare facilities, and even the leading Internet service providers (ISPs) all use Speedtest to optimize their own networks.
At Ookla®, we sit at the intersection between the service providers tasked with designing and optimizing networks and the consumers that make use of those networks every day. Our insights not only help people choose a mobile or Wi-Fi service provider, we help organizations of every type optimize the networks and services they provide.
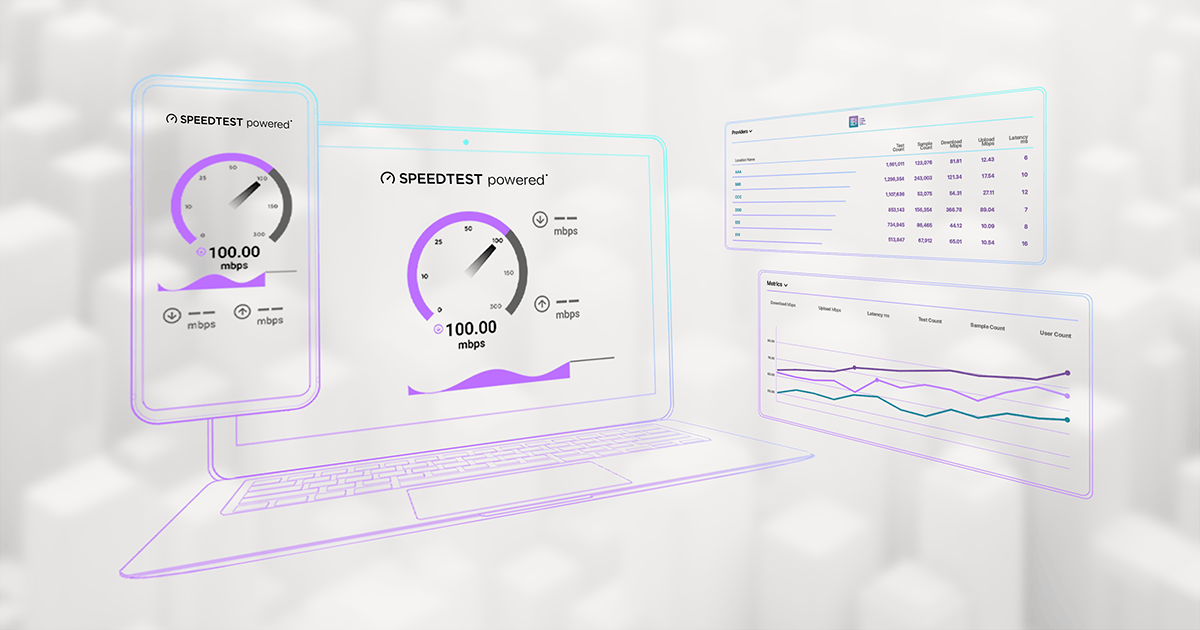
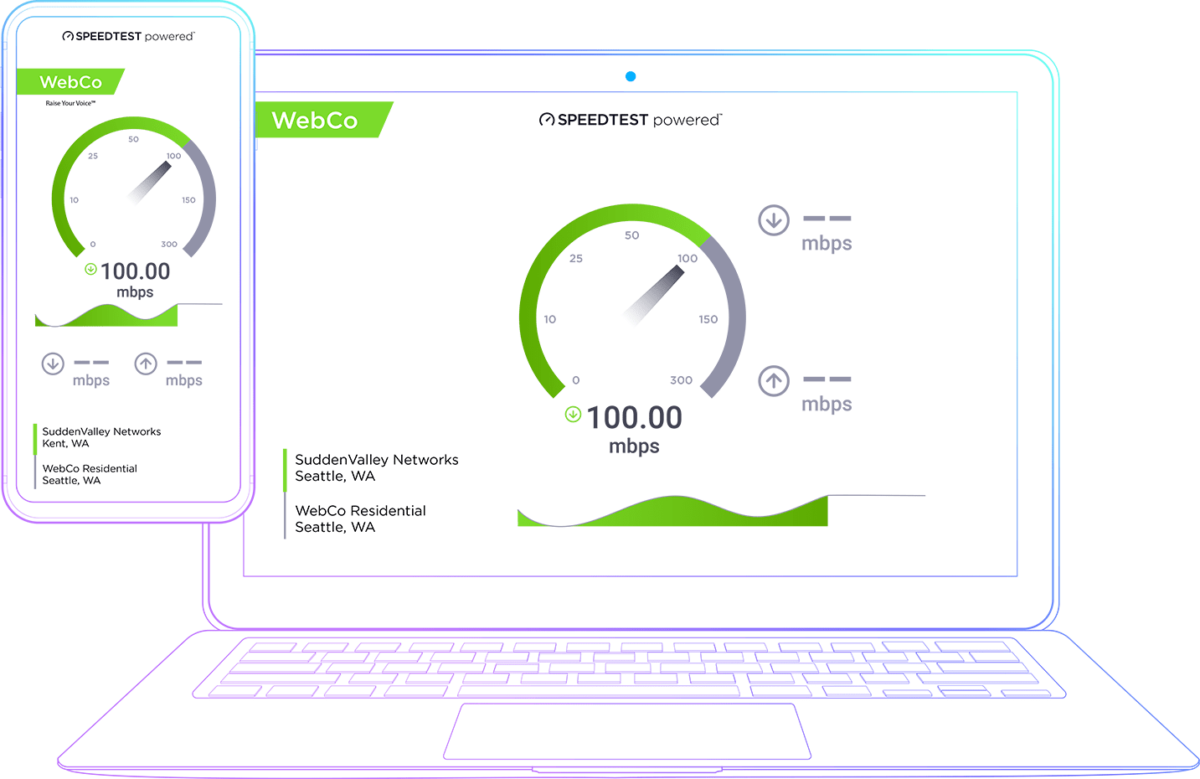
Speedtest Powered™ bridges the gap between these two worlds. As part of the enterprise side of Speedtest that most users never see, it encompasses three solutions: Speedtest Custom, Speedtest SDK, and Speedtest Embedded. These tools allow organizations to leverage the trusted testing capabilities that have made Speedtest the global standard for internet performance measurement while maintaining their unique brand identity. Enterprises rely on these solutions to solve connectivity challenges and deliver reliable service across every network touchpoint.
For a deeper look at how organizations are integrating Speedtest Powered across apps, websites, and connected devices, explore our latest white paper. Here’s how different enterprises are putting these tools to work:
Real-World Data Making a Real-World Impact
From education to aviation, organizations are integrating Speedtest capabilities directly into their systems to solve critical connectivity challenges. Here’s how they’re putting Speedtest Powered tools to work:
Enhanced Customer Experience for Airline In-Flight Connectivity
Many airlines offer in-flight Wi-Fi as a way for passengers to work or just consume some entertainment during their journey. Some even offer upgraded experiences with faster speeds or longer durations at an additional cost. To ensure the highest level of customer experience, airlines use Speedtest Embedded to consistently monitor Wi-Fi performance across their entire fleet. This solution enables real-time performance tracking and SLA verification, ensuring passengers receive the connectivity they expect (and at many times, pay for) at 35,000 feet. Airline IT teams can quickly identify and address connectivity issues, while flight crews have immediate visibility into network performance.
Remote Testing Solutions for Schools and Enhanced Work-from-Home Efficiency
A school district in a major city integrated Speedtest SDK into their student devices to support remote learning initiatives. With this capability, IT teams can monitor student connectivity without requiring manual testing, ensuring educational continuity and compliance with federal remote learning programs. The solution also helps the school district quickly identify and address connectivity challenges, enhancing both student success and operational efficiency. Similarly, enterprises use Speedtest Embedded to monitor connectivity performance across their remote workforce, enabling both automatic and on-demand testing to their private servers to ensure reliable work-from-home experiences.
Healthcare Innovation
A major healthcare system integrated Speedtest solutions across their operations to ensure reliable connectivity for critical medical services and remote staff. By implementing Speedtest Custom in their facilities, medical teams can verify network performance for bandwidth-intensive tasks like medical image transfers. Healthcare providers also use Speedtest Embedded to monitor connectivity for remote employees, ensuring their IT infrastructure supports seamless operations whether staff are on-site or working from home. This approach helps maintain operational efficiency while supporting the high-performance network demands of modern healthcare delivery.
5G Network Optimization
A major 5G provider integrated Speedtest SDK into their customer-facing mobile app to gain comprehensive insights into network performance. The solution enables periodic measurements across consumer devices while allowing both customers and support teams to run on-demand tests. This allows the provider to collect over 200 data points — including device information, Wi-Fi details, connection metrics, and location data — helping optimize their 5G network deployment and identify areas needing coverage improvements.
Customer Care Evolution
Relaying experiential information to a customer care rep can be challenging for invisible mediums like cellular and Wi-Fi services. Terms like “slow,” “stuttery,” “sometimes not great,” are instantly cleared up with a simple Speedtest. A leading ISP integrated Speedtest Custom into their support workflow, empowering customers to verify their connection speeds while providing valuable data to internal support teams. This has reduced the need for on-site technician visits and enhanced customer satisfaction through more efficient problem diagnosis and troubleshooting.
Telecom Compliance and Optimization
A mobile operator in Europe integrated Speedtest SDK into their mobile and web platforms to meet new regulatory requirements for subscriber speed reporting. The solution enabled users to test and report their speeds while providing the operator with comprehensive network performance insights. This breadth and depth of data, including device types, connection quality, and location information, helps the operator optimize their network, diagnose customer issues efficiently, and provide stakeholders with actionable information while meeting regulatory requirements.
Conclusion
Speedtest isn’t just the tool millions use to check their home internet speeds; it’s also powering network measurement and optimization behind the scenes across multiple industries.
Through Speedtest Powered solutions—Speedtest Custom, SDK, and Embedded—organizations can integrate trusted performance testing directly into their platforms while maintaining brand consistency. The result? Better data, better insights, and better customer experiences.
Ready to bring the power of Speedtest to your organization? Visit our product page for a deeper look into our solutions, or check out our latest white paper to explore real-world implementations.
Ookla retains ownership of this article including all of the intellectual property rights, data, content graphs and analysis. This article may not be quoted, reproduced, distributed or published for any commercial purpose without prior consent. Members of the press and others using the findings in this article for non-commercial purposes are welcome to publicly share and link to report information with attribution to Ookla.
Dave Andersen is a Marketing Program Manager at Ookla, where he creates enterprise and consumer content across Ookla’s brands. Dave got his start in the telco space in 2012, producing content for RootMetrics. Dave has a bachelors in marketing from Washington State University and studied creative writing in Oklahoma State’s MFA program.
For travelers heading out of the country to the World Cup this summer, many assume their roaming setup is already taken care of before they leave. The reality is more complicated. Roaming performance varies significantly depending on a traveler’s home operator, not just the country they’re visiting.
The agreements operators negotiate with foreign networks influence which network a device connects to—such as 5G or LTE—and how that connection is handled once it’s on the network. In fact, travelers from the same country, sitting in the same stadium, can have completely different experiences based purely on their operator in their home country.
The stakes are higher for fans in 2026 than they have ever been. FIFA is delivering tickets exclusively through its official app this year, with no printed or offline backup, which means an unreliable connection at the gate could be a real problem.
For a deeper look at roaming and network readiness across all three host countries, check out Ookla analyst Mike Dano’s recent article and our World Cup 2026 roaming webinar, available on demand.
Why Don’t All Fans Get the Same Signal at World Cup 2026?
Roaming performance varies significantly depending on a traveler’s home operator, not just the country they’re visiting. When a traveler lands in a foreign country and their phone connects to a local network, that connection is governed by a roaming agreement—a prenegotiated deal between a user’s home provider and the local operator. Those agreements shape which network the phone can access and whether it can use 5G or is limited to LTE. Most travelers have no visibility into these agreements and no reason to think about them until something goes wrong.
The 2022 World Cup in Qatar illustrated this issue clearly. Argentina’s Personal, Mexico’s Telcel, and Brazil’s Vivo all had roaming agreements that gave their customers access to Qatar’s 5G network. On the other hand, Claro and AT&T Mexico customers were largely limited to LTE and could not access that 5G network at all. Fans with 5G access had a noticeably better experience than those on LTE, a difference shaped in part by roaming agreements.
In 2026, the challenge is bigger. Forty-eight teams, 16 stadiums, and three host countries mean roaming traffic will hit multiple cities simultaneously, and fans may be moving between all three countries over the course of the event. How well a fan’s connection performs depends on roaming agreements, network conditions in each destination, and other factors such as device support and network load.
What to Expect in Each Host Country at World Cup 2026
For fans traveling to a single host city, the roaming question is fairly straightforward compared to those moving between countries. But a significant number of World Cup travelers will move across multiple countries over the course of the tournament, catching games in Dallas one week and Mexico City the next. Each trip places travelers on a different network, governed by different roaming agreements, with meaningfully different performance expectations.
Once fans are inside a stadium, connectivity can be another challenge. Tens of thousands of fans uploading, streaming, and messaging at the same time—especially during kickoff and halftime—can push even well-prepared networks to their limits. Recent Speedtest Intelligence data shows those differences clearly across the three host countries:
United States: U.S. stadiums generally offer the strongest performance of the three host countries. Median download speeds range from 242.19 Mbps at AT&T Stadium to 413.74 Mbps at Mercedes-Benz Stadium, with newer venues delivering noticeably faster results. Across cities and at airports, T-Mobile leads, while Verizon tends to lead at the venues themselves.
Mexico: Travelers will often connect to Telcel’s LTE network, though 5G access varies by roaming agreement. For example, Bell Canada subscribers had no 5G access when roaming on Telcel, while Telus subscribers showed 34% 5G access on the same network. Inside stadiums, median download speeds range from 35.66 Mbps at Estadio Banorte to 53.27 Mbps at Estadio Akron.
Canada: Rogers, Bell, and Telus are closely matched overall, with Telus generally leading at venues in Toronto and Vancouver. Stadium speeds are tightly grouped—140.61 Mbps at BMO Field to 143.37 Mbps at BC Place—though all three venues come in well below U.S. counterparts.
eSIMs and World Cup 2026: What Travelers Should Know
An eSIM is a digital SIM card built into most modern smartphones that allows a traveler to purchase and activate a local or regional data plan without swapping out a physical SIM card. For most fans, the default move is adding an international roaming package before the trip, but an eSIM offers an alternative that’s often cheaper and faster, without relying on whatever roaming agreement their home operator has negotiated.
The difference between an eSIM and an international roaming package can be meaningful. Brazilian travelers roaming into the U.S., for example, often experienced slower speeds than local users when using standard roaming—but those connecting through T-Mobile’s network, which Ookla ranked as the fastest in the country in 2025, saw considerably better results.
For anyone heading to the World Cup this summer, researching eSIM options before departure is worth the time. Setting up an eSim generally takes about ten minutes on most modern smartphones.
How Should Fans Prepare for Roaming at World Cup 2026?
Fans traveling to World Cup 2026 should confirm 5G roaming access by destination, research eSIM options, and download the FIFA app before departure. An eSIM in particular can save a lot of last-minute headaches. Most roaming problems are discovered at the worst possible moment, usually at the airport, or worse, at the stadium gate.
The 2026 World Cup spans three countries with meaningfully different network environments, and an operator that performs well in one host country may have a completely different arrangement in another. A little homework before departure goes a long way:
Confirm 5G access by destination: Check whether the operator supports 5G roaming in each country on the itinerary. Roaming packages often bury that information in the fine print, and LTE-only access in Mexico or Canada can come as a surprise to travelers who assumed 5G was included.
Research eSIM providers: Buying a local eSIM plan before departure can mean faster speeds and more predictable costs than a standard roaming package.
Download and set up the FIFA app before leaving home: Tickets for World Cup 2026 are delivered exclusively through FIFA’s official app, with no printed or offline alternative. Logging in, downloading tickets, and confirming access ahead of time reduces the risk of dealing with account or connectivity issues at the gate.
If traveling across multiple host countries: A single international roaming package does not guarantee consistent performance across the US, Canada, and Mexico. Performance can vary by destination, so earlier steps—such as checking 5G access and considering eSIM options—become more important.
The Bottom Line on Roaming at World Cup 2026
The 2026 World Cup is the largest and most logistically complex version of the tournament ever staged, and the mobile network experience will reflect that complexity. A fan traveling from Brazil to games in Dallas, Mexico City, and Vancouver is effectively navigating three separate network environments, each with its own variables.
That is largely a solvable problem. Checking roaming agreements, researching eSIM options, and confirming the FIFA app is working before departure are not complicated steps. They just require knowing to take them in the first place.
Ookla retains ownership of this article including all of the intellectual property rights, data, content graphs and analysis. This article may not be quoted, reproduced, distributed or published for any commercial purpose without prior consent. Members of the press and others using the findings in this article for non-commercial purposes are welcome to publicly share and link to report information with attribution to Ookla.
Dave Andersen is a Marketing Program Manager at Ookla, where he creates enterprise and consumer content across Ookla’s brands. Dave got his start in the telco space in 2012, producing content for RootMetrics. Dave has a bachelors in marketing from Washington State University and studied creative writing in Oklahoma State’s MFA program.
New data shines a light on the growth of mmWave 5G networks in the U.S., and their performance.
In the very, very early days of 5G in the U.S., millimeter wave (mmWave) spectrum was trumpeted as ground zero for the technology. Some even referred to the combination of 5G and mmWave as “wireless fiber.”
Indeed, in 2017, a bidding war broke out between Verizon and AT&T over mmWave spectrum owner Straight Path. Verizon eventually won the company’s mmWave holdings with a $3.1 billion acquisition deal.
But the noise surrounding mmWave 5G quickly died down after the FCC auctioned mid-band C-band spectrum in 2021. Unlike short-range mmWave spectrum, transmissions in midband spectrum like C-band (3.7 GHz) travel much further, thereby allowing operators including Verizon and AT&T to supercharge both the speed and the reach of their 5G connections.
Further, few other countries in the world followed in the mmWave footsteps of the U.S., with international spectrum regulators instead putting a focus on releasing mid-band spectrum for 5G.
However, mmWave networks haven’t disappeared. New drive test data from Ookla’s RootMetrics®, coupled with crowdsourced information from Ookla’s Speedtest Insights™, shows the ongoing growth of mmWave 5G networks in the U.S., as well as the remarkable performance characteristics of those systems.
Key takeaways:
Across all of RootMetrics’ testing in the second half of 2025, in both urban (metro) and rural (state) areas, mmWave showed up in 2.2% of Verizon’s samples. For AT&T, that figure was 0.2%. For T-Mobile, that figure was almost 0% (and as a result, this report will mainly focus on Verizon and AT&T).
Verizon’s mmWave connections showed up in 75 markets in the first half of 2024 (out of a total of 125 markets), a figure that rose to 91 in the second half of 2025. That’s almost triple the number of markets where RootMetrics recorded AT&T mmWave systems in the second half of 2025. 5G mmWave from T-Mobile, meanwhile, only showed up in 1 market covered by RootMetrics technicians during the second half of 2025.
Most mmWave samples were obtained within 150 meters (about 500 feet) of a mmWave transmission site, reflecting the spectrum’s relatively diminutive coverage area. However, download speeds over mmWave connections reached beyond 1 Gbps in some markets.
Denver, Atlanta, Philadelphia, and Boston are top mmWave cities for Verizon. Roughly 60% of RootMetrics’ outdoor testing samples landed on Verizon’s mmWave in these cities in the second half of 2025.
Verizon leads the way
The story of mmWave in the U.S. primarily centers on Verizon. The company’s acquisition of Straight Path (and later XO Communications) coupled with its subsequent spending in FCC mmWave spectrum auctions, gave the operator a solid footprint in the high-band spectrum. More importantly, Verizon then began a network buildout campaign that put mmWave-capable small cells (mini cell transmission sites) into stadiums and other big venues, as well as in outdoor, downtown areas with lots of foot traffic.
By 2020, Verizon’s CEO sought to leverage the company’s mmWave investments via an appearance during the unveiling of Apple’s first mmWave-capable iPhone.
“5G just got real,” Hans Vestberg, Verizon’s CEO at the time, proclaimed during the event.
Since then, Verizon has expanded its mmWave footprint via services for both mobile and fixed wireless access (FWA) users.
Now, RootMetrics’ testing highlights the scope and breadth of Verizon’s mmWave deployment. RootMetrics conducts controlled driving and walking tests using flagship Android smartphones across 125 of the nation’s largest metropolitan markets twice a year.
According to this testing data, Verizon continued to add to its mmWave network footprint in big U.S. cities throughout 2025. The number of distinct U.S. metropolitan markets where RootMetrics’ testing engineers registered Verizon mmWave samples increased from 75 in the first half of 2024 to 91 in the second half of 2025. That’s almost triple the number of markets where AT&T has deployed mmWave systems.
5G mmWave from T-Mobile, meanwhile, only showed up in one market covered by RootMetrics technicians during the second half of 2025 (a decline from two markets recorded in the first half of 2024). That lines up with the operator’s general approach toward mmWave.
Number of Markets with mmWave Samples
RootMetrics® | 1H 2024 – 2H 2025
Verizon’s mmWave signals also popped up in more rural RootMetrics state-area testing, which covers locations in large and small towns, as well as the highways between them. In state-area testing, RootMetrics’ technicians recorded Verizon mmWave connections in 33 markets in the second half of 2025, up from 14 in the first half of 2024. AT&T’s mmWave signals showed up in just 7 markets in the second half of 2025. T-Mobile mmWave didn’t show in any of these areas.
Further, Verizon’s mmWave connections also show up in a greater portion of RootMetrics’ samples in each of those U.S. metro areas, when compared with AT&T:
Before continuing, it’s worth explaining RootMetrics’ network-testing methodology. The company conducted over 3 million tests in the second half of 2025 across the entire U.S. Unlike crowd-sourced data from Speedtest®, RootMetrics’ data is derived from technicians who drive – and walk – around each city they test. Such tests are also randomized – meaning, RootMetrics technicians don’t test the same route each time they travel through a particular market. Instead, they test different routes.
RootMetrics’ technicians also visit a variety of different locations during their nationwide testing. In urban, metro areas, they drive through downtown areas and they walk along both indoor and outdoor routes. These outdoor routes typically traverse downtown streets and city parks.
In more suburban and rural settings (“state routes,” in RootMetrics parlance), technicians typically drive through neighborhoods, along business corridors, and down interstates and highways.
These testing methods highlight the different types of spectrum that operators deploy in these various locations. For example, Verizon generally leverages its 700 MHz low-band spectrum to cover the more rural “state routes” tested by RootMetrics – which makes sense considering signals in such spectrum can typically travel several miles at least. mmWave signals, meanwhile, can only travel a few hundred yards, making them more appropriate for dense, urban downtown locations (“metro areas,” in RootMetrics’ parlance).
Across all of RootMetrics’ testing samples in the second half of 2025, in both urban (metro) and rural (state) areas, mmWave showed up in 2.2% of Verizon’s samples. For AT&T, that figure was 0.2%. For T-Mobile, that figure was almost 0% (and as a result, this report will mainly focus on Verizon and AT&T).
For comparison’s sake, it’s clear that Verizon pivoted to mid-band C-band spectrum when the FCC made that spectrum available in 2021. According to RootMetrics data, Verizon increased its use of C-band spectrum to 81.3% of all samples in metro areas by the fourth quarter of 2025, up from 74.4% in the first quarter of 2025.
The reach of mmWave
mmWave 5G is distinct because it sits way up in the millimeter wave spectrum bands (generally between 20 GHz and 40 GHz). Earlier cellular networks – from 1G in the 1980s to 4G in the 2010s – mostly sat in much lower spectrum bands, generally from 700 MHz to 1900 MHz.
mmWave spectrum was long considered unusable for mobile, cellular communications until early work on the 5G standard convinced some in the global wireless industry that advanced technologies could unlock mmWave spectrum bands for commercial, on-the-move applications. Operators like Verizon coveted such mmWave bands because they promised to create massive pipes of network capacity, spanning multiple 100 MHz blocks of mmWave spectrum. Those ample chunks of spectrum were unheard of even in the world of 4G, when spectrum blocks didn’t get much wider than 20 MHz.
However, due to the physics of signal propagation, transmissions in mmWave spectrum sport a few important characteristics: They cannot travel nearly as far as transmissions in lower spectrum bands, such as 700 MHz. As a result, 5G signals in low-band spectrum like 700 MHz can travel many miles; signals in high-band, mmWave spectrum like 26 GHz can only travel several hundred meters. Moreover, mmWave signals typically cannot penetrate into buildings or other structures.
T-Mobile’s former CTO Neville Ray used a “layer cake” metaphor to explain this situation, with mmWave networks playing only in small, dense urban areas at the top of the cake:
However, such illustrations are mostly based on general networking principles rather than real-world data. Here, RootMetrics offers a clear look at the exact reach of mature, commercial mmWave networks. In general, 5G mmWave signals aren’t usable beyond 900 meters (or about half a mile). Further, most RootMetrics mmWave samples in the second half of 2025 were collected within just 150 meters (about 500 feet) of a mmWave transmission site.
Distance from Transmission Site, in Meters
RootMetrics® | 2H 2025 | % of total samples
In comparison, most RootMetrics’ C-band spectrum samples were collected within 1,000 meters (just over half a mile) from the transmission site – and in some cases they reached more than two miles from the transmission site.
AT&T exclusively uses the 39 GHz mmWave band. Most of Verizon’s mmWave transmissions travel over the 28 GHz mmWave band, but a very small amount use 39 GHz (just under 6% of samples in the second half of 2025). Verizon’s mmWave signals don’t show the same drop-off at 50 meters that AT&T’s signals do – likely a consequence of the inherently broader propagation characteristics of signals in 28 GHz compared with the higher 39 GHz band.
RootMetrics data also highlights the performance of mmWave 5G signals as users move away from mmWave transmission sites. All wireless networks show a degradation in performance as the distance between a user and a transmission site increases – but the situation can be measured in meters in 5G mmWave.
Median mmWave Download Speeds Slow as Distance Increases (in Meters)
RootMetrics® | 2H 2025
Finally, RootMetrics data can also show the exact signal characteristics that create connections between mmWave-capable devices and mmWave transmission sites. These “access thresholds” essentially show how strong a mmWave signal must be before the network will allow a user’s phone to connect to a mmWave site. If the signal isn’t strong enough, the network won’t allow the phone to connect to mmWave, and the phone will instead remain on a mid-band or low-band connection.
Access Thresholds for mmWave Connections, in dBm
RootMetrics® | 2H 2025
In a 5G network, dBm (decibels-milliwatts) is a measure of the power level of the radio signal received by a device. Values closer to zero indicate a stronger, more reliable connection.
Looking for signals: mmWave in big U.S. cities
Denver, Atlanta, Philadelphia, and Boston are top mmWave cities for Verizon. Roughly 60% of RootMetrics’ outdoor testing samples landed on Verizon’s mmWave in these cities in the second half of 2025. For AT&T, Philadelphia, Chicago, and Los Angeles are top mmWave cities – although AT&T’s mmWave touched roughly 20% of RootMetrics’ outdoor testing samples in these cities in the second half of 2025.
mmWave Samples in U.S. Metro Areas, by Activity
RootMetrics® | 2H 2025 | % of total samples
That both AT&T and Verizon view mmWave networks as an outdoor coverage solution is noteworthy. In the early days of mmWave 5G – before mid-band spectrum like C-band became available – mmWave networks were touted as a reasonable solution for urban outdoor areas, like downtown corridors. More recently, mmWave has been viewed as an ideal option for covering massive indoor locations, like stadiums, convention centers, and other high-traffic buildings.
Nonetheless, 5G signal scans from Ookla’s Speedtest Insights show Verizon’s extensive indoor and outdoor mmWave coverage throughout downtown Denver and Boston:
However, a closer look at Verizon’s coverage throughout the southern part of downtown Denver tells the story of mmWave’s relatively diminutive propagation characteristics, particular when compared with transmissions across all of Verizon’s spectrum bands, including both low-band and mid-band:
Finally, it’s worth noting that Speedtest Insights also shows some of T-Mobile’s mmWave deployments. For example, mmWave shows up in one of T-Mobile’s retail stores in its hometown of Bellevue, Washington. It also shows up in SoFi Stadium in Inglewood, California.
mmWave: Very, very fast
For operators, the economic calculation for mmWave can be tricky. Since coverage is measured in hundreds of meters, and mmWave transmitters are decidedly expensive to purchase, install and maintain, is the juice worth the squeeze?
The performance of mmWave connections helps to illustrate the reasons driving such deployments.
mmWave Median Download Speeds in Metro Areas
RootMetrics® | 2H 2025
Uplink speeds see a similar boost from mmWave.
The reason for these speeds is clear: Both AT&T and Verizon devote an eye-watering amount of mmWave spectrum to their deployments. Most of Verizon’s mmWave deployments using the initial 5G non standalone (NSA) version of the technology span eight 100 MHz channels. When combining all those channels together, Verizon is using an astounding 800 MHz worth of spectrum, mostly in the 28 GHz band, for its mmWave transmissions. That spectrum “depth” is the primary reason the operator is able to supply connections in some cases exceeding 1 Gbps.
AT&T also devotes a substantial amount of spectrum to its mmWave deployments. In some cities, like Seattle, the operator is using 800 MHz worth of spectrum. In others, like Atlanta, it’s using 400 MHz.
To be clear though, a variety of factors go into raw download speeds beyond spectrum depth, including users’ distance from transmission sites, their phone’s capabilities, their operator’s networking settings, and other factors.
mmWave: Across the globe, and into the future
Roughly six years on from the introduction of mmWave 5G, the U.S. remains the technology’s most visible proponent.
According to a Global mobile Suppliers Association (GSA) report from July of last year, 203 operators in 56 countries and territories were investing in 5G mmWave network deployments. Of those, 24 operators in 17 countries had launched 5G networks using mmWave spectrum.
Similarly, in a report released in December of last year, GSMA Intelligence found that 35 operators from 17 countries had launched 5G services in the mmWave bands. The firm reported that, at the end of the third quarter of 2025, mmWave spectrum for 5G had been assigned in 25 markets globally.
On the device side of things, the GSA recorded 150 devices that supported mmWave transmissions by June 2025, up from just 21 at the end of 2019.
However, the GSA reported a “considerable decrease” in spending on mmWave spectrum since the end of 2020. Indeed, operators in India didn’t bid in a 2024 mmWave spectrum auction, and operators in South Korea didn’t meet mmWave buildout requirements and ultimately returned their spectrum licenses to the country’s regulator. Among device vendors, companies like Apple have shown some recent ambivalence toward mmWave, going so far as to remove the technology from newer phones bound for the U.S. market. Such moves can help reduce the overall cost of devices.
Thus, it’s not clear whether Verizon’s new CEO, Dan Schulman, will continue the mmWave expansion spearheaded by the company’s former CEO.
Regardless, mmWave momentum continues. Ofcom in the U.K. recently conducted an auction of mmWave spectrum in that country, drawing some operator interest. Regulators in India, Japan and Canada may release additional mmWave spectrum as well. And KDDI in Japan has touted an expanding mmWave footprint in some downtown areas. Such moves could push more phone makers to add mmWave support into their devices – a key requirement for broad deployments.
Broad, international support for mmWave 5G is important because it can drive economies of scale for both equipment manufacturers and device vendors, potentially lowering costs and accelerating global adoption.
Finally, all of this mmWave gyration may affect the future of 6G. For example, U.S. officials are pushing for the 7 GHz band to be incorporated into future 6G networks. The 7 GHz band is much lower than mmWave bands like 28 GHz, but it’s higher than the 3.5 GHz band used for most mid-band spectrum deployments globally. Thus, networks in the 7 GHz band may suffer from some of the same propagation challenges that affect 5G mmWave networks. Support – and equipment – for the 7 GHz band will be a critical test for its success.
Ookla retains ownership of this article including all of the intellectual property rights, data, content graphs and analysis. This article may not be quoted, reproduced, distributed or published for any commercial purpose without prior consent. Members of the press and others using the findings in this article for non-commercial purposes are welcome to publicly share and link to report information with attribution to Ookla.
Mike Dano is a Lead Industry Analyst in Ookla’s research and content team. He covers the North and South American markets, and global technology trends. Previously, Mike was a journalist covering the global telecom industry for 25 years at publications including RCR Wireless News, Fierce Network and Light Reading.
The gap between urban and rural users decreased in 43 states during the second half of 2025, according to a new Ookla report.
The U.S. broadband landscape underwent a big shift in the latter half of 2025. Thanks to record-breaking new fiber builds, the aggressive expansion of SpaceX’s Starlink, and the growth in fixed wireless access (FWA), broadband availability achieved some new milestones.
The latest Ookla U.S. State Broadband Report using Speedtest Intelligence® data found that in 43 states, the gap between urban and rural users meeting the FCC’s minimum broadband speed standards of 100 Mbps download and 20 Mbps upload decreased compared to the first half of the year. These findings are based on Ookla’s analysis, which uses the U.S. Census Bureau’s urban-rural classifications to categorize user data. To see how your state compares across key broadband metrics, download the full report.
In addition, the number of states that are able to deliver fixed broadband services (fiber, cable and DSL) to the FCC’s minimum standard of broadband speeds of 100/20 Mbps increased in the second half of 2025 to 45 states and the District of Columbia, which is up from 38 states and the District of Columbia in the first half of 2025. Plus, 13 states are now delivering the minimum of 100/20 Mbps fixed broadband speeds to 70% or more of Speedtest users.
Key Takeaways
Montana saw the biggest annual improvement in fixed broadband in 2H 2025 jumping from 41.09% of its users experiencing the minimum standard of fixed broadband speeds of 100/20 Mbps in 1H 2025 to 54.58% in 2H 2025.
In Nebraska, 58.31% of Starlink LEO satellite users receive minimum broadband speeds of100/20 Mbps, which is the highest percentage of any of the 50 states and the District of Columbia for Starlink service.
Starlink turns the tables on the digital divide. In 29 of the 50 states, rural Starlink users get better broadband speeds than urban users. In addition, based upon the number of Speedtest samples collected across the U.S., five states—Florida, Massachusetts, Hawaii, New Jersey and Connecticut—have more Starlink users in urban areas than rural areas.
Connecticut, New Jersey lead state rankings
Connecticut, New Jersey, Delaware and 10 other states are the top-ranking U.S. states in the second half of 2025 with at least 70% of Speedtest users experiencing 100/20 Mbps broadband speeds. This is more than double the number of states (five) that had 70% or more of Speedtest users experiencing 100/20 Mbps broadband speeds in the first half of 2025.
Those three states have consistently been at the top of the state rankings. They benefit from having a smaller land mass with high population densities, making it more efficient and less costly for broadband providers to provide high-speed connectivity to customers in these states.
In addition, 45 states and the District of Columbia are now delivering the minimum broadband speeds of 100/20 Mbps to 60% or more of their users. This is an increase from 38 states and the District of Columbia that met this criteria in the 1H of 2025.
Starlink’s surprising city appeal
Starlink’s appeal as a broadband provider goes beyond just rural areas where fixed broadband options are non-existent. Instead, Starlink appears to be carving out a niche market for urban dwellers too. While Starlink’s service isn’t a substitute for the speed and price of a fiber-optic connection it does appeal to a certain segment or urban residents because it allows them to escape having to purchase from a fixed provider that provides poor service or or doesn’t offer compelling price plans. It also serves as a reliable backup for those who require 24/7 connection and for digital nomads with a roaming plan, Starlink can be used to deliver broadband on the go.
Speedtest samples collected across the U.S. indicate that five states—Florida, Massachusetts, Hawaii, New Jersey and Connecticut —have more Starlink users in urban areas than rural areas.
State
No. of Starlink Test Samples from Rural Areas of the State
No. of Starlink Test Samples from Urban Areas of the State
New Jersey
649
1731
Hawaii
851
1494
Florida
11451
11717
Massachusetts
786
1041
Connecticut
382
543
Note: These findings are based on Ookla’s analysis, which uses the U.S. Census Bureau’s urban-rural classifications to categorize user data.
Download the full report
To find your state’s standing and how it compares to the rest of the country in broadband connectivity, download our free report.
Ookla retains ownership of this article including all of the intellectual property rights, data, content graphs and analysis. This article may not be quoted, reproduced, distributed or published for any commercial purpose without prior consent. Members of the press and others using the findings in this article for non-commercial purposes are welcome to publicly share and link to report information with attribution to Ookla.
Sue Marek is Ookla’s editorial director and part of the company’s analyst team. She oversees the company’s thought leadership and editorial content. Sue is a journalist with more than 30 years of experience covering the telecom industry and her work has appeared in Fierce Network, Light Reading, and SDxCentral. She is a frequent speaker at industry events and has moderated panels at Mobile World Las Vegas, Connect(x), the Consumer Electronics Show, the Competitive Carriers’ Show and 5G North America. Sue has a B.S. in journalism from the University of Colorado.
The rules raise questions about the routers installed across the U.S. This is what Speedtest data reveals about the equipment currently in American homes, including those routers using older generations of Wi-Fi.
The Federal Communications Commission (FCC) recently issued new rules intended to address reported security risks posed by routers produced outside of the U.S. The agency said security gaps in “foreign-made routers” were exploited in the recent Flax, Volt, and Salt Typhoon cyberattacks.
To address the situation, the FCC said that all new models of non-U.S.-produced routers will need a waiver to be sold to consumers in the U.S. The rules will impact not only companies that are based outside of the U.S. but also devices developed, designed, assembled, and manufactured outside of the U.S.
The move ignited a firestorm.
“To our knowledge consumer-grade Wi-Fi routers available in the U.S. are manufactured nearly exclusively in China, Taiwan, and Vietnam,” wrote Claus Hetting, CEO of Wi-Fi NOW. “Foreign manufacturing cannot easily be relocated since it is typically based on long-term contracts with foreign manufacturing entities. Such contracts will be costly to terminate.”
“It is not possible to build a consumer router based entirely on U.S. components; that part of the supply chain doesn’t exist in the United States,” added analyst Avi Greengart of Techsponential.
Speedtest® data helps highlight the Wi-Fi router vendors that will be most directly affected by these new rules. Here is a list of the top 10 Wi-Fi router vendors in the U.S. from January 2025 to March 2026, based on Speedtest users. This data can be considered a proxy for residential and public Wi-Fi router market share:
Rank
Vendor
Share of Speedtest samples
1
Eero
10%
2
TP-Link
9.9%
3
Netgear
9.6%
4
Arcadyan
8.9%
5
Askey
5.1%
6
Sagemcom
4.9%
7
Asustek
4.8%
8
Calix
4.4%
9
Arris
3.8%
10
Google
2.8%
Further, it’s clear that some of these existing gadgets – currently deployed in networks across the U.S. – will soon need to be replaced in order to take advantage of newer Wi-Fi technologies. Wi-Fi 4 was introduced in 2009 and supports theoretical peak speeds up to 600 Mbps. Wi-Fi 7 – the latest generation of the technology – supports theoretical peak speeds up to 46 Gbps, alongside more advanced networking and security technologies.
Wi-Fi generation breakdown by vendor
Speedtest Intelligence | January 2025 – March 2026
Indeed, roughly 28% of all Speedtest samples in the U.S. ran over Wi-Fi 5, and around 7% used Wi-Fi 4 or older. These older generations typically do not have the more advanced security protocols of newer generations of Wi-Fi. Additional rules affecting router vendors – coupled with rising costs for networking components – could potentially slow U.S. adoption of newer Wi-Fi technologies including Wi-Fi 7 and Wi-Fi 6E, which uses the 6 GHz band freed by the FCC for unlicensed operations.
Finally, it’s worth noting that U.S. service providers often supply their customers’ routers. Here, we can see the top three Wi-Fi router vendors – based on Speedtest samples from January 2025 to March 2026 – for each of the major internet service providers in the U.S.:
Operator
Verizon (prior to Frontier acquisition)
Comcast
Charter
AT&T (prior to Lumen transaction)
Top vendors
1. Arcadyan 2. Wistron 3. Netgear
1. Arris 2. Netgear 3. Technicolor
1. Askey 2. Sagemcom 3. Netgear
1. Humax 2. Nokia 3. Netgear
Although it’s not clear how the FCC’s new router rules will be implemented, it’s likely that these top router vendors will need to quickly determine how these rules will impact them in the coming months and years.
Ookla retains ownership of this article including all of the intellectual property rights, data, content graphs and analysis. This article may not be quoted, reproduced, distributed or published for any commercial purpose without prior consent. Members of the press and others using the findings in this article for non-commercial purposes are welcome to publicly share and link to report information with attribution to Ookla.
Mike Dano is a Lead Industry Analyst in Ookla’s research and content team. He covers the North and South American markets, and global technology trends. Previously, Mike was a journalist covering the global telecom industry for 25 years at publications including RCR Wireless News, Fierce Network and Light Reading.
Austria leads on the slopes, where Alpine-specific auction incentives, public co-funding, and deep low-band spectrum holdings drive superior outcomes in some of Europe’s most challenging yet lucrative radio environments.
Europe’s largest ski resorts are among the most demanding environments for mobile networks. Extreme terrain, steep changes in elevation between sites and users, seasonal demand spikes that can exceed baseline capacity by an order of magnitude, and remote power constraints all combine to make Alpine connectivity an infrastructure challenge that separates well-invested operators from the rest.
For the tens of millions of visitors who pass through the Alps’ major ski resorts each winter, mobile connectivity is no longer a luxury. It underpins safety communications, real-time slope monitoring, social media sharing from the chairlift, and the growing dependence on digital lift passes and resort apps.
To understand how operators are meeting this challenge, we examined Speedtest Intelligence® data across 17 of Europe’s top ski resorts in five Alpine nations (France, Switzerland, Austria, Italy, and Germany) over a 12-month period from March 2025 to March 2026. The analysis draws on consumer-initiated Speedtest results, background signal scans measuring 4G and 5G signal strength and quality, and quality of experience (QoE) metrics including web page load times.
Key Takeaways
Austria leads its Alpine peers in median mobile download speeds at top ski resorts. A1 delivered median download speeds of 144.21 Mbps and the strongest 10th percentile outcomes (20.97 Mbps) of all 17 studied operators. The combination of Breitbandstrategie 2030 co-funding, alpine-specific spectrum auction incentives, and deep low-band holdings (Magenta Telekom alone holds 120 MHz across 700 MHz, 800 MHz, and 900 MHz spectrum) has resulted in infrastructure density that sustains performance even in the worst 10% of network conditions.
Italy’s mobile network outcomes at top ski resorts are the most competitively balanced of the five countries studied. The country’s four operators sit within just 16.66 Mbps of each other on median download speed (99.06 to 115.72 Mbps), and it is the only market where every operator exceeds 95 Mbps at the median. This reflects the broader national picture in a fiercely competitive and price-sensitive four-player market. The collective 700 MHz spectrum coverage obligation, which requires all operators to jointly reach 99.4% population coverage by June 2027, and the Milano Cortina 2026 Olympic 5G buildout, have driven competition across the Dolomites.
France has the widest within-country performance gap at resorts. SFR leads with a median download speed of 165.32 Mbps while Free trails at 48.79 Mbps, a 116.53 Mbps spread that reflects divergent spectrum and technology strategies across French Alpine terrain. While ARCEP’s New Deal Mobile has resulted in 3,200+ shared 4G sites and converging signal strength, shared infrastructure alone has not closed the throughput gap.
Germany’s top resorts record the lowest median download speeds (66.43 Mbps) but the best latency and fastest web page loads, while Swisscom leads the pack in Switzerland. Household-centric auction conditions tied to population coverage and transport corridors rather than tourism zones have left Bavarian resorts as a secondary priority in Germany. Without the geographic deployment mandates seen in France or the public co-funding of Austria, operator commercial strategy is the decisive variable, and Salt’s −110 dBm 4G RSRP, the weakest of any operator across all five countries, shows what happens when that incentive is absent.
The Alps poses a unique radio engineering challenge for mobile operators in tough mountain terrain
Providing cellular connectivity at ski resorts in the Alps is an order of magnitude more difficult than serving a comparable number of users in a lowland town. The physics, the logistics, and the economics all work against European operators.
Operators building remote mountain sites increasingly deploy hybrid solar-wind power systems that can supply as much as 80% of daily load from renewables, reducing diesel generator dependence by 70% to 80%, but the upfront engineering cost for a hardened Alpine installation can run 2.5 to 3.5 times that of an equivalent lowland site.
At 3,000 meters, base station equipment needs to operate in temperature ranges of −30 to +40 degrees Celsius across a single year. At −20 degrees Celsius, conventional lithium-ion batteries used for power backup retain roughly 50% of rated capacity, and charging rates must be throttled to prevent damage, meaning that a site designed for eight hours of backup power in summer may deliver fewer than four in winter.
Wet snow, which behaves like rain for signal propagation purposes, produces measurable attenuation on mid-band frequencies, while ice accumulation of even a quarter-inch on antenna radomes “changes the entire deployment scenario” according to engineering guidance. Avalanche protection adds further cost. Steel and concrete snow sheds, flexible net barriers, and reinforced catching dams are standard protective infrastructure around mountain base stations, and in extreme cases operators rely on remote avalanche control systems to manage hazards without placing personnel at risk.
Backhaul is a major constraint. Fiber installation in Alpine terrain requires specialized ASU (Aerial Self-Supporting) cable rated for heavy snowfall and high wind, or trenching through rocky substrate that in many areas can only be excavated during summer months. Where fiber is uneconomical, satellite backhaul can be installed in one to two days at roughly a third of the cost of a microwave link, and A1 in Austria has adopted this approach to connect alpine huts and remote mountain refuges through a partnership with the Austrian and German Alpine associations.
Similarly, Swisscom’s experience in the Ueschinen Valley in the Bernese Oberland illustrates the tradeoffs. When fiber was assessed for this mountain valley serving primarily summer-inhabited alpine huts, the cost-benefit case failed. Instead, Swisscom deployed a 5G site in autumn 2021, providing the entire valley with broadband at a fraction of the fiber cost (and making use of pre-existing fiber for the site backhaul only rather than needing to deploy it to every home).
Equipment logistics present their own challenge. Helicopter delivery to high-altitude sites is standard practice across the Alps, but thin air at elevation reduces rotor lift capacity, and flight windows are constrained by weather. Deutsche Telekom demonstrated one alternative at the Jizerska 50 cross-country ski race in the Czech Jizera Mountains, deploying a drone-mounted base station at 2.3 kilometers altitude that provided connectivity to over 4,400 race participants. This solution provided measured speeds of 95 Mbps download and 34 Mbps upload, a proof-of-concept for temporary surge capacity at mountain events (noting though that drone usage is still at an early stage in the Alpine context and features severe constraints like short battery runtime).
Austria’s sets the Alpine benchmark
Austria emerges as the strongest overall performer in ski resort connectivity in our analysis, combining the highest median download speeds with solid upload performance and latency. The country-level median download of 110.48 Mbps and upload of 17.69 Mbps both rank first among the five countries studied.
The four resorts studied (Ski Arlberg, Saalbach-Hinterglemm-Leogang-Fieberbrunn, Ischgl, and KitzSki) include Austria’s highest-profile ski domains, and our data suggests these destinations benefit from deliberate investment in Alpine connectivity.
Austria Leads European Ski Resort Download Speeds
Speedtest Intelligence® | Mar 2025 – Mar 2026
A1 drives much of this result. At 144.21 Mbps median download and 24.64 Mbps upload, A1 ranks second among all 17 operators on download and first on upload. Critically, A1 also delivers the strongest 10th percentile download performance of any operator at 20.97 Mbps, meaning that even users experiencing the worst 10% of conditions still receive a usable broadband-grade connection.
The gap between A1’s median and 10th percentile download across top Austrian resorts (a ratio of roughly 7:1) is notably tighter than operators like Orange in France (24:1) or Sunrise in Switzerland (21:1), pointing to more consistent infrastructure density across Austrian resort terrain.
Drei (3) follows at 100.89 Mbps median download, and Magenta Telekom sits at 86.85 Mbps. The 57.36 Mbps spread between A1 and Magenta is material but moderate by Alpine standards, and all three operators deliver acceptable performance for typical resort usage.
A1 and SFR Top the Operator Rankings at European Ski Resorts
Speedtest Intelligence® | Mar 2025 – Mar 2026
Analysis of signal strength data further supports A1’s lead. Its median 4G signal strength (known as Reference Signal Received Power or RSRP) of −100 dBm is the strongest of any operator in our data, and its 4G signal quality (RSRQ) of −9 dB is among the best. Magenta Telekom’s 5G signal stands out with a median RSRP of −95 dBm, the strongest 5G reading across all operators, likely reflecting the usage of its leading 120MHz-wide low-band allocation (prime spectrum for wide coverage that travels further in Alpine terrain) across the 700, 800, and 900 MHz bands.
Median web page load times at the top resorts in Austria cluster around 1.4 seconds across all three operators. The fact that A1’s outcomes here are essentially equivalent to Drei despite its significantly higher download speeds illustrate the diminishing returns of raw speed on QoE metrics that are dominated by deeper factors like core interconnect, peering, and content delivery network (CDN) routing. These are the behind-the-scenes infrastructure elements that determine how efficiently data travels between servers and end users, rather than simply how fast the last mile connection can go.
Italy’s tight operator spread points to competitive balance
Italy’s ski resorts deliver the second-highest median download speeds (101.85 Mbps) and present the most balanced competitive picture of any country in the analysis. The three Italian resorts studied (Sella Ronda, Cortina d’Ampezzo, and Kronplatz) sit directly in the zone that received Olympic infrastructure investment, and the post-Games persistence of this network will be a critical test for long-term connectivity improvement in the Dolomites.
All four operators measured (Vodafone, WINDTRE, Iliad, and TIM) sit between 99.06 Mbps and 115.72 Mbps on median download, a total spread of just 16.66 Mbps or roughly 14% variance. The strong showing is somewhat surprising, as it runs counter to Italy’s broader country-level mobile standing. In the latest edition of the Speedtest Global Index™, Italy ranked 52nd globally and ahead of only Germany among the peer group.
A1 and TIM Lead on 4G Signal Strength Across Alpine Resorts
Speedtest Intelligence® | Mar 2025 – Mar 2026 | Median 4G RSRP in dBm (closer to 0 = stronger signal)
Vodafone leads with a median download speed of 115.72 Mbps and with the lowest latency in the country (43 milliseconds). TIM, despite ranking last among Italian operators on median download speed at 99.06 Mbps, delivers the strongest 10th percentile download (12.51 Mbps) and the best 4G RSRP (-100 dBm), consistent with its position as the operator with the largest physical footprint in Italy. TIM’s extensive 4G population coverage and 60 MHz of low-band spectrum give it deep reach that translates into more consistent mountain coverage, even if peak throughput is modestly lower.
WINDTRE deserves attention for upload performance. With a median of 17.98 Mbps, it delivers the highest upload speed of any Italian operator and one of the highest in the full five-country dataset, a finding that may reflect its 170 MHz of mid-band spectrum and capacity optimization choices.
Iliad, the newest entrant, delivers a competitive 101.40 Mbps median download speed, demonstrating that its national roaming and infrastructure-sharing arrangements provide reasonable resort coverage.
Italy features the poorest QoE outcomes among the five studied countries, with median web page load times ranging from 1.4 seconds (Vodafone) to 1.5 seconds (Iliad), roughly 0.1 to 0.2 seconds slower than the fastest country, Germany. This disconnect between relatively strong download speeds and slower page loads strongly suggests that network routing, CDN proximity, and peering arrangements, rather than raw throughput, may be the constraint on user experience in Italian resort areas.
France features the widest operator divide in the Alps
The four French resorts studied (Les 3 Vallees, Paradiski, Tignes-Val d’Isere, and Chamonix-Mont-Blanc) include the largest ski domains in the Alps and represent peak-demand environments where infrastructure sharing alone may not fully address congestion.
France’s overall median download speed of 83.44 Mbps across its top resorts place it fourth among the five studied countries, but this average masks a striking divergence between operators. SFR leads at 165.32 Mbps, the single highest median download of any operator across all five markets. Bouygues Telecom follows at 120.08 Mbps, while Orange sits at 61.62 Mbps and Free trails at 48.79 Mbps. The 116.53 Mbps spread between SFR and Free represents a 70% variance, the widest of any country in the study. It is also notable that this runs counter to the broader national pattern over recent quarters, where Orange leads on speed and consistency ahead of Bouygues, with both well ahead of SFR and Free.
France's Upload Deficit at Ski Resorts Is Pronounced
Speedtest Intelligence® | Mar 2025 – Mar 2026
The French upload story at ski resorts is even more notable. With an overall median upload speed of 6.20 Mbps, France’s upload speed is less than half the next-lowest country (Italy at 13.85 Mbps) and barely a third of Austria’s 17.69 Mbps. Even SFR, France’s fastest downlink operator, manages only 8.38 Mbps upload. Orange’s 10th percentile upload speed drops to 0.35 Mbps, and Free’s to 0.41 Mbps, levels that would render video calls and cloud uploads essentially nonfunctional. This upload deficit may reflect TDD configuration choices on mid-band spectrum, uplink resource allocation policies, or (most likely) backhaul constraints and seasonal congestion specific to French mountain infrastructure.
French Operators Show Extreme Download/Upload Imbalance at Ski Resorts
Speedtest Intelligence® | Mar 2025 – Mar 2026 | Ratio of median download to upload speed (lower = more balanced)
Deeper analysis of the 10th percentile outcomes expose an Alpine consistency problem across all French operators. Orange’s 10th percentile download is just 2.59 Mbps, meaning the worst 10% of user experiences deliver less than 3 Mbps despite a median of 61.62 Mbps. This 24:1 ratio between median and 10th percentile is the highest in our data and points to potential severe congestion or coverage holes within the resort footprint. Free (16:1 ratio) and Bouygues (20:1) show similar patterns. SFR, despite leading on median download, drops to 9.48 Mbps at 10th percentile (17:1) ratio.
Median multi-sever latency performance in France (56 to 58 ms across all four operators) is tightly clustered, suggesting that latency is not the differentiating factor between French operators at ski resorts. The more impactful divergence is on signal. Three of four operators (Orange, SFR, and Bouygues Telecom) feature an identical 4G RSRP of −103 dBm, while Free registers −106 dBm, consistent with Free’s smaller national site footprint and narrower low-band allocation (37 MHz total vs. 47 MHz to 57 MHz for its competitors).
Swisscom dominates, but Switzerland’s overall position is middle of the Alpine pack
Switzerland’s overall median download of 84.76 Mbps at resorts places it third, just above France, despite Swisscom delivering 130.40 Mbps, a figure that would rank among the top operators in any country. The gap reflects the sharp dropoff below Swisscom. Salt records 69.39 Mbps and Sunrise 57.13 Mbps, a 73.27 Mbps spread between top and bottom that represents a wide 56% variance.
On upload and latency, Switzerland is more competitive. Median upload speeds reach 15.91 Mbps overall (second only to Austria), and the median multi-server latency of 48 ms is the second-best, with Swisscom delivering the lowest single-operator latency in our entire dataset at 33 ms.
Analysis of the 10th percentile outcomes highlights a consistency challenge. Sunrise’s 10th percentile download speed is just 2.71 Mbps (a 21:1 ratio to its median) and Salt’s is 4.93 Mbps (14:1). Even Swisscom’s 10th percentile of 8.08 Mbps represents a 16:1 ratio. These floor-performance readings suggest that at peak times or in terrain-challenged areas of Zermatt, Verbier, and the Jungfrau Region, users on any operator can experience severe performance degradation (over and above what is observed in countries like Austria).
Floor Performance Varies Dramatically Across Alpine Operators
Speedtest Intelligence® | Mar 2025 – Mar 2026
Signal data provides a partial explanation for these challenges. Swisscom’s median 4G RSRP of −102 dBm is acceptable but not exceptional. Salt’s median −110 dBm is the weakest 4G reading of any operator across all five countries, consistent with coverage limitations in peripheral Alpine valleys. Salt’s 5G signal at −106 dBm tracks similarly weak.
Swisscom holds the largest low-band allocation in Switzerland (80 MHz across the 700, 800, and 900 MHz bands) and the deepest total spectrum portfolio at 454 MHz across all bands, vs. Sunrise at 294 MHz and Salt at 270 MHz. This spectrum depth, and the operator’s status as the universal service licence holder, likely underpins Swisscom’s clear Alpine advantage.
Switzerland’s market-driven regulatory model, which lacks the kind of direct government co-funding seen in France (ARCEP New Deal Mobile) or Austria (Alpine Infrastructure Fund), places the burden of mountain investment on operator economics.
Germany trades raw speed for latency and QoE
Germany’s ski resort performance is unique. With a 66.43 Mbps median download speed, it ranks last among the five countries. But with a median latency of 42 ms, it delivers the best multi-server responsiveness, 6 ms faster than second-placed Switzerland and 26 ms better than France. Garmisch-Partenkirchen, Oberstdorf, and Sudelfeld are located in Bavaria but do not sit on priority transport corridors, creating a gap where commercial incentive alone drives investment.
Telekom dominates the German market on speed at resorts, recording a 120.58 Mbps median download, more than double its nearest domestic competitor (Vodafone at 58.95 Mbps, O2 at 54.39 Mbps). Telekom also leads on upload (20.22 Mbps) and latency (35 ms), the latter being the second-lowest single-operator figure in our entire dataset after Swisscom.
But Telekom’s 10th percentile download drops to 6.14 Mbps (a 20:1 ratio), notably weaker than the consistency levels seen in Austria. Vodafone’s 10th percentile download speed of 9.38 Mbps actually represents a tighter ratio (6:1), suggesting more even if lower-ceiling coverage. O2’s 5.69 Mbps 10th percentile and modest signal readings (4G RSRP −105 dBm, 5G −103 dBm) likely reflect some rural coverage gaps.
Germany Leads on Latency and Web Page Load Times at Ski Resorts
Speedtest Intelligence® | Mar 2025 – Mar 2026
The profile of results align closely with the relative spectrum position of each German operator. Telekom, with 70 MHz of low-band spectrum (the largest low-band allocation among German operators, spanning 700, 800, and 900 MHz), has the propagation advantage needed for mountain terrain. Vodafone and O2, with weaker low-band positions, therefore compete less effectively at altitude.
Overall, Germany delivers the best median web page load times of any country. Telekom records 1.2 seconds, the lowest figure across all 17 operators, while Vodafone and O2 also perform well at 1.3 seconds each. This QoE advantage aligns with Germany’s latency leadership (and the inherent advantage that it features the highest density of hyperscale infrastructure in the DACH region) and suggests favorable CDN positioning, routing decisions and peering arrangements for German networks.
Policy approaches to Alpine coverage vary widely from subsidized infrastructure sharing to targeted rollout obligations
The regulatory frameworks shaping Alpine connectivity differ materially across the five countries studied, and these differences can help to explain the performance patterns in our data.
France’s policy approach is the most prescriptive. ARCEP’s New Deal Mobile program, announced in January 2018, replaced the traditional auction logic with a commitment-based framework in which operators accepted binding coverage obligations in exchange for administrative renewal of their spectrum rights. The targeted coverage mechanism requires each operator to cover up to 5,000 areas, with government orders issued at a rate of roughly 600 to 800 areas per year per operator and each designated location to be activated within at most 24 months.
Infrastructure sharing is central, but more selectively than the original text implied. Of those 5,000 areas, 2,000 are explicitly intended for four-operator RAN sharing in places where no operator provides “good coverage”; in the remaining areas operators must at least share passive infrastructure, and in some cases active sharing also applies. Separately, operators must reach 99.8% population “good coverage” for voice and SMS, with deadlines staggered between 2028 and 2031 depending on operator. Compliance is enforced with fines. Historically, SFR was penalized €380,000 for failing to cover 47 town centers by the January 2016 deadline, and Orange received a €27,000 penalty for missing five. Critically for ski areas, the 3.4 to 3.8 GHz obligations require 25% of sites in the final two rollout phases to be located in sparsely populated areas.
Austria, meanwhile, has combined spectrum policy with direct public funding. The Breitbandstrategie 2030 targets nationwide symmetric gigabit-capable connectivity by 2030, and the federal government has made €1.4 billion (US $1.6 billion) available through 2026 under Broadband Austria 2030. Coverage obligations from the 2020 multi-band auction (700, 1500, and 2100 MHz) require A1, Hutchison, and T-Mobile Austria to cover 1,702 of 2,100 underserved cadastral communities, roughly 81%, with first deadlines in summer 2022 and most remaining obligations falling in late 2023 and late 2025. Embedding rural buildout directly into the award process helps explain why operators with stronger rural network positions perform relatively well in Alpine terrain.
Five distinct regulatory approaches shape Alpine connectivity investment decisions across Europe.
By contrast, Switzerland takes the most market-driven approach. Swisscom is the universal service licence holder for 2024 to 2031, but the obligation remains modest: basic telephony plus internet access at 10/1 Mbit/s, or 80/8 Mbit/s on request, with reduced rates permitted in exceptional cases. The February 2019 spectrum auction raised around €414 million (US$477 million) and imposed mainly population-based obligations: licensees with 700 MHz spectrum had to reach at least 50% of the population with their own infrastructure by December 2024, while those without 700 MHz spectrum faced a 25% threshold. Those benchmarks can be met without specifically targeting remote Alpine terrain.
Italy’s 700 MHz auction, concluded in October 2018, included a distinctive collective coverage obligation. The 700 MHz licensees must jointly reach 99.4% of the population within 54 months of the band’s July 2022 availability. This joint structure creates a cooperative incentive, since any single operator’s shortfall affects the group, and it is consistent with infrastructure-sharing approaches. Earlier this year, TIM and Fastweb+Vodafone first announced a preliminary RAN-sharing agreement focused on municipalities with fewer than 35,000 inhabitants, and later announced a non-binding initiative to develop up to 6,000 new towers.
Italy’s Piano Italia 5G program provides major public support for fiber backhaul to more than 10,000 existing mobile sites and for new 5G sites in underserved areas, with public funding covering up to 90% of project cost. The Milano Cortina 2026 Winter Olympics added a further layer, with TIM as Official Telecommunications Partner and FiberCop as Fiber Infrastructure Partner connecting venues to high-capacity fiber infrastructure.
Germany’s regulatory model is the most explicitly focused on household and transport coverage. BNetzA’s 2019 auction required at least 100 Mbps for 98% of households in each federal state by the end of 2022, alongside obligations covering motorways, major federal roads, and rail routes. According to operators’ submissions, all three incumbents met the household threshold, but BNetzA said gaps remained in some transport locations and tunnels. That structure is aimed at population density and corridors rather than tourism zones, leaving mountain coverage more dependent on commercial incentive.
Federal support exists, but execution has been slower than the headline ambition suggests. The Mobilfunkstrategie earmarked about €1.1 billion (US$1.3 billion) from the Special Fund for Digital Infrastructure to support up to 5,000 additional masts, and by the end of 2024 the Mobilfunkinfrastrukturgesellschaft had funded 267 sites, with the first masts in operation and the remainder still in the realization phase. Updated obligations adopted in 2025 require at least 50 Mbps over 99.5% of Germany’s land area from 2030, so German ski resorts are still likely to rely primarily on operator-led investment for the foreseeable future.
Bars on the piste matter for competitive differentiation
For operators, the Alpine corridor is both a technical challenge and a strategic opportunity, a place where network quality is highly visible, directly experienced by affluent and digitally engaged visitors, and increasingly essential to resort operations.
The performance landscape across Europe’s top ski resorts reveals a set of structural themes that extend beyond the mountains. Markets where regulation explicitly targets geographic coverage (e.g., France’s ARCEP New Deal Mobile, Austria’s Alpine investment incentives, Italy’s joint coverage obligations) show stronger outcomes than markets where obligations are tied primarily to population thresholds and transport corridors. Germany’s household-centric auction conditions, despite generating significant auction revenue, leave tourism-dependent mountain zones as a secondary priority.
Operator strategy matters as much as regulation. A1 in Austria and Swisscom in Switzerland have built measurable Alpine advantages that function as competitive differentiation. In markets where operator performance is more tightly clustered (Italy) or where infrastructure sharing dominates (France), the quality of the user experience can become more uniform or constrained by shared bottlenecks.
Emerging direct-to-device (D2D) satellite services from providers like SpaceX’s Starlink and AST SpaceMobile represent a potential complementary layer for the highest-altitude and most remote Alpine terrain where terrestrial economics remain prohibitive. Switzerland’s Salt, for example, was the the first operator in Europe to report a successful (albeit non-commercial) Starlink direct-to-cell test, sending satellite-based text messages to a standard 4G smartphone over its mobile spectrum, touting it as a future coverage extension and resilience layer in the most remote areas.
Ookla retains ownership of this article including all of the intellectual property rights, data, content graphs and analysis. This article may not be quoted, reproduced, distributed or published for any commercial purpose without prior consent. Members of the press and others using the findings in this article for non-commercial purposes are welcome to publicly share and link to report information with attribution to Ookla.
Luke Kehoe leads Ookla’s research and thought leadership efforts in Europe.
An electronic engineering alumnus of University College Dublin, Luke has extensive experience collaborating with mobile operators, telecoms vendors, and government agencies in research and advisory roles across Europe. He has contributed to internationally recognised thought leadership publications in areas such as 5G, IoT, open RAN, and edge computing, working with prestigious organisations like the Telecom Infra Project and the World Economic Forum.
Analysis of Speedtest data across 20 major French rail corridors reveals sharp operator disparities in throughput, latency, and quality of experience.
France operates one of Europe’s most heavily used passenger rail networks, carrying hundreds of millions of riders each year across a system that spans high-speed LGV corridors, intercity Intercités routes, and dense regional TER services. As mobile connectivity has shifted from a convenience to a baseline expectation for rail passengers, the quality of cellular service along these corridors has become an infrastructure question in its own right.
The French government and France’s telecom regulator, ARCEP, recognized this early: the 2018 New Deal Mobile established explicit obligations for 4G coverage along approximately 23,000 km of regional rail track, with a target of 90% coverage of daily train services by the end of 2025. By ARCEP’s own reporting, trackside 4G coverage now reaches 97.7% to 99.3% of daily train services, depending on the operator.
Yet coverage presence and coverage quality are not the same thing, and the gap between them is where the passenger experience is actually shaped. Analysis of Speedtest Intelligence® data across a sample of 20 high-traffic French rail routes, encompassing LGV, intercity, and regional corridors, reveals that the passenger’s designated operator matters enormously for throughput, latency, and real-time application performance. The underlying driver is not a mystery: it maps closely to each operator’s spectrum position, particularly in the sub-1 GHz and mid-band ranges most relevant to rail propagation, and network footprint.
This analysis draws on Speedtest Intelligence data collected between March 2025 and March 2026, alongside quality of experience (QoE) and signal metrics, for all four French mobile network operators: Orange, SFR, Bouygues Telecom, and Free. Tests were captured within a 100-meter buffer of the 20 sampled rail corridors.
Key Takeaways:
Orange leads with a median download speed of 283.4 Mbps across the sampled rail corridors, 52% faster than second-place SFR (186.5 Mbps) and more than double Free’s 120.4 Mbps. Orange holds the largest sub-1 GHz spectrum portfolio in France at 57.4 MHz, including both 700 and 800 MHz bands, giving it materially deeper low-band reach in the radio environment along rail corridors where propagation and carriage penetration advantages are most pronounced.
Multiserver latency splits the market into two distinct tiers: Orange (33 ms) and Bouygues Telecom (34 ms) cluster within a millisecond of each other, while SFR (43 ms) and Free (64 ms) trail significantly. This two-tier pattern persists almost identically across content delivery networks (CDN), gaming, and video conferencing latency, suggesting potential structural network architecture differences in core routing rather than route-specific variation.
Orange recorded a leading median 4G signal quality (RSRQ) of -9 dB, a 3 dB advantage over all three rivals (each at -12 dB), despite near-identical signal strength (RSRP) readings of -100 to -104 dBm across operators. The RSRQ gap points to better spectral isolation or more effective load management across Orange’s rail-adjacent cell sites, potentially supported by its 10 MHz mid-band spectrum advantage at 2600 MHz and greater carrier aggregation depth.
Application-layer quality of experience (QoE) metrics partially compress the operator gap: median web page load times span only ~0.1 seconds from Orange (1.1 seconds) to Bouygues Telecom (1.2 seconds), and video conferencing jitter varies by just 2 ms across all four operators (4 to 6 ms). However, video start time inverts the throughput ranking, with SFR leading at 1.3 seconds and Bouygues trailing at 1.6 seconds, pointing to differences in CDN peering, edge caching, or video optimization strategy.
France’s New Deal Mobile already provides a relatively robust coverage obligation framework. However, ARCEP’s February 2025 enforcement notices to all four operators cites over 300 blocked or delayed deployment sites. This highlights that meeting even geographic coverage targets remains a challenge before quality of service (QoS) metrics can enter the regulatory conversation. Among major European markets, only Germany has moved toward mandating performance floors on rail, while the UK, Spain, and Italy lag further behind.
Orange’s speed lead maps to spectrum depth, not just signal reach
During the period of analysis between March 2025 and March 2026, the download speed disparity observed across French operators on rail is striking. Orange’s median of 283.4 Mbps is approximately 52% above SFR’s 186.5 Mbps, ~110% above Bouygues Telecom’s 135.0 Mbps, and ~135% above Free’s 120.4 Mbps. This is not a marginal gap: it represents a fundamentally different user experience in bandwidth-intensive applications such as video streaming, large file transfers, and cloud-based workflows.
Orange leads on download speed, while Bouygues is ahead on upload
Speedtest Intelligence® | March 2025 – March 2026
Analysis of spectrum data published by GSMA Intelligence provides an explanation for this disparity. Orange holds 257 MHz of total assigned spectrum nationally, the largest portfolio among the four operators, compared with 227 MHz for SFR, 217 MHz for Bouygues Telecom, and 207 MHz for Free. More critically for rail environments, where low-frequency propagation and in-vehicle penetration matter most, Orange leads in sub-1 GHz holdings at 57.4 MHz spanning both the 700 and 800 MHz bands.
SFR and Bouygues Telecom each hold 47.4 MHz of sub-1 GHz spectrum, while Free holds only 37.4 MHz and notably lacks any 800 MHz assignment entirely, relying on 700 MHz and 900 MHz for its low-band coverage layer. Free’s absence from the 800 MHz band, the workhorse of 4G coverage in rural and semi-rural terrain, is a constraint for rail corridor performance.
Orange also holds a 10 MHz mid-band advantage at 2600 MHz (40 MHz vs. 30 MHz for SFR and Bouygues Telecom), which, when combined with its low-band depth, affords greater carrier aggregation flexibility across the frequency layers most relevant to rail. At 3.5 GHz, where Orange holds 90 MHz, the performance impact on rail is limited: the propagation characteristics of C-band are less well suited to the extended inter-site distances and in-carriage penetration losses typical of rail environments.
Orange's unique low-band depth lends it a coverage advantage
Analysis of GSMA Intelligence Data | 2026
Upload speeds tell a different story. Bouygues Telecom leads at 24.7 Mbps, narrowly ahead of Orange at 23.6 Mbps, with SFR at 16.6 Mbps and Free at 9.2 Mbps. The Bouygues-Orange convergence on upload, despite Orange’s clear download lead, may reflect uplink scheduling optimization or time division duplexing (TDD) configuration choices that weight differently across operators.
Analysis of the signal environment confirms this spectrum narrative. Median 4G reference signal received power (RSRP) readings, which measure the strength of the signal from the cell tower, are tightly clustered across operators, ranging from -100 dBm (Bouygues Telecom) to -104 dBm (Free), indicating that all four operators reach rail corridors at broadly comparable signal strength. Yet Orange’s reference signal received quality (RSRQ), which measures the quality of the signal, of -9 dB is 3 dB better than every rival (all at -12 dB).
Since RSRQ captures signal quality relative to total received power including interference, this gap suggests that Orange achieves better spectral isolation on rail, whether through denser site grids, more effective inter-cell interference management, or the greater carrier aggregation depth that its wider spectrum portfolio likely enables.
Orange's 3 dB signal quality advantage persists despite comparable signal strength
Speedtest Intelligence® | March 2025 – March 2026
When coverage does not equal quality: the QoE picture on French rail
While throughput and latency capture raw network capability, QoE metrics reflect what passengers actually feel when using applications. Here, the operator gap narrows considerably at the application layer, even as it remains wide at the access layer.
Median web page load times span just ~0.1 seconds across operators: from Orange at 1.1 seconds to Bouygues Telecom at 1.2 seconds, with SFR (1.2 seconds) and Free (1.2 seconds) in between. That ~10% spread stands in contrast to the 135% gap in raw download throughput, illustrating how application-layer optimization, CDN placement, and protocol efficiency can partially compensate for underlying network differences. A web page load is shaped by DNS resolution, TLS negotiation, and content rendering, all of which are less sensitive to peak throughput than to latency and connection reliability.
Video start time introduces an inversion: SFR leads at 1.3 seconds, followed by Free at 1.4 seconds, Orange at 1.4 seconds, and Bouygues Telecom at 1.6 seconds. The fact that SFR and Free outperform Orange on video start, despite trailing on throughput, points to potential differences in CDN peering arrangements, edge caching topology, or video player optimization that are distinct from raw radio performance. Video start time is heavily influenced by the initial buffering phase, where server proximity and connection setup overhead can outweigh sustained bandwidth.
Application-layer QoE compresses the operator gap despite wide throughput differences
Speedtest Intelligence® | March 2025 – March 2026
Video conferencing metrics reveal a broadly similar picture across all four networks on rail, with median jitter ranging from just 4 ms (Bouygues Telecom) to 6 ms (Free) and mean packet loss from 2.79% (Orange) to 3.47% (Bouygues Telecom). These are not dramatic spreads. Median video conferencing latency falls into the same two-tier structure as multiserver latency: Orange and SFR at 59 ms, Free at 68 ms, and Bouygues Telecom at 77 ms.
CDN and gaming latency mirror this pattern exactly: Orange and SFR share a 59 ms median, Free sits at 68 ms, and Bouygues Telecom at 77 ms. The consistency of this tiering across multiple latency endpoints suggests a core network or peering architecture difference rather than a radio access variation.
Two-tier latency: Orange & Bouygues lead on multi-server, Orange & SFR on apps
Speedtest Intelligence® | March 2025 – March 2026
France’s rail coverage framework: obligations, enforcement, and the quality blind spot
France’s approach to mobile coverage on rail rests primarily on the New Deal Mobile, the landmark 2018 agreement between the government, ARCEP, and all four operators that embedded legally binding coverage commitments into operator frequency licenses. For rail specifically, the framework mandated 4G coverage along 90% of daily train services across approximately 23,000 km of regional rail track by December 31, 2025, with phased obligations for in-vehicle coverage on the 700 MHz band extending to 2030.
ARCEP enforces these obligations through a combination of operator-reported coverage maps, field measurement campaigns exceeding one million data points annually, and its public Mon Reseau Mobile platform. The framework has delivered measurable progress: white zones with zero mobile coverage have fallen from 11% of the territory in 2017 to under 2% (by Q3 2023), and trackside 4G coverage rates now exceed 97% for all operators.
However, ARCEP’s 2024 quality of service campaign found that web page loads succeeded in only around 70% of attempts on average across TGV, Intercites, and TER services, with per-operator success rates varying from around 64% to 79%. Coverage presence, in other words, does not guarantee usable service.
The enforcement reality is challenging. France has demonstrated willingness to levy penalties, but the clearest recent example is from the fixed side rather than mobile: ARCEP fined Orange €26 million (US$30 million) in November 2023 for failing to meet its legally binding FTTH rollout commitments in AMII areas. On the mobile side, ARCEP has also issued multiple formal notices under the New Deal Mobile framework.
Looking ahead, the transition from GSM-R to FRMCS (Future Railway Mobile Communication System), the 5G-based European standard for railway operational communications, will add a new dimension to rail connectivity.
SNCF Réseau appears to be pursuing a hybrid FRMCS model in which dedicated railway infrastructure remains central on the core network, while commercial mobile networks may be used selectively to extend coverage or reduce deployment cost on certain regional or cross-border sections. This will tie commercial network quality on rail directly to operational railway communications for the first time, potentially raising the stakes for on-rail mobile performance beyond passenger experience.
How France’s approach compares: regulatory lessons from Germany, the UK, Spain, and Italy
France sits in the middle of a wide European spectrum on rail mobile regulation, a position that becomes clearer when compared against its four largest peer markets.
Germany has moved furthest toward regulating quality rather than just coverage on rail. Under conditions attached to its 2019 5G spectrum auction, BNetzA set explicit bandwidth floors: 100 Mbps along major railway lines (Hauptschienenwege) and 50 Mbps along other railway lines. Operators have equipped approximately 400 rail tunnels with mobile coverage as part of broader transport corridor obligations. The GINT program has allocated €6.4 million to test 5G feasibility on rail, and FRMCS pilots are expected from 2026. Germany’s approach represents a regulatory philosophy fundamentally different from France’s: it targets what the network delivers, not merely where it reaches.
The United Kingdom sits at the other end of the spectrum. Ofcom’s last dedicated rail connectivity study dates to 2019, and Parliament has repeatedly called for annual reporting that has not materialized. The UK lacks rail-specific spectrum obligations, and responsibility for rail connectivity is fragmented across multiple government departments. The Shared Rural Network targets rural coverage broadly but does not address rail corridors specifically. A Network Rail and Neos Networks infrastructure agreement signals momentum, but a coordinated rail connectivity program is not expected to deliver results before 2027 at the earliest.
Spain has adopted a public-private partnership model. ADIF, the national rail infrastructure manager, signed a €25.5 million (US$29.4 million) contract with Vodafone and SEMI for 5G deployment on high-speed AVE routes, funded in part through the EU Recovery and Resilience Facility. The Spanish approach is project-driven rather than obligation-based, delivering targeted improvements on flagship routes without establishing a universal framework.
Italy has focused on nodes rather than links. FS Group and TIM have partnered on tunnel coverage across high-speed corridors, while INWIT has deployed 5G infrastructure at major stations including Roma Termini. Italy’s PNRR-funded feasibility studies have explored corridor-level connectivity, but AGCOM has not imposed rail-specific coverage or quality obligations. The emphasis remains on ensuring connectivity at stations rather than along the routes between them.
At the EU level, the Connecting Europe Facility (CEF) Digital program allocates approximately €300 million (US$345 million) for 5G corridors along Trans-European Transport Network (TEN-T) routes through 2027. Several France-relevant inception studies have been approved, including projects for the Paris-Brussels and Frejus cross-border rail corridors. The revised TEN-T Regulation (2024/1679) emphasizes digital connectivity as a component of transport infrastructure, but defers specific mandates to member states.
Coverage is a floor, not a ceiling, on rail
France has built one of Europe’s most progressive mobile coverage obligation frameworks for rail, and it has largely eliminated coverage dead zones across the national network thanks to proactive collaboration with industry. Our data reveals that the challenge has now shifted to deeper network optimization, which requires going beyond baseline coverage metrics to understand what passengers actually experience on trains when they have a signal.
The constraints of coverage obligations alone in stimulating better outcomes should be taken into account in the absence of other supporting measures. Orange’s dominant speed performance likely maps to its spectrum advantages, a 57.4 MHz sub-1 GHz portfolio and a 10 MHz lead in mid-band holdings, that no coverage obligation can easily replicate for its rivals. Competitive dynamics beyond the mandate may also play a role here.
As FRMCS approaches and CEF Digital projects advance from inception studies toward deployment, the strategic question shifts from whether trains have signals to what that signal can deliver. Germany’s model of regulating bandwidth floors on rail, rather than just coverage existence, offers a forward-looking template. It could be reinforced with additional metrics for video, latency, QoE, etc. For France and the rest of Europe, the next phase of rail connectivity policy will need to grapple not just with where networks reach, but with how well they perform when they get there.
L’écart de connectivité ferroviaire en France : pourquoi les seuls objectifs de couverture ne peuvent pas combler le fossé d’expérience mobile sur les voies ferrées
L’analyse des données Speedtest sur 20 corridors ferroviaires majeurs français révèle des disparités nettes entre opérateurs en termes de débit et de latence, exposant les limites d’un cadre réglementaire qui impose la portée géographique mais pas encore la qualité de service.
La France opère l’un des réseaux ferroviaires de passagers les plus intensément utilisés d’Europe, transportant des centaines de millions de voyageurs chaque année sur un système qui s’étend des corridors LGV à grande vitesse, aux services Intercités et aux services régionaux TER denses. À mesure que la connectivité mobile est passée d’une commodité à une attente de base pour les passagers des trains, la qualité du service cellulaire le long de ces corridors est devenue une question d’infrastructure à part entière.
Le gouvernement français et le régulateur français des télécommunications, l’ARCEP, ont reconnu ce fait précocement : le New Deal Mobile de 2018 a établi des obligations explicites pour la couverture 4G le long d’environ 23 000 km de voies ferrées régionales, avec un objectif de 90 % de couverture des services de trains quotidiens d’ici fin 2025. Selon le propre rapport de l’ARCEP, la couverture 4G en bordure de voies ferrées atteint désormais 97,7 % à 99,3 % des services de trains quotidiens, selon l’opérateur.
Cependant, la présence de couverture et la qualité de la couverture ne sont pas la même chose, et c’est le fossé entre elles qui façonne réellement l’expérience des passagers. L’analyse des données Speedtest Intelligence® sur un échantillon de 20 routes ferroviaires françaises à fort trafic, englobant des corridors LGV, Intercités et régionaux, révèle que l’opérateur auquel s’abonne un passager importe énormément pour le débit, la latence et les performances des applications en temps réel. Le facteur sous-jacent n’est pas un mystère : il correspond étroitement au portefeuille de spectre de chaque opérateur, particulièrement dans les bandes sub-1 GHz et moyennes les plus efficaces pour la propagation ferroviaire, ainsi qu’à son empreinte réseau.
Cette analyse s’appuie sur les données Speedtest Intelligence collectées entre mars 2025 et mars 2026, ainsi que sur les métriques de qualité d’expérience (QoE) et de signal, couvrant les quatre opérateurs mobiles français : Orange, SFR, Bouygues Telecom et Free. Les tests ont été capturés dans un rayon de 100 mètres autour des 20 corridors ferroviaires échantillonnés.
Enseignements clés :
Orange domine avec un débit descendant médian de 283,40 Mbps sur les corridors ferroviaires échantillonnés, 52 % plus rapide que SFR en deuxième position (186,53 Mbps) et plus du double des 120,41 Mbps de Free. Orange détient le plus grand portefeuille de spectre sub-1 GHz en France avec 57,4 MHz, incluant les bandes 700 et 800 MHz, lui donnant une portée clairement plus importante en bande basse dans l’environnement radio le long des corridors ferroviaires où les avantages de propagation et de pénétration dans les wagons sont les plus importants.
La latence multi-serveurs divise le marché en deux niveaux distincts : Orange (33 ms) et Bouygues Telecom (34 ms) se situent à moins d’une milliseconde l’une de l’autre, tandis que SFR (43 ms) et Free (64 ms) accusent un retard important. Ce schéma à deux niveaux persiste presque identiquement sur les réseaux de distribution de contenu (CDN), les jeux et la conférence vidéo en latence, suggérant des différences potentielles d’architecture réseau structurelle dans l’acheminement central plutôt qu’une variation spécifique aux itinéraires.
Orange a enregistré une qualité de signal 4G médiane dominante (RSRQ) de -9 dB, un avantage de 3 dB sur les trois rivaux (chacun à -12 dB), malgré des lectures de puissance de signal (RSRP) pratiquement identiques de -100 à -104 dBm sur tous les opérateurs. L’écart RSRQ pointe vers une meilleure isolation spectrale ou une gestion de charge plus efficace sur les sites cellulaires adjacents aux voies ferrées d’Orange, potentiellement soutenue par son avantage de spectre en mi-bande de 10 MHz sur 2600 MHz et une profondeur d’agrégation de porteuses plus importante.
Les métriques de qualité d’expérience (QoE) au niveau des applications compriment partiellement l’écart opérateur : les temps de chargement des pages Web médians s’étendent sur seulement environ 0,1 secondes d’Orange (1,1 secondes) à Bouygues Telecom (1,2 secondes), et la gigue (jitter) de conférence vidéo varie de seulement 2 ms sur les quatre opérateurs (4 à 6 ms). Cependant, le temps de démarrage vidéo inverse le classement du débit, SFR se classant en tête à 1,3 secondes et Bouygues en retard à 1,6 secondes, pointant vers des différences dans l’appairage CDN, l’utilisation de serveur cache en périphérie ou la stratégie d’optimisation vidéo.
Le New Deal Mobile français fournit déjà un cadre d’obligation de couverture relativement robuste. Cependant, les avis d’application de février 2025 de l’ARCEP à tous les quatre opérateurs citent plus de 300 sites de déploiement bloqués ou retardés. Cela souligne que respecter même les objectifs de couverture géographique reste un défi avant que les métriques de qualité de service (QoS) puissent entrer dans le débat réglementaire. Parmi les grands marchés européens, seule l’Allemagne a avancé pour mandater des minimums de performance sur les voies ferrées, tandis que le Royaume-Uni, l’Espagne et l’Italie accusent davantage de retard.
L’avance en vitesse d’Orange correspond à la profondeur spectrale, pas seulement à la portée du signal
Au cours de la période d’analyse entre mars 2025 et mars 2026, la disparité de vitesse de téléchargement observée entre les opérateurs français sur les voies ferrées est frappante. La médiane d’Orange de 283,40 Mbps est environ 52 % supérieure aux 186,53 Mbps de SFR, ~110 % supérieure aux 135,02 Mbps de Bouygues Telecom, et ~135 % supérieure aux 120,41 Mbps de Free. Ce n’est pas un écart marginal : il représente une expérience utilisateur fondamentalement différente dans les applications intensives en bande passante telles que la transmission vidéo, les transferts de fichiers volumineux et les applications cloud.
Débits descendants et montants des opérateurs sur les corridors ferroviaires français
Speedtest Intelligence® | mars 2025 – mars 2026
L’analyse des données de spectre publiées par GSMA Intelligence fournit une explication de cette disparité. Orange détient 257 MHz de spectre assigné au total au niveau national, le plus grand portefeuille parmi les quatre opérateurs, comparé avec 227 MHz pour SFR, 217 MHz pour Bouygues Telecom et 207 MHz pour Free. Plus crucialement pour les environnements ferroviaires, où la propagation en basse fréquence et la pénétration dans les wagons comptent le plus, Orange domine les allocations sub-1 GHz avec 57,4 MHz couvrant à la fois les bandes 700 et 800 MHz.
SFR et Bouygues Telecom détiennent chacun 47,4 MHz de spectre sub-1 GHz, tandis que Free n’en détient que 37,4 MHz et ne dispose notamment d’aucune attribution dans la bande 800 MHz, s’appuyant sur 700 et 900 MHz pour sa couche de couverture en bande basse. L’absence de Free de la bande 800 MHz, l’outil de base de la couverture 4G dans le terrain rural et semi-rural, est une contrainte pour la performance des corridors ferroviaires.
Orange détient également un avantage en mi-bande de 10 MHz sur 2600 MHz (40 MHz comparés à 30 MHz pour SFR et Bouygues Telecom), qui, combiné avec sa profondeur en bande basse, lui confère une flexibilité d’agrégation de porteuses plus importante sur les couches de fréquence les plus efficaces pour les voies ferrées. Sur 3,5 GHz, où Orange détient 90 MHz, l’impact sur la performance ferroviaire est limité : les caractéristiques de propagation de la bande C conviennent moins bien aux distances inter-sites étendues et aux pertes de pénétration dans les wagons typiques des environnements ferroviaires.
Portefeuille de spectre des opérateurs mobiles français
Analyse des données GSMA Intelligence | 2026
Les débits montants dénotent une toute autre réalité. Bouygues Telecom mène à 24,75 Mbps, de justesse devant Orange à 23,59 Mbps, avec SFR à 16,59 Mbps et Free à 9,18 Mbps. La convergence Bouygues-Orange sur la vitesse ascendante, malgré la nette avance en descente d’Orange, peut refléter des choix d’optimisation de planification ou de configuration TDD qui pèsent différemment selon les opérateurs.
L’analyse de l’environnement de signal confirme cette observation. Les lectures médianes de puissance du signal de référence reçu 4G (RSRP), qui mesurent la force du signal de la tour cellulaire, sont étroitement regroupées entre opérateurs, allant de -100 dBm (Bouygues Telecom) à -104 dBm (Free), indiquant que les quatre opérateurs atteignent les corridors ferroviaires à une intensité de signal comparable. Cependant, la qualité du signal de référence reçu (RSRQ) d’Orange, qui mesure la qualité du signal, de -9 dB, est 3 dB meilleure que celle de chaque rival (tous à -12 dB).
Étant donné que RSRQ capture la qualité du signal par rapport à la puissance totale reçue incluant les interférences, cet écart suggère qu’Orange réalise une meilleure isolation spectrale sur les voies ferrées, que ce soit par des grilles de sites plus denses, une gestion plus efficace des interférences inter-cellules, ou la profondeur d’agrégation de porteuses plus importante que son portefeuille de spectre plus large favorise probablement.
Qualité du signal 4G sur les corridors ferroviaires français
Speedtest Intelligence® | mars 2025 – mars 2026
Quand la couverture ne rime pas avec qualité : l’état de la QoE sur les lignes ferroviaires françaises
Bien que le débit et la latence capturent la capacité réseau brute, les métriques de qualité d’expérience reflètent ce que les passagers perçoivent réellement lorsqu’ils utilisent les applications. Ici, l’écart opérateur se rétrécit considérablement au niveau application, même s’il reste large au niveau de l’accès.
Les temps de chargement des pages Web médians s’étendent sur seulement environ 0,1 secondes entre opérateurs : d’Orange à 1,1 secondes à Bouygues Telecom à 1,2 secondes, avec SFR (1,2 secondes) et Free (1,2 secondes) entre les deux. Cet écart d’environ 10 % contraste fortement avec l’écart de 135 % en débit de téléchargement brut, illustrant comment l’optimisation au niveau application, le placement CDN et l’efficacité des protocoles peuvent partiellement compenser les différences réseau sous-jacentes. Un chargement de page Web est façonné par la résolution DNS, la négociation TLS et le rendu de contenu, tout cela étant moins sensible au débit maximal qu’à la latence et à la fiabilité de la connexion.
Le temps de démarrage vidéo introduit une inversion du classement : SFR se classe en tête à 1,3 secondes, suivi de Free à 1,4 secondes, Orange à 1,4 secondes et Bouygues Telecom à 1,6 secondes. Le fait que SFR et Free surpassent Orange au démarrage vidéo, malgré un retard de débit, pointe vers des différences potentielles dans les arrangements d’appairage CDN, la topologie du serveur cache en périphérie ou l’optimisation du lecteur vidéo qui sont distinctes de la performance radio brute. Le temps de démarrage vidéo est fortement influencé par la phase de buffering initiale, où la proximité du serveur et la surcharge pour l’établissement de connexion peuvent surpasser la bande passante soutenue.
Métriques de qualité d'expérience sur les voies ferrées françaises
Speedtest Intelligence® | mars 2025 – mars 2026
Les métriques de conférence vidéo révèlent un état largement similaire sur les quatre réseaux sur les voies ferrées, avec une gigue (jitter) médiane variant de seulement 4 ms (Bouygues Telecom) à 6 ms (Free) et une perte de paquets moyenne de 2,79 % (Orange) à 3,47 % (Bouygues Telecom). Ce ne sont pas des écarts dramatiques. La latence de conférence vidéo médiane tombe dans la même structure à deux niveaux que la latence multi-serveurs : Orange et SFR à 59 ms, Free à 68 ms et Bouygues Telecom à 77 ms.
Les latences CDN et jeux reflètent exactement ce modèle : Orange et SFR partagent une médiane de 59 ms, Free se situe à 68 ms et Bouygues Telecom à 77 ms. La cohérence de cette hiérarchisation sur plusieurs points de terminaison de latence suggère une différence d’architecture réseau central ou d’appairage plutôt qu’une variation d’accès radio.
Niveaux de latence des opérateurs français sur les voies ferrées
Speedtest Intelligence® | mars 2025 – mars 2026
Le cadre de couverture ferroviaire français : obligations, application et l’angle mort de la qualité
L’approche française de la couverture mobile sur les voies ferrées repose principalement sur le New Deal Mobile, l’accord majeur de 2018 entre le gouvernement, l’ARCEP et les quatre opérateurs, intégrant des engagements de couverture juridiquement contraignants dans les licences de fréquences des opérateurs. Pour les voies ferrées spécifiquement, le cadre mandate la couverture 4G le long de 90 % des services de trains quotidiens sur environ 23 000 km de voies ferrées régionales d’ici le 31 décembre 2025, avec des obligations échelonnées pour la couverture dans les wagons sur la bande 700 MHz s’étendant à 2030.
L’ARCEP applique ces obligations par une combinaison de cartes de couverture rapportées par les opérateurs, de campagnes de mesure sur le terrain dépassant un million de points de données annuels et de sa plateforme publique Mon Réseau Mobile. Ce dispositif a permis des avancées tangibles : les zones blanches, dépourvues de toute couverture mobile, sont passées de 11 % du territoire en 2017 à moins de 2 % (au T3 2023), et les taux de couverture 4G le long des voies ferrées dépassent désormais les 97 % pour l’ensemble des opérateurs.
Cependant, la campagne de qualité de service de l’ARCEP en 2024 a constaté que les chargements de pages Web n’ont réussi que dans environ 70 % des tentatives en moyenne sur les services TGV, Intercités et TER, avec des taux de réussite par opérateur variant d’environ 64 % à 79 %. La présence de couverture, en d’autres termes, ne garantit pas un service utilisable.
Dans les faits, faire respecter ces obligations s’avère complexe. Si la France a déjà prouvé sa volonté de sévir, l’exemple récent le plus marquant concerne le réseau fixe et non le mobile : en novembre 2023, l’ARCEP a infligé une amende de 26 millions d’euros (30 millions de dollars) à Orange pour le non-respect de ses engagements juridiquement contraignants de déploiement FTTH en zone AMII. Sur le front du mobile, l’ARCEP a également adressé de multiples mises en demeure dans le cadre du New Deal Mobile.
À l’avenir, la transition du GSM-R vers le FRMCS (Future Railway Mobile Communication System), la norme européenne basée sur 5G pour les communications opérationnelles ferroviaires, ajoutera une nouvelle dimension à la connectivité ferroviaire.
SNCF Réseau semble s’orienter vers un modèle FRMCS hybride : l’infrastructure ferroviaire dédiée resterait au cœur du réseau principal, tandis que les réseaux mobiles commerciaux pourraient être mis à contribution de façon ciblée pour étendre la couverture ou réduire les coûts de déploiement sur certains tronçons régionaux ou transfrontaliers. Pour la première fois, la qualité des réseaux commerciaux sur le domaine ferroviaire sera directement corrélée aux communications opérationnelles. Les enjeux liés à la connectivité mobile sur les rails s’en trouveront ainsi décuplés, dépassant largement le simple cadre de l’expérience voyageur.
Comment l’approche française se compare : leçons réglementaires d’Allemagne, du Royaume-Uni, d’Espagne et d’Italie
La France se situe au milieu d’un large spectre européen en matière de régulation mobile ferroviaire, une position qui devient plus claire lorsqu’elle est comparée à ses quatre plus grands marchés pairs.
L’Allemagne a avancé le plus loin vers la régulation de la qualité plutôt que seulement la couverture sur les voies ferrées. Selon les conditions attachées à son enchère de spectre 5G de 2019, BNetzA a fixé explicitement le minimum pour la bande passante : 100 Mbps le long des lignes ferroviaires majeures (Hauptschienenwege) et 50 Mbps le long des autres lignes ferroviaires. Les opérateurs ont équipé environ 400 tunnels ferroviaires avec une couverture mobile dans le cadre d’obligations plus larges de corridors de transport. Le programme GINT a alloué 6,4 millions d’euros pour tester la faisabilité de la 5G sur les voies ferrées, et les pilotes FRMCS sont attendus à partir de 2026. L’approche allemande représente une philosophie réglementaire fondamentalement différente de celle de la France : elle cible ce que le réseau fournit, pas simplement où il atteint.
Le Royaume-Uni se situe à l’autre extrémité du spectre. La dernière étude dédiée d’Ofcom sur la connectivité ferroviaire date de 2019, et le Parlement a appelé à plusieurs reprises à des rapports annuels qui ne se sont pas matérialisés. Le Royaume-Uni n’a pas d’obligations de spectre ferroviaire spécifiques, et la responsabilité de la connectivité ferroviaire est fragmentée entre plusieurs départements gouvernementaux. Le Shared Rural Network cible largement la couverture rurale mais ne s’adresse pas spécifiquement aux corridors ferroviaires. Un accord d’infrastructure entre Network Rail et Neos Networks signale un élan, mais un programme de connectivité ferroviaire coordonné n’est pas attendu pour fournir des résultats avant 2027 au plus tôt.
L’Espagne a adopté un modèle de partenariat public-privé. ADIF, le gestionnaire national des infrastructures ferroviaires, a signé un contrat de 25,5 millions d’euros avec Vodafone et SEMI pour le déploiement de 5G sur les routes AVE à grande vitesse, financé en partie par la Facilité pour la reprise et la résilience de l’UE. L’approche espagnole est basée sur des projets plutôt que sur des obligations, fournissant des améliorations ciblées sur les itinéraires phares sans établir un cadre universel.
L’Italie s’est concentrée sur les nœuds plutôt que sur les liens. Le groupe FS et TIM se sont associés sur la couverture des tunnels sur les corridors à grande vitesse, tandis qu’INWIT a déployé l’infrastructure 5G dans les principales gares incluant Roma Termini. Les études de faisabilité financées par le PNRR de l’Italie ont exploré la connectivité au niveau des corridors, mais l’AGCOM n’a pas imposé d’obligations de couverture ou de qualité ferroviaires. L’accent demeure sur l’assurance de la connectivité aux gares plutôt que le long des itinéraires qui les séparent.
Au niveau de l’UE, le programme Connecting Europe Facility (CEF) Digital alloue environ 300 millions d’euros pour les corridors 5G le long des routes du Réseau transeuropéen de transport (RTE-T) jusqu’à 2027. Plusieurs études d’amorçage pertinentes pour la France ont été approuvées, incluant des projets pour les corridors ferroviaires transfrontaliers Paris-Bruxelles et Fréjus. Le règlement révisé RTE-T (2024/1679) souligne la connectivité numérique comme composante de l’infrastructure de transport, mais renvoie les obligations spécifiques aux États membres.
La couverture est un plancher, pas un plafond, sur les voies ferrées
La France a construit l’un des cadres d’obligations de couverture mobile les plus progressifs d’Europe pour les voies ferrées, et elle a largement éliminé les zones mortes de couverture sur le réseau national grâce à une collaboration proactive avec l’industrie. Nos données révèlent que le défi a maintenant basculé vers une optimisation réseau plus profonde, qui nécessite d’aller au-delà des simples métriques de couverture de base pour comprendre ce que les passagers vivent réellement sur les trains quand ils ont un signal.
En l’absence d’autres mesures de soutien, il convient de prendre en compte les contraintes des obligations de couverture seules dans la stimulation de meilleurs résultats. Par exemple, la performance de débit dominante d’Orange est grâce à son portefeuille sub-1 GHz de 57,4 MHz et son avantage de spectre mi-bande de 10 MHz (et peut également refléter la concurrence entre opérateurs au-delà du mandat), des avantages qu’aucune obligation de couverture ne peut facilement reproduire pour ses rivaux.
À mesure que FRMCS approche et que les projets CEF Digital progressent des études initiales au déploiement, la question stratégique passe de savoir si les trains ont des signaux à ce que ce signal peut fournir. Le modèle allemand de régulation des planchers de bande passante sur les voies ferrées, plutôt que simplement l’existence de la couverture, offre un modèle avant-gardiste. Il pourrait être renforcé par des métriques supplémentaires pour la vidéo, la latence, la QoE, etc. Pour la France et le reste de l’Europe, la prochaine phase de la politique de connectivité ferroviaire devra s’attaquer non seulement à la couverture géographique des réseaux, mais aussi à la performance de ces derniers une fois sur place.
Ookla retains ownership of this article including all of the intellectual property rights, data, content graphs and analysis. This article may not be quoted, reproduced, distributed or published for any commercial purpose without prior consent. Members of the press and others using the findings in this article for non-commercial purposes are welcome to publicly share and link to report information with attribution to Ookla.
Luke Kehoe leads Ookla’s research and thought leadership efforts in Europe.
An electronic engineering alumnus of University College Dublin, Luke has extensive experience collaborating with mobile operators, telecoms vendors, and government agencies in research and advisory roles across Europe. He has contributed to internationally recognised thought leadership publications in areas such as 5G, IoT, open RAN, and edge computing, working with prestigious organisations like the Telecom Infra Project and the World Economic Forum.
Ookla® has formed a partnership with Arcep, France’s telecommunications regulator, to integrate Speedtest® crowdsourced data into Arcep’s “Mon Réseau Mobile” mapping platform, giving French consumers richer, more up-to-date insight into mobile network quality across the country.
Arcep’s Mon Réseau Mobile helps users identify the best mobile operator wherever they go in France, from home and work to vacation destinations and everywhere in between. With this partnership, Arcep’s platform now incorporates speed data (both download and upload) and latency drawn from Speedtest, supplementing Arcep’s existing coverage data with real-world, user-generated measurements. This quarter alone, Arcep published more than 420,000 Ookla measurements, with each French department represented by between 300 and 80,000 test points.
Ookla’s anonymized and aggregated data methodology upholds Arcep’s code of conduct, which promotes transparency in how mobile data is collected. Results will be published quarterly for the duration of the one-year partnership, and will also be available as open data on data.gouv.fr.
Speedtest data complements Arcep’s annual mobile service quality survey, which covers 1,700,000 test points, providing users with additional and more up-to-date information. The partnership supports Arcep’s broader data-driven regulation philosophy, reaffirmed under its Ambition 2030 strategy and based on two key principles:
Making regulator-collected data publicly available so consumers can make informed choices about their operator
Incentivizing operators to compete not just on price, but on the quality of service and coverage they offer
The approach also draws on data collected from users themselves—who are often the first to detect market malfunctions—to identify early warning signs and better tailor regulation to their needs. For Arcep and the nation’s consumers, data from the partnership is particularly valuable in rural areas, which have historically had fewer measurement points.
Arcep is not alone in turning to trusted third-party data to inform policy and empower consumers. Ookla works with telecommunications regulators around the world, including the FCC in the United States, the CRTC in Canada, ComReg in Ireland, and IMDA in Singapore, among others, providing the kind of independent, crowdsourced intelligence that helps shape better connectivity outcomes for users everywhere.To learn how Ookla’s data can support your organization, reach out to our team.
Ookla retains ownership of this article including all of the intellectual property rights, data, content graphs and analysis. This article may not be quoted, reproduced, distributed or published for any commercial purpose without prior consent. Members of the press and others using the findings in this article for non-commercial purposes are welcome to publicly share and link to report information with attribution to Ookla.
Dave Andersen is a Marketing Program Manager at Ookla, where he creates enterprise and consumer content across Ookla’s brands. Dave got his start in the telco space in 2012, producing content for RootMetrics. Dave has a bachelors in marketing from Washington State University and studied creative writing in Oklahoma State’s MFA program.