| June 12, 2024

Exploring 5G Indoor Connectivity Within the Greater Bay Area

繁體字

The Guangdong-Hong Kong-Macao Greater Bay Area (GBA) is one of the regions with the fastest urbanization process in China in the past 4 decades. With the highest concentration of skyscrapers in the world, operators in the region must prioritize seamless indoor and outdoor 5G coverage to optimize services and meet customer needs.

In this report, we use data from Cell Analytics™ to examine the 5G indoor performance and signal quality across Guangzhou, Shenzhen, Hong Kong, and Macau, the four major cities in GBA.

Key Takeaways

  • Guangzhou and Shenzhen showed better city-wide indoor 5G coverage and quality compared to Hong Kong and Macau. Guangzhou reported a mean RSRP of -82.89 dBm, with Shenzhen slightly lower at -86.96 dBm. Additionally, both cities boast better 5G indoor quality with scores of 10.09 dB and 10.98 dB, respectively. In contrast, Hong Kong’s mean RSRP was at -87.36 dBm, while Macau’s was at -91.02 dBm.
  • China Mobile in Guangzhou stands out for offering better indoor 5G coverage in the city. The operator reported a mean RSRP of -79.17 dBm, which is significantly better by approximately 8 dB compared to China Unicom’s mean RSRP of -87.2 dBm. There were only minor differences in 5G indoor signal strength between operators in the other cities, but in Macau, the operators had significantly weaker indoor signal strength than almost all other operators in the other selected cities.

Indoor 5G Traffic Continue to Rise Among the Greater Bay Area Cities

The Guangdong-Hong Kong-Macao Greater Bay Area, commonly known as the Greater Bay Area (GBA), comprises nine cities in the Guangdong region of China and the two Special Administrative Regions (SAR) of Hong Kong and Macau. These cities are connected by an extensive transportation network, including high-speed rail, bridges, and tunnels, due to their proximity. As a key economic and technological hub in China, the adoption of 5G technology has become a key driver in the region, enabling the transformation of various industries and promoting automation and digitalization. In our recent article, we delved into the factors driving the rollout of 5G technology and examined its performance in the GBA region.

Indoor coverage is particularly important for the major “core” cities of GBA; Guangzhou, Shenzhen, Hong Kong, and Macau, where high-rise buildings dominate the skyline and indoor spaces play essential roles in commercial and tourist activities. In this recent article, we touched on the different technical solutions to address indoor cellular coverage challenges. 

Chart of Top Cities with Highest Number of Buildings More Than 150 Meters Height

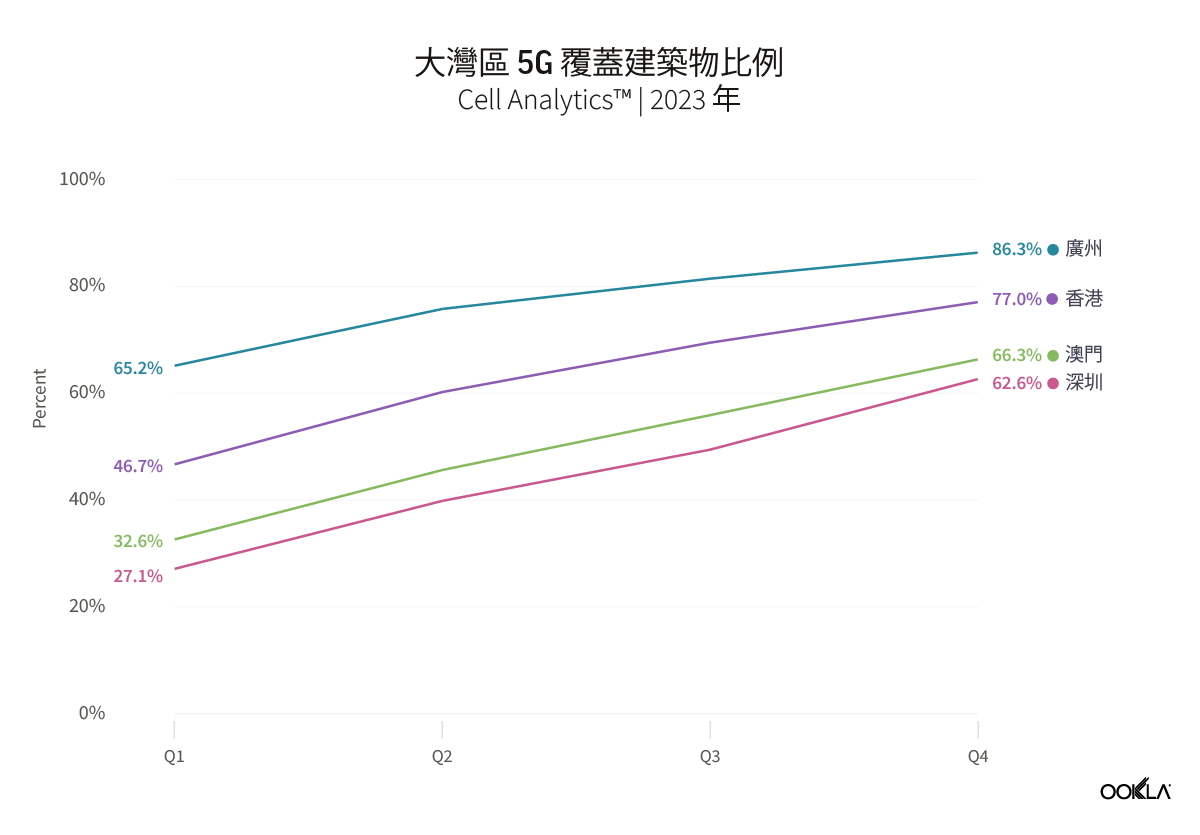
In order to assess the reach of 5G coverage inside buildings, we analyzed data from Ookla® Cell Analytics™ to measure the percentage of buildings in Hong Kong, Macau, Shenzhen, and Guangzhou with reported indoor 5G samples between Q1 2023 to Q4 2023. In this analysis, we have only considered buildings taller than 10 meters, which is the height of a typical three-story building or more.

Chart of Percentage of Buildings with 5G Coverage in the Greater Bay Area

The chart shows an increase in the number of buildings with detected indoor 5G samples for every quarter from Q1 2023 to Q4 2023 across all four cities. Guangzhou, Shenzhen, and Macau all had an increase of more than 30 percentage points between Q1 2023 and Q4 2023, while Hong Kong saw a rise of 21 percentage points within the same period. The significant increase in the number of 5G base stations in China and its Special Administrative Regions has been the driving force behind the growth of indoor traffic. The Ministry of Industry and Information Technology (MIIT) of China announced that there were 3.38 million 5G sites in China at the end of 2023, which would have included a significant number of dedicated 5G indoor sites.

As 5G traffic continues to proliferate, subscribers are increasingly demanding optimal indoor coverage to ensure a seamless experience. Meeting these expectations requires a comprehensive strategy by the service providers that accounts for the unique challenges of the different indoor environments in each city.

5G indoor coverage and quality differs across the core cities of the Greater Bay Area

Drilling down into Cell Analytics data at the city level from Q4 2023 to Q1 2024, we evaluated subscribers’ 5G indoor experience by measuring the average Reference Signal Received Power (RSRP) and Reference Signal Received Quality (RSRQ). RSRP represents the network signal strength received by a mobile phone. An RSRP value that exceeds -90 dBm indicates superior coverage. If the signal strength is between -90 dBm and -100 dBm, then network coverage is considered good. Below this range, expect slower download speeds and potential network disconnections. RSRQ is a metric used to evaluate the quality of the reference signal received by a device. A value of -10 dB or higher indicates excellent network quality while a value between -10 dB and -15 dB is considered good. An RSRQ value lower than -15 dB is poor or indicates no signal at all.

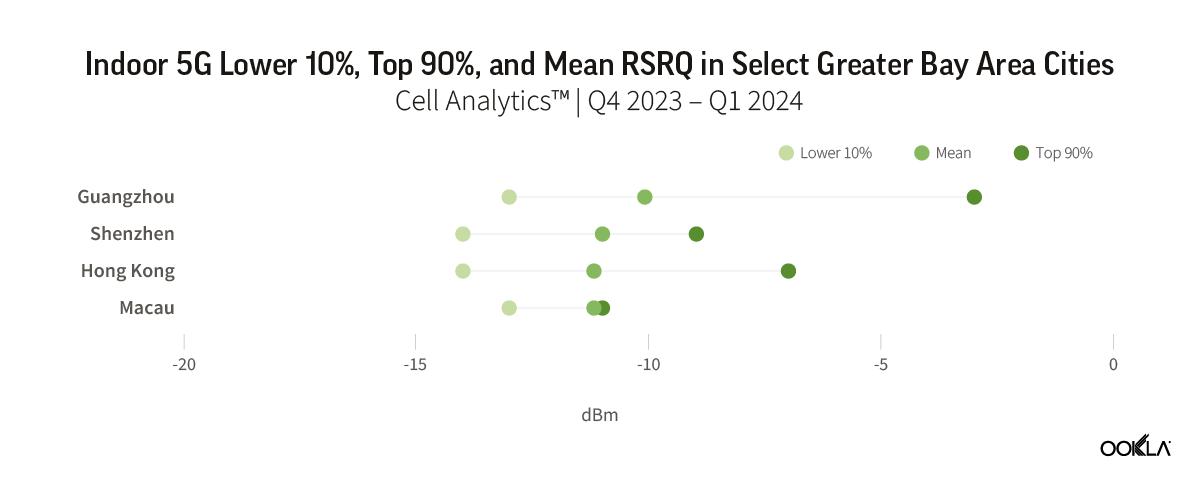
We compared the average RSRP and RSRQ for each of the four major cities in GBA and plotted out the range between the values of the Lower 10% and the Top 90% to examine the variations in the signal strength and quality of each city.

Chart of Indoor 5G Lower 10%, Top 90%, and Mean RSRP in Select Greater Bay Area Cities
Chart of Indoor 5G Lower 10%, Top 90%, and Mean RSRQ in Select Greater Bay Area Cities

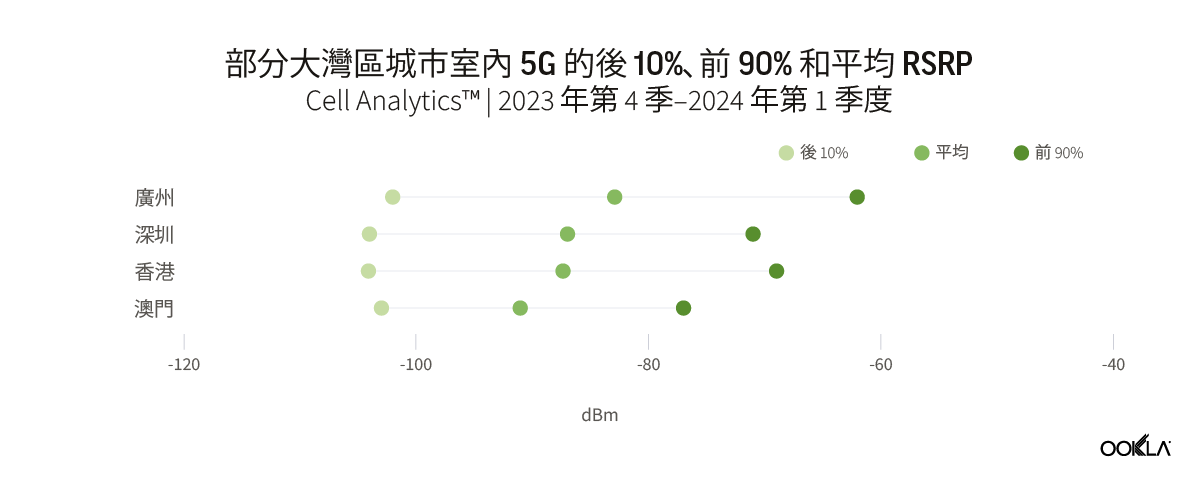
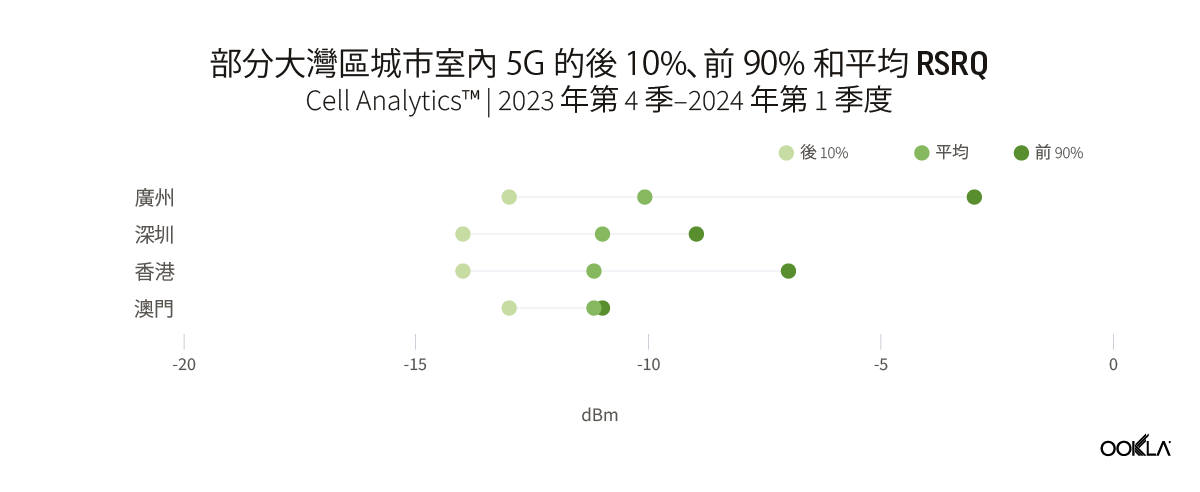
Overall, the Chinese cities of Guangzhou and Shenzhen reported better city-wide 5G indoor coverage than those of Hong Kong and Macau. Guangzhou reported a weighted average RSRP of -82.9 dBm of all samples detected inside buildings, followed by Shenzhen with RSRP of -87.0 dBm. Both cities also reported better city-wide 5G indoor quality compared to Hong Kong and Macau, at -10.1 dB and -11.0 dB, respectively.

The data shows a substantial variance in performance and quality between the top and bottom 10% of users when connected to 5G indoors in these cities. The Upper 90% of samples in all cities had extremely good RSRP, ranging from -77 dBm in Macau to -62 dBm in Guangzhou. While the Lower 10% reported signal strength of around -104 dBm. This indicates that while, in general, users were experiencing reasonable 5G average speeds indoors, there are still hotspots with a concentration of users who are experiencing poor performance and coverage.

5G performance uplift accentuates the need for better indoor coverage

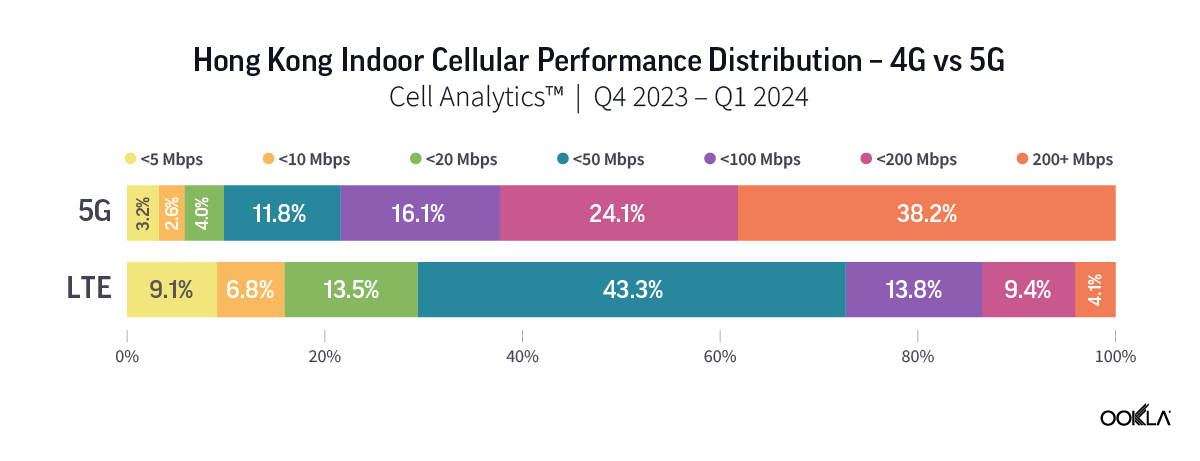
While today’s indoor 4G and Wi-Fi networks may meet the current connectivity demands, having dedicated in-building 5G networks provides a more seamless and efficient connectivity experience, bridging the gap between 4G’s inherent limitations in terms of latency and performance with the requirements of newer data-intensive use cases and low-latency applications.

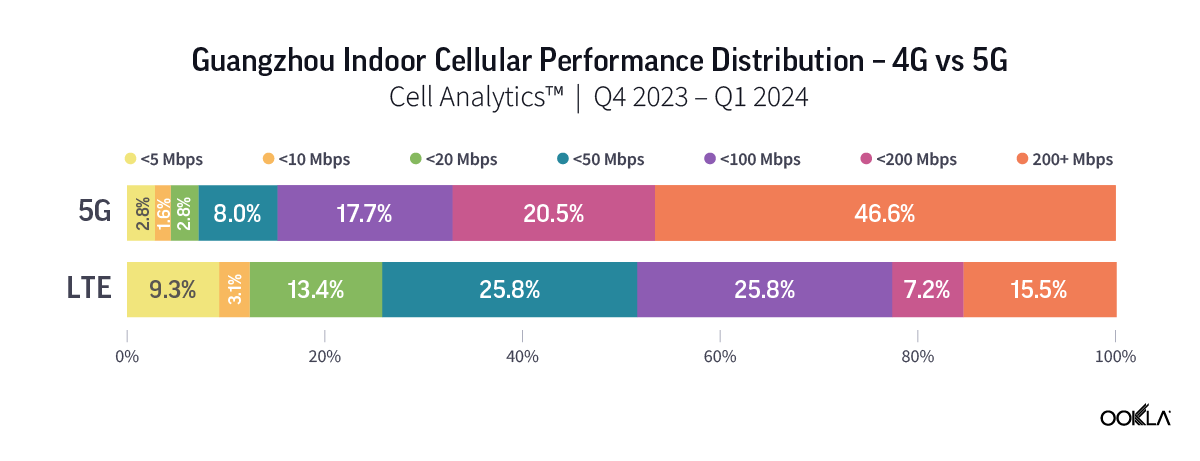
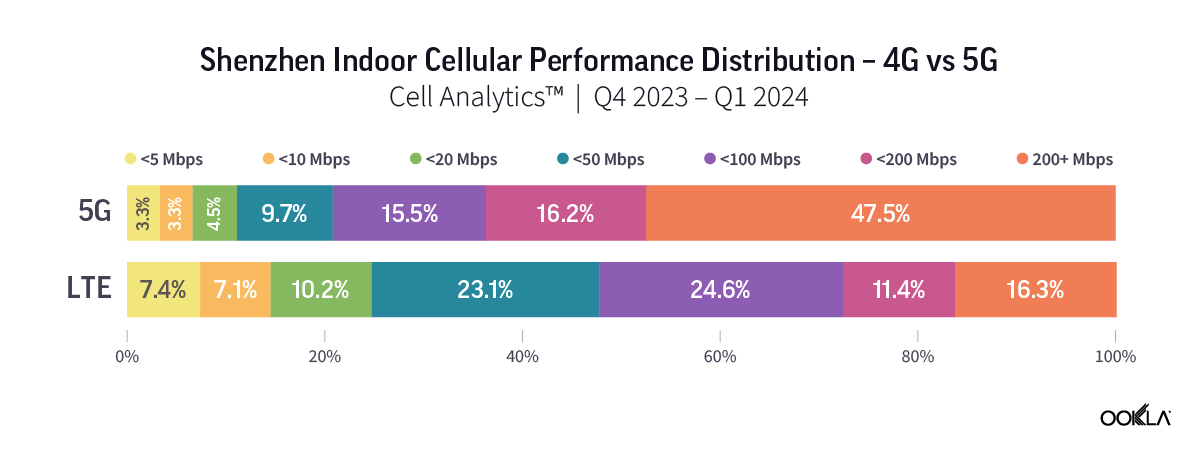
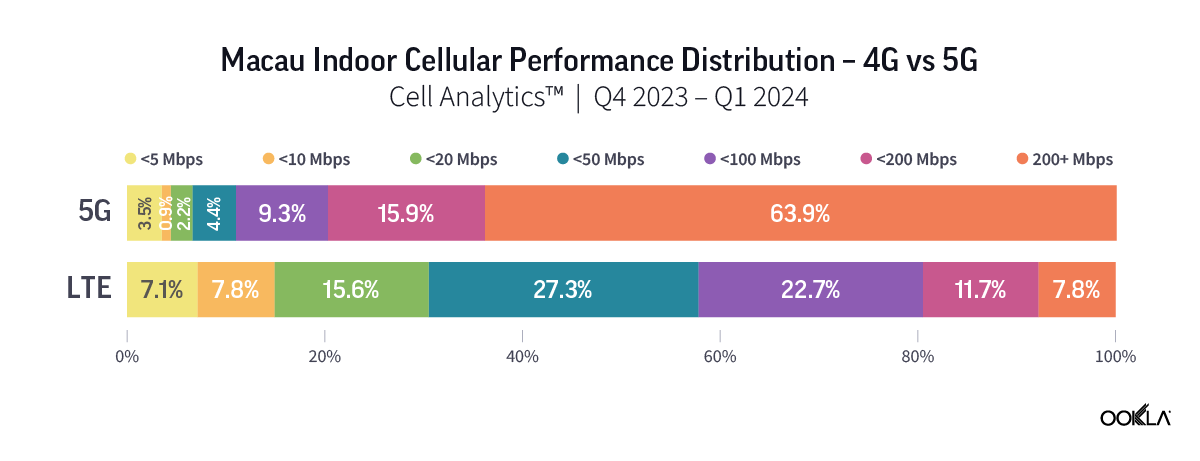
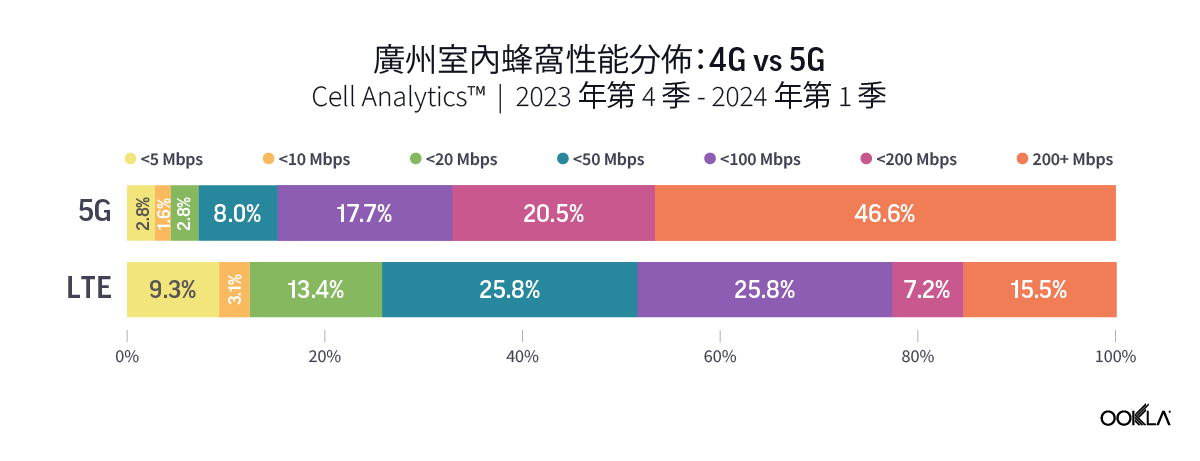
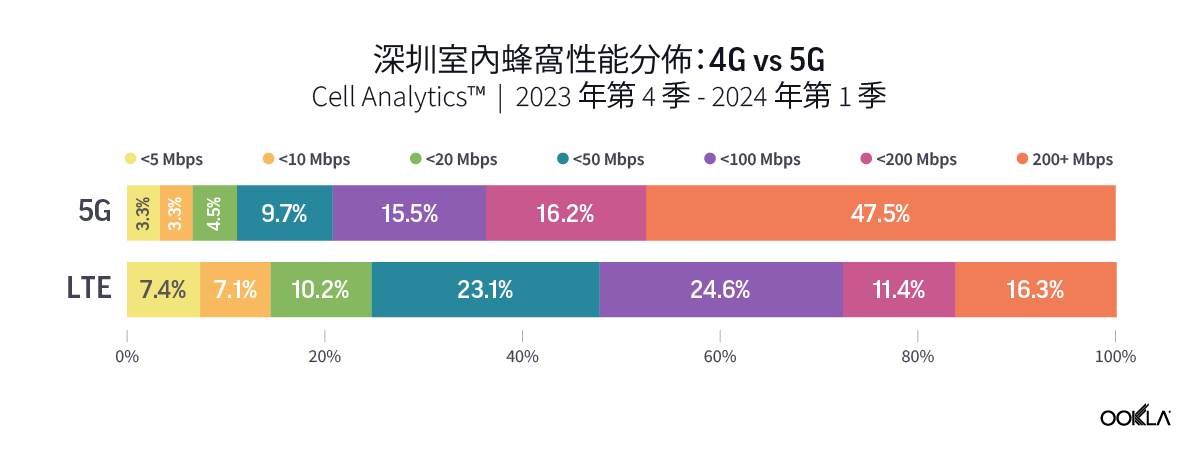
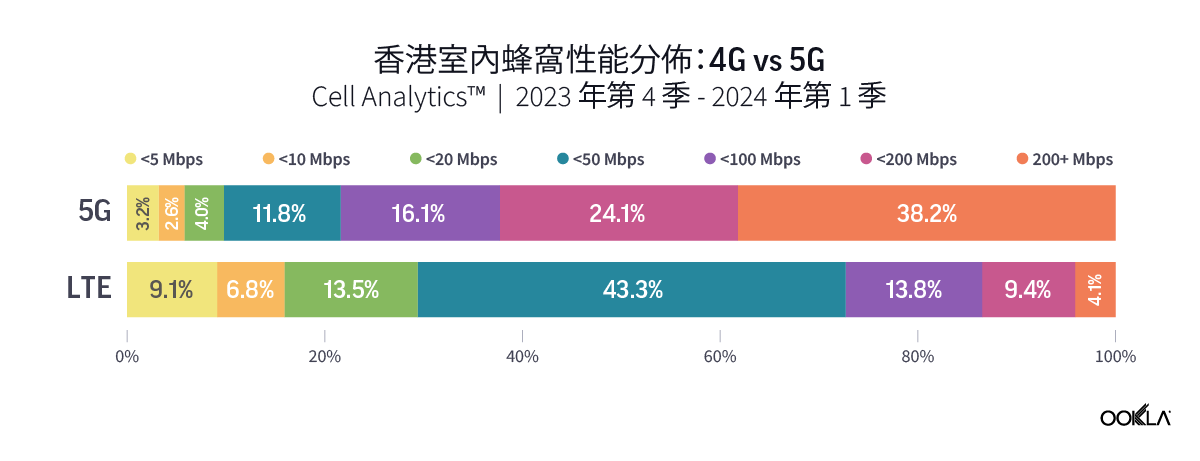
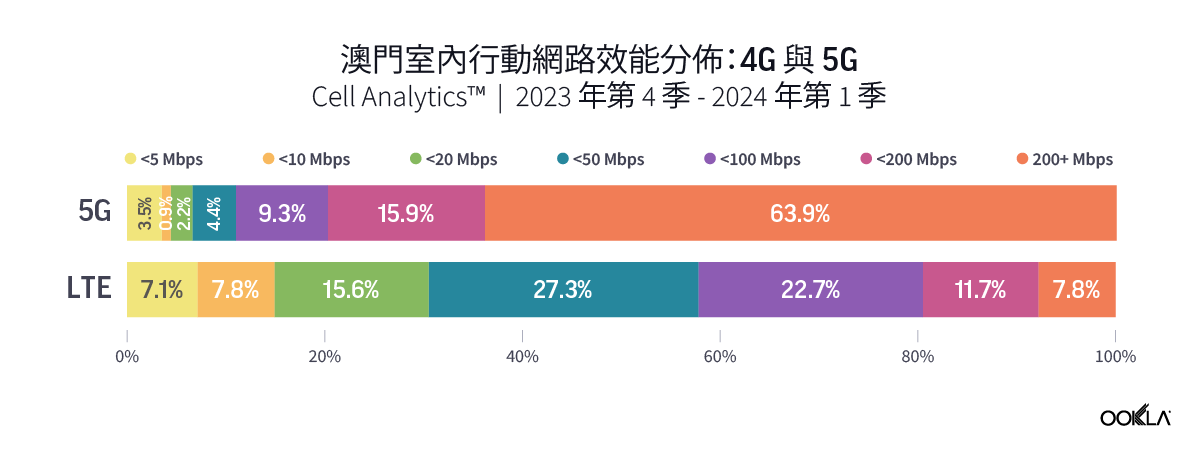
Ookla’s data for Q4 2023 to Q1 2024 reveal a higher percentage of users experiencing significant performance improvement when connected to 5G networks indoors. In Guangzhou and Shenzhen, over 45% of indoor 5G samples achieved speeds of 200 Mbps or higher, while only approximately 15% of 4G users experienced the same speed. The percentage is much higher in Macau, where more than 60% of indoor 5G users were on speeds of more than 200 Mbps, as compared to only 7.8% for those on 4G indoor networks.

Significant variations in 5G coverage among operators in Guangzhou, while operators in other cities exhibit only minor differences

Given the increasing reliance on mobile services for commercial transactions, ensuring uninterrupted 5G connectivity within buildings is paramount for service providers and building owners, particularly in buildings with a high concentration of users. This can be achieved by deploying advanced technologies such as small cells, distributed antenna systems (DAS), and network function virtualization (NFV). This enhances the consumer experience and adds substantial value to businesses by enabling various digital services, such as 8K video, augmented and virtual reality, and the Internet of Things (IoT). The building tenants can also leverage the 5G network to connect video cameras, point-of-sale (PoS) devices, and signage systems, which can attract customers who rely on mobile services for digital store deals and commercial transactions.

Through Cell Analytics data, we compared the 5G signal strength (RSRP) of top operators in Guangzhou, Shenzhen, Hong Kong, and Macau from Q4 2023 to Q1 2024. For each location, we compare operators’ RSRP values of samples detected inside buildings with a height of more than 10 meters to determine which ones offer better 5G coverage.

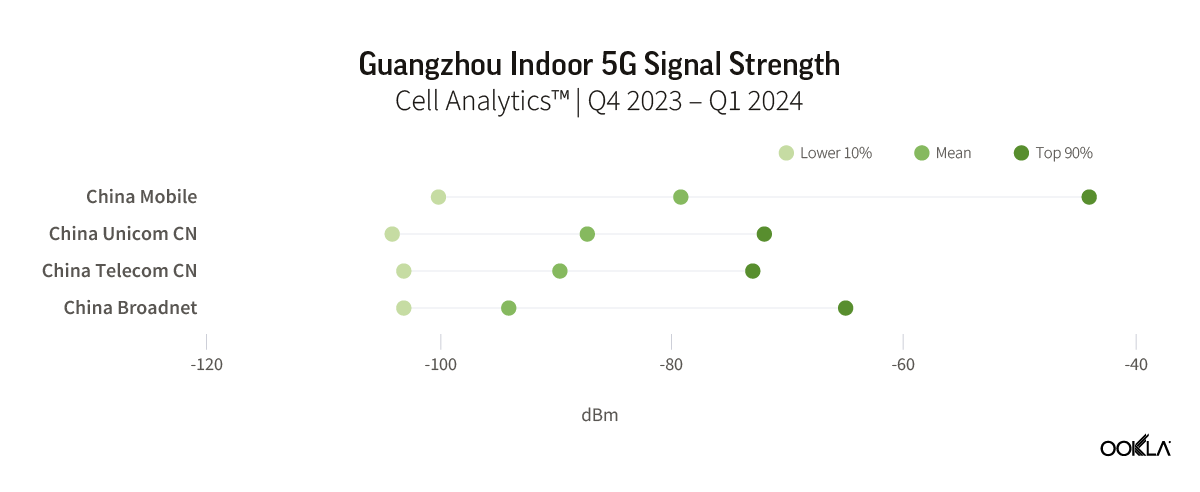
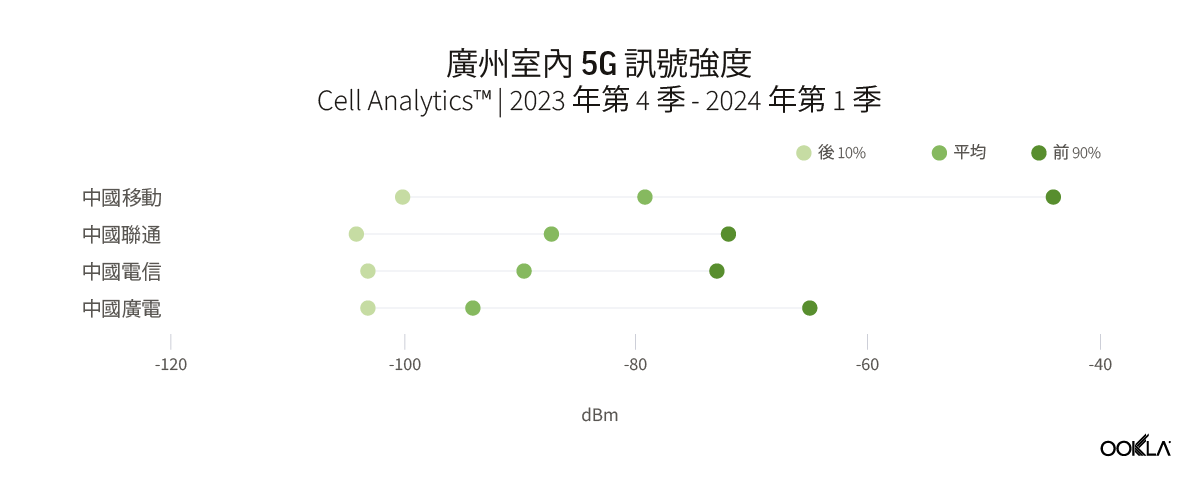
In Guangzhou, China Mobile had the best indoor 5G coverage across the city. Their weighted mean RSRP was -79.2 dBm, which is around 8 dB stronger than China Unicom’s mean RSRP of -87.2 dBm. The Upper 90% of China Mobile’s 5G network users reported a strong signal strength with an RSRP of -44 dBm when they were indoors. This indicates that there could be more buildings with dedicated wireless 5G networks in the city.

Chart of Guangzhou Indoor 5G Signal Strength

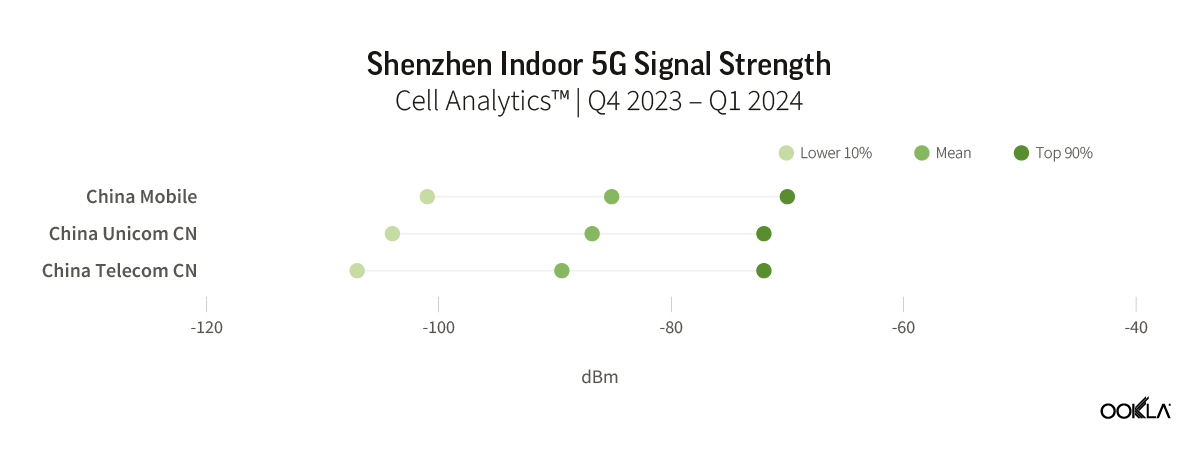
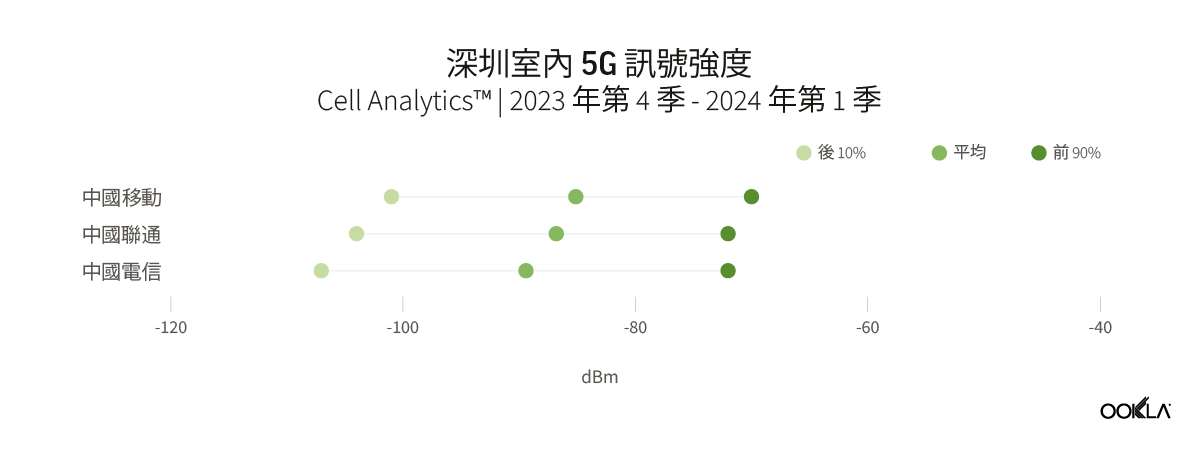
The three service providers in Shenzhen reported a small variation in their 5G indoor signal strength. China Mobile had a slightly better mean RSRP at -85.1 dBm, compared to China Unicom’s -86.8 dBm and China Telecom’s -89.4 dBm. Overall, there is unlikely to be a significant difference in 5G coverage when indoors, and consumers in the city may not notice any major differences. During the period, there were insufficient samples available for China Broadnet to be included in the analysis.

Chart of Shenzhen Indoor 5G Signal Strength

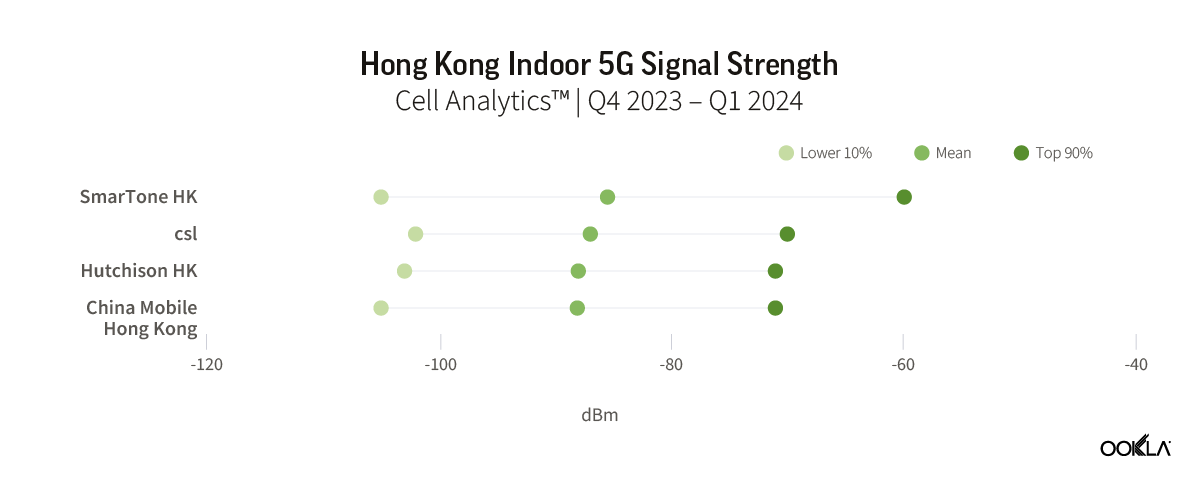
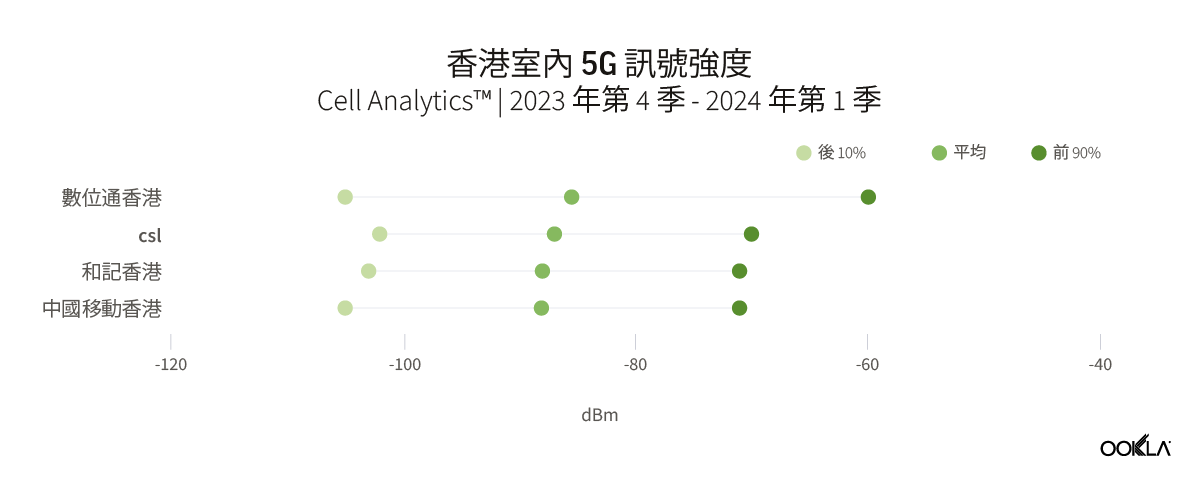
In Hong Kong, much like what was observed in Shenzhen, the difference in average signal strength among the top four telecom operators was marginal. Between Q4 2023 and Q1 2024, the difference in the mean RSRP between the carriers was only 1.5 dB. SmarTone stood out slightly by having the highest RSRP at -85.5 dBm. This indicates a competitive and closely matched performance among the operators, with opportunities for further improvements in indoor connectivity and quality.

Chart of Hong Kong Indoor 5G Signal Strength

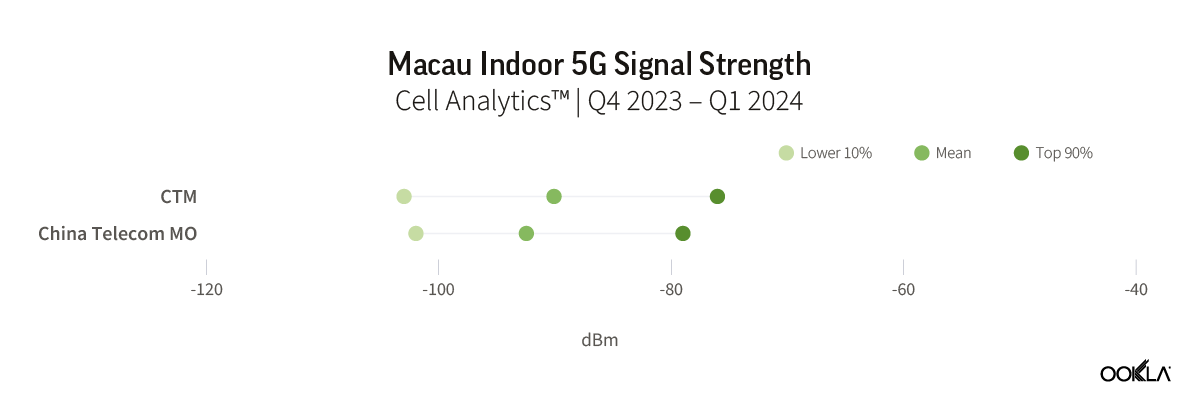
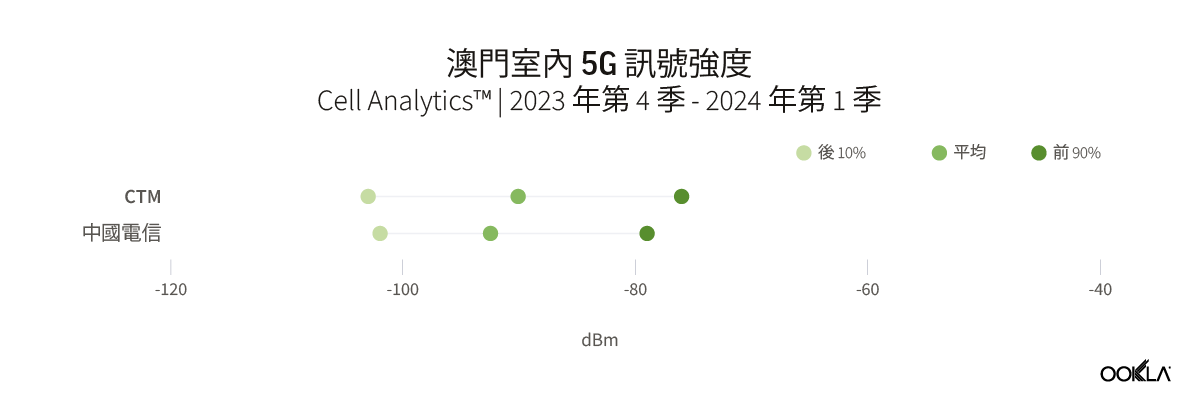
Macau is the most recent city in GBA to launch its 5G network, with CTM and China Telecom Macau receiving their 5G licenses in November 2022. In our previous report, we discussed how Macau, being a newly launched network, was rated higher than the other three cities in terms of overall 5G performance. However, the latest data reveals that in terms of indoor 5G signal strength, both operators are trailing behind other operators in the selected cities, except for China Broadnet in Guangzhou. Both CTM and China Telecom Macau reported 5G indoor mean RSCP lower than -90 dBm, with CTM at -90.1 dBm and China Telecom Macau at -92.5 dBm.

Chart of Macau Indoor 5G Signal Strength

The imperative of 5G indoor network expansion

With the increasing adoption of 5G technology, consumers are expecting faster network speeds and consistent connectivity. As most 5G data traffic is expected to occur indoors, prioritizing the expansion of indoor coverage is crucial for operators to meet users’ expectations. 5G indoor deployments are a strategic avenue for operators to monetize their investments through advances such as massive IoT (IoT), enhanced mobile broadband (eMBB), and fixed wireless access (FWA), which will all play an important role in transformation across sectors such as industrial automation, retail applications, and smart cities. The primary challenge lies in delivering consistent performance and quality across various indoor settings, where issues may be confined to certain floors or sections.

Regulators can have a proactive role in reducing bureaucratic hurdles and encouraging government-industry collaboration, such as promoting the parallel development of indoor and outdoor 5G coverage across the country. As a step towards prioritizing 5G indoor coverage, China’s Ministry of Industry and Information Technology (MIIT) mandated that operators share the mid-band spectrum (3.3-3.4 GHz) for indoor coverage to promote co-development and cost-sharing. 

There is also a significant push in the GBA to extend 5G coverage, making it readily available in public transport infrastructures. One such example is CSL, which provides 5G network coverage along the MTR lines in Hong Kong, with some routes utilizing dedicated 5G spectrum. 

Ookla can assist operators in identifying buildings or indoor venues with coverage or capacity issues using crowdsourced data and diagnosis. Powered by millions of signal measurements collected daily by Speedtest®, Cell Analytics provides intelligence about wireless service quality, RF measurements, data usage, user density, cell site locations, and much more. It helps operators to track their own and competitors’ performance and understand how new 5G deployments are affecting user experience and quality of service. To find out more about Cell Analytics, please get in touch.


探索大灣區 5G 網路室內鏈接

粵港澳大灣區 (GBA) 是過去 40 多年來,中國都市化最快的地區之一。該地區是全球摩天大樓最集中的地區,營運商必須優先考慮室內外 5G 無縫覆蓋,以優化服務並滿足客戶需求。

在本報告中,我們使用 Cell Analytics™ 的資料,檢驗廣州、深圳、香港和澳門這四個 GBA 主要城市的 5G 室內效能和訊號品質。

關鍵摘要

  • 與香港和澳門相比,廣州和深圳的全市室內 5G 覆蓋範圍和品質更好。廣州報告的平均 RSRP 為 -82.9 dBm,深圳略低,為 -87.0 dBm。此外,兩個城市的 5G 室內品質均較好,得分分別為 10.1 dB 和 11.0 dB。相比之下,香港的平均 RSRP 為 -87.4 dBm,而澳門為 -91.0 dBm。
  • 廣州移動因在該市提供更好的室內 5G 覆蓋而脫穎而出。該營運商的平均 RSRP 為 -79.17 dBm,以 8 dB 的差距,明顯優於中國聯通的平均 RSRP -87.2 dBm。其他城市營運商之間的 5G 室內訊號強度僅有微小差異,但在澳門,營運商的室內訊號強度明顯弱於其他選定城市的幾乎所有其他營運商。

大灣區城市室內 5G 流量持續上升

粵港澳大灣區普遍稱為大灣區 (GBA),由中國廣東地區九個城市及香港、澳門兩個特別行政區組成。由於鄰近,這些城市由廣泛的交通網絡連接起來,包括高鐵、橋樑和隧道。這裡是中國重要的經濟和技術中心,而 5G 技術的採用已成為該地區的關鍵驅動力,推動著各行各業轉型,並促進自動化和數位化。在我們最近的 文章中,我們深入研究了推動 5G 技術推出的因素,並研究了其在大灣區的表現。

室內涵蓋率對於 GBA 主要「中心」城市尤為重要,廣州、深圳、香港和澳門的高樓大廈主宰著天際線,室內空間在商業和旅遊活動中扮演著重要角色。在最近的這篇文章中,我們探討了解決室內蜂窩覆蓋挑戰的不同技術解決方案。

图形:最多建築物高度超過 150 公尺的城市

為了評估建築物內的 5G 涵蓋率,我們分析了 Ookla® Cell Analytics™ 的資料,以衡量在 2023 年第 1 季到 2023 年第 4 季期間,香港、澳門、深圳和廣州回報室內 5G 樣本的建築物比例。在此分析中,我們只考慮了高於 10 公尺的建築物,亦即典型三層樓以上建築的高度。

图形:大灣區 5G 覆蓋建築物比例

圖表顯示,從 2023 年第 1 季到 2023 年第 4 季,四個城市偵測到室內 5G 樣本的建築物數量,每一季均有增加。廣州、深圳和澳門在 2023 年第 1 季到 2023 年第 4 季期間的成長幅度均超過 30 個百分點,而香港在同一期間的成長幅度為 21 個百分點。 中國和特別行政區 5G 基地台數量大幅成長,是室內流量成長的驅動力。根據中國工業和資訊化部 (MIIT) 公告,在 2023 年底,中國有 338 萬座 5G 基地台,其中包括大量專用的 5G 室內基地台。

隨著 5G 流量持續激增,訂閱用戶為了獲得無縫的體驗,對最佳室內涵蓋率的要求也愈來愈高。滿足這些期望需要服務提供者制定全面的策略,以應對每個城市不同室內環境的獨特挑戰。

大灣區中心城市的 5G 室內涵蓋率與品質各不相同

我們深入研究 2023 年第四季至 2024 年第一季城市層級的 Cell Analytics 數據,透過測量平均參考訊號接收功率 (RSRP) 和參考訊號接收品質 (RSRQ) 來評估使用者的 5G 室內體驗。RSRP 代表手機接收到的網路訊號強度。RSRP 值超過 -90 dBm,表示涵蓋率優異。如果訊號強度在 -90 dBm 和 -100 dBm 之間,則認為網路覆蓋範圍良好。 低於此範圍,下載速度會變慢,並且可能會出現網路連線中斷的情況。RSRQ 是用於評估設備接收的參考訊號品質的指標。-10 dB 或更高的值表示網路品質極佳,介於 -10 dB 和 -15 dB 之間的值則是尚可。RSRQ 值低於 -15 dB 表示訊號較差或根本沒有訊號。

我們比較了 GBA 四個主要城市的平均 RSRP 和 RSRQ,並繪製出後 10% 與前 90% 之間的範圍,以檢視每個城市訊號強度和品質的差異。

图形:部分大灣區城市室內 5G 的後 10%、前 90% 和平均 RSRP

图形:部分大灣區城市室內 5G 的後 10%、前 90% 和平均 RSRQ

整體而言,中國城市廣州和深圳的 5G 室內覆蓋範圍優於香港和澳門。廣州報告在建築物內檢測到的所有樣本的加權平均 RSRP 為 -82.9 dBm,其次是深圳,RSRP 為 -87.0 dBm。與香港和澳門相比,這兩個城市的全市 5G 室內品質也更好,分別為 -10.1 dB 和 -11.0 dB。

資料顯示,這些城市中,前 10% 使用者和後 10% 的使用者在室內連接 5G 時,效能和品質有顯著差異。所有城市上 90%的樣本都具有非常好的 RSRP,範圍從澳門的-77 dBm 到廣州的-62 dBm。後 10% 的樣本則顯示訊號強度約為 -104 dBm。這說明雖然整體而言,使用者在室內能體驗到合理的 5G 平均速度,但在使用者集中的熱點,效能和涵蓋率體驗仍然不佳。

5G 性能提升凸顯對更好室內覆蓋的需求

雖然現在的室內 4G 和 Wi-Fi 網路可以滿足目前的連線需求,但擁有專用的室內 5G 網路,能夠提供更順暢、有效率的連線體驗,以滿足新的資料密集型使用案例和低延遲應用需求,彌補 4G 在延遲和效能方面的固有限制。

Ookla 2023 年第四季至 2024 年第一季的數據顯示,在室內連接 5G 網路時,體驗到效能顯著提升的用戶比例更高。在廣州和深圳,超過 45% 的室內 5G 樣本實現了 200 Mbps 或更高的速度,而只有約 15% 的 4G 使用者體驗到了相同的速度。該比例在澳門高出許多,室內 5G 使用者速度超過 200 Mbps 的比例超過 60%,4G 室內網路的使用者則僅有 7.8%。

廣州業者 5G 覆蓋差異較大,其他城市業者差異較小

由於商業交易愈來愈依賴行動服務,因此對服務提供者和建築物擁有者而言,確保建築物內的 5G 連線不中斷是首要之務,在使用者密集高的建築物中更是如此。這可以透過部署小型蜂窩、分散式天線系統 (DAS) 和網路功能虛擬化 (NFV) 等先進技術來實現。如此一來,就能夠提供 8K 影片、擴增實境和虛擬實境及物聯網 (IoT) 等多種數位服務,藉此提升用戶體驗,並為企業增加巨大價值。大樓租戶還可以利用 5G 網路連接攝影機、銷售點 (PoS) 設備和標牌系統,這可以吸引依賴行動服務進行數位商店交易和商業交易的客戶。

透過 Cell Analytics 資料,我們比較了廣州、深圳、香港和澳門頂尖營運商在 2023 年第 4 季到 2024 年第 1 季的 5G 訊號強度 (RSRP)。在每個地點,我們利用在超過 10 公尺高的建築物內偵測到的樣本,比較了營運商 RSRP 值,以判斷哪些城市提供的 5G 涵蓋率更佳。

在廣州,中國移動擁有全市最好的室內 5G 覆蓋範圍。他們的加權平均 RSRP 為 -79.2 dBm,比中國聯通的平均 RSRP -87.2 dBm 高出約 8 dB。中國移動前 90% 5G 網路使用者回報的室內訊號強度較強,為 RSRP -44 dBm。這表明該市可能會有更多擁有專用無線 5G 網路的建築物。

图形:廣州室內 5G 訊號強度

深圳的三家服務提供者報告其 5G 室內訊號強度略有差異。與中國聯通的 -86.8 dBm 和中國電信的 -89.4 dBm 相比,中國移動的平均 RSRP 略高,為 -85.1 dBm。總體而言,室內 5G 覆蓋範圍不太可能出現顯著差異,城市消費者可能不會注意到任何重大差異。在此期間,中國廣電沒有足夠的樣本可供分析。

图形:深圳室內 5G 訊號強度

在香港,與深圳的情況非常相似,四大電信業者之間的平均訊號強度差異微乎其微。2023 年第四季和 2024 年第一季之間,各載波之間的平均 RSRP 差異僅為 1.5 dB。SmarTone 的 RSRP 最高為 -85.5 dBm,稍微突出。這表明運營商之間的競爭和緊密匹配的表現,以及進一步改善室內連接和品質的機會。

图形:香港室內 5G 訊號強度

澳門是 GBA 最晚推出 5G 網路的城市,CTM 和中國電信 (澳門) 於 2022 年 11 月獲得 5G 執照。我們先前的報告討論過,澳門新推出的網路整體 5G 效能為何比其他三個城市更優異。然而,最新資料顯示,就室內 5G 訊號強度而言,除了廣州的中國廣電之外,這兩家營運商都落後於選定城市的其他營運商。CTM 和中國電信澳門均報告 5G 室內平均 RSCP 低於-90 dBm,其中 CTM 為-90.1 dBm,中國電信澳門為-92.5 dBm。

图形:澳門室內 5G 訊號強度

5G 室內網路擴容勢在必行

5G 技術日益普及,消費者對網路速度和連線穩定度的期望也隨之提高。由於大部分 5G 數據流量預計發生在室內,因此優先擴大室內覆蓋範圍對於營運商滿足用戶期望至關重要。營運商能夠經由 5G 室內部署這個策略途徑,透過大規模物聯網 (IoT)、增強型行動寬頻 (eMBB) 和固定無線接取 (FWA) 等先進技術,將投資變現。這些技術將在工業自動化、零售應用和智慧城市等領域的轉型中,佔有一席之地。主要挑戰在於在各種室內環境中提供一致的性能和質量,其中問題可能僅限於某些樓層或部分。

監管機構可以在減少官僚障礙和鼓勵政府與行業合作方面發揮積極作用,例如促進全國室內和室外 5G 覆蓋的並行發展。中國工業和資訊化部 (MIIT) 為了優先發展 5G 室內涵蓋率,要求營運商共享中頻段頻譜 (3.3-3.4 GHz),以促進共同開發和成本分攤。

大灣區也大力推動擴大 5G 覆蓋範圍,使其在公共交通基礎設施中隨時可用。其中一個例子是 CSL,他們在香港地鐵沿線提供 5G 網路涵蓋率,其中幾個路線使用了專用的 5G 頻譜。

Ookla 可以利用群眾外包的資料和診斷,協助營運商識別有涵蓋率或容量問題的建築物或室內場所。Cell Analytics 利用 Speedtest® 每天收集的數百萬個訊號測量資料,提供有關無線服務品質、RF 測量值、資料使用量、使用者密度、行動網路基地台位置等資訊的相關情報。它可以幫助營運商追蹤自己和競爭對手的表現,並了解新的 5G 部署如何影響用戶體驗和服務品質。要了解有關 Cell Analytics 的更多信息,請 與我們聯繫

Ookla retains ownership of this article including all of the intellectual property rights, data, content graphs and analysis. This article may not be quoted, reproduced, distributed or published for any commercial purpose without prior consent. Members of the press and others using the findings in this article for non-commercial purposes are welcome to publicly share and link to report information with attribution to Ookla.

| January 4, 2023

The Speedtest Global Index Shows These Countries Sped Forward for Internet Experience in 2022

Internet connectivity continues to speed ahead for people around the world, especially as countries prioritize and improve mobile and fixed broadband networks. That’s nowhere more apparent than on the Speedtest Global Index™, which tracks countries’ internet speeds and the overall global median internet speeds. Last year, we took a look at the state of the internet speeds over the years, and today we’re back to see how most of 2022 fared from November 2021 to November 2022, and what countries made our top 10 fastest mobile and fixed broadband lists.

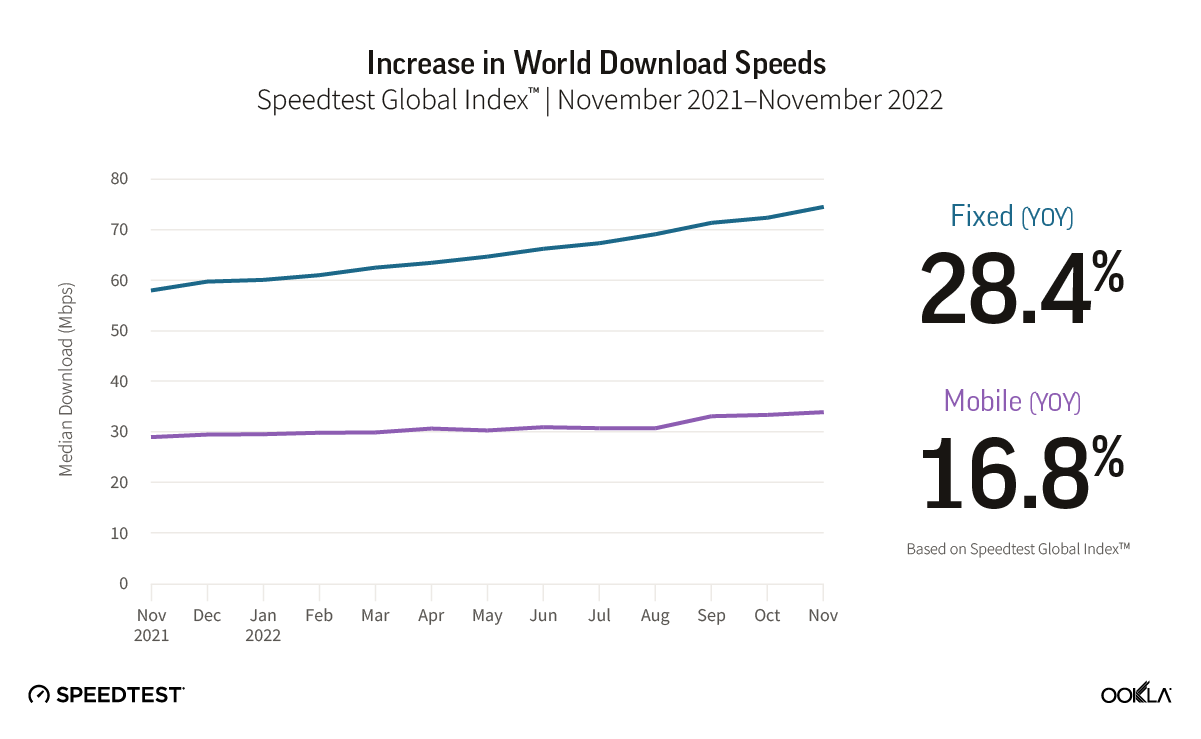
Mobile download speed jumped nearly 17% over the last year globally, fixed broadband up at least 28%

Chart of increase in world download speeds from November 2021 through 2022

The improvement of global median download speeds has been somewhat asymmetrical over the past year on the Speedtest Global Index. Fixed broadband speeds made greater strides over the past year than mobile download speeds, with fixed broadband speeds becoming at least 28% faster and mobile becoming nearly 17% faster from November 2021 to November 2022. Gains in upload speed were even more pronounced with mobile becoming at least 9% faster and fixed broadband becoming at least 30% faster. Latency, which is becoming an increasingly important metric, decreased on mobile over the course of the year from 29 ms in 2021 to 28 ms in 2022, while fixed broadband latency remained the same at 10 ms.

Top 10 rankings remain relatively constant over the past year, U.A.E. joins fixed broadband list and Denmark, Macau (SAR), and Brunei race ahead for mobile during 2022

Chile raced ahead on fixed broadband

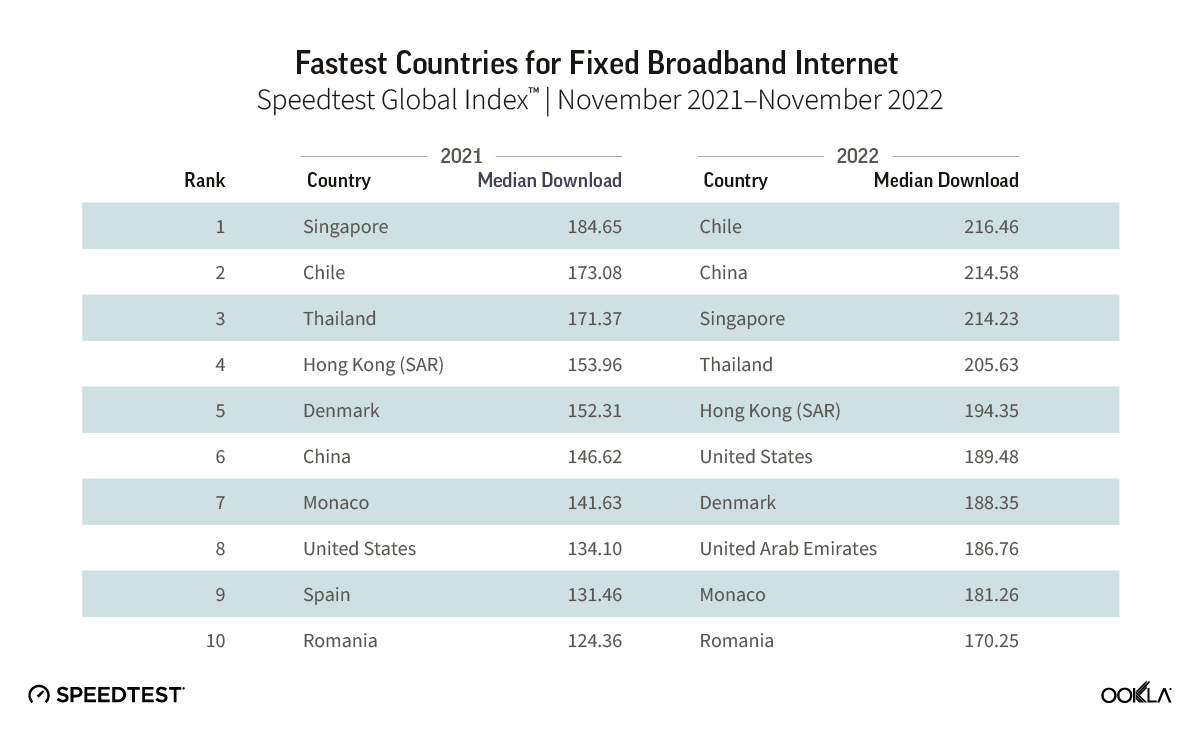
List of fastest countries for fixed braodband internet from November 2021 through 2022

The competition for the fastest fixed broadband was neck-and-neck on the Speedtest Global Index during 2022, with Chile (216.23 Mbps) taking top honors and China (214.23 Mbps) and Singapore (214.23 Mbps) a hair behind. Over the course of the year, the top 10 countries for fastest fixed broadband remained relatively the same while each country jostled up and down the list for fixed broadband superiority. Only Spain was replaced from the top 10 with the U.A.E. taking its place. Notably, China jumped four places from sixth to second, improving its median download speed from 146.62 Mbps in 2021 to 214.58 Mbps in 2022. Romania’s tenth place finish in 2022 would have earned fourth place in 2021, showing how fast these countries are all prioritizing improved fixed broadband speeds.

Qatar soars to first for fastest mobile country

List of fastest countries for mobile internet from November 2021 through 2022

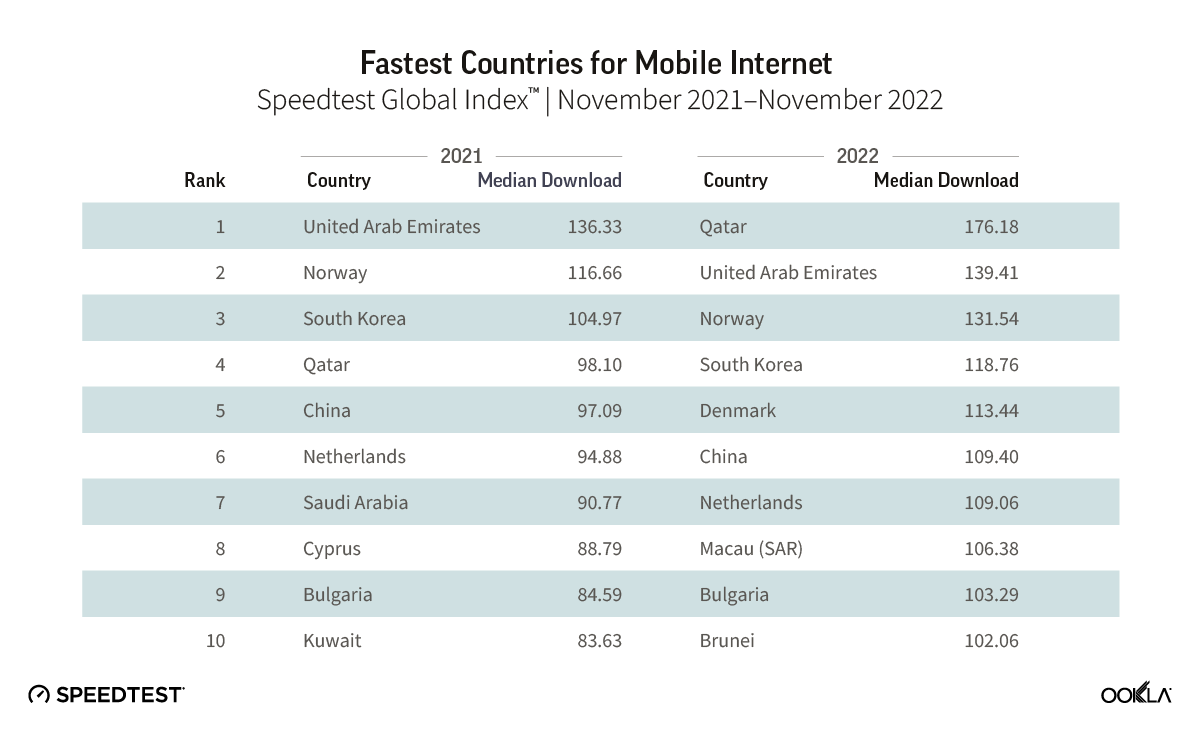
Ahead of hosting the FIFA World Cup 2022®, Qatar rocketed to first place on the Speedtest Global Index with a median download speed of 176.18 Mbps in November 2022 from 98.10 Mbps in November 2022. Next on the list was the U.A.E. at 139.41 Mbps, which had the fastest median download speed in November 2021. Notably, all 10 countries on our November 2022 list had median mobile download speeds greater than 100 Mbps. New to our 2022 list Denmark (113.44 Mbps), Macau (SAR) (106.38 Mbps), and Brunei (102.36 Mbps) replaced Saudi Arabia, Cyprus, and Kuwait from our 2021 list.

Most of the top 10 countries perform well for fixed and mobile

Chart of 2022 perfromance against global median for leading countries

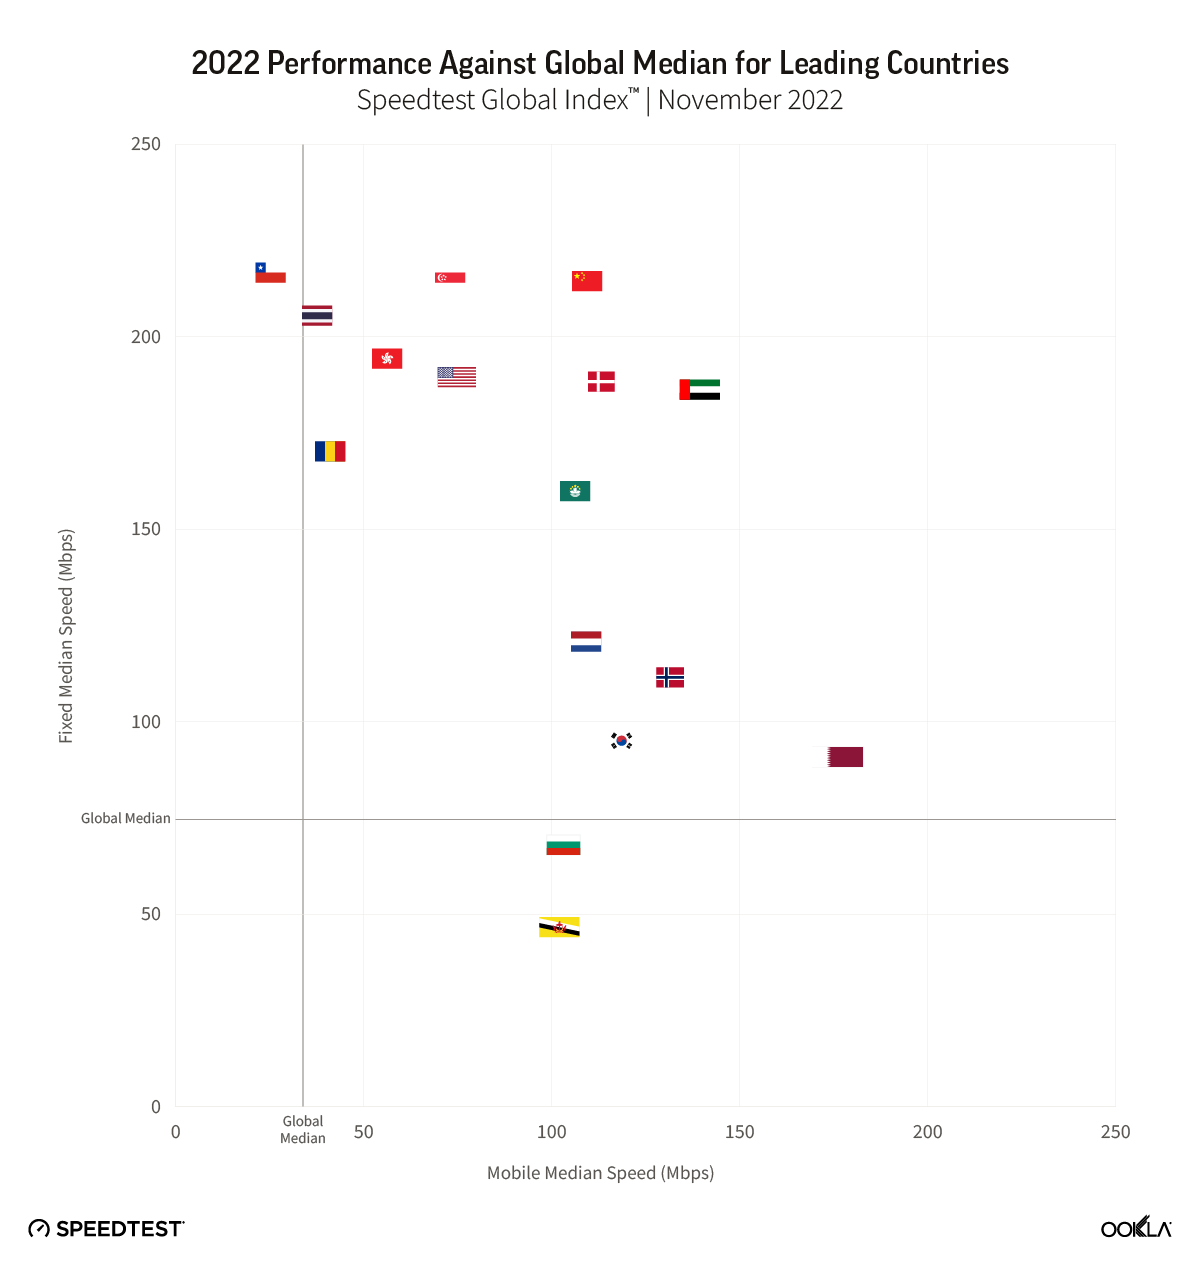
Out of the 17 countries appearing on either the fastest fixed broadband or mobile Speedtest Global Index top 10s during November 2021 — with China, Denmark, and the U.A.E. appearing on both lists — all but Monaco met the statistical threshold to be included to look at overall fixed and mobile performance. Looking at the remaining 16 countries, most every country on both lists performed relatively well against the global median for both fixed and mobile, which appear as gray lines in the image above. Three countries underperformed a global median: Brunei and Bulgaria for fixed, and Chile for mobile. Thailand performed at about roughly the global median for mobile, as did Romania.

We’re excited to see how global speeds and rankings change over the next year as individual countries and their providers choose to invest and expand different technologies, particularly in 5G and fiber. Be sure to track your country’s and check in on our monthly updates on the Speedtest Global Index. If you want more in-depth analyses and updates, subscribe to Ookla Research™.

Ookla retains ownership of this article including all of the intellectual property rights, data, content graphs and analysis. This article may not be quoted, reproduced, distributed or published for any commercial purpose without prior consent. Members of the press and others using the findings in this article for non-commercial purposes are welcome to publicly share and link to report information with attribution to Ookla.
| December 19, 2023

The State of Worldwide Connectivity in 2023

To gain insight into the current performance of networks, we analyzed Speedtest® data in Q3 2023. Our analysis compares changes in 5G performance to the previous year, identifies the top 10 countries with the best performance, and discusses customer satisfaction with 5G. We also ranked countries based on the performance of their fixed networks and investigated the connectivity gap across the world.

5G | Fixed | Connectivity for All

Key takeaways 

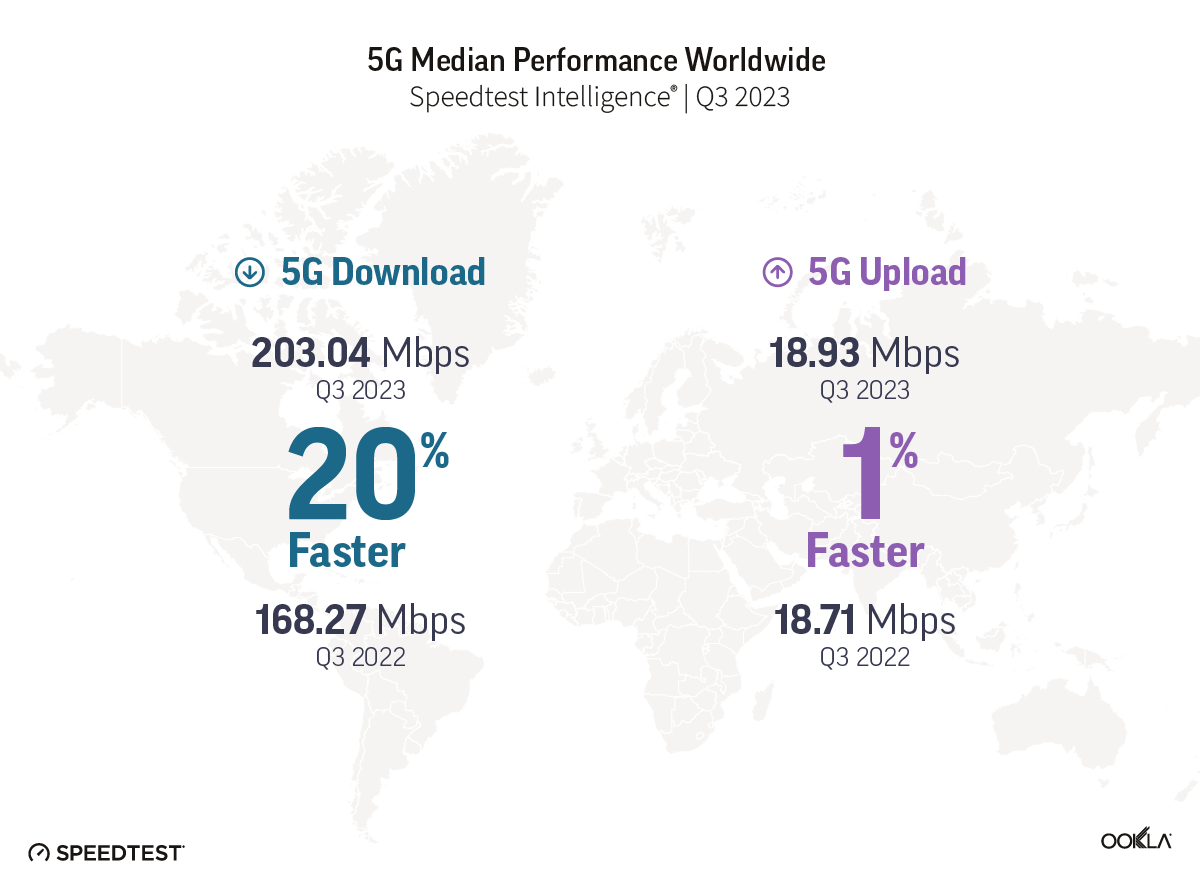
  • Global 5G download speed improved. The median global 5G download speed experienced a substantial 20% increase in Q3 2023, reaching 203.04 Mbps, compared to 168.27 Mbps in Q3 2022. This improvement aligns with a significant rise in global 5G subscriptions, indicating positive progress in user adoption of 5G and the performance of 5G networks. 
  • Top 5G performers have shifted. The top 10 countries for 5G performance witnessed notable changes, with the United Arab Emirates claiming the top spot, surpassing South Korea. Malaysia, India, and the Dominican Republic also made significant strides, showcasing a dynamic shift in the global 5G landscape.
  • Speedtest user ratings indicate room for 5G improvement. Despite advancements in 5G technology, there has been a decline in the Net Promoter Score (NPS) among 5G users. Factors contributing to this dissatisfaction could include unmet expectations and discrepancies between actual 5G speeds and advertised speeds.
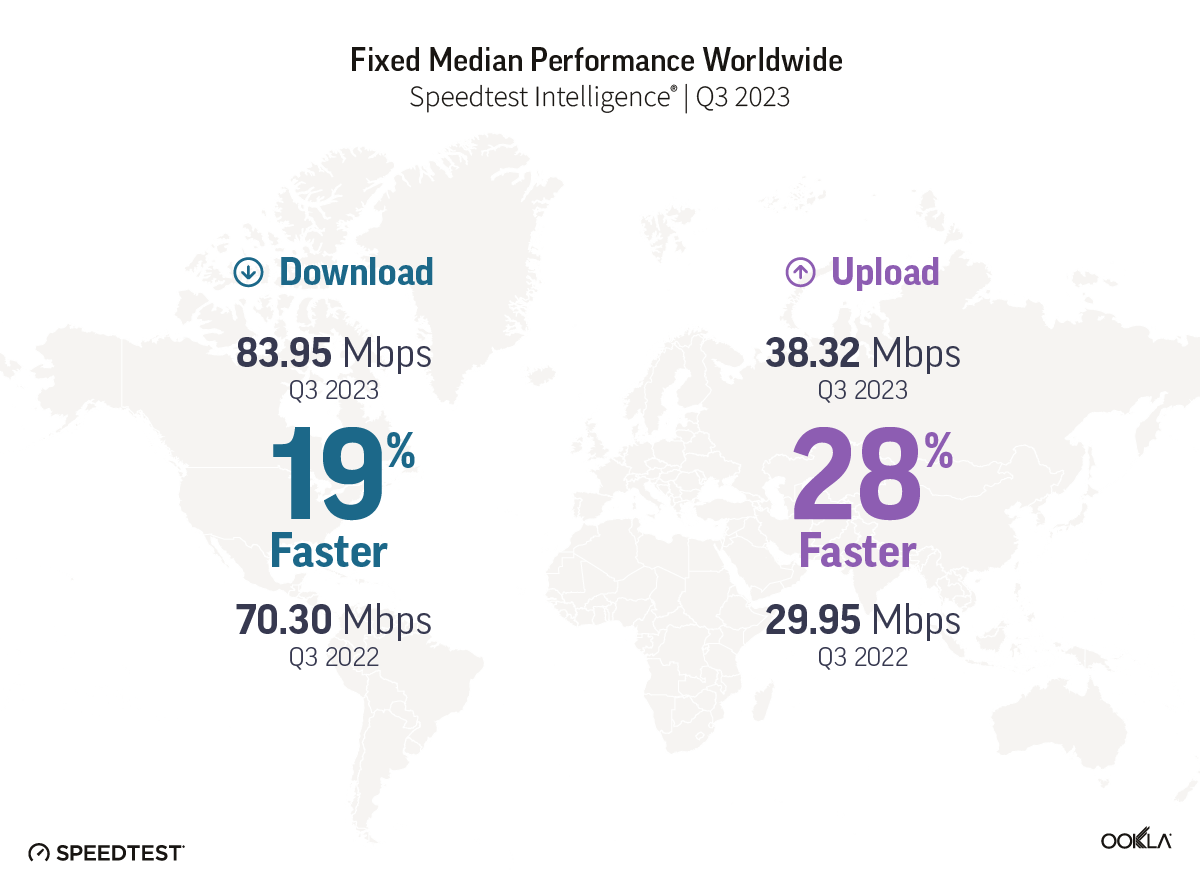
  • Fixed Networks Advancements. On a global scale, fixed networks demonstrated significant performance improvement, with a 19% increase in median download speed (83.95 Mbps) and a 28% increase in upload speed (38.32 Mbps) in Q3 2023 compared to the previous year. This highlights the ongoing transition to more advanced broadband technologies, particularly Fiber-to-the-Home (FTTH).
  • The imperative of closing the connectivity gaps. Despite improvements in global connectivity, there are still areas that fall outside of network coverage. Speedtest® data highlights disparities in internet performance between fixed and mobile networks across different regions, emphasizing the importance of addressing connectivity challenges worldwide.

5G Networks

Global 5G download speed improvements

Illustration of 5G Median Performance Worldwide

The median global 5G download speed has experienced a noteworthy surge, registering a 20% increase and reaching 203.04 Mbps in Q3 2023, compared to 168.27 Mbps in Q3 2022, according to Speedtest Intelligence® data. This improvement coincides with a substantial rise in global 5G connections, reaching 1.4 billion according to GSMA Intelligence, representing a 65% year-on-year increase from 872 million a year ago. 

In terms of upload speed and latency, only a very modest improvement of 1% occurred. Median 5G upload speeds reached 18.93 Mbps in Q3 2023, compared to 18.71 Mbps in the same period last year; multi-server latency, a critical metric for network responsiveness, improved from 45 ms in Q3 2022 to 44 ms in Q3 2023. 

Speedtest users experiencing the top 10% of 5G download speeds globally have seen a 9% increase, rising from 525.54 Mbps in Q3 2022 to 573.12 Mbps in Q3 2023. However, speeds have not yet reached Gigabit levels, primarly because of network economics. 5G was originally designed to deliver peak data rates of up to 20 Gbps based on IMT-2020 requirements, but we are still a ways off before gigabit speeds become the new normal. For instance, symmetrical download, upload speeds, and ultra-low latency haven’t been realized, partially because the vast majority of 5G networks are not ‘true 5G’ as they have been deployed in Non-Standalone (NSA) mode, meaning they rely on a 4G LTE network core. According to GSA, over 40 operators have launched 5G standalone (SA) in public networks, but the rollout is not yet complete. Nevertheless, the industry is actively exploring the prospect of 5G Advanced, which promises symmetrical upload and download speeds and ultra-low latency, signaling a proactive stance ahead of the eventual transition to 6G.

Malaysia joined South Korea and the U.A.E at 5G speeds podium

Chart of Fastest Countries for Median 5G Download Speed

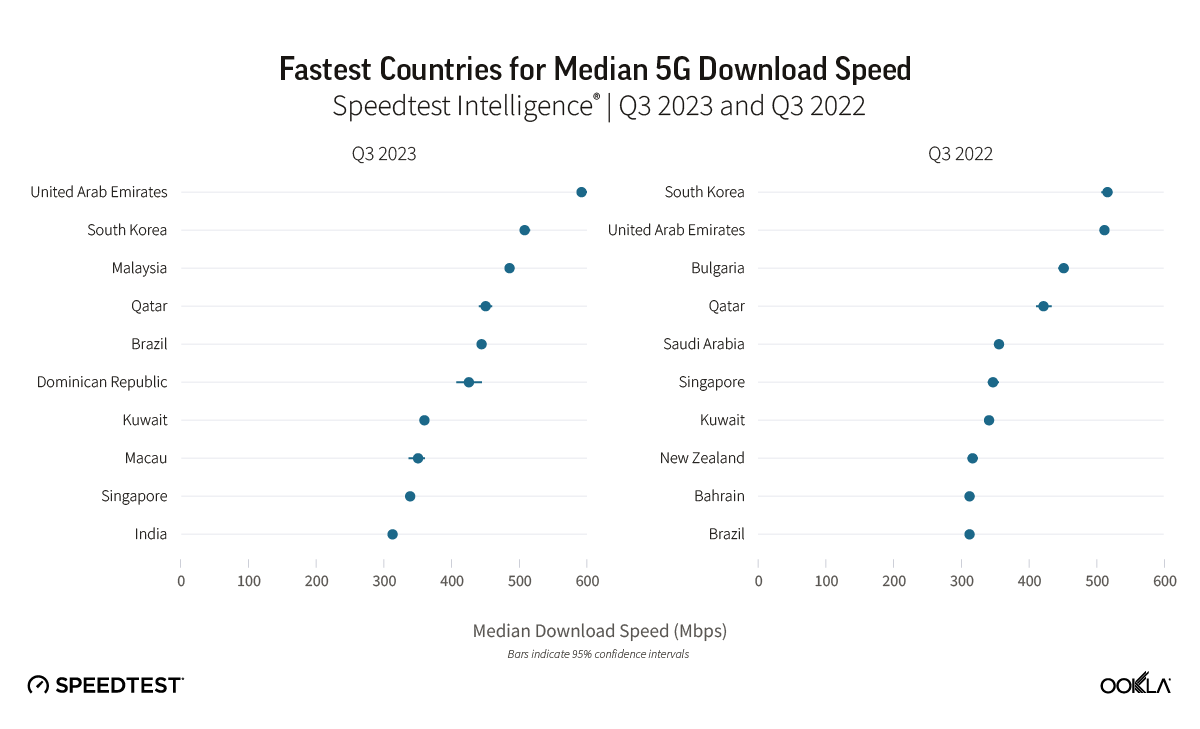
During Q3 2023, the United Arab Emirates and South Korea stood out as leaders in 5G performance, boasting the fastest median 5G download speeds globally at 592.01 Mbps and 507.59 Mbps, respectively. Our top 10 list also includes Malaysia, Qatar, Brazil, the Dominican Republic, Kuwait, Macau, Singapore, and India. The shift in the top 10 rankings reveals dynamic changes, with Malaysia, the Dominican Republic, and India making significant strides, while Bulgaria, Saudi Arabia, New Zealand, and Bahrain dropped out of the rankings.

The U.A.E showcased a 14% increase in its median 5G download speed, reaching 592.01 Mbps in Q3 2023, up from 511.68 Mbps in Q3 2022, allowing the U.A.E to take the top spot from South Korea. Key factors contributing to the U.A.E.’s 5G leadership include fierce market competition driven by Etisalat and du, resulting in extensive 5G coverage and widespread access to 5G services. Additionally, the allocation of a 100 MHz of contiguous spectrum, as discussed in our 5G spectrum article, has played a pivotal role in achieving faster speeds, lower latency, and improved spectral efficiency.

The regional shift in 5G performance leadership is noteworthy. In 2022, half of the top 10 countries were from the Middle East, while in 2023, the same proportion hailed from the Asia Pacific region. Our analysis suggests that early adopters in the Asia Pacific region have outperformed major European markets in 5G performance, due to factors such as early spectrum availability and supportive government policies.

Malaysia’s remarkable achievement in reaching the third spot globally for 5G download speed, with a reported speed of 485.24 Mbps in Q3 2023, is particularly noteworthy. Despite launching its nationwide 5G network less than two years ago, Malaysia’s unconventional deployment strategy has proven effective. India has also made a significant leap, with its median 5G download speed of 312.26 Mbps allowing India to reach the top 10 worldwide. The country’s climb of 72 places on the Speedtest Global Index™ between September 2022 and August 2023 is primarily credited to the launch of 5G. Following a 5G spectrum auction in India, operators have successfully addressed network congestion issues by offloading 4G traffic onto 5G networks.

In Brazil, 5G download speed increased 1.4 times, jumping from 312.09 Mbps in Q3 2022 to 443.93 Mbps in Q3 2023. Before Brazil’s 5G spectrum auction, operators had offered 5G using DSS since July 2020. While DSS can provide broad 5G coverage, its speeds are often similar to those on 4G LTE networks. In November of 2021, however, Brazil’s multi-band 5G spectrum auction closed, which not only generated BRL47.2 billion ($8.5 billion) in total commitments, but it also allowed operators to deliver much faster speeds on dedicated 5G spectrum compared to DSS. National operators – Telefonica Brasil (Vivo), Claro Brazil, and TIM Brazil – ended up with 40 MHz or 50 MHz in the 2.3 GHz spectrum band and 100 MHz each in the 3.5 GHz band. The subsequent simultaneous activation of 5G networks in July 2022 marked a transformative moment with the continuous expansion of 5G services to 623 municipalities by December 2023. An upcoming spectrum auction expects to improve Brazil’s 5G standing even further.

The Dominican Republic’s entry into the top 10 fastest 5G countries was marked by its official launch of 5G services in December 2021, making it the first Caribbean nation and the third in Latin America to adopt a 5G network.

Disparity Between 5G Performance and Consumer Perception

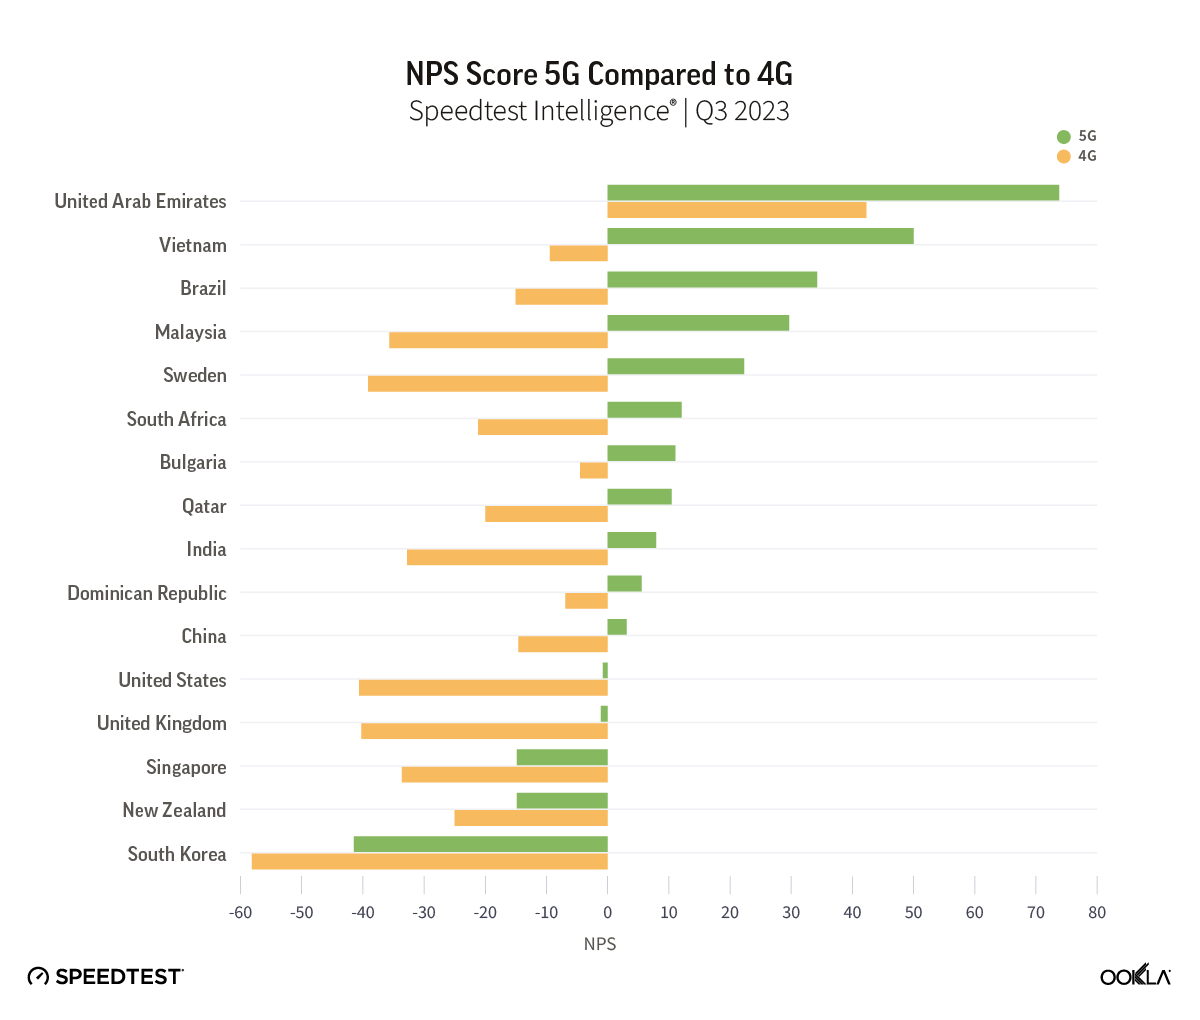
The Net Promoter Score (NPS) is a tool that gauges customer loyalty and satisfaction. At the end of Speetest, users may be asked to answer “How likely is it that you would recommend [provider] to a friend or colleague?” on a scale from 0-10. Net Promoter Scores are applied to both users and providers. Users are categorized into Detractors (score 0-6), Passives (score 7-8), and Promoters (score 9-10). NPS is the percent of Promoters minus the percent of Detractors and is displayed in the range from -100 to 100. Providers are ranked in descending order of NPS. NPS categorizes users into Detractors (those that score 0-6), Passives (scores between 7 and 8), and Promoters (scores of 9-10). NPS represents the percentage of Promoters minus the percent of Detractors displayed in the range from -100 to 100. 

In our article discussing whether 5G was meeting customer expectations, we found that 5G users typically rate their network operator with NPS scores universally higher than those for 4G LTE users. In Q3 2023, that trend continued, as 5G  users that were on 5G network when answering the NPS question still scored higher than those on 4G across all markets analyzed. It isn’t surprising given that at a global level, 5G had a 637% better median download speed than 4G and a 130% better median upload speed. 

Chart of NPS Score, 5G Compared to 4G

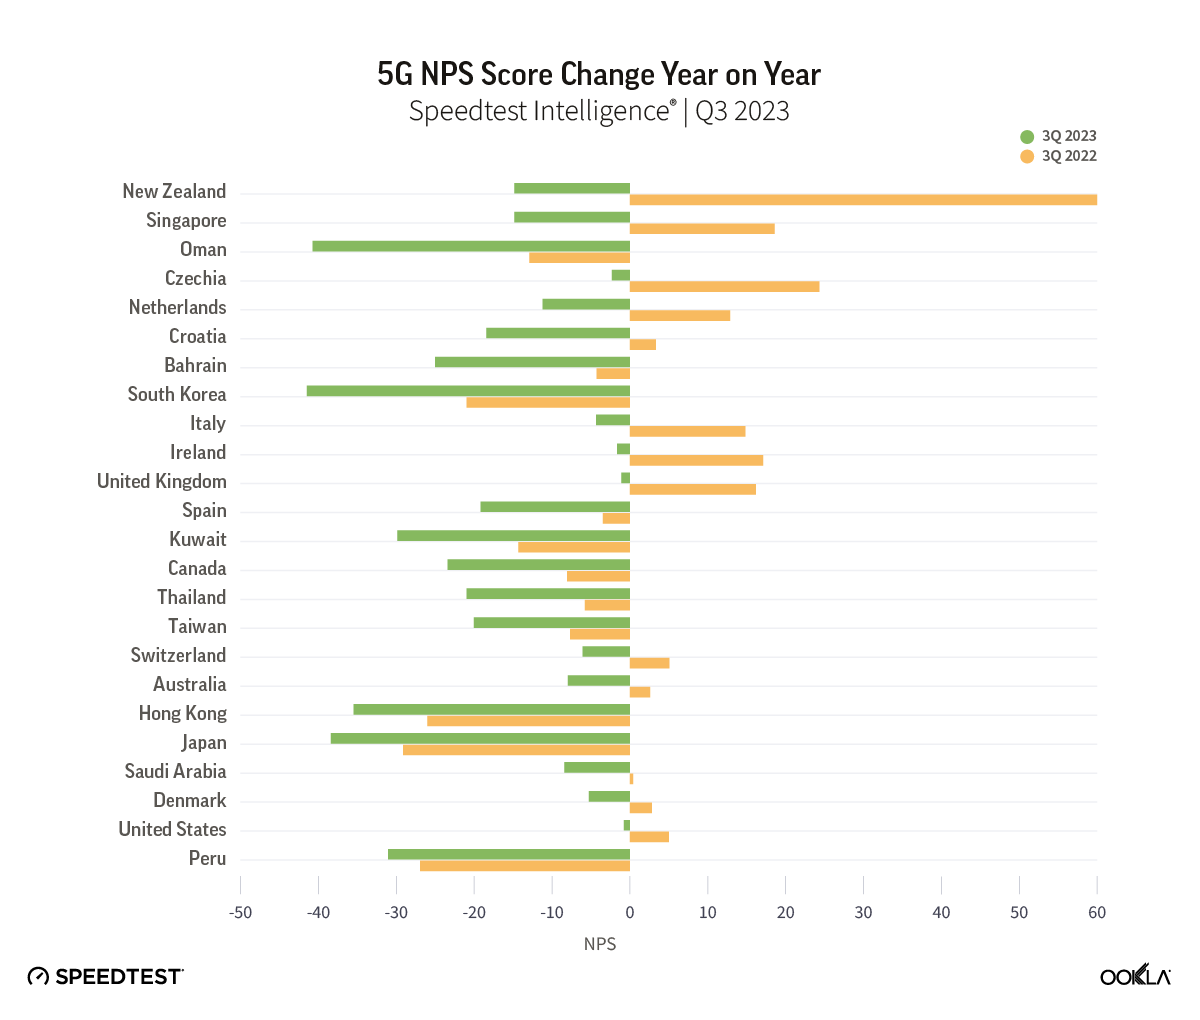
While 5G NPS still outpaces scores on 4G, our data shows that 5G NPS has been decreasing annually. This could point to the fact that excitement about 5G as a new technology is waning as users become used to faster speeds, or as customers await new use cases that can take advantage of the faster speeds that 5G can provide. After all, we are still waiting for that killer app for 5G, the way the video and streaming were for 4G. 

While it is difficult to fully explain the reasons behind the 5G NPS decrease without further research, we can clearly see that network performance isn’t the only factor at play influencing NPS declines. Others can include customer care, pricing, and other services. For example, in South Korea, one of the first countries to launch 5G with one of the world’s fastest speeds, consumers scored 5G networks -41.47 in Q3 2023 compared to -20.51 in Q3 2022. 

In March 2021, South Korean consumers launched a class action suit against operators because they felt they were being misled by the promises of 5G in the country. Recently, South Korea’s antitrust regulator fined three 5G operators a total of 33.6 billion won ($25.06 million) for making exaggerated claims about the level of performance their networks could achieve. South Korean operators claimed consumers could experience theoretical 5G speeds, which are not practically achievable in a “real world” environment, as factors such as spectrum usage, network densification, user location, and device capability significantly affect actual performance. Our data shows that the top 10% of 5G users in South Korea experienced speeds of 1.004 Gbps in Q3 2023, which, although impressive, are far lower than the advertised 20 Gbps speeds. 

Chart of 5G NPS Score Change Year on Year

Fixed Networks

Fiber driving fixed performance gains 

Illustration of Fixed Median Performance Worldwide

On a global scale, fixed networks have demonstrated significant advancements, achieving a median download speed of 83.95 Mbps and an upload speed of 38.32 Mbps in Q3 2023, per Speedtest Intelligence data. This signifies a substantial 19% improvement in download speed and an impressive 28% enhancement in upload speed compared to those in 2022. This also indicates that more fixed connections have migrated to fiber networks.

According to the World Broadband Association (WBBA) report titled “Next Generation Broadband Roadmap 2023 to 2030” Fiber-to-the-Home (FTTH) is identified as the natural progression from copper-based xDSL broadband networks. The shift towards FTTH varies across different countries and regions, but the industry is committed to embracing more advanced and efficient broadband technologies. 

Oftentimes, despite improvement in underlying broadband technology, Wi-Fi is the bottleneck that reduces customer experience. Our research has shown that Wi-Fi performance can lag behind ethernet in markets where advanced cable and fiber connections are replacing legacy broadband technology (such as DSL or coax cable). Wi-Fi speeds typically range from 30-40% of ethernet, indicating a need to accelerate the adoption of more advanced Wi-Fi technologies and optimize the home network environment.

The UAE, Singapore, and Hong Kong are in the lead for fixed

Chart of Fastest Countries for Fixed Broadband Download Speed

The United Arab Emirates (UAE) and Singapore led the way in fixed network performance.

The UAE achieved a median download speed of 247.63 Mbps in Q3 2023, representing a notable 1.83 times increase compared to the previous year. Most customers in the UAE have access to fiber networks, and additional measures have been implemented by operators in the region to enhance internet speeds, such as increasing the minimum download speed from 250 Mbps to 500 Mbps and offering price discounts to incentivize users to upgrade to higher-tier plans. 

Singapore also leads on the 2023 Fiber Development Index (FDI), with maximum scores in seven of the nine metrics. Singapore, along with Qatar and South Korea, has achieved 100% FTHH coverage. One of the reasons for this success, besides having a smaller area, is that Singapore’s regulator mandates building owners and real estate developers to provide adequate space, facilities, and accessibility for network operators to pre-install fiber networks.

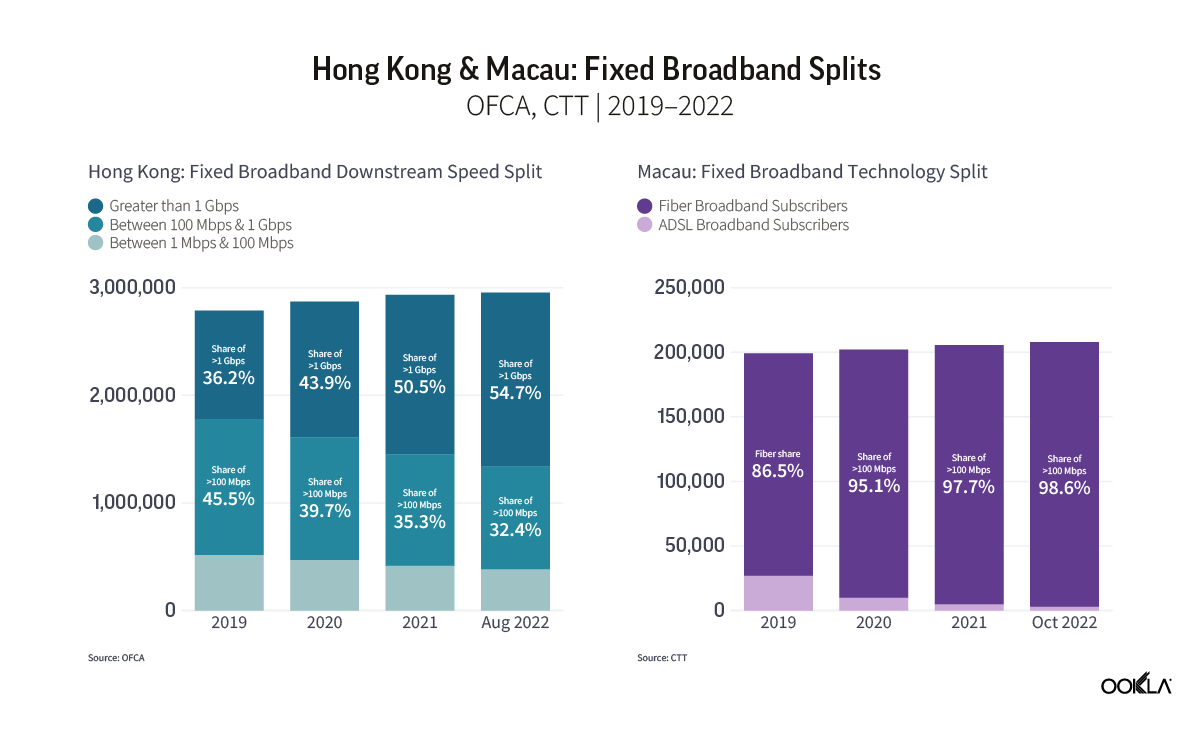
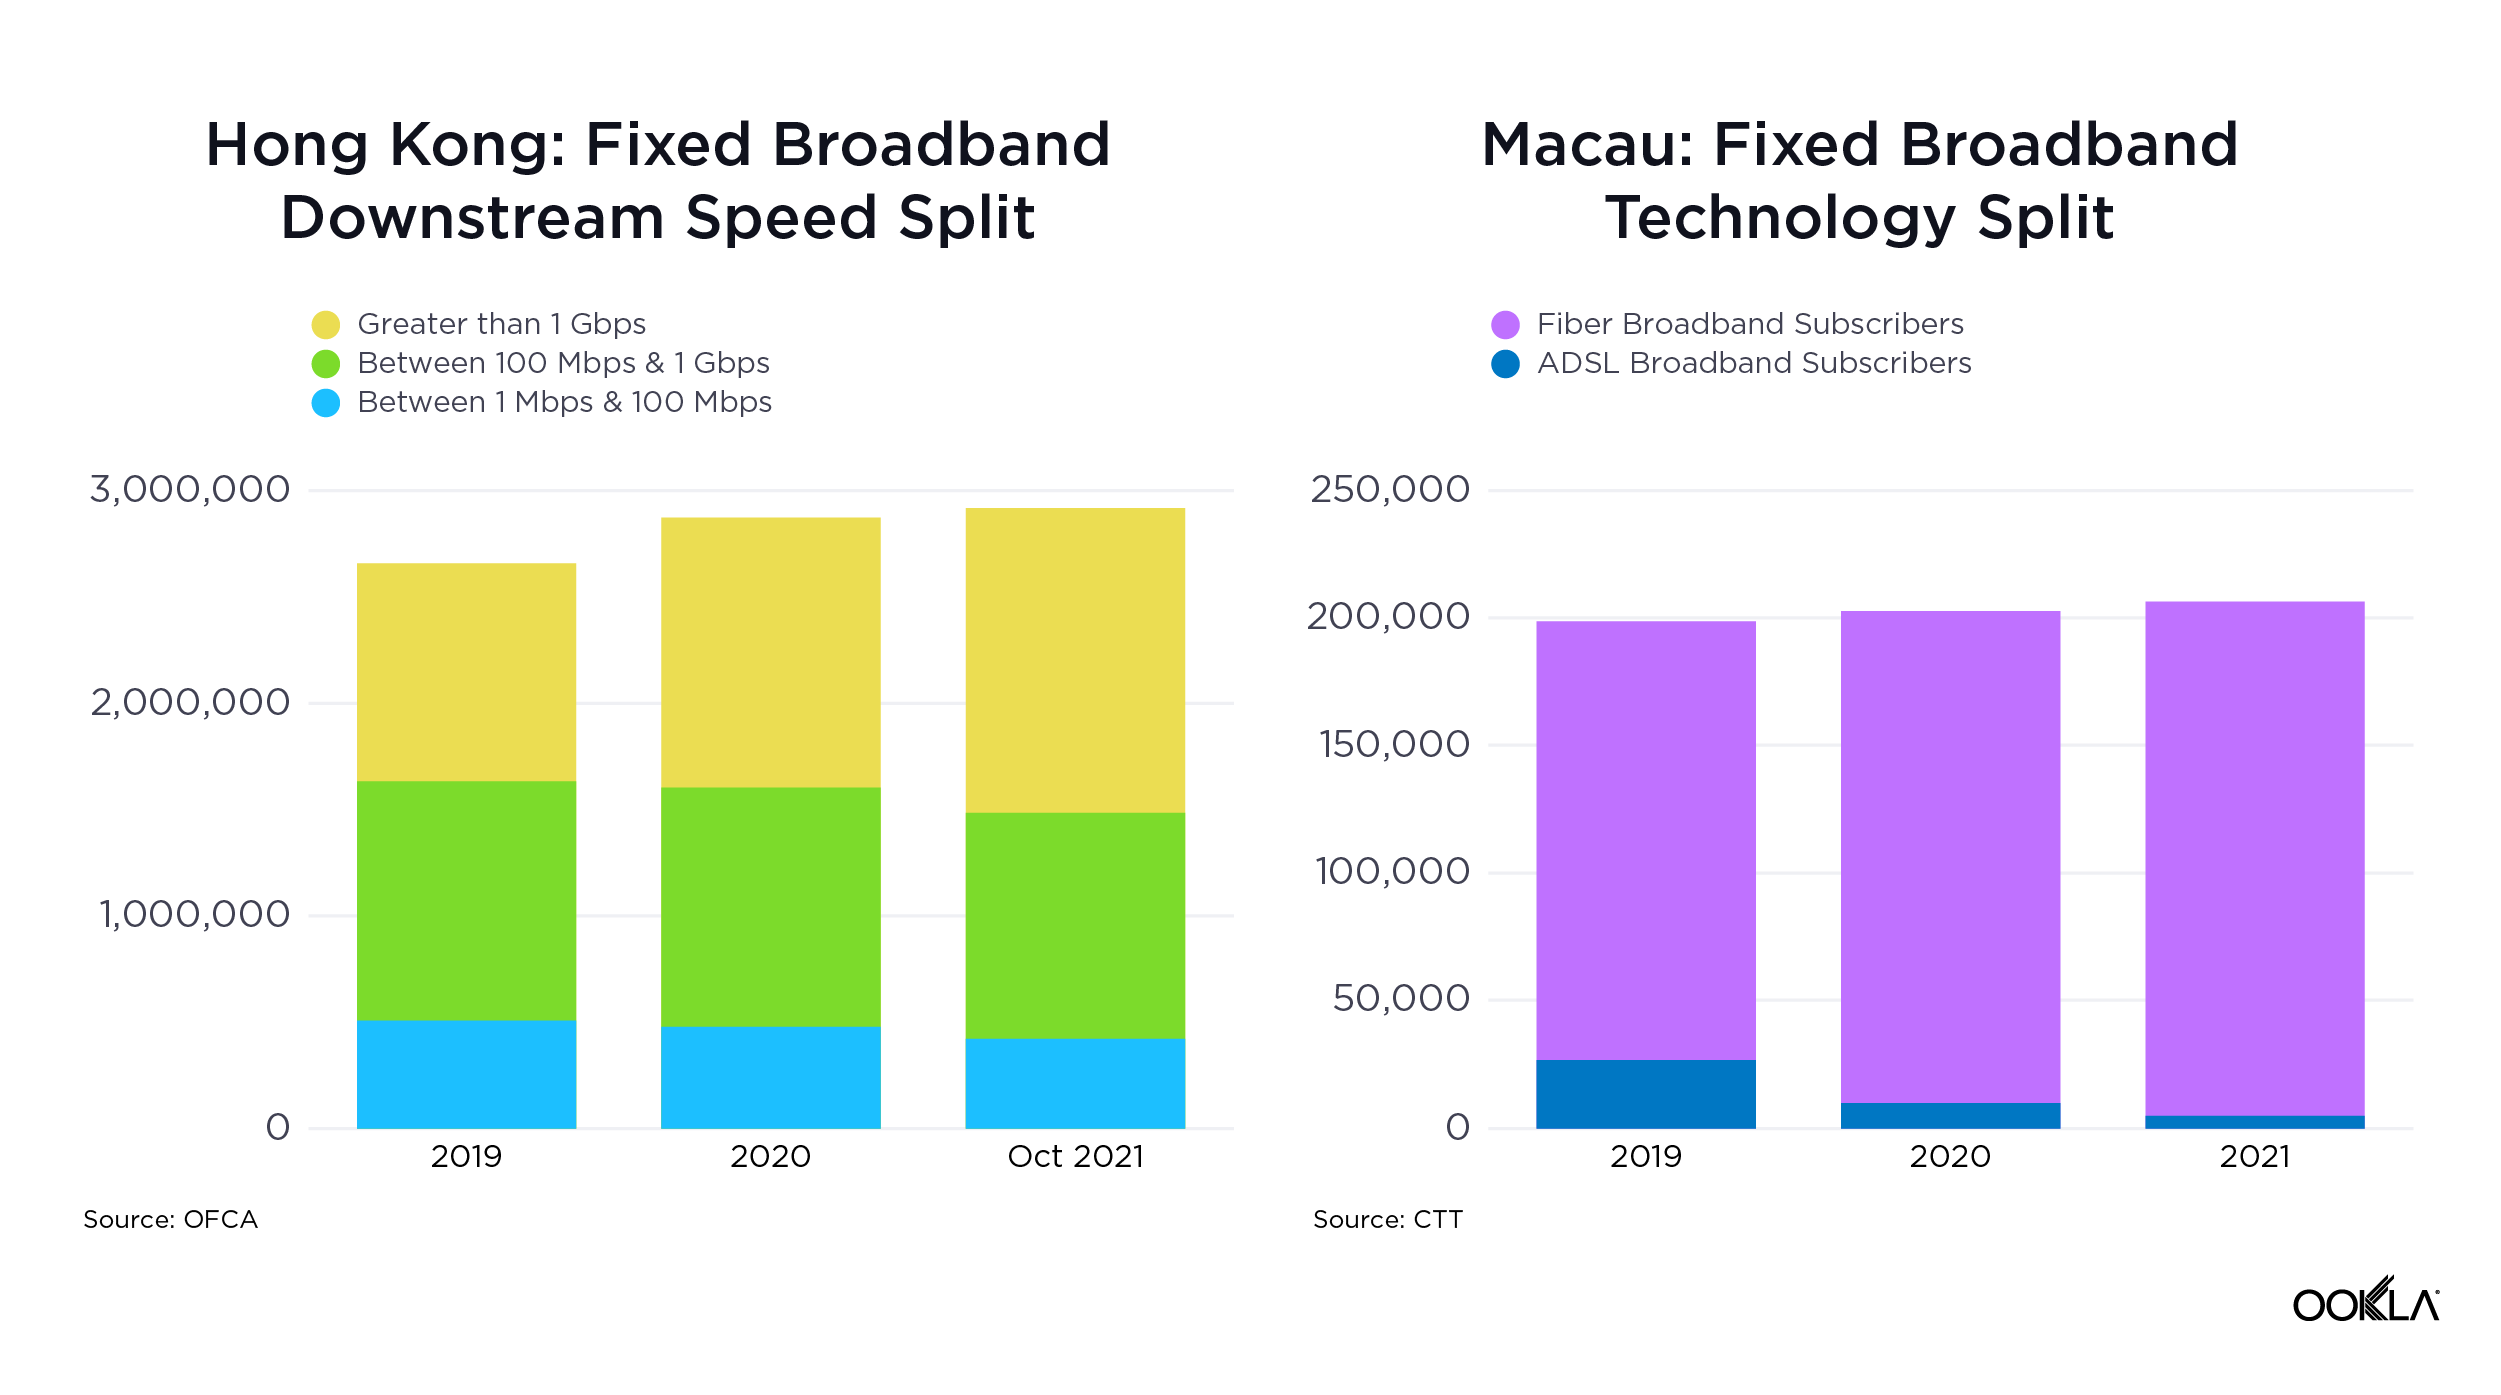
Hong Kong also demonstrated significant progress, with a 37% increase in median download speed and a 40% increase in upload speed. To track broadband adoption, the Office of the Communications Authority (OFCA) in Hong Kong monitors broadband adoption by advertised speed and technology mix; as of August 2023, 66% of residential clients already subscribed to the Internet with a download speed equal to or greater than 1 Gbps.

Chile has seen a 14% improvement in median download speed and a 29% improvement in upload speed on the back of a greater fiber adoption. Chile has been the top-performing fixed broadband market across Latin America, consistently outperforming other regional markets but over the last three years, it has also closed the performance gap with other leading markets globally. Chile’s strong fixed broadband performance — an anomaly in the region — is primarily due to strong competition among Chilean ISPs. Chile has seven ISPs with over 5% market share, all heavily focused on migrating customers to fiber. 

Thailand is a newcomer to the ranking as FTTH continues to grow strongly. FTTH constitutes an impressive 95% of fixed broadband users in Thailand, equivalent to around 58.96% of household penetration. Operators have been actively rolling out fiber in adherence to the Digital Thailand National Policy.

In the United States, there has been a 26% improvement in median download speed and a 7% improvement in upload speed. In this very competitive market, with a range of access technologies vying for customers, a combination of migration to fiber, 5G fixed-wireless access (FWA), and faster cable connections is helping drive higher performance levels. In line with the demand for faster network performance in the market, the FCC recently announced that it is seeking input on a planned increase to its definition of broadband/high-speed internet to 100 Mbps download and 20 Mbps upload, up from the current 25 Mbps download and 3 Mbps upload standard.

As discussed in our recent article, several European countries are making substantial progress in offering high-speed broadband. Across Europe, Denmark had the fastest median download speed for fixed broadband (196.43 Mbps), followed by Spain (176.08 Mbps) and France (170.51 Mbps). Denmark experienced a 25% improvement in median download speed and a 16% improvement in upload speed. Spain also showed significant improvement, with a 32% increase in median download speed and a 29% increase in upload speed. France exhibited even stronger progress, with a 53% increase in median download speed and a 41% increase in upload speed. The speed gains we’ve seen in Spain and France are correlated with an increase in fiber adoption; for example, Spain boasts nearly 90% fiber optic coverage, thanks to private initiatives and government support, while France expects a full-fiber rollout by 2025.

Connectivity for All

The imperative of closing the connectivity gap

Massive investments are being made to bridge the connectivity gap as recognition of connectivity as a fundamental human right is growing. According to a WBBA Whitepaper, a high level of broadband penetration is critical to the country’s socioeconomic development. However, it’s not only about being connected to the network per se; the quality of that broadband connection is equally crucial. Unlike other utility services like gas and electricity, where quality is generally stable, with broadband, the quality of the network experience is crucial to ensure users can benefit fully from multiple applications.

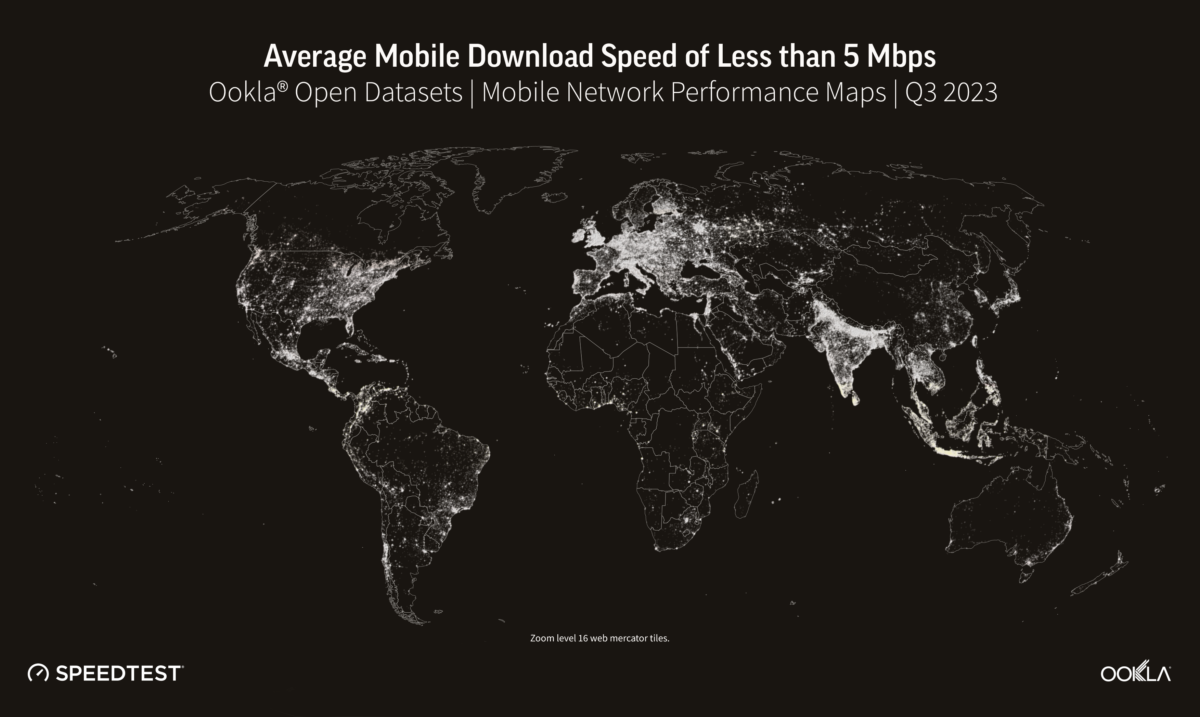
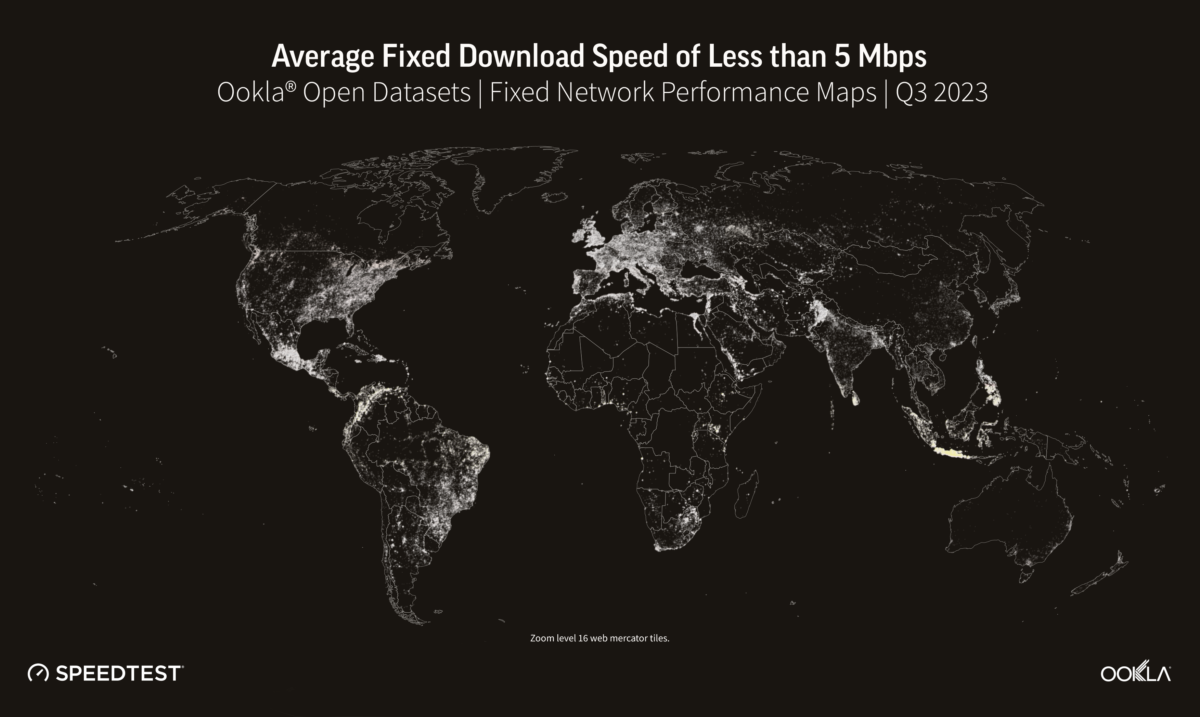
To assess the digital divide, we mapped mobile and fixed internet performance using data from the Open Data Initiative, which Ookla provides as part of Ookla for Good

Determining where a digital divide exists is a complex issue that involves identifying where network infrastructure is located, where people need connectivity, and how affordable it is. Although it can be challenging to dig into a specific location, it is evident that there are varying levels of Internet performance worldwide. A quick glance at our data shows that fixed broadband customers are more likely to experience faster networks (measured as an average download speed of 100 Mbps and above) than mobile across the Americas and Europe. The opposite is true for mobile networks across Africa and APAC, where mobile networks are often the primary means of connectivity. Compared to urban areas, rural communities are often ill-equipped for broadband access. Due to a lack of bandwidth (and therefore slower speeds), people in these areas need help doing many things on the internet, such as streaming videos. The US regulator FCC defines broadband in the United States as access to  25 Mbps download and 3 Mbps upload speeds. Areas without those speeds are classified as broadband “digital deserts,” even if those areas have internet access. Although broadband definitions can vary considerably from country to country, we can see in the next section that many areas fall outside any standards of connectivity globally.

Despite the world becoming increasingly connected, many rural and remote areas still struggle to access the internet. For example, large swathes of South America and Africa fall outside terrestrial network coverage. As discussed in our recent article, cellular networks are critical to connecting individuals and businesses as internet access in Africa is predominantly mobile. Before we can start discussing 5G, connecting communities with the internet in general is a priority. Affordable 4G smartphones and targeted financing for under-served demographics are key for bridging the digital divide and reducing poverty, as a World Bank study found that 4G coverage can help cut poverty by up to 4.3%. 

5G technology can potentially replace fixed internet access in situations where the cost of fiber deployments is high and rolling out traditional fixed broadband networks isn’t commercially viable. However, in countries like Indonesia, satellite technology may be a more effective solution for connecting remote areas. While 5G Fixed Wireless Access (FWA) and satellite technology can complement each other, the adoption of satellite technology is currently limited by factors such as coverage, device affordability, and service cost. As revealed in our recent article, Starlink outperforms GEO satellites and is a suitable replacement for fixed networks in rural areas. While it may not match the leading cable or fiber providers in terms of median speeds or multi-server latency, satellite internet provides a viable alternative in places where cable and fiber access networks are unavailable. This is mainly due to a more consistent distribution of download performance across Speedtest samples, unlike FWA and DSL-based services, where performance is impacted by the distance from the cell site or exchange/DSLAM.

Fixed and mobile network operators across the globe widely use Speedtest data to enhance Internet quality, improve accessibility, and inform network expansion. The United States Federal Communications Commission and the Malaysian Communications and Multimedia Commission rely on Speedtest data to ensure accountability of telecommunications entities and allocate funds for rural and urban connectivity development. Ookla also licenses data to NGOs and educational institutions to help bridge the digital divide between areas with and without modern Internet access. Our mapping data is used to track results and determine whether broadband infrastructure can handle growth as more people connect devices and technologies demand more bandwidth. We are also actively involved in discussing best practices for ensuring digital transformation and connectivity for all in the APAC region, Central Asia, and Europe. If you are interested in working with us, please reach out. 

Keep track of how well your country is performing on Ookla’s Speedtest Global Index and get advice on how to plan and optimize your network.

Ookla retains ownership of this article including all of the intellectual property rights, data, content graphs and analysis. This article may not be quoted, reproduced, distributed or published for any commercial purpose without prior consent. Members of the press and others using the findings in this article for non-commercial purposes are welcome to publicly share and link to report information with attribution to Ookla.
| October 12, 2023

Transforming Connectivity with 5G in The Greater Bay Area

The Greater Bay Area (GBA) in China refers to the integrated city cluster in the Pearl River Delta of South China. Sometimes considered China’s Silicon Valley, it has emerged as one of the most economically developed regions in China, and as such has been at the forefront of its 5G rollout plans.

In this report, we will examine the 5G performance across the Greater Bay Area. We benchmark the results among the eleven cities in the area, focusing in particular on the four major cities of Guangzhou, Hong Kong, Macau, and Shenzhen. 

Key takeaways

  • The Greater Bay Area’s 5G growth is supported by policies and initiatives promoting 5G technology. The Greater Bay Area 5G Industry Alliance and network-sharing agreements are initiatives that foster collaboration among industry stakeholders, while also boosting deployment efficiency. Additionally, subsidy programs further encourage 5G expansion in the GBA. 
  • It is still early days for Macau, but the city’s 5G network has the fastest median download speed in the Greater Bay Area at 383.59 Mbps, while early adopter Hong Kong lags behind with a median download speed of 136.65 Mbps.
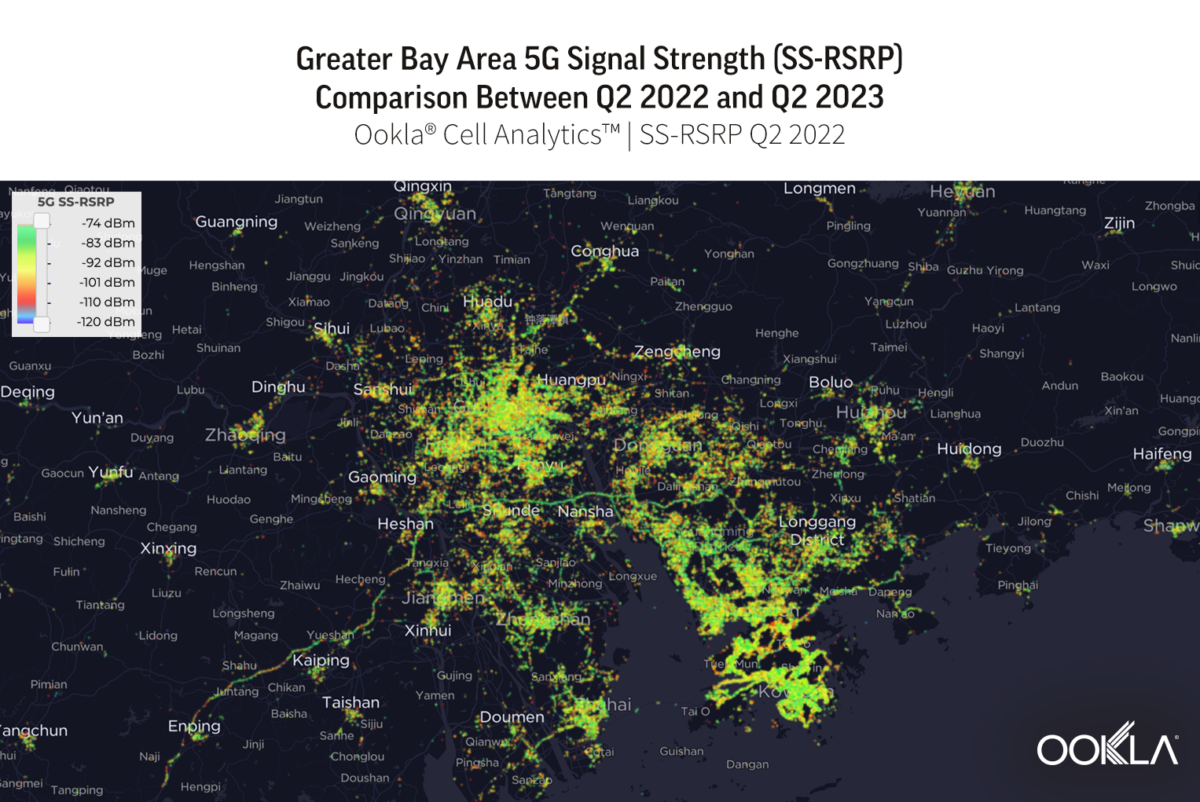
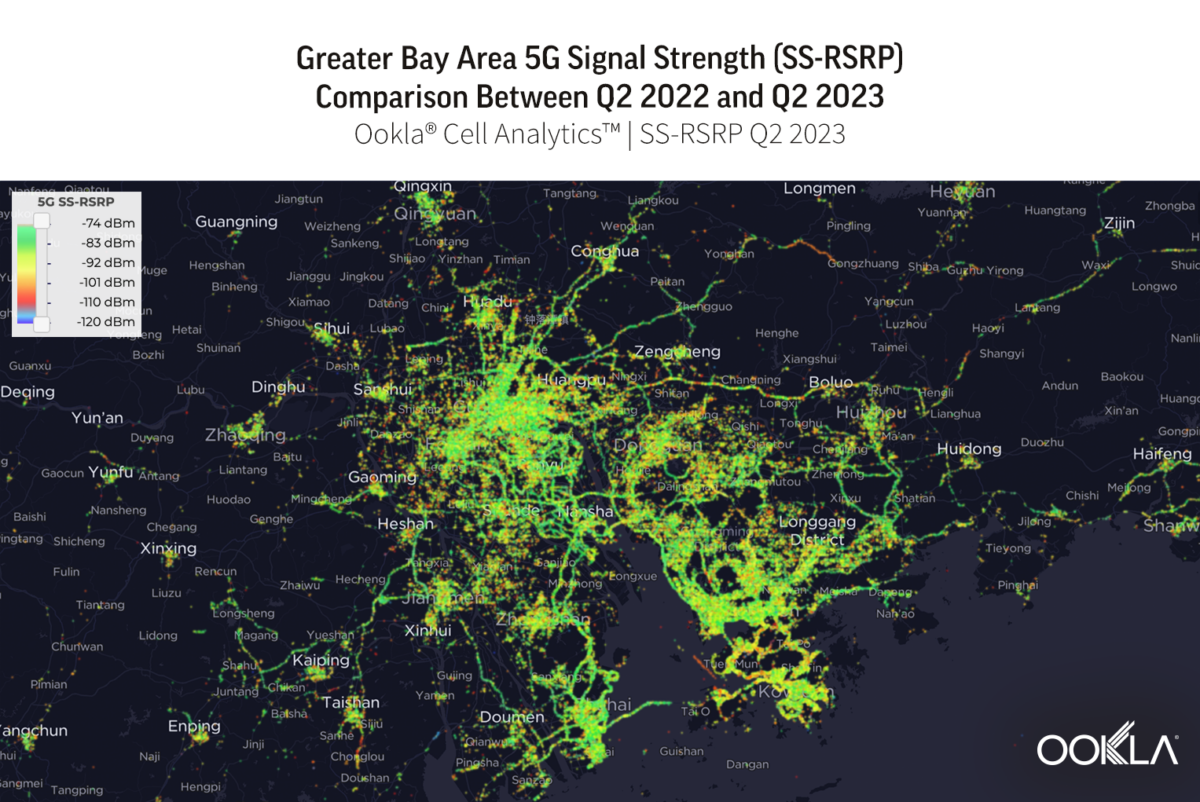
  • Improved integration between cities in the Greater Bay Area. Efforts to improve 5G infrastructure and connectivity between cities in the Greater Bay Area result in better coverage in highly populated areas and increased coverage along major connecting roads. Coverage plots show significantly more SS-RSRP samples of better than -92 dBm in Q2 2023 as compared to the previous year.
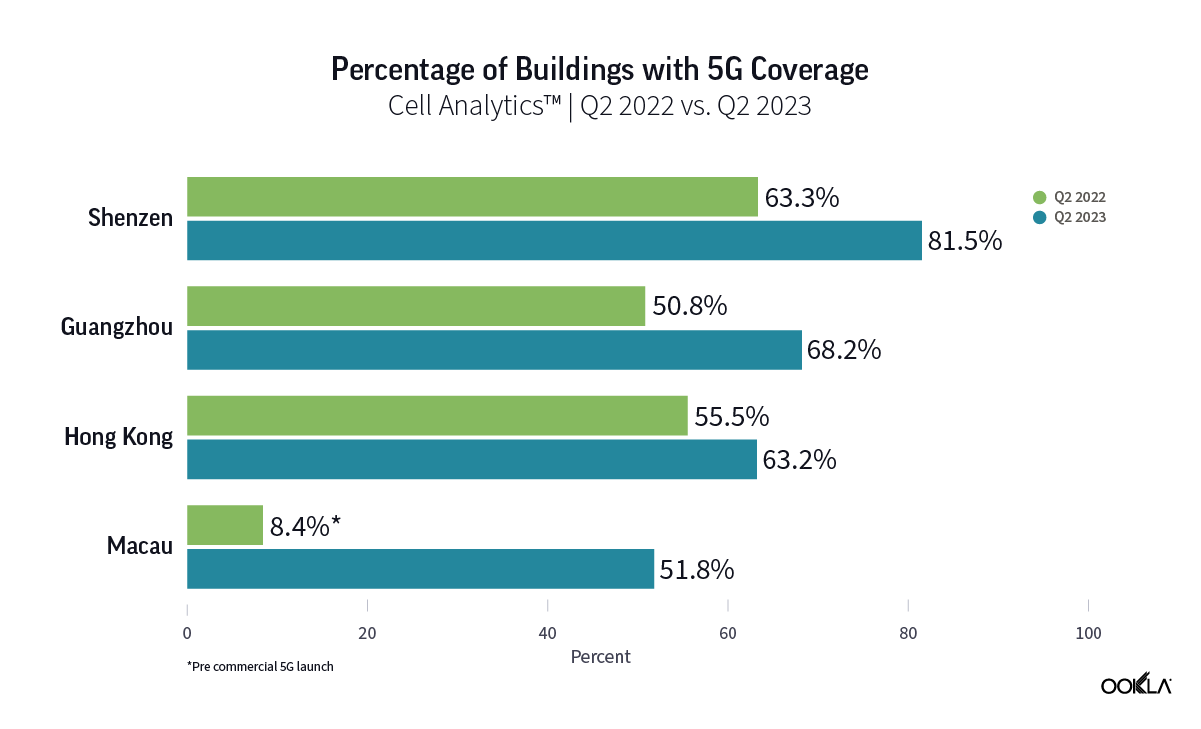
  • Operators have made strides in expanding 5G coverage within indoor settings. In under a year, over half (51.8%) of Macau’s buildings have reported indoor 5G coverage. Shenzhen (81.5%), Guangzhou (68.2%), and Hong Kong (63.2%) have also seen an increase in the number of buildings with 5G coverage in Q2 2023 compared to the previous year.

Coordinated initiatives and policies driving 5G deployment

The Greater Bay Area encompasses nine cities, including Guangzhou, Shenzhen, Zhuhai, Foshan, Dongguan, Huizhou, Zhongshan, Jiangmen, and Zhaoqing, as well as two Special Administrative Regions, Hong Kong, and Macau. With a population of 87 million, the region’s combined gross domestic product (GDP) was nearly US$2 trillion in 2022, accounting for almost 11% of China’s GDP.

5G technology is integral to China’s government vision and technology policies. The technology is a big part of the country’s development policy and goals for 2021 – 2025, as detailed in its 14th Five-Year Plan for National Plan. Benefiting from the central government policy, the Greater Bay Area has emerged as a thriving hub for established and emerging tech companies and startups. 

Given this dynamic, federal, and local governments are actively promoting 5G technology within the Greater Bay Area. One example is the establishment of the Greater Bay Area 5G Industry Alliance in 2019 by China Mobile Hong Kong, China Mobile Guangdong, CTM, and the Guangdong Communication Industry Association. The alliance members consist of operators, leading companies in the industry, social organizations, academic researchers, and enterprises involved in 5G technology. Their primary goal is to enhance and encourage the development of 5G industries among stakeholders and operators in the GBA region.

The Ministry of Industry and Information Technology (MIIT) in China also facilitated sharing of 5G networks and encouraged commercial partnerships among 5G operators. As a result, China Unicom and China Telecom have signed a cooperation agreement to share their 5G infrastructure. Providing subsidies is also a common tactic regulators and governments use to encourage 5G deployment. In Hong Kong, for example, from May 2020 till the end of December 2022, the Office of the Communications Authority (OFCA) ran a subsidy scheme to encourage various sectors, through financial incentives, to deploy 5G technology.

As a result, the GBA has witnessed significant investments and a rapid rollout of 5G infrastructure. By 2021, all cities in the region have launched 5G networks, with Guangzhou, Shenzhen, and Hong Kong leading the way.

Macau’s early 5G performance impresses

Chart of 5G Performance for All Operators Combined for Greater Bay Area

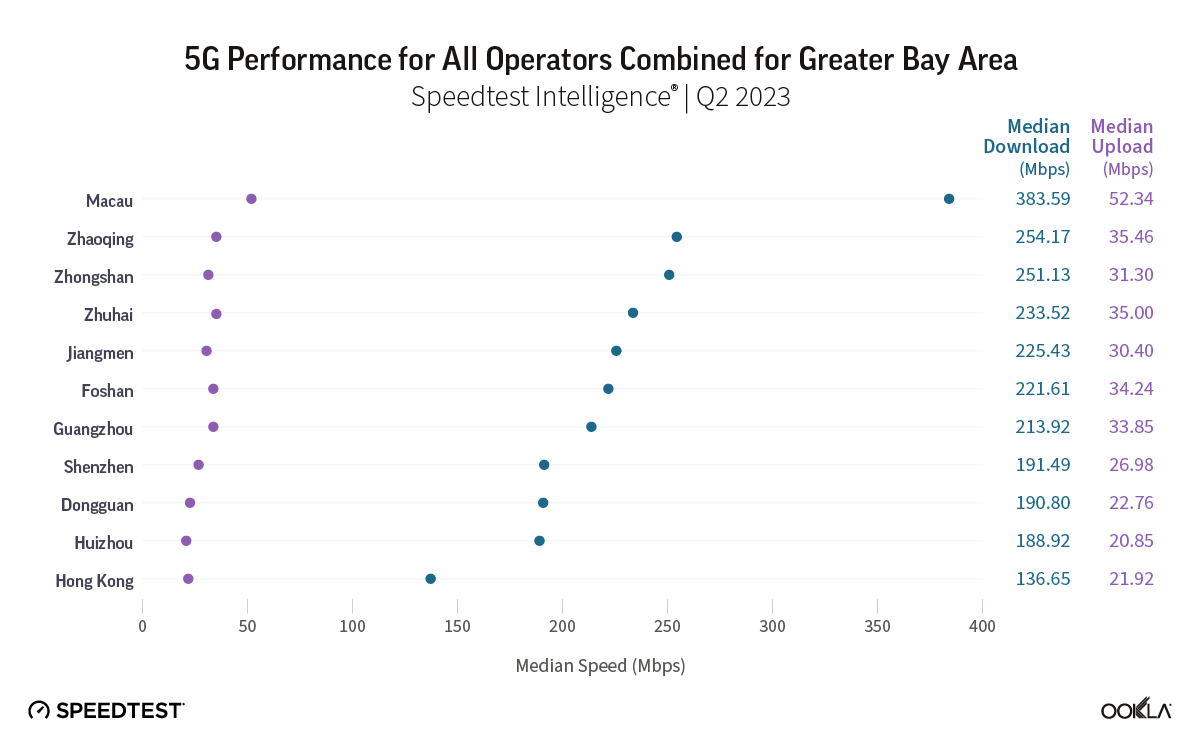
According to Speedtest Intelligence® Q2 2023 data, Macau outpaced all the other cities in the Greater Bay Area on median download speed, being the only city that topped 300 Mbps at 383.59 Mbps. Despite being the most recent city in GBA to launch its 5G network, operators in Macau began deploying as early as 2020, ahead of being granted their 5G licenses in November of 2022. CTM, one of the providers, stated that their 5G network has been fully operational since June 2021. Macau’s regulatory body, the Macau Post and Telecommunications Bureau (CTT), also mandated as part of the 5G license award that operators must cover 50% of the territory within the first year and provide full coverage within 18 months.

Within Guangdong Province, the nine cities have reported median download speeds ranging from 188 Mbps to 255 Mbps in Q2 2023. The cities of Zhaoqing and Zhongshan are the only cities in the province to report speeds of over 250 Mbps. Zhaoqing has a speed of 254.17 Mbps, while Zhongshan reports a speed of 251.13 Mbps.

Despite being an early adopter of 5G, Hong Kong’s median download speed of 136.65 Mbps in Q2 2023 falls behind the other cities in the GBA. One factor contributing to the lower median download speed is a preference for low bands to fulfill coverage obligations. CMHK, for example, has been deploying its 700 MHz 5G spectrum, enabling better indoor penetration and broader 5G coverage at the expense of median download speed.

Macau operators rank highest for 5G performance in the Greater Bay Area

Chart of 5G Performance Among Providers in Guangzhou, Hong Kong, Macau, and Shenzhen

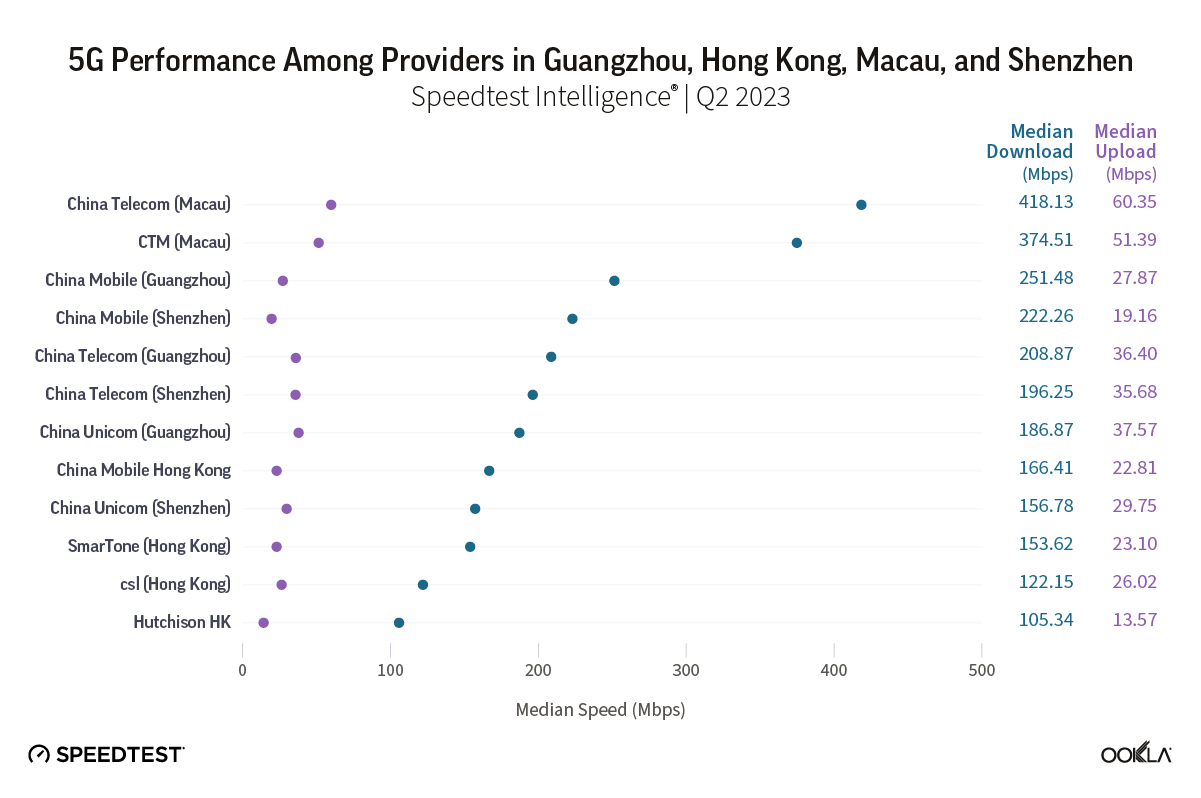
In this section, we drill down into the operators’ 5G performance in the major cities of Guangzhou, Shenzhen, Hong Kong, and Macau to understand which operators are driving 5G performance in these cities. Speedtest Intelligence data shows considerable variation in the median 5G download speeds across these four cities.

As with any new launches, it is not surprising that the operators in Macau rank higher in terms of performance than those in the other three cities. During Q2 2023, China Telecom in Macau reported a median download performance of 418.13 Mbps, while CTM Macau achieved 374.51 Mbps during the same period. While operators in Macau continue to invest in 5G solutions, it’s worth noting that users could see 5G speeds decline after more and more users join and congestion ticks up.

On the other end of the chart, SmarTone, csl, and Hutchinson in Hong Kong reported speeds of 153.62 Mbps, 122.15 Mbps, and 105.34 Mbps respectively. CMHK tops the 5G operators in Hong Kong with a recorded median download speed of 166.41 Mbps in Q2 2023. Although reporting comparatively slower speeds than its neighboring cities, the number of 5G users in Hong Kong exceeded four million in April 2023, representing over 60% of the population. 

Low latency comes to the fore with 5G

China remains one of the biggest gaming markets globally, with three in ten (29%) Chinese consumers claiming to spend most of their time gaming each week. 5G technology is expected to revolutionize how gamers connect to the internet by providing a much more reliable connection as more casual and serious gamers adopt mobile gaming. This has created a demand for low-latency network connections so gamers can enjoy seamless and lag-free mobile gameplay. Latency, or the reaction time of a connection, is a crucial metric for achieving optimal performance in technologies like gaming, video conferencing, and AR/VR. Aiming for a latency of 59 ms or less is recommended for the best gaming experience.

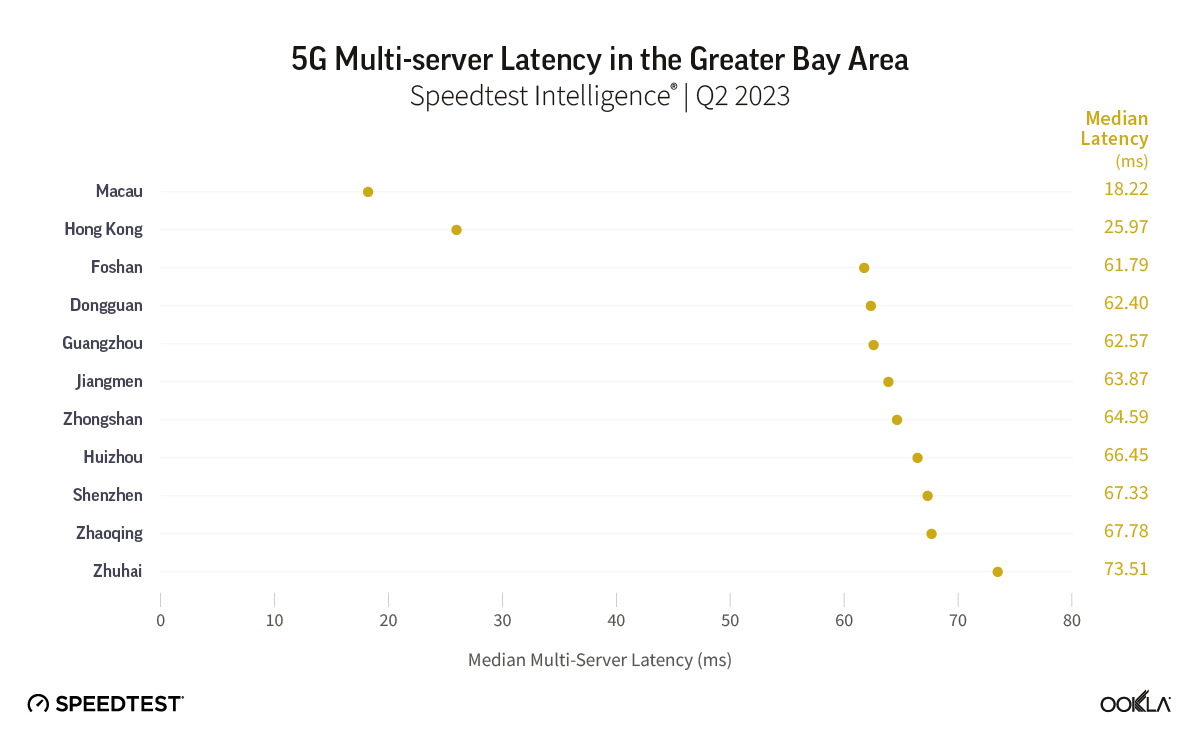
Chart of 5G Multi-server Latency in the Greater Bay Area

During Q2 2023, gamers in Macau and Hong Kong experienced significantly lower median latency on 5G, with both cities registering latency below 30 ms. Macau emerged ahead with a median latency of 18.22 ms, whereas Hong Kong reported a median latency of 25.97 ms. 

On the other hand, GBA cities in Guangdong Province reported a 5G median latency of over 60 ms during the same time frame. It’s worth noting that approximately 80% of tests conducted in Guangdong Province utilized servers based in Hong Kong and Macau, which influenced the higher latency results in these cities.

While gaming is usually top of mind when we talk about latency, having a low-latency network also plays a crucial role in driving digital transformation and achieving high levels of automation and responsiveness in key industries, such as manufacturing, logistics, and healthcare. The Chinese University of Hong Kong Hospital (CUHK) has partnered with Huawei Hong Kong to establish a 5G smart hospital. CUHKMC is utilizing the high throughput and low latency capabilities of 5G technology to facilitate innovative medical digital transformation. These include remote consultations and collaboration, telemedicine, and other applications to enhance patient treatment experience.

Boosting Cross-Border Connectivity

The Chinese government has implemented several measures to enhance the integration of Hong Kong, Guangzhou, Shenzhen, and Macau, along with the seven other cities in Guangdong Province. To encourage greater mobility across the Greater Bay Area, operators in the region are enhancing infrastructure by building more 5G sites and creating data plans that can be used while roaming within the GBA, reducing cross-border roaming expenses.

Comparing the 5G signal strength using the SS-RSRP metric from Ookla® Cell Analytics™ between Q2 2022 and Q2 2023, shows improvements in terms of 5G coverage in heavily populated areas of the region. The plot indicates significantly more samples along arterial routes connecting the main cities in Q2 2023, with more recorded samples with SS-RSRP of more than -92 dBm.

Similar effort on expanding 5G indoor coverage

With 70 to 80 percent of data traffic projected to be generated indoors, improving indoor coverage and user experience has become a priority, especially in highly dense cities such as those within the Greater Bay Area. China’s Ministry of Industry and Information Technology (MIIT) issued a 5G spectrum license to China Unicom, China Telecom, and China Broadnet to share the 3.3–3.4 GHz band as part of an effort to prioritize 5G indoor coverage. There has also been a significant drive by mobile operators in the GBA to extend 5G coverage to be readily available in public transport infrastructures. In Hong Kong, csl provides 5G network coverage along the MTR lines, with dedicated 5G spectrum on some routes.

Chart of Percentage of Buildings with 5G Coverage in Greater Bay Area

We analyzed data from Ookla® Cell Analytics™ to compare the percentage of buildings in Hong Kong, Macau, Shenzhen, and Guangzhou with reported 5G coverage in Q2 2022 and Q2 2023. Deployment of 5G primarily uses high-frequency spectrums, which poses challenges for indoor penetration. In this analysis, we have only considered buildings taller than 10 meters as they are more likely to be high-rise buildings with in-building solutions such as distributed antenna systems (DAS) or served by sites nearby.

Macau, which did not have any commercial 5G network a year prior, undeniably has the most significant increase in the percentage of buildings with 5G coverage over the past year. The operators in the city have managed to provide 5G coverage to more than 50% (51.8%) of the city’s buildings in less than a year.

Shenzhen, Guangzhou, and Hong Kong also saw increased buildings with reported 5G coverage. Shenzhen and Guangzhou had 81.5% and 68.2% of buildings with reported 5G coverage in Q2 2023, respectively, equating to an 18.2% and 17.4% increase from the previous year. Hong Kong, one of the most densely populated cities in the world, reported a total of 63.2 % of buildings with 5G indoor coverage in Q 2023, an increase from 55.5 % a year before. Operators’ use of sub-1 GHz frequencies in 5G deployment is one of the contributing factors to the reported increase in in-building 5G coverage. 

The outlook for the Greater Bay Area

The Greater Bay Area has embraced 5G technology, unlocking its potential to revolutionize various industries and drive automation and digitalization, and will continue to be a key driver of China’s economic growth. The region’s 5G network infrastructure has brought transformative opportunities across diverse sectors. However, there are still improvements to be made in terms of in-building coverage and implementation of more advanced 5G use cases. We will closely monitor the progress and implementation of 5G technology within the Greater Bay Area. If you are interested in benchmarking your performance or want to learn more about internet speeds and performance in other markets worldwide, visit the Speedtest Intelligence®.

Ookla retains ownership of this article including all of the intellectual property rights, data, content graphs and analysis. This article may not be quoted, reproduced, distributed or published for any commercial purpose without prior consent. Members of the press and others using the findings in this article for non-commercial purposes are welcome to publicly share and link to report information with attribution to Ookla.
| September 8, 2021

Despite All Odds, Global Internet Speeds Continue Impressive Increase


“A lot has changed” we wrote in our 2019 global roundup of internet speeds based on the Speedtest Global Index. Little did we know how much was about to change. But two things remain the same: the internet is getting faster and the Speedtest Global Index is still a fantastic resource for tracking improvements on a global and country level (if we do say so ourselves). Today we’re taking a look back at how much internet speeds have increased over the past four years and which countries have seen some of the largest gains.

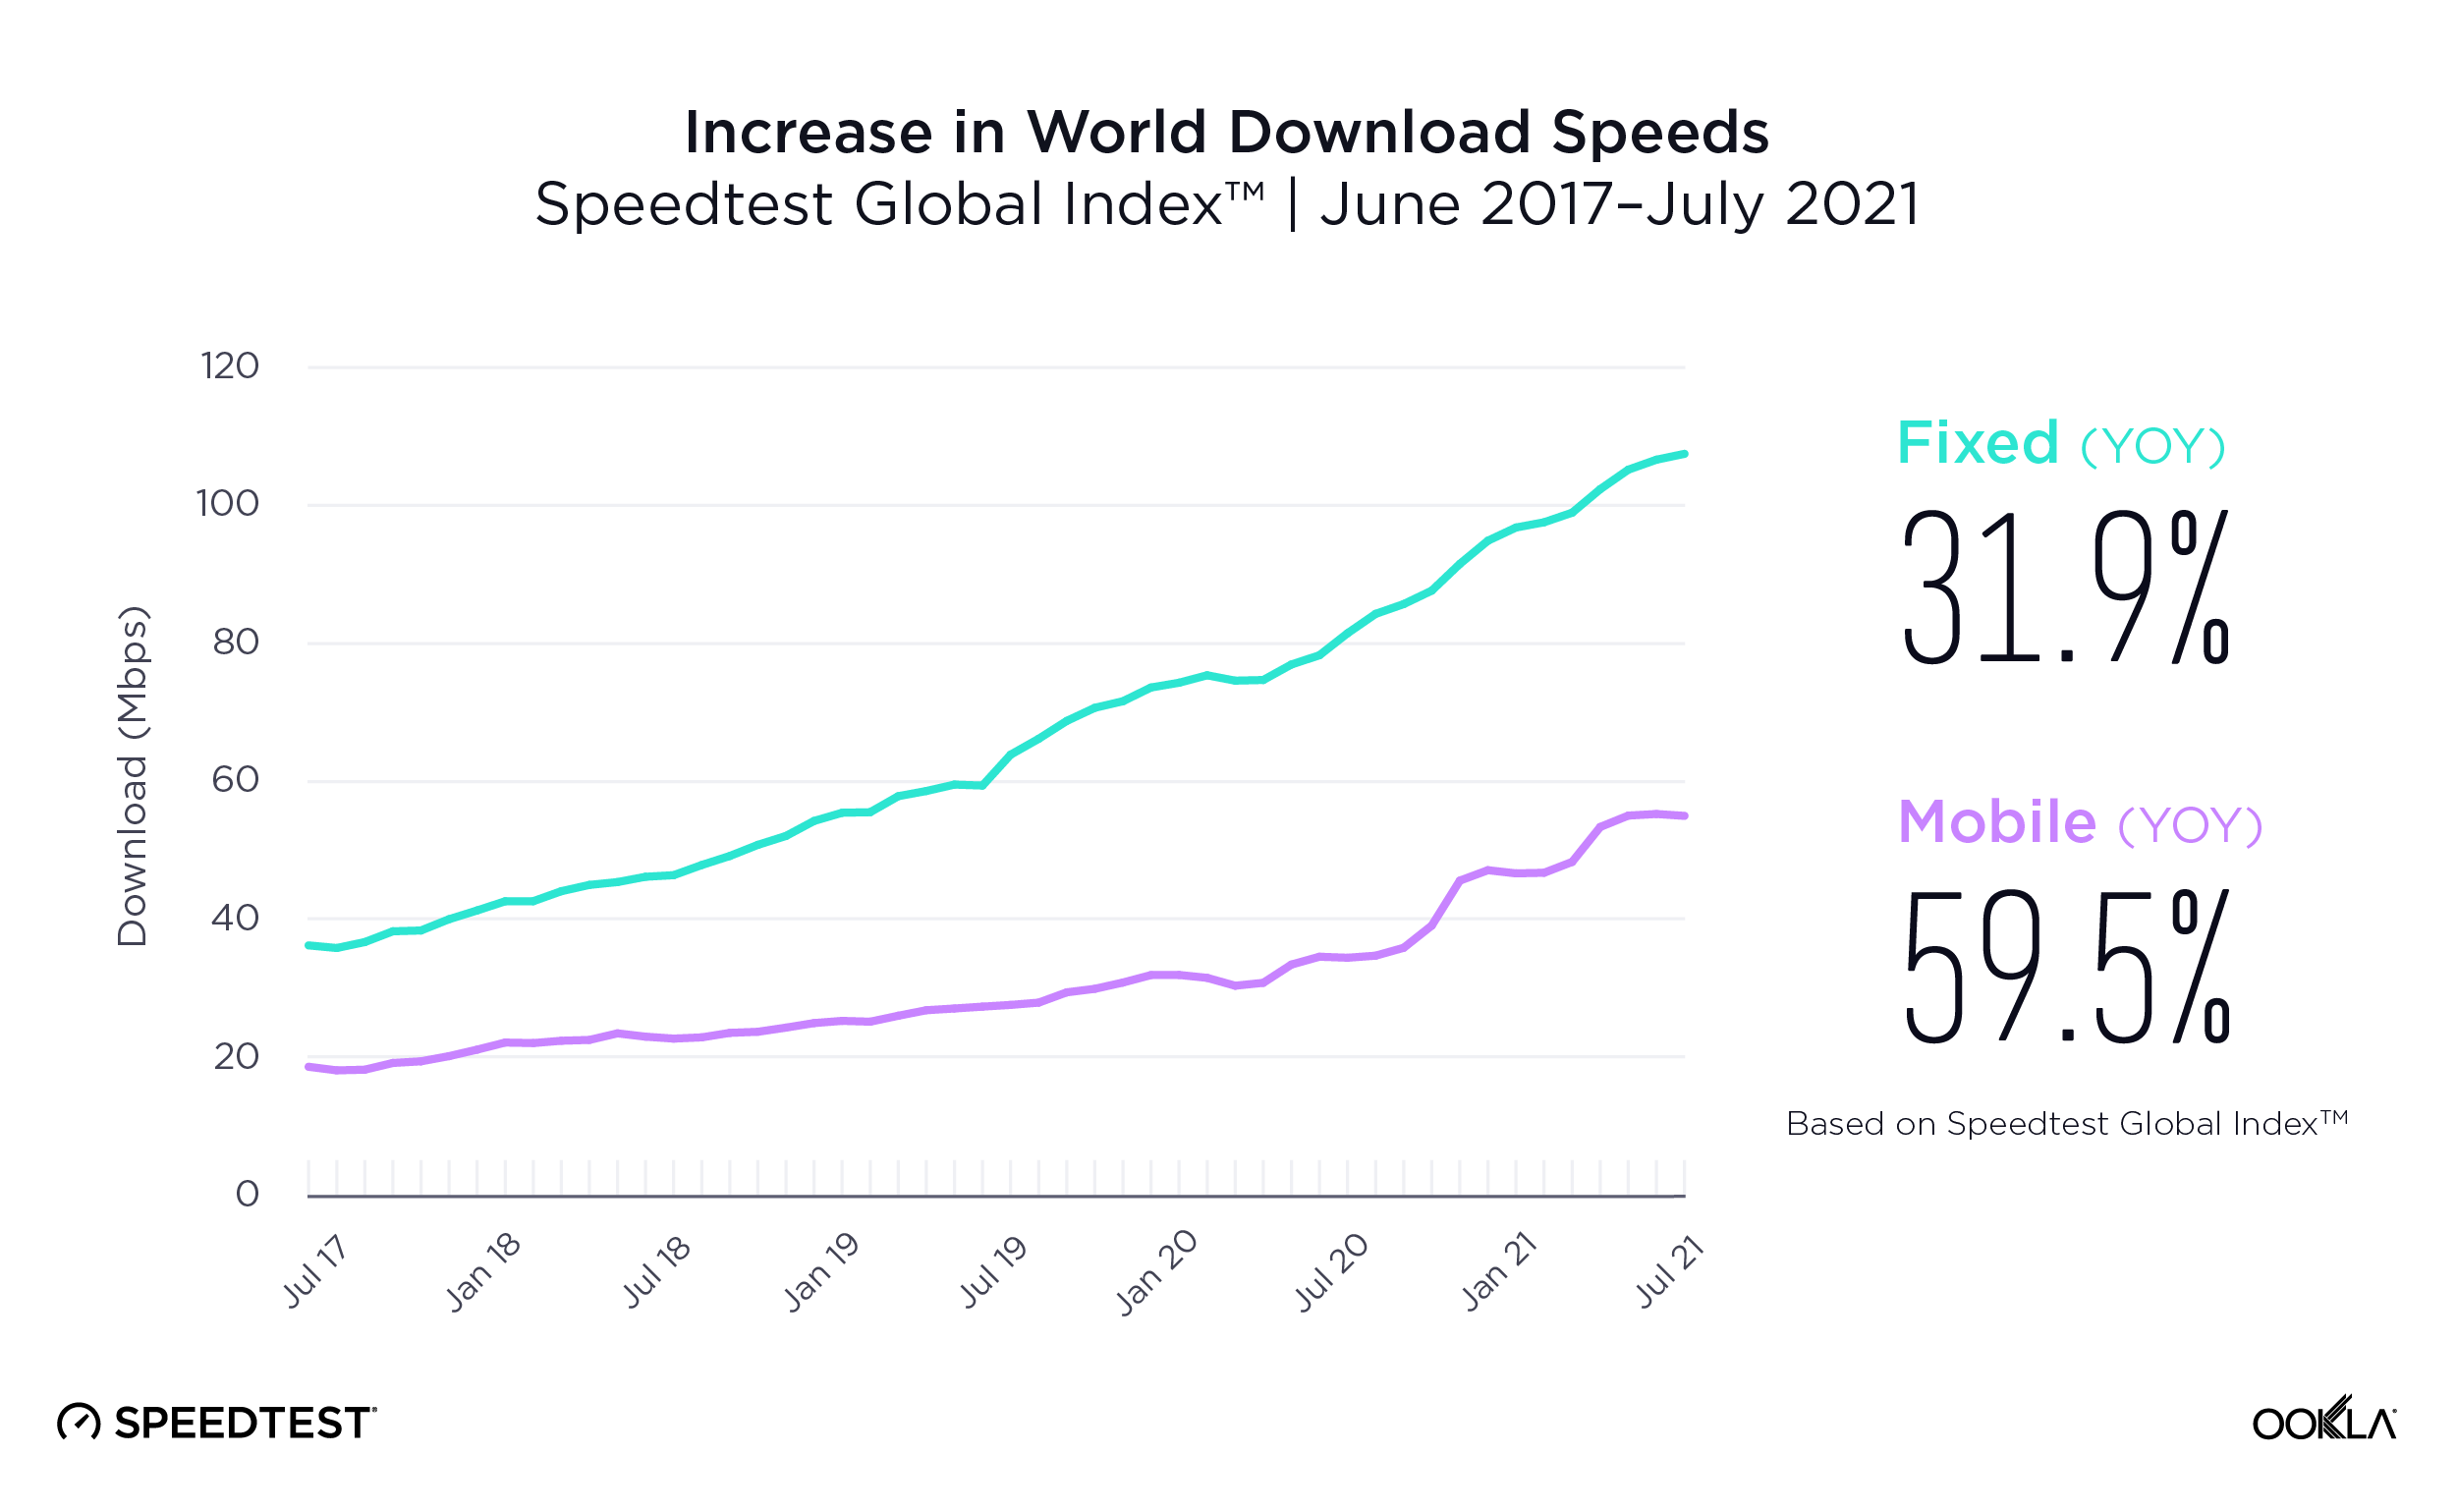
Mobile download speed jumped 59.5% over the last year globally, fixed broadband up 31.9%

The global mean of download speeds improved over the last 12 months on both mobile and fixed broadband to 55.07 Mbps and 107.50 Mbps, respectively, in July 2021. Mobile saw an increase of 59.5% when comparing July 2020 to July 2021 and fixed broadband saw an increase of 31.9%, according to the Speedtest Global Index.

ookla_global-index_world-speeds_0921-1

Looking further back, mean download speed over mobile was 98.9% faster in July 2021 than in July 2019, 141.4% faster when comparing July 2021 to July 2018, and 194.0% faster when comparing July 2021 to June 2017, the month we began tracking speeds on the Speedtest Global Index. Over the last two years there were only two months when the global average for mobile download speed did not show an upward slope: February and March 2020. Speeds began increasing again in April 2020, but did not recover to pre-February levels until May 2020. This coincides with initial lockdowns due to COVID-19 in many countries.

On fixed broadband, mean download speed was 68.2% faster in July 2021 than in July 2019, 131.3% faster in July 2021 than in July 2018, and 196.1% faster in July 2021 than in June 2017. There was a similar dip in download speed over fixed broadband in March of 2020 as we saw on mobile. The speed increased again in April 2020 but did not recover to a pre-March level until April 2020.

Top 10 rankings are somewhat constant over three years, U.S. and Canada slip off in 2021

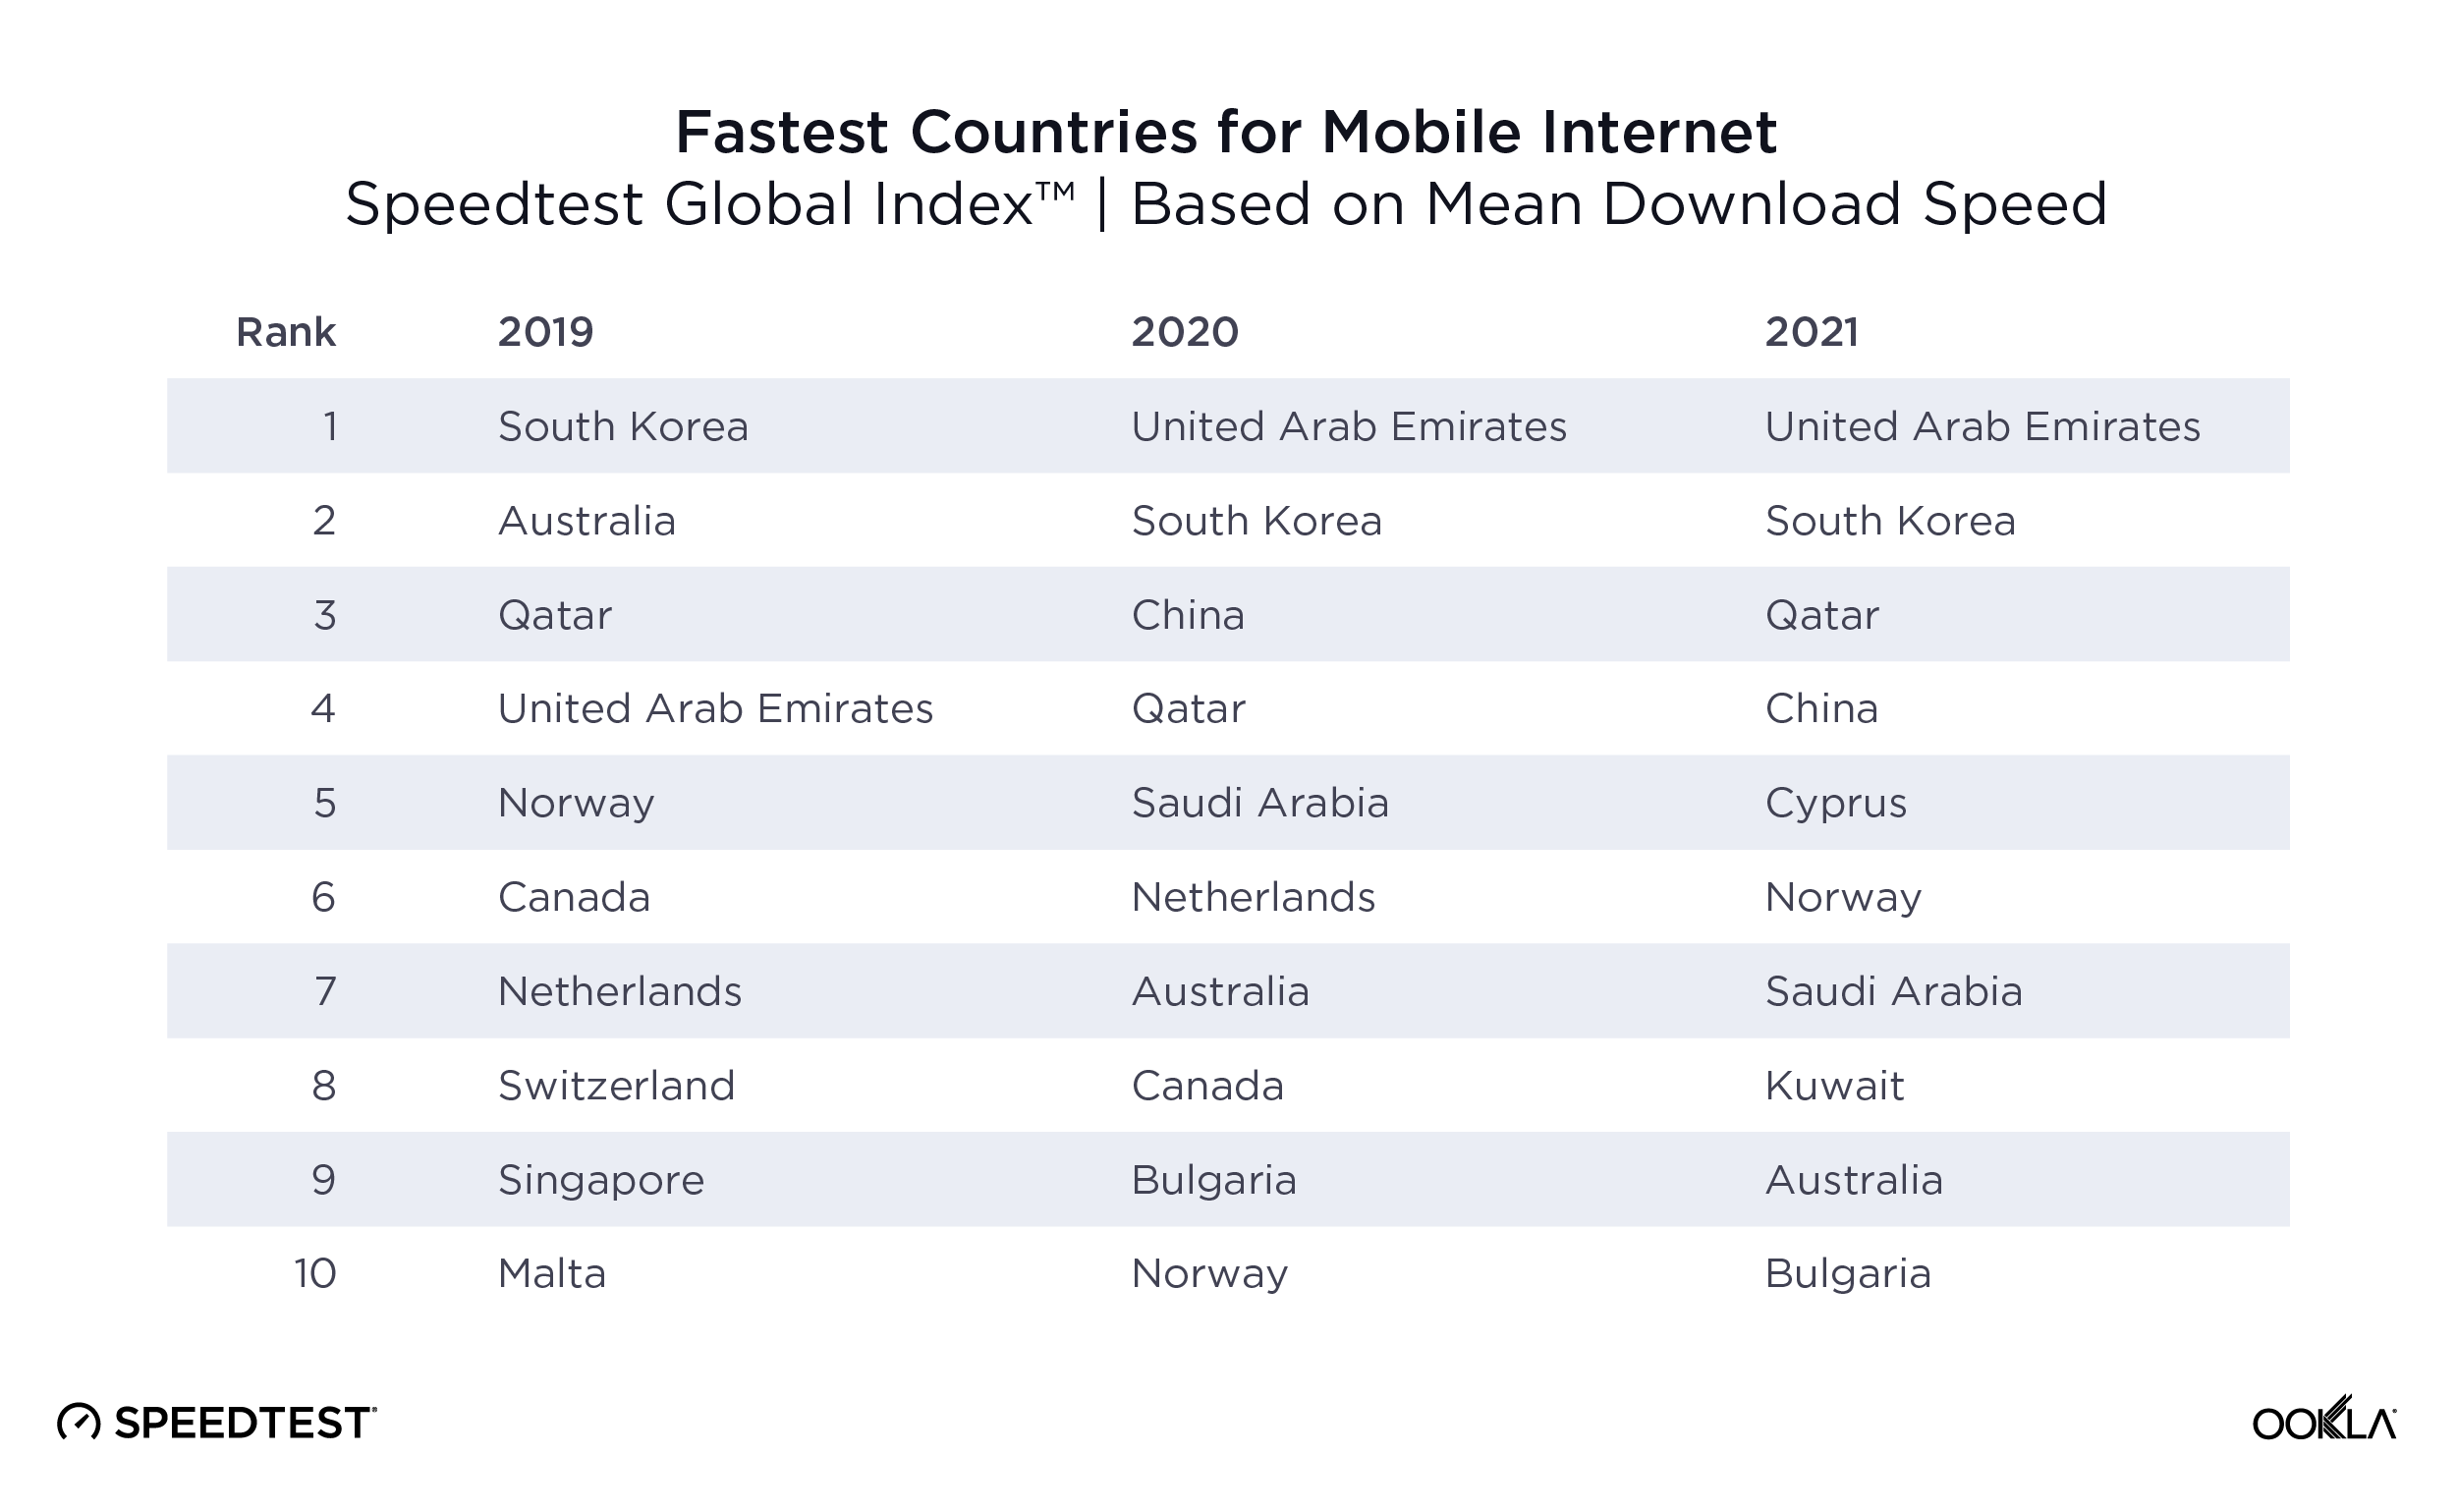
There has been surprising parity of which countries continue to occupy the top 10 spots on the Speedtest Global Index in July of each year. However, the lists for mobile and fixed broadband are radically different, with only one country (South Korea) showing up on both lists in 2021.

ookla_fastest-countries_mobile_0921

The United Arab Emirates and South Korea maintain their first and second place rankings for mobile in both 2020 and 2021 and China and Qatar merely flip-flop for third and fourth place. It’s interesting to see Australia and Canada decline in the rankings although their speeds have increased dramatically during the past three years. 5G is shifting mobile rankings where even countries with 5G (which few countries had in 2019) need a strong 5G focus to maintain their presence at the top of the list lest they be outpaced by other countries with larger investments in 5G.

ookla_fastest-countries_fixed_0921

The fixed broadband rankings are more dynamic than those on mobile. Monaco traveled up and down the top 10 from sixth place in 2019 to 10th in 2020 to first place in 2021. Singapore ranked first or second in all three years and Hong Kong (SAR) was in the top four. Romania was solidly in fifth place while South Korea dropped lower in the ranking every year. Chile and Denmark both debuted in the top 10 in 2021 and the United States dropped off the list.

Most of the top 10 countries perform well for fixed and mobile

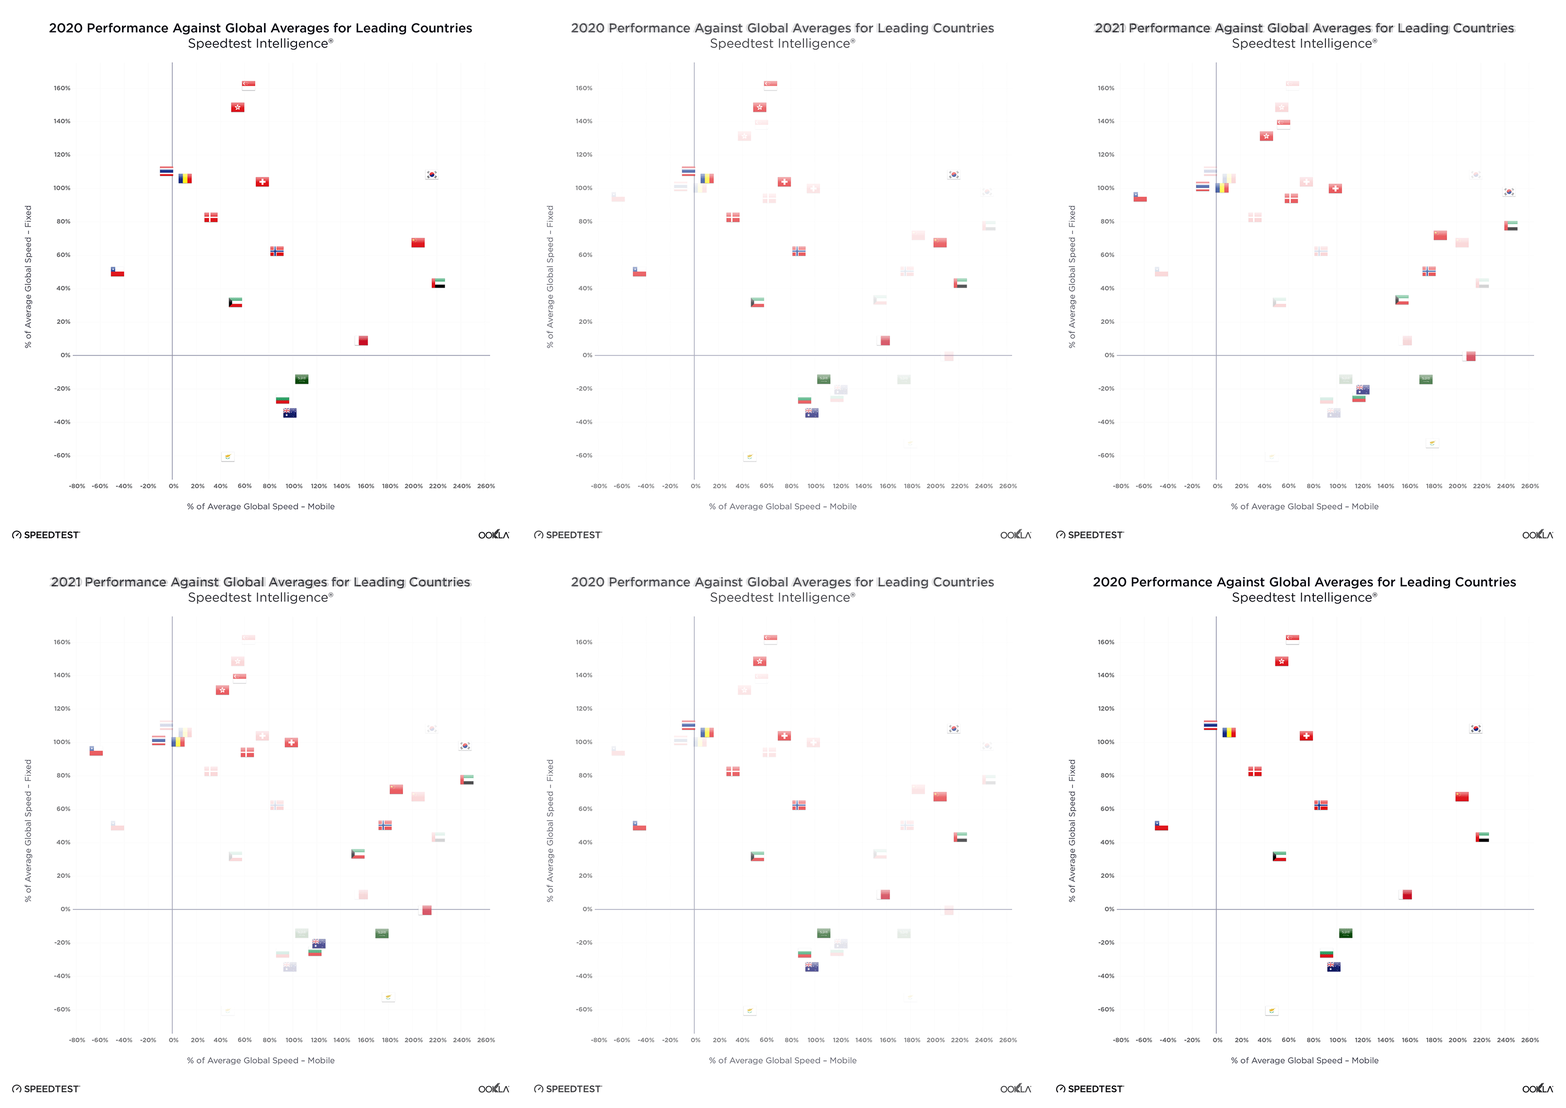
We were curious to see if countries that made the top 10 in July 2021 for either mobile or fixed broadband were also performing well on the other medium, so we plotted the percentage difference from the global average for mobile download speed against download speed on fixed broadband. Note that the global average increased between 2020 and 2021 and that Liechtenstein and Monaco are not included in this comparison as they did not have sufficient samples to be listed on both axes.

2020/2021 chart of leading country performance again global averages

Most countries that made the top 10 in July 2021 for either mobile or fixed broadband were performing well over the global average for both at that point in time. South Korea and the U.A.E. stood out with mean mobile download speeds that were more than 240% faster than the global average and fixed broadband downloads that were more than 70% faster than the global average. China’s mobile download speed was more than 180% faster than the global average and the country was more than 70% faster than the global average for fixed broadband. Switzerland’s mobile and fixed broadband download speeds were close to 100% faster than the global average.

Chile and Thailand are in a quadrant that shows both had faster than average fixed broadband download speeds, but their mobile download speeds were slower than the global average in July 2021. Australia, Bulgaria, Cyprus and Saudi Arabia were in the opposite quadrant with faster than average mobile speeds and below average fixed broadband speeds.

Comparing the chart for July 2021 to that of July 2020, we saw a wide variety of outcomes. Countries with increases compared to the global average on mobile and fixed broadband included Australia, Cyprus, Denmark, Hong Kong, Romania and the U.A.E. Chile and Norway showed dramatic increases compared to the global average on fixed broadband and declines on mobile. Bulgaria, China, Kuwait, Saudi Arabia and Switzerland increased on mobile but showed little change on fixed. South Korea and Qatar increased on mobile compared to the global average and declined on fixed. Singapore and Thailand declined on both mobile and fixed broadband compared to the global average.

We’re interested to see how global speeds and rankings change over time as individual countries and their providers choose to invest in different technologies. Track your country’s performance using monthly updates on the Speedtest Global Index. Check the Ookla 5G Map for up-to-date information on 5G deployments where you live, and if you want more in-depth analyses, subscribe to Ookla Research.

Ookla retains ownership of this article including all of the intellectual property rights, data, content graphs and analysis. This article may not be quoted, reproduced, distributed or published for any commercial purpose without prior consent. Members of the press and others using the findings in this article for non-commercial purposes are welcome to publicly share and link to report information with attribution to Ookla.
| September 4, 2019

In-Depth Analysis of Changes in World Internet Performance Using the Speedtest Global Index

A lot has changed in the two years since 2017 when we first began ranking mobile and fixed broadband speeds of countries around the world with the Speedtest Global IndexTM. 5G is being deployed around the world and fiber continues to make gigabit speeds a reality in more and more countries. We’ve been tracking it all and are here to report on how much speeds have increased, which countries are leading internet performance and which are falling behind, and what trends we see across continents.

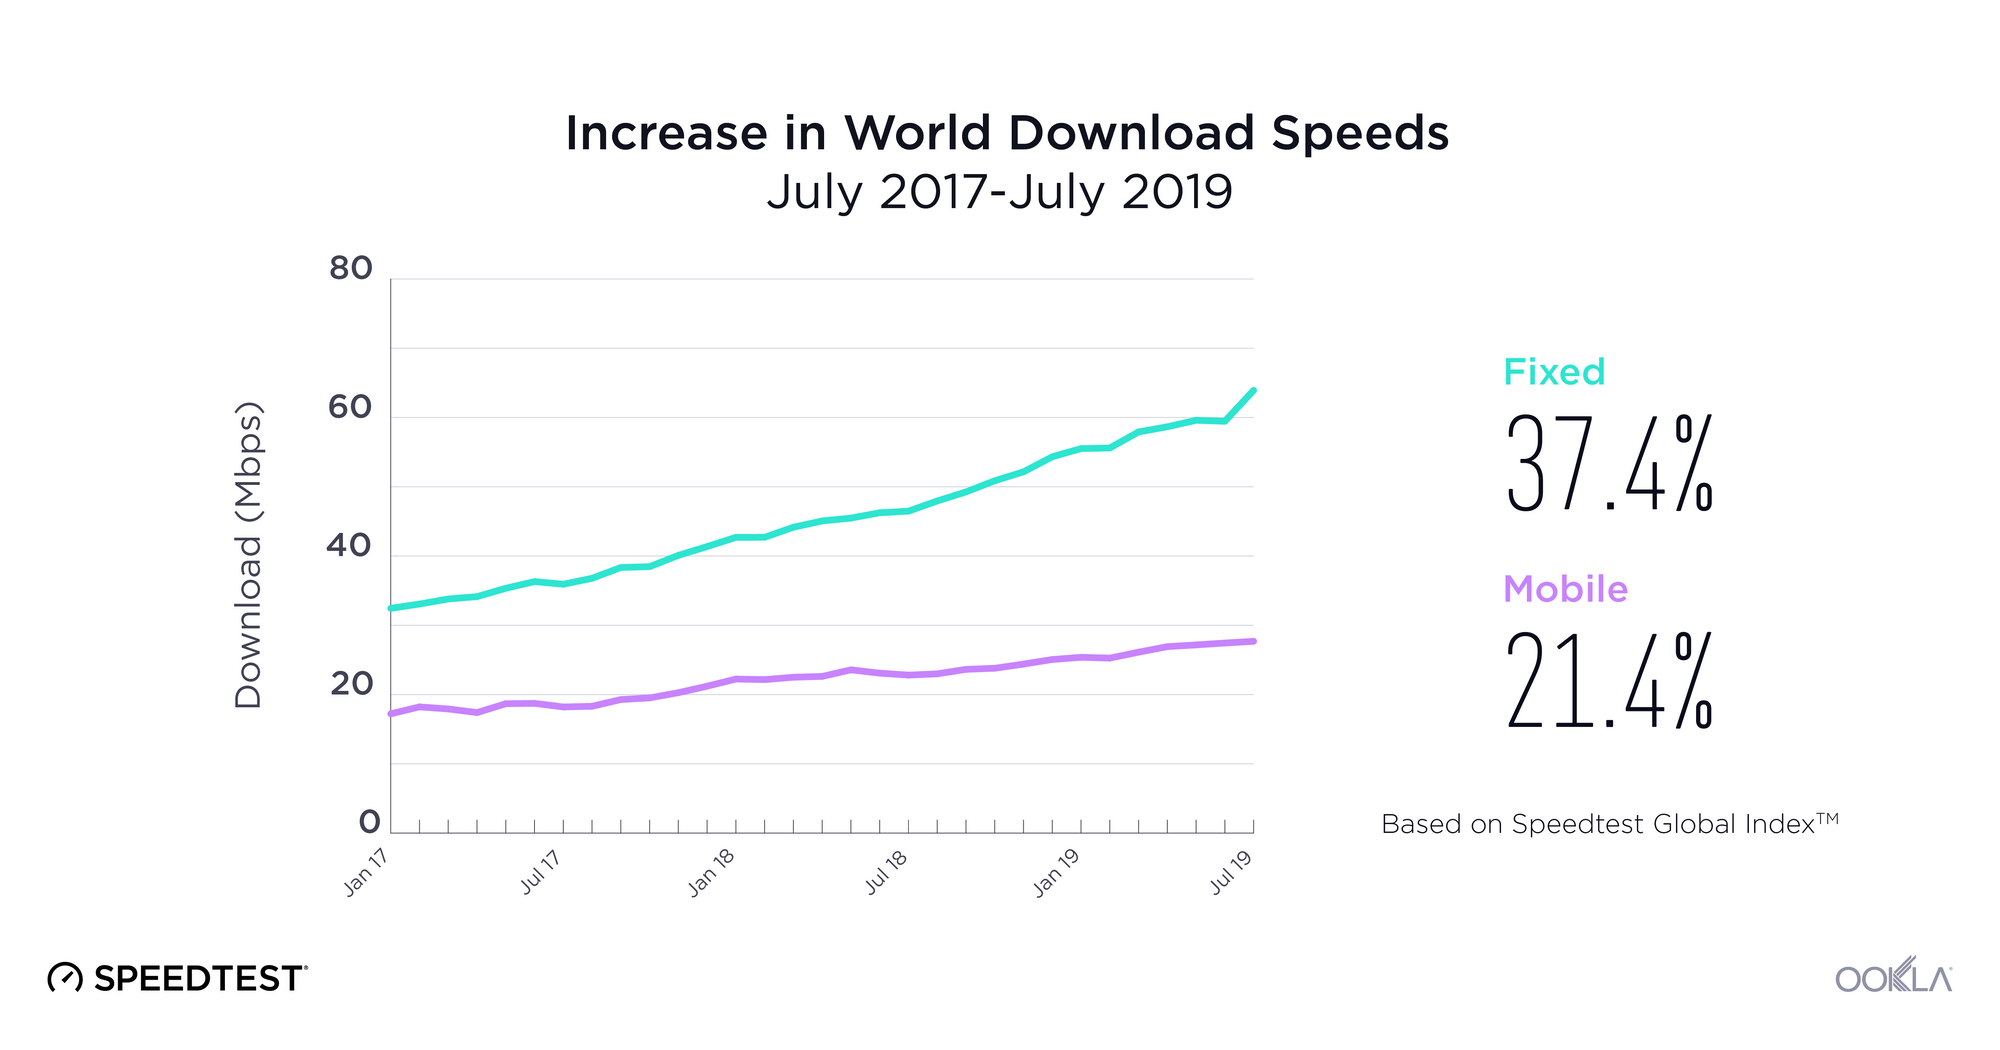
World mobile speed increased 21.4% with fixed broadband up 37.4%

World-Download-Speeds-2019-OG2

Looking just at the last year, the world’s mean download speed over mobile increased 21.4% from 22.81 Mbps in July 2018 to 27.69 Mbps in July 2019. Mean upload speed over mobile increased 18.1% from 9.13 Mbps to 10.78 Mbps. The world average for download speed over fixed broadband increased 37.4% from 46.48 Mbps in July 2018 to 63.85 Mbps in July 2019. Mean upload speed over fixed broadband increased 48.9% from 22.52 Mbps to 33.53 Mbps.

Shake-ups in the country rankings for internet performance

Fastest-Countries-Mobile-2018-2019

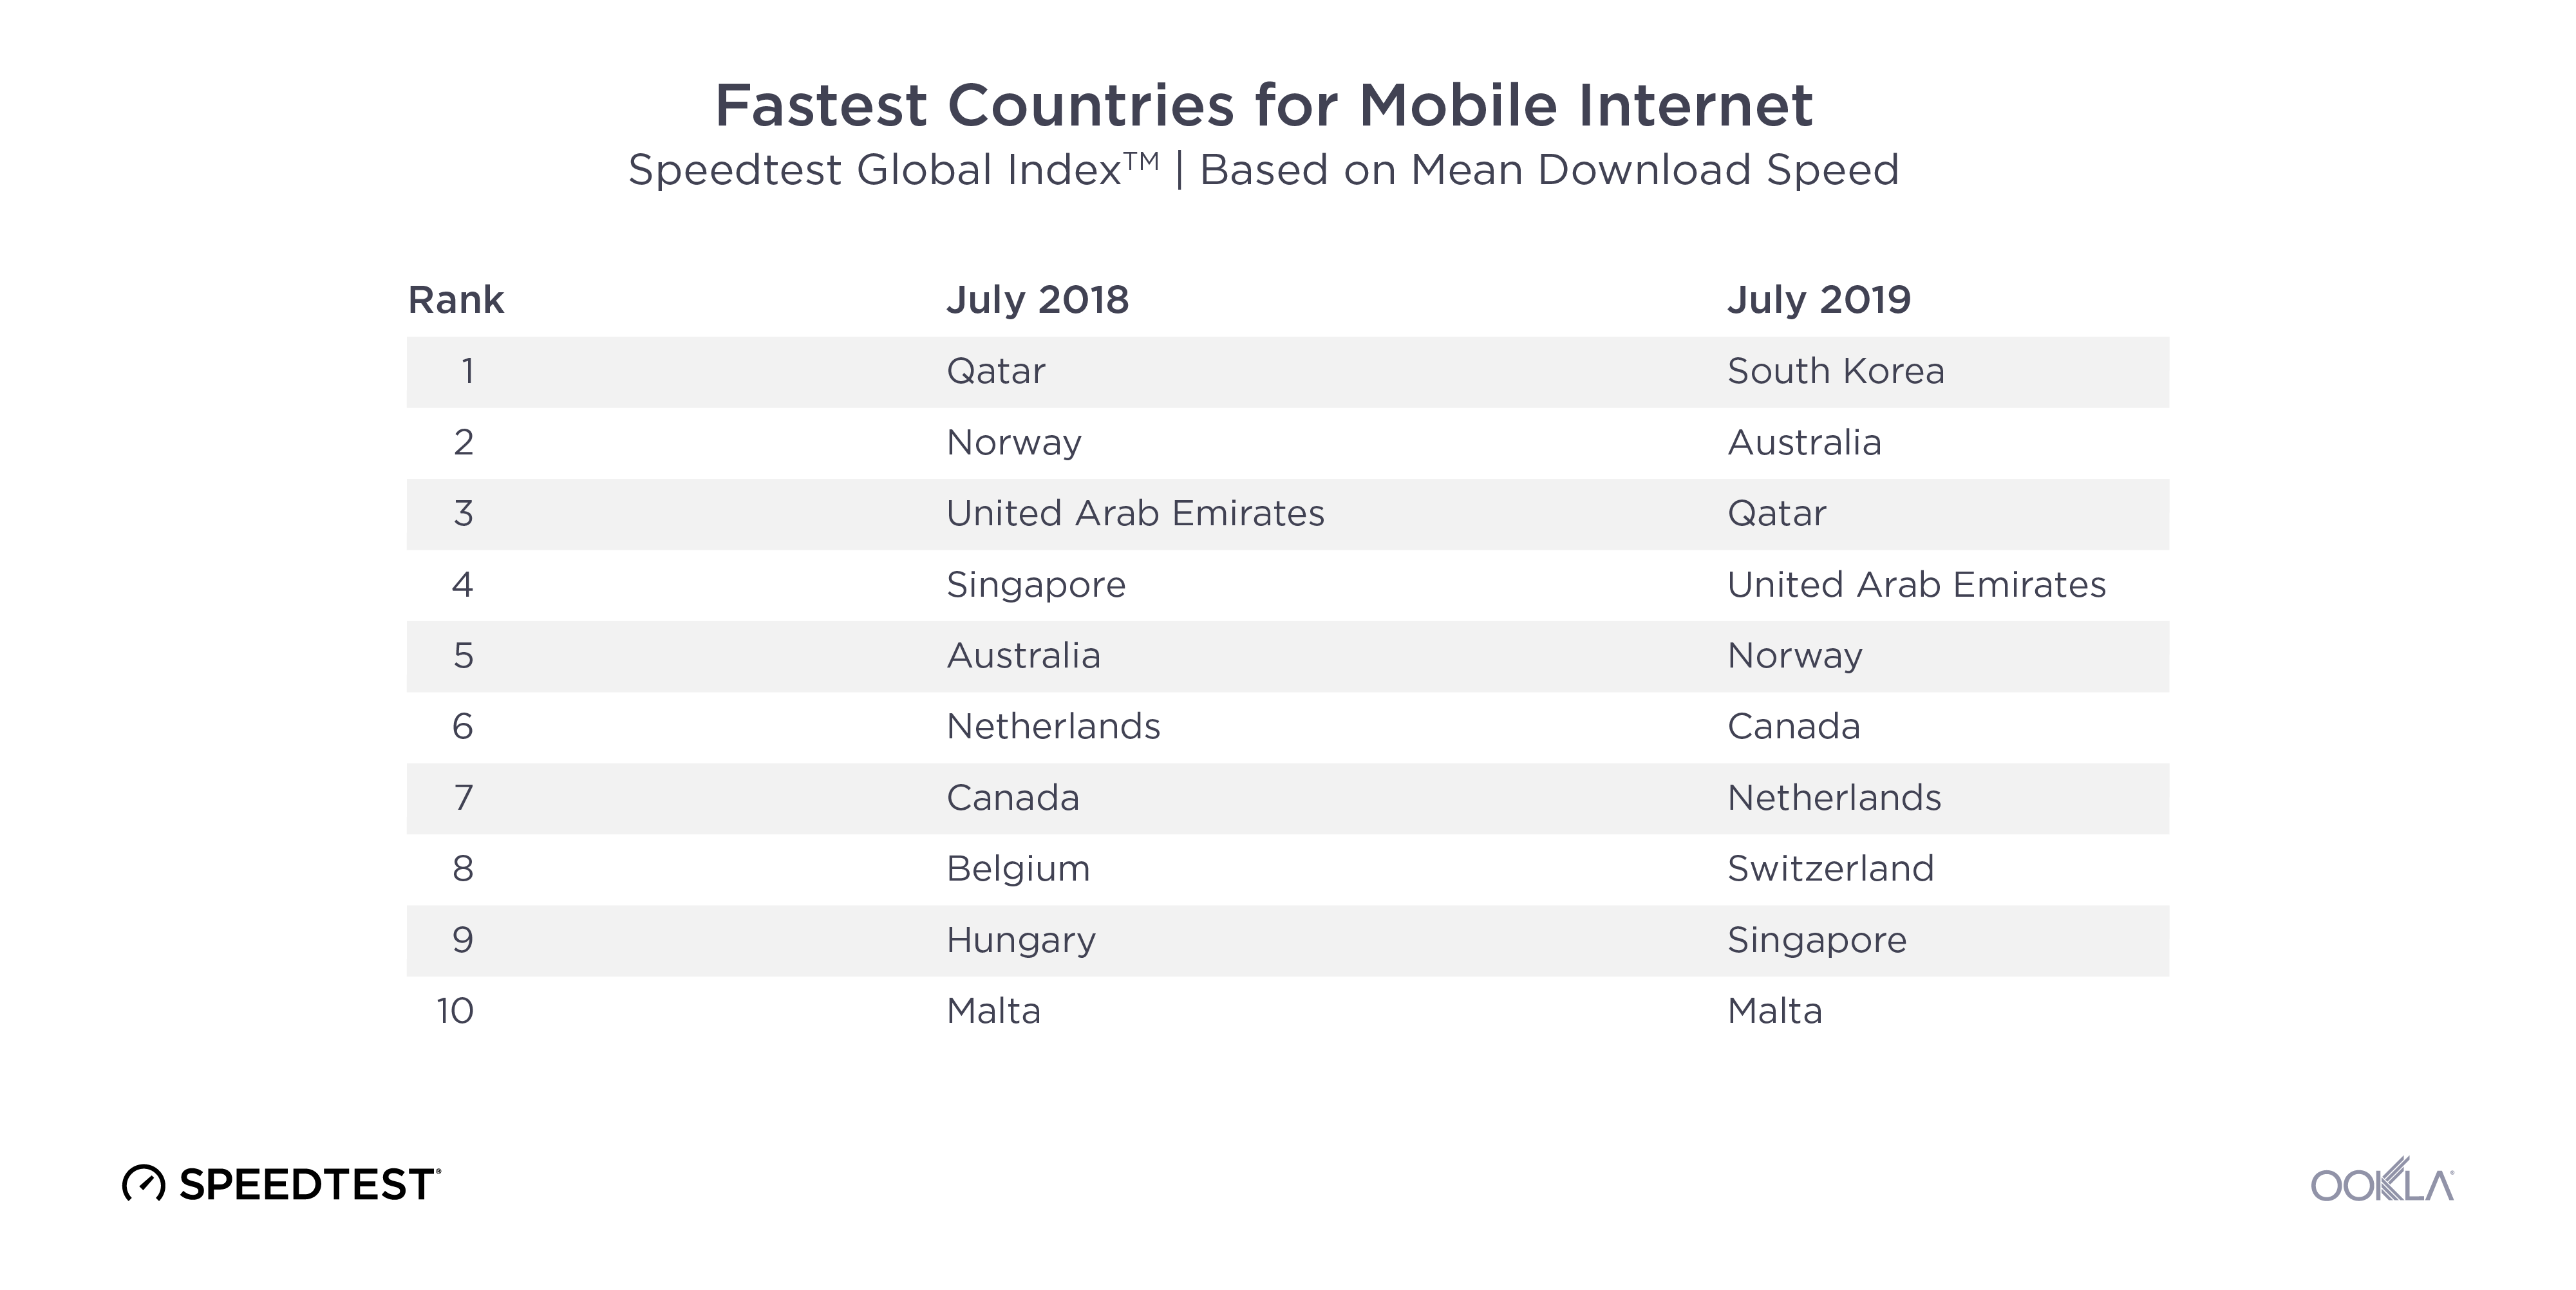
Mobile speeds in the fastest countries have skyrocketed in the past year which has dramatically shifted the rankings. South Korea, which was not even in the top ten a year ago, saw a 165.9% increase in mean download speed over mobile during the past 12 months, in large part due to 5G. Switzerland’s mean download speed increased 23.5%. Canada’s was up 22.2%, Australia 21.2%, the Netherlands 17.3%, UAE 11.1%, Malta 10.3% and Norway 5.8%. Qatar remained in the top ten, although the country’s mean download speed over mobile actually dropped 1.4% from July 2018 to July 2019.

Individual mobile operators can make a huge difference in a country’s speeds. In 2017 we were excited to see Telenor uncap their mobile speeds, which drove Norway to the top of the Speedtest Global Index. A big part of South Korea’s mobile success in the past year is the way KT, LG U+ and SK Telecom banded together to release 5G at the same time. Switzerland has also benefited from 5G and Sunrise leads the country with 262 5G deployments across the country while Swisscomm has 52.

Fastest-Countries-Fixed-2018-2019

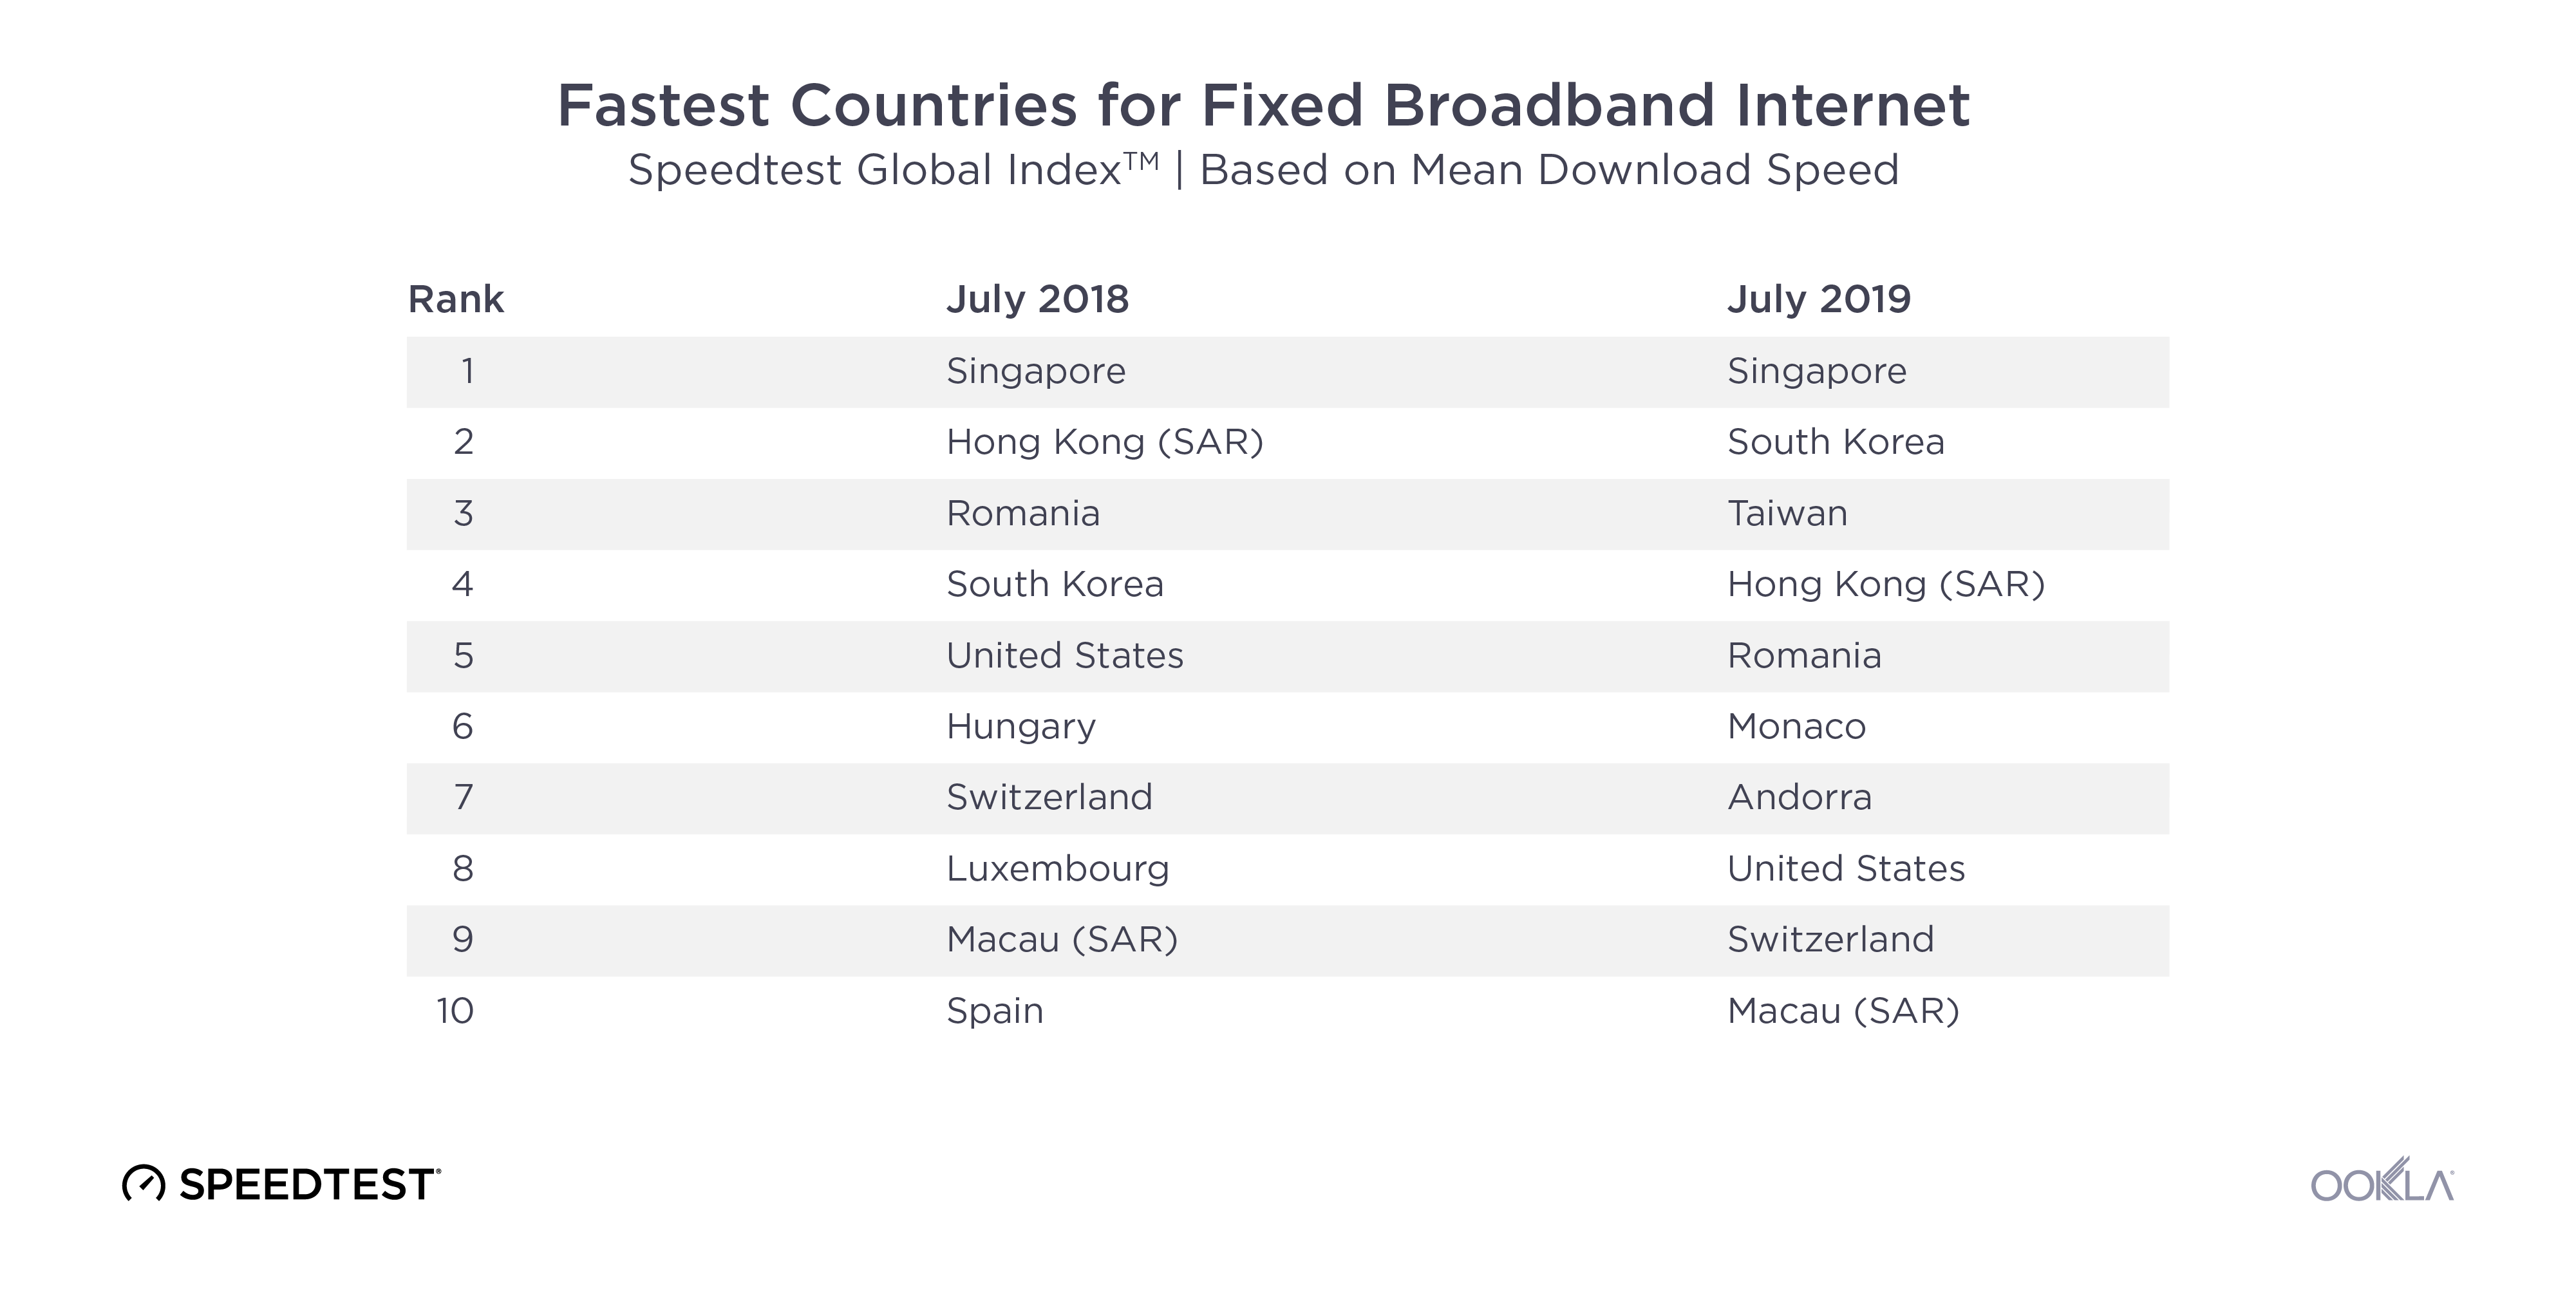
Fixed broadband rankings on the Speedtest Global Index have not changed as dramatically during the past 12 months as those on mobile. Singapore remains the fastest country with an increase in mean download speed over fixed broadband of 5.6%. Taiwan had the largest jump in speeds among the top 10 with a 166.5% improvement in fixed download speed between July 2018 and July 2019. Mean download speed over fixed broadband increased 52.4% in South Korea, 26.4% in Macau, 21.7% in Romania, 21.0% in Switzerland, 19.3% in the United States and 3.5% in Hong Kong.

Monaco and Andorra did not have enough tests to qualify for the Speedtest Global Index one year ago, but massive fixed broadband improvements in both countries inspired us to lower our test count threshold for inclusion and also share these smaller countries’ success stories.

Technologies paving the way: 5G and gigabit

The presence of 5G is not enough to change a market

As discussed above, 5G has the potential to rocket a country to the top of the mobile rankings on the Speedtest Global Index. In practice, we’ve seen 5G speeds that were over 1000% faster than those on LTE.

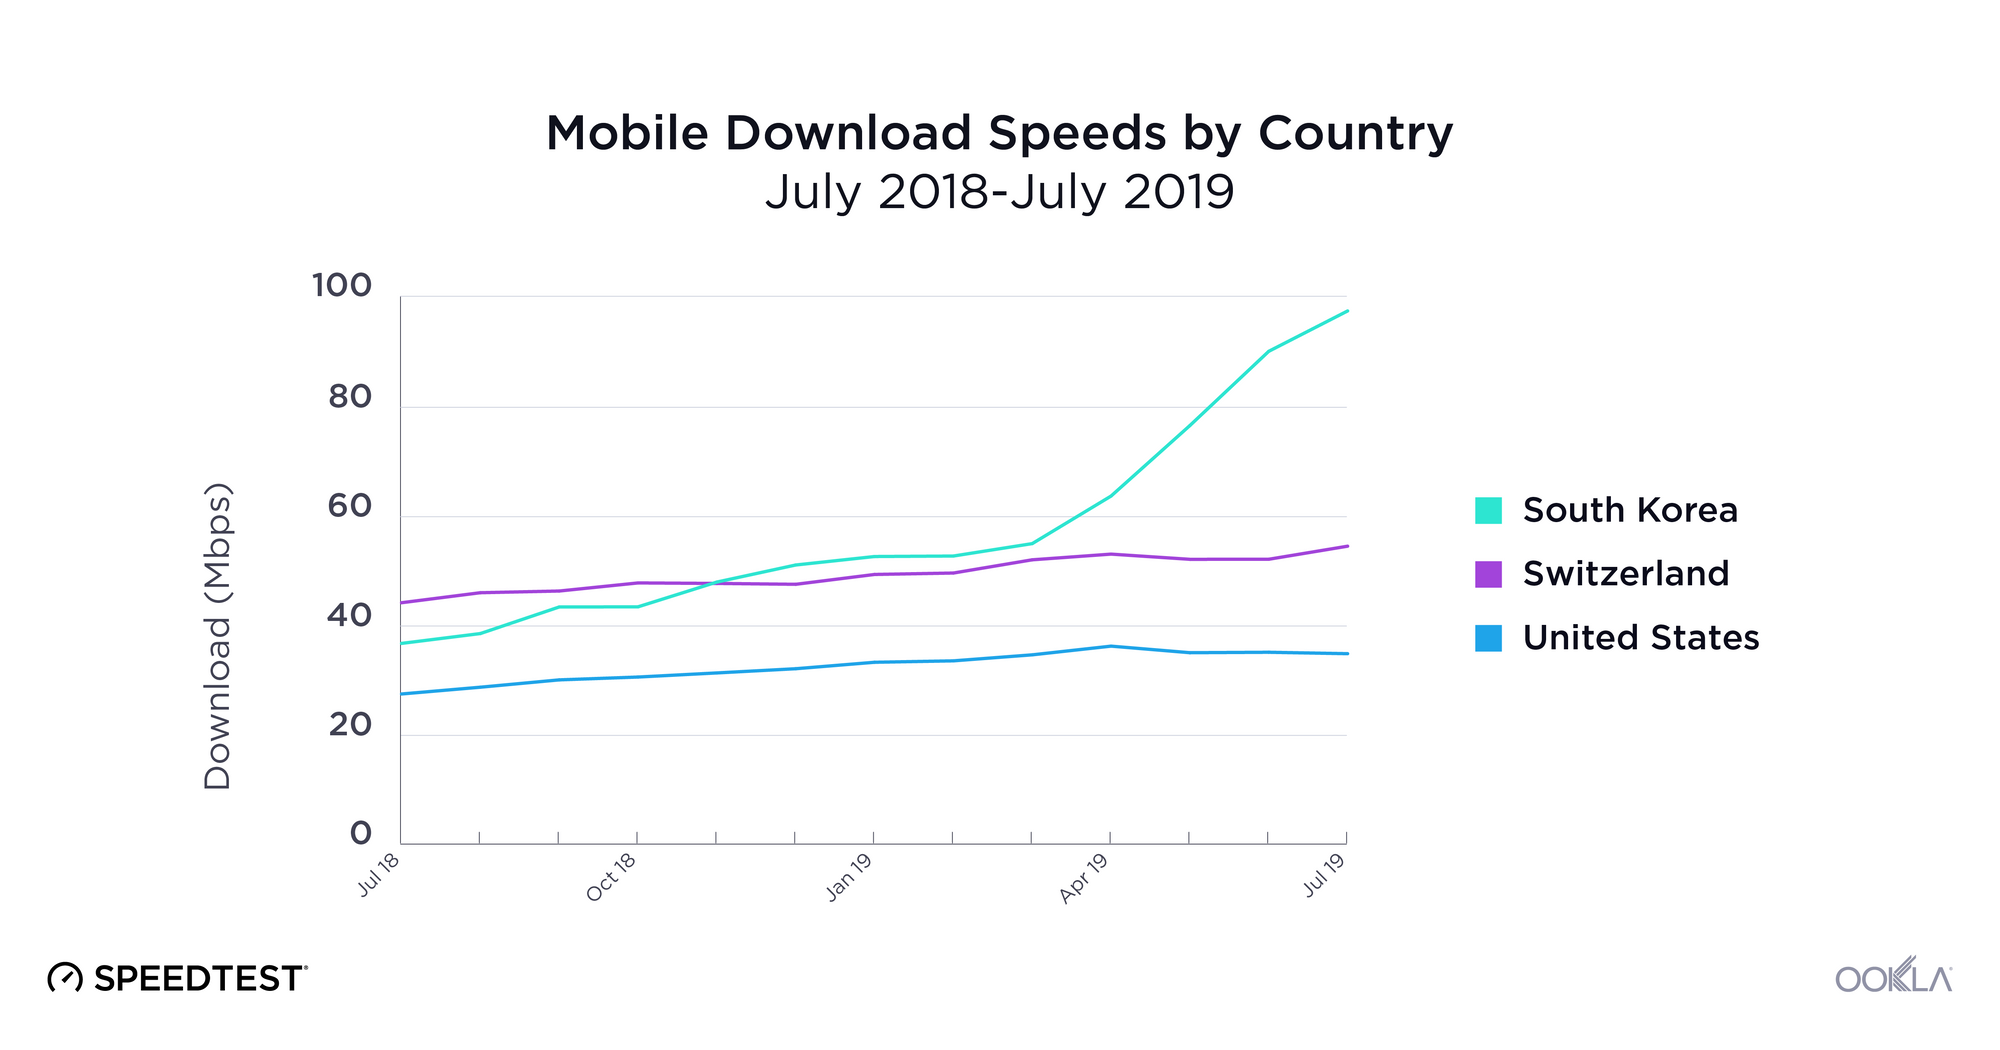
Mobile-Download-Speeds-by-Country

In reality, though, unless 5G is commercially available widely across a country and from all mobile operators (as was the case in South Korea), the change in speeds at the country level is not that significant. Though commercial 5G was launched widely across Switzerland by Sunrise and Swisscom in April 2019, the country’s mean download speed only increased 2.8% in the three months since. The average mobile download speed in the U.S. has actually declined slightly since 5G was initially deployed. This is because 5G is still only available in a very limited number of markets to consumers with 5G-capable devices.

Visit the Ookla 5G Map for the latest on 5G deployments across the globe.

Gigabit is a game-changer, if you can get it

Unlike 5G, fiber connections have been rolling out since 2007, opening up the possibility of gigabit-speed fixed broadband. That said, it’s costly and time-intensive to lay miles and miles of fiber so progress has varied widely across the globe.

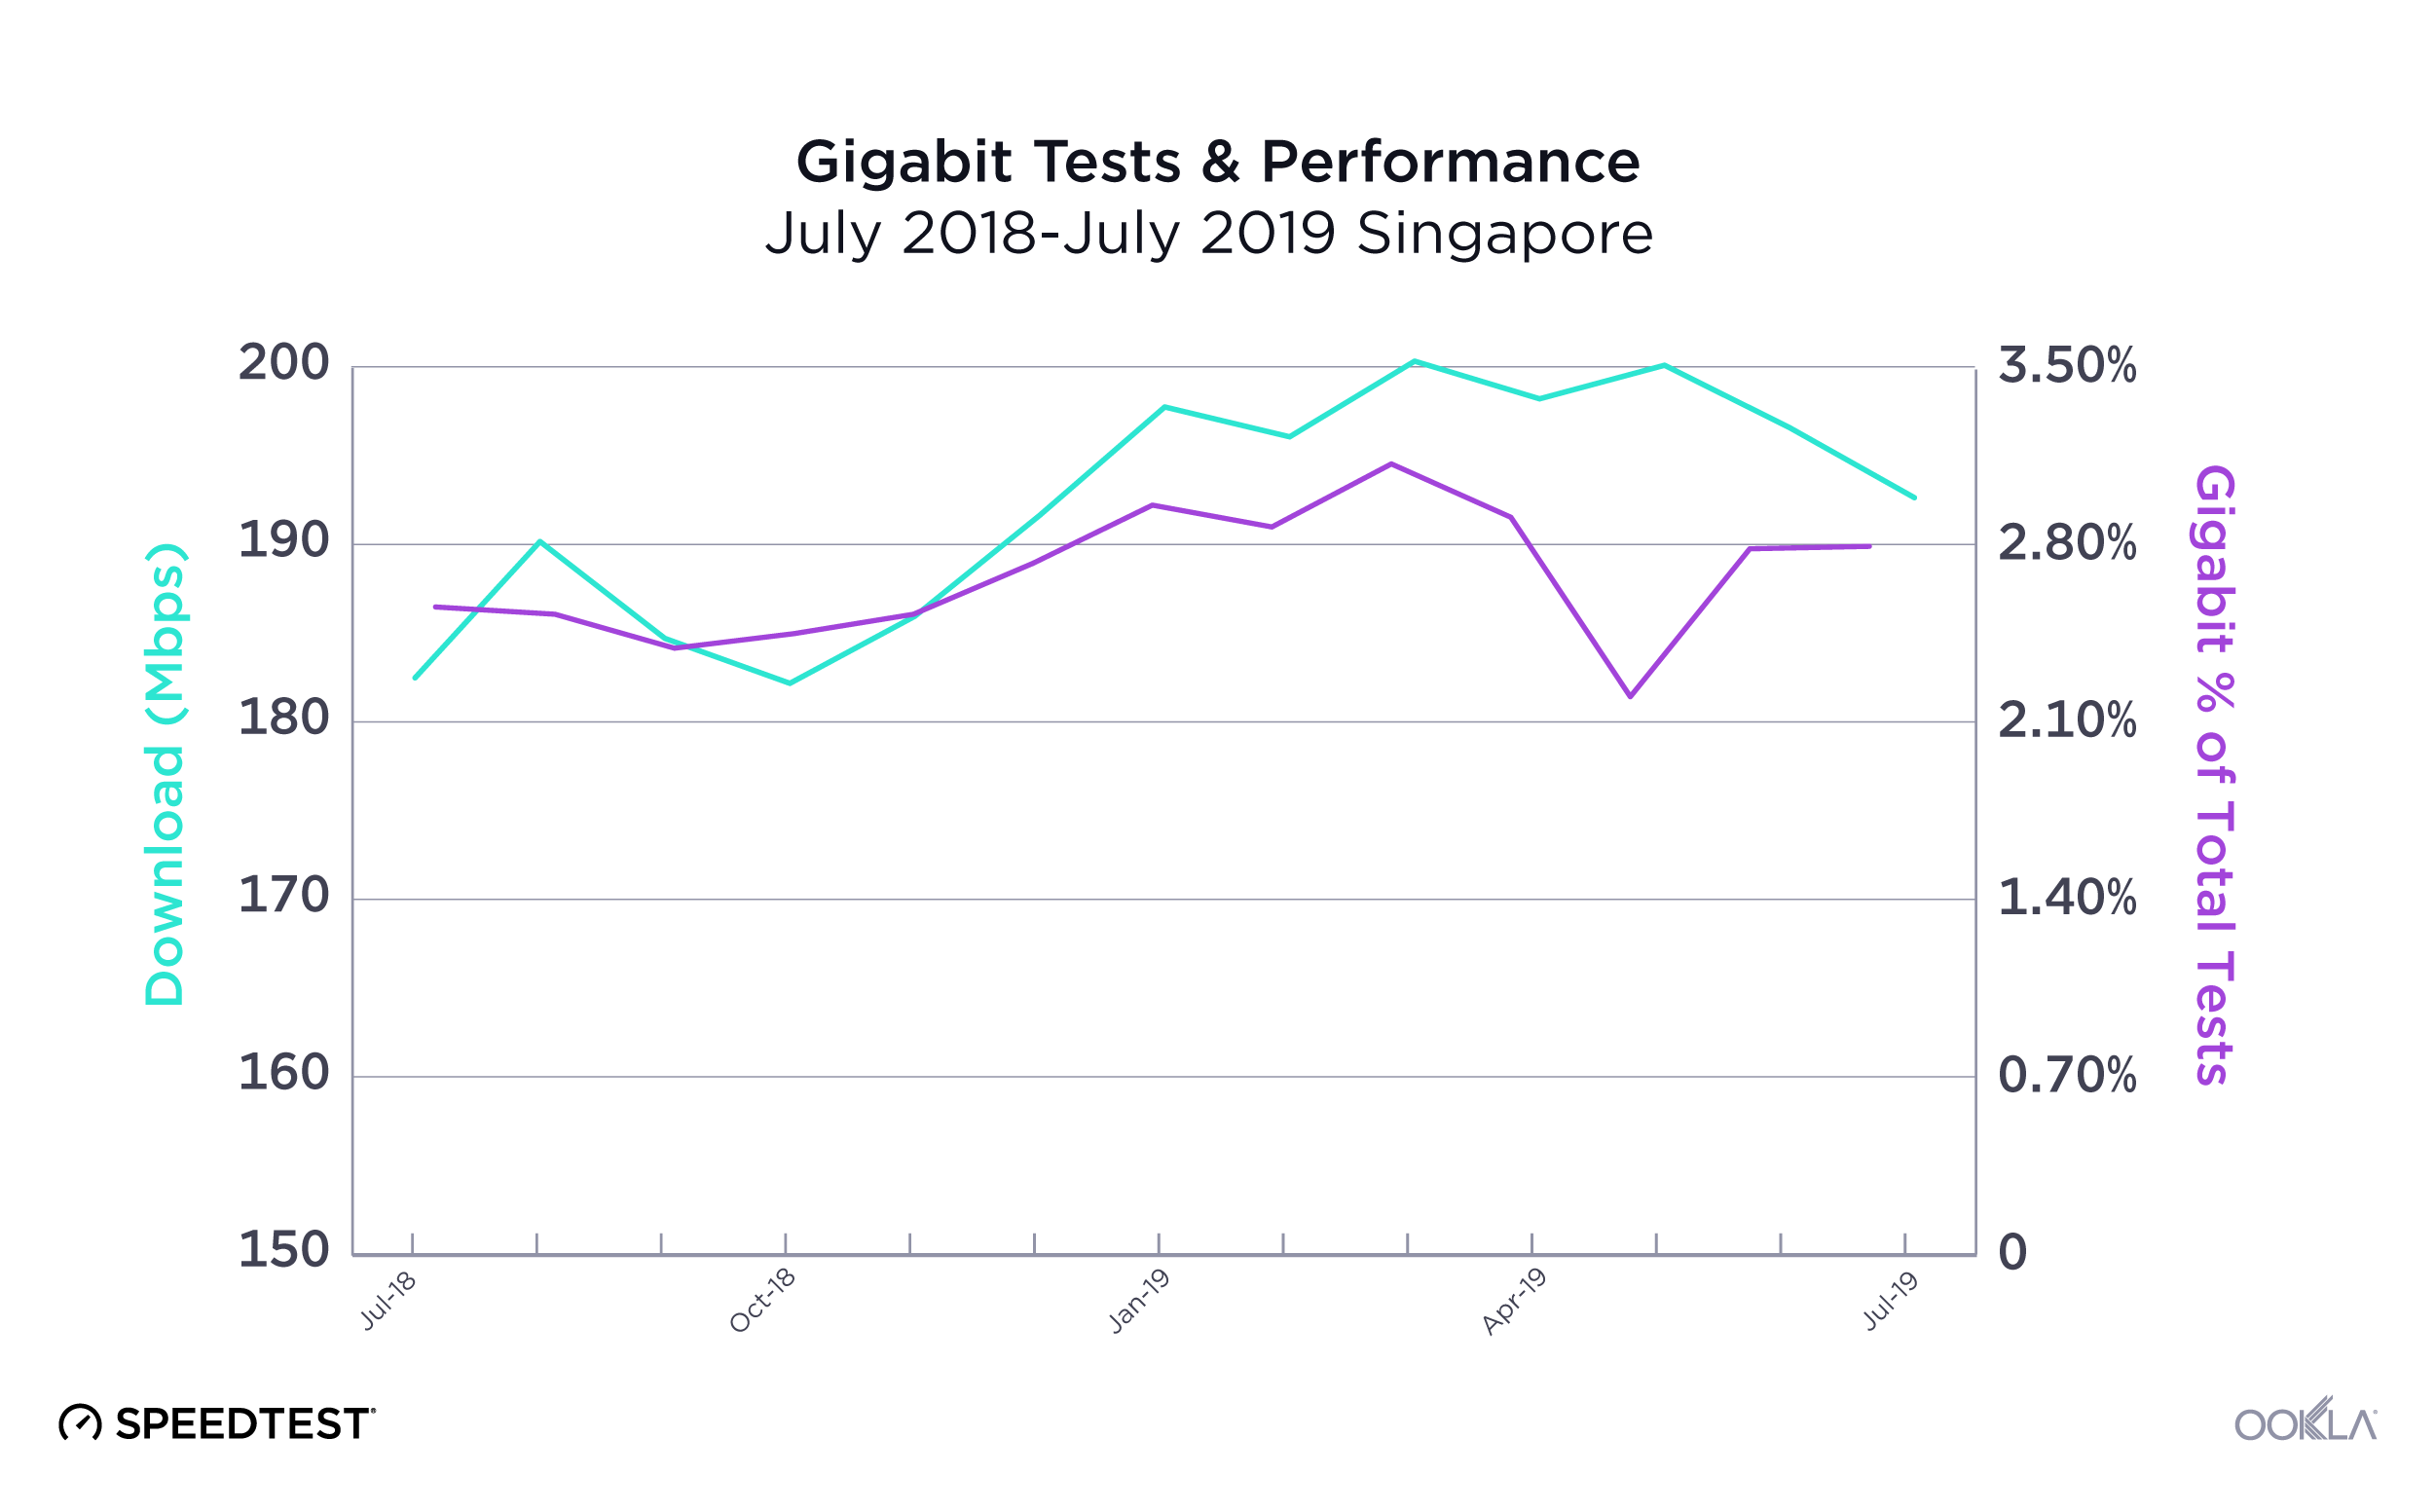
Gigabit-Test---Performance_Singapore-1

Geographically small countries like Singapore have the advantage when it comes to fiber, because It’s easier and cheaper to lay fiber optic cable across the country’s small footprint. Singaporean internet service providers (ISPs) have used this advantage to go beyond mere gigabit and offer connections as fast as 10 Gbps. This is reflected both in Singapore’s dominance of the fixed rankings on the Speedtest Global Index and in the fact that 2.87% of their total Speedtest results over fixed broadband are gigabit-speed (800 Mbps or higher).

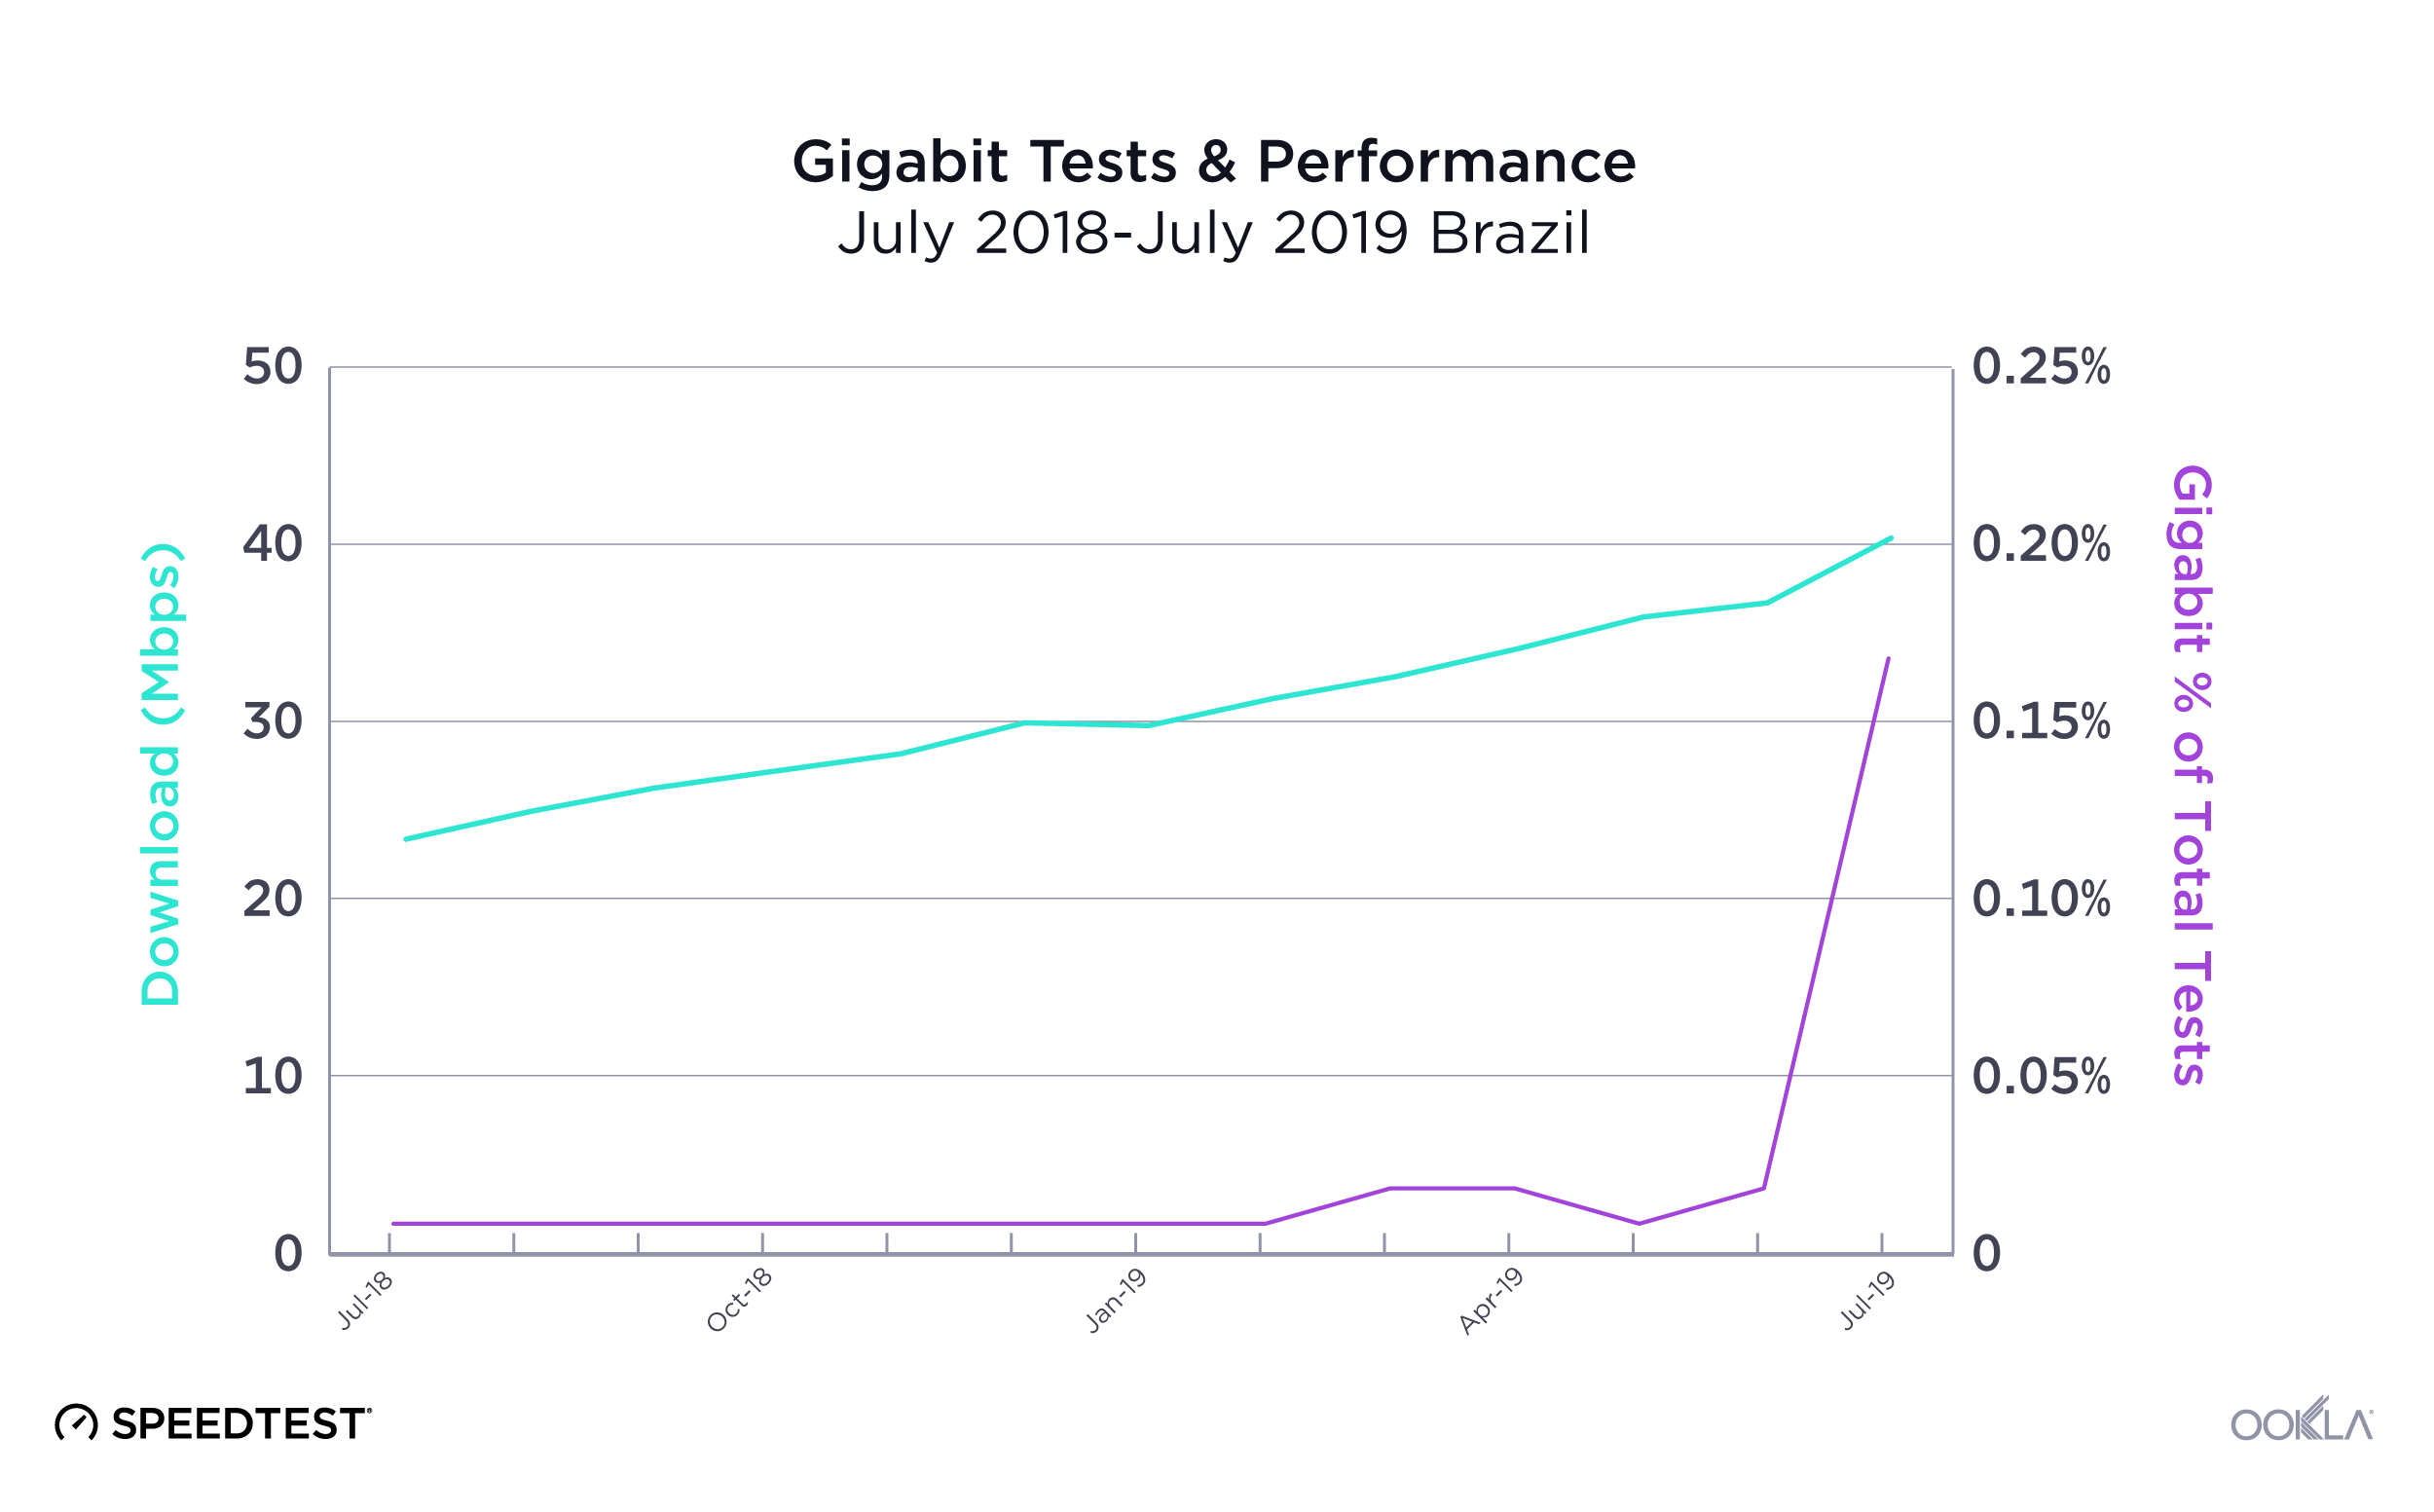
Gigabit-Test---Performance_Brazil-1

Brazil offers a good contrast for how difficult it can be for gigabit to reach the masses. While the first Brazilian ISP to offer fiber-to-the-premises (FTTP) initially did so in 2007, easy access to gigabit speeds was slow to follow. However, that may be starting to change. Between June and July 2019 we saw a large uptick in gigabit-speed results in Brazil, where the proportion of gigabit speed tests increased from 0.02% of total fixed broadband tests to 0.17%. This corresponded with a large increase in mean download speed at the country level.

Comparing world mobile and fixed broadband at a glance

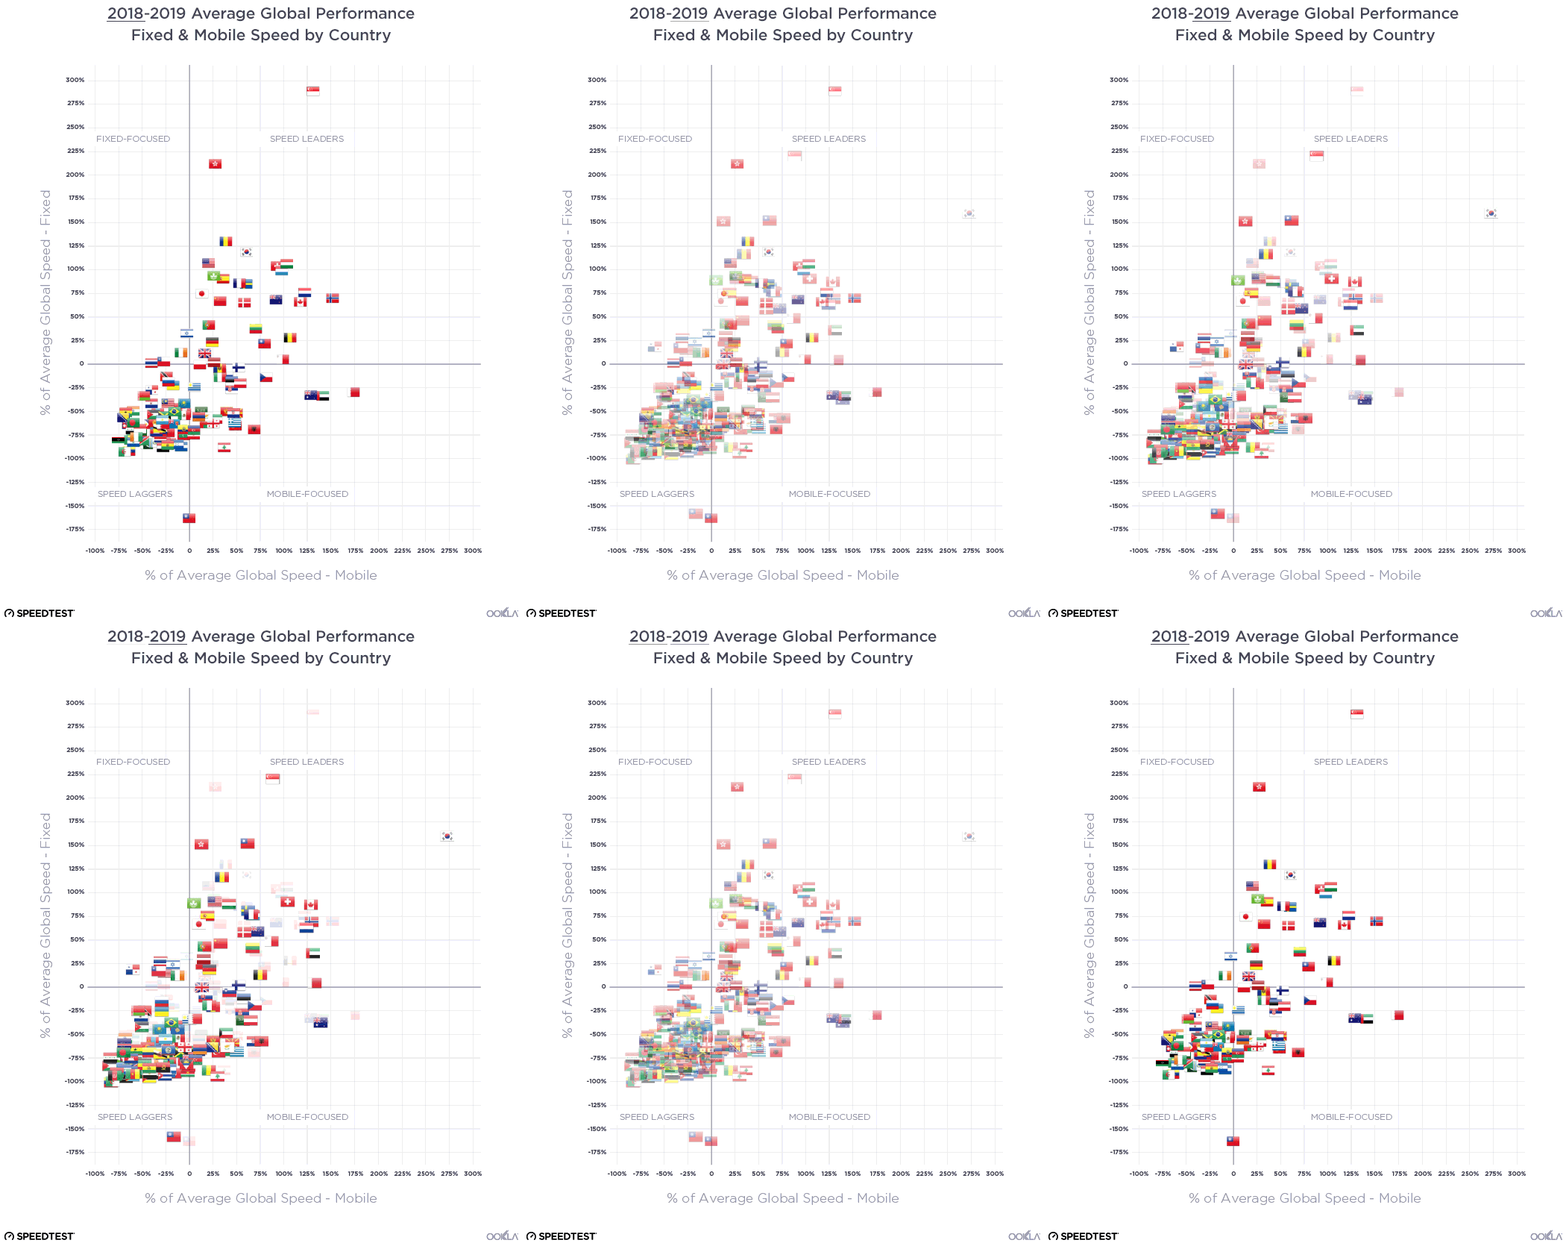
We were curious to see just how different internet performance experiences were around the world, so we plotted average mobile download speed against average download speed on fixed broadband. All of the graphs below use a percentage difference from the global average, a number that changed between 2018 and 2019.

fade-Performance-vs-Global---Quadrant-All

Speed Leaders

There was not much change in the list of countries that showed above-average download speeds on both mobile and fixed broadband between July 2018 and July 2019, the “Speed Leaders.” What did change was that fixed broadband speeds increased significantly enough among the group to bring the whole pack closer to Singapore and Hong Kong. On the mobile axis, South Korea’s major increase in download speed made that country more of an outlier, pushing the boundaries of what great performance can look like.

Fixed-Focused countries

Between July 2018 and July 2019 we saw the number of countries considered to be “Fixed-Focused” (having faster download speeds over fixed broadband than the world average while their average mobile download speeds were slower than average) increase. Ireland was the only country that solidly fit this category in 2018. Thailand and Chile started near the midline for fixed speeds and below-average for mobile speeds in 2018. 2019 found both countries squarely in the Fixed-Focused category. Israel also edged into this category as their mobile download speed fell between July 2018 and 2019.

Mobile-Focused countries

The “Mobile-Focused” category saw the most movement between July 2018 and July 2019 as some countries (the UAE and Qatar) increased their fixed speeds sufficiently to join the Speed Leaders. Meanwhile, Bosnia and Herzegovina’s mobile download speed increased year-over-year to move them into the Mobile-Focused quadrant. Georgia’s mobile download speed decreased enough to move them from Mobile-Focused to Speed Laggers.

It will be interesting to see how many of these Mobile-Focused countries double down on their mobile investments and explore 5G alternatives to fixed broadband.

Speed Laggers

No country wants to be in the position of having slower than average mobile and fixed broadband speeds. We saw 57 countries in this “Speed Laggers” quadrant in July 2018 and 78 in July 2019. This increase is mostly due to our expansion of the number of countries we consider for the Speedtest Global Index based on test count. There were enough countries in this category that we’ve considered them separately by continent below.

Regional views of mobile and fixed broadband performance

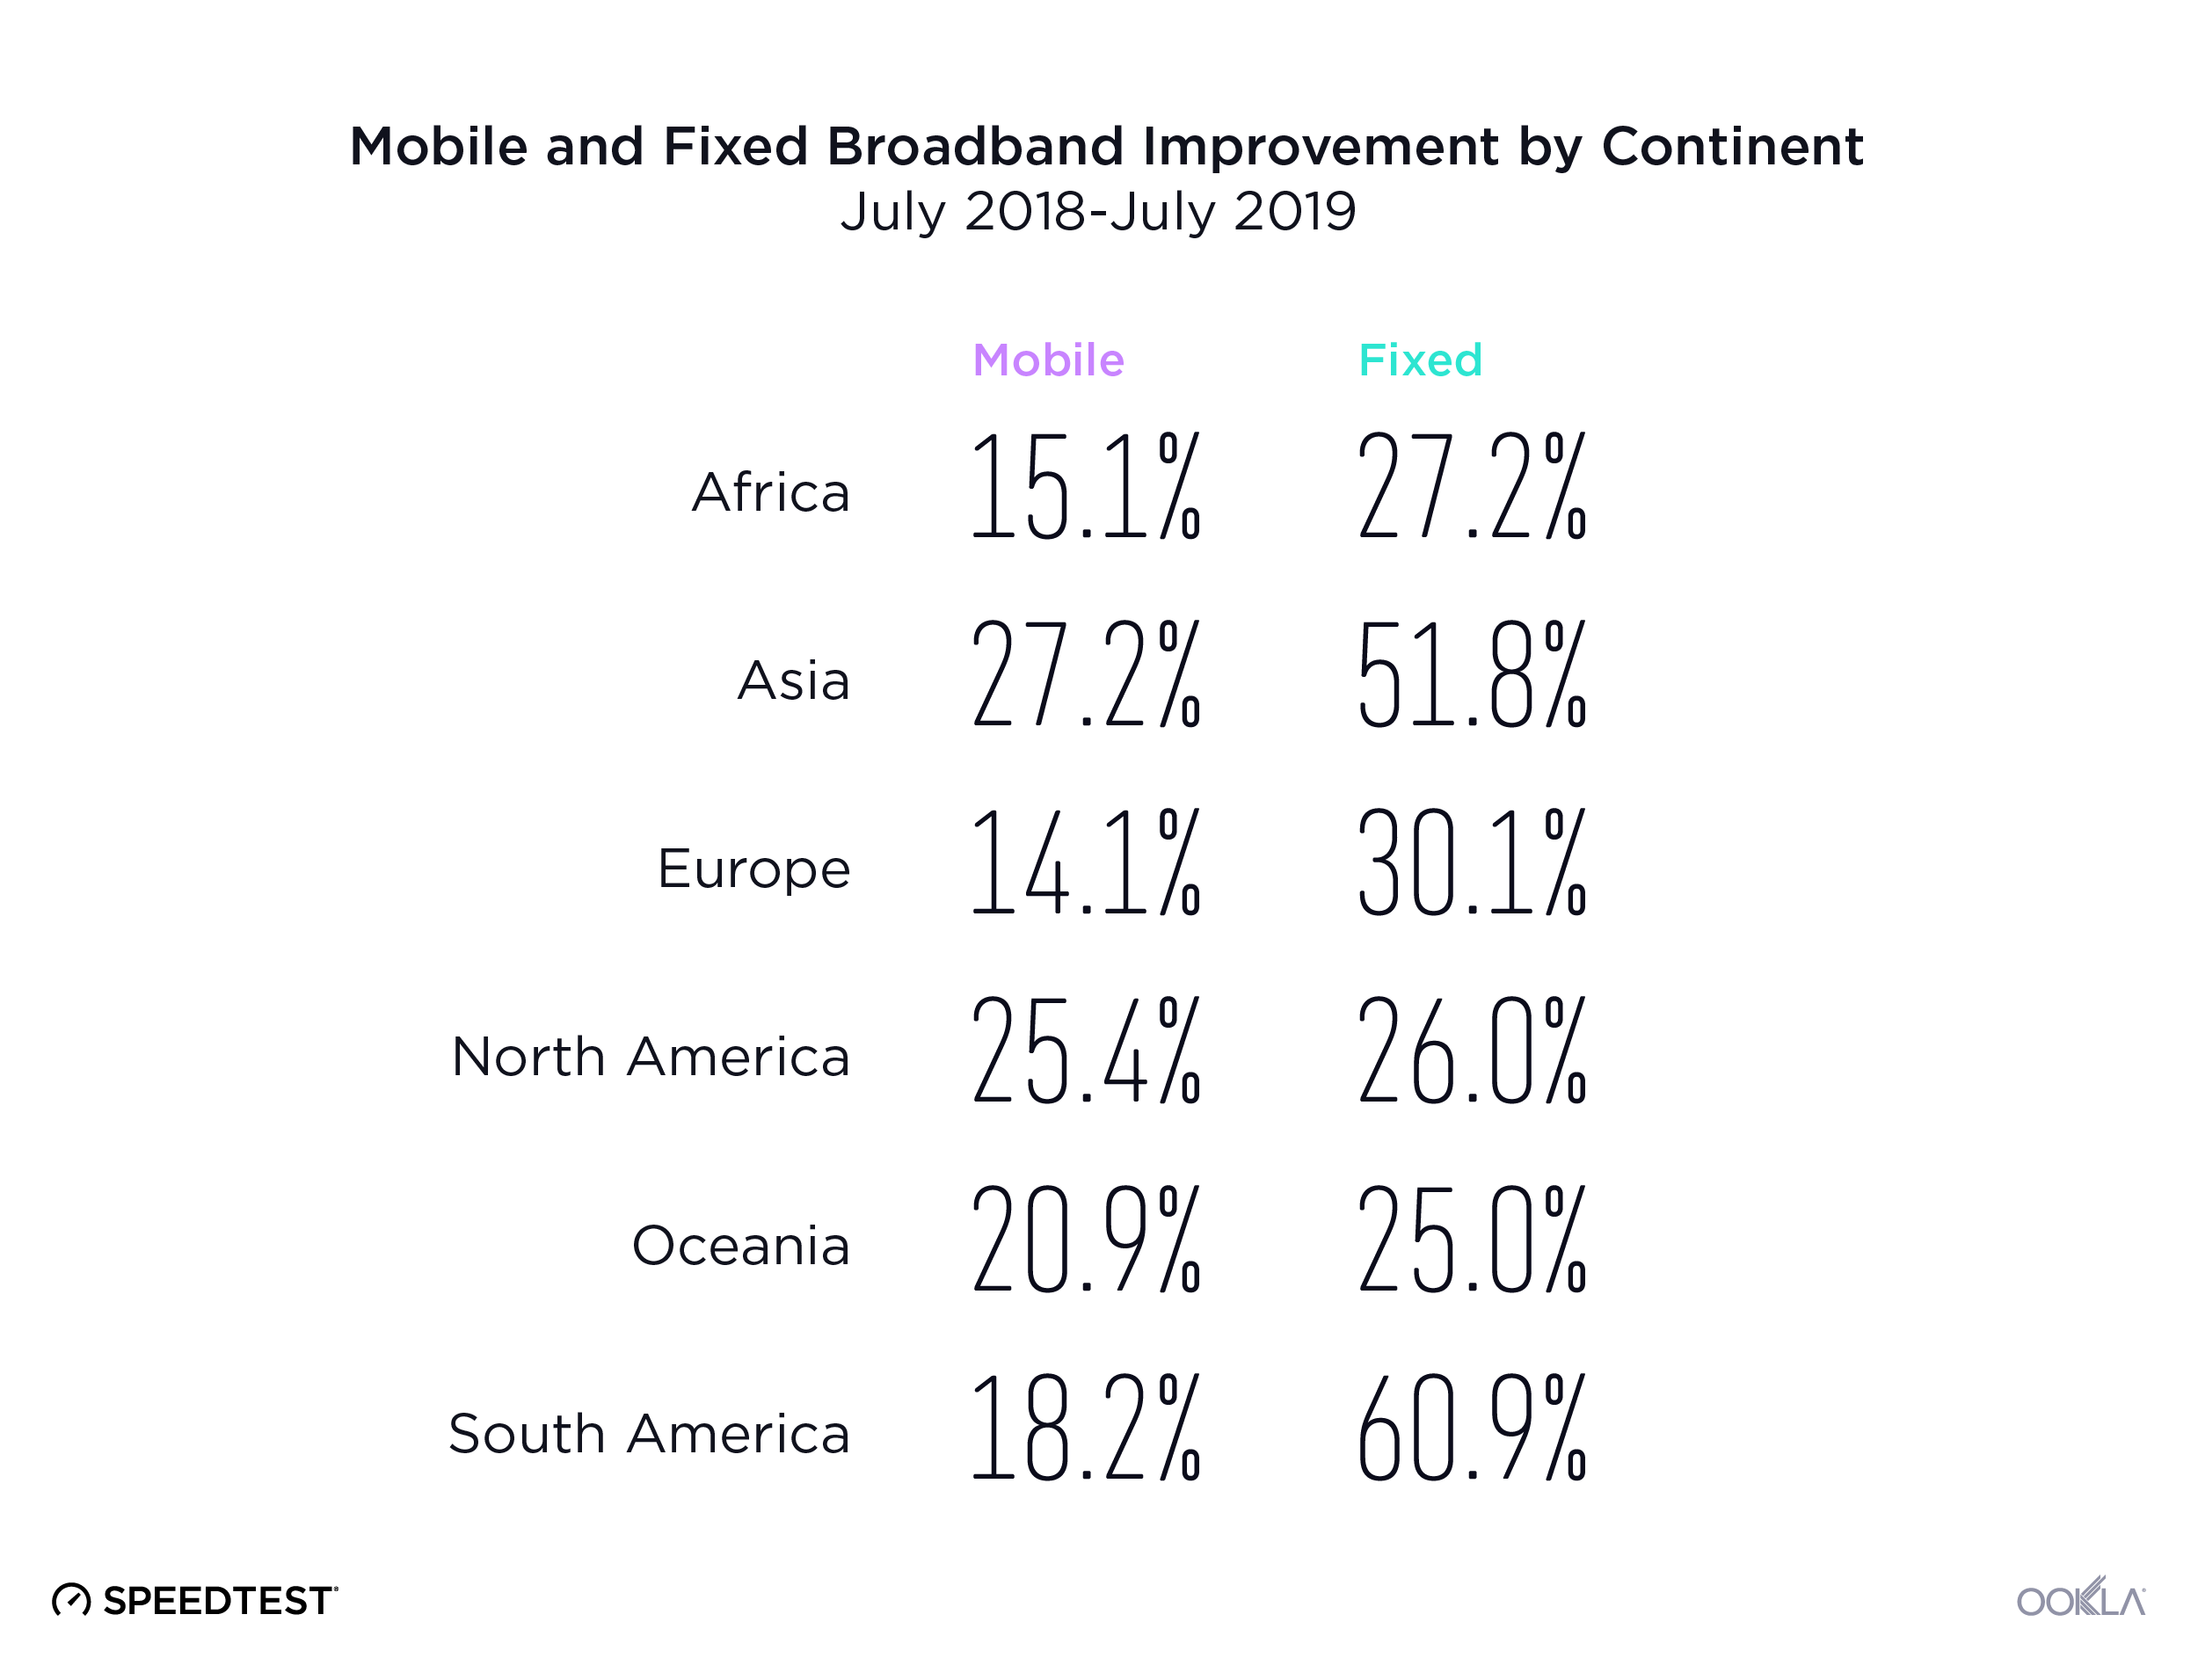
Mobile-and-Fixed-Broadband-Improvement-by-Continent-02

We aggregated Speedtest results by continent to analyze mobile and fixed broadband performance by continent.

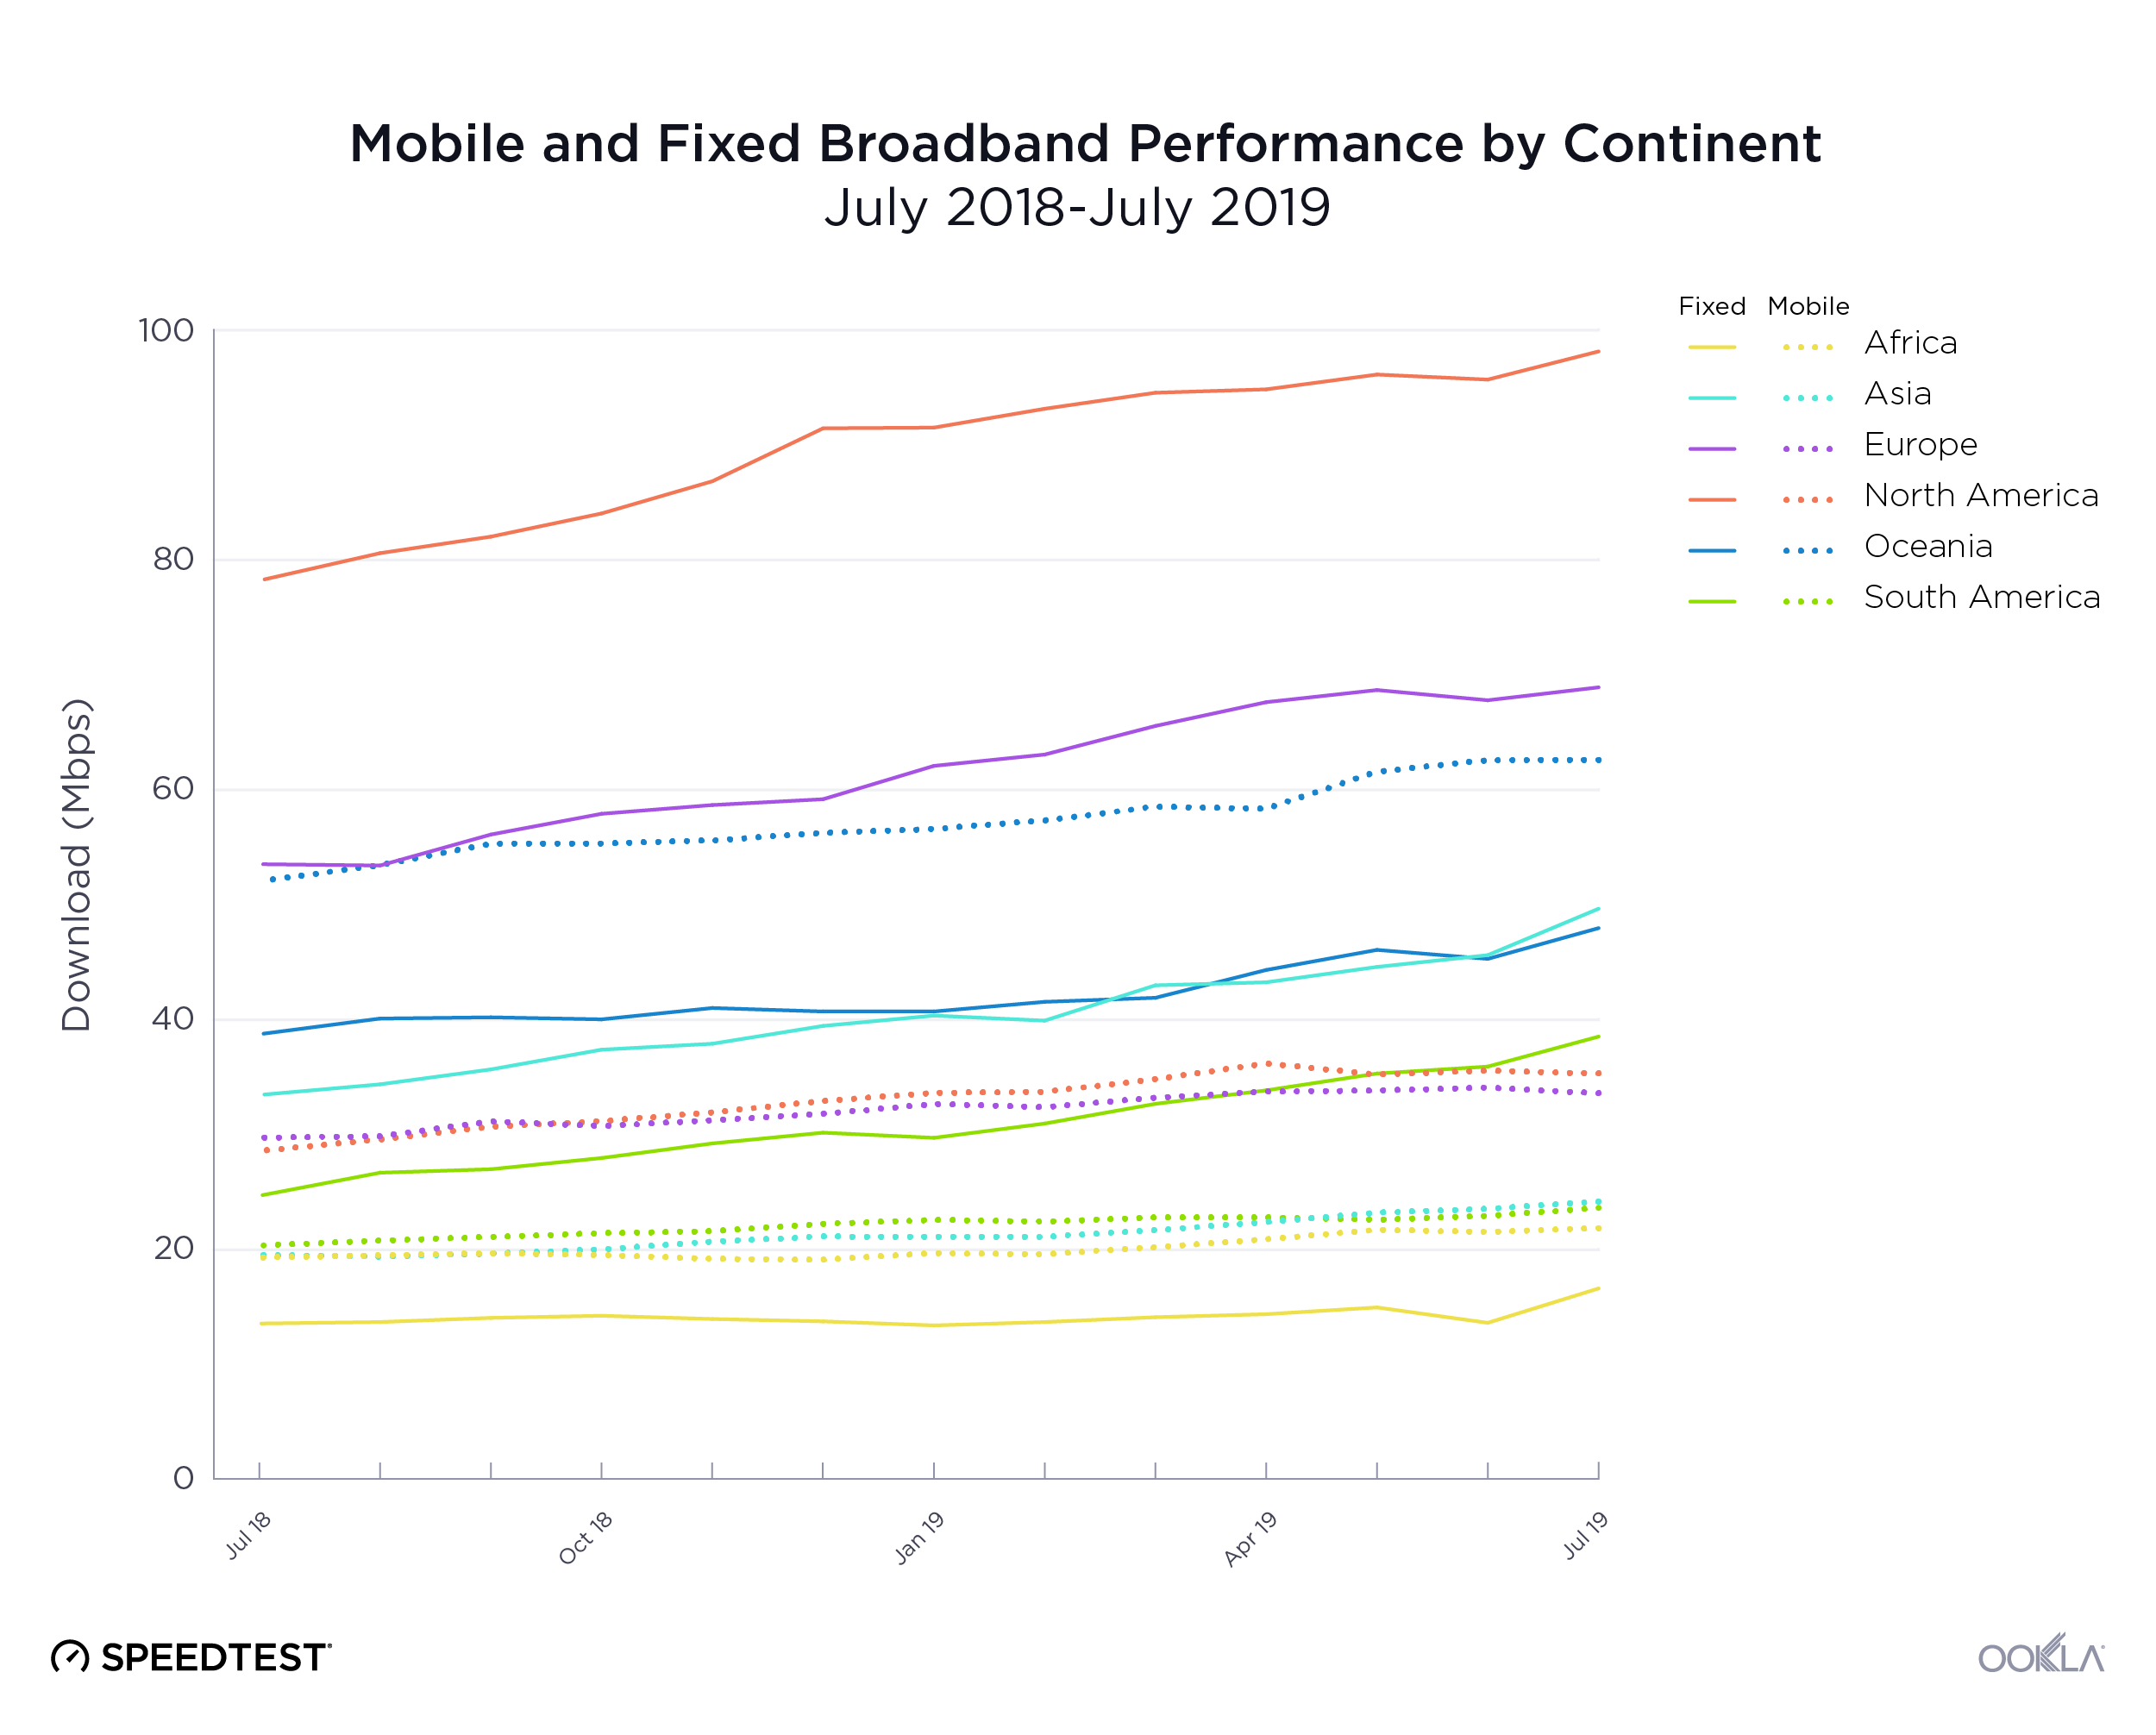
Mobile-and-Fixed-Performance-by-Continent-01

Asia had the highest percentage increase in mobile download speed followed by North America, Oceania, South America, Africa and Europe. Oceania had the fastest mean download speed in July 2019. North America placed second, Europe third, Asia fourth, South America fifth and Africa sixth.

On the fixed broadband side, South America saw the highest percentage increase in download speed. Asia came in second, Europe third, Africa fourth, North America fifth and Oceania sixth. North America had the fastest mean download speed in July 2019. Europe was second, Asia third, and Oceania fourth. As we saw with mobile, South America and Africa again ranked fifth and sixth, respectively.

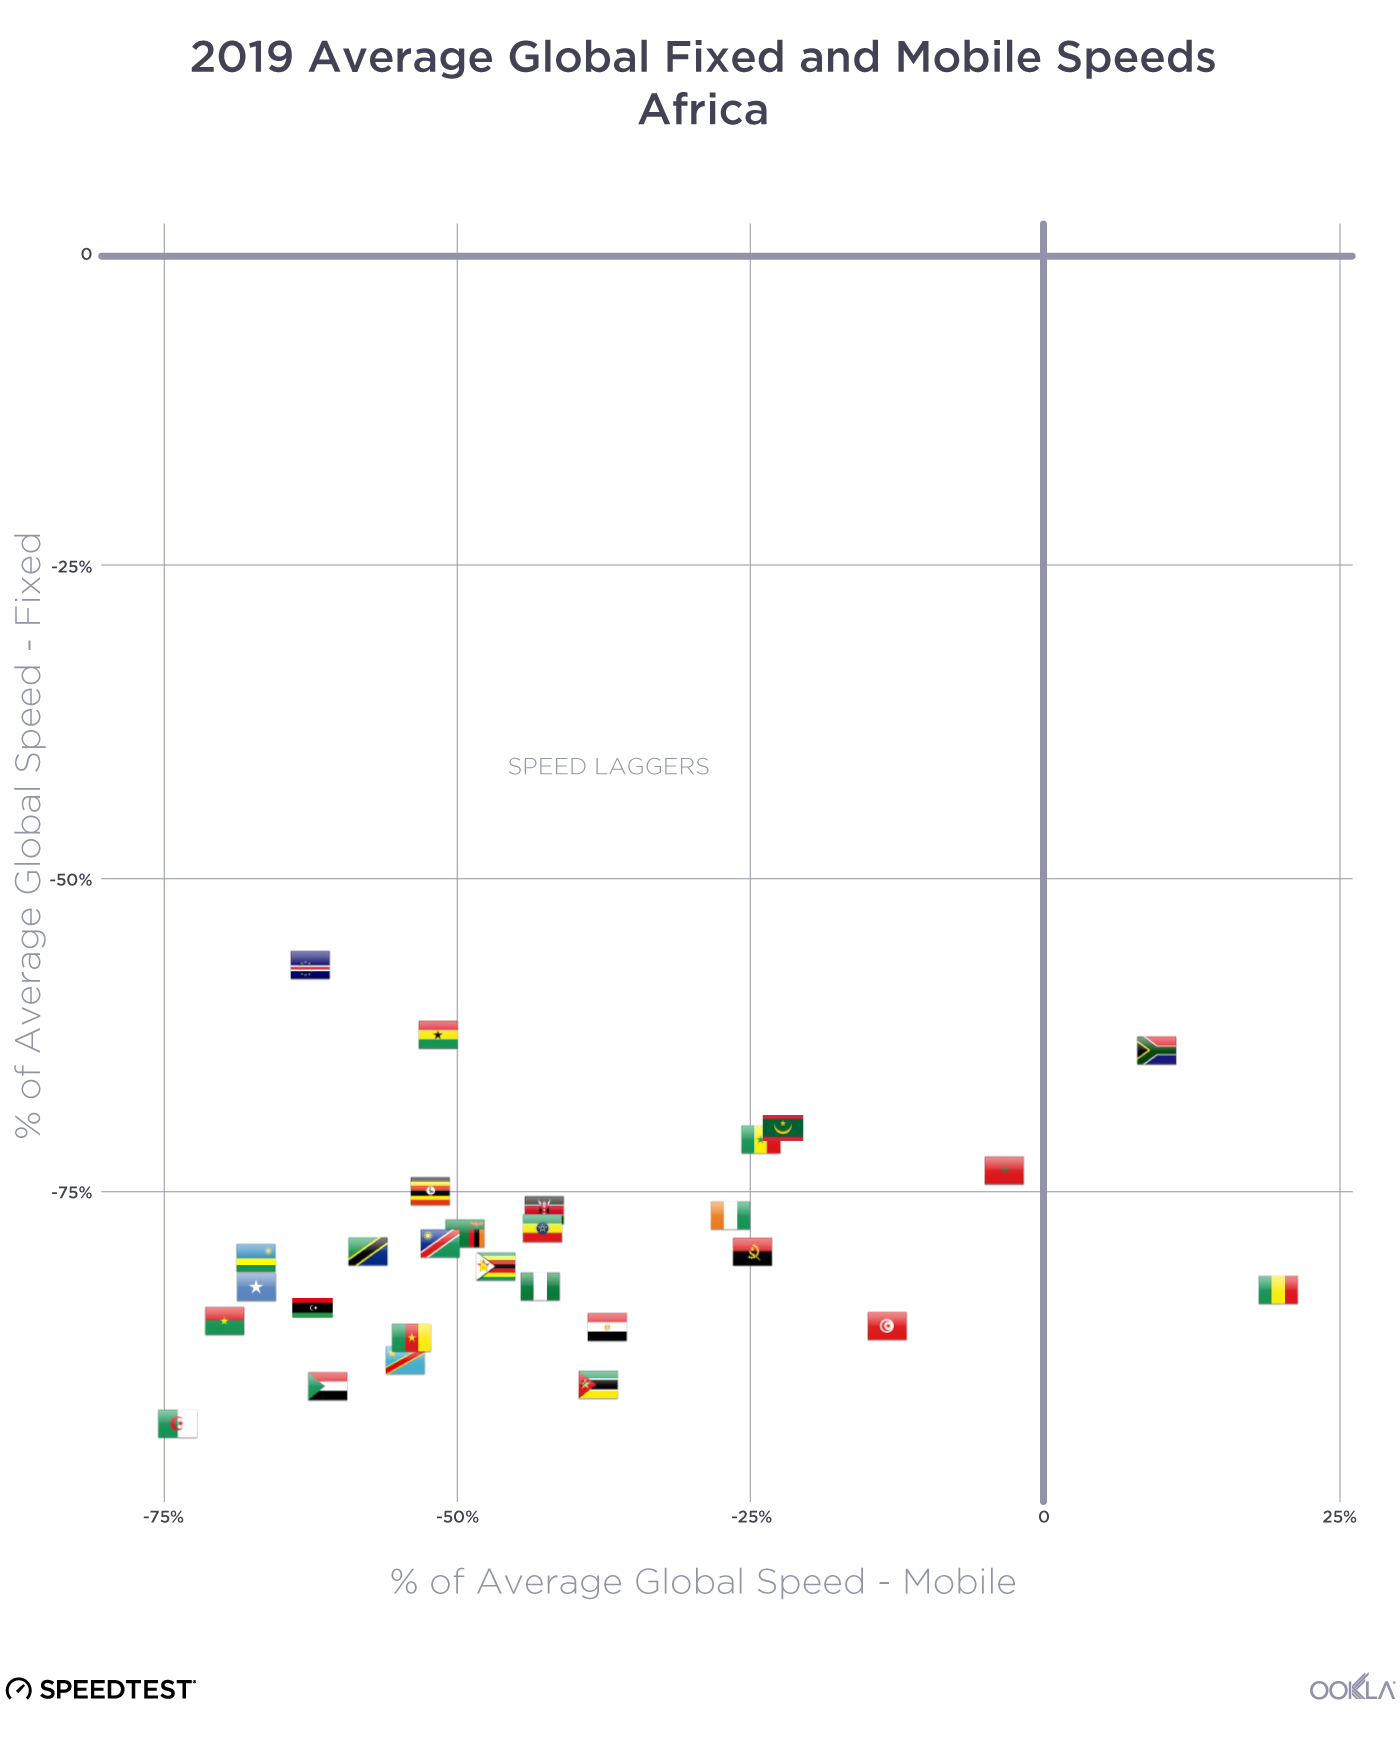
A zoomed-in view of the speed quadrants separated by continent offers a more detailed view of each country’s role in these rankings.

Africa mostly lags in internet speeds

2019-Performance-vs-Global---Africa

In July 2019, all but two African countries in the Speedtest Global Index fell into the Speed Laggers category, having mobile and fixed broadband speeds that were below global averages. The exceptions were South Africa and Guinea, which both had fast enough mobile speeds to place them in the mobile-focused quadrant.

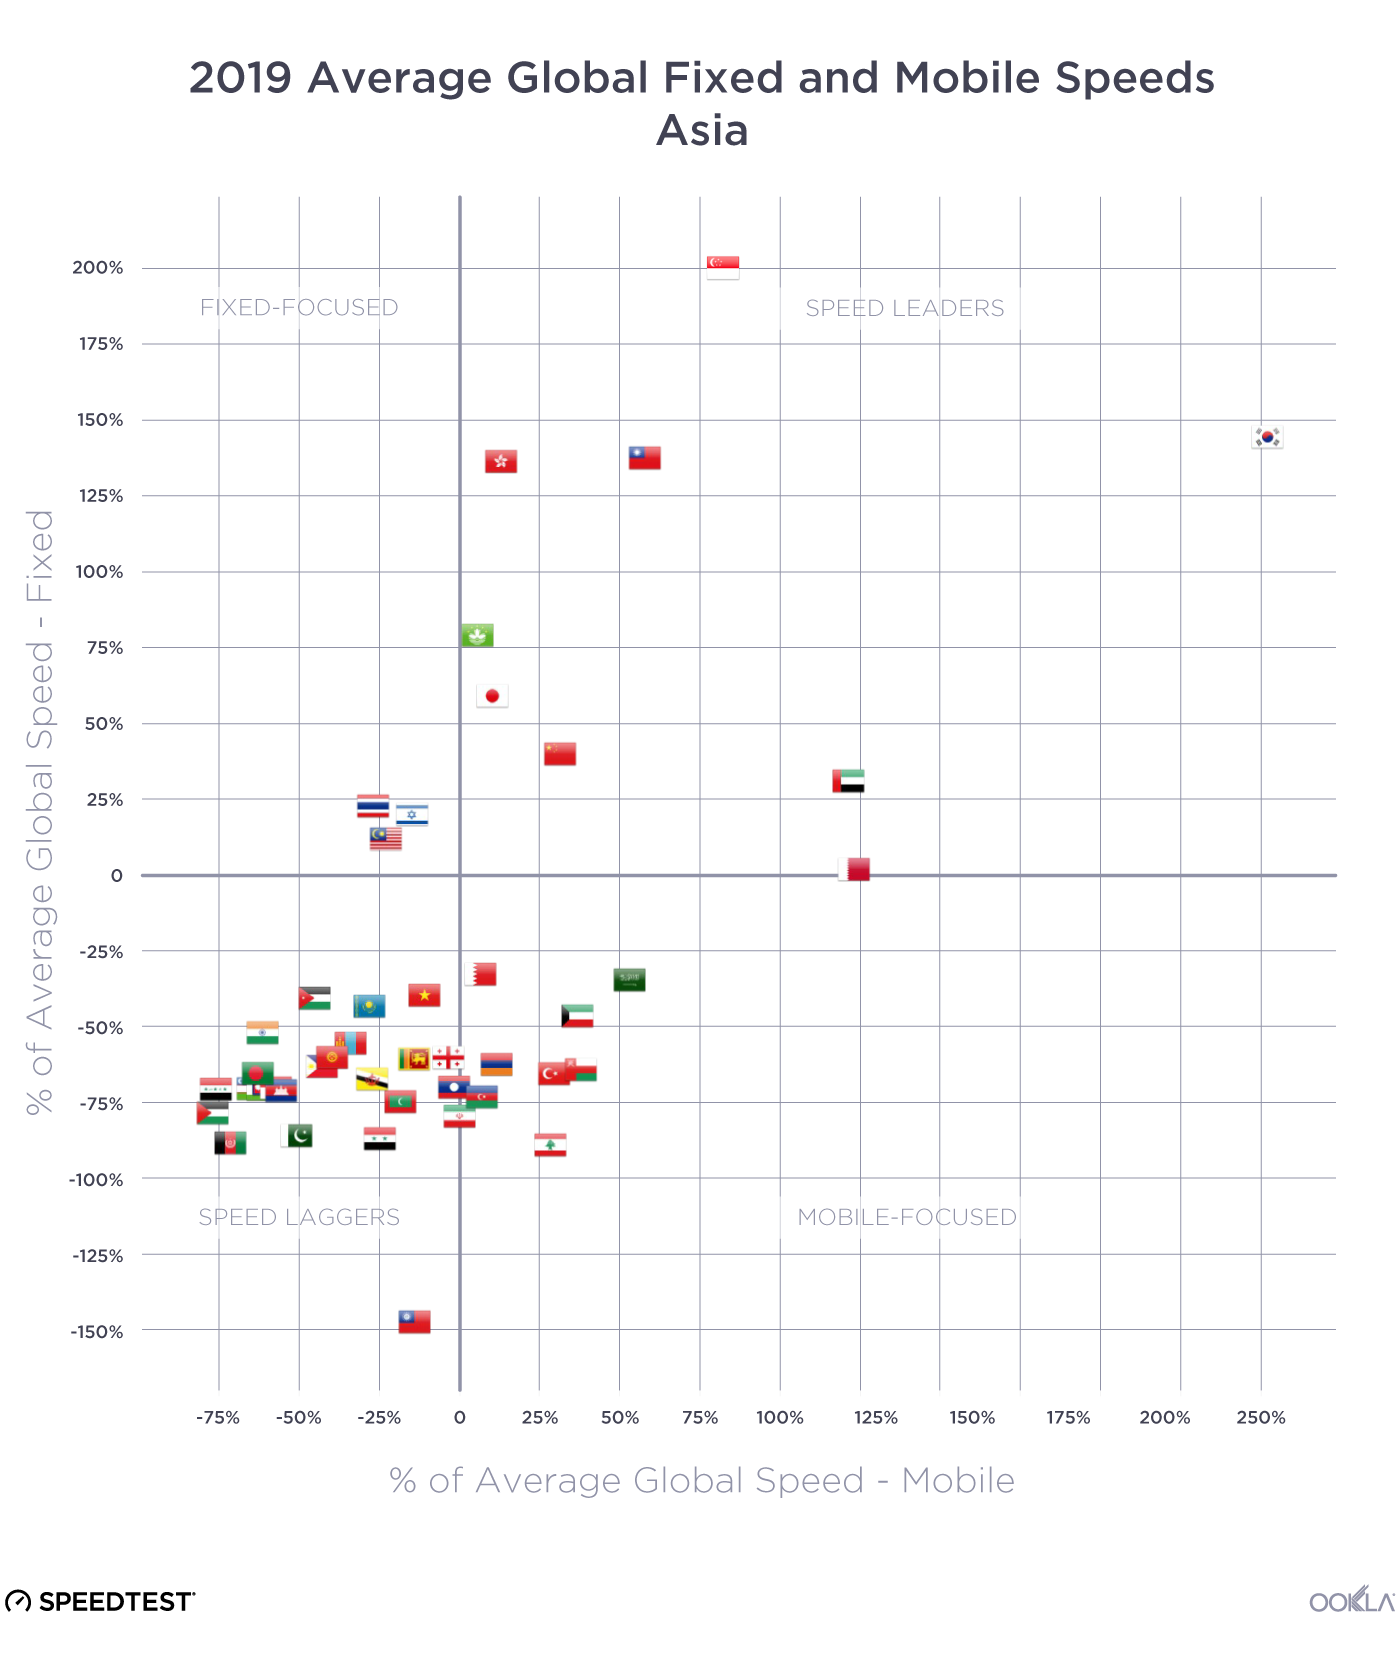
Asian markets show a wide breadth of internet performance

2019-Performance-vs-Global---Asia

Asia was the most diverse continent we examined in terms of internet performance. We saw a plurality of countries in each of the four quadrants in July 2019. Most of the Speed Leaders were in East Asia: China, Hong Kong (SAR), Japan, Macau (SAR), South Korea, and Taiwan. If we include Singapore, another Speed Leader, these are among the wealthiest nations in Asia (using GDP per capita). Two of Asia’s Fixed-Focused countries are in Southeast Asia (Malaysia and Thailand) and one is in the Middle East (Israel).

The Speed Laggers category contained countries from South Asia (including Afghanistan, India and Pakistan), Southeast Asia (Brunei, Cambodia, the Philippines and Vietnam) and the Middle East (Jordan). Mobile-Focused countries in Asia were mostly Middle Eastern, including Kuwait, Lebanon, Oman, Saudi Arabia and Turkey.

European mobile performance is mostly strong, fixed varies

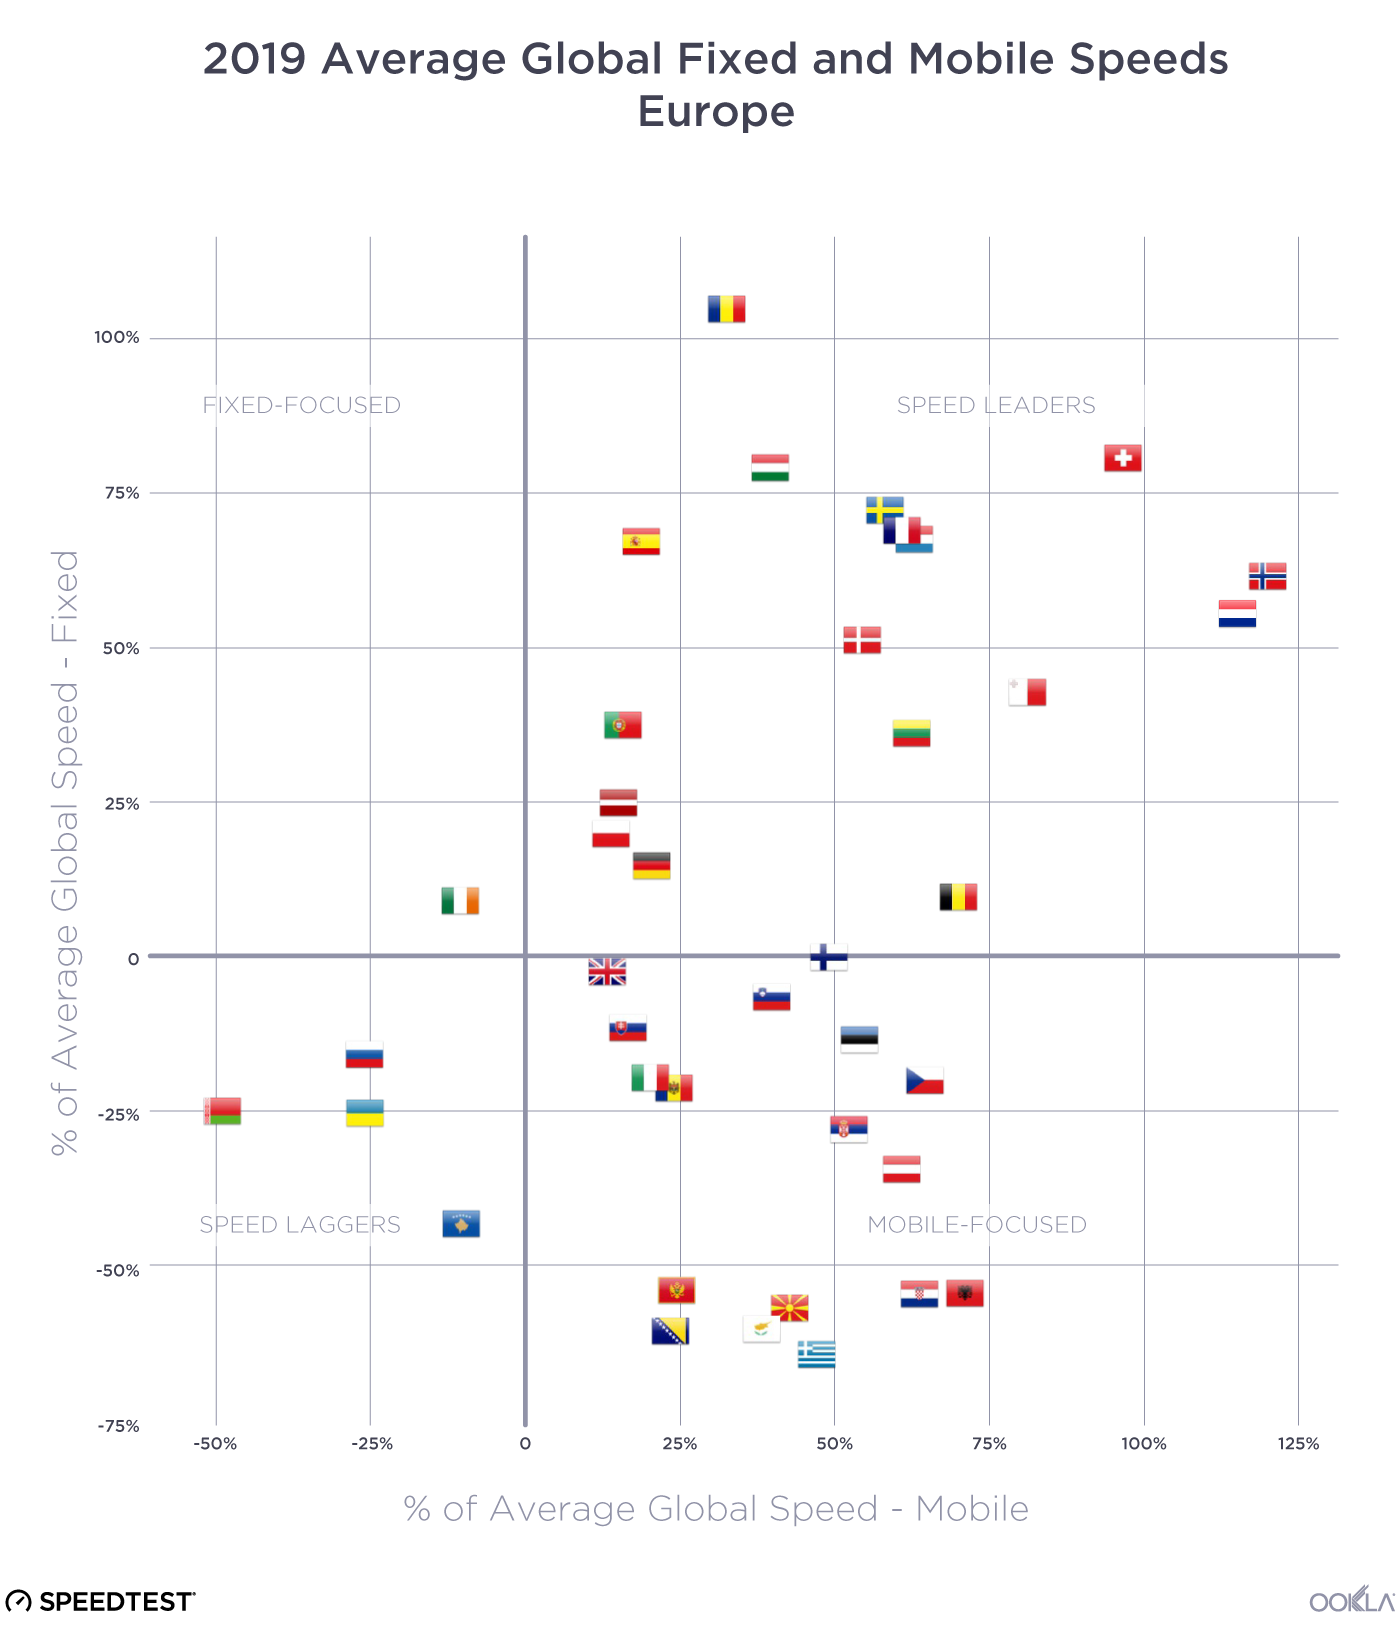
2019-Performance-vs-Global---Europe

With the exception of Ireland, the European countries on the Speedtest Global Index fell into the Speed Leaders, Mobile-Focused, and Speed Laggers categories. All of the Speed Laggers (Belarus, Kazakhstan, Russia and the Ukraine) were from Eastern Europe. Countries from Southeast Europe (including Albania, Bosnia and Herzegovina, Croatia, Greece, Montenegro, Moldova, Serbia and Slovenia) and Central Europe (Austria and the Czech Republic) made up the bulk of the Mobile-Focused category.

Speed Leaders included countries from the Baltics (Estonia, Latvia and Lithuania), the Nordics (Denmark, Norway and Sweden), Central Europe (Poland and Romania), and Western Europe (including Belgium, France, Germany, the Netherlands, and Spain).

North American internet performance is sharply divided

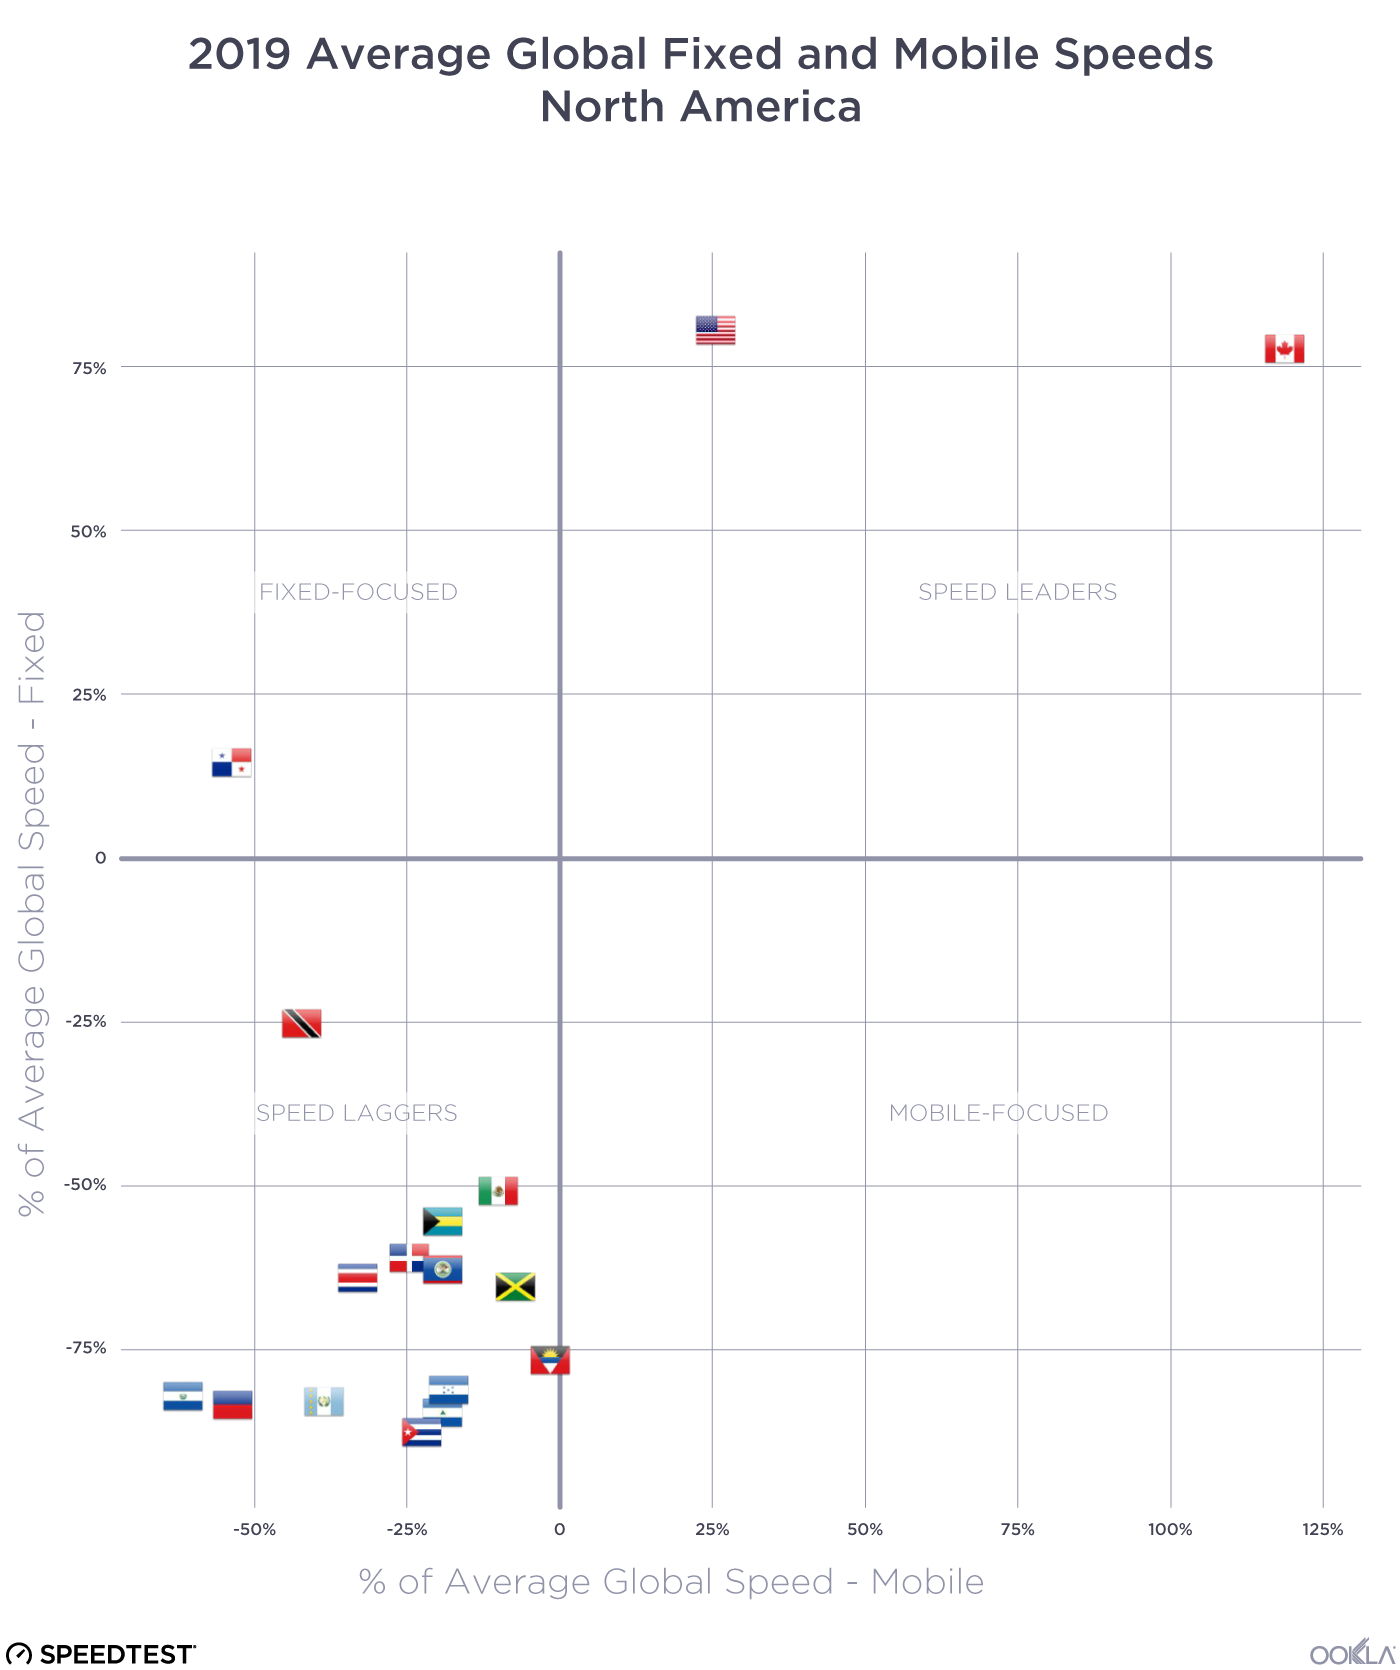
2019-Performance-vs-Global---North-America

Canada and the U.S. are the only two North American countries in the Speed Leaders category. Panama is the only North American country under Fixed-Focused. Mexico and all of the Central American countries fall into the Speed Laggers category. There are no North American countries that are Mobile-Focused.

Each country in Oceania has a very different internet story

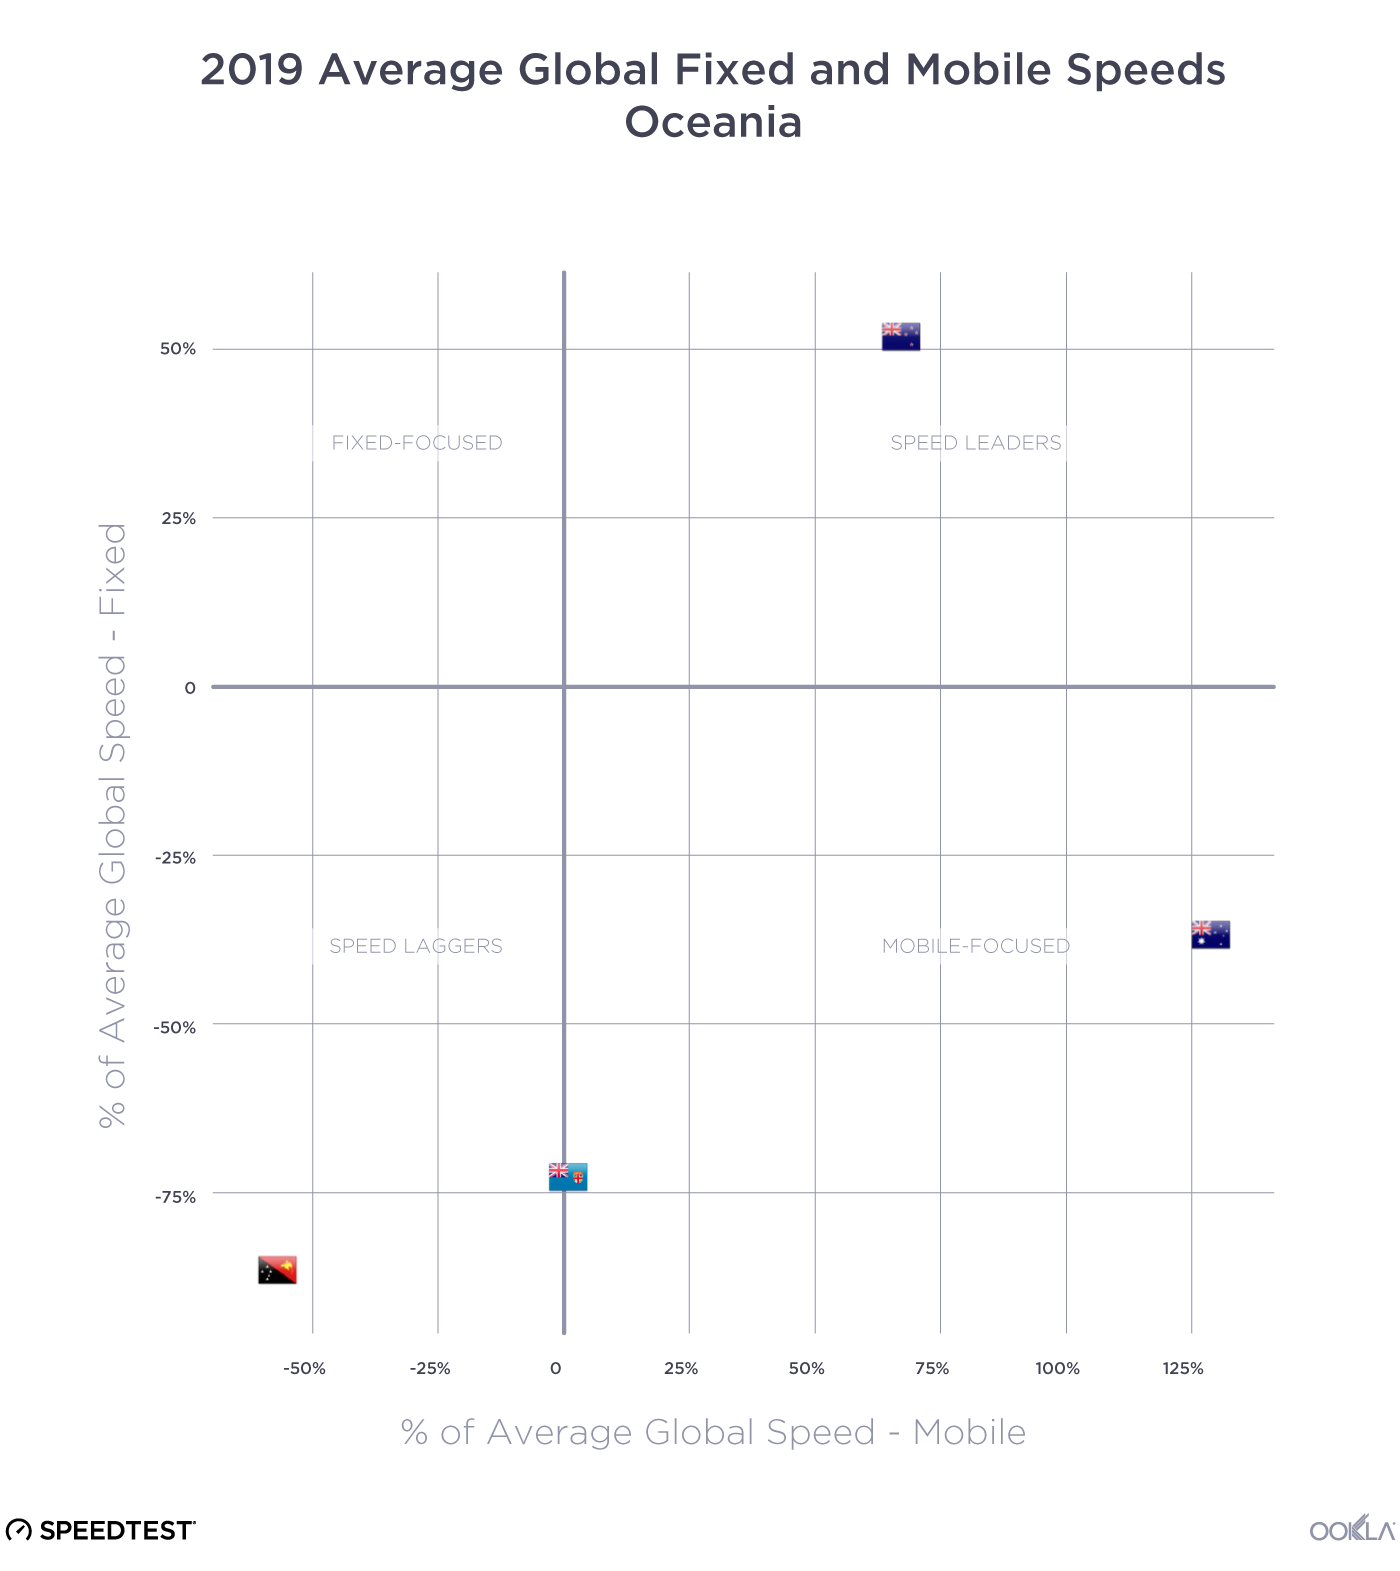
2019-Performance-vs-Global---Ocean

Oceania is represented in three of the four quadrants: Speed Leaders (New Zealand), Mobile-Focused (Australia) and Speed Laggers (Papua New Guinea) with Fiji straddling the divide between Speed Laggers and Mobile-Focused.

South America mostly lags in mobile and fixed internet speeds

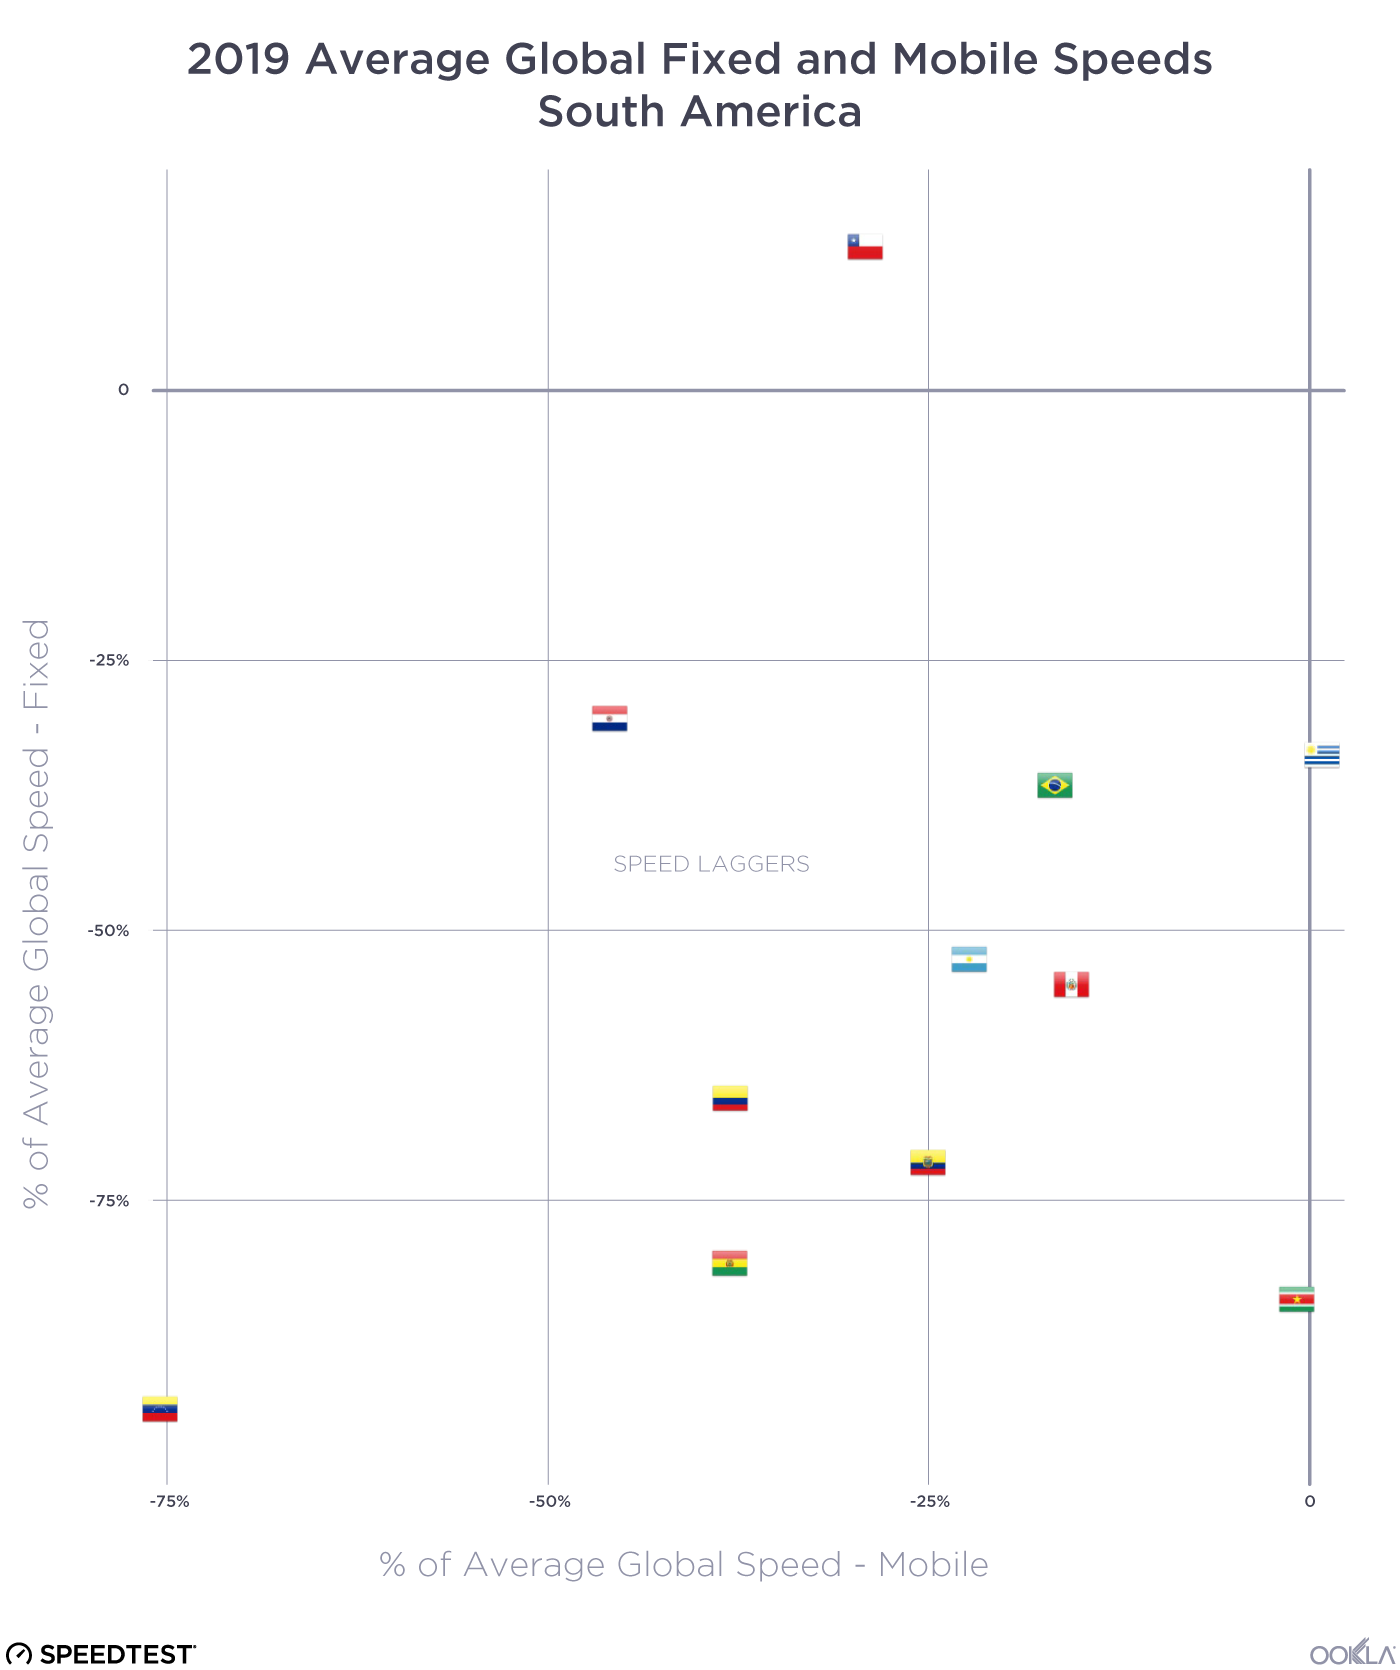
2019-Performance-vs-Global---South-America

Most of the South American countries represented on the Speedtest Global Index are in the Speed Laggers quadrant (Argentina, Bolivia, Brazil, Colombia, Ecuador, Paraguay, Peru, Suriname and Venezuela). Chile is an exception, being part of the Fixed-Focused group, as is Uruguay which sits in Mobile-Focused.

Global internet speeds are improving on average and 5G and gigabit are compounding those advances where available. However, not all countries are benefitting equally. We’ll be interested to see how 5G continues to push mobile speeds in the next year and also whether 5G Wi-Fi becomes a game changer for fixed broadband. Remember to check the Speedtest Global Index on a monthly basis for updated country rankings. And take a Speedtest to make sure your experience is represented in your country’s averages.

Editor’s Note: This article was edited on September 10, 2019 to correct an error in the labeling on the first image. The colors in a later image were updated for consistency.

Ookla retains ownership of this article including all of the intellectual property rights, data, content graphs and analysis. This article may not be quoted, reproduced, distributed or published for any commercial purpose without prior consent. Members of the press and others using the findings in this article for non-commercial purposes are welcome to publicly share and link to report information with attribution to Ookla.
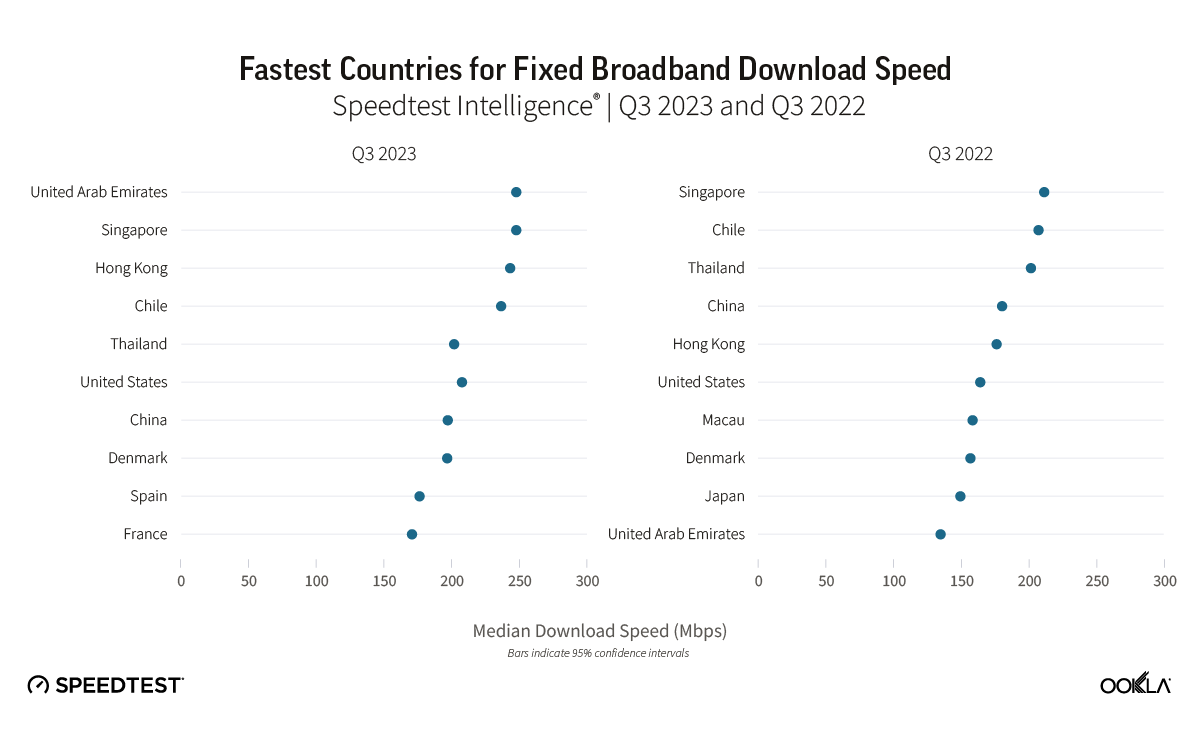
| March 13, 2020

Tracking COVID-19’s Impact on Global Internet Performance (Updated July 20)

We are no longer updating this article as internet speeds in most countries have stabilized to pre-pandemic levels. For ongoing information about internet speeds in specific countries, visit the Speedtest Global IndexTM or contact our press team.

Ookla® closely monitored the impact of COVID-19 on the performance and quality of global mobile and broadband internet networks in the early days of the pandemic. We shared regular information based on Ookla data to assist in the understanding of this unprecedented situation. You can still download the July 20, 2020 CSV here which contains all the public data we tracked in this article. If you are looking for information on internet or online service outages, please check Downdetector®.

Ookla retains ownership of this article including all of the intellectual property rights, data, content graphs and analysis. This article may not be quoted, reproduced, distributed or published for any commercial purpose without prior consent. Members of the press and others using the findings in this article for non-commercial purposes are welcome to publicly share and link to report information with attribution to Ookla.

| January 8, 2023

Hong Kong & Macau: Driving Greater Adoption of Fiber Services in Advanced Telecoms Markets

Key messages

  • Despite ranking highly in Ookla’s Speedtest Global Index™ based on median download speeds, operators in both Hong Kong (SAR) and Macau (SAR) are focussed on driving greater fixed broadband performance and fiber adoption.
  • We see greater proliferation of advanced fiber services in both markets to help encourage user adoption of faster fiber services, including flagship 10 Gbps fiber connections, fiber to the room (FTTR) services, and well as the option for subscribers to purchase multiple Gigabit channels which utilize the same connection, allowing them to allocate channels for different activities.
  • The latest statistics from the regulators in both markets point to further increases in fiber penetration over the course of 2022, reaching a high of 84.6% in Hong Kong, and 98.6% in Macau.
  • Ookla® Speedtest Intelligence® data for Q3 2022 shows that China Mobile Hong Kong (CMHK) led the Hong Kong market with a median download speed of 271.99 Mbps, while CTM led the Macau market with a speed of 160.15 Mbps.

Advancing towards a gigabit digital economy

Ookla recently presented at the Communications Association of Hong Kong’s (CAHK) Symposium 2022, “Challenge and Opportunities for Fiber Gigabit Economy”. Markets like Hong Kong  and Macau are advanced in terms of fixed network development and adoption, characterized by low levels of connection growth and strong fiber penetration, and Ookla’s Speedtest Global Index™ ranks Hong Kong 5th and Macau 12th on median fixed download speeds, as of November 2022. The development of fixed broadband networks in Hong Kong and Macau is predominantly driven by market forces, however, the Government of Hong Kong has sought to intervene, by subsidizing the deployment of fiber networks in remote locations, with a view to reducing digital inequality and helping boost the growth of the digital economy.

To track broadband adoption, the Office of the Communications Authority (OFCA) in Hong Kong monitors broadband adoption by advertised speed and technology mix, while the Macau Post and Telecommunications (CTT) monitors broadband adoption by technology. Based on the latest data they provide for 2022:

  • The number of broadband subscribers in Hong Kong rose by 0.7% during the first eight months of 2022, to reach 2.95 million. Fiber-to-the-Home/Building (FTTH/B) penetration stood at 84.6%, and 87.1% subscribed to packages with a maximum download speed equal to or greater than 100 Mbps.
  • Macau saw fixed broadband subscribers grow by 1.1% during the first 10 months of 2022, to reach 208,000, with a fiber penetration rate of 98.6%.

Chart of Hong Kong and Macau fixed broadband splits

Global comparison leaves room for improvement

We used Ookla® Speedtest Intelligence® data to compare broadband performance for Hong Kong and Macau with that of other major cities globally. Hong Kong recorded median Wi-Fi download speeds of 203.46 Mbps in Q3 2022, up from 184.79 Mbps in Q4 2021. Macau, on the other hand, lags behind its peers in terms of its median download speed performance, recording 160.13 Mbps in Q3 2022, up from 136.89 Mbps in Q4 2021. Despite strong download performance, median Wi-Fi upload speeds in Hong Kong lagged behind download performance, at 153.96 Mbps, while Macau recorded a more symmetrical median upload speed of 148.73 Mbps. Greater penetration of fiber in broadband access networks allows providers the ability to offer more symmetrical upload and download speeds.

Chart of Hong Kong and Macau Wi-Fi performance versus major global cities

Hong Kong: China Mobile Hong Kong leads on performance

We examined fixed Wi-Fi performance in Hong Kong, excluding any 5G fixed-wireless internet connections from the analysis. Providers in Hong Kong offer a range of broadband packages based on network speeds, but are also starting to differentiate through additional services such as the provision of fiber to the room and security services. Strong competition continues to drive innovation in the market, with China Mobile Hong Kong (CMHK) offering dual Gigabit fiber connections for additional capacity, and NETVIGATOR offering a Multi-Use Broadband Service, which provides bandwidth on multiple channels (up to four), with separate IP addresses, to allow consumers to divide their activities between channels. The availability of higher speed subscription tiers depends on the provider’s footprint and whether fiber connectivity is to the premises (FTTP) or to the building (FTTB), with some buildings utilizing copper as part of the last mile. Migrating Hong Kong’s remaining FTTB connections (17.8% of total as of August 2022) to FTTH (66.8% of total) would help boost median speeds.

Chart of Hong Kong fixed Wi-Fi provider performance

Our examination of fixed broadband Wi-Fi performance in Hong Kong shows that CMHK was the fastest provider overall during Q3 2022, with a median download speed of 271.99 Mbps, followed by NETVIGATOR with 221.79 Mbps. While providers continue to market broadband based primarily on download speeds, services such as video calling and online gaming demand are driving the importance and growth of upload speeds. CMHK also led the market based on median upload speeds at 213.93 Mbps during Q3 2022, followed by NETVIGATOR and HKBN. Looking at the distribution of Wi-Fi samples between 5 GHz, which offers higher capacity than lower frequency bands, NETVIGATOR and HKBN led the market based on the percentage of 5 GHz samples, with 78.2% and 77.9% respectively.

Chart of Hong Kong 5 GHz share of fixed Wi-Fi provider samples

Macau: CTM outstrips MTEL on overall performance

Macau lagged behind Hong Kong on fixed Wi-Fi performance for both median download and upload speeds during Q3 2022, despite the regulator CTT reporting widespread adoption of fiber in the market. Providers CTM and MTEL offer a range of fiber broadband plans for residential users, segmented by speed, with download speeds ranging from 150 Mbps to 10 Gbps for CTM, and from 25 Mbps to 600 Mbps for MTEL.

Chart of Macau fixed Wi-Fi provider performance

Speedtest Intelligence performance data for Macau during 2022 aligns with CTM’s focus on providing higher broadband speed tiers in the market. CTM maintained a significant performance gap over MTEL, recording a median download speed of 160.15 Mbps compared to MTEL at 89.63 Mbps during Q3 2022. Upload performance between the two providers showed a similar picture, with CTM recording a median speed of 151.96 Mbps in Q3 2022 — almost double that of MTEL which recorded 77.49 Mbps. Looking at the distribution of Wi-Fi samples between 5 GHz and other bands, CTM outstripped MTEL with a greater proportion of samples using 5 GHz during Q3 2022.

Chart of Macau 5 GHz share of fixed Wi-Fi provider samples

In order to maintain or improve their position among top-performing cities globally, providers in Hong Kong and Macau need to drive greater availability of higher-speed broadband services and newer routers, while encouraging existing customers to upgrade to faster speeds. For Hong Kong in particular, improving the penetration of routers which support 5 GHz Wi-Fi could help those providers that currently lag behind in the market on overall performance. We’ll continue monitoring how fixed broadband performs across major cities like Hong Kong and Macau. If you want to learn more about Speedtest Intelligence, please inquire here.

Ookla retains ownership of this article including all of the intellectual property rights, data, content graphs and analysis. This article may not be quoted, reproduced, distributed or published for any commercial purpose without prior consent. Members of the press and others using the findings in this article for non-commercial purposes are welcome to publicly share and link to report information with attribution to Ookla.
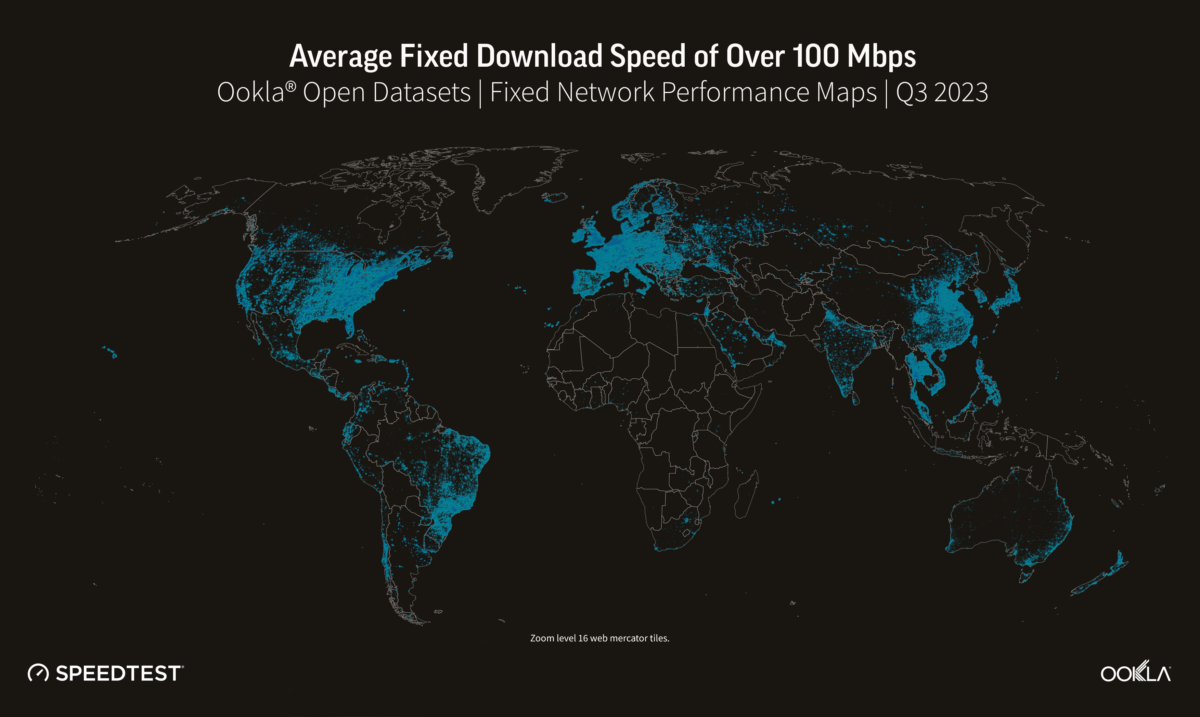
| March 14, 2022

Hong Kong & Macau: Migration to Faster Fiber Services Driving Performance Gains

讀中文

Operators in Hong Kong and Macau are continuing to drive migration of their customer bases from legacy fixed-line technologies to faster fiber and cable connections. Both markets are heavily saturated and connection growth remains low, with Hong Kong adding an additional 50,000 broadband subscribers to reach 2.92 million in total in the 10 months ended October 2021, while Macau saw fixed broadband subscribers grow by 4,000 to reach 206,000 during 2021.

The regulators in both markets provide detailed broadband subscription statistics. In Hong Kong, the Office of the Communications Authority (OFCA) tracks broadband adoption by advertised speed and technology mix. It recorded 85.4% of broadband subscribers on packages with a maximum download speed equal to or greater than 100 Mbps, and 80.3% fiber to the home/building (FTTH/B) as of October 2021. Of these, over half subscribe to broadband packages offering speeds of at least 1 Gbps. In Macau, the Macau Post and Telecommunications (CTT) tracks broadband adoption by technology, with 97.8% of Macau broadband subscribers using fiber at the end of 2021.

Global city ranking leaves room for improvement

We used Ookla® Speedtest Intelligence® data to rank the broadband performance of select cities globally. Across all cities with a minimum of 10,000 samples in Q4 2021, Hong Kong ranked 20 on median Wi-Fi download speeds with 184.80 Mbps, while Macau ranked 74 with a download speed of 129.90 Mbps. Despite strong download performance, median Wi-Fi upload speeds in Hong Kong lagged behind download performance, at 125.70 Mbps, while Macau recorded a more symmetrical median upload speed of 105.70 Mbps. Greater penetration of fiber in broadband access networks provides operators with the ability to offer more symmetrical upload and download speeds.

hong kong and macau performance versus other major global cities

Hong Kong: China Mobile Hong Kong leads on download performance

We examined fixed Wi-Fi performance in Hong Kong, excluding any 5G fixed-wireless internet connections from the analysis. Operators in Hong Kong offer a range of broadband packages based on network speeds, e.g. HGC offers subscriptions with download speeds ranging from 6 Mbps to 2.2 Gbps. Availability of higher speed subscription tiers depends on the operator’s footprint and whether fiber connectivity is to the premises (FTTP) or to the building (FTTB), with some buildings utilizing copper as part of the last mile. Migrating Hong Kong’s remaining FTTP connections (19.3% of total) to FTTH (61.0% of total) would help boost median speeds. China Mobile Hong Kong (CMHK) has gone one step further in a bid to boost home fiber speeds, launching a fiber to the room (FTTR) service in September 2021, which deploys optical cables within a house/apartment.

Hong Kong Fixed Wi-Fi Operator Performance

Our examination of fixed broadband Wi-Fi performance in Hong Kong shows CMHK, which obtained in excess of 3% of overall samples to be considered in this analysis in Q3 2021, in first place in Q4 2021, with a median download speed of 251.73 Mbps, followed by Netvigator with 216.06 Mbps. While operators continue to market broadband based primarily on download speeds, upload speeds continue to grow in importance given the increased prevalence of remote working and growth in demand for services such as video calling and online gaming. Netvigator led the market based on median upload speeds in Q4 2021, recording 174.72 Mbps, followed by CMHK and HKBN. Looking at the distribution of Wi-Fi samples between 5 GHz, which offers higher capacity than lower frequency bands, Netvigator and HKBN led the market based on percentage of 5 GHz samples, with 75.3% and 74.1% respectively.

Hong Kong: 5Ghz Share of Fixed Wi-Fi Operator Samples

Macau: CTM outstrips MTEL on overall performance

Macau lags Hong Kong on fixed Wi-Fi performance for both median download and upload speeds, despite the regulator CTT reporting widespread adoption of fiber in the market. Operators MTEL and CTM offer a range of fiber broadband plans for residential users, segmented by download speed. As of February 2022, MTEL offers packages ranging from 25 Mbps to 600 Mbps, while CTM offers a wider range of speeds, from 50 Mbps to its headline speed of 10 Gbps, introduced in September 2020.

Macau Fixed Wi-Fi Operator Performance

Speedtest Intelligence performance data for Macau during 2021 aligns with CTM’s focus on providing higher broadband speed tiers in the market. CTM maintained a significant performance gap over MTEL, recording a median download speed of 131.80 Mbps in Q4 2021, compared to MTEL with 72.26 Mbps. Upload performance between the two operators shows a similar picture, with CTM recording a median speed of 107.39 Mbps in Q4 2021, over double that of MTEL which recorded 52.26 Mbps. Looking at the distribution of Wi-Fi samples between 5 GHz and other bands, MTEL recorded a greater proportion of samples using 5 GHz than CTM.

Macau: 5 Ghz Share of Fixed Wi-Fi Operator Samples

In order to maintain or improve their position among top-performing cities globally, operators in Hong Kong and Macau need to drive greater availability of higher-speed broadband services, while encouraging existing customers to upgrade to faster speeds. For Hong Kong in particular, improving the penetration of routers which support 5 GHz Wi-Fi could help those operators which currently lag the market on overall performance. We’ll continue monitoring how fixed broadband performs across major cities like Hong Kong and Macau. If you want to learn more about Speedtest Intelligence, please inquire here.


香港澳門:轉移到更快速的光纖服務將有助提升性能

香港及澳門的營辦商正在不斷向客戶進行推廣,希望他們轉用更快速的光纖及電纜網絡接駁,以取代傳統固網技術。但這兩個市場都已經嚴重飽和,網絡接駁增長仍然很低;2021 年的 10 個月內,香港增加了 50,000 名寬頻用戶,總數達到 292 萬;而澳門的固網寬頻用戶在 2021 年增加 了4,000個,總數達到 206,000個。

兩個市場的監管機構均提供了詳細的寬頻訂閱統計數據。香港的通訊事務管理局(OFCA)透過營辦商宣傳的網速及技術追蹤寬頻用量:截至 2021 年 10 月,85.4% 的寬頻用戶使用最大下載速度等於或大於 100 Mbps 的服務計劃,80.3% 的寬頻用戶使用「光纖到戶 」(FTTH)/「光纖到樓」(FTTB),其中超過一半人訂閱網速至少為 1 Gbps 的服務計劃。澳門郵電 (CTT)則透過技術來追蹤寬頻用量:截至 2021 年底,97.8% 的澳門寬頻用戶使用光纖。

全球城市排名顯示仍有進步空間

hong kong and macau performance versus other major global cities

香港:中國移動香港的下載表現領先

我們測試了香港的固網 Wi-Fi 性能,但並不包括任何 5G 固網無線互聯網接駁。香港營辦商提供大量不同網速的寬頻計劃,例如HGC環電提供下載速度由6 Mbps至 2.2 Gbps的寬頻計劃。寬頻速度取決於營辦商的網絡覆蓋範圍,以及是使用「光纖到樓」(FTTP/FTTB)技術,而某些大廈在最後一英里會使用銅線接入。將香港剩餘的 FTTP接駁(佔總數的 19.3%)轉移為到 FTTH接駁(佔總數的 61.0%)將有助提升速度中位數。中國移動香港(CMHK)在2021年9月推出了FTTR (Fiber to the Room)技術,實現光纖接入房屋/單位內部,令家居光纖寬頻的網速又向前邁進了一步。

Hong Kong Fixed Wi-Fi Operator Performance

我們對香港固網寬頻 Wi-Fi 性能的測試顯示,中國移動香港在2021年第三季才開始成為Top Providers(獲得超過3%的總體樣本),因此在2021年第三季前無數據顯示。在 2021 年第四季度,中國移動香港以 251.73 Mbps 的下載速度中位數位居第一,而網上行則以216.06 Mbps排名第二。雖然營辦商繼續主要以下載速度來推銷其寬頻計劃,但鑑於遠程工作的日益普及,以及視像通話及網上遊戲等服務的需求增加,上載速度的重要性亦不斷上升。根據 2021 年第四季的上載速度中位數資料,網上行以174.72 Mbps領先市場,其次是中國移動香港及香港寬頻。根據5 GHz(比低頻段擁有更廣的覆蓋範圍與更強的穿透能力) Wi-Fi熱點分佈的樣本,網上行及香港寬頻以 5 GHz 樣本百分比領先市場,分別為 75.3% 和 74.1%。

Hong Kong: 5Ghz Share of Fixed Wi-Fi Operator Samples

澳門:澳門電訊的整體表現比MTel 電信更出色

儘管監管機構澳門郵電的報告顯示該市場廣泛採用光纖技術,但其固網 Wi-Fi 的下上載速度均落後於香港。營辦商MTel 電信有限公司及澳門電訊為住宅用戶提供一系列不同下載速度的光纖寬頻計劃。2022 年 2 月,MTel 電信有限公司提供下載速度由25 Mbps 至 600 Mbps的寬頻計劃,而澳門電訊則提供50 Mbps至10 Gbps(於2020年9月推出的主打)的寬頻計劃,速度範圍更廣泛。

Macau Fixed Wi-Fi Operator Performance

Speedtest Intelligence 的2021年澳門網路連接速度表現數據反映了澳門電訊致力於向市場提供更快速的寬頻服務。在2021 年第四季,澳門電訊的下載速度中位數為131.80 Mbps,其性能遠超只有72.26 Mbps的MTel 電信;而兩者的上載速度中位數差距亦很大,澳門電訊的上載速度中位數為107.39 Mbps,比只有52.26 Mbps 的 MTel 電信快兩倍。如比較5 GHz及其他頻段Wi-Fi熱點分佈的樣本,MTel 電信5 GHz Wi-Fi熱點分佈的樣本百分比較澳門電訊高。

Macau: 5 Ghz Share of Fixed Wi-Fi Operator Samples

如要保持或提高在全球表現最好城市的排名,港澳兩地的營辦商需要提供更高的高速寬頻服務可及性,同時鼓勵現有客戶升級到更快速的寬頻計劃。特別是香港,如果支援 5 GHz Wi-Fi的設備可以更滲透市場,便可以幫助那些目前在整體性能方面落後於市場的營辦商。我們將繼續監測固網寬頻在香港和澳門等主要城市的表現。如果您想了解更多有關Speedtest Intelligence的資訊請到此處查詢


Ookla retains ownership of this article including all of the intellectual property rights, data, content graphs and analysis. This article may not be quoted, reproduced, distributed or published for any commercial purpose without prior consent. Members of the press and others using the findings in this article for non-commercial purposes are welcome to publicly share and link to report information with attribution to Ookla.