| June 23, 2020

Investigating the Gaming Experience in Indonesia


Bahasa Indonesia

Gaming is a fast-growing industry in Indonesia with millions of daily players. However, latency, a key metric for a high-quality gaming experience, is not equal across the country. And while most games are played on mobile devices, the fixed broadband networks that support console and PC games often show a much lower latency in many areas. Today we’re examining latency on both fixed broadband and mobile at the country, province and city level in Indonesia to see where players are most likely to have smooth gameplay with less lag.

Latency (or ping) is the reaction time of a connection and it is measured in milliseconds. For the best gaming experience, users should expect their latency to be 59 ms or less. Latency when gaming can vary, depending on the servers connected to, and connecting to a server within a gamer’s own region is preferred. Speedtest tests to the closest, lowest-latency server — often within the same population center as the user.

Telkom offered lowest latency in Q1 2020

ookla_Indonesia_mobile_fixed_latency_0620

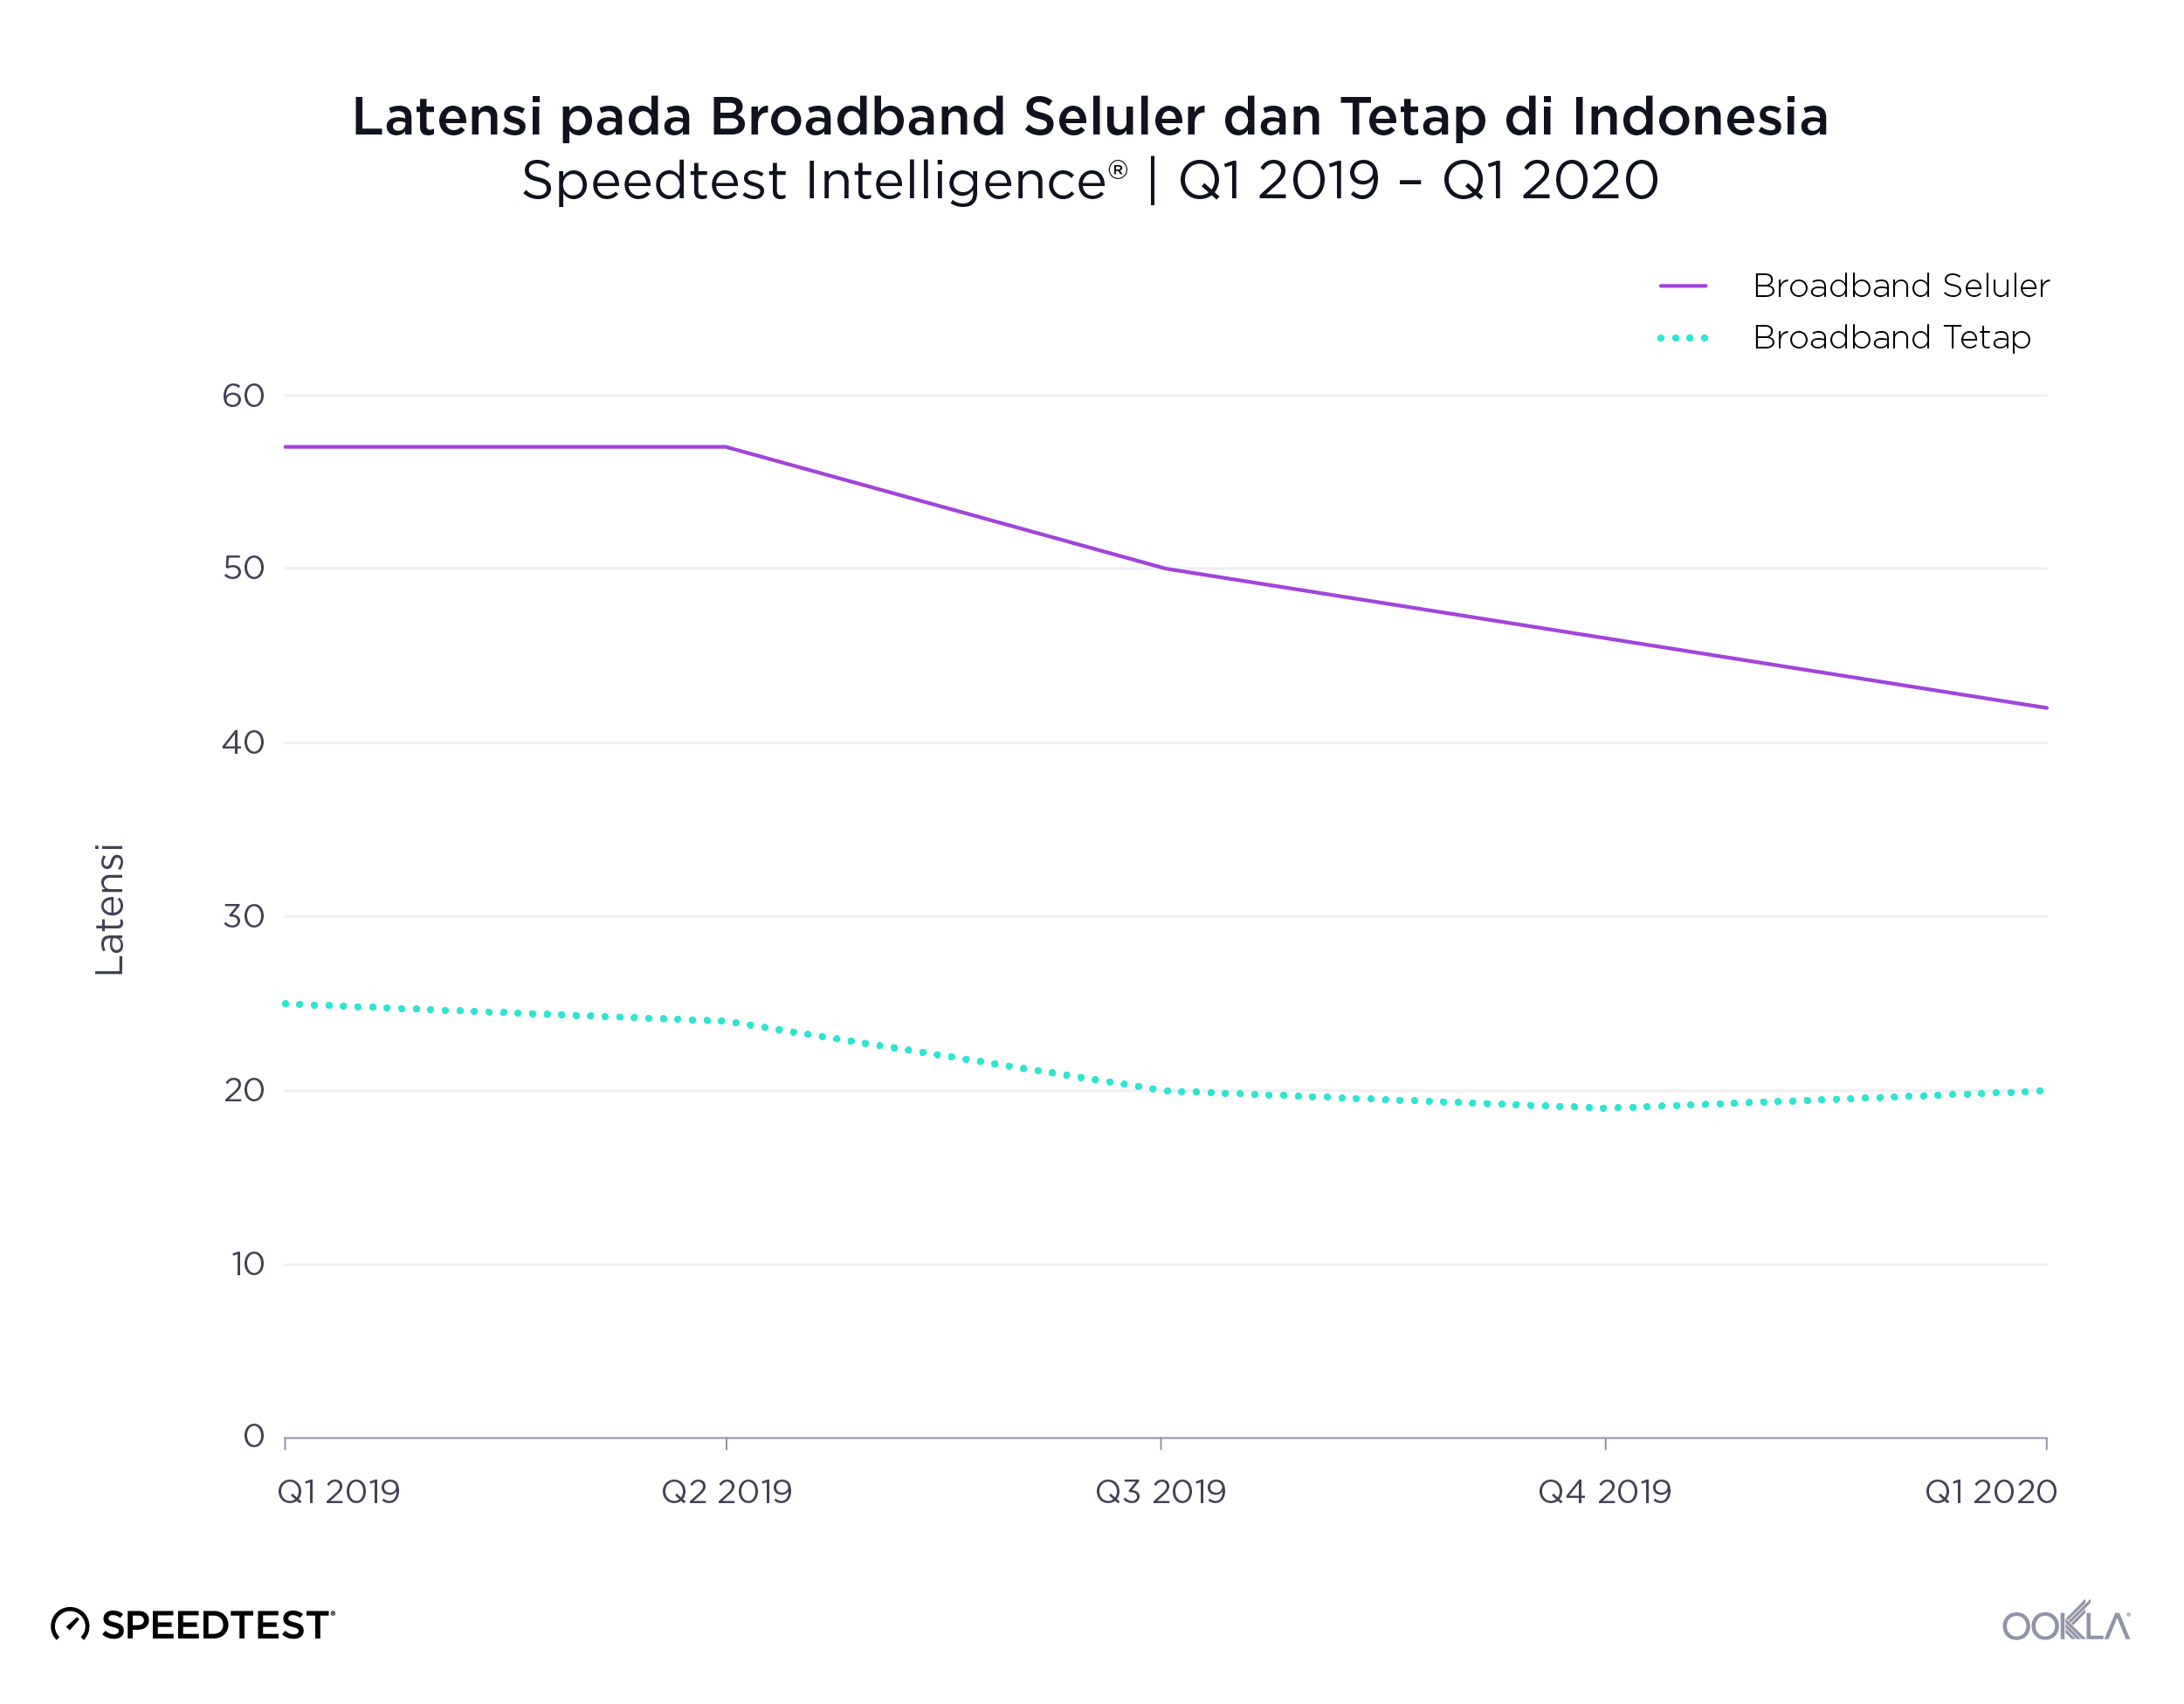
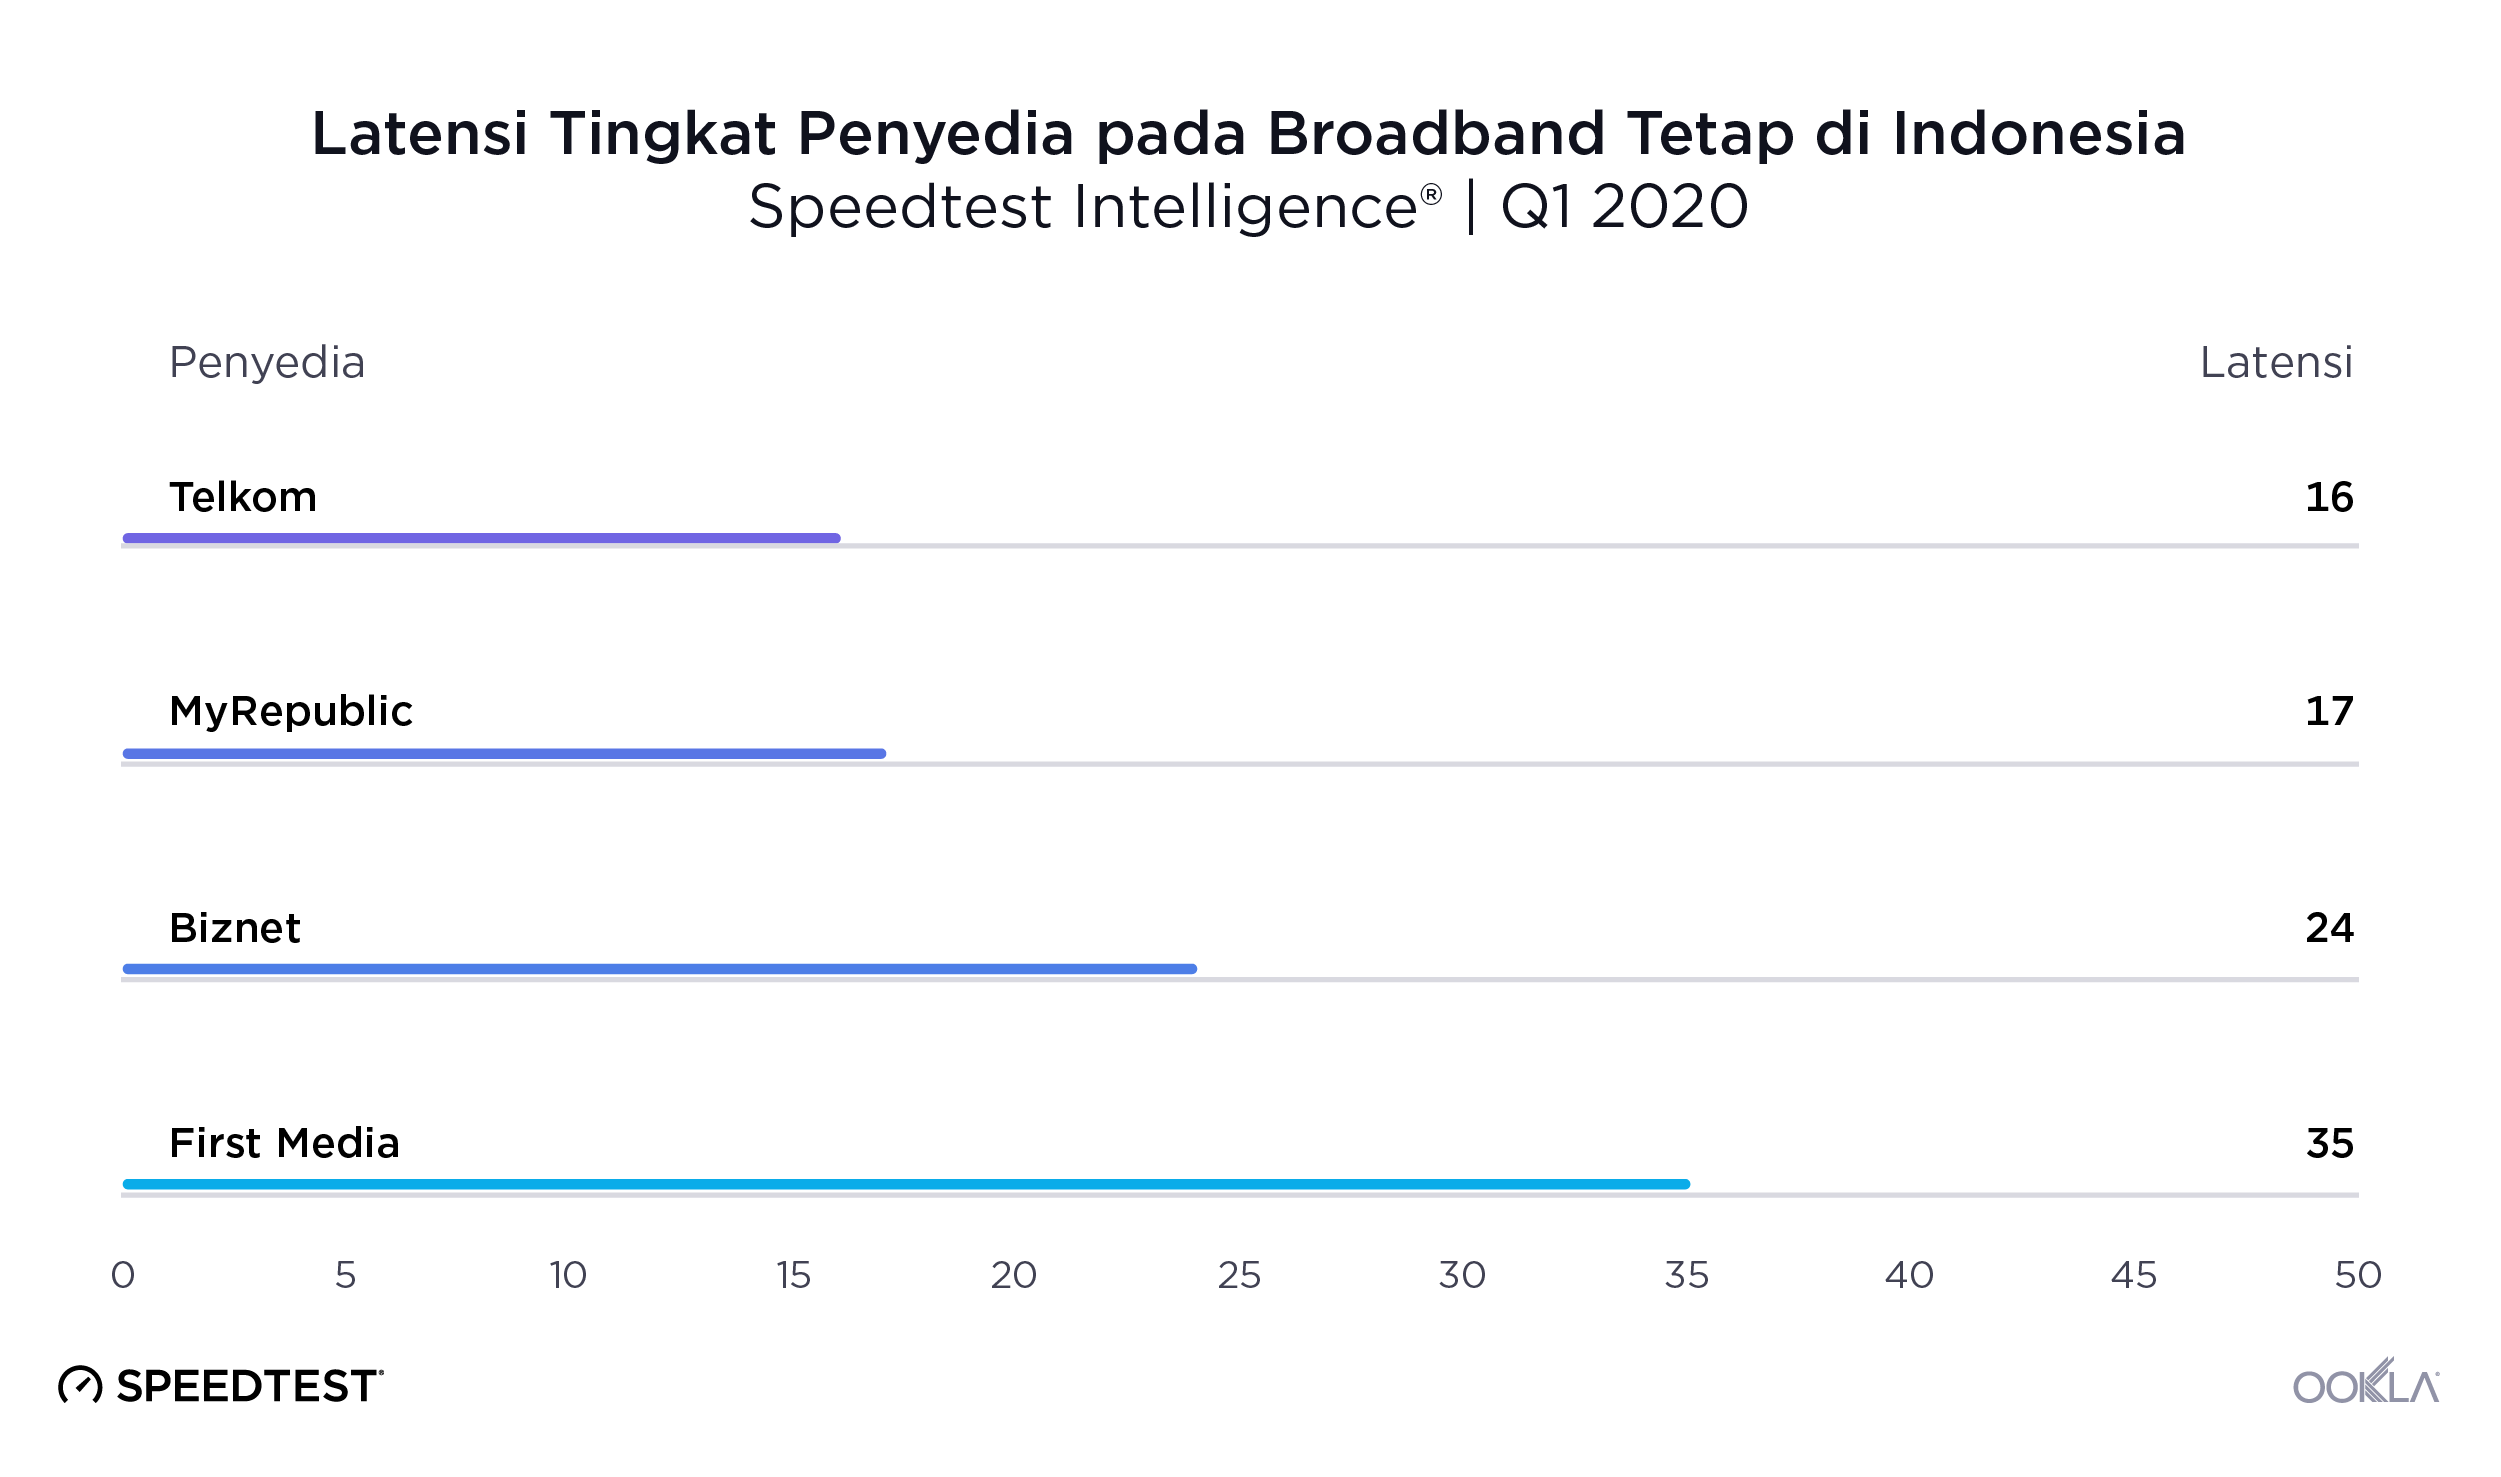
During Q1 2020, Indonesia’s mean latency on fixed broadband was 20 ms. On mobile, mean latency was 42 ms. At the country level, fixed broadband providers in Indonesia showed a range of latency between 16 ms and 35 ms during Q1 2020. Telkom had the lowest latency on fixed broadband at 16 ms. MyRepublic followed closely with 17 ms. Biznet and First Media had the highest latency at 24 ms and 35 ms, respectively.
ookla_Indonesia_fixed_provider_latency_chart_0620-

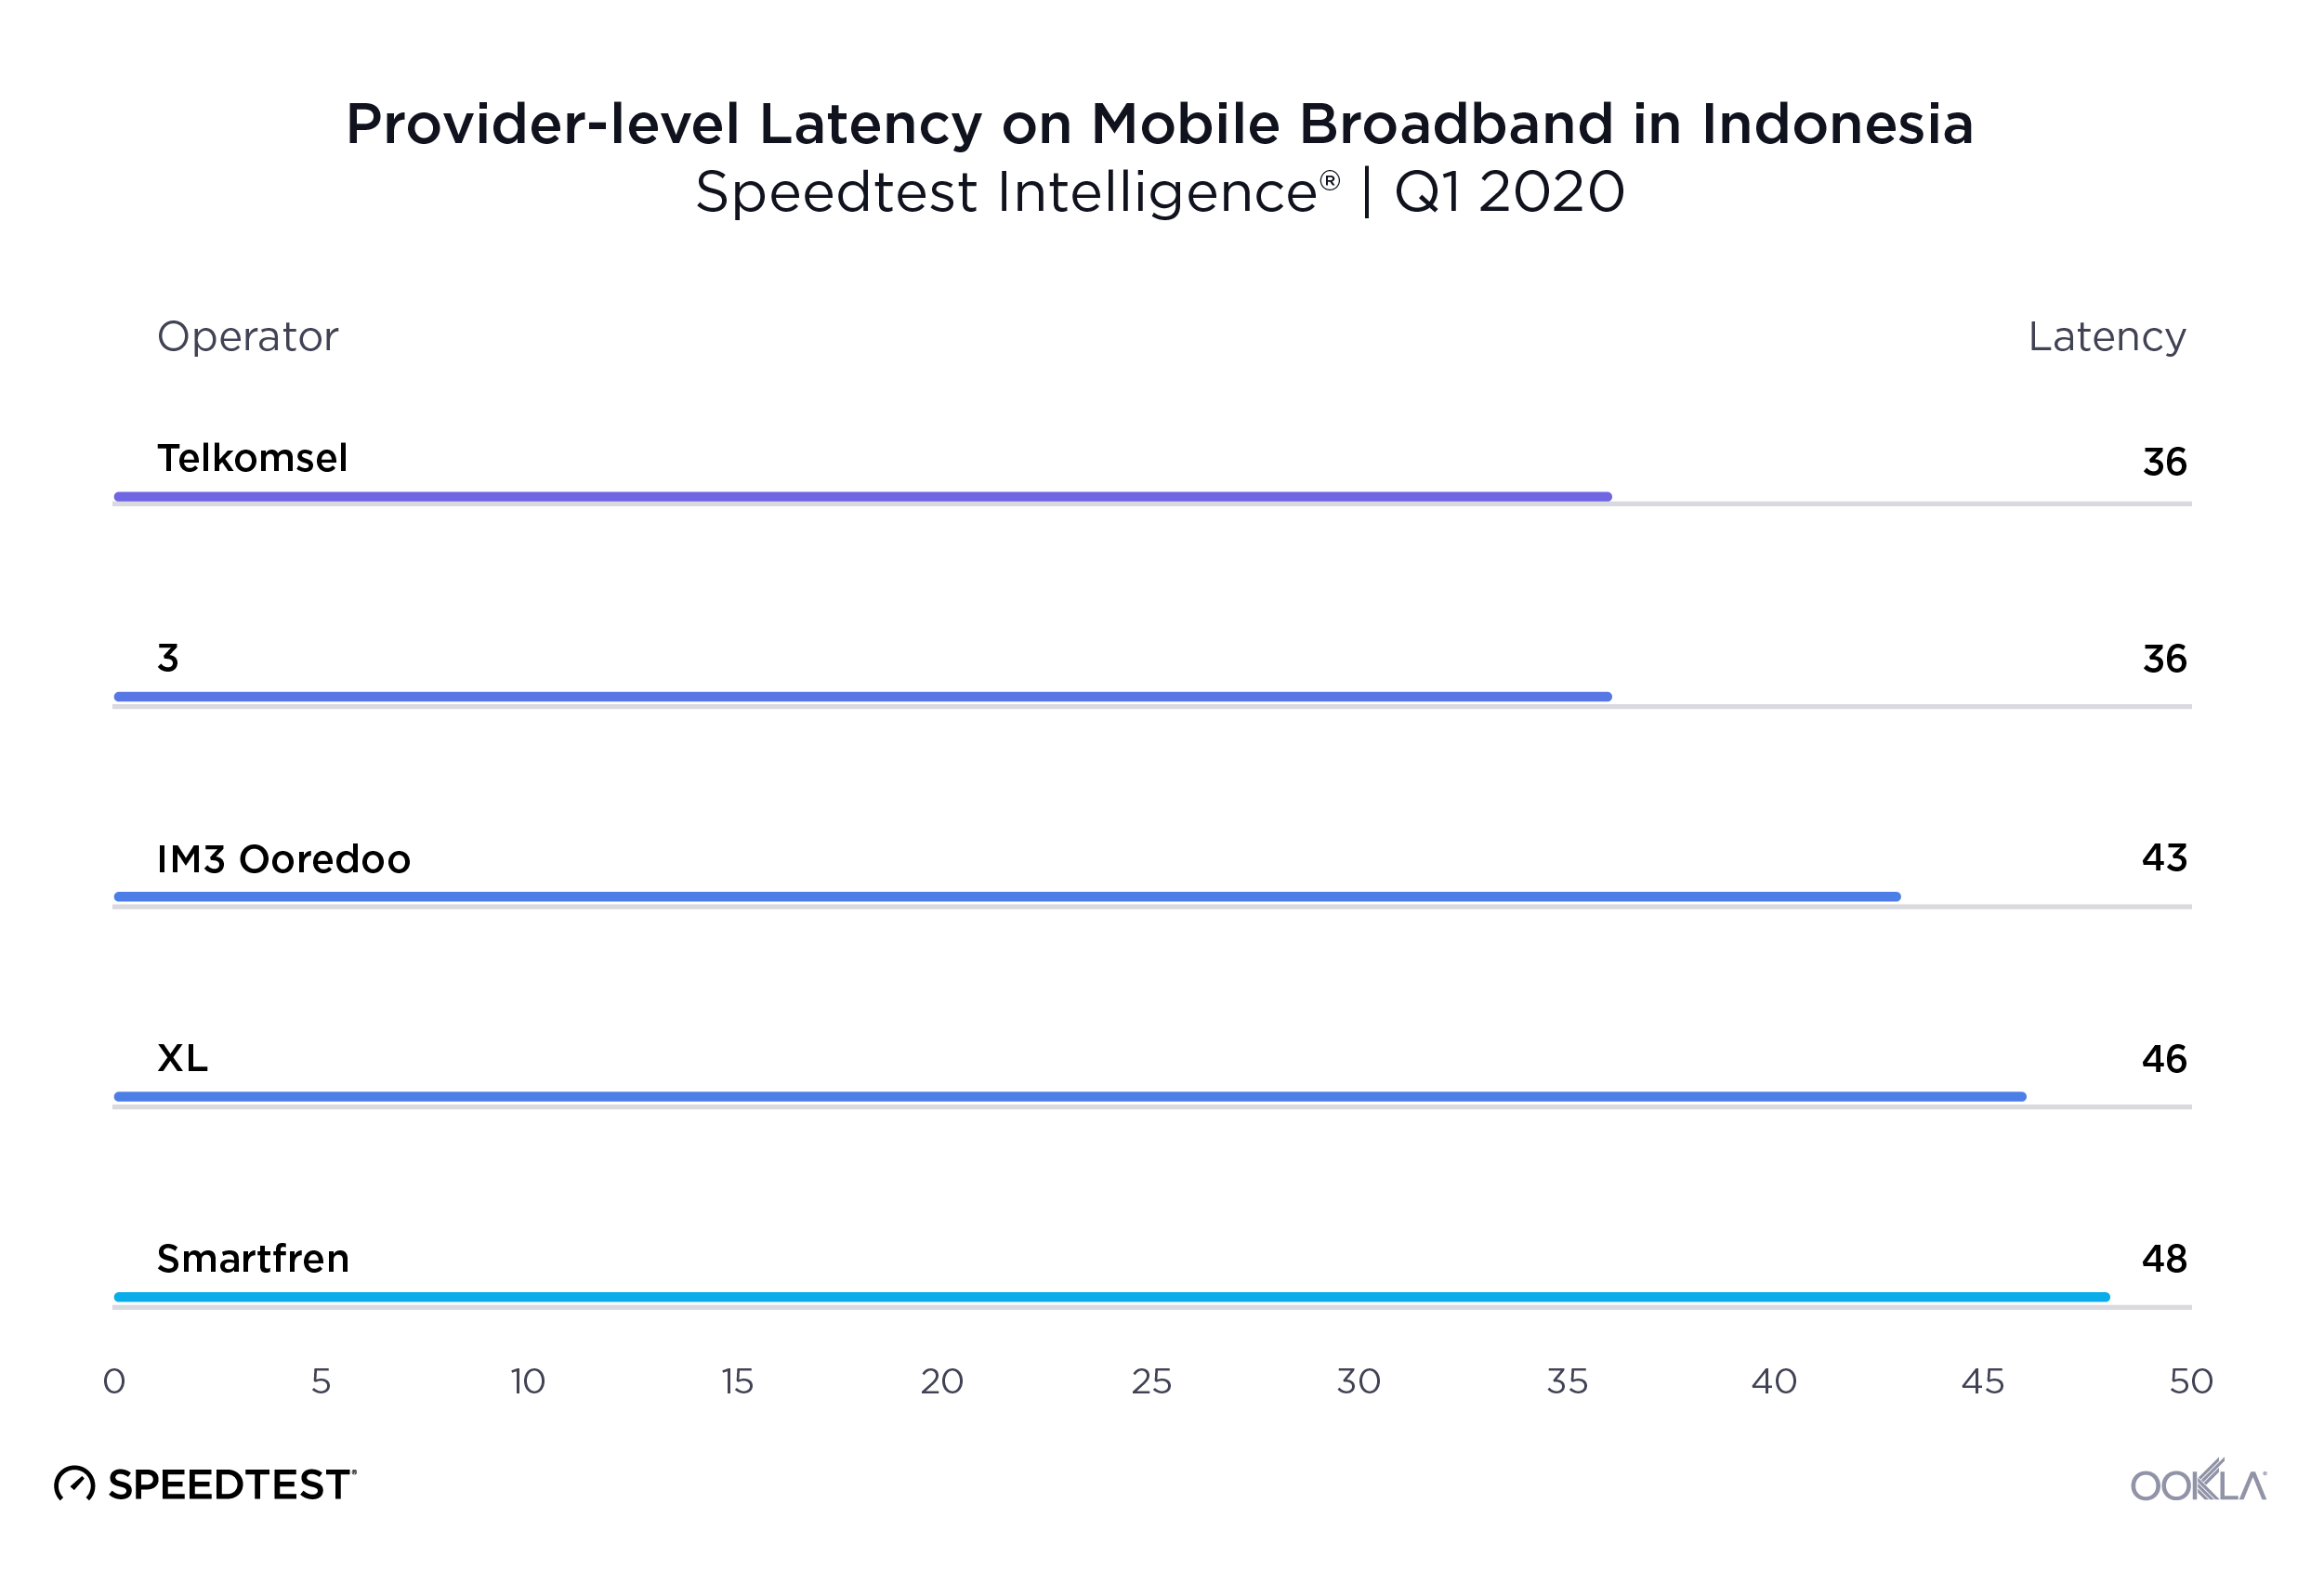
Telkomsel and 3 had the lowest latency on mobile at 36 ms. Mean mobile latency on IM3 Ooredoo, XL and Smartfren ranged between 36 ms and 48 ms during this period.
ookla_Indonesia_mobile_provider_latency_chart_0720_en

Internet performance stayed consistent during the pandemic

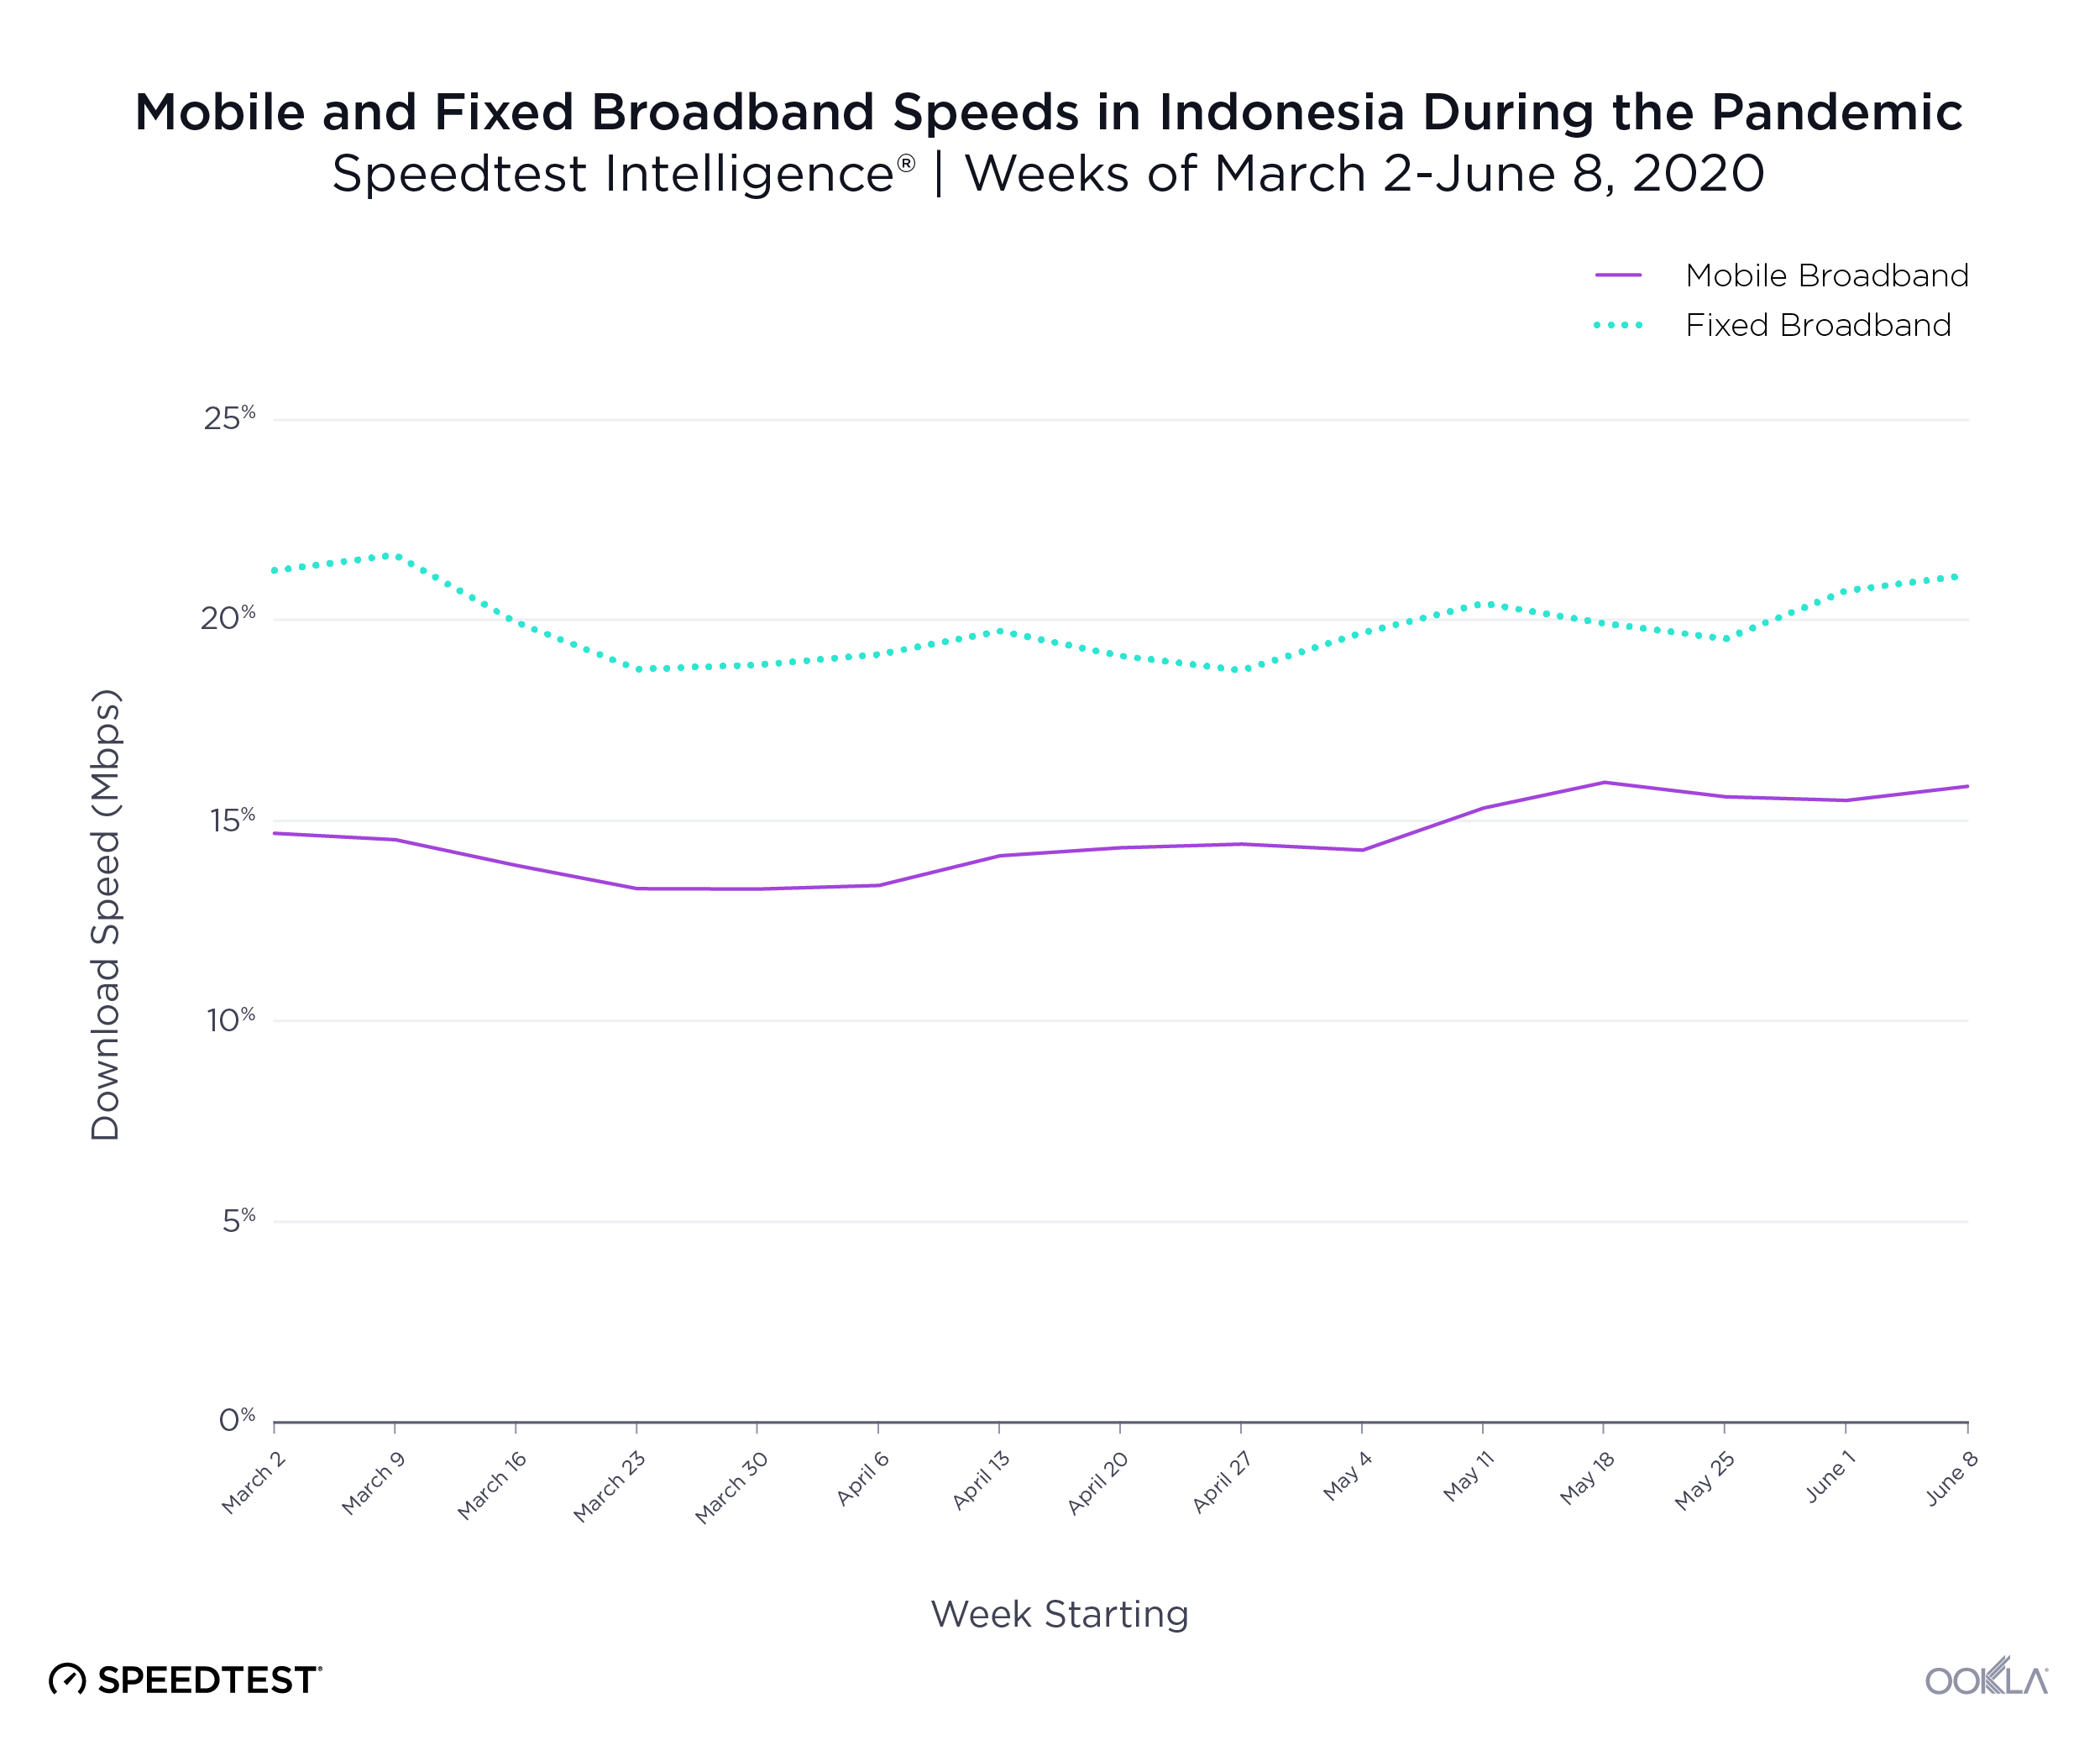
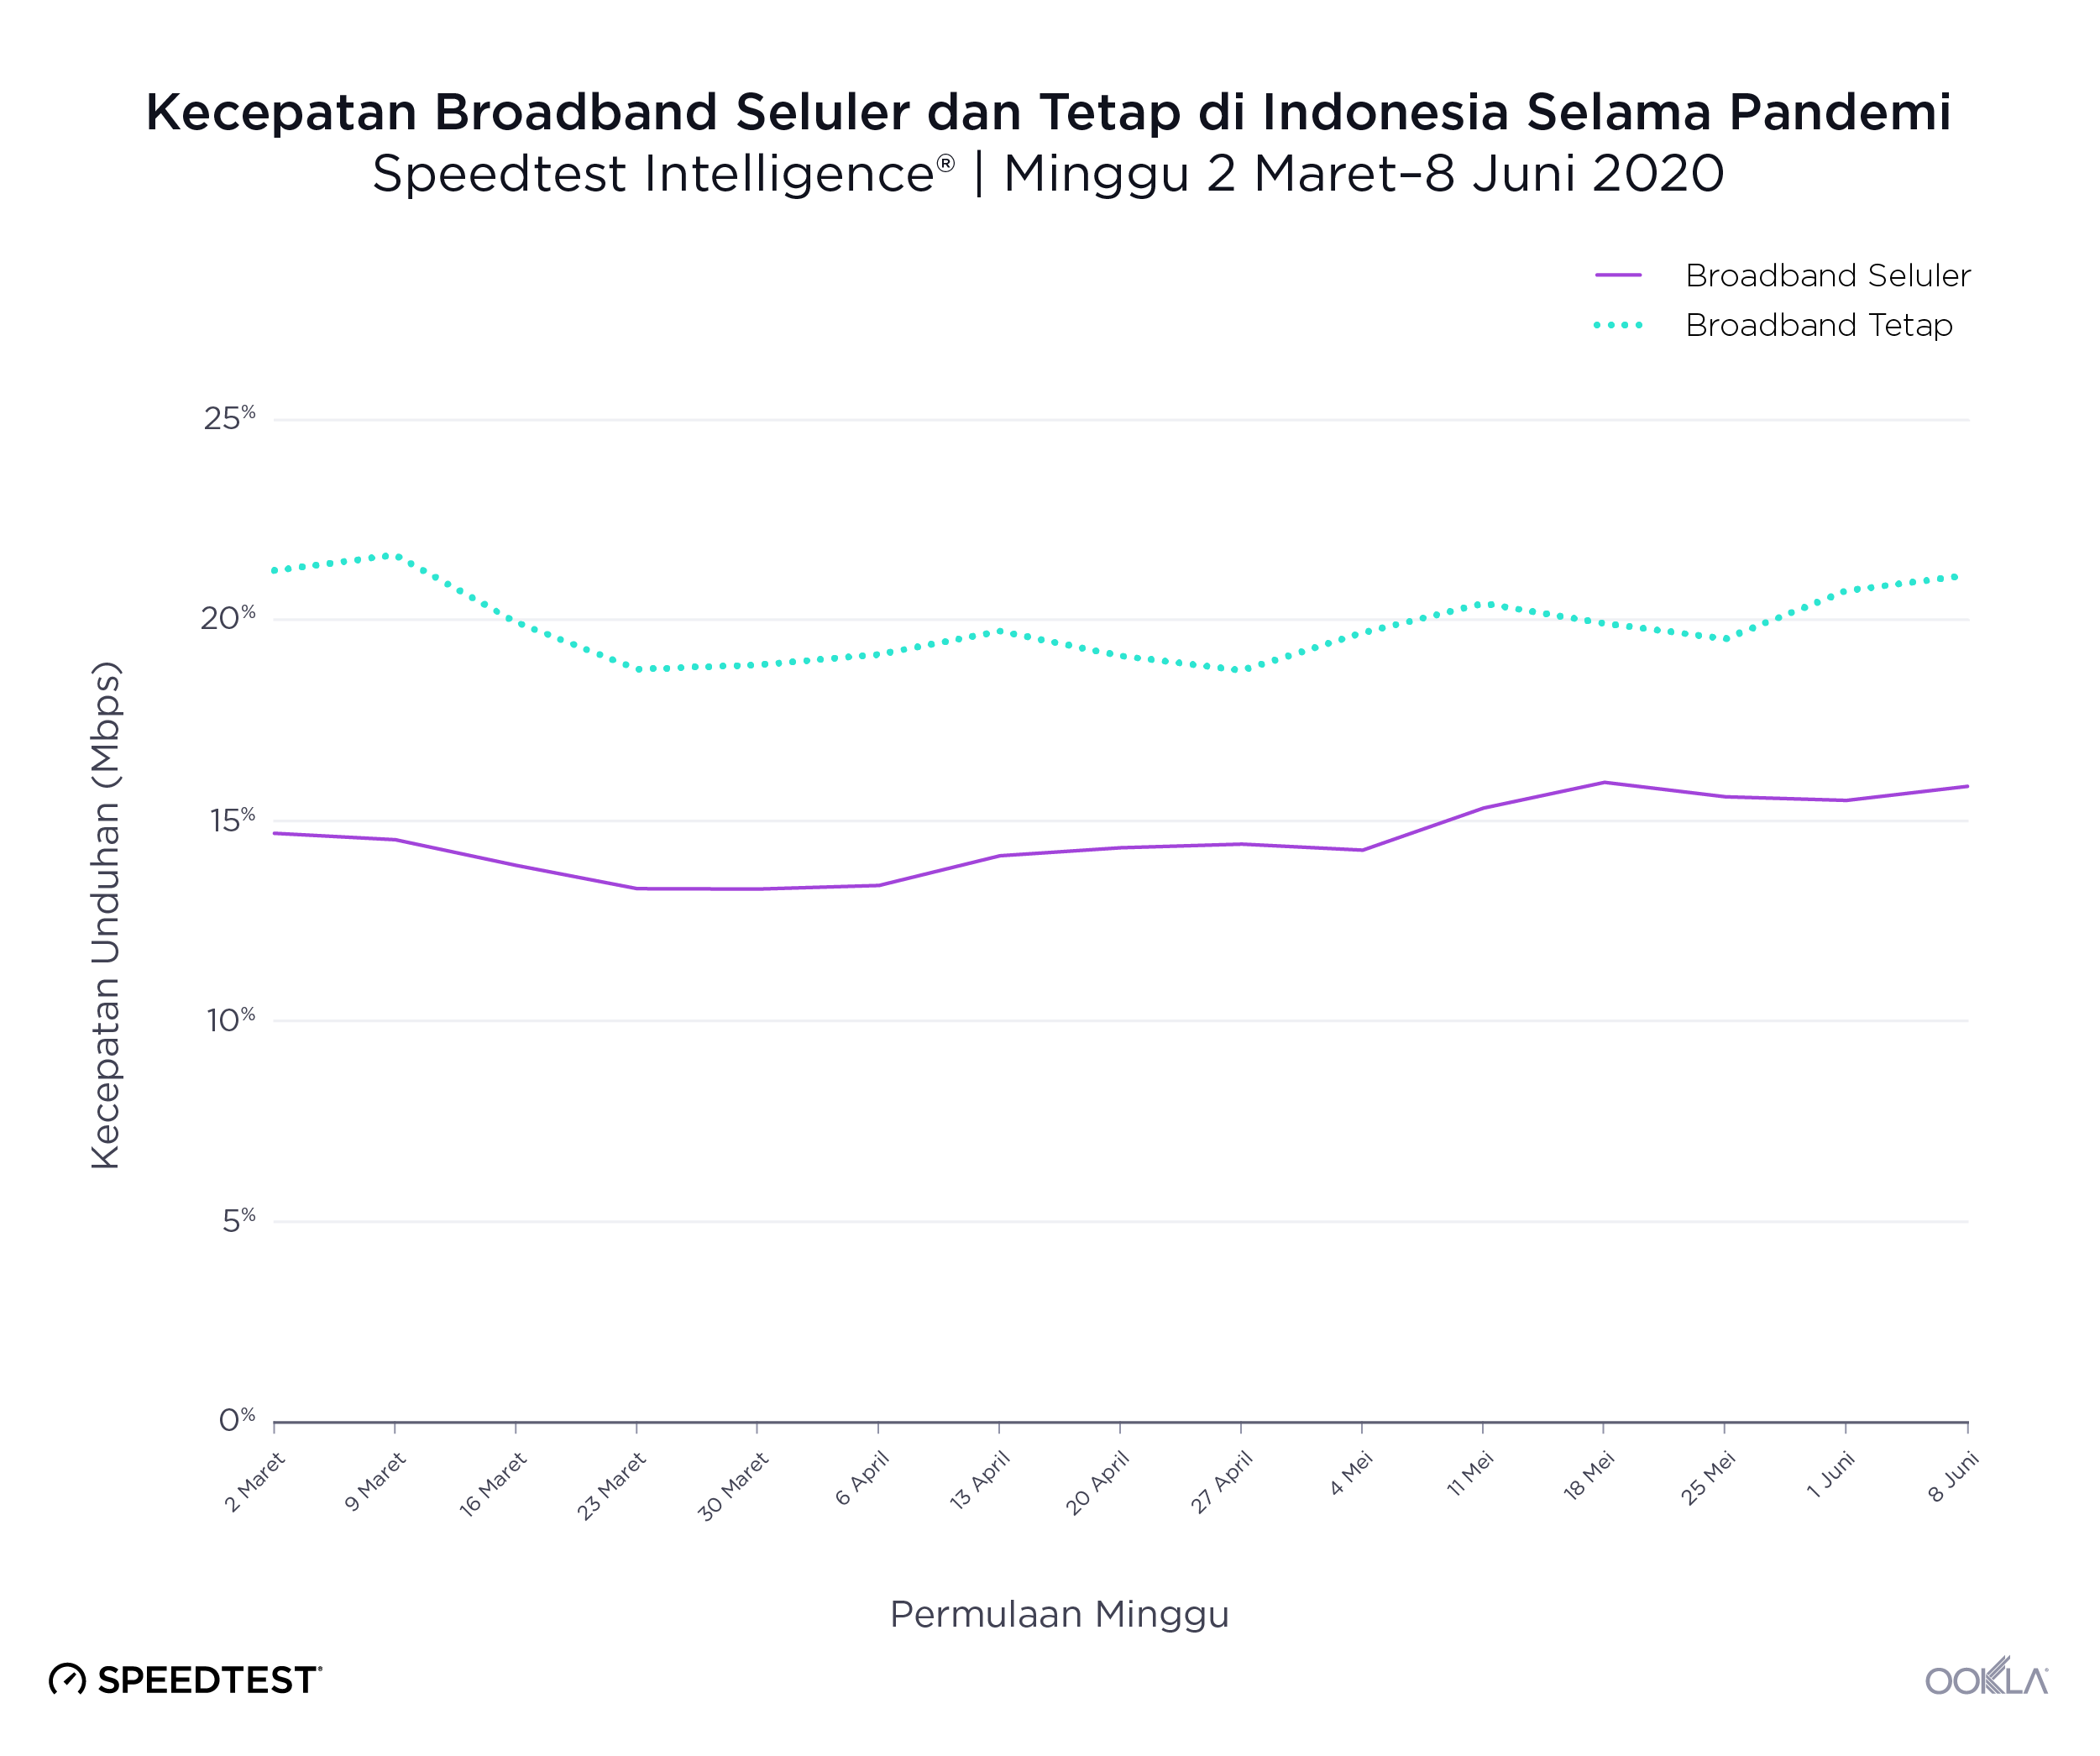
Internet speed also matters when gaming. We’ve been using data from Speedtest Intelligence® to track internet speeds at a global level during the pandemic, and Indonesia’s mobile and fixed broadband speeds have largely been consistent with pre-pandemic performance.
ookla_Indonesia_performance_0620

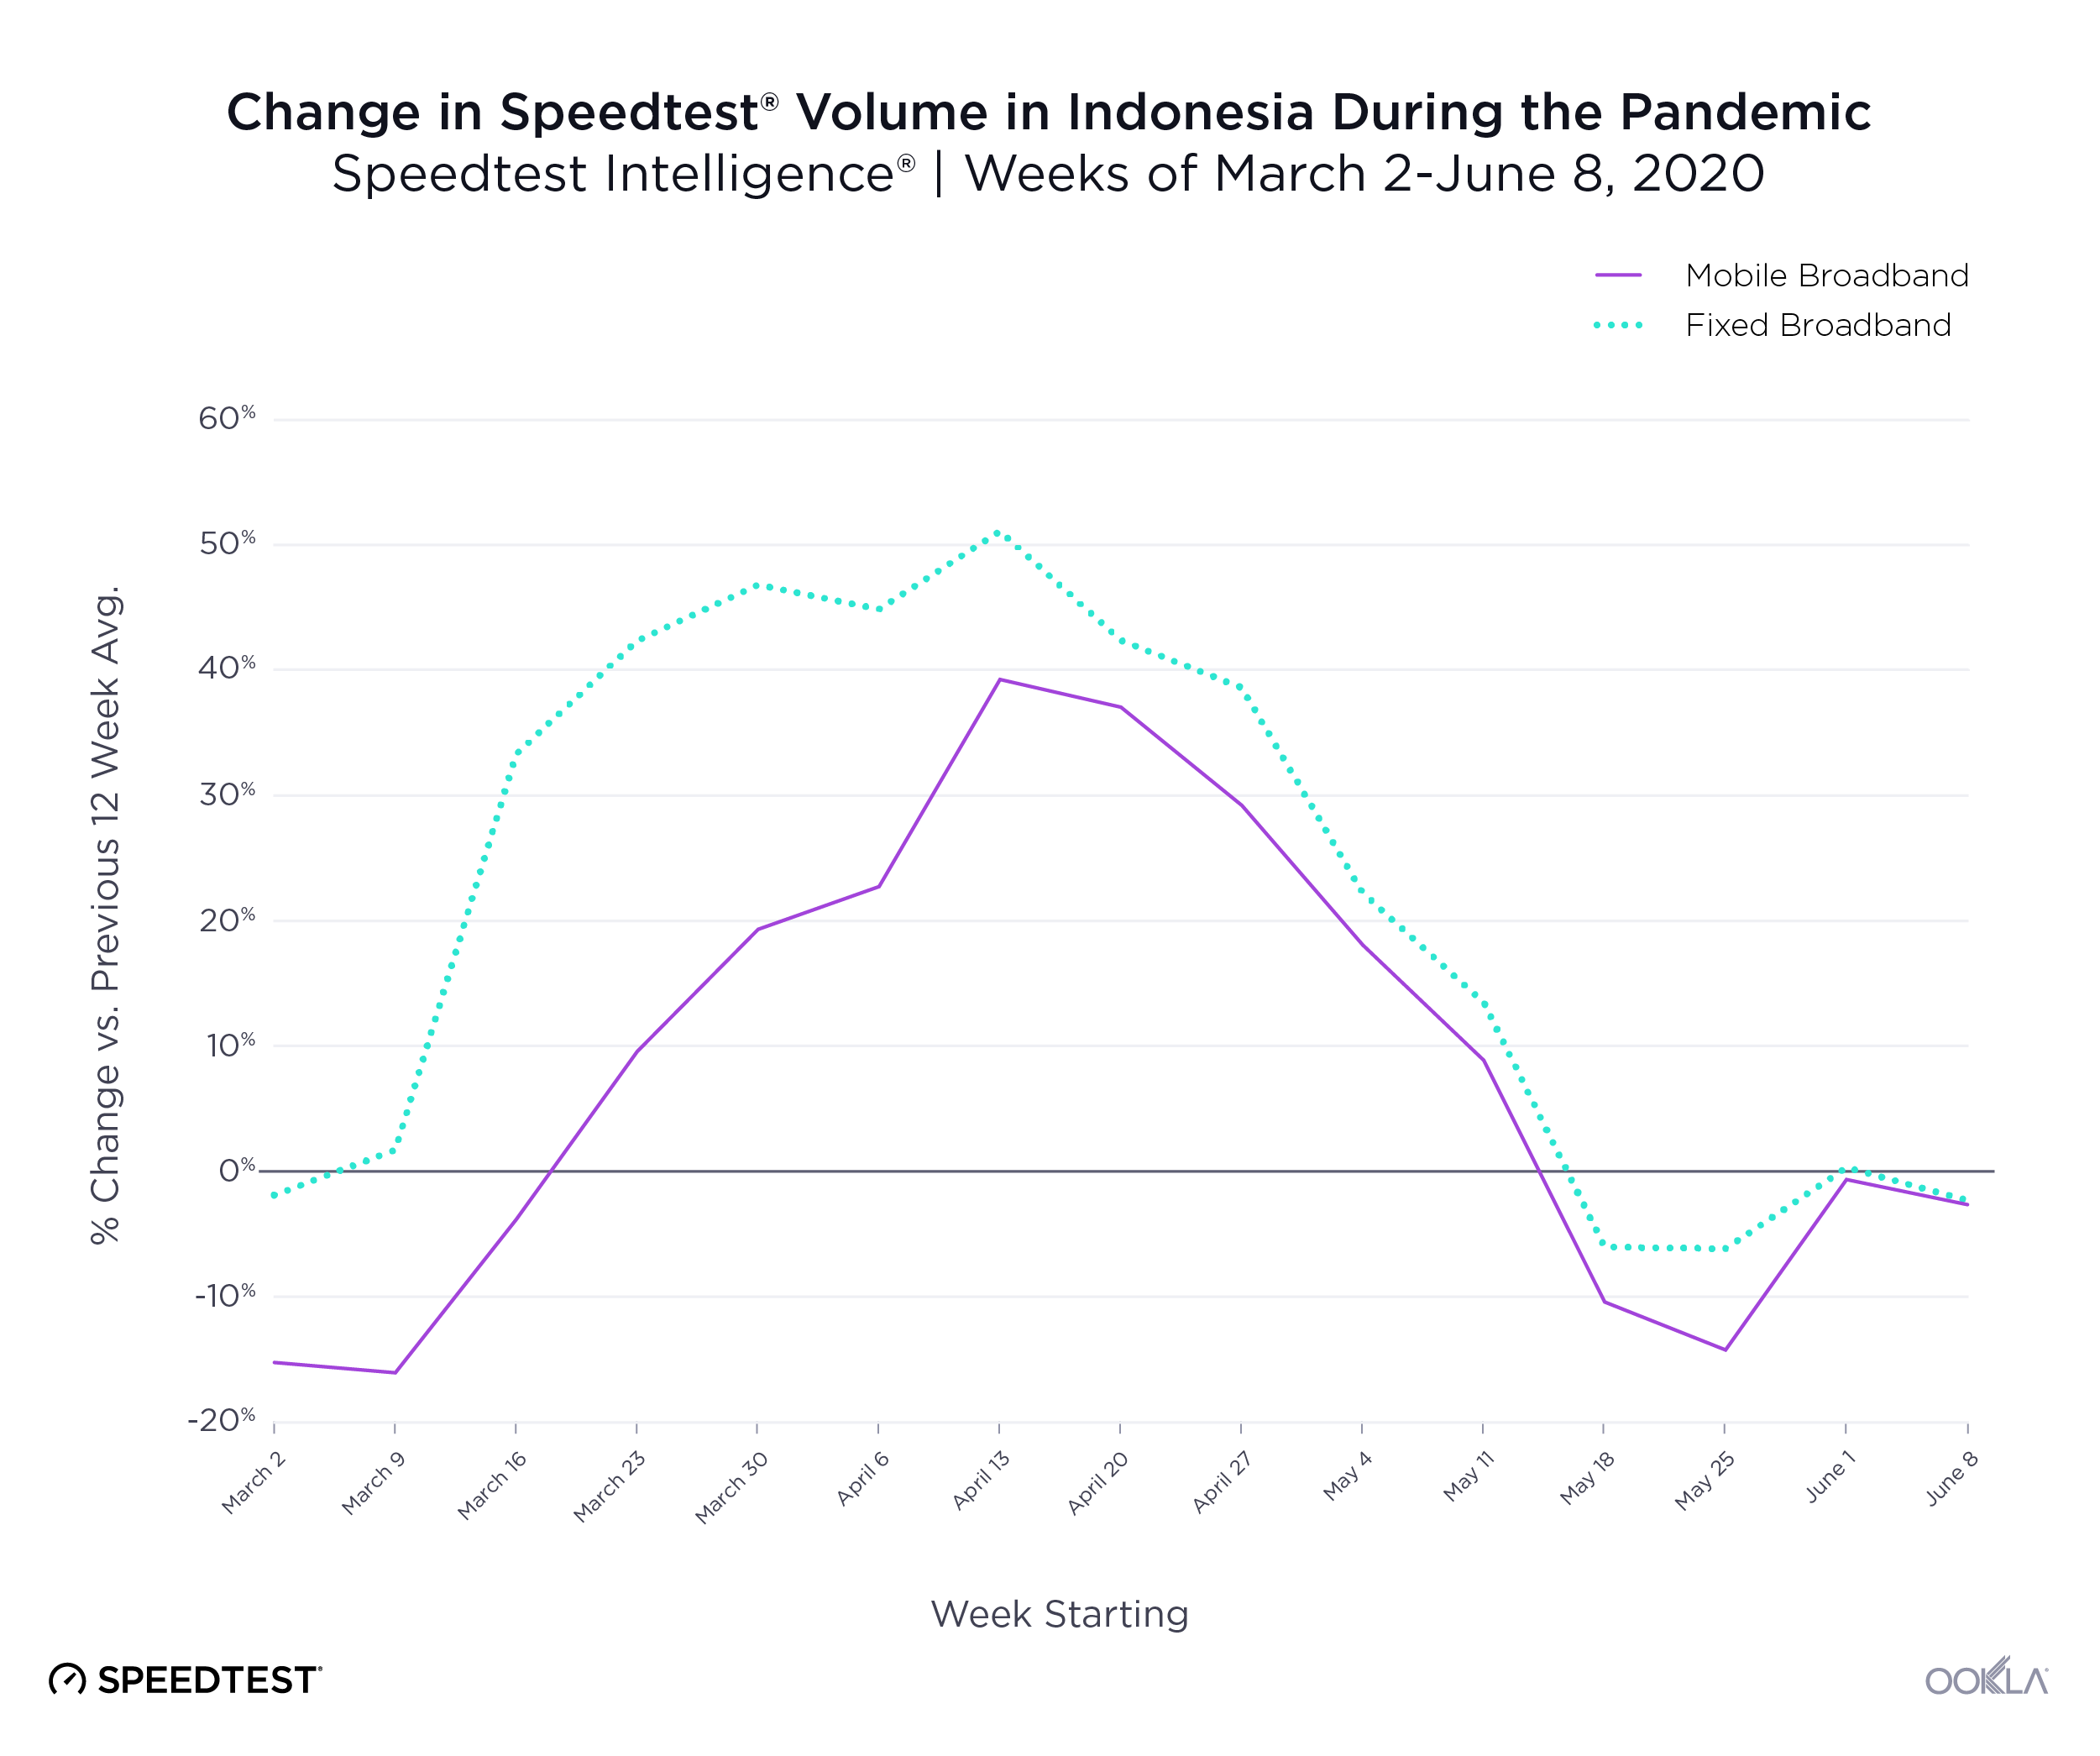
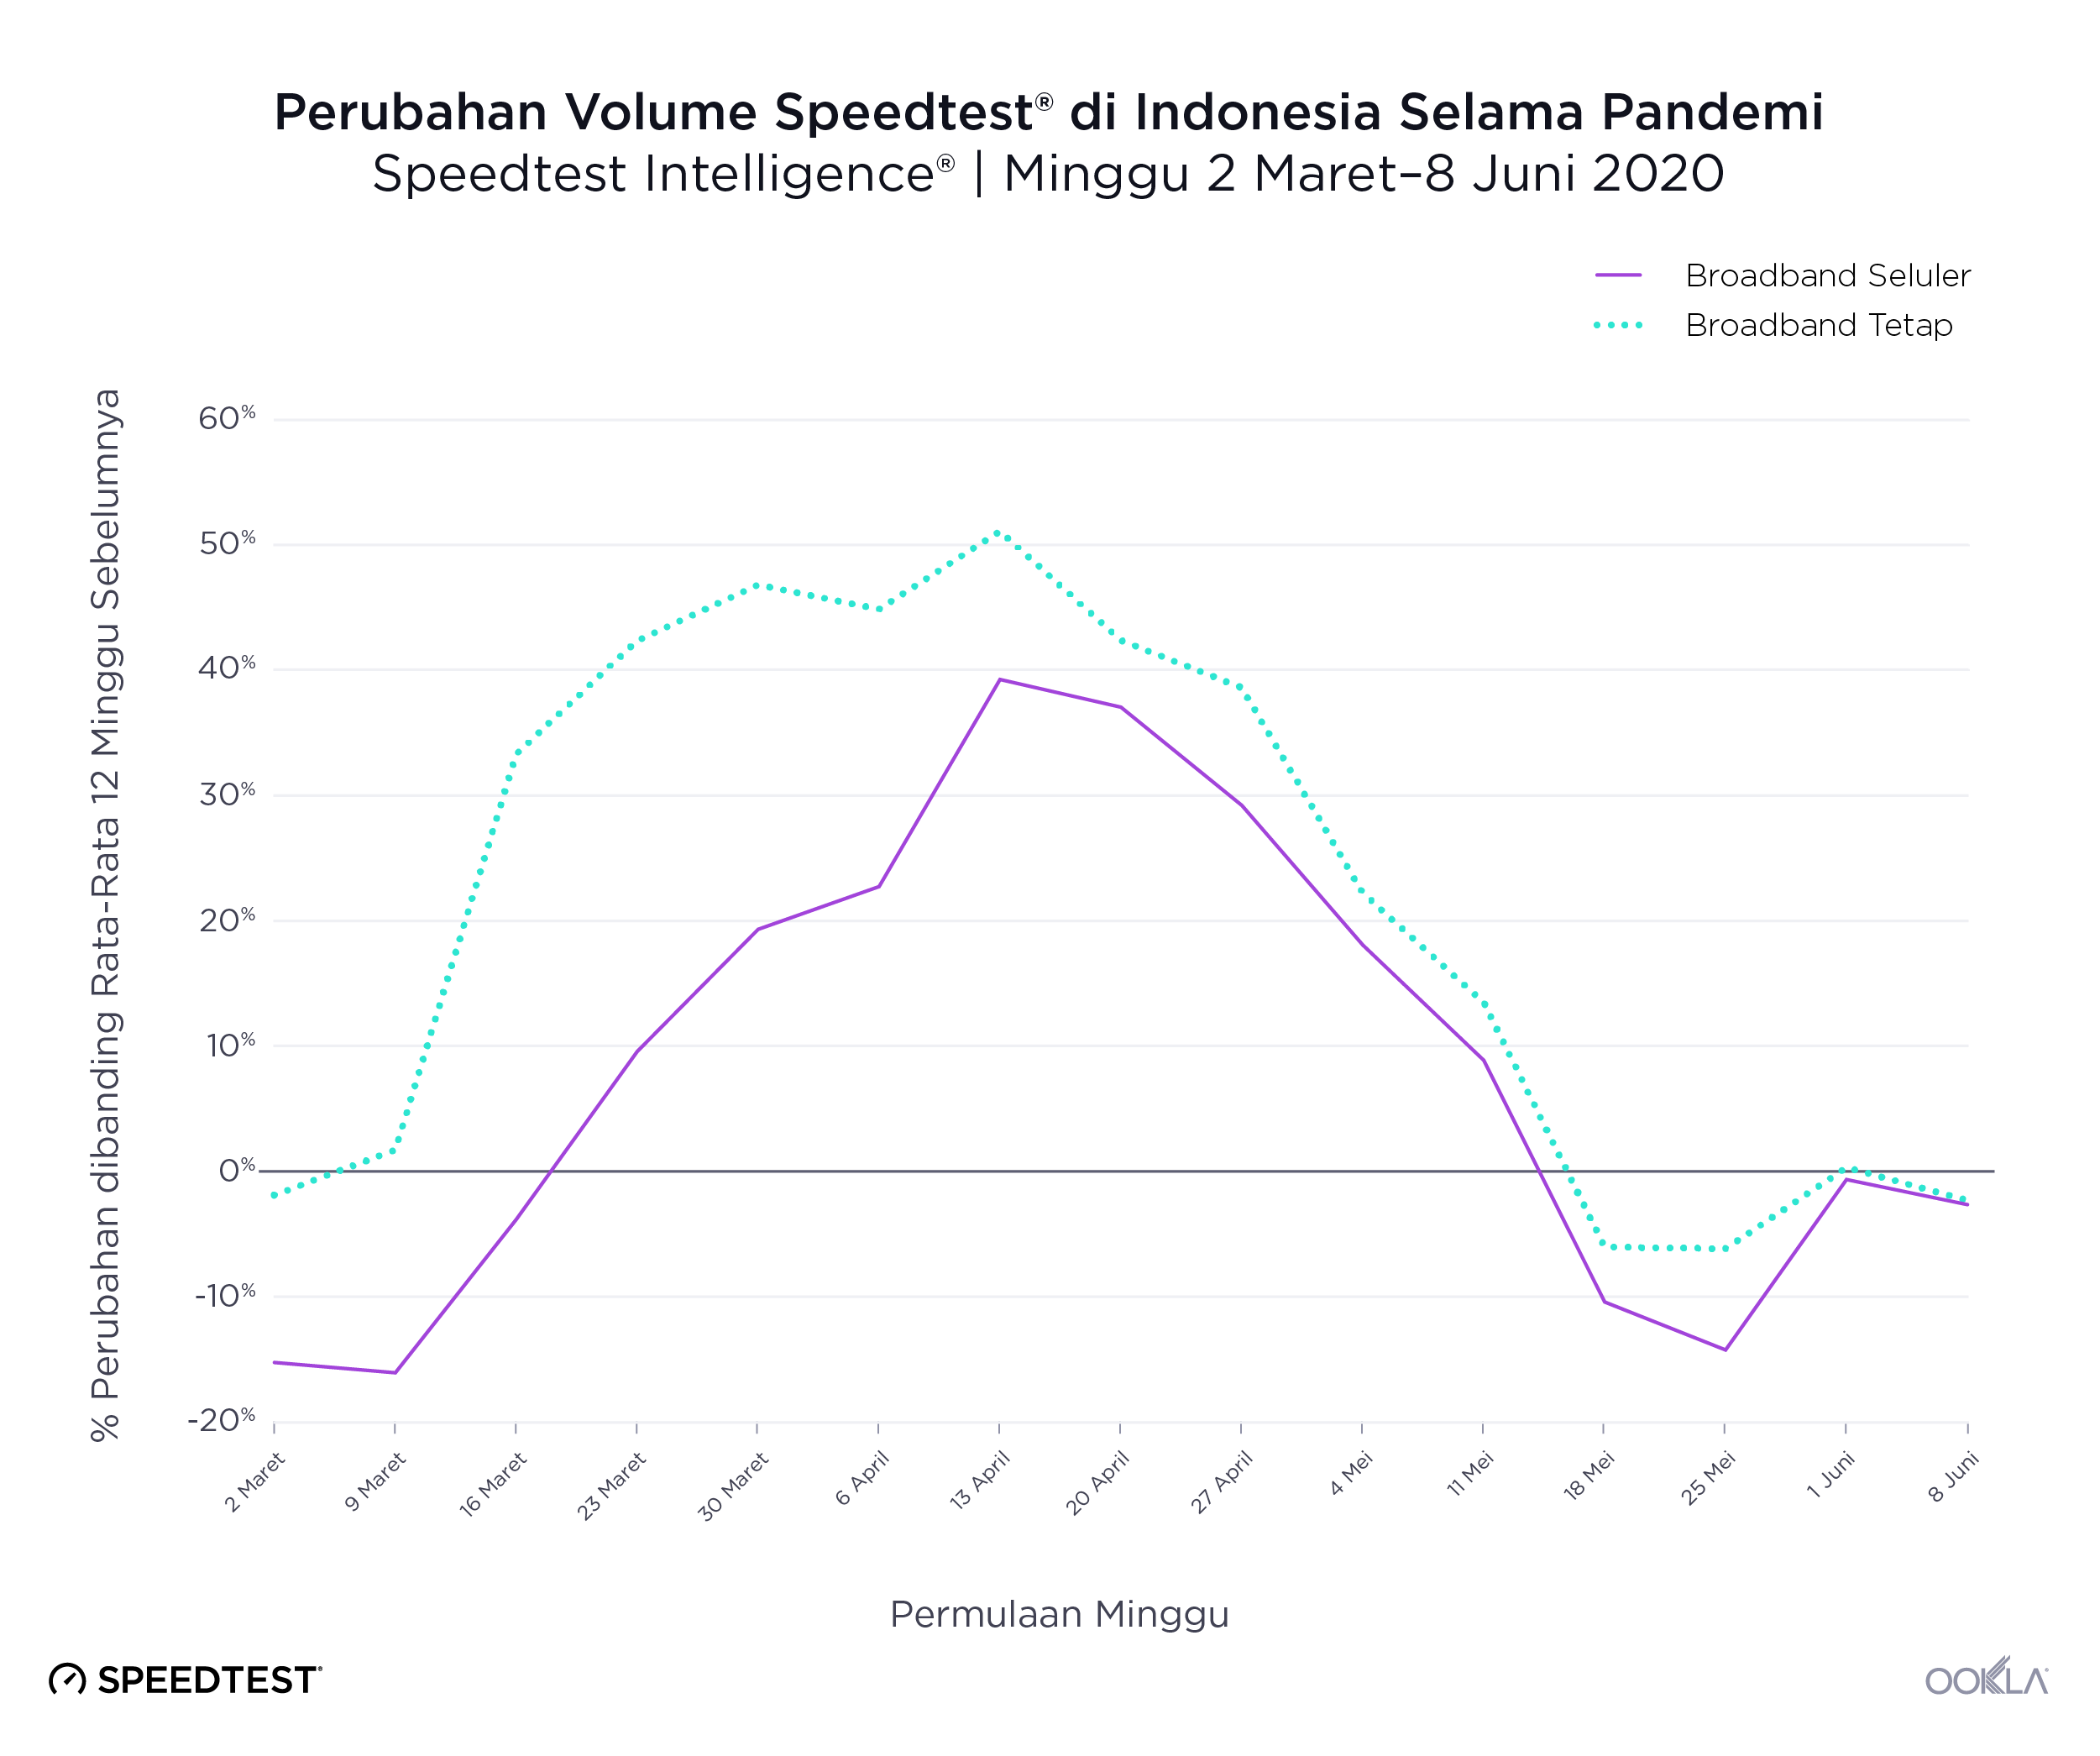
The volume of users taking a Speedtest increased dramatically on both fixed and mobile between the weeks of March 9 and April 13, 2020 as people adjusted to new internet usage patterns during the pandemic. Test volume started decreasing after the week of April 13.
ookla_Indonesia_volume_change_0620

Bandung had lowest latency on fixed broadband, Bekasi on mobile

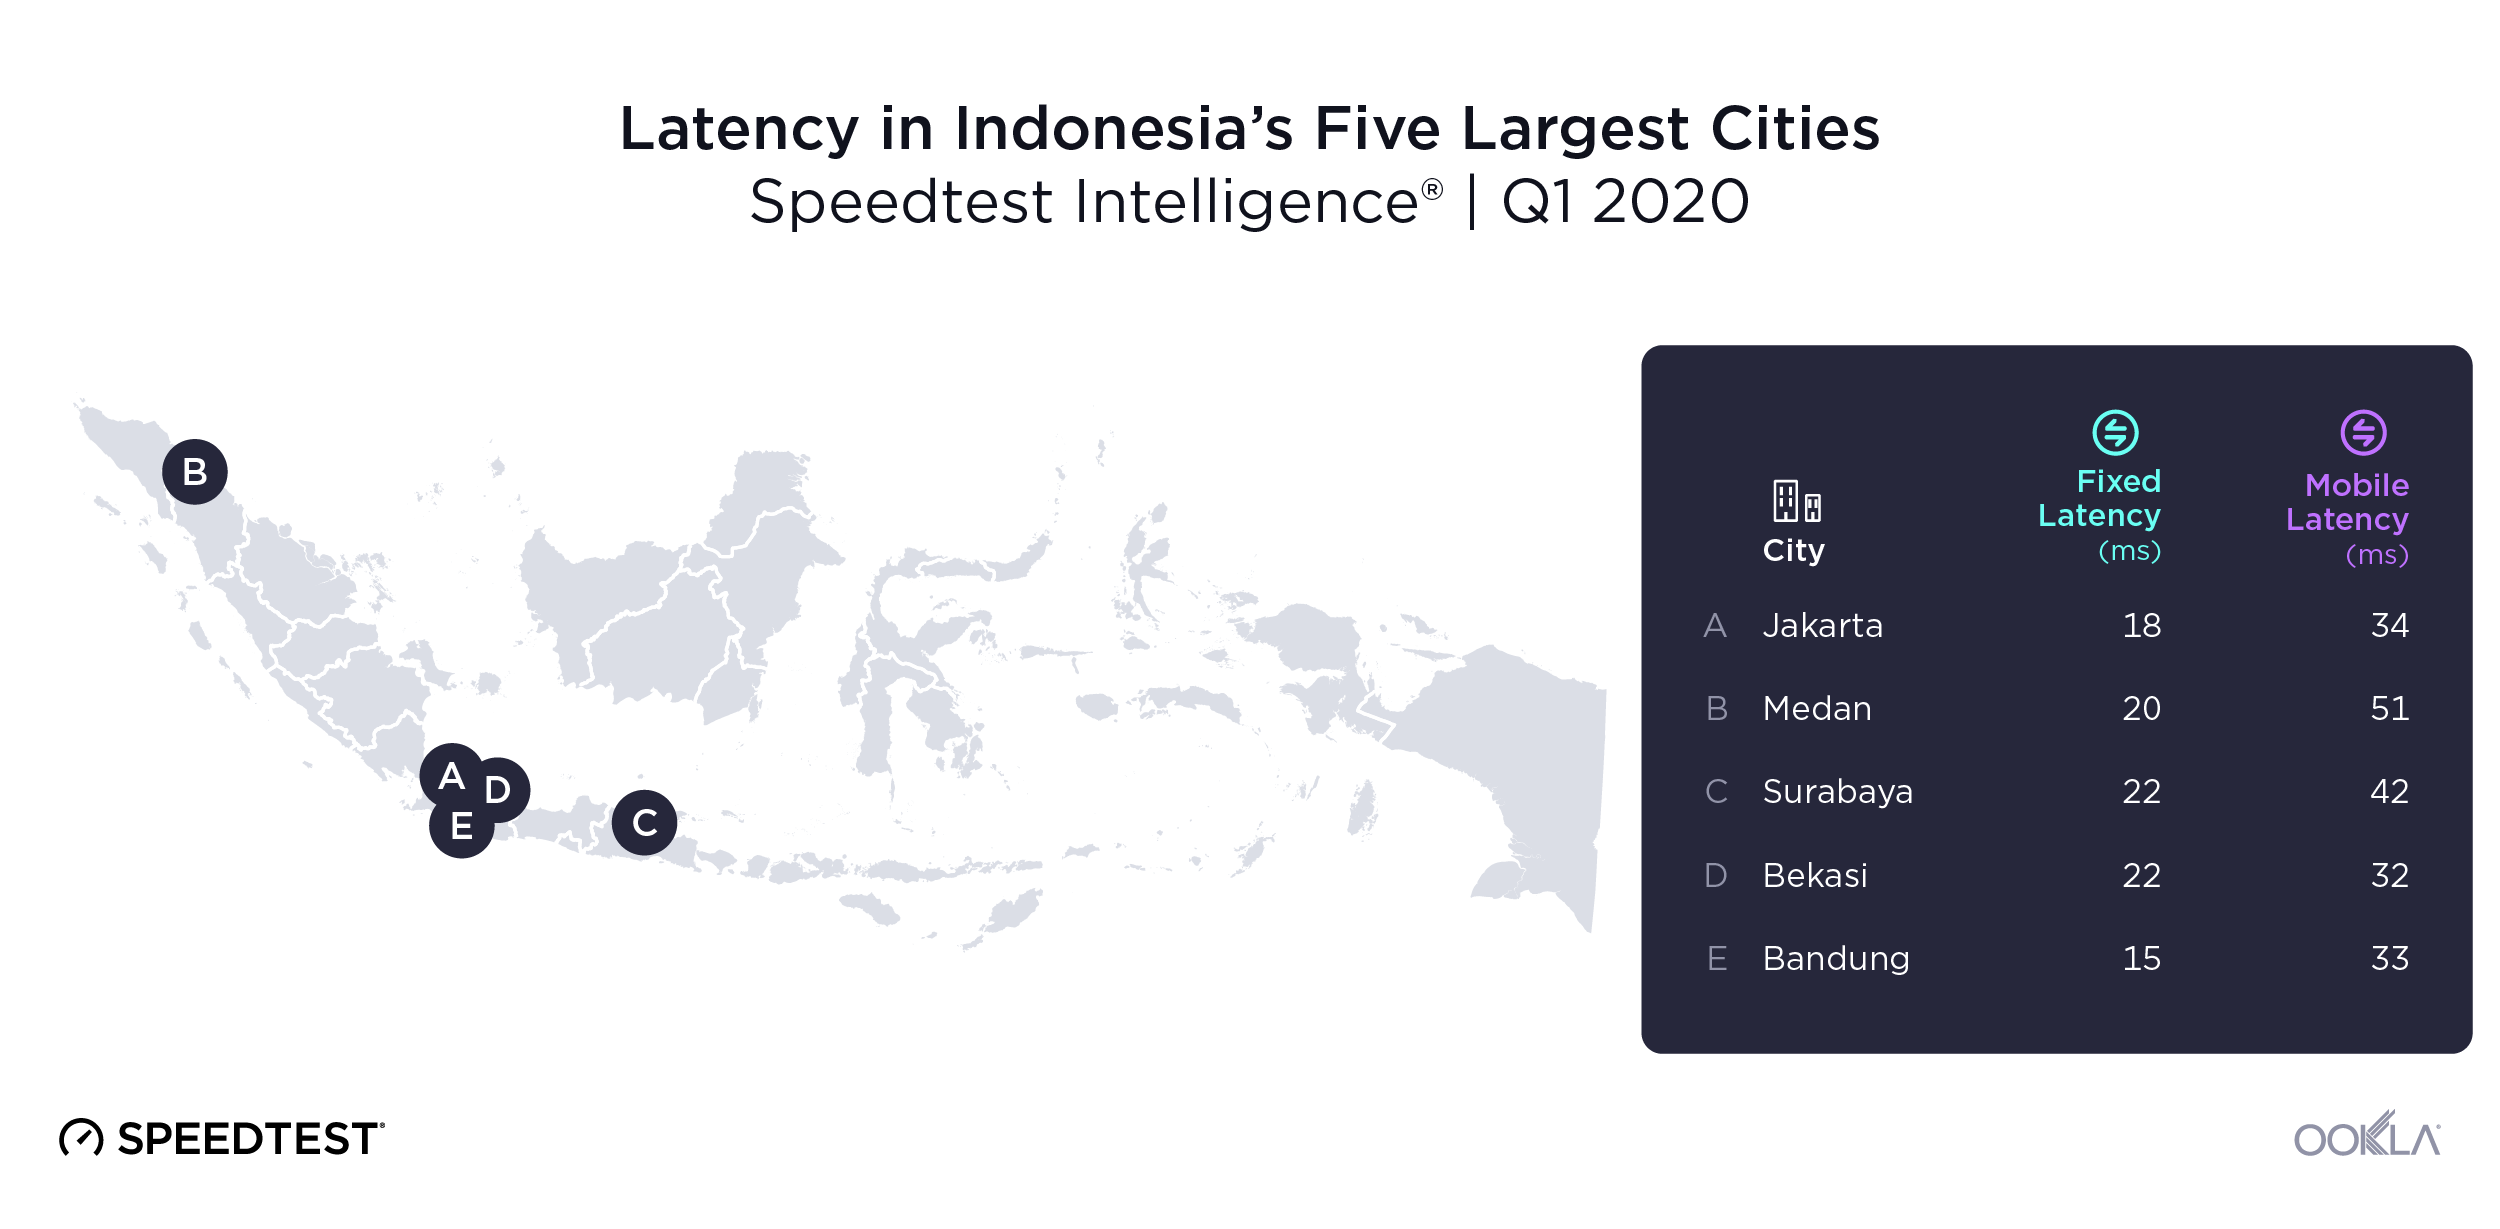
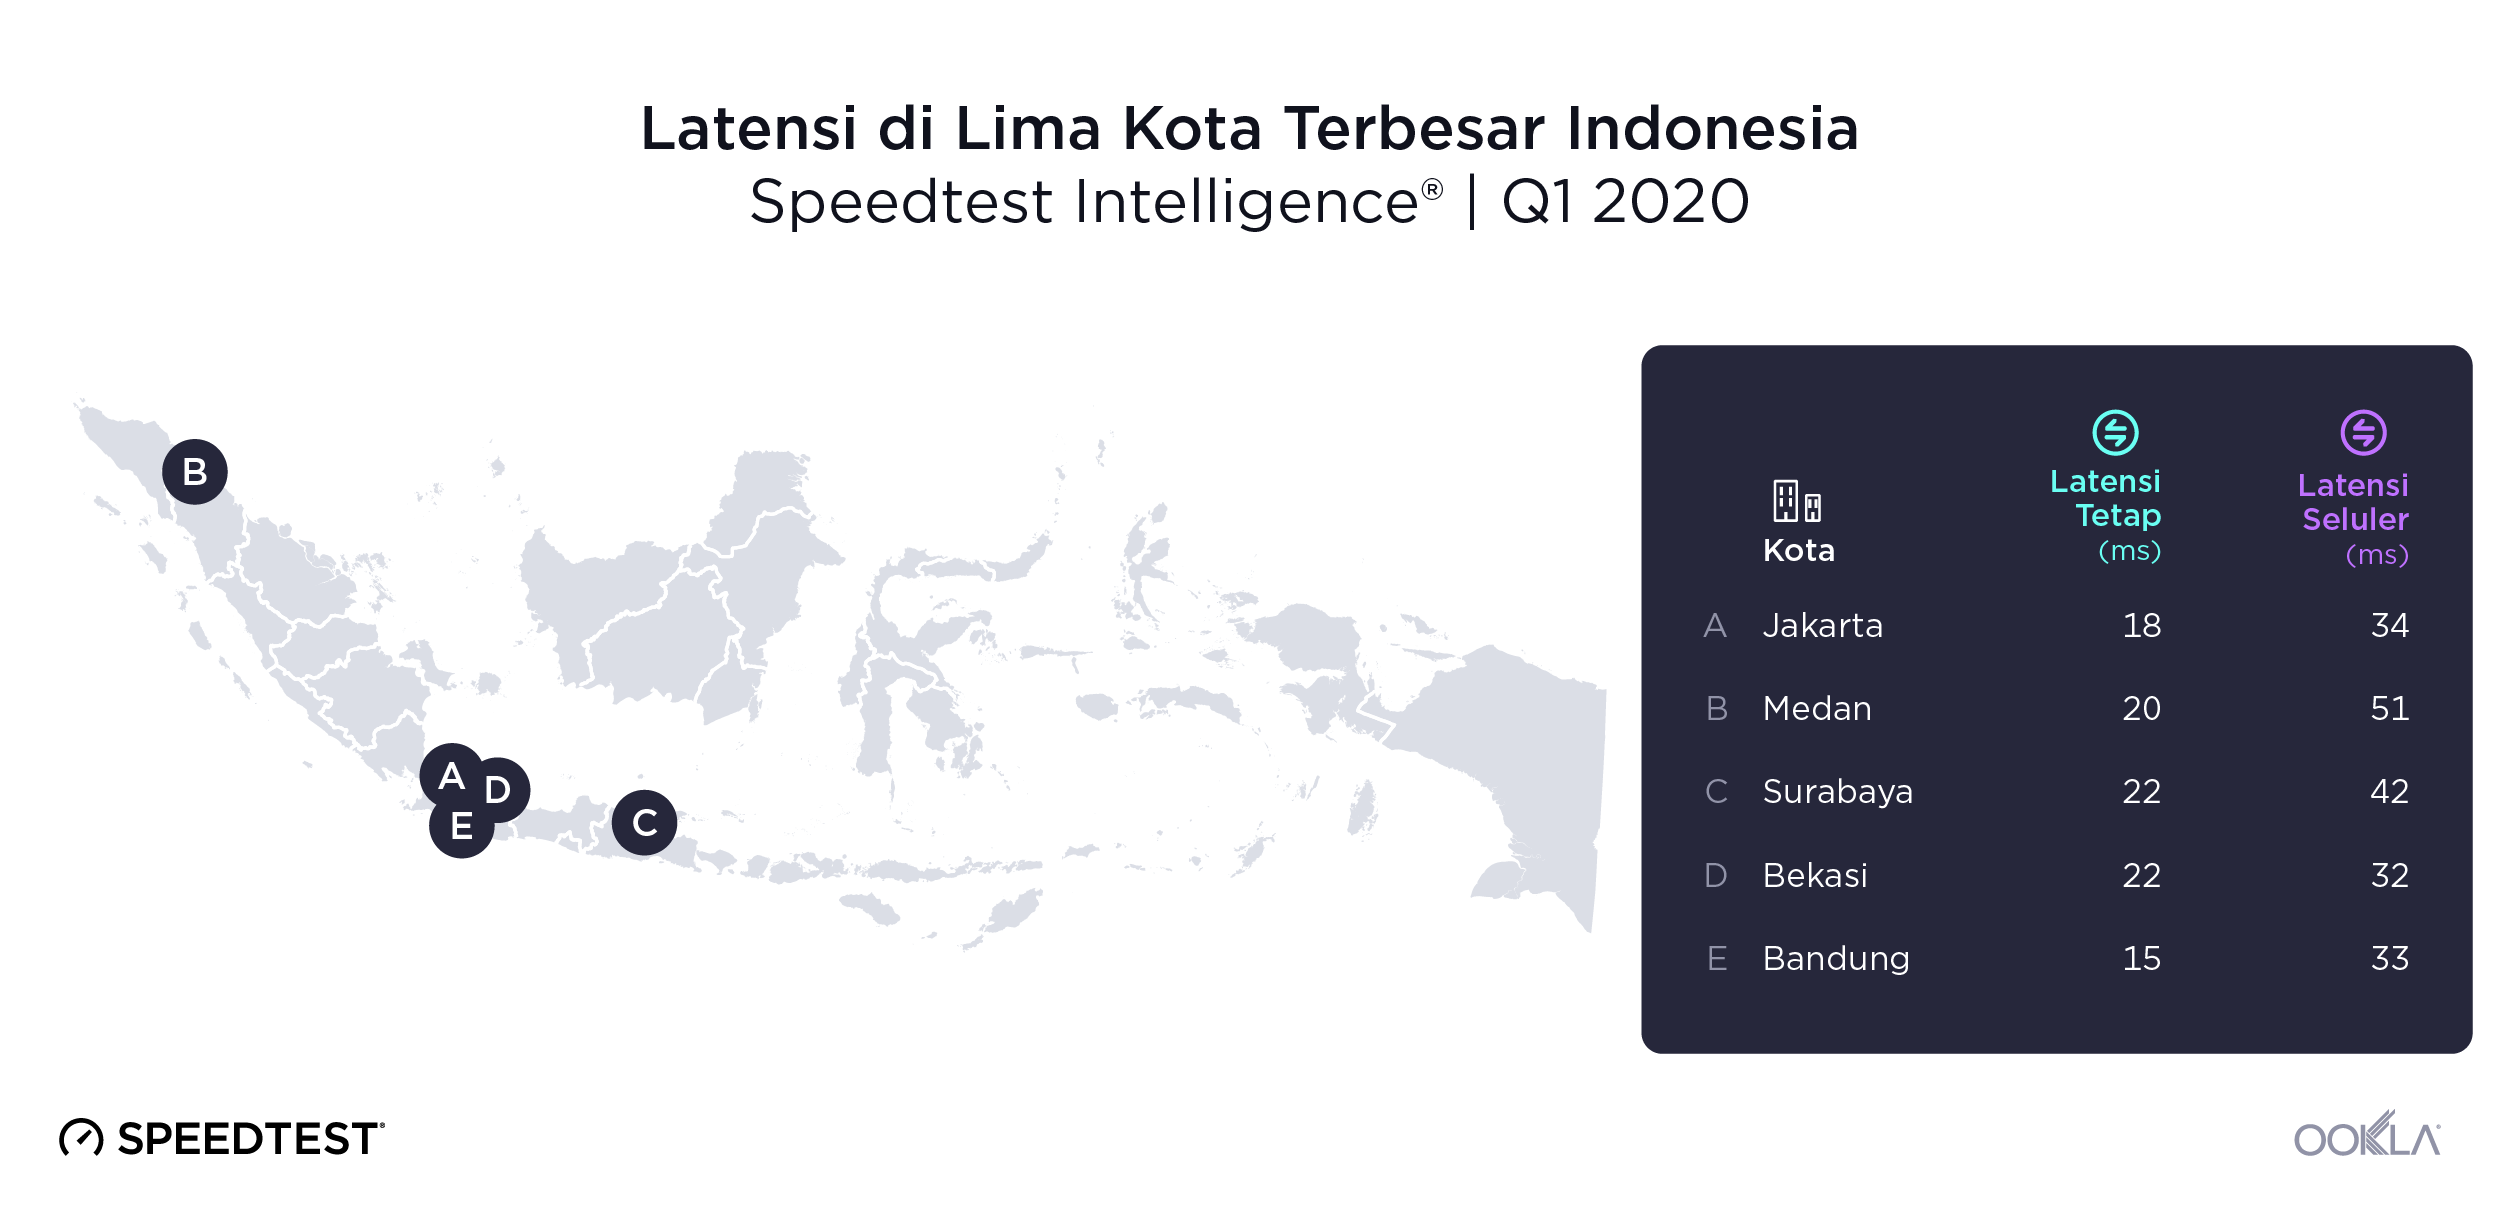
Looking at fixed and mobile latency in the five largest cities in Indonesia during Q1 2020, we found slight variation in fixed broadband latency and a wider spread on mobile.
Ookla_Indonesia_cities_latency_0620

Bandung, a city in West Java, showed the lowest fixed broadband latency of the group at 15 ms during Q1 2020. Surabaya and Bekasi had the highest latency at 22 ms. The biggest improvement on fixed broadband latency was seen in Medan, which showed a decrease in fixed broadband latency from 32 ms in Q1 2019 to 20 ms in Q1 2020.

The city of Bekasi, located west of Jakarta, had the lowest mobile latency at 32 ms during Q1 2020, followed closely by Bandung.

We saw significant improvements on mobile latency in all five cities when comparing Q1 2019 to Q1 2020. Most notably, mobile latency in Medan improved from 72 ms in Q1 2019 to 51 ms in Q1 2020.

East and Central Kalimantan had lowest fixed broadband latency

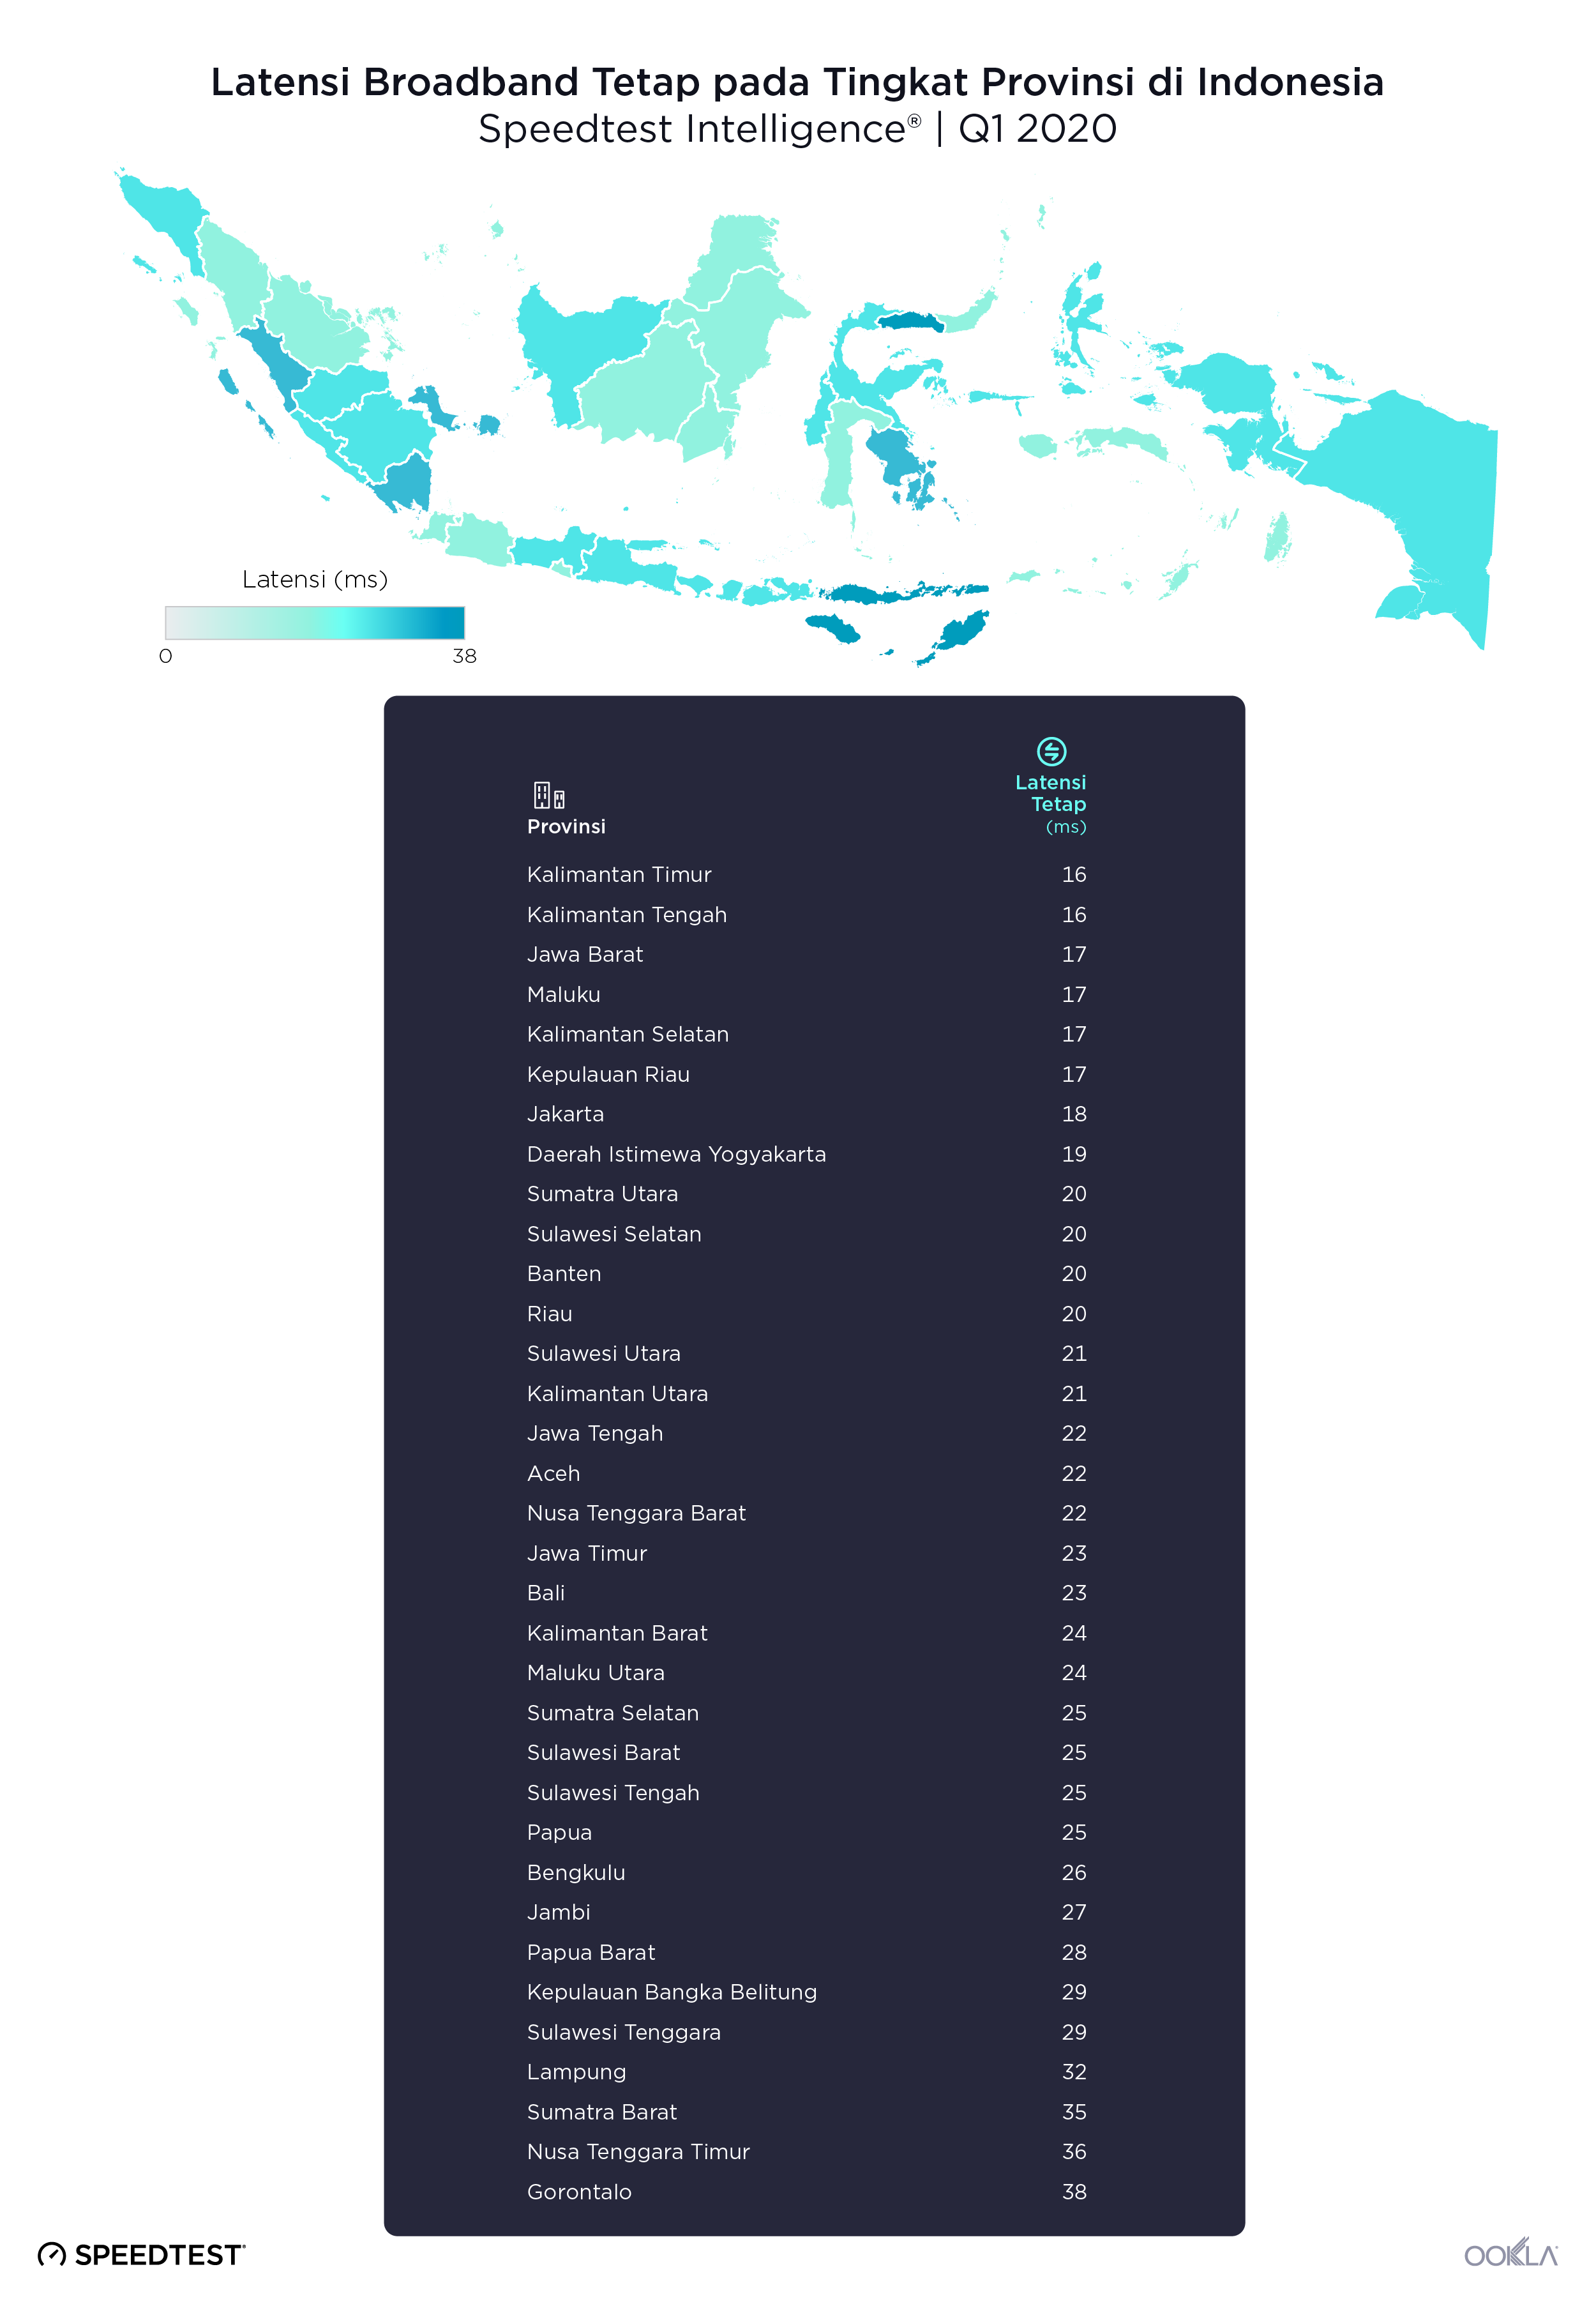
Ookla_Indonesia_province_fixed_latency_0620-2

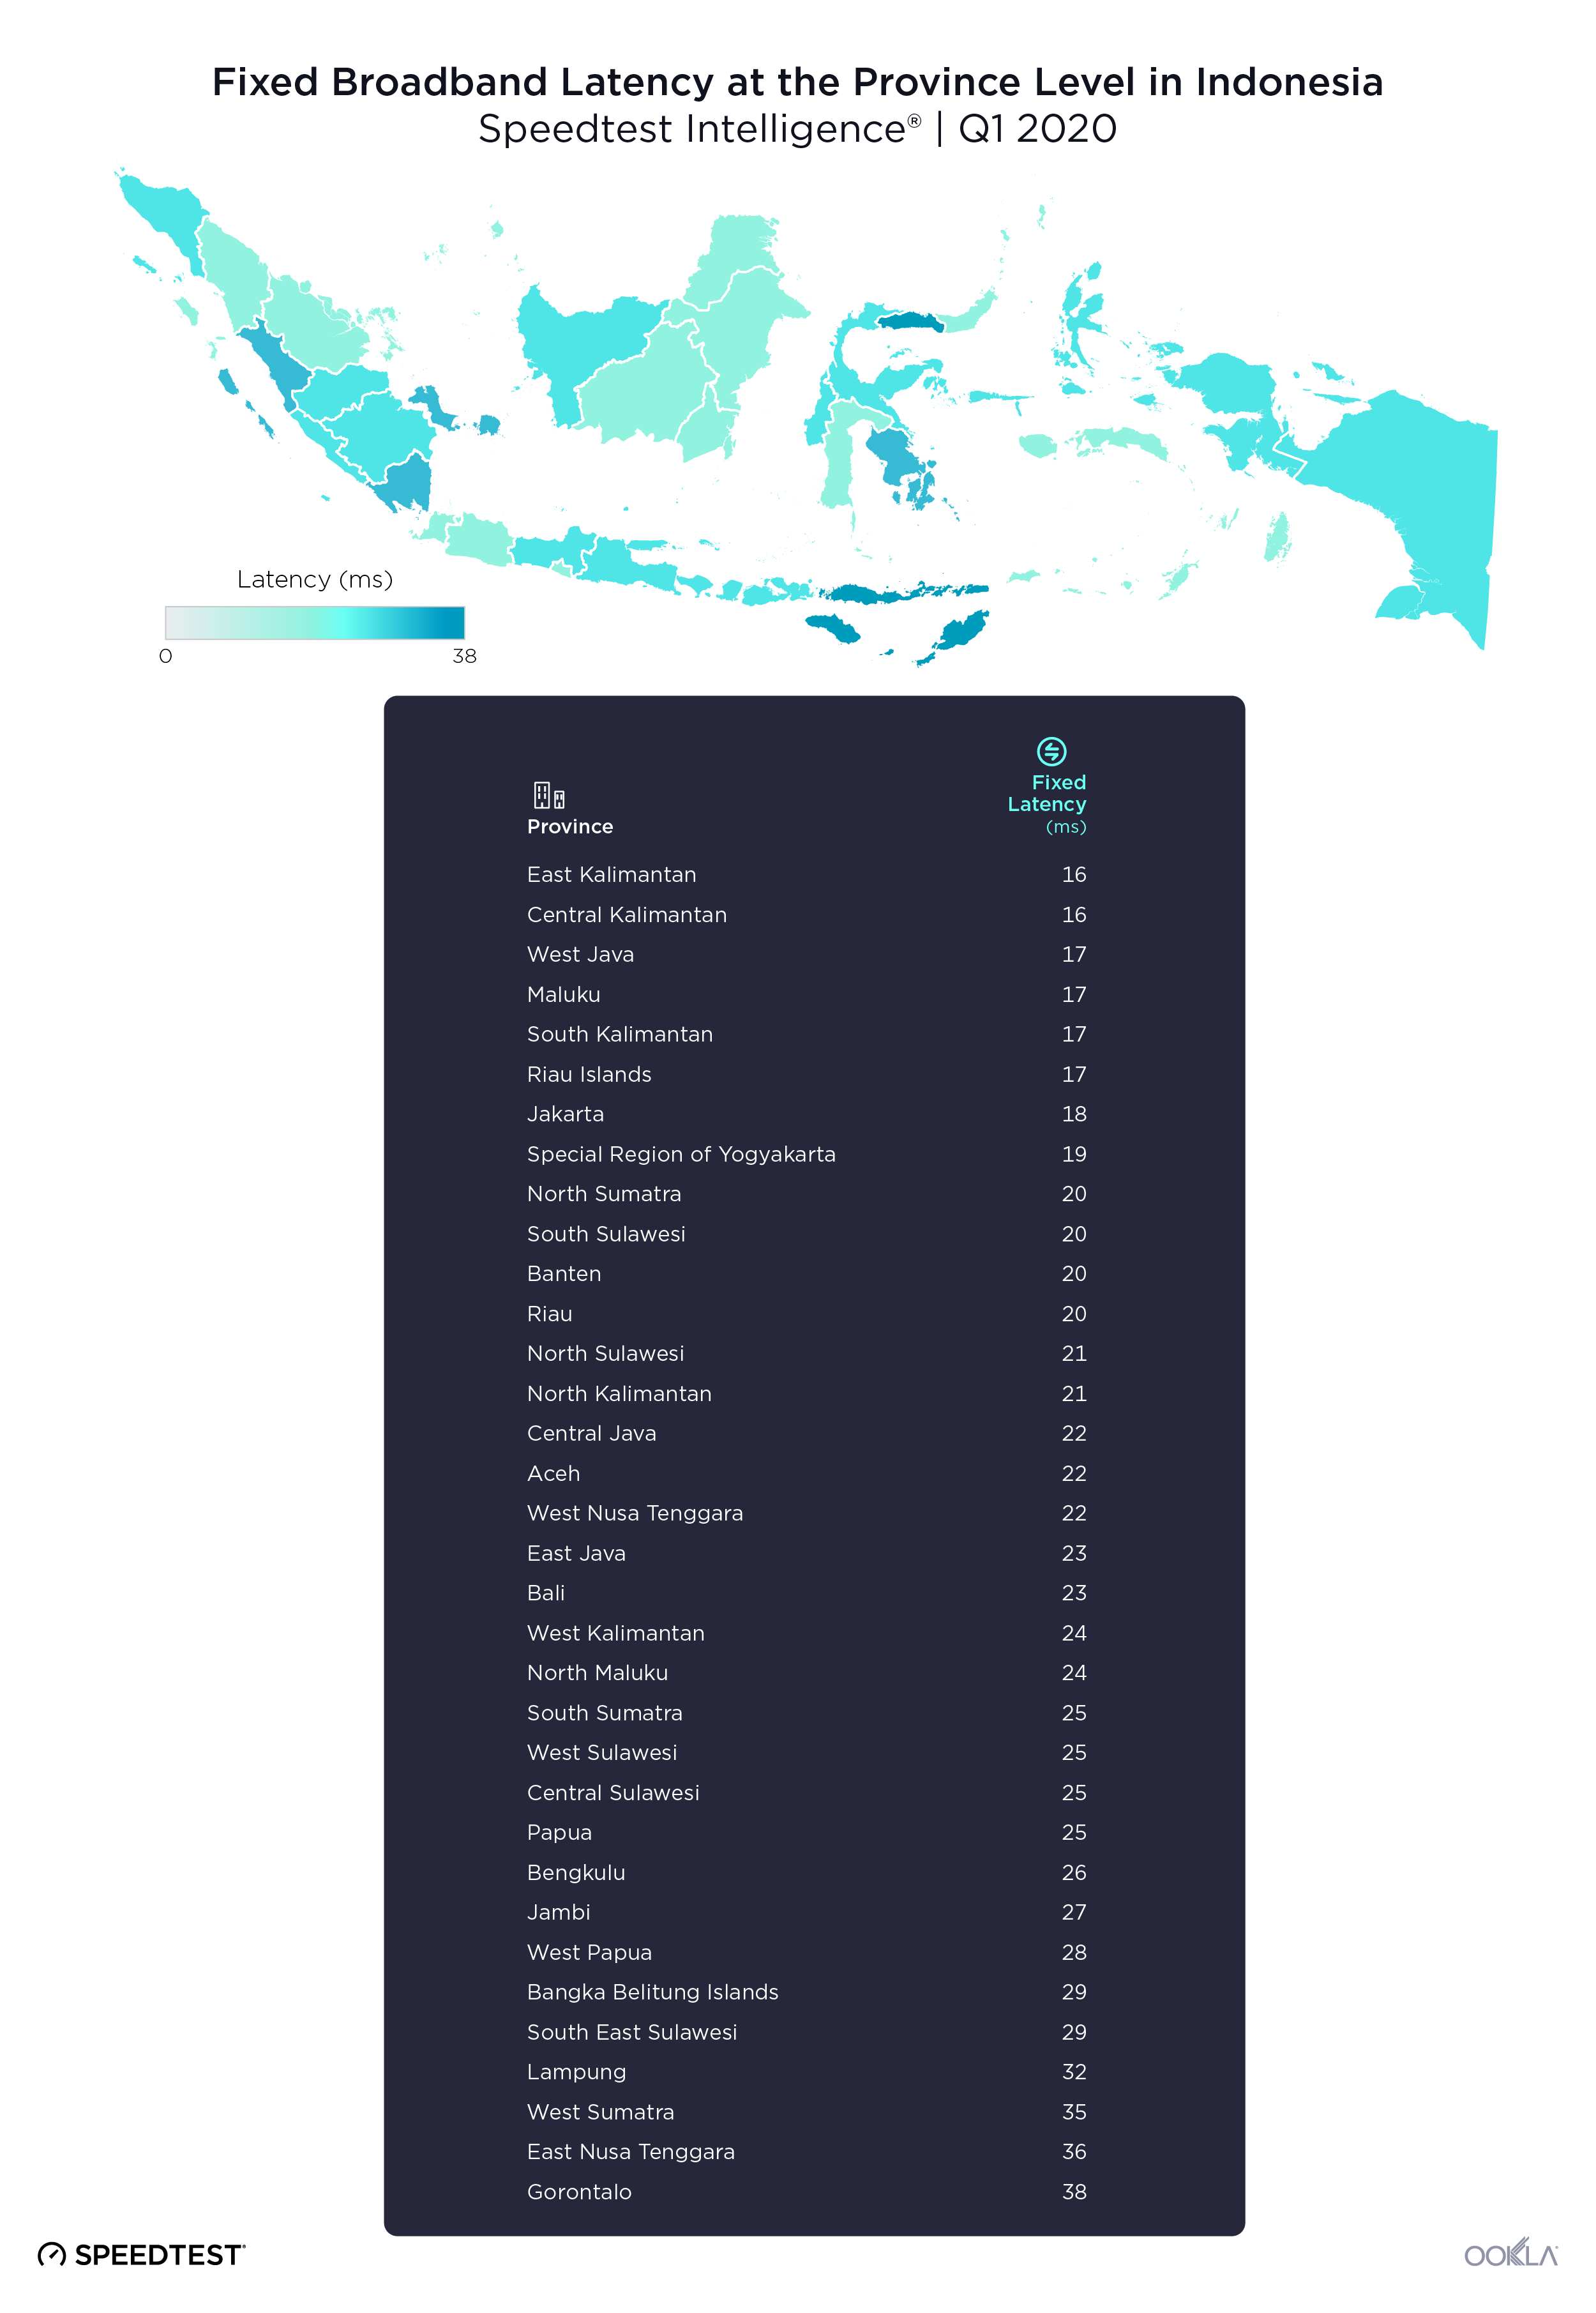
An analysis of latency on fixed broadband in Indonesia’s 34 provinces during Q1 2020 revealed that all provinces had mean latencies within the acceptable range for online gaming. Latency on fixed broadband ranged from 16 ms in East Kalimantan and Central Kalimantan to 38 ms in Gorontalo.

Banten had lowest mobile latency during Q1 2020

Ookla_Indonesia_province_mobile_latency_0620-2

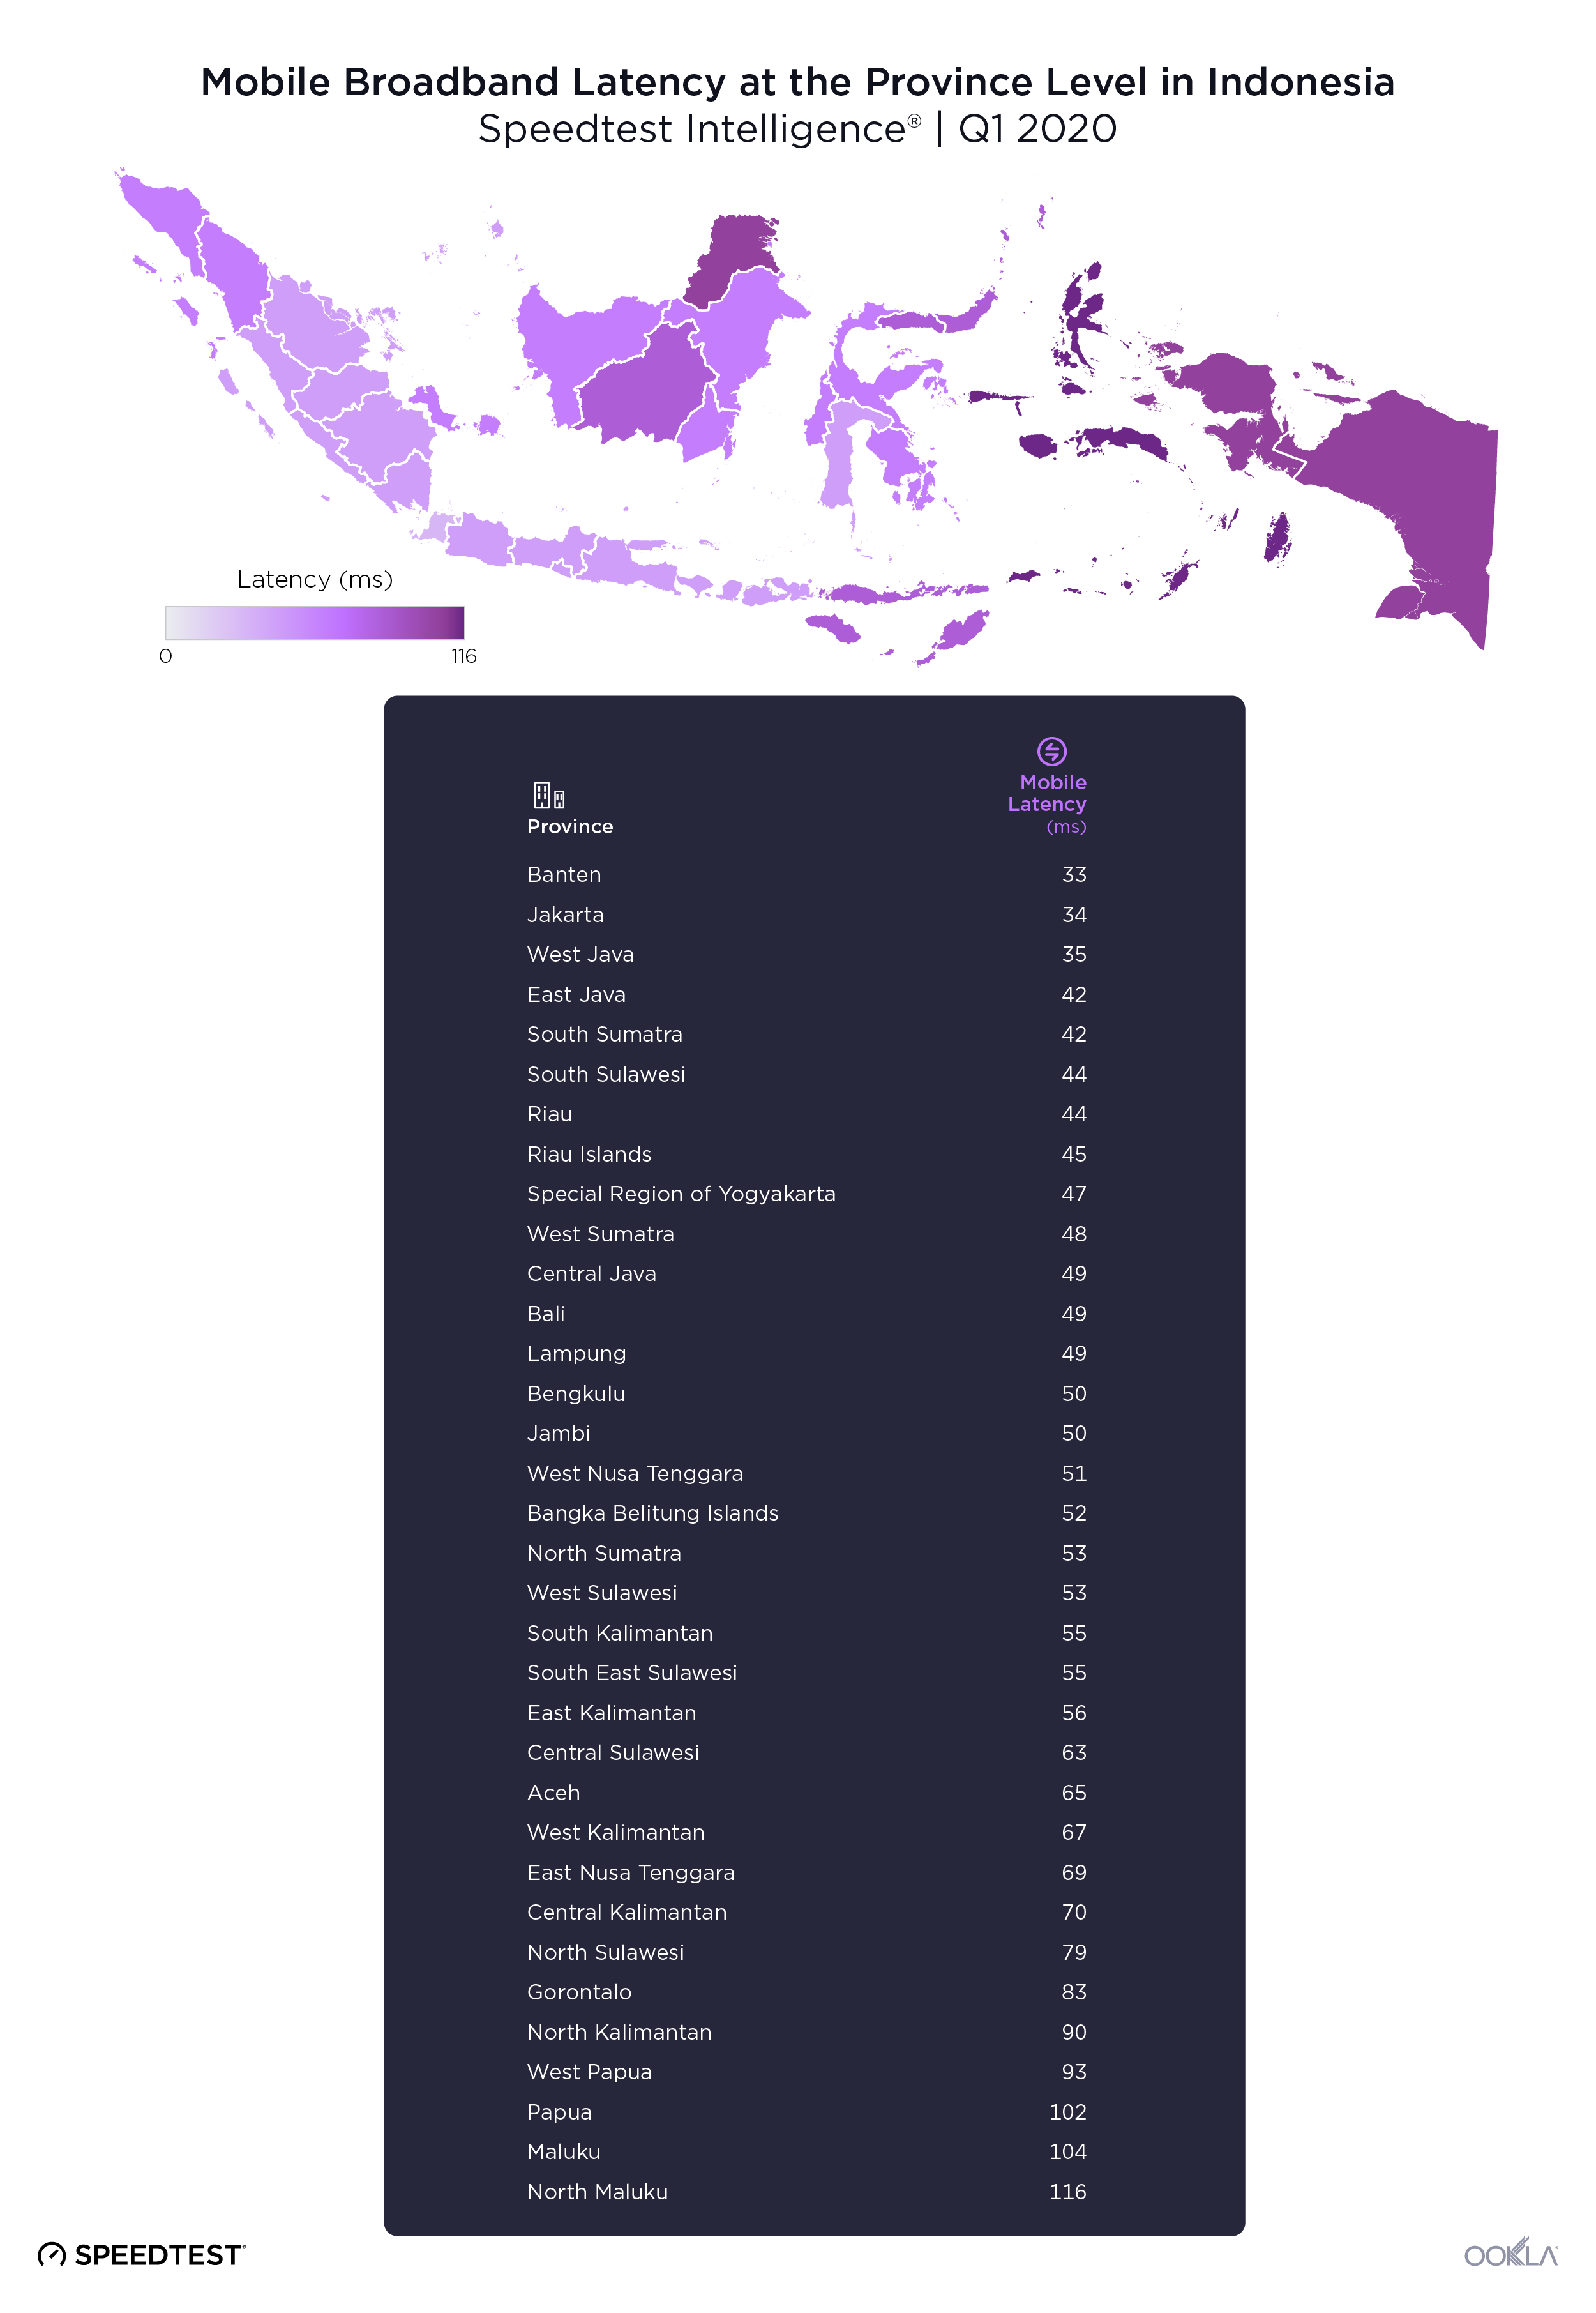
Mean latency on mobile showed a much wider range among Indonesia’s provinces in Q1 2020 than we saw on fixed broadband. Mobile latency during this period ranged from a low of 33 ms in Banten to a high of 116 ms in North Maluku.

Internet performance looks to be strong and improving in many parts of Indonesia, which is essential to a good gaming experience. We look forward to seeing if the lagging provinces catch up in the near future. To learn more about how other Asian countries’ internet performance compares to Indonesia, visit the Speedtest Global IndexTM.

Editor’s note: This article was updated on July 16, 2020 to correct an error in the latency by provider section.


Meneliti Pengalaman Bermain Game di Indonesia

Industri game adalah salah satu bidang yang berkembang pesat di Indonesia dengan jutaan pemain setiap harinya. Namun, latensi, patokan utama untuk pengalaman bermain game berkualitas tinggi, belum tersebar secara merata di negara ini. Meskipun sebagian besar game dimainkan pada perangkat seluler, jaringan broadband tetap yang mendukung game konsol dan PC sering menunjukkan latensi yang jauh lebih rendah di banyak wilayah. Kini, kami sedang memeriksa latensi pada broadband tetap dan seluler di tingkat negara, provinsi, dan kota di Indonesia untuk melihat di wilayah mana pemain dapat bermain dengan lancar dengan hanya mengalami sedikit jeda.

Latensi (disebut juga ping) adalah waktu reaksi koneksi yang diukur dalam milidetik. Untuk mendapatkan pengalaman bermain game terbaik, pengguna setidaknya perlu mengharapkan latensi sebesar 59 ms atau kurang. Latensi saat bermain game dapat bervariasi, tergantung pada server yang terhubung. Selain itu, menghubungkan ke server di dalam wilayah pemain game sendiri lebih disukai. Speedtest menguji ke server terdekat dengan latensi terendah—sering kali dalam pusat populasi yang sama dengan pengguna.

Telkom menunjukkan latensi terendah di Q1 2020

ookla_Indonesia_mobile_fixed_latency_chart_0620id

Selama Q1 2020, latensi rata-rata Indonesia pada broadband tetap adalah 20 ms. Sedangkan pada broadband seluler, latensi rata-rata adalah 42 ms. Pada tingkat negara, penyedia layanan broadband tetap di Indonesia menunjukkan latensi dalam kisaran antara 16 ms hingga 35 ms selama Q1 2020. Telkom memiliki latensi terendah sebesar 16 ms pada broadband tetap. Kemudian disusul oleh MyRepublic dengan 17 ms. Biznet dan First Media memiliki latensi tertinggi, masing-masing sebesar 24 ms dan 35 ms.

ookla_Indonesia_fixed_provider_latency_chart_0620id

Telkomsel dan 3 memiliki latensi terendah pada ponsel di 36 ms. Selama periode ini, latensi rata-rata IM3 Ooredoo, XL, dan Smartfren berkisar antara 36 ms hingga 48 ms.

ookla_Indonesia_mobile_provider_latency_chart_0720_id

Kinerja internet tetap konsisten selama pandemi

Kecepatan internet juga menjadi hal yang sangat penting saat bermain game. Kami telah menggunakan data dari Speedtest Intelligence® untuk melacak kecepatan internet di tingkat global selama pandemi. Hasilnya, kecepatan broadband seluler dan tetap di Indonesia sebagian besar konsisten dengan kinerja pra-pandemi.

ookla_Indonesia_performance_0620id

Volume pengguna yang menggunakan Speedtest pada broadband seluler dan tetap meningkat drastis antara minggu 9 Maret hingga 13 April 2020 ketika banyak orang menyesuaikan diri dengan pola penggunaan internet baru selama pandemi. Volume pengujian mulai menurun setelah minggu 13 April.

ookla_Indonesia_volume_change_0620id

Bandung memiliki latensi terendah pada broadband tetap, sedangkan Bekasi pada broadband seluler

Berkaca pada latensi tetap dan seluler di lima kota terbesar di Indonesia selama Q1 2020, kami menemukan sedikit variasi pada latensi broadband tetap dan variasi yang lebih luas pada latensi seluler.

Ookla_Indonesia_cities_latency_0620-1

Bandung, sebuah kota di Jawa Barat, menunjukkan latensi broadband tetap terendah dalam kelompoknya sebesar 15 ms pada Q1 2020. Surabaya dan Bekasi memiliki latensi tertinggi sebesar 22 ms. Peningkatan terbesar dalam hal latensi broadband tetap terlihat di Medan, yang menunjukkan penurunan latensi broadband tetap dari 32 ms pada Q1 2019 menjadi 20 ms pada Q1 2020.

Kota Bekasi, yang terletak di sebelah barat Jakarta, memiliki latensi seluler terendah sebesar 32 ms selama Q1 2020, diikuti oleh Bandung.

Saat membandingkan Q1 2019 hingga Q1 2020, kami melihat peningkatan latensi seluler signifikan di kelima kota tersebut. Paling mencolok, latensi seluler di Medan meningkat dari 72 ms pada Q1 2019 menjadi 51 ms pada Q1 2020.

Kalimantan Timur dan Kalimantan Tengah memiliki latensi broadband tetap terendah

Ookla_Indonesia_province_fixed_latency_0620id-1

Analisis latensi pada broadband tetap di 34 provinsi di Indonesia selama Q1 2020 menunjukkan bahwa semua provinsi memiliki latensi rata-rata dalam kisaran yang dapat diterima untuk bermain game online. Latensi broadband tetap berkisar antara 16 ms di Kalimantan Timur dan Kalimantan Tengah hingga 38 ms di Gorontalo.

Banten memiliki latensi seluler terendah selama Q1 2020

Ookla_Indonesia_province_mobile_latency_0620id-1

Latensi seluler rata-rata menunjukkan kisaran yang jauh lebih luas di antara provinsi-provinsi Indonesia pada Q1 2020 dibanding yang kami lihat pada broadband tetap. Latensi seluler selama periode ini berkisar antara 33 ms di Banten (terendah) hingga 116 ms di Maluku Utara (tertinggi).

Kinerja internet terlihat sangat baik dan meningkat di berbagai daerah di Indonesia. Hal ini penting untuk pengalaman bermain game yang baik. Kami berharap dapat melihat provinsi yang tertinggal mampu mengejar dalam waktu dekat. Untuk mempelajari lebih lanjut tentang kinerja internet negara-negara Asia lainnya dibandingkan dengan Indonesia, kunjungi Indeks Global SpeedtestTM.

Catatan editor: Artikel ini diperbarui pada 16 Juli 2020 untuk memperbaiki kesalahan dalam latensi oleh bagian penyedia.

Ookla retains ownership of this article including all of the intellectual property rights, data, content graphs and analysis. This article may not be quoted, reproduced, distributed or published for any commercial purpose without prior consent. Members of the press and others using the findings in this article for non-commercial purposes are welcome to publicly share and link to report information with attribution to Ookla.

| April 14, 2020

Can’t Connect? The Most Significant Online Service Outages in Q1 2020

“We’re experiencing problems at the moment” became an all-too-familiar phrase during the first three months of 2020. As we continue with our series of most significant outages across the globe, this article examines major web and online service outages from Q1 2020 using Downdetector® data. Outages came under increased scrutiny as COVID-19 spread and more people began working or studying from home, gaming, video conferencing and using more online services than ever before. However, we saw significant outages both before and after this time. The six categories of outages we’re highlighting here are: collaboration platforms, gaming, telecom operators, streaming services, social media and financial institutions.

Collaboration platforms

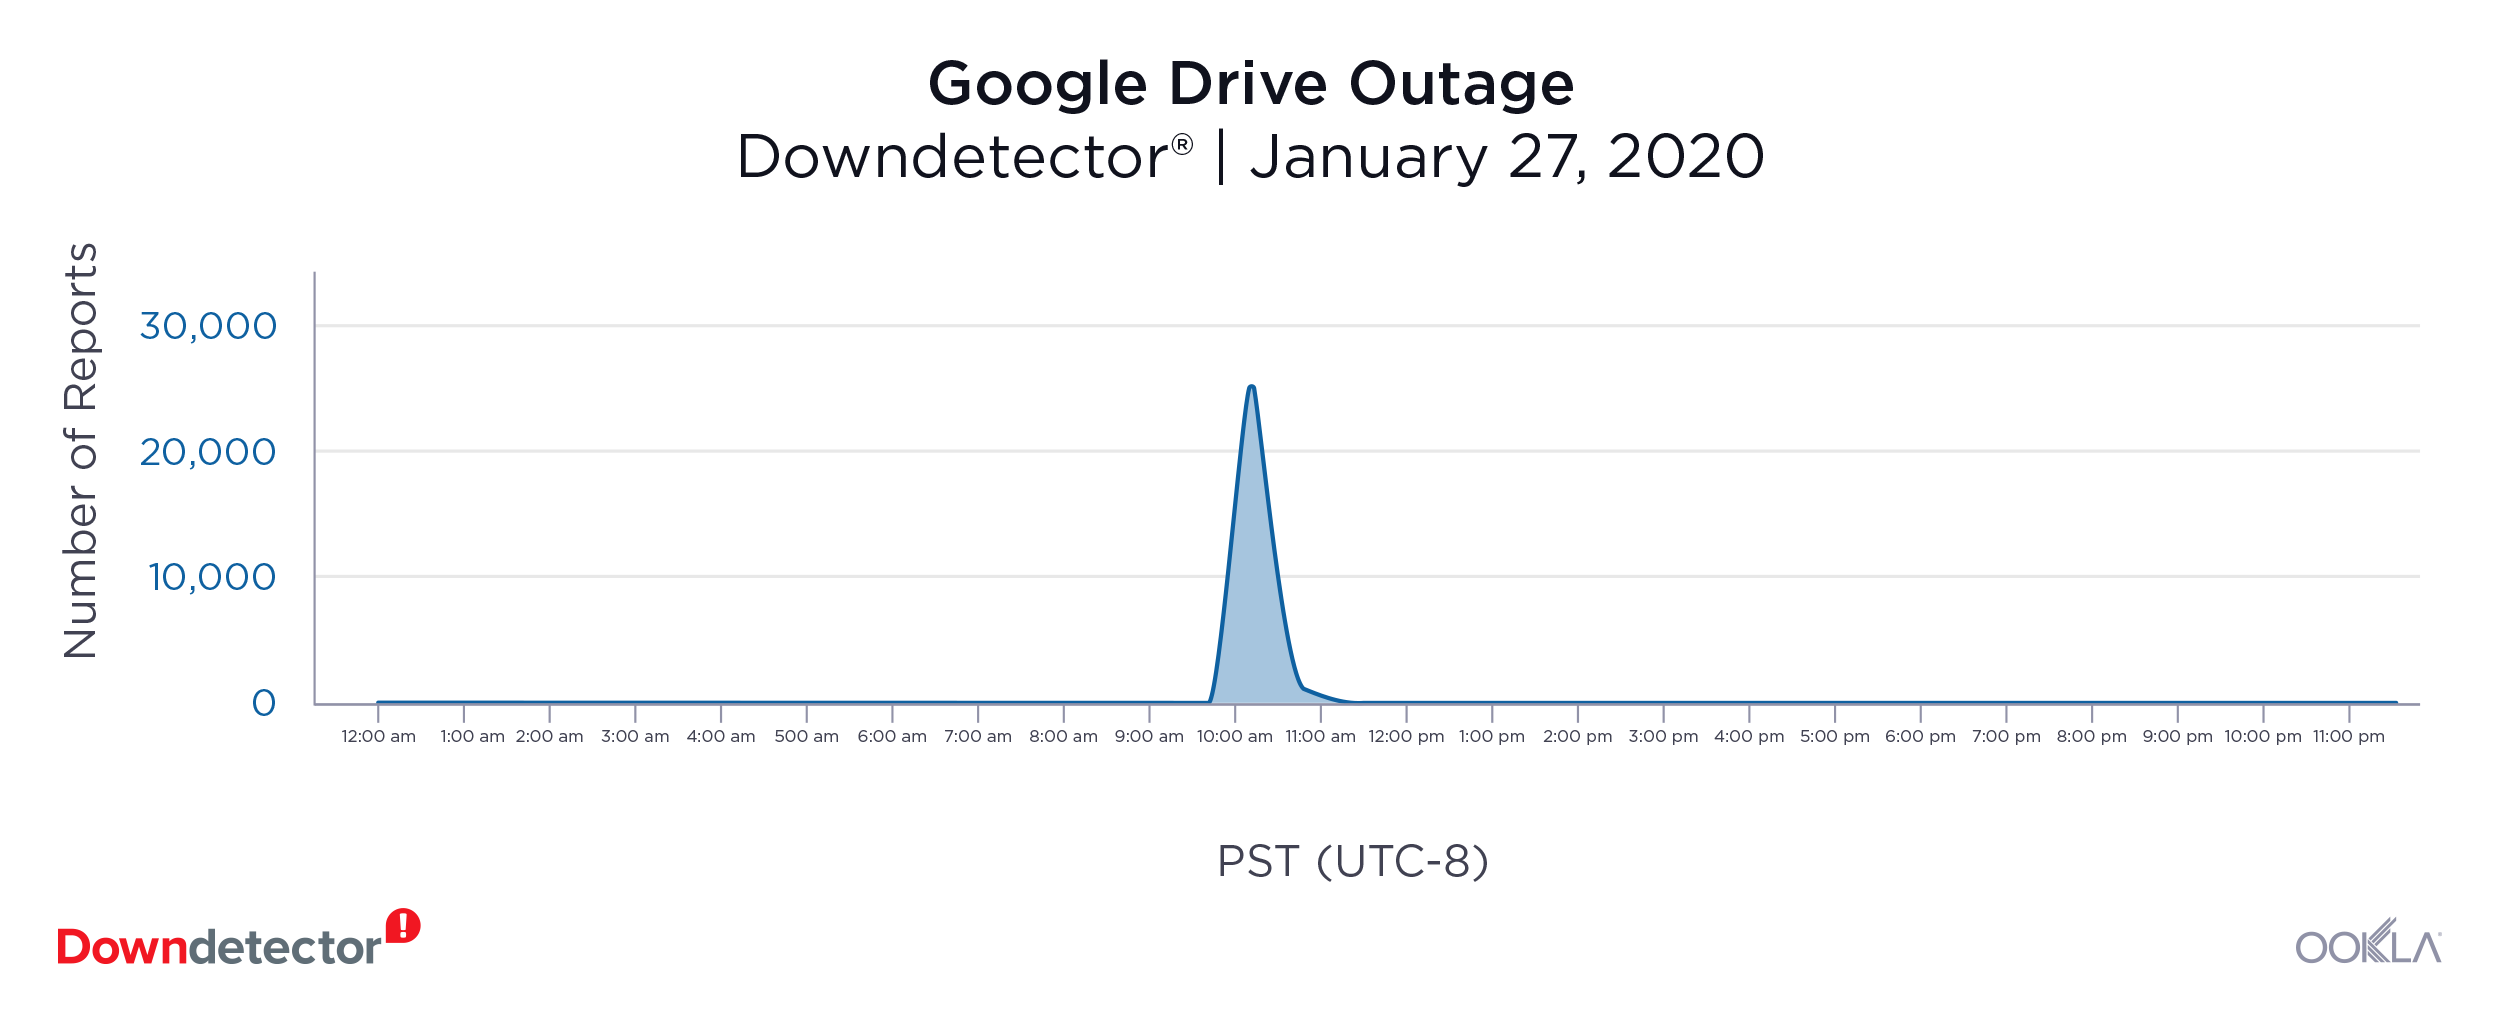
Google Drive (January 27, 2020): 24,558 outage reports at peak

1-Google-Drive-1
Users of Google’s popular file storage and synchronization service rushed to Downdetector when receiving the following error message: “Google Docs encountered an error. Please try reloading this page, or coming back to it in a few minutes.” on January 27. The outage reportedly lasted an hour and Downdetector received 24,558 reports during the peak fifteen minutes of the outage. Most reports originated from the US, but users also reported problems in Germany, Japan, Mexico, the Netherlands and the UK.

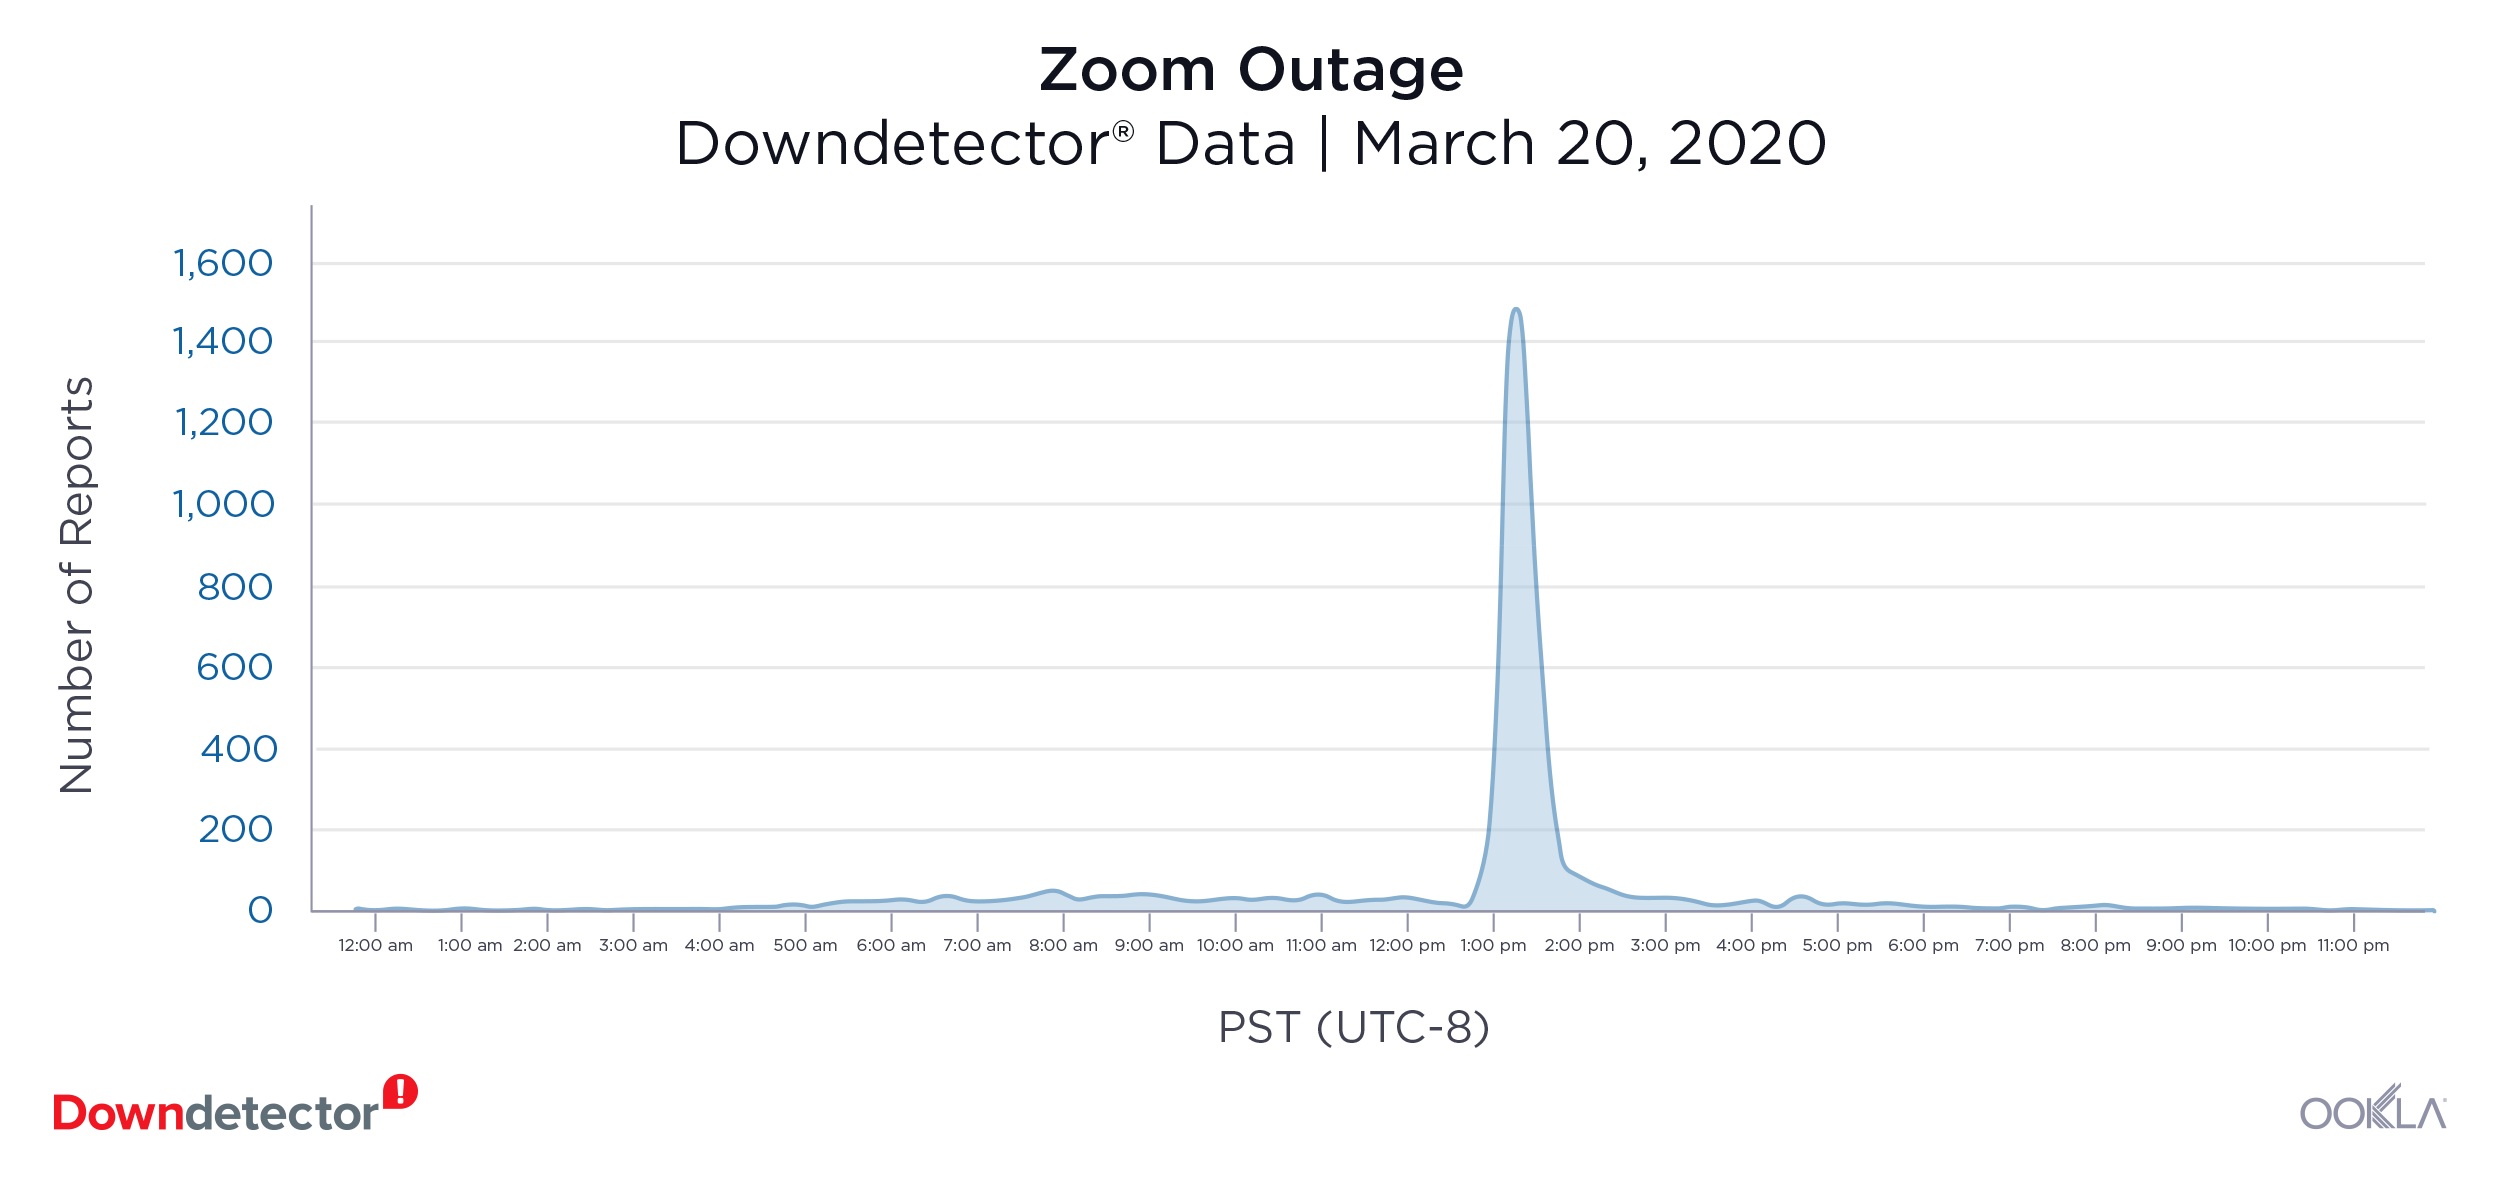
Zoom (March 20, 2020): 1,483 reports at peak

2-Zoom-1
Video conferencing software like Zoom has become an important tool to communicate. Amid an increase in volume, Zoom users, mostly in the U.S., reported an outage on March 20 that left people unable to access the service or make calls. The service also experienced a smaller outage on March 5 with 586 reports at the peak. Both outages lasted approximately two hours.

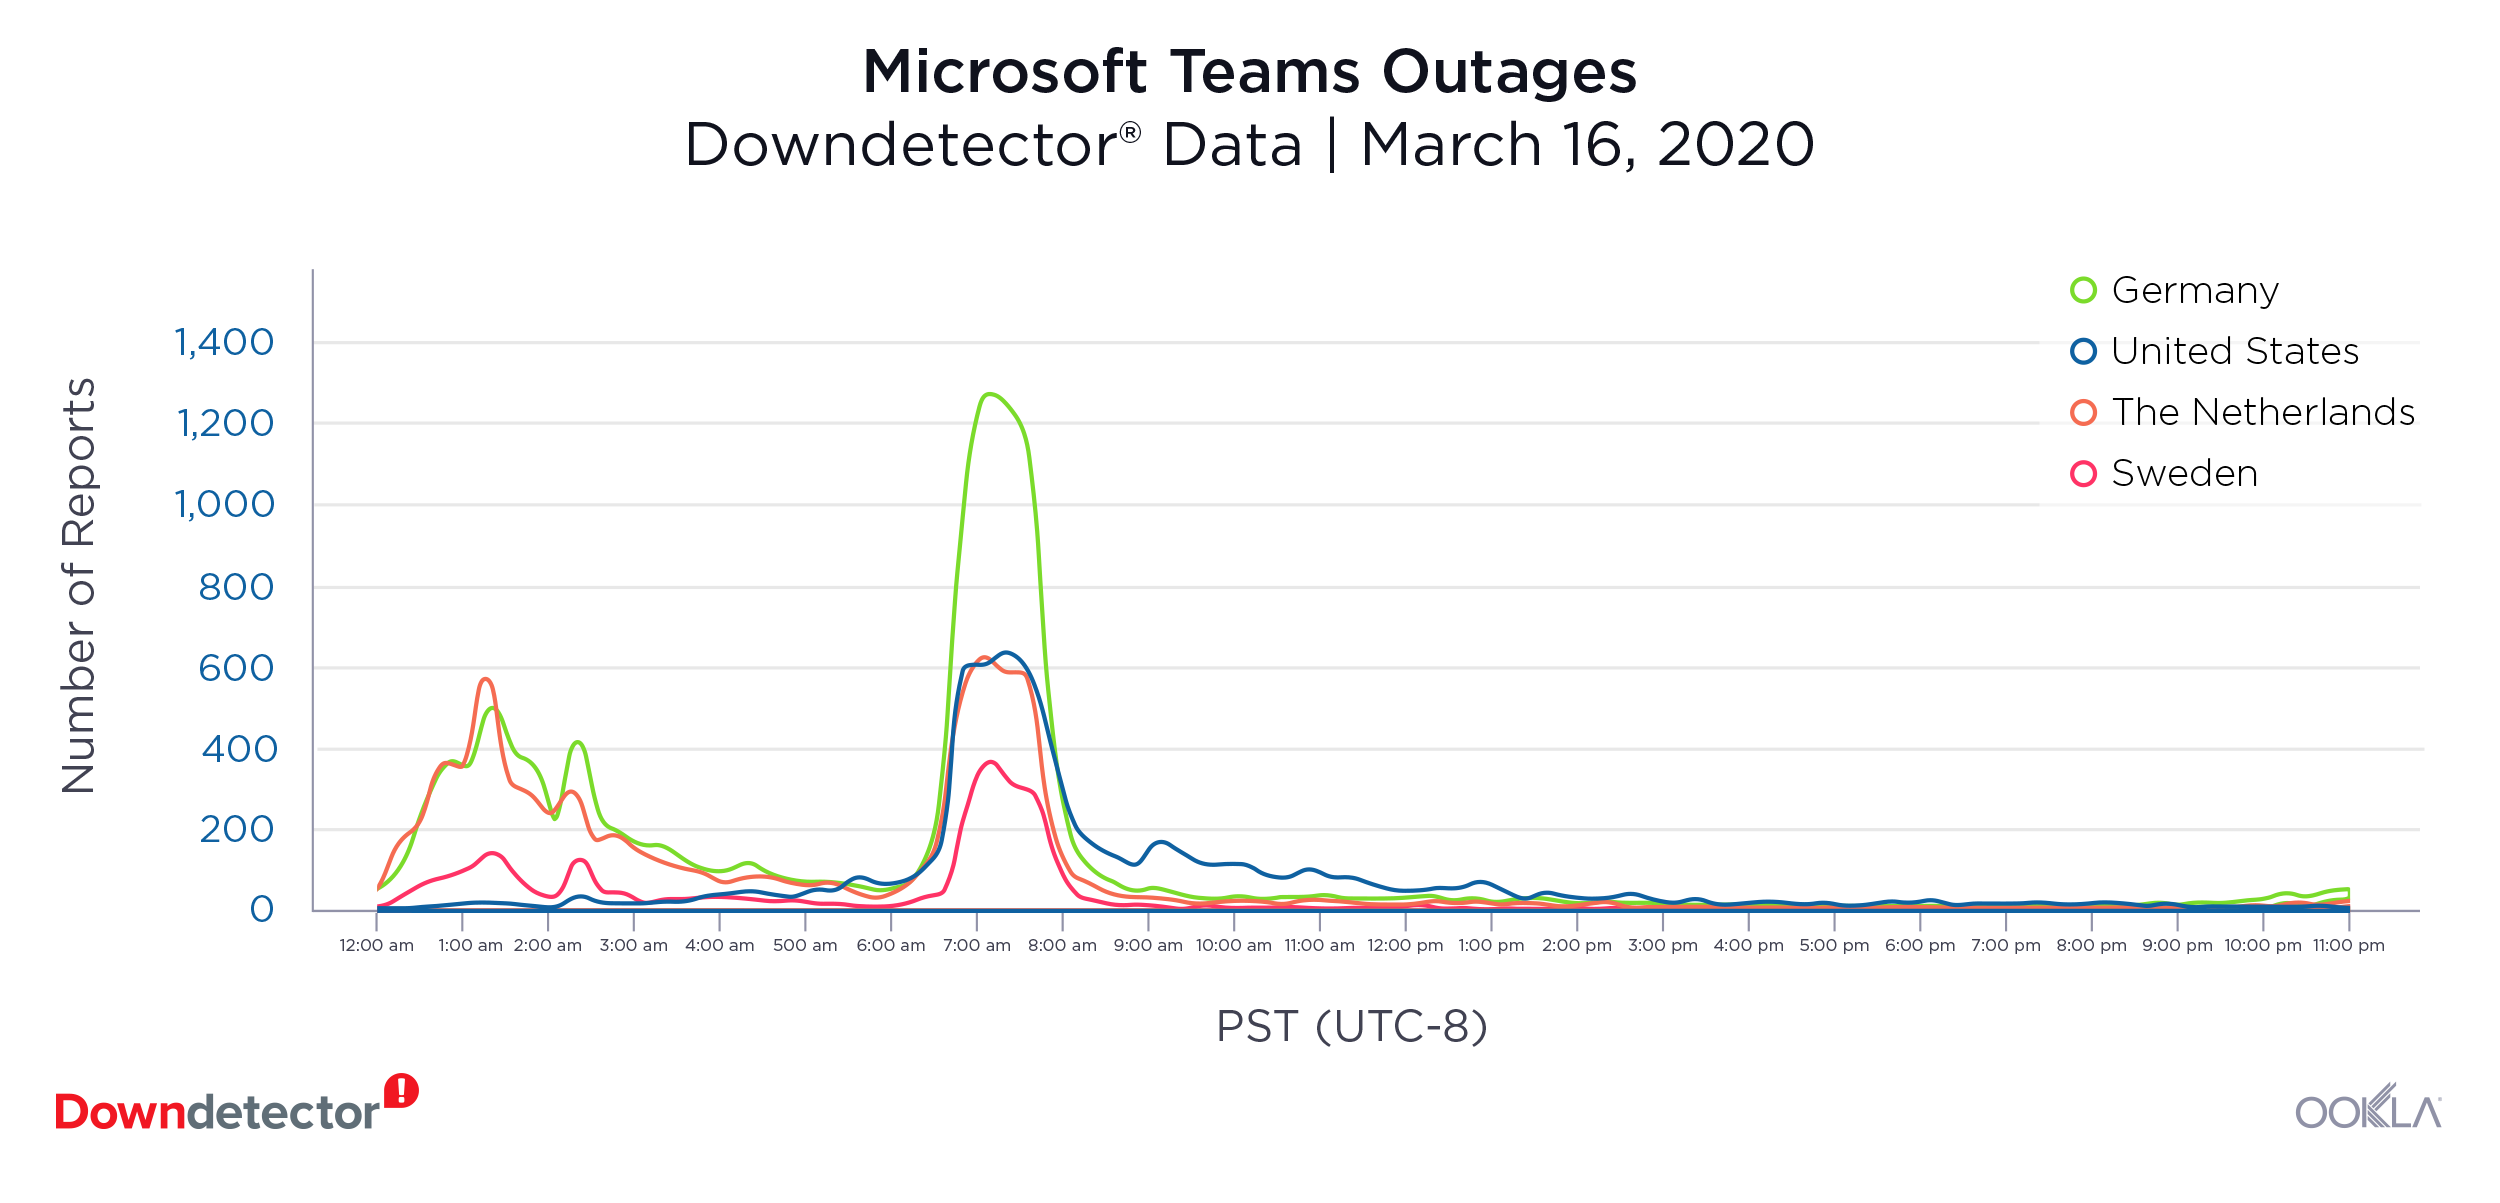
Microsoft Teams (March 16): Multiple outages

3-Teams
Microsoft Teams experienced a worldwide outage on March 16. The collaboration platform that streamlines communication in an organization was reportedly down for users in Germany, the Netherlands, Sweden and the U.S. The duration of the outage varied by country, but lasted more than six hours in most and recurred in the Netherlands for a period on March 17. Teams also experienced a significant outage over the span of five hours on February 2 when 9,386 users in the U.S. reported problems at the peak.

Gaming

Steam (multiple outages)

Steam-Bar-Outage-1
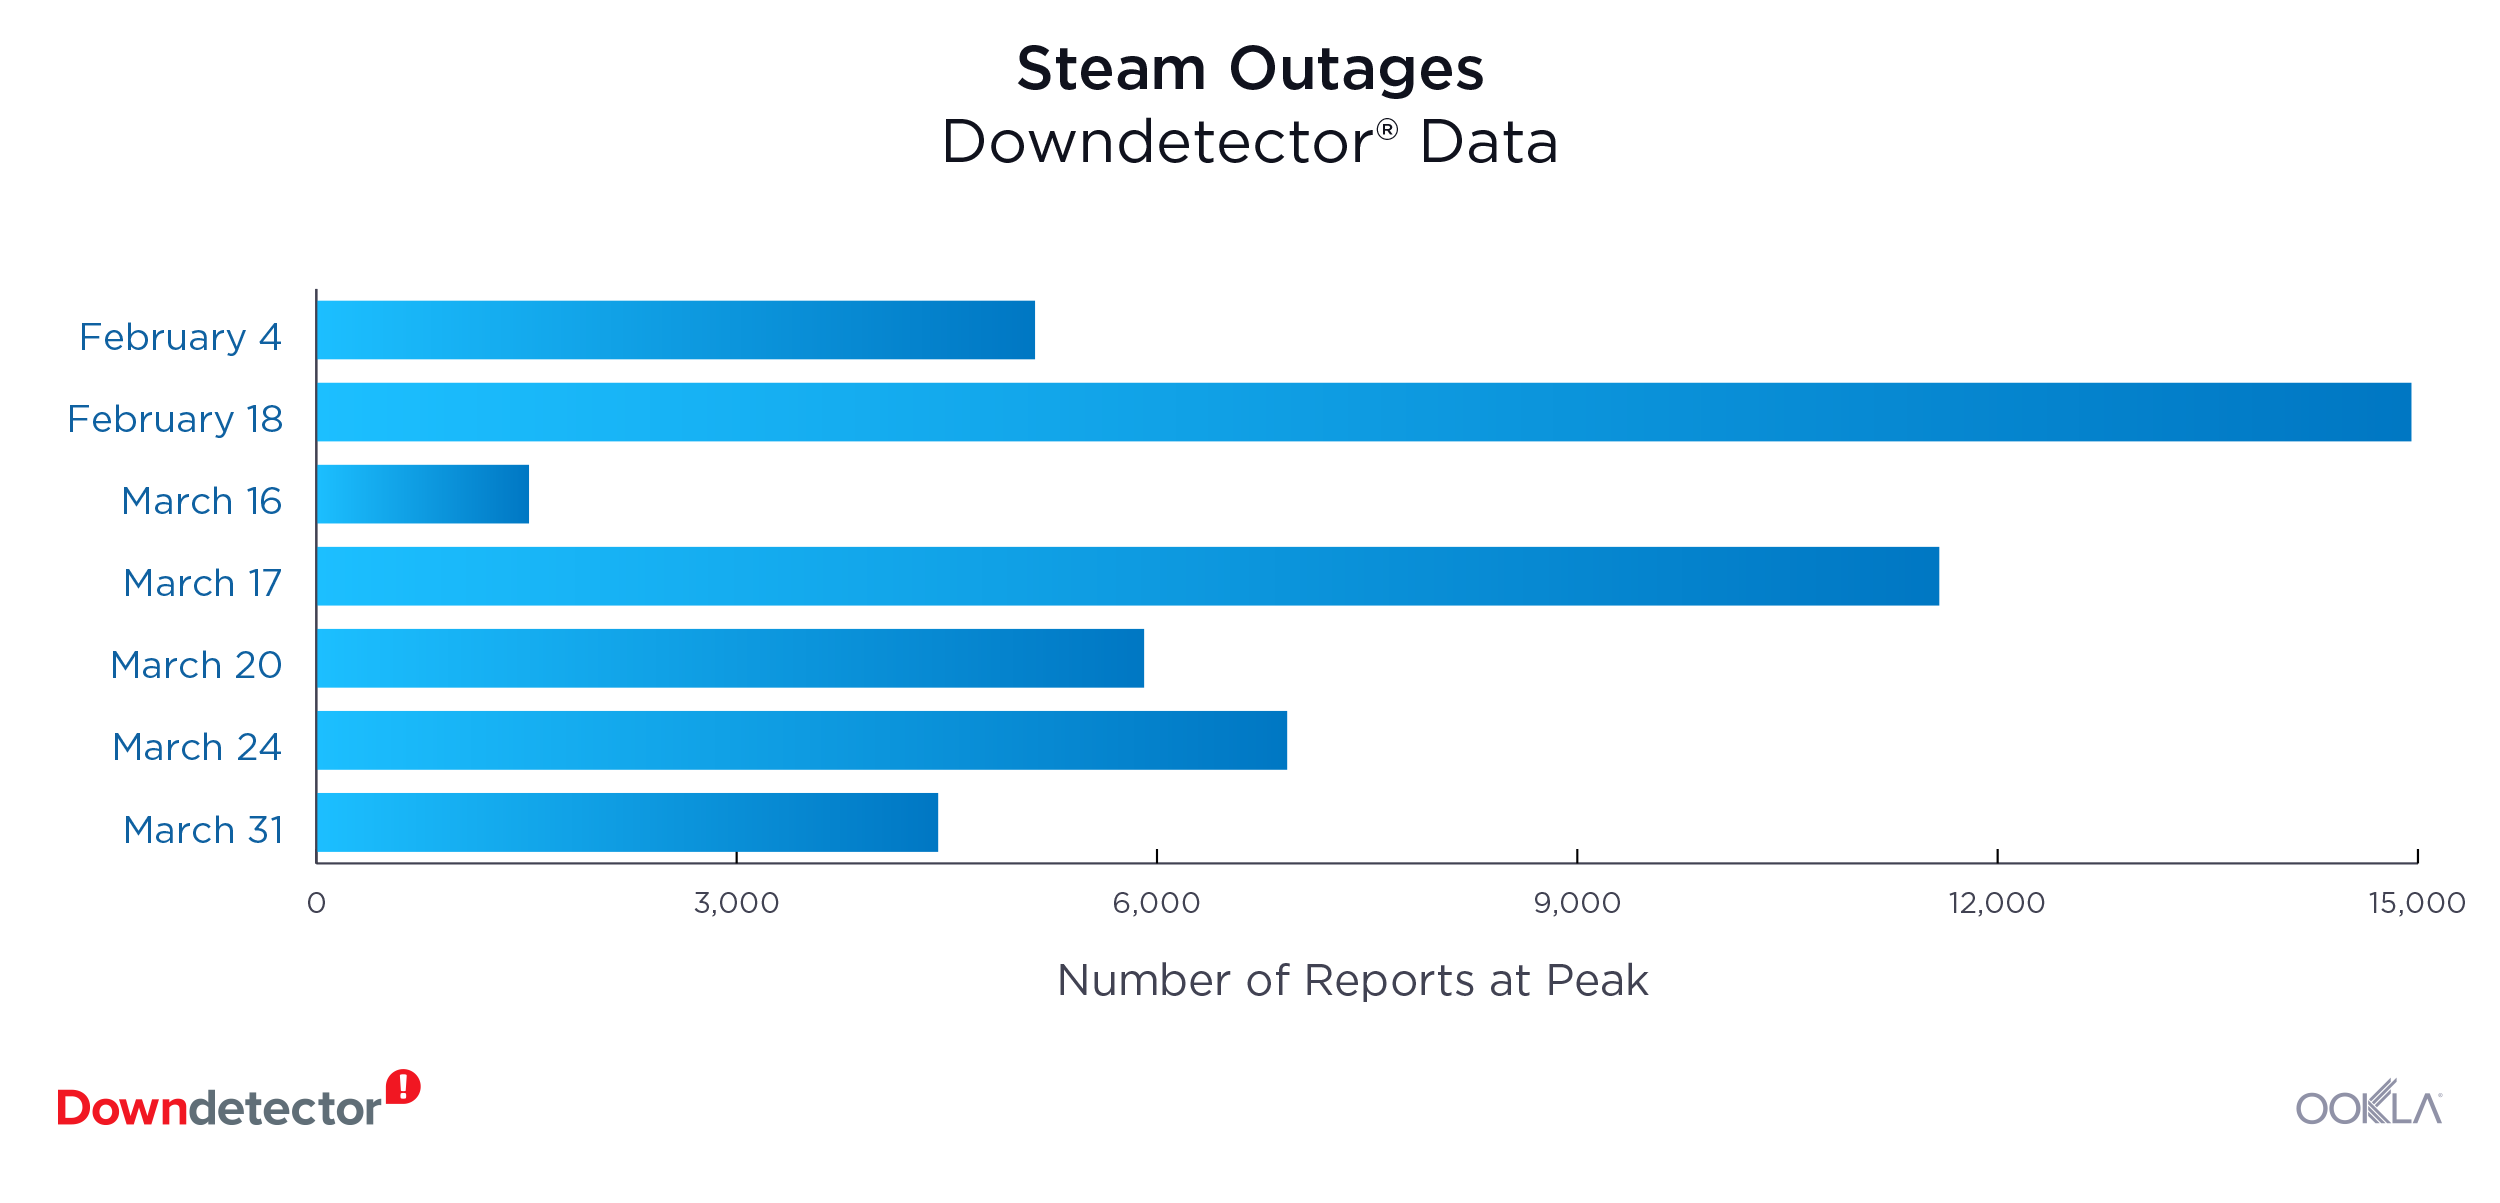
Steam suffered nine major outages during Q1 2020 (seven of which are pictured above), according to reports from users in Germany, the U.K. and the U.S. The largest outage took place on February 18 when the gaming platform was down for about three hours and 14,955 users reported issues at the peak of the outage. Steam users rushed to Downdetector again on March 17, which was Steam’s second largest outage with 11,585 reports at the peak of the outage. The two subsequent Tuesdays also proved problematic for Steam with 6,931 outages during the peak on March 24 and 4,440 outages during the March 31 peak.

Call of Duty (March 15): 7,761 outages at peak

4-Call-of-Duty
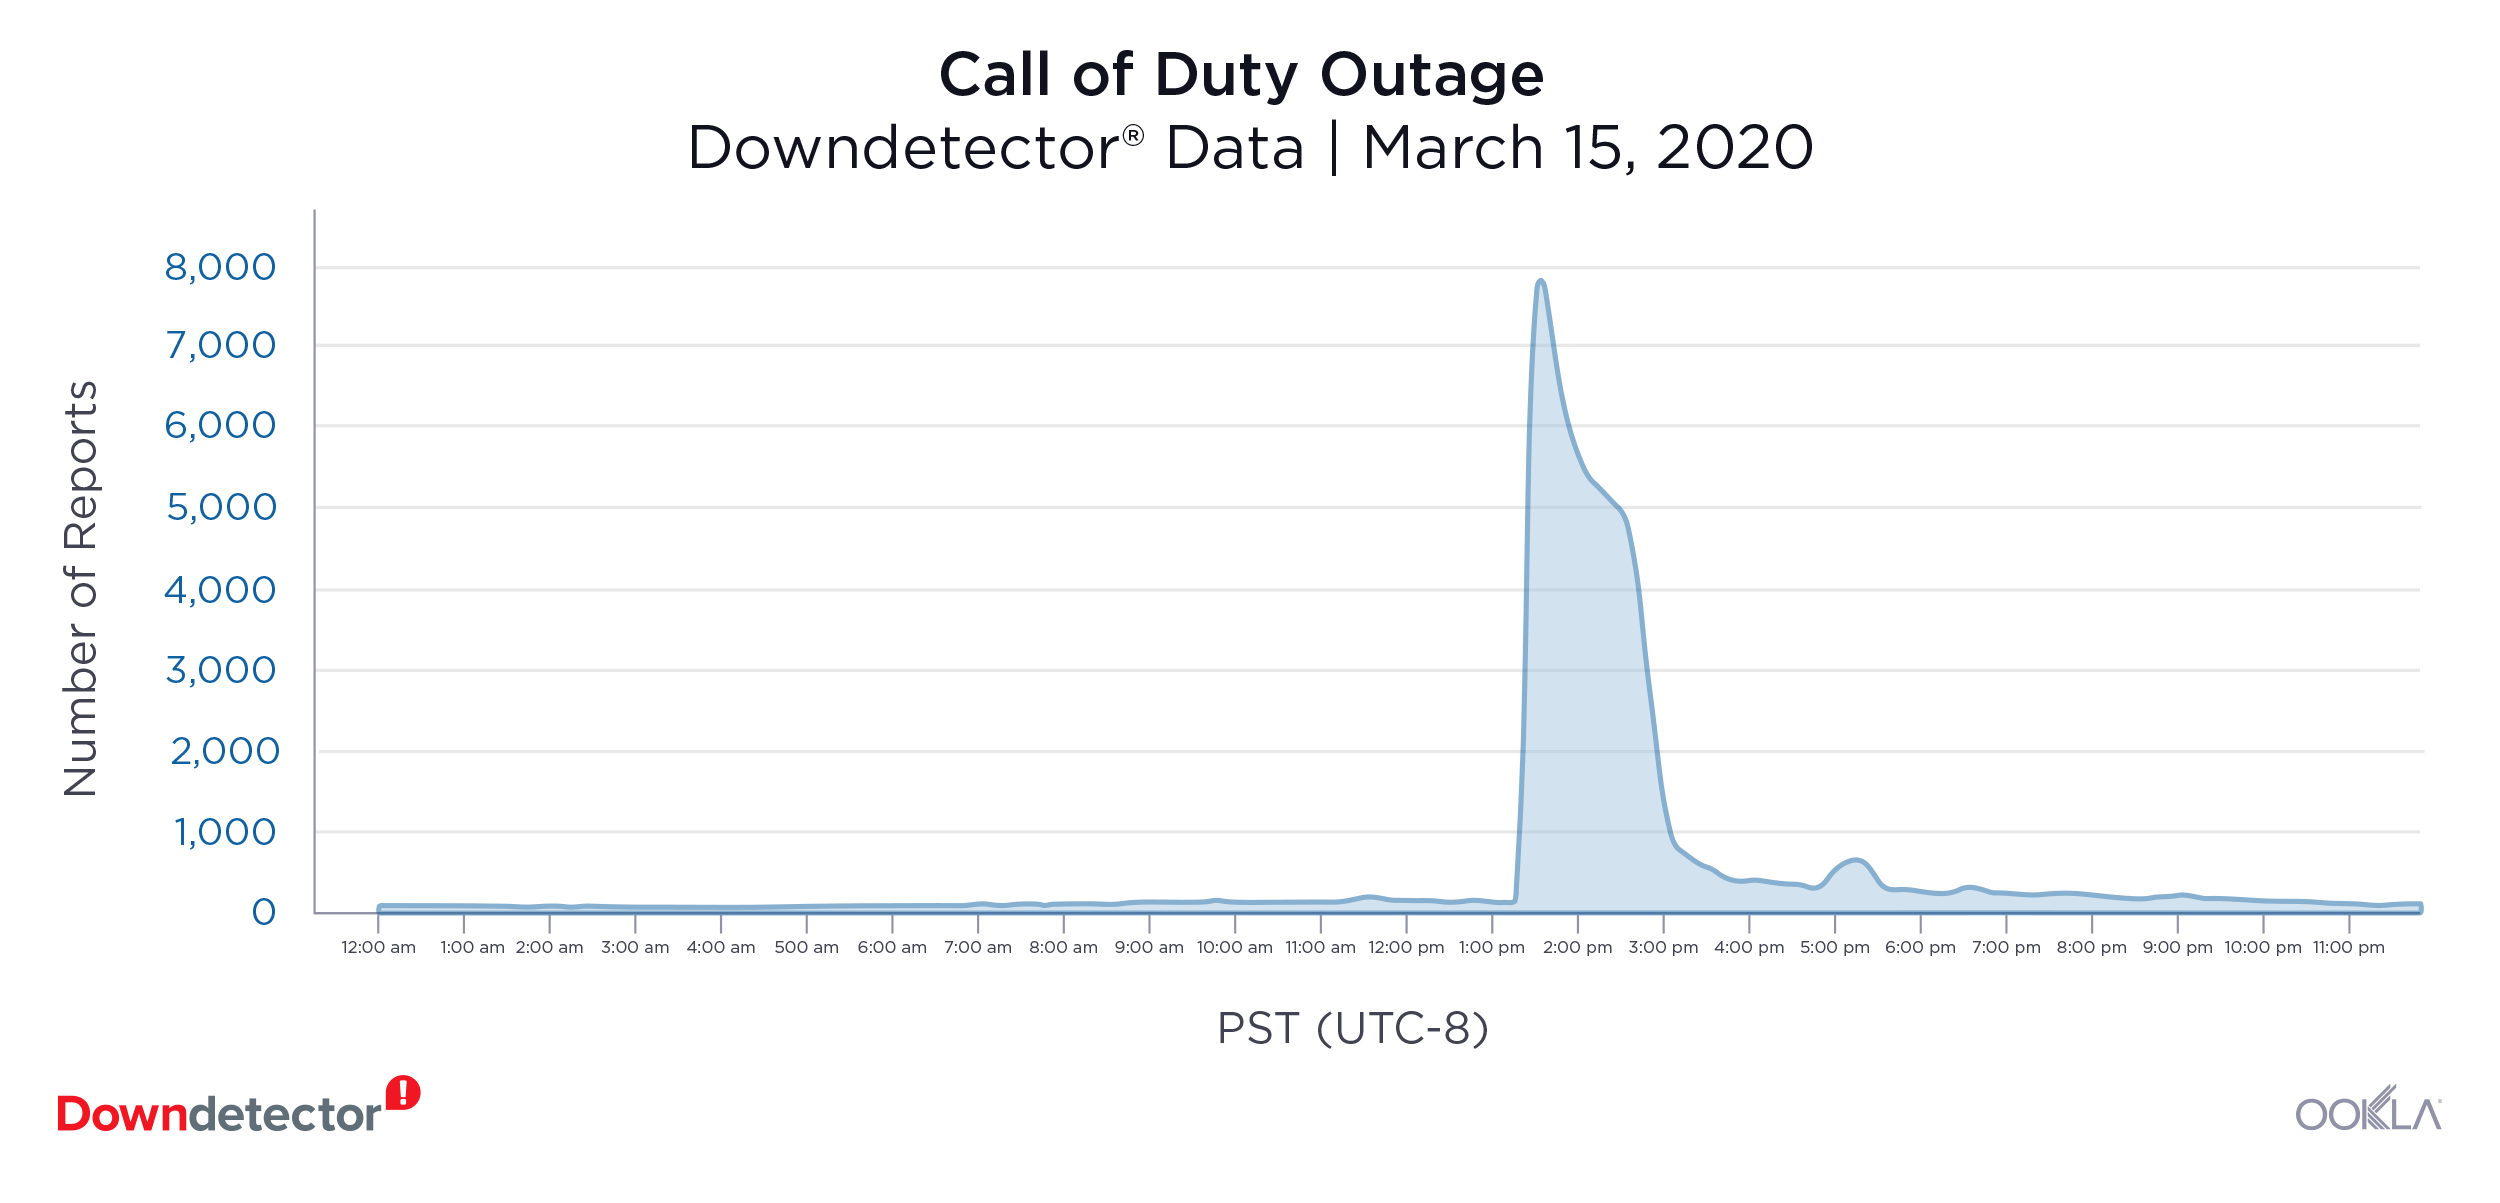
Users in the U.S. reported multiple Call of Duty outages during Q1 2020. The largest outage took place on March 15, with 7,761 reports at the peak of an outage that primarily affected the server connection of the gaming platform. Gamers were unable to play with friends for about four hours that day. On March 17, Call of Duty had a smaller outage with 3,549 reports at peak.

Fortnite (March 17): 3,998 reports at peak

5-Fortnite

On March 17, Fornite tweeted “We’re currently investigating issues with logins, matchmaking, the Item Shop, and other Fortnight services. We’ll provide an update when these are resolved,” after users reported having problems with the gaming platform. Users were unable to access Fornite for about four hours that day. Most of the reports came from France, Germany, Japan, the Netherlands, Spain, the U.K. and the U.S.

Telecom providers

Italy

TIM Italy (March 12): 2,667 reports at peak

6-TIM
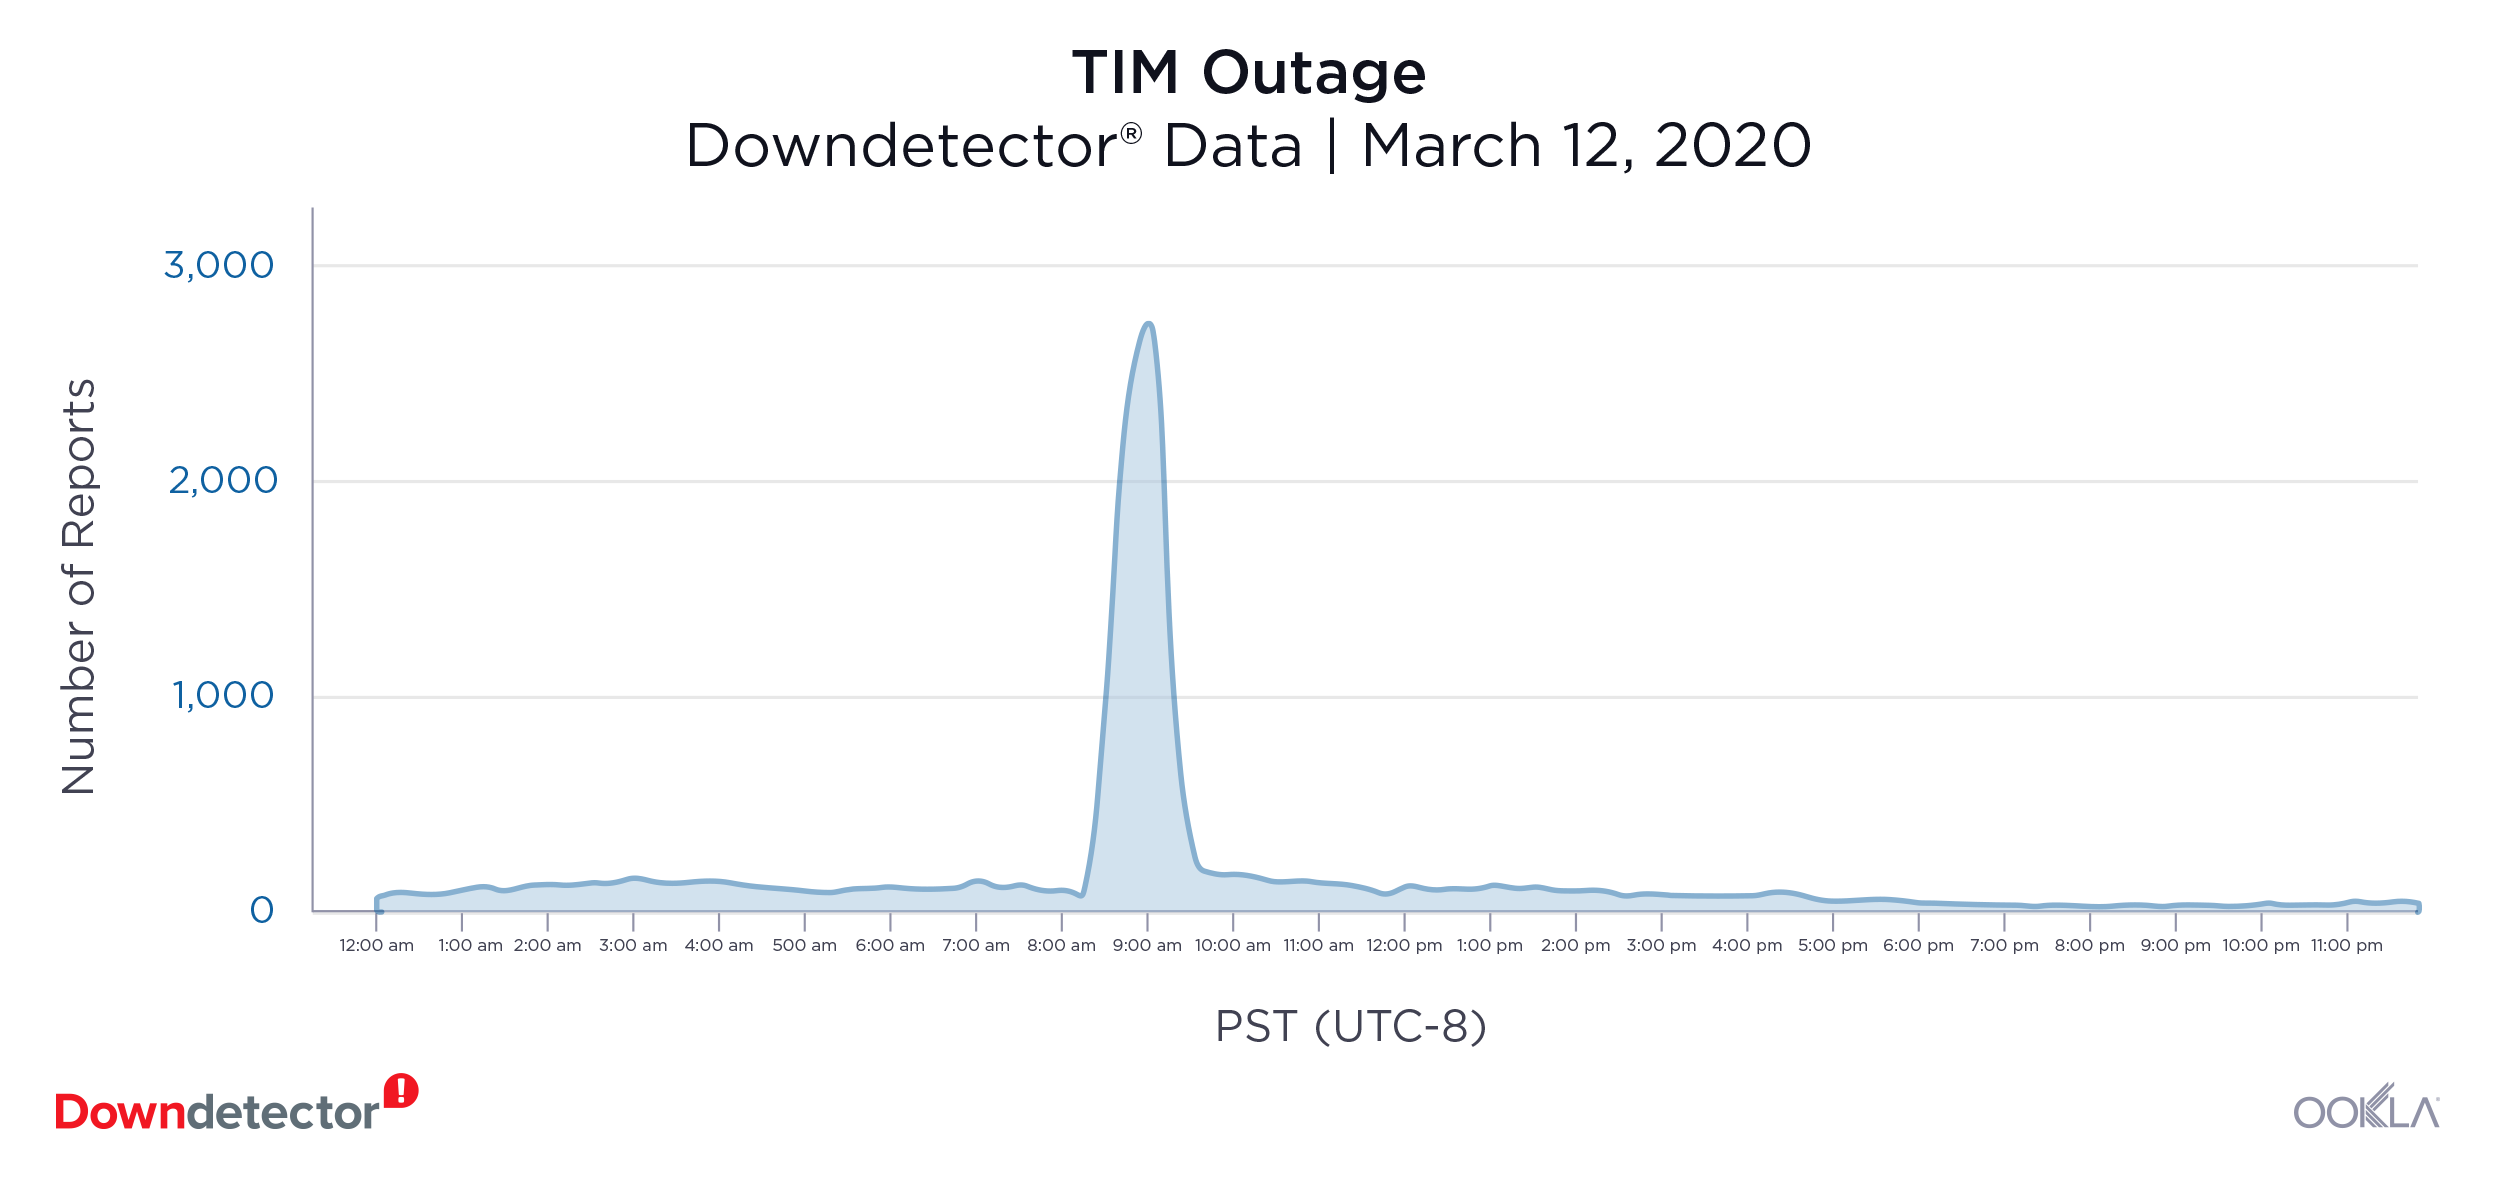
Users throughout Italy flooded Downdetector with reports of problems with their mobile internet connections on March 12. The outage lasted close to an hour and showed 2,667 reports at the peak of the outage. TIM had a smaller outage the day before with 1,337 reports at the peak of the outage.

Vodafone Italy (February 14th): 1,733 reports at peak

7-Vodafone
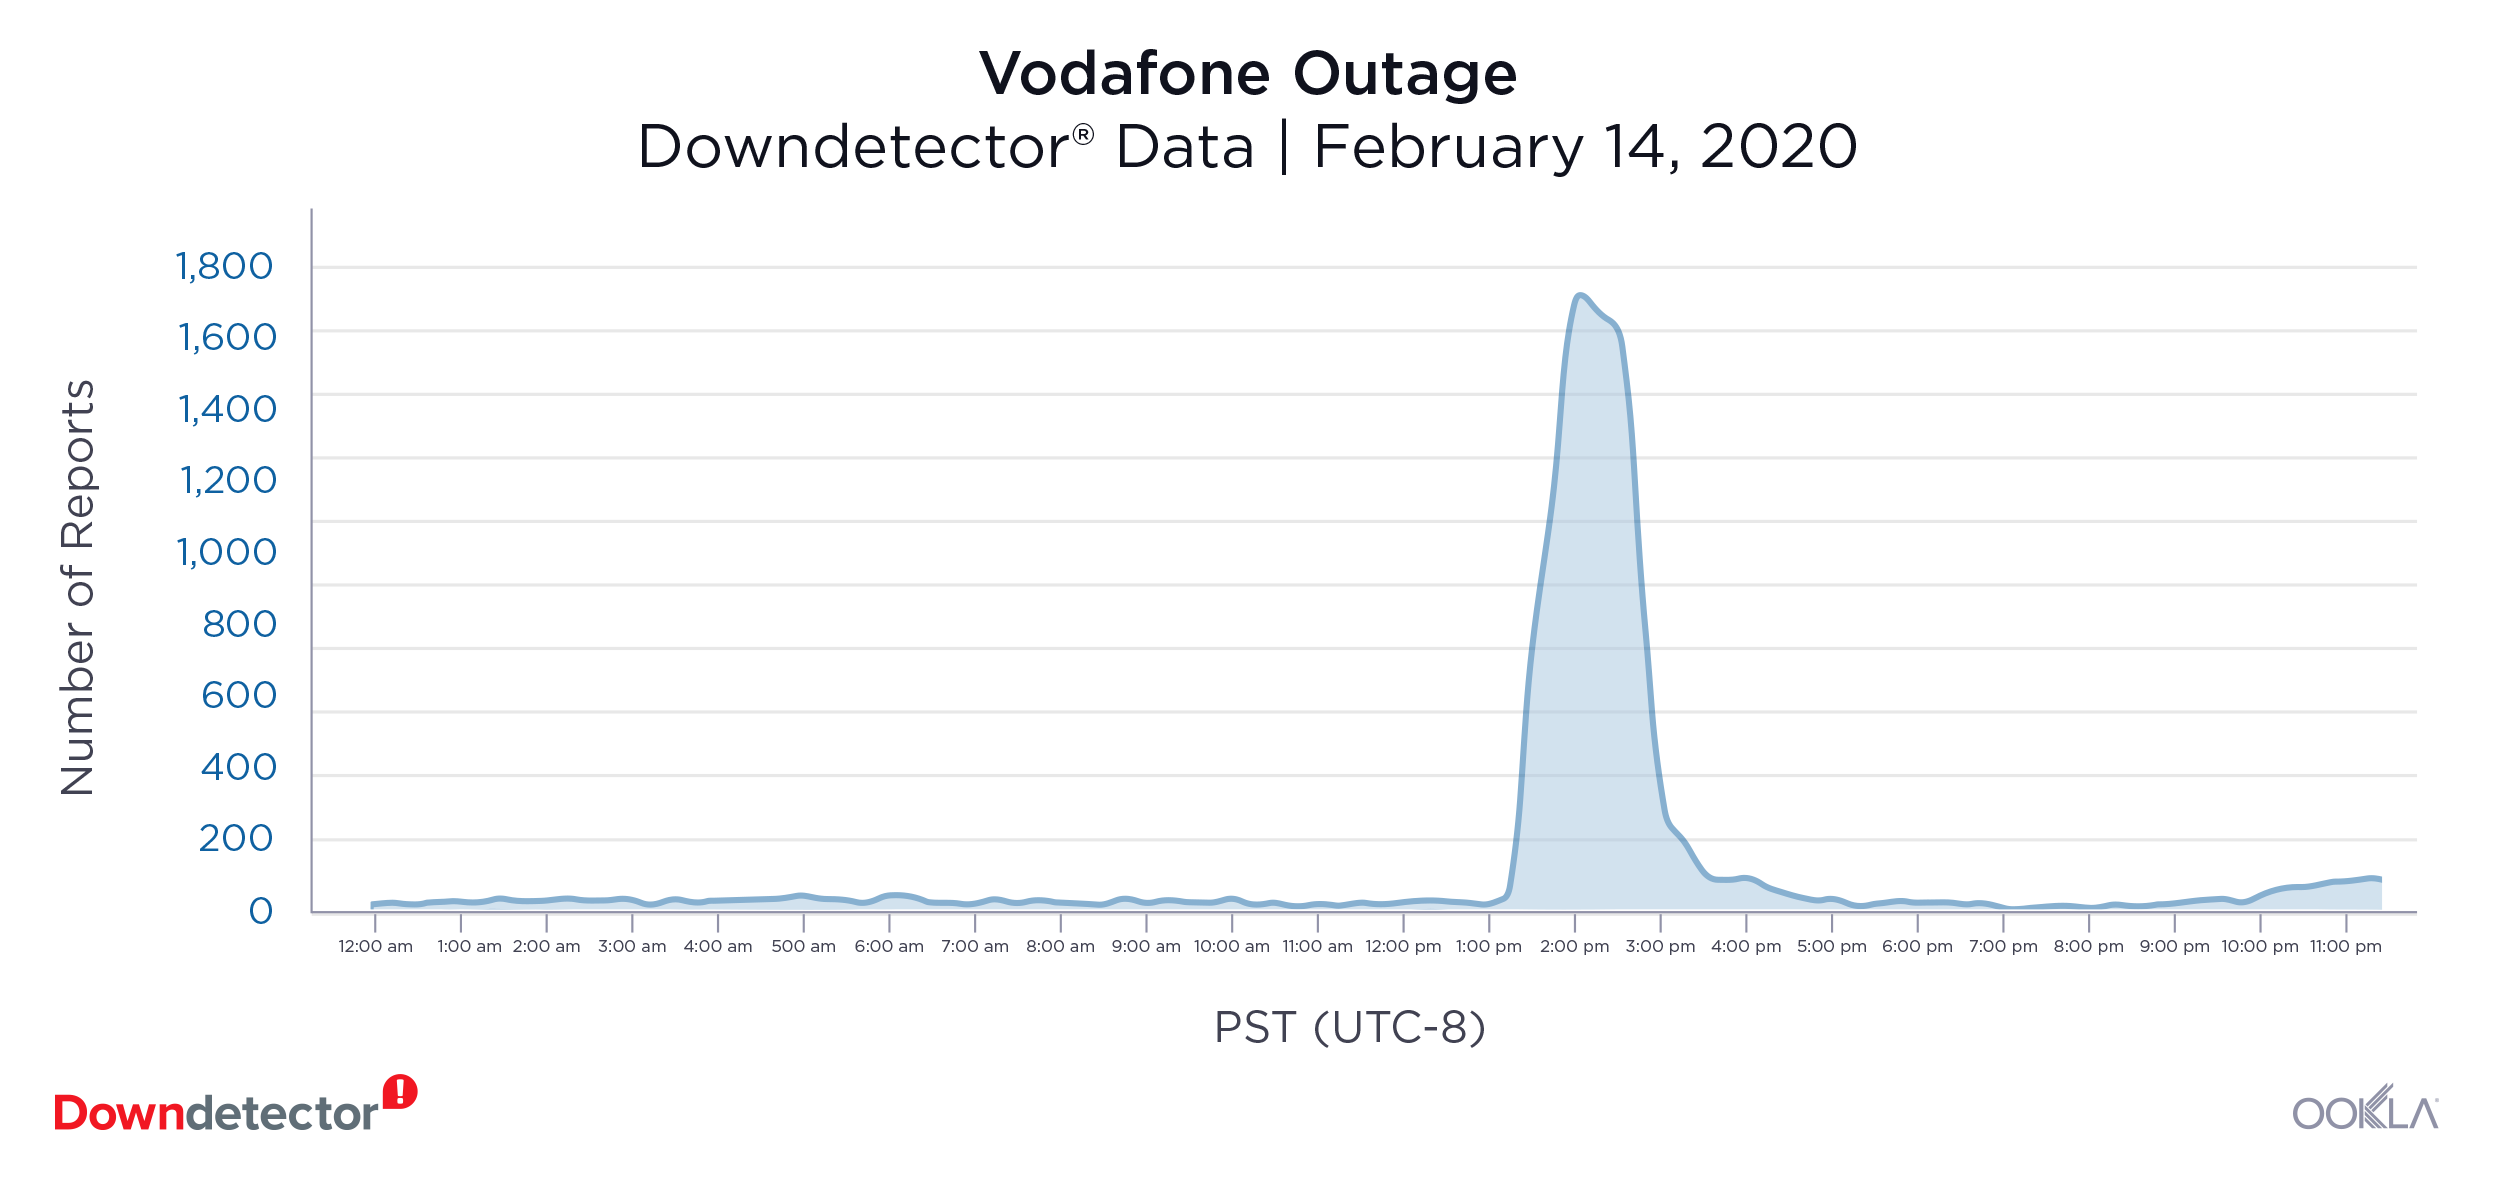
Vodafone users in Italy reported having problems with their mobile service on February 14. The outage lasted four hours and peaked at 1,733 reports. Users also reported problems with their mobile internet connection.

United States

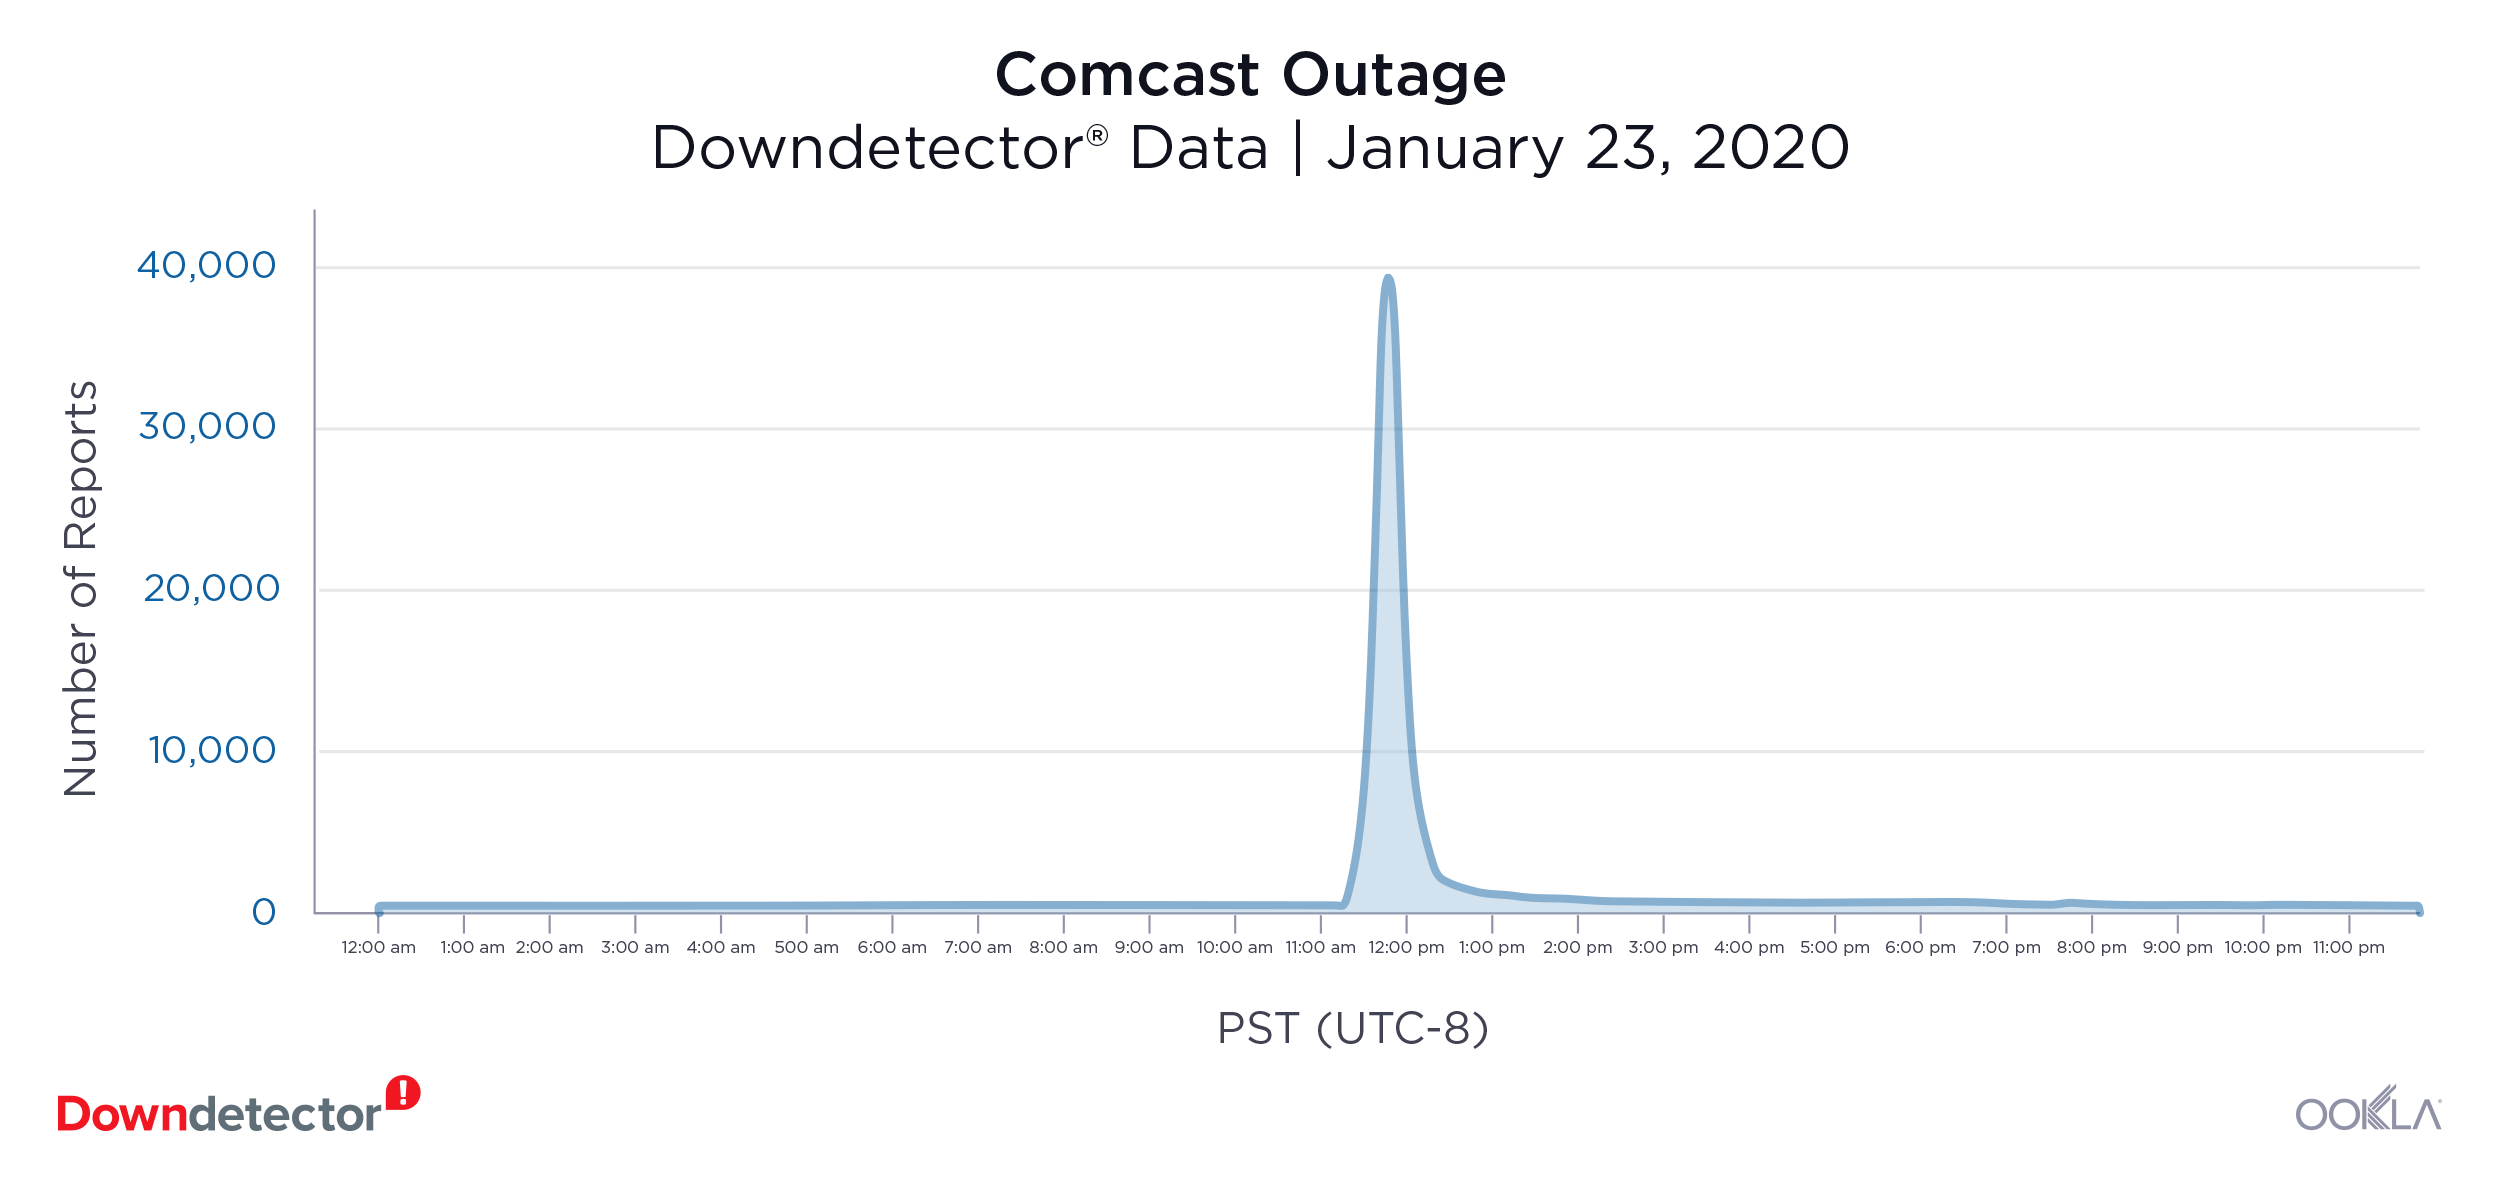
Comcast (January 23): 39,638 reports at peak

8-Comcast
The U.S. internet service provider experienced a major outage on January 23. The outage lasted for two hours with 39,638 reports at the peak of the outage. Weeks later, the service experienced a smaller outage on March 3 with 1,124 reports during the peak.

United Kingdom

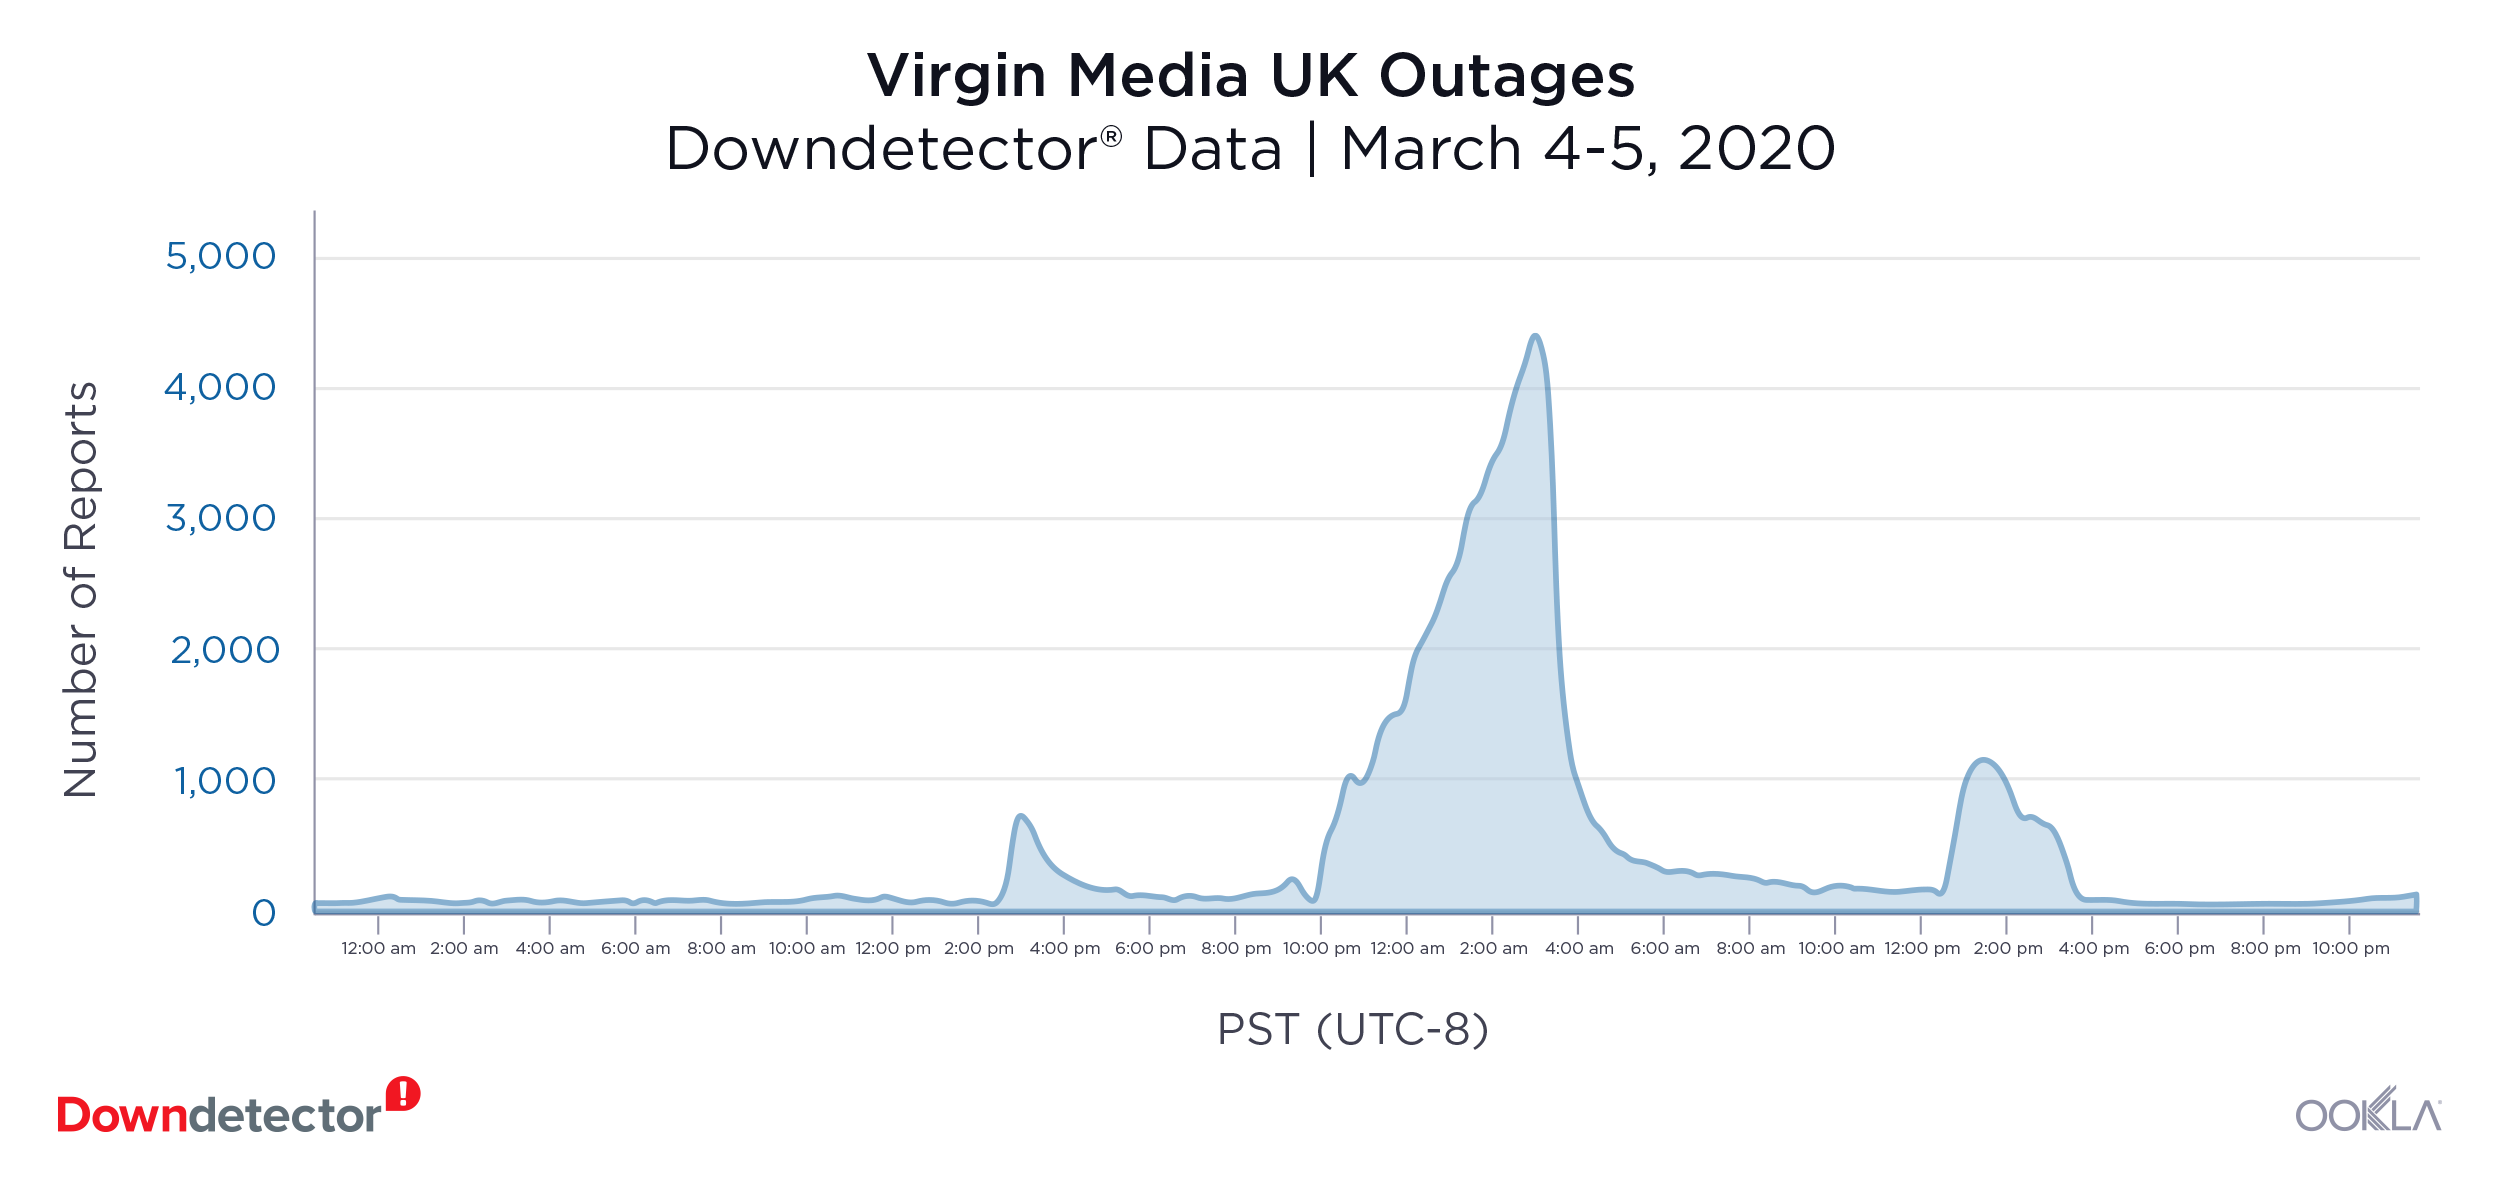
Virgin Media (March 4-5): 4,348 reports at peak

9-Virgin-UK
Users in the U.K. reported their internet service was not working during Virgin Media’s outage starting on March 4 and continuing through March 5. The outage peaked on March 5 when 4,348 users reported issues.

Social Media

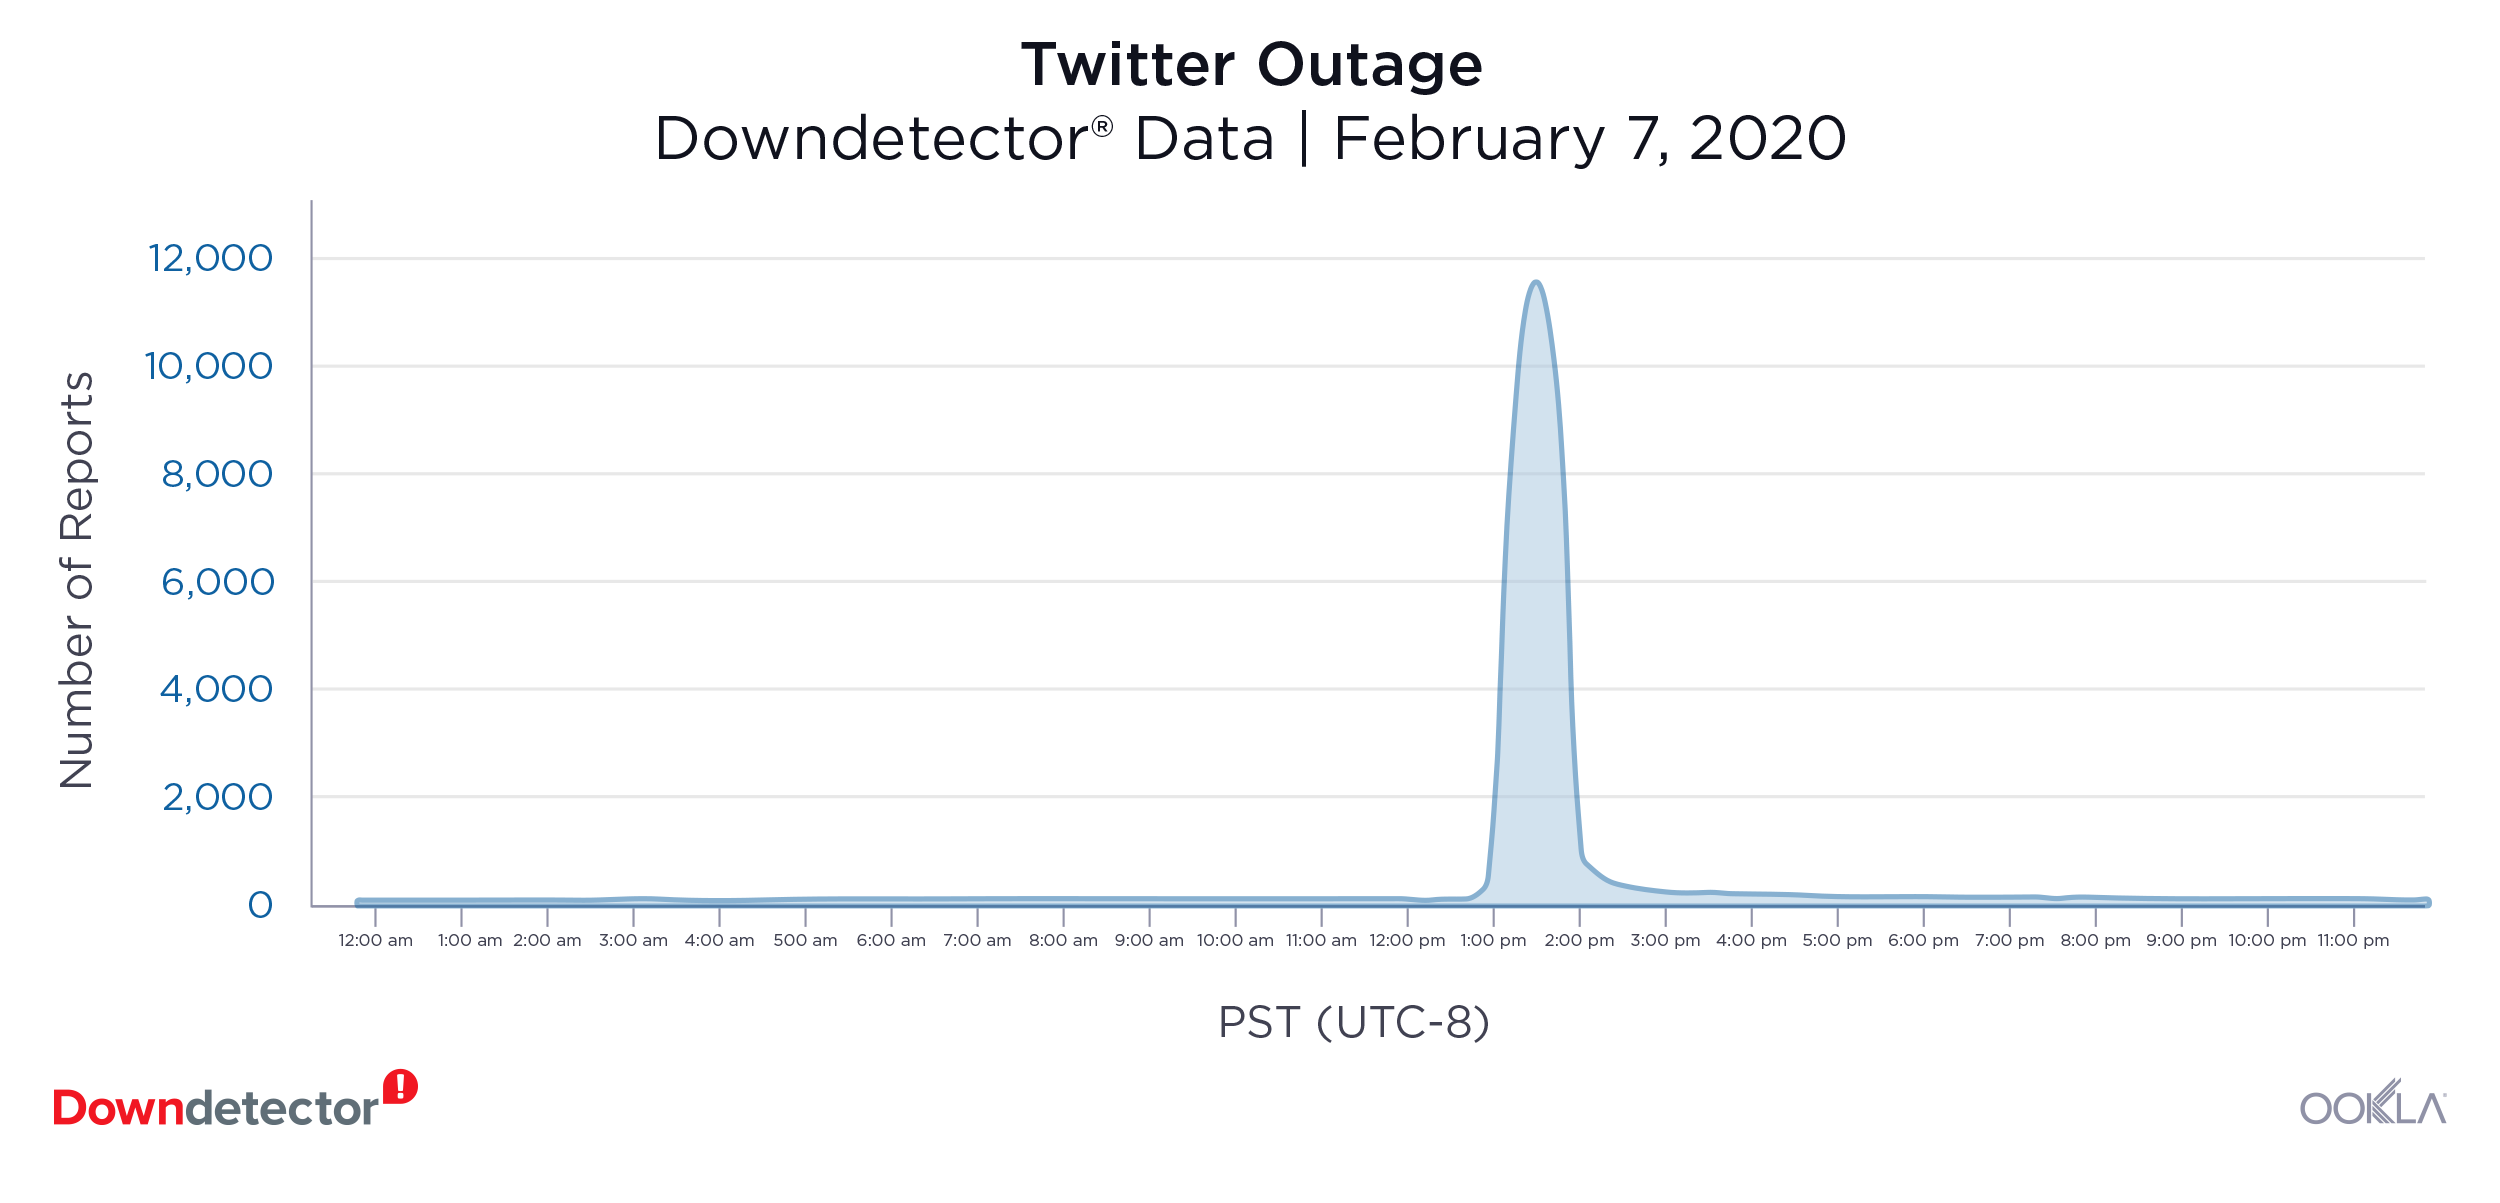
Twitter (February 7): 11,542 reports at peak

10-Twitter-1
The largest social media outage in Q1 2020 belonged to Twitter. On February 7, users in the Twitterverse were unable to tweet, retweet or like tweets for about two hours. Over 11,500 U.S. users reported problems during the peak of the outage. Users in Germany, Japan and the U.K. also reported problems with the platform.

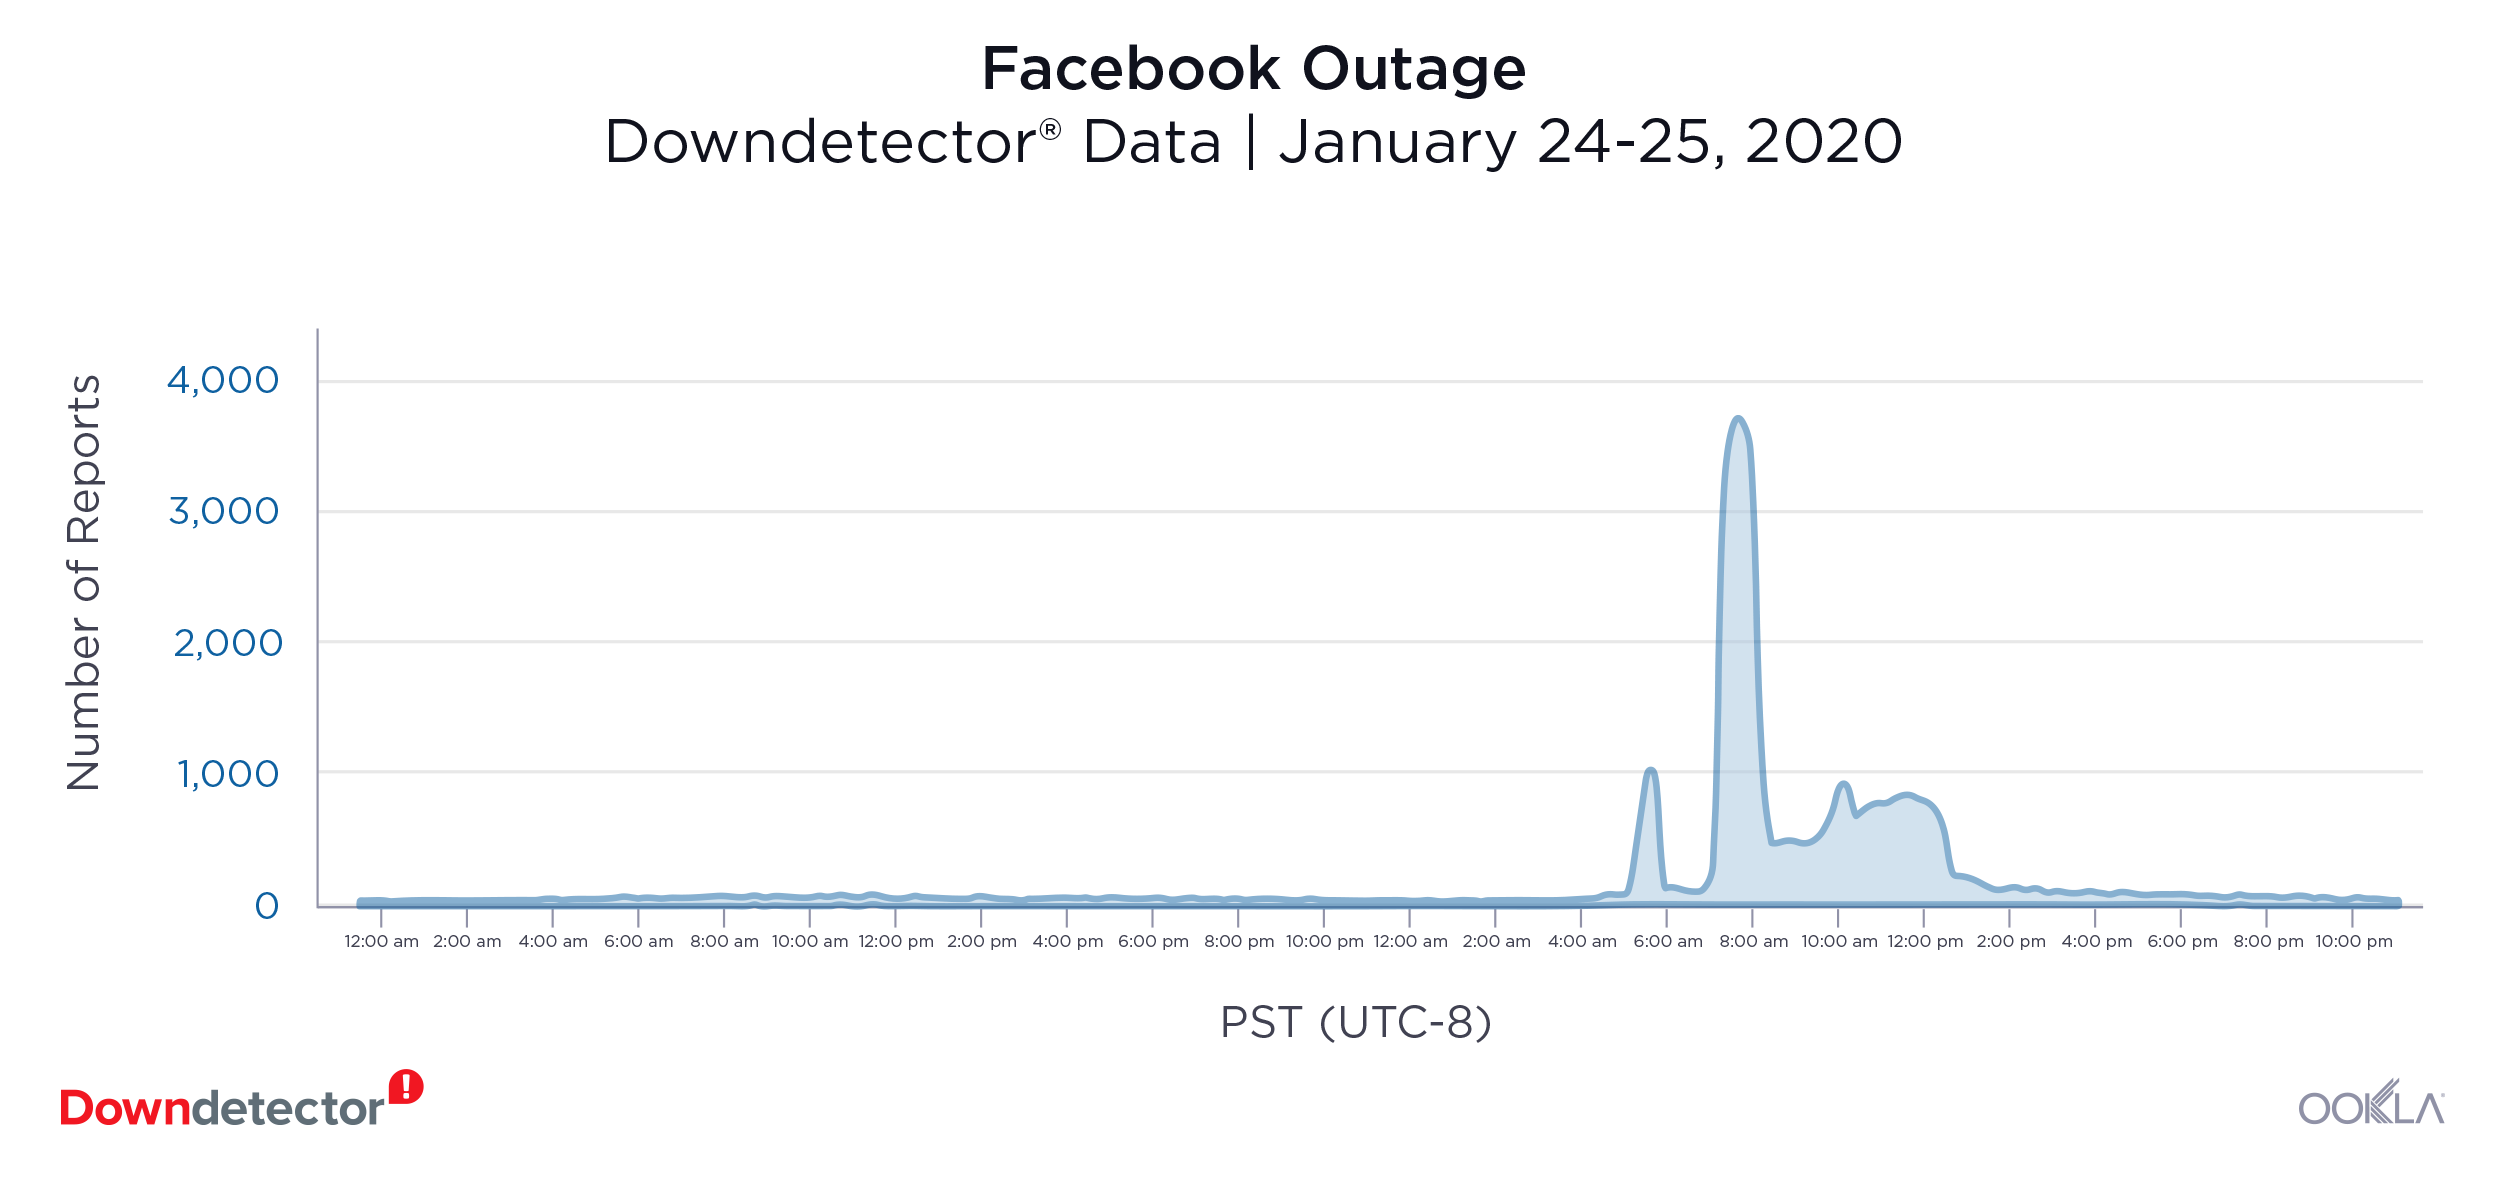
Facebook (January 24-25): 3,718 reports at peak

11-Facebook
Facebook users reported problems with the site on Downdetector starting on January 24. Most users reported problems with their newsfeed or the inability to log in to the social media platform. At the peak of the outage, there were 3,718 reports from users in the U.S. Users in Germany and the U.K. also reported problems that day. Users were still experiencing issues through January 25.

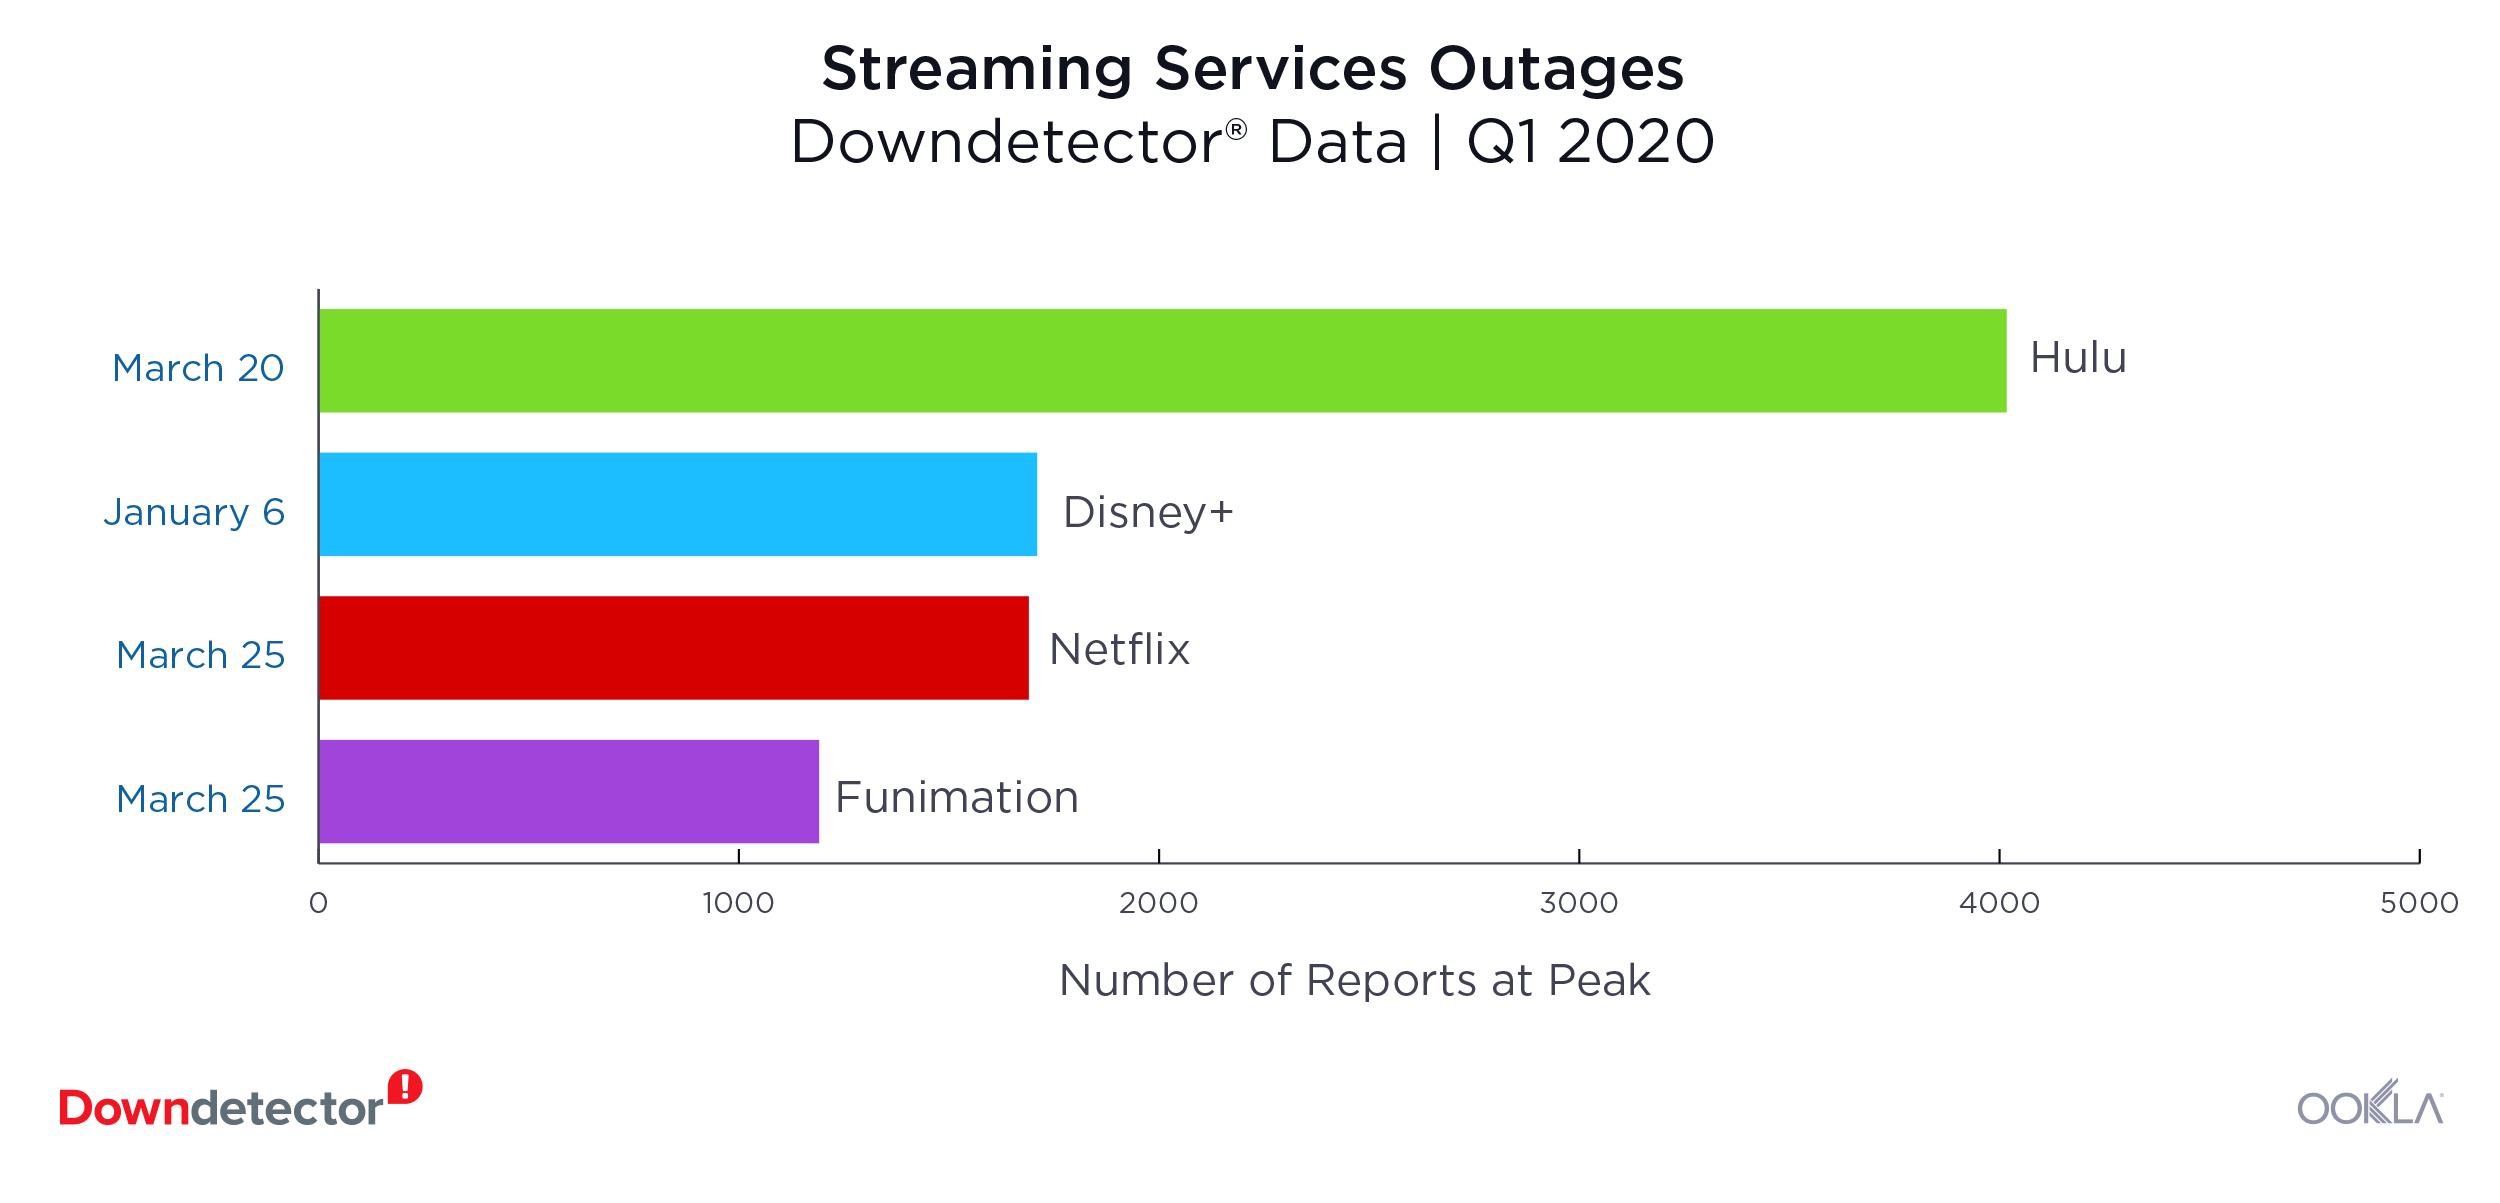
Streaming Services

Streaming-bar-outages

Hulu (March 20): 4,017 reports at peak

People hoping to binge-watch their favorite shows while in quarantine were disappointed to find Hulu was down on March 20. Users complaints on Downdetector included not being able to log in or of the player not working properly. The outage lasted approximately two hours.

Disney+ (January 6): 1,710 reports at peak

Disney + experienced an outage at the beginning of Q1 2020 that reached 1,710 reports at the peak. For an hour, users in the U.S. reported they were unable to log in to the platform.

Netflix (March 25): 1,690 reports at peak

For two hours on March 25, thousands of Netflix users were unable to stream their favorite shows. At the peak of Nexflix’s biggest outage in Q1 2020, 1,690 users reported problems in the U.S.

Funimation (March 25): 1,191 reports at peak

Anime lovers in the US reported problems with Funimation towards the end of Q1 2020. Most users complained of not being able to log in to the service for about an hour that day. There were 1,191 reports at the peak of the outage.

Financial Services

Robinhood (multiple outages)

robinhood-barchart

Robinhood had multiple fumbles during Q1 2020, leaving users frustrated with the financial service. The most significant outage took place on March 2 with 14,429 reports at the peak of the outage. Robin Hood experienced additional outages on March 3 and March 9 with 3,538 and 3,119 reports during the respective peaks.

Is an outage disrupting your day? You’re not alone. Find out if there’s an outage and bond with other frustrated users on Downdetector and read about other significant outages here.

Editor’s note: This article was updated on April 14 to clarify the Steam section and related graphic.

Ookla retains ownership of this article including all of the intellectual property rights, data, content graphs and analysis. This article may not be quoted, reproduced, distributed or published for any commercial purpose without prior consent. Members of the press and others using the findings in this article for non-commercial purposes are welcome to publicly share and link to report information with attribution to Ookla.

| March 31, 2020

Exploring Internet Performance in Malaysia

Internet performance in Malaysia as a whole is similar to performance in other major Southeast Asian markets, but performance within Malaysia varies greatly at the state and city level. This article explores the current state of Malaysia’s fixed broadband and mobile network performance, including data on: internet speeds, latency and 4G Availability at the country level. We include information on how Malaysia compares to major Southeast Asian countries and examines performance variations across Malaysian states and cities during Q3-Q4 2019.

Malaysia’s fixed broadband ranks third in Southeast Asia

Ookla_Fixed_Speeds_Chart_Malaysia_0320
We compared Malaysia’s fixed broadband performance at the country level to other major markets in Southeast Asia during Q3-Q4 2019. Singapore ranked first on our list for both download and upload speeds over fixed broadband with a mean download speed of 191.89 Mbps and a mean upload speed of 199.32 Mbps. Malaysia ranked third for download speed with a mean speed of 76.69 Mbps. Indonesia had the slowest mean download and upload speeds over fixed broadband during this period. At 20.49 Mbps, Indonesia’s mean download speed was 836.6% slower than that of Singapore.

Thailand showed the highest increase in mean download speed over fixed broadband during Q3-Q4 2019 at 59.4%. Vietnam, the Philippines and Malaysia had more modest increases in mean download speed at 11.8%, 11.3% and 9.1%, respectively. Indonesia followed Malaysia with a 5.4% increase in mean download speed over fixed broadband. Singapore’s mean download speed increased only by 4.2% during this period.

Speedtest data for latency in major Southeast Asian markets during Q3-Q4 2019 revealed Vietnam had the lowest latency on the list at 9 ms. Singapore was second at 11 ms, Malaysia was in a less favourable fifth place with a latency of 24 ms, followed only by the Philippines with the highest latency on the list at 34 ms.

Malaysia ranks fourth in Southeast Asia for mobile broadband download speed

Ookla_Mobile_Speeds_Chart_Malaysia_0320
During Q3-Q4 2019, Singapore had the fastest mean download speed on mobile in major Southeast Asian markets at 52.28 Mbps, followed by Vietnam at 26.28 Mbps. Malaysia ranked fourth for mean download speed over mobile with 22.12 Mbps, while Indonesia was last with 12.65 Mbps.

Rankings for mean upload speed over mobile during Q3-Q4 2019 followed almost the same rankings as we saw for download speed with Singapore at the top of the list at 19.62 Mbps. Malaysia ranked fourth with a mean upload speed of 11.40 Mbps over mobile. In this category, the Philippines ranked last with a mean upload speed of 7.12 Mbps on mobile.

Thailand experienced the largest increase in mobile download speed during Q3-Q4 2019 at 28.7%. Vietnam followed closely with an increase of 23.5% in mean download speed. Malaysia was third with an increase of 11.8% in mean download speed on mobile broadband, only slightly better than the 6.4% increase in mean download speed in the Philippines.

Malaysia was second only to the Philippines for mobile latency during Q3-Q4 2019 at 29 ms. Thailand had the highest latency on this list at 52 ms.

How Malaysian mobile operators are preparing for 5G

Malaysian mobile operators spent the better half of 2019 conducting 5G field trials and signing multiple memorandums of understanding (MoUs) with infrastructure vendors in preparation for commercial deployments.

In February 2019, Maxis and Huawei signed an MoU under which the two companies agreed to collaborate on 5G field trials. By October, the two companies inked a deal ensuring a full-fledged deployment of 5G equipment and services, which also involves modernizing the existing LTE infrastructure supplied by Huawei.

Similarly, U Mobile and ZTE followed up with an MoU in March, but the operator signed a three-year contract with Nokia in which the vendor will supply Single RAN and transport infrastructure, paving the way towards commercial 5G rollouts.

According to the Malaysian Communications and Multimedia Commission (MCMC), 5G commercial rollouts are projected for Q3 2020 using spectrum allocations in the 700MHz, 3.5GHz and 26GHz-28GHz millimeter wave frequency bands.

In January 2020, numerous 5G related announcements were made by Malaysian operators. Telekom Malaysia and Digi Telecommunications announced a 5G demonstration project during which the two operators will be exploring both mobile and fixed 5G use cases. Under this project, Digi will operate Radio Access and Core network while leveraging fiber backhaul provided by Telekom Malaysia. The two operators also explored 5G network sharing possibilities. In parallel, Telekom Malaysia and U Mobile joined forces to explore network sharing opportunities both with shared and dedicated spectrum licenses. This will help the two operators better understand the economic and technological efficiencies associated with 5G network sharing.

We have been tracking the progress of 5G testing across Malaysia using Speedtest data and have seen multiple operators achieve download speeds over 1 Gbps, upload speeds over 100 Mbps and single-digit latency. Celcom and Maxis have successfully conducted 5G MOCN (Multi Operator Core Network) limited trials, reaching peak download speeds of over 1.1 Gbps. MOCN functionality allows two or more operators to use the same radio access network while maintaining individual network cores. During the same month, Telekom Malaysia successfully tested standalone 5G using aggregated 700MHz and 3.5GHz achieving a downlink throughput of 1.5 Gbps.

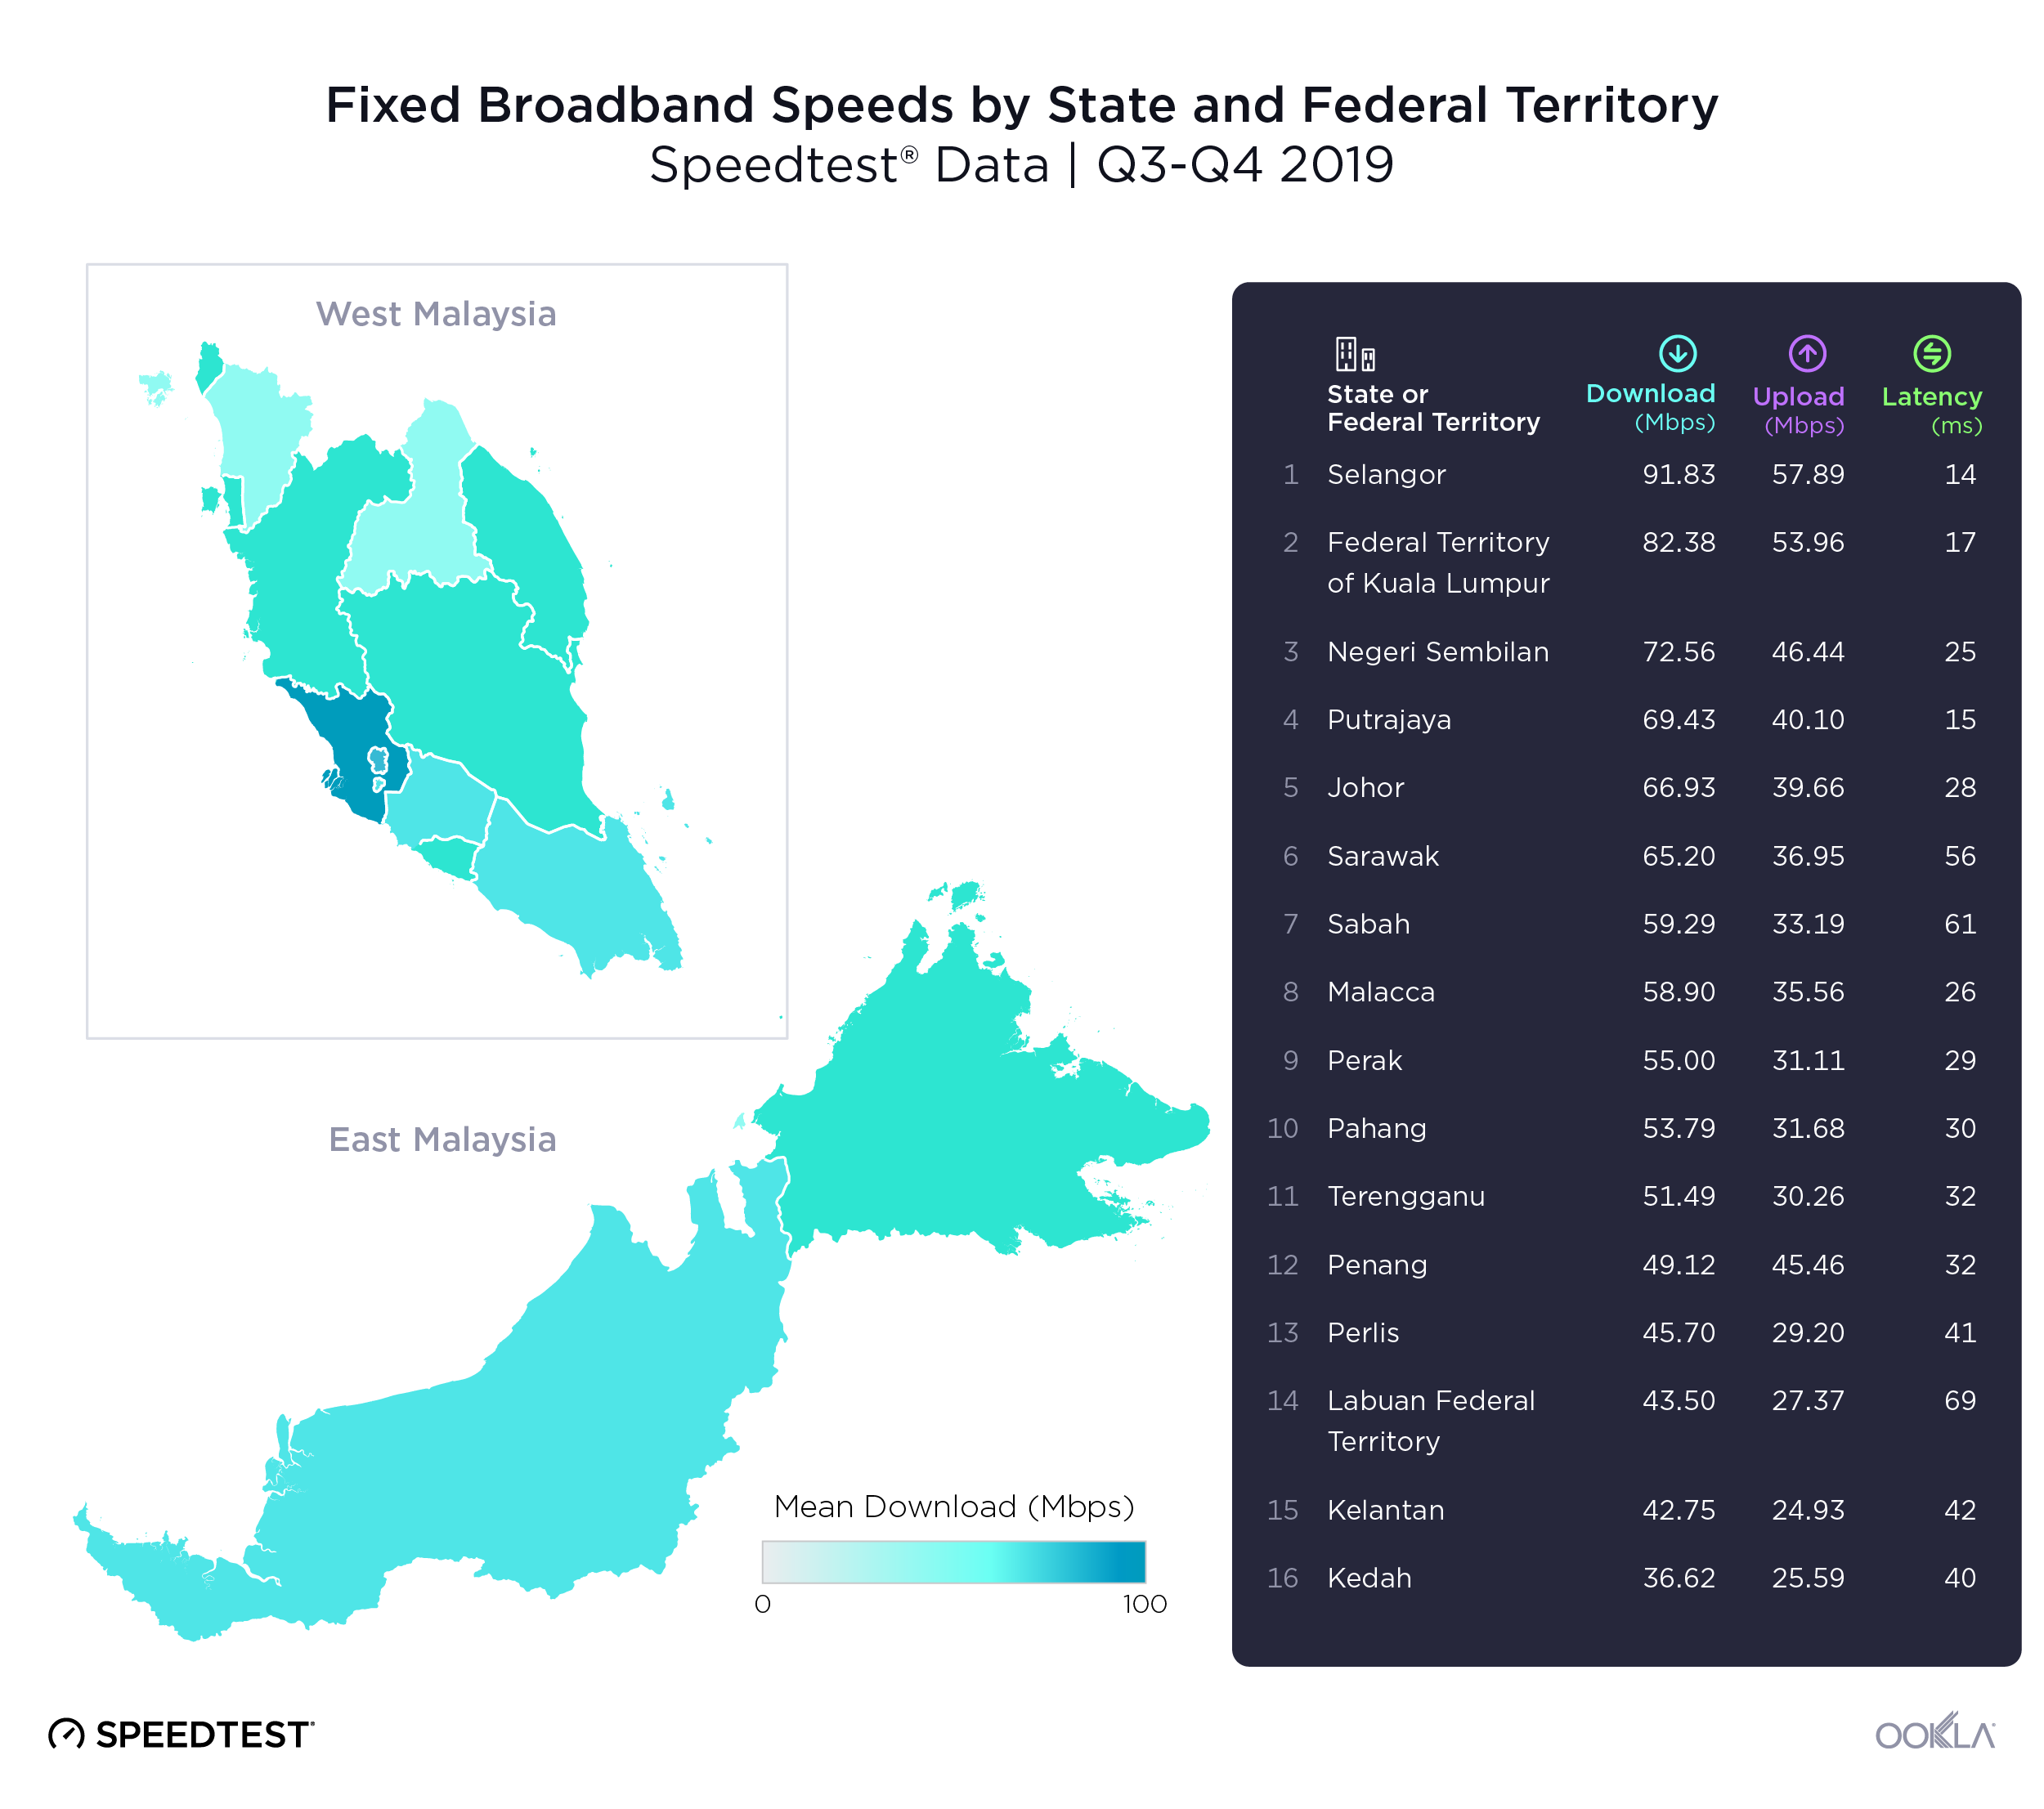
Selangor had the fastest fixed broadband in Malaysia

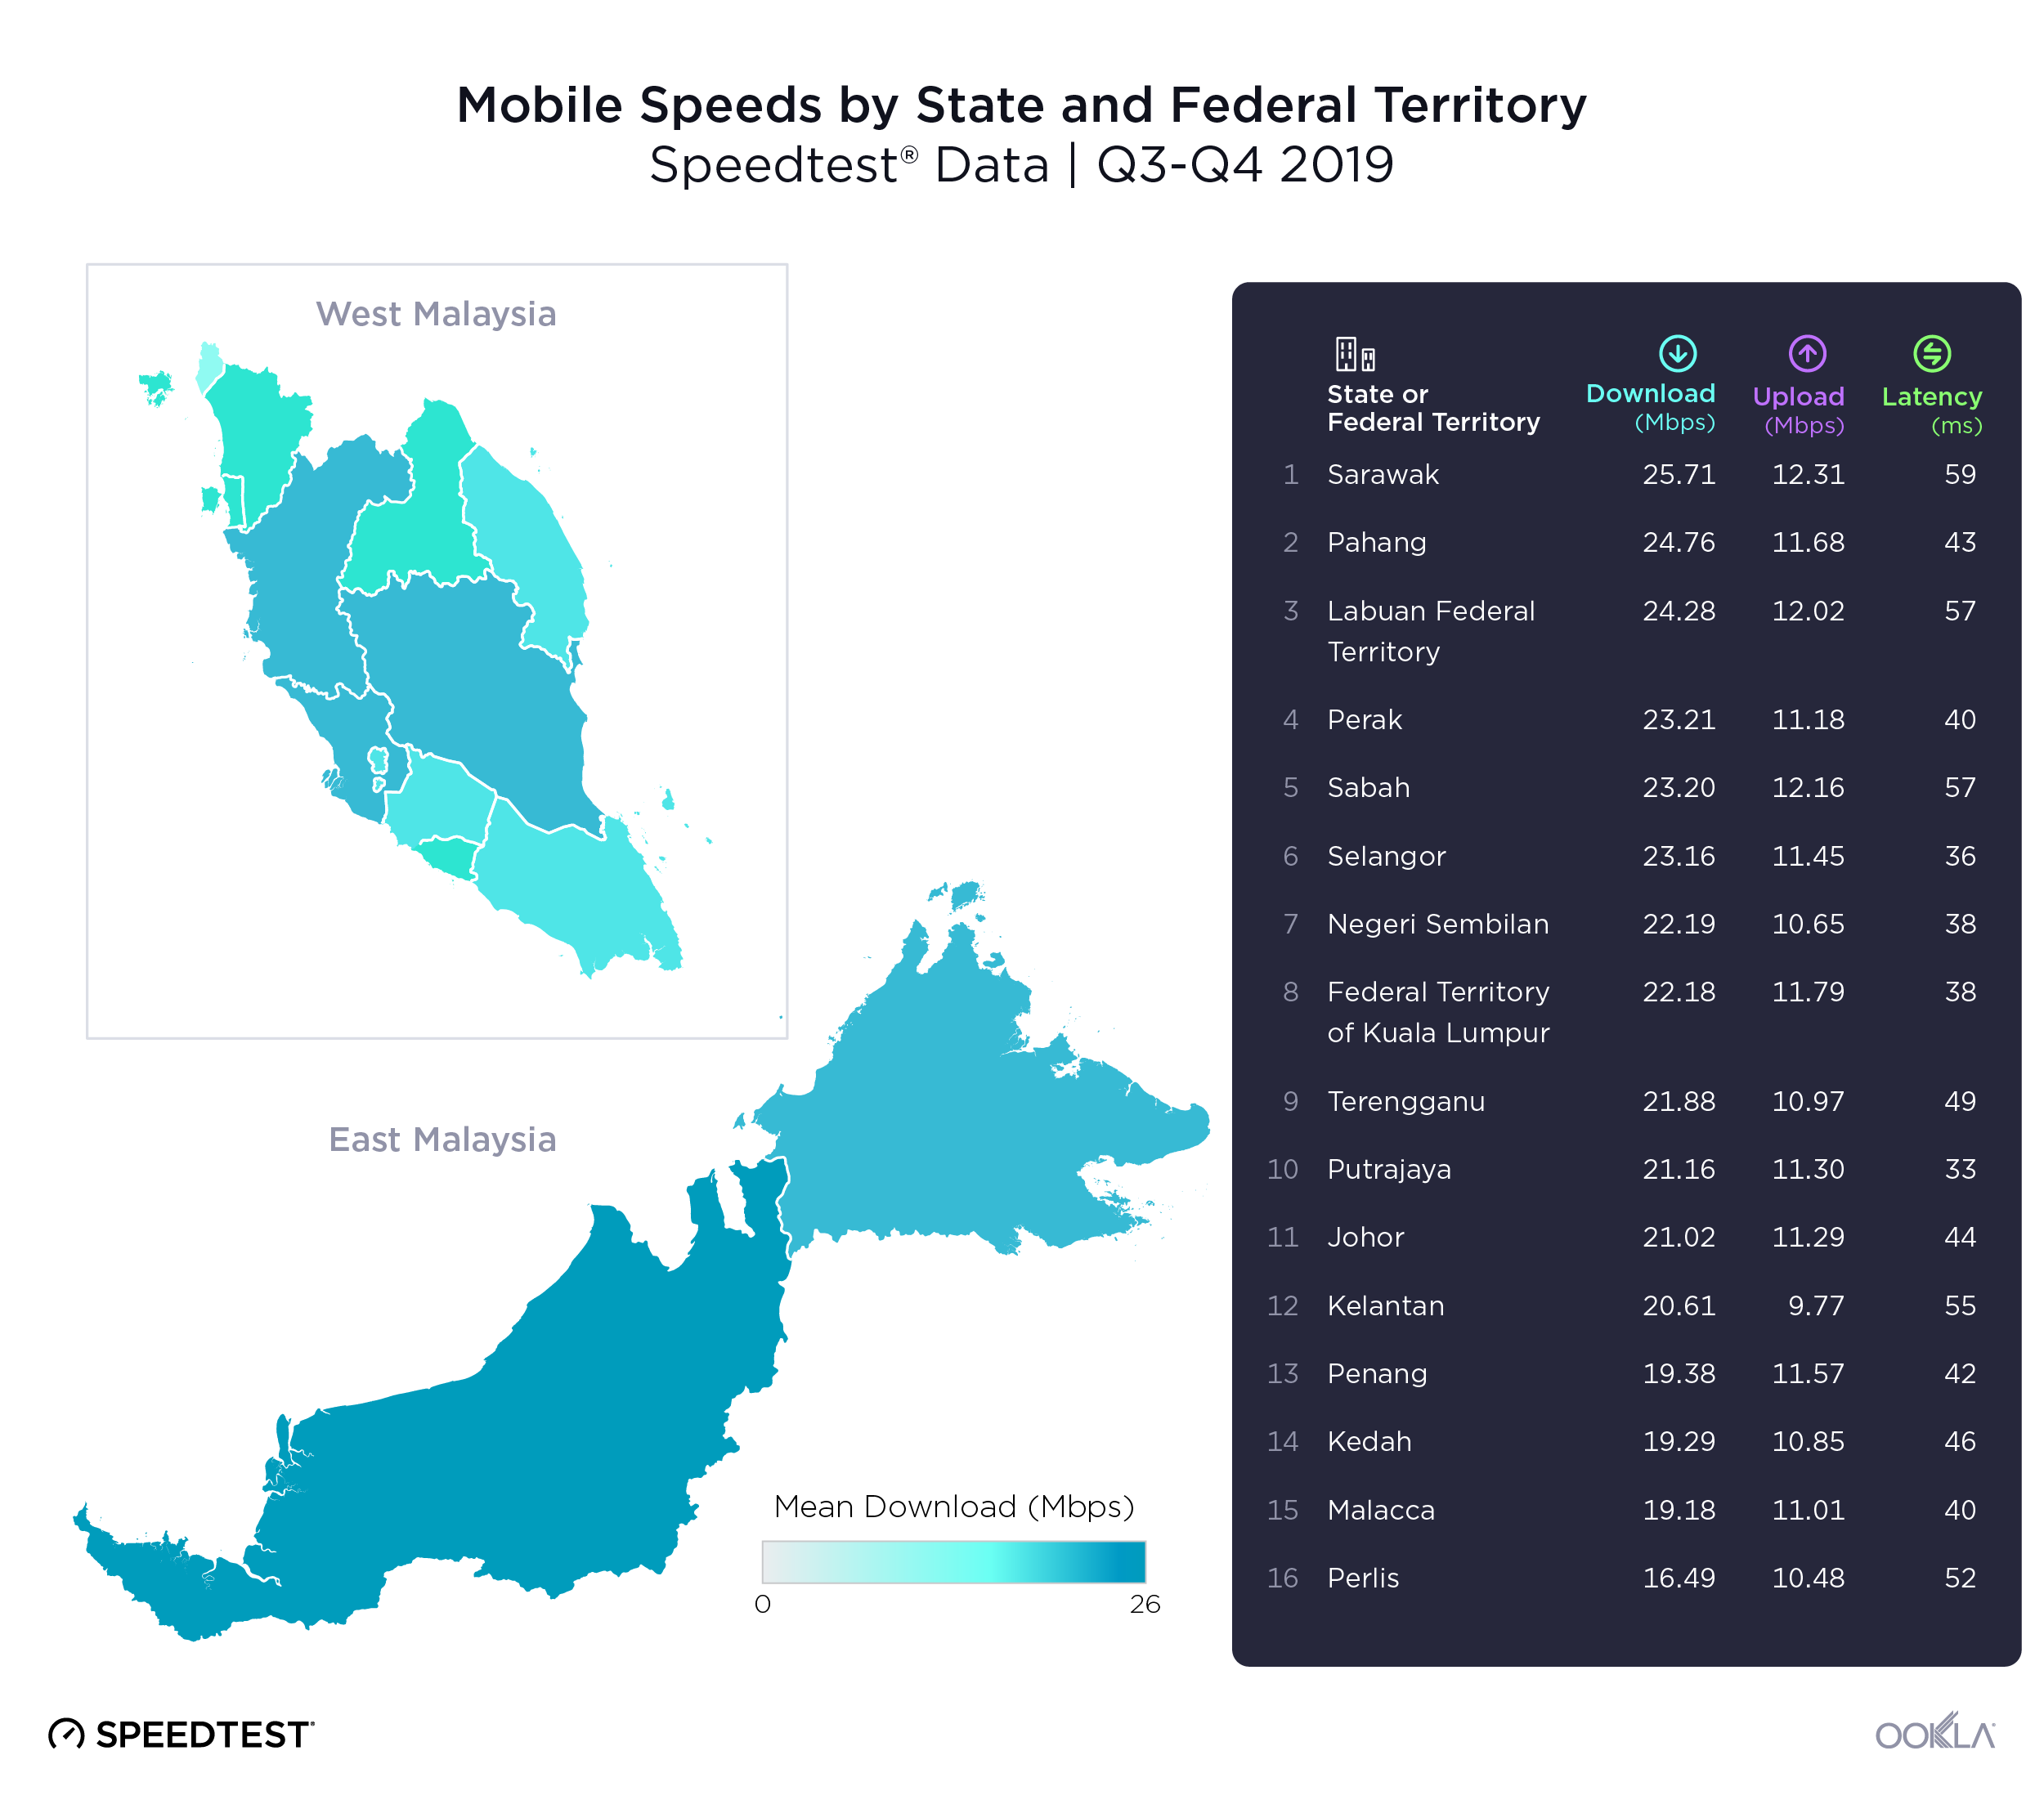
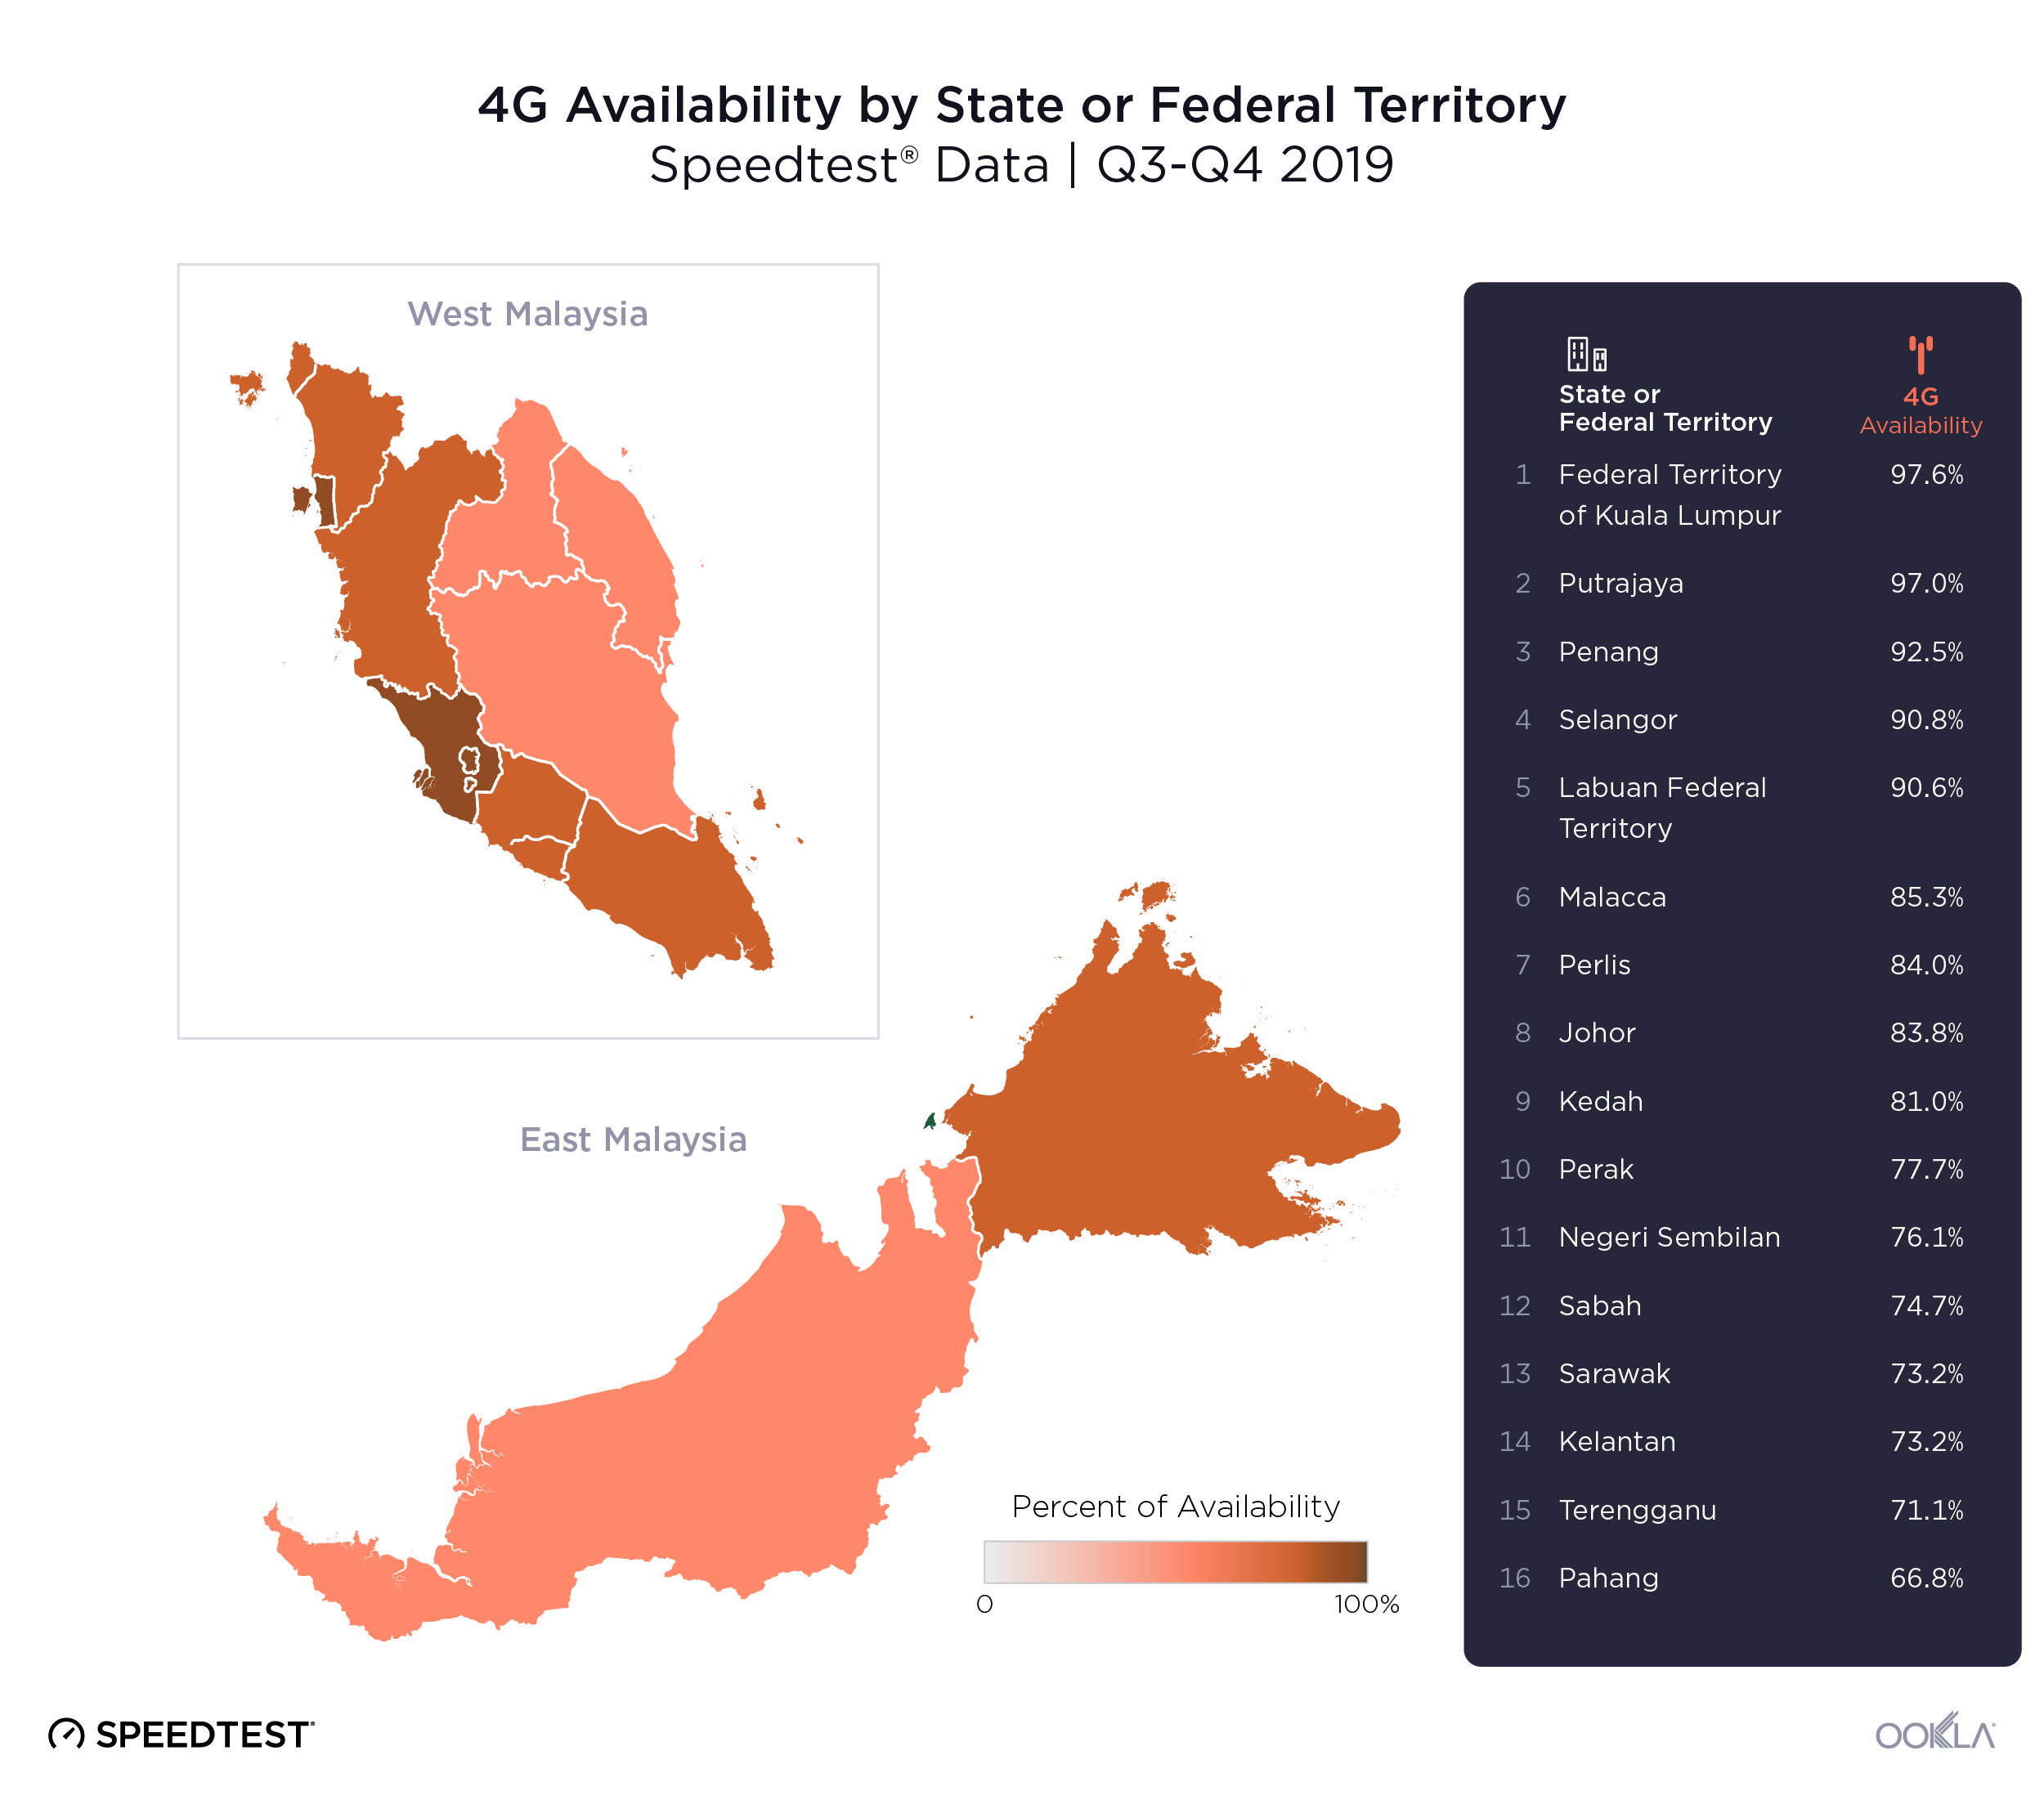
We explored internet speeds and 4G Availability in Malaysia’s 13 states and 3 federal territories using Speedtest data during Q3-Q4 2019.
Ookla_Malaysia_States_Fixed-Broadband-Speeds_0320
Selangor had the fastest mean download and upload speeds on fixed broadband during Q3-Q4 2019, as well as having the lowest latency (14 ms). Mean download speeds on fixed broadband ranged from a high of 91.83 Mbps in Selangor to a low of 36.62 Mbps in Kedah, a 60.1% difference. Selangor’s mean upload speed over fixed broadband was 57.89 Mbps while Kelantan had the slowest mean upload speed over fixed broadband at 24.93 Mbps. Labuan had the highest latency at 69 ms over fixed broadband during this period.
Ookla_Malaysia_States_Mobile-Speeds_0320
The difference between fastest and slowest speeds on mobile broadband was smaller than that of fixed broadband. Sarawak led the group with the fastest mean download and upload speeds on mobile broadband at 25.71 Mbps and 12.31 Mbps, respectively. Perlis was slowest with a mean download speed of 16.49 Mbps, a 35.9% difference. Kelantan had the slowest mean upload speed on mobile at 9.77 Mbps. Latency rankings over mobile were very different among the states and territories than those for speeds. The Federal Territory of Putrajaya had the lowest mobile latency during Q3-Q4 2019 at 33 ms. Sarawak had the highest mobile latency at 59 ms during this period.

4G dominates throughout Malaysia

Ookla_Malaysia_Best-Available-Signal_0320
The map above illustrates the best available mobile technologies throughout the country of Malaysia as represented in Speedtest data. We saw 4G available in most parts of Malaysia that were tested, especially in the western coast of the Malaysian peninsula. The second most prevalent signal was 3G, often found at the edges of places where 4G is more readily available. 2G is the least available signal and is found mostly in East Malaysia, near Brunei. 5G is currently not commercially available in the country, but deployments are expected by Q3 2020.
Ookla_Malaysia_States_4G-Availability_0320
The Federal Territory of Kuala Lumpur had the highest 4G Availability with 97.6% of tested locations showing access to 4G during Q3-Q4 2019. Pahang had the lowest 4G Availability at 66.8%.

Kuala Lumpur was fastest city for fixed broadband

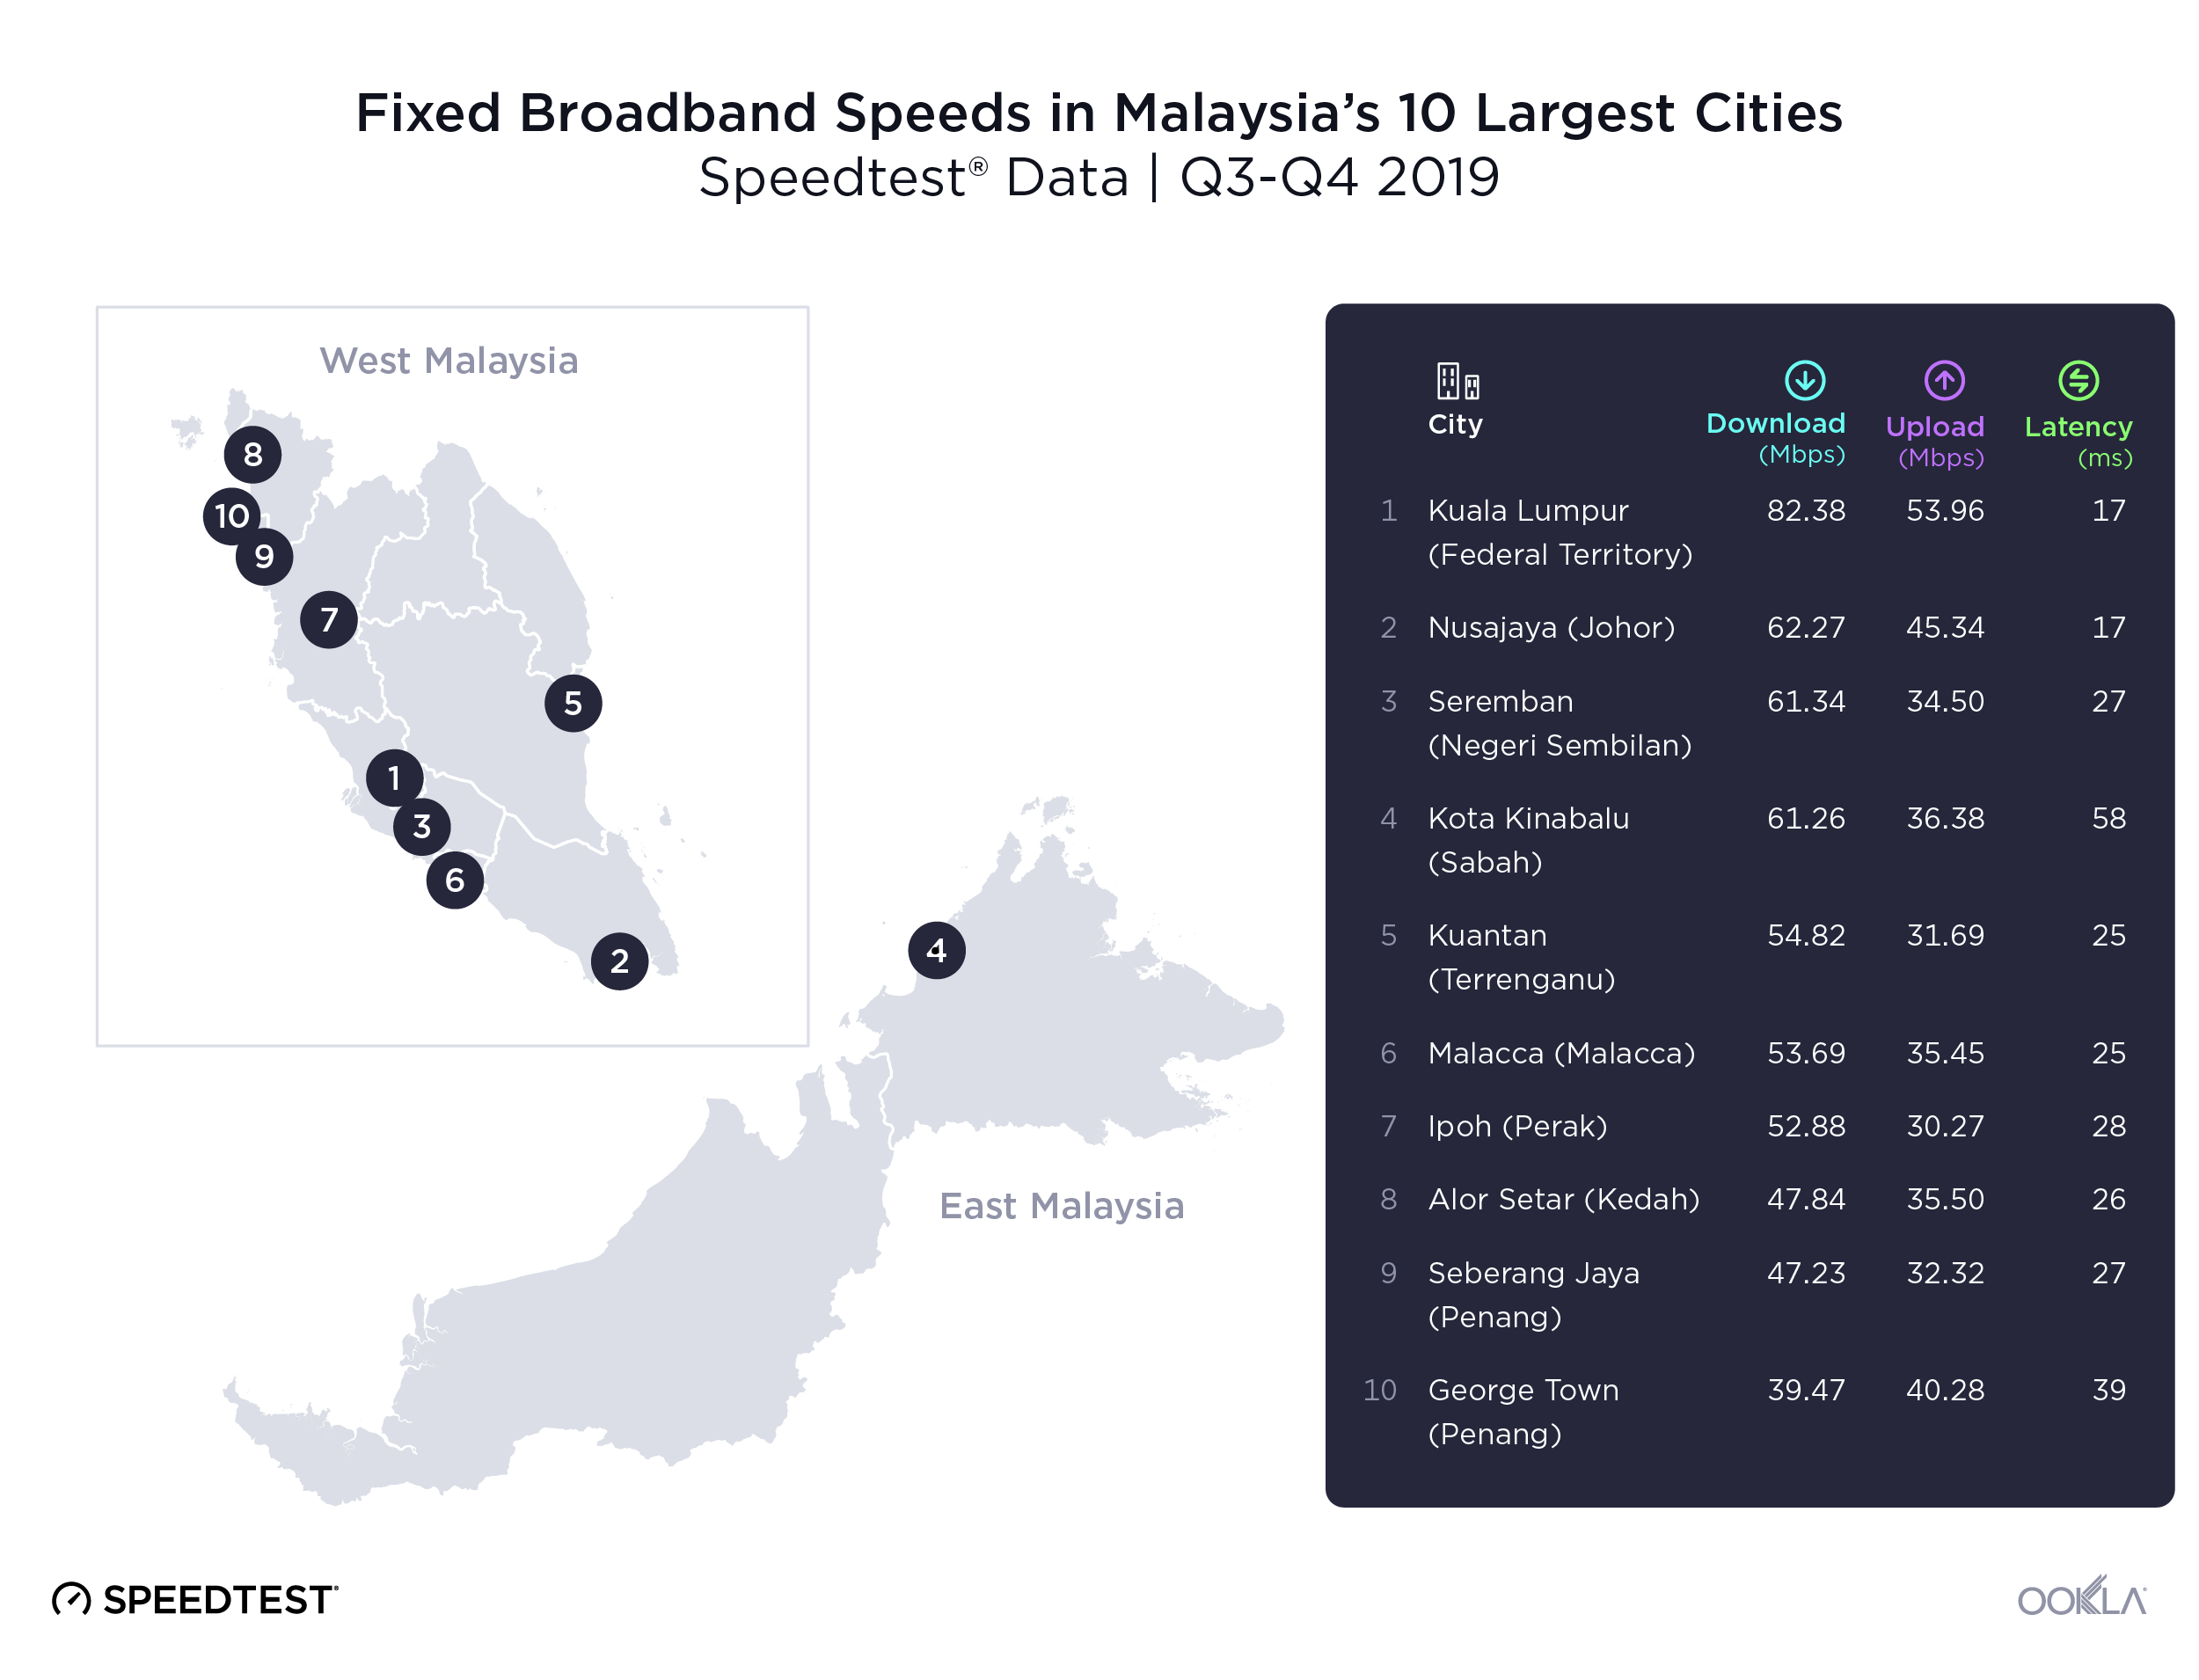
Speedtest data on internet speeds and 4G Availability in Malaysia’s 10 largest cities during Q3-Q4 2019 revealed a stark difference in speeds between cities on fixed broadband. The nation’s capital of Kuala Lumpur led the group with the fastest mean download and upload speeds on fixed broadband at 82.38 Mbps and 53.96 Mbps, respectively. George Town had the slowest mean download speed on fixed broadband at 39.47 Mbps, 52.1% slower than Kuala Lumpur. Ipoh was last for mean upload speed over fixed broadband at 30.27 Mbps, 43.9% slower than Kuala Lumpur.
Ookla_Malaysia_Cities_Fixed-Broadband-Speeds_0320

Kuala Lumpur came on top once again with the lowest mean latency over fixed broadband on the list at 17 ms during Q3-Q4 2019. Kota Kinabalu showed the highest mean latency over fixed broadband at 58 ms.

Nusajaya ranks first among cities for mobile broadband

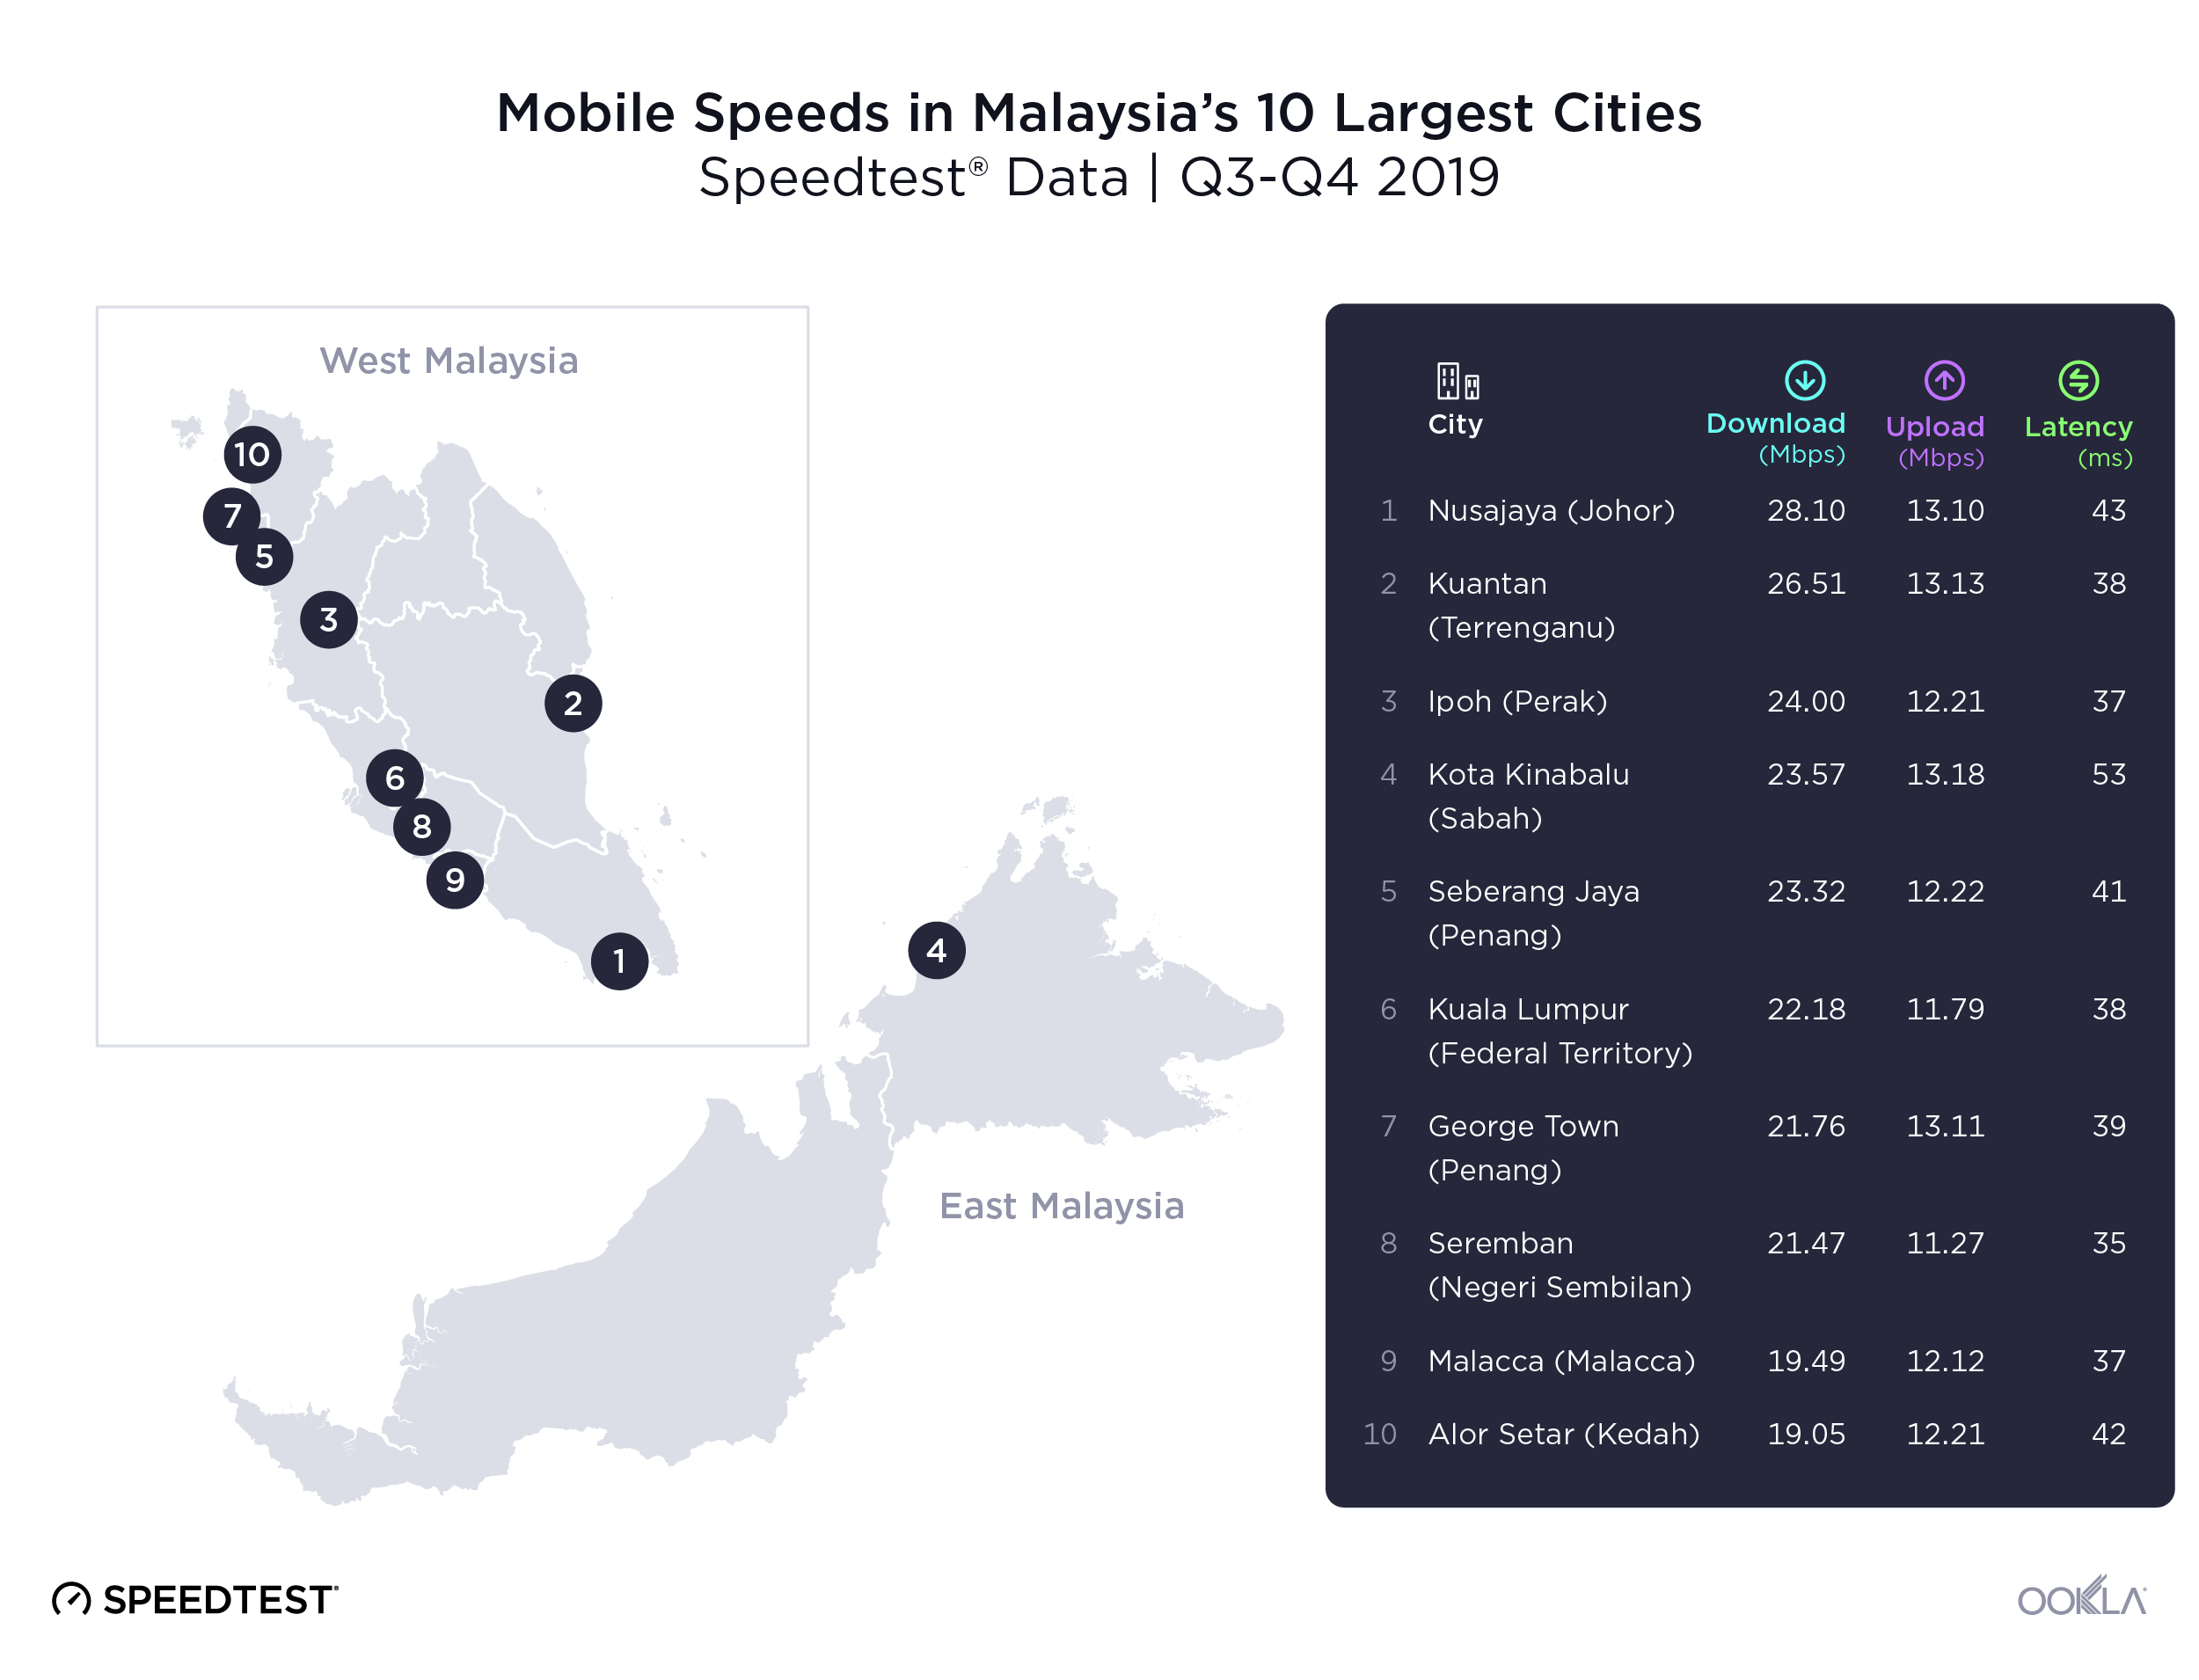
Differences in speed on mobile broadband were not as stark as those on fixed broadband for Malaysia’s ten largest cities during Q3-Q4 2019. First-place Nusajaya showed a mean download speed on mobile of 28.10 Mbps, followed closely by Kuantan at 26.51 Mbps. Alor Setar ranked last with a mean download speed of 19.05 Mbps, a 32.2% difference from Nusajaya.
Ookla_Malaysia_Cities_Mobile-Speeds_0320
Upload speeds on mobile showed a very different ranking from download speeds with Kota Kinabalu first with a mean upload speed of 13.18 Mbps. Kuala Lumpur was second to last at 11.79 Mbps, followed only by Seremban with a mean upload speed of 11.27 Mbps.

Latency over mobile was higher than latency over fixed for most cities during Q3-Q4 2019. First place Seremban had the lowest latency at 35 ms. Kota Kinabalu was last at 53 ms.

We’ll continue to follow Malaysia’s internet speeds, mobile performance and 5G deployments. If you’d like to learn more about internet speeds in Southeast Asia and other markets around the world, click here to read more insights from Ookla.

Editor’s note: This article was updated on March 31 to correct a typo in the second paragraph that incorrectly identified Malaysia’s mean download speed.

Ookla retains ownership of this article including all of the intellectual property rights, data, content graphs and analysis. This article may not be quoted, reproduced, distributed or published for any commercial purpose without prior consent. Members of the press and others using the findings in this article for non-commercial purposes are welcome to publicly share and link to report information with attribution to Ookla.

| March 18, 2020

Set Yourself Up to Effectively Work from Home or Learn Remotely

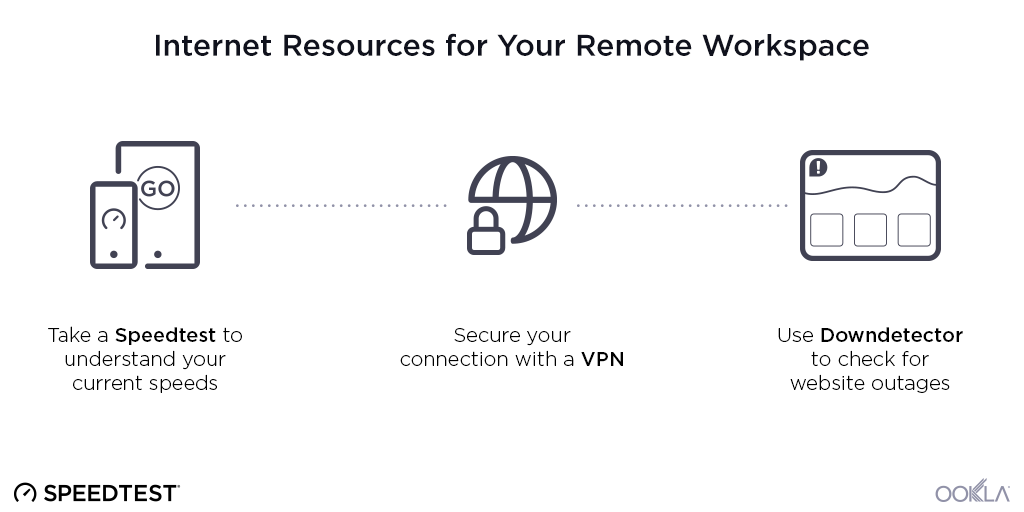
If you’ve suddenly found yourself working from home more often or learning remotely, there are a few things you might want to consider to ensure your new workspace has the internet connectivity and speeds you need to work effectively. We also offer some advice on securing your connection and troubleshooting web outages to keep in mind when making your transition from a traditional in-person experience to a home office or classroom.

wfh-explainer-1

1. Understand your home internet needs and capabilities

How to test your internet speed

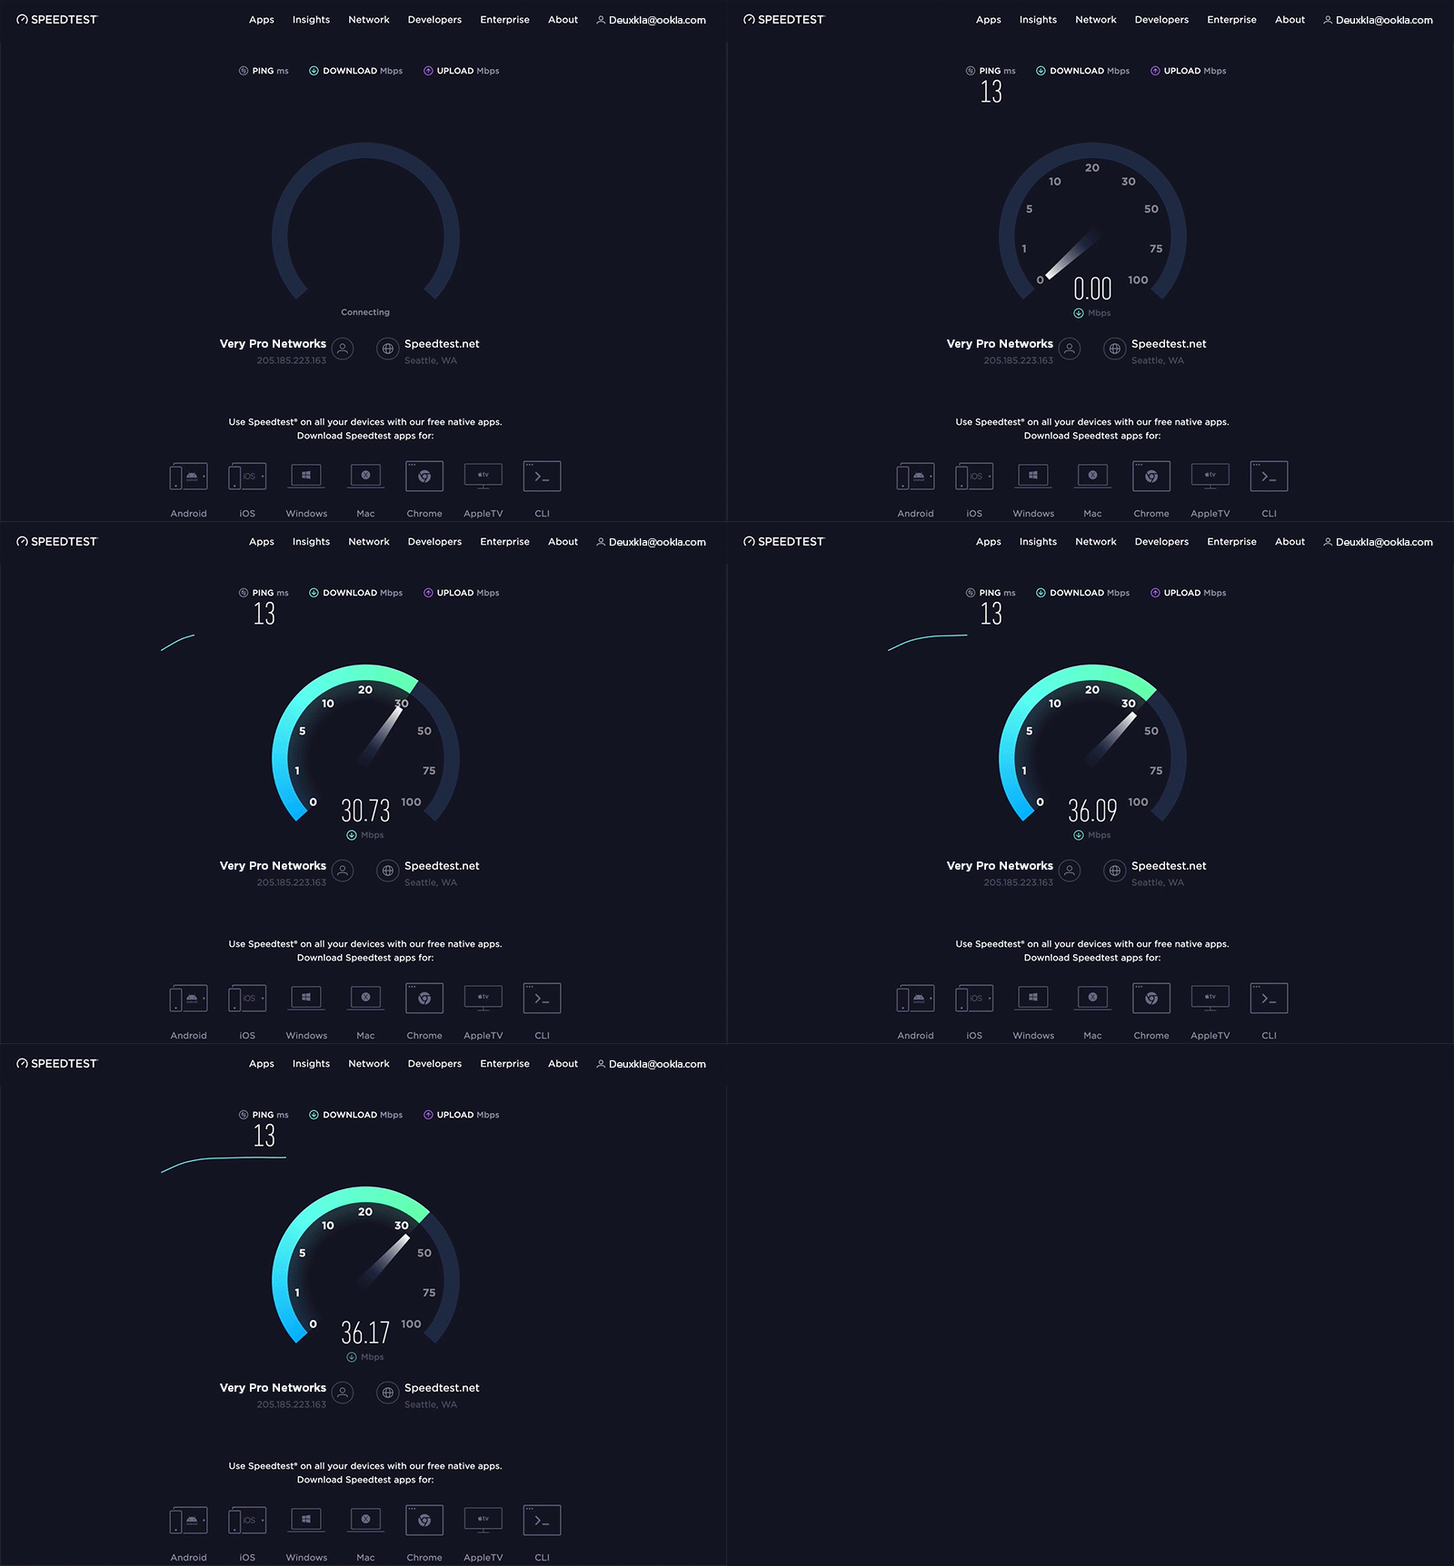
To begin setting up your home workspace, test your internet speed to make sure your connection is fast enough for your needs. An easy way to test your broadband internet speed at home is by using Speedtest®.

Free Speedtest desktop apps are also available for Windows and Mac, as well as on many other platforms.

speedtest-desktop800

To run a Speedtest, make sure you are connected to the Wi-Fi or ethernet connection you’d like to test, click or tap on the “GO” button and wait a few seconds until your download and upload speeds have been analyzed. You’ll see your speeds at the top along with ping and jitter.

What speeds you need for different tasks

Bandwidth-spectrum

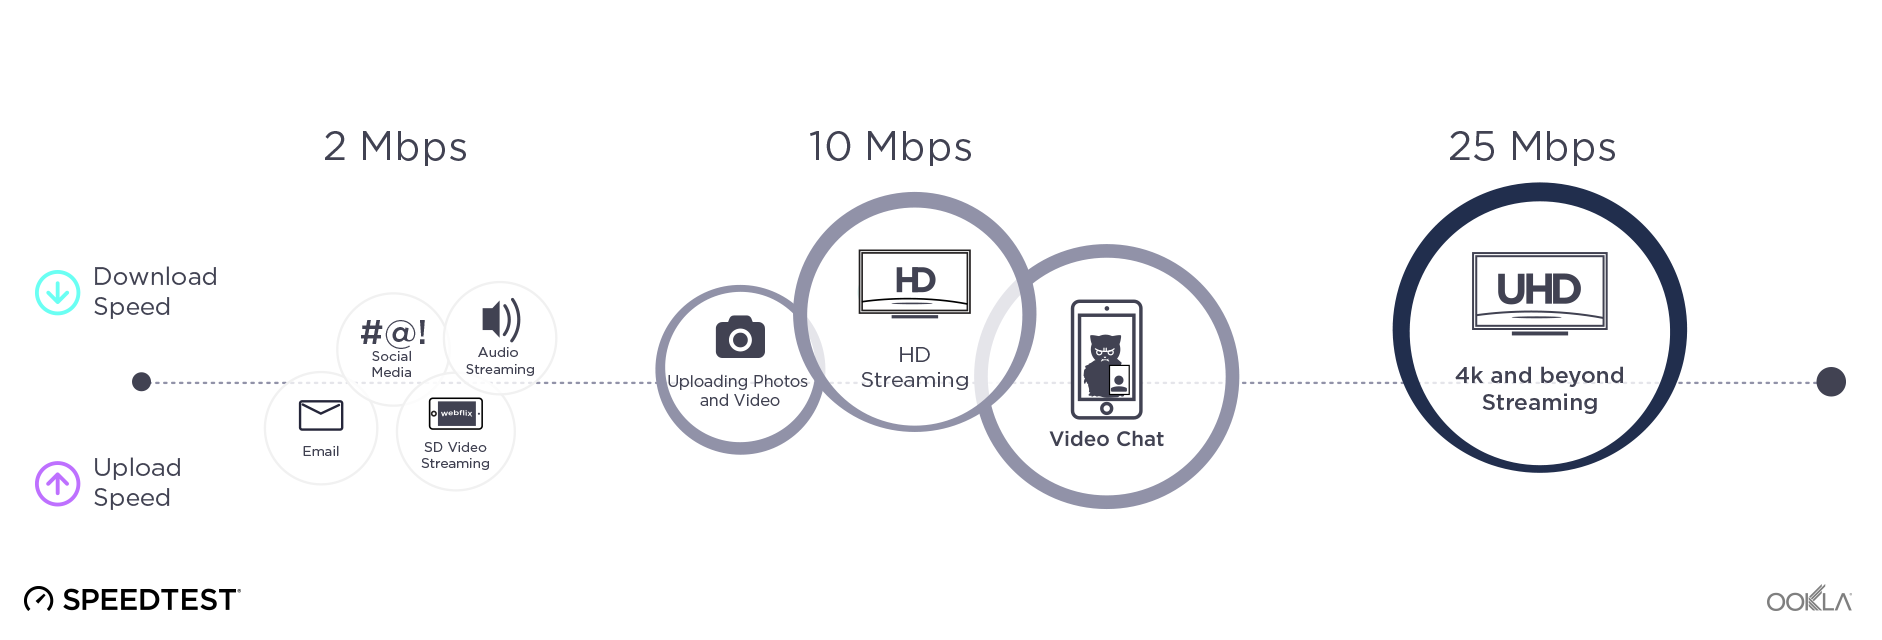
The graphic above illustrates the kind of speeds you need for different activities like video conferencing or uploading large documents.

A download and upload speed of 2 Mbps is sufficient for those who only use email, social media and audio conference calls on one device at a time. For remote work and learning that requires video conferencing or uploading and downloading large documents like videos, average download speeds of 10 Mbps would be preferable. A download speed of 25 Mbps or higher is desirable for those who have multiple people working from home or people using streaming services at the same time.

Keep in mind that internet usage is cumulative. This means that you need to consider all the speed needs that are happening at the same time together: the person in your house who is only sending and receiving emails, the one streaming HD, and the person on video chat (even if they’re all you).

How to get faster internet

If your Speedtest shows your internet connection is not as fast as you need it to be, check to see if you’re running any ongoing downloads or other programs like video chat that might be hogging your bandwidth. Close those programs and test again. If your speeds are still low, reboot your computer, modem and router. You may also want to check the Speedtest Global IndexTM to see the average speeds in your country and how your connection compares.

If your speeds are still not where they should be, this would be a good time to contact your ISP for help or to upgrade your service package. Keep in mind that you may need to upgrade your router to obtain faster speeds.

Get the most out of your Wi-Fi

wifi-waves

Most people are not using a hardwired connection at home, instead they’re using Wi-Fi on their laptops or mobile devices. That’s why getting Wi-Fi right is so important. People are often tempted to use the Wi-Fi connection labeled “5 GHz” because it’s faster. However, 5 GHz has shorter range and is bad at penetrating walls. While 2.4 GHz is slower and can be subject to interference from bluetooth devices, 2.4 GHz Wi-Fi has a longer range and is better at penetrating walls. Choose the connection that’s best for your home Wi-Fi setup and then test your speeds on both 2.4 GHz and 5 GHz to see which one truly works best for you.

2. Secure your connection

For those who deal with sensitive and important data on a daily basis, a secure connection is essential. Multiple companies now rely on Virtual Private Networks (VPNs) to enable their employees to send and receive data across a shared or public network as if their devices were directly connected to a private network.

If you are working from your mobile device, check out Ookla’s recently released Speedtest VPNTM that ensures your online privacy and security from the convenience of your Speedtest mobile application.

Your company or school may also already have a preferred VPN product they use in the office that you can use at home. If they don’t, there are multiple options beyond Speedtest VPN that you can test in your home office. We recommend browsing through PC Magazine’s VPN reviews to find the VPN that is best for you.

3. How to keep up with outages

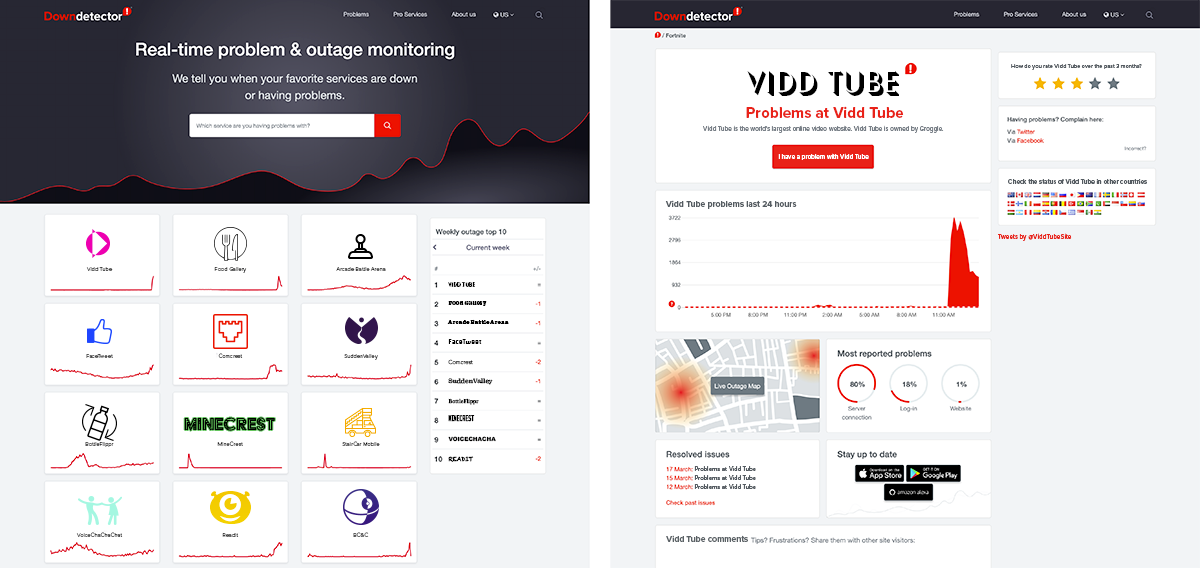
Sometimes your internet connection is working just fine and it’s the services you rely on that are having an issue. Bookmark Downdetector to keep up with website and online services outages. Part of the Ookla family of products, this website is your go-to resource to see if others are experiencing issues with the same website or app, which can be more common during periods of increased usage and network congestion.

dd-screen-2

Simply type the website or app’s name in the search bar on the home page and click on the search button. You’ll navigate to a page that includes a chart with the number of reports from the last 24 hours, a live outage map where you can see where reports of an outage are coming from, and the most reported problems for the site you searched. You’ll also see comments from other users with the same problems at the bottom of the page.

Remote work and learning requires some adjustment, but with the proper internet setup, you can enjoy the flexibility as much as you enjoy the lax dress code. Visit our Frequently Asked Questions page if you need more information about internet speeds.

Ookla retains ownership of this article including all of the intellectual property rights, data, content graphs and analysis. This article may not be quoted, reproduced, distributed or published for any commercial purpose without prior consent. Members of the press and others using the findings in this article for non-commercial purposes are welcome to publicly share and link to report information with attribution to Ookla.

| March 2, 2020

Mobile and Fixed Broadband Speeds and 4G Availability in Spain

Versión en español

We investigated Spain’s fixed broadband and mobile network performance, 4G Availability, how Spain’s speeds and coverage compare with neighboring European countries and the performance and 4G Availability of top providers in Spain’s ten largest cities during Q3-Q4 2019. In addition to ranking Spain’s providers by top speeds and coverage, we also analyzed the effects of mobile plans with speed caps on Speedtest® results and ranked the providers on consistency of their network performance.

Spain and France were the fastest on our list for fixed broadband

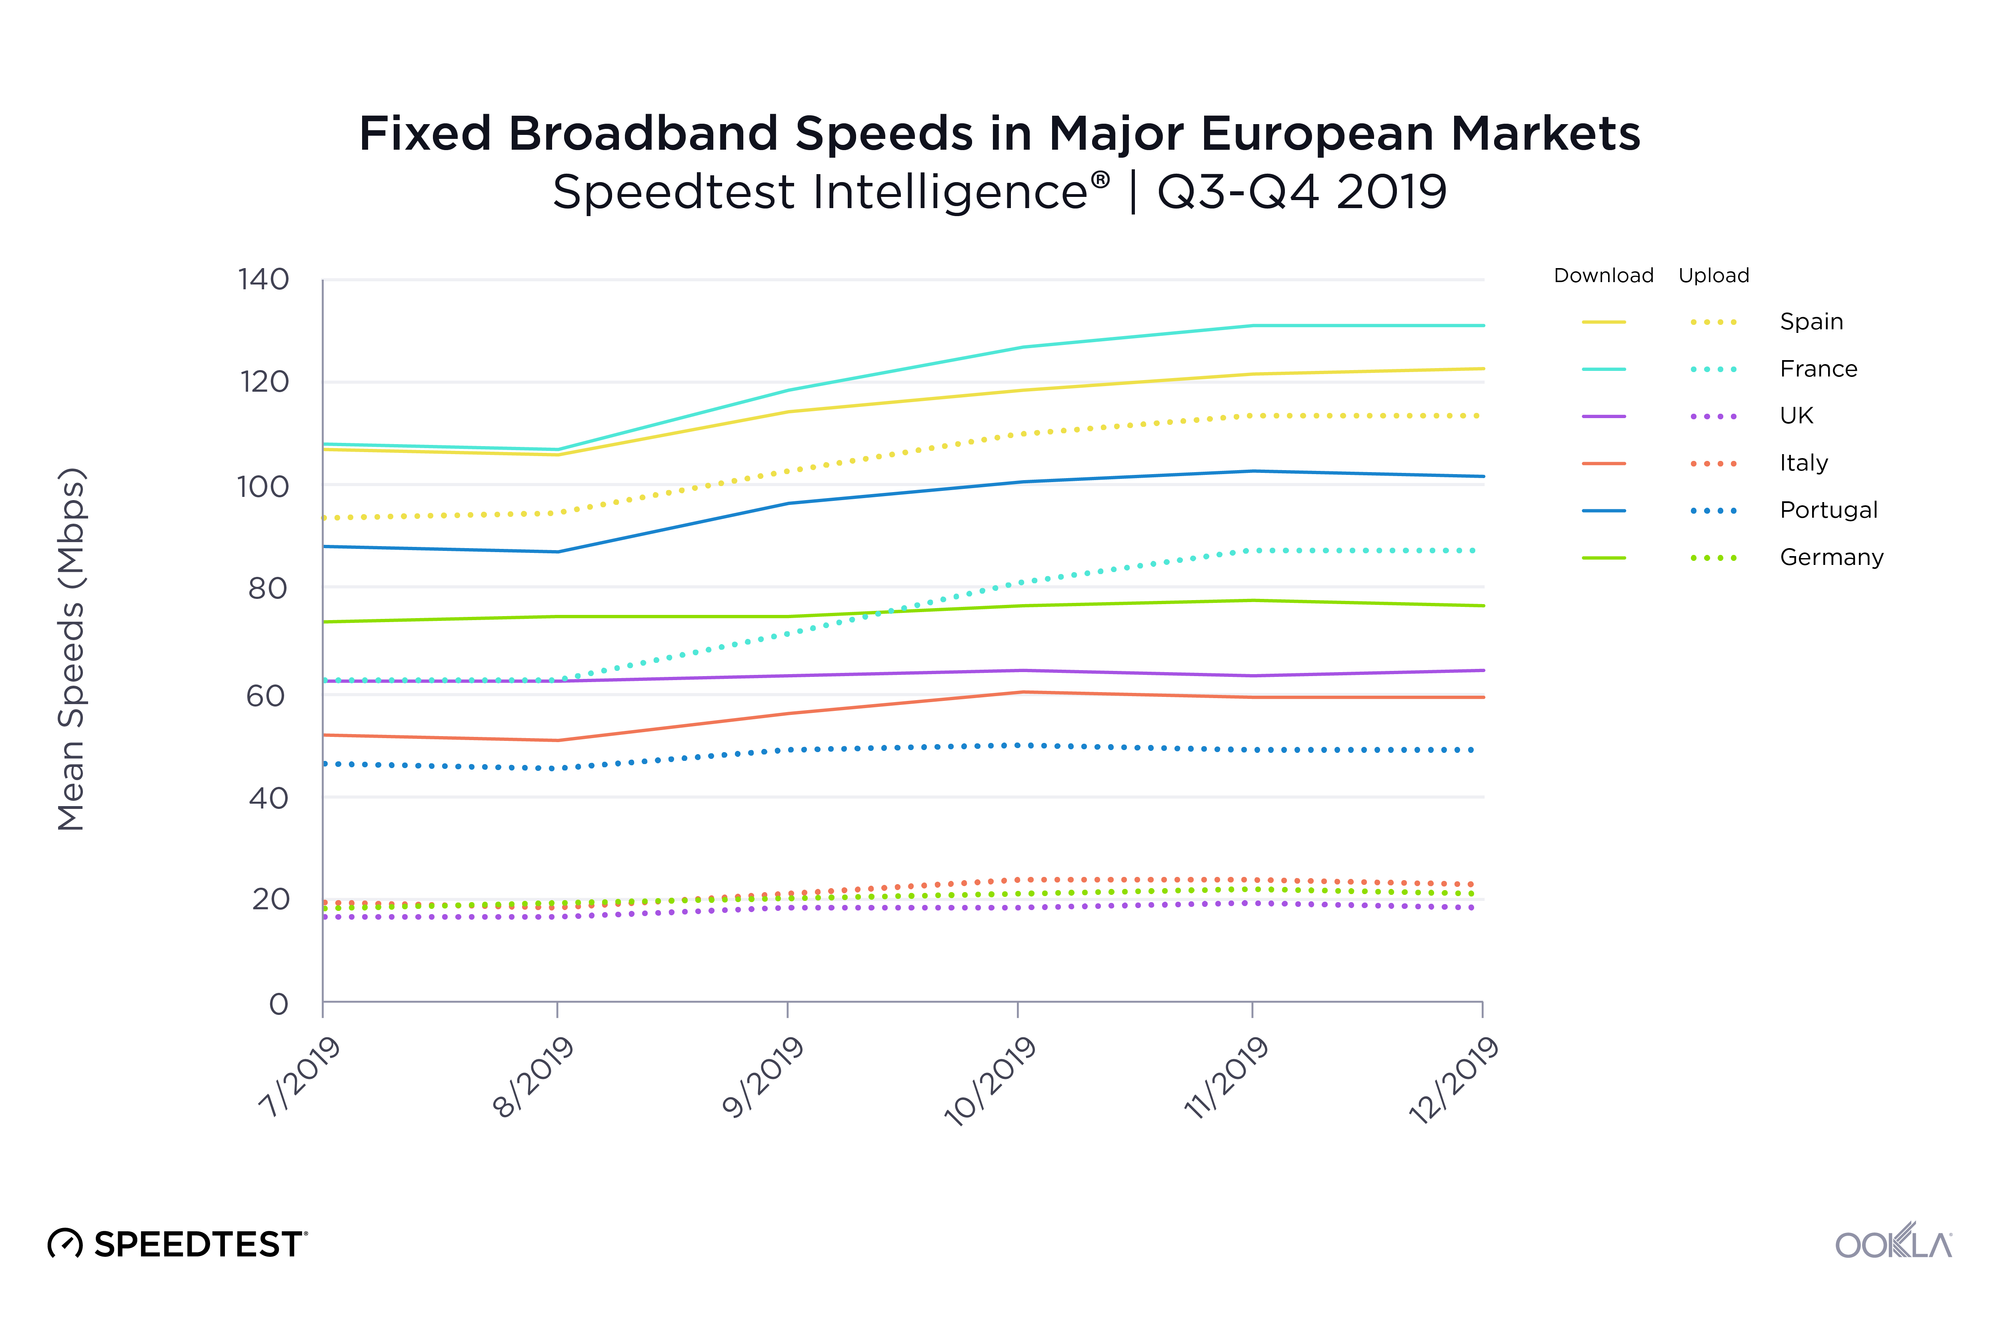
We compared Spain’s fixed broadband performance at the country level to several other western European countries during Q3-Q4 2019. Spain was well positioned for mean download speed on fixed broadband at 113.72 Mbps, second only to France’s 119.37 Mbps. Spain had the fastest mean upload speed on this list at 103.72 Mbps. Italy had the slowest mean download speed on this list at 56.72 Mbps while the United Kingdom had the slowest mean upload speed at 18.28 Mbps.
fixed-broadband-speeds-eng-1

France showed the highest increase in mean download speed during Q3-Q4 2019 at 21.5%, followed by Portugal and Italy at 15.4% and Spain at 14.5%. Speeds remained relatively flat for this period for Italy, the U.K. and Germany.

An examination of latency over fixed broadband during Q3-Q4 2019 revealed a very different performance order. Portugal had the lowest latency during this period at 16 ms. Germany and the U.K. were tied for second at 23 ms. Spain was third (25 ms), Italy fourth (30 ms) and France fifth (32 ms).
Spain ranks fourth for mobile download speed

mobile-speeds-eng-1

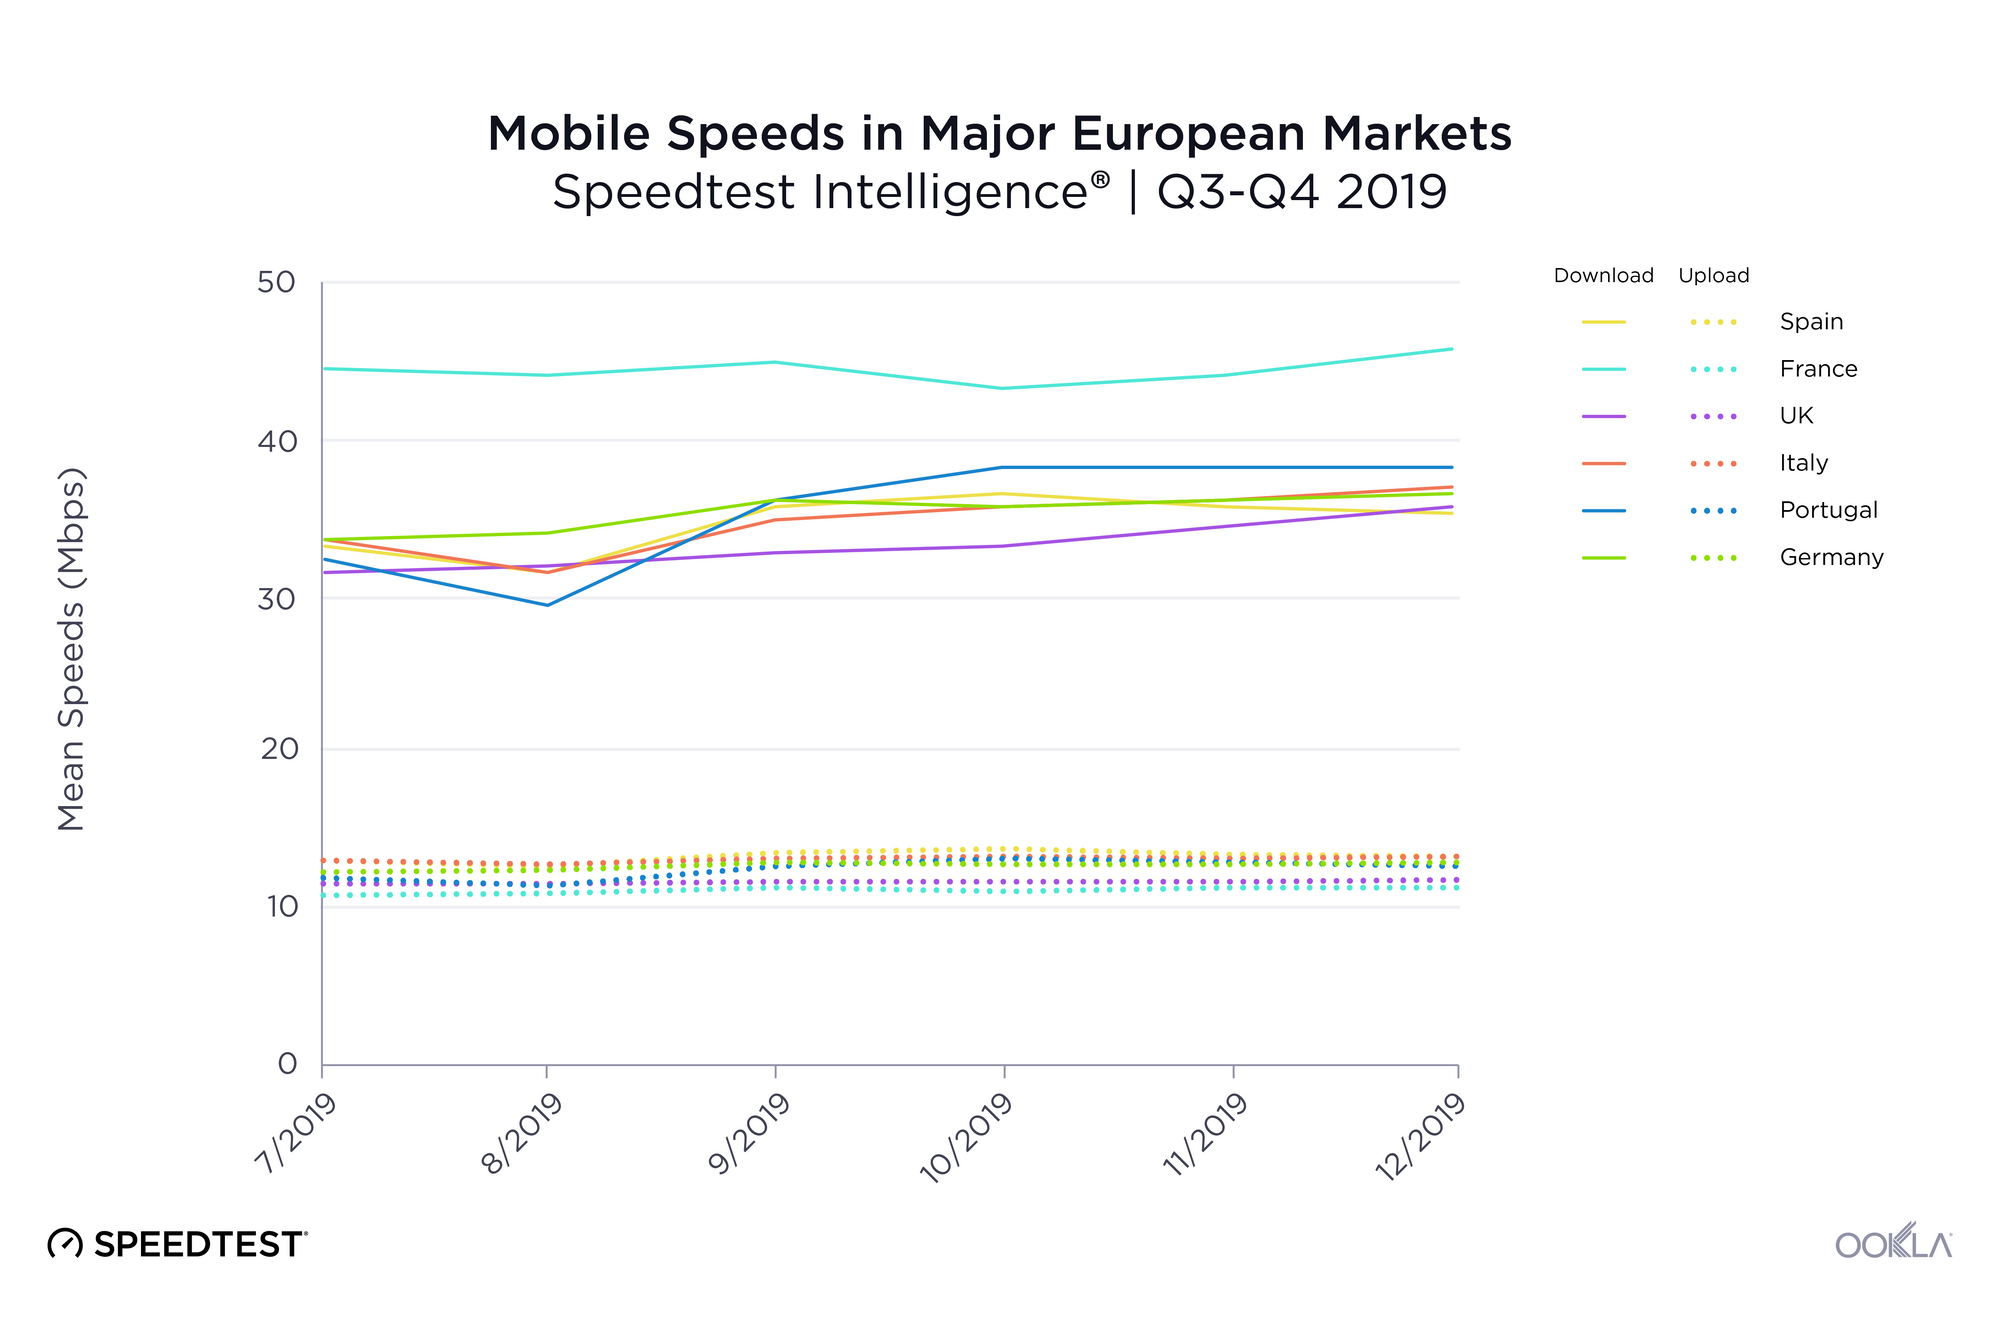
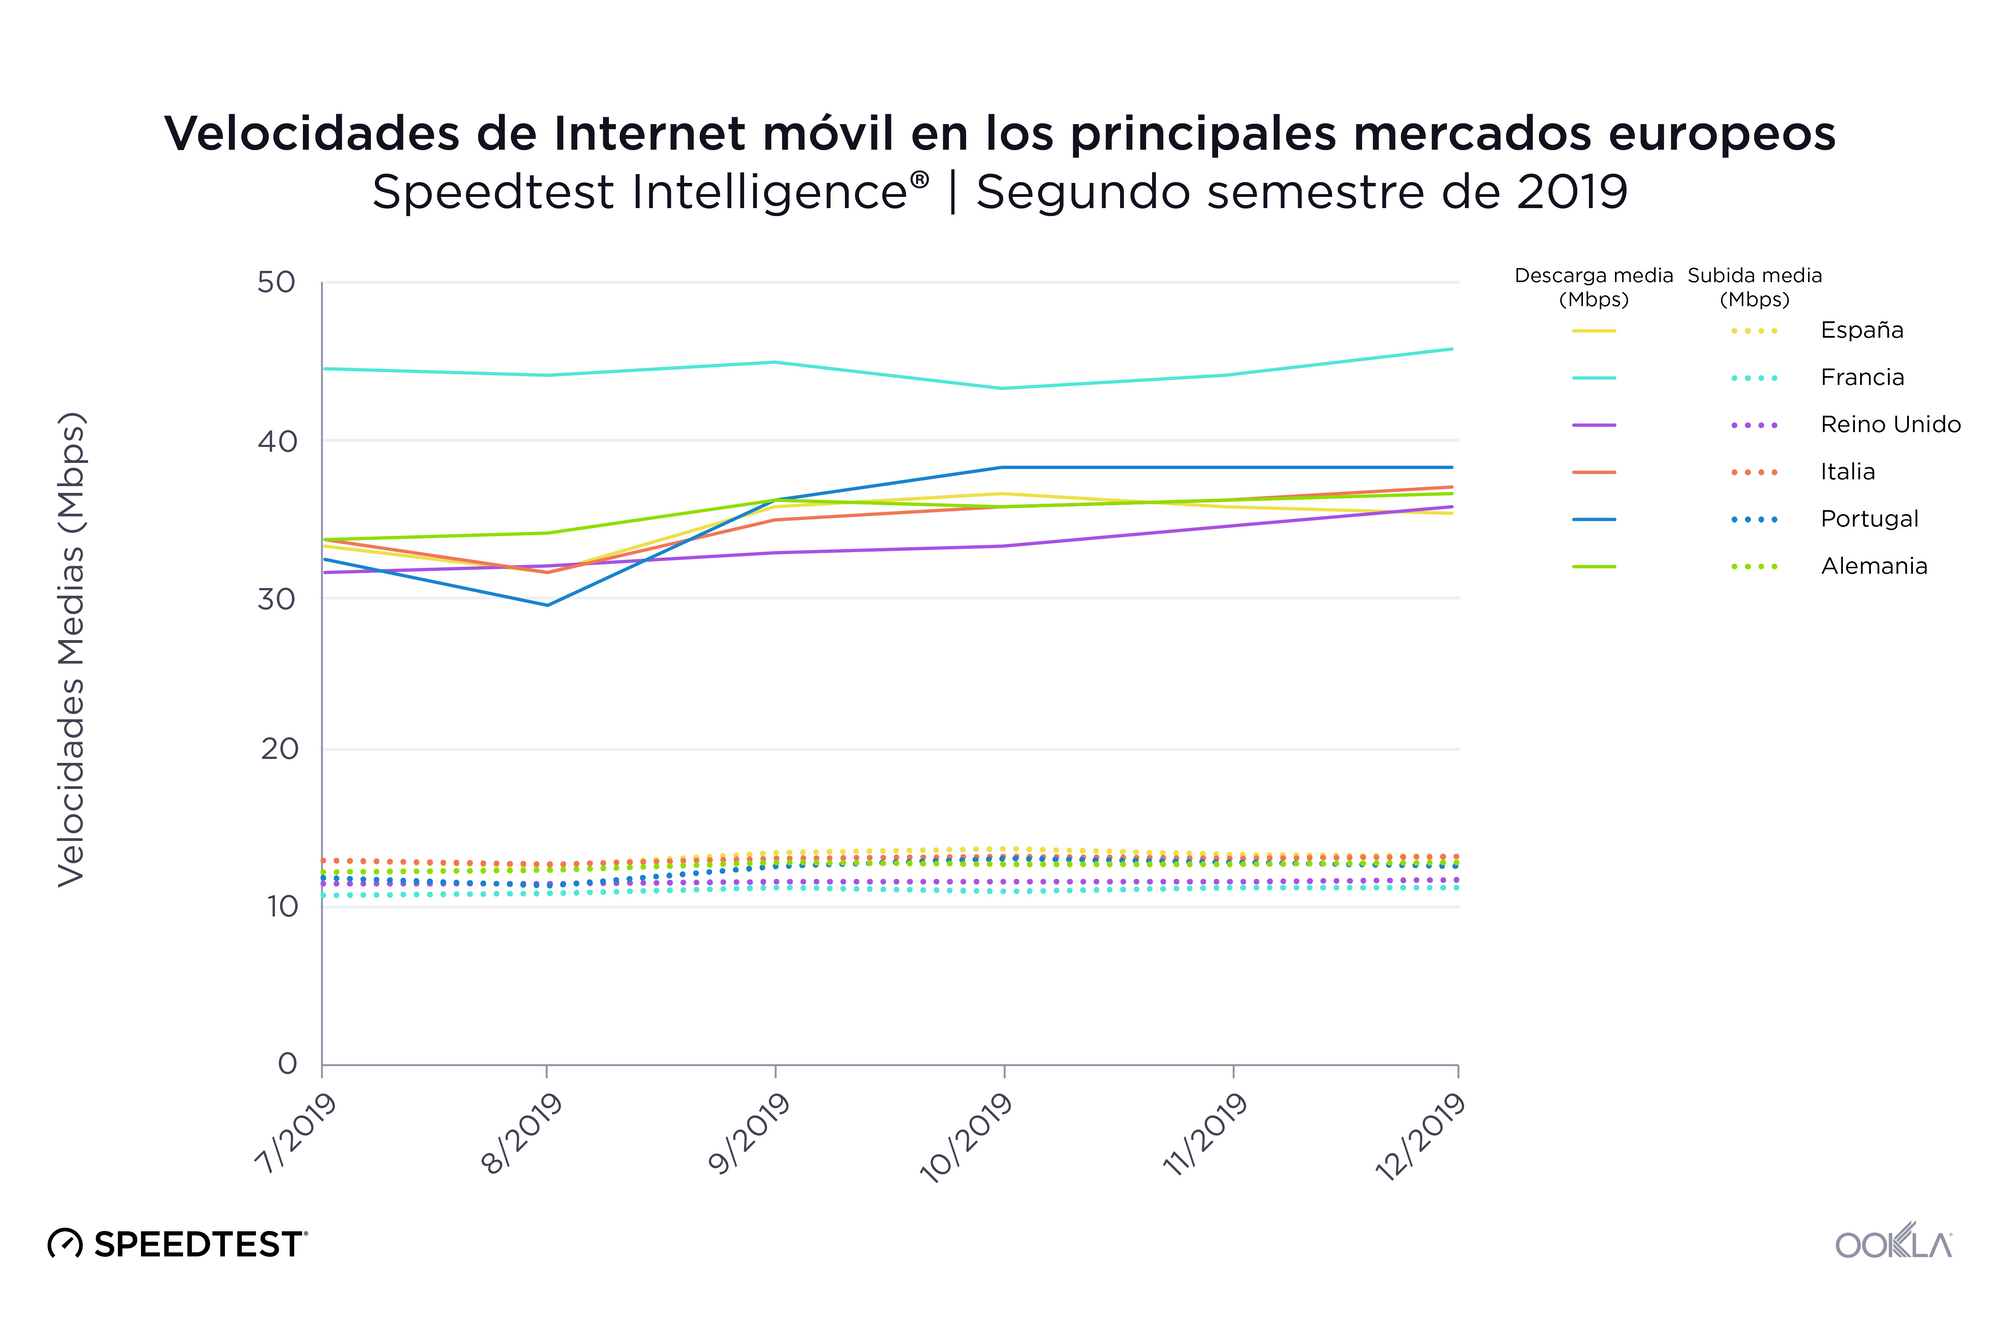
Spain did not rank as well for mean download speed over mobile as they did on fixed broadband, coming in fourth with 33.97 Mbps during Q3-Q4 2019. This was 22.8% slower than first-place France. However, Spain showed the fastest mean upload speeds on mobile at 13.12 Mbps during Q3-Q4 2019.

Portugal saw the largest increase in mobile download speed during Q3-Q4 2019 at 18.4%. Spain’s mean download speed over mobile increased only 6.7% during this period. France showed the smallest increase in mobile download speed at 2.8%.

As we saw on fixed broadband, Portugal had the lowest mobile latency at 32 ms. Germany was second at 41 ms, France third at 43 ms, the U.K. fourth at 44 ms, Spain fifth at 47 ms and Italy last at 52 ms.

United Kingdom and Spain lead in 4G Availability

We used data from Speedtest coverage scans on Android to compare 4G Availability in each market during Q3-Q4 2019. While the U.K. showed the highest 4G Availability at 88.8%, Spain tied for a very close second, with 4G available in 87.7% of tested locations. Germany had the lowest 4G Availability at 72.1% during this period.

4G Availability in Major European Markets
Speedtest Intelligence® | Q3-Q4 2019
Country 4G Availability
United Kingdom 88.8%
Spain 87.7%
France 87.7%
Italy 86.7%
Portugal 85.0%
Germany 72.1%

Looking specifically at Spain’s top mobile providers, Orange had the highest 4G Availability at 88.1%. Movistar was second, Yoigo third, and Vodafone fourth.

4G Availability by Provider in Spain
Speedtest Intelligence® | Q3-Q4 2019
Provider 4G Availability
Orange 88.1%
Movistar 87.7%
Yoigo 87.4%
Vodafone 86.1%

Spain’s 5G deployments are expanding

5G-Deployments-in-Spain-0220-1
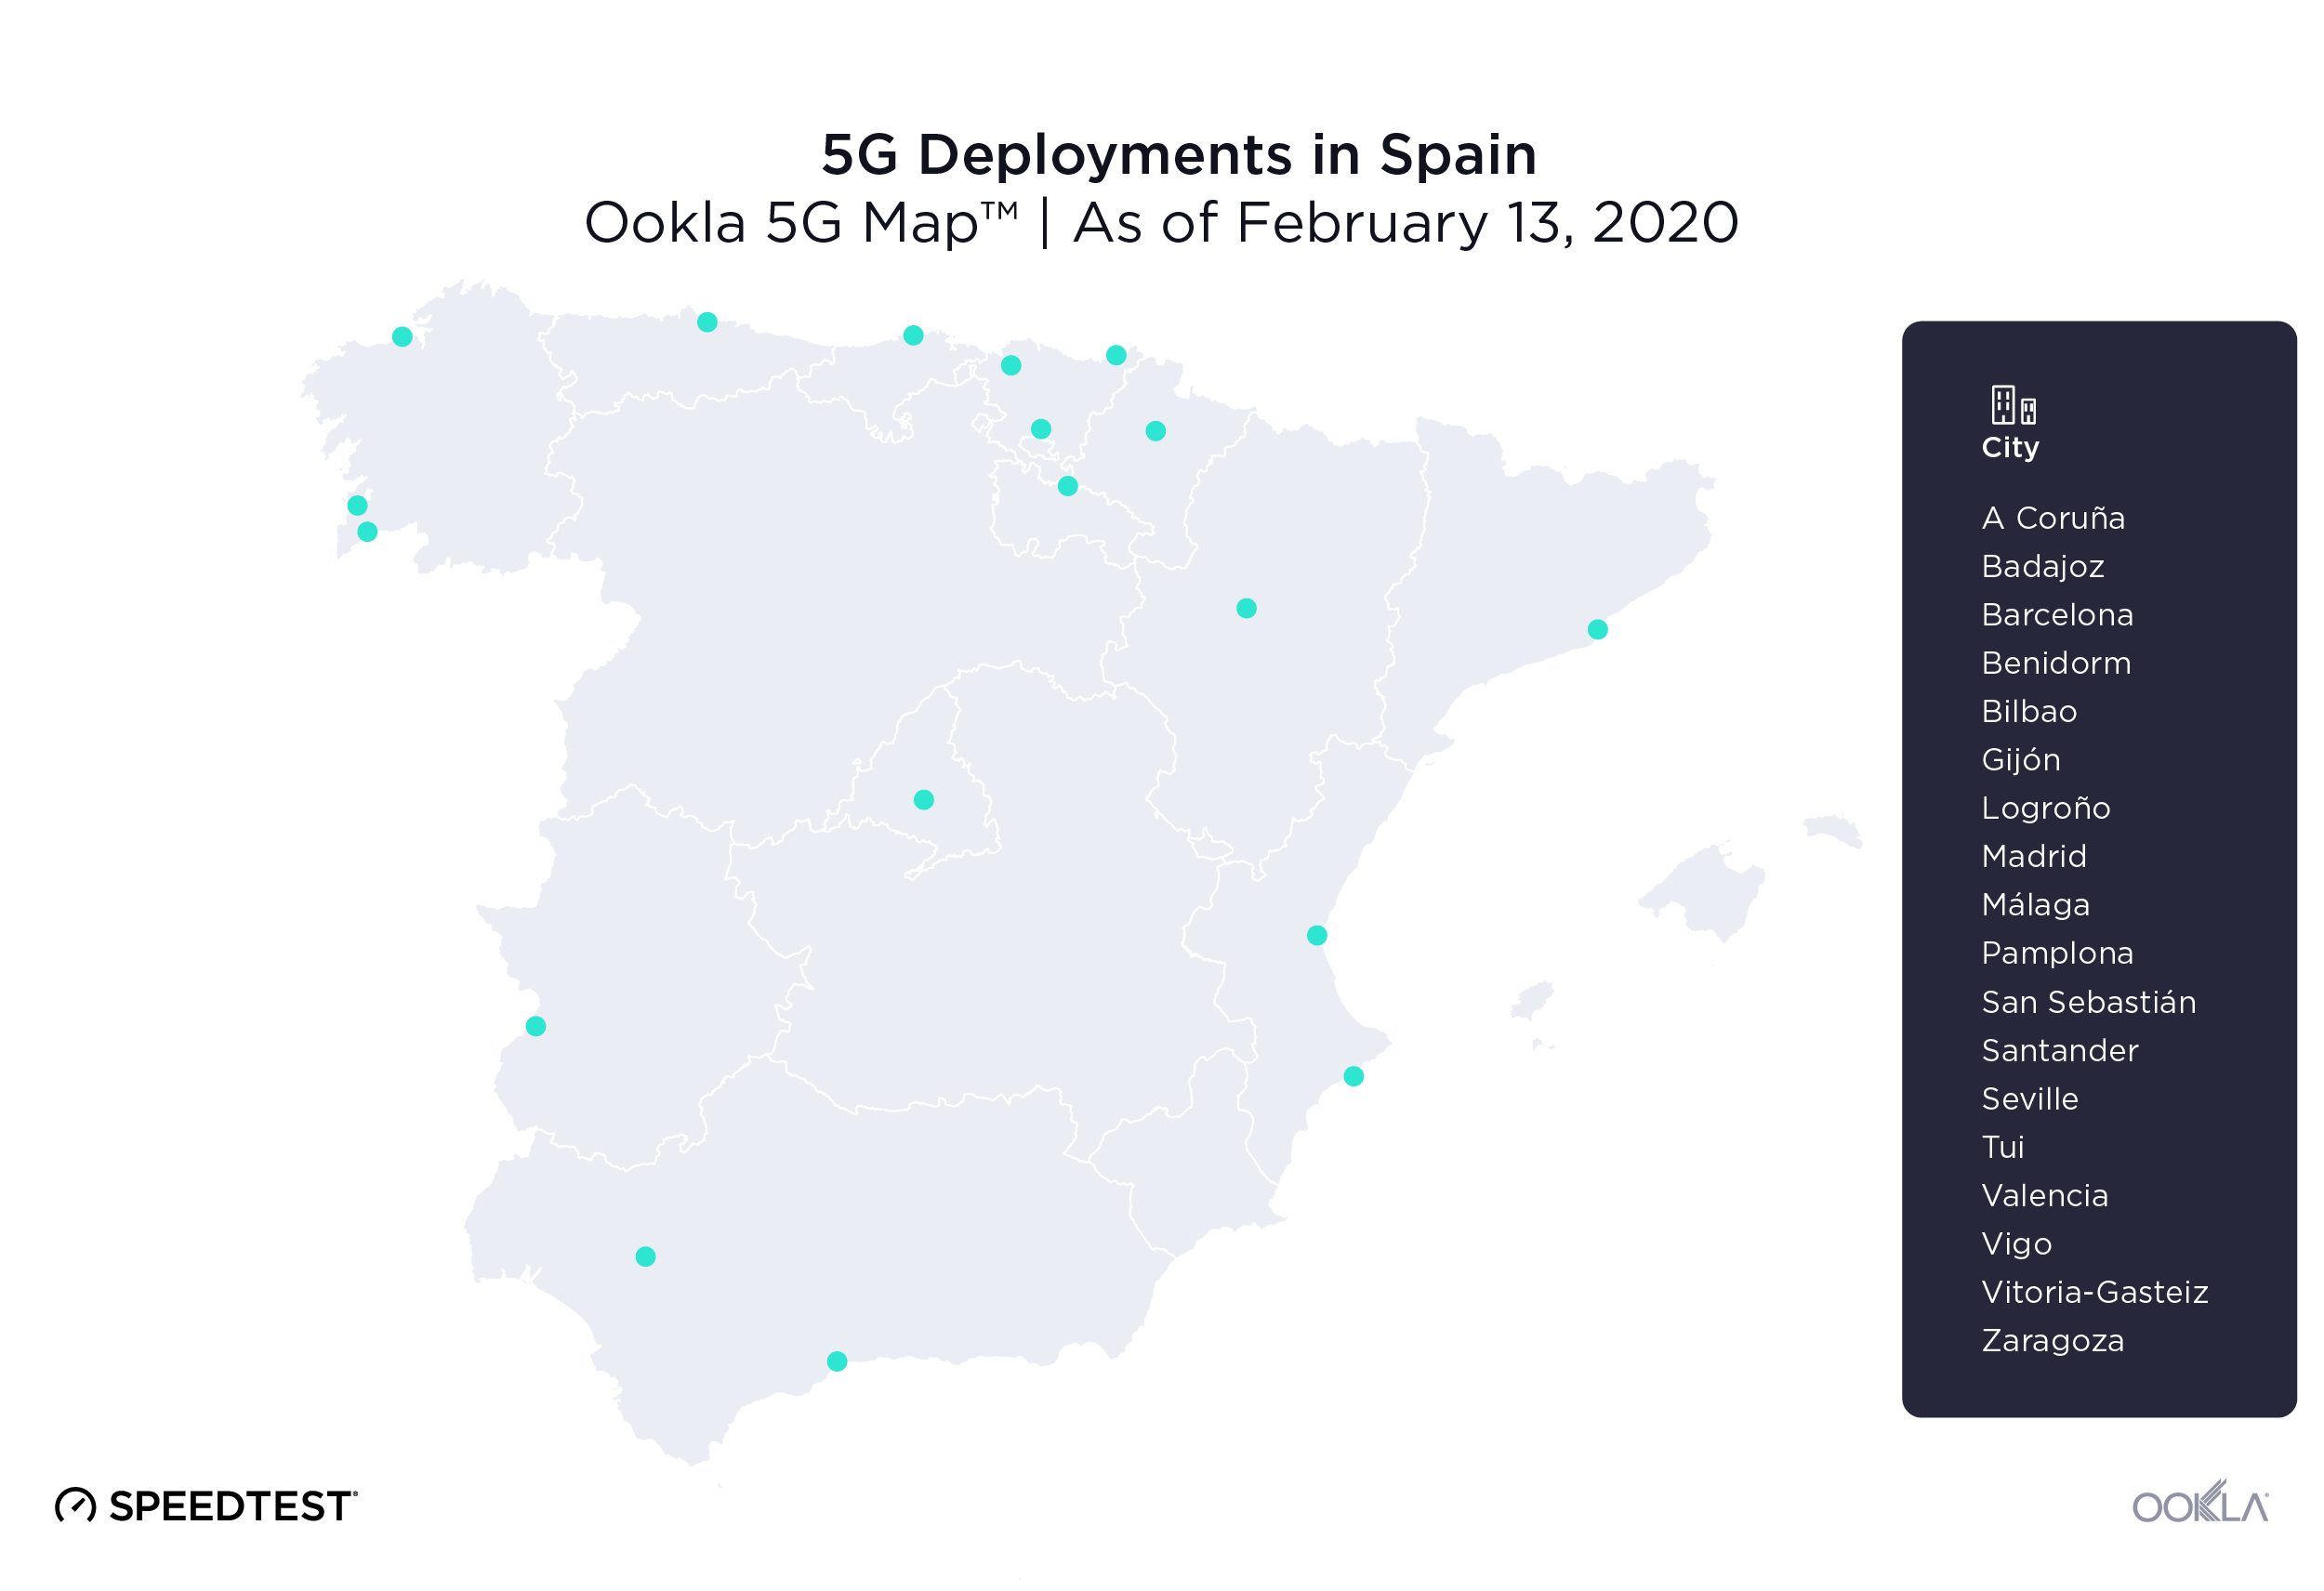
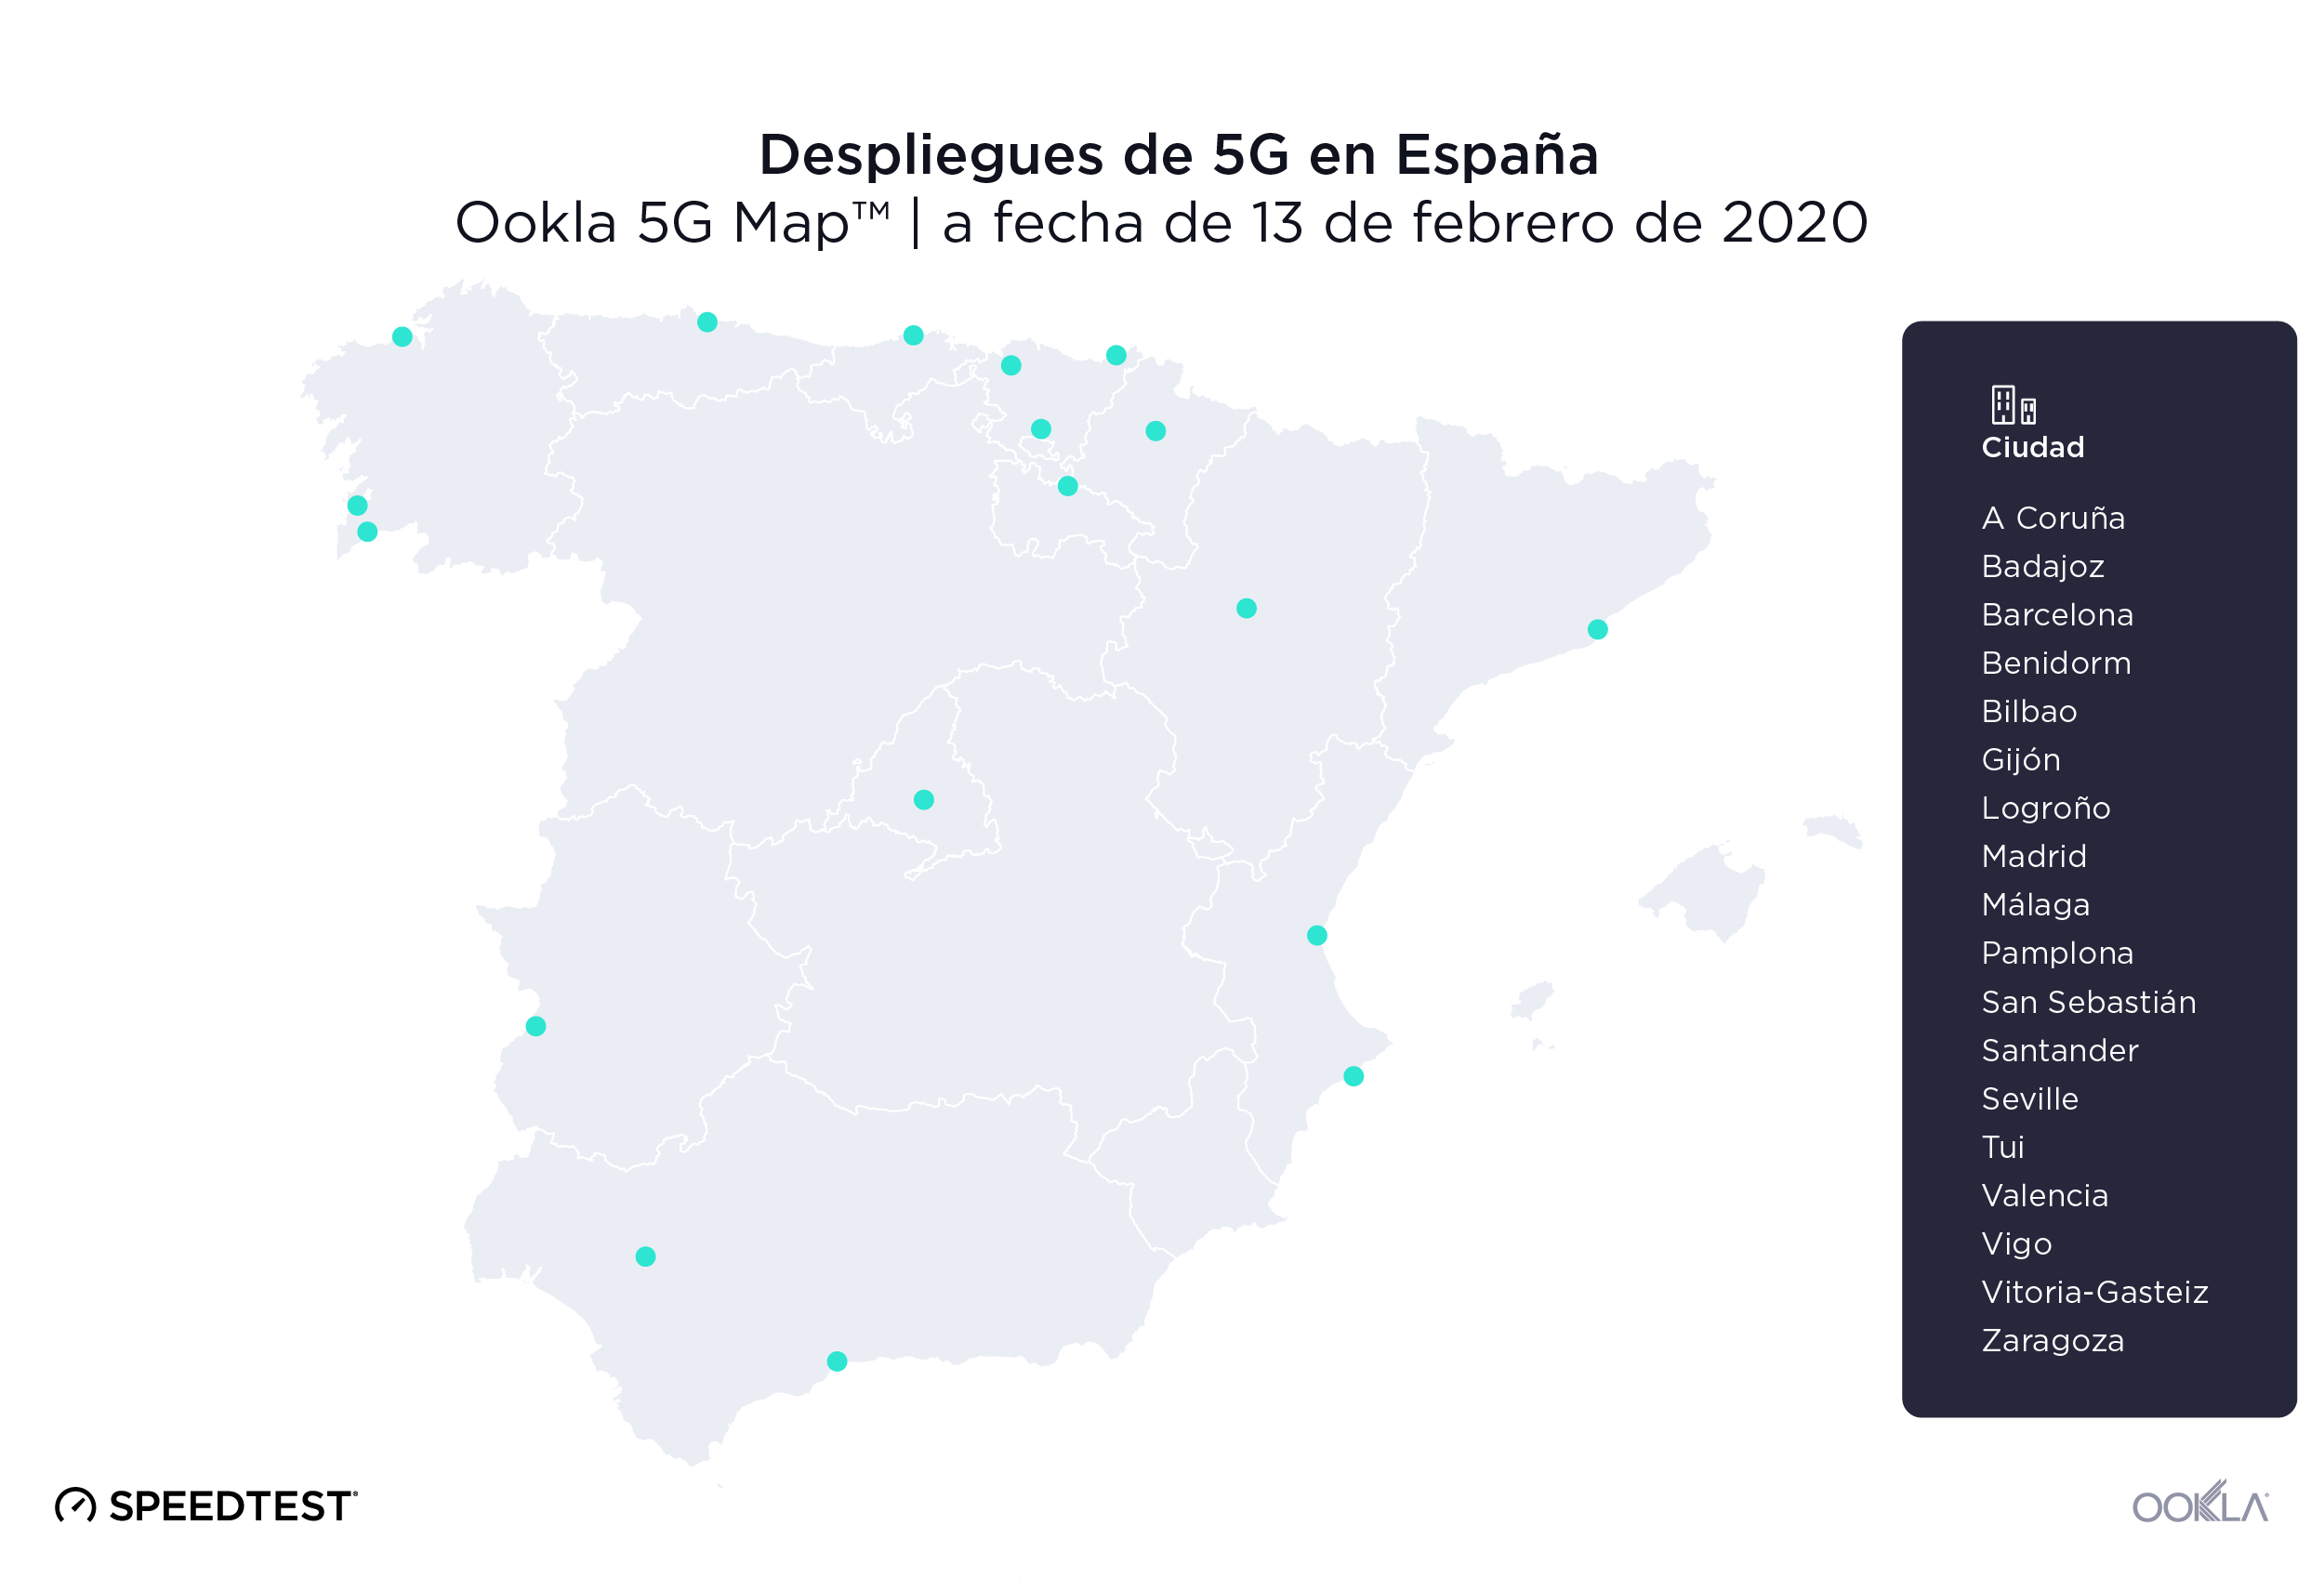
The excitement for 5G is evident in Spain. Vodafone had commercially available 5G deployments in a total of 18 Spanish cities as of February 13, 2020, including Barcelona, Madrid, Valencia, Málaga and Bilbao. Speedtest data reveals the mean download speed on 5G for Spain in Q3-Q4 2019 was 350.68 Mbps — an order of magnitude faster than the national average for mobile download speed — and the mean upload speed over 5G was 31.82 Mbps. Mean latency over 5G in Spain was 27 ms during Q3-Q4 2019.

MÁSMÓVIL was Spain’s fastest fixed broadband provider

Using Speed Score, a metric that combines measures of download and upload speed, to compare top ISPs in Spain during Q3-Q4 2019, we found that MÁSMÓVIL led with a score of 133.75 on fixed broadband. Orange was in second place with 115.25, followed by Vodafone (105.07) and Movistar (103.01).

Fixed Broadband Performance by Provider in Spain
Speedtest Intelligence® | Q3-Q4 2019
Provider Speed ScoreTM
MÁSMÓVIL 133.75
Orange 115.25
Vodafone 105.07
Movistar 103.01

Movistar was Spain’s fastest mobile operator

Movistar had the highest Speed Score among Spain’s mobile operators during Q3-Q4 2019 at 37.76. Orange was second at 33.02, Vodafone third at 26.34 and Yoigo fourth at 22.43. As we will discuss below, overall speed performance can be impacted by the speed caps and tariff plans that are in place in Spain.

Mobile Performance by Operator in Spain
Speedtest Intelligence® | Q3-Q4 2019
Provider Speed ScoreTM
Movistar 37.76
Orange 33.02
Vodafone 26.34
Yoigo 22.43

Speed capping affects overall performance

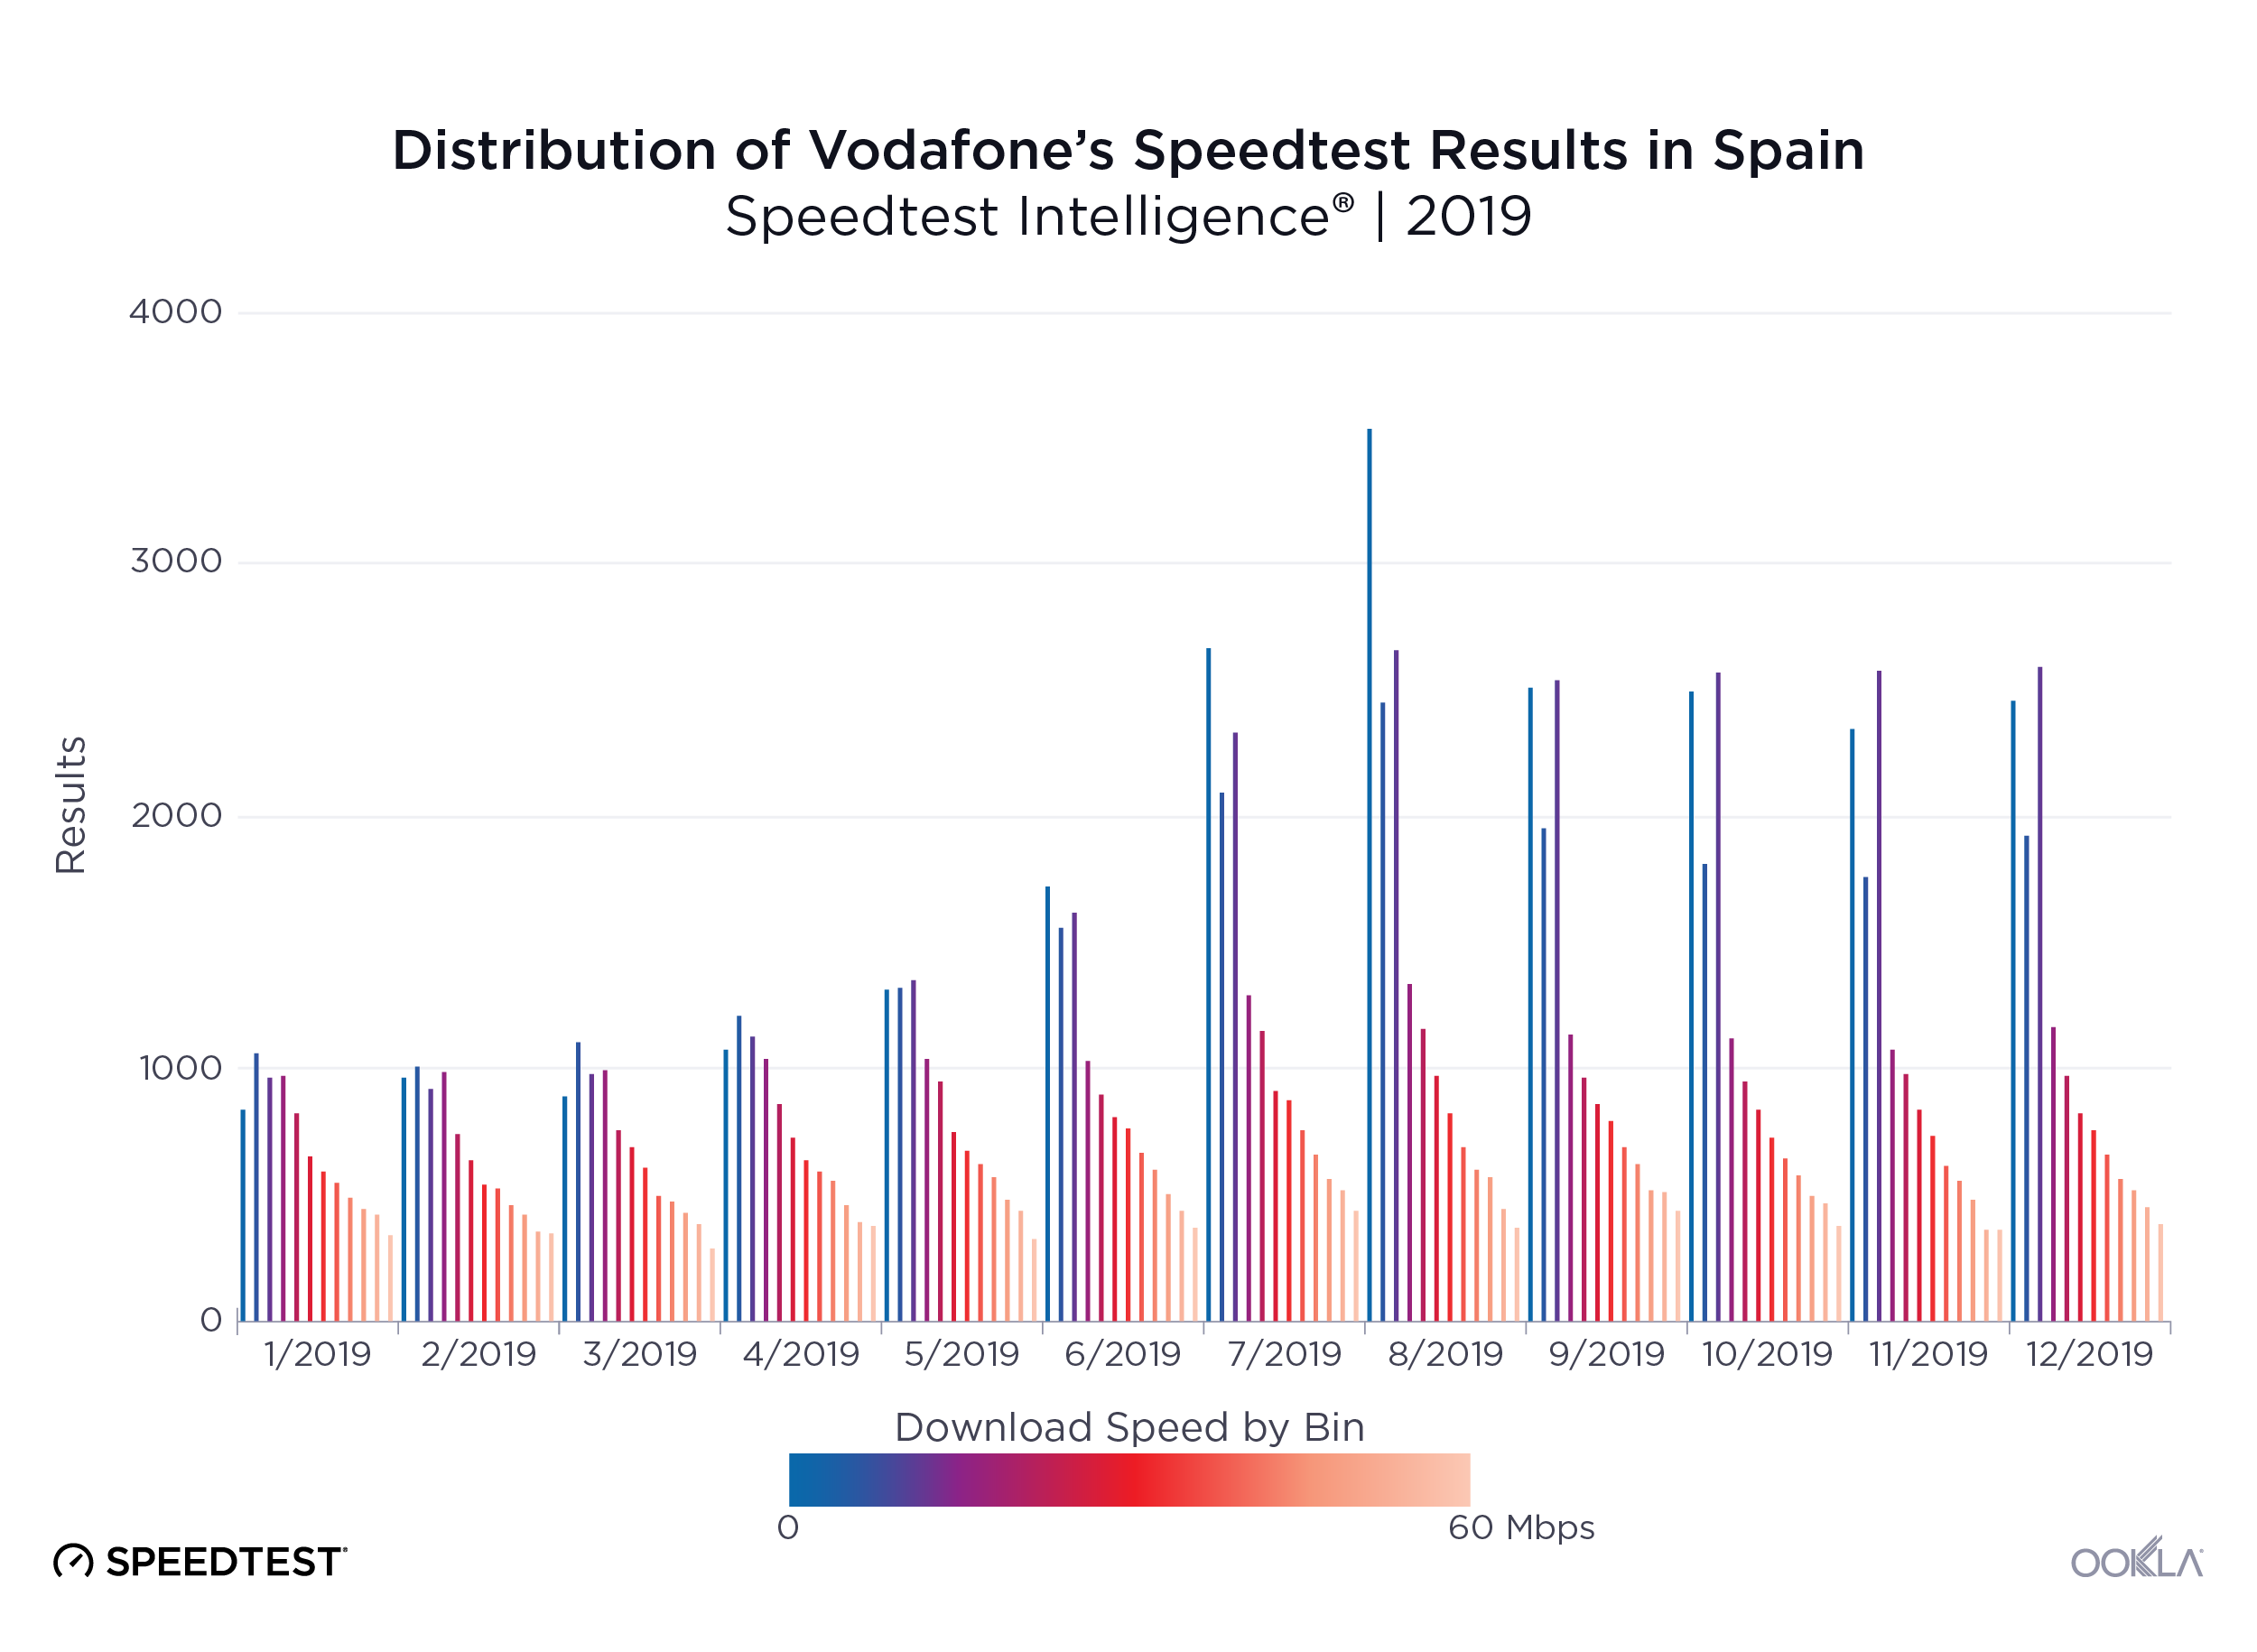
Speed capping, a limit of service imposed onto an internet connection by an operator, allows operators to also offer plans that focus on affordability rather than maximum performance.
Ookla_Distribution-Speedtest-Results_Vodafone_Spain_0220-3_en
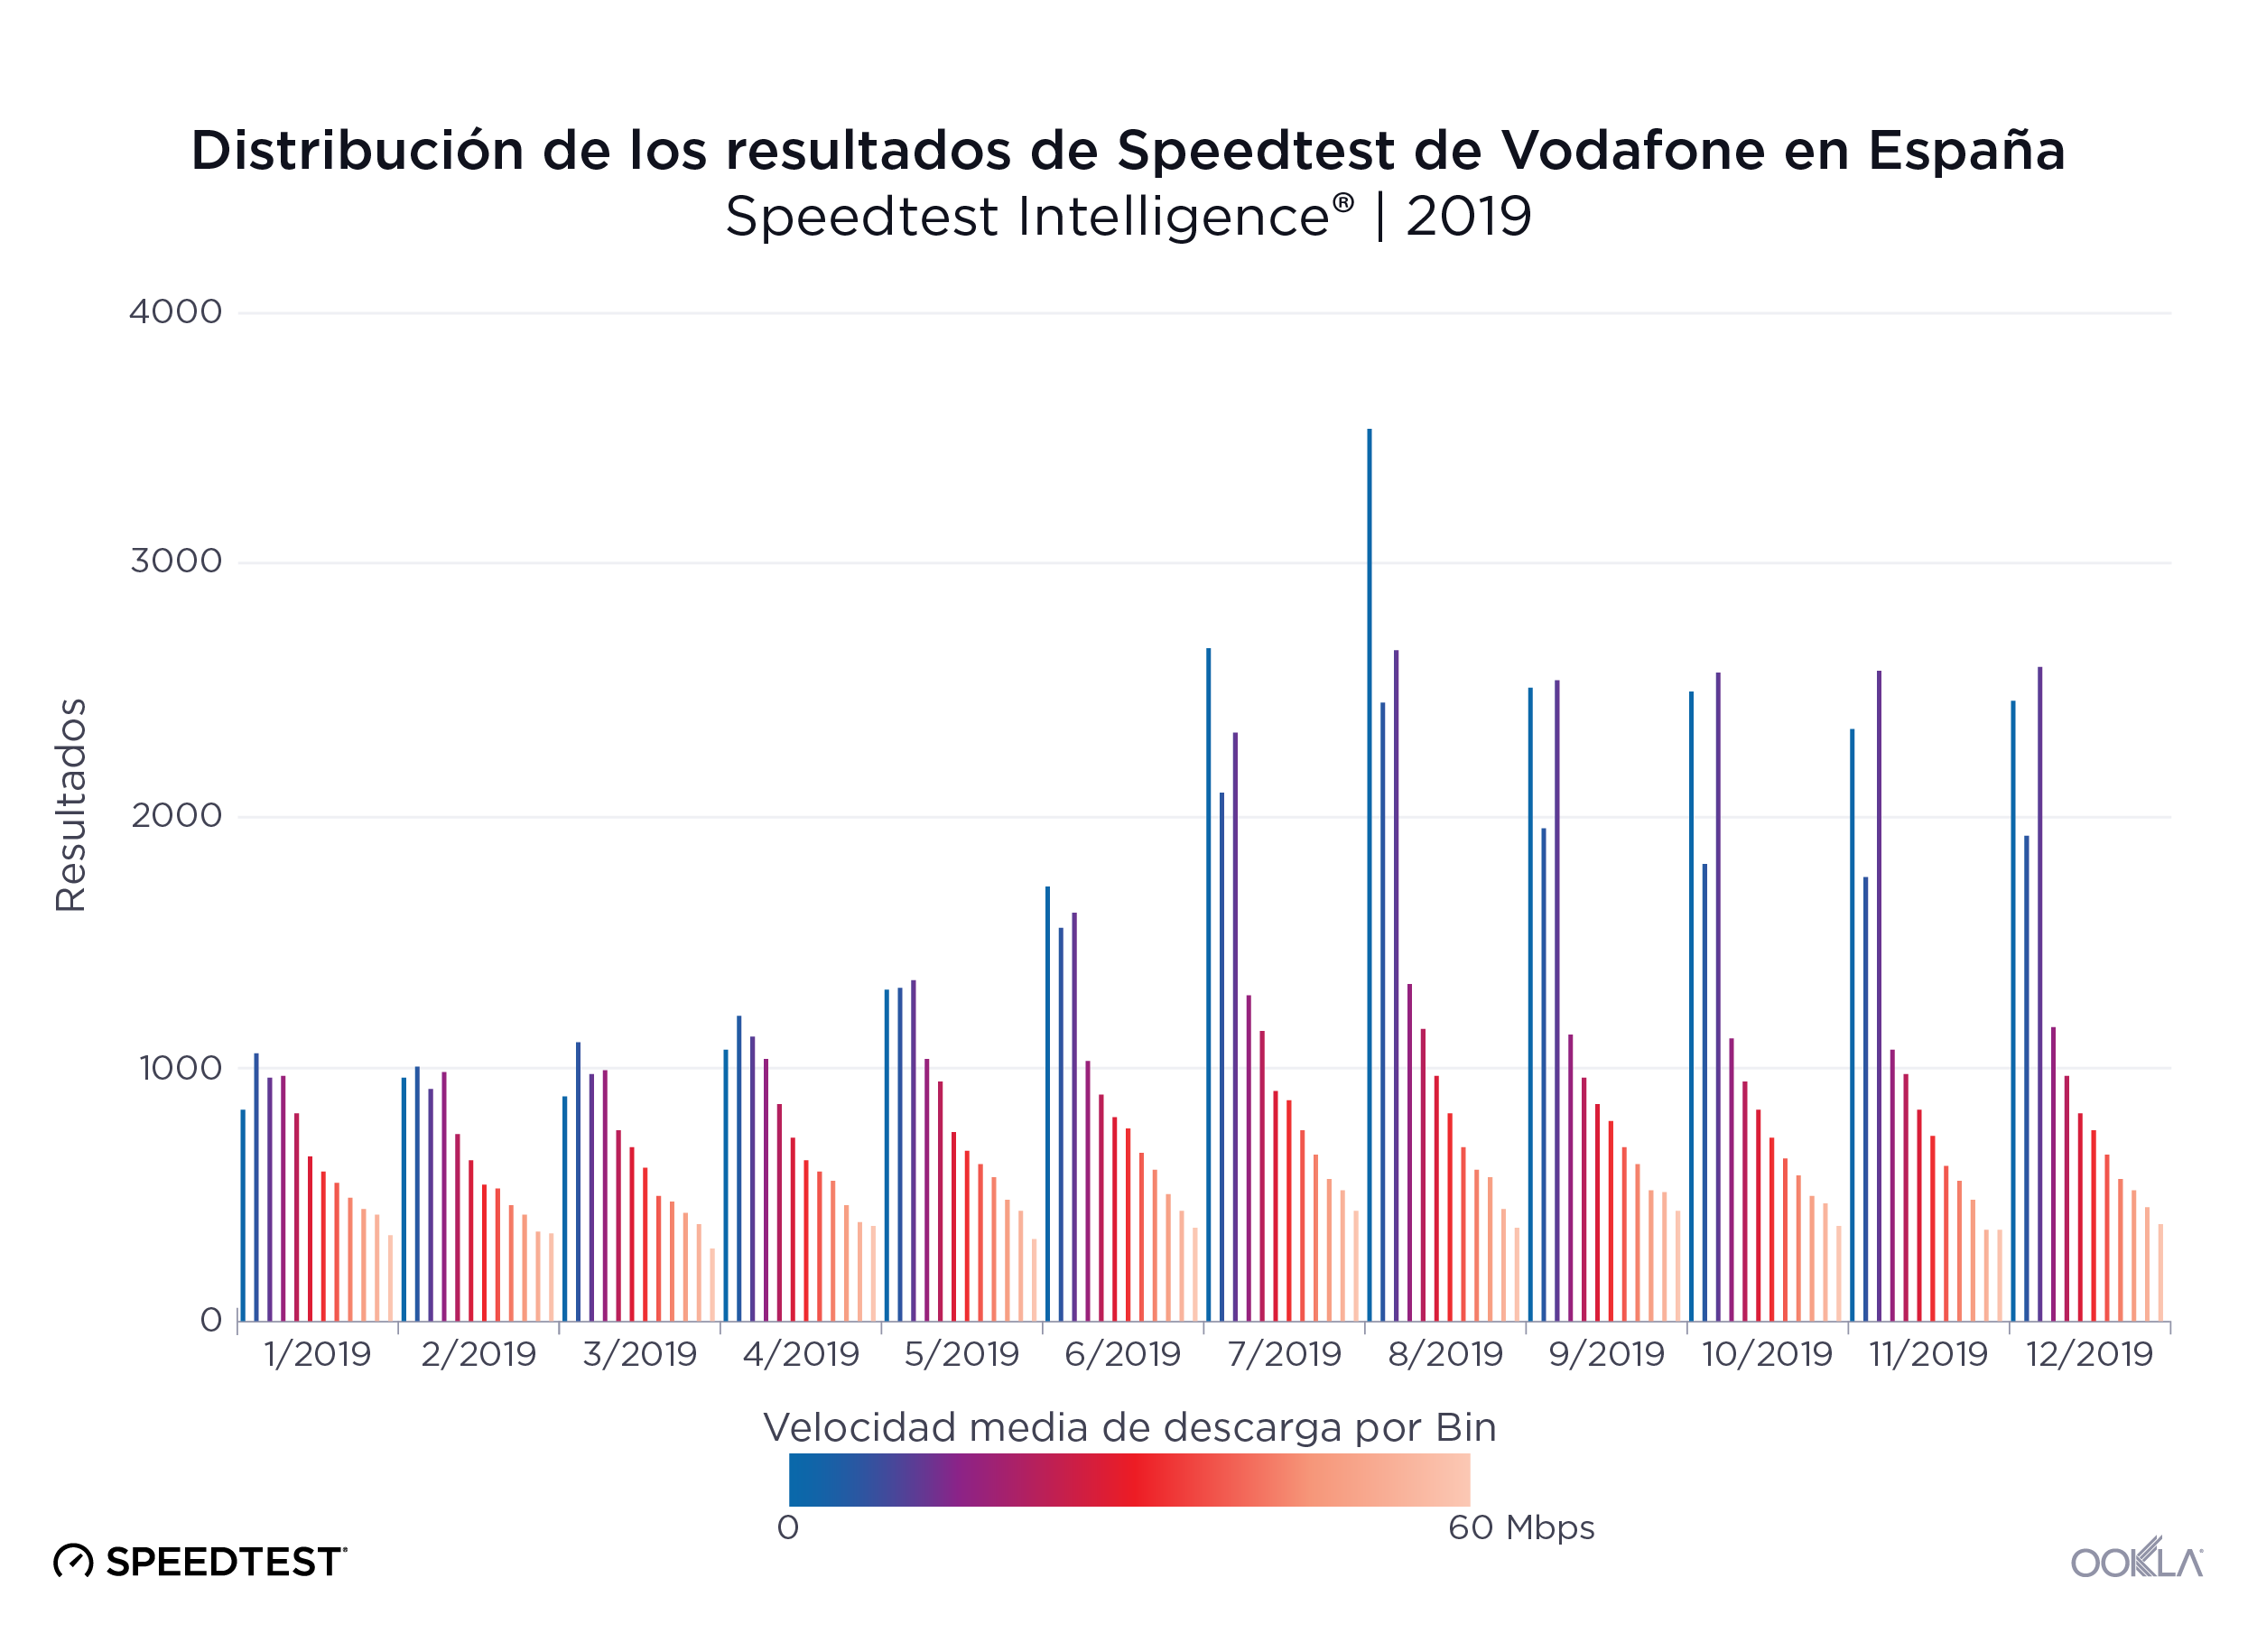
The chart above shows how Vodafone’s introduction of subscription plans that use speed capping affected the distribution of download speeds. While those plans (with caps at 2 Mbps and 10 Mbps, respectively) were available starting in April, we don’t see the true effect on average speeds until May and June when the 0-5 Mbps and 10-15 Mbps buckets start to spike. We’ve only showed bins up to 60 Mbps to make this and the following graphs more legible.

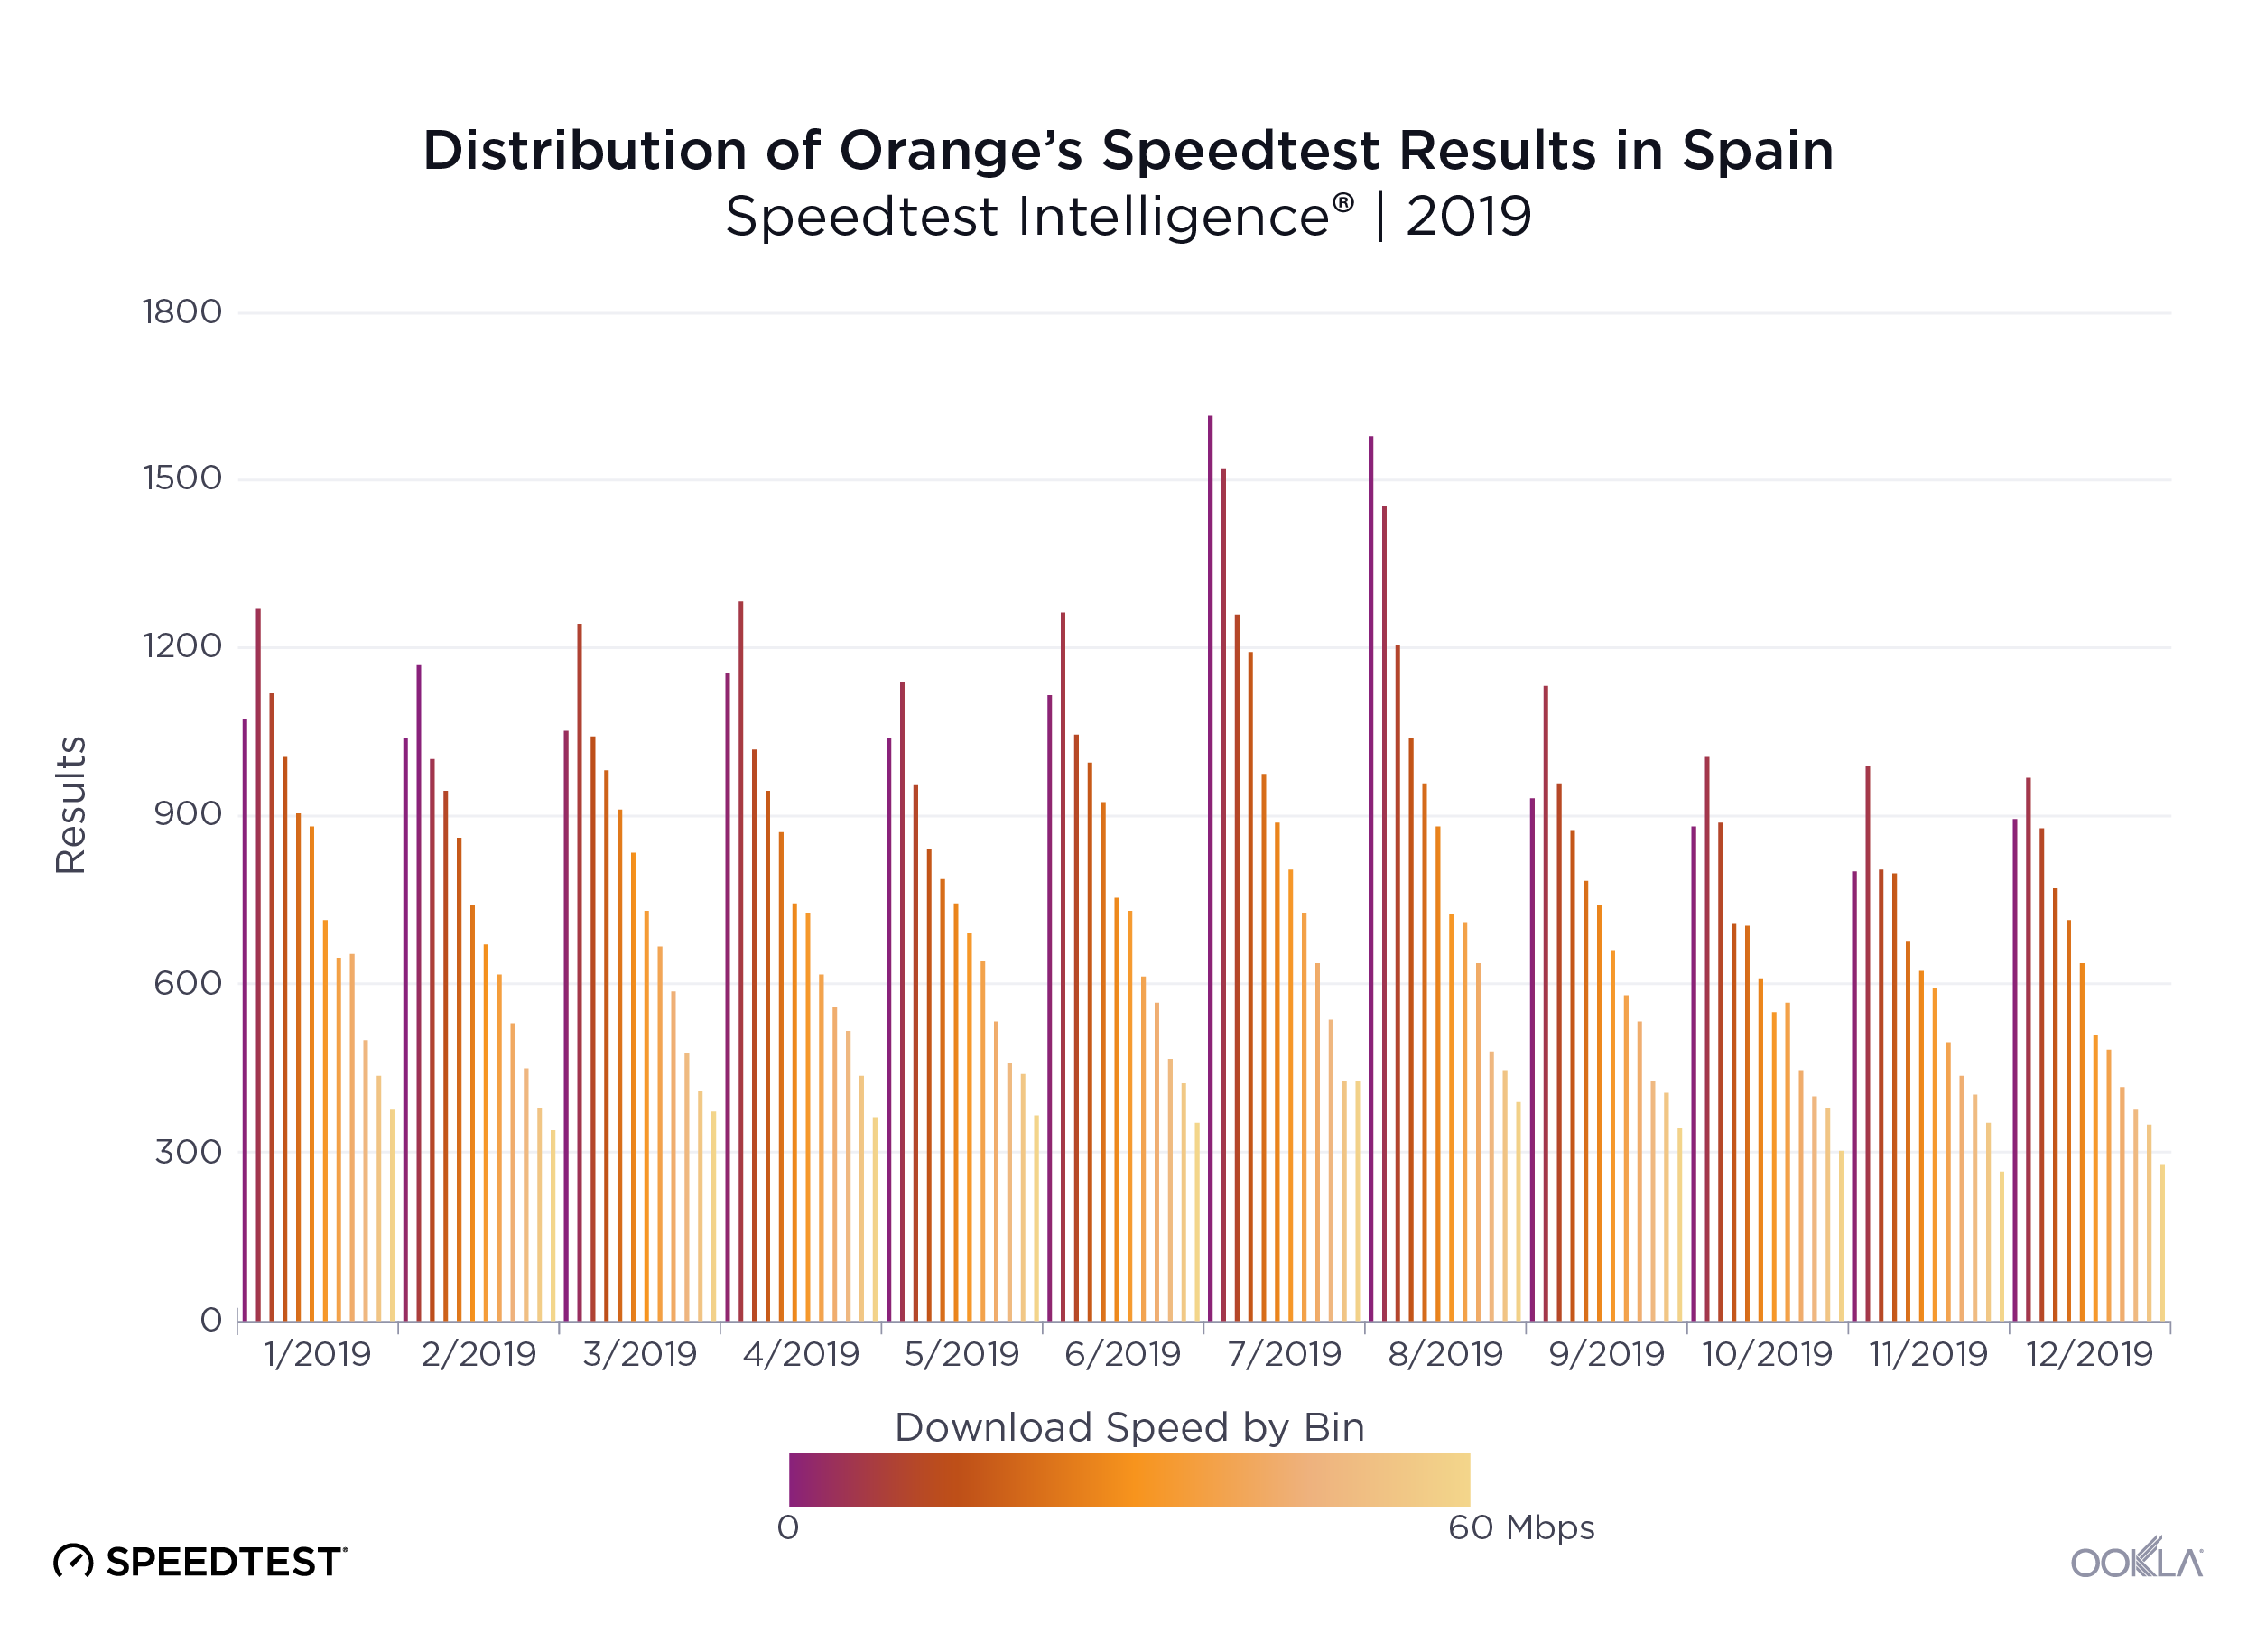
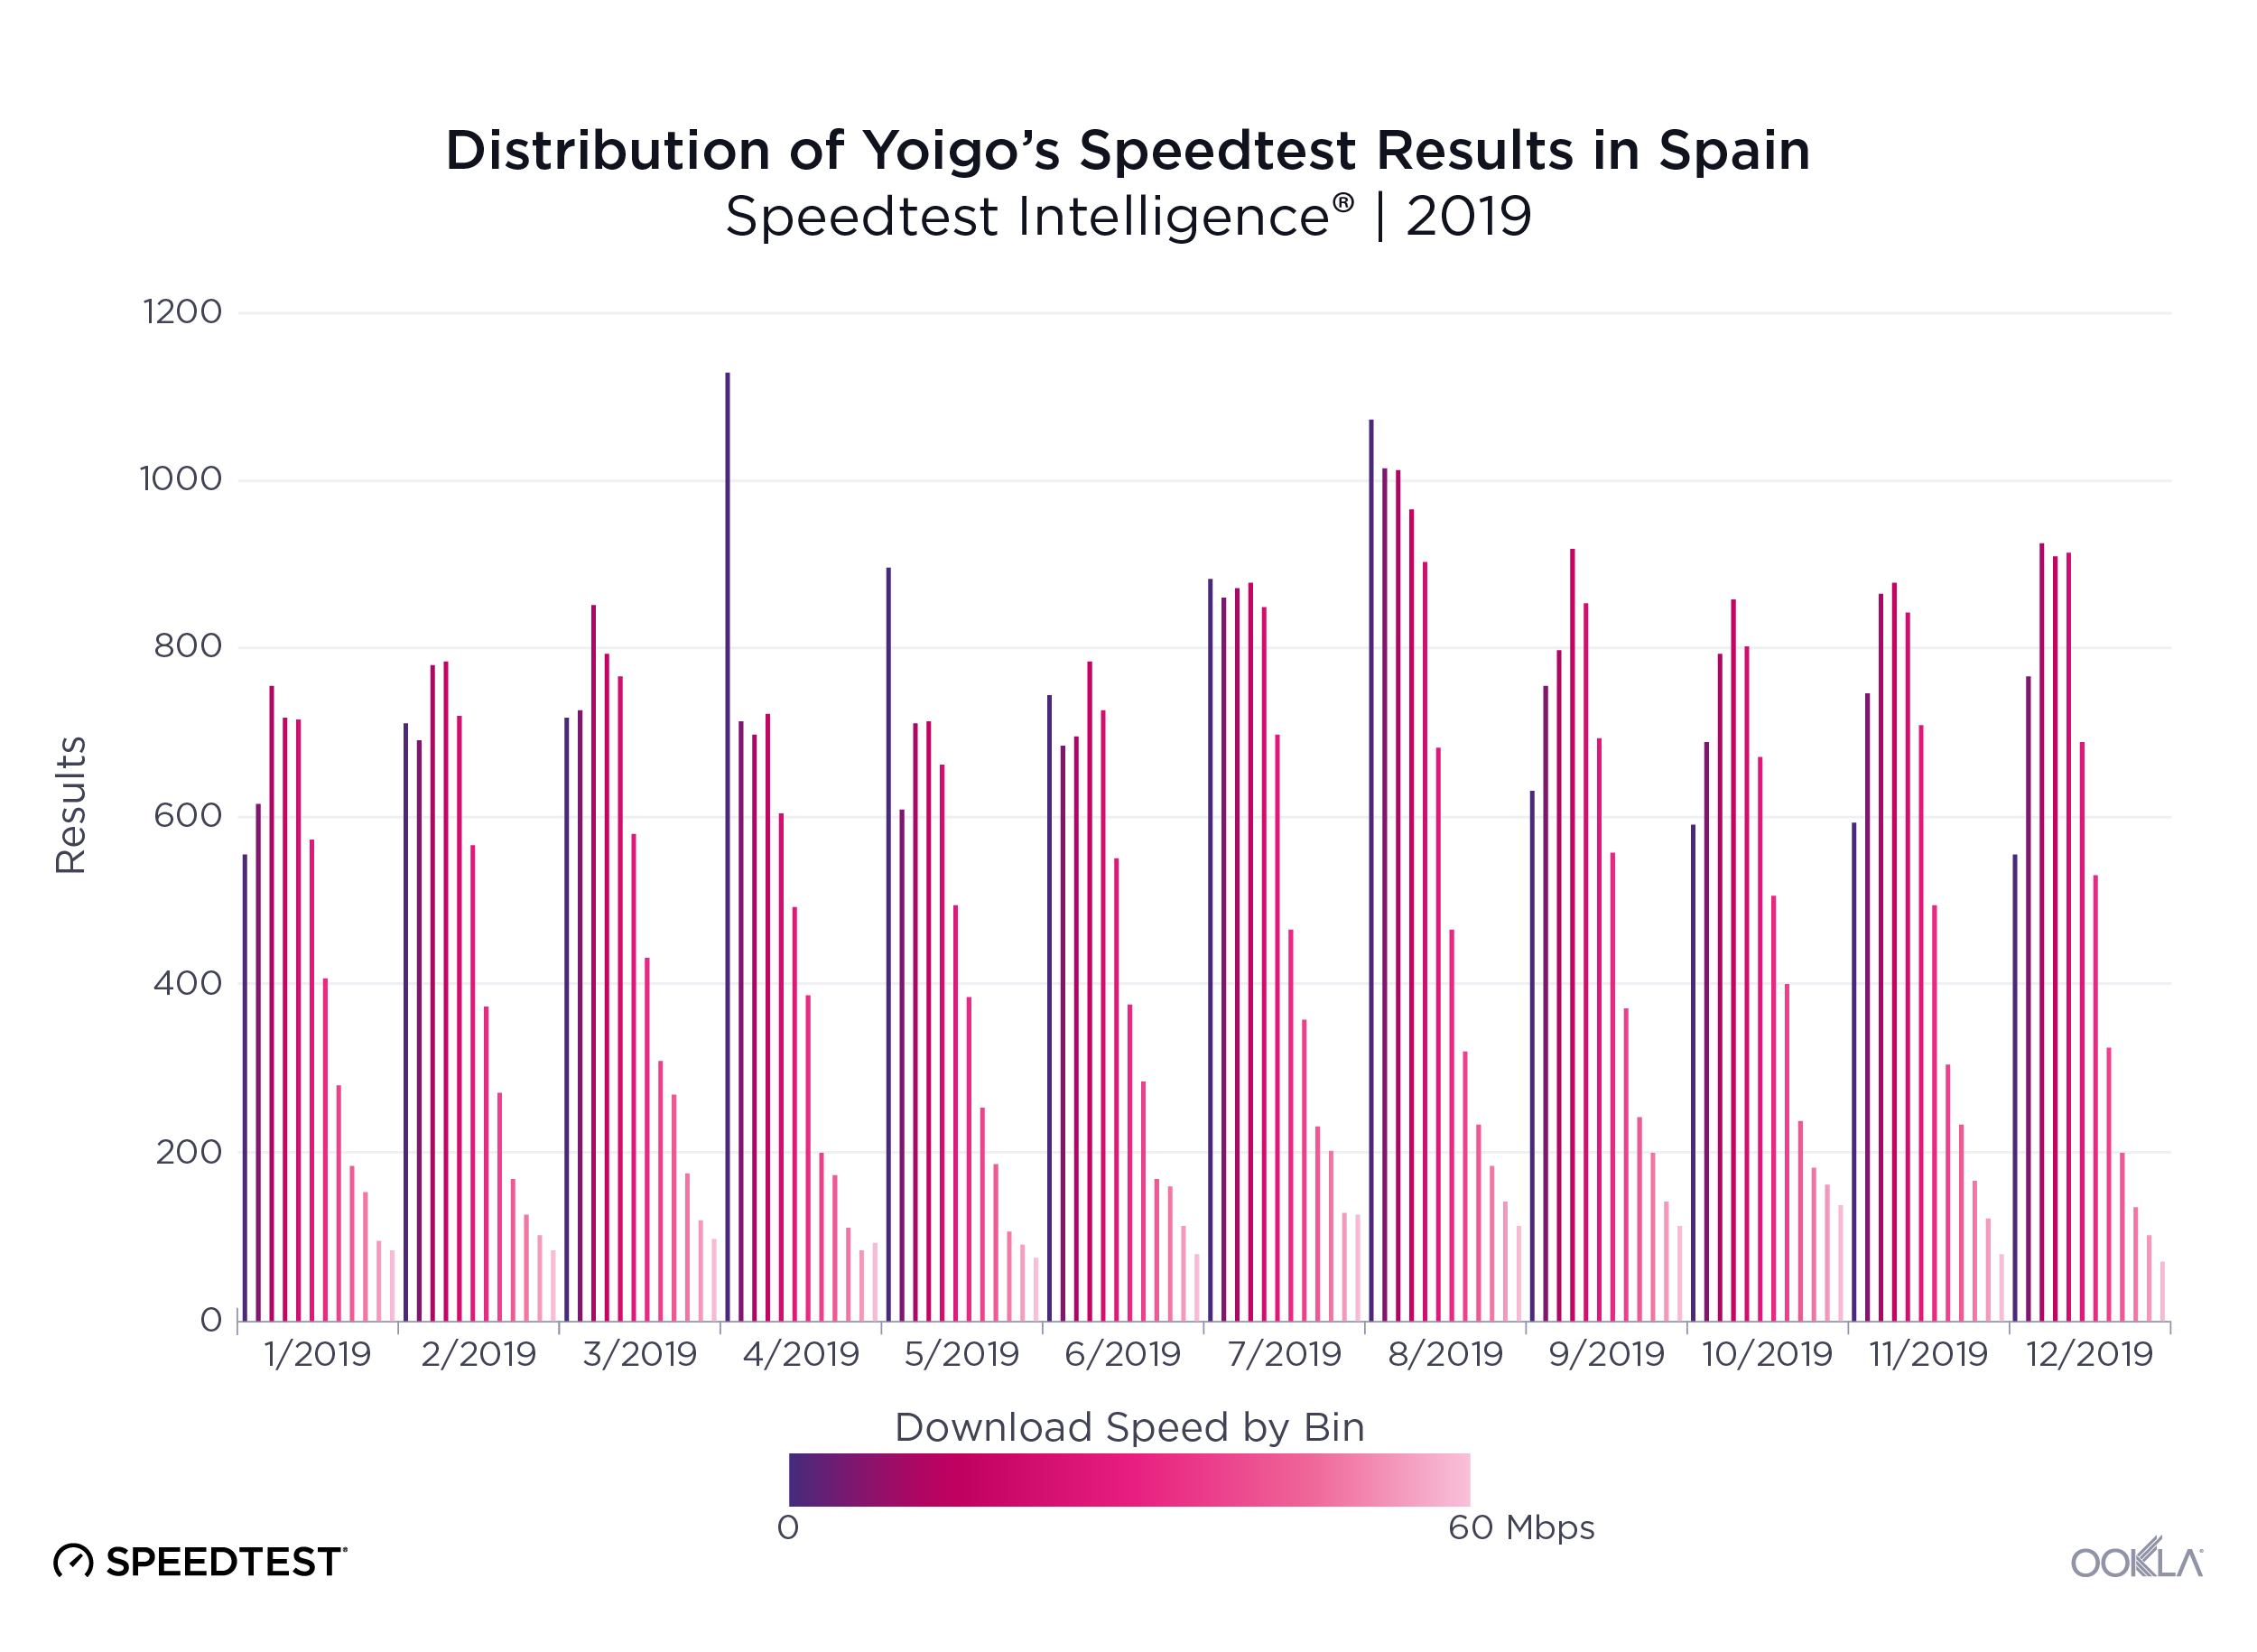
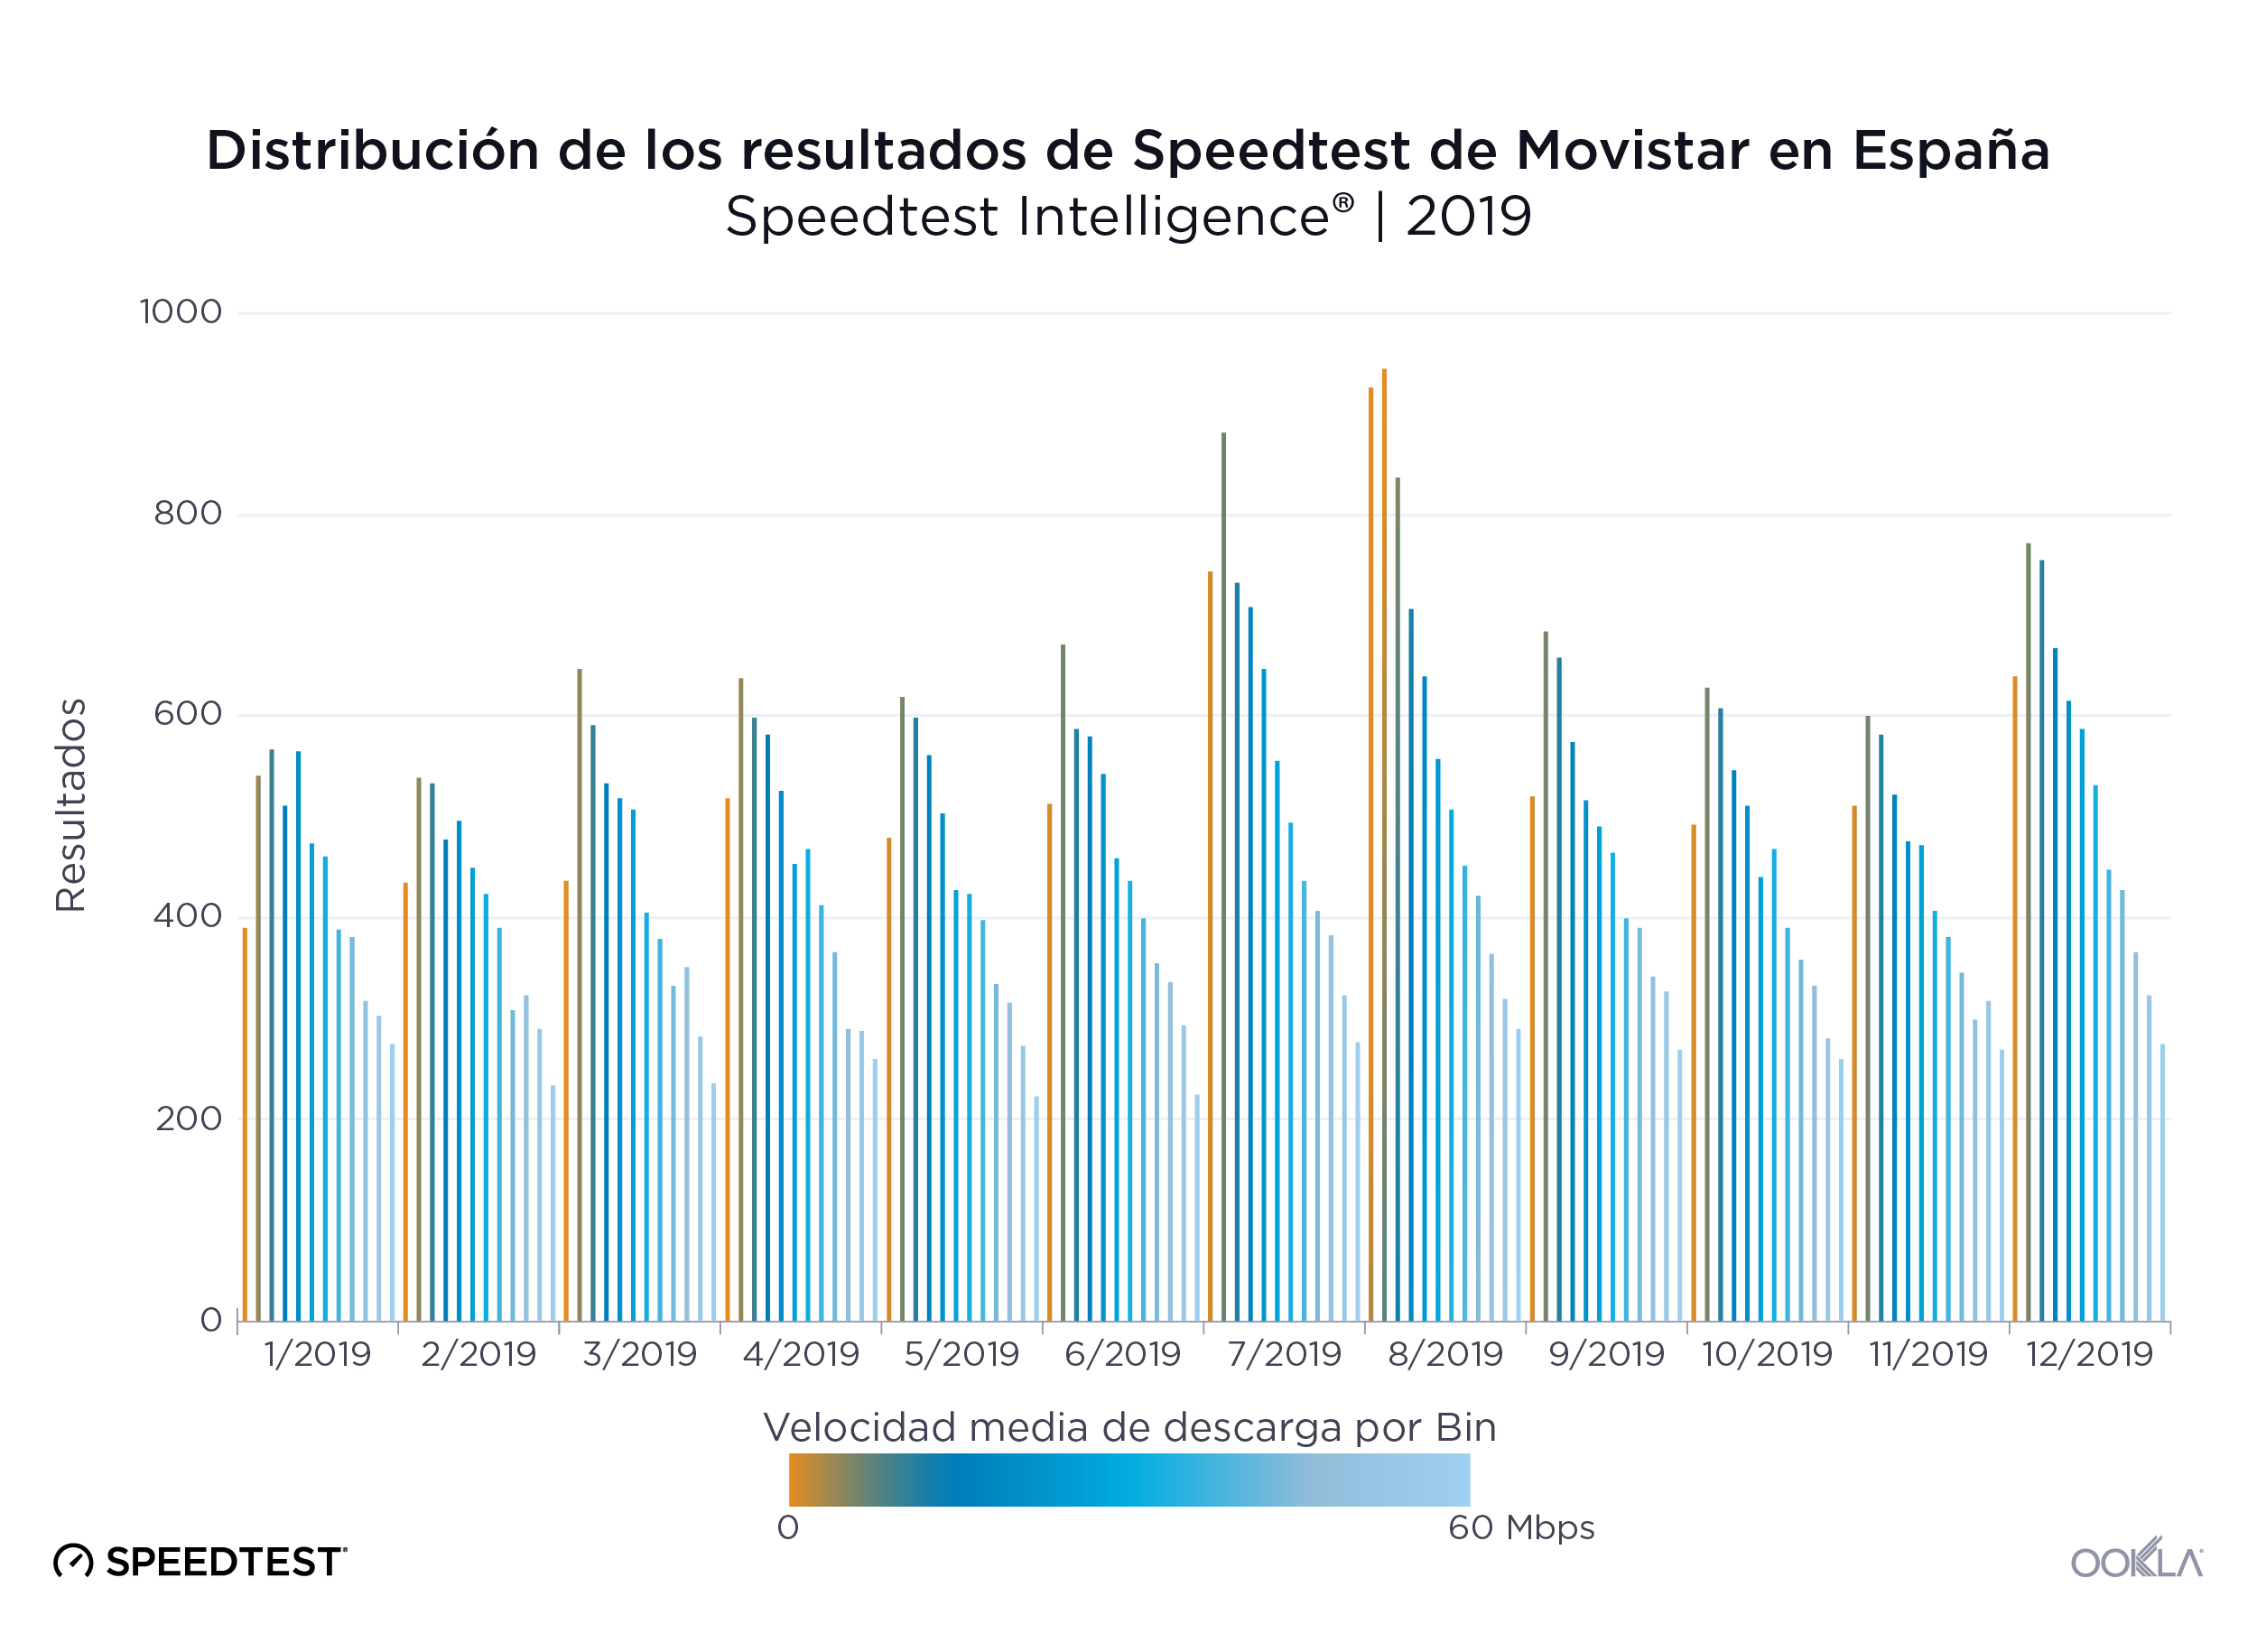
In contrast, we see more even distributions of download speeds among all other mobile operators in Spain.
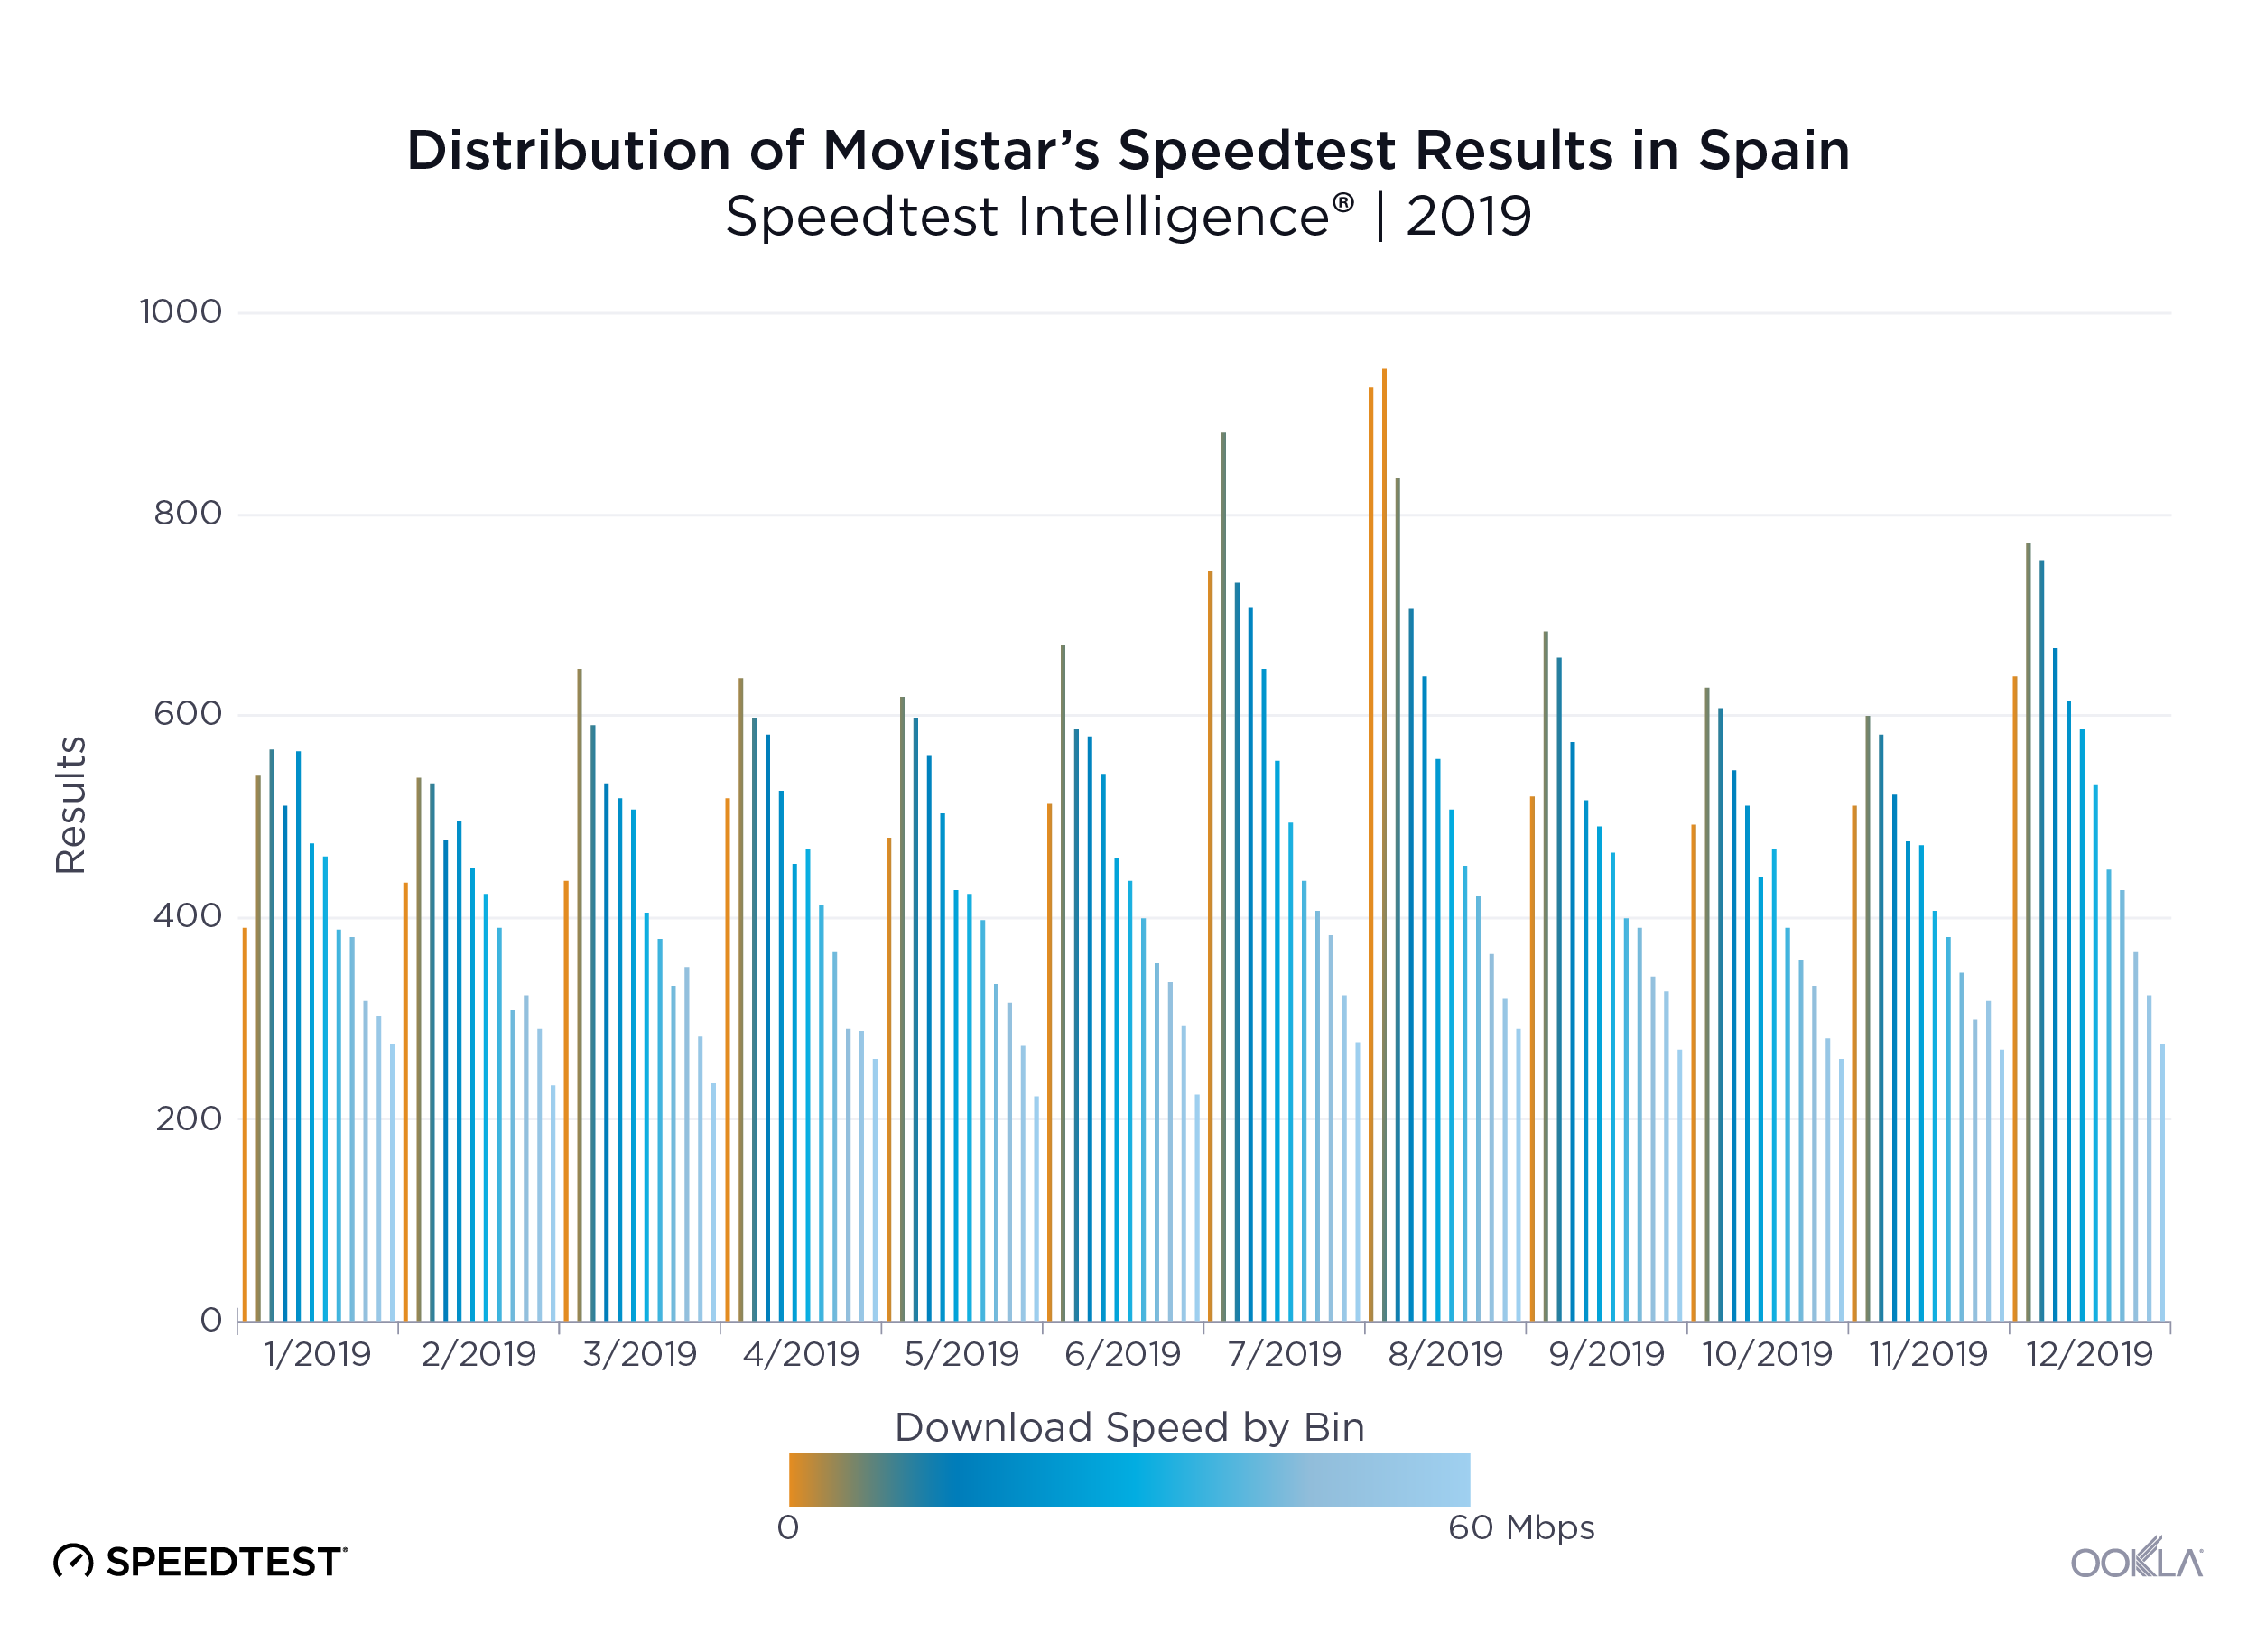
Ookla_Distribution-Speedtest-Results_Movistar_Spain_0220-3_en
Ookla_Distribution-Speedtest-Results_Orange_Spain_0220-3_en
Ookla_Distribution-Speedtest-Results_Yoigo_Spain_0220-3_en

MÁSMÓVIL and Movistar (mobile) offer the most consistent speeds

Speed is important, but if those speeds are inconsistent, it becomes difficult for users to reliably use their devices to stream HD video, browse the web or use online gaming. We used Speedtest data to calculate each top provider’s APS (Acceptable Performance Score) in Spain during Q3-Q4 2019.

APS for fixed broadband measures the percentage of samples that equal or exceed a download speed of 25 Mbps and also equal or exceed an upload speed of 3 Mbps. MÁSMÓVIL provided the most consistent experience in Spain on fixed broadband in Q3-Q4 2019 with an APS of 81.6%. Movistar was in last place with an APS of 61.9%.

Speed Consistency by Provider on Fixed Broadband
Speedtest Intelligence® | Q3-Q4 2019
Provider APS
MÁSMÓVIL 81.6%
Orange 75.1%
Vodafone 73.5%
Movistar 61.9%

APS on mobile measures the percentage of samples that equal or exceed a download speed of 5 Mbps and also equal or exceed an upload speed of 1 Mbps. Movistar took the top spot for consistency on mobile broadband with an APS of 88.9%. Vodafone had the lowest consistency score with an APS of 79.8%.

Speed Consistency by Operator on Mobile
Speedtest Intelligence® | Q3-Q4 2019
Provider APS
Movistar 88.9%
Orange 84.3%
Yoigo 82.6%
Vodafone 79.8%

Madrid led fixed and mobile broadband speeds
Ookla_Fixed-Broadband-Speeds_Spain_0220-1
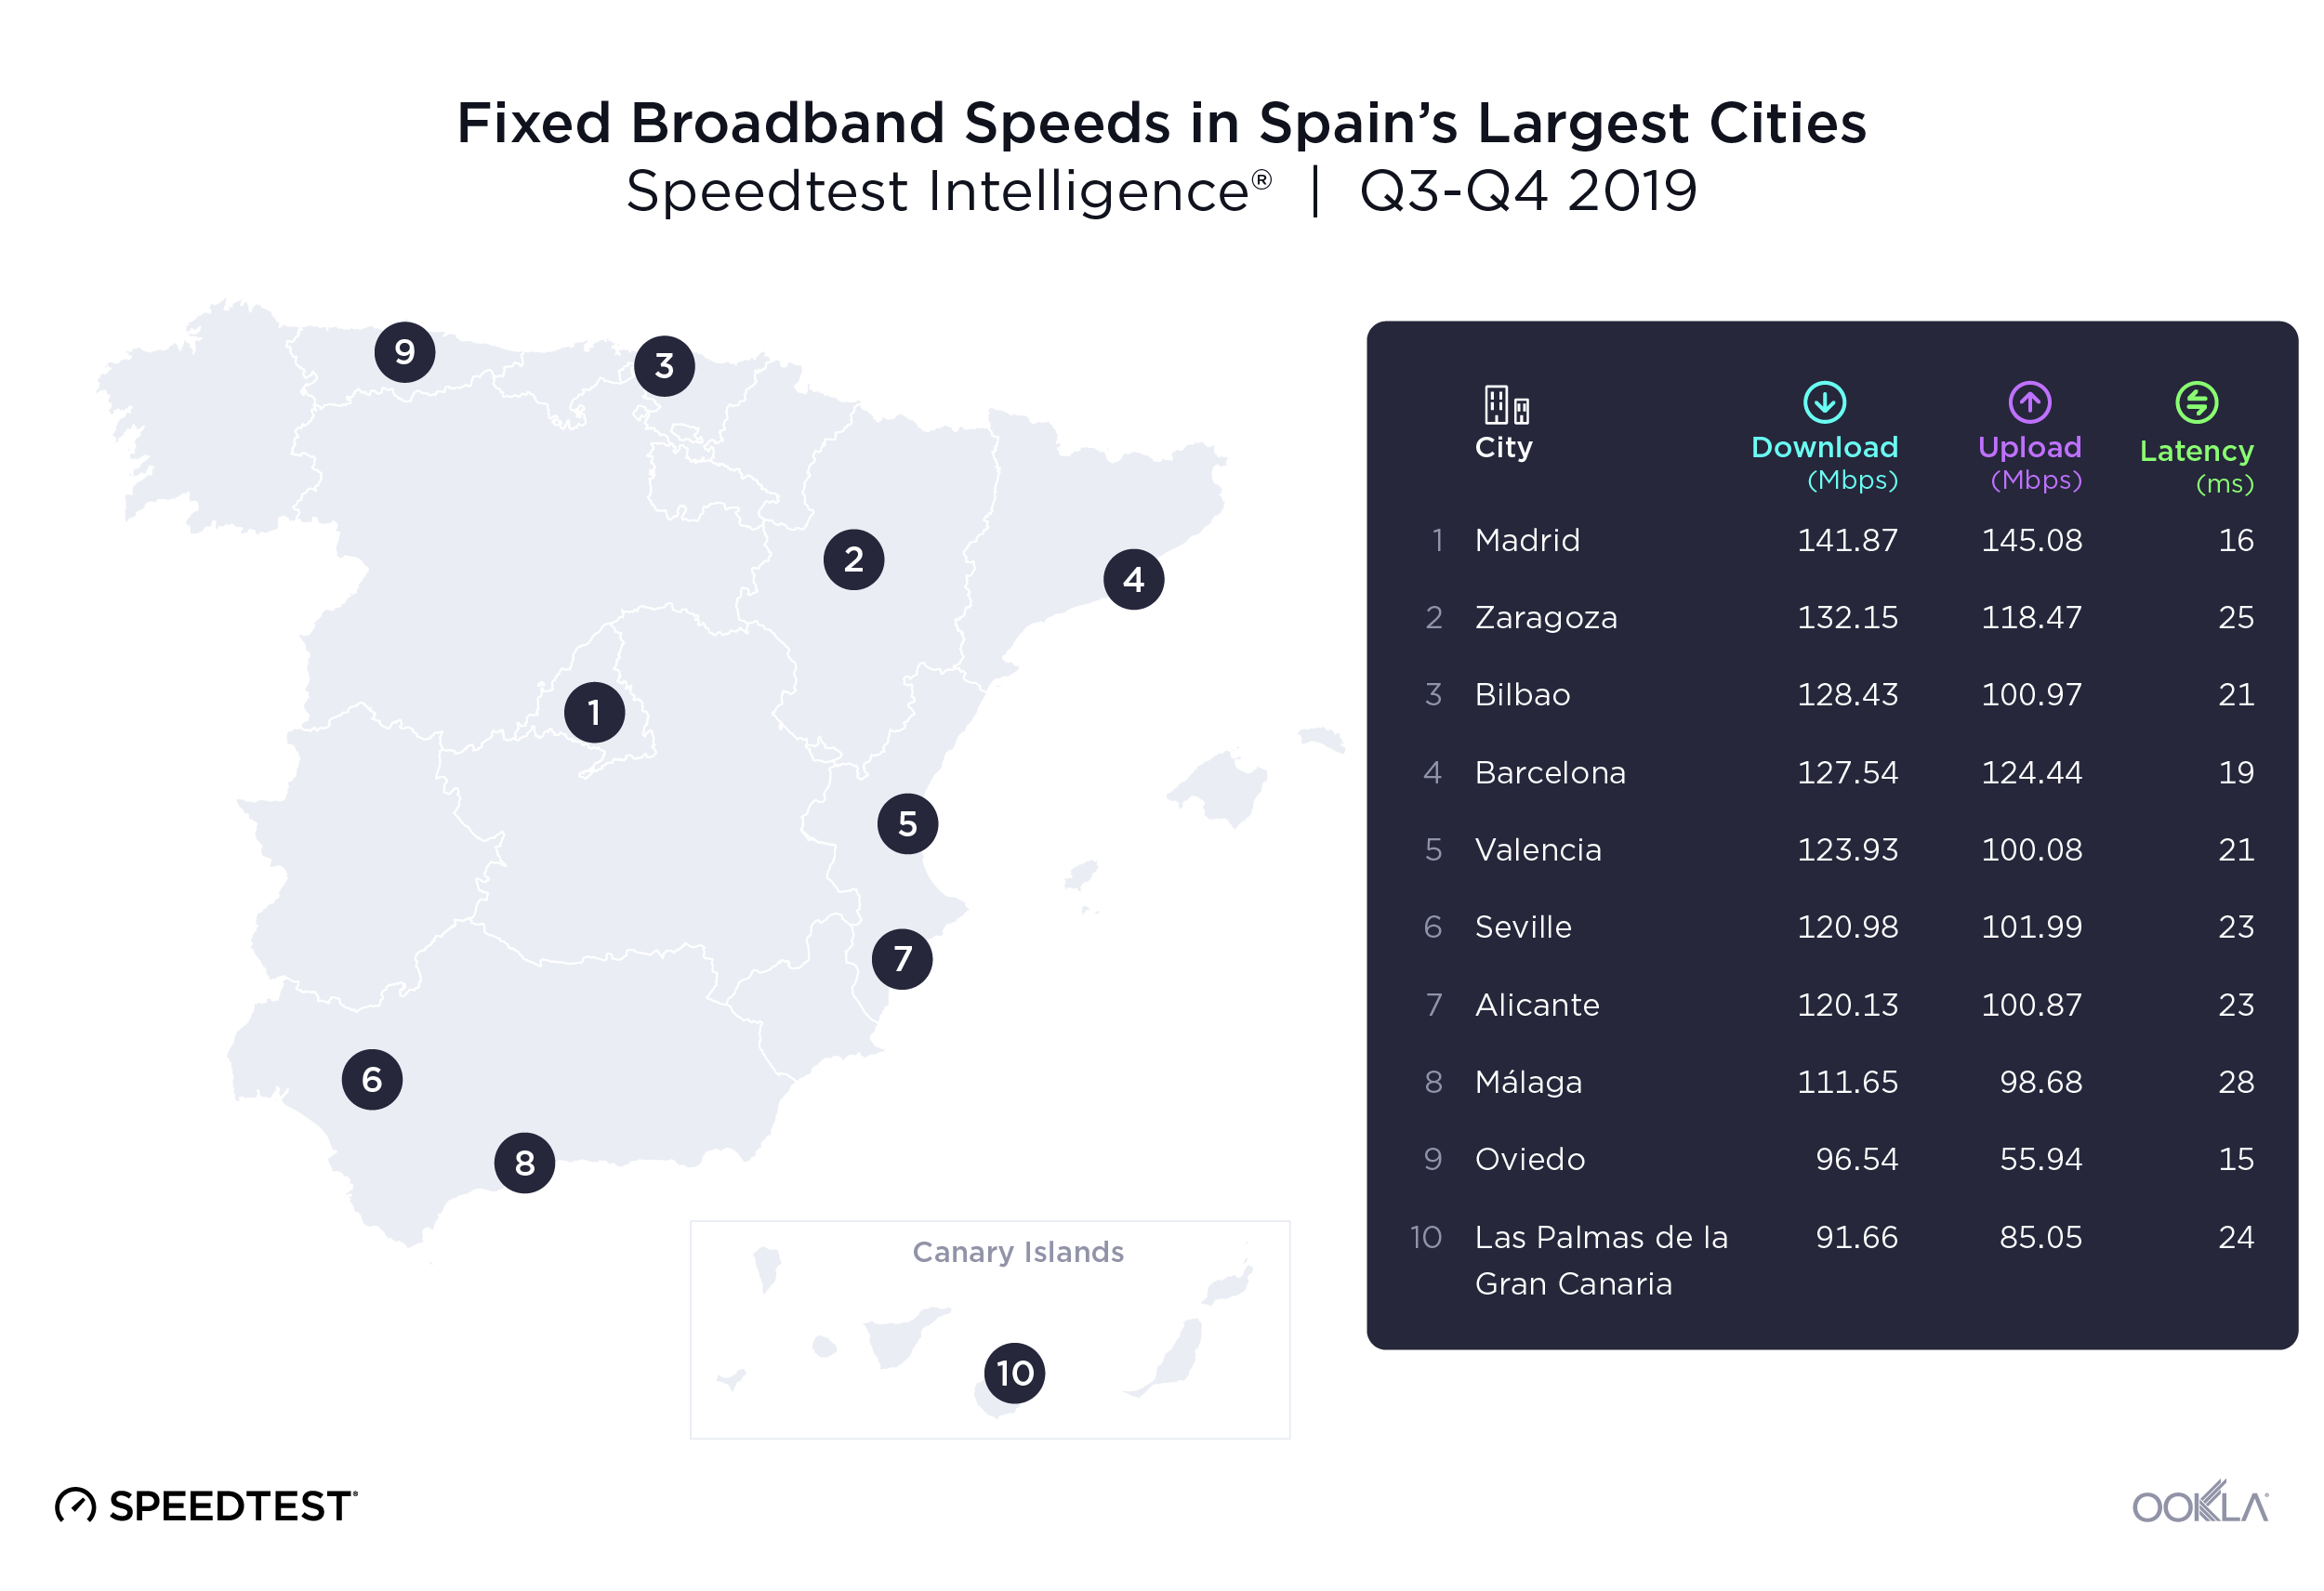
We used Speedtest data from 2,183,336 user-initiated tests to investigate internet speeds in Spain’s ten most populous cities during Q3-Q4 2019. Madrid had the fastest mean download speeds on both fixed broadband and mobile.

Mean download speeds on fixed broadband ranged from 141.87 Mbps in Madrid to 91.66 Mbps in Las Palmas de la Gran Canaria, a 35.4% difference. Madrid also had the fastest mean upload speed over fixed broadband at 145.08 Mbps. Oviedo took the last place in upload speeds on fixed broadband with a 61.4% slower upload speed than Madrid.

Oviedo had the lowest latency over fixed broadband of the cities on our list during Q3-Q4 2019 at 15 ms. Málaga had the highest latency at 28 ms.
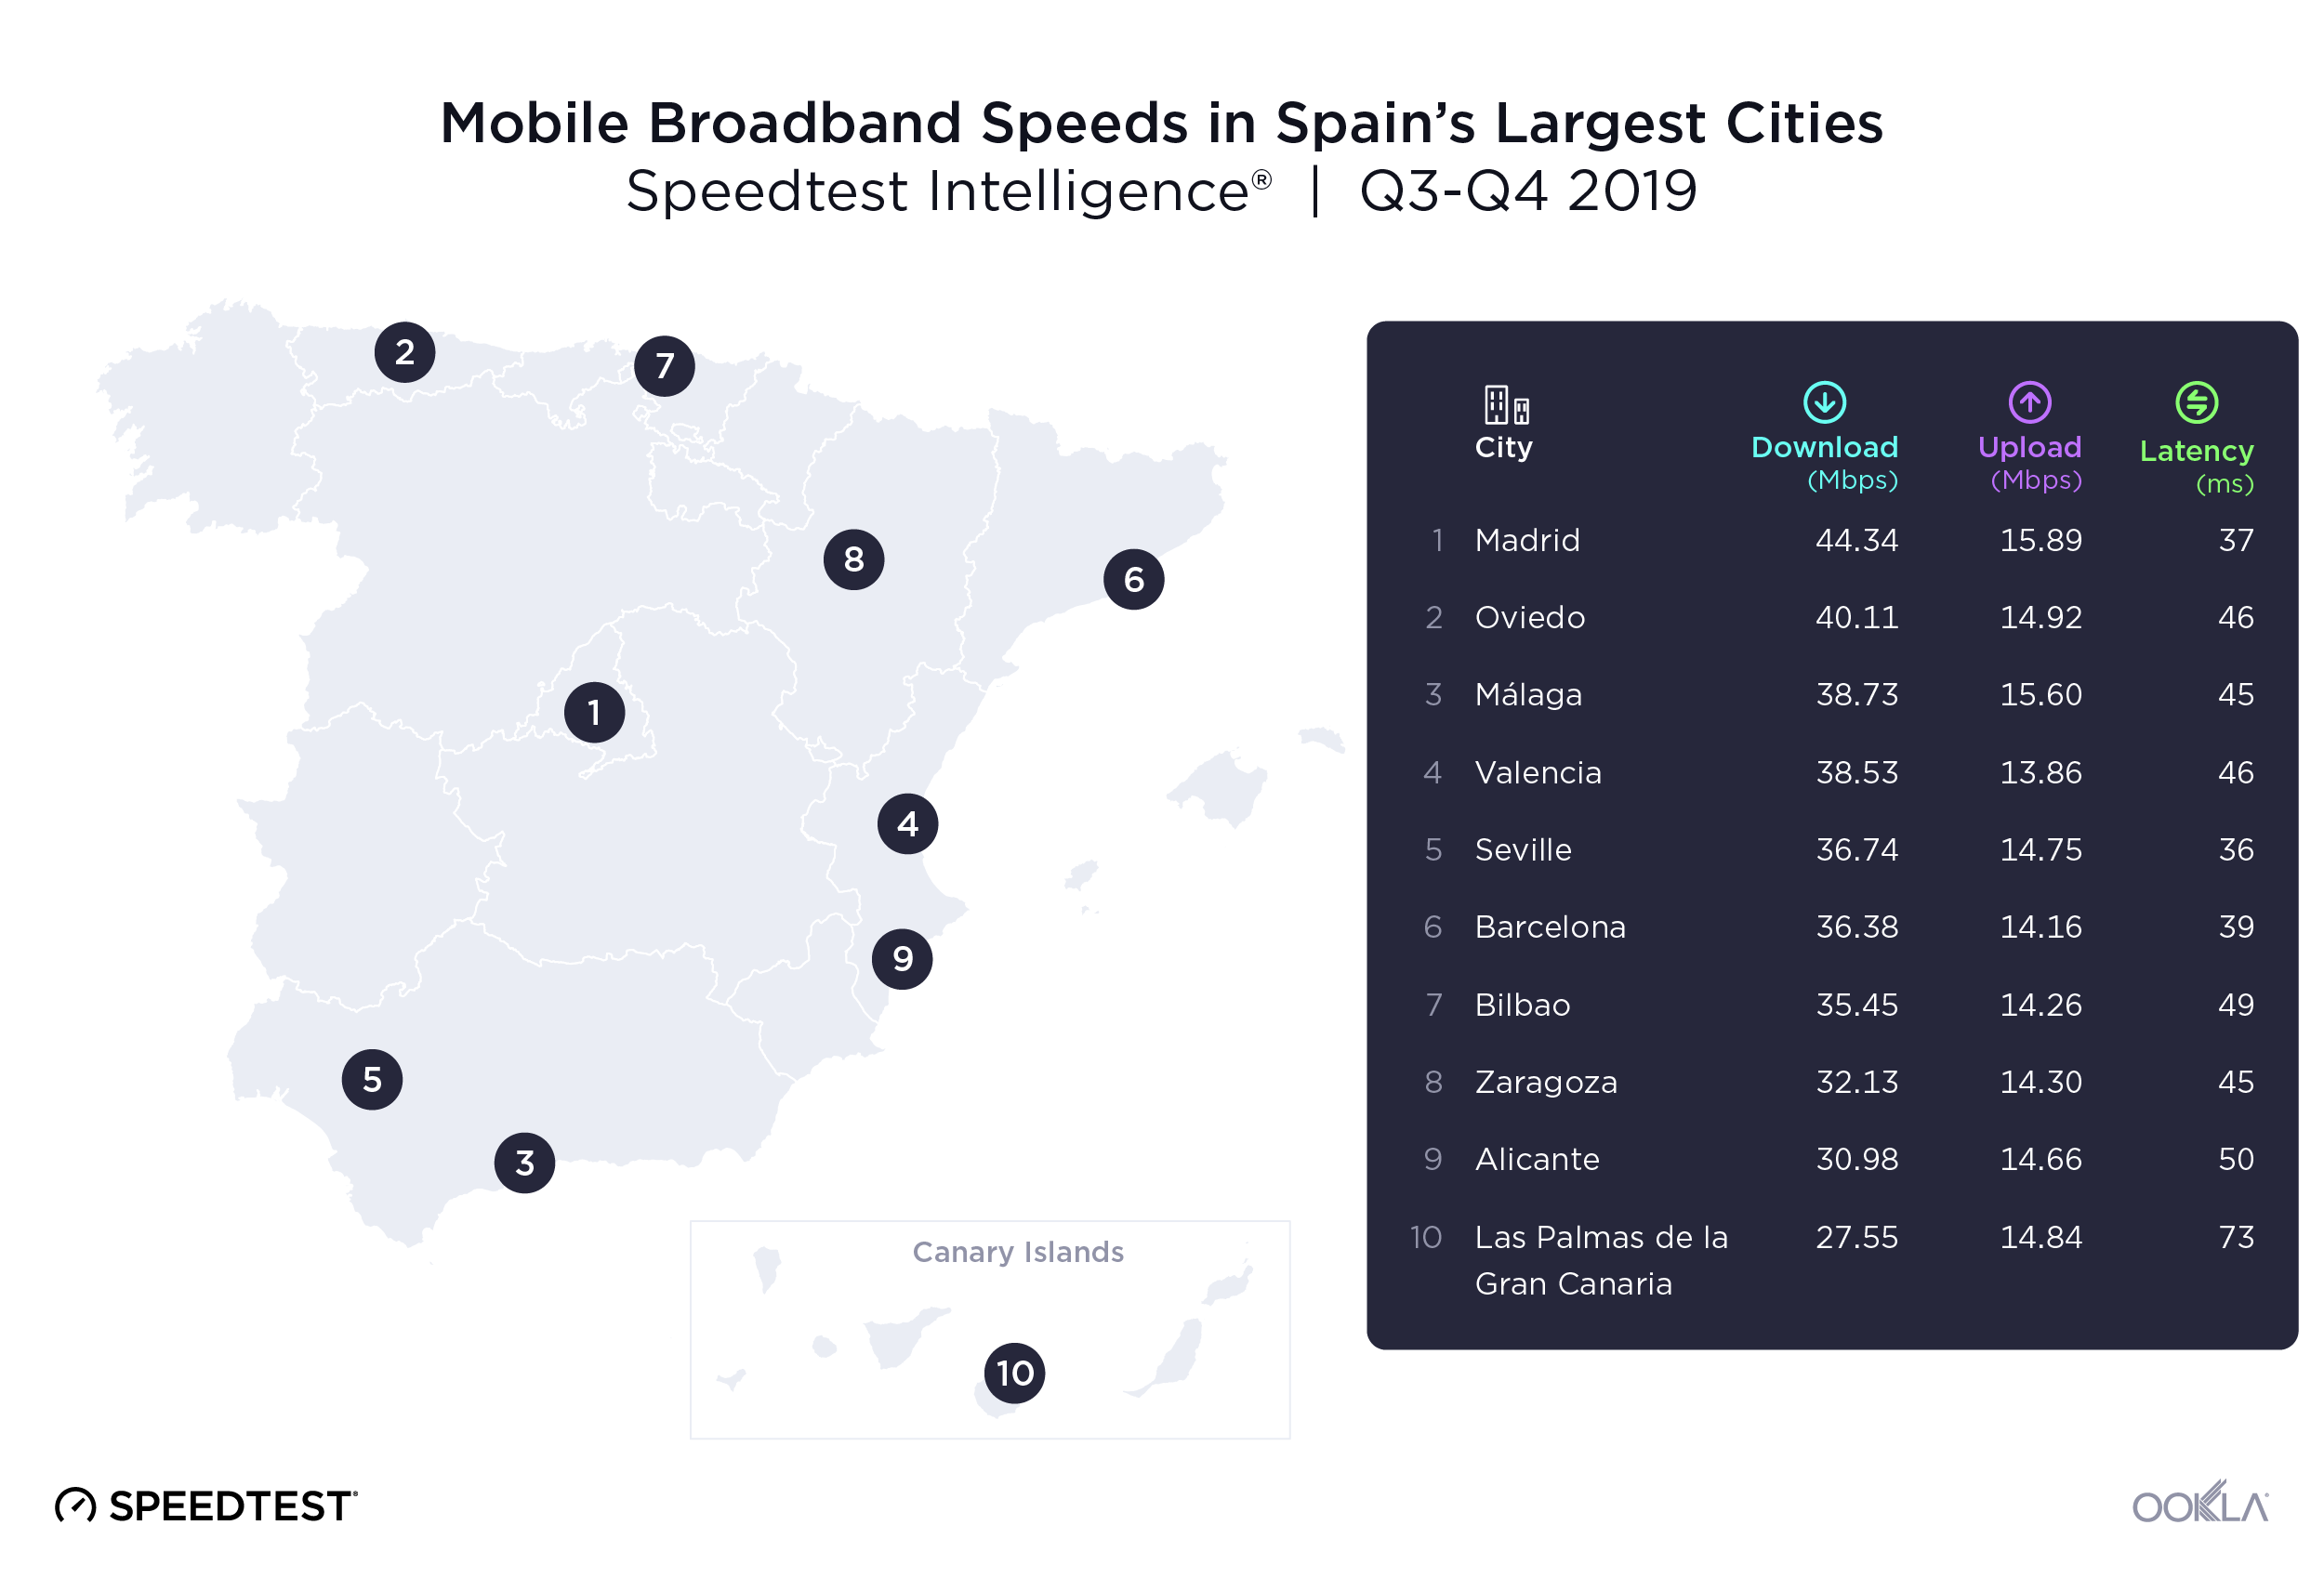
Ookla_Mobile-Broadband-Speeds_Spain_0220-1
The gap between fastest and slowest speeds between Spanish cities on mobile broadband was similar to what we saw fixed broadband during Q3-Q4 2019. Madrid once again led in performance on mobile broadband with a mean download speed of 44.35 Mbps and a mean upload speed of 15.89 Mbps. Las Palmas was in last place on download speeds with a 37.9% slower mean download speed than Madrid. Valencia had the slowest mean upload speed over mobile at 13.86 Mbps. Seville had the lowest latency over mobile at 36 ms during Q3-Q4 2019 and Las Palmas had the highest mobile latency at 73 ms.

Zaragoza led 4G Availability in Spain’s most populous cities

4G Availability in Spain’s Largest Cities
Speedtest Intelligence® | Q3-Q4 2019
City 4G Availability
Zaragoza 97.2%
Valencia 97.1%
Seville 96.8%
Málaga 96.7%
Oviedo 95.4%
Madrid 95.1%
Las Palmas de la Gran Canaria 95.0%
Alicante 94.6%
Bilbao 94.3%
Barcelona 87.7%

4G Availability was higher in Spain’s largest cities than the country’s average, with Zaragoza having the highest 4G Availability at 97.2% of tested locations. Barcelona had the lowest 4G Availability on our list at 87.7%.

MÁSMÓVIL was fastest fixed broadband provider in 6 cities

Looking specifically at Speed Score in individual Spanish cities during Q3-Q4 2019, we found MÁSMÓVIL was the fastest provider in six cities: Málaga, Seville, Zaragoza, Madrid, Valencia and Alicante. Adamo, the fastest fixed provider in Barcelona, had the highest Speed Score on the list at 185.29. Vodafone was the fastest provider in Bilbao and Oviedo.

Fixed Broadband Performance by Operator in Spain’s Largest Cities
Speedtest Intelligence® | Q3-Q4 2019
City Provider Speed ScoreTM
Barcelona Adamo 185.29
Málaga MÁSMÓVIL 156.24
Seville MÁSMÓVIL 148.78
Madrid MÁSMÓVIL 145.83
Bilbao Vodafone 144.65
Zaragoza MÁSMÓVIL 144.40
Oviedo Vodafone 143.85
Valencia MÁSMÓVIL 143.99
Alicante MÁSMÓVIL 143.72
Las Palmas Orange 114.46

Looking at the fastest Spanish providers on mobile broadband for each city during Q3-Q4 2019, Movistar dominated the list with the fastest Speed Score in 7 cities. Movistar also had the highest Speed Score overall at 52.04 in Seville. Vodafone was the fastest mobile provider in Madrid (35.67). Orange was the fastest provider in Barcelona (35.37) and Oviedo (45.10).

Mobile Performance by Operator in Spain’s Largest Cities
Speedtest Intelligence® | Q3-Q4 2019
City Provider Speed ScoreTM
Seville Movistar 52.04
Valencia Movistar 50.80
Alicante Movistar 50.36
Málaga Movistar 48.97
Bilbao Movistar 48.86
Oviedo Orange 45.10
Zaragoza Movistar 40.79
Madrid Vodafone 35.67
Las Palmas Movistar 35.37
Barcelona Vodafone 31.37

We look forward to following these markets and investigating the changing landscape of internet performance and mobile coverage in Europe. Want to learn more about fixed and mobile speeds in different markets? Click here to read more Ookla Research.

Editor’s note: This article was updated on March 4, 2020 to correct an editing error that incorrectly reported the figures for mobile APS.

Velocidades de banda ancha fija y móvil, y disponibilidad de 4G en España

Hemos investigado el rendimiento de la banda ancha fija y móvil, así como la disponibilidad de 4G en España. También hemos comparado las velocidades y la cobertura españolas con las de los países europeos vecinos, así como el rendimiento y la disponibilidad de 4G de los principales proveedores de las diez ciudades más grandes de España en el segundo semestre de 2019. Además de clasificar a los proveedores españoles por su velocidad y cobertura máximas, también hemos analizado los efectos de los planes móviles con limitaciones de velocidad basándonos en los resultados de Speedtest® y hemos clasificado a los proveedores según la constancia del rendimiento de sus redes.

España y Francia fueron los países más rápidos de nuestra lista de banda ancha fija

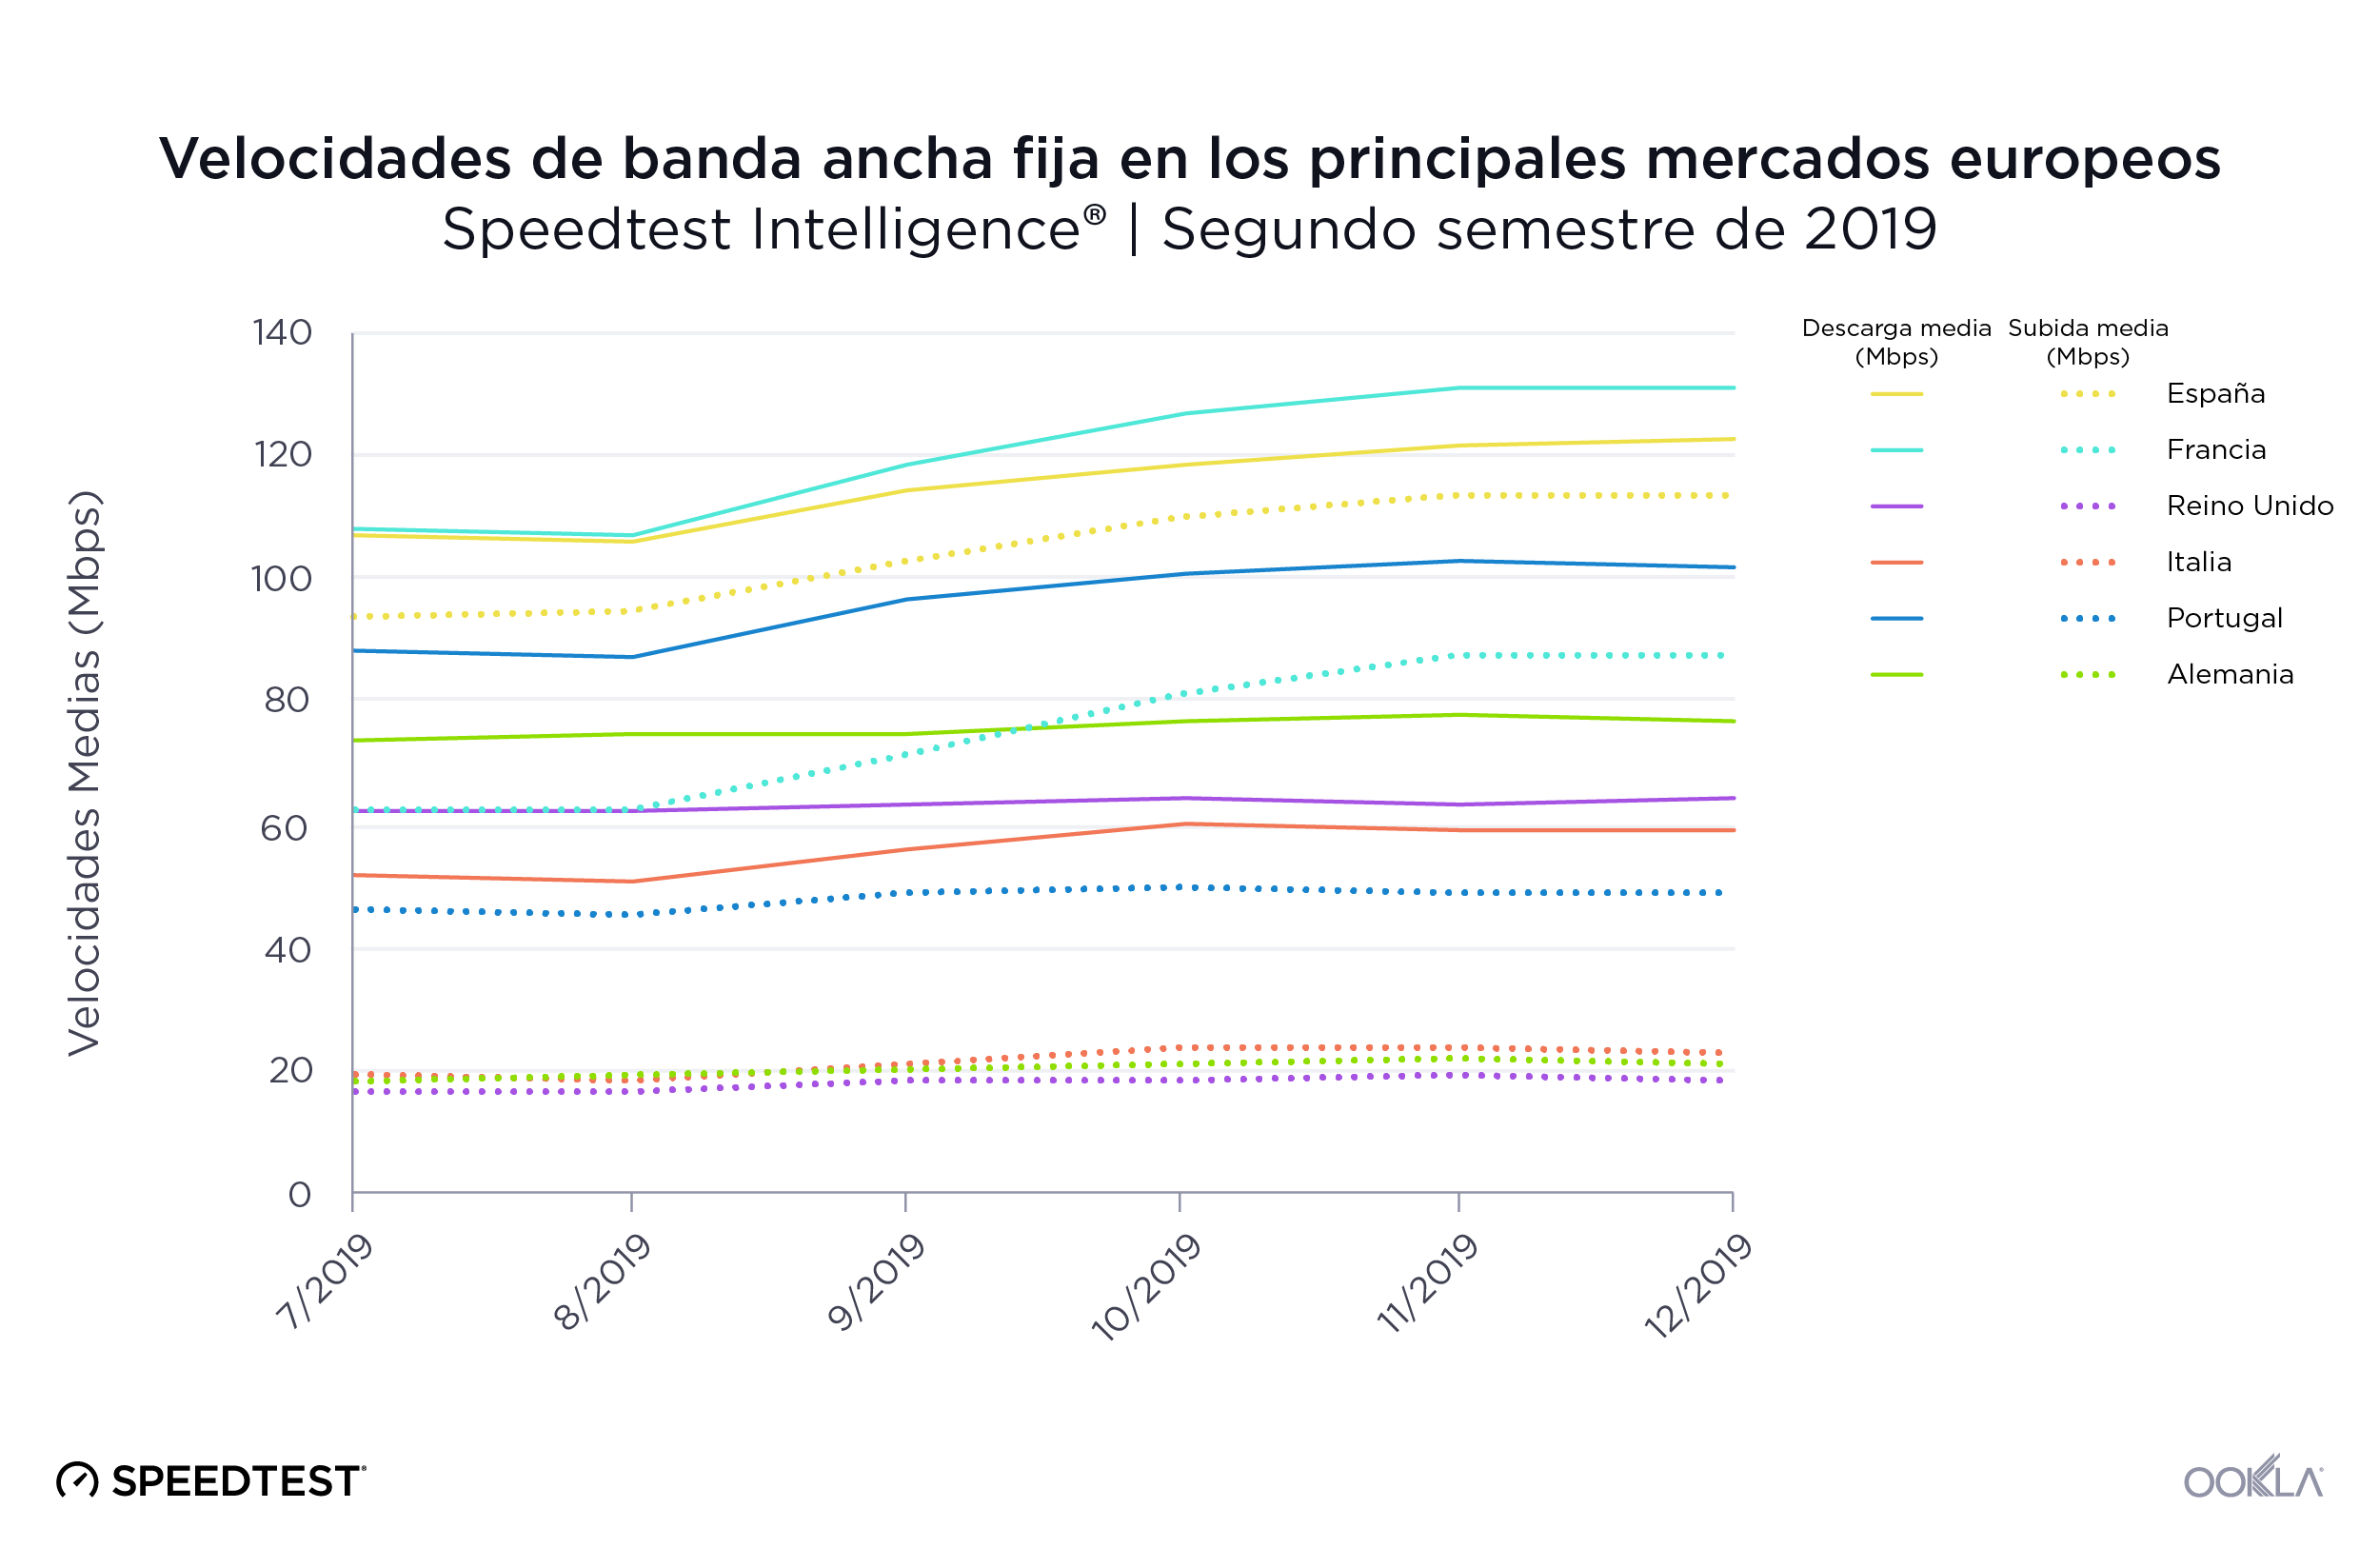
Hemos comparado el rendimiento de la banda ancha fija de España a nivel de país con varios otros países de la Europa occidental en el segundo semestre de 2019. España obtuvo una buena posición en cuanto a velocidad de descarga media en banda ancha fija, con 113,72 Mbps, en segundo lugar solo después de los 119,37 Mbps de Francia. España registró la velocidad de subida media más alta de esta lista: 103,72 Mbps. Italia obtuvo la velocidad de descarga media más baja de esta lista, 56,72 Mbps, mientras que el Reino Unido registró la velocidad de subida media más baja, 18,28 Mbps.
fixed-broadband-speeds-sp-2

Francia registró el mayor aumento en la velocidad de descarga media del segundo semestre de 2019, con el 21,5 %, seguida de Portugal y Italia, con el 15,4 %, y España, con el 14,5 %. Las velocidades se mantuvieron relativamente invariables durante este periodo en Italia, Reino Unido y Alemania.

Un análisis de la latencia en banda ancha fija en el segundo semestre de 2019 reveló una clasificación por rendimiento muy distinta. Portugal se anotó la latencia más baja de este periodo: 16 ms. Alemania y Reino Unido empataron en el segundo puesto con 23 ms. España resultó tercera (25 ms), Italia cuarta (30 ms) y Francia quinta (32 ms).

España, cuarto país en velocidad de descarga en Internet móvil
mobile-speeds-sp-3

La clasificación de España en velocidad de descarga media por móvil no fue tan buena como la de banda ancha fija, quedándose con un cuarto puesto con 33,97 Mbps en el segundo semestre de 2019. Esto supuso una velocidad un 22,8 % más lenta que la del primer país clasificado, Francia. Sin embargo, España registró las velocidades de subida medias más altas en Internet móvil, con 13,12 Mbps en el segundo semestre de 2019.

Portugal experimentó el mayor aumento en velocidad de descarga de Internet móvil en el segundo semestre de 2019, el 18,4 %. La velocidad de descarga media de España en Internet móvil aumentó solo un 6,7 % en este periodo. Francia registró el menor aumento de velocidad de descarga de Internet móvil, un 2,8 %.

Como vimos en la banda ancha fija, la latencia móvil más baja fue la de Portugal, con 32 ms. Alemania fue segunda con 41 ms, Francia tercera con 43 ms, Reino Unido cuarto con 44 ms, España quinta con 47 ms e Italia última con 52 ms.

Reino Unido y España, líderes en disponibilidad de 4G

Utilizamos datos de exploraciones de cobertura de Speedtest en Android para comparar la disponibilidad de 4G en cada mercado en el segundo semestre de 2019. Mientras que el Reino Unido mostró la mayor disponibilidad de 4G con el 88,8 %, España y Francia ocuparon el segundo lugar, con 4G disponible en el 87,7 % de las ubicaciones probadas. Durante ese período, Alemania tuvo la menor disponibilidad de 4G con un 72,1 %.

Disponibilidad de 4G en los principales mercados europeos
Speedtest Intelligence® | Segundo semestre de 2019
País Disponibilidad de 4G
Reino Unido 88,8 %
España 87,7 %
Francia 87,7 %
Italia 86,7 %
Portugal 85,0 %
Alemania 72,1 %

Si nos fijamos específicamente en los principales proveedores móviles de España, Orange ofreció la mayor disponibilidad de 4G con un 88,1 %. Movistar fue segundo, Yoigo tercero, y Vodafone cuarto.

Disponibilidad de 4G por proveedor en España
Speedtest Intelligence® | Segundo semestre de 2019
Proveedor Disponibilidad de 4G
Orange 88,1 %
Movistar 87,7 %
Yoigo 87,4 %
Vodafone 86,1 %

Los despliegues de 5G en España se están expandiendo
5G-Deployments-in-Spain-0220_es
El entusiasmo por el 5G es evidente en España. Vodafone desplegó 5G comercialmente disponible en un total de 18 ciudades españolas a fecha del 13 de febrero de 2020, incluidas Barcelona, Madrid, Valencia, Málaga y Bilbao. Los datos de Speedtest revelan que en España la velocidad media de descarga en 5G en el segundo semestre de 2019 fue de 350,68 Mbps (velocidad superior a la media nacional para Internet móvil) y la velocidad de subida media por 5G fue de 31,82 Mbps. La latencia media por 5G en España fue de 27 ms en el segundo semestre de 2019.

MÁSMÓVIL fue el proveedor de banda ancha fija más rápido de España

Al utilizar Speed Score™, sistema que combina mediciones de velocidades de descarga y de subida, para comparar los principales proveedores de servicios de Internet de España en el segundo semestre de 2019, descubrimos que MÁSMÓVIL obtuvo los mejores resultados, con una puntuación de 133,75 en banda ancha fija. Orange ocupó el segundo lugar con 115,25, seguido de Vodafone (105,07) y Movistar (103,01).

Rendimiento de la banda ancha fija en España por proveedor
Speedtest Intelligence® | Segundo semestre de 2019
Proveedor Speed ScoreTM
MÁSMÓVIL 133,75
Orange 115,25
Vodafone 105,07
Movistar 103,01

Movistar fue el operador móvil más rápido de España

Movistar obtuvo la máxima puntuación de velocidad de entre los operadores móviles de España en el segundo semestre de 2019, con 37,76. Orange fue segundo con 33,02, Vodafone la tercera con 26,34 y Yoigo cuarta con 22,43. Como veremos más adelante, el rendimiento general de la velocidad puede verse afectado por los límites de velocidad y los planes de tarifas vigentes en España.

Rendimiento de Internet móvil en España por operador
Speedtest Intelligence® | Segundo semestre de 2019
Proveedor Speed ScoreTM
Movistar 37,76
Orange 33,02
Vodafone 26,34
Yoigo 22,43

La limitación de velocidad afecta al rendimiento general

La limitación de la velocidad, una restricción de servicio impuesta a una conexión de Internet por los operadores, permite a estos ofrecer también planes que se centren en la asequibilidad más que en el rendimiento máximo.
Ookla_Distribution-Speedtest-Results_Vodafone_Spain_0220-3_es
En el gráfico anterior se muestra cómo los planes de suscripción con limitación de velocidad introducidos por Vodafone afectaron a la distribución de las velocidades de descarga. Aunque esos planes (con limitaciones de 2 Mbps y 10 Mbps, respectivamente) estaban disponibles desde abril, no vemos un efecto verdadero en las velocidades medias hasta mayo y junio cuando las medidas de 0-5 Mbps y 10-15 Mbps empiezan a sobresalir.

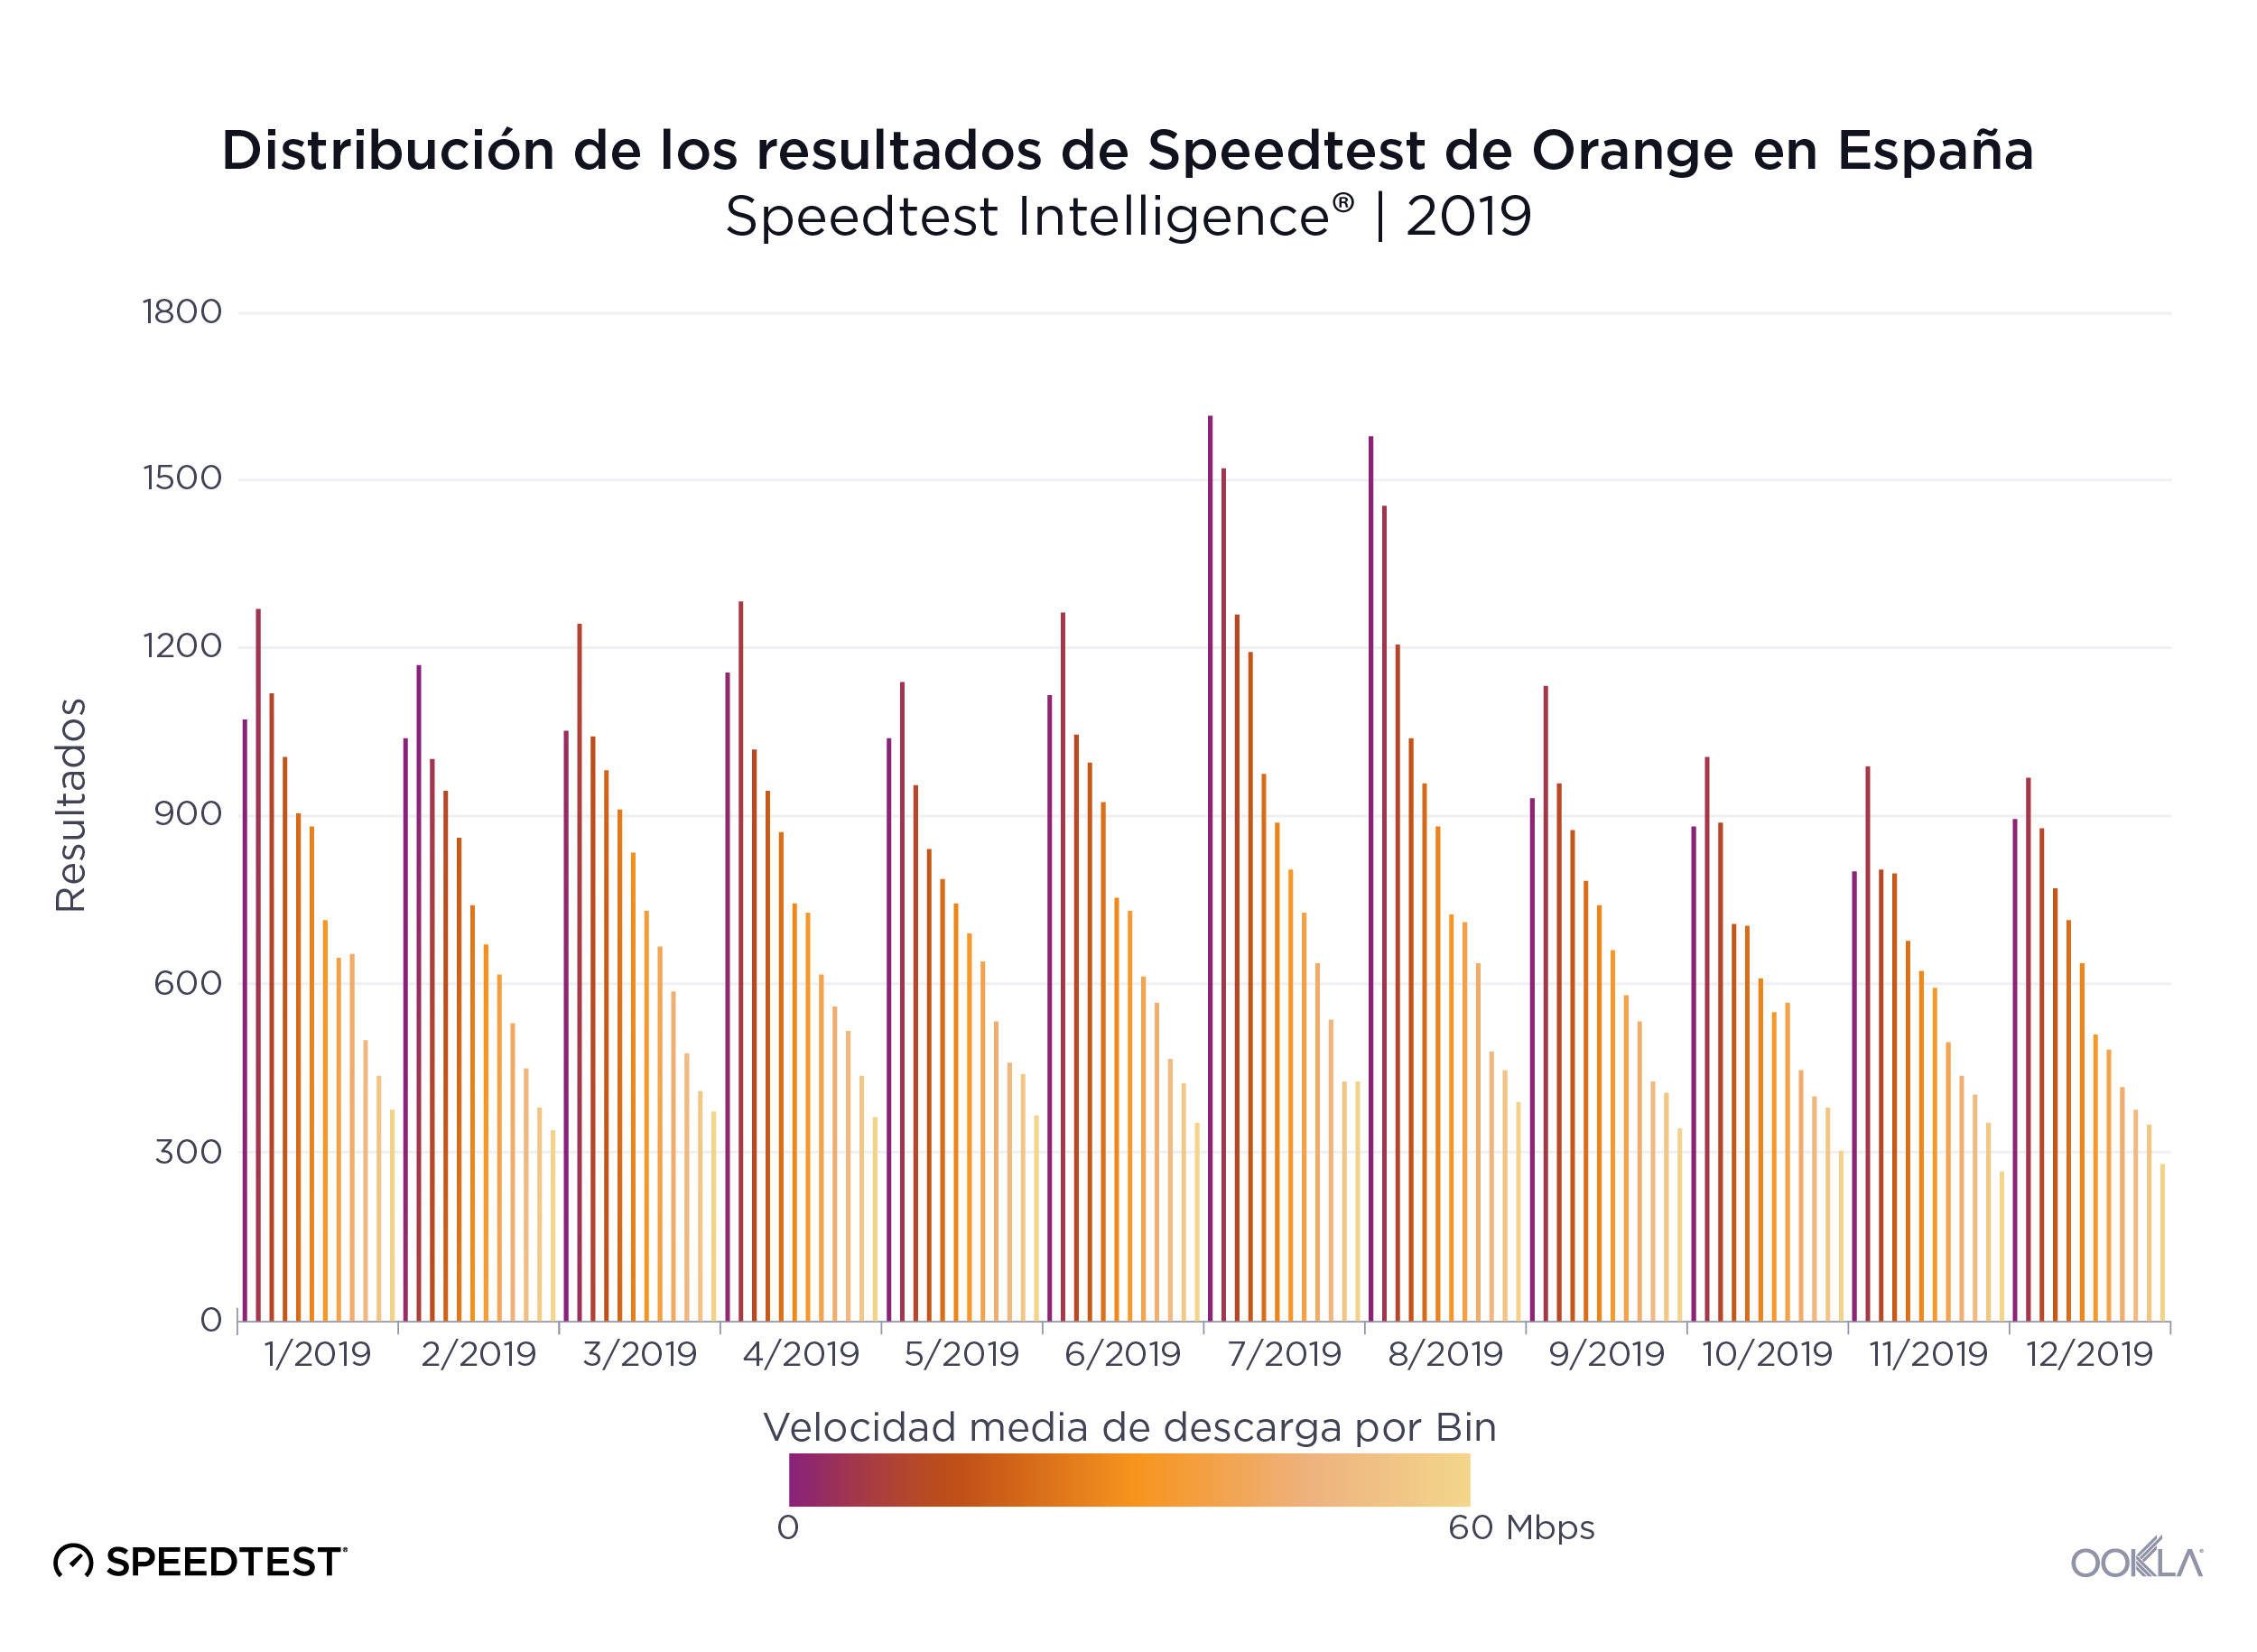
En cambio, en el resto de operadores móviles de España vemos distribuciones más uniformes de las velocidades de descarga.
Ookla_Distribution-Speedtest-Results_Movistar_Spain_0220-3_es
Ookla_Distribution-Speedtest-Results_Orange_Spain_0220-3_es
Ookla_Distribution-Speedtest-Results_Yoigo_Spain_0220-3_es

MÁSMÓVIL y Movistar (móvil) ofrecen las velocidades más constantes

La velocidad es importante, pero si no es constante, resulta difícil que los usuarios utilicen sus dispositivos con fiabilidad para transmitir vídeo de alta definición, navegar por la web o jugar en línea. Utilizamos los datos de Speedtest para calcular la PRA (puntuación de rendimiento aceptable) de cada uno de los principales proveedores de España durante el segundo semestre de 2019.

La PRA de banda ancha fija mide el porcentaje de muestras que igualan o superan una velocidad de descarga de 25 Mbps y que también igualan o superan una velocidad de subida de 3 Mbps. MÁSMÓVIL proporcionó el mayor nivel de constancia de España en banda ancha fija en el segundo semestre de 2019 con una PRA de 81,6 %. Movistar quedó en último lugar con una PRA del 61,9 %.

Constancia de velocidad por proveedor en banda ancha fija
Speedtest Intelligence® | Segundo semestre de 2019
Proveedor PRA
MÁSMÓVIL 81,6 %
Orange 75,1 %
Vodafone 73,5 %
Movistar 61,9 %

La PRA de Internet móvil mide el porcentaje de muestras que igualan o superan una velocidad de descarga de 5 Mbps y que también igualan o superan una velocidad de subida de 1 Mbps. Movistar ocupó el primer lugar en constancia de banda ancha móvil con una PRA del 88,9 %, Vodafone obtuvo la puntuación más baja en constancia con una PRA del 79,8 %.

Constancia de velocidad por operador en Internet móvil
Speedtest Intelligence® | Segundo semestre de 2019
Proveedor PRA
Movistar 88,9 %
Orange 84,3 %
Yoigo 82,6 %
Vodafone 79,8 %

Madrid lideró las velocidades de banda ancha fija y móvil
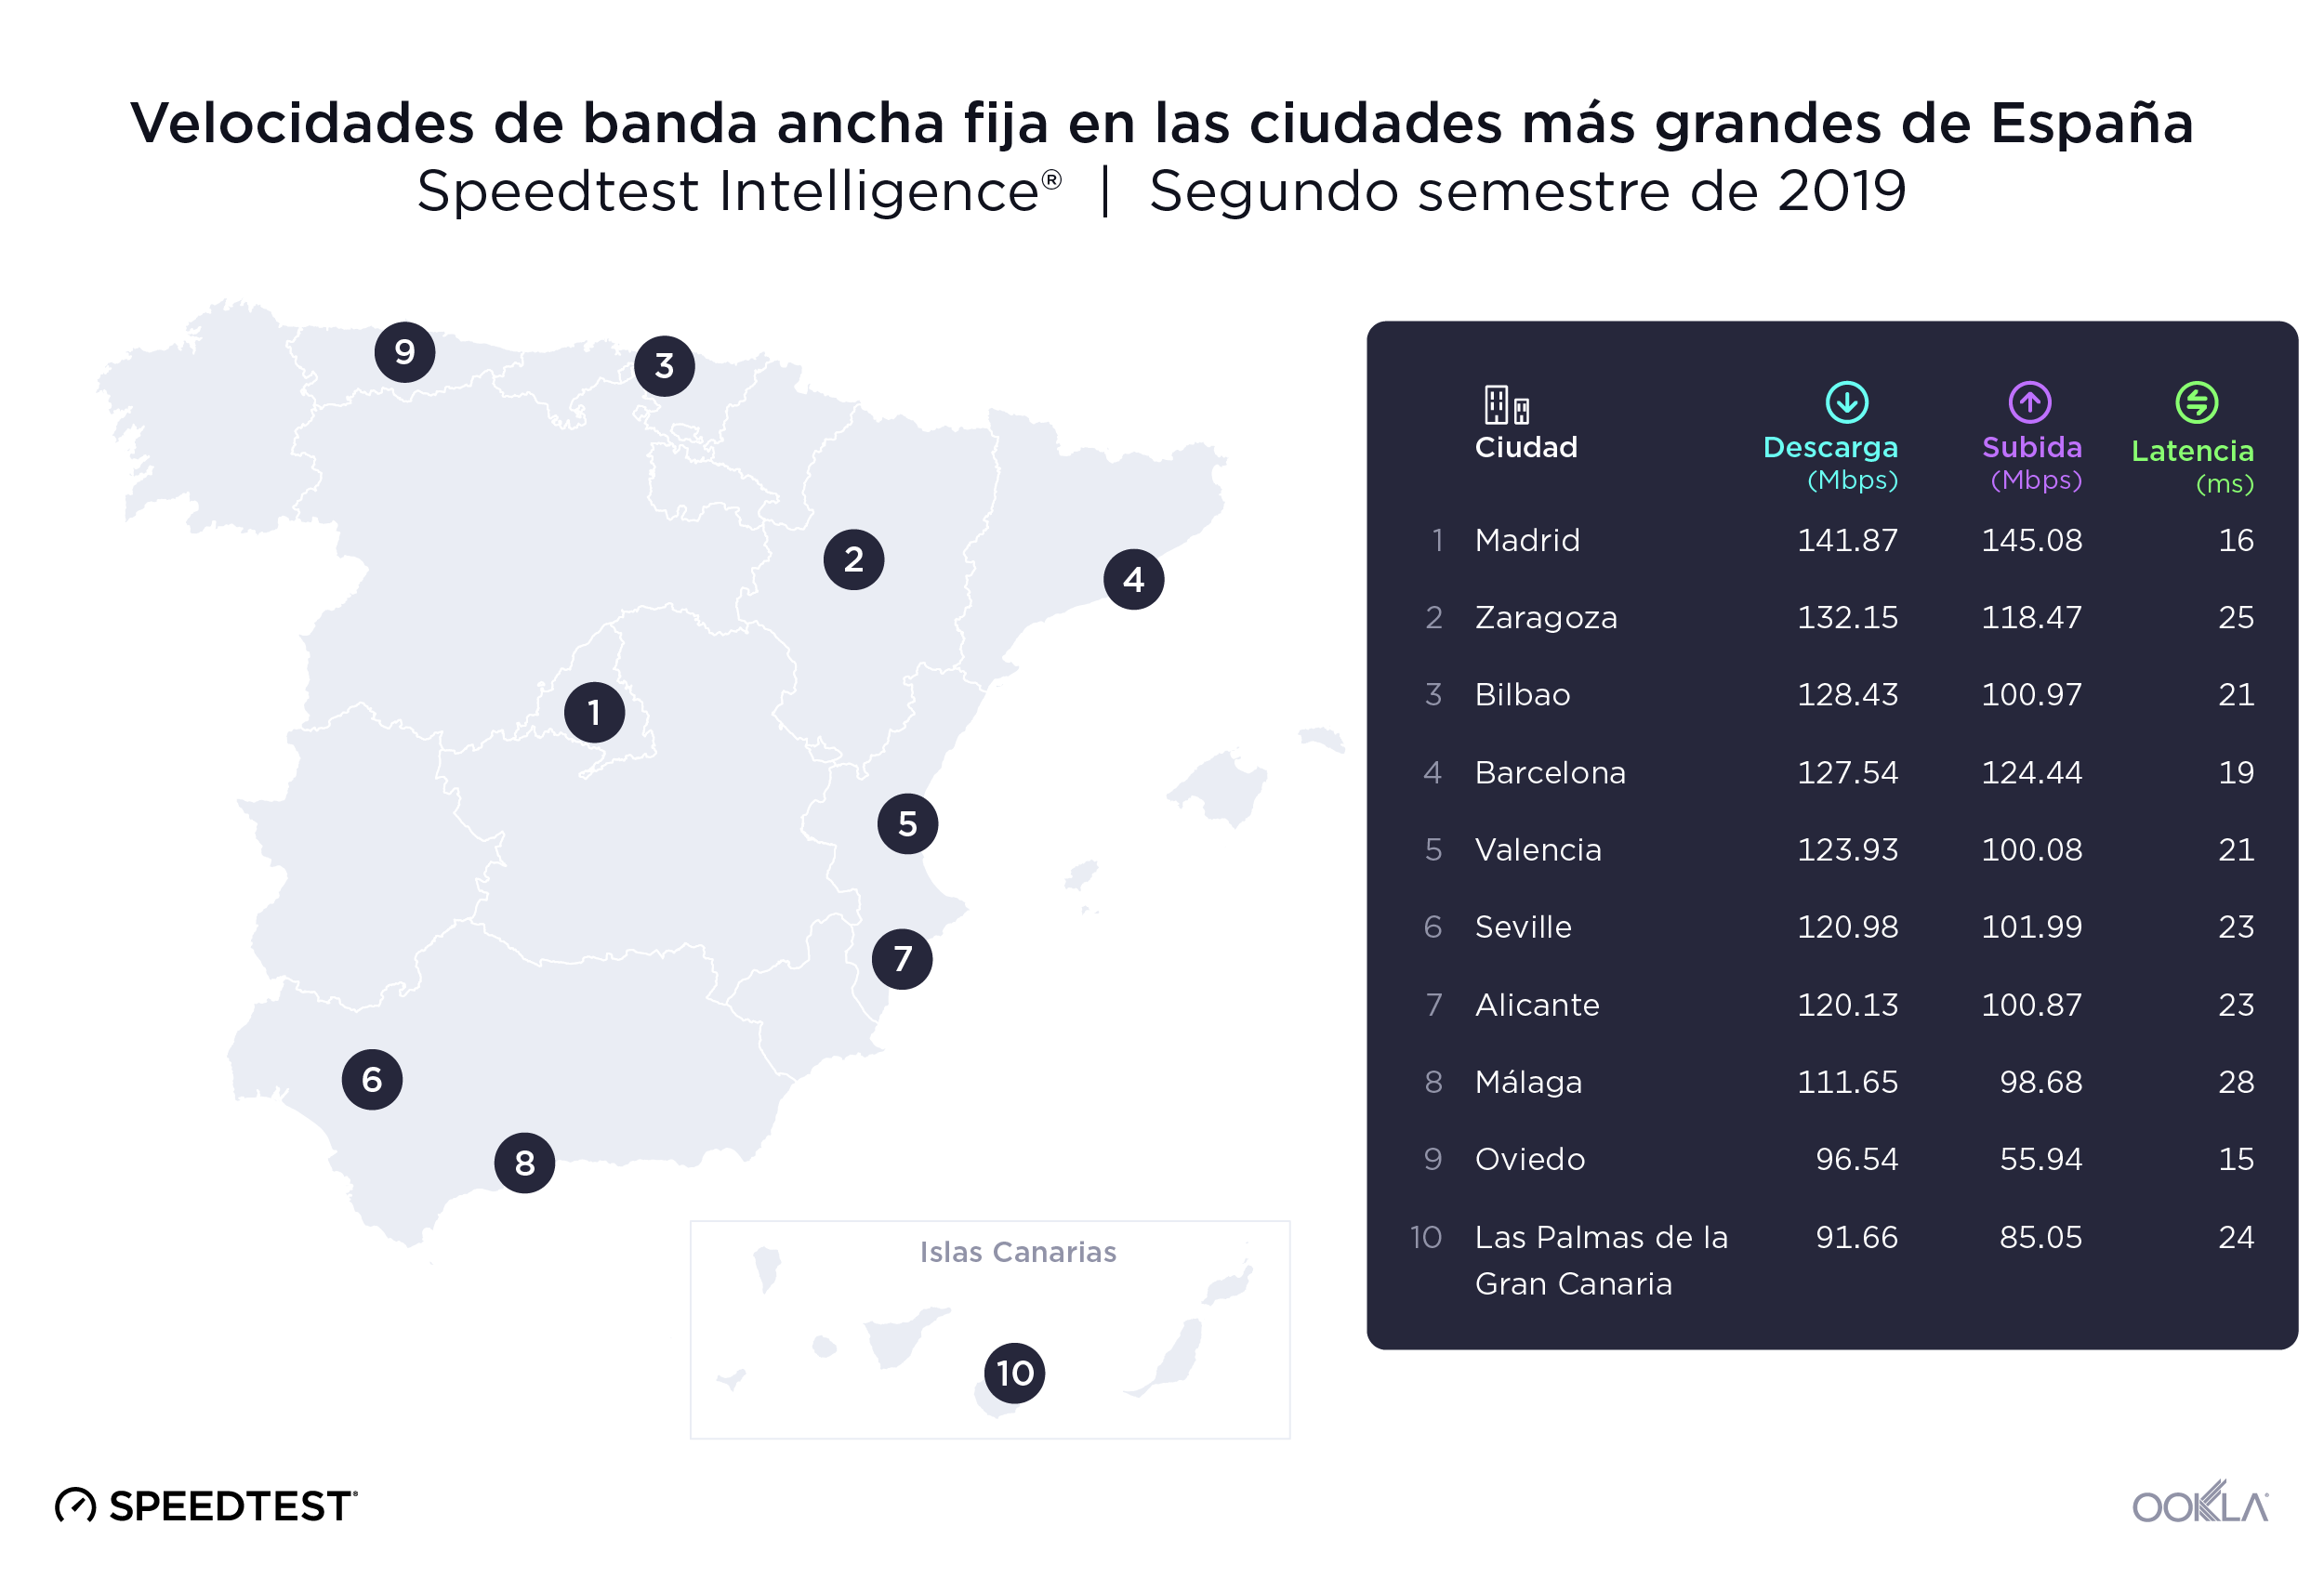
Ookla_Fixed-Broadband-Speeds_Spain_0220_es-2
Para estudiar las velocidades de Internet de las diez ciudades más pobladas de España en el segundo semestre de 2019 utilizamos los datos de Speedtest de 2.183.336 pruebas realizadas por los usuarios. Madrid registró las velocidades medias de descarga más altas tanto en banda ancha fija como en Internet móvil.

Las velocidades medias de descarga por banda ancha fija oscilaron entre los 141,87 Mbps de Madrid y los 91,66 Mbps de Las Palmas de la Gran Canaria, una diferencia del 35,4 %. Madrid registró también la velocidad de subida media más alta por banda ancha fija, con 145,08 Mbps. Oviedo ocupó el último lugar en velocidad de subida por banda ancha fija con un 61,4 % menos de velocidad de subida que Madrid.

Oviedo tuvo la menor latencia en banda ancha fija de las ciudades de nuestra lista durante el segundo semestre de 2019, con 15 ms. Málaga registró la latencia más alta, con 28 ms.
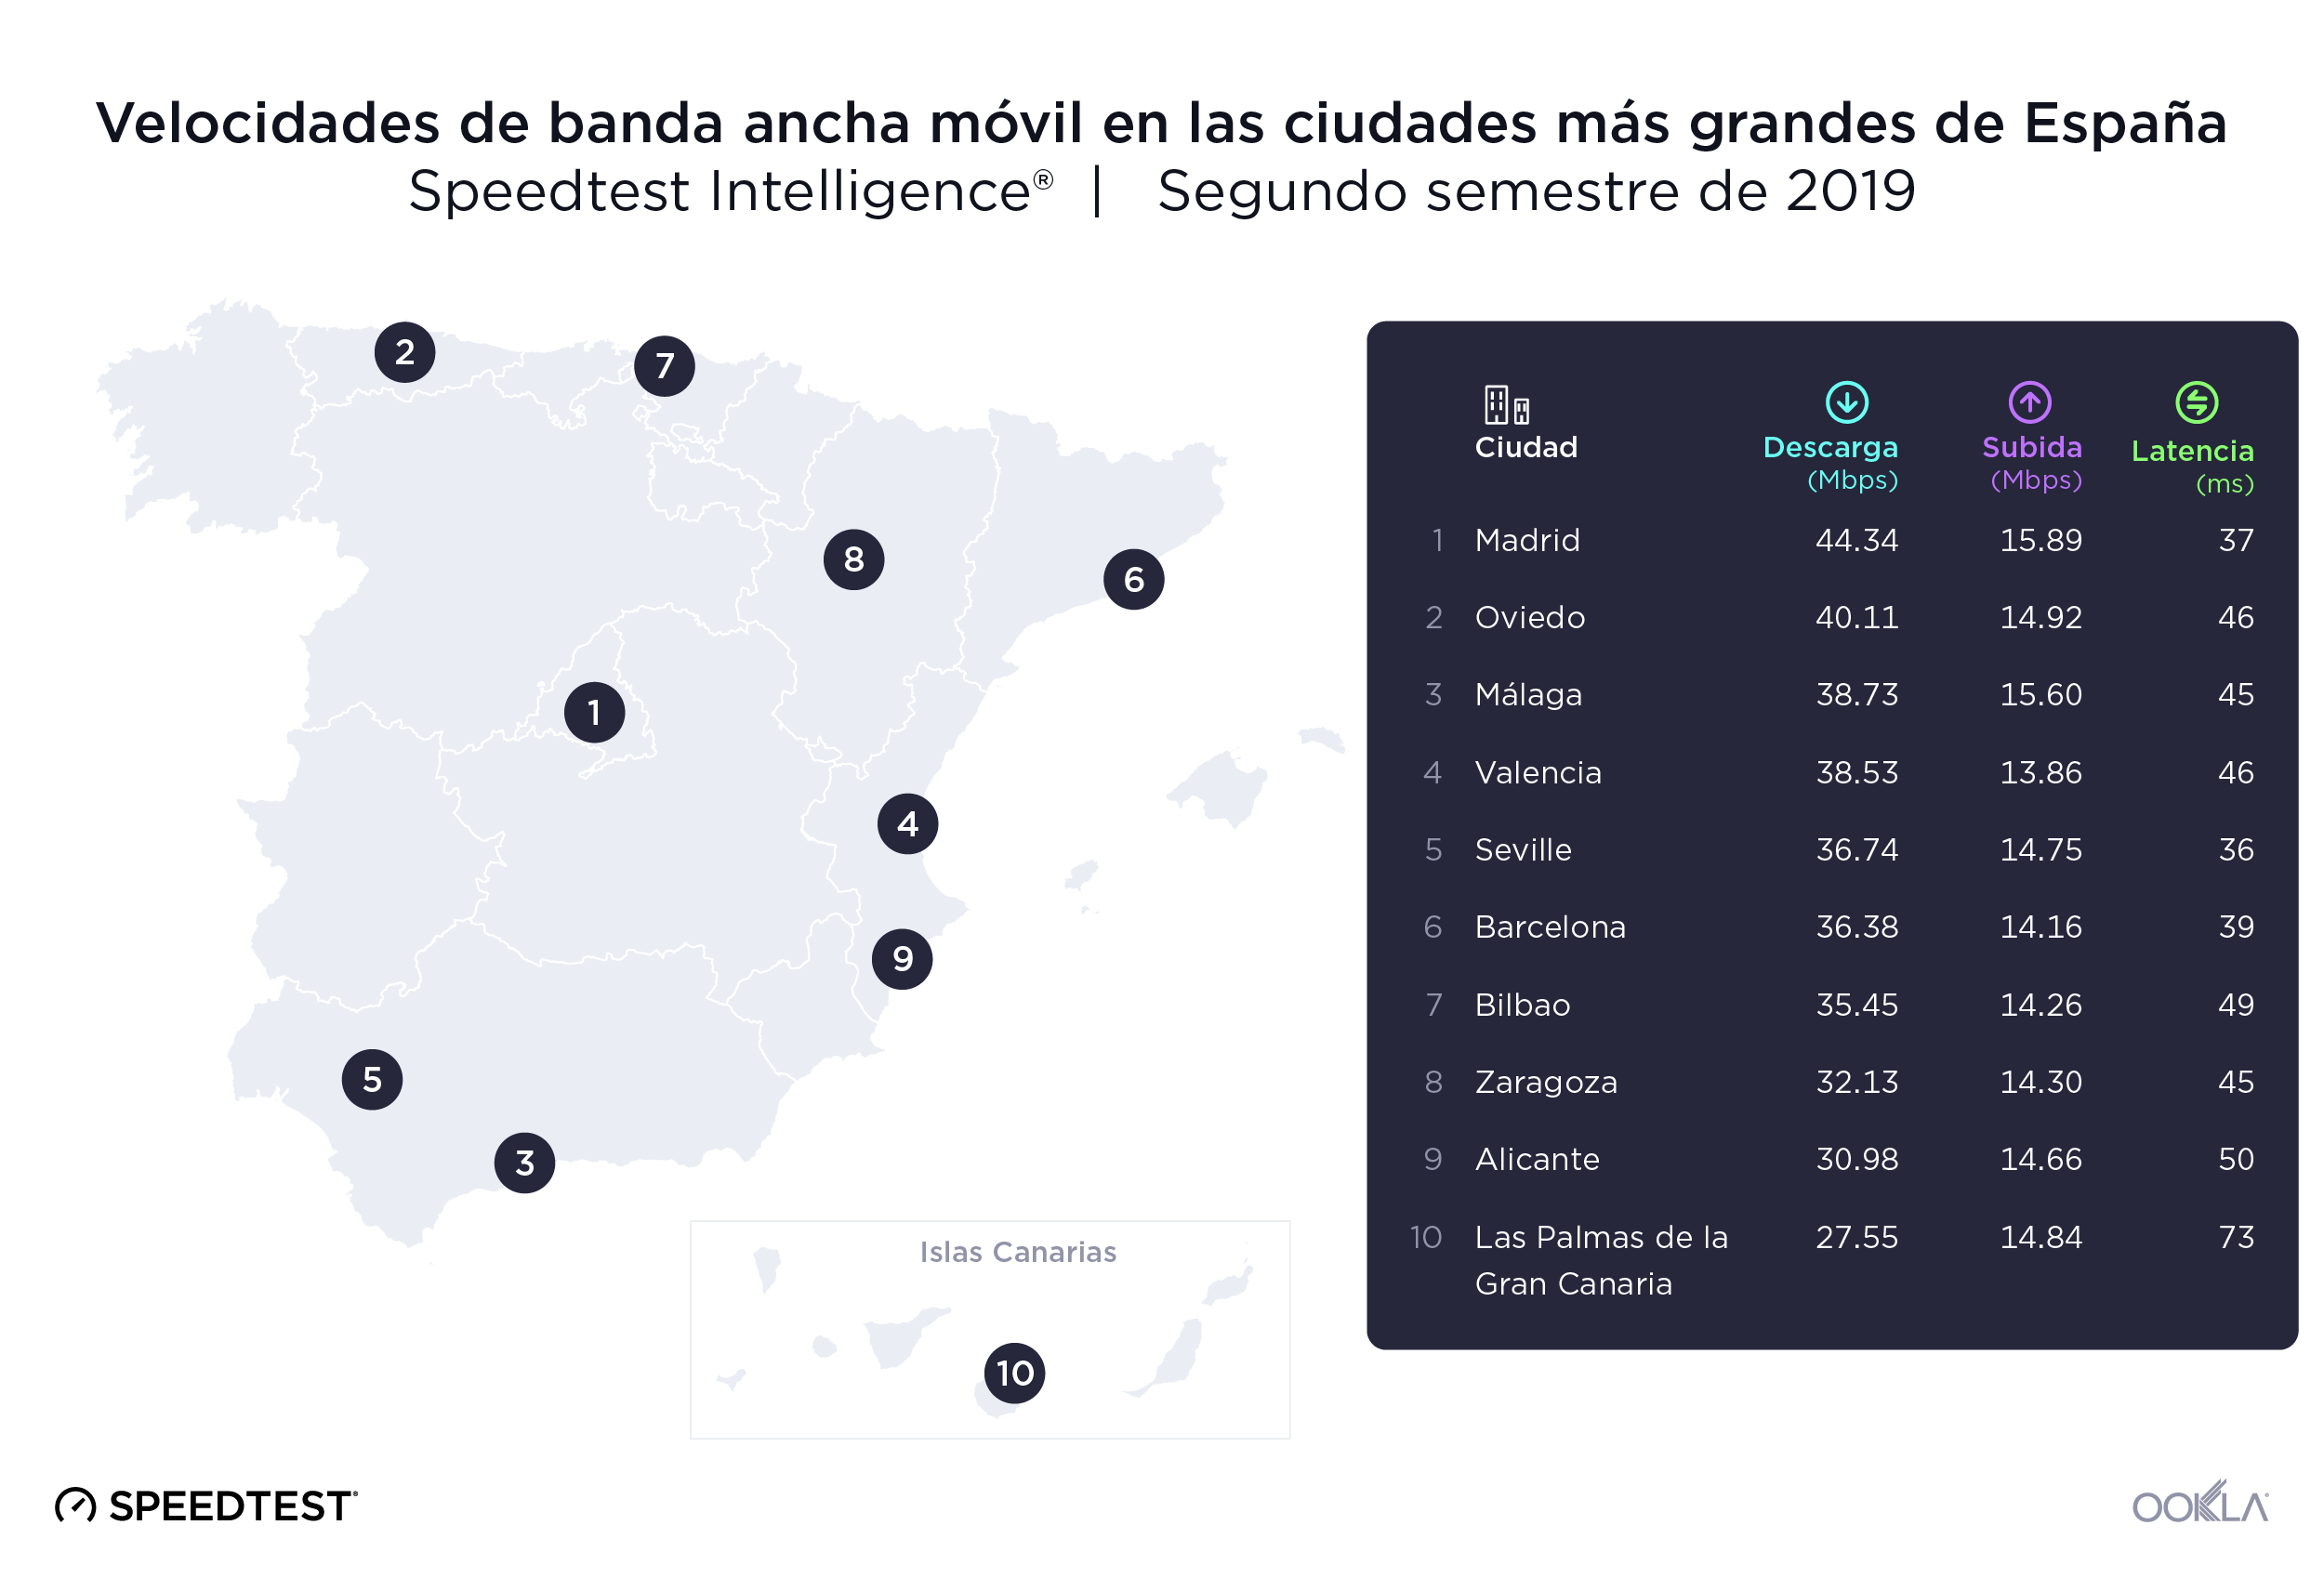
Ookla_Mobile-Broadband-Speeds_Spain_0220_es-1
La brecha entre las velocidades más rápidas y más lentas de las ciudades españolas por banda ancha móvil fue similar a la que apreciamos en la banda ancha fija en el segundo semestre de 2019. Madrid volvió a liderar el rendimiento de la banda ancha móvil con una velocidad media de descarga de 44,35 Mbps y una velocidad media de subida de 15,89 Mbps. Las Palmas quedó en último lugar en velocidades de descarga con un 37,9 % menos de velocidad media de descarga que Madrid. Valencia registró la velocidad de subida media más baja por Internet móvil: 13,86 Mbps. Sevilla obtuvo la menor latencia por Internet móvil con 36 ms en el segundo semestre de 2019 y Las Palmas registró la mayor latencia por Internet móvil con 73 ms.

Zaragoza lideró la disponibilidad de 4G en las ciudades españolas más pobladas

Disponibilidad de 4G en las ciudades más grandes de España
Speedtest Intelligence® | Segundo semestre de 2019
Ciudad Disponibilidad de 4G
Zaragoza 97,2 %
Valencia 97,1 %
Sevilla 96,8 %
Málaga 96,7 %
Oviedo 95,4 %
Madrid 95,1 %
Las Palmas de la Gran Canaria 95,0 %
Alicante 94,6 %
Bilbao 94,3 %
Barcelona 87,7 %

La disponibilidad de 4G en las ciudades más grandes de España superó el promedio del país, siendo Zaragoza la de mayor disponibilidad de 4G con el 97,2 % de las ubicaciones analizadas. Barcelona tuvo la menor disponibilidad de 4G de nuestra lista, con el 87,7 %.

MÁSMÓVIL fue el proveedor de banda ancha fija más rápido de 6 ciudades

Si nos fijamos específicamente en la puntuación de velocidad en cada una de las ciudades españolas en el segundo semestre de 2019, vemos que MÁSMÓVIL fue el proveedor más rápido en seis ciudades: Málaga, Sevilla, Zaragoza, Madrid, Valencia y Alicante. Adamo, el proveedor fijo más rápido de Barcelona, consiguió la puntuación de velocidad más alta de la lista con 185,29. Vodafone fue el proveedor más rápido en Bilbao y Oviedo.

Rendimiento de la banda ancha fija por operador en las ciudades más grandes de España
Speedtest Intelligence® | Segundo semestre de 2019
Ciudad Proveedor Speed ScoreTM
Barcelona Adamo 185,29
Málaga MÁSMÓVIL 156,24
Sevilla MÁSMÓVIL 148,78
Madrid MÁSMÓVIL 145,83
Bilbao Vodafone 144,65
Zaragoza MÁSMÓVIL 144,40
Valencia MÁSMÓVIL 143,99
Oviedo Vodafone 143,85
Alicante MÁSMÓVIL 143,72
Las Palmas Orange 114,46

Si nos fijamos en los proveedores españoles más rápidos en banda ancha móvil de cada ciudad en el segundo semestre de 2019, Movistar dominó la lista con la puntuación de velocidad más alta en 7 ciudades. Movistar consiguió también la puntuación de velocidad máxima, con 52,04 en Sevilla. Vodafone fue el proveedor de Internet móvil más rápido en Madrid (35,67). Orange fue el proveedor más rápido de Barcelona (35,37) y Oviedo (45,10).

Rendimiento de Internet móvil por operador en las ciudades más grandes de España
Speedtest Intelligence® | Segundo semestre de 2019
Ciudad Proveedor Speed ScoreTM
Sevilla Movistar 52,04
Valencia Movistar 50,80
Alicante Movistar 50,36
Málaga Movistar 48,97
Bilbao Movistar 48,86
Oviedo Orange 45,10
Zaragoza Movistar 40,79
Madrid Vodafone 35,67
Barcelona Orange 35,37
Las Palmas Movistar 31,37

Nos encantará seguir la evolución de estos mercados y estudiar el cambiante panorama del rendimiento de Internet y de la cobertura móvil en Europa. Si desea obtener más información sobre las velocidades fijas y móviles en diferentes mercados, haga clic aquí para leer más información de Ookla.

Nota del editor: Este artículo fue actualizado el 4 de marzo del 2020 que para corregir un error de edición que reportaba cifras incorrectas del PRA móvil.

Ookla retains ownership of this article including all of the intellectual property rights, data, content graphs and analysis. This article may not be quoted, reproduced, distributed or published for any commercial purpose without prior consent. Members of the press and others using the findings in this article for non-commercial purposes are welcome to publicly share and link to report information with attribution to Ookla.

| February 12, 2020

How Roaming Affects Mobile Speeds in Europe

Last year, we conducted an expansive analysis of mobile roaming in the European Union. We’re updating our data to see which countries have the best roaming speeds and how roaming affects time spent on Wi-Fi. This analysis is based on Speedtest data from Android devices in Europe during Q3-Q4 2019. Despite Brexit, we’ve included data from the United Kingdom to keep parity year-over-year, as the roaming agreement remains in place for 2020 and this data involves travel within a specific set of countries.

Roaming in Europe typically means slower download speeds

Mobile roaming speeds are affected by the deals struck between individual mobile operators on a country-by-country basis. This means roaming speeds can depend on the plan a subscriber has selected in their home country and on what is offered in the country of destination.

Out of the 28 countries we examined, residents of 22 countries experienced slower speeds when roaming elsewhere in Europe than they do in their home countries. Travelers from the Netherlands experience the most significant loss in speed, with a roaming download speed that is 54.7% slower than at home. However, users in Slovakia barely notice a change in download speed with a roaming download speed only 2.6% slower than the mean download speed in Slovakia during this period.

Roaming vs. Local Mobile Download Speeds in Europe
Speedtest® Data | Q3-Q4 2019
Country Local Speeds (Mbps) Roaming Speed Upload (Mbps) % Change
Austria 46.30 35.93 -22.4%
Belgium 50.95 33.38 -34.5%
Bulgaria 55.32 30.95 -44.1%
Croatia 52.40 43.73 -16.6%
Cyprus 43.50 21.04 -51.6%
Czech Republic 47.00 36.37 -22.6%
Denmark 48.38 32.28 -33.3%
Estonia 42.61 43.90 3.0%
Finland 43.38 41.46 -4.4%
France 44.34 34.00 -23.3%
Germany 34.07 30.48 -10.5%
Greece 39.90 45.03 12.9%
Hungary 45.53 29.55 -35.1%
Ireland 26.73 32.05 19.9%
Italy 33.64 40.98 21.8%
Latvia 33.20 38.54 16.1%
Lithuania 46.72 39.73 -15.0%
Luxembourg 52.55 34.61 -34.1%
Malta 48.88 32.30 -33.9%
Netherlands 62.52 28.31 -54.7%
Poland 33.07 25.57 -22.7%
Portugal 34.49 36.34 5.4%
Romania 37.84 33.69 -11.0%
Slovakia 34.74 33.83 -2.6%
Slovenia 39.34 32.67 -16.9%
Spain 34.28 27.56 -19.6%
Sweden 48.52 36.55 -24.7%
United Kingdom 36.36 34.96 -3.8%

Upload speeds locally are also mostly faster than those experienced while roaming. Cyprus, Denmark, and the Netherlands all had relatively high mean upload speeds locally, but they also had the largest loss in roaming upload speeds ranging from 31.3% to 36.7% slower upload speeds on mobile roaming.

Residents of some European countries do benefit from faster speeds when roaming on mobile. Users from Estonia, Portugal, Greece, Latvia, Ireland, and Italy all experienced faster download speeds when roaming elsewhere in Europe than they did in their home countries during Q3-Q4 2019. Italian and Irish travelers gained the most when roaming with download speeds that were 21.8% and 19.9% faster than their local speeds, respectively.

A total of 12 countries had higher mean upload speeds while roaming than they experienced locally during this period. France, Latvia, and Ireland benefitted the most with an increase in upload speeds that ranged from 26.5% to 21.4% while roaming.

Latency increases dramatically while roaming in Europe

Unlike mean download and upload speeds, latency is almost always dramatically different while roaming. This is because roaming signals are routed through a user’s home network, making latency a significant issue for Europeans when traveling.

Local vs. Roaming Latency in Europe
Speedtest® Data | Q3-Q4 2019
Country Local Latency (ms) Roaming Latency (ms) % Change
Austria 26 84 220.4%
Belgium 27 83 205.7%
Bulgaria 27 127 368.3%
Croatia 33 89 166.0%
Cyprus 23 213 825.5%
Czech Republic 26 74 187.6%
Denmark 26 100 287.9%
Estonia 25 76 201.5%
Finland 27 97 254.6%
France 41 82 98.8%
Germany 38 87 128.1%
Greece 29 129 349.8%
Hungary 25 93 272.6%
Ireland 35 100 185.0%
Italy 50 91 81.2%
Latvia 26 95 268.2%
Lithuania 27 107 302.2%
Luxembourg 23 83 262.6%
Malta 19 136 611.6%
Netherlands 28 87 208.3%
Poland 35 109 209.2%
Portugal 30 109 258.8%
Romania 30 113 275.3%
Slovakia 31 76 105.5%
Slovenia 24 74 208.2%
Spain 45 107 137.4%
Sweden 29 118 304.3%
United Kingdom 38 103 173.1%

In their home country, residents of Malta (19 ms), Luxembourg (22 ms) and Cyprus (23 ms) enjoyed the lowest latencies in Europe. Residents of France, Spain and Italy experienced the highest latencies in their home countries at 41 ms, 45 ms and 50 ms, respectively.

European residents experienced an increase of at least 81.2% in their latency when visiting other countries within Europe. Residents from Cyprus, Malta and Bulgaria experience the biggest increase in latency when visiting other countries in Europe, ranging from Cyprus’ 825.5% to Bulgaria’s 368.3%. The countries that experienced the smallest increase in latency were Italy (81.2%), France (98.8%) and Germany (128.1%).

Locals spend more time on Wi-Fi than visitors in Europe

While there are no roaming changes within the E.U., users often opt to connect to Wi-Fi to avoid additional data overages at home and abroad. The following table compares the percentage of time spent on Wi-Fi by a resident of a country with that of a visitor to the same country during Q3-Q4 2019.

Percentage of Time Spent on Wi-Fi in Europe
Speedtest® Data | Q3-Q4 2019
Country Local Customers Visitors % Change
Austria 75.5% 40.5% -46.3%
Belgium 77.9% 35.8% -54.1%
Bulgaria 74.0% 60.3% -18.5%
Croatia 74.3% 53.8% -27.5%
Cyprus 79.3% 70.2% -11.5%
Czech Republic 80.1% 46.6% -41.8%
Denmark 78.7% 60.3% -23.4%
Estonia 70.3% 51.9% -26.2%
Finland 63.0% 60.3% -4.4%
France 69.3% 48.7% -29.7%
Germany 80.0% 47.1% -41.1%
Greece 79.3% 64.3% -19.0%
Hungary 76.8% 47.8% -37.8%
Ireland 75.6% 58.9% -22.0%
Italy 70.9% 55.1% -22.2%
Latvia 68.8% 49.2% -28.4%
Lithuania 73.8% 52.2% -29.2%
Luxembourg 72.4% 30.8% -57.4%
Malta 79.4% 65.9% -17.1%
Netherlands 81.8% 49.1% -40.1%
Poland 70.2% 58.2% -17.1%
Portugal 76.5% 61.9% -19.0%
Romania 69.6% 64.1% -7.9%
Slovakia 76.2% 40.1% -47.4%
Slovenia 70.7% 24.7% -65.2%
Spain 78.3% 62.8% -19.7%
Sweden 81.8% 53.8% -34.3%
United Kingdom 79.3% 60.9% -23.1%

As we saw last year, Finnish residents spent the least amount of time on Wi-Fi at 63.0%. Latvia showed the second lowest time spent on Wi-Fi (68.8%), followed by France (69.3%). Residents from the Netherlands, Sweden and the Czech Republic spent the most time on Wi-Fi at 81.8%, 81.8%, and 80.1%, respectively.

Visitors to Cyprus, Malta and Greece spent the most amount of time on Wi-Fi during this period. Time spent on Wi-Fi by visitors ranged from 64.3% in Greece to 70.2% in Cyprus. Visitors to Slovenia, Luxembourg and Belgium as a destination country spent the least amount of time on Wi-Fi at 25.7%, 30.8% and 35.8%, respectively.

Are you interested in more data on roaming performance? Read more here!

Ookla retains ownership of this article including all of the intellectual property rights, data, content graphs and analysis. This article may not be quoted, reproduced, distributed or published for any commercial purpose without prior consent. Members of the press and others using the findings in this article for non-commercial purposes are welcome to publicly share and link to report information with attribution to Ookla.

| January 22, 2020

What Went Down? The Most Significant Online Service Outages in Q4 2019

“Unable to connect” — three words that bring people together in frustration and annoyance around the world. In the last three months of 2019, outages affected users across the globe as they tried to access all kinds of different industries, from gaming to streaming services. Downdetector® data from Q4 2019 provides unique insight into outages including the dates, duration and location and number of reports submitted by users. We’ve divided the outages into five categories: Gaming, Mobile Operators, Social Media Sites, Streaming Services and Financial Institutions.

Gaming

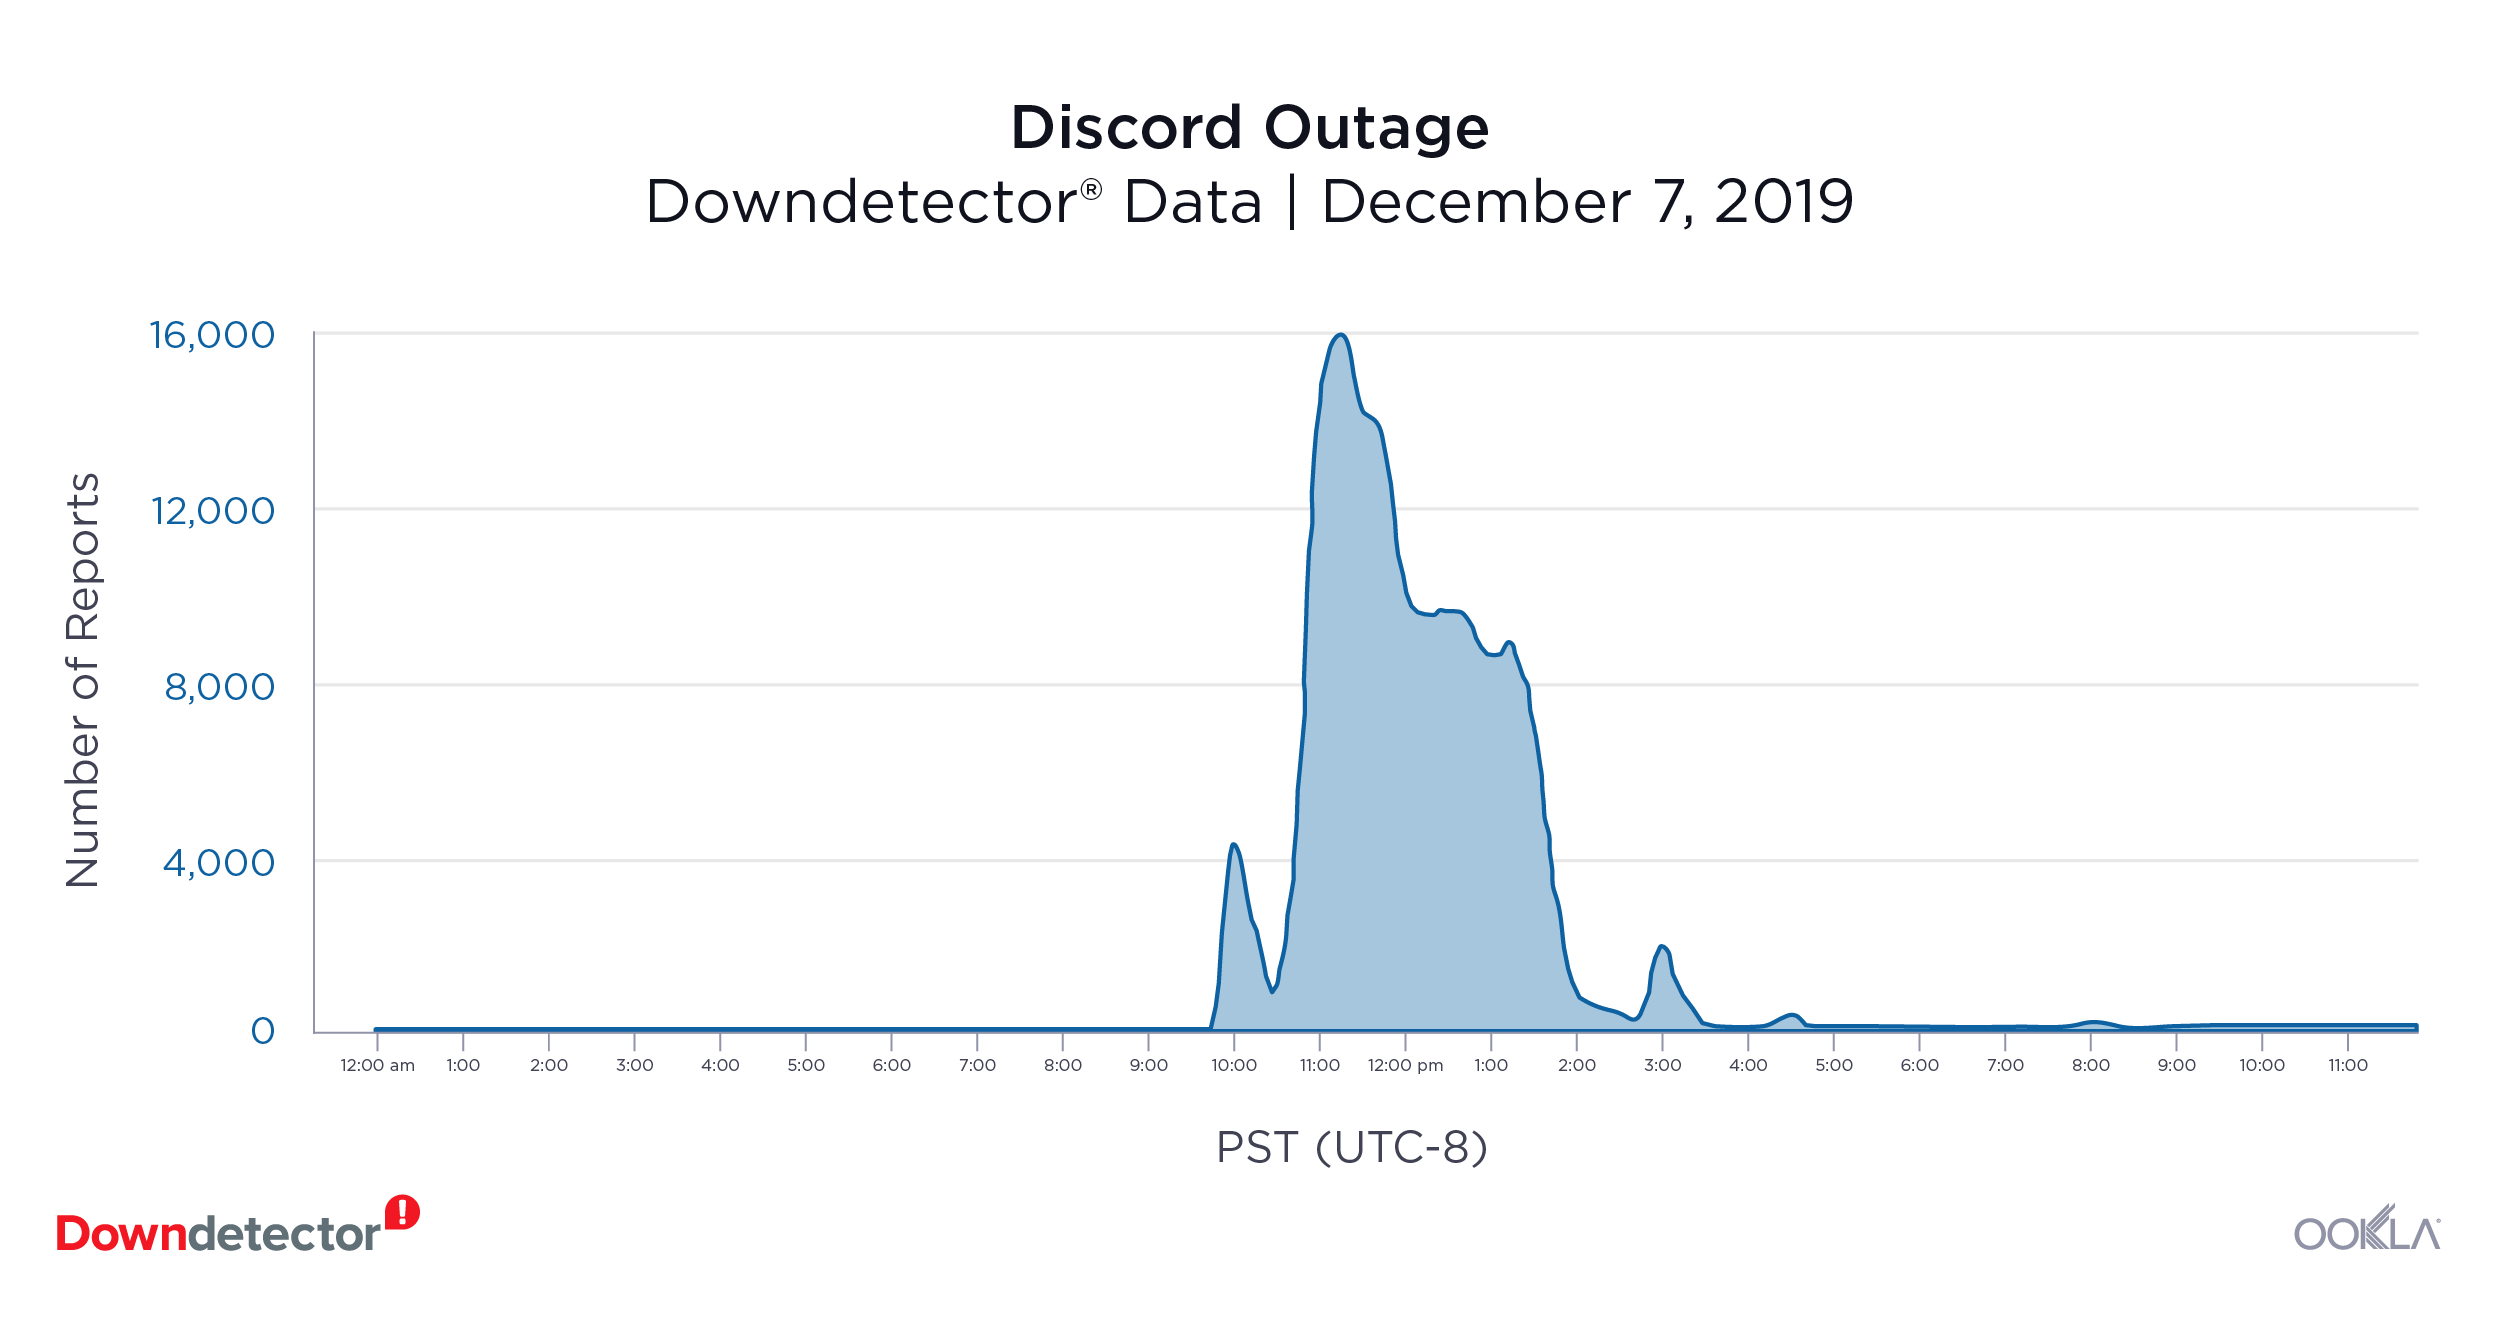
Discord (December 7, 2019): 15,976 outage reports at peak

The largest gaming outage we saw during Q4 2019, Discord, was apparently “due to an issue with Google compute platform.” Starting on December 7, 2019, outage reports were still trickling into Downdetector on December 8. The highest volume of reports happened over 5.5 hours and with a peak of 15,976 reports in the United States.

Downdetector_Outage_Discord

Fortnite (October 13, 2019): 11,326 outage reports at peak

“The End”, an event where Fortnite was preparing for a big release, coincided with the largest Fortnite outage we saw during Q4 2019. On October 13, 2019, Fortnite users flooded to Downdetector to report an outage that started around 10:30 a.m. PST and lasted for six and a half hours. At the peak of the outage there were 11,326 reports, predominantly from users in the United States.

Mobile Operators

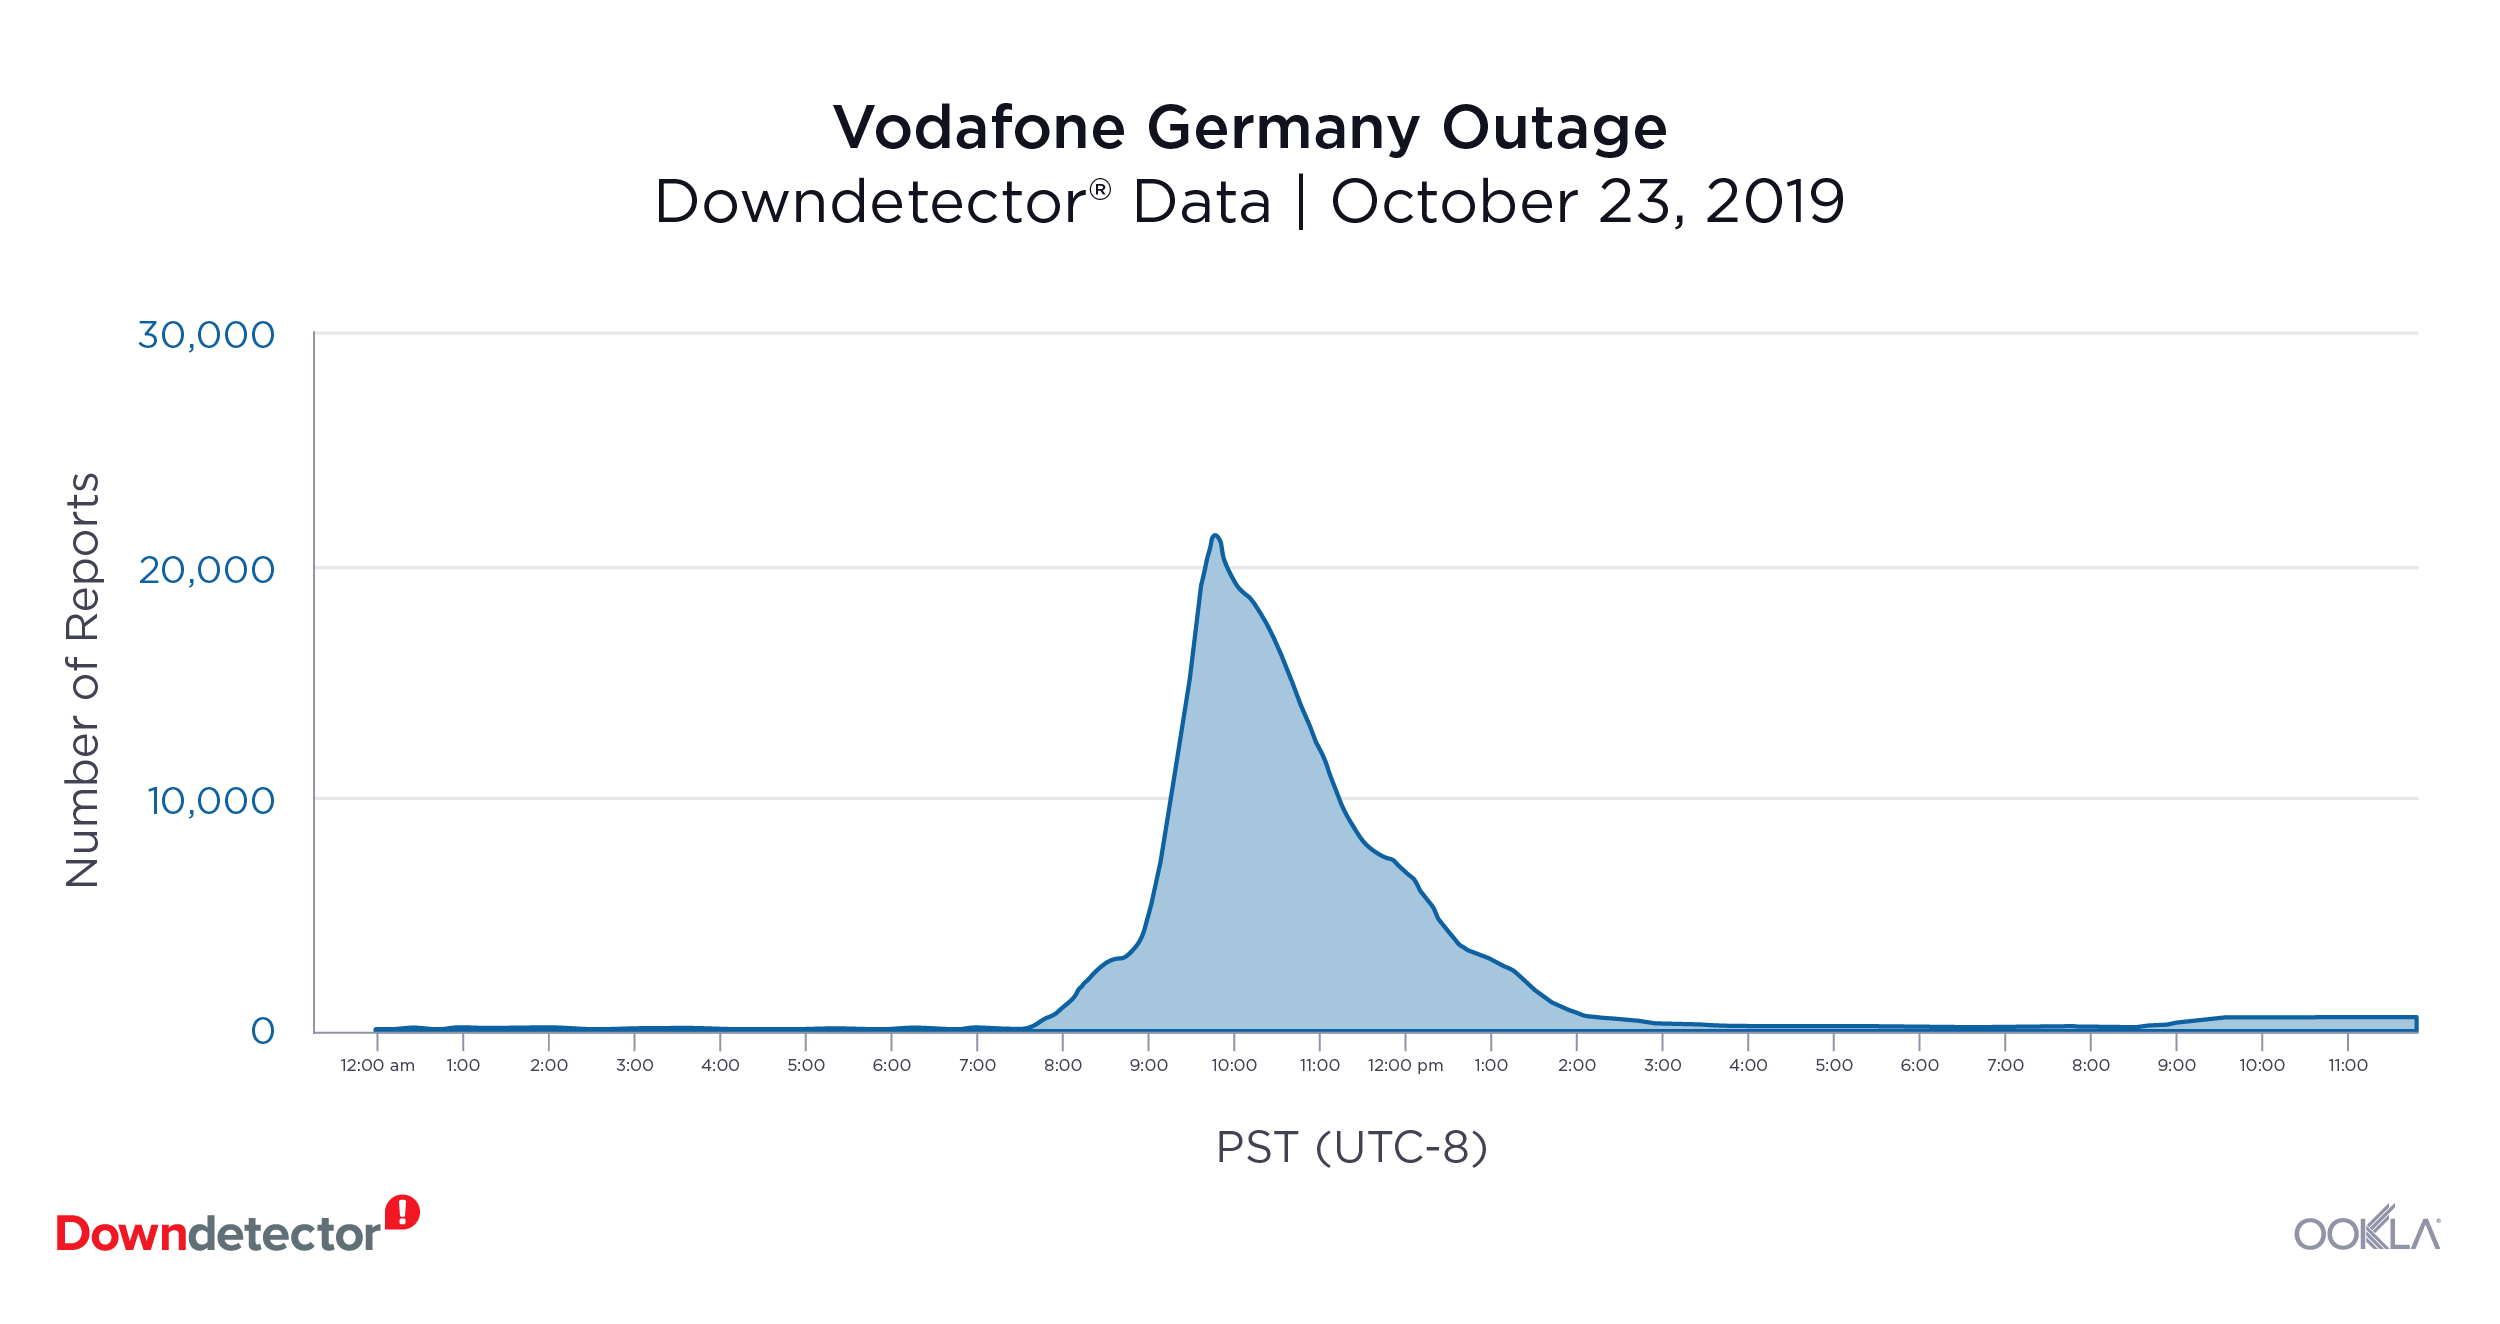
Vodafone Germany (October 23, 2019): 21,065 outage reports at peak

The multinational mobile service provider was down for about four hours for thousands of users on October 23, 2019. At the peak of the outage, 21,065 users, primarily in Germany, reported having problems with their service.

Downdetector_Outage_Vodafone-DE

Social Media Sites

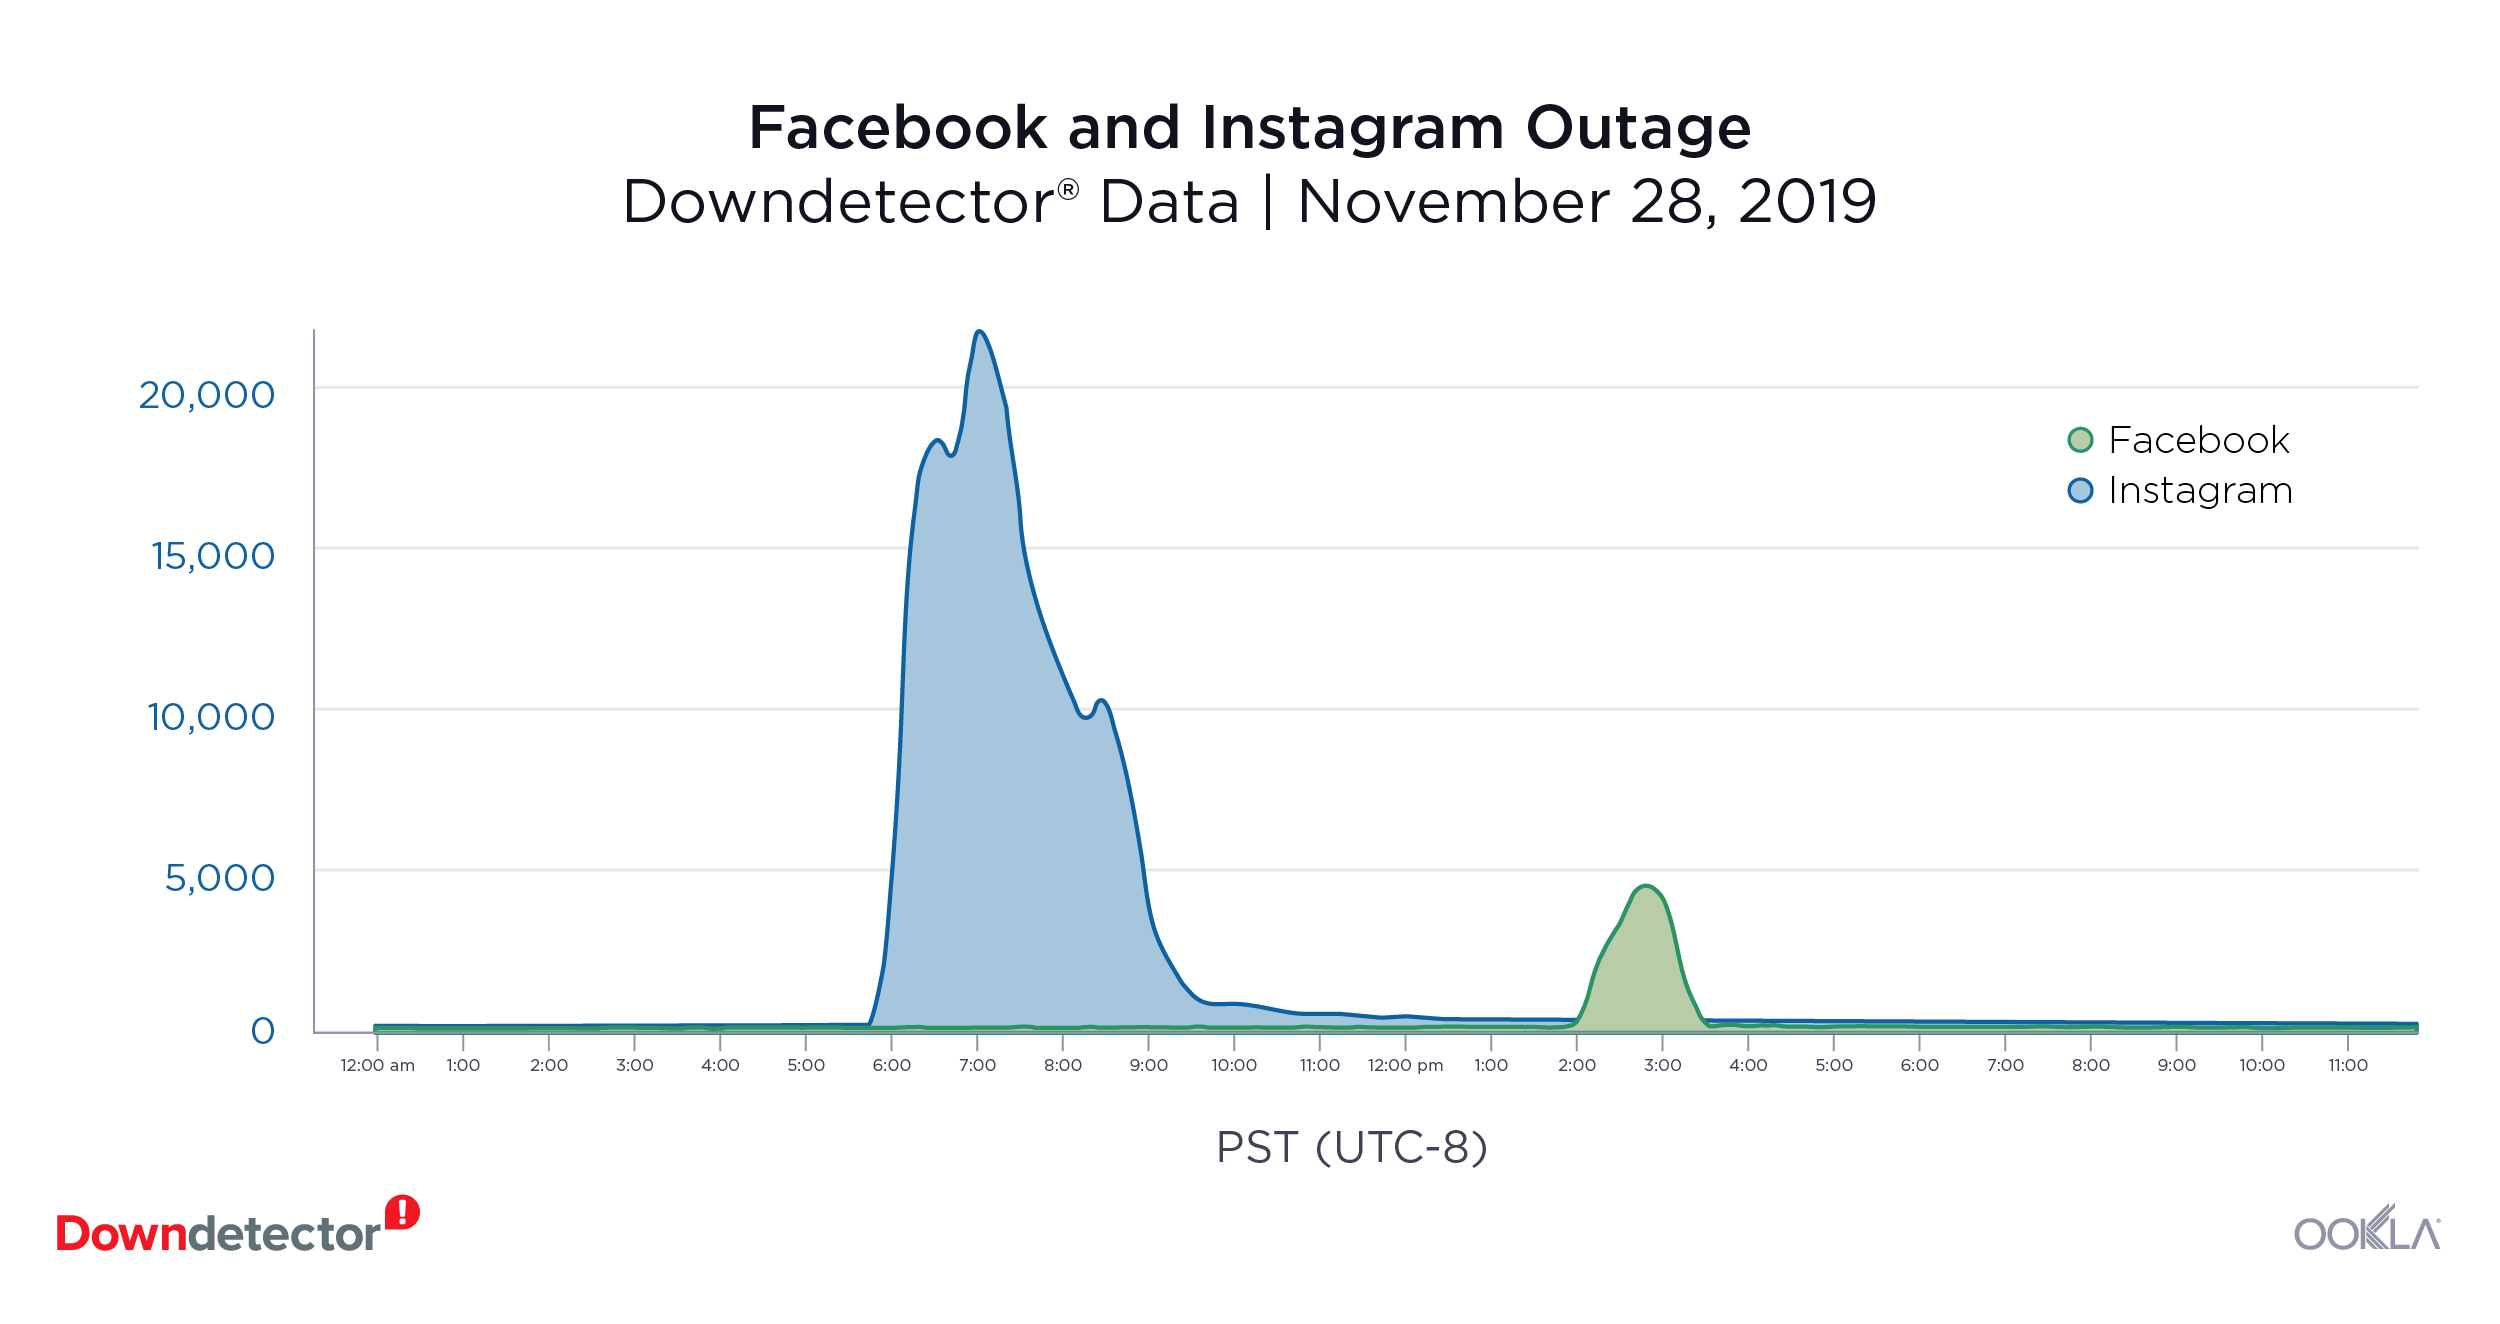
Facebook (November 28, 2019): 12,726 outage reports at peak

Instagram (November 28, 2019): 21,682 outage reports at peak

The Facebook family of social media sites outage on November 28, 2019 was one of many social outages in Q4 2019. The outage lasted about five hours and affected users in the U.S., Germany, Italy and Spain. A combined 34,408 Facebook and Instagram users reported outages at the peak of the outage. Facebook’s Messenger app experienced a smaller outage on November 18, 2019 with 8,952 users reporting outages at the peak.

Downdetector_Outage_Facebook_Instagram

Snapchat (October 14, 2019): 18,252 outage reports at peak

This popular multimedia messaging app was down for five and a half hours on October 14, 2019, leaving users unable to chat, send or receive photos from their friends. At the peak of the outage, 18,252 users from the U.S. reported problems. The outage was so significant, the hashtag #SnapchatDown was trending on Twitter at the time of the outage.

Twitter (October 22, 2019): 15,952 outage reports at peak

Where do Twitter users go to complain when Twitter is down? Our data shows Twitter users in the east coast of the U.S. rushed to Downdetector to report problems with the social media platform on October 22, 2019. Even though the outage lasted only about a half an hour, 15,952 users reported that they were unable to tweet, retweet, like tweets or access their account at the peak of the outage. Problems were also reported in parts of Europe and Latin America.

Streaming Services

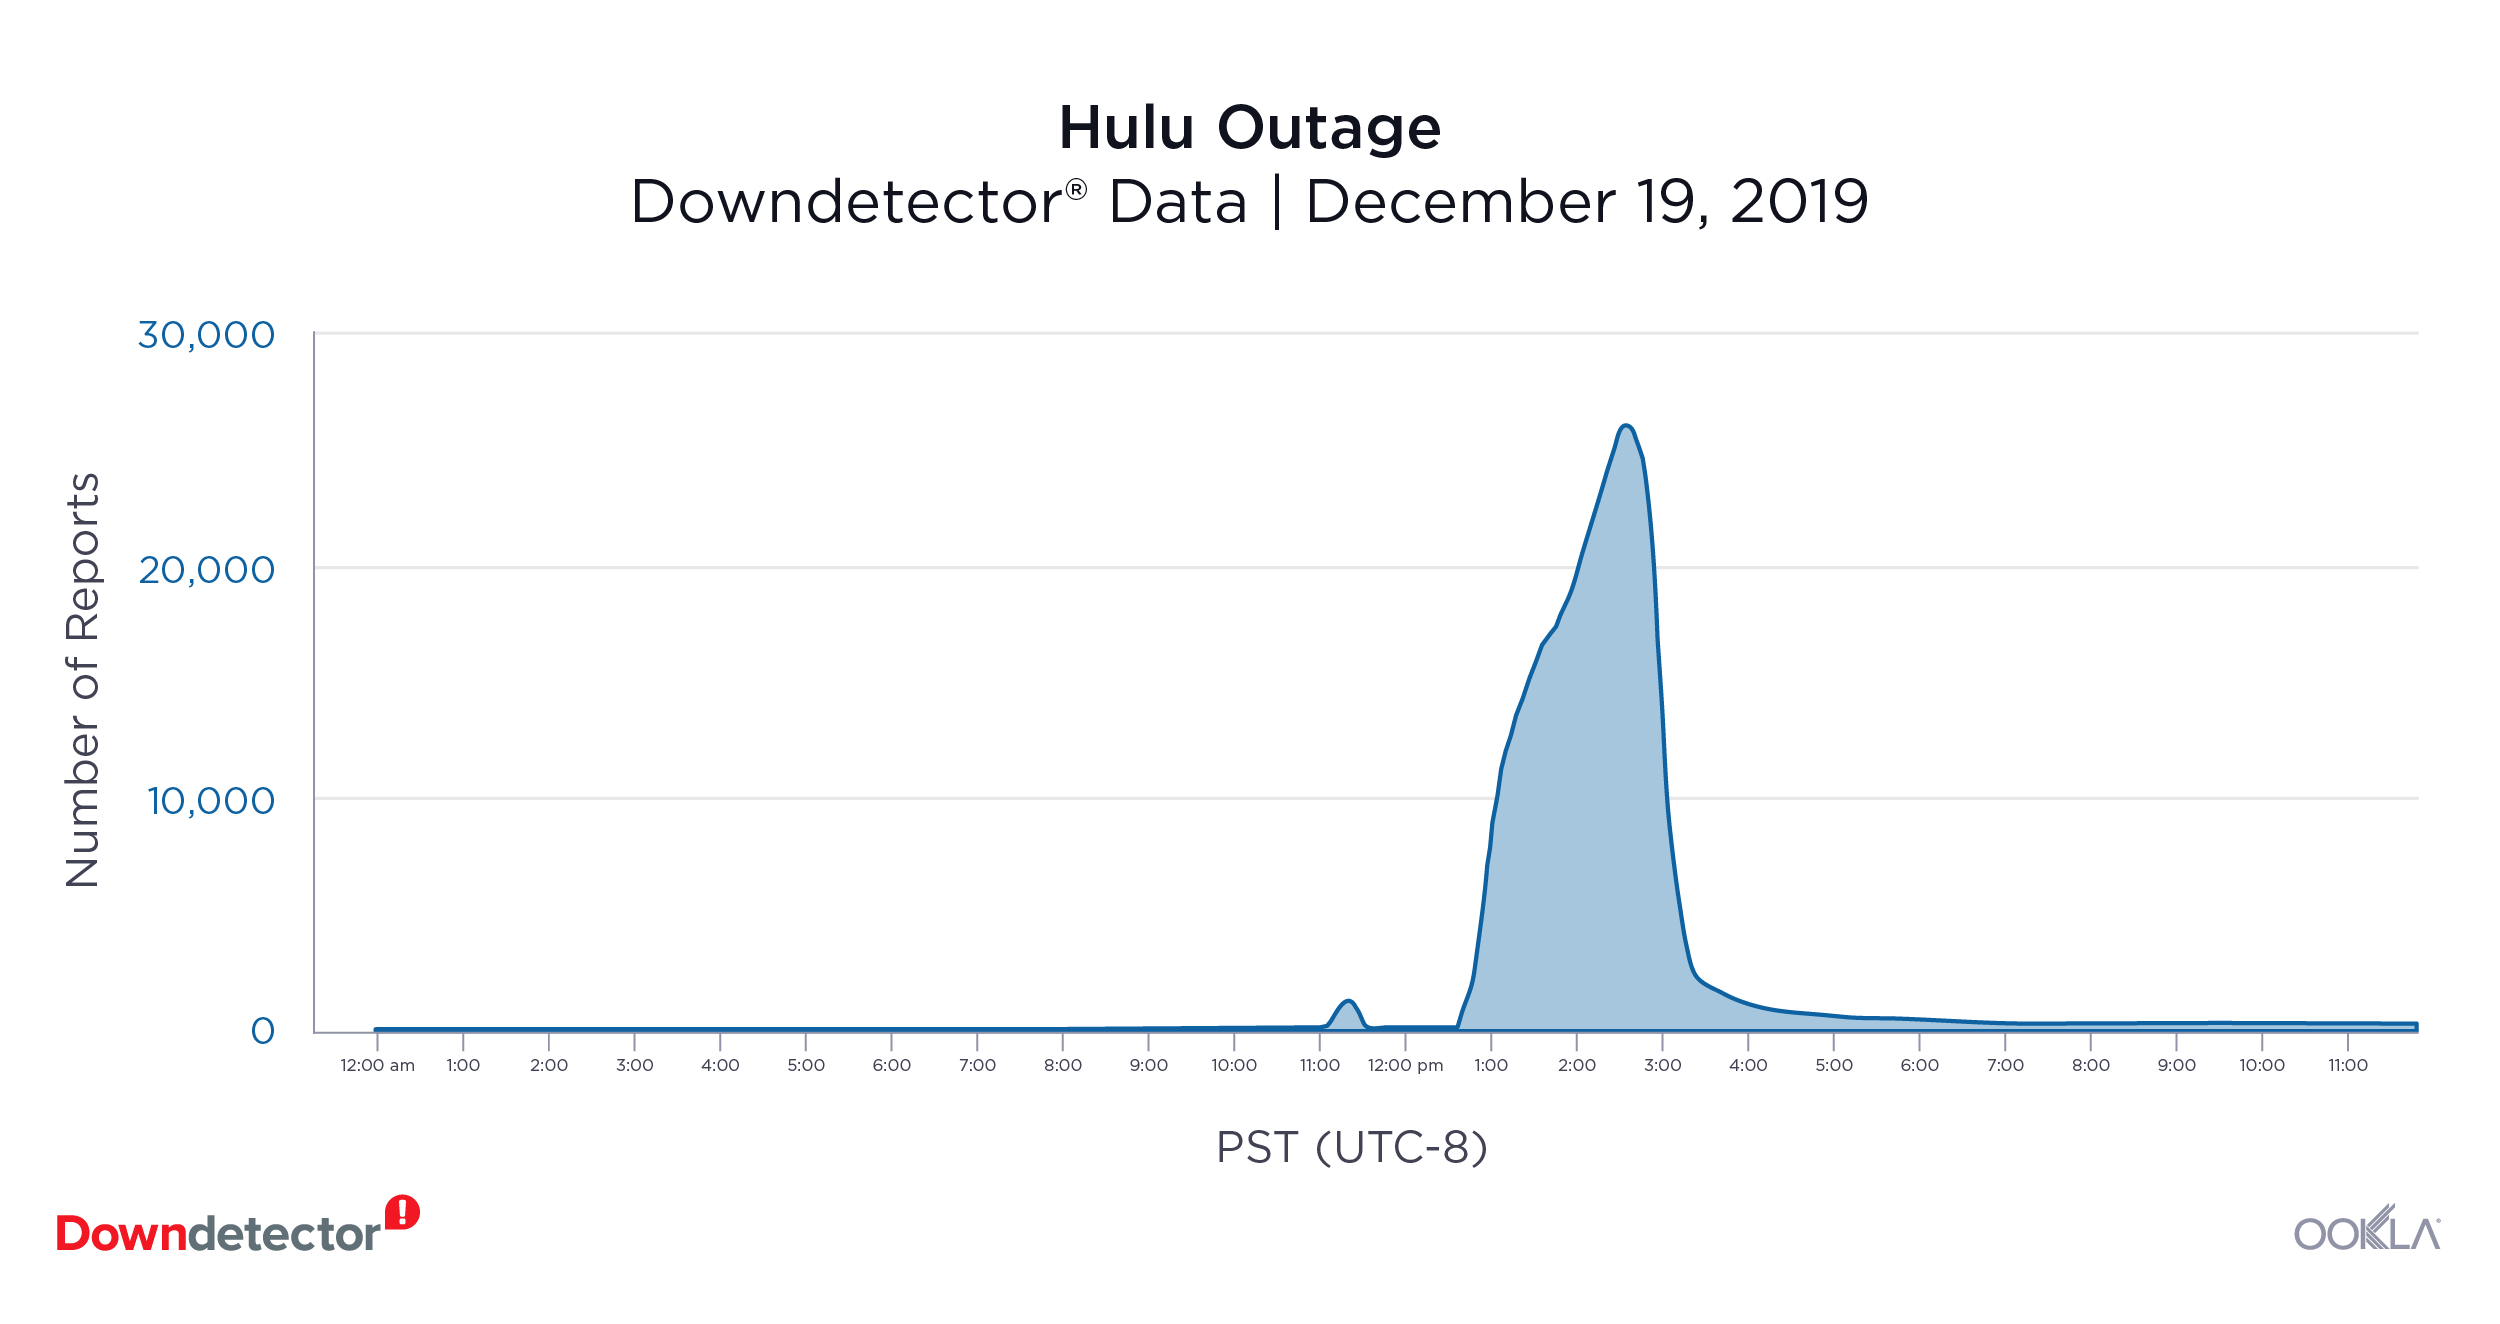
Hulu (December 19, 2019): 25,777 outage reports at peak

Hulu users reported problems with the streaming service on the morning of December 19, 2019. At the peak, 25,777 users in the United States were reporting that the streaming service was down. Seven hours after the outage began, most users had regained access to their accounts and were able to watch their favorite shows and movies. In contrast, Netflix, Hulu’s main competitor, had a small outage in Germany on November 13, 2019. At its peak, only 3,197 people were reported problems with the service.

Downdetector_Outage_Hulu

Disney+ (November 12, 2019): 8,441 outage reports at peak

After months of hyped advertising and special offers, Disney+ users were eager to begin streaming their favorite movies and shows on the new service on November 12, 2019. However, problems began early in the morning on launch day in the U.S. and continued throughout the day. At the peak of the outage, 8,441 users reported that they couldn’t access the platform through the app or stream any of the content Disney+ was offering.

Financial Institutions

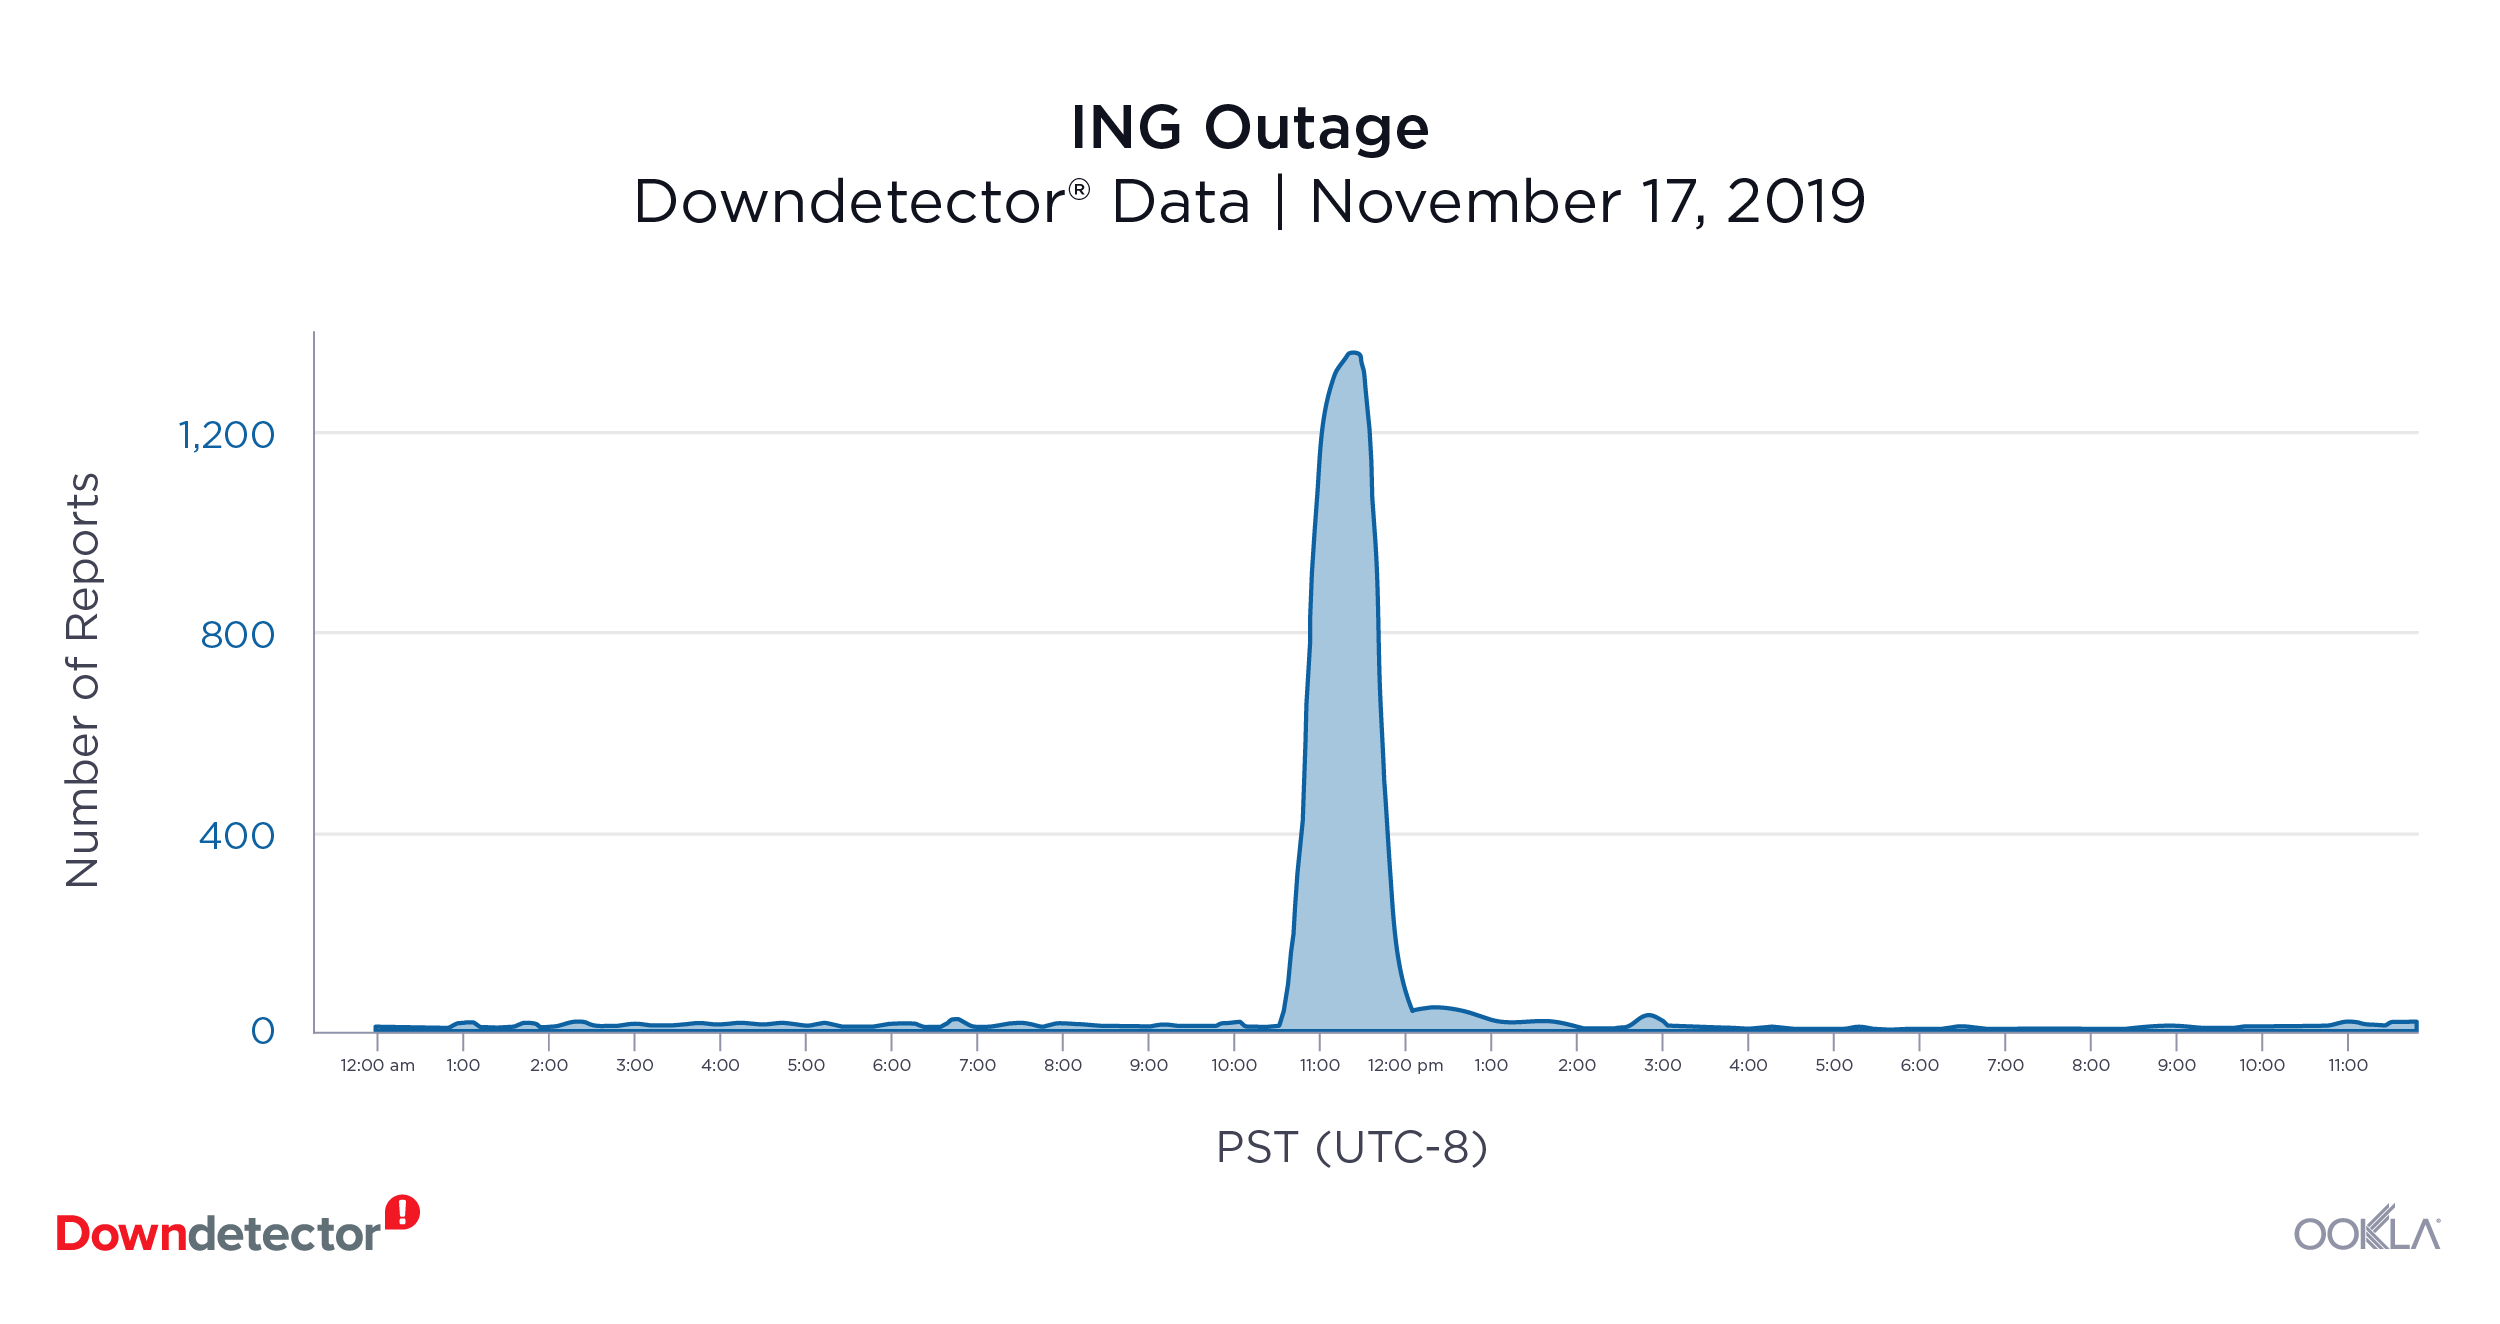
ING (November 17,2019): 1,342 outage reports at peak

Banks take the security and uptimes of their websites very seriously, so we expect to see fewer outages and for the outages that do occur to be small and short. This held true when Dutch users of banking giant ING reported problems with that website on November 17, 2019. The outage lasted about an hour and a half and there were 1,342 reports at the peak. No other countries reported problems with the bank’s mobile banking that day.

Downdetector_Outage_ING

These were the most significant outages we saw in Q4 2019 among the more than 5,500 sites that Downdetector monitors across the internet. Do outages impact your customers’ experience with your services? To learn more about how data from Downdetector can help your network operations center and customer care team detect and resolve issues faster, contact us here.

Ookla retains ownership of this article including all of the intellectual property rights, data, content graphs and analysis. This article may not be quoted, reproduced, distributed or published for any commercial purpose without prior consent. Members of the press and others using the findings in this article for non-commercial purposes are welcome to publicly share and link to report information with attribution to Ookla.

| December 4, 2019

Borrowed Networks: National Roaming in Mexico


Leer en español

Increased competition and new roaming agreements have significantly changed the telecommunications landscape in Mexico in the past decade such that subscribers of some operators often have cellular connectivity even if their own provider does not have coverage in a certain area. We considered Speedtest® data from Android devices during Q3 2019 to investigate where subscribers experience roaming, how much time they are spending roaming on 4G and how roaming affects mobile speeds.

Roaming is common in Mexico, but differs widely by operator and location

Ookla_Mexico_ATT_On-network_Roaming_map_1219_en
Ookla_Mexico_Movistar_On-network_Roaming_map_1219_en
Ookla_Mexico_Telcel_On-network_Roaming_map_1219_en

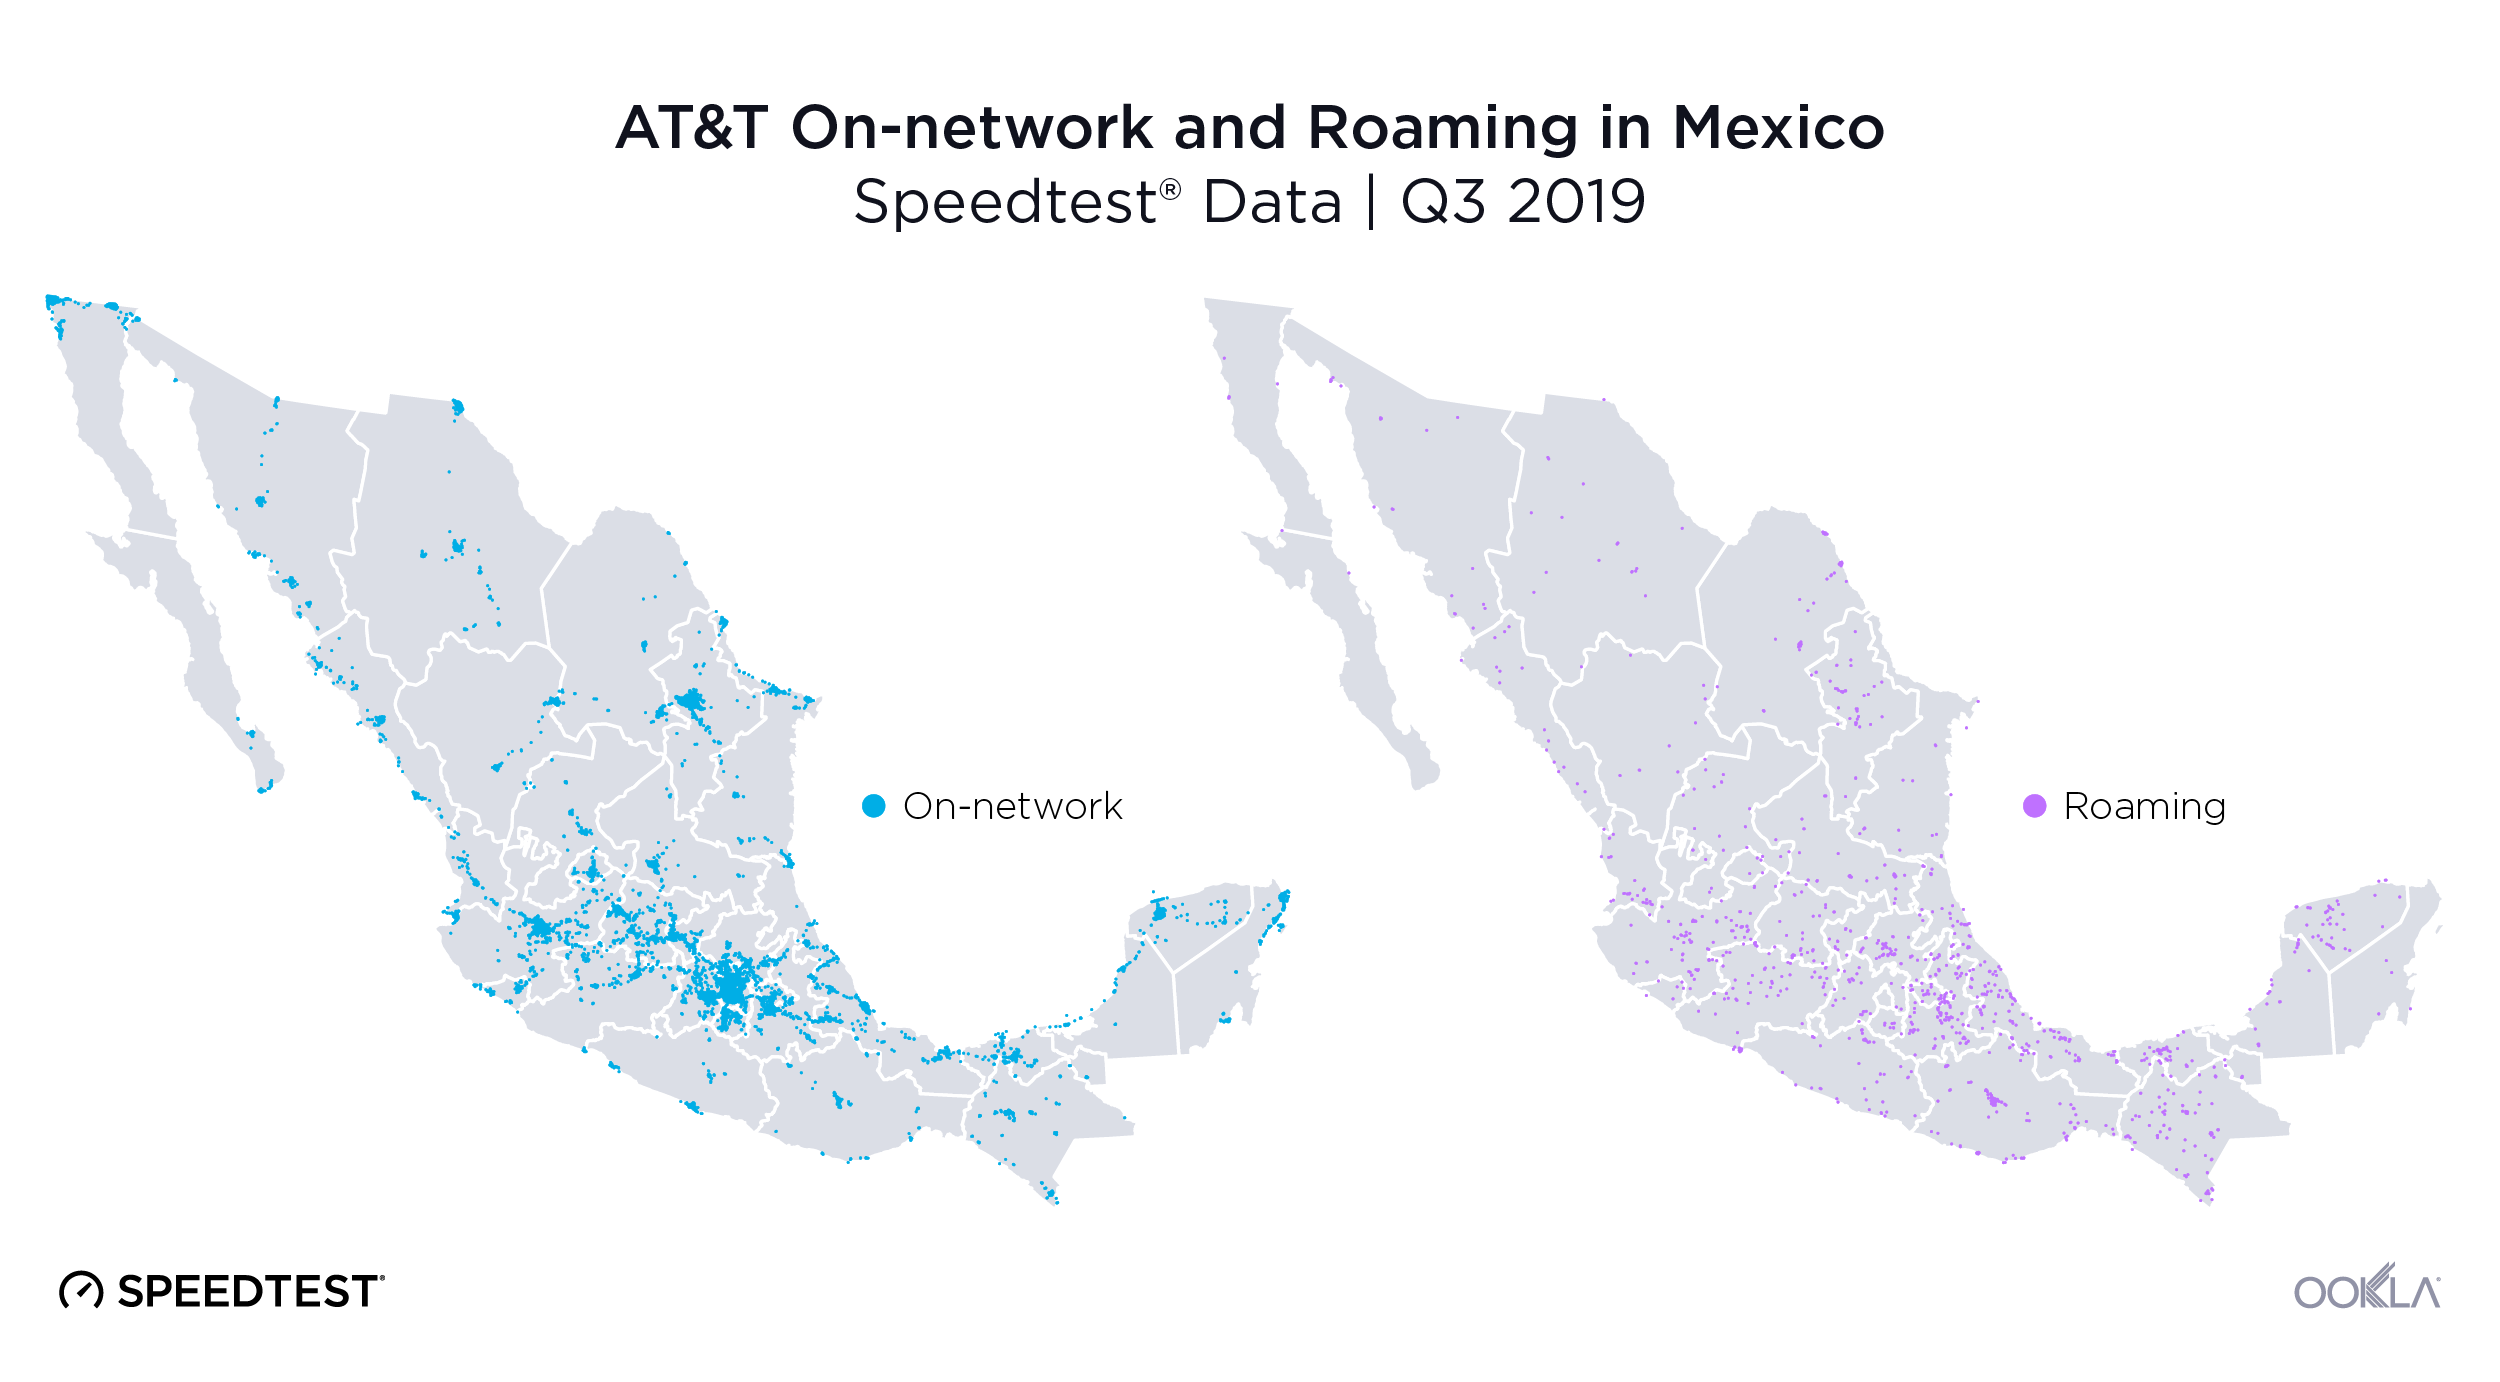
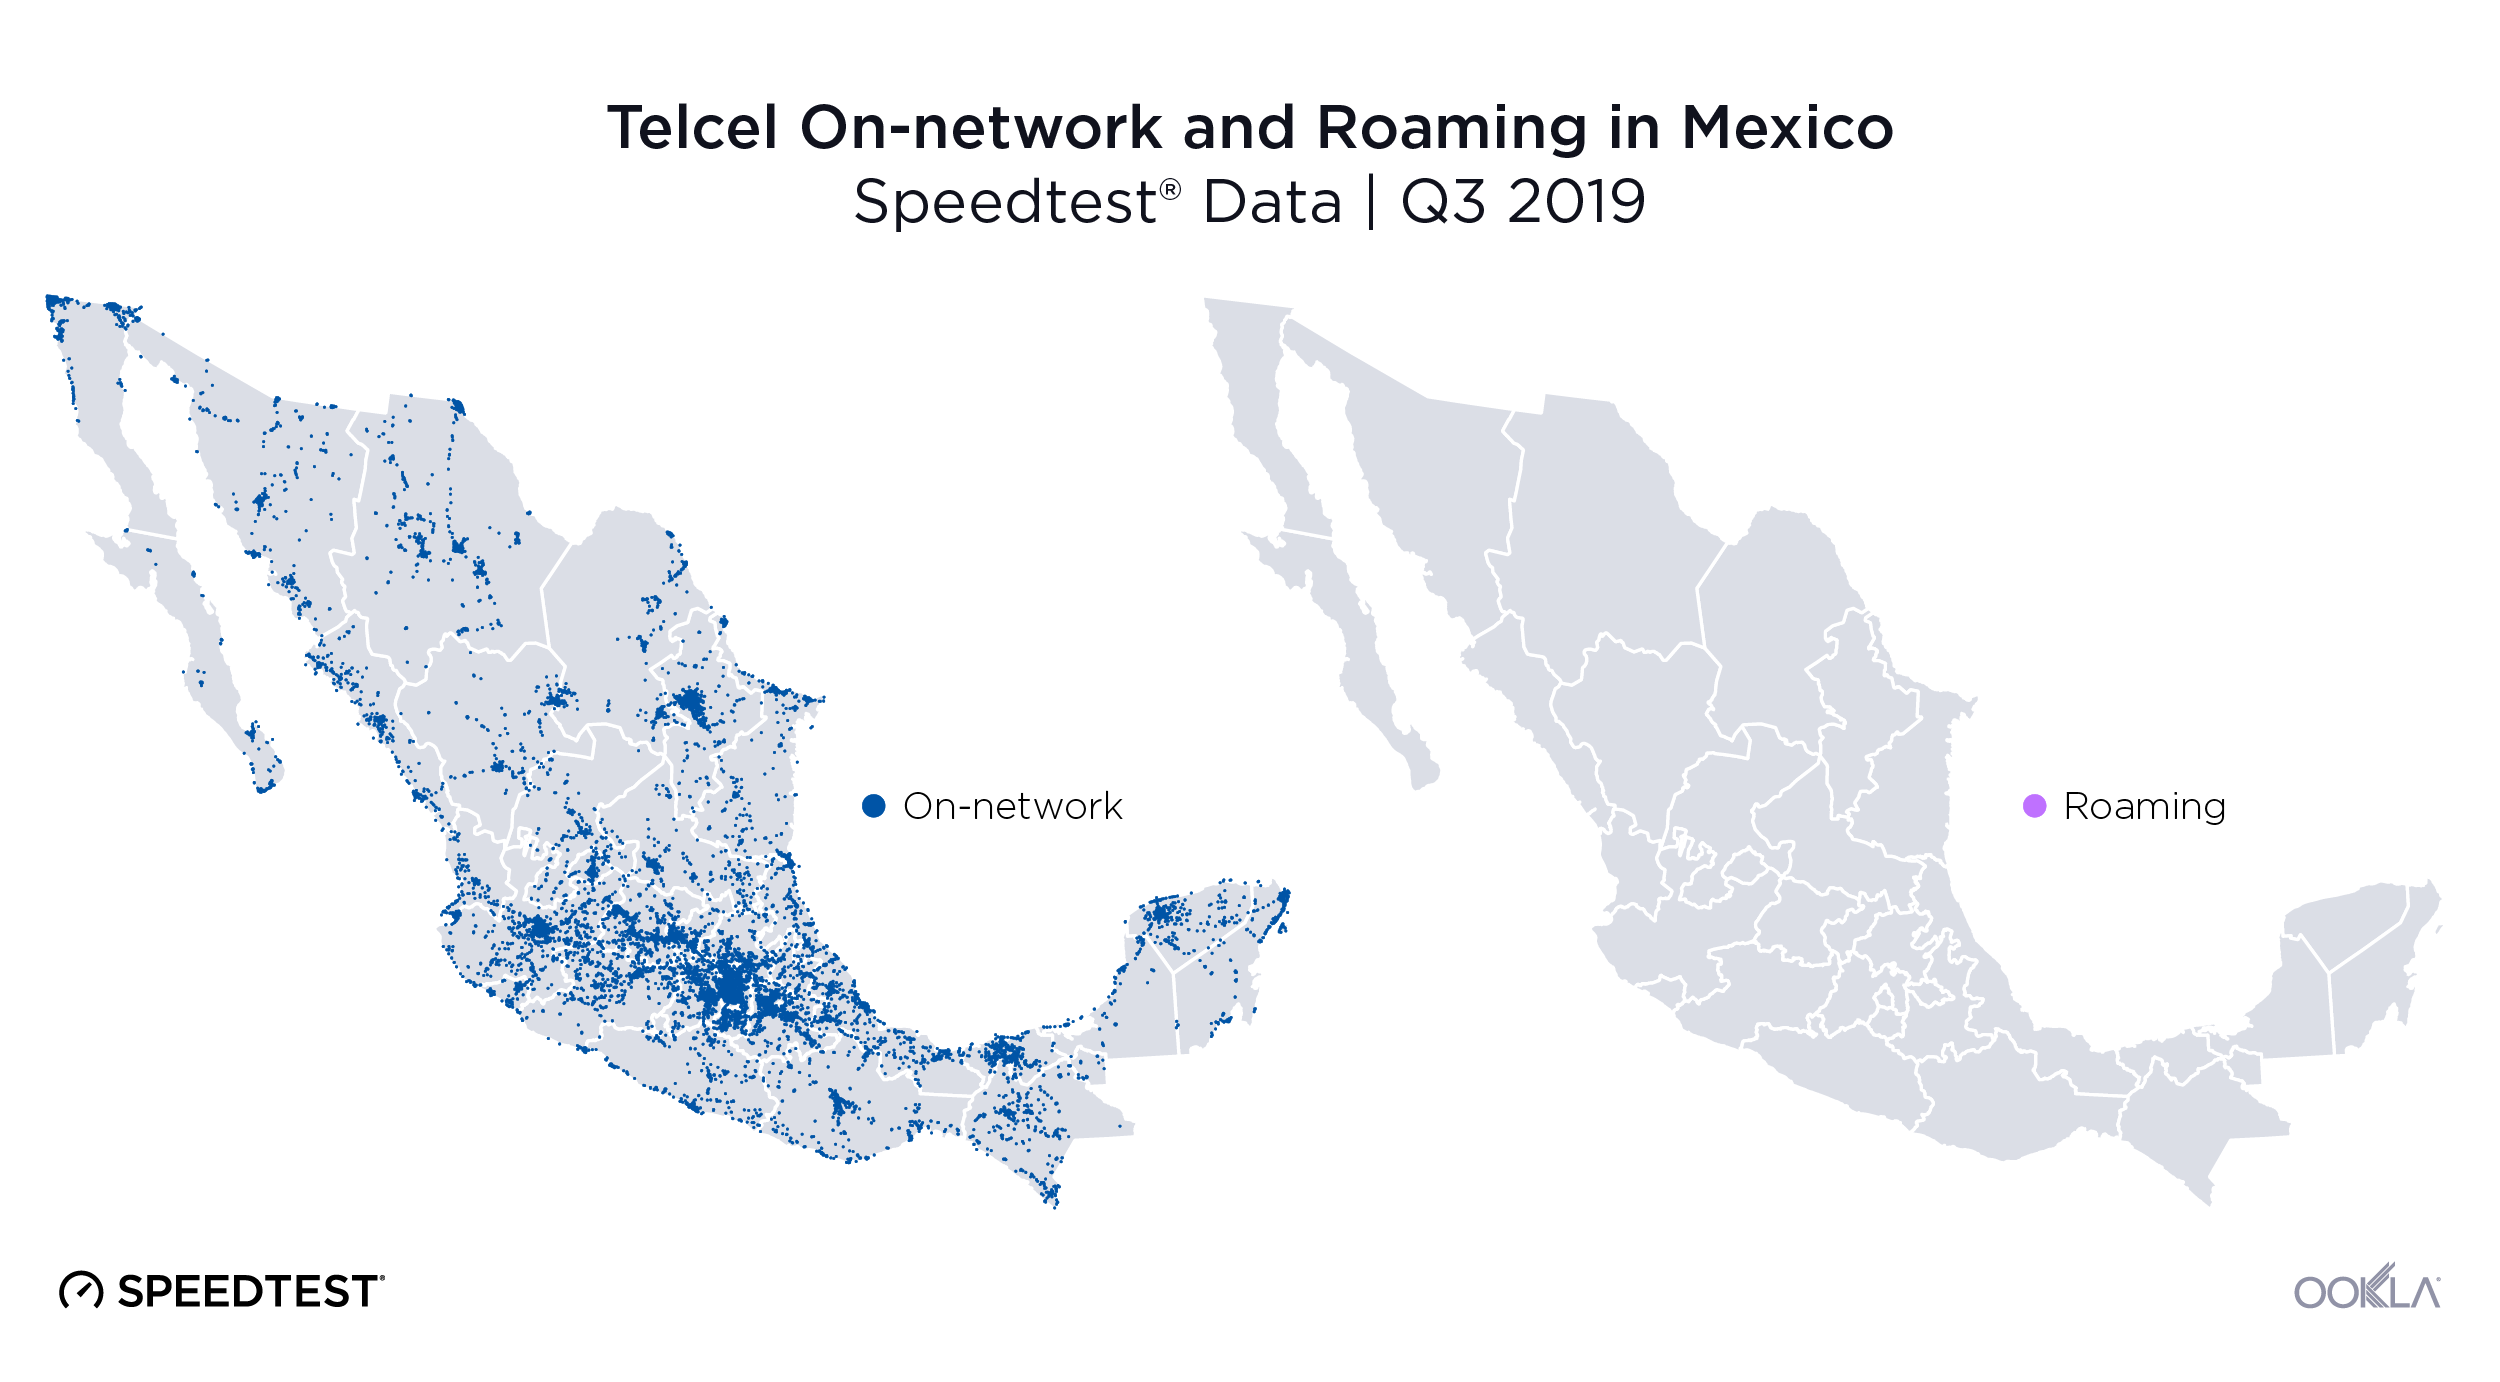
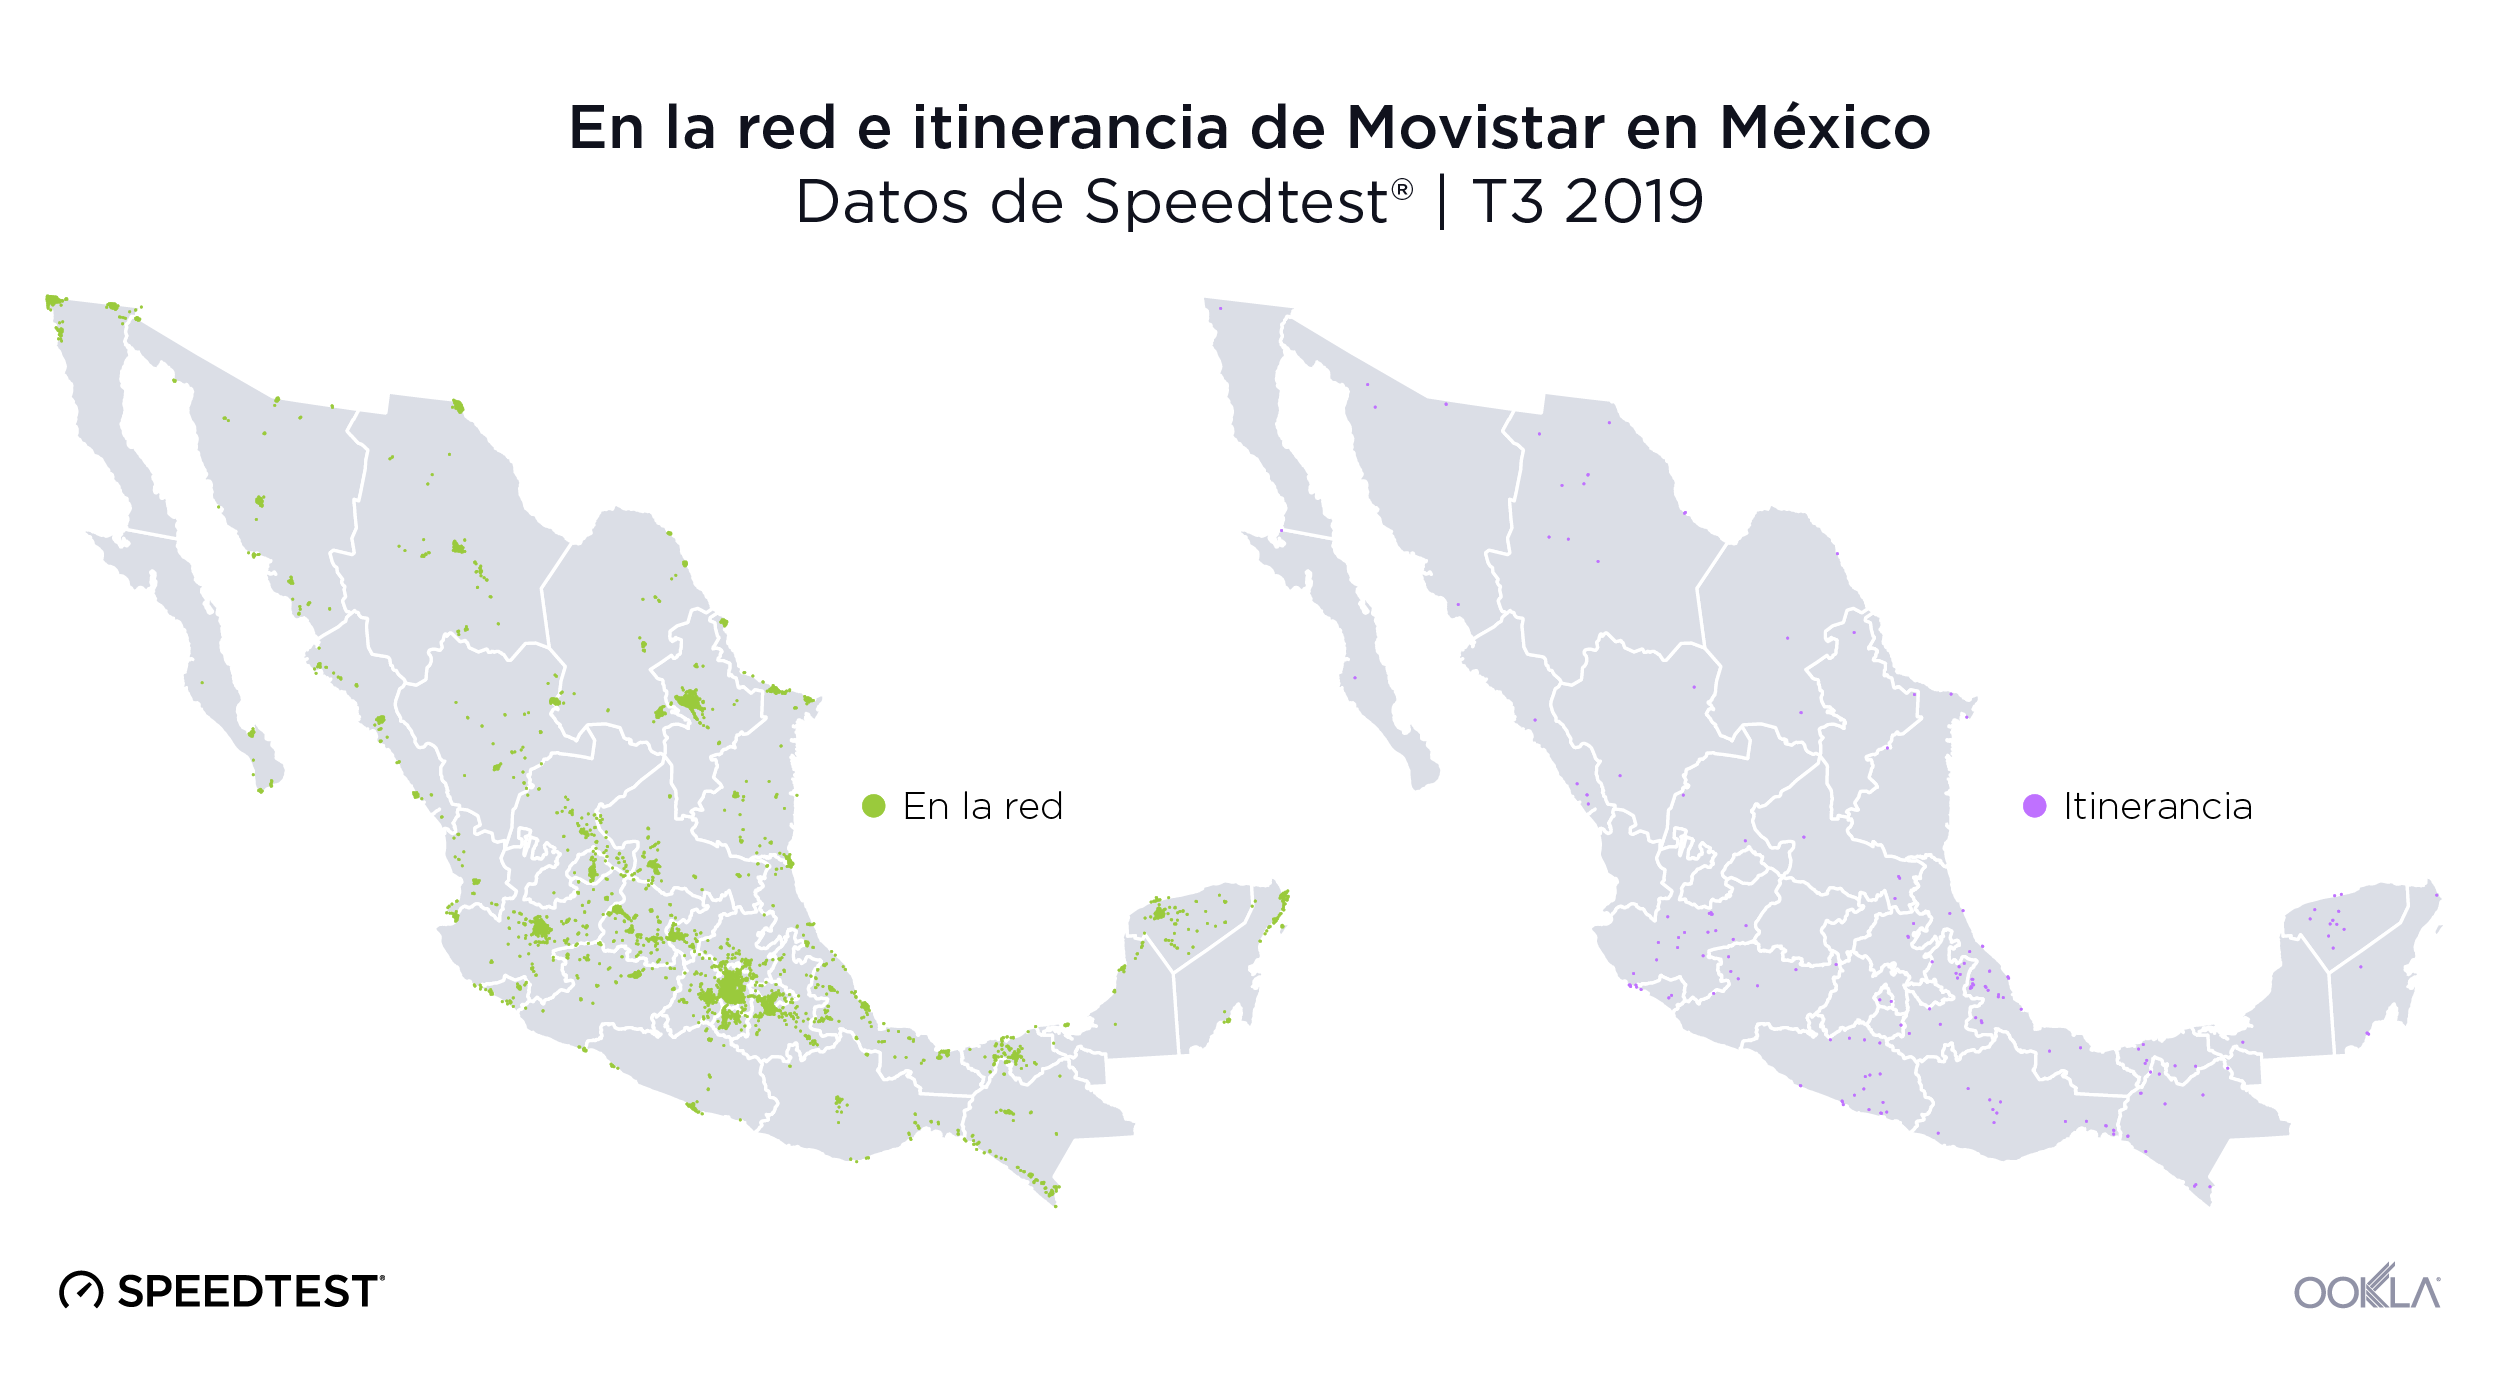
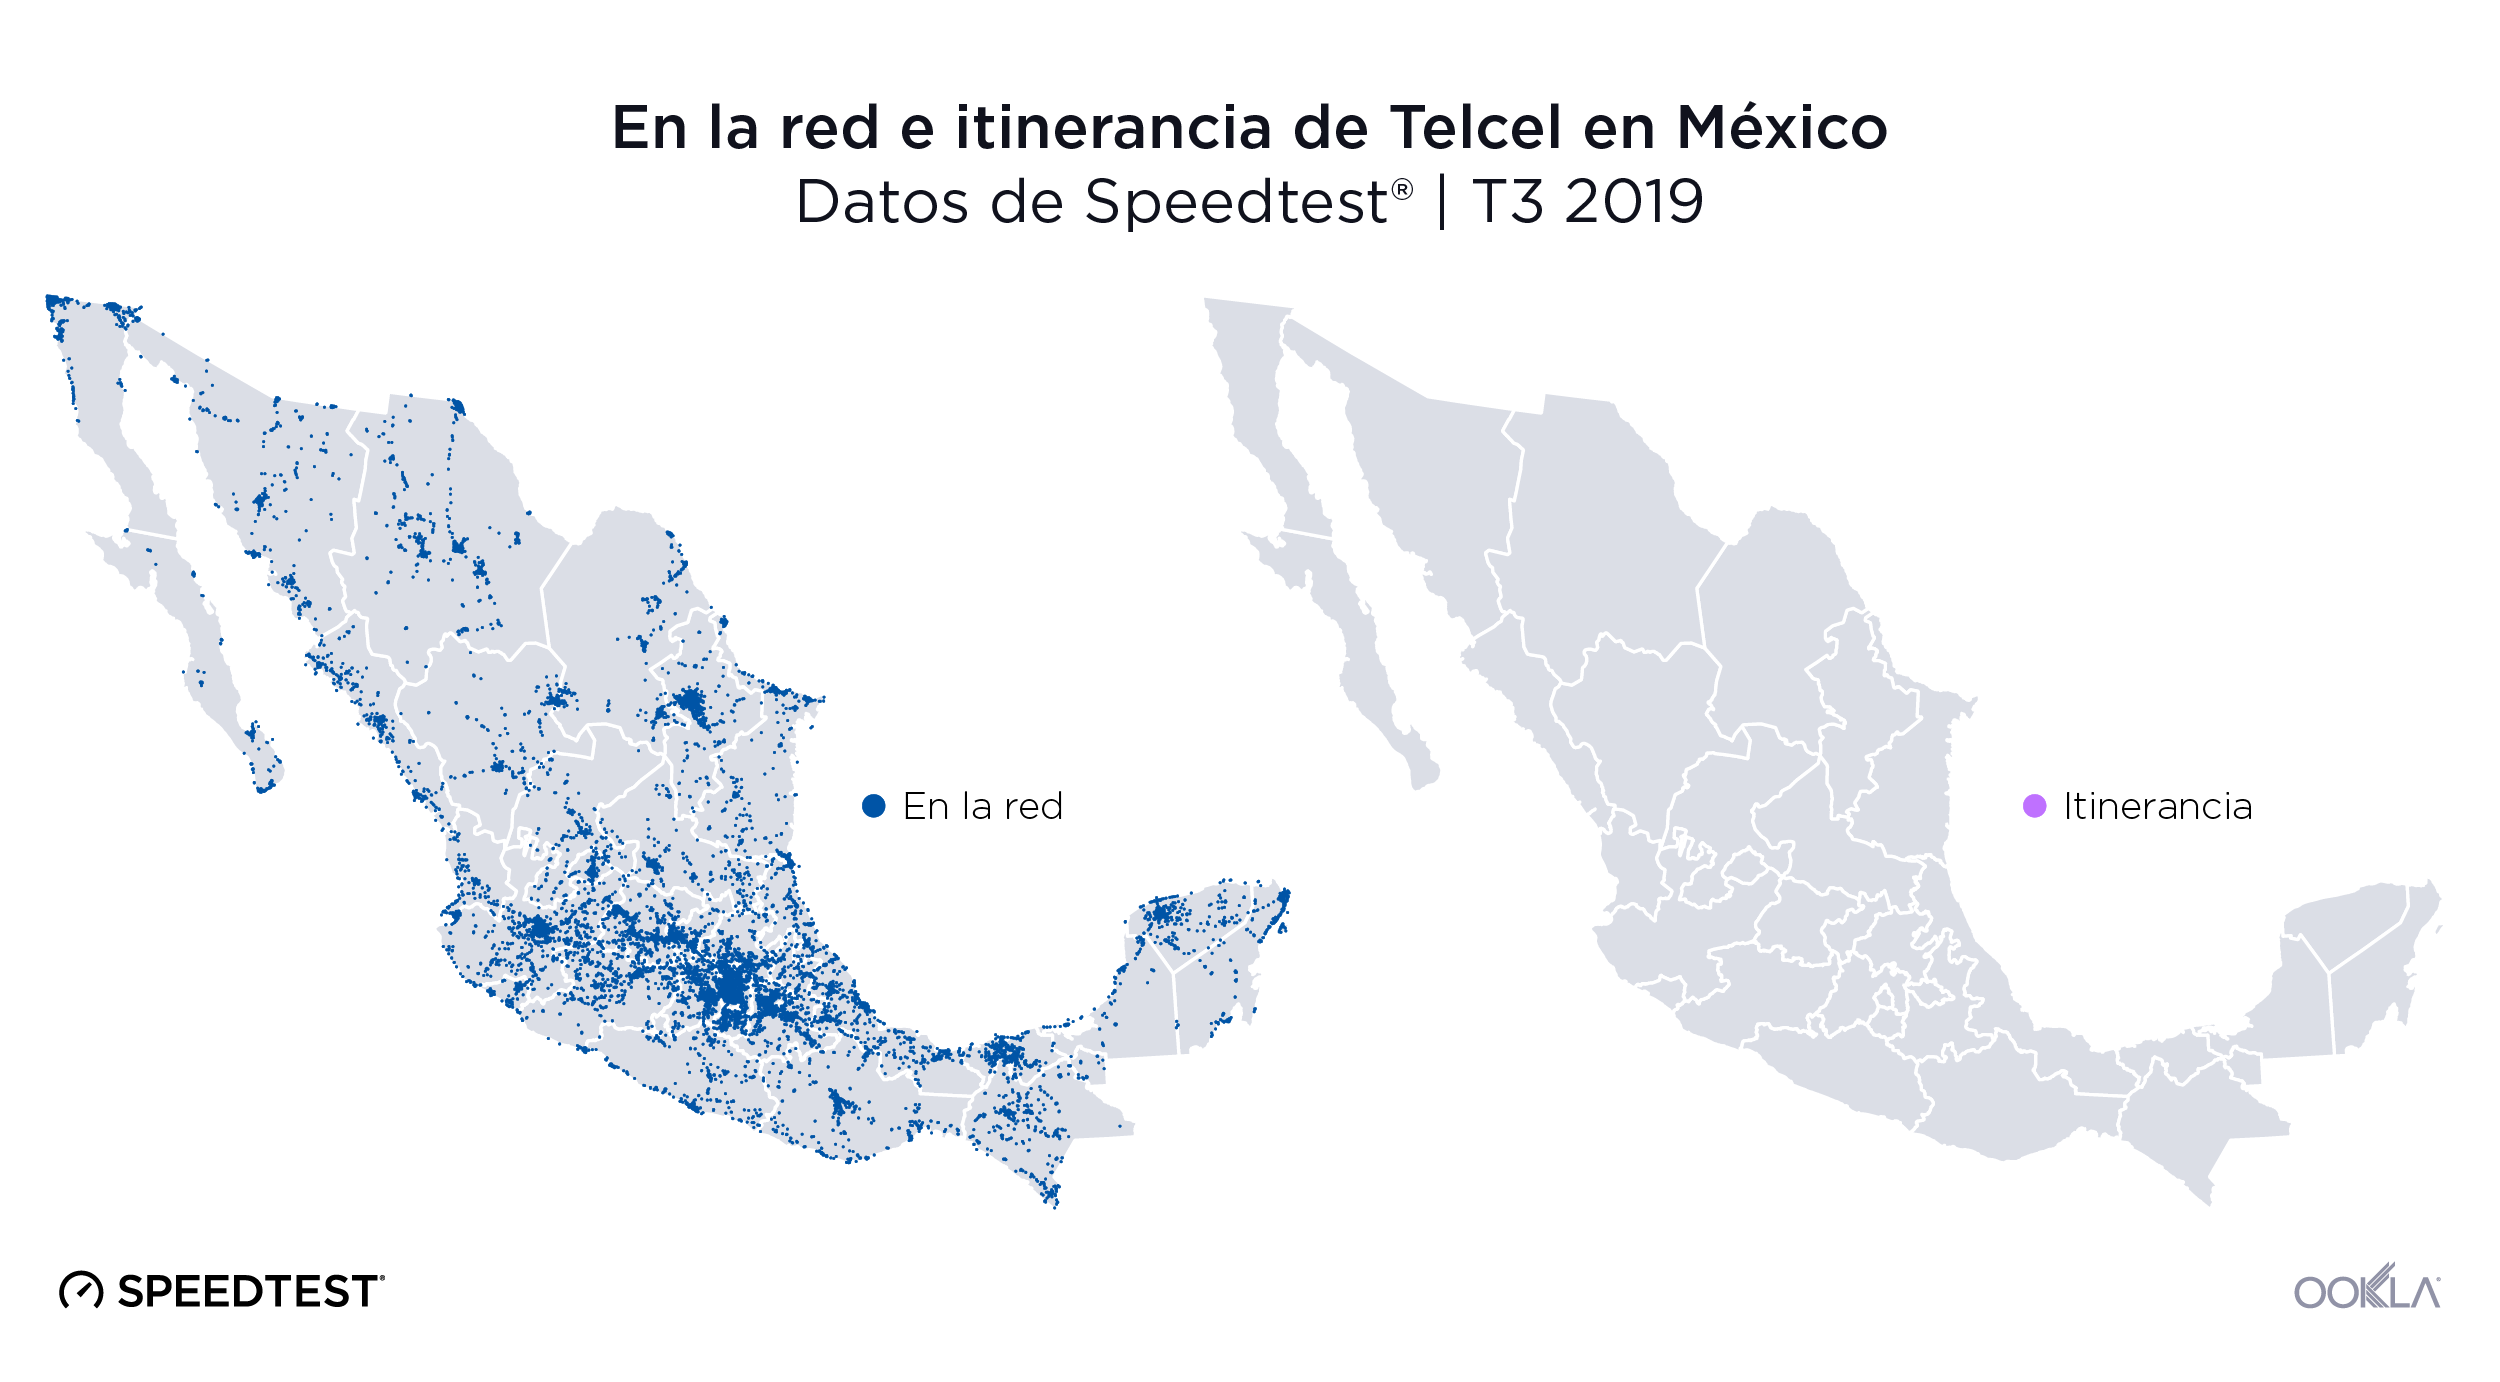
AT&T, Movistar and Telcel all demonstrated a majority of on-network activity in major cities like Mexico City, Guadalajara, Mérida, Monterrey and Tijuana. However, Telcel showed substantially more on-network activity in areas beyond large cities than competitors, including up and down Mexico’s western coast from Tapachula in Chiapas to Guaymas in Sonora. Both AT&T and Movistar showed more roaming in this same area.

It’s interesting to note that on-network and roaming activity in Mexico often occur within close proximity, even in major cities. For example, the map shows most of AT&T’s on-network activity concentrated in central Mexico. The same was true of AT&T’s roaming activity. We have considered AT&T and subsidiary Unefon jointly throughout this article.

A similar overlap can be seen in Movistar’s on-network and roaming activity, although Movistar demonstrated roaming in fewer locations than we saw on AT&T. Telcel showed virtually no roaming.

It will be interesting to see how the recent deal between AT&T and Telefonica (Movistar’s parent company) affects the roaming experience for subscribers.

AT&T shows the most Time Spent on 4G on and off network

Time-Spent-On-Net-Roam-in-Mexico-ENG-2

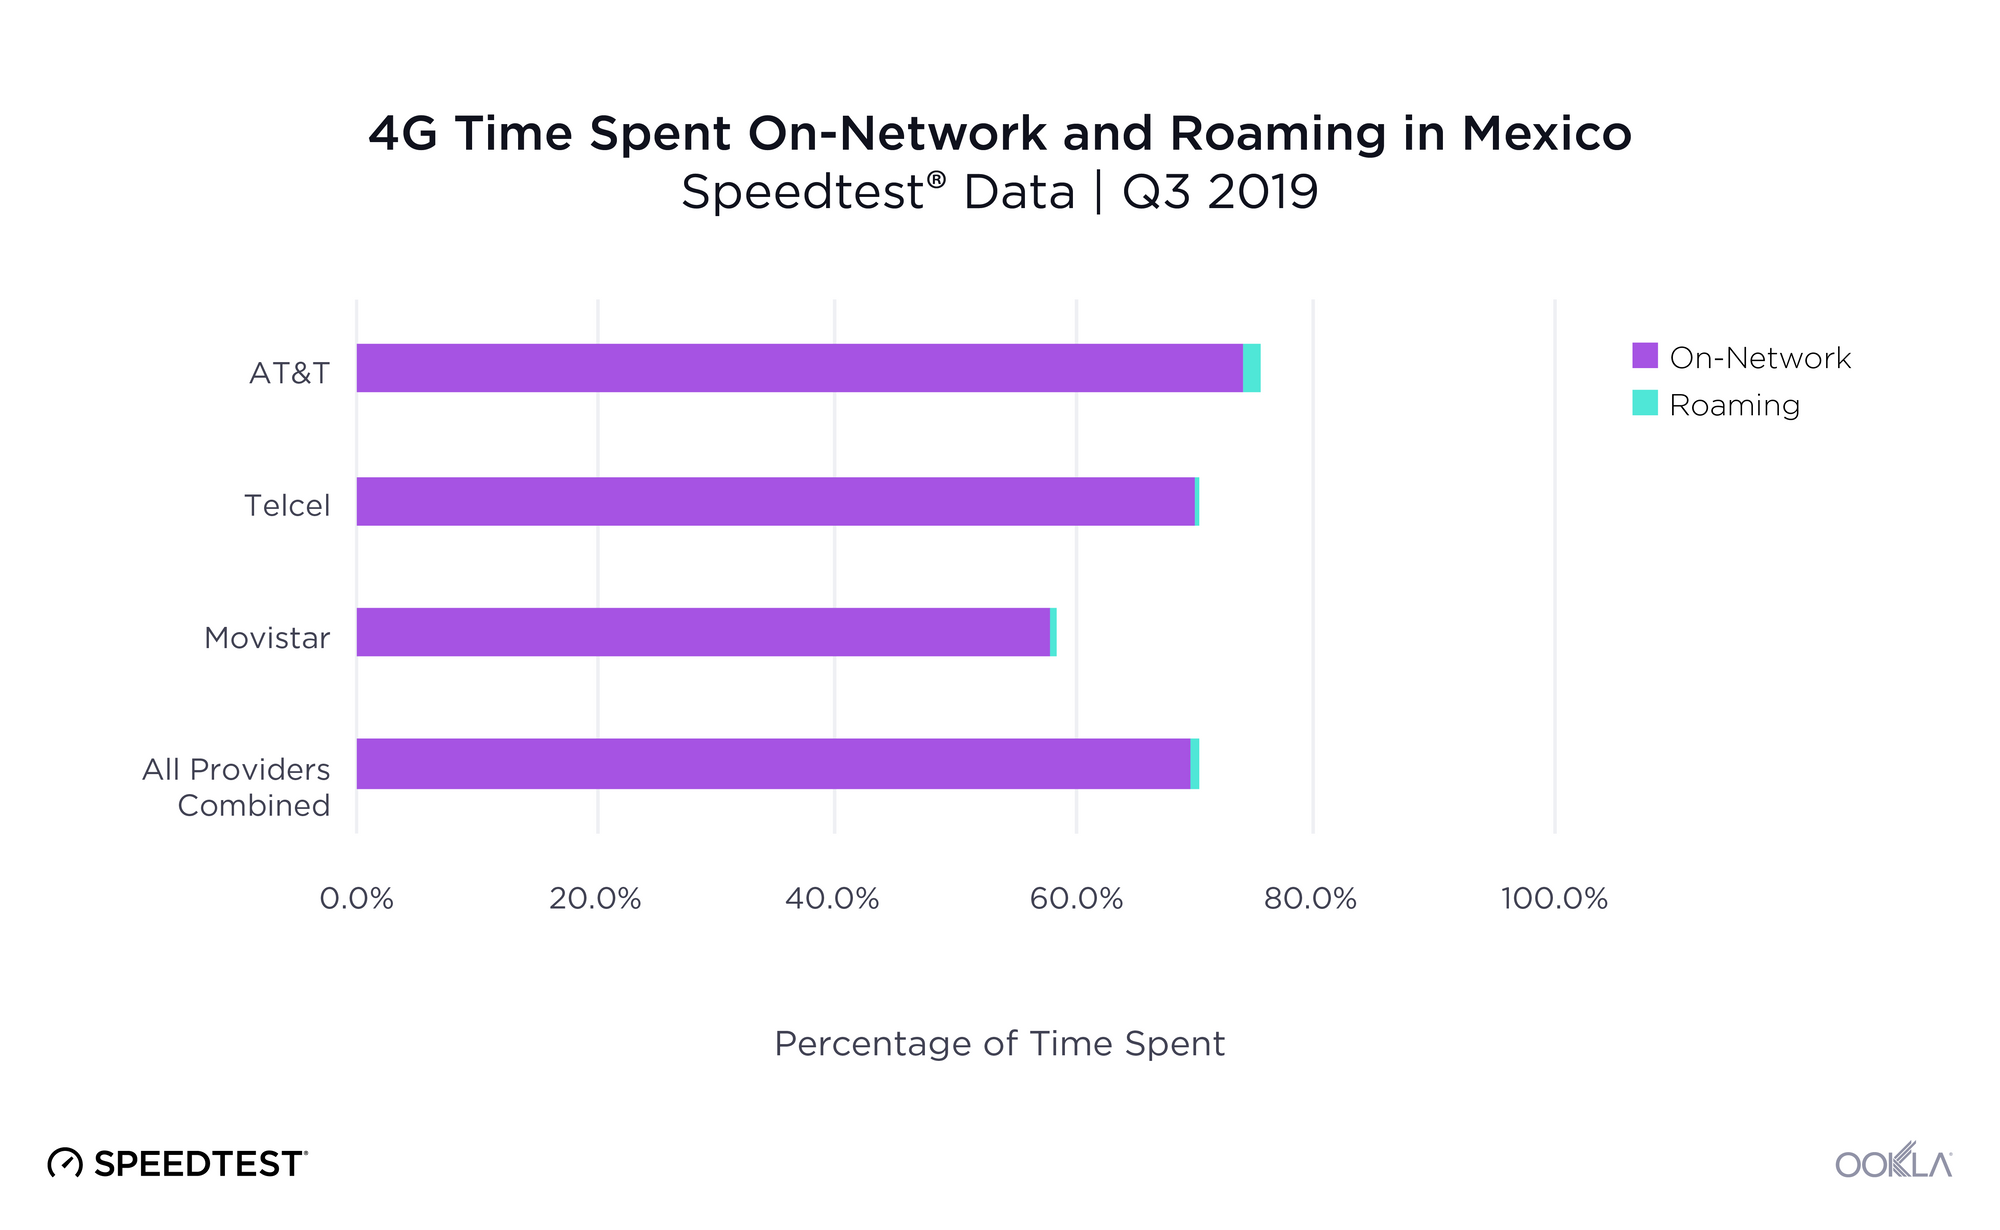
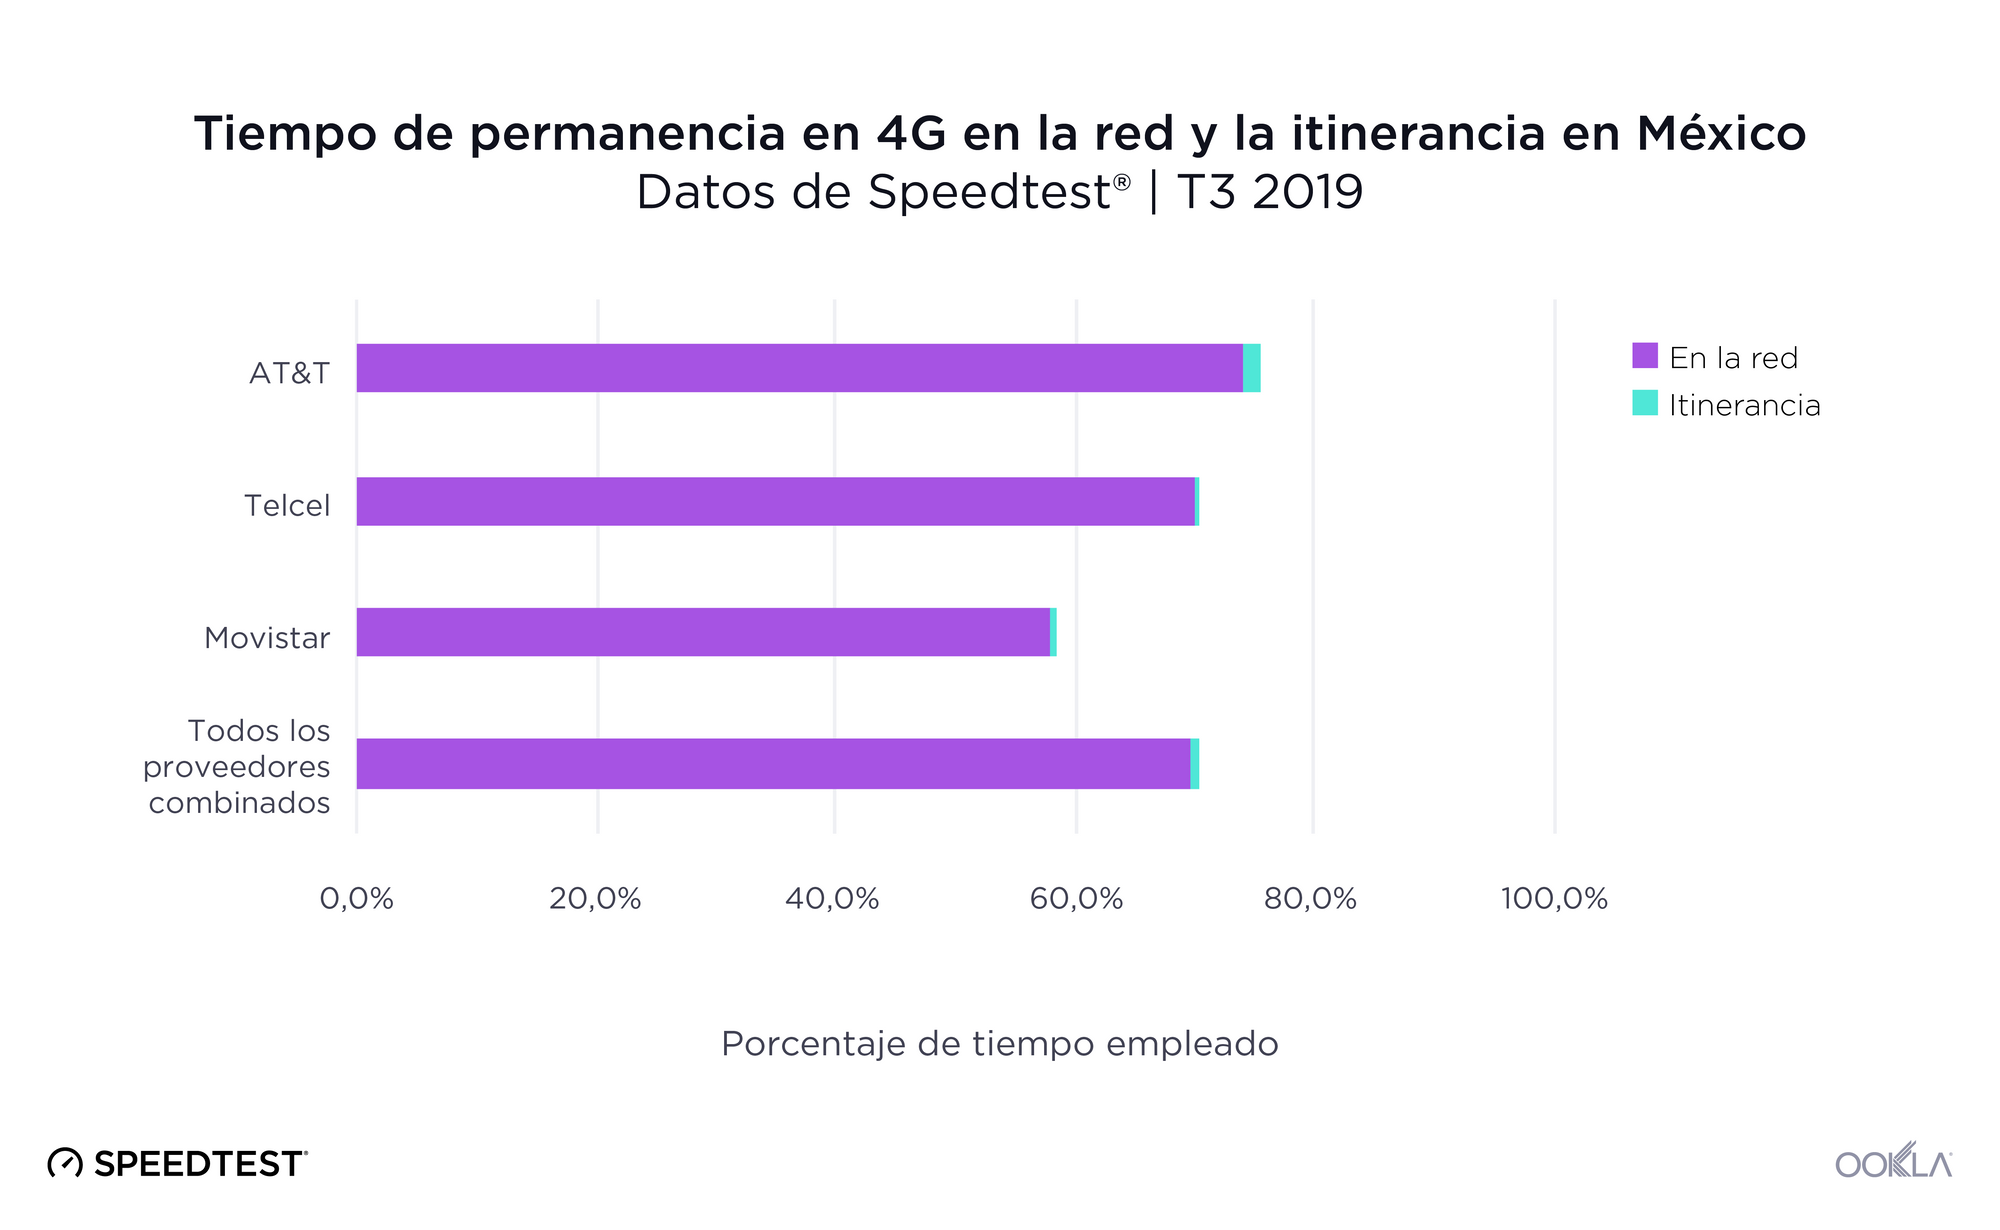
We used Speedtest data on Time Spent to measure how often, on average, consumers were able to connect to 4G LTE on their own network and while roaming in Mexico during Q3 2019. Reported 4G roaming includes “emergency calls only” modes (which do not have normal voice or data service).

Mobile users in Mexico were able to connect on-network to 4G LTE 69.9% of the time on average throughout the country. Separating results by provider, AT&T had the highest Time Spent on-network on 4G at 74.4%. Telcel followed with 70.4% and Movistar was third with 58.1%.

Time Spent roaming on 4G in Mexico was a fraction of what we saw looking at Time Spent on 4G while on-network with users spending an average of 0.7% of the time roaming on 4G during Q3 2019. At the operator level, AT&T subscribers showed the most Time Spent roaming on 4G at 1.4%. Movistar followed with subscribers spending 0.7% of the time roaming on 4G. Telcel subscribers had the least Time Spent roaming on 4G at 0.3%.

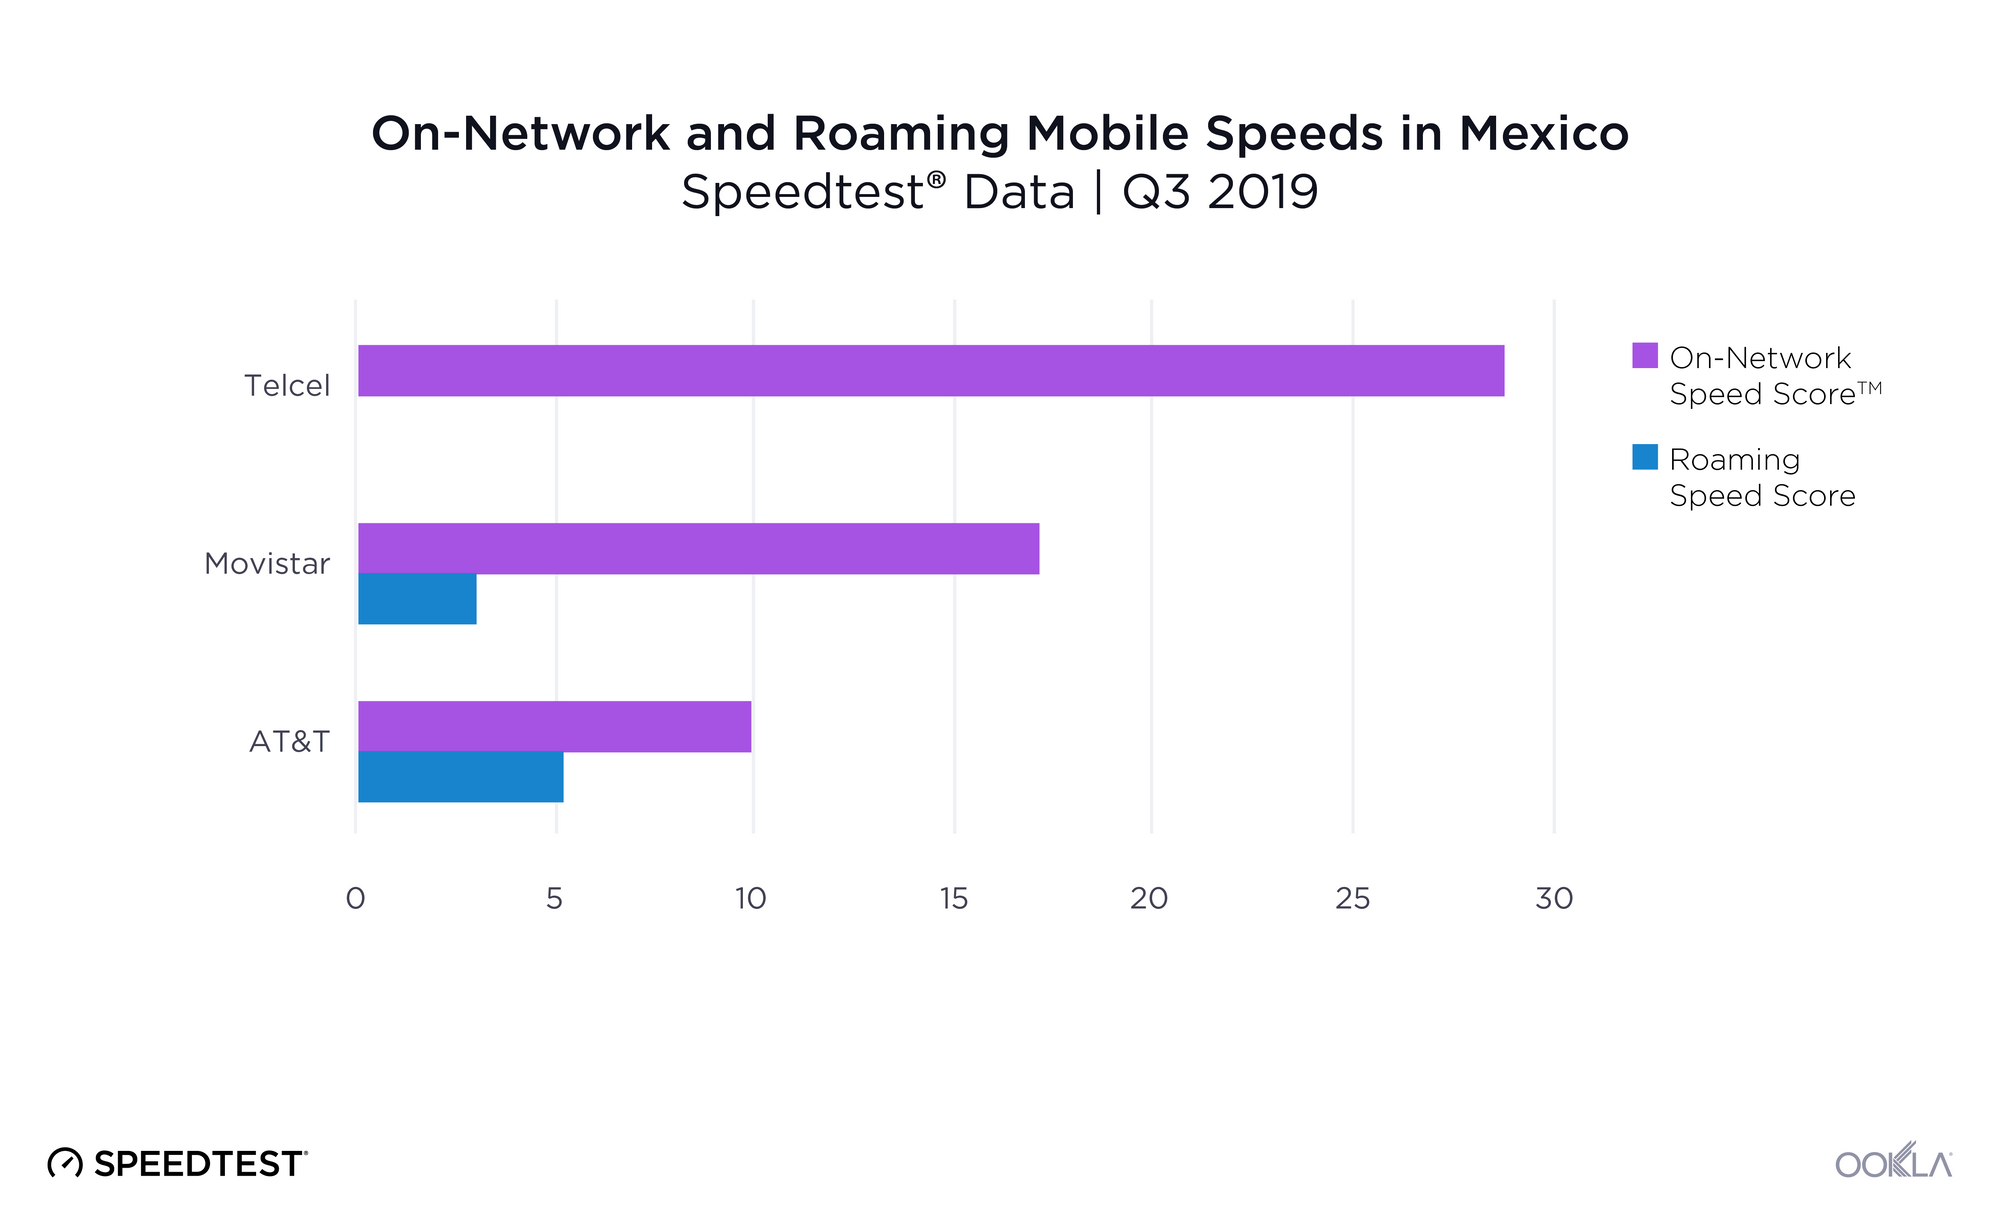
Telcel was the fastest operator for on network use

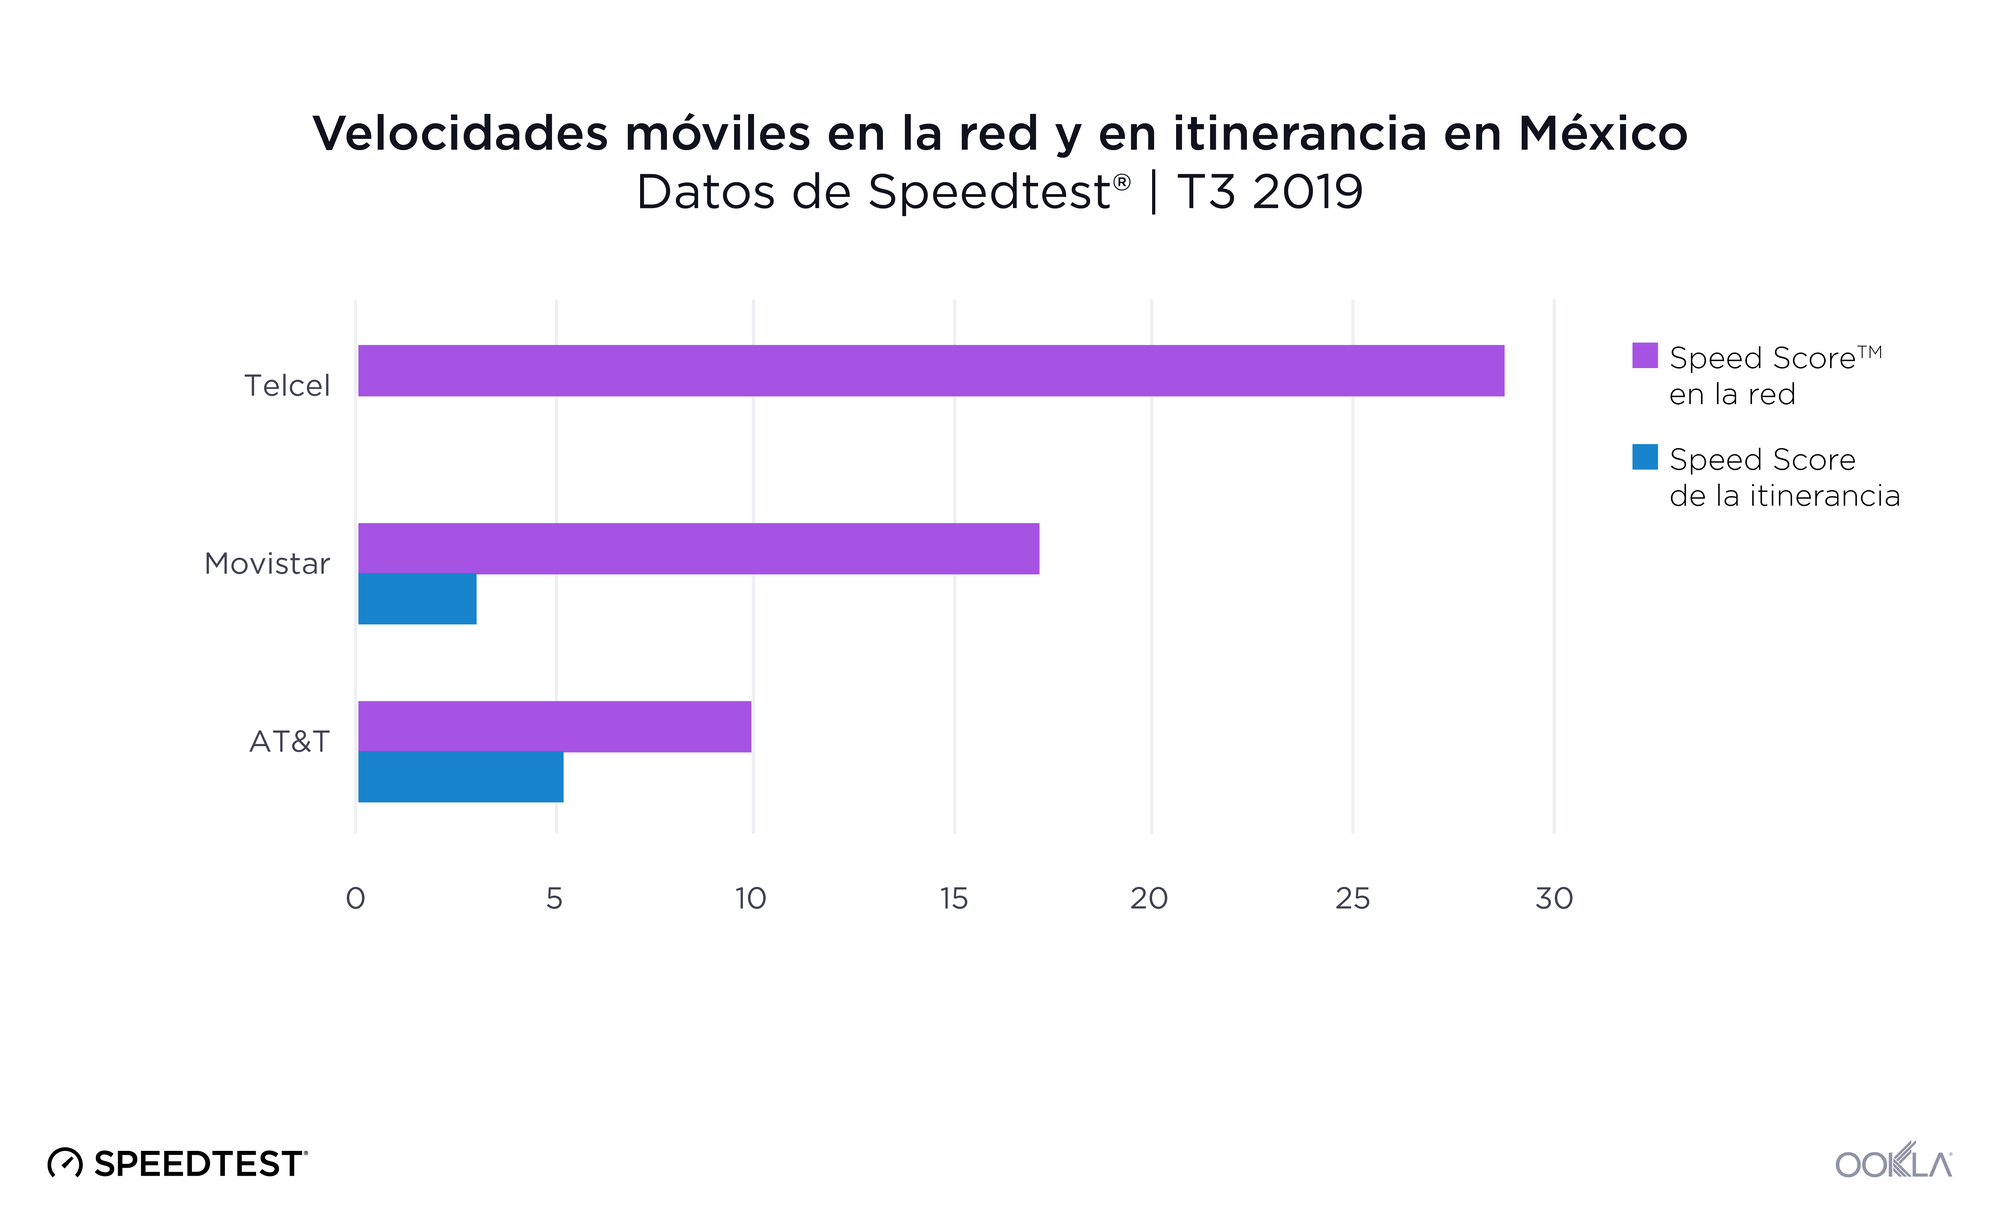
On-net-Roaming-Mobile-Speeds-in-Mexico-ENG-1

At 24.18 Mbps, mean download speed on-network in Mexico was 173.5% faster than mean download speed while roaming during Q3 2019. We use Speed Score™ to measure operator performance as it incorporates measures of download and upload speed. Telcel was the fastest operator with an on-network Speed Score of 28.80. Movistar showed the second fastest on-network performance with a Speed Score of 17.15. AT&T ranked third for on-network performance with a Speed Score of 9.87, 65.7% slower than Telcel.
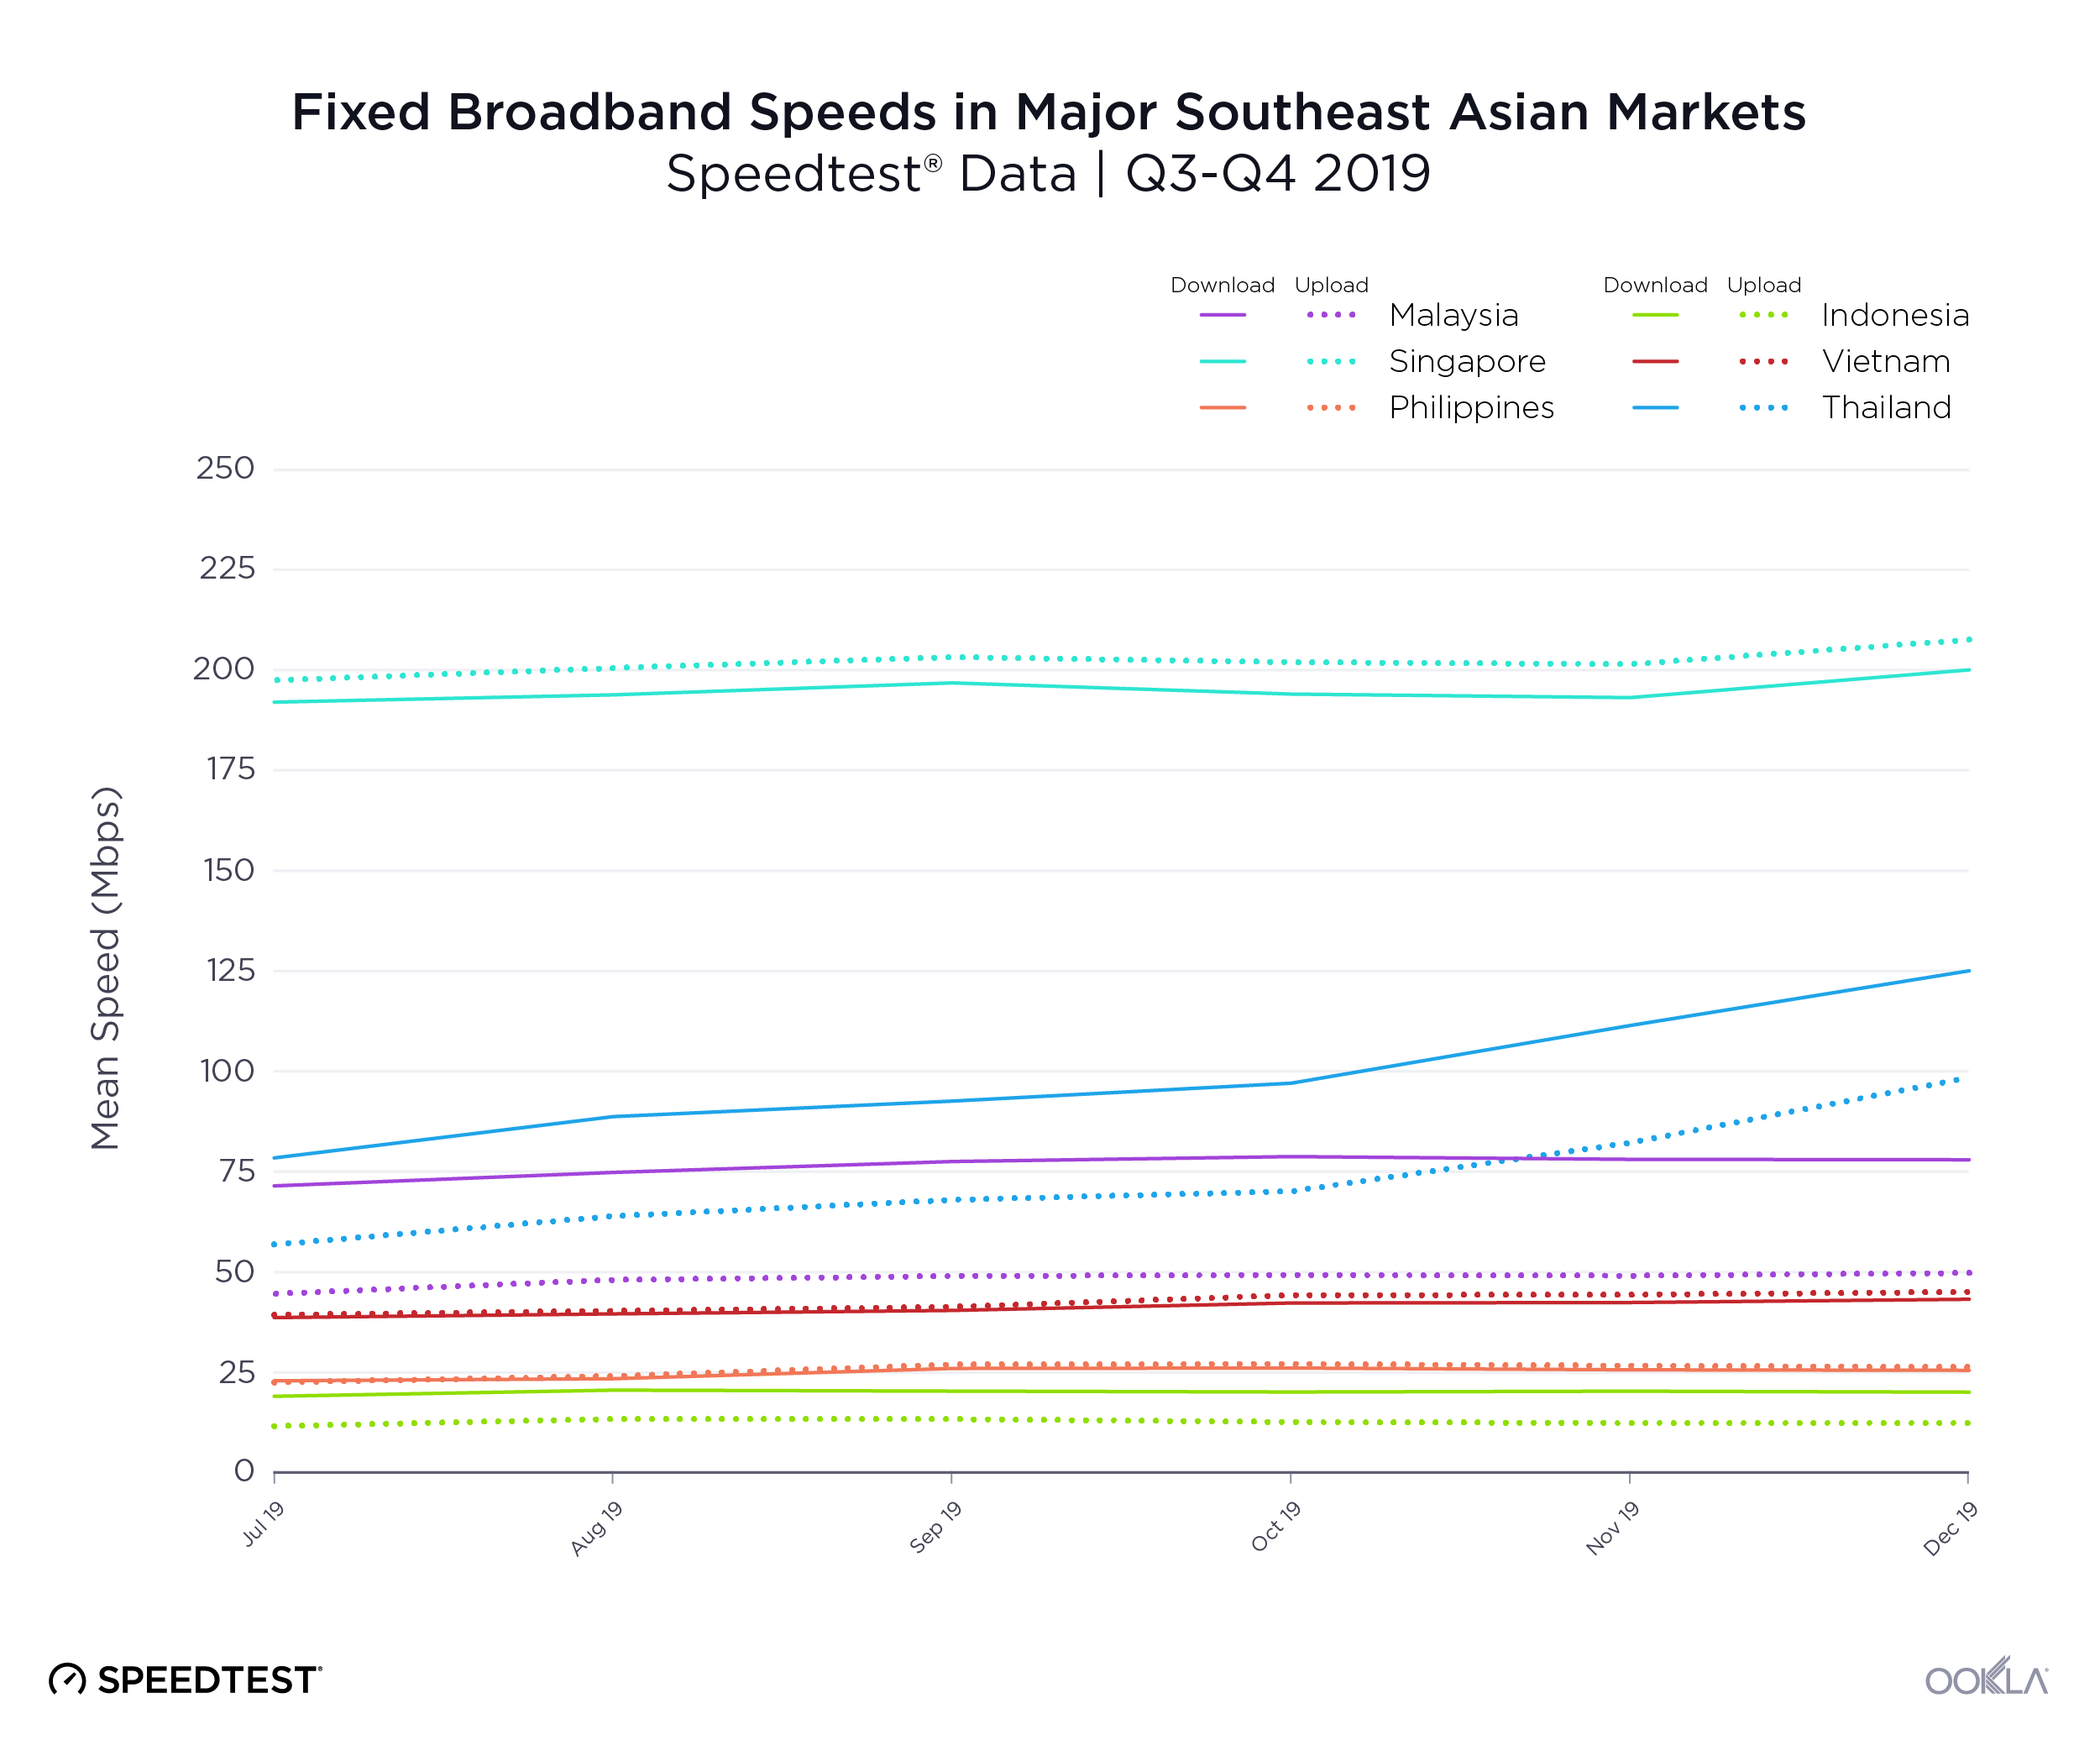
AT&T had the fastest Speed Score while roaming with a Speed Score of 5.18, 47.5% slower than their on-network measure. Movistar had the second fastest Speed Score while roaming at 3.02, 82.4% less than on-network. Telcel showed virtually no roaming.
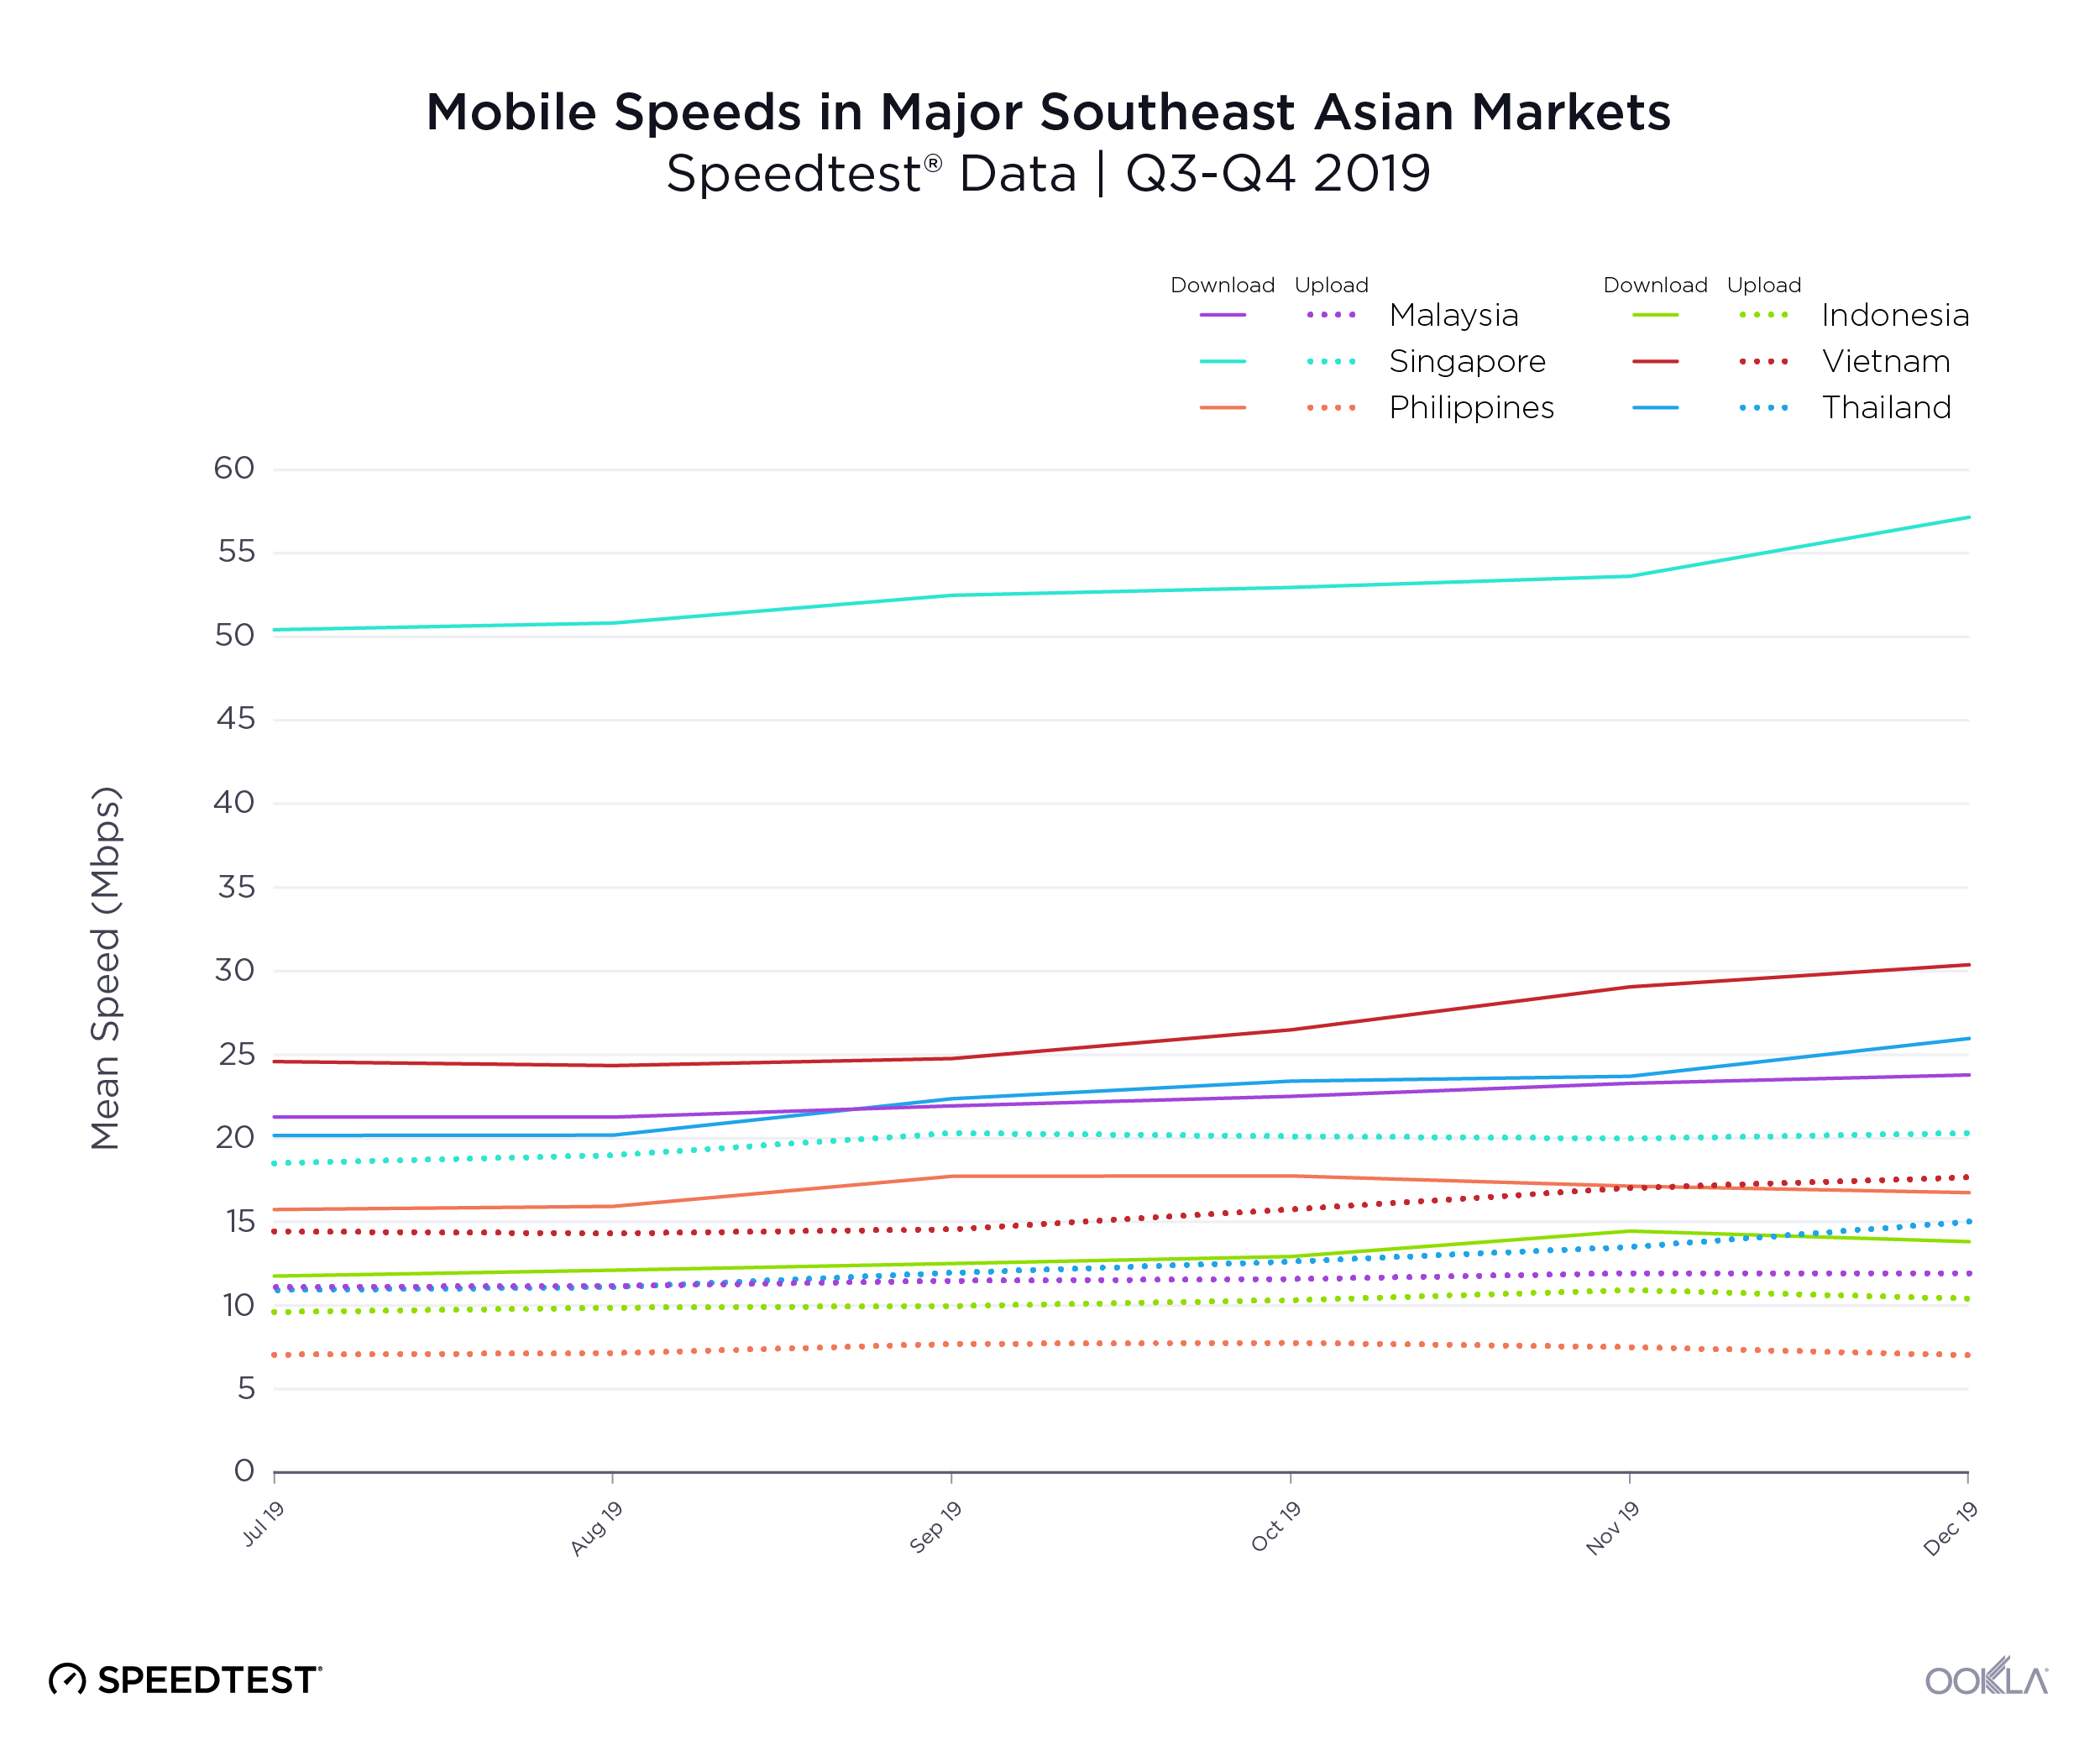
We will continue to analyze emerging trends and their effects on internet performance as telecommunications in Mexico continue to evolve. To find out more about internet speeds in Mexico or other parts of the world, contact us.

Editor’s note: The maps and speed data in this article have been revised to further reflect the experience of consumers using a single SIM.


Redes prestadas: Itinerancia nacional en México

El aumento de la competencia y los nuevos acuerdos de itinerancia han cambiado significativamente el panorama de las telecomunicaciones en México en la última década, de tal modo que suscriptores de algunos proveedores frequentemente tienen conectividad celular incluso si su propio proveedor no contaba con cobertura en un área determinada. Tomamos en cuenta datos de Speedtest® de dispositivos Android durante el tercer trimestre de 2019 para investigar dónde experimentan itinerancia los suscriptores, durante cuánto tiempo usan la itinerancia en 4G y de qué manera la itinerancia afecta las velocidades móviles.

La itinerancia es común en México, pero difiere ampliamente por operador y ubicación

Ookla_Mexico_ATT_On-network_Roaming_map_1219_es
Ookla_Mexico_Movistar_On-network_Roaming_map_1219_es
Ookla_Mexico_Telcel_On-network_Roaming_map_1219_es

AT&T, Movistar y Telcel demostraron una mayoría de actividad en la red en grandes ciudades como ciudad de México, Guadalajara, Mérida, Monterrey y Tijuana. Sin embargo, Telcel exhibió una actividad en la red en áreas alejadas de las grandes ciudades sustancialmente mayor que la competencia, incluida la costa oeste de México, desde Tapachula en Chiapas hasta Guaymas en Sonora. Tanto AT&T como Movistar exhibieron mayor itinerancia en la misma área.

Es interesante destacar que, a menudo, la actividad en la red y de la itinerancia en México ocurren a escasa distancia entre sí, incluso en las grandes ciudades. Por ejemplo, el mapa muestra que la mayoría de la actividad en la red de AT&T se concentró en el centro de México. Lo mismo sucedió con la actividad de la itinerancia de AT&T. A lo largo de este artículo consideramos de manera conjunta a AT&T y el subsidiario Unefon.

Puede verse una superposición similar en la actividad en la red y de la itinerancia de Movistar, aunque esta empresa exhibió itinerancia en menos lugares que AT&T. Telcel prácticamente no mostró itinerancia.

Será interesante ver de qué manera el acuerdo reciente entre AT&T y Telefónica (sociedad matriz de Movistar) afecta la experiencia de itinerancia para los suscriptores.

AT&T exhibe la mayor cantidad de tiempo de permanencia en 4G dentro y fuera de la red

Time-Spent-On-Net-Roam-in-Mexico-SP-2

Empleamos datos de Speedtest sobre el tiempo de permanencia para mostrar con qué frecuencia, en promedio, los consumidores pudieron conectarse a 4G LTE en su propia red y durante la itinerancia en México en el tercer trimestre de 2019. Los datos de itinerancia incluyen reportes en modo de emergencia, los cuales no implican servicio de voz y datos.

Los usuarios móviles en México pudieron conectarse a la red en 4G LTE el 69,9 % del tiempo en promedio en todo el país. Si separamos los resultados por proveedor, AT&T tuvo la mayor cantidad de tiempo de permanencia en 4G, con el 74,4 %. Le siguió Telcel, con el 70,4 %, y Movistar quedó tercero con el 58,1 %.

El tiempo de permanencia en itinerancia en 4G en México fue una fracción de lo que se vio de tiempo de permanencia en 4G en la red, ya que los usuarios pasaron, en promedio, el 0,7 % del tiempo con itinerancia en 4G durante el tercer trimestre de 2019. En el caso de los operadores, los suscriptores de AT&T exhibieron la mayor cantidad de tiempo de permanencia en 4G, con el 1,4 %. Le siguió Movistar, con el 0,7 % del tiempo de permanencia en itinerancia en 4G de parte de los suscriptores. Los suscriptores de Telcel tuvieron la menor cantidad de tiempo de permanencia en itinerancia en 4G, con el 0,3 %.

Telcel fue el operador más rápido

On-net-Roaming-Mobile-Speeds-in-Mexico-SP-1

Con 24,18 Mbps, la velocidad media de descarga en la red en México fue un 173,5 % más rápida que la velocidad media de descarga en itinerancia durante el tercer trimestre de 2019. Utilizamos Speed Score™ para medir el rendimiento de los operadores, ya que incluye mediciones de velocidades de carga y descarga. Telcel fue el operador más rápido, con una puntuación de velocidad en la red de Speed Score de 28,80. Movistar tuvo el segundo mejor rendimiento de velocidad en la red, con un resultado de 17,15. AT&T se quedó con el tercer lugar, con 9,87, un 65,7 % más lento que Telcel.

AT&T demostró tener la puntuación más alta de Speed Score, con una velocidad de itinerancia de 5,18, un 47,5% más lento que su medición de la red. Movistar quedó segundo con un resultado de Speed Score de 3,02 en cuanto a la velocidad de la itinerancia, 82,4% inferior al rendimiento de la red de la empresa. Telcel prácticamente no mostró itinerancia.

Continuaremos analizando las tendencias emergentes y sus efectos sobre el rendimiento de Internet a medida que las telecomunicaciones en México continúen evolucionando. Para obtener más información sobre las velocidades de Internet en México y otras partes del mundo, comuníquese con nosotros.

Nota del editor: Los mapas y datos de velocidades en este artículo fueron ajustados para reflejar más a fondo la experiencia de los consumidores usando una sola tarjeta SIM. .

Ookla retains ownership of this article including all of the intellectual property rights, data, content graphs and analysis. This article may not be quoted, reproduced, distributed or published for any commercial purpose without prior consent. Members of the press and others using the findings in this article for non-commercial purposes are welcome to publicly share and link to report information with attribution to Ookla.