| November 12, 2024

More Fast, Free Airport Wi-Fi Just in Time for the Holidays

Airports in the United States have seen record-breaking numbers of travelers this year, and the always-busy Thanksgiving weekend could put even more stress on airport services. Including free Wi-Fi. We took a careful look at recent performance at the 50 largest airports by passenger volume in the U.S. as part of our ongoing series to help you plan ahead. Speeds have slipped at some of the top airports, but two more airports have free Wi-Fi download speeds over 150 Mbps than last year. Read on for details.

10 airports have free fixed broadband Wi-Fi over 150 Mbps

Fixed Broadband Internet Download Speeds Over Free Wi-Fi at U.S. Airports
Speedtest Intelligence® | Q3 2024
A map showing fixed broadband speeds in selected airports in the United States.

Chart of Fixed Broadband Internet Speeds Over Free Wi-Fi at U.S. Airports

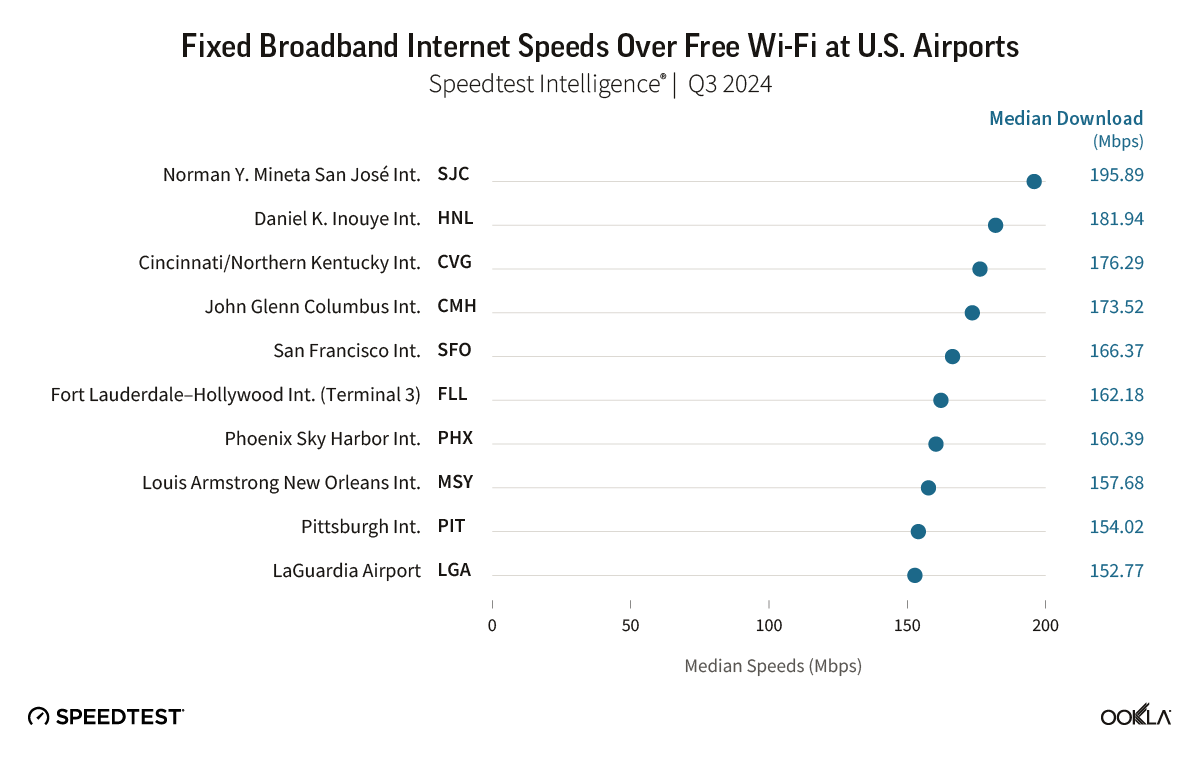
Speedtest Intelligence® shows Norman Y. Mineta San José International Airport, Daniel K. Inouye International Airport, and Cincinnati/Northern Kentucky International Airport were once again home to some of the fastest free airport Wi-Fi among the country’s busiest airports, with median download speeds of 195.89 Mbps (down from 259.37 Mbps last year), 181.94 Mbps (down from 187.58 Mbps), and 176.29 Mbps (down from 210.09 Mbps), respectively, during Q3 2024.  

Rounding out the top 10 were:

  • John Glenn Columbus International Airport (173.52 Mbps),
  • San Francisco International Airport (166.37 Mbps), 
  • Fort Lauderdale–Hollywood International Airport (162.18 Mbps in Terminal 3), 
  • Phoenix Sky Harbor International Airport (160.39 Mbps), 
  • Fort Lauderdale–Hollywood International Airport (158.38 Mbps), 
  • Louis Armstrong New Orleans International Airport (157.68 Mbps), 
  • Pittsburgh International Airport (154.02 Mbps), and LaGuardia Airport (152.77 Mbps). 

Keep in mind that 150 Mbps is more than fast enough for 4K streaming and multi-player gaming

Ekahau®, our Wi-Fi solution, helps airports and other large-scale businesses ensure the networks you depend on are meeting your needs. Unfortunately, some airports are still not meeting the Wi-Fi optimization challenge. Specifically, two airports (William P. Hobby Airport and George Bush Intercontinental Airport) showed median download speeds over Wi-Fi of less than 25 Mbps. However, we are heartened that this is down from five last year with Raleigh-Durham International Airport, Philadelphia International Airport (Free PHL Airport WiFi-24), and Logan International Airport graduating by improving their speeds.

There was one change to our airport list this year, which is based on passenger volume: Kahului Airport was removed and John Glenn Columbus International Airport added. We have not included Kansas City International Airport, San Francisco Bay Oakland International Airport, San Antonio International Airport, or San Diego International Airport because there were insufficient samples.

Fort Lauderdale-Hollywood International Airport splits their free airport Wi-Fi among four separate SSIDs for different terminals, which we have listed separately in these results. While terminals 2 and 3 have a slight edge, the performance does not vary widely enough between them to intentionally hang out in the wrong terminal just to get a minor bump in speed, but if you’re in Philadelphia you definitely want to choose “Free PHL Airport WiFi” when possible, rather than “Free PHL Airport WiFi-24” if your device supports 5 GHz.

Mobile performance at 24 airports beats 150 Mbps

Mobile Internet Download Speeds at U.S. Airports
Speedtest Intelligence® | Q3 2024

Chart of Mobile Internet Speeds at U.S. Airports

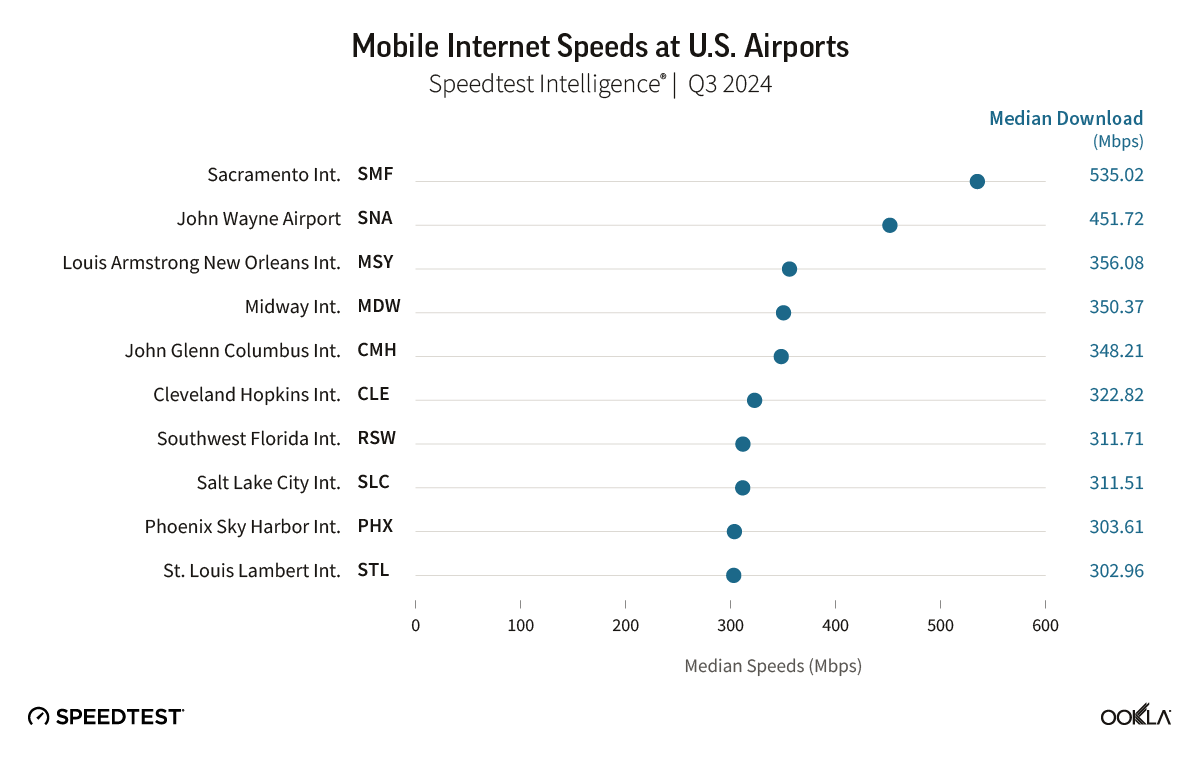
Speedtest Intelligence® shows Sacramento International Airport and John Wayne Airport were the fastest airports on our list for mobile download speed during Q4 2024 at 535.02 Mbps and 451.72 Mbps, respectively. In all, 24 airports in our study had median download speeds over 150 Mbps, up from 18 in 2023. Fifteen of the airports showed median download speeds over 200 Mbps in 2024. 

We’re happy to report that no airport on our list showed median mobile download speeds of less than 25 Mbps.

Wi-Fi or mobile? The airports where it makes a difference

Where Wi-Fi wins

Wi-Fi is the fastest choice at 10 airports where download speed over mobile network service is significantly slower than the free airport Wi-Fi. Details on how much faster the Wi-Fi is than mobile are as follows:

  • 102% at Hartsfield–Jackson Atlanta International Airport, 
  • 90% at Orlando International Airport, 
  • 82% at San Francisco International Airport, 
  • 77% at Dallas/Fort Worth International Airport, 
  • 70% at Seattle-Tacoma International Airport, 
  • 42% at Baltimore/Washington International Airport, 
  • 28% at John F. Kennedy International Airport, 
  • 25% at Harry Reid International Airport, and 
  • 10% at Daniel K. Inouye International Airport. 

It’s important to note that many of these differences are smaller than last year as mobile speeds are catching up to Wi-Fi capabilities.

Places to choose mobile service instead

Twenty-nine airports had faster download speeds over mobile than over free airport Wi-Fi during Q3 2024. Special mention goes to the following airports with massive improvements:

  • Southwest Florida International Airport showed mobile service 635% faster than airport Wi-Fi,
  • Mobile at Tampa International Airport was 528% faster than Wi-Fi, and 
  • Mobile was 341% faster than airport Wi-Fi at Sacramento International Airport. 

Mobile service was 4X faster than airport Wi-Fi at:

  • Salt Lake City International Airport, Logan International Airport, and 
  • Cleveland Hopkins International Airport. 

Mobile was 3X faster than airport Wi-Fi at: 

  • Philadelphia International Airport, 
  • Indianapolis International Airport, 
  • John Wayne Airport, 
  • Denver International Airport, 
  • Detroit Metropolitan Airport, and 
  • George Bush Intercontinental Airport. 

Mobile service was 2X faster at: 

  • Raleigh-Durham International Airport, 
  • Midway International Airport, 
  • Portland International Airport, 
  • St. Louis Lambert International Airport, 
  • Austin–Bergstrom International Airport, 
  • William P. Hobby Airport, 
  • Minneapolis–Saint Paul International Airport, 
  • Los Angeles International Airport, 
  • Louis Armstrong New Orleans International Airport, 
  • Phoenix Sky Harbor International Airport, 
  • John Glenn Columbus International Airport, 
  • Ronald Reagan Washington National Airport, and 
  • Miami International Airport. 

And mobile service was 1X faster than airport Wi-Fi at: 

  • Charlotte Douglas International Airport, 
  • Washington Dulles International Airport, 
  • LaGuardia Airport, and 
  • Nashville International Airport.

All in all, it looks like your airport internet will probably be faster than the security line, and in many airports, faster than your mobile service. Set yourself up for success by downloading a few of your favorite shows along with the Speedtest apps for Android and iOS before you leave the house. And while you’re waiting for that flight, help out travelers next year by taking a Speedtest at the airport to share your experience. 

Ookla retains ownership of this article including all of the intellectual property rights, data, content graphs and analysis. This article may not be quoted, reproduced, distributed or published for any commercial purpose without prior consent. Members of the press and others using the findings in this article for non-commercial purposes are welcome to publicly share and link to report information with attribution to Ookla.

| November 14, 2024

e& UAE Consolidates its Position as the Fastest 5G Operator in the World

During the first half of 2024, e& United Arab Emirates (U.A.E) set a new benchmark for 5G speeds, outperforming all other operators worldwide. This achievement directly results from e&’s continued investment in its mobile infrastructure and the deployment of 5G Standalone (SA), ensuring it stays ahead of international competitors. In this article, we examine the network performance of the world’s leading 5G operators, analyze the factors contributing to their speeds, and discuss the importance of 5G speed competition as the industry prepares for 6G.

Key Takeaways:

  • The U.A.E. is the fastest 5G market. According to Ookla® Speedtest Intelligence® data, The U.A.E. led the world in 5G speeds during Q1-Q2 2024, with a median download speed of 660.08 Mbps.
  • e& UAE is the top-performing 5G operator in the UAE and globally: e& UAE recorded the highest median 5G  download speed globally at 749.63 Mbps and an upload speed of 43.52 Mbps in Q1-Q2 2024. This performance has earned e& UAE the highest Speed Score®, showcasing continuous and steady improvements since 2022.
  • Competing on high-performing, robust networks can help operators better prepare for 6G. Mobile operators that focus on delivering fast and reliable service now not only gain a competitive edge but also position themselves as leaders in industry innovations like 6G, helping them capitalize on the growth in next-generation digital services.

The U.A.E. leads in 5G performance globally

According to Ookla Speedtest Intelligence data, the U.A.E. was the fastest 5G market globally in Q1-Q2 2024, with a median download speed of 660.08 Mbps. Building on recent improvements in 5G performance and continued fiber deployments, the U.A.E. secured a leading position in July and August 2024 on the Speedtest Global Index™ for both mobile and fixed broadband services across all technologies — a first since the index’s launch in 2017.

Government support and operators’ investments were vital to achieving this result. For example, the U.A.E’s telecom regulator TDRA waived the fee for 5G frequencies of 3GHz and above for five years, and operators had access to large amounts of spectrum in the 2500-2600 MHz and 3300 MHz-3800 MHz ranges. Furthermore, as of March 2024, local operators e& UAE and du have invested more than $816 million (AED3 billion) in their mobile infrastructure and collectively rolled out more than 11,000 sites.

The neighboring country, Qatar, was in second position with a median 5G download speed of 613.08 Mbps. Operators have been deploying additional sites and activating new 5G carriers in the lead-up to and during the AFC Asian Cup at the beginning of 2024. This helped to achieve significant advancements in 5G network speed in the country from September 2023.

South Korea is considered a pioneer in 5G deployment and adoption of 5G technology, launching the world’s first commercial 5G network in April 2019. The nation’s telecommunication providers have undertaken substantial investments in expanding their 5G infrastructure, supported by governmental initiatives to achieve nationwide coverage exceeding 90% by 2026. According to Speedtest Intelligence data, the median download speed in the first half of 2024 was 524.99 Mbps.

Brazil showcased impressive download speeds at 443.23 Mbps considering its size compared to all other countries featured in the leaderboard. The activation of 5G in July 2022 and access to large amounts of dedicated spectrum, combined with the continuous expansion of 5G services since 2023, propelled the country into the top 4 fastest 5G markets.

5G Performance, Fastest 5G Countries in the World
Source: Speedtest Intelligence® | Q1-Q2 2024
5G Performance, Top Fastest Countries

e& UAE tops the global 5G performance leaderboard

We examined the 5G performance of the top operators globally during Q1-Q2 2024 using Ookla’s Speed Score metric. We considered operators that lead in Speed Score in their domestic markets. The score combines upload and download speed metrics, with download speed contributing 80% and upload speed 20% to the final score. Both upload and download speed components are measured using a modified trimean, which combines speeds from the 10th percentile, 50th percentile (median), and 90th percentile in a weighted average using a 1:8:1 ratio.

e& UAE consistently led in 5G Speed Score, showing a strong upward trend over time, indicating solid and sustained improvement in 5G performance. 5G median download speed steadily increased to 749.63 Mbps during H1 2024, with a peak speed of 1380.54 Mbps. e& UAE’s upload speed performed well, with a median of 43.52 Mbps and a peak performance of 134.78 Mbps.

Since Q1-Q2 2023, Ooredoo (Qatar) has gradually improved its 5G Speed Score, moving to second position in Q1-Q2 2024 with a download speed of 666.14 Mbps. Ooredoo’s upload speed also improved slightly, though less significantly than the download speed. 

LG U+ (South Korea) displayed a relatively stable Speed Score with modest improvements over time. Its download speed reached 546.83 Mbps in H1 2024, and its upload speed followed a similar pattern, with a slight jump during the first half of 2024 to 44.28 Mbps, securing the second position.

Claro (Brazil) experienced a significant rise in Speed Score since H1 2023, following the launch of 5G SA, reflecting the sharp rise in download and upload speeds during that period, before stabilizing at 501.29 Mbps and 38.45 Mbps, respectively, in H1 2024.

Claro‘s Speed Score in Guatemala declined in the second half of 2022 before recovering in the first half of 2024. However, upload speed exhibited a sharp decline throughout 2022 and 2023 before recovering by the end of the period.

The Speed Score of A1 (Bulgaria) declined consistently, along with reduced download and upload speeds, indicating network capacity constraints. However, it achieved the sixth-highest Speed Score in the world, with a median download speed of 439.37 Mbps and a median upload speed of 34.08 Mbps.

5G Performance, Fastest 5G Operators in the World
Source: Speedtest Intelligence® | Q2 2024
5G Performance, Fastest 5G Operators in the World

E& UAE’s leadership in 5G speeds translated into a higher customer satisfaction score

e& UAE emerged as the fastest 5G operator in the U.A.E. during the first half of 2024, achieving a median download speed of 861.52 Mbps, significantly ahead of du’s 651.30 Mbps in Q3 2024. e& UAE’s steady improvement in 5G performance since 2022 boosted the U.A.E’s 5G download speed.

Since 1H 2022, e& UAE has outperformed du in terms of 5G download speeds. From mid-2022 to mid-2023, the performance gap between e& UAE and du widened significantly as e& UAE demonstrated consistent growth in download speeds, reaching 861.52 Mbps in Q3 2024. This growth highlights e& UAE’s substantial investment in infrastructure and success in delivering faster 5G services. 

e& UAE achieved near-nationwide coverage of 5G and deployed 5G SA technology in 2023, first as a fixed wireless access (FWA) solution and subsequently as a mobile service. The deployment of 5G SA enables higher throughput, enhances basic services such as voice, and improves advanced consumer and enterprise applications such as AR/VR and IoT.

5G Performance in the U.A.E.
Source: Speedtest Intelligence® | Q1-Q2 2022 — Q3 2024
5G Performance in the U.A.E.

Net Promoter Score (NPS), a key performance indicator of customer experience, generally positively correlates with improved network performance. Speedtest Intelligence data shows that mobile subscribers who use 5G universally rate their network operators a higher NPS than those on 4G LTE.

The U.A.E. has a similar trend, with 5G users more likely to recommend their operators than those on 4G. e& UAE, recognized as the fastest 5G operator in the market, leads with an NPS of 53.8 in Q1-Q2 2024, outperforming du with an average NPS of 36.7.

5G Net Promoter Scores in the U.A.E.
Source: Speedtest Intelligence® | Q2 2024
5G Net Promoter Scores in the U.A.E.

Competing on 5G speed can help operators be better prepared for 6G

Speed competition remains critical for mobile telecom operators, even though current network capabilities allow users to accomplish virtually any task. The pursuit of higher speeds is not merely a technical ambition; it reflects a commitment to excellence that appeals to both consumers and investors and positions the country as economically competitive on the global stage. 

Speed is also a highly relatable concept for consumers, driving their choice of service providers and stimulating spending. This makes speed an essential marketing tool for operators, who should leverage their network’s performance to maintain customer loyalty and protect their market share.

Beyond its immediate consumer appeal, speed competition plays a crucial role in supporting the development of the broader ICT industry. Speed helps companies stay competitive by leveraging technologies such as AI, cloud, and edge computing to enable real-time decision-making, operational efficiency, and rapid innovation.

In essence, competing in 5G speed is not just about delivering exceptional service today; it’s about laying the groundwork for tomorrow’s innovations, as illustrated by the U.A.E’s recent announcement of its 6G strategy. By investing in scalable and adaptable infrastructure now, operators ensure that they remain at the forefront of technology innovation. This proactive approach to network development also helps operators cultivate the expertise and skills necessary to anticipate market demand better and inform service enhancements and new offerings. Ultimately, telecom operators are building a foundation for long-term success to support next-generation digital services.

Ookla will continue to monitor 5G performance and deployments globally and benchmark countries and operators. For more information about Speedtest Intelligence data and insights, please contact us.

Ookla retains ownership of this article including all of the intellectual property rights, data, content graphs and analysis. This article may not be quoted, reproduced, distributed or published for any commercial purpose without prior consent. Members of the press and others using the findings in this article for non-commercial purposes are welcome to publicly share and link to report information with attribution to Ookla.

| November 4, 2024

Smartphone User Survey Reveals Habits and Frustrations

In a recent study conducted by Omdia and commissioned by Ookla, over 2,000 smartphone users across the U.S. and U.K. were surveyed to learn about consumer usage patterns, satisfaction levels, and pain points. The findings highlight user expectations in each country, from cost concerns to reliable connectivity to fast browsing speeds and more.

Read on for a look at some of the key findings from our study, or you can download our full white paper for a deeper dive into its findings, with in-depth analysis and the complete survey results.

Wi-Fi remains crucial alongside widespread cellular data usage

In a survey focused primarily on smartphone users, the results showed that Wi-Fi continues to play a vital role for all users. This underscores the enduring importance of Wi-Fi in users’ connectivity strategies, even as 5G technology continues to gain traction.

Network outages: a critical issue for user satisfaction

While not the most frequently cited frustration, network outages emerge as a critical issue with far-reaching implications for user satisfaction and loyalty. The survey reveals that outages have a disproportionate impact on customer perceptions and behavior. Respondents strongly considered switching carriers as a result of network outages and emphasized the importance of timely communication from their providers to alleviate frustration and maintain trust.

In such a dynamic and complex connectivity ecosystem, tools like Speedtest® and Downdetector® play vital roles. By providing objective data on network performance and real-time information on service outages, these tools help address many of the key issues highlighted in our survey. For instance, Speedtest data can help providers pinpoint areas for improvement to enhance customer satisfaction and reduce churn, while Downdetector’s outage reporting can help service providers address user concerns about prompt updates during network issues.

Want to explore all of the findings from our latest smartphone survey? Download the white paper to see all of the survey questions, results, and in-depth analysis.

Ookla retains ownership of this article including all of the intellectual property rights, data, content graphs and analysis. This article may not be quoted, reproduced, distributed or published for any commercial purpose without prior consent. Members of the press and others using the findings in this article for non-commercial purposes are welcome to publicly share and link to report information with attribution to Ookla.

| October 21, 2024

GenAI will offer more immersive experiences for consumers and drive network measurement innovation

In the last three years, generative AI (GenAI) has driven most of the hype around AI. Its ability to understand and respond to queries in a human-like way and produce high-quality programming code, music, and video content raises critical questions about network requirements to support these applications and how best to measure network performance. This article covers current and emerging GenAI use cases and discusses the implications of growing consumer adoption on network performance and measurement strategies.

Key Takeaways:

  • The growing adoption of GenAI and its evolution has the potential to disrupt traffic usage patterns significantly. The surge in demand for GenAI and the diversity of the content types it can generate could lead to a significant increase in data traffic and a heightened need for improved bandwidth and latency in the medium to long term. Advancements in data compression and prompting techniques could mitigate demand pressures and lead to less severe outcomes than anticipated.
  • GenAI drives the need for new approaches to measure the quality of experience. The evolution of GenAI from chatbots to real-time conversations with richer and more interactive applications will require a new content distribution infrastructure and unlock new use cases. This will prompt a rethink of how we assess network performance and user experience.
  • Addressing data misuse, misinformation, and mistrust concerns will be crucial for widespread GenAI adoption. As GenAI content becomes more sophisticated, privacy, security, and trustworthiness issues will grow in importance. Establishing robust regulatory and technical safeguards will be vital to building consumer and business confidence in these technologies.

GenAI has captivated users, businesses, and investors alike

GenAI is a small part of AI that specializes in generating novel content using computer models trained on terabytes of existing digital datasets of text, computer code, images, and videos. Despite the recent decline in overall AI private investment, GenAI continues to attract the most funding. Private funding for GenAI surged to $25.3 billion in 2023, nearly nine times the amount raised in 2022. In October 2024, OpenAI, the company behind ChatGPT, the leading GenAI chatbot, raised $6.6 billion in new funding, valuing it at $157 billion despite incurring $5 billion in losses that year.

GenAI is not just capturing the attention of investors; it is also a hot topic among Fortune 500 companies. GenAI was the most frequently cited AI theme on earnings calls, appearing in nearly 20% of all earning calls during 2023. This shows that corporate leaders see significant potential in this technology.

GenAI services have also become very popular among consumers. For example, ChatGPT made headlines with its record-breaking growth. After the release of ChatGPT 3.5 in May 2023, the service reached 100 million users in just 64 days – the fastest-growing consumer application to date. Today, the ChatGPT website attracts over 600 million monthly visitors (down from its peak of 2 billion visits a month), and the service has more than 180 million users. While growth has slowed, ChatGPT is expected to capture 75.2% of GenAI users globally, even as its market share dips due to the rise of many proprietary and open-source alternatives. The U.S. is home to the largest ChatGPT user base, expected to increase to 87.9 million users by 2025.

Businesses are eagerly embracing GenAI for its perceived benefits. A CCS Insight survey found that 82% of U.S. and European companies have already deployed GenAI or plan to do so in the next 12 months. GenAI has been mostly used for administrative-type tasks such as generating draft contracts and summarizing notes, content creation, marketing, and customer support.

The telecom industry is increasingly bullish on GenAI. Operators are using the technology to introduce more sophisticated chatbots that offer a more human-like customer service experience. According to a recent GSMA Intelligence survey, 81% of global telecom operators are currently testing GenAI. While the initial focus is on cost reduction and operational efficiency, GenAI could eventually create new revenue streams by enabling new AI-powered consumer and B2B services. A 2023 McKinsey report suggests that GenAI could boost telecom revenue by 2.3% to 3.7% (as a percentage of total industry revenue), corresponding to an additional $60 to $100 billion. 

The rapid evolution of GenAI services could lead to increased network requirements 

GenAI is a broad category of applications that can generate different types of content. Most users are familiar with large language models (LLM), such as GPT-4, which powers ChatGPT. LLMs are a subset of GenAI trained on vast amounts of text to generate responses in natural language. As such, most current interactions with GenAI services are basic text-based conversations. These conversations are latency-tolerant and do not demand a high throughput since most of the delay is on the server side, where data processing and content generation take place.

The evolution of GenAI, from chatbots to real-time conversations with richer and more interactive content, will require more powerful servers that can process complex requests, do it faster, and send back high-resolution images or videos. In this context, minimizing downlink latency is crucial to maintaining natural conversations between users and GenAI agents. Additionally, download speed becomes essential for sending and rendering media content on users’ devices. In the future, the ease of creating realistic images or videos (or enhancing them) will encourage more people to become content creators and editors. This will enable new use cases that combine real and synthetic content generated on the fly and streamed live. In this scenario, good uplink latency and throughput metrics will be essential to provide viewers with a high-resolution and lag-free experience.

The reduction in the size of the LLM models, the increased optimization of GenAI applications, and the growing power of system-on-chips (SoCs) have given rise to a new generation of GenAI-powered smartphones. Devices such as the iPhone 16 with Apple Intelligence and Samsung Galaxy S24 with Galaxy AI are slowly transforming the way we interact with our phones and consume content, shifting from individual app usage to an ‘app-free’ experience with an intelligent, voice-controlled digital assistant that can draft emails, translate conversations, make a booking, or manage calendars. According to IDC, GenAI smartphones will be the fastest-growing smartphone segment through 2028, with over 234 million units expected to ship in 2024 alone. 

The proliferation of dedicated GenAI applications on smartphones will help to engage more users with GenAI and shift their usage from static to nomadic. While basic tasks will continue to be handled on the device for responsiveness and data privacy, more complex tasks like generating a picture or a video clip will be partially offloaded to a server (similar to Apple’s Private Cloud Compute). In this case, download speed and latency could be paramount to ensuring a good customer experience. Even for offline GenAI usage or when using on a portable processing unit (for example, embedded in a wireless router), mobile users may need to regularly download and update large GenAI models, highlighting the importance of robust cellular download speeds.

There is much uncertainty about GenAI’s overall impact on traffic profiles. The widespread adoption of GenAI media content could significantly disrupt consumer usage patterns, potentially leading to a surge in data traffic that could strain existing network infrastructure. On the other hand, advancements in data compression and prompting techniques could mitigate demand pressures, leading to less severe outcomes than anticipated.

Service providers will need to monitor developments and be prepared to make further investments to upgrade bandwidth and capacity to keep pace with demand and maintain performance levels. If GenAI leads to substantial additional traffic, then operators may ask GenAI service providers to pay their ‘fair share’ use of the infrastructure. 

GenAI drives the need for new service quality metrics and facilitates network optimization for operators

The rise of GenAI is transforming the way we create and consume content. This transformation necessitates new means of collecting network data and methodologies to capture the performance of AI-powered services accurately. Traditional metrics like throughput, packet loss, and jitter remain essential, but new KPIs need to be defined to reflect the ‘perceived quality’ of generated (or enhanced) content. Some aspects that could be considered include the relevance and accuracy of the generated content and the responsiveness of interactive GenAI applications.

The infrastructure required to support the growth of GenAI is likely to be different from traditional content delivery networks (CDNs). Some use cases will support near real-time interaction and require robust data privacy, necessitating edge computing deployment to offload the central cloud-based GenAI servers, reduce latency by processing data closer to the user, and minimize the amount of traffic exchanged between the user and the central server. Therefore, future network measurement approaches should factor in the distributed nature of these edge compute units and redefine latency to include edge processing and content generation time at the edge. 

Operators can use GenAI tools to analyze measurement data, identify patterns, and predict potential issues based on recent incidents. According to a 2023 GSMA Intelligence survey, two-thirds of operators considered troubleshooting and maintenance to be the biggest impact of GenAI. For example, GenAI tools can provide network engineers with automated, tailored network analytics and upgrade recommendations. Ookla is using GenAI in Downdetector Explorer™ to provide network maintenance teams with up-to-date situation reports following service disruptions.

GenAI promises more immersive experiences for consumers while driving network measurement innovation

We are at the beginning of the GenAI revolution, and its potential is undeniable. GenAI promises consumers a more immersive experience, increased engagement, and greater creativity and content sharing. Combining AI-generated text, code, audio, and video could enable highly personalized and hyper-realistic immersive experiences beyond what is currently available. In the medium term, real-time services like video conferencing or gaming could be enhanced with AI-generated content, such as virtual avatars and personalized game characters, pushing network requirements to new heights. This shift will also significantly impact content distribution infrastructure and demand new approaches to moderating content, measuring network performance, and assessing customer quality of experience.

As GenAI content becomes more sophisticated and indistinguishable from human-produced content, concerns around data misuse, the spread of misinformation, and mistrust will grow. Addressing these issues will be crucial for fostering consumer and business confidence, ultimately driving the widespread adoption of AI technologies. In the meantime, GenAI will continue to be deployed with human supervision while we improve their understanding of its risks and limitations and establish regulatory and technical safeguards for its use.

We will continue to follow the development of GenAI and its adoption by consumers and telecom operators to gauge its impact on network performance and optimization. Furthermore, Ookla is actively using GenAI to transform its data into actionable insights and predictive analytics that help providers understand how to deliver better real-world connectivity experiences to consumers.

Ookla retains ownership of this article including all of the intellectual property rights, data, content graphs and analysis. This article may not be quoted, reproduced, distributed or published for any commercial purpose without prior consent. Members of the press and others using the findings in this article for non-commercial purposes are welcome to publicly share and link to report information with attribution to Ookla.

| October 17, 2024

Using Controlled Testing to Complement Crowdsourced Data for Better Insights at Hajj

Nearly 2 million visitors converged on Makkah between 14 and 18 June 2024 to perform the Hajj pilgrimage. As digital connectivity becomes increasingly essential, network performance plays a vital role in ensuring pilgrims can stay in touch with loved ones, access crucial information, and document their journey. However, providing a good network experience during the Hajj season is a big challenge due to the diverse terrain and high population density across multiple locations. The influx of users from different markets with an array of devices, some with outdated technologies, adds to the complexity.

During Hajj 2024, Ookla conducted controlled walk testing across key locations using RootMetrics® to examine how the network expansions and improvements announced by the operators have impacted the pilgrimage experience. Crowdsourced data was overlaid to assess the network’s impact on Quality of Experience (QoE) metrics to gain an even greater picture of the performance improvements.

Examining cellular network performance during the Hajj season

The controlled testing team was equipped with the latest 5G capable handsets, featuring SIM cards from three major operators in the region. A predefined path was tested over four days, covering five locations along the pilgrims’ path (Haram, Mina, Muzdalifah, Arafat, and Jamarat). Each area has its own terrain characteristics, population density, and mobility requirements. Most of the tests were conducted outdoors (68%), except in parts of the Haram (on day 1) and Jamarat (on day 4). 

Testing encompassed various controlled assessments to measure different aspects of network performance and reliability, including:

  • Data throughput download/upload tests
  • Call and SMS tests
  • Secure lite data tests
  • Video tests
Hajj steps and controlled tests itinerary

Controlled plus crowd testing provides a unique perspective

By analyzing network performance across all operators at the same location and the same time, our controlled testing provides accurate benchmarking and unique insights. It also enables us to schedule tests during peak hours to assess networks’ resilience and identify potential bottlenecks. Additionally, it allows for root cause analysis to pinpoint the reasons behind sub-optimal network performance or coverage issues, which may be attributed to configuration problems or inefficient spectrum utilization.

Combining walk test measurements with crowdsourced user experience data can effectively assess the impact of Quality of Service (QoS) parameters on Quality of Experience (QoE) metrics, identify issues, and prioritize improvements. Ookla Consumer QoE™ provides a comprehensive view of real-world consumer network experiences at times and locations that matter most to consumers. This data offers a valuable overlay with the detailed QoS and radio frequency data collected during walk tests.

Learn more about Ookla insights at Hajj

Please get in touch if you would like to know more about network QoS and QoE performance during Hajj 2024 and how it impacted pilgrims’ experience.

Ookla retains ownership of this article including all of the intellectual property rights, data, content graphs and analysis. This article may not be quoted, reproduced, distributed or published for any commercial purpose without prior consent. Members of the press and others using the findings in this article for non-commercial purposes are welcome to publicly share and link to report information with attribution to Ookla.

| October 13, 2024

South Korea Leads Mobile Game Score in East Asia as 5G Drives Improved Mobile Gaming Experience

As 5G networks continue their rapid proliferation across Asia Pacific, it is poised to transform mobile gaming. It has brought faster downloads, smoother gameplay, and more immersive experiences with its fast speeds and minimal lag. This article examines the impact of 5G on mobile gaming experience in the region, in particular within selected East Asia markets.

Key Takeaways

  • South Korea led the Game Score™ in East Asia with 90.06 out of 100 during 1H 2024, followed by China with 85.64 and Japan with a score of 81.85. South Korea also recorded the lowest gaming latency across all technologies in the region, with a median latency of 55 ms, outperforming neighboring markets.
  • 5G addressed the latency and bandwidth challenges of 4G networks for mobile gaming by providing significantly higher bandwidth and speed. In 1H 2024, 5G download speeds were, on average, 4.91 times faster than 4G across East Asia, with South Korean users experiencing 8.45 times improvement over 4G. Latency also improved compared to 4G  across all markets, with South Korea leading the region with a reported latency of 51 ms. 
  • South Korean operators topped East Asia’s 5G Game Score rankings, with all three major carriers achieving scores above 90. LG U+ provided the best gaming experience with a 5G Game Score of 92.56 and a median latency of 49 ms, closely followed by SK Telecom and KT. China Unicom led the Chinese market with a score of 88.73, while Softbank was the top performer in Japan with a score of 87.31. All top operators across East Asia reported strong gaming performance on 5G, with scores over 80.

Asia Pacific at the forefront of global gaming market growth

The global games market, encompassing both mobile and other platforms, generated over $184 billion in revenue in 2023, a year-on-year growth of 0.6%. Notably, the Asia Pacific region continues to lead the gaming sector, contributing a remarkable $84.1 billion to this total. This dominance not only reflects the region’s vibrant gaming culture but also emphasizes its pivotal role in driving the industry’s overall growth. Mobile gaming, in particular, has solidified its position as a dominant force within this market, capturing a significant 49% share and generating approximately $90 billion in revenue in 2023. This surge underscores a fundamental shift in consumer preferences, as gamers increasingly favor mobile devices for their gaming experiences.

Growth in mobile gaming is further fueled by strategic initiatives from governments and mobile operators in various markets, particularly within East Asia. These stakeholders are actively promoting mobile gaming through supportive policies and enhanced connectivity, fostering an environment ripe for innovation and engagement. As a result, East Asia is well-positioned to continue leading the global gaming market in the years to come.

China, as one of the largest gaming markets, is actively supported by government agencies and telecom operators in promoting mobile gaming. The recent lift of the regulatory freeze on approving new games is significantly propelling the growth of the gaming industry, with major players such as Tencent and NetEase leading the way in driving innovation in mobile gaming.

South Korea is another leading nation in the mobile gaming industry, supported by strong government involvement. The Ministry of Culture, Sports, and Tourism has long been sponsoring esports and gaming tournaments like the World Cyber Olympics. The recent initiatives include building infrastructure like the esports stadium in Pangyo, and companies like Netmarble and Nexon dominate the market with government-backed initiatives for global gaming expansion.

In Japan, the government has been actively promoting the gaming industry, including mobile gaming, by providing tax incentives and creating an ecosystem that fosters innovation and esports. Japan’s mobile operators, such as NTT Docomo and SoftBank, have partnered with game developers to enhance cloud gaming experiences, offering services like 5G gaming platforms to ensure smooth, high-speed gaming on mobile devices. 

In Hong Kong, the government has focused on transforming the city into a regional hub for esports and gaming technology. Various public-private partnerships are in place to host major gaming tournaments, elevating Hong Kong’s profile in the regional gaming scene. Similarly in Taiwan, the government is supporting mobile gaming through initiatives focused on the development of esports. The Ministry of Digital Affairs has introduced policies to encourage indie game developers to enter the esports arena, positioning Taiwan as a competitive player in the region’s mobile gaming and esports market.

South Korea leads East Asia in Game Score and has the lowest latency

A smooth mobile gaming experience relies on stable and fast mobile data connections. With real-time multiplayer games becoming the norm, low latency and minimal lag are essential for uninterrupted gameplay. High-speed mobile data ensures quick responses to in-game actions, reducing delays and enhancing immersion, which helps players stay competitive and enjoy a seamless gaming experience.

Our Speedtest Game Score™ is a unique measure to assess consumer gaming experience across different networks. The score takes into account different aspects of a consumer’s gaming experience based on multiple network key performance indicators. Game Score is based on Ookla’s consumer-initiated Speedtest results for download and upload speeds, as well as Consumer QoE’s™ latency and jitter measurements taken to real-world game servers. Each of these components is evaluated and scored on a scale of 0-100,  and are then combined in a weighted average to produce a Game Score. A higher score signifies a better gaming experience for the user.

Overall Game Score™ in Selected East Asia Markets
Speedtest Intelligence® | 1H 2024

Across the East Asia markets, South Korea had the highest Game Scores across all mobile technologies during the first half of 2024 in APAC with a score of 90.06 on a 100-point scale. This is not surprising as South Korea consistently tops Ookla’s Speedtest Global Index mobile performance ranking for Asia Pacific markets. South Korea was followed by China with a score of 85.64 and Japan with a score of 81.85. 

South Korea also stands out with the lowest gaming latency across all technologies compared to the neighboring markets in East Asia. In 1H 2024, South Korea reported a median gaming latency of 55 ms, significantly outperforming the other markets. Japan follows with a median latency of 68 ms, still offering a smooth gaming experience. Meanwhile, China, Taiwan, and Hong Kong show higher latencies of 85 ms, 84 ms, and 87 ms, respectively. These higher latencies suggest potential delays and less fluid gameplay compared to South Korea and Japan. 

5G driving enhanced mobile gaming experience 

The limitations of previous generation mobile networks, particularly in terms of latency and bandwidth, have restricted the full potential of mobile games. 5G has overcome these challenges by offering significantly higher bandwidth and speed than 4G. This advancement enables faster downloads and updates for games, along with smooth streaming of high-quality content. It’s especially beneficial for cloud gaming, especially cloud-based AAA games played on mobile devices, which demand substantial data for a lag-free experience. 

Game Latency, the delay before data transfer starts, is key for gaming. Lower latency equals faster reactions in-game, and 5G’s ultra-low latency removes lag in online games, making gameplay smooth and responsive. Speedtest data shows that for the markets in East Asia, all reported improved latency on 5G compared to 4G, and all markets had latency of below 80 ms during the first half of 2024. South Korea reported the lowest latency on 5G at 51 ms, followed by Japan with 65 ms. Hong Kong and China saw gaming latency improvements of 15 ms on 5G, resulting in latencies of 73 ms and 79 ms, respectively. Enhancements in 5G infrastructure and connecting to a server within a gamer’s own region can enhance overall gaming latency.

Mobile Gaming Performance in Selected East Asia Markets
Speedtest Intelligence® | 1H 2024

While download speed requirements for online mobile gaming vary depending on the game type, faster download speeds ensure smoother gameplay, faster matchmaking, and reduced wait times for content. Several factors influence download speed, including the quality of the mobile network, network congestion, signal strength, and the device’s processing power. A stable and fast connection allows for an optimal gaming experience, minimizing delays and disruptions.

Speedtest Intelligence data from 1H 2024 shows a significant improvement in overall performance when comparing 4G and 5G networks in selected East Asia markets. The median download speed in these markets was, on average, five times faster than the median download speeds of 4G. South Korean mobile users experienced the most significant increase in download performance, with 5G median download speeds reported to be eight times faster than 4G, increasing from 61.11 Mbps to 524.99 Mbps. Taiwan and China both reported median download speeds of more than 200 Mbps and around five times performance improvement, at 265.21 Mbps and 226.93 Mbps, respectively.

Upload speed also plays an essential role in creating a smooth gaming experience without interruptions or quality degradation, particularly in multiplayer games. Across all markets, there is a significant increase in upload speeds with 5G compared to 4G. Notably, South Korea has the largest improvement in upload speeds between 4G and 5G, with 5G offering almost four times higher upload performance. This means that gamers in South Korea could experience the most substantial improvement in gameplay and streaming quality when transitioning from 4G to 5G. In other markets, the switch to 5G resulted in at least a twofold improvement in upload speeds compared to 4G.

South Korean operators top gaming experience in the region

A global leader in 5G adoption, South Korea boasts a thriving mobile gaming industry. With 5G, the country has witnessed a surge in the popularity of esports and cloud gaming services. The Ministry of Culture, Sports, and Tourism has long been sponsoring esports and gaming tournaments like the World Cyber Olympics. Other initiatives include building infrastructure like the esports stadium in Pangyo. Of all the top operators in the markets in East Asia, South Korean operators sit at the top for 5G Game Score in 1H 2024, with all three major operators reported Game Score of above 90.

Top Operators 5G Game Score
Speedtest Intelligence® | 1H 2024

LG U+ provided the best 5G gaming experience in 1H 2024 among all the operators in the market, with a 5G Game Score of 92.56 and a median game latency to key gaming server locations of 49 ms. LG U+ was closely followed by SK Telecom with a 5G Game Score of 92.33 and KT with 90.98.

China Unicom was top for operators from China, the world’s largest mobile gaming market, with a Game Score of 88.73. Softbank leads in terms of 5G Game Score among all the top operators from Japan with a score of 87.31. Overall all the top operators in East Asia reported very good Game Score results, with scores above 80.

5G as a catalyst for cloud gaming services

One of the most significant advancements in mobile gaming is cloud gaming, where games are streamed directly from the cloud, removing the need for high-end hardware. This technology allows gamers to play cutting-edge titles on handheld devices without being bound by hardware limitations, making it possible to experience seamless gaming both indoors and on the go. 

The rollout of 5G networks in East Asia has been a game-changer for cloud gaming. Ericsson’s research shows that two-thirds of gamers rely primarily on mobile networks (4G/5G) or Wi-Fi for cloud gaming, with the most common setup being a smartphone connected via a mobile network. The faster speeds, lower latency, and greater bandwidth offered by 5G are essential to delivering the smooth, responsive experiences cloud gaming demands, placing higher requirements on network operators to ensure consistent quality of service (QoS). 

For the mobile operators in East Asia, the strategy is to use cloud gaming to attract more 5G subscribers. In Hong Kong, CSL partnered with Blacknut, a premium game streaming platform, to provide access to over 500 cloud-based games across multiple devices for a monthly fee. South Korea has also been a leader in cloud gaming, with LG U+ offering GeForce Now, which enables users to stream games directly from servers, and SK Telecom launching SKT 5GX Cloud Game in collaboration with Microsoft, offering a robust library of games via the cloud since 2020.

Tencent, one of the world’s largest gaming companies, partnered with China Unicom to integrate START, a cloud gaming platform designed to deliver high-quality gaming experiences without the need for high-performance devices. This initiative is part of China’s push for 5G and cloud gaming, providing gamers with smooth and immersive gaming experiences through ultra-fast mobile connections.

These initiatives highlight the growing synergy between telecom operators and gaming companies in East Asia. As 5G continues to expand, cloud gaming is poised to become more accessible and reliable, enabling millions of gamers across the region to enjoy high-quality gaming experiences without the need for expensive hardware. This evolution not only enhances the gaming landscape but also drives the demand for robust, high-performance mobile networks, ensuring that 5G will continue to play a central role in the future of cloud gaming.

We will continue to monitor mobile gaming performance across Asia Pacific. For more information about Speedtest Intelligence data and insights, please contact us.

Ookla retains ownership of this article including all of the intellectual property rights, data, content graphs and analysis. This article may not be quoted, reproduced, distributed or published for any commercial purpose without prior consent. Members of the press and others using the findings in this article for non-commercial purposes are welcome to publicly share and link to report information with attribution to Ookla.

| July 29, 2024

Faster Speeds and the Promise of New Use Cases is Driving 5G SA Adoption

The deployment of 5G networks is progressing as demand for faster and more reliable connectivity continues to grow. The standalone (SA) deployment model marks a significant milestone in the evolution of 5G, aiming to offer lower latency, increased bandwidth, and improved reliability compared to earlier network configurations. In this article, we use Ookla Speedtest Intelligence® data to track 5G SA deployments since Q2 2023, 5G SA service adoption, and examine its impact on network performance. We also highlight key regions and countries that made notable advancements in 5G SA infrastructure.

Key Takeaways:

  • India, the U.S., and Southeast Asia are at the forefront of 5G SA adoption. T-Mobile and SK Telekom were among the first to launch 5G SA in 2020, while Chinese operators and Jio in India lead in terms of active 5G SA users. Europe somewhat lags, with operators still hesitant due to the relatively low ROI on existing 5G investments and unclear business cases for 5G SA. However, Europe has the highest number of operators planning to launch it.
  • The U.A.E. and South Korea lead the world in 5G SA performance. 5G SA download speeds reached 879.89 Mbps and 729.89 Mbps, respectively. Their 5G SA upload speeds were also impressive, at 70.93 Mbps and 77.65 Mbps, respectively. This performance is a result of significant advancements made by local operators in deploying 5G SA and testing advanced features such as network slicing and mobile edge computing (MEC).
  • The change in speed of 5G SA varied widely between countries over a year. Speedtest Intelligence data shows that 5G SA performance declined in many countries between Q2 2023 and Q2 2024, primarily driven by increased user base and network traffic. Conversely, markets such as Canada and the U.S. improved their performance thanks to access to additional spectrum.

5G SA deployments are expected to increase this year as adoption gains momentum and ecosystem matures

Most existing 5G deployments use the non-standalone (NSA) model which uses the 4G core network. This model is faster to roll out, requires less investment, and maximizes existing network assets. Unlike 5G NSA, 5G SA uses a dedicated 5G core network, unlocking the full capabilities of 5G with better speed, latency, support for large numbers of devices, and more agile service creation. It also enables new features such as network slicing where an operator can dedicate a network segment to specific customers or use cases. Furthermore, the core network functions provided by a cloud-native architecture enable more scalability and automation than physical or virtualized architectures. However, this comes with higher infrastructure complexity, investment as well as staff training costs.  Many operators use NSA as a stepping stone towards SA, with a few exceptions, such as DISH in the U.S. and Jio in India, which adopted SA from the outset. Other scenarios for deploying 5G SA include an overlay for a public 5G NSA network or as a private network for enterprise use cases. 

The Global Mobile Suppliers Association (GSA) identified 130 operators that had invested in public 5G SA networks as of the end of June 2024. 5G SA represented more than 37% of the 614 operators known to have invested in 5G either through trials or deployments. The GSA reported 1,535 commercially available devices, including handsets and fixed wireless access (FWA) customer premises equipment (CPEs), that support 5G SA, demonstrating the growing maturity of the device ecosystem. 

However, only 11 new 5G SA deployments in nine countries were recorded (out of 46 new 5G networks launched in 32 countries) in 2023, according to Analysys Mason, showing a slowdown in deployments. We expect the pace of 5G SA launches to accelerate in 2024 and beyond supported by the growing device ecosystem and commercial appetite for new 5G use cases. 

To identify where 5G SA access has been activated and the network expanded between Q2 2023 and Q2 2024, we used Speedtest Intelligence® data to identify devices that connect to 5G SA. The maps below confirm that the number of 5G SA samples increased year-on-year and that coverage has expanded beyond urban centers. However, mobile subscribers in most of Africa, Europe, Central Asia, and Latin America have yet to experience 5G SA.

In the following sections, we examine the year-on-year changes in 5G SA performance across different regions and identify which countries are leading in the Developed Asia Pacific, the Americas, Emerging Asia Pacific, and Europe.

The developed Asia-Pacific (DVAP) region is at the forefront of 5G SA launches

Operators in this region boast 5G SA networks, with launches happening as early as 2020. Strong government support, operators’ technology leadership, and a high consumer appetite for high-speed internet services drove this rapid adoption.

South Korea is considered a pioneer in the adoption and deployment of 5G technology, with SK Telecom deploying one of the first 5G SA services in H1 2020, and supporting advanced features such as network slicing and mobile edge computing (MEC). Speedtest Intelligence data shows that the country led the region in download and upload speeds in Q2 2024. South Korea has one of the highest median speeds among the countries analyzed at 729.89 Mbps (download) and 77.65 Mbps (upload). The other top-performing country is the U.A.E with a median download speed of 879.89 Mbps and a median upload speed of 70.93 Mbps. 

All three service providers in Singapore commercialized 5G SA services, covering more than 95% of the country. Users experienced excellent download speed with a median value of 481.96 Mbps. However, Singapore lagged in upload speed with a median value of 32.09 Mbps.

Macau and Japan are second and third in the region with median download speeds of 404.22 Mbps and 272.73 Mbps, respectively. Mainland China followed with a median speed of 236.95 Mbps. Policies and initiatives such as network-sharing agreements and government subsidies supported 5G growth.

In Australia, TPG Telecom launched its 5G SA network in November 2021, following Telstra’s announcement in May 2020. However, the country lagged behind its regional peers with median download speeds and upload speeds of 146.68 Mbps and 17.69 Mbps, respectively.

The performance of most reviewed DVAP countries remained largely stable or slightly declined between Q2 2023 and Q2 2024. The only two exceptions are South Korea and Australia where performance improved by 12% and 18%, respectively. The most substantial declines were observed in upload speeds, while South Korea stood out with a 17% boost in performance.

5G Standalone Network Performance, Select Countries in Developed Asia Pacific
Source: Speedtest Intelligence® | Q2 2023 – Q2 2024
5G Standalone Network Performance, Select Countries in Developed Asia Pacific

T-Mobile and DISH Push 5G SA Coverage in the U.S.

In the U.S., T-Mobile launched its 5G Standalone (SA) network over 600 MHz spectrum in August 2020, becoming one of the first operators in the world to do so. This was followed by a faster service over 2.5 GHz mid-band spectrum in November 2022 which helped the operator to maintain its national lead in 5G performance. On the other hand, Verizon extensively tested 5G SA in 2023 but so far has been slow to deploy a nationwide SA network. DISH, another notable 5G SA operator, pioneered a cloud-native Open RAN-based 5G SA network in June 2023 and expanded coverage to 73% of the population by the end of that year. In Canada, Rogers Wireless launched the first 5G SA at the beginning of 2021, a year after introducing 5G NSA. 

In Brazil, the median download and upload speeds reached 474.65 Mbps and 32.36 Mbps in Q2 2024, respectively, exceeding those in Canada and the U.S. The main operators in Brazil, Claro, Telefonica (Vivo), and TIM have launched 5G SA over the 3.5 GHz band, making the service available to a large proportion of the population.

While download and upload speed improved in Canada and the U.S. between Q2 2023 and Q2 2024, according to Speedtest Intelligence, it declined in Brazil. The deployment of C-band has likely helped to increase download speed in both Canada and the U.S.

5G Standalone Network Performance, Select Countries in the Americas
Source: Speedtest Intelligence® | Q2 2023 – Q2 2024
5G Standalone Network Performance, Select Countries in the Americas

India leads in the Emerging Asian Pacific (EMAP) region with fast expansion to 5G SA network

India is at the forefront of the Emerging Asian Pacific region’s rapid 5G Standalone (SA) network expansion. However, according to Ookla’s Speedtest data for Q2 2024, the Philippines surpasses both India and Thailand with a median 5G SA download speed of 375.40 Mbps. Globe, the first mobile operator to introduce 5G Non-Standalone (NSA) in the Philippines, expanded its 5G outdoor coverage to 97.44% of the capital by the end of H1 2023. The company also launched 5G SA private networks in 2023, along with network slicing.

India follows closely behind the Philippines, with a median download speed of just under 300 Mbps. Jio has been a leader in enhancing 5G SA coverage since its launch in October 2022, while Bharti Airtel initially opted for NSA, with plans to transition to full 5G SA. 

Jio’s rapid coverage expansion and high throughput are supported by its access to mid-band (3.5 GHz) and low-band (700 MHz) frequencies. Additionally, all new 5G handsets released in India are SA-compatible, boosting the adoption of 5G SA services, and more than 90% of them support carrier aggregation and Voice over New Radio (VoNR). 

Thailand lags behind in median download speed for Q2 2024 but outperforms India and the Philippines in upload speed. It was among the first countries in the region to introduce 5G services, with operators quickly expanding coverage to reach over 80% of the population. AIS, the leading operator in Thailand, launched 5G NSA services in February 2020 using 700 MHz, 2.6 GHz, and 26 GHz bandwidths, followed by 5G SA in July 2020. The operator enabled VoNR in 2021. 

Unlike the DVAP region, countries in EMAP have experienced a more substantial decline in 5G SA network performance compared to Q2 2023. The rapid coverage expansion and adoption have likely increased the load on 5G SA infrastructure, putting pressure on the operators to scale up network capacity in the future to at least maintain a similar performance level.

5G Standalone Network Performance, Select Countries in Emerging Asia Pacific
Source: Speedtest Intelligence® | Q2 2023 – Q2 2024
5G Standalone Network Performance, Select Countries in Emerging Asia Pacific

Europe is home to the highest number of operators looking to deploy 5G SA

A growing number of European operators are offering or planning to offer 5G SA, driven by a maturing device ecosystem. However, many remain hesitant due to cost and the need to demonstrate clear business cases for 5G SA. GSMA Intelligence reports that Europe has the highest number of planned 5G SA launches, with 45 operators planning to deploy it as of Q1 2024.

Elisa in Finland was one of the first operators in the region to launch 5G SA in November 2021. Other notable examples of SA implementations include Vodafone in Germany (April 2021) and the UK (June 2023), Bouygues Telecom (2022) in France, Three in Austria, Wind Tre in Italy (both in 2022), Orange and Telefónica in Spain, and TDC Denmark in 2023. 

The recent 5G SA launch in Spain may explain why that country saw such high speeds, with Speedtest Intelligence reporting download and upload speeds of 614.91 Mbps and 56.93 Mbps, respectively, in Q2 2023. However, Spain experienced a significant drop in performance in 2024, with speeds falling to 427.64 Mbps (download) and 30.55 Mbps (upload). Despite this decline, Spain continued to outperform the UK and Germany.

5G Standalone Network Performance, Select Countries in Europe
Source: Speedtest Intelligence® | Q2 2023 – Q2 2024
5G Standalone Network Performance, Select Countries in Europe

While 5G SA deployments appear to have slowed in 2023 compared to previous years, we expect momentum to increase from 2024 due to rising enterprise demand for private networks and interest in network slicing, as well as consumer demand for immersive gaming and VR applications.  The ecosystem’s maturity and the availability of more network equipment and devices supporting 5G SA will also stimulate the market. According to the GSA, 21% of operators worldwide investing in 5G have included 5G SA in their plans.

Interestingly, the growing popularity and adoption of 5G SA have impacted its performance, with many markets seeing some degradation compared to 2023, according to Speedtest Intelligence.  Nonetheless, 5G SA still offers a markedly faster download speed than 5G NSA. Beyond speed, 5G SA promises new capabilities, such as network slicing, that have started to emerge in the most advanced markets but will take time to become a reality for most consumers and enterprises worldwide.

We will continue to track the deployments of 5G SA and monitor their impact on network global performance. For more information about Speedtest Intelligence data and insights, please contact us.

Ookla retains ownership of this article including all of the intellectual property rights, data, content graphs and analysis. This article may not be quoted, reproduced, distributed or published for any commercial purpose without prior consent. Members of the press and others using the findings in this article for non-commercial purposes are welcome to publicly share and link to report information with attribution to Ookla.

| September 26, 2024

How Pontificia Universidad Católica del Perú used Ookla for Good™ to Enhance their Data Analytics Diploma Program [Case Study]

AI PUCP (Artificial Intelligence Group from Pontificia Universidad Católica del Perú) is dedicated to advancing education and practical skill development in data analysis. As part of their Data Analytics diploma program, the “Programming for Exploratory Data Analysis” course utilizes Ookla for Good’s open datasets to teach students about network performance. By integrating this data into their curriculum, PUCP provides students with invaluable hands-on experience in analyzing mobile network connectivity. This collaboration not only enhances students’ technical skills but also supports efforts to address connectivity challenges, such as the digital divide, in Peru.

Situation

The “Programming for Exploratory Data Analysis” course at Pontificia Universidad Católica del Perú is designed to equip students with the skills to analyze and interpret complex datasets. It starts by learning Python from scratch and then moves on to different types of data, including building Recommendation Systems, analyzing Text data, manipulating Network datasets, solving Optimization Problems and one week is specifically focused on Geographical Data. On that topic, Lecturer Cristhian Castro Chávez wanted to give his students relevant and insightful data they could explore, allowing them to apply the skills they had gained throughout the course.

Given the telecommunications and engineering backgrounds of many of the students, using real-world data is crucial for developing their future skills. Providing students with complex and applicable datasets is essential for their learning experience; however, sourcing and integrating such data into the course curriculum can be challenging. Educational institutions and professors often struggle to find datasets that are both insightful and representative of real-world situations.

Read the full case study here (available in English and Spanish).

Ookla retains ownership of this article including all of the intellectual property rights, data, content graphs and analysis. This article may not be quoted, reproduced, distributed or published for any commercial purpose without prior consent. Members of the press and others using the findings in this article for non-commercial purposes are welcome to publicly share and link to report information with attribution to Ookla.

| September 17, 2024

Mapping Internet Connectivity Inequality in Cities around the World

In today’s urbanized and digitized world, broadband connectivity is as crucial as basic utilities. However, significant disparities in broadband quality still remain, and this chasm is contributing to the creation of a new generation of digital inequalities. As a result, understanding the geographic distribution of broadband availability and quality is essential for crafting policies that ensure equitable digital access.

The Joint Research Centre of the European Commission recently published a research utilizing mobile and fixed broadband performance data from the Ookla for Good™ program. Their study focused on the issue of digital inequality by exploring the quality of broadband connectivity across urban centers globally. Key research questions in their study focused on the following:

  • Do urban centers in higher-income countries enjoy better mobile and fixed broadband quality compared to lower-income countries?
  • Are more populous urban centers better connected?
  • What is the relationship between population dynamics and broadband speed in urban centers?

To address these questions, the European Commission’s Joint Research Centre leveraged a combination of traditional and emerging data sources, including Ookla’s Speedtest® data:

  • Remote sensing data and official population statistics (Global Human Settlement Layer or GHSL).
  • Country borders and income data (Global Administrative layer, GADM, and World Bank).
  • Global broadband speed data (Speedtest® by Ookla®, using data from 2021).

Key findings

The research revealed stark geographic and income disparities in internet download speeds, underscoring the urgent need for targeted policies to bridge the digital divide — especially considering that urban centers are already the places where most people live.

Cities in 125 countries fall below the global median download speed of 86.45 Mbps as of 2021 (which has since increased to 93.93 Mbps in June 2024). In fact, entire regions — such as Africa — lag significantly, with median speeds in countries like the Central African Republic and Eritrea below 3 Mbps.

Regional and income group variations

Broadband speeds vary significantly by region and income group. About 40% of urban centers have connectivity exceeding 100 Mbps, while 60% are split between 0–30 Mbps and 30–100 Mbps. Over 70% of urban centers with speeds below 30 Mbps are in Africa, Central, and Southern Asia. To address these disparities, policies should focus on both expanding access to connectivity and improving speeds in underserved areas.

Connectivity and affluence

A strong correlation exists between connectivity and affluence. High-income countries enjoy significantly better broadband speeds. In contrast, lower-middle-income countries struggle, with 51% of urban centers in the 0–30 Mbps download speed range. Investment in digital infrastructure in these countries is crucial to support economic development and competitiveness.

Map: Countries showing the lowest and hightest distance from median Download Speeds

Figure 1. Map of world countries shaded in blue represent areas with fixed broadband download speeds above the global median fixed download speed of 86.45 Mbps in 2021, while areas shaded in red are below the global median. Dark colors highlight countries showing the lowest and highest distance from median value. Source: Authors’ elaboration on Ookla Speedtest Intelligence data from 2021.

Mobile vs. fixed broadband

High-speed mobile networks are more widespread than fixed broadband, with Ookla® data showing that mobile connectivity was more widely available than fixed broadband solutions in urban centers. While the global median download speed for fixed broadband networks (86.45 Mbps) surpasses that of mobile connections (33.5 Mbps), in many Global South countries, mobile broadband is more affordable and performs better than fixed broadband networks. Policymakers should therefore consider promoting mobile broadband as a cost-effective solution to bridge the digital gap.

Income and urbanization as drivers of connectivity

Income and urbanization drive access to better and faster connections. Larger urban centers, even in lower-income countries, tend to have faster broadband. This suggests that policies aimed at urban development should include comprehensive digital infrastructure plans to ensure all urban residents benefit from high-speed connectivity.

Three key observations of internet speeds across the world

The research identified three primary connectivity scenarios that were observed in countries across the world:

  1. Symmetrical speeds: Some countries, like Sweden, have symmetrical high-speed connections, while others, like Burundi, have symmetrical speeds but slower connections.
  2. Faster fixed network speeds: Countries like India and Brazil benefit from existing infrastructure that supports higher fixed network speeds.
  3. Faster mobile network speeds: Regions in West and South Africa and Southeast Asia often have faster mobile network speeds due to rapid urban growth favoring mobile infrastructure deployment.

Map: Urban Centers Classified by Mobile Network Connectivity Speed and Population Size Class

Figure 2. Map of urban centers classified by mobile network connectivity speed and population size class. Source: Authors’ elaboration on Ookla data from 2021.

Looking ahead

The European Commission’s Joint Research Centre’s research highlights significant disparities in broadband quality across urban centers, driven by geographic, economic, and infrastructural factors. Policymakers must prioritize investments in digital infrastructure, particularly in underserved regions, to ensure equitable access to high-quality broadband connectivity.

After all, bridging the digital divide is not just about technology; it’s also about fostering inclusive economic growth and ensuring that all urban residents can participate in the digital economy. To learn more about this important work, read the complete article from the Joint Research Centre of the European Commission. 

The role of Ookla for Good™

At Ookla, we are proud to support research like this through our Ookla for Good initiative. The mission of Ookla for Good is to bring fast and reliable internet access to every person, regardless of location or socioeconomic status. 

That’s why we make this data available on a complimentary basis to policymakers, humanitarian organizations, academic research institutions, journalists, and consumers. The work we do with our partners is more significant than just improving internet speeds; we aim to leave a lasting impact on the communities we support worldwide.

We are grateful to Patrizia Sulis and colleagues (Michele Melchiorri, Paola Proietti, Marcello Schiavina, Alice Siragusa) for their work with our data within the European Commission’s paper and guidance in composing this article. For more information, please contact Patrizia Sulis – Spatial Data Scientist – Joint Research Centre, European Commission. And to read the full study, be sure to check out their article:

  • (2024) Integration of Remote and Social Sensing Data Reveals Uneven Quality of Broadband Connectivity Across World Cities. In Urban Inequalities from Space: Earth Observation Applications in the Majority World (pp. 13-31). Cham: Springer International Publishing.

To learn more about Ookla for Good and inquire about partnership opportunities, visit the Ookla for Good page on our website.

Ookla retains ownership of this article including all of the intellectual property rights, data, content graphs and analysis. This article may not be quoted, reproduced, distributed or published for any commercial purpose without prior consent. Members of the press and others using the findings in this article for non-commercial purposes are welcome to publicly share and link to report information with attribution to Ookla.

| September 16, 2024

How RTMC used Ookla’s Data Services to Empower Uzbekistan’s Digital Transformation [Case Study]

The telecommunications landscape in Central Asia is evolving rapidly, and Uzbekistan has risen to the challenge with its ambitious Digital Uzbekistan 2030 plan. This comprehensive national strategy aims to improve the country’s digital infrastructure, increase the efficiency of government services, and foster innovation and economic growth through the integration of modern technologies.

The Republican Telecommunications Management Center of Uzbekistan (RTMC), responsible for implementing this strategy, recognized that data-driven decision making and real-time connectivity performance data were crucial for success. RTMC turned to Ookla’s Speedtest Intelligence® data, which has played a key role in Uzbekistan’s journey, particularly in the implementation of 5G technology and the overall improvement of connectivity in the country.

Situation

As RTMC began implementing Digital Uzbekistan 2030, they encountered a significant challenge: a lack of objective, real-time network performance data to show progress and evaluate user experiences.

A key objective of the strategy was ensuring a widespread penetration of 5G technology throughout the country, but RTMC needed a way to evaluate 5G deployments and performance. Traditional methods of on-site measurements proved to be sporadic and often not comprehensive enough to provide a clear picture of the evolving telecommunications landscape.

Read the full case study here (available in English and Russian).

Ookla retains ownership of this article including all of the intellectual property rights, data, content graphs and analysis. This article may not be quoted, reproduced, distributed or published for any commercial purpose without prior consent. Members of the press and others using the findings in this article for non-commercial purposes are welcome to publicly share and link to report information with attribution to Ookla.