| November 26, 2024

5G is Contributing to Improving MTN's Network Performance in West and Central Africa

This article examines the mobile performance of select MTN subsidiaries and joint-venture (hereafter referred to as “opcos”) across five of its nine markets in West and Central Africa (WCA). We look at how these opcos’ performance compares with each other and how it evolved between Q2 2022 and Q2 2024, analyze the factors that impacted their performance, and discuss their 5G plans.

Key Takeaways:

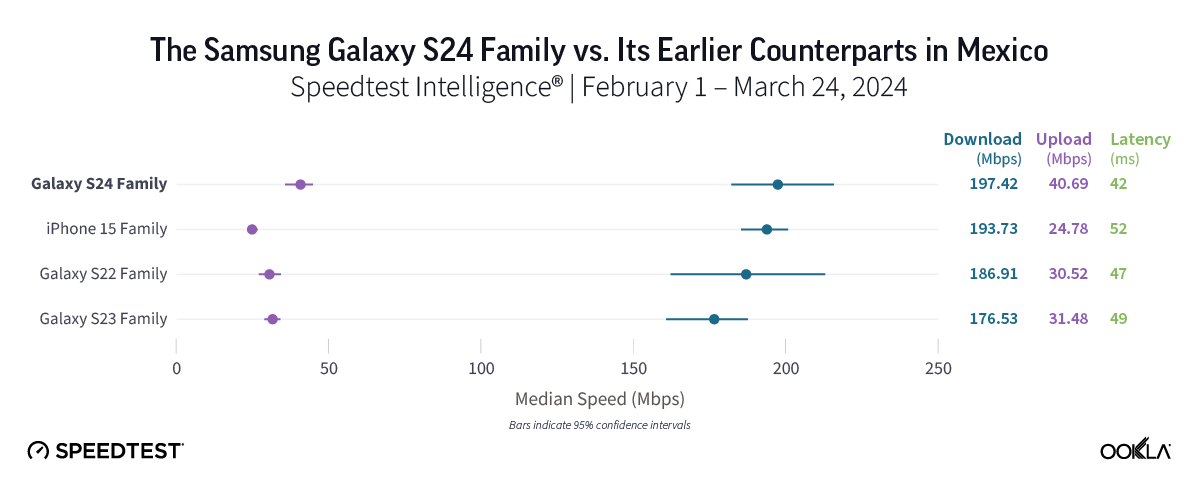
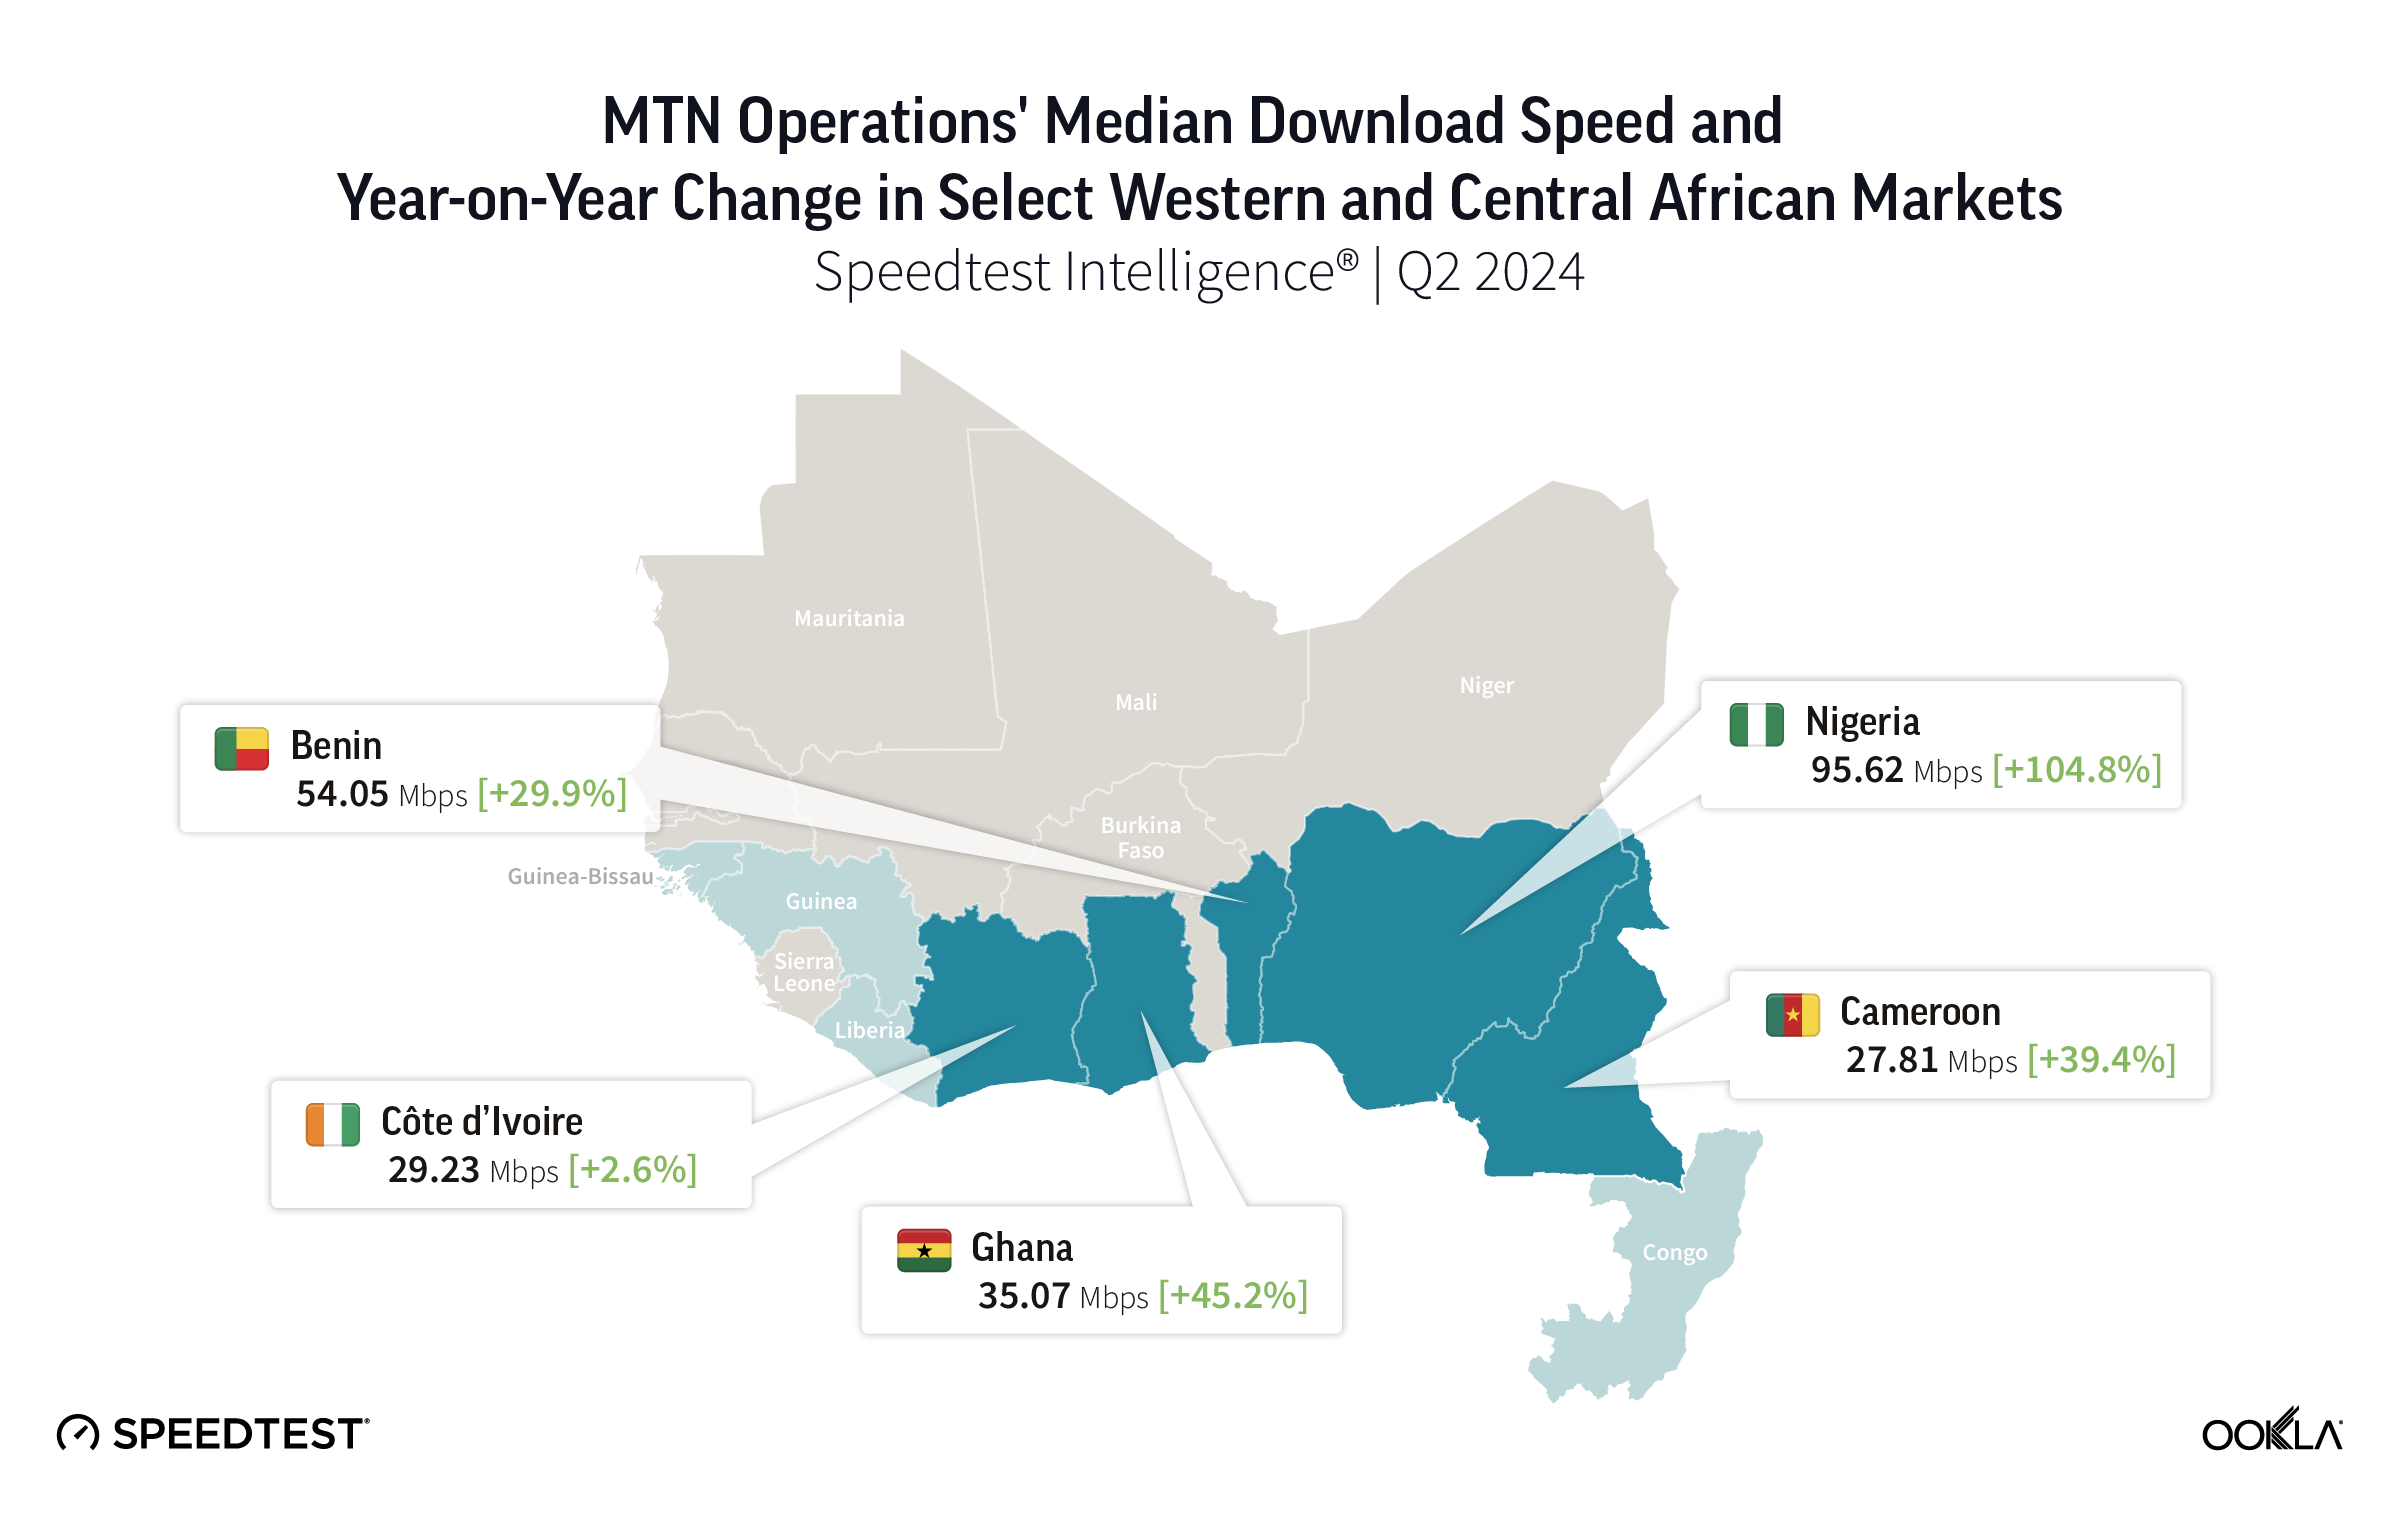
  • Nigeria leads MTN opcos in West and Central Africa (WCA) in mobile download speed for handsets with modern chipsets, according to Speedtest Intelligence®. In Q2 2024, MTN Nigeria significantly widened its lead over the other opcos in WCA in terms of download speeds, reaching 95.62 Mbps. MTN Nigeria also excelled in median upload speed at 17.01 Mbps, closely followed by MTN Ghana at 16.74 Mbps.
  • Despite challenging macroeconomic and operational conditions, MTN opcos in WCA  improved their network performance. While all reviewed MTN opcos rose in performance since Q2 2022, Nigeria and Ghana stood out by moving up the most in download and upload speed rankings over the last 2 years. The two opcos were also the front runners for median multi-server latency, with Ghana achieving this without launching 5G.
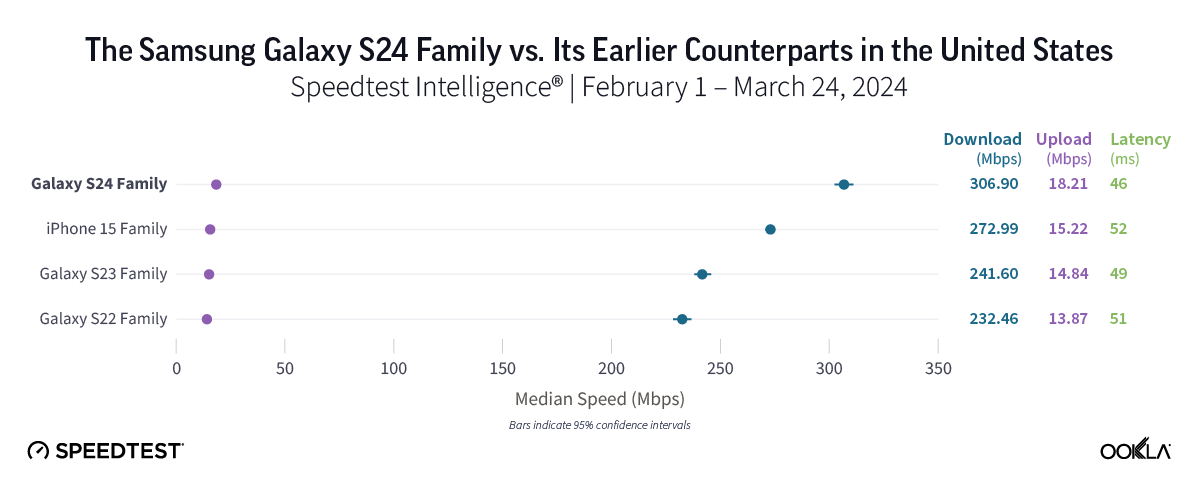
  • 5G service availability in Nigeria has significantly improved over the last 18 months. Speedtest Intelligence shows that 5G Service —a geospatial measure of the percentage of an operator’s known locations with 5G service— in Nigeria increased from 17.2% in Q1 2023 to 35.70% in Q2 2024, surpassing South Africa’s 31.6%.

MTN aims to continue investing in new network technologies and bridging the broadband coverage divide to remain competitive

MTN is the largest operator group in Africa operating in 15 markets, offering voice, data, fintech, digital, enterprise, and wholesale services to nearly 300 million fixed and mobile subscribers. MTN Group’s service revenue grew by 13.5% to ZAR210 billion ($11.1 billion), driven by data revenue of ZAR 84 billion ($4.5 billion) and voice revenue of ZAR 83 billion ($4.4 billion).

African countries in the MTN footprint face economic and political challenges, including slowing growth, high inflation, currency devaluation, and political instability in neighboring countries. These conditions dampen investment appetite and increase the cost of doing business. However, the large, fast-growing, and youthful population combined with low levels of data and digital adoption offer significant growth opportunities for telecom operators like MTN.

Map of MTN Operations' Median Download Speed and Year-on-Year Changes in Select Western and Central African Markets

In 2023, service revenue from West and Central Africa (WCA) accounted for 63.6% of the Group’s revenue. Data revenue surged by 51.3% (excluding Nigeria) and by 38.6% in Nigeria, driven by increased data users and traffic and supported by network investments.

At the beginning of 2021, MTN announced its Ambition 2025 strategy to provide ‘leading digital solutions for Africa’s progress’. This growth strategy’s objective is to double the number of consumer mobile data users to 200 million and home broadband customers to 10 million by 2025, achieve 95% broadband population coverage, and ensure data contributes to half of the Group’s total revenue. This strategy is supported by network expansion, modernization, and improved service affordability.

In the following sections, we analyze MTN opcos’ performance in WCA and review their network deployment plans, including 5G. 

Nigeria delivered the fastest median download speed in Q2 2024 across MTN opcos in WCA

In a previous article, we found that MTN performed best among other operator groups in Sub-Saharan Africa during Q2 2022. For the current analysis, we use Speedtest Intelligence data to compare mobile performance between Q2 2022 and Q2 2024 on modern chipsets across select five (out of nine) MTN opcos in WCA. 

Our results show that Nigeria led MTN’s opcos in WCA in median download speeds, achieving 95.62 Mbps in Q2 2024. Nigeria along with Ghana, more than tripled their median download speeds within two years. Benin, Cameroon, and Nigeria saw greater jumps in download speeds between 2023 and 2024 compared to the previous year.

Generally, all opcos saw more modest improvements in upload speed compared to download speeds. MTN Nigeria led the group with a median upload speed of 17.01 Mbps in Q2 2024, closely followed by MTN Ghana at 16.74 Mbps. Both countries significantly increased their upload speeds between Q2 2022 and Q2 2024. 

Cellular Network Performance, Select MTN Operators in West and Central Africa
Source: Speedtest Intelligence® | Q2 2022 – Q2 2024
Cellular Network Performance, Select MTN Operators in West and Central Africa

MTN Nigeria outperformed the other opcos in the region with a substantial margin in median download speed. Its upload speed also saw a remarkable recovery with an impressive 17.01 Mbps in Q2 2024.

MTN Benin’s download speed significantly increased between Q2 2022 and Q2 2023, plateauing around 56 Mbps. It then slightly declined during H1 2024, maintaining its position as the second-fastest opco in WCA.

MTN Ghana made an impressive turnaround, climbing from the bottom to among the top three operators in download and upload speeds. Its download speed increased more than 3x (similar to Nigeria’s improvement rate), and its upload speed more than doubled over the two years to Q2 2024. This improvement was partly due to MTN’s investments in network infrastructure and high smartphone penetration among its subscribers (63.8%) in 2023.

MTN Côte d’Ivoire, the second-largest mobile operator in the country, saw modest performance improvements until the end of 2023. Then download speeds peaked at 39.49 Mbps in Q1 2024, around the start of the African Football Championship (CAN), but fell to 29.23 Mbps in Q2 2024. Upload speeds also improved, but not as significantly as download speeds. MTN Cameroon showed the smallest network performance improvement over the two years, ending at the bottom of the pack.

MTN Ghana and Nigeria were the front runners for median latency, maintaining a tight range of approximately 42 ms to 54 ms between Q2 2022 and Q2 2024. Opco latency in Benin and Côte d’Ivoire fluctuated between a low of around 38 ms and a high of 143 ms. MTN Cameroon consistently had higher latency, over 230 ms, throughout the period.

MTN Nigeria could further solidify its leadership in Africa by expanding 5G coverage and boosting adoption rates

Nigeria, the continent’s most populous country, boasts the largest mobile market, with 217.5 million subscribers in 2023. Following regulatory impacts from the two SIM campaigns in 2017 and 2021, market growth resumed and is projected to continue into 2024. The country presents significant growth opportunities for data services, with internet penetration reaching 45.4% in 2023

However, Nigeria faces economic challenges, including currency depreciation, high inflation, and a shortage of hard currency. Operational challenges such as fuel shortages, infrastructure vandalism, and regional unrest also impede infrastructure expansion and maintenance. Despite these hurdles, MTN Group announced in 2023 its ambition to invest $3.5 billion in Nigeria over the next five years.

MTN was the first operator to launch 5G in Nigeria, followed by Airtel and ISP Mafab Communications in June and January 2023, respectively. By December 2023, MTN Nigeria’s 5G network covered 11.3% of the population. However, according to the Nigerian Communications Commission (NCC), Nigeria had 2.3 million 5G subscribers by the end of 2023, representing just 1.04% of the total 224.7 million active mobile subscribers.5G coverage has improved over the last 18 months. Speedtest Intelligence shows that 5G Service —a geospatial measure of the percentage of an operator’s known locations with 5G service— in Nigeria increased from 17.2% in Q1 2023 to 35.70% in Q2 2024, surpassing South Africa’s 31.6%. MTN invested $120 million to raise 5G network coverage from 3% to 11%, extending service to key cities in all six regions, but further expansion is needed.

Speedtest Intelligence’s 5G Availability data, which measures the percentage of users with 5G-capable devices who spend most of their time on a 4G or 5G network, indicates an upward trend in Nigeria to reach 13.9% in Q2 2024, reflecting increased service activation and adoption. However, the level remains low compared to South Africa, which reached 31.3% in Q2 2024. Customers may hesitate to activate 5G due to data usage and battery life concerns. MTN can address these concerns by offering affordable data plans and financing options to facilitate the acquisition of newer, more energy-efficient devices.

5G Service and 5G Availability, Nigeria
Source: Speedtest Intelligence® | Q1 2023 – Q2 2024
5G Service and 5G Availability, Nigeria

Apart from Nigeria, MTN’s 5G rollout plans in West and Central Africa are progressing slowly

Côte d’Ivoire is the only other country in the region where MTN launched 5G services. The rollout coincided with the African Football Championship (CAN) in January 2024, covering Abidjan and several major cities. Despite network rollout delays and logistics bottlenecks in 2023, MTN also upgraded its 4G networks in late 2023 in preparation for the football competition. The local telecom regulator, ARTCI (Autorite de Regulation des Telecommunications de Côte d’Ivoire), considered introducing network sharing to expedite 5G deployment, similar to the model adopted in Malaysia, but there have been no updates on this plan so far in 2024.

In the rest of the WCA region, MTN has conducted 5G pilot projects, such as in the Republic of Congo (Congo-Brazzaville) but remains committed to investing in 4G infrastructure to enhance accessibility. In Cameroon, MTN has been expanding its network capabilities and testing 5G since 2021. In 2023, it committed $200 million over three years towards network services. MTN has also pledged to invest $215 million over the next three years in Benin to develop its 5G infrastructure following successful trials. 

In Ghana, MTN initially announced its readiness to roll out 5G in 2022, but the National Communications Authority (NCA) did not grant it the license, considering a shared infrastructure approach. Macroeconomic challenges, including slowed-down economic growth, high inflation (averaging 40.3% in 2023), and currency devaluation (down 34.5% against the US dollar), have also delayed the 5G rollout. In May 2024, the Ghanaian government partnered with seven industry players (excluding MTN) to establish the Next-Gen Infrastructure Company (NGIC) to deploy the infrastructure and launch 5G services within six months. However, concerns have been raised over the lack of transparency around this partnership. NGIC eventually launched 5G on the first of November, 2024. Finally, MTN confirmed its plan to exit Guinea-Bissau and Guinea-Conakry due to high risk and limited growth.

This analysis shows that mobile network performance has improved significantly in some key West and Central African markets. The impact of 5G has so far been limited to Nigeria as it is still in its early stages in most of the region. MTN is keen to expand 5G coverage to the rest of its footprint, following the examples of Nigeria and Côte d’Ivoire, while continuing to invest in its 4G network infrastructure. Despite ongoing political and macroeconomic challenges, MTN and other operators in the region are well-positioned to meet the growing demand for high-speed broadband.

We will continue to monitor mobile networks’ performance across Africa, benchmark countries, and operators, and explore how various factors affect it. For more information about Speedtest Intelligence data and insights, please contact us.

Ookla retains ownership of this article including all of the intellectual property rights, data, content graphs and analysis. This article may not be quoted, reproduced, distributed or published for any commercial purpose without prior consent. Members of the press and others using the findings in this article for non-commercial purposes are welcome to publicly share and link to report information with attribution to Ookla.

| December 2, 2024

Too Big to Fail? The Largest Outages in 2024 According to Downdetector

Our reliance on technology is so total that for many it feels like the world is ending when a popular site or service on the internet is inaccessible, and 2024 saw many outages that reminded us how much one such interruption can disrupt the daily lives of millions. We analyzed Downdetector® data from Q1-Q3 2024 to see where that pain of disconnection was felt most acutely. Read on to revisit the largest outages of 2024 at a global level and sorted by region.

Note that while some companies experienced more than one large outage during this time period, we’ve listed only the largest incident per company in each chart.

The world’s biggest outages this year

Chart of World's Largest Outage i, Downdetector, Q1-Q3 2024

Users of social media sites, internet providers, and gaming sites and services suffered the most disruptions this year according to Downdetector data on the world’s biggest outages. Facebook had the largest outage on our list. On March 5, over 11.1 million people across the world reported issues with the popular social media site.

The second largest global outage may be the most memorable. While CrowdStrike is not a service most people think of, we saw nearly 5 million reports to services that rely on it (or rely on Microsoft which relies on Crowdstrike), including emergency services, airlines, and ride sharing apps when a routine software update went bad on July 19.

AT&T suffered the third largest outage in the world, according to Downdetector data, when an equipment configuration error caused customers across the entire United States to lose network access for over 12 hours.

Biggest outages in each region

Asia Pacific region hit by global outages

Chart of Largest Outage in Asia-Pacific Region, Downdetector, Q1-Q3 2024

The March 5 Facebook outage also topped the list of outages in the Asia-Pacific region, instigating over 908k user reports to Downdetector and taking Instagram down with it as the second largest outage. The third largest outage happened on June 26 when over 168k Microsoft 365 users in the Asia-Pacific region reported service disruptions on the service. Japan was especially hard hit with over 139k user reports from that country alone.

People in the Asia-Pacific region were also affected by local outages, with over 76k users reporting issues with Japanese payment system PayPay in May, and 65k users in India reported issues with Jio during a September service disruption.

Europe struggles with social media sites

Chart of Largest Outage in Europe, Downdetector, Q1-Q3 2024

Social media sites were the main source of disconnection in Europe according to data from Downdetector. Over 3.4 million European users reported issues with Facebook during the March 5 outage, making that the largest outage in Europe during Q1-Q3 2024. WhatsApp users suffered the second largest outage in Europe with over 1.1 million people reporting issues during an outage in early April.

Two German companies also showed up on our list of largest outages in Europe with over 218k reports of issues with 1&1 and over 209k reports of issues with Deutsche Telekom when the two companies experienced service disruptions almost a week apart in late May.

Latin America feels pain from global social outages

Chart of Largest Outage in Latin America, Downdetector, Q1-Q3 2024

Latin America’s top three outages mirrored those in Europe with social media sites causing the most pain for users according to data from Downdetector. The March 5 Facebook outage was felt profoundly with almost 850k user reports on Downdetector in Latin America for issues related to Facebook and over 260k related to Instagram. WhatsApp had the second largest outage in the region with almost 420k user reports during the two hours the service was down on April 3.

Bait, a Mexican Mobile Virtual Network Operator (MVNO) owned by Walmart, suffered an outage on April 2 where almost 99k users reported issues to Downdetector. And on September 24, over 74k users reported issues with Brazilian fintech bank Nubank.

Middle East and Africa experience mix of local and global outages

Chart of Largest Outage in the Middle East and Africa, Downdetector, Q1-Q3 2024

Outage patterns in the Middle East and Africa differed from those in other regions with users reporting about as many issues with local sites and services as global ones. The two largest outages, Microsoft 365 on March 14 and Facebook on March 5, were part of global events.

The third largest outage in the region was with South African telecommunications provider Telkom. Almost 55k users across Africa reported issues to Downdetector when Telkom experienced an outage on May 13. MTN, Vodacom, and du are other telecom providers that made our list of top outages in the Middle East and Africa during Q1-Q3 2024.

United States and Canada

Chart of Largest Outage in U.S. and Canada, Downdetector, Q1-Q3 2024

As we saw with much of the rest of the world, Facebook topped the list of outages in the U.S. according to Downdetector with over 5.8 million users reporting issues with the service during its outage on March 5. The Crowdstrike and AT&T outages also hit the U.S. hard with almost 5 million and over 3.4 million user reports, respectively. Gaming sites and services and telecom providers filled out the rest of the list in the U.S.

Downdetector is your source for information about service disruptions, monitoring real-time performance for thousands of popular web services globally. Find Downdetector on the web or in the free Speedtest app for Android or iOS. We’ve recently introduced push notifications so you can learn about outages as soon as they happen. Businesses looking for early alerting on service issues may be interested in Downdetector ExplorerTM.

Ookla retains ownership of this article including all of the intellectual property rights, data, content graphs and analysis. This article may not be quoted, reproduced, distributed or published for any commercial purpose without prior consent. Members of the press and others using the findings in this article for non-commercial purposes are welcome to publicly share and link to report information with attribution to Ookla.

| November 25, 2024

Is Telecoms Consolidation the Panacea for Europe’s Digital Competitiveness?

Mario Draghi has flirted with a radical restructuring of Europe’s telecoms market, seeking to cultivate pan-European scale and reinvigorate innovation and investment in telecoms. But is consolidation the answer?

Europe’s telecoms sector is at an inflection point. After a decade of stagnant revenues, lacklustre innovation and fierce competition, policymakers in Brussels are scrutinising the fundamental structure of the market. Earlier this year, a landmark report by Mario Draghi reignited discussions on consolidation, championing the creation of pan-European operators and calling for a decisive regulatory shift from proactive competition oversight (ex ante) to a reactive focus on enforcement after issues arise (ex post).

The proposed shift in policy comes as concerns over Europe’s telecoms sector’s ability to compete on a global stage reach a crescendo. A central tenet of the Draghi report is that the bloc’s fragmented telecoms market—a morass of dozens of small operators compared to just a handful in similarly sized regions elsewhere—has triggered a race to the bottom in pricing, eroding profitability and leaving Europe ill-equipped to compete with the more unified and dynamic markets of North America, the Middle East and Asia.

Timeline graphic: European Telecoms Consolidation Timeline: Key Mergers & New Entrants

Mobile network quality is a key factor in the European telecoms competitiveness equation, shaping both consumer satisfaction and the bloc’s attractiveness for investment. Proponents of consolidation argue that fewer, larger operators could enhance network performance and better position the bloc to achieve the European Commission’s ambitious Digital Decade 2030 goals. The simple argument is that by cultivating market dynamics that prioritise service quality over price wars, consolidation would create stronger incentives for investment in capital-intensive mobile networks.

Critics, however, challenge this narrative that favours consolidation. Instead, they argue that network quality is not solely a function of market concentration or structure and emphasise that other factors such as pricing also play an important role in shaping Europe’s overall telecoms competitiveness. In contrast to Draghi’s position, they propose that similar outcomes could be achieved without reducing competition by deploying other policy tools, such as providing targeted funding for infrastructure rollouts or incentivising network sharing initiatives.

This white paper aims to provide independent, informed insights to support the ongoing policy discourse in Europe. It explores whether empirical evidence supports the arguments for and against consolidation in the bloc’s telecoms sector, analysing network quality, investment and pricing outcomes across the EU and a sample of other high-income countries to assess the impact of varying market structures (e.g., three or four players) and levels of market concentration.

telecoms consolidation europe white paper download button

Key takeaways

Three-player mobile markets in the EU and other high-income countries exhibit better network performance and consumer sentiment outcomes.

This trend is consistent across all technologies and at similar levels of market concentration. Among the top ten European countries ranked by median download speed in Q2-Q3 2024, seven are three-player markets. The other three — Denmark, Sweden, and France — are four-player markets where operators engage in network sharing, whether in spectrum, site infrastructure or multi-operator core networks. This suggests that the level of network sharing in these countries is more extensive than in most other four-player markets. Overall, the studied three-player markets in the EU delivered median download speeds that were 56% higher than those in four-player markets during Q2-Q3, according to Speedtest Intelligence® data.

Market concentration is not a robust predictor of 5G coverage outcomes.

Socio-economic factors such as population distribution and economic development impart a greater impact on metrics relating to overall network reach, with wealthier, more urbanised countries enjoying investment conditions that are more conducive to the attainment of very high levels of service coverage and network availability. In four-player markets, however, disparities in overall 4G availability between the best- and worst-performing operators tend to be more pronounced than their three-player counterparts.

Intense price-based competition leads to markedly lower mobile data pricing outcomes in four-player markets over time.

The median consumer cost per gigabyte in highly concentrated markets — often seen in countries with the three-player structure — is nearly five times higher than in low-concentration markets. In four-player, lower-concentration markets, depressed ARPU and higher median capital intensity may result more from limited absolute revenues constraining reinvestment than from increased competition spurring greater investment. Conversely, in some highly concentrated non-EU high-income countries, greater market concentration is associated with lower capital intensity per operator, as larger players may face reduced incentives to invest.

There is no one-size-fits-all concentration profile that uniformly optimises network quality and consumer pricing outcomes in every country.

Exceptional outcomes in countries such as Denmark — a four-player market with low concentration but very high median download speed — and the Netherlands — a three-player market with high concentration and also high median download speed — suggest a targeted policy toolkit, rather than the blunt instrument of consolidation, is needed to achieve balanced outcomes across a bloc with highly diverse market contexts.

Download the full white paper

For a detailed analysis of how market structure (e.g., three vs. four operators) and market concentration (measured by the Herfindahl-Hirschman Index) impact network quality and consumer prices in the EU and a sample of other high-income countries, download our full white paper, “A Reality Check on Telecoms Consolidation in Europe: Can it Boost the Bloc’s Digital Competitiveness?

Ookla retains ownership of this article including all of the intellectual property rights, data, content graphs and analysis. This article may not be quoted, reproduced, distributed or published for any commercial purpose without prior consent. Members of the press and others using the findings in this article for non-commercial purposes are welcome to publicly share and link to report information with attribution to Ookla.

| May 7, 2024

Assessing and Addressing Indoor Coverage Issues

In an era where staying connected is not just a convenience but a necessity, fast and reliable indoor cellular and Wi-Fi connectivity play a pivotal role for enterprises and consumers alike. In fact, according to Ericsson, up to 80% of all data traffic is consumed at indoor locations and 90% of our time is spent indoors, making good indoor cell and Wi-Fi performance more important than ever. From enabling mission-critical business applications to allowing users to binge Fallout while stuck at the airport, users expect perfect connectivity 24/7, regardless of location. 

However, achieving consistently reliable and high-speed indoor coverage isn’t as straightforward as it might sound. Obstacles like walls, windows, and various building materials can attenuate radio signals and hamper propagation, while suboptimal access point (AP) placement, improper power level configurations, and interference from nearby networks or devices can further degrade indoor connectivity performance.

Chart titled "Deploying solutions can fail if not properly planned"

To overcome these challenges, proper network planning is critical, and that’s where Ookla can help. With complementary datasets like Ekahau’s Wi-Fi performance suite and Ookla’s solutions for mobile network intelligence including Cell Analytics™ and Ookla Wind™, operators can identify and address indoor coverage issues for both cellular and Wi-Fi networks. 

Detecting Indoor Coverage Issues

Internet users often switch between Wi-Fi and cellular networks, but these transitions aren’t always as seamless as one would expect. Some users might encounter poor service while moving between networks, while others may simply switch off one network type altogether, avoiding the need to report any problems to their ISP. This compounds challenges for ISPs in identifying and addressing coverage issues, making proactive network monitoring and testing critical. 

The first step in maximizing indoor connectivity and detecting coverage issues is understanding your network’s current gaps, weak signal areas, and sources of interference or poor performance.

Evaluating Cellular Coverage with Cell Analytics

Powered by the Ookla® Speedtest® network testing platform, Cell Analytics provides unparalleled intelligence into wireless service quality, RF measurements, data usage, user density – both indoors and outdoors – cell site locations, and much more. Cell Analytics leverages billions of samples from consumer devices to show you indoor coverage gaps, weak signal areas, and buildings with good coverage but poor quality. Some key capabilities of Cell Analytics include: 

  • Assessing the performance, quality, and availability of existing networks
  • Identifying and fixing network issues faster
  • Locating opportunities for capacity expansion
  • Prioritizing network optimization and marketing efforts
  • Focusing engineering efforts where they’re needed most

Evaluating Wi-Fi Coverage with Ekahau’s Sidekick 2

Ekahau’s Sidekick 2 Wi-Fi testing and measurement device assesses your network health and provides early detection for any changes in the environment that can negatively impact your Wi-Fi network. The Sidekick 2 enables comprehensive site surveys to rapidly detect issues like:

  • Poor primary or secondary coverage 
  • Interference sources 
  • Wall attenuation sources 
  • AP placement 
  • AP power levels
  • Security vulnerabilities 

With an easy-to-use mobile app interface, the Sidekick 2 empowers anyone to collect reliable Wi-Fi data simply by walking around a facility. If you can walk a dog, you can use the Sidekick 2!

Chart titled "Leverage Ookla's tools for indoor coverage improvement"

Improving Indoor Coverage with Ookla Wind & Ekahau

Ookla Wind offers another complementary solution for identifying and improving indoor coverage via a controlled walk/drive testing solution. Using our handset-based Android app, Ookla Wind provides controlled testing of 5G, 4G, Wi-Fi, and other network types, allowing ISPs to diagnose coverage problems and validate improvements at a granular level. Some key capabilities include:

  • Walk/drive test automation with scripting
  • Integrated Speedtest SDK for real-world throughput testing
  • Cloud-based reporting and visualization of test data
  • Real-time monitoring during live events at venues like stadiums

On the Wi-Fi side, Ekahau’s software solutions are designed to simplify Wi-Fi design and optimization for anyone, whether you’re a veteran IT pro or a recently hired IT intern. Using measured survey data collected by the Sidekick 2, Ekahau’s software can help you take the next steps toward improving your indoor coverage. Let’s take a look at how Ekahau’s Optimizer and Analyzer software solutions can help solve your network woes with ease. 

Ekahau Optimizer allows you to perform incredibly accurate health check and security surveys with the Sidekick 2 and the Android or iOS device of your choice. Ekahau Optimizer automatically analyzes data from the Sidekick 2, then it identifies and makes recommendations for fixing several key issues that IT admins have to contend with on a regular basis, such as primary and secondary coverage issues, SNR problems, minimum basic rates, SSID configuration, channel widths, and more. 

Ekahau Analyzer provides another convenient solution for troubleshooting the most common network issues, including coverage problems. Connected to the Sidekick, the app validates your network’s configuration and makes it easy to visualize actual spectrum utilization and access point reporting side-by-side, view associated stations, discover rogue devices, and identify the channels your APs are operating on to improve overall Wi-Fi performance. 

Conclusion

In today’s hyperconnected world, reliable indoor connectivity is a must for both businesses and consumers alike. By combining Ookla’s crowdsourced testing and analytics capabilities with Ekahau’s powerful Wi-Fi solutions, organizations get a 360-degree view of their indoor mobile and Wi-Fi coverage and can ensure their networks deliver the seamless indoor experiences users demand.

Image linked to access to On-Demand video of the "How to Optimize Indoor Cellular and Wi-Fi Coverage webinar

From pinpointing indoor coverage gaps and identifying other issues using Cell Analytics and Ekahau to conducting controlled testing with Wind, these complementary solutions provide end-to-end indoor connectivity optimization solutions for IT admins across a broad range of industry.

To learn more about how Ookla and Ekahau solutions can be used to solve coverage problems, check out our recent webinar on-demand, “How to Optimize Indoor Cellular and Wi-Fi Coverage.” 

Ookla retains ownership of this article including all of the intellectual property rights, data, content graphs and analysis. This article may not be quoted, reproduced, distributed or published for any commercial purpose without prior consent. Members of the press and others using the findings in this article for non-commercial purposes are welcome to publicly share and link to report information with attribution to Ookla.

| July 18, 2024

Why Customer-Centric Companies Turn to Crowdsourced Service Disruption Management

The reliability of online services has become more important than ever as service providers face the constant challenge of maintaining a seamless user experience across an expanding array of websites, applications, and cloud-based platforms. 

All it takes is a little bit of downtime for sites like YouTube or Facebook to turn into national headlines. For end users, the source of the issue is irrelevant; if the video isn’t playing on Facebook, it’s a Facebook issue. For businesses, internal tracking systems may not trigger if a downstream service like a contracted Content Delivery Network (CDN) experiences a service disruption. Scenarios like those mean that user-reported issues become the key to identifying the correlation and restoring connectivity.

Service Disruption Management (SDM) has emerged as a crucial tool for addressing these challenges, and Ookla is at the forefront of this approach with its two Crowdsourced Service Disruption Management (CSDM) solutions: Downdetector Explorer™ and Downdetector Connect™.

In this article, we’ll take a closer look at how these solutions work together to help service providers quickly identify and manage service disruptions, enhance customer experiences, reduce operational costs, and lower churn. 

For a deeper look into how service disruption management solutions have benefitted providers, check out our detailed white paper, How to Increase Customer Lifetime Value with Crowdsourced Service Disruption Management Solutions

What is Service Disruption Management or SDM?

Service disruption management (SDM) is a solution that enables service providers to identify, diagnose, resolve, and communicate service outages and other issues quickly and efficiently. In this context, the term “service provider” refers to a broad range of organizations, including ISPs, mobile carriers, telecommunications companies, and digital service providers like Netflix, Reddit, and scores of others. Traditionally, SDM has been implemented through various internal tracking tools and systems, such as network monitoring and fault management solutions. 

However, these internal systems can be enhanced by integrating them with crowdsourced service disruption management (CSDM) solutions, such as Downdetector Explorer and Downdetector Connect. CSDM tools leverage the collective intelligence and feedback of millions of users to help service providers prioritize issues that matter most to their customers. 

By integrating CSDM with existing network management systems, service providers can gain a more comprehensive view of their performance and take swift action to mitigate the impact of service disruptions on end users. 

Ookla’s solutions: leading the Crowdsourced SDM charge

Ookla has taken SDM to the next level with Downdetector Explorer and Downdetector Connect. These innovative platforms work together to provide service providers with a comprehensive approach to managing service disruptions.

Downdetector Explorer leverages the power of crowdsourced data on Downdetector.com to identify outages and disruptions in real-time for various online services, such as websites, apps, and cloud services. It harnesses the collective input of millions of users worldwide to provide real-time status and outage information for thousands of services, giving service providers valuable insights to resolve issues quickly and efficiently.

A key feature of Downdetector Explorer is its ability to monitor outages for third-party services that an ISP or mobile carrier doesn’t own, such as CDN providers like Akamai or various OTT services. This unique capability allows service providers to better understand the cause of an outage, even if it’s not directly related to their own infrastructure.

Downdetector Connect complements Downdetector Explorer by providing a custom-branded and official service disruption detection platform that incorporates digital customer engagement channels, advanced analytics to direct engineering efforts where needed, and customer messaging capabilities for personalized communication. It also incorporates a mobile SDK that collects connectivity information to provide insights into the customer’s experience.

Together, these solutions help service providers understand disruptions to vital services by using unbiased, transparent user reports and problem indicators from around the web. The Downdetector platform tracks over 14,000 services around the globe, from your favorite social media and gaming websites, to banks and internet service providers and more. It receives more than 25 million monthly reports from users, real-time analysis, and verification of outage reports, empowering network operations centers and customer care teams when an issue happens.

Chart of Capabilities of Ookla's SDM Solutions

Ookla’s CSDM solutions in action: real-world success stories

The effectiveness of Ookla’s CSDM solutions has been demonstrated through their successful implementation by several tier-1 operators worldwide. These operators have integrated Downdetector Explorer and Downdetector Connect into their network management strategies, achieving significant improvements in key performance indicators (KPIs) and customer satisfaction.

For example, an operator from the Asia Pacific region leveraged Ookla’s CSDM solutions to offer a highly personalized customer experience and reduce the costs of credits for issues unrelated to service disruptions. The platform delivered the following benefits:

  • Achieved a 65% resolution rate for service issues
  • Reduced service-related contacts by 17%
  • Decreased credits for non-service-related issues by 51%
  • Improved its Net Promoter Score (NPS) — a key performance indicator of customer experience — from -13 to +34.8, indicating a substantial boost in customer loyalty

Another operator, this one in Western Europe, increased its transparency and digital engagement while improving its customer acquisition process. By using Ookla’s tools, the operator achieved:

  • A 400x increase in digital engagement
  • A 40% reduction in support calls
  • An 80% decrease in support calls during major outages
  • One of the highest NPS scores in their market, showcasing the platform’s impact on customer satisfaction

Service providers can now proactively identify and resolve network issues, leading to improved customer experiences, increased loyalty, and reduced operational costs. As more and more providers adopt and integrate crowdsourced SDM tools into their service management strategies, we expect to see similar success stories and industry-wide improvements going forward. 

Downdetector Explorer screenshot

The Future of CSDM 

As the complexity of online services and the demand for their reliability continue to grow, the importance of crowdsourced service disruption management will only continue to increase. The emergence of new technologies and new use cases will further drive the need for advanced CSDM solutions that can quickly identify and resolve service disruptions and keep customers happy.

One area of huge potential in the CSDM space is the integration of artificial intelligence (AI) and machine learning (ML) technologies into CSDM solutions. These technologies have the potential to enhance the accuracy and efficiency of service disruption detection and resolution, allowing service providers to stay ahead of the curve in ensuring the reliability of online services and maintaining customer satisfaction. 

AI- and ML-powered CSDM solutions can analyze vast amounts of data from multiple sources in real-time, identifying patterns and anomalies that may indicate potential service disruptions. Integrating AI and ML into CSDM solutions would allow providers to proactively identify and address potential problems before they occur, significantly improving outage resolution times and enabling the prediction of future disruptions based on historical data.

Conclusion 

The reliability of online services is paramount in our increasingly digital world, and crowdsourced service disruption management has emerged as a game-changer for online service providers. CSDM solutions leverage the power of crowdsourced data, enabling providers to quickly identify service disruptions and respond more effectively. This protects them from potential reputational damage and financial losses.

As CSDM continues to advance, service providers that adopt these crowdsourced solutions will be better equipped to reduce downtime and provide excellent customer experiences. With improved issue detection and more rapid responses to disruptions, service providers will also be able to foster long-lasting customer relationships and maintain a competitive edge in an increasingly demanding market.

Image of Ookla White paper | How to Increase Customer Lifetime Value with Crowdsourced Service Disruption Management Solutions

To learn more about how CSDM solutions like Downdetector Explorer and Downdetector Connect can transform your service disruption management strategy, reach out to our team. 

And for a more in-depth exploration of how SDM can help service providers maximize Customer Lifetime Value (CLV) and support the different stages of Customer Lifecycle Management (CLM), read our comprehensive white paper, How to Increase Customer Lifetime Value with Crowdsourced Service Disruption Management Solutions

Ookla retains ownership of this article including all of the intellectual property rights, data, content graphs and analysis. This article may not be quoted, reproduced, distributed or published for any commercial purpose without prior consent. Members of the press and others using the findings in this article for non-commercial purposes are welcome to publicly share and link to report information with attribution to Ookla.

| October 4, 2024

The Power of the Crowd: How Downdetector’s User-Generated Reports Identify Website Outages in Real Time

Picture this scenario: Your company’s internal monitoring tools haven’t detected an issue with your website, but users are flooding social media and Downdetector® complaining that your site is down. You’re left wondering, “How did our users notice a problem before we did, and what can we do about it now?” This scenario highlights a key gap in traditional monitoring approaches — the disconnect between internal metrics and real-world user experiences.

Downdetector offers a powerful solution to this common challenge. By harnessing crowdsourced data from its global user base, Downdetector and its commercial counterpart Downdetector Explorer™ provide real-time insights into service disruptions across millions of services spanning myriad industries. The platform’s continuous stream of user-submitted outage reports allows Downdetector to identify issues often before the affected service providers themselves are aware, enabling faster response times and more proactive problem-solving. 

In this article, we’ll explore how enterprises can use Downdetector Explorer to identify service disruptions, resolve issues faster, and provide better customer support. We’ll share insights from disruptions at major companies like AT&T, WhatsApp, and PlayStation, demonstrating Downdetector’s impact in real-world scenarios.

For a deeper dive into Downdetector and its role in service outages, don’t miss our webinar “Is It Just You? Leveraging Downdetector to Identify Service Disruptions.”

Downdetector: How it works & why it matters

What if you could tap into the experiences of millions of users around the world to detect website or service disruptions in real-time? Enter Downdetector Explorer. Users submit problem reports as they encounter issues, effectively creating a worldwide network of website outage detectors. This crowdsourced approach complements internal monitoring systems, offering insights that can reduce response times and improve service quality for enterprises. 

With real-time status information for over 20,000 services across more than 45 Downdetector domains representing over 45 countries, Downdetector has become the go-to platform for service disruption insights. Here’s the short version of how it works (and here’s the longer version) along with some of its key benefits: 

  • User-generated reports: Consumers report issues they’re experiencing through Downdetector’s mobile app, website, or through the Speedtest® app. Downdetector also monitors and analyzes indicators from social media platforms and other sources around the web to automatically detect incidents and service disruptions. The ability to rapidly detect service disruptions, often before internal monitoring tools identify a problem, is vital in managing service disruptions effectively. 
  • Real-time analysis and anomaly detection: Downdetector’s systems analyze and validate reports in real-time, distinguishing between genuine service issues and isolated incidents. For example, an incident is identified when the number of problem reports for a service is significantly higher than its baseline or average. This can trigger a “danger state” that alerts businesses to potential issues, allowing them to quickly identify problems and diagnose whether incidents are caused by internal issues or external services like CDNs, cloud hosting providers, or other sources. 
  • Third-party service monitoring: A key feature of Downdetector Explorer is its ability to monitor outages for services beyond a company’s own infrastructure. This includes CDN providers like Akamai, various OTT services, and cloud hosting platforms. By providing visibility into these interconnected services, Downdetector Explorer enables companies to better understand the root cause of outages, even when they originate outside their own infrastructure

The following sections explore how companies across various industries have benefited from Downdetector’s capabilities, demonstrating its value across multiple real-world scenarios. To see more of these benefits in practice, be sure to watch our recent webinar

Illustration of how Downdetector works.

Identifying root causes: The AT&T outage 

Imagine waking up one morning to find your phone has no signal. No calls, no texts, no mobile data. Frustrating, right? That’s exactly what millions of AT&T customers experienced one morning. But here’s where the story gets interesting –- and where Downdetector shined.

During this widespread service disruption, Downdetector became a critical source for real-time insights, showcasing how crowdsourced data can be a game-changer in understanding and addressing large-scale outages. Here’s how Downdetector helped make sense of this digital disruption:

  • Early detection: Downdetector observed a significant spike in AT&T-related reports, quickly highlighting the widespread nature of the issue. The collective experiences of users provide Downdetector with a unique, consumer perspective on service disruptions, offering insights into the full scope and impact of an outage.
  • Nationwide impact: Downdetector logged almost two million unique user reports about AT&T services, with reports submitted from affected users across multiple cities and regions. This clearly indicated a severe, nationwide issue rather than isolated or localized incidents.

Line Diagram showing AT&T Outage. AT&T has up to 80k user reports between 12pm and 4pm, feb 22, 2024. AT&T dwarfs T-Mobile and Verizon user report lines on the chart.

  • Comparative analysis: Downdetector’s data revealed a significant disparity in user user-generated reports between AT&T and its competitors. While Verizon and T-Mobile experienced an increase in reports, their volumes were substantially lower than AT&T’s, helping identify AT&T as the primary source of the problem. Interestingly, many of the reports for Verizon and T-Mobile were likely “sympathetic” in nature — their customers submitted reports after failing to connect with AT&T users, mistakenly (but understandably) attributing the issue to their own provider. 
  • Root cause indication: The pattern and distribution of reports across AT&T’s services suggested an internal root cause rather than an external factor affecting multiple providers.
  • Timely information: Downdetector provided these insights within the first few hours of the outage, while it took AT&T approximately 16 hours to make a public announcement confirming the internal cause.

This example illustrates how Downdetector Explorer can provide crucial context and insights that can help cut through the confusion that often accompanies major outages. For service providers, having access to real-time, user-generated data enables more informed decision-making about the scope and source of issues, guides targeted troubleshooting efforts, and supports clearer and quicker communication with customers

Early alerting and filling gaps in internal testing: the WhatsApp outage

As our reliance on digital communication grows, even a brief disruption to a popular communication app can cause serious frustration, impacting our ability to connect with people and even conduct business. That’s exactly what happened when WhatsApp, a platform used for messaging, calling, and sharing media, experienced a service outage. As users began experiencing and reporting issues, Downdetector immediately began collecting and analyzing user-generated reports, providing real-time information into the developing situation.

This event showcased Downdetector’s unique ability to provide insights into application-level issues that might not be immediately apparent through traditional monitoring tools. Let’s explore how Downdetector helped illuminate this digital disruption:

  • Rapid global detection: Downdetector quickly identified a surge in WhatsApp-related reports from multiple countries, signaling a widespread issue. The ability to pinpoint where users are experiencing problems is especially important for service providers with international user bases.
  • Real-time, app-specific insights: When reporting disruptions on Downdetector, users select from a predefined list of problem indicators, helping narrow down the issue. This structured reporting system provides real-time visibility into the specific issues users are experiencing. For the WhatsApp outage, the pattern of these reports helped quickly identify the nature, scope, and geographic spread of the problems within the WhatsApp service.
  • Outage duration tracking: Downdetector’s continuous monitoring allowed for accurate tracking of the outage’s duration, from initial spike to resolution.

Line diagram of WhatsApp outage. Whatsapp shows over 800,000 user reports at approx 6:30pm UTC, 2024-04-03

The WhatsApp outage demonstrates Downdetector’s unique ability to detect and monitor issues that may slip through the cracks of traditional testing tools. By tapping into real-world user experiences, Downdetector offers a level of monitoring that can alert companies to problems faster and provide a more comprehensive view of service disruptions.

Diagnosing multi-service issues: The PlayStation Network outage

When your favorite online game stutters or crashes, is it the game itself, the gaming platform, or your internet connection? This complexity is exactly what makes outages in the gaming industry particularly challenging to diagnose. The gaming ecosystem’s intricate nature, with its multiple layers of services, can create a perfect storm for confusion during outages.

In an outage affecting users of the PlayStation Network, EA, and popular games like FIFA, Downdetector’s insights proved invaluable in unraveling a web of interconnected services. Its ability to collect and analyze data across various platforms simultaneously provided a clear picture of the situation. Here’s how Downdetector helped unravel this dilemma:

  • Comprehensive service monitoring: Downdetector received user reports across multiple services simultaneously, including the PlayStation Network, EA’s servers, and individual games like FIFA.
  • Identifying the root cause: A spike in reports for PlayStation Network, significantly higher than those for EA or individual games, pointed to the source of the problem.
  • Global impact: Downdetector’s data revealed that the issue affected PlayStation Network users worldwide, ruling out localized problems.
  • Connecting the dots: Downdetector’s data revealed a correlation between increased reports for the PlayStation Network and reports for specific games like FIFA. This highlighted the interconnected nature of gaming services, showing how issues with a platform like PlayStation Network can coincide with perceived problems in individual games.
  • Real-time data collection and analysis: Downdetector continuously collected user reports throughout the event, providing a real-time view of the issue’s scale and geographic spread. By tracking report volumes for the PlayStation Network alongside those for games and other related services, Downdetector offered insights into how the situation evolved over time.

Line diagram of Playstation Network Outage showing approx 3,200 user reports on March 21, 2024

Downdetector’s holistic view of the gaming ecosystem enabled a quick identification of the PlayStation Network as the primary source of the problem. The ability to rapidly diagnose issues is crucial in an industry where even a second of downtime can lead to a spike in customer service outreach and potential revenue loss. It can also potentially mean the difference between winning and losing for millions of gamers

The bottom line 

In our digital landscape where just a few minutes of downtime can have significant impacts, the ability to quickly detect and understand service disruptions is more critical than ever. As we’ve seen through the case studies above, service disruptions can have far-reaching consequences across various sectors. 

These examples highlight a common challenge facing service providers: the discrepancy between what internal monitoring systems report and what users are actually experiencing and reporting when faced with service outages or issues. Downdetector bridges this gap by using the power of crowdsourced data, offering a unique perspective that complements traditional monitoring tools. Downdetector Explorer empowers businesses with the tools they need to stay ahead of outages, improve customer communication, and ultimately deliver a better user experience.

Webinar title image: Is It Just You? Leveraging Downdetector to Identify Service Disruptions. Resolve issues faster and provide better customer support with real-time insights.

To learn more about how Downdetector can benefit your organization and to dive deeper into these and other case studies, including an insightful analysis of a Bank of America outage, watch our recent webinar, “Is It Just You? Leveraging Downdetector to Identify Service Disruptions.” For more on how Downdetector works, visit our methodology page.

Ookla retains ownership of this article including all of the intellectual property rights, data, content graphs and analysis. This article may not be quoted, reproduced, distributed or published for any commercial purpose without prior consent. Members of the press and others using the findings in this article for non-commercial purposes are welcome to publicly share and link to report information with attribution to Ookla.

| November 6, 2024

The Path to "Full" 5G: Challenges and Opportunities in Standalone 5G Deployment

5G technology has been making headlines for years, but the transition to standalone 5G (5G SA) has been slower than many expected. While non-standalone 5G (NSA) uses 5G radio technology alongside existing 4G core networks, 5G SA represents a complete transition to an independent 5G network with its own core. Think of SA 5G as “pure” or “real” 5G, with 4G LTE removed entirely from the equation. This evolution promises notable improvements in network performance and capabilities, yet its deployment has faced obstacles.

Our recent webinar, “The Slow Road to 5G Standalone: What’s Delaying Deployment?” explored the challenges and opportunities in 5G SA deployment and implementation. Featuring experts from Ookla and T-Mobile, the discussion provided comprehensive insights into the current state and future potential of this technology.

In this article, we’ll explore key takeaways from the webinar, including the benefits, challenges, emerging use cases of 5G SA, and we’ll also take a look at T-Mobile’s aggressive approach to 5G SA. For a deeper look at these topics, including expert analysis and detailed performance data, watch the full webinar

Key benefits and technical improvements of 5G SA

5G Standalone (SA) technology promises to deliver significant advantages over its predecessors, opening new possibilities for consumers and industries alike. But the transition to 5G SA involves more than just upgrading cell towers—it requires the implementation of an entirely new core network. This core acts as the “brain” of the system, managing data connections, handling security, and enabling advanced features.

To fully realize the potential of 5G SA, several technological innovations have been introduced to enhance network performance and user experiences. These include better management of network resources and more efficient data transmission. A standalone 5G core is essential to unleash these developments, setting 5G SA apart as “real” 5G and enabling capabilities that were impossible with 4G-dependent networks.

The result is better use of available spectrum, faster data speeds, and extended coverage in challenging environments like indoor spaces or rural regions. Key benefits for users include:

  • Improved upload speeds: Faster upload speeds for activities like social media sharing, file uploads, and cloud services.
  • Better coverage in more places: Improved connectivity in areas previously underserved by mobile networks, enhancing user experiences in more locations.
  • Lower latency: Near-real-time responsiveness for applications like gaming and augmented reality.
  • Increased network efficiency: Operators can serve more users with improved quality of service, leading to a smoother and more reliable mobile experience.

Beyond these immediate improvements, 5G SA also paves the way for transformative technologies like network slicing, which we’ll explore in later sections.

Challenges to 5G standalone deployment

While 5G SA promises significant advancements in mobile technology, our webinar discussed a perhaps surprising reality: the deployment of 5G SA has been slower than many industry experts anticipated, with only about 12% of 5G networks worldwide utilizing SA technology. This gap between the technology’s potential and its current adoption raises important questions about the obstacles facing network operators and the future trajectory of 5G technology. Several challenges have contributed to this slow adoption:

  • Technical complexity and core network upgrades: Transitioning to a fully independent 5G core network presents significant hurdles, requiring extensive and costly upgrades to the core infrastructure, which is both technically challenging and time-consuming.
  • Transition hurdles: Operators must carefully manage the transition from NSA to 5G SA to minimize disruptions to existing services while gradually introducing SA capabilities. This process requires coordinating changes across the network infrastructure, device ecosystem, and service offerings simultaneously.
  • Unclear ROI: Some operators are hesitant to invest heavily in 5G SA without a clear return on investment.
  • Lack of a widely recognized “killer use case”: While applications like network slicing and enhanced Fixed Wireless Access (FWA) show promise, some operators are still waiting for more compelling use cases that clearly demonstrate the need for SA capabilities before making the leap.
  • 5G SA ecosystem compatibility and availability: Ensuring all network components, devices, and applications are SA 5G-compatible presents a significant challenge, and the limited availability of SA-compatible devices in the market can slow down adoption.

Despite these industry-wide challenges, some carriers have chosen to forge ahead with 5G SA deployment, recognizing its long-term potential. T-Mobile, in particular, has taken a bold approach to 5G SA implementation.

T-Mobile’s aggressive approach to 5G SA

While many mobile carriers have been cautious in their approach to 5G SA, T-Mobile has taken a decidedly different path. The company recognized early on that to truly differentiate its 5G offerings and introduce new features, a full transition to 5G SA was necessary. T-Mobile has since positioned itself as a leader in 5G SA, providing valuable insights for the industry into both the challenges and benefits of this technology.

T-Mobile viewed 5G SA as a pathway to improved network performance, advanced features, and more efficient use of its spectrum assets. Central to this vision was T-Mobile’s recognition that a dedicated 5G core network was essential to achieve superior performance beyond what NSA 5G could offer. The carrier’s approach has thus far yielded promising results:

  • Enhanced coverage and capacity: Broader network reach and ability to serve more users, especially in densely populated urban areas
  • Advanced features: Early implementation of network slicing and Voice over New Radio (VoNR), enabling new service possibilities
  • Improved uplink performance: Faster upload speeds and better coverage, benefiting applications like live streaming and large file transfers

While T-Mobile and its users have clearly benefited from this technology, the carrier’s journey hasn’t been without challenges. T-Mobile had to navigate issues such as ensuring device compatibility across its customer base, optimizing network performance during the transition, and educating customers about the benefits of 5G SA.

Emerging use cases for 5G SA

The true measure of SA 5G’s value lies in the new applications and services it enables. While many mobile operators are still cautious about immediate 5G SA deployment, this technology represents the future of 5G. As carriers inevitably move in this direction, they’re looking to both enhance existing services and enable entirely new possibilities. 

Our webinar delved into three key areas where 5G SA is already making an impact and showing its transformative potential: Network Slicing, Fixed Wireless Access (FWA), and Voice over New Radio (VoNR). 

Network slicing is a capability unique to 5G SA that allows operators to create virtual network segments tailored to specific use cases or customers. This enables the allocation of dedicated network resources to ensure optimal performance for critical services. T-Mobile has leveraged this capability to launch T-Priority, the world’s first network slice for first responders. Key benefits of network slicing include:

  • Better prioritization: Up to 5x higher network resource prioritization for critical services
  • Customized performance: Ability to optimize network parameters for specific applications or user groups
  • Improved reliability: Dedicated resources to ensure consistent performance for essential services

Fixed Wireless Access (FWA) uses 5G technology to provide home internet services, competing directly with traditional broadband options. 5G SA’s expanded capacity and performance make it particularly well-suited for this application. T-Mobile has identified FWA as a major growth opportunity, setting an ambitious target of 12 million FWA customers by 2027-2028. Key advantages of 5G SA for FWA include:

  • Expanded wireless capacity: Ability to serve more home internet customers in a given area compared to previous wireless technologies
  • Competitive performance: Offers speeds and latency that can rival or exceed traditional home broadband options in many areas, providing consumers with more choices
  • Simplified and cost-effective deployment: Implementation is faster and more cost-effective than laying traditional broadband infrastructure

Voice over New Radio (VoNR) represents the next evolution in mobile voice technology. By enabling voice calls to be carried entirely over a 5G network, VoNR promises improved call quality and lower latency compared to existing voice services. (We’ll explore VoNR in more detail in the next section.)

With T-Mobile’s T-Priority in use, we’re already seeing the real-world impact of 5G SA. As other applications continue to develop and mature, we can expect 5G SA’s influence to expand across various industries and services.

Voice over New Radio (VoNR): the next evolution in mobile voice

As 5G SA networks mature, they’re not just improving data services—they’re also revolutionizing voice communications. Voice over New Radio (VoNR) represents a significant leap forward from its predecessor, Voice over LTE (VoLTE). This technology enables voice calls to be carried entirely over a 5G network, potentially offering superior call quality and reduced call setup times. 

T-Mobile has been at the forefront of VoNR deployment, providing valuable insights into its real-world performance and benefits. Key aspects of T-Mobile’s VoNR deployment and performance include

  • Nationwide reach: VoNR is now enabled for over 300 million people in the U.S.
  • Controlled rollout: T-Mobile implemented VoNR market-by-market, ensuring performance met specific metrics before enabling the service.
  • Device compatibility: A large portion of T-Mobile’s device base is either VoNR-capable or can be enabled for VoNR.
  • Promising performance: Call failure rates for VoNR are comparable to, and in some cases better than, VoLTE.
  • Rapid adoption: VoNR’s share of calls has increased threefold from the second half of 2023 to the first half of 2024.

As more devices become VoNR-capable and coverage expands, more and more users should enjoy a seamless voice experience that fully leverages the capabilities of 5G technology.

Measuring 5G SA performance: Complementary datasets from Speedtest and RootMetrics

As mobile operators deploy 5G SA, measuring its real-world impact is crucial for understanding the technology’s true benefits and challenges. Ookla’s complementary datasets—combining RootMetrics’ controlled testing methodology with Speedtest’s crowdsourced data—provide a comprehensive view of network performance from both controlled and real-world environments. 

Data from RootMetrics testing across 125 of the largest metropolitan markets in the U.S. revealed several notable findings about 5G SA performance:

  • Network usage patterns vary significantly between operators: While T-Mobile extensively uses 5G SA when available, other carriers often default to LTE for lighter data tasks such as loading apps or webpages.
  • Latency improvements are task-dependent: RootMetrics testing showed that latency benefits become more pronounced with complex tasks like video streaming, which requires multiple network interactions.
  • Urban deployment focus: 5G SA availability and usage is currently more prevalent in metropolitan areas than in more rural areas. 

RootMetrics’ real-world performance data provides quantitative evidence of 5G SA’s benefits across various network scenarios and use cases, offering valuable insights for mobile operators as they plan their 5G SA deployments.

 If you’d like to see Ookla’s tools in action yourself, reach out to our team

The Road Ahead: 5G Advanced and Beyond

As 5G SA networks continue to evolve, the industry is already looking toward the next phase of development. Our webinar provided insight into the future of 5G technology, including the upcoming 5G Advanced standard and early considerations for 6G. These developments promise to further optimize network capabilities and open up new possibilities for innovation. Some key points about the future of 5G include: 

  • 5G Advanced: The next evolution of 5G, focusing on improving network efficiency and user experiences. 
  • 6G planning: Initial discussions and research into 6G technology have begun, with a focus on creating new value and revenue streams beyond enhanced mobile broadband. 
  • Spectrum refarming: Carriers are actively shifting spectrum from LTE to 5G, aiming to improve network efficiency and overall 5G performance.
  • Industry applications: The industry is expanding Fixed Wireless Access (FWA) capabilities and exploring new use cases for network slicing across various sectors, aiming to harness the full potential of mature 5G networks.

The evolution from 5G SA to 5G Advanced and early 6G research signals the industry’s commitment to continuous innovation. These developments aim to refine existing capabilities and create entirely new value propositions, potentially reshaping various aspects of technology and society in the coming years.

Conclusion

The journey to widespread 5G SA adoption is complex, but the potential benefits are immense. As we’ve seen, early adopters like T-Mobile (and its users) are already reaping the rewards of their investment, from improved network performance to innovative services like network slicing and enhanced FWA offerings.

To dive deeper into the intricacies of 5G SA deployment, including expert insights and real-world examples, watch our full webinar on demand!

Ookla retains ownership of this article including all of the intellectual property rights, data, content graphs and analysis. This article may not be quoted, reproduced, distributed or published for any commercial purpose without prior consent. Members of the press and others using the findings in this article for non-commercial purposes are welcome to publicly share and link to report information with attribution to Ookla.

| April 14, 2024

Early 5G Results for the Samsung Galaxy S24 Family: How do New S24 Models Stack up to Previous Generations and iPhone 15’s on 5G? 

Consumers around the world eagerly awaited Samsung’s release of the latest line of its flagship Galaxy S series of smartphones on February 1, 2024. Was the wait worth it? In this article, we analyze how the Samsung Galaxy S24 family measures up against its predecessors in terms of 5G speed and latency during its first several weeks on the market (February 1 – March 24, 2024). 

With new chipsets and technologies alongside plenty of other cool new features in Galaxy S24 devices, we examined early results from Speedtest® users in 15 select countries around the world to see whether the Galaxy S24 lineup — comprising the S24, S24+, and S24 Ultra models — outpaced Samsung’s earlier S22 and S23 families for 5G performance. Additionally, we’ve compared the 5G speeds and latency of Apple’s iPhone 15 family — including the iPhone 15, 15 Pro, and 15 Pro Max — against Samsung’s offerings.

It’s important to note that device performance metrics can vary significantly from one country to another. Factors such as government and mobile operator investments in 5G infrastructure, spectrum allocations, and the extent of 5G network deployment all contribute to these variations.

Key takeaways:

  • The Samsung Galaxy S24 family showed a statistically significant lead for median 5G download speeds in seven out of 15 countries in this study. On the other hand, the Apple iPhone 15 family posted the fastest 5G speeds in only one country. It’s worth noting, however, that speed differences between Galaxy S24 devices and iPhone 15’s were relatively minor in some of the countries analyzed (see the charts below for details). 
  • The S24 family recorded the lowest median 5G multi-server latency in 10 of 15 countries, whereas iPhone 15 devices offered the highest median 5G latency in 10 markets.
  • Samsung Galaxy S22 models unsurprisingly offered the slowest median 5G download speeds in eight countries, while the Galaxy S23 family was slowest in four countries. 
  • Devices in the Galaxy S24 family experienced the fastest median 5G upload speed in 13 of the 15 countries examined for this analysis. However, upload speeds were much slower than 5G download speeds, ranging from 11.83 Mbps to Mbps to 66.52 Mbps, with median 5G upload speeds of 50 Mbps or better found in only three countries (South Korea, Qatar, and the U.A.E.). 

To learn more about what speeds mean in real-world terms, check out our article looking at how much speed users need for a variety of daily mobile activities.

Take me straight to the data!

Asia Pacific | Middle East & Africa | Europe | North America 

New chipsets and modems in the Galaxy S24 family 

Everyone wants to know if the newest technology is worth the upgrade when they’re investing in an expensive new smartphone. Each device within the Galaxy S24 family has various upgrades (including new AI features), but when it comes to features that impact speed and latency performance, here’s a look at the chipsets and modems for each line of smarthpones in our study:

  • Samsung Galaxy S24 Ultra models use Qualcomm’s Snapdragon 8 Gen 3 chipset globally, while the S24 and S24+ use it only in Canada, China, Hong Kong, Taiwan, and the United States. The Samsung Exynos 2400 is used elsewhere for the S24 & S24+.
  • The Galaxy S23 series uses Qualcomm’s Snapdragon 8 Gen 2 worldwide, while Samsung S22 models use an Exynos 2200 chipset in Europe and the Snapdragon 8 Gen 1 elsewhere. 
  • Galaxy S24 devices utilize the Snapdragon X75 5G modem, S23 models have a Qualcomm Snapdragon X70 modem, while S22 models have a Qualcomm Snapdragon X65 modem.
  • Apple iPhone 15 models use Apple’s A16 Bionic chipset, while iPhone 15 Pro and Pro Max models use the A 17 Pro chip. All devices in the Apple iPhone 15 family utilize Qualcomm’s Snapdragon X70 5G modem. 

Do you own one of these devices? See how your speeds compare by taking a quick Speedtest. And to learn more about mobile and fixed broadband performance in cities and regions across the world, visit the Speedtest Performance Directory, where you’ll find ISP recommendations, insights on mobile and fixed broadband performance, and more. 

Digging into the Data: Where does the Samsung Galaxy S24 Family Lead its S22, S23, and iPhone 15 Counterparts Around the Globe? 

Early findings from Speedtest Intelligence® reveal that the latest Galaxy S24 family outperformed its predecessors — especially S22 models — in terms of 5G speed across several of the countries we analyzed. While differences in speed between devices were minimal in some countries, S24 models showed significant speed advantages over previous generation Samsung devices in markets like Qatar, the United Arab Emirates, and others. 

Does that mean users in those locations should upgrade immediately? Not necessarily. The decision to upgrade depends on various factors, from price to features to performance and more. However, if speed is your primary concern, the Galaxy S24 series is a compelling option, especially for consumers currently utilizing devices from the Galaxy S22 lineup, which is now over two years old.

Read on to see our complete analysis of all 15 countries in this study or select a region below to dig into more localized results. 

Asia Pacific | Middle East & Africa | Europe | North America 

Asia Pacific

Consumers in Hong Kong who want new features might want to upgrade

Speedtest Intelligence data revealed strong performance for all device families in Hong Kong, with the new Galaxy S24 family performing particularly well, boasting a median 5G download speed of 165.74 Mbps and the lowest median 5G multi-server latency in the market at 21.74 ms. However, the S24’s median 5G download speed was statistically comparable to that of its older Samsung and iPhone 15 peers, making the choice to upgrade currently more about new features than about performance.

Bottom line: With strong — and similar — 5G download speeds across all device families in Japan, upgrading to a new Galaxy device isn’t a must just yet, unless you want to enjoy the S24 family’s new features.

5G speeds were fast across the board in India, where the Samsung Galaxy 24 family held a slight edge 

In the early days following the release of the Galaxy S24 series in India, the latest Samsung models led for both 5G download speeds and 5G multi-server latency. While 5G speeds impressed across all device families in India — all notched speeds of at least 273.78 Mbps — Galaxy S24 models posted the top median 5G download speed at 302.43 Mbps and the lowest median 5G multi-server latency at 41.56 ms. On the other hand, Galaxy S22 devices showed the slowest — but still impressive — speeds in India at 273.78 Mbps, while the Samsung Galaxy S23 was just a tick behind at 279.93 Mbps. The iPhone 15 family, meanwhile, clocked in with a median 5G download speed of 285.78 Mbps.

Bottom line: Consumers in India currently using S22 devices might want to upgrade to an S24 model, given the nearly 30 Mbps speed advantage the new devices provided in this study. However, with excellent 5G speeds across all device families and similar speeds for devices in the S22, S23, and iPhone 15 families, users might not feel a huge difference in their 5G experience from one device to another. 

Samsung Galaxy enthusiasts in Indonesia needn’t rush to upgrade to an S24 device — yet

In contrast with what our results showed in most countries, the iPhone 15 family emerged as the leader in Indonesia with a median 5G download speed of 80.49 Mbps. All three Samsung Galaxy families trailed with speeds ranging from 55.61 Mbps for the S24 family to 69.24 Mbps for S23 models. While the iPhone 15 family’s 5G speed was nearly 25 Mbps faster than that of S24 devices, it’s worth noting that the difference among all three Samsung Galaxy models was only about 14 Mbps, and our results revealed no statistical difference in median 5G download speeds between the S22 and S23 families. 

Bottom line: Despite the iPhone 15 providing the top speeds in the market, the Galaxy S24 could hold greater long-term potential for consumers in Indonesia, especially when compared to older Samsung models. Equipped with a newer processor and modem, the S24 could see quicker speeds over time as Indonesia’s 5G networks evolve. In the meantime, users shouldn’t experience notable disparities in speed or latency among all three Samsung device families analyzed. 

No clear advantage to upgrading to a new Galaxy S24 in Japan

People in Japan who upgraded to a Galaxy S24 device likely haven’t seen a performance boost just yet. While all four device families performed similarly well in Japan, there was no statistical difference in the median 5G download speeds offered by all three Galaxy families, with speeds ranging from 110.48 Mbps to 118.93 Mbps across all three Galaxy devices. The iPhone 15 lineup also had a strong speed at 125.48 Mbps. 

Bottom line: With generally similar median 5G download speeds across all device families in Japan, users who are considering upgrading to a new Galaxy smartphone might want to wait. While we anticipate the S24’s speeds to surpass those of its predecessors over time, 5G speeds in the market were quite close across all three Galaxy device families in the early days of the S24’s release. 

For users in the Philippines who want the fastest 5G, Galaxy S22 users may want to upgrade. 

Samsung Galaxy S24 users in the Philippines might have noticed a modest improvement to their 5G speeds compared to those on older S23 and S22 models since they upgraded, as the Galaxy S24 family’s median 5G download speed of 157.38 Mbps was about 20 Mbps faster than that of Galaxy S22’s (137.68 Mbps) and a little over 15 Mbps faster than the Galaxy S23 family (140.06 Mbps). Meanwhile, the iPhone 15 family’s median 5G download speed of 120.04 Mbps trailed all three Samsung Galaxy families in the market.

Bottom line: For users in the Philippines seeking the fastest possible 5G experience, upgrading to an S24 device is worth considering. However, it’s worth noting that the differences in speed between devices wasn’t as stark as that in some other countries, and upgrading likely isn’t for everyone just yet.

Samsung Galaxy S24 and iPhone 15 much faster on 5G in South Korea than S22 devices 

In South Korea, home to the first widespread 5G launch in the world, our results reflected outstanding 5G speeds, with the iPhone 15 and Samsung Galaxy S24 families posting similar median 5G download speeds of 598.64 Mbps and 590.28 Mbps, respectively. The S22 family, meanwhile, offered the “slowest” 5G speeds in South Korea, posting an excellent median 5G download speed of 475.42 Mbps, while Galaxy S23 devices came in at 511.82 Mbps.

Bottom line: 5G users in South Korea can expect remarkable 5G speeds across the board, regardless of their device. However, Samsung Galaxy loyalists who currently use S22 models might want to consider moving to an S24 model, given that the S24 family was over 100 Mbps faster than Galaxy S22’s, while also offering the top median 5G upload speed in the market at 55.22 Mbps. For users who prioritize the fastest 5G experience, Galaxy S24’s and iPhone 15’s are both worth a look.

Samsung Galaxy S24 family provides top 5G download speeds in Thailand 

In Thailand, Speedtest Intelligence showed that the Galaxy S24 family delivered the fastest median 5G download speed in the market at 171.27 Mbps. That speed marks a notable improvement of roughly 35 Mbps over the S22’s 132.60 Mbps and the S23’s 135.55 Mbps. The Galaxy S24 family also offered the lowest median 5G multi-server latency in Thailand at 32.46 ms. The iPhone 15 family provided the second-fastest median 5G download speed in the market at 147.53 Mbps.

Bottom line: If you’re thinking of upgrading from an S22 or S23 device, our findings suggest that the Galaxy S24 might be the right choice. With faster 5G speeds compared to previous generations, coupled with low latency, smartphones in the Galaxy S24 family should allow for quick content downloads and smooth connectivity overall.

Middle East and Africa 

Excellent 5G speeds in Nigeria, but too soon to tell if you should upgrade for performance 

In Nigeria, 5G speeds were impressive overall, from the Galaxy S23 family’s median 5G download speed of 281.67 Mbps to the new Galaxy S24’s speed of 383.97 Mbps. However, in these early days of the S24 lineup’s release, we are still waiting to see how things stabilize in the market before we can make a firm recommendation on whether to upgrade. 

Bottom line: For users who like to have the latest gear and/or want the new features offered by the S24 lineup, upgrading is certainly worth considering. But with fast 5G speeds in general, users on any of the device families we looked at should see a quick download experience in general. 

Samsung Galaxy S24 by far the fastest 5G in Qatar 

Home to some of the fastest 5G speeds in the world, Qatar showcased impressive median 5G download speeds across all three device families analyzed. The Galaxy S24 family led the pack with a jaw-dropping median 5G download speed of 971.49 Mbps and the top median 5G upload speed in the market at 66.52 Mbps. The Galaxy S22 and S23 families trailed, albeit with great median 5G download speeds of 675.06 Mbps and 758.49 Mbps, respectively. The iPhone 15 family also had a strong showing in Qatar, posting a median 5G download speed of 788.97 Mbps. 

Bottom line: Consumers in Qatar with older Galaxy S22 or S23 devices might want to make the switch, given that the S24 family’s remarkable median 5G download speed of nearly 1 Gbps was much faster than those of either the Galaxy S23 or especially S22 families.

Galaxy S24 a good option for Samsung fans in the U.A.E.

In the U.A.E., which is home to outstanding 5G speeds in general, the Samsung Galaxy S24 and iPhone 15 families delivered the top median 5G download speeds in the market at 828.11 Mbps and 819.48 Mbps, respectively. When compared to its earlier generation Samsung predecessors, the S24 family held a commanding speed advantage, boasting speeds that were at least 170 Mbps higher than those of either the S22 (639.33 Mbps) or S23 (657.79 Mbps) families. 

Bottom line: With median 5G download speeds ranging from 639.33 Mbps to 828.11 Mbps, consumers in the U.A.E. will likely enjoy fantastic speeds regardless of device model. However, for current S22 or S23 users hoping to boost their speeds, the Galaxy S24 family stands out as a good choice.

Europe

Galaxy 24 family clocked 5G speeds over 80 Mbps faster than those on S22 devices in France

In France, the Galaxy S24 family was the frontrunner, delivering the fastest median 5G download speed among all device families in the market at 292.15 Mbps. That marks a significant improvement of over 80 Mbps compared to the S22 family’s speed of 211.32 Mbps, along with a jump of more than 60 Mbps compared to the S23’s speed of 229.78 Mbps. Meanwhile, iPhone 15 users experienced the second-fastest median 5G download speed in the market at 257.15 Mbps, with 5G latency nearly identical to that of the S22 and S23 families.

Bottom line: For consumers currently using an S23 or especially an S22 model, upgrading to an S24 device is worth considering. Our results in France showed that the latest Samsung lineup delivered a superior 5G speed experience over older Galaxy models, especially those in the Galaxy S22 family.

Galaxy S24’s a good choice over S22 models in Spain

All four device families in Spain provided good 5G speeds, ranging from the S22’s median 5G download speed of 141.33 Mbps to the S24 family’s speed of 179.34 Mbps. While speeds recorded on S24, S23, and iPhone 15 devices were statistically similar, the difference in speed between the S24 and S22 was much starker, with the S24 nearly 40 Mbps faster than the S22. 

Bottom line: The decision to upgrade should be more straightforward for S22 users in Spain compared to those with S23 or iPhone 15 models, as the S24’s median 5G download speed of 179.34 Mbps was almost 40 Mbps faster than that of the S22 family. 

Samsung Galaxy S24 likely worth an upgrade from S22 in the U.K. 

In the U.K., Samsung Galaxy S24 models were the fastest in the market, with the S24’s median 5G download speed of 156.71 Mbps offering a speed gain of nearly 40 Mbps compared to the Galaxy S22 family. Galaxy S24 models also posted faster speeds than both the Galaxy S23 and iPhone 15 families, but the difference was less stark than it was with the S22 family, with Galaxy S22 models clocking in at 120.49 Mbps, Galaxy S23’s at 133.49 Mbps, and iPhone 15’s at 138.07 Mbps. 

Bottom line: U.K. consumers using either S22 or S23 models may want to look into upgrading to the S24 to enjoy faster speeds. That’s especially true for S22 users, given that the S24’s median 5G download speed was nearly 40 Mbps faster than that of S22 devices.

North America

No major 5G speed boost for users in Mexico who upgraded to a Galaxy S24 

5G speeds in Mexico were impressive, with all device families posting median 5G download speeds of 176.53 Mbps or better. While Speedtest users of the Galaxy S24 family experienced the fastest median 5G download speed in the market at 197.42 Mbps, that speed marked only a modest improvement compared to Galaxy S22 devices (186.51 Mbps) and iPhone 15 models (193.73 Mbps). The Galaxy S23 family showed the slowest 5G speed in the market at 176.53 Mbps, coming in about 20 Mbps slower than Galaxy S24 models

Bottom line: For users eager to embrace the new features offered by Galaxy S24 devices or move on from S23 devices, an upgrade might be worthwhile. However, with fast 5G speeds across all device families in Mexico and only about 20 Mbps separating all four device families in our study, users likely won’t see a major change in their 5G experience by upgrading. 

Galaxy S22 users in the U.S. could get faster 5G with the S24 family. 

5G speeds in the U.S. had an impressive showing across the board, with median 5G download speeds of at least 232.46 Mbps across all device families. The Samsung Galaxy S24 family led the way with an excellent median 5G download speed of 306.90 Mbps and the lowest median 5G multi-server latency at 45.71 ms. Users of the Galaxy S24 family enjoyed speeds roughly 75 Mbps faster than those on S22 models (232.46 Mbps) and approximately 65 Mbps faster than those on S23 devices (241.60 Mbps). Meanwhile, the iPhone 15 family also offered a strong performance, with a median 5G download speed of 272.99 Mbps. 

Bottom line: Users of older Samsung device models in the United States may want to switch to one of the newer models to capitalize on the faster 5G speeds offered by S24 devices, though speeds were strong for all device families in this study. 

Ookla will continue monitoring how devices are performing 

We’ll continue to check in on device performance as new models enter the market, so stay tuned for further insights into mobile and fixed broadband performance in countries around the world. 

If you’ve recently made the switch to an S24 device, make sure you’re getting the speeds you need by downloading the iOS or Android Speedtest® app.

Ookla retains ownership of this article including all of the intellectual property rights, data, content graphs and analysis. This article may not be quoted, reproduced, distributed or published for any commercial purpose without prior consent. Members of the press and others using the findings in this article for non-commercial purposes are welcome to publicly share and link to report information with attribution to Ookla.

| November 15, 2024

Introducing Downdetector® Push Notifications

You know Ookla® Downdetector as a powerful tool to troubleshoot your internet connection, giving you real-time details about internet sites and services that might be having issues. You probably also know you can access Downdetector in the free Speedtest® app. We know you’re busy and sometimes you want to know what’s broken on the internet before you get there, so we’ve added push notifications to the Speedtest app to give you real-time alerts about the services that are most important to you. 

Downdetector push notifications you might want to set up today:

  • Major retailers — discover whether all the Black Friday traffic overwhelmed their servers before you try to load up your cart 
  • Social media sites — did your latest video fail to get likes or is the site just not responding since you uploaded it?
  • Your internet provider — whether a big storm is coming or you have a big call, you want to know early if your internet is out so you can plan for alternatives
  • Streaming services — did the series finale crash the site? Find out before you pop the popcorn
  • Gaming sites and services — launch days are notoriously hard on these. Avoid the frustration of refreshing over and over to get that big game by knowing what’s not working in advance
  • Your bank — get alerted when the site is down before you go to pay your bills

How to set up Downdetector push notifications 

You should see a new “Introducing Downdetector Notifications” pop-up next time you open the free Speedtest app. If you have an account already, you can sign in and visit the Downdetector tab to start selecting favorites. 

If you don’t already have an account or are looking for more detailed instructions, see below.

First create a free account

create account screen

Downdetector push notifications are available to anyone with a free Speedtest account. There are two ways create an account:

  1. In the app — open the Speedtest app on either Android or iOS. Click the hamburger menu in the upper right corner. Click the blue button near the top of the app labeled “Create Account” and fill in the fields on the next screen. We’ll send you a verification email to confirm your account. Click the link in that email and you are ready to go.
  2. On Speedtest.net — click “Sign In” in the upper right corner. This will take you to a page where you can either create an account or sign in to an existing account. To create an account, click “Register” on the left side of the screen. Simply fill in the fields on the “Create an account” screen, check the Captcha box if you see one, and click “Register” again. We’ll send you a verification email to confirm your account. Click the link in that email and you are ready to go.

Pick your favorite services

screen to select favorite services

Tap the Downdetector tab at the bottom of your screen inside the Speedtest app. You’ll see a “Get Outage Alerts” pop-up where you’ll then want to click “Sign In” to sign into your free Speedtest account (if you aren’t already). 

Once you have signed in, you will see the Downdetector page you are used to seeing but with stars to the left of all the services. You can favorite up to three services to monitor by pressing the star the the left of the service name. The stars next to the services you have chosen will then turn blue. 

Next, you will be given a new pop-up where you can select “Allow Notifications.” This is the permission that allows us to notify you when your favorite services are experiencing reports of service disruptions. If you have already enabled push notifications from the Speedtest app, you will not have to do so again.

phone lock screen with Downdetector push notification

You’re all set! We’ll send you a notification the next time one of your favorite services is having issues. 

Prepare for the next major internet outage by setting up push notifications for your favorite services today. Easy access to outage details will help you decide if you need to work on something else for a while. Download the free Speedtest app for Android and iOS to set yourself up for success today.

Ookla retains ownership of this article including all of the intellectual property rights, data, content graphs and analysis. This article may not be quoted, reproduced, distributed or published for any commercial purpose without prior consent. Members of the press and others using the findings in this article for non-commercial purposes are welcome to publicly share and link to report information with attribution to Ookla.

| November 17, 2024

iPhone 16 5G Performance: How Does Apple's Latest and Greatest Compare to Previous iPhones and Samsung Galaxy Flagships?

The latest iPhone 16 family of smartphones launched on September 20, and with Black Friday approaching, many potential buyers are considering upgrading to a new iPhone model. But a key question remains: Is it worth it? To help answer that question, we’ve analyzed how the iPhone 16 family of devices measures up against its predecessors in terms of 5G speed and latency during its first several weeks on the market. 

Looking at Speedtest® data from 11 select countries around the world from September 20 – October 20, 2024, we examined whether the iPhone 16 lineup — comprising the iPhone 16, 16 Plus, 16 Pro, and 16 Pro Max models — outpaced Apple’s earlier iPhone 14 and 15 families for 5G speed and latency performance. We’ve also compared the 5G speeds and latency of iPhone models with Samsung’s most recent offering, the Galaxy S24 family, including the S24, S24+, and S24 Ultra.

It’s important to note that device performance metrics can vary significantly from one country to another. Factors such as the performance of networks themselves in each country, government and mobile operator investments in 5G infrastructure, spectrum allocations, and the extent of 5G network deployment all contribute to speeds and variations across countries. 

Key takeaways:

  • The Apple iPhone 16 lineup showed a statistically significant lead for median 5G download speeds in five out of 11 countries in this study. 
  • At the slower end of the scale, the Apple iPhone 14 offered the slowest median 5G download speeds in 7 out of 11 countries. It’s worth noting, however, that speed differences between the devices were relatively minor in some of the countries analyzed (see the charts below for details). 
  • The Samsung Galaxy S24 family recorded the lowest (and, therefore, best) median 5G multi-server latency in 8 countries, whereas the iPhone 16 lineup led for 5G latency in one market. 
  • The Galaxy S24 family led on median 5G upload speeds in 8 of 11 countries, while iPhone 14 and 15 devices typically showed the slowest upload speeds. 

To learn more about what speeds mean in real-world terms, check out our article looking at how much speed users need for a variety of daily mobile activities.

Take me straight to the data!

Asia Pacific | Europe | Latin America | North America 

New chipsets and modems in the iPhone 16 lineup 

When investing in an expensive new smartphone, consumers naturally want to know if the upgrade will be worth it. While the iPhone 16 lineup includes various new upgrades and features, let’s look at the components that impact connectivity performance, specifically the chipsets and modems across our study’s devices:

  • iPhone 16 base model and 16 Plus use the Apple A18 system on a chip (SoC), while the Pro and Pro Max models feature the A18 Pro, with all iPhone 16 devices incorporating the Snapdragon X75 5G modem.
  • iPhone 15 base models use the A16 Bionic chipset and Pro models run on the A17 Pro, and both are paired with the Snapdragon X70 5G modem
  • iPhone 14 and 14 Plus models are equipped with an A15 chipset, and the iPhone 14 Pro and Pro Max feature the A16 Bionic chip. All iPhone 14 devices use a Snapdragon X65 5G modem
  • Samsung Galaxy S24 devices also utilize the Snapdragon X75 5G modem

Do you own one of these devices? See how your speeds compare by taking a quick Speedtest

Digging into the data: Where does the Apple iPhone 16 lead its earlier iPhone and Samsung counterparts around the world?  

Early findings from Speedtest Intelligence® show that the latest iPhone 16 family outperformed its predecessors in terms of 5G performance across several of the markets we analyzed. While the performance differences between device families were minimal in some countries, iPhone 16 models demonstrated major speed advantages over previous generation Apple and Samsung devices in markets like Canada, France, Taiwan, and the United States.

Does that mean users in those locations should upgrade immediately? Not necessarily. The decision to upgrade depends on factors other than network performance, from price to new features and plenty of other things. However, our initial data on the 5G capabilities of the iPhone 16 series is encouraging in its early days of release.

Read on to see our complete analysis of all 11 countries in this study or select a region below to dig into more localized results.

Asia Pacific | Europe | Latin America | North America 

Asia Pacific 

iPhone 16 shows modest lead in 5G speeds in India

In India, all device families posted strong 5G results, with speeds ranging from 231.94 to 261.57 Mbps. The iPhone 16 lineup posted a median 5G download speed of 261.57 Mbps and the lowest median 5G multi-server latency at 44 ms. The Galaxy S24 family followed closely at 251.17 Mbps for downloads and claimed the top spot for 5G upload speeds at 19.69 Mbps. The iPhone 15 and 14 families trailed but still delivered solid speeds above 230 Mbps, with median 5G upload speeds of roughly 14 Mbps each.

Bottom line: Current iPhone 14 users might be tempted by the 30 Mbps advantage seen with the iPhone 16 lineup in this study. While 5G speeds were excellent across all device families in India, early adopters who want the latest and greatest might find the iPhone 16’s performance edge helps justify that upgrade itch.

Galaxy S24 family leads the Philippines for 5G speeds, while iPhone 16’s show modest advantage over previous iPhones

Speedtest Intelligence data revealed the Galaxy S24 family leading the Philippines market with a median 5G download speed of 158.47 Mbps and the lowest median 5G multi-server latency at 32 ms. The iPhone 16 lineup showed relatively minor improvement over its predecessors, posting a median 5G download speed of 125.68 Mbps, a tick above the iPhone 15 and 14 families (both registered speeds of about 120 Mbps).  

Bottom line: While the iPhone 16 showed slight improvements over previous iPhone generations, the Galaxy S24 family offered the strongest 5G performance in the Philippines, with a roughly 33 Mbps advantage in 5G download speeds.

iPhone 16 lineup leads Taiwan for 5G speed, with impressive performance across all devices

5G speeds were excellent across the board in Taiwan, with median 5G download speeds ranging from 287.83 to 342.37 Mbps. The iPhone 16 lineup led the market with a median 5G download speed of 342.37 Mbps. The Galaxy S24 family followed at 313.96 Mbps and matched the iPhone 16’s 5G upload performance at around 38 Mbps. The iPhone 15 and 14 families trailed the 16 lineup but still impressed with speeds above 287 Mbps.

Bottom line: The iPhone 16 lineup led Taiwan’s impressive 5G speed landscape by roughly 30 Mbps. However, with all device families delivering median 5G download speeds of at least 287 Mbps, users should experience excellent 5G performance regardless of which phone they choose, making the decision to upgrade a bit tricky and potentially more about the new model’s features than about speed.

Europe 

For users in Belgium, the iPhone 16 is worth a look

Speeds in Belgium were strong across the board, with the iPhone 16 lineup clocking a median 5G download speed of 237.37 Mbps. The iPhone 14 and 15 lineups trailed, posting median 5G download speeds of a little over 170 Mbps each. Latency was also impressive in general, with all four device families registering median 5G multi-server latency of 40 ms or better.

Bottom line: The iPhone 16 family’s current speed advantages over its predecessors in Belgium suggest an upgrade might be worth considering for users focused on 5G performance. That said, all devices in the market delivered good speeds that should provide users with quick downloads and strong connectivity overall. 

Upgrading to an iPhone 16 may be appealing for France users

In France, the iPhone 16 lineup led the way for 5G speed with a median 5G download speed of 279.29 Mbps, offering a speed advantage of nearly 60 Mbps compared to older iPhones. The Galaxy S24 family placed second at 242.34 Mbps and posted the lowest median 5G multi-server latency at 38 ms.

Bottom line: With the iPhone 16 lineup clocking 5G download speeds significantly faster than both previous iPhone generations and the latest Samsung devices, users seeking faster speeds may want to consider a new iPhone.

German users could see 5G speed gains with an iPhone 16 

The iPhone 16 lineup led the pack in Germany with a median 5G download speed of 172.69 Mbps, more than 40 Mbps faster than iPhone 14 and 15 models, which delivered speeds of roughly 130 Mbps each. Meanwhile, the Galaxy S24 series trailed in download speed, but it registered the lowest median 5G multi-server latency in the market at 34 ms.

Bottom line: If you’re using an older iPhone in Germany, the iPhone 16’s speed advantage over previous models – and Galaxy S24 devices – could make it an appealing upgrade option.

Latin America

No compelling reason to upgrade just yet in Brazil

All devices in our study showed outstanding 5G speeds in Brazil, with speeds ranging from the iPhone 14’s median 5G download speed of 444.29 Mbps to the Galaxy S24’s 482.95 Mbps. The iPhone 16 and 15 families posted similar speeds of 468.11 Mbps and 465.75 Mbps, respectively.

Bottom line: Brazil was home to the fastest 5G speed on an iPhone in our 11-country study, with even the “slowest” speed in the market outpacing the top performers in other markets by over 100 Mbps. With all device lineups performing exceptionally well, the decision to upgrade in Brazil might come down to features rather than speed.

Galaxy S24 outpaces the iPhone 16 lineup for 5G speed in Colombia

The Samsung Galaxy S24 family had a performance edge in Colombia, with its median 5G download speed of 246.05 Mbps coming in about 50 Mbps faster than its iPhone competitors. Its median 5G upload speed of 35.66 Mbps also led the market. All three iPhone lineups posted median 5G download speeds ranging from 181.27 Mbps to 195.25 Mbps.

Bottom line: The Galaxy S24 series led for 5G performance in Colombia, but when deciding whether to get a new device, raw speed isn’t always everything. Apple enthusiasts might consider the iPhone 16’s complete feature set and strong 5G speeds (even though they trailed those of the Galaxy S24 family), while current S24 users in Colombia will likely stand pat with the knowledge that their devices offer strong 5G performance in the market.

North America

iPhone 16 lineup in Canada faster than its predecessors

The iPhone 16 lineup showcased strong performance in Canada with a median 5G download speed of 182.43 Mbps, about 45 Mbps faster than those of earlier iPhone models. The Galaxy S24 family placed second at 155.61 Mbps and achieved the lowest median 5G multi-server latency at 34 ms, while iPhone 14 and 15 models trailed with still-strong speeds of 124.64 Mbps and 137.54 Mbps, respectively.

Bottom line: For Canadians looking for top-notch 5G performance, the iPhone 16 lineup makes a strong case with its lead in speed over older iPhone models. While all device families in Canada delivered good 5G speeds, for users who want both top performance and the latest features, the iPhone 16’s speed advantage might help justify that upgrade you’ve been considering.

No clear speed advantage in Mexico for the new iPhone 16 

The latest iPhone devices showed remarkably close 5G speeds in Mexico, with speeds varying by just a few megabits per second across the different iPhone families. While the iPhone 14 family had a median 5G download speed of 191.31 Mbps, the iPhone 15 and 16 lineups performed similarly well, clocking in at 185.88 Mbps and 185.79 Mbps, respectively. The Galaxy S24 family followed at 173.70 Mbps.

Bottom line: Users in Mexico considering an iPhone upgrade might want to weigh factors beyond 5G performance, as our data shows minimal speed differences between recent iPhone generations. The choice to upgrade likely depends more on desired features and other device capabilities than network performance alone. 

iPhone 16 offers a strong choice in the United States

In the United States, our results showed the iPhone 16 lineup reaching a median 5G download speed of 324.23 Mbps, well ahead of both the Galaxy S24 family at 287.35 Mbps and older iPhones at 244.48 Mbps (iPhone 15) and 220.76 Mbps (iPhone 14). All device families provided solid latency performance below 53 ms.

Bottom line: While all devices in our study provided good speeds in the U.S., the iPhone 16’s standout performance is hard to ignore and makes a strong case for upgrading, particularly for users seeking the fastest 5G.

Ookla will continue monitoring how devices are performing 

We’ll continue to check in on device performance as new models enter the market, so stay tuned for further insights into mobile and fixed broadband performance in countries around the world. 

If you’ve recently made the switch to a new iPhone, make sure you’re getting the speeds you need (and pay for) by downloading the Speedtest app for iOS or Android.

Ookla retains ownership of this article including all of the intellectual property rights, data, content graphs and analysis. This article may not be quoted, reproduced, distributed or published for any commercial purpose without prior consent. Members of the press and others using the findings in this article for non-commercial purposes are welcome to publicly share and link to report information with attribution to Ookla.