| February 24, 2025

Illustrating the Global State of 5G SA (Poster Download)

Global 5G SA rollouts are gaining momentum after a sluggish start, with China, India, Singapore, and the U.S. maintaining a substantial lead

The telecoms industry is approaching the midpoint of the 5G technology cycle, with capital investment in radio access network (RAN) expansion slowing significantly in developed markets over the last two years as the initial 5G coverage layer nears maturity. Many advanced operators are now prioritizing network densification while cautiously transitioning to a new 5G core architecture with standalone (SA), seeking to unlock new monetization opportunities through the enhanced flexibility, agility, and performance that 5G SA enables.

The interplay of high interest rates driving up the cost of capital, challenges in monetizing the initial non-standalone (NSA) architecture, and the technical complexity of the new 5G core—demanding an entirely new skill set to support implementation—has weighed on the global rollout of 5G SA, with significant regional disparities persisting in commercialization progress.

For the first time, and with the goal of offering deeper insight into the state of 5G SA worldwide, Ookla® has created a high-resolution downloadable poster based on Speedtest Intelligence® data, providing a unified view of the global reach of both 5G NSA and 5G SA networks in 2024. This visual is part of a flagship global study in collaboration with Omdia, comparing the competitiveness of leading regions and countries in 5G SA deployment, performance, and monetization.


Key Takeaways:

Asia Pacific remains at the forefront of global 5G SA deployment

In 2024, seven of the top ten countries by 5G SA reach were in Asia Pacific, with China (77.1% 5G SA sample share), India (51.1%), and Singapore (37.5%) leading globally. The region’s strong position has been driven by a higher number of multi-operator 5G SA deployments (as seen in China and Australia), extensive low-band rollout (such as Reliance Jio’s use of the 700MHz band for deep nationwide coverage in India), and favorable demographics, including very high urbanization in countries like Singapore.

Asia Pacific leads the world in 5G SA reach
Speedtest Intelligence® | 2024

Outside of Asia Pacific, the United States also ranks highly in 5G SA reach, despite only one of its three largest operators engaging in a commercial launch to date. In contrast, just two European countries—Spain and Austria—make the top ten, highlighting the region’s slow pace of 5G SA deployment and the broader decline in its global competitiveness in mobile network infrastructure during the 5G cycle.

Spectrum diversity propels the U.S. to a leading position in 5G SA performance

The U.S. has distinguished itself with significantly higher 5G SA reach than competing regions like Europe while also delivering superior median download speeds. In Q4 2024, median download speeds on 5G SA in the U.S. reached 388.44 Mbps, a substantial increase from 305.36 Mbps in the same period the previous year, and well ahead of Asian competitors such as Japan (254.18 Mbps) and China (224.82 Mbps).

The U.S.’s strong performance has been driven by T-Mobile’s post-merger 5G SA buildout—the first globally—which balanced nationwide reach with network depth. Its “layer cake” strategy combined a broad 600 MHz rollout, initially launched as 5G NSA in 2019 before transitioning to 5G SA in 2020, with mid-band deployments in the 2.5 GHz band. This approach has allowed T-Mobile to more extensively implement features like carrier aggregation and Voice over NR (VoNR) on its maturing 5G SA network, lending it a competitive edge in both availability and key performance metrics such as download speed and latency.


South Korea led the world in Q4 2024 with the highest median 5G SA download speeds at 746.25 Mbps, driven by its exclusive use of the 3.5 GHz band. However, it continues to trail its regional peers in 5G SA reach due to the challenging propagation characteristics exhibited by this spectrum and the limited commercialization beyond a single operator, KT.

5G SA enhances download speeds and latency globally, yet uplink advancements remain underutilized

Globally, 5G SA networks are delivering significantly improved performance across key metrics compared to the non-standalone architecture. In Q4 2024, median latency—a key beneficiary of transitioning to the 5G core—was nearly 20% lower on 5G SA networks compared to 5G NSA networks in Europe and China, and more than 25% lower in the United States and Japan. Similarly, median download speeds on 5G SA were more than 57% higher in Europe and 84% higher in China than those on non-standalone networks.

European 5G SA Users Benefit from Markedly Lower Latency and Higher Download Speed
Speedtest Intelligence® | Q4 2024

Notwithstanding these improvements, 5G SA’s full potential remains largely untapped in Europe. Advanced uplink capabilities unlocked by the technology—such as higher-order MIMO and carrier aggregation—remain limited to a few operators in leading markets like the United States, highlighting the still nascent profile of the device and equipment ecosystems for 5G SA. 


A detailed analysis of the state of 5G SA around the world is featured in Ookla’s flagship report, produced in collaboration with Omdia, on regional competitiveness in the technology.

Ookla will be at Mobile World Congress this year, located at Booth 2I28 in Hall 2. Please drop by to discuss the state of connectivity in your market, and how Ookla’s network insights can help deliver better connected experiences.

Ookla retains ownership of this article including all of the intellectual property rights, data, content graphs and analysis. This article may not be quoted, reproduced, distributed or published for any commercial purpose without prior consent. Members of the press and others using the findings in this article for non-commercial purposes are welcome to publicly share and link to report information with attribution to Ookla.

| October 1, 2024

How the 50 U.S. States Stack up in Broadband Speed Performance: 1H 2024

Check out the full report available now with the complete results for all 50 states.

Affordable, reliable, high-speed broadband is considered a necessity in the U.S. because it enables people to access online classes, secure health care assistance, register for basic government services, handle their banking needs and participate in many other essential services.  

It’s also critical to the economic viability of every state because it supports remote workers, enables businesses to operate more efficiently and attracts new enterprises to an area. 

But many states have struggled to make broadband service available to 100% of their residents primarily because service providers are focused on providing it to areas where it’s most profitable. Using Ookla’s Speedtest Intelligence® data, this report identifies the states that are currently delivering the minimum standard for fixed broadband speeds as established by the Federal Communications Commission (FCC) to the highest percentage of Speedtest users. It also singles out the states that need the most improvement when it comes to delivering the minimum standard for broadband to their residents. 

Key takeaways 

  • Connecticut, North Dakota, Delaware and six other states are the top performing states because they have the highest percentage of Speedtest users that meet the FCC’s minimum standard for fixed broadband speeds of 100 Mbps downstream and 20 Mbps upstream. While comparing small, densely populated states with larger, sparsely populated states may seem unfair, we thought it was important to note the current performance of each state so we can track their progress in future reports.  
  • New Mexico, Arizona and Minnesota saw the biggest improvement in the percentage of Speedtest users getting the FCC’s minimum standard for fixed broadband speeds (100 Mbps down/20 Mbps up) between the first half of 2023 and the first half of 2024.  
  • Washington, Alaska, Illinois and Oregon have the most prominent digital divide of all the 50 states. These four states have the biggest gap between the percentage of rural Speedtest users vs. the percentage of urban Speedtest users that get FCC’s minimum standard of broadband speeds of 100 Mbps downstream/20 Mbps upstream. 
  • Not surprisingly, less than 40% of the Speedtest users of Alaska, Montana and Wyoming (which are three of the least densely populated states in the U.S.), are receiving the minimum broadband speeds of 100 Mbps downstream/20 Mbps upstream.

Broadband in the spotlight

The COVID-19 pandemic put a spotlight on the importance of having broadband access and the role it played in allowing people to continue working and receiving access to healthcare as well as keeping students in school.  The American Rescue Plan Act of 2021 provided $3.2 billion to help low-income households in the U.S. pay for broadband access during the COVID-19 pandemic. 

This sudden focus on broadband accessibility, also prompted Congress to pass the Infrastructure Investment and Jobs Act of 2021 which set aside $42.5 billion for the Broadband, Equity, Access and Deployment (BEAD) program and provided funding for every state to expand its broadband services. The National Telecommunications and Information Administration (NTIA) runs the BEAD program and the funding is being used for planning, infrastructure, and adoption programs in all 50 states, Washington, DC and several U.S. territories. 

BEAD initially provided $100 million to every state with the remainder of the funding to be divided among the 50 states based upon their unserved and underserved populations. As of September 18, 2024, 44 eligible entities have been approved for both the Volume 1 and Volume 2 phases of BEAD. Volume 1 of the state’s proposal details the list of locations that are eligible for BEAD funding as well as a description of how certain entities can dispute the eligibility status of the various locations. Volume 2 includes each state’s description of how it plans to select ISPs and its overall broadband objectives. Once approved for both phases, states can then get access to the money that has been allocated for them.  

To help manage these federal funds every state and territory established a broadband office that is tasked with determining the extent of their broadband coverage problems and draft broadband strategies that will resolve the problem. 

The FCC in March 2024 decided to revise its current definition of broadband as 100 Mbps downstream and 20 Mbps upstream, which is a substantial upgrade from its previous benchmark of 25 Mbps download and 3 Mbps upload speed that was first established in 2015.

This is the first time in nearly a decade that the FCC raised the speed requirement. Although this new benchmark is being used throughout the U.S., many households still lack basic broadband services. 

Top performing states

Using Ookla’s Speedtest Intelligence® data collected in the first half of 2024 we were able to compare the median download and upload speeds in all 50 states and identify the states that currently doing the best job of delivering the FCC’s minimum standard for fixed broadband speeds (100 Mbps downstream/20 Mbps upstream) to the highest percentage of Speedtest users.  

At least 60% or more of the Speedtest users in Connecticut, North Dakota, Delaware, Maryland, New Hampshire, North Dakota, Rhode Island, Tennessee, Utah and Virginia are getting the FCC’s minimum standard for fixed broadband speeds of 100 Mbps downstream and 20 Mbps upstream.  In Connecticut, which is the top state, 65.8% of Speedtest users are receiving the minimum broadband standard. But at just 65.8% that indicates that there is much more work ahead for states. 

Interestingly, all nine of the states in this list have received final approval for both phases of BEAD funding. However, it’s unlikely that BEAD funding approval played any role in these nine states leading the rest of the country in delivering the minimum standard for broadband because BEAD funding isn’t expected to start impacting broadband deployment projects until 2025 at the earliest, with some states having to wait longer depending on their proposal status with NTIA.

Top performing U.S. states with over 60% of Speedtest users achieving broadband speeds

RankStatePercentage of Speedtest users achieving broadband speedsBEAD funding approval
1Connecticut65.8Yes
2North Dakota65.5Yes
3Maryland63.7Yes
4Delaware63.3Yes
5Rhode Island62.7Yes
6Tennessee62.2Yes
7Utah61.8Yes
8New Hampshire60.5Yes
9Virginia60.1Yes
Source: Ookla Speedtest data.
*Note NTIA approval of BEAD funding is changing rapidly. While BEAD funds haven’t likely played a role in broadband deployments yet, they will in the future.

Southwestern US sees big improvements in broadband 

New Mexico, Arizona and Minnesota saw the biggest improvement in the percentage of their residents getting the FCC’s minimum standard for fixed broadband speeds (100 Mbps down/20 Mbps up) between the first half of 2023 and the first half of 2024.  

New Mexico leads the rest of the states with its gains in broadband in the past year. Ookla data indicates that New Mexico saw a 50% increase in the percentage of its population with access to the FCC’s minimum broadband speeds of 100 Mbps/20 Mbps. Arizona also saw a 45% jump in the percent of  its population with access to the FCC’s minimum broadband speeds of 100 Mbps/20 Mbps. 

Arizona, and specifically, the city of Mesa, AZ, has been a hotbed of activity for fiber deployments. In 2022 Google Fiber decided to deploy fiber to Mesa, AZ after the city council approved plans to bring a data center to the area. In addition, AT&T also announced plans to bring its fiber service to Mesa in 2023. These new fiber entrants are competing with existing broadband providers Cox Communications and Lumen. 

U.S. states with largest year-on-year increase in Speedtest users achieving broadband speeds

RankStateIncrease in Speedtest users obtaining broadband speeds (1H 2023 vs 1H 2024)BEAD funding approval
1New Mexico50%Yes
2Arizona45%Yes
3Nevada37%Yes
4Minnesota38%No
5Colorado35%Yes
6Washington35%Yes
7Oregon32%Yes
8Wyoming32%Yes
9Maine30%Yes
10Utah29%Yes
Source: Ookla Speedtest data.
*Note NTIA approval of BEAD funding is changing rapidly. While BEAD funds haven’t likely played a role in broadband deployments yet, they will in the future.

Sparse population equals inferior broadband

Not surprisingly, the most sparsely populated states in the U.S. tend to also have the smallest percentage of their population receiving the FCC’s minimum broadband speeds. Building broadband networks in rural states is incredibly expensive, and in some areas the terrain can make it nearly impossible. For example, in Alaska, where the ground may be frozen for many months out of the year, it’s difficult to dig trenches to install fiber. 

Ookla’s Speedtest data collected in the first half of 2024 found that less than 40% of the residents of Alaska, Montana and Wyoming (which are three of the most sparsely populated states in the U.S.), receive the minimum broadband speeds of 100 Mbps downstream/20 Mbps upstream.

The digital divide is still evident in many states

A big part of the impetus behind the federal government’s BEAD program is to finally close the gap between those with and without access to broadband, or what is commonly referred to as the digital divide.

But there are still many states that have a prominent gap between the number of rural and urban residents that have access to the FCC’s minimum standard of broadband speeds of 100 Mbps downstream/20 Mbps upstream.

Using the Census Bureau’s urban-rural classification and Ookla data compiled in the 1H of 2024, Washington, Alaska, Illinois and Oregon have the biggest digital divide compared to the other 50 states. For example, while 61.1% of urban Speedtest users in Washington state receive broadband speeds of 100 Mbps/20 Mbps, only 28.7% of its rural Speedtest users receive those same speeds.  

Breaking Down the Digital Divide
Percentage of urban and rural Speedtest users in each state with access to broadband speeds of 100/20 Mbps.

Broadband speeds are improving but more work is needed

U.S. broadband networks offer faster and more reliable connectivity to more people today than they did just a few years ago, however there’s still a large percentage of the U.S. population without adequate access to broadband connectivity.  

Thanks to new funding such as the BEAD program, there are many efforts underway to improve modern broadband networks. We expect to see these advancements in 2025 as more states start to put their BEAD funding into action. 

We will provide semi-annual updates on the broadband speed performance of providers in the 50 states and also to track the improvements that states are making to bridge the digital divide. For more information about Speedtest Intelligence data and insights, please get in touch.

Ookla retains ownership of this article including all of the intellectual property rights, data, content graphs and analysis. This article may not be quoted, reproduced, distributed or published for any commercial purpose without prior consent. Members of the press and others using the findings in this article for non-commercial purposes are welcome to publicly share and link to report information with attribution to Ookla.

| August 28, 2024

Paris - Do Major Sporting Events Leave a Network Legacy?

With the 2024 Summer Olympics in Paris having concluded on Sunday 11th August, and the handover to Los Angeles 2028 complete, we look back at how mobile networks performed during the Games, and examine the legacy of other major sporting events. Our data shows a strong increase in upload performance across both 4G and 5G networks in Paris in time for the event. However data from past events shows that this is a common trend, and that not all major sporting events leave a network legacy, with many deployments focussed on adding temporary capacity which is then removed post-event. The African Cup of Nations in Cote D’Ivoire, which took place in January and February 2024, is one exception, with 4G-LTE performance in the capital city of Abidjan increasing in time for the event and being sustained for the six month period afterwards. With so much infrastructure investment targeted at these events, often in congested areas of large cities, operators and organizers should do more to ensure they leave a lasting impact on the network user experience.

Driving network improvements to ensure sufficient capacity for major events

Major sporting events place considerable strain on public mobile networks, necessitating careful planning to anticipate demand. In the case of the Paris Olympics, organizers deployed additional cell sites and backhaul (both permanent and temporary), and added fiber. They also deployed a dedicated private wireless 5G network. Orange, the official connectivity partner of the Paris Olympics, opened up its 5G network to existing 4G consumer and business customers across France, from June to September. In addition to allowing existing 4G users to try 5G, this also freed up capacity on Orange’s 4G network, allowing it to better support 4G roaming users. The mobile operator also implemented an innovative push-to-talk (PTT) service over 4G to allow those organizing the Games to communicate more securely and effectively. For many large events like this, the host city or nation will embark upon significant upgrades to transport links and communication networks, and organizing committees such as the IOC and FIFA are increasingly keen that the events leave a legacy for residents and future visitors.

Network performance, based on consumer-initiated Speedtest samples, showed an increase in median 5G download performance in Paris during the weeks leading up to the opening ceremony on 26th July, as well as sustained performance across the duration of the event. What’s more interesting is the trend in median 5G upload speeds, which ramped up in early July to reach a weekly high of 27.07 Mbps in the week of the opening ceremony, but declined thereafter, down to 23.30 Mbps during the final week. Since the games concluded, 5G performance has picked up again, as the crowds who attended have subsided and the demand on the network abates.

Paris, Summer Olympics 2024 – Weekly Performance Before & During the Games
Speedtest Intelligence® | May – August 2024


This stronger proportional uplift in upload performance over download highlights the desire of network operators to adequately serve the anticipated spike in demand from users to upload and stream video content. Despite this, upload performance over 5G remained approximately 1/10th that of download performance, while Orange’s private wireless 5G network, geared to serve the upload of high-definition content from the Games to the International Broadcasting Centre, was configured to have 80% of its throughput dedicated to the uplink. 4G performance followed a similar pattern, showing stable median download speeds and a ramping up of upload performance.

Assessing the network legacy of past events

While we wait to evaluate the network legacy of these Games for Parisians, we examined previous sporting events, to assess whether the network infrastructure deployed had a more permanent or transitory impact on users. We looked at network performance six months prior to, during, and six months following the events.

5G Performance – Select Major Sporting Events
Speedtest Intelligence® | 2020-2024

5G uplink performance is clearly prioritized for these major events, which makes sense given the increased demand from visitors to upload and stream live content. With the exception of Tokyo, the other three major events saw a statistically significant improvement in median 5G upload speeds. The World Cup in Qatar led the way with a 34.8% improvement, followed closely by Paris with a 29.5% increase. That said, the improvements appear only temporary, with median upload speeds falling in the six months after each event. The uplift is more muted for median 5G download performance, with an increase recorded for both the Winter Olympics in Beijing and the FIFA World Cup in Qatar, while differences in 5G download speeds at the Summer Olympics in Paris and in Tokyo were too close to call. 

4G-LTE Performance – Select Major Sporting Events
Speedtest Intelligence® | 2016 – 2024

4G performance leading up to these major events paints a similar picture to 5G, with more of a focus on improvements to uplink capacity, however there is evidence of more sustained performance post-event. While there was no statistically significant increase in 4G download performance in time for the Summer Olympics in Paris, upload performance ramped up by 9.7%. We also recorded increased upload performance for the Summer Olympics in Rio de Janeiro, the Winter Olympics in Beijing, and for the African Cup of Nations in Cote D’Ivoire. The latter two of these recorded increases in both 4G download and upload performance in time for the events, and in Abidjan this performance uplift was sustained for the six months following the event.

We’ll continue to examine network performance at major events globally. We’re keen to see how the network build advances for LA28, especially given the big focus on major transport initiatives, including “Twenty-Eight by ’28”, which is really placing infrastructure development at the heart of the games.

Ookla retains ownership of this article including all of the intellectual property rights, data, content graphs and analysis. This article may not be quoted, reproduced, distributed or published for any commercial purpose without prior consent. Members of the press and others using the findings in this article for non-commercial purposes are welcome to publicly share and link to report information with attribution to Ookla.

| June 24, 2024

5G in the U.S. – Additional Mid-band Spectrum Driving Performance Gains

5G performance in the United States continues to improve as more mid-band spectrum becomes available. In March, T-Mobile gained access to additional 2.5 GHz spectrum it won at auction 108 in 2022, and we’re already beginning to see the impact of this, adding extra capacity to its 5G network and boosting performance in rural U.S. locations in particular. In just one month, T-Mobile’s median download performance across the U.S. increased by 29.64 Mbps. Its recent agreement to acquire the bulk of US Cellular’s wireless operations and a portion of its spectrum holdings will help it further reinforce its competitive lead. Verizon and AT&T have both benefited from the early vacation of C-band spectrum by satellite providers, the licenses for which were acquired through Auction 107 in February 2021. AT&T acquired additional 3.45 GHz licenses, former U.S. Department of Defense spectrum, made available through Auction 110 which concluded in January 2022. All three major carriers have since been upgrading their sites to support their new spectrum frequencies. This update reviews the latest Speedtest Intelligence® data to highlight the impact of deployments in new spectrum bands for U.S. 5G users.

Key takeaways

  • Recent trends highlight the importance of additional mid-band spectrum for 5G. Speedtest Intelligence data shows a clear correlation between the release of additional mid-band spectrum, 5G performance, and consumer sentiment for 5G networks, with all three national wireless providers benefitting over the past 6 months. This sends a clear message to the FCC and other regulators, of the benefits of allocating additional spectrum for cellular use, as advocated for by industry bodies such as the CTIA, CCA and GSMA.
  • T-Mobile intent on holding its lead. While C-band spectrum allowed Verizon in particular to play catch-up during Q4 2023, T-Mobile has continued to build on its performance advantage and innovate, moving to a 5G Standalone (SA) architecture, testing six carrier aggregation, while also benefiting from deploying in additional mid-band spectrum starting in March. T-Mobile recorded a median 5G download speed of 287.14 Mbps as of March 2024, an increase of 29.64 Mbps in a single month, which helped it extend its lead over Verizon, which recorded 224.67 Mbps, and AT&T with 145.36 Mbps. Additional spectral capacity will also help fuel further growth of 5G Fixed-Wireless Access (FWA) services, as wireless operators have had to be selective in signing up new fixed customers in order to manage capacity.
  • Additional mid-band spectrum helping close the gap on regional disparities within the U.S. While the U.S. ranks highly on 5G performance, 5G Service, and 5G Availability metrics versus other leading 5G markets globally, there have remained wide disparities in 5G performance between U.S. states, and between urban and rural locations. Recent mid-band spectrum deployments are starting to shift the needle for a number of states and rural communities.
  • 5G upload and latency performance need more attention. To date, capacity gains from additional spectrum are being directed almost universally to boost 5G download performance, in part because 5G-NR TDD radios are being used in both 2.5 GHz and 3.5 GHz bands. While latency remains relatively static, we do see a consistent improvement from T-Mobile, a trend which will be important if the carrier is to differentiate itself on latency-critical applications in the future.

T-Mobile continues to maintain its national lead on 5G performance

Speedtest Intelligence data for the U.S., covering the last three years, clearly shows how instrumental additional mid-band spectrum has been for all major US carriers. Four points in time stand out very clearly when we look at median download speeds across the market:

  • T-Mobile’s deployment of 5G in both 600 MHz and 2.5 GHz spectrum during 2021 (acquired through the merger with Sprint), giving it a significant early advantage, as AT&T and Verizon focussed more heavily on mmWave spectrum.
  • Verizon performance picked up in January 2022, after it began C-band deployments, which had been delayed due to concerns of interference at airports from the FAA. 
  • The early vacation of the remaining C-band spectrum by incumbent satellite operators in August 2023, giving AT&T and Verizon full access to the spectrum frequencies they acquired at auction in 2021.
  • T-Mobile’s recent deployment following the release of additional 2.5 GHz spectrum as part of Auction 108, beginning in March 2024.

Chart fo U.S. 5G Median Download Speeds | January 2021 - May 2024

T-Mobile had capitalized on its early advantage, building out 5G in 600 MHz spectrum to cover 200 million Points of Presence (PoPs) as of 2020, following that up with wide deployment in its mid-band 2.5 GHz spectrum holdings. Despite performance boosts for AT&T and Verizon from additional C-band spectrum in Q4 2023, T-Mobile still led the pack with a median 5G download speed of 275.50 Mbps as of May 2024, 23% faster than next placed Verizon. Its lead had narrowed since August, with Verizon’s C-band spectrum helping it increase median 5G performance from 133.56 Mbps in June to 215.57 Mbps in December. AT&T also saw performance pick up in the second half of 2023, and at the turn of the year, these trends pointed towards a much more competitive 5G market during 2024, while also driving increased capacity for wireless provider’s 5G FWA services.

T-Mobile has continued to innovate in order to drive performance gains across its 5G network. In addition to deploying a 5G Standalone architecture, it is pushing the envelope on carrier aggregation, most recently completing a test with Ericsson and Qualcomm of six carrier aggregation, stitching together two channels of each of its 2.5 GHz, PCS, and AWS spectrum to achieve download speeds in excess of 3.6 Gbps. Furthermore, having finally gained access to additional 2.5 GHz spectrum it won during auction 108 in 2022, but had not been cleared to use, T-Mobile has rapidly been enabling the new spectrum across its footprint. This has allowed it to extend its lead in the market, recording a median 5G download speed of 287.14 Mbps in March 2024. As cellular providers ramp up their home broadband offerings via 5G fixed wireless access (FWA), as we recently highlighted, they will need to balance fixed net additions carefully in order to ensure cellular performance does not suffer, and will require additional high capacity spectrum over time to meet demand.

Driving improved quality of experience and consumer sentiment

The uplift in 5G performance is driving improved consumer sentiment, as measured by net promoter score (NPS). NPS is a key performance indicator of customer experience, categorizing users into Detractors (score 0-6), Passives (score 7-8), and Promoters (score 9-10), with the NPS representing the percentage of Promoters minus the percent of Detractors, displayed in the range from -100 to 100. Reviewing Speedtest Intelligence data shows that U.S. cellular providers returned either flat or declines in 5G NPS over the period March to August 2023. From September onwards, we see a strong uplift in 5G NPS in particular for Verizon and AT&T following their C-band deployments. T-Mobile on the other hand, has seen a sizable increase in 5G NPS in March, corresponding to its deployment in additional mid-band spectrum.

Chart of 5G Net Promoter Scores, U.S. Wireless Providers

Key to this growth in 5G NPS for all three cellular providers, is the impact that increases in 5G performance are impacting the quality of experience for end users for key use cases such as video streaming and mobile gaming. Both measures, as highlighted by Ookla’s 5G Game Score™ and 5G Video Score™ metrics have seen strong increases over the course of the past year.

5G Video & Gaming Quality of Experience
Speedtest Intelligence® | Q1 2023 – Q1 2024

Positioning the U.S. strongly internationally

Performance gains from all national cellular providers have enabled the U.S. to climb the ranks when compared to its peers internationally. Over the course of just one year, it has moved from 20th place on Ookla’s Speedtest Global Index, to reach 11th as of February 2024. This has been driven by increased availability of mid-band spectrum for 5G use, as advocated for by the CTIA, which recently released a report claiming that the U.S. could benefit from an additional $200 billion in economic growth over the next 10 years through allocating additional mid-band spectrum for 5G.

U.S. providers are also continuing to expand the reach of 5G networks across the market. 5G Service, the share of known operator locations where 5G was present (of total locations with cellular service) climbed from 68.4% in Q3 2023 to 76.7% in Q1 2024. Deployment of 5G in low band spectrum is also critical to ensuring high 5G Availability – the share of 5G users that spend a majority of their time connected to 5G networks. The U.S. still tracks as one of the leading markets globally for 5G Availability, despite its comparatively large landmass, although that metric remained level quarter-on-quarter.

5G Service and 5G Availability – U.S. vs Other Leading 5G Markets
Speedtest Intelligence® | Q1 2024

Closing disparities in 5G performance between U.S. states & rural locations 

While national median speeds continue to advance, there remain some significant disparities in 5G performance at an individual state level. The Midwestern States fare best, with Illinois, Kansas, North Dakota, and Minnesota all within the top-5 performing states nationally, with median 5G download speeds above 225 Mbps during Q4 2023. At the other end of the scale are U.S. states with the highest shares of rural populations, including Vermont, Maine, Mississippi, and West Virginia, which had median download speeds below 100 Mbps. 

5G Median Download Speed by U.S. State (Mbps)
Speedtest Intelligence® | Q4 2023

Differing allocations of spectrum, channel bandwidths, device capabilities, and carrier aggregation options all impact the observed performance of each service provider across the locations they serve. While each network operator has its own 5G deployment strategy, the deployment of mid-band spectrum for capacity in urban locations, complemented with sub-1 GHz spectrum to enable wider and better 5G coverage, is the common approach. While performance gaps will remain as a result of these deployment strategies, recent mid-band spectrum deployments, including in C-band and 2.5 GHz, are beginning to help close the performance gap for some states. 

We examined T-Mobile’s recent performance, comparing data between February and March, as it deploys 5G in its additional 2.5 GHz spectrum. The results show performance has increased across a wide range of U.S. states, with its median 5G performance increasing by more than 10 Mbps within 35 States and the District of Columbia. Among the ten states with the lowest median 5G download speed (based on data for all providers), T-Mobile showed the most significant performance uplifts in West Virginia (+79.73 Mbps), Wyoming (+66.61 Mbps), and New Hampshire (+48.50 Mbps).

T-Mobile’s 2.5 GHz Dividend – Uplift in 5G Median Download Speeds (Top 15 Improving States)
Speedtest Intelligence® | March vs February 2024

Speedtest Intelligence data also illustrates the gap between rural and urban U.S. locations, which has widened over the last three years as mid-band deployments have tended to focus on more urban locations. That is beginning to change, with both T-Mobile and Verizon keen to highlight the impact of their recent spectrum deployments on rural 5G performance. While AT&T only saw a minor increase in median 5G download speeds in rural locations, both T-Mobile and Verizon have targeted significant increases in performance through mid-band spectrum deployments.

Mid-band spectrum driving improvements in urban & rural 5G performance
Speedtest Intelligence® | Q1 2021 – Q1 2024

All eyes on download throughput – upload & latency require attention

Additional spectrum has fueled surges in download performance thanks to the deployment of 5G in mid-band spectrum, but upload and latency metrics have not improved to the same degree. All three cellular providers maintained relatively static median upload speeds across the two year period we examined (Q1 2022 to Q1 2024). 5G latency performance was a mixed picture, with T-Mobile the only provider to consistently improve, reducing its latency from 55 ms in Q1 2022 to 46 ms in Q1 2024. Both Verizon and AT&T saw latency grow over the same period.

5G Median Upload and Latency Performance, (by provider, U.S.)
Speedtest Intelligence® | Q1 2022 – Q1 2024

It’s very clear that U.S. cellular providers are prioritizing improvements in download performance. This will likely continue in 2024, as T-Mobile, AT&T, and Verizon each seek to gain the upper hand, using any 5G network advantages to capture a larger share of competitive churn. Over time however, we expect the relative importance of upload and latency performance to grow, as 5G download performance begins to exhibit diminishing marginal returns, and increasing importance is given to improving the experience of latency-sensitive use cases such as video calling, mobile gaming, and augmented reality.

2024 is set to drive renewed competitive pressure between all of the service providers in the U.S., with the continuing deployment of 5G in mid-band spectrum, T-Mobile’s acquisition of US Cellular’s assets, and made all the more interesting given the DISH wildcard. We’ll continue to monitor and report on 5G performance trends in the U.S., and their impact on Speedtest users. To learn more about Ookla Speedtest Intelligence, please get in touch.

Ookla retains ownership of this article including all of the intellectual property rights, data, content graphs and analysis. This article may not be quoted, reproduced, distributed or published for any commercial purpose without prior consent. Members of the press and others using the findings in this article for non-commercial purposes are welcome to publicly share and link to report information with attribution to Ookla.

| January 16, 2024

52 New Ookla Market Reports Available for Q4 2023

Ookla® Market Reports™ identify key data about internet performance in countries across the world. This quarter we’ve provided updated analyses for 52 markets using Speedtest Intelligence® and summarized the top takeaways below. Click through to the market report to see more details and charts about the countries you’re interested in, including the fastest fixed broadband providers and mobile operators, who had the most consistent service, as well as 5G and device performance in select countries during Q4 2023. Jump forward to a continent using these links:

Africa | Americas | Asia | Europe | Oceania

Africa

  • Côte d’Ivoire: Orange recorded the fastest median mobile and fixed download speeds during Q4 2023, at 30.13 Mbps and 65.90 Mbps, respectively. Moov Africa recorded the lowest mobile median multi-server latency at 83 ms, while CANALBOX recorded the lowest latency over fixed broadband at 70 ms. Of Côte d’Ivoire most populous cities, Abidjan had the fastest median fixed download speed of 58.88 Mbps.
  • Mozambique: Tmcel recorded the fastest mobile median download speed of 27.80 Mbps in Q4 2023, and also the highest mobile Consistency at 91.6%. Of Mozambique’s most populous cities, Maputo had the fastest median mobile and fixed download speeds at 26.33 Mbps and 14.65 Mbps, respectively. SpaceX’s Starlink recorded the fastest fixed broadband median download speed in Q4 2023 at 36.13 Mbps, along with the highest Consistency at 49.7%. Meanwhile, TVCABO recorded the lowest latency over fixed broadband at 16 ms.
  • Senegal: There was no winner of fastest median mobile performance in Senegal during Q4 2023, with Free and Orange both tied. Orange led the market for median fixed broadband download performance, with 21.46 Mbps in Q4 2023. Orange also had the lowest latency at 90 ms and highest Consistency of 45.4%. Of Senegal’s most populous cities, Dakar had the fastest median fixed download speed of 27.11 Mbps.

Americas

  • Argentina: Personal had the fastest median download speed over mobile at 36.59 Mbps, while also registering the lowest latency of 39 ms during Q4 2023. In the fixed broadband market, there was no statistically fastest network, with Movistar and Telecentro delivering median download speeds of 106.41 Mbps and 105.98 Mbps, respectively. Movistar recorded the lowest latency of 9 ms. Among Argentina’s most populous cities, Mendoza recorded the fastest mobile median download speed of 37.75 Mbps, while Buenos Aires recorded the fastest fixed download speed of 109.79 Mbps.
  • Belize: Digi had the fastest median mobile download and upload speeds of 17.50 Mbps and 9.28 Mbps, respectively during Q4 2023. Digi also recorded the highest Consistency of 80.3%, while smart! recorded the lowest median latency of 56 ms. There was no statistically fastest fixed network in the market based on download speed, however NEXGEN recorded the fastest median upload speed at 47.47 Mbps.
  • Canada: Bell was the fastest mobile operator in Canada with a median download speed of 121.33 Mbps in Q4 2023. Bell also had the fastest median 5G download speed at 194.23 Mbps. Rogers had the fastest median mobile upload speed of 15.10 Mbps, and the highest Consistency of 88.2%. Bell pure fibre was fastest for fixed broadband, recording a median download speed of 307.77 Mbps and a median upload speed of 264.97 Mbps. Bell pure fibre also recorded the highest Video Score, of 87.90. Of Canada’s most populous cities, St. John’s recorded the fastest median mobile download speed at 171.76 Mbps, while Fredericton recorded the fastest median fixed broadband download speed of 247.89 Mbps.
  • Colombia: Movistar was fastest for fixed broadband with a median download speed of 210.46 Mbps in Q4 2023. ETB had the lowest latency over fixed broadband at 7 ms. Of Colombia’s most populous cities, Cartagena recorded the fastest median fixed download speed of 146.74 Mbps.
  • Costa Rica: Claro had the fastest median download speed among mobile operators at 40.56 Mbps during Q4 2023. Liberty recorded the fastest median upload speed at 10.73 Mbps, the lowest mobile latency at 33 ms, and the highest Consistency at 78.6%. Metrocom was fastest for fixed broadband download and upload performance, at 225.94 Mbps and 179.66 Mbps, respectively. Metrocom also recorded the lowest latency, at 6 ms.
  • Dominican Republic: Claro had the fastest median download and upload speeds among mobile operators at 34.27 Mbps and 9.84 Mbps, respectively. Claro also recorded the highest Consistency, at 77.0%. Viva had the lowest mobile latency at 43 ms. SpaceX’s Starlink was fastest for fixed broadband download performance at 48.08 Mbps, while Claro recorded the fastest median upload speed at 25.38 Mbps, and the lowest latency at 41 ms. Altice recorded the highest fixed broadband Consistency, at 66.6%.
  • Ecuador: CNT recorded the fastest median mobile download speed during Q4 2023, at 26.22 Mbps, while Movistar recorded the lowest mobile multi-server latency at 41 ms. Netlife was fastest for fixed broadband, with a median download speed of 91.56 Mbps. Netlife also recorded the lowest latency over fixed broadband at 8 ms. Xtrim recorded the highest fixed broadband Consistency at 84.8%. Of Ecuador’s most populous cities, Santo Domingo recorded the fastest median mobile download speed of 31.58 Mbps, while Guayaquil recorded the fastest median fixed download speed of 88.59 Mbps.
  • El Salvador: Claro had the fastest median download speed among mobile operators in El Salvador, at 40.97 Mbps, along with the highest Consistency of 90.4%. Movistar registered the fastest median mobile upload speed of 13.35 Mbps and lowest latency at 73 ms. Cable Color recorded the fastest median fixed download speed at 55.57 Mbps, the top median upload speed at 57.04 Mbps, and the lowest median latency of 51 ms. Of El Salvador’s most populous cities, Santa Tecla showed the fastest median mobile and fixed download speeds during Q4 2023 at 39.27 Mbps and 54.98 Mbps respectively.
  • Guatemala: Claro was the fastest mobile operator in Guatemala during Q4 2023 with a median download speed of 41.63 Mbps and a median upload speed of 19.61 Mbps. Claro also had the highest Consistency at 87.9%, while also leading the market for 5G performance, with a median 5G download speed of 388.34 Mbps. Tigo recorded the lowest median mobile latency at 79 ms. SpaceX’s Starlink was fastest for median fixed download performance at 54.32 Mbps, while Cable Color was fastest for fixed upload performance at 33.45 Mbps. Cable Color also had the lowest median latency on fixed broadband at 27 ms. Claro recorded the highest fixed broadband Consistency at 73.1%. Of Guatemala’s most populous cities, Escuintla showed the fastest median mobile download speed during Q4 2023 at 44.16 Mbps, while Villa Nueva recorded the fastest median fixed download speed, at 60.83 Mbps.
  • Guyana: There was no winner of fastest median mobile performance in Guyana during Q4 2023, with ENet and Digicel posting median download speeds of 24.64 Mbps and 23.53 Mbps, respectively. ENet recorded the fastest median mobile upload speed at 18.49 Mbps and offered the lowest median latency at 143 ms. In the fixed broadband market, ENet recorded the fastest median download and upload speeds, of 70.20 Mbps and 52.25 Mbps, respectively, while also recording the lowest median latency of 130 ms. GTT recorded the highest fixed broadband Consistency during Q4 2023, at 69.2%.
  • Haiti: Digicel was the fastest mobile operator in Haiti with a median mobile download speed of 14.26 Mbps, a median upload speed of 10.52 Mbps, and Consistency of 67.2%. Natcom recorded the lowest mobile latency, of 62 ms. SpaceX Starlink had the fastest median fixed download speed at 41.73 Mbps. Natcom had the fastest median fixed upload speed at 31.89 Mbps, the lowest median fixed latency at 47 ms, and the highest fixed broadband Consistency of 64.0%.
  • Honduras: Claro recorded the fastest median mobile download and upload speeds during Q4 2023, of 53.06 Mbps and 16.22 Mbps, respectively, while also recording the highest Consistency at 87.2%. Tigo recorded the lowest median mobile latency at 93 ms. Claro had the fastest median fixed download speed at 47.26 Mbps during Q4 2023, and the highest fixed broadband Consistency at 80.2%. TEVISAT recorded the fastest median upload speed, of 22.36 Mbps, and the lowest median fixed latency at 20 ms. Of Honduras’ most populous cities, El Progreso recorded the fastest median mobile download speed during Q4 2023, of 41.69 Mbps, while Tegucigalpa showed the fastest median fixed download speed at 41.97 Mbps.
  • Jamaica: There was no winner of fastest median mobile download performance in Jamaica during Q4 2023, with Flow and Digicel tied. Digicel recorded the fastest median upload speed of 8.37 Mbps and highest Consistency of 81.9%. Flow had the lowest mobile median latency at 38 ms. SpaceX Starlink had the fastest median download speed over fixed broadband at 84.10 Mbps, and the highest fixed broadband Consistency at 77.8%. Digicel+ recorded the fastest median upload speed of 46.14 Mbps, while Flow recorded the lowest median fixed latency at 25 ms.
  • Mexico: Telcel had the fastest median download and upload speeds over mobile at 52.06 Mbps and 13.50 Mbps, respectively, and the operator also delivered the fastest median 5G download speed at 233.82 Mbps. Telcel also had the lowest mobile median latency at 62 ms and highest Consistency at 87.2%. Totalplay was fastest for fixed broadband with a median download speed of 88.87 Mbps and a median upload speed of 30.50 Mbps. Totalplay also had the lowest median fixed broadband latency at 28 ms and the highest Consistency at 84.0%. Among Mexico’s most populous cities, Monterrey recorded the fastest median mobile download speed of 38.36 Mbps, while Guadalajara recorded the fastest median fixed broadband speed of 80.32 Mbps.
  • Panama: MasMovil was the fastest mobile operator with median download and upload speeds of 27.24 Mbps and 15.18 Mbps, respectively, as well as the highest Consistency of 79.3%. Digicel recorded the lowest median mobile latency, at 34 ms. There was no winner of the fastest median fixed download performance, with both Tigo and MasMovil tied. MasMovil recorded the fastest median upload speed of 33.38 Mbps and the lowest median latency at 16ms. Among Panama’s most populous cities, David recorded the fastest median mobile download speed of 21.57 Mbps, while La Chorrera recorded the fastest median fixed broadband speed of 156.71 Mbps.
  • Peru: Claro was the fastest mobile operator in Peru with a median download speed of 23.30 Mbps during Q4 2023, and also had the highest mobile Consistency in the market with 80.6%.
  • Trinidad and Tobago: Digicel had the fastest median download speed over mobile at 33.29 Mbps and the highest Video Score in the market at 74.86. bmobile recorded the fastest median mobile upload speed of 12.17 Mbps, and the lowest median latency at 32 ms. Digicel+ had the fastest median fixed broadband download and upload speeds at 118.53 Mbps and 107.24 Mbps, respectively. Digicel+ also had the lowest median latency at 7 ms.
  • United States: T-Mobile was the fastest mobile operator with median download and upload speeds of 188.96 Mbps and 12.19 Mbps, respectively. T-Mobile also recorded the highest mobile Consistency at 87.3%, and the lowest median mobile latency of 50 ms. T-Mobile also led the market with the fastest median 5G download speed at 238.87 Mbps, as well as the lowest 5G latency of 48 ms. T-Mobile secured the highest Video Score across all technologies with 78.21, and for 5G, with a Video Score of 81.54. Cox led the market as the fastest fixed broadband provider with a median download speed of 261.27 Mbps, while AT&T Internet recorded the fastest median fixed upload speed of 195.64 Mbps, and Verizon had the lowest median latency over fixed broadband at 15 ms.
  • Uruguay: Antel was the fastest mobile operator in Uruguay during Q4 2023 with a median download speed of 117.79 Mbps, and recorded the lowest median latency of 44 ms.
  • Venezuela: Digitel was the fastest mobile operator with a median download speed of 14.37 Mbps and a median upload speed of 6.97 Mbps during Q4 2023. Digitel also recorded the highest Consistency in the market, with 68.0%, and the lowest median latency of 97 ms. Airtek Solutions had the fastest median fixed download and upload speeds of 94.76 Mbps and 94.89 Mbps, respectively. Airtek Solutions also recorded the highest fixed broadband Consistency of 86.0%, and the lowest median latency at 7 ms. Among Venezuela’s most populous cities, Maracaibo recorded the fastest median mobile and fixed download speeds of 17.17 Mbps and 82.35 Mbps, respectively.

Asia

  • Afghanistan: The fastest mobile operator in Afghanistan was Afghan Wireless with a median download speed of 6.68 Mbps in Q4 2023. The operator also had the lowest median latency at 77 ms and the highest Consistency of 51.0%.
  • Bangladesh: Banglalink was the fastest mobile operator in Bangladesh with a median download speed of 26.74 Mbps in Q4 2023. Banglalink also recorded the highest Consistency of 89.0% and the lowest median latency of 33 ms. DOT Internet was the fastest fixed broadband provider with a median download speed of 91.35 Mbps, while also recording the highest Consistency at 87.5% and the lowest median latency at 5 ms.
  • Bhutan: There was no statistical winner for fastest mobile download performance during Q4 2023 in Bhutan, with TashiCell and BT both tied with speeds of 31.52 Mbps and 28.15 Mbps, respectively. TashiCell recorded the lowest median mobile latency of 52 ms.
  • Brunei: There was no statistical winner for fastest mobile download performance during Q4 2023 in Brunei, with DST and Imagine both tied with speeds of 97.34 Mbps and 91.53 Mbps, respectively.
  • Cambodia: Cellcard recorded the fastest median mobile download speed at 33.74 Mbps during Q4 2023, while Metfone recorded the highest Consistency at 80.8% and the lowest median latency at 38 ms. MekongNet was the fastest fixed broadband provider, with a median fixed download speed of 48.29 Mbps. MekongNet also recorded the highest Consistency at 71.1%. OpenNet recorded the lowest median latency over fixed broadband, at 7ms.
  • China: China Broadnet was the fastest mobile operator in China during Q4 2023, with a median download speed of 248.77 Mbps, and median 5G download speed of 305.61 Mbps. China Mobile recorded the lowest median mobile latency, at 42 ms. There was no statistical winner for fastest fixed download performance, with China Unicom and China Mobile both tied with speeds of 246.93 Mbps and 245.59 Mbps, respectively. China Mobile recorded the highest fixed broadband Consistency, of 93.4%, while China Telecom recorded the lowest median fixed broadband latency at 22 ms. Among China’s most populous cities, Beijing recorded the fastest median mobile download speed of 232.41 Mbps, while Tianjin recorded the fastest median fixed download speed of 326.07 Mbps.
  • Georgia: Geocell recorded the fastest mobile download performance during Q4 2023 in Georgia, at 50.52 Mbps, and the lowest mobile latency at 37 ms. MagtiCom had the fastest median fixed download speed at 27.81 Mbps and the highest Consistency of 66.5%. Among Georgia’s most populous cities, Tbilisi recorded the fastest median mobile download speed of 36.17 Mbps, while Rustavi recorded the fastest median fixed download speed of 27.38 Mbps.
  • Hong Kong (SAR): China Mobile Hong Kong was the fastest mobile operator in Hong Kong (SAR) during Q4 2023, with a median download speed across all technologies of 98.94 Mbps, and a median download speed over 5G of 177.96 Mbps. csl recorded the fastest median mobile upload speed, at 16.89 Mbps.
  • Indonesia: Telkomsel was the fastest Indonesian mobile operator with a median download speed of 31.14 Mbps. Telkomsel also had the lowest median mobile latency at 45 ms.
  • Japan: Rakuten Mobile recorded the fastest mobile download and upload speeds during Q4 2023 in Japan, at 51.16 Mbps and 20.21 Mbps, respectively. Rakuten Mobile also recorded the highest Consistency in the market at 90.6%, while SoftBank recorded the lowest median latency at 43 ms. So-net had the fastest fixed download and upload speeds, at 296.29 Mbps and 219.53 Mbps, respectively, as well as the lowest median latency over fixed broadband at 9 ms. SpaceX Starlink recorded the highest fixed broadband Consistency in the market at 96.4%.
  • Kazakhstan: Tele2 recorded the highest mobile Consistency in Kazakhstan during Q4 2023 with 85.3% and the lowest median mobile latency at 39 ms.
  • Malaysia: TM was the fastest fixed broadband provider in Malaysia with a median download speed of 112.00 Mbps in Q4 2023. TIME recorded the lowest fixed broadband latency at 9 ms.
  • Pakistan: Jazz delivered the fastest median mobile download speed in Pakistan at 21.38 Mbps in Q4 2023. Zong recorded the highest mobile Consistency, at 83.2%, and the lowest median mobile latency of 45 ms. Transworld recorded the fastest median fixed broadband download speed at 22.08 Mbps and the highest Consistency at 46.1%, while Connect Communications recorded the lowest median fixed broadband latency at 12 ms.
  • Philippines: Smart delivered the fastest median mobile download speed in the Philippines at 37.64 Mbps in Q4 2023.
  • South Korea: SK Telecom recorded the fastest median mobile download speed at 192.67 Mbps, while also recording the highest Consistency in the market at 89.1%. LG U+ had the lowest median mobile latency in the market at 76 ms. In South Korea’s fixed broadband market, LG U+ delivered the fastest median download speed at 146.20 Mbps, and the lowest median latency of 57 ms.
  • Sri Lanka: There was no statistical winner for fastest mobile download performance during Q4 2023 in Sri Lanka, with Dialog and SLT-Mobitel both tied with speeds of 23.98 Mbps and 23.89 Mbps, respectively. Dialog delivered the lowest median mobile latency of 36 ms. SLT-Mobitel recorded the fastest fixed download speed of 37.46 Mbps, as well as the highest fixed broadband Consistency of 57.9% and the lowest fixed broadband latency at 13 ms.
  • Vietnam: Viettel was the fastest fixed provider in Vietnam during Q4 2023, with a median download speed of 107.40 Mbps. Viettel also recorded the highest fixed broadband Consistency at 94.8% and the lowest median fixed broadband latency of 4 ms.

Europe

  • Albania: Vodafone recorded the fastest median mobile download speed in Albania during Q4 2023, of 53.36 Mbps. One Albania recorded the highest mobile Consistency of 86.1%. Digicom was the fastest fixed broadband provider with a median download speed of 94.74 Mbps. Abissnet recorded the lowest fixed broadband latency, at 7 ms. Among Albania’s most populous cities, Vlorë recorded the fastest median mobile download speed of 75.34 Mbps, while Shkodër recorded the fastest median fixed download speed of 69.91 Mbps.
  • Belgium: Proximus recorded the fastest median mobile download speed in Belgium during Q4 2023, at 89.67 Mbps. Proximus also recorded the highest mobile Consistency in the market at 89.8%. There was no statistical winner for fastest fixed download performance, with Telenet and VOO both tied with speeds of 158.08 Mbps and 156.00 Mbps, respectively. VOO recorded the highest Consistency at 89.8%. Among Belgium’s most populous cities, Ghent recorded the fastest median mobile and fixed download speeds, of 168.89 Mbps and 90.14 Mbps, respectively.
  • Denmark: Telia was the fastest mobile operator in Denmark during Q4 2023, with a median download speed of 163.41 Mbps. Hiper was fastest for fixed broadband, with a median download speed of 277.56 Mbps.
  • Estonia: The fastest mobile operator in Estonia was Telia with a median download speed of 92.39 Mbps in Q4 2023. Elisa recorded the highest mobile Consistency of 91.9%. Elisa was the fastest fixed broadband provider, with a median download speed of 100.13 Mbps. Elisa also recorded the highest fixed broadband Consistency, of 86.3%. Infonet recorded the lowest median fixed broadband latency of 5 ms.
  • Finland: DNA had the fastest median mobile download speed at 113.57 Mbps in Q4 2023, and the highest Consistency of 95.4%. DNA also recorded the fastest median 5G download performance, at 247.54 Mbps. Telia recorded the lowest median mobile latency of 31 ms. Lounea was fastest for fixed broadband with a median download speed of 171.31 Mbps. Lounea also recorded the highest fixed broadband Consistency in the market at 91.5%, as well as the lowest median fixed broadband latency at 13 ms.
  • Germany: Telekom was the fastest mobile operator in Germany during Q4 2023, with a median download speed of 90.26 Mbps, as well as the top median download speed over 5G at 179.25 Mbps. Telekom also recorded the highest mobile Consistency in the market at 92.1% and the lowest median mobile latency of 38 ms. Deutsche Glasfaser recorded the fastest fixed broadband performance, with a median download speed at 201.43 Mbps. Deutsche Glasfaser also recorded the highest fixed broadband Consistency in the market at 90.5% and the lowest latency of 14 ms.
  • Latvia: There was no statistical winner for fastest mobile download performance in Latvia during Q4 2023, with BITĖ and LMT both tied with speeds of 81.56 Mbps and 81.11 Mbps, respectively. BITĖ recorded the highest mobile Consistency in the market of 91.3%, while LMT recorded the lowest mobile latency at 27 ms. Balticom was fastest for fixed broadband with a median download speed of 275.19 Mbps, while also leading with the highest fixed broadband Consistency of 93.7%, and the lowest median latency at 4 ms. Among Latvia’s most populous cities, Olaine recorded the fastest median mobile download speed, of 170.18 Mbps, while Salaspils recorded the fastest median fixed broadband download speed of 94.64 Mbps.
  • Lithuania: Telia was the fastest mobile operator in Lithuania during Q4 2023, with a median download speed of 116.58 Mbps in Q4 2023. Telia also recorded the highest Consistency in the market at 94.7%, and the lowest median mobile latency at 32 ms. Cgates was fastest for fixed broadband with a median download speed of 177.14 Mbps. Cgates also recorded the highest Consistency over fixed broadband in the market at 90.9%, while Penki recorded the lowest fixed broadband latency, at 4ms. Among Lithuania’s most populous cities, Panevėžys recorded the fastest median mobile download speed, of 106.34 Mbps, while Klaipėda recorded the fastest median fixed broadband download speed of 138.34 Mbps.
  • Poland: T-Mobile was the fastest mobile operator in Poland during Q4 2023, with a median download speed of 49.10 Mbps. T-Mobile also recorded the highest Consistency in the market at 88.4%. Plus recorded the fastest 5G performance in the market, with a median 5G download speed of 133.34 Mbps. Plus also recorded the lowest median mobile latency, at 43 ms. UPC was the fastest provider for fixed broadband with a median download speed of 232.36 Mbps, while Netia recorded the lowest fixed broadband latency, at 16 ms. Among Poland’s most populous cities, Łódź recorded the fastest median mobile download speed of  46.53 Mbps, while Wrocław recorded the fastest median fixed download speed of 172.86 Mbps.
  • Turkey: Turkcell was the fastest mobile operator in Turkey with a median download speed of 56.73 Mbps in Q4 2023, and Turkcell also recorded the highest Consistency of 91.3%. Türk Telekom had the lowest median mobile latency at 39 ms. TurkNet was fastest for fixed broadband, with a median download speed of 66.57 Mbps. TurkNet also recorded the lowest median fixed latency at 13 ms, and the highest Consistency at 81.5%. Among Turkey’s most populous cities, Istanbul recorded the fastest median download speeds across mobile and fixed, at 38.50 Mbps and 47.81 Mbps, respectively.

Oceania

  • New Zealand: There was no statistical winner for fastest mobile download performance during Q4 2023 in New Zealand, with One NZ and Spark both tied with speeds of 73.52 Mbps and 70.23 Mbps, respectively. 2degrees led the market with the highest Consistency of 91.0% and the lowest median mobile multi-server latency at 40 ms.

The Speedtest Global Index is your resource to understand how internet connectivity compares around the world and how it’s changing. Check back next month for updated data on country and city rankings, and look for updated Ookla Market Reports with 1H 2024 data in July.

Ookla retains ownership of this article including all of the intellectual property rights, data, content graphs and analysis. This article may not be quoted, reproduced, distributed or published for any commercial purpose without prior consent. Members of the press and others using the findings in this article for non-commercial purposes are welcome to publicly share and link to report information with attribution to Ookla.

| April 2, 2024

Introducing Speedtest Insights™ for smarter, faster connectivity decisions

As the importance of connectivity has grown, understanding network performance and coverage has become essential for a broad group of stakeholders beyond just network engineers. Governments, regulators, infrastructure companies, and other enterprises outside of the traditional telecommunications space are now actively addressing connectivity challenges to pave the way for a more connected future.

While many tools exist for understanding network performance, most are built with network engineers in mind. The deep technical views that engineers require can be overly complex for users who just want straightforward connectivity insights. 

To that end, we are excited to announce the launch of our new product designed especially for this audience. Speedtest Insights™ helps you visualize connectivity on an intuitive map with user-friendly data — so that you can make connectivity decisions with clarity and confidence. 

See connectivity trends in the areas that matter most, no GIS skills required

With Speedtest Insights, no GIS skills are required to make informed decisions. View and compare network performance, mobile signal, and cell location data on an intuitive map-based platform.

Governments, regulators, infrastructure companies, and enterprises can leverage Ookla’s easy-to-use mapping interface to quickly understand connectivity at a high level or pinpoint precise areas of need. Speedtest Insights helps you: 

  • Visualize connectivity on an intuitive map with user-friendly data names and a simple “excellent, good, fair, poor” rating system
  • Eliminate guesswork about whether or not a network provides adequate service in an area and avoid costly in-person testing
  • Identify unserved and underserved areas to support grant proposals, win funding, and prioritize investment opportunities 

Measure real-world network performance and coverage

Every day, millions of consumer-initiated tests are taken with Speedtest by users around the world who want to understand their own connected experiences. Powered by the same crowdsourced Speedtest data, Speedtest Insights demonstrates real-world fixed and mobile network performance with metrics like Download Speed, Upload Speed, and Latency. 

You can also analyze Signal Strength and Signal Quality with signal data drawn from billions of crowdsourced daily network samples. Combined with Estimated Cell Locations, you can gain meaningful insight into the coverage of mobile networks. View 4G Signal Strength layered with 4G Cell Locations in the image below for a detailed view of mobile coverage in the U.K.

Real-world consumer-initiated data often differs from coverage data reported by carriers and provides a better look into how consumers are actually experiencing networks for more informed grant proposals and connectivity investment strategies.

Add administrative boundaries or other geographic areas to your map views such as counties, states/provinces, nations, and U.S. census tracts to get a better understanding of connectivity trends in the areas that matter most to you. View Fixed Download Speed layered with U.S. Census Tracts in the image below to identify census tracts that can be prioritized for broadband improvements.

Comprehensive performance and signal information within key geographic areas helps you monitor connectivity over time and ensure compliance with regulatory standards. With a wide range of customizable views, helpful features, and an easy-to-use interface, Speedtest Insights can help solve all of your connectivity challenges. 

Do you need to make smarter, faster connectivity decisions? Inquire here to get started with Speedtest Insights

Ookla retains ownership of this article including all of the intellectual property rights, data, content graphs and analysis. This article may not be quoted, reproduced, distributed or published for any commercial purpose without prior consent. Members of the press and others using the findings in this article for non-commercial purposes are welcome to publicly share and link to report information with attribution to Ookla.

| April 12, 2018

What Would a Merger Between Sprint and T-Mobile Mean for Customers?

Editor’s note: Rumors of the merger of Sprint and T-Mobile were confirmed on April 29 through a video announcement featuring CEOs of both companies.

As was the case in October, rumors once again abound that a merger between Sprint and T-Mobile is coming. Though we cannot know if that is true, we are interested to explore what such a combination might mean for the online experiences of customers in the future.

Speeds

T-Mobile is the fastest of the big four carriers in the U.S. and Sprint is the slowest.

Existing Sprint customers would definitely benefit from T-Mobile’s recent infrastructure investments. Over the past six months, T-Mobile has been aggressively deploying LTE on their 600 MHz greenfield spectrum assets, which already cover more than 300,000 square miles, using 5G ready infrastructure equipment. These assets will be fully 5G operational once the vendors push over-the-air software upgrades, likely to happen sometime before the end of this year.

The 5 GHz License-Assisted Access (LAA) has already been deployed in a few urban areas, adding 60 MHz of downlink capacity to the existing network. This effectively provides up to 1 Gbps peak download speeds. T-Mobile spectrum assets also include 200 MHz of millimeter wave (mmWave) spectrum across 100 million people, which is readily available for 5G deployment mainly in urban areas where the network traffic is the highest. These mmWave spectrum assets alone could provide speeds of about 1 Gbps. The nature of the non-standalone (NSA) 5G, which we will be seeing next year, is to operate on top of the existing LTE network which significantly improves the overall user experience.

Perhaps the most interesting aspect of the merger, at least from the technological side, is the integration of Sprint’s 2.5 GHz 5G-ready spectrum into the existing T-Mobile core. This integration offers up to 100 MHz of greenfield 5G spectrum in addition to 60 MHz of already deployed LTE capacity. Unlike the 28 GHz and 39 GHz mmWave spectrum, 2.5 GHz is more suited for wider area coverage and will offer higher spectral efficiency by the way of Higher Order MIMO (4×4 MIMO) and Higher Order Modulation (256 QAM).

Some capacity-enabling technologies like Massive-MIMO and FD-MIMO (Full Dimension MIMO) are already being deployed by both operators, adding 32, 64, and even 128 antenna elements to the cell sites. This will not only support the upcoming 5G, but will have the immediate benefits in terms of speeds for users equipped with LTE terminals.

Mergers aren’t about taking the average of carriers’ speeds, though. They are about how networks improve when the assets of both companies are combined. In the case of a merger between Sprint and T-Mobile, spectrum holdings will play a huge role.

The difference spectrum makes

Spectrum is the range of radio frequencies used to transmit voice and data. Different carriers hold and operate on different parts of the spectrum. Sprint holds a massive 150 MHz of nationwide 2.5 GHz spectrum, which uniquely positions them to provide an outstanding consumer experience. To date, most of that spectrum has been underutilized due to lack of funding, changes in leadership and unorthodox deployment strategies. Only 20-60 MHz of Sprint’s 2.5 GHz spectrum has thus far been deployed for commercial use, with some additional spectrum used for wireless backhaul. Sprint also holds about 37 MHz of mid-band spectrum, which is then shared between the legacy 3G and LTE technologies, and about 12 MHz of low-band spectrum.

And while the high-band (2.5 GHz) spectrum is excellent for providing incremental capacity, due to its signal properties it can’t propagate very far or penetrate concrete structures very well. This is why Sprint subscribers often end up falling back to Sprint’s limited mid- or low-band LTE network layer, which can translate to slower speeds and increased load times. T-Mobile’s cell site density and excellent mid-band spectrum could come in very handy to radically improve Sprint customers’ experience in a post-merger world.

On the other hand, a tightly-spaced cellular grid is T-Mobile’s strong point. This grid is optimized for 70 MHz of T-Mobile’s mid-band spectrum and delivers wideband LTE experience using both the 2100 MHz Advanced Wireless Spectrum (AWS) and 1900 MHz Personal Communications Service (PCS) layers. Combining what’s already the fastest LTE network in the U.S. with the massive 2.5 GHz spectrum assets on a dense network grid could potentially deliver exceptional network performance. This is because fewer users are served by any individual cell which increases network resources, improving speeds and overall user experience.

Both Sprint and T-Mobile operate in the 1900 MHz PCS frequency band, and in many markets the carriers could combine the existing holdings into a wider contiguous spectrum allocation which will further improve user experience.

How spectrum integration might play out

The obvious benefits to the merger would be the synergies. Mostly network-driven, these would include decommissioning redundant Sprint macro sites and reducing the operating expenditure of the combined company. The remaining portion of Sprint’s cell sites would fortify the existing T-Mobile footprint, adding incremental network capacity. Timing is essential, though. Over the last six months, Sprint has commited to $6B in network investments and may have signed contracts with tower companies and backhaul suppliers. The execution of this investment is still in the early stage, but once it’s had an opportunity to ramp up some of the synergies will dissipate.

T-Mobile is well known for its network efficiencies. They run a lean LTE network with a strong focus on extracting the highest possible spectral efficiency out of the existing spectrum assets, and also spearhead efforts in commercializing the latest advanced LTE features.

T-Mobile’s previous experience with absorbing a CDMA operator (Metro PCS) could offer insight into how spectrum and resource sharing would be affected by a merger. In that case, T-Mobile successfully migrated the Metro PCS customer base onto its advanced network core in record time, repurposing the spectrum shortly after sunsetting the CDMA network. This type of approach offers additional cost efficiencies, as Sprint’s older CDMA infrastructure can be removed, and redundant cell sites decommissioned.

Another potentially positive outcome to a merger comes with the upcoming 5G standardization. T-Mobile could utilize Sprint’s rather limited low-band spectrum to provide a dedicated narrowband IoT channel.

Coverage

What about coverage? Maps of Speedtest results from the U.S. Market Report showed a larger footprint of results on T-Mobile.

The combined entity would potentially number over 130 million subscribers, which would be comparable in size to both Verizon and AT&T. Overlaying the Speedtest coverage maps, we see that although the strengths of both networks are in urban centers, there are some areas where we see Speedtest results on Sprint but not T-Mobile. This includes much of central West Virginia. Sprint also sees more tests in more rural parts of southwestern Oregon, southwestern Colorado (near Montrose), the Texas panhandle, eastern Nebraska, and much of Wisconsin.

T-Mobile shows results in the following areas where Sprint results are sparse: southwestern Montana, northern Nevada, southern Wyoming, northeastern Arizona, across North and South Dakota, northern Minnesota, throughout rural New Mexico and in the more suburban areas near the Alabama/Tennessee border.

Presumably, customers in areas that have only had access to one network would see the biggest benefit from a merger.

Good news or bad?

A combined Sprint and T-Mobile could make for one powerhouse of a carrier with the customer base and clout of Verizon and AT&T. Not only would Sprint’s 2.5 GHz spectrum portfolio be a major asset to the combined entity, a merger between the two would also expand their geographical footprint and improve the cell site density in many markets which will be the key for the upcoming high band 5G deployment.

That said, there are a lot of unknowns. These things take time and it could take years for consumers to benefit from the combined spectrum efficiencies. From an operational point of view, mergers of this size typically shed a lot of jobs. Reducing the number of major carriers in the U.S. from four to three will change the competitive landscape in a way that could increase prices. We also do not yet know how such a merger would impact speeds, but we’ll share data on that here when we do.

Editor’s note: An earlier version of this article appeared on this blog on September 27, 2017.

Ookla retains ownership of this article including all of the intellectual property rights, data, content graphs and analysis. This article may not be quoted, reproduced, distributed or published for any commercial purpose without prior consent. Members of the press and others using the findings in this article for non-commercial purposes are welcome to publicly share and link to report information with attribution to Ookla.

| May 28, 2020

How T-Mobile’s Merger with Sprint is Changing the Game for 5G

After almost two years and numerous legal battles, T-Mobile and Sprint are finally one. Equipped with a vast arsenal of spectrum assets, the new company aims to create an unparalleled 5G experience from urban areas to underserved rural communities across America. The biggest prize of this merger is 150 MHz of Sprint’s 2.5 GHz spectrum across top 100 markets. Combining Sprint and T-Mobile assets, T-Mobile now controls 319 MHz of sub-6GHz spectrum nationwide, and they have already started injecting some of this valuable capacity into the network and making it available to Americans.

The Philadelphia experiment

Because of the leasing and permitting work done in Philadelphia months ahead of the April 1, 2020 merger approval, T-Mobile was able to activate a number of 2.5 GHz (n41) sites on day one, followed by the official market launch on April 21. Massive MIMO radios were overlaid on T-Mobile’s existing cell sites, adding 60 MHz of spectrum in the 2.5 GHz band. Since Philadelphia wasn’t one of the nine markets where Sprint launched 5G, the fallow 2.5 GHz spectrum was readily available for use. T-Mobile had already covered Philadelphia with 5G in the 600 MHz band (n71), and the 2.5 GHz layer should provide a much-needed capacity boost. We can already see the increase in performance over the past four months.
t-mobile_5G_performance_philadelphia_0520-1

An analysis of all 5G tests taken on T-Mobile’s network in Philadelphia shows mean download speeds doubling during the month of April. A huge jump from 60.40 Mbps to 119.82 Mbps coincides with the rollout of 5G on the fresh mid-band spectrum. During the same month, we observed peak 5G download speeds exceeding 700 Mbps. Mean latency also fell from 30 ms to 21 ms over the period. Unlike the millimeter wave frequencies, which could offer greater speeds in a very small footprint, the 2.5 GHz band provides a good balance between coverage and capacity for mobile use.

T-Mobile’s layer cake in Manhattan

On May 5, T-Mobile launched its second mid-band 5G market in New York City. This launch marked the world’s first 5G network built on low, mid and high frequency bands. Paired with the multi-gigabit fiber backhaul, this 5G network is designed to deliver uncompromised performance. T-Mobile calls this the “Layer Cake 5G strategy.”
t-mobile_5G_performance_nyc_0520-1

Mean download speeds of T-Mobile’s 5G network in New York City increased from 79.18 Mbps in January 2020 to 98.96 Mbps in May (as seen through the 15th of the month). This represents a 25.0% jump across all three 5G layers. Mean upload speeds have also improved 11.0% during the same period.
t-mobile_5G_performance_NYC_Philadelphia_0520-1

Analyzing week-over-week performance, Speedtest Intelligence® offers unique insights on the upward-trending download speeds on T-Mobile’s 5G across these two markets. A combination of additional 600 MHz spectrum explained in our previous article and the new 2.5 GHz 5G layer were likely the main drivers behind this improved performance.

Field testing the layers of 5G

Users are typically not aware of the layers of technologies that they’re utilizing when they connect to a 5G network. To better understand the performance and capabilities of T-Mobile’s layer cake 5G network, I looked at the performance of each individual 5G layer separately. This process involved running over 300 tests on the ground in New York City between May 5 and 19 (while fully complying with the social distancing and health guidelines) and logging modem diagnostic messages. This allowed me to observe individual throughput contributions across three different 5G layers on two different devices, the Samsung Galaxy S20 Ultra 5G and the OnePlus 8 Pro. While both devices are powered by Qualcomm’s latest Snapdragon 865 5G Mobile Platform, only the Samsung Galaxy S20 Ultra 5G (and S20+ 5G) has the required mmWave hardware components to fully access the 5G spectrum layer cake. The open-market OnePlus 8 Pro could only access sub-6 GHz 5G.

According to T-Mobile’s published map of projected 2.5 GHz coverage, the newly launched mid-band 5G layer is mostly available in the eastern parts of Manhattan. That meant a quick ride to the areas east of Herald Square in Midtown as well as parts of East Village. Keep in mind that the walk tests were collected on a recently launched and lightly loaded mid-band 5G network. This report samples what this network is capable of and should not be considered predictive of future performance under normal use.

LAA boosts speeds

License Assisted Access (LAA) is LTE technology that leverages the unlicensed 5 GHz spectrum. While often overlooked, this technology has been deployed on T-Mobile sites in New York City since 2017, and adds ample downlink capacity (40-60MHz) using Ericsson’s micro Radio 2205, “assisted” by the anchor in the licensed LTE mid-band. This can significantly boost download speeds on capable devices, while at the same time offloading traffic from the licensed spectrum and improving the LTE experience for all users served by that cell.

In Manhattan, many low-build rooftop sites with Ericsson AIR 5121 mmWave radios originally received the LAA treatment and are excellent candidates to receive (or have already received) the 2.5 GHz 5G overlay. This means these NYC sites would gain 40-60 MHz of LAA downlink capacity in addition to the full three layer 5G deployed in the 600 MHz low-band, 2.5 GHz mid-band, the 28 GHz mmWave high-band spectrum and LTE. This would open up a variety of options in terms of network scheduling and capacity management.

What each NR layer contributes to download speeds

Based on personal field test data logged over the course of the last eight months, the observed peak download contribution of the NR physical layer (PHY) on Sprint’s (now decommissioned) 2.5 GHz 5G network using Nokia radio and 40 MHz bandwidth was 367 Mbps, achieved on Sprint’s 5G launch day in New York City, August 27, 2019.

T-Mobile’s new 2.5 GHz deployment — leveraging the same amount of spectrum, Ericsson AIR 6488 radio access, under similar network conditions — produced a peak downlink NR contribution in excess of 541 Mbps, an improvement in spectral efficiency of 47 percent. The downlink NR contribution measures the portion of the download speed arriving at the device only from the 5G layer, the remainder of the download speed comes from LTE.

Furthermore, on May 19, the NR bandwidth on some sites was increased from 40 MHz to 60 MHz, and I’ve since observed a peak NR downlink contribution approaching 900 Mbps. The increased bandwidth was observed on three locations in the East Village, while the majority of 2.5 GHz sites are still at 40 MHz. We should stress again that these peak 5G speeds are meant to show the full potential of this new network deployment and have been achieved in good outdoor signal conditions, on a lightly loaded 5G network.

When taking into account the 3:1 TDD frame configuration (75% downlink 25% uplink), the effective peak downlink spectral efficiency of the 2.5 GHz NR layer looks like this:
peak-spectral-efficiency_0520-2

Lower spectral efficiency on Sprint’s legacy network could be attributed to the lower distribution of 256 QAM and MIMO (Rank 3, 4). Granted, there could have been a potential performance penalty associated with an earlier software load on Nokia’s massive MIMO radios running in split-mode. These radios were logically partitioned for both n41 and LTE B41 concurrent operation, while pushing carrier aggregation across three LTE CCs and using 100-120MHz of spectrum in total. In contrast, T-Mobile’s existing deployment consists of Ericsson AIR 6488 radios delivering only n41, while LTE mid-band anchor bands are delivered from separate radios (B2, B66).

40 MHz of n41 delivered NR upload speeds of 33 Mbps on T-Mobile vs. 23 Mbps on Sprint, a 43.5% increase. Tests from May 19 using 60 MHz wide NR channel produced consistent speeds of 50 Mbps arriving from the NR layer.

peak-upload-contributions_0520-2

The benefits for both users and the operator are apparent as the aggregate (LTE B66 + NR n41) upload speeds achieved on capable user devices now well exceed 100 Mbps.

In addition to the new mid-band 5G (n41), T-Mobile’s low-band 5G (n71), which launched in early December, is providing the foundational layer for the future SA (Standalone) NR. The initial 5 MHz FDD deployment was, from my first-hand experience, capable of boosting the downlink performance at the capable user terminals with an additional 42 Mbps. As of the middle of March, that allocation was increased to 10 MHz, now delivering peak n71 speeds of roughly 100 Mbps. With wider NR channels comes an improved spectral efficiency.

Millimeter wave adds capacity

T-Mobile’s millimeter wave (mmWave) NR layer (n261) has been available in New York City since June 2019. Leveraging the existing macro grid, T-Mobile’s Manhattan mmWave overlay, in terms of cell site density, is one of the most impressive in the world. This layer leverages 100 MHz of spectrum (2×50 MHz) in the 28 GHz band (n261), adding peak n261 speeds of over 520 Mbps in addition to the LTE anchor bands. In comparison, T-Mobile’s mid-band 2.5 GHz NR layer is able to deliver similar capacity out of just 40 MHz of spectrum. This jump in spectral efficiency is attributed to the use of up to four data streams and 256 QAM modulation in the mid-band, something the current generation of mmWave chipsets can’t do.

During my testing, the Samsung Galaxy S20 Ultra 5G was able to switch between all three NR spectrum bands seamlessly and deliver consistent performance at hundreds of megabits per second. While 100 MHz of mmWave can deliver a speed boost of a few hundred megabits per second, the full potential of this spectrum can be unlocked by deploying much wider 400 MHz or 800 MHz blocks of mmWave spectrum, which can produce speeds of multiple gigabits per second, just on that layer alone. T-Mobile now controls 1,160 MHz of mmWave spectrum nationwide, including significant amounts of not-yet-deployed 24 GHz and 47 GHz licenses won in recent auctions.

Device limitations (and opportunities)

T-Mobile’s 5G network uses a mechanism called the EUTRA-NR Dual Connectivity (EN-DC) split bearer, which allows for combining of data traffic from LTE (master node) and 5G (secondary node) both on the downlink (sub-6 and mmWave) as well as on the uplink (sub-6). This improves user experience by enabling utilization of the maximum amount of data streams across two technologies supported by capable 5G devices. Both devices are capable of aggregating two mid-band LTE anchor bands (B2, B66) with sub-6 NR, but only the Samsung Galaxy S20 Ultra 5G has the ability to leverage up to four spatial streams on the two mid-band LTE bands and NR (n41) at the same time. The OnePlus 8 Pro supports EN-DC combinations with two streams per the mid-band LTE anchors paired with four streams on n41. This is likely related to the RF Front End design limitation on the OnePlus device.
field-test-t-mobile_5G_device_nyc_0520-1

In my field tests, both devices delivered excellent speeds, leveraging 40 MHz of 2.5 GHz 5G (n41) with two LTE mid-band component carriers (CC) on the downlink, while the OnePlus 8 Pro had an additional help coming from the LAA CCs. On the uplink, devices utilized dual connectivity combining one LTE CC with NR. The latency was also similar between devices, although I did observe latency as low as 7 ms.

What’s missing from the Galaxy S20 Ultra 5G — and what the OnePlus 8 Pro fully capitalizes on — is the ability to aggregate mid-band LTE with LAA and mid-band NR. As we’ve described, the existing Manhattan LAA cell sites in some areas conveniently located on every two to three city block corners are the obvious candidates for the 5G mid/high-band overlay, which is exactly what I observed on the streets of the East Village. The combination of 60 MHz of LAA, 30 MHz of mid-band LTE (B66+B2) and 60 MHz NR produced an outstanding user experience, delivering mean download speeds of 989 Mbps and mean upload speeds of 107 Mbps. During May 19 testing, I recorded peak speeds in excess of 1.2 Gbps with the NR contribution of 900 Mbps. This particular test utilized only a single LTE CC (B66), three LAA CCs and 60 MHz of NR.

field-test_Oneplus-8-pro-performance_0520-1

Considering that Samsung’s Galaxy S20 lineup uses state-of-the-art RF Front End components and is built to provide uncompromised user experience, we really hope to see LAA EN-DC support added via the future software updates for both sub-6 and mmWave, which would unlock the device’s full potential. The business case for operators is very appealing: the ability to free up the licensed LTE spectrum in densely populated areas while at the same time providing a significant boost in user experience, as shown in this report. It’s also worth noting that the branded Samsung Galaxy S20 lineup does support the use of higher order MIMO on both LTE mid-band and n41 concurrently, which could prove to be an advantage over the OnePlus device outside of the dense urban areas where LAA isn’t available.

How unique device features boost performance

While most smartphones today can’t aggregate multiple low-band component carriers across multiple low-band frequencies, T-Mobile’s branded devices powered by Qualcomm’s Snapdragon X55 5G Modem-RF System are capable of aggregating multiple low-band channels within the same frequency band (600 MHz). In other words, these smartphones (including the Samsung Galaxy S20 Ultra 5G, and the OnePlus 8 Pro) are able to leverage all of the deployed downlink 600 MHz capacity by way of EN-DC, which allows for concurrent use of LTE band 71 and n71, in addition to the use of mid-band LTE anchors (Band 2 and Band 66). These devices also support uplink carrier aggregation of the LTE anchor band and sub-6 NR.

Because the OnePlus 7T Pro 5G McLaren Edition was the first device to receive this feature, we analyzed its performance in the U.S. as a whole during the first four months of 2020. The software update on February 13 resulted in an improvement of over 30% in mean download speeds from those seen in January 2020. The concurrent use of multiple 600 MHz channels produced mean download speeds of 82.35 Mbps and a latency of 32 ms in April.
t-mobile_5G_performance_oneplus_0520

What the future holds

In markets like New York City, Sprint’s legacy 2.5 GHz LTE network (for the most part) operates on a 60 MHz contiguous chunk of spectrum (3CC LTE carrier aggregation) adjacent to T-Mobile’s 40 MHz (in some parts 60 MHz) NR. In addition to this 100 MHz contiguous spectrum block, Sprint uses a separate 20 MHz slice for its small cells applications, for a total of 80 MHz of deployed 2.5 GHz LTE capacity. Repurposing 20 MHz (or more) of LTE channels and widening the 2.5 GHz NR capacity could easily provide a quick incremental capacity gain for T-Mobile, as already seen on some sites in Manhattan.

Furthermore, the existing Nokia 64T64R massive MIMO radios used on Sprint’s sites still operate in split-mode (32T32R for LTE, 32T32R for NR), but the NR logical partition is not in use. These could have the NR portion of antenna elements remapped for 64T64R LTE which should, in theory, further enhance the LTE coverage through the use of beamforming and deliver an improved LTE sector capacity for users with legacy Sprint LTE B41 devices. When we consider that over 80% of Sprint’s postpaid subscribers own smartphones capable of accessing the T-Mobile network, and 10 million unique Sprint subscribers already utilize T-Mobile’s LTE network on a weekly basis, the accelerated refarm of the 2.5 GHz spectrum makes even more sense.

While T-Mobile could easily add LTE B41 capability to its n41 sites, most (if not all) T-Mobile branded devices aren’t currently capable of aggregating LTE B41 channels with all of T-Mobile’s existing LTE spectrum bands. Therefore, adding LTE B41 wouldn’t provide any immediate capacity gain to T-Mobile’s user base. To achieve that capacity gain, Class II Permissive Change would have to be filed with the FCC for the entire portfolio of T-Mobile’s branded devices and then T-Mobile would have to perform a large-scale software update push, which could be a massive undertaking, and frankly isn’t necessary.

As we described back in August integrating a portion of Sprint’s PCS spectrum onto T-Mobile’s network and widening the existing PCS channels to 15 or 20 MHz could further improve user experience and overall network efficiency for the combined network. This could be highly beneficial in markets with a high uptake of Sprint customers where Sprint’s PCS spectrum holdings sit adjacent to T-Mobile’s. Alternatively, PCS spectrum swap with other operators could produce similar results.

Top-Largest-Markets_TMobile-Sprint-03

Over the past few years, Sprint has done a lot of work to densify its network using small cells and distributed antenna systems (DAS). These nodes provide added coverage and capacity, but often operate on their own separate 2.5 GHz frequency block, different from the blocks used on Sprint’s macro sites. Repurposing Sprint’s network of small cells and outdoor DAS (oDAS) and retrofitting for T-Mobile’s LTE/NR at some point in the future could provide additional capacity in urban and suburban areas.

Standalone 5G should improve performance and coverage

Finally, the launch of the Standalone (SA) 5G slated for later this year will offer many core benefits, such as reduced latency, improved speeds and network slicing, to name a few. With the introduction of VoNR (Voice over NR), SA 5G should provide an improved 5G coverage, especially for customers in rural America, as the need for mid-band LTE anchors would be removed.

The existing portfolio of branded devices powered by the 2nd generation Qualcomm Snapdragon X55 5G Modem-RF System has the support for Standalone 5G, but will require a software update. Recent announcements of SA 5G lab and field testing using a commercial OnePlus 8 device indicate that T-Mobile is inching closer to commercializing this service. The upcoming 3rd generation Qualcomm Snapdragon X60 Modem-RF System will fully set the stage for standalone 5G deployments around the world by enabling mmWave-sub6 aggregation, as well as sub-6 carrier aggregation across FDD and TDD bands. This means that the upcoming portfolio of T-Mobile’s 5G devices will be able to combine n71 with n41, n261 with n41, and so on. The Dynamic Spectrum Sharing (DSS) feature, which enables coexistence of LTE and 5G in the same frequency channel at the same time, will likely find its purpose in T-Mobile’s toolbox by enabling the use of n2 and n66 frequency bands.

Two weeks of testing T-Mobile’s 5G in New York City delivered an impressive user experience, and it was just an early taste of a 5G layer cake that could continue to improve. Low-band 5G provides the foundational layer of the cake, the mid-band filling is already thickening and the mmWave at the moment is the cherry on top, with the potential to become a much bigger layer. We’re excited to see how other operators can learn from this approach and improve 5G performance across the globe.

Ookla retains ownership of this article including all of the intellectual property rights, data, content graphs and analysis. This article may not be quoted, reproduced, distributed or published for any commercial purpose without prior consent. Members of the press and others using the findings in this article for non-commercial purposes are welcome to publicly share and link to report information with attribution to Ookla.

| November 16, 2020

Rakuten is Leveraging O-RAN to Reimagine Mobile and it Could Change the Way We Use Our Phones Forever

日本語

Japanese companies have often been at the forefront of applying innovative new technology to improve the everyday lives of their customers. For example, the world’s very first 1G phone service was pioneered and launched in Japan in 1979. So it’s no surprise that the most cutting-edge approach to mobile is already underway in Japan as Rakuten embraces the Open Radio Access Network (O-RAN) standard to build a cloud-native mobile network, Rakuten Mobile. This fully virtual mobile network allows Rakuten to reduce the costs associated with building and upgrading a network and also offers Rakuten Mobile’s customers a complete beginning-to-end user experience for their online activities.

Rakuten disrupts a well-established market

EN-Rakuten-Diagram

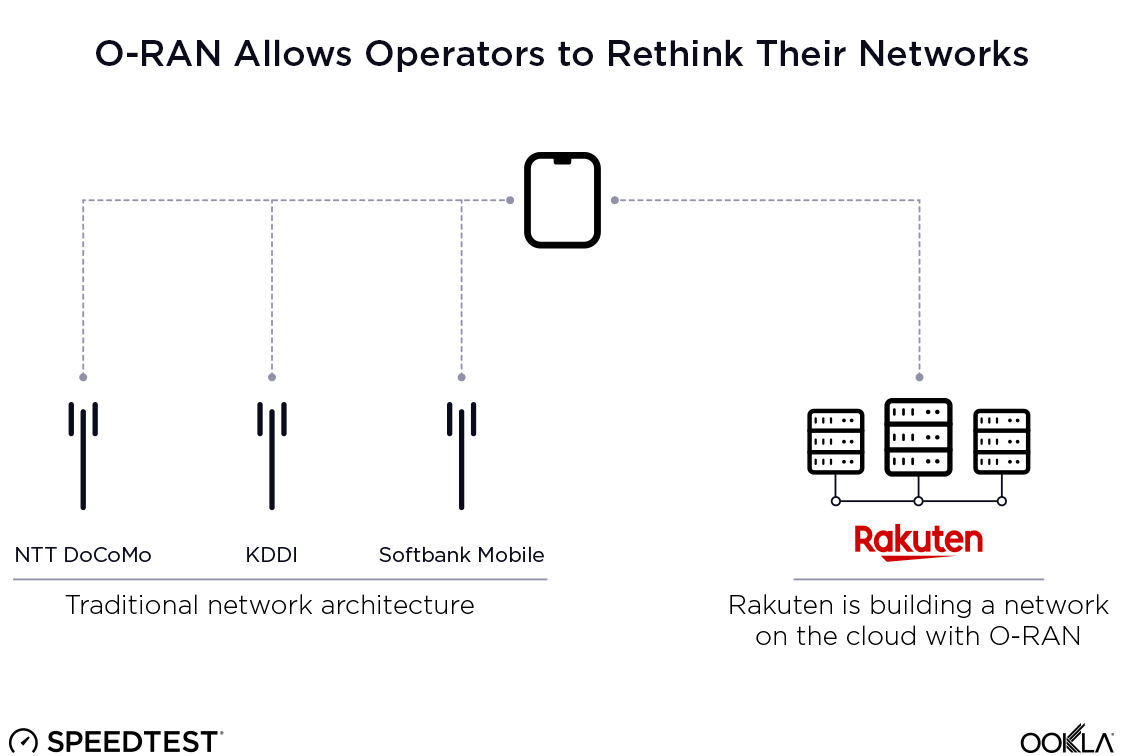
Prior to Rakuten Mobile’s entry, the Japanese mobile market was dominated by three major operators: NTT Docomo, au by KDDI and Softbank Mobile. All three have been in operation for over a decade and have deployed 5G throughout Japan.

NTT DoCoMo was spun off from Nippon Telegraph and Telephone (NTT) with 2G service in 1991. Over the next decade, the company transitioned to 3G. It currently offers LTE service on a combination of 700 MHz, 800 MHz, 1.5 GHz, 1.8 GHz, 2.1 GHz and 3.5 GHz bands. Recently the company has launched 5G service on 3.6GHz, 4.5GHz and mmWave.

KDDI was created in 2000 as a result of a merger of three companies: KDD, DDI and IDO. The company used CDMA technology for its 2G and 3G services, and currently offers LTE services using 700 MHz, 800 MHz, 1.4 GHz, 2.1 GHz and 3.5 GHz. Recently launched 5G service is rolled out on 3.8 GHz, 4.1 GHz and mmWave.

Softbank Mobile, the third major operator in Japan, entered the Japanese market in 2006 with the purchase of Vodafone Japan. Softbank Mobile’s LTE frequency bands span from 700 MHz to 3.5 GHz, and 5G is rolled out on 3.9 GHz and mmWave.

Rakuten is new to mobile, but this is only one part of a well-established business. Founded in 1997 as an e-commerce company with only six employees and one server, the company now has a global reach with a portfolio of over 70 companies and more than a billion membership and loyalty program customers worldwide. The enterprise now covers a wide variety of industries including banking, travel, online shopping, advertising, global messaging, video delivery, data analysis and now wireless, just to name a few.

What’s extremely interesting about Rakuten as a wireless operator is the company’s culture and decades of data-centric expertise in the cloud space. Offering end-to-end user experience and controlling the entire customers’ online journey certainly brings tremendous value to the company, but it also opens the idea of other tech giants like Amazon, Google and Apple entering the mobile telecom space. With the promise of running fully virtualized network functions, the costs associated with network rollouts and operational expenditure may be significantly reduced, and any new entrants to the telecom space may bring fresh perspectives on running and operating a mobile network.

Rakuten leverages the cloud to break the chains of infrastructure

Rakuten opted for a cloud-native mobile network approach using O-RAN instead of relying entirely on traditional network infrastructure equipment vendors for core and radio access technology. This means Rakuten is decoupling radio access from baseband processing and virtualizing a large amount of network functions. This approach relies on data centers and the cloud, which are Rakuten’s strengths.

In the traditional telco world, infrastructure vendors’ solutions typically provide an end-to-end vertical stack, which includes everything from radio access and baseband processing to the transport and core. This means that when operators lock into a contract with infrastructure giants like Huawei, Nokia and Ericsson, they are locked into a proprietary closed ecosystem of software and hardware.

Once hardware and software are disaggregated, operators will be free to deploy any software-defined functions offered by any company, small or large, following “white-box” O-RAN guidelines. This approach, called “virtualization,” can be run on any off-the-shelf computer server. Virtualization reduces the importance of traditional telco hardware, speeds up rollouts, drives innovation and significantly reduces the operator’s capital expenditures. Virtualization can quickly and easily disrupt the economics of traditional operators, paving the way for fresh opportunities both for new entrants and the industry as a whole. With O-RAN, operators can work with major infrastructure vendors like Nokia, NEC, Fujitsu, Cisco and Intel and smaller companies like Airspan and Altiostar to choose custom solutions.

This also means that multi-vendor interoperability and a multitude of innovations like virtualization and automation will largely depend on a vendor’s nimbleness in the research and development space.

The innovations behind O-RAN

O-RAN architecture is a concept designed to address the future needs of mobile network providers based on openness, interoperability and industry collaboration as a whole. Traditional network deployments rely on 3GPP-compliant hardware, typically designed by a single vendor providing a closed-box software and hardware solution as well as security aspects of the networks. On the other hand, the O-RAN Alliance and its members (which include leading telecom, cloud and chipset suppliers, as well as network operators) have been leading an effort to standardize virtual RAN functions and open interfaces to enable cloud-native deployments and multi-vendor interoperability.

O-RAN opens the door to new solutions

One of the goals of this initiative is to maximize the openness and use of common off-the-shelf hardware while minimizing the use of the proprietary telecom hardware. Creating a standardized multi-vendor virtual RAN environment allows third parties to access what used to be closed vendor RAN data and create a multitude of innovative services and applications.

O-RAN promises open interfaces that enable smaller vendors to introduce their products and services in ways that are tailored to suit operators’ unique needs. This should foster vendor diversity and infrastructure robustness while allowing the operators to minimize security risks by controlling all aspects of the network.

By using commercial off-the-shelf (COTS) hardware with virtualization software in the form of containers and virtual machines (VM), the Radio Access Network basically becomes the first app in the O-RAN app store.

Improving network security and agility

Another major aspect of O-RAN is the unparalleled view it provides into the security apparatus of the network, allowing the operator to have full end-to-end visibility and transparency into the entire stack — and to control the entire supply chain for each and every component. Furthermore, because of the software-based nature of O-RAN, the operator has the ability to add, inspect or replace network functions much faster than with traditional deployments which often require physical visits for upgrades. In this way O-RAN improves the efficacy and agility of the network.

This is potentially the first time in the history of the mobile industry where operators will be given the voice and the ability to custom-build networks. From an engineering perspective, moving hardware-based baseband to the virtual world is challenging, but also fun. With recent advancements in software-defined networks and virtualization, LTE and 5G networks have the potential to behave like Wi-Fi networks from installation through integration. The concept of a telecom app store will continue driving innovation, collaboration and industry support, while both private and government sectors will need to be engaged to drive this ongoing transformation in the industry.

Allowing applications to program the network

During the last decade, progress has been made on building applications that can run on top of the network. O-RAN promises to take this to the next level by allowing applications to actually program and run the network itself, which introduces the importance of artificial intelligence (AI). The use of AI to program a network could dramatically simplify the rollout and operation of 5G networks.

Leveraging automation, virtualization and artificial intelligence could also enable self-driving network operations and reduce operating expense. Future deployments could (ideally) depend on virtualized network elements and a standardized white-box approach, which would foster a multi-vendor, interoperable and autonomous RAN.

One of the main propositions of O-RAN architecture is to extend the software-defined network (SDN) concept of decoupling the control-plane (CP) from the user-plane (UP) into RAN, while bringing in embedded intelligence. Separating UP from CP allows for more scalability and cost-effectiveness on the UP. According to the O-RAN Alliance White Paper, this new architecture introduces a set of key interfaces between multiple decoupled RAN components. These include enhanced 3GPP interfaces (F1, W1, E1, X2, Xn) to enable multi-vendor interoperability. In addition to the proposed white-box hardware, many software components will be delivered on an open-source basis like the RAN intelligent controller, protocol stack, PHY layer processing and virtualization platform.

How Rakuten made the world’s first Open Radio Access Network

As a brand new entrant in the Japanese mobile space, Rakuten took its cloud-centric approach and virtualized everything from radio to the core with hundreds of virtual functions implemented. These functions are delivered from multiple computing centers leveraging COTS hardware.

Rakuten has also fostered innovation on the radio access side by having infrastructure giants like Nokia agree to open up the radio, which is typically a black box. This allows Rakuten to control all the hardware that goes into the network, the supply chain, the ecosystem as well as the security aspect of this platform. Rakuten prides itself in the “zero touch provisioning” which breaks free from traditional network rollouts, drastically speeds up the deployment process and requirements, and redefines the way telecom operators can architect, provision and deploy the network.

A company like Rakuten — with decades of experience running server-centric IP-based services — already has an advantage over traditional telcos because of the hundreds of edge data centers they operate. At this time, Rakuten has an infrastructure of nearly 300 edge data centers that can bring content geographically closer to the user and drastically reduce latency. The CP workloads are handled by central data servers, and the entire operation is managed by the horizontal cloud. Everything from radio access, transport and network functions are virtualized and orchestrated by the Rakuten Mobile operating system.
Mobile-Architecture_1120_en-1

The process of activating and provisioning a new site takes minutes, rather than hours or days, bringing significant savings in capital and operational expenditures. For the field technicians this means all they have to do is hang radio units, connect the fiber and power, and the new cell site will be up and running.

Rakuten began initial trials late last year. Using an app-based approach, they onboarded 5,000 customers to test and validate the world’s first end-to-end cloud-native architecture. The official April 2020 launch was on LTE only, and the initial network service area covers Tokyo, Nagoya City and Osaka City. Outside of the native coverage area, users will have the ability to roam on KDDI and Okinawa Cellular. Since the operator owns the end-to-end orchestration and automation of eNodeB as a virtual network function, and both hardware and software is 5G-ready from the get-go. This also means that new network feature rollouts and fixes are significantly easier than they are for a traditional telco. On September 30, Rakuten rolled out a commercial 5G network which will be the test of how easy this flexible software-based architecture makes rolling out core and network functions.

Rakuten Mobile is performing well so far

As revolutionary as Rakuten’s approach is, end users are more likely to care about performance than how the network is configured. We took a look at Rakuten’s performance over 4G LTE and 5G in Tokyo during Q2-Q3 2020. Data for 5G is limited to Q3 as Rakuten’s 5G is only newly commercially available.

Median Speeds for Rakuten Mobile in Tokyo
Speedtest Intelligence® | Q2-Q3 2020
Download (Mbps) Upload (Mbps)
Q2 LTE 38.05 18.28
Q3 LTE 31.68 19.51
Q3 5G 101.33 18.78

Rakuten delivered a median LTE download speed of 38.05 Mbps in Q2 2020. However, LTE download speed was 16.7% lower in Q3 2020. Upload speed over LTE increased slightly. Users with access to the 5G network layer that launched at the end of Q3 2020 experienced a median download speed of 101.33 Mbps, 166.3% faster than the median download speed over LTE in Q2 and 219.9% faster than median download speed over LTE in Q3. The median upload speed on 5G was slower than on LTE.

What operators can learn from the Rakuten model

The Rakuten model is a very early dive into the world of O-RAN architecture. It went from a proof-of-concept to a fully fledged commercial mobile network serving millions of customers in what felt like the blink of an eye. There are still many unknowns, in particular in terms of future scalability and security, but the operator seems to be very confident with its own Rakuten Mobile Platform (RMP). In fact, that same platform is being offered as a turn-key solution to existing mobile operators and new entrants.

This model promises a significant cost reduction in both capital and operating expense, including head count (due to the data-centric nature and the level of automation). This approach seems to pose a threat to the traditional telecom giants like Ericsson, Nokia and Huawei in terms of revenue. However, these companies’ willingness to open their radio components and allow customization for Rakuten’s specific needs implies that broader change is coming in the telecom world.
dish_spectrum_map_en-01

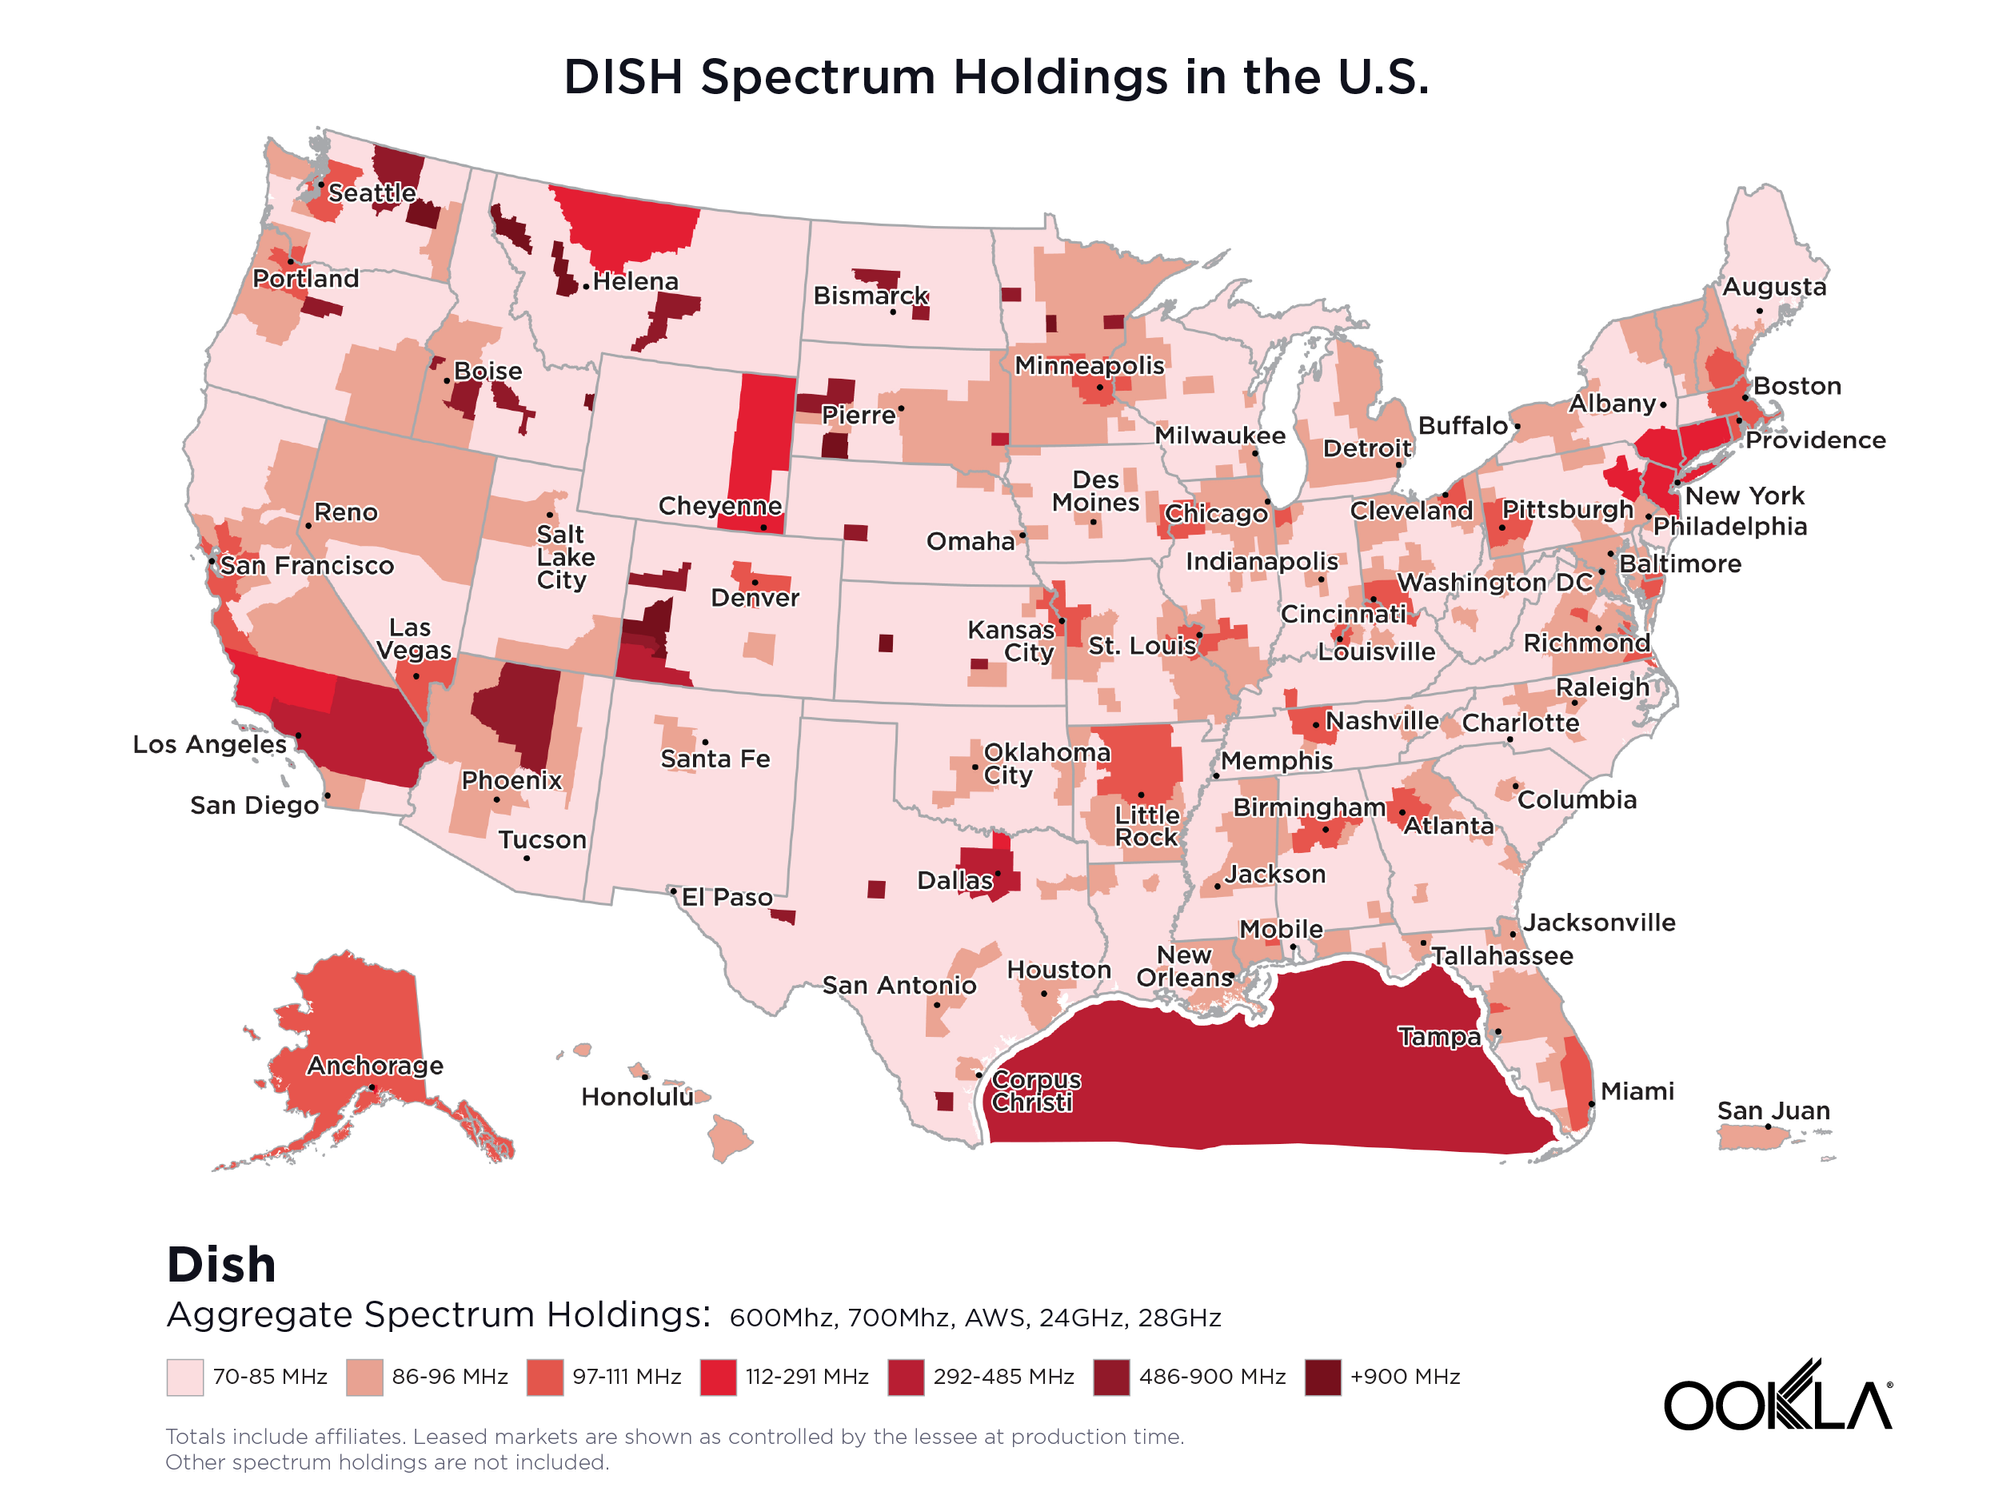
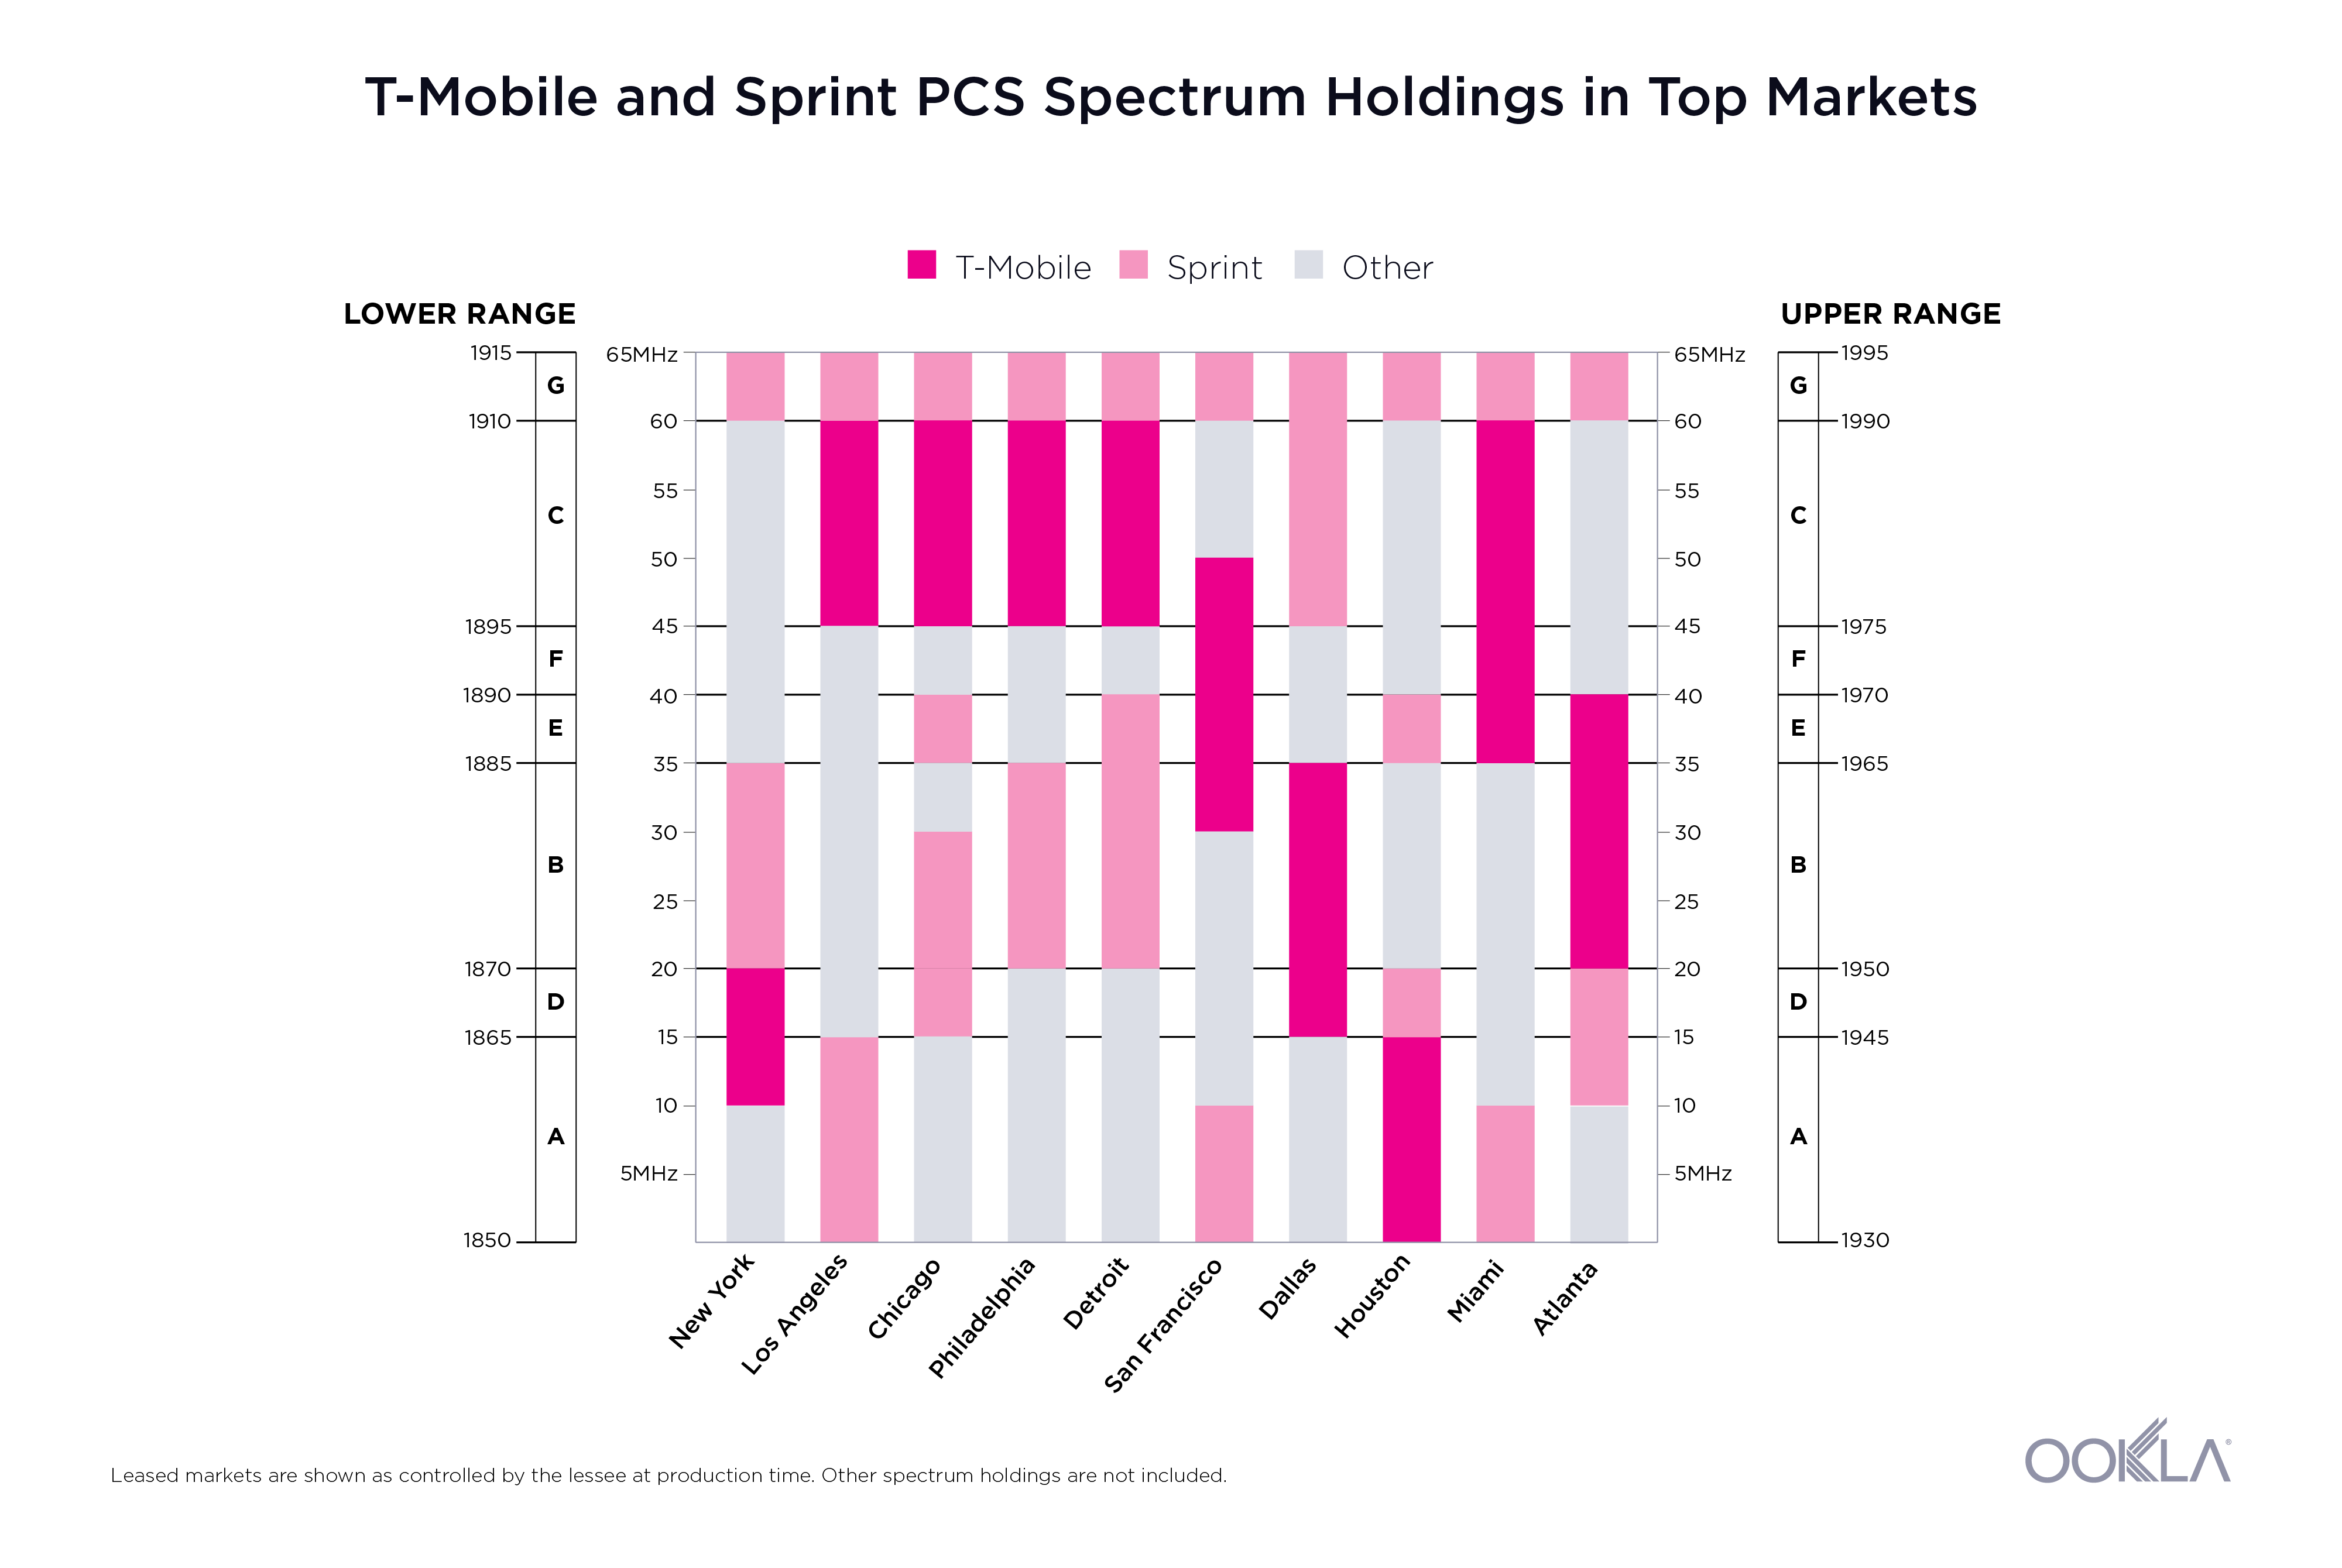
An operator that could benefit from the extension of this experiment is DISH, a recent entrant to the U.S. mobile market. Over the past few decades, DISH has acquired significant amounts of spectrum that spans from 600 MHz all the way up to the mmWave, including the potential acquisition of Sprint’s 800 MHz spectrum assets. Similar to Rakuten Mobile, DISH could potentially combine fallow spectrum and the promise of building and deploying a facilities-based O-RAN 5G network. Deploying a lean network could, at least in theory, enable a rapid deployment of DISH’s assets, which could create many new jobs while leveraging American companies that are eager to innovate and disrupt, such as Cisco, Altiostar, Mavenir, Qualcomm, Intel and Airspan (to name a few).

A recent announcement reveals VMWare as a strategic partner in providing a cloud-based abstraction layer, which is essentially a 5G operating system that will hold the silicon, software and cloud together, and will enable a hyper-scale of public cloud capacity where needed.

O-RAN would allow DISH and other mobile operators to expand beyond the constraints of vertical solutions provided by traditional telco vendors like Ericsson, Huawei and Nokia. The O-RAN concept would simplify and fully automate the network deployment using DISH’s greenfield environment. Nokia has been the most receptive to the O-RAN approach, agreeing to provide 5G core applications including subscriber management, device management and integration services (among others). DISH has recently signed a deal with Japanese giant Fujitsu, securing a large order of O-RAN-compliant radios while Altiostar and Mavenir will also be providing O-RAN software.

While all eyes will be immediately focused on Rakuten Mobile and its cloud-native O-RAN 5G network, operators and infrastructure vendors around the world are working together to improve the O-RAN concept. From a financial and operational standpoint, the O-RAN model makes a lot of sense, and a few operators are already looking into leveraging at least some tools from the O-RAN toolbox. India’s Reliance Jio has plans for a deployment similar to Rakuten’s, while U.S. telcos Verizon and AT&T are already making steps to allow for multi-vendor 5G interoperability in some markets. Recently, Telefónica Spain and STC in Saudi Arabia have shown interest in Rakuten’s mobile platform.

We are likely to see a lot more O-RAN announcements in the coming year, and we at Ookla will continue monitoring Rakuten’s network performance, so stay tuned.


楽天がO-RANの活用でモバイルを一新、携帯電話の今後のありかたをまったく変える可能性を示す

日本の企業はこれまでに何度も、顧客の生活を豊かにする革新的な新技術導入の最前線にいました。たとえば、世界初の1Gの通話サービスは1979年に日本で初めて始まりました。そのため、楽天がOpen Radio Access Network(O-RAN)標準を採用し、クラウドネイティブなモバイルネットワークとして楽天モバイルを構築することで、携帯通信への最先端のアプローチがすでに日本で始まっていることも驚きではありません。楽天は、この完全に仮想的なモバイルネットワークにより、ネットワークの構築とアップグレードにかかるコストを削減し、さらに、楽天モバイルの顧客にオンラインでのアクティビティにおける一貫したユーザーエクスペリエンスを提供できるようになりました。

楽天が確立された市場を打破

JP-Rakuten-Diagram

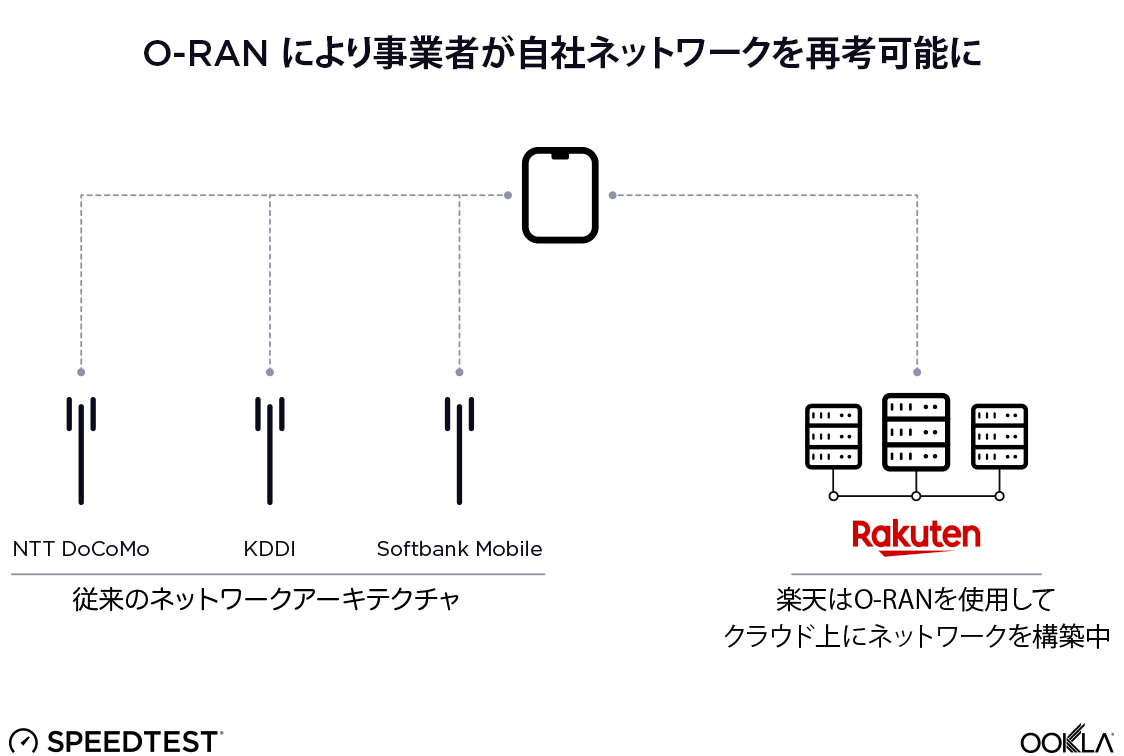
楽天モバイルの参入以前、日本の携帯通信市場はNTT Docomo、au by KDDI、Softbankモバイルの3社の主要な事業者によって支配されていました。これら3社すべては10年以上運営されており、日本全国で5Gを展開しています。

NTT DoCoMoは日本電信電話(NTT)から派生し、1991年に2Gサービスを開始しました。その後10年間で、同社は3Gに移行しています。現在は、700MHz、800MHz、1.5GHz、1.8GHz、2.1GHz、3.5GHzのバンドでLTEサービスを提供しています。現在、同社は3.6GHz、4.5GHz、ミリ波で5Gサービスを開始しています。

KDDIは、KDD、DDI、IDOの3社が合併して2000年に設立されました。同社は2Gと3GサービスにCDMA技術を使用し、現在では700MHz、800MHz、1.4GHz、2.1GHz、3.5GHzを使用してLTEサービスを提供しています。最近開始された5Gサービスは、3.8GHz、4.1GHz、ミリ波で展開されています。

日本の3つめのキャリアであるSoftbankモバイルは、Vodafone Japanを買収して2006年に日本市場に参入しました。SoftbankモバイルのLTE周波数バンドは700MHzから3.5GHzで、5Gは3.9GHzとミリ波で展開されています。

楽天は携帯通信事業に初参入ですが、同事業は確立されたビジネスの一部となっています。1997年にわずか6名の従業員と1台のサーバーでEコマース企業として設立された同社は、現在では70社以上の企業のポートフォリオと、10億人以上の会員とポイントプログラムの顧客を世界中に抱え、グローバルに展開しています。同社は現在幅広い業界に展開しており、いくつか例を挙げると、銀行、旅行、オンラインショッピング、広告、グローバルメッセージ機能、動画配信、データ解析、そして携帯通信などです。

楽天が携帯通信事業者として非常に興味深い点は、同社の文化とクラウド事業における数十年分のデータ中心のノウハウです。エンドツーエンドのユーザーエクスペリエンスの提供と顧客のオンラインジャーニー全体の制御は、確かに多大な価値をもたらしていますが、同時に、Amazon、Google、Appleなどの情報技術系最大手企業が携帯通信事業に参入したことを連想させます。完全に仮想化されたネットワーク機能を実行するという約束のもと、ネットワークの展開と運用費用に関連するコストが大幅に削減され、新規通信事業者が増えることでモバイルネットワークの実行と運用に新しい展望をもたらすでしょう。

楽天はクラウドを活用してインフラストラクチャの鎖を解く

楽天は、核となる技術と無線アクセス技術について従来のネットワークインフラストラクチャの設備ベンダーに完全に依存するのではなく、O-RANを使用してクラウドネイティブなモバイルネットワークへのアプローチを採用しました。これは、楽天が無線アクセスをベースバンド処理から分離させ、多数のネットワーク機能を仮想化していることを意味します。このアプローチでは、楽天の強みであるデータセンターとクラウドを基盤としています。

従来の携帯通信業界では、インフラストラクチャベンダーのソリューションがエンドツーエンドの垂直スタックを提供することが一般的でした。これには、無線アクセスとベースバンド処理から、転送とコアに至るまでのすべてが含まれています。これは、事業者がHuawei、Nokia、Ericssonなどのインフラストラクチャの大手企業との契約に縛られると、ソフトウェアとハードウェアの私的に閉じられたエコシステムに閉じ込められることを意味します。

ハードウェアとソフトウェアが分離されると、事業者は大小あらゆる企業によって提供される、あらゆるソフトウェア定義機能を自由に展開できます。これは「ホワイトボックス化」されたO-RANのガイドラインに従っています。「仮想化」と呼ばれるこのアプローチは、あらゆる既成のコンピューターサーバー上で実行可能です。仮想化は従来の携帯通信ハードウェアの重要性を低減し、展開を高速化し、イノベーションを促進して事業者の資本支出を大幅に減らします。仮想化は従来の事業者の経済を一瞬で簡単に破壊させ得るため、新たな参入企業と業界全体の両方で新鮮な機会を創出しています。O-RANを使用することで、事業者は、Nokia、NEC、富士通、Cisco、Intelなどの大手インフラストラクチャベンダー、およびAirspanやAltiostarなどの小規模な企業と提携し、カスタムのソリューションを選択できます。

これは同時に、マルチベンダーの相互運用性と、仮想化や自動化などのイノベーションの数が、研究と開発分野におけるベンダーの俊敏性に大きく依存することも意味します。

O-RANの背景にあるイノベーション

O-RANアーキテクチャは、モバイルネットワークプロバイダーの将来のニーズに対応するために設計されたコンセプトで、オープン性、相互運用性、業界全体の協業性に基づいています。従来のネットワーク展開は3GPP準拠のハードウェアに依存しており、これは通常、クローズボックスのソフトウェアとハードウェアソリューション、およびネットワークのセキュリティ面を提供する単一のベンダーにより設計されています。一方で、O-RANアライアンスとそのメンバー(大手通信企業、クラウドおよびチップセットのサプライヤー、携帯通信事業者を含む)は、仮想RAN機能とオープンインフラストラクチャを標準化し、クラウドネイティブな展開とマルチベンダーの相互運用性を実現するための取り組みを進めています。

新たなソリューションへの扉を開くO-RAN

このイニシアチブの目標の1つに、私的な携帯通信ハードウェアの使用を最小限にしながら、オープン性と一般的な既成ハードウェアの使用を最大限にすることが挙げられます。標準化されたマルチベンダーの仮想RAN環境を作り上げることにより、サードパーティがかつてはクローズドだったベンダーのRANデータにアクセスし、多くの革新的なサービスとアプリケーションを作成できるようになります。

O-RANは、小規模なベンダーが、事業者固有のニーズに合うようにカスタマイズされた、自社の製品とサービスを導入できるようにするオープンなインターフェイスを確約します。これにより、事業者がネットワークのすべての側面を制御することでセキュリティのリスクを最小限に抑えながら、ベンダーの多様性を広げ、インフラストラクチャの堅牢性を強化することにつながります。

商用の既成(COTS)ハードウェアを、コンテナと仮想マシン(VM)の形で仮想化ソフトウェアとともに使用することで、基本的に無線アクセスネットワークがO-RANのアプリストア内の最初のアプリとなります。

ネットワークのセキュリティと俊敏性を向上

O-RANの他の大きな側面として、ネットワークのセキュリティ組織にもたらされる他にはない視点があります。これにより、事業者はスタック全体に完全なエンドツーエンドの視認性と透明性を手に入れることができます。そして、各コンポーネントすべてに対するサプライチェーン全体を管理できます。さらに、O-RANのソフトウェアベースの性質によって、アップグレードのために物理的に訪れる必要があった従来の展開よりもはるかに高速にネットワーク機能を追加、点検、交換することができます。このようにして、O-RANはネットワークの有効性と俊敏性を高めることができます。

事業者がカスタムに構築されたネットワークを表明し実行できるのは、携帯通信業界においてこれが初めてかもしれません。エンジニアリングの観点からは、ハードウェアベースのベースバンドを仮想世界に移行するのは困難ですが、同時に楽しさもあります。最近のソフトウェア定義ネットワークと仮想化の進歩により、LTEおよび5Gネットワークは、設置から統合までWi-Fiネットワークのように機能する可能性を秘めています。携帯通信アプリストアのコンセプトはこれからもイノベーション、コラボレーション、業界のサポートを推進しつづけます。一方で一般部門と政府部門の両方が業界におけるこの継続的な転換の促進に従事する必要があります。

アプリケーションによるネットワークのプログラミングを実現

ここ10年間で、ネットワークの上層で実行可能なアプリケーションの構築は進歩しています。O-RANは、アプリケーションが実際にネットワークそのものをプログラミングおよび実行できるようにすることで、これを次のレベルへと高めます。これは、人工知能(AI)の重要性につながります。ネットワークのプログラミングにAIを使用することで、5Gネットワークの展開と運用が劇的に簡素化できます。

自動化、仮想化、人工知能の活用により、自己駆動形のネットワーク運用が実現し、運用コストを削減できます。将来の展開は(理想的には)、仮想化ネットワーク要素と標準化されたホワイトボックスのアプローチに基づく可能性があり、これにより、マルチベンダー化、相互運用性、自律型RANが推進されます。

O-RANアーキテクチャの主な課題の1つに、埋め込みインテリジェンスをもたらしながら、同時に制御プレーン(CP)をユーザープレーン(UP)からRANに分離させるという、ソフトウェア定義ネットワーク(SDN)の概念を拡大することが挙げられます。UPをCPから分離させることにより、UPでのスケーラビリティとコスト効率性が高まります。O-RANアライアンスのホワイトペーパーによると、この新たなアーキテクチャによって、複数の分離されたRANコンポーネント間の一連の主なインターフェイスが導入されます。これには、マルチベンダーの相互運用性を実現するための3GPPインターフェイス(F1、W1、E1、X2、Xn)が含まれます。提唱されたホワイトボックスのハードウェアに加えて、多くのソフトウェアコンポーネントは、RANインテリジェントコントローラー、プロトコルスタック、PHYレイヤー処理、仮想化プラットフォームのように、オープンソースベースで提供されます。

楽天はいかにして世界初のオープン無線アクセスネットワークを作り上げたか

日本の携帯通信事業への新たな参入企業として、楽天はそのクラウド中心のアプローチを採用し、数百の仮想化機能を実装して無線からコアにいたるまでのすべてを仮想化しました。これらの機能は、COTSハードウェアを活用した複数のコンピューティングセンターから提供されます。

また楽天は、Nokiaのようなインフラストラクチャ大手企業の周波数を利用可能にすることについて合意を得ることで、無線アクセスにおける革新を促進しました。これは、通常はブラックボックスとなっています。これにより、楽天はネットワーク、サプライチェーン、エコシステム、そしてこのプラットフォームのセキュリティ面に使用されるすべてのハードウェアを制御できます。楽天は、従来のネットワーク展開から解放し、展開プロセスと要件を劇的に高速化させ、携帯通信事業者がネットワークを設計、プロビジョニング、展開する方法を再定義する「ゼロタッチプロビジョニング」に自信を持っています。

サーバー中心のIPベースのサービスを運用してきた数十年の経験を持つ楽天のような企業は、同社が運用する数百のエッジデータセンターにより、従来の携帯通信よりもすでに優位に立っています。現時点で、楽天は300か所近いエッジデータセンターのインフラストラクチャを有しており、地理的にユーザーに近い場所にコンテンツを配信することで、遅延を劇的に低減しています。CPのワークロードは中央データサーバーによって処理され、運用全体は水平的なクラウドによって管理されます。無線アクセス、転送、ネットワーク機能のすべては仮想化され、楽天モバイルのオペレーティングシステムによってオーケストレーションされます。
Mobile-Architecture_1120_jp

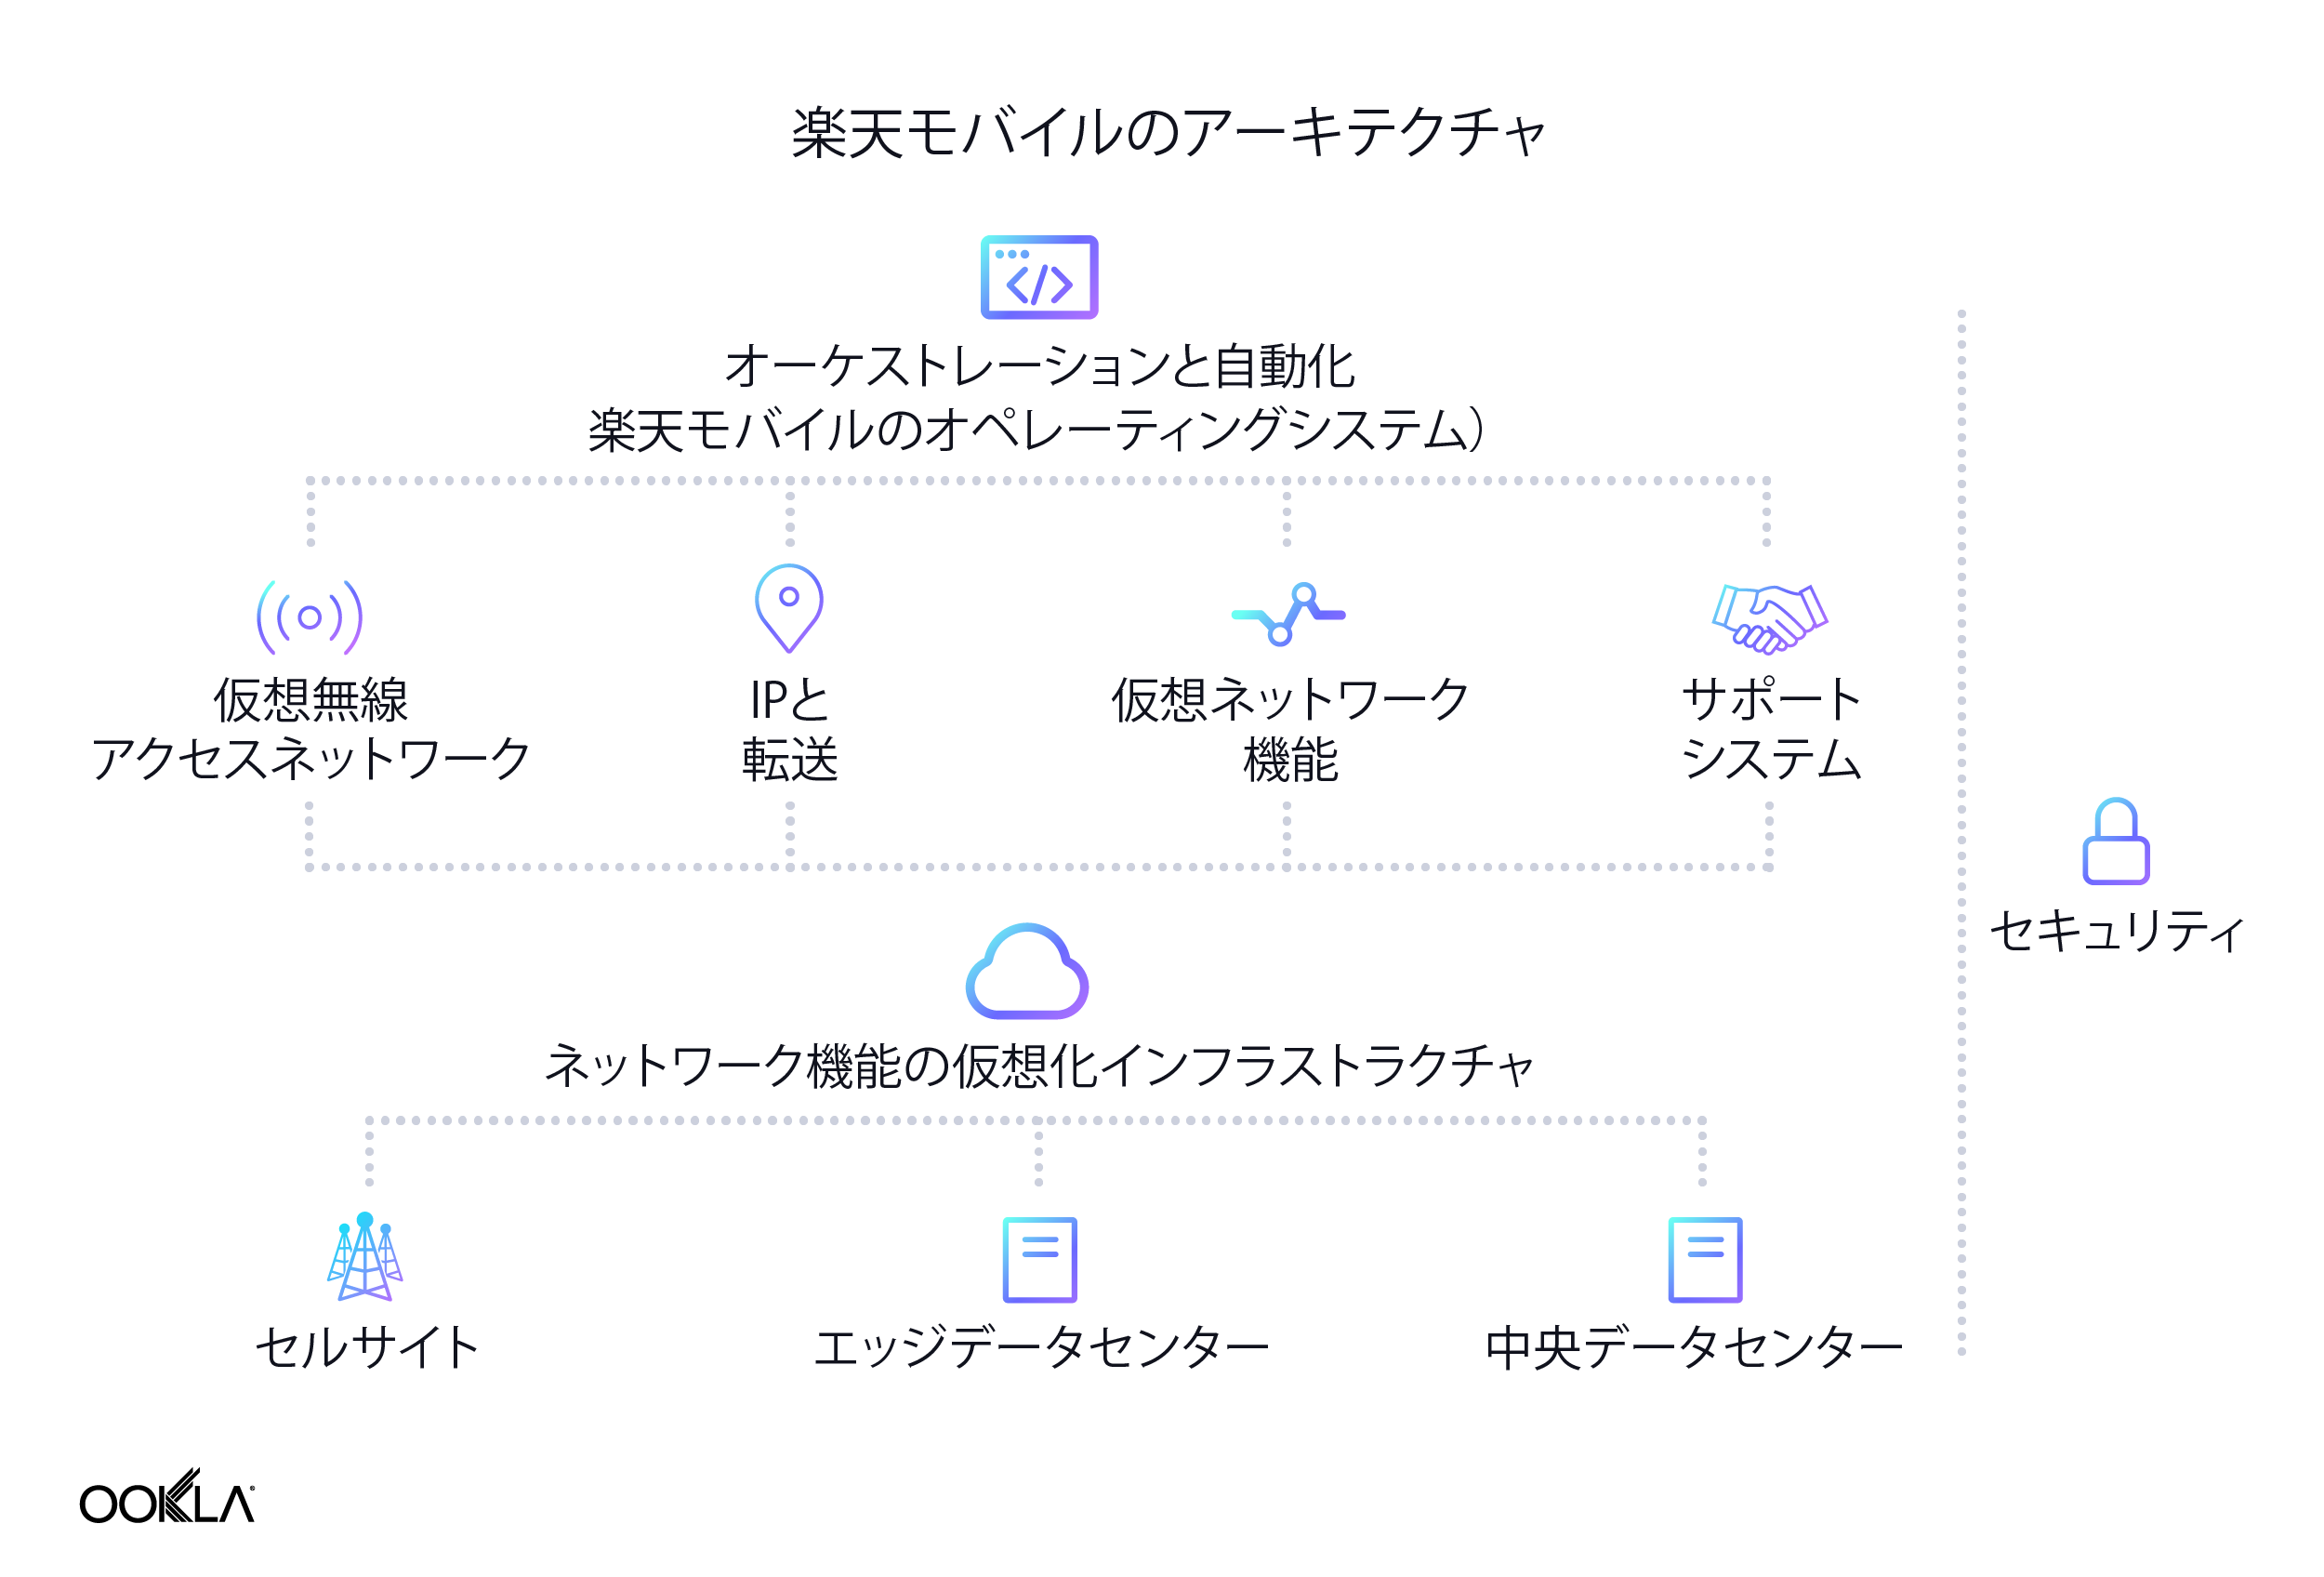
新たなサイトの有効化とプロビジョニングのプロセスは、数時間も数日もかかることなく、数分で完了し、資本コストおよび運用コストを大幅に削減できます。現場技術者にとってこれは、無線ユニットを吊るし、ケーブルと電源を接続するだけで、新たなセルサイトを稼動できることを意味します。

楽天は初期テストを昨年後半に開始しています。アプリベースのアプローチを使用することで、5,000人の顧客を招待して世界初のエンドツーエンドのクラウドネイティブなアーキテクチャをテストおよび検証しました。2020年4月に公式に運用開始したのはLTEのみで、当初のネットワークサービスでは東京、名古屋市、大阪市のエリアをカバーしています。ネイティブにカバーされているエリアの外では、ユーザーはKDDIおよび沖縄セルラーからローミングできます。事業者は、eNodeBのエンドツーエンドのオーケストレーションと自動化を仮想ネットワーク機能として所有しており、ハードウェアとソフトウェアの両方が最初から5Gに対応しています。これは、新たなネットワーク機能の展開と修正が従来の携帯通信よりも大幅に簡単であることも意味します。9月30日に、楽天は商用の5Gネットワークを展開しました。これは、この柔軟なソフトウェアベースのアーキテクチャによって、コアとネットワーク機能の展開がどれくらい簡単になるかのテストです。

楽天モバイルのパフォーマンスは順調

楽天のアプローチは革命的ですが、エンドユーザーはネットワーク構成の仕組みよりもパフォーマンスを気にします。2020年第2四半期から第3四半期の、東京における4G LTEと5Gの楽天のパフォーマンスを確認してみました。楽天の5Gは商用的に開始されたばかりのため、5Gのデータは第3四半期のみとなっています。

東京における楽天モバイルの中央速度
Speedtest Intelligence® | 2020年第2四半期から第3四半期
下り(Mbps) 上り(Mbps)
第2四半期LTE 38.05 18.28
第3四半期LTE 31.68 19.51
第3四半期5G 101.33 18.78

楽天は、2020年第2四半期のLTEの中央速度が下り38.05Mbpsでした。しかし、2020年第3四半期にはLTEの下り速度は16.7%落ちています。LTEでの上り速度はわずかに上昇しています。2020年第3四半期の終わりに開始された、5Gネットワークレイヤーにアクセスできるユーザーは、101.33Mbpsの下り中央速度で利用しています。これは、第2四半期のLTEでの下り中央速度よりも166.3%速く、さらに第3四半期の下り中央速度よりも219.9%速くなっています。5Gの上り中央速度はLTEよりも低速でした。

事業者が楽天モデルから学べること

楽天モデルでは、O-RANアーキテクチャの世界へかなり早い段階で踏み入りました。そこから概念実証が始まり、あっという間に数百万人のユーザーにサービスを提供する、完全に実用的な商用モバイルネットワークになりました。特に将来のスケーラビリティとセキュリティに関しては、まだ数多くの未知の部分があるものの、楽天は独自の楽天モバイルプラットフォーム(RMP)に非常に信頼を置いているように見えます。実際、この同じプラットフォームが既存の携帯通信事業者と新たな参入企業に対して、ターンキーソリューションとして提供されています。

このモデルでは、社員数を含む、資本コストと運用コストの両方の大幅な削減が確約されています(データ中心の性質と自動化のレベルによるものです)。このアプローチは、Ericsson、Nokia、Huaweiのような従来の携帯通信大手企業にとって、収益の観点からは脅威となる可能性を秘めているでしょう。ただし、これらの企業が無線コンポーネントを開放し、楽天固有のニーズに対するカスタマイズを快く許可したことは、携帯通信業界において大きな変化が訪れることを示唆しています。
dish_spectrum_map_jp-01

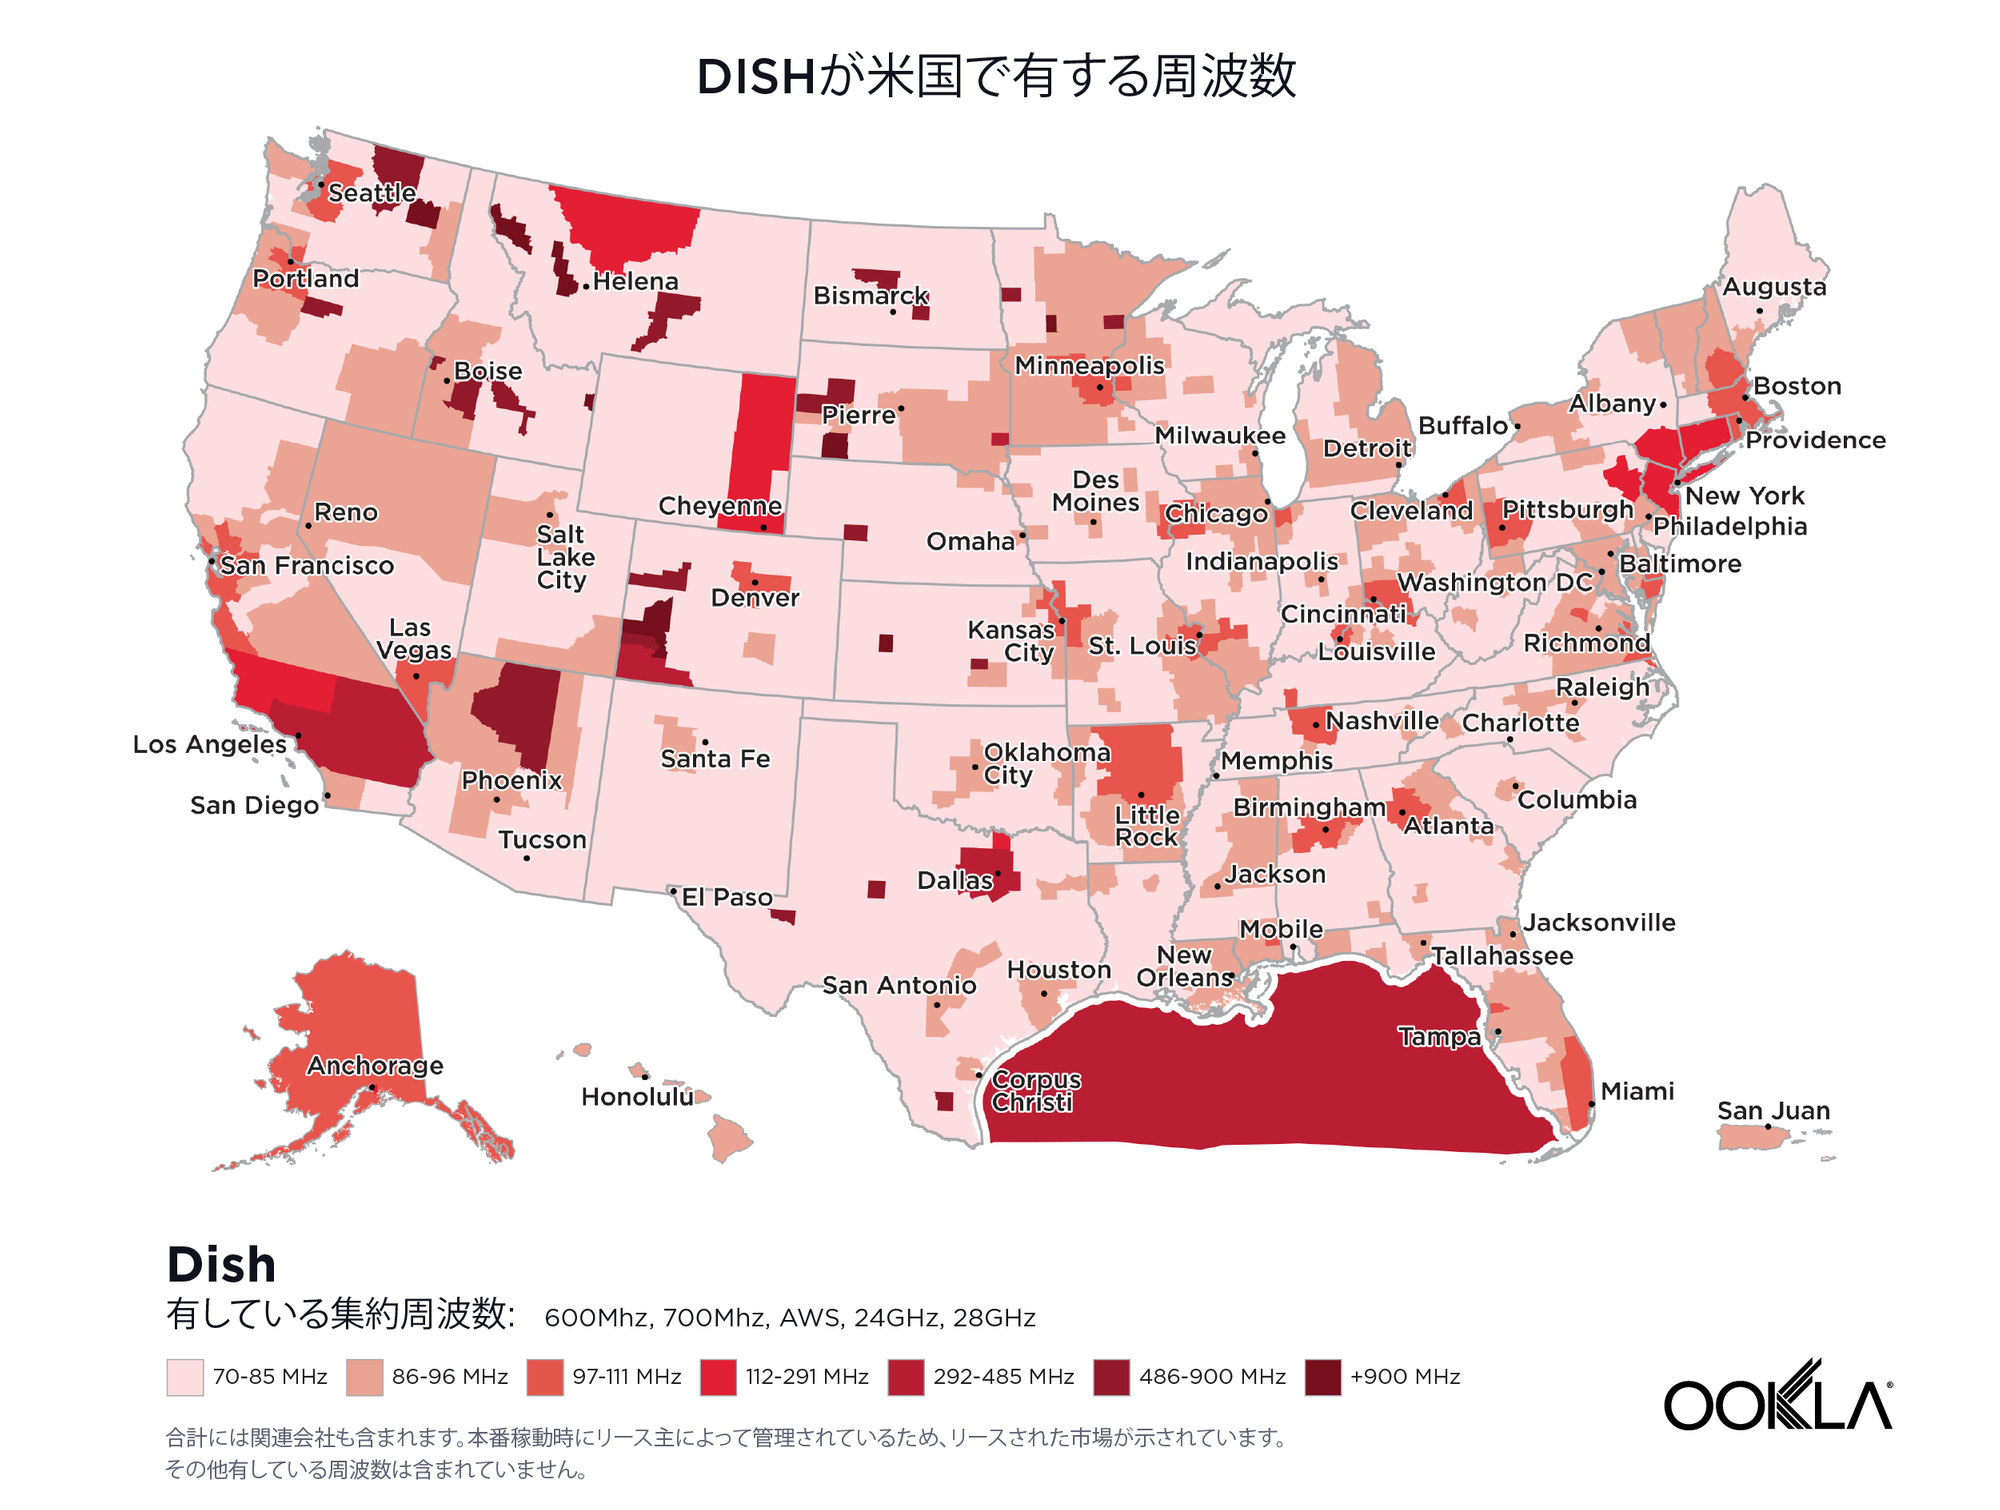
この試みが広がることでメリットを享受できる可能性のある事業者にDISHが挙げられます。同社は、米国の携帯通信市場に最近参入しました。過去数十年間で、DISHは600MHzからミリ波にいたるまでの十分な周波数を獲得しています。また、Sprintの800MHz周波数アセットも獲得予定です。楽天モバイルと同様に、DISHでは、使用されていない周波数と、施設ベースのO-RAN 5Gネットワークを構築および展開するという契約を組みわせることが検討されています。無駄のないネットワークの展開によって、少なくとも理論的には、DISHのアセットの迅速な展開が可能になります。これにより、Cisco、Altiostar、Mavenir、Qualcomm、Intel、Airspanなど(ごく一部の例ですが)の、革新と打破に意欲的な米国企業を活用しながら、多くの業務が新たに創出される可能性があります。

最近の発表では、VMwareが、シリコン、ソフトウェア、クラウドをまとめて有する本質的な5Gオペレーティングシステムであり、必要な場合にパブリッククラウドのキャパシティを拡大できるようにする、クラウドベースの抽象化レイヤーの提供における戦略的パートナーとなっています。

O-RANにより、DISHなどの携帯通信事業者が、Ericsson、Huawei、Nokiaなどの従来の携帯通信ベンダーにより提供されている垂直的なソリューションの制約を超えて拡張することができるようになります。O-RANの概念は、DISHの未開発環境を使用したネットワーク展開を簡素化し、完全に自動化するものになるでしょう。NokiaはO-RANアプローチを最も受け入れている企業であり、とりわけ登録者管理、デバイス管理、統合サービスなどの5Gコアアプリケーションの提供に合意しています。DISHは最近、O-RANに準拠した大量の無線を有している日本の大手企業である富士通との契約に署名しています。一方、AltiostarとMavenirもO-RANソフトウェアを提供予定です

楽天モバイルとそのクラウドネイティブなO-RAN 5Gネットワークに多くの注目が集まる一方で、世界中の事業者とインフラストラクチャベンダーが協力してO-RANの概念を向上させています。経済的および運用的な観点からは、O-RANモデルは大変理にかなっており、小数の事業者はすでにO-RANツールボックスの少なくとも一部のツールを活用することを検討しています。インドのReliance Jioでは楽天に似た展開を計画しており、米国の携帯通信事業者であるVerizonとAT&Tではすでに一部の市場でマルチベンダーの5G相互運用性を許可するための手順を踏んでいます。最近では、サウジアラビアのTelefónica SpainおよびSTCが楽天のモバイルプラットフォームに興味を示しています。

来年にはさらに多くのO-RAN関連の発表があると思われます。Ooklaでは楽天のネットワークのパフォーマンスを引き続き注視していく予定です。

Ookla retains ownership of this article including all of the intellectual property rights, data, content graphs and analysis. This article may not be quoted, reproduced, distributed or published for any commercial purpose without prior consent. Members of the press and others using the findings in this article for non-commercial purposes are welcome to publicly share and link to report information with attribution to Ookla.

| December 4, 2019

Borrowed Networks: National Roaming in Mexico


Leer en español

Increased competition and new roaming agreements have significantly changed the telecommunications landscape in Mexico in the past decade such that subscribers of some operators often have cellular connectivity even if their own provider does not have coverage in a certain area. We considered Speedtest® data from Android devices during Q3 2019 to investigate where subscribers experience roaming, how much time they are spending roaming on 4G and how roaming affects mobile speeds.

Roaming is common in Mexico, but differs widely by operator and location

Ookla_Mexico_ATT_On-network_Roaming_map_1219_en
Ookla_Mexico_Movistar_On-network_Roaming_map_1219_en
Ookla_Mexico_Telcel_On-network_Roaming_map_1219_en

AT&T, Movistar and Telcel all demonstrated a majority of on-network activity in major cities like Mexico City, Guadalajara, Mérida, Monterrey and Tijuana. However, Telcel showed substantially more on-network activity in areas beyond large cities than competitors, including up and down Mexico’s western coast from Tapachula in Chiapas to Guaymas in Sonora. Both AT&T and Movistar showed more roaming in this same area.

It’s interesting to note that on-network and roaming activity in Mexico often occur within close proximity, even in major cities. For example, the map shows most of AT&T’s on-network activity concentrated in central Mexico. The same was true of AT&T’s roaming activity. We have considered AT&T and subsidiary Unefon jointly throughout this article.

A similar overlap can be seen in Movistar’s on-network and roaming activity, although Movistar demonstrated roaming in fewer locations than we saw on AT&T. Telcel showed virtually no roaming.

It will be interesting to see how the recent deal between AT&T and Telefonica (Movistar’s parent company) affects the roaming experience for subscribers.

AT&T shows the most Time Spent on 4G on and off network

Time-Spent-On-Net-Roam-in-Mexico-ENG-2

We used Speedtest data on Time Spent to measure how often, on average, consumers were able to connect to 4G LTE on their own network and while roaming in Mexico during Q3 2019. Reported 4G roaming includes “emergency calls only” modes (which do not have normal voice or data service).

Mobile users in Mexico were able to connect on-network to 4G LTE 69.9% of the time on average throughout the country. Separating results by provider, AT&T had the highest Time Spent on-network on 4G at 74.4%. Telcel followed with 70.4% and Movistar was third with 58.1%.

Time Spent roaming on 4G in Mexico was a fraction of what we saw looking at Time Spent on 4G while on-network with users spending an average of 0.7% of the time roaming on 4G during Q3 2019. At the operator level, AT&T subscribers showed the most Time Spent roaming on 4G at 1.4%. Movistar followed with subscribers spending 0.7% of the time roaming on 4G. Telcel subscribers had the least Time Spent roaming on 4G at 0.3%.

Telcel was the fastest operator for on network use

On-net-Roaming-Mobile-Speeds-in-Mexico-ENG-1

At 24.18 Mbps, mean download speed on-network in Mexico was 173.5% faster than mean download speed while roaming during Q3 2019. We use Speed Score™ to measure operator performance as it incorporates measures of download and upload speed. Telcel was the fastest operator with an on-network Speed Score of 28.80. Movistar showed the second fastest on-network performance with a Speed Score of 17.15. AT&T ranked third for on-network performance with a Speed Score of 9.87, 65.7% slower than Telcel.

AT&T had the fastest Speed Score while roaming with a Speed Score of 5.18, 47.5% slower than their on-network measure. Movistar had the second fastest Speed Score while roaming at 3.02, 82.4% less than on-network. Telcel showed virtually no roaming.

We will continue to analyze emerging trends and their effects on internet performance as telecommunications in Mexico continue to evolve. To find out more about internet speeds in Mexico or other parts of the world, contact us.

Editor’s note: The maps and speed data in this article have been revised to further reflect the experience of consumers using a single SIM.


Redes prestadas: Itinerancia nacional en México

El aumento de la competencia y los nuevos acuerdos de itinerancia han cambiado significativamente el panorama de las telecomunicaciones en México en la última década, de tal modo que suscriptores de algunos proveedores frequentemente tienen conectividad celular incluso si su propio proveedor no contaba con cobertura en un área determinada. Tomamos en cuenta datos de Speedtest® de dispositivos Android durante el tercer trimestre de 2019 para investigar dónde experimentan itinerancia los suscriptores, durante cuánto tiempo usan la itinerancia en 4G y de qué manera la itinerancia afecta las velocidades móviles.

La itinerancia es común en México, pero difiere ampliamente por operador y ubicación

Ookla_Mexico_ATT_On-network_Roaming_map_1219_es
Ookla_Mexico_Movistar_On-network_Roaming_map_1219_es
Ookla_Mexico_Telcel_On-network_Roaming_map_1219_es

AT&T, Movistar y Telcel demostraron una mayoría de actividad en la red en grandes ciudades como ciudad de México, Guadalajara, Mérida, Monterrey y Tijuana. Sin embargo, Telcel exhibió una actividad en la red en áreas alejadas de las grandes ciudades sustancialmente mayor que la competencia, incluida la costa oeste de México, desde Tapachula en Chiapas hasta Guaymas en Sonora. Tanto AT&T como Movistar exhibieron mayor itinerancia en la misma área.

Es interesante destacar que, a menudo, la actividad en la red y de la itinerancia en México ocurren a escasa distancia entre sí, incluso en las grandes ciudades. Por ejemplo, el mapa muestra que la mayoría de la actividad en la red de AT&T se concentró en el centro de México. Lo mismo sucedió con la actividad de la itinerancia de AT&T. A lo largo de este artículo consideramos de manera conjunta a AT&T y el subsidiario Unefon.

Puede verse una superposición similar en la actividad en la red y de la itinerancia de Movistar, aunque esta empresa exhibió itinerancia en menos lugares que AT&T. Telcel prácticamente no mostró itinerancia.

Será interesante ver de qué manera el acuerdo reciente entre AT&T y Telefónica (sociedad matriz de Movistar) afecta la experiencia de itinerancia para los suscriptores.

AT&T exhibe la mayor cantidad de tiempo de permanencia en 4G dentro y fuera de la red

Time-Spent-On-Net-Roam-in-Mexico-SP-2

Empleamos datos de Speedtest sobre el tiempo de permanencia para mostrar con qué frecuencia, en promedio, los consumidores pudieron conectarse a 4G LTE en su propia red y durante la itinerancia en México en el tercer trimestre de 2019. Los datos de itinerancia incluyen reportes en modo de emergencia, los cuales no implican servicio de voz y datos.

Los usuarios móviles en México pudieron conectarse a la red en 4G LTE el 69,9 % del tiempo en promedio en todo el país. Si separamos los resultados por proveedor, AT&T tuvo la mayor cantidad de tiempo de permanencia en 4G, con el 74,4 %. Le siguió Telcel, con el 70,4 %, y Movistar quedó tercero con el 58,1 %.

El tiempo de permanencia en itinerancia en 4G en México fue una fracción de lo que se vio de tiempo de permanencia en 4G en la red, ya que los usuarios pasaron, en promedio, el 0,7 % del tiempo con itinerancia en 4G durante el tercer trimestre de 2019. En el caso de los operadores, los suscriptores de AT&T exhibieron la mayor cantidad de tiempo de permanencia en 4G, con el 1,4 %. Le siguió Movistar, con el 0,7 % del tiempo de permanencia en itinerancia en 4G de parte de los suscriptores. Los suscriptores de Telcel tuvieron la menor cantidad de tiempo de permanencia en itinerancia en 4G, con el 0,3 %.

Telcel fue el operador más rápido

On-net-Roaming-Mobile-Speeds-in-Mexico-SP-1

Con 24,18 Mbps, la velocidad media de descarga en la red en México fue un 173,5 % más rápida que la velocidad media de descarga en itinerancia durante el tercer trimestre de 2019. Utilizamos Speed Score™ para medir el rendimiento de los operadores, ya que incluye mediciones de velocidades de carga y descarga. Telcel fue el operador más rápido, con una puntuación de velocidad en la red de Speed Score de 28,80. Movistar tuvo el segundo mejor rendimiento de velocidad en la red, con un resultado de 17,15. AT&T se quedó con el tercer lugar, con 9,87, un 65,7 % más lento que Telcel.

AT&T demostró tener la puntuación más alta de Speed Score, con una velocidad de itinerancia de 5,18, un 47,5% más lento que su medición de la red. Movistar quedó segundo con un resultado de Speed Score de 3,02 en cuanto a la velocidad de la itinerancia, 82,4% inferior al rendimiento de la red de la empresa. Telcel prácticamente no mostró itinerancia.

Continuaremos analizando las tendencias emergentes y sus efectos sobre el rendimiento de Internet a medida que las telecomunicaciones en México continúen evolucionando. Para obtener más información sobre las velocidades de Internet en México y otras partes del mundo, comuníquese con nosotros.

Nota del editor: Los mapas y datos de velocidades en este artículo fueron ajustados para reflejar más a fondo la experiencia de los consumidores usando una sola tarjeta SIM. .

Ookla retains ownership of this article including all of the intellectual property rights, data, content graphs and analysis. This article may not be quoted, reproduced, distributed or published for any commercial purpose without prior consent. Members of the press and others using the findings in this article for non-commercial purposes are welcome to publicly share and link to report information with attribution to Ookla.