| January 22, 2020

What Went Down? The Most Significant Online Service Outages in Q4 2019

“Unable to connect” — three words that bring people together in frustration and annoyance around the world. In the last three months of 2019, outages affected users across the globe as they tried to access all kinds of different industries, from gaming to streaming services. Downdetector® data from Q4 2019 provides unique insight into outages including the dates, duration and location and number of reports submitted by users. We’ve divided the outages into five categories: Gaming, Mobile Operators, Social Media Sites, Streaming Services and Financial Institutions.

Gaming

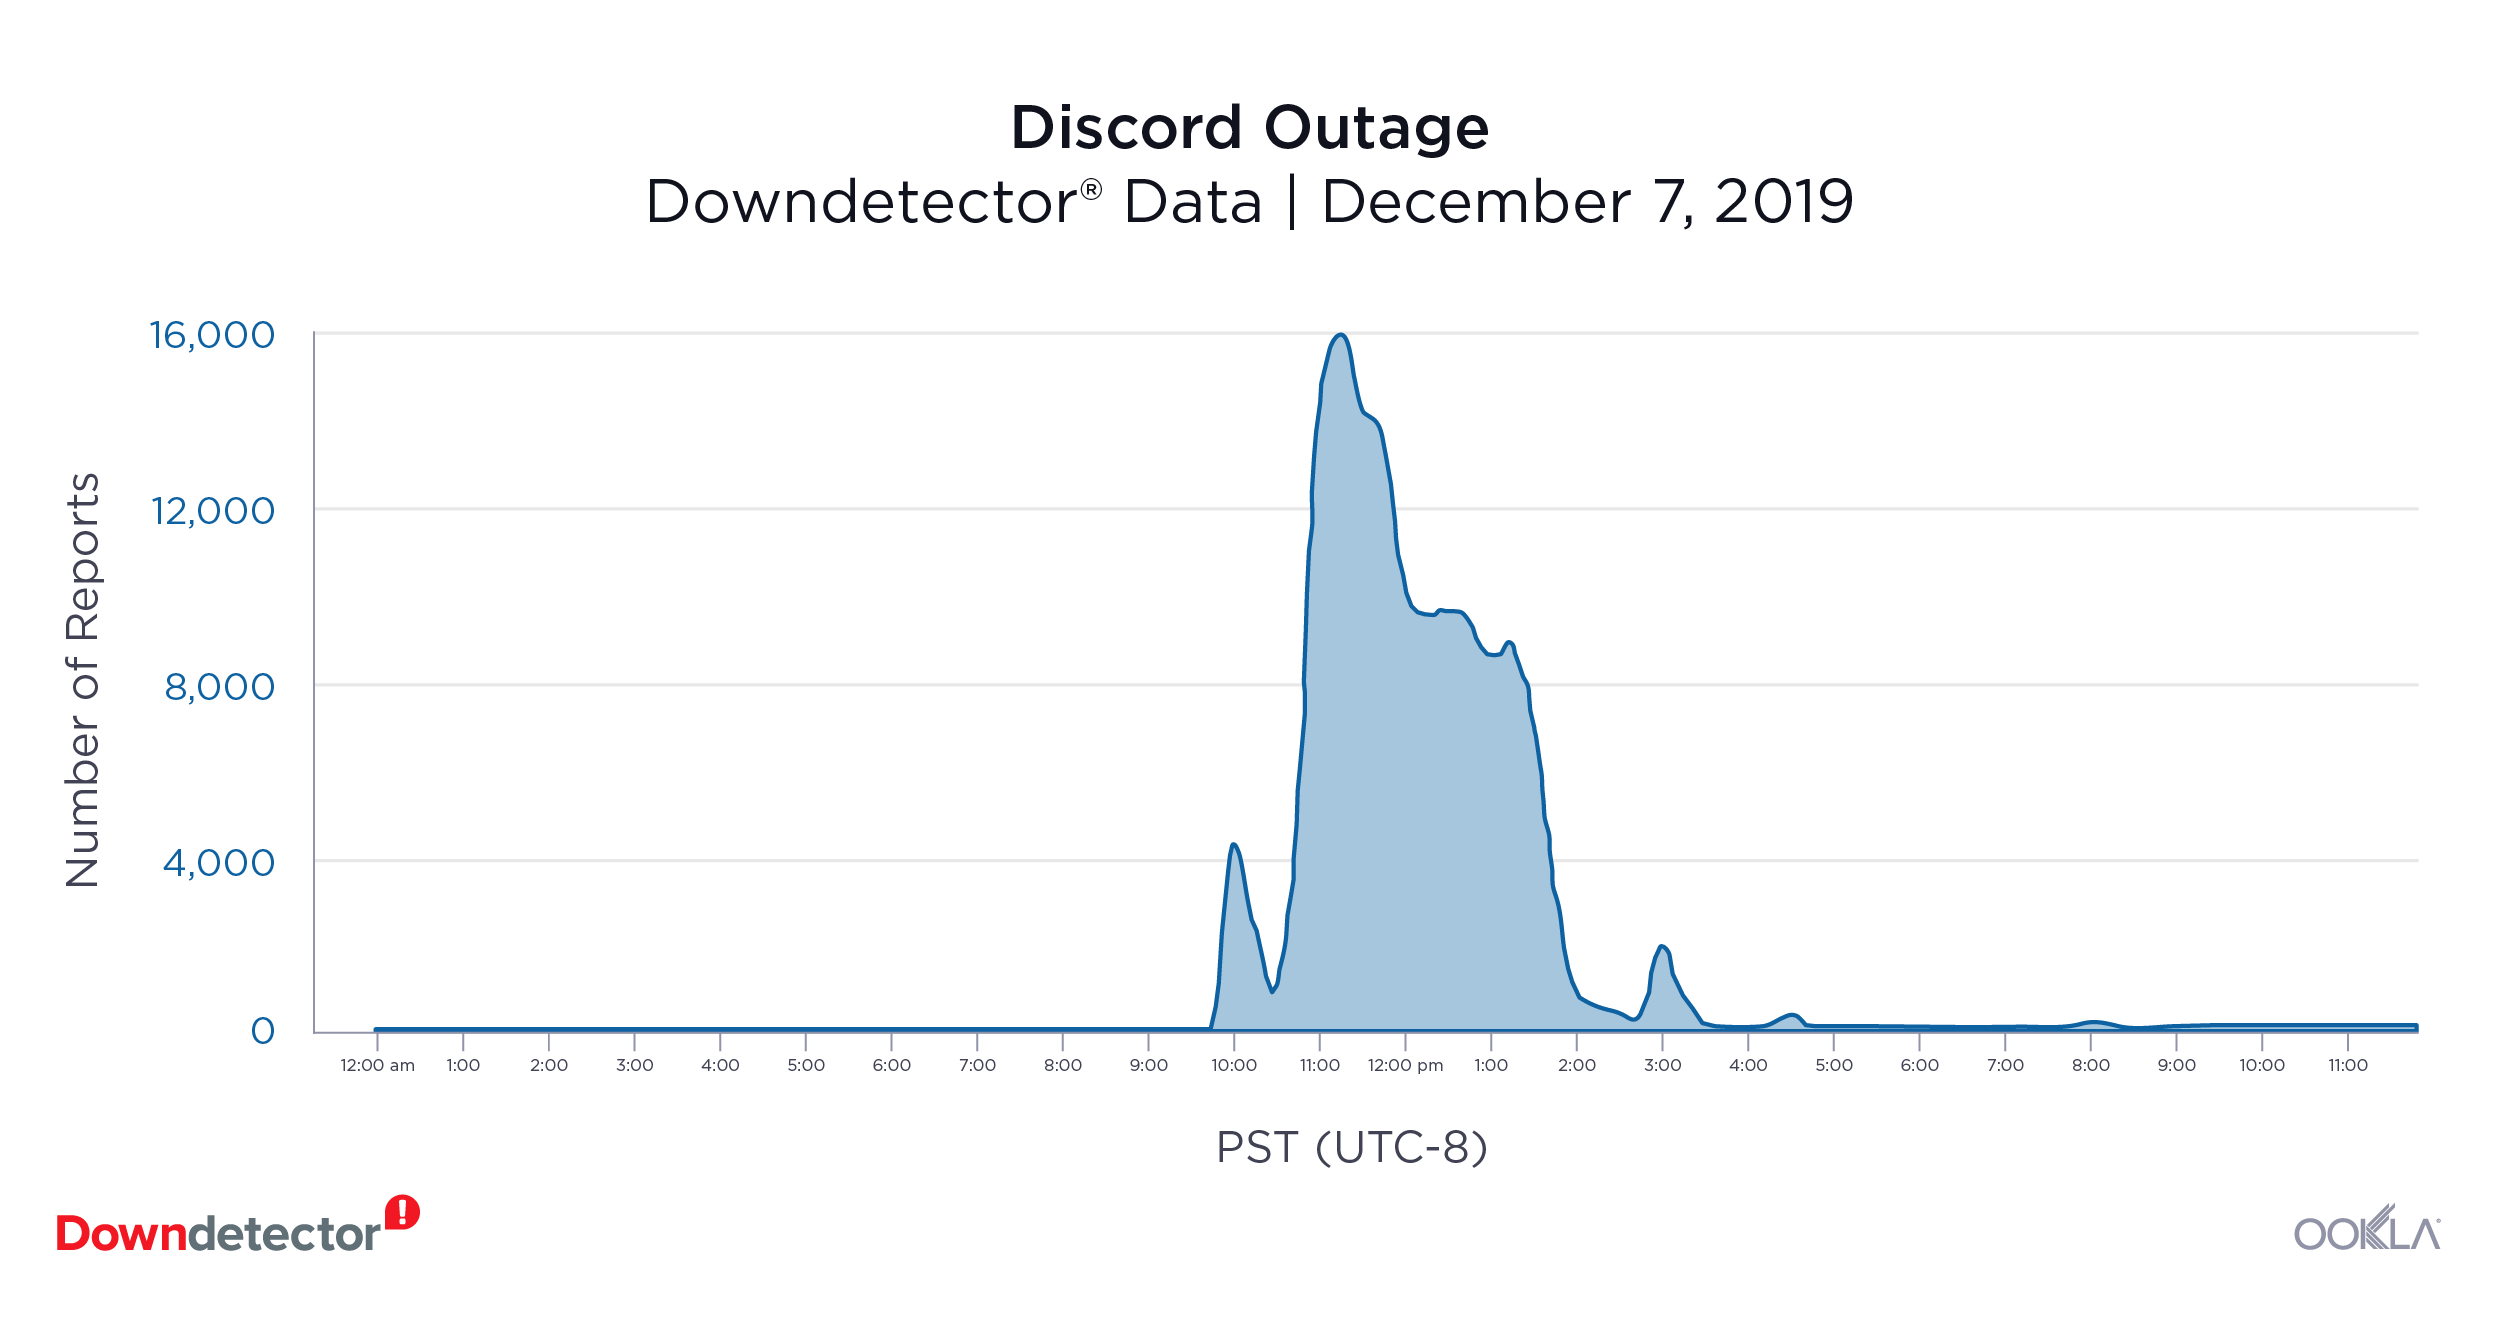
Discord (December 7, 2019): 15,976 outage reports at peak

The largest gaming outage we saw during Q4 2019, Discord, was apparently “due to an issue with Google compute platform.” Starting on December 7, 2019, outage reports were still trickling into Downdetector on December 8. The highest volume of reports happened over 5.5 hours and with a peak of 15,976 reports in the United States.

Downdetector_Outage_Discord

Fortnite (October 13, 2019): 11,326 outage reports at peak

“The End”, an event where Fortnite was preparing for a big release, coincided with the largest Fortnite outage we saw during Q4 2019. On October 13, 2019, Fortnite users flooded to Downdetector to report an outage that started around 10:30 a.m. PST and lasted for six and a half hours. At the peak of the outage there were 11,326 reports, predominantly from users in the United States.

Mobile Operators

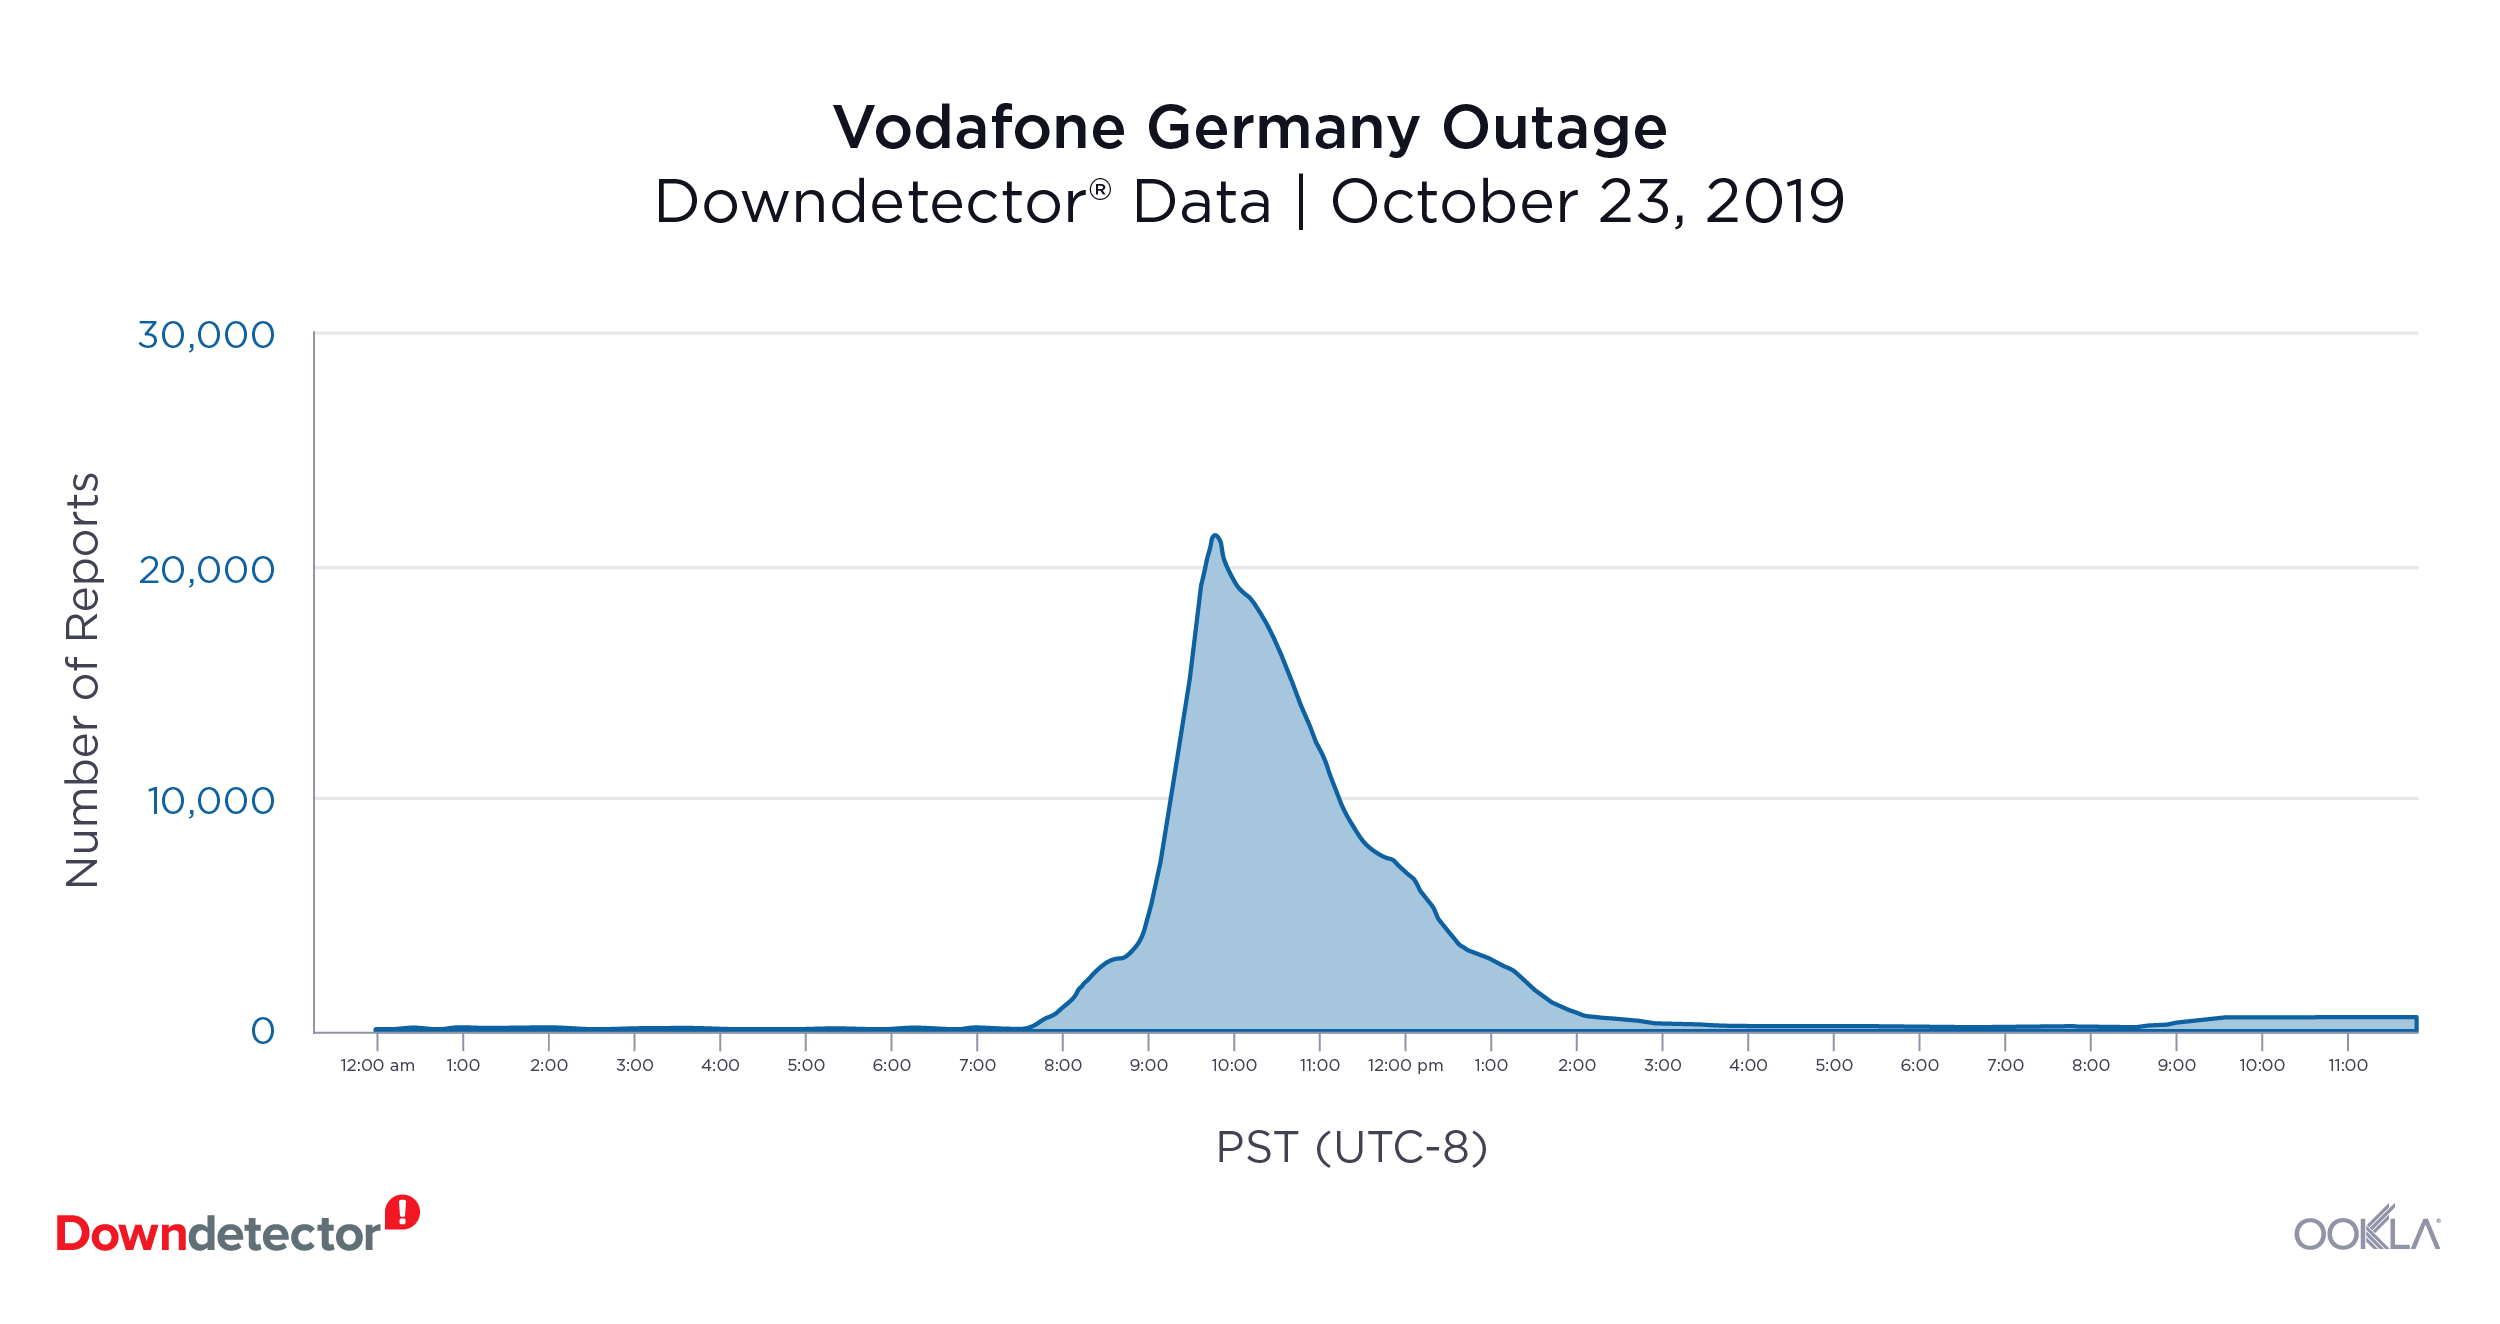
Vodafone Germany (October 23, 2019): 21,065 outage reports at peak

The multinational mobile service provider was down for about four hours for thousands of users on October 23, 2019. At the peak of the outage, 21,065 users, primarily in Germany, reported having problems with their service.

Downdetector_Outage_Vodafone-DE

Social Media Sites

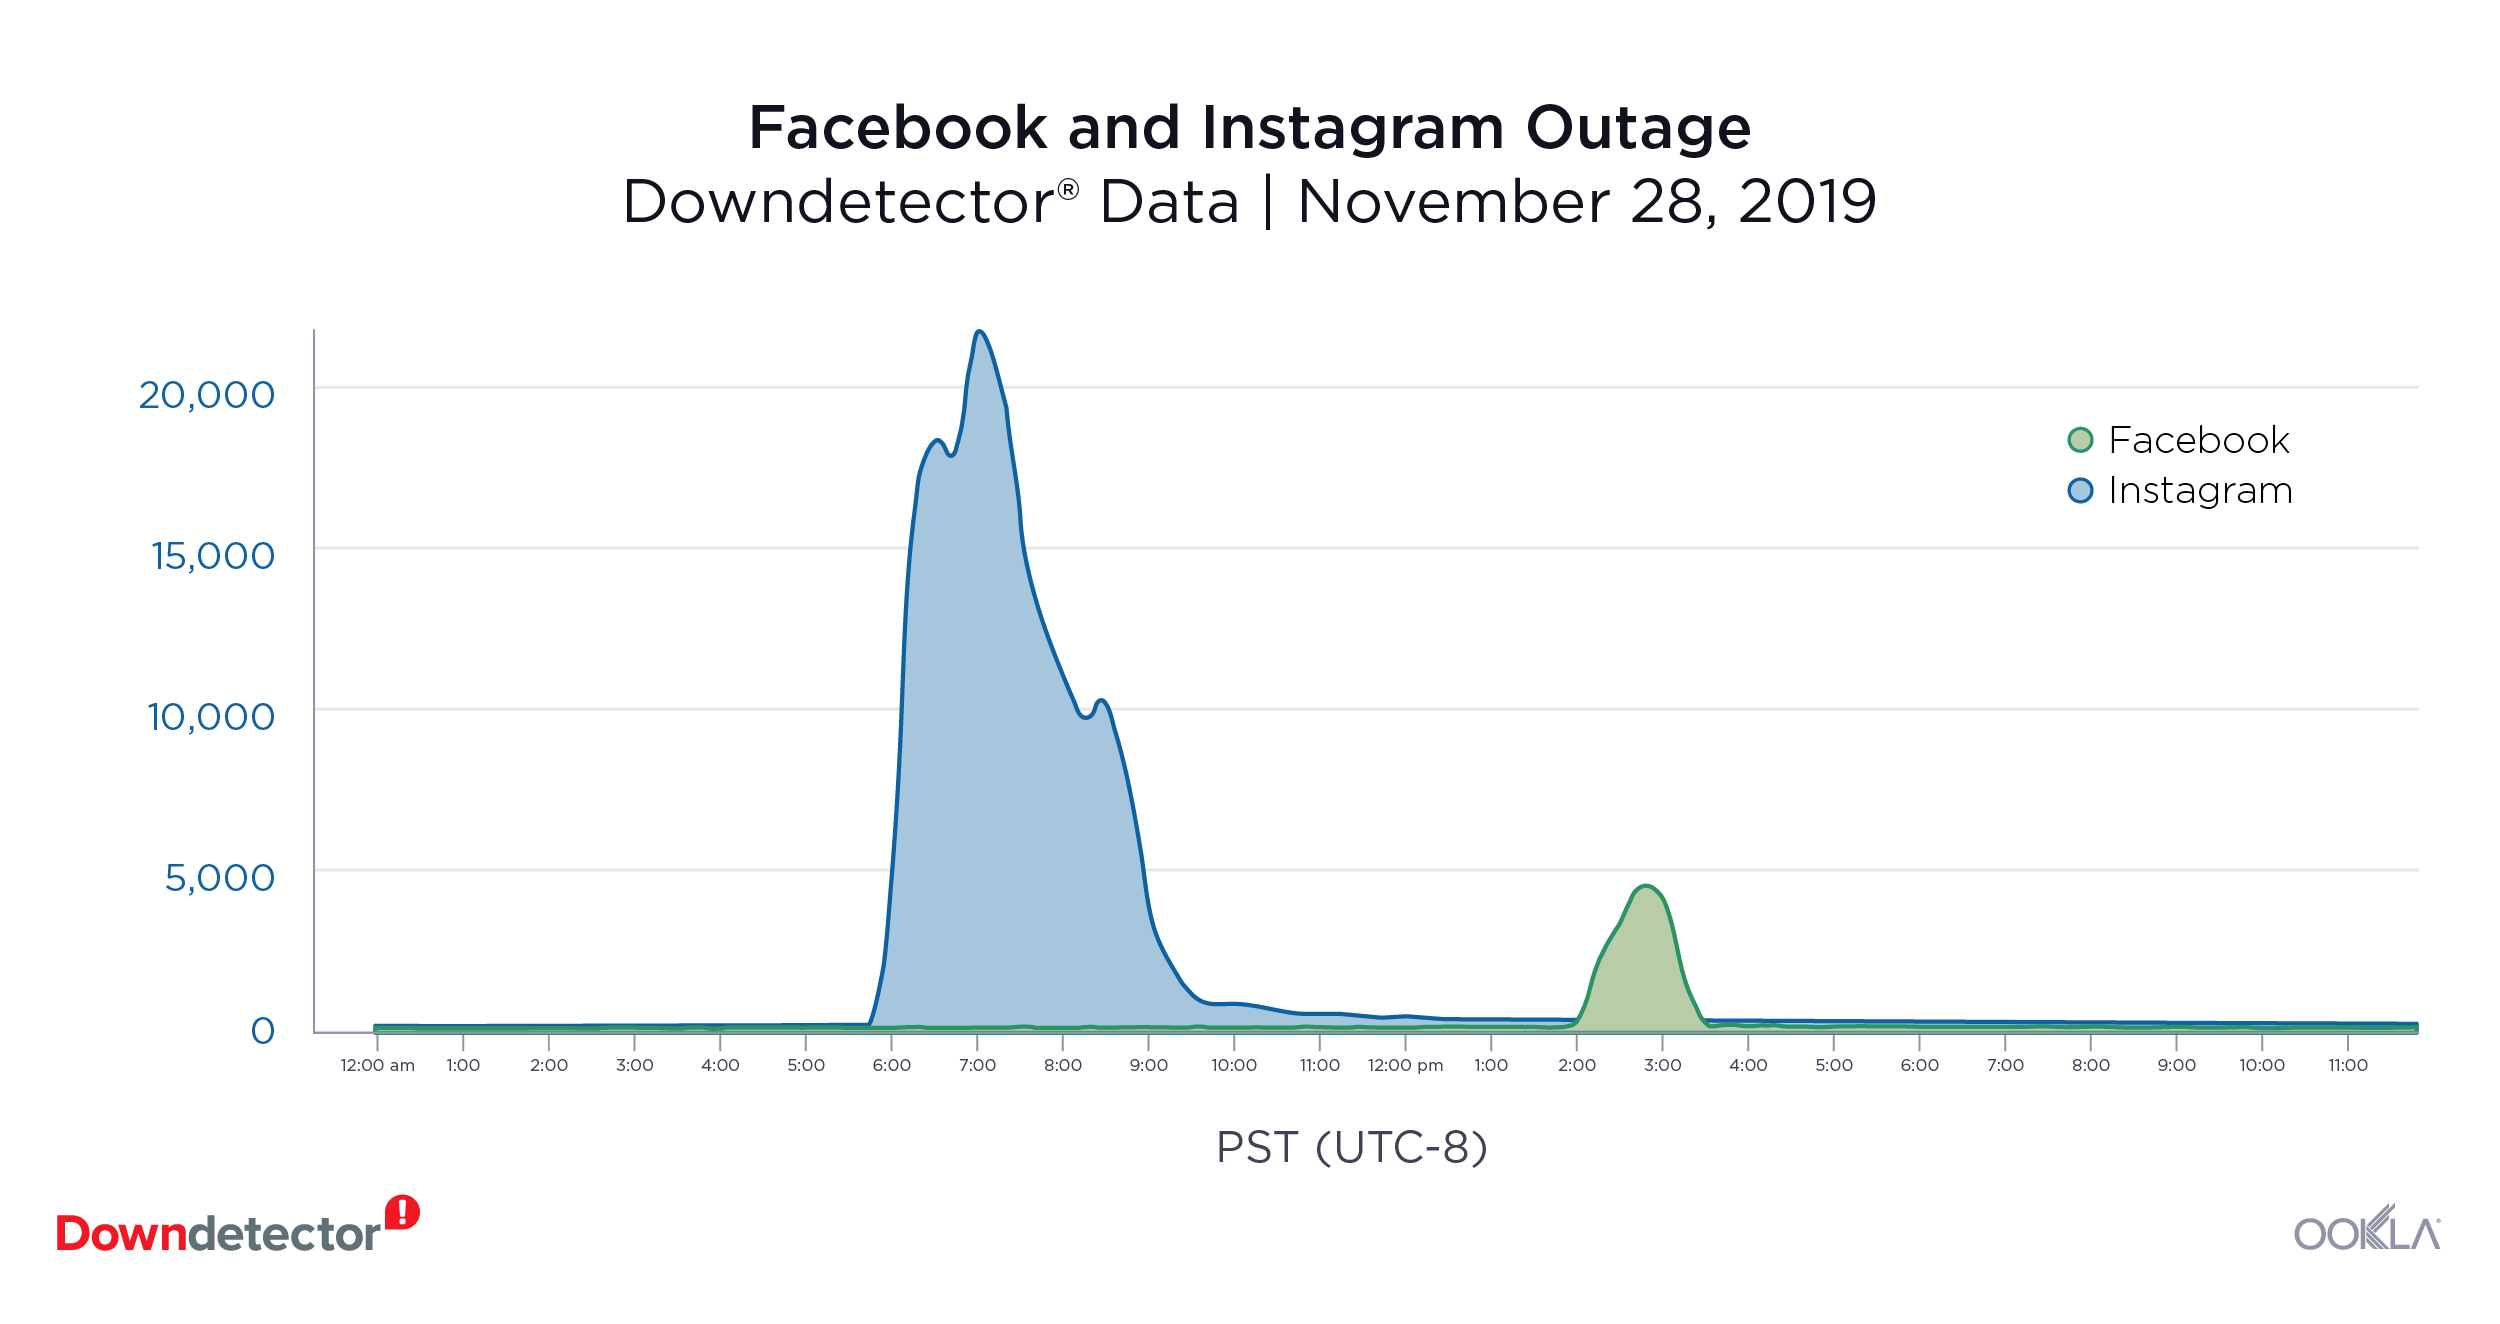
Facebook (November 28, 2019): 12,726 outage reports at peak

Instagram (November 28, 2019): 21,682 outage reports at peak

The Facebook family of social media sites outage on November 28, 2019 was one of many social outages in Q4 2019. The outage lasted about five hours and affected users in the U.S., Germany, Italy and Spain. A combined 34,408 Facebook and Instagram users reported outages at the peak of the outage. Facebook’s Messenger app experienced a smaller outage on November 18, 2019 with 8,952 users reporting outages at the peak.

Downdetector_Outage_Facebook_Instagram

Snapchat (October 14, 2019): 18,252 outage reports at peak

This popular multimedia messaging app was down for five and a half hours on October 14, 2019, leaving users unable to chat, send or receive photos from their friends. At the peak of the outage, 18,252 users from the U.S. reported problems. The outage was so significant, the hashtag #SnapchatDown was trending on Twitter at the time of the outage.

Twitter (October 22, 2019): 15,952 outage reports at peak

Where do Twitter users go to complain when Twitter is down? Our data shows Twitter users in the east coast of the U.S. rushed to Downdetector to report problems with the social media platform on October 22, 2019. Even though the outage lasted only about a half an hour, 15,952 users reported that they were unable to tweet, retweet, like tweets or access their account at the peak of the outage. Problems were also reported in parts of Europe and Latin America.

Streaming Services

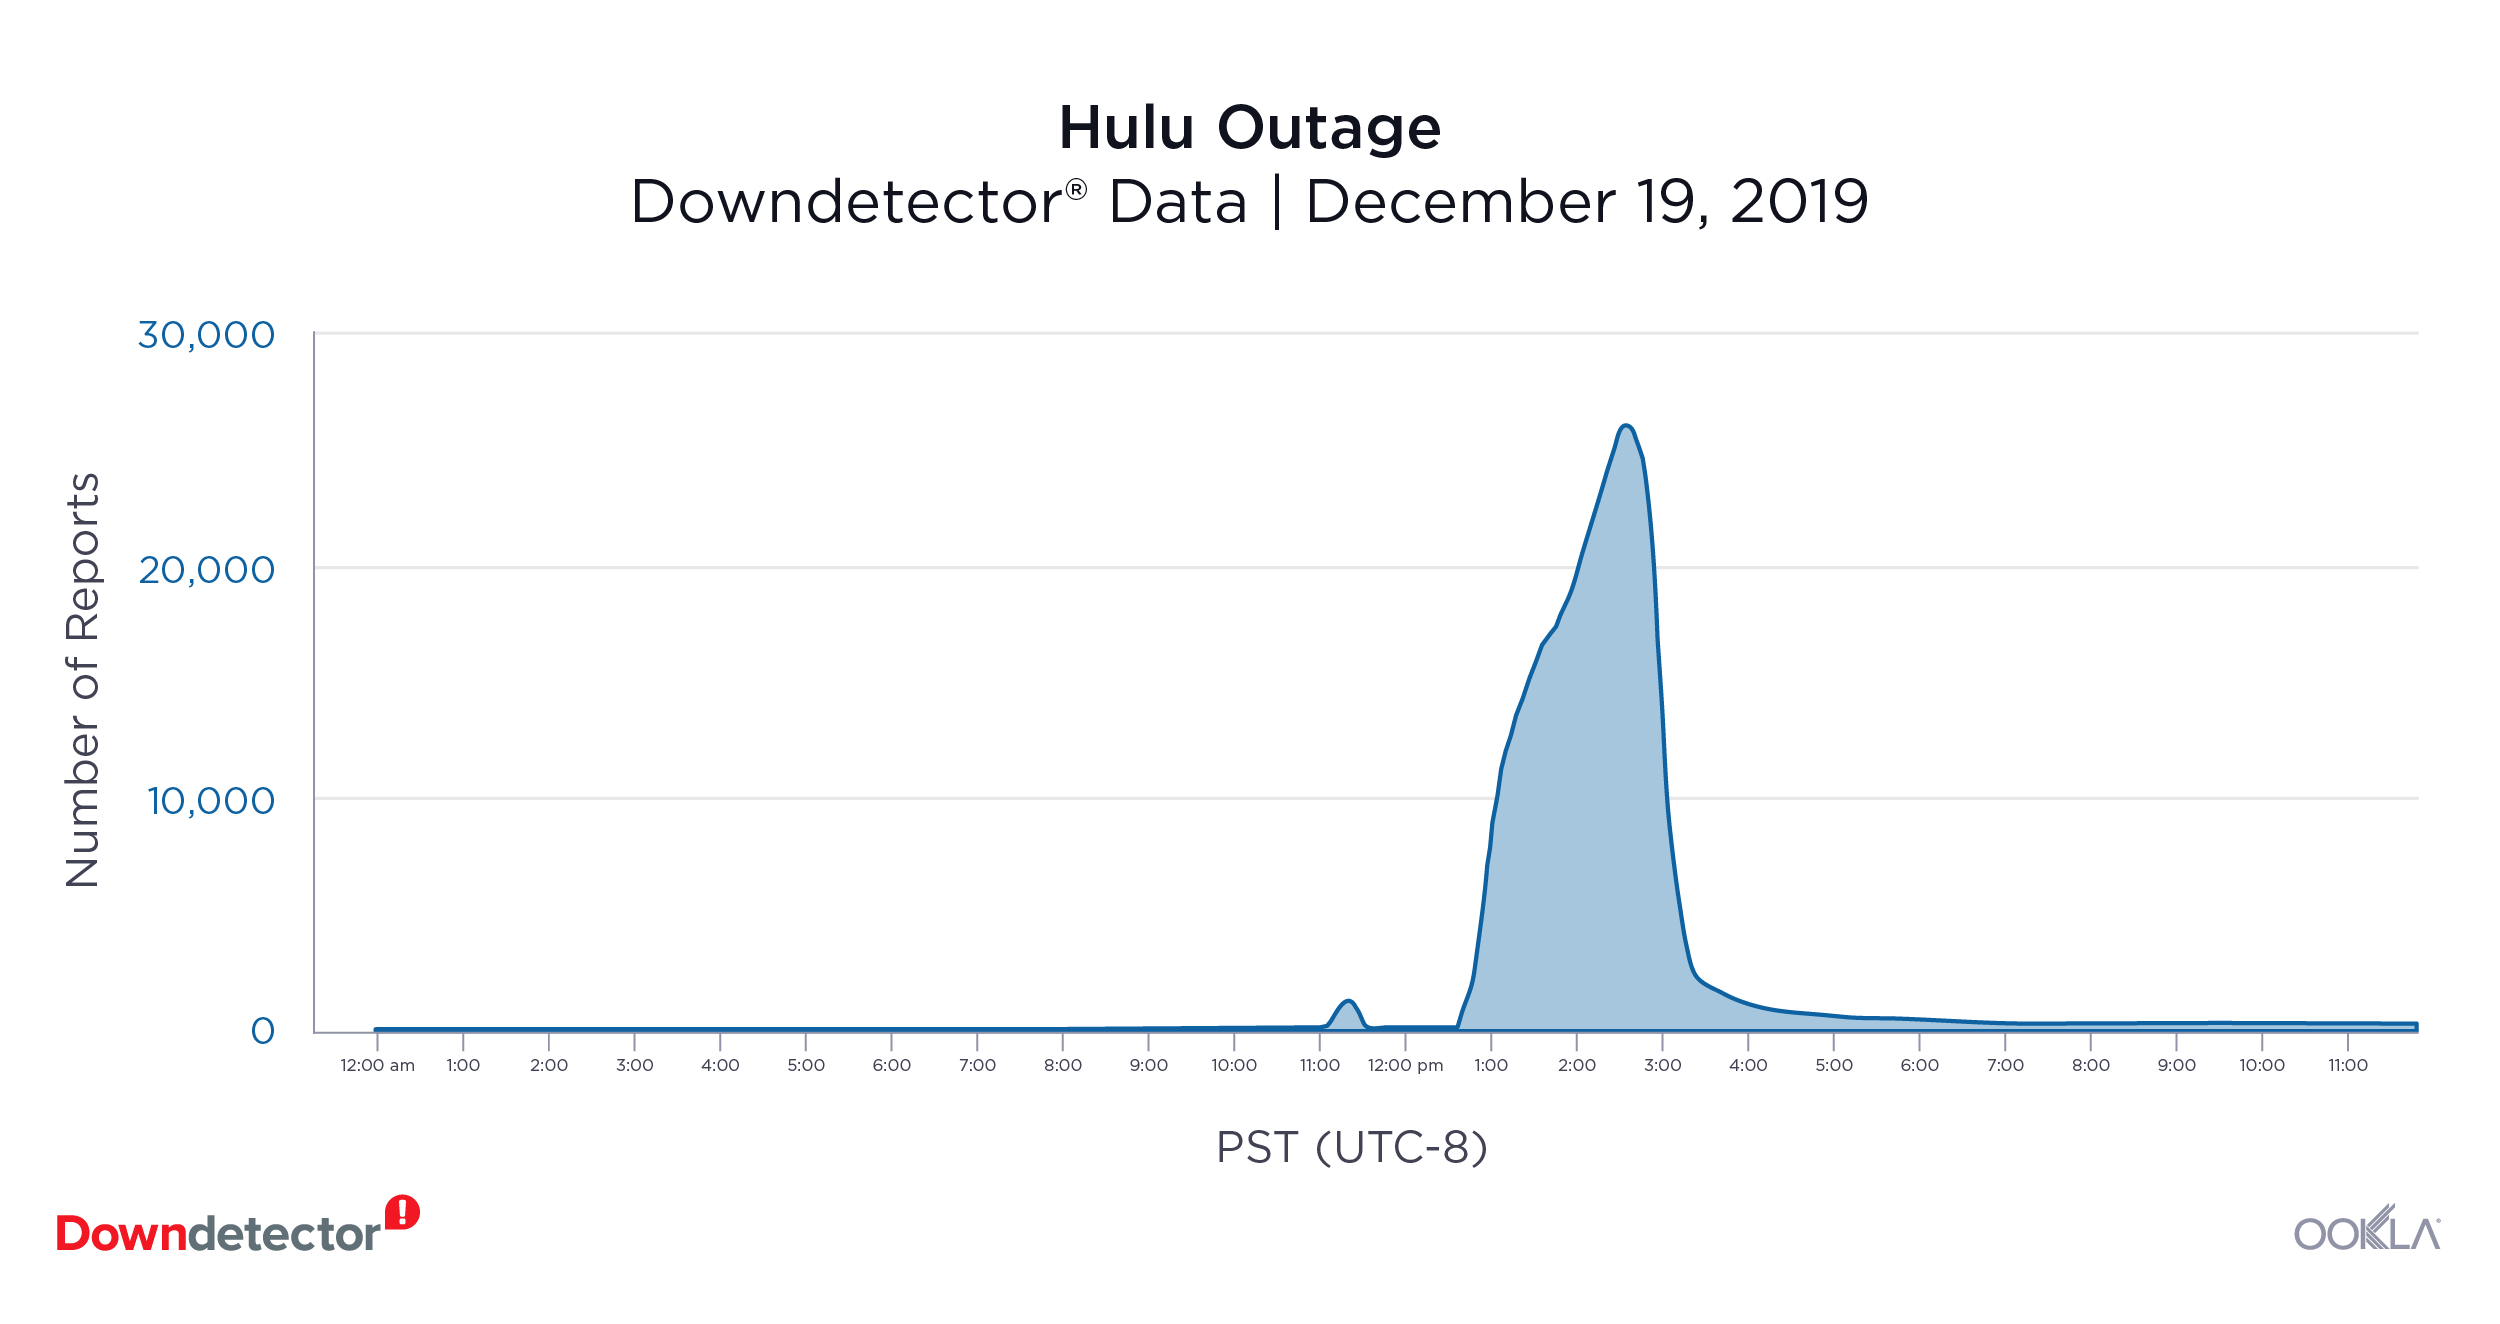
Hulu (December 19, 2019): 25,777 outage reports at peak

Hulu users reported problems with the streaming service on the morning of December 19, 2019. At the peak, 25,777 users in the United States were reporting that the streaming service was down. Seven hours after the outage began, most users had regained access to their accounts and were able to watch their favorite shows and movies. In contrast, Netflix, Hulu’s main competitor, had a small outage in Germany on November 13, 2019. At its peak, only 3,197 people were reported problems with the service.

Downdetector_Outage_Hulu

Disney+ (November 12, 2019): 8,441 outage reports at peak

After months of hyped advertising and special offers, Disney+ users were eager to begin streaming their favorite movies and shows on the new service on November 12, 2019. However, problems began early in the morning on launch day in the U.S. and continued throughout the day. At the peak of the outage, 8,441 users reported that they couldn’t access the platform through the app or stream any of the content Disney+ was offering.

Financial Institutions

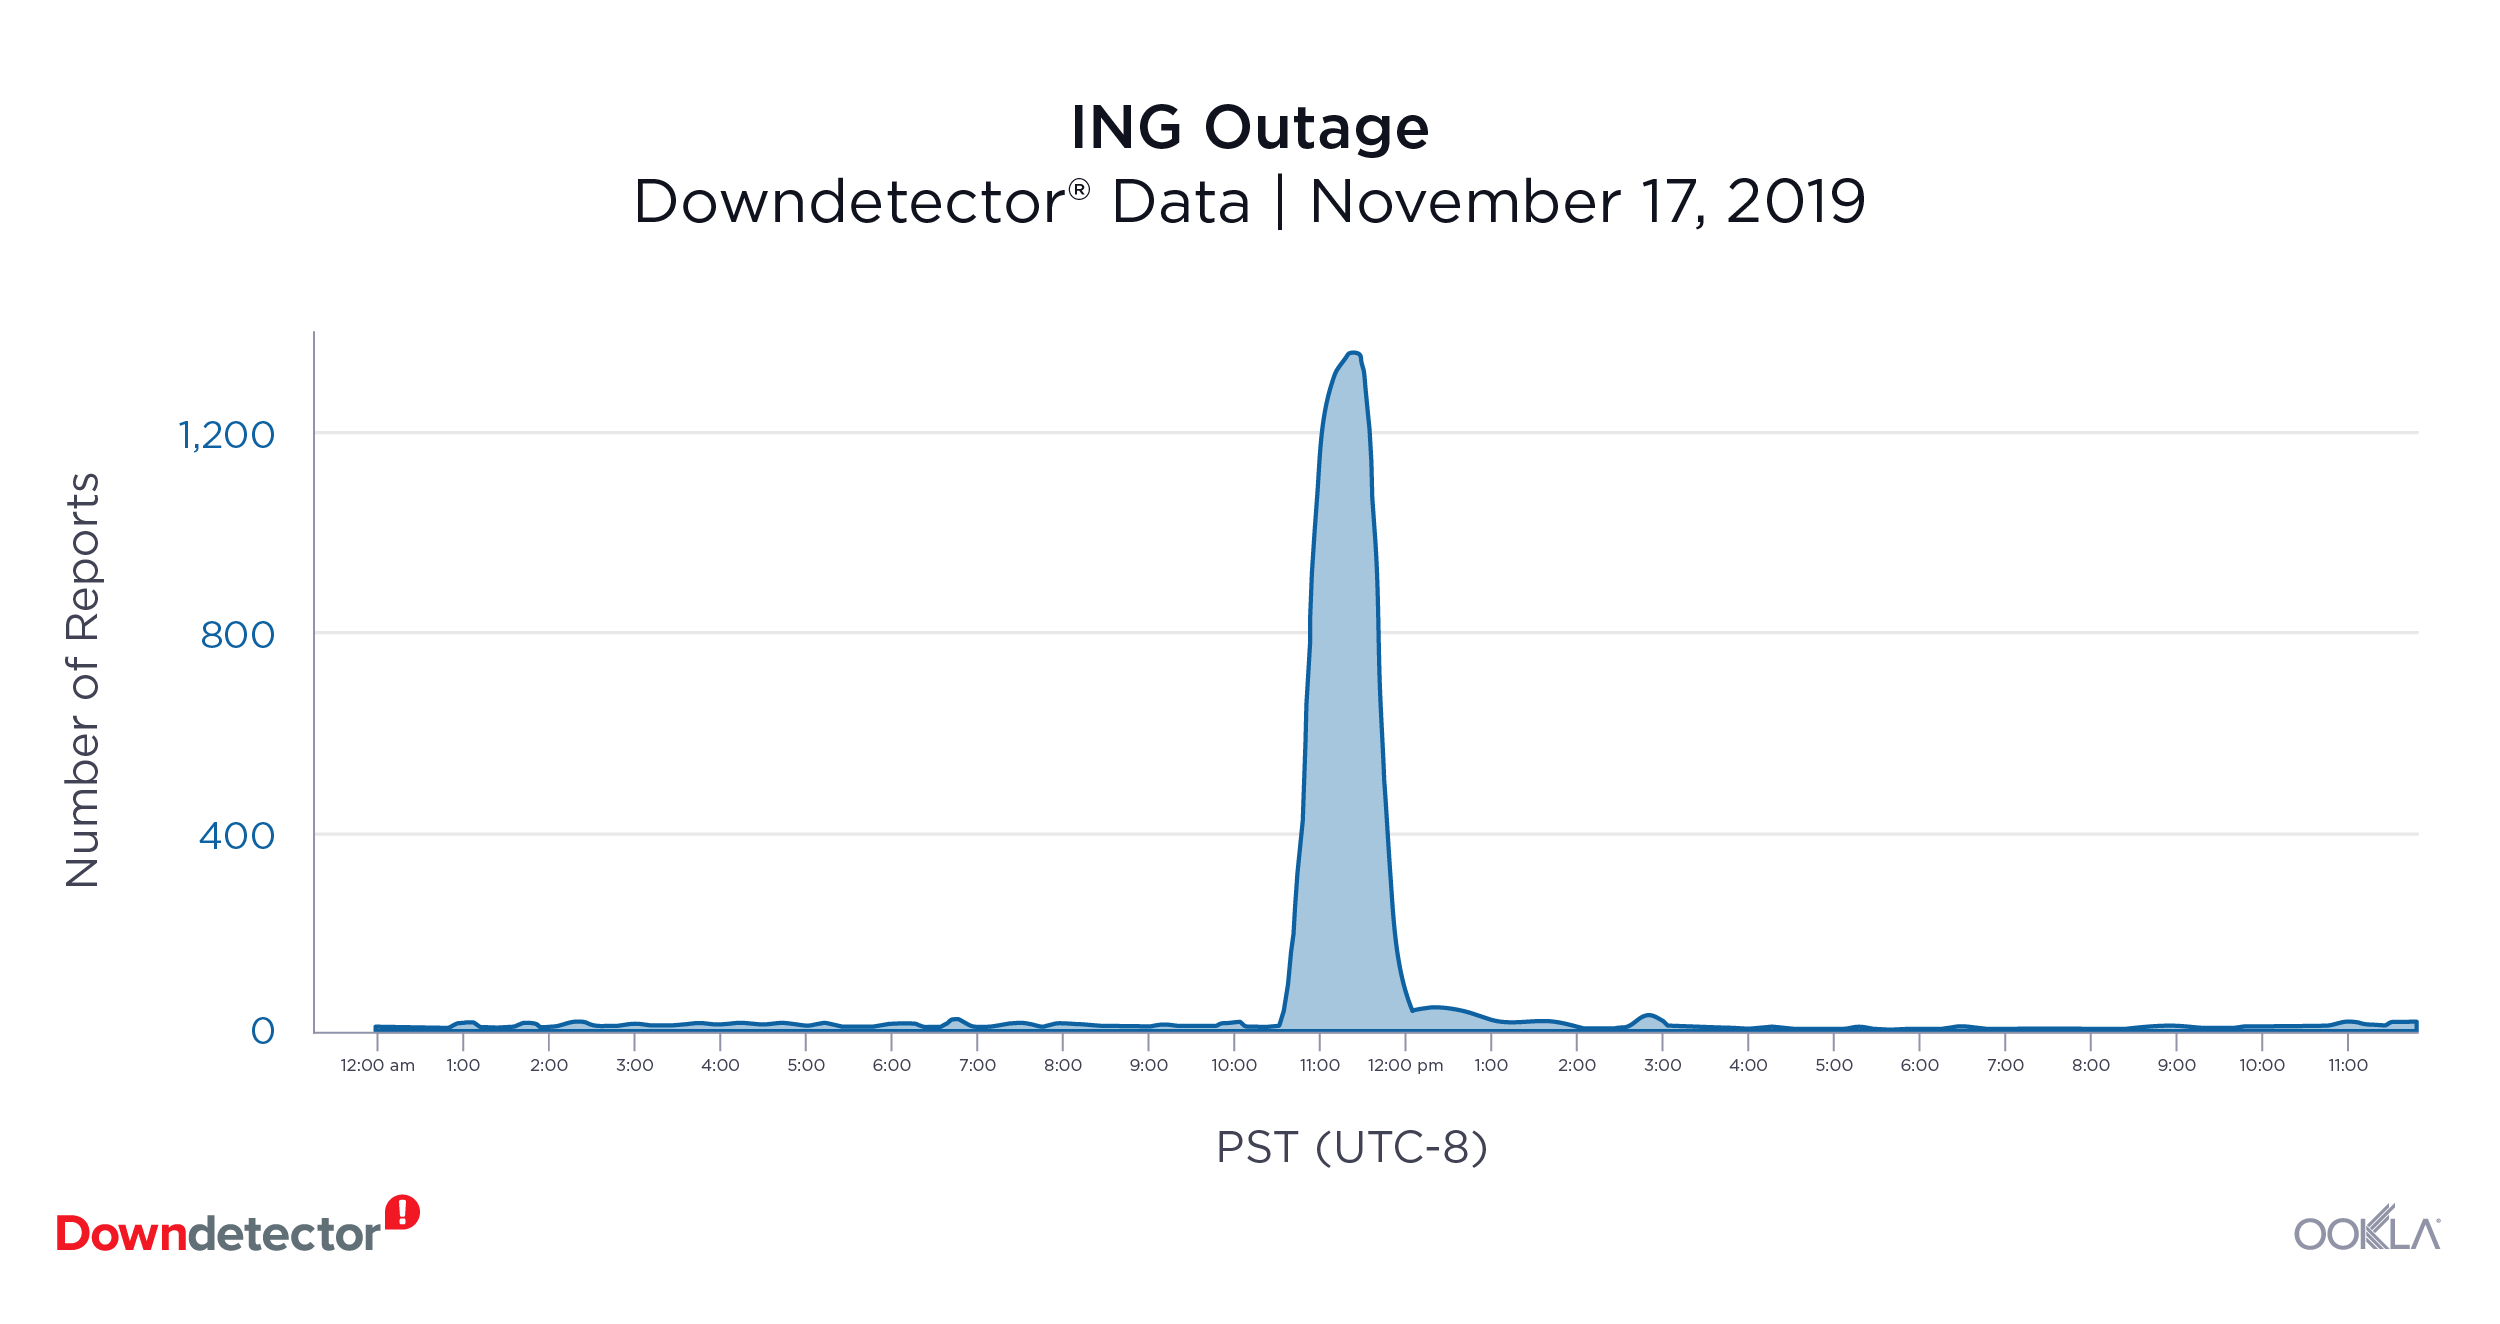
ING (November 17,2019): 1,342 outage reports at peak

Banks take the security and uptimes of their websites very seriously, so we expect to see fewer outages and for the outages that do occur to be small and short. This held true when Dutch users of banking giant ING reported problems with that website on November 17, 2019. The outage lasted about an hour and a half and there were 1,342 reports at the peak. No other countries reported problems with the bank’s mobile banking that day.

Downdetector_Outage_ING

These were the most significant outages we saw in Q4 2019 among the more than 5,500 sites that Downdetector monitors across the internet. Do outages impact your customers’ experience with your services? To learn more about how data from Downdetector can help your network operations center and customer care team detect and resolve issues faster, contact us here.

Ookla retains ownership of this article including all of the intellectual property rights, data, content graphs and analysis. This article may not be quoted, reproduced, distributed or published for any commercial purpose without prior consent. Members of the press and others using the findings in this article for non-commercial purposes are welcome to publicly share and link to report information with attribution to Ookla.

| February 12, 2020

How Roaming Affects Mobile Speeds in Europe

Last year, we conducted an expansive analysis of mobile roaming in the European Union. We’re updating our data to see which countries have the best roaming speeds and how roaming affects time spent on Wi-Fi. This analysis is based on Speedtest data from Android devices in Europe during Q3-Q4 2019. Despite Brexit, we’ve included data from the United Kingdom to keep parity year-over-year, as the roaming agreement remains in place for 2020 and this data involves travel within a specific set of countries.

Roaming in Europe typically means slower download speeds

Mobile roaming speeds are affected by the deals struck between individual mobile operators on a country-by-country basis. This means roaming speeds can depend on the plan a subscriber has selected in their home country and on what is offered in the country of destination.

Out of the 28 countries we examined, residents of 22 countries experienced slower speeds when roaming elsewhere in Europe than they do in their home countries. Travelers from the Netherlands experience the most significant loss in speed, with a roaming download speed that is 54.7% slower than at home. However, users in Slovakia barely notice a change in download speed with a roaming download speed only 2.6% slower than the mean download speed in Slovakia during this period.

Roaming vs. Local Mobile Download Speeds in Europe
Speedtest® Data | Q3-Q4 2019
Country Local Speeds (Mbps) Roaming Speed Upload (Mbps) % Change
Austria 46.30 35.93 -22.4%
Belgium 50.95 33.38 -34.5%
Bulgaria 55.32 30.95 -44.1%
Croatia 52.40 43.73 -16.6%
Cyprus 43.50 21.04 -51.6%
Czech Republic 47.00 36.37 -22.6%
Denmark 48.38 32.28 -33.3%
Estonia 42.61 43.90 3.0%
Finland 43.38 41.46 -4.4%
France 44.34 34.00 -23.3%
Germany 34.07 30.48 -10.5%
Greece 39.90 45.03 12.9%
Hungary 45.53 29.55 -35.1%
Ireland 26.73 32.05 19.9%
Italy 33.64 40.98 21.8%
Latvia 33.20 38.54 16.1%
Lithuania 46.72 39.73 -15.0%
Luxembourg 52.55 34.61 -34.1%
Malta 48.88 32.30 -33.9%
Netherlands 62.52 28.31 -54.7%
Poland 33.07 25.57 -22.7%
Portugal 34.49 36.34 5.4%
Romania 37.84 33.69 -11.0%
Slovakia 34.74 33.83 -2.6%
Slovenia 39.34 32.67 -16.9%
Spain 34.28 27.56 -19.6%
Sweden 48.52 36.55 -24.7%
United Kingdom 36.36 34.96 -3.8%

Upload speeds locally are also mostly faster than those experienced while roaming. Cyprus, Denmark, and the Netherlands all had relatively high mean upload speeds locally, but they also had the largest loss in roaming upload speeds ranging from 31.3% to 36.7% slower upload speeds on mobile roaming.

Residents of some European countries do benefit from faster speeds when roaming on mobile. Users from Estonia, Portugal, Greece, Latvia, Ireland, and Italy all experienced faster download speeds when roaming elsewhere in Europe than they did in their home countries during Q3-Q4 2019. Italian and Irish travelers gained the most when roaming with download speeds that were 21.8% and 19.9% faster than their local speeds, respectively.

A total of 12 countries had higher mean upload speeds while roaming than they experienced locally during this period. France, Latvia, and Ireland benefitted the most with an increase in upload speeds that ranged from 26.5% to 21.4% while roaming.

Latency increases dramatically while roaming in Europe

Unlike mean download and upload speeds, latency is almost always dramatically different while roaming. This is because roaming signals are routed through a user’s home network, making latency a significant issue for Europeans when traveling.

Local vs. Roaming Latency in Europe
Speedtest® Data | Q3-Q4 2019
Country Local Latency (ms) Roaming Latency (ms) % Change
Austria 26 84 220.4%
Belgium 27 83 205.7%
Bulgaria 27 127 368.3%
Croatia 33 89 166.0%
Cyprus 23 213 825.5%
Czech Republic 26 74 187.6%
Denmark 26 100 287.9%
Estonia 25 76 201.5%
Finland 27 97 254.6%
France 41 82 98.8%
Germany 38 87 128.1%
Greece 29 129 349.8%
Hungary 25 93 272.6%
Ireland 35 100 185.0%
Italy 50 91 81.2%
Latvia 26 95 268.2%
Lithuania 27 107 302.2%
Luxembourg 23 83 262.6%
Malta 19 136 611.6%
Netherlands 28 87 208.3%
Poland 35 109 209.2%
Portugal 30 109 258.8%
Romania 30 113 275.3%
Slovakia 31 76 105.5%
Slovenia 24 74 208.2%
Spain 45 107 137.4%
Sweden 29 118 304.3%
United Kingdom 38 103 173.1%

In their home country, residents of Malta (19 ms), Luxembourg (22 ms) and Cyprus (23 ms) enjoyed the lowest latencies in Europe. Residents of France, Spain and Italy experienced the highest latencies in their home countries at 41 ms, 45 ms and 50 ms, respectively.

European residents experienced an increase of at least 81.2% in their latency when visiting other countries within Europe. Residents from Cyprus, Malta and Bulgaria experience the biggest increase in latency when visiting other countries in Europe, ranging from Cyprus’ 825.5% to Bulgaria’s 368.3%. The countries that experienced the smallest increase in latency were Italy (81.2%), France (98.8%) and Germany (128.1%).

Locals spend more time on Wi-Fi than visitors in Europe

While there are no roaming changes within the E.U., users often opt to connect to Wi-Fi to avoid additional data overages at home and abroad. The following table compares the percentage of time spent on Wi-Fi by a resident of a country with that of a visitor to the same country during Q3-Q4 2019.

Percentage of Time Spent on Wi-Fi in Europe
Speedtest® Data | Q3-Q4 2019
Country Local Customers Visitors % Change
Austria 75.5% 40.5% -46.3%
Belgium 77.9% 35.8% -54.1%
Bulgaria 74.0% 60.3% -18.5%
Croatia 74.3% 53.8% -27.5%
Cyprus 79.3% 70.2% -11.5%
Czech Republic 80.1% 46.6% -41.8%
Denmark 78.7% 60.3% -23.4%
Estonia 70.3% 51.9% -26.2%
Finland 63.0% 60.3% -4.4%
France 69.3% 48.7% -29.7%
Germany 80.0% 47.1% -41.1%
Greece 79.3% 64.3% -19.0%
Hungary 76.8% 47.8% -37.8%
Ireland 75.6% 58.9% -22.0%
Italy 70.9% 55.1% -22.2%
Latvia 68.8% 49.2% -28.4%
Lithuania 73.8% 52.2% -29.2%
Luxembourg 72.4% 30.8% -57.4%
Malta 79.4% 65.9% -17.1%
Netherlands 81.8% 49.1% -40.1%
Poland 70.2% 58.2% -17.1%
Portugal 76.5% 61.9% -19.0%
Romania 69.6% 64.1% -7.9%
Slovakia 76.2% 40.1% -47.4%
Slovenia 70.7% 24.7% -65.2%
Spain 78.3% 62.8% -19.7%
Sweden 81.8% 53.8% -34.3%
United Kingdom 79.3% 60.9% -23.1%

As we saw last year, Finnish residents spent the least amount of time on Wi-Fi at 63.0%. Latvia showed the second lowest time spent on Wi-Fi (68.8%), followed by France (69.3%). Residents from the Netherlands, Sweden and the Czech Republic spent the most time on Wi-Fi at 81.8%, 81.8%, and 80.1%, respectively.

Visitors to Cyprus, Malta and Greece spent the most amount of time on Wi-Fi during this period. Time spent on Wi-Fi by visitors ranged from 64.3% in Greece to 70.2% in Cyprus. Visitors to Slovenia, Luxembourg and Belgium as a destination country spent the least amount of time on Wi-Fi at 25.7%, 30.8% and 35.8%, respectively.

Are you interested in more data on roaming performance? Read more here!

Ookla retains ownership of this article including all of the intellectual property rights, data, content graphs and analysis. This article may not be quoted, reproduced, distributed or published for any commercial purpose without prior consent. Members of the press and others using the findings in this article for non-commercial purposes are welcome to publicly share and link to report information with attribution to Ookla.

| March 2, 2020

Mobile and Fixed Broadband Speeds and 4G Availability in Spain

Versión en español

We investigated Spain’s fixed broadband and mobile network performance, 4G Availability, how Spain’s speeds and coverage compare with neighboring European countries and the performance and 4G Availability of top providers in Spain’s ten largest cities during Q3-Q4 2019. In addition to ranking Spain’s providers by top speeds and coverage, we also analyzed the effects of mobile plans with speed caps on Speedtest® results and ranked the providers on consistency of their network performance.

Spain and France were the fastest on our list for fixed broadband

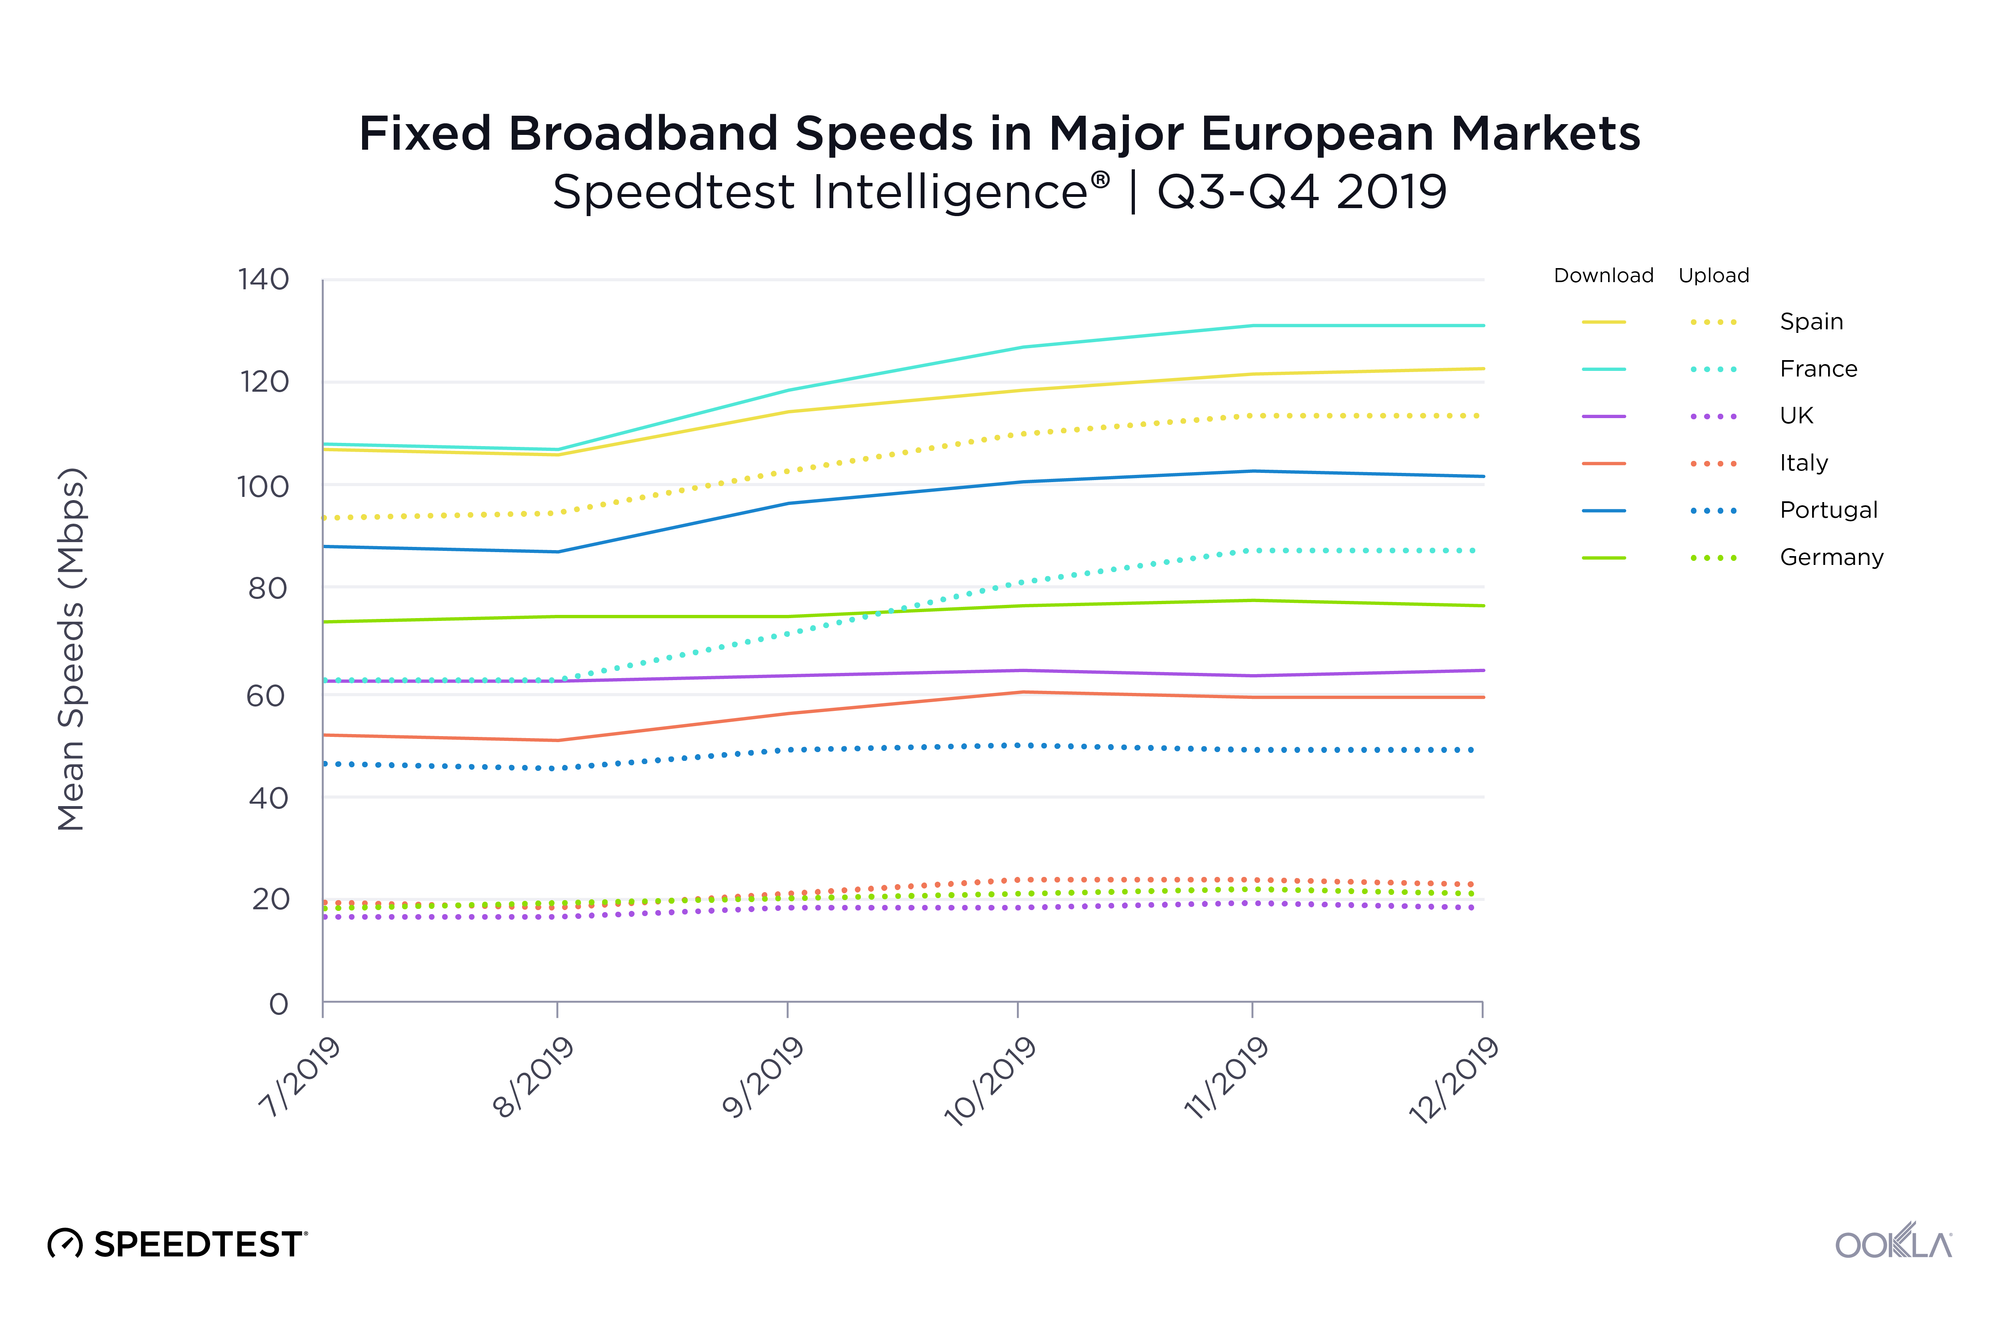
We compared Spain’s fixed broadband performance at the country level to several other western European countries during Q3-Q4 2019. Spain was well positioned for mean download speed on fixed broadband at 113.72 Mbps, second only to France’s 119.37 Mbps. Spain had the fastest mean upload speed on this list at 103.72 Mbps. Italy had the slowest mean download speed on this list at 56.72 Mbps while the United Kingdom had the slowest mean upload speed at 18.28 Mbps.
fixed-broadband-speeds-eng-1

France showed the highest increase in mean download speed during Q3-Q4 2019 at 21.5%, followed by Portugal and Italy at 15.4% and Spain at 14.5%. Speeds remained relatively flat for this period for Italy, the U.K. and Germany.

An examination of latency over fixed broadband during Q3-Q4 2019 revealed a very different performance order. Portugal had the lowest latency during this period at 16 ms. Germany and the U.K. were tied for second at 23 ms. Spain was third (25 ms), Italy fourth (30 ms) and France fifth (32 ms).
Spain ranks fourth for mobile download speed

mobile-speeds-eng-1

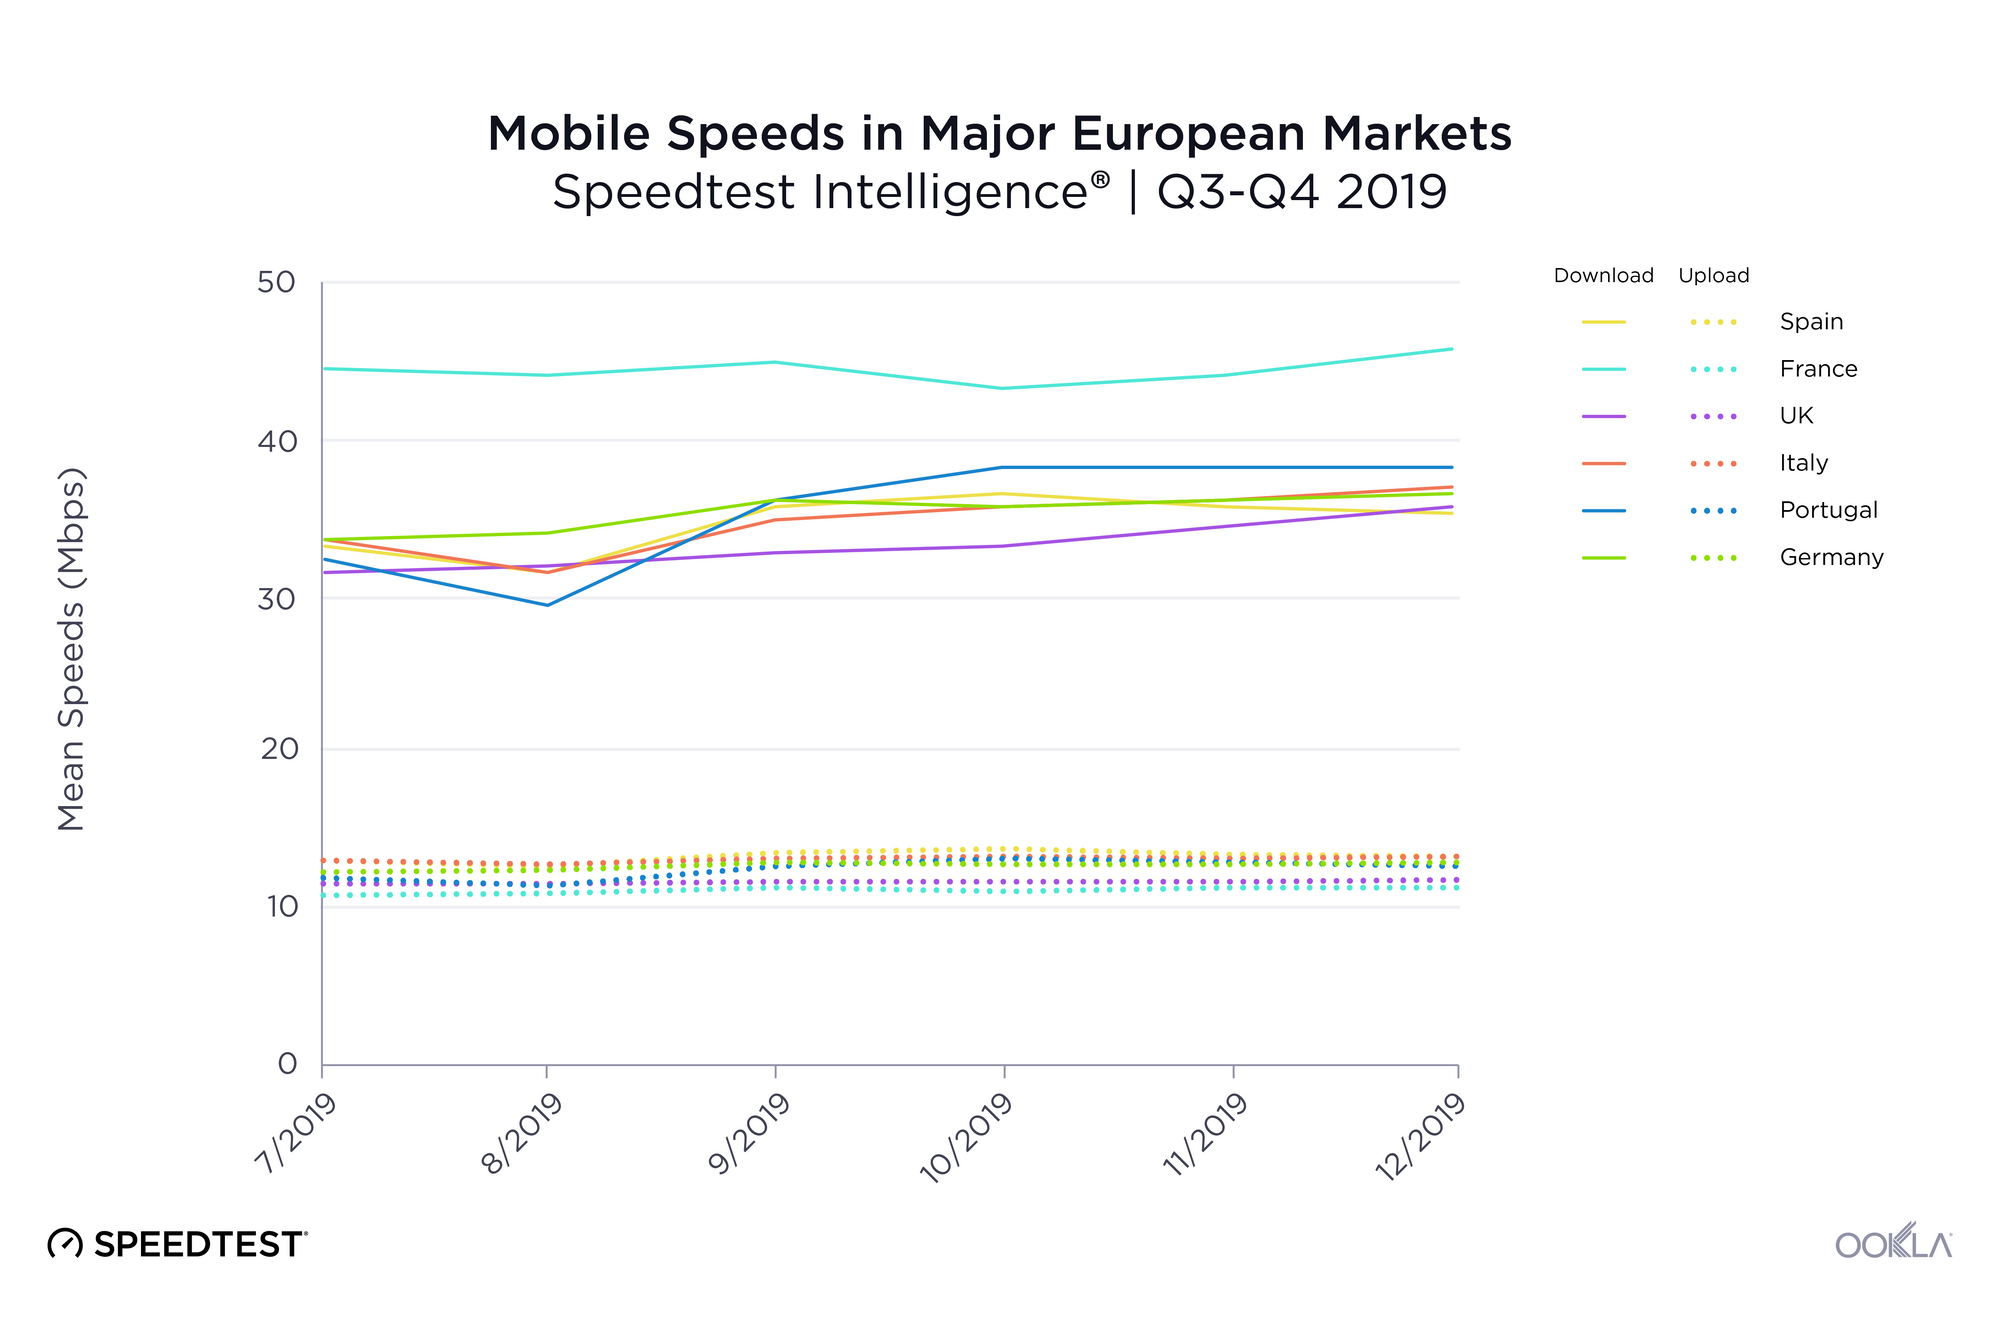
Spain did not rank as well for mean download speed over mobile as they did on fixed broadband, coming in fourth with 33.97 Mbps during Q3-Q4 2019. This was 22.8% slower than first-place France. However, Spain showed the fastest mean upload speeds on mobile at 13.12 Mbps during Q3-Q4 2019.

Portugal saw the largest increase in mobile download speed during Q3-Q4 2019 at 18.4%. Spain’s mean download speed over mobile increased only 6.7% during this period. France showed the smallest increase in mobile download speed at 2.8%.

As we saw on fixed broadband, Portugal had the lowest mobile latency at 32 ms. Germany was second at 41 ms, France third at 43 ms, the U.K. fourth at 44 ms, Spain fifth at 47 ms and Italy last at 52 ms.

United Kingdom and Spain lead in 4G Availability

We used data from Speedtest coverage scans on Android to compare 4G Availability in each market during Q3-Q4 2019. While the U.K. showed the highest 4G Availability at 88.8%, Spain tied for a very close second, with 4G available in 87.7% of tested locations. Germany had the lowest 4G Availability at 72.1% during this period.

4G Availability in Major European Markets
Speedtest Intelligence® | Q3-Q4 2019
Country 4G Availability
United Kingdom 88.8%
Spain 87.7%
France 87.7%
Italy 86.7%
Portugal 85.0%
Germany 72.1%

Looking specifically at Spain’s top mobile providers, Orange had the highest 4G Availability at 88.1%. Movistar was second, Yoigo third, and Vodafone fourth.

4G Availability by Provider in Spain
Speedtest Intelligence® | Q3-Q4 2019
Provider 4G Availability
Orange 88.1%
Movistar 87.7%
Yoigo 87.4%
Vodafone 86.1%

Spain’s 5G deployments are expanding

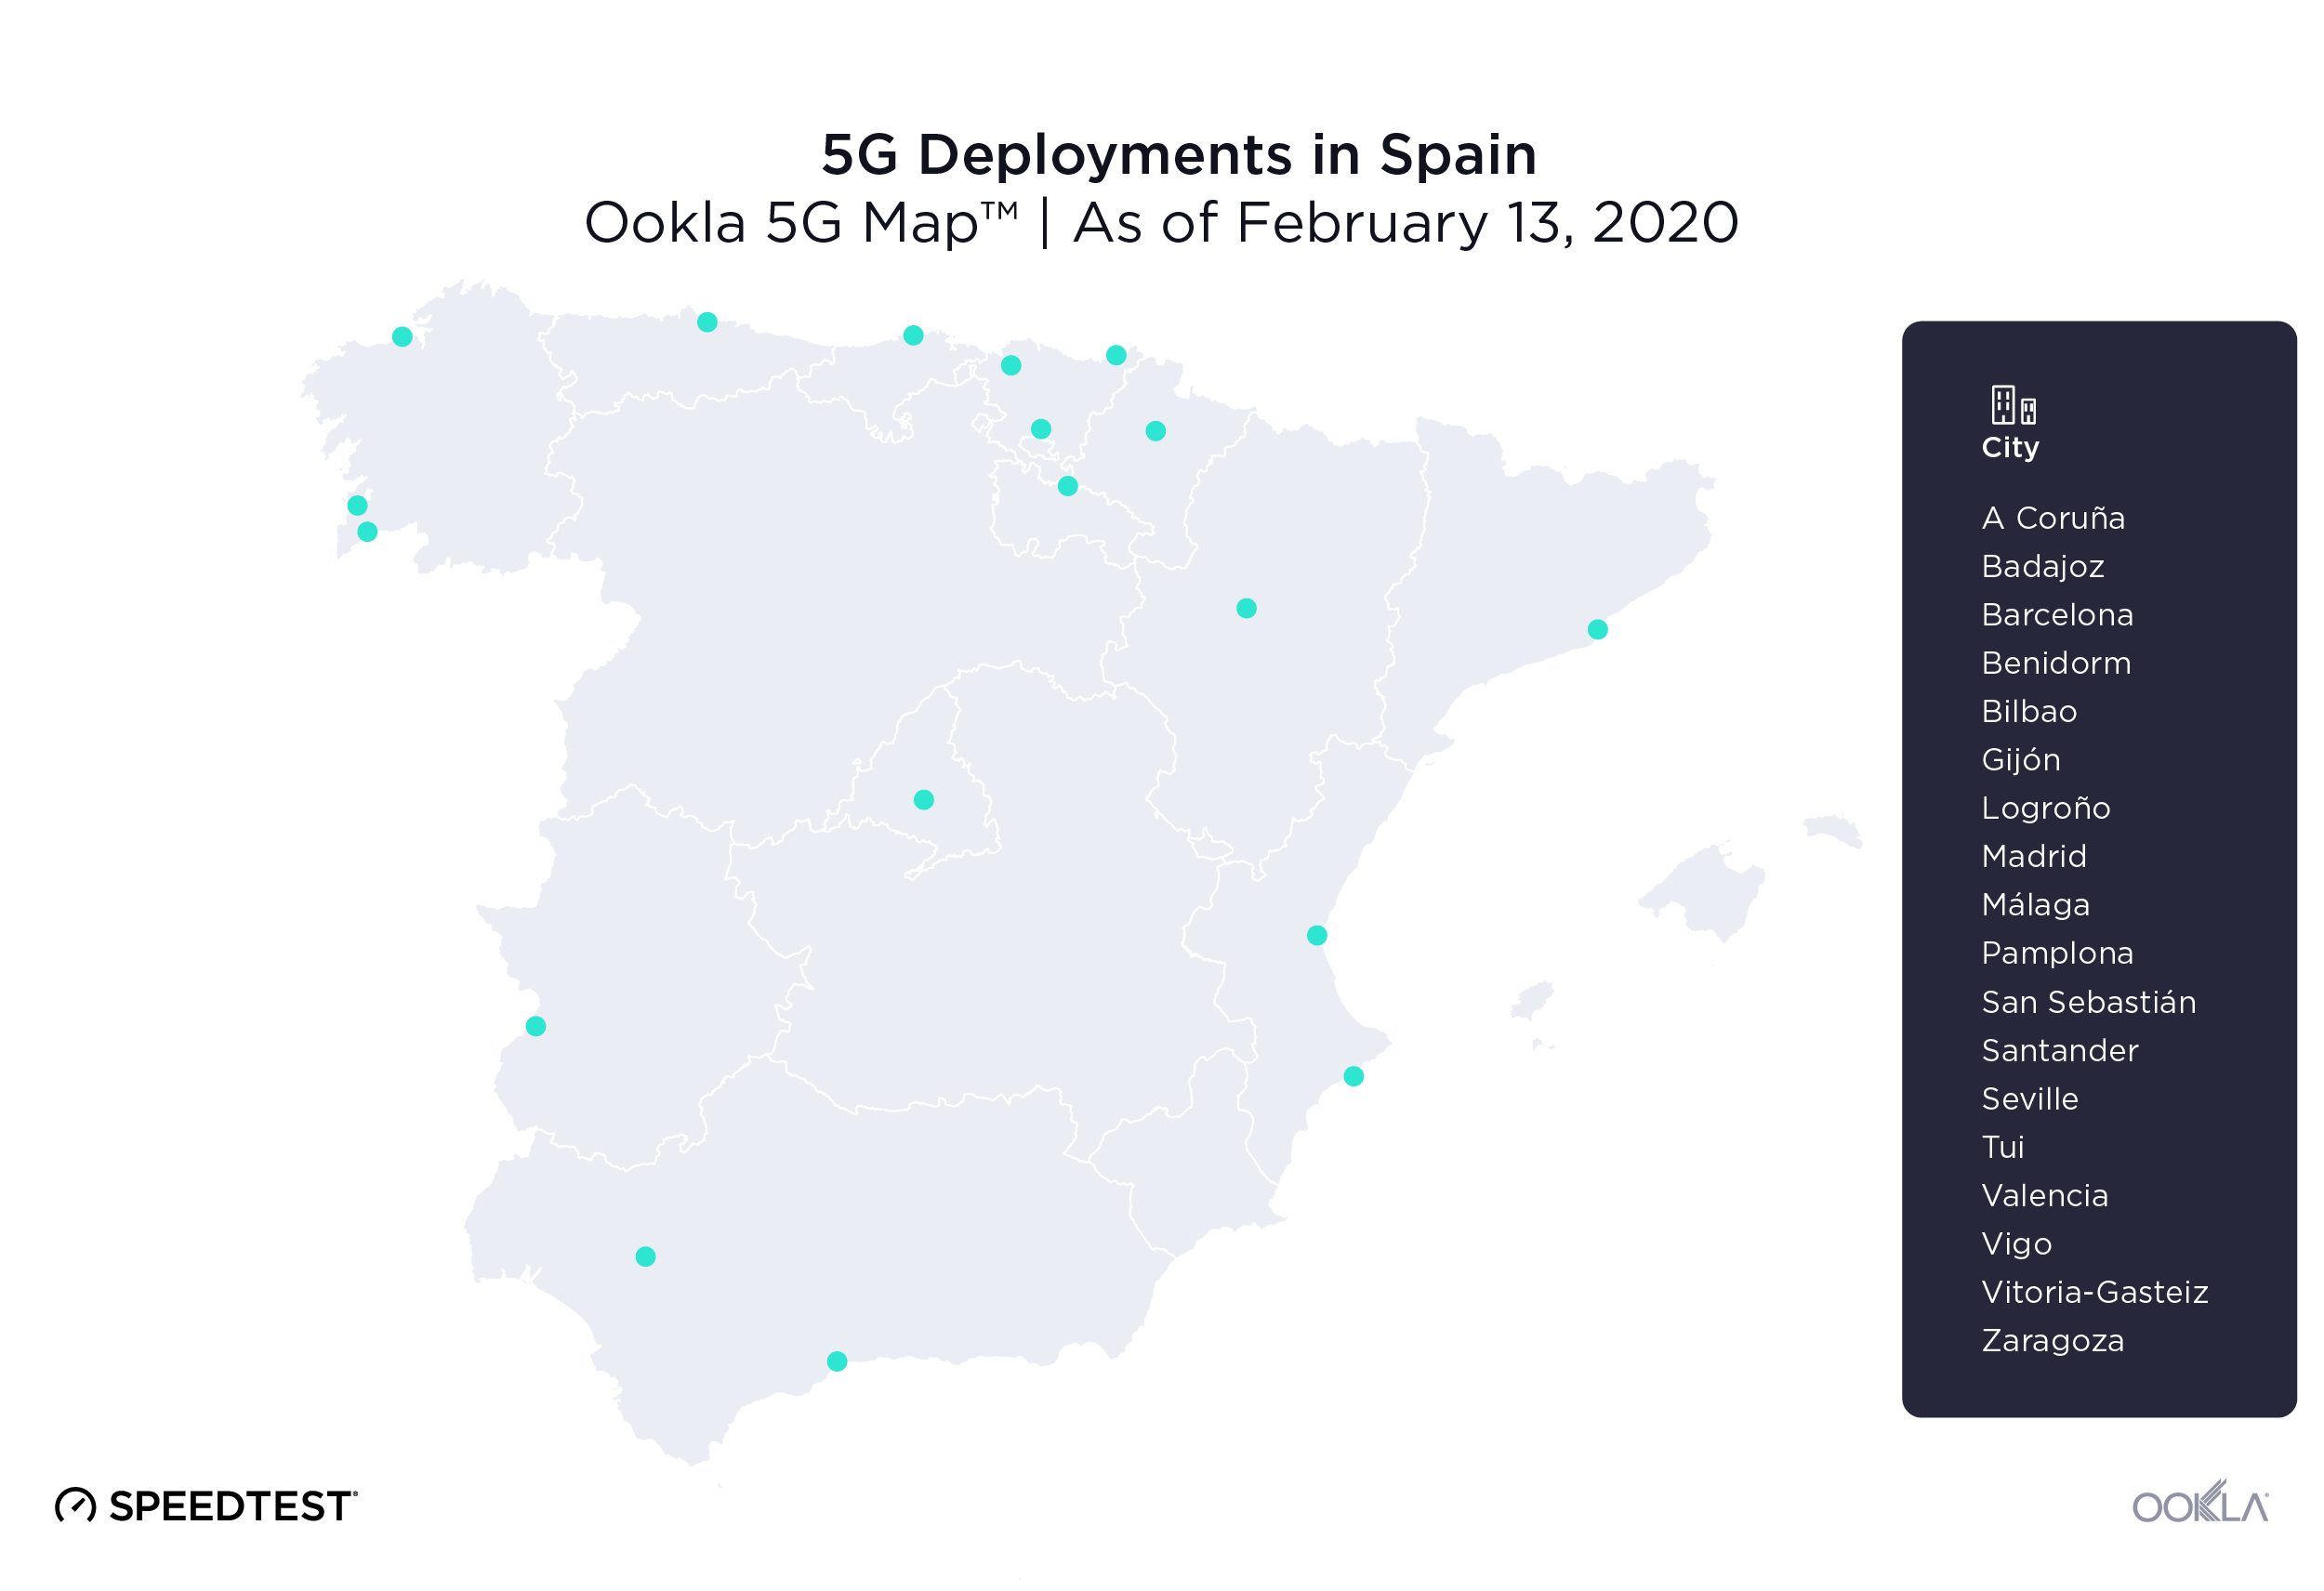
5G-Deployments-in-Spain-0220-1
The excitement for 5G is evident in Spain. Vodafone had commercially available 5G deployments in a total of 18 Spanish cities as of February 13, 2020, including Barcelona, Madrid, Valencia, Málaga and Bilbao. Speedtest data reveals the mean download speed on 5G for Spain in Q3-Q4 2019 was 350.68 Mbps — an order of magnitude faster than the national average for mobile download speed — and the mean upload speed over 5G was 31.82 Mbps. Mean latency over 5G in Spain was 27 ms during Q3-Q4 2019.

MÁSMÓVIL was Spain’s fastest fixed broadband provider

Using Speed Score, a metric that combines measures of download and upload speed, to compare top ISPs in Spain during Q3-Q4 2019, we found that MÁSMÓVIL led with a score of 133.75 on fixed broadband. Orange was in second place with 115.25, followed by Vodafone (105.07) and Movistar (103.01).

Fixed Broadband Performance by Provider in Spain
Speedtest Intelligence® | Q3-Q4 2019
Provider Speed ScoreTM
MÁSMÓVIL 133.75
Orange 115.25
Vodafone 105.07
Movistar 103.01

Movistar was Spain’s fastest mobile operator

Movistar had the highest Speed Score among Spain’s mobile operators during Q3-Q4 2019 at 37.76. Orange was second at 33.02, Vodafone third at 26.34 and Yoigo fourth at 22.43. As we will discuss below, overall speed performance can be impacted by the speed caps and tariff plans that are in place in Spain.

Mobile Performance by Operator in Spain
Speedtest Intelligence® | Q3-Q4 2019
Provider Speed ScoreTM
Movistar 37.76
Orange 33.02
Vodafone 26.34
Yoigo 22.43

Speed capping affects overall performance

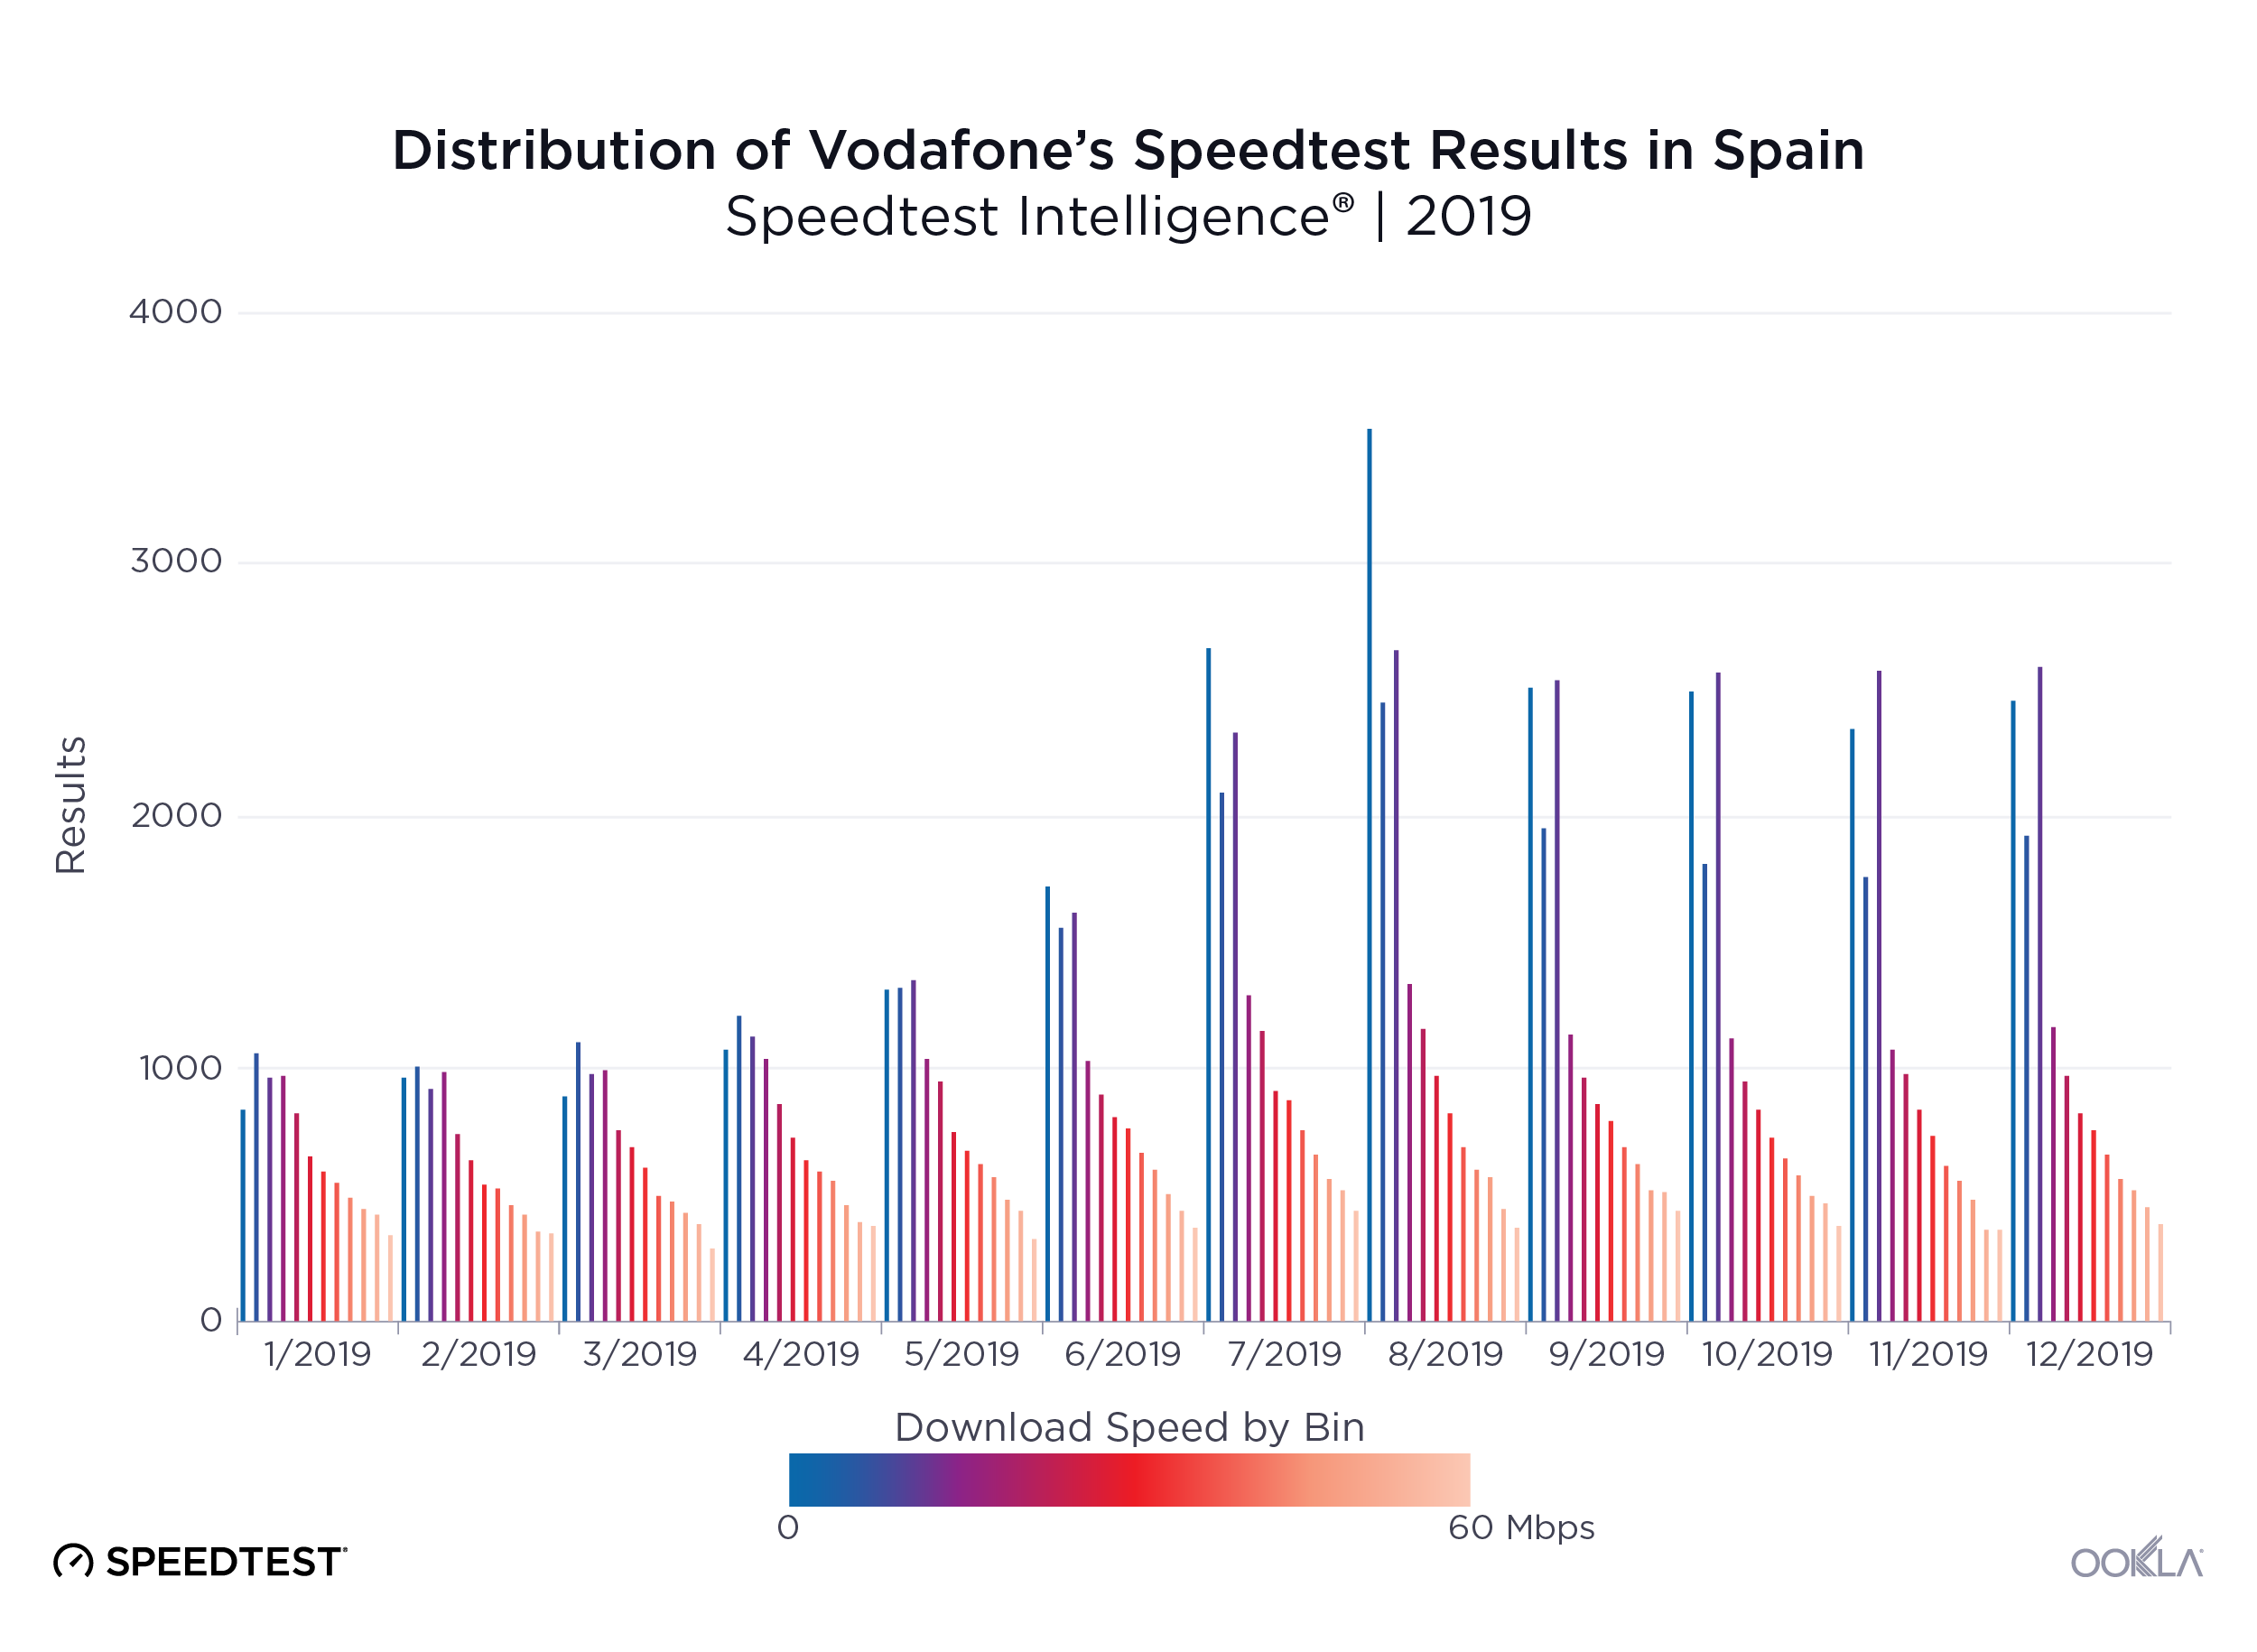
Speed capping, a limit of service imposed onto an internet connection by an operator, allows operators to also offer plans that focus on affordability rather than maximum performance.
Ookla_Distribution-Speedtest-Results_Vodafone_Spain_0220-3_en
The chart above shows how Vodafone’s introduction of subscription plans that use speed capping affected the distribution of download speeds. While those plans (with caps at 2 Mbps and 10 Mbps, respectively) were available starting in April, we don’t see the true effect on average speeds until May and June when the 0-5 Mbps and 10-15 Mbps buckets start to spike. We’ve only showed bins up to 60 Mbps to make this and the following graphs more legible.

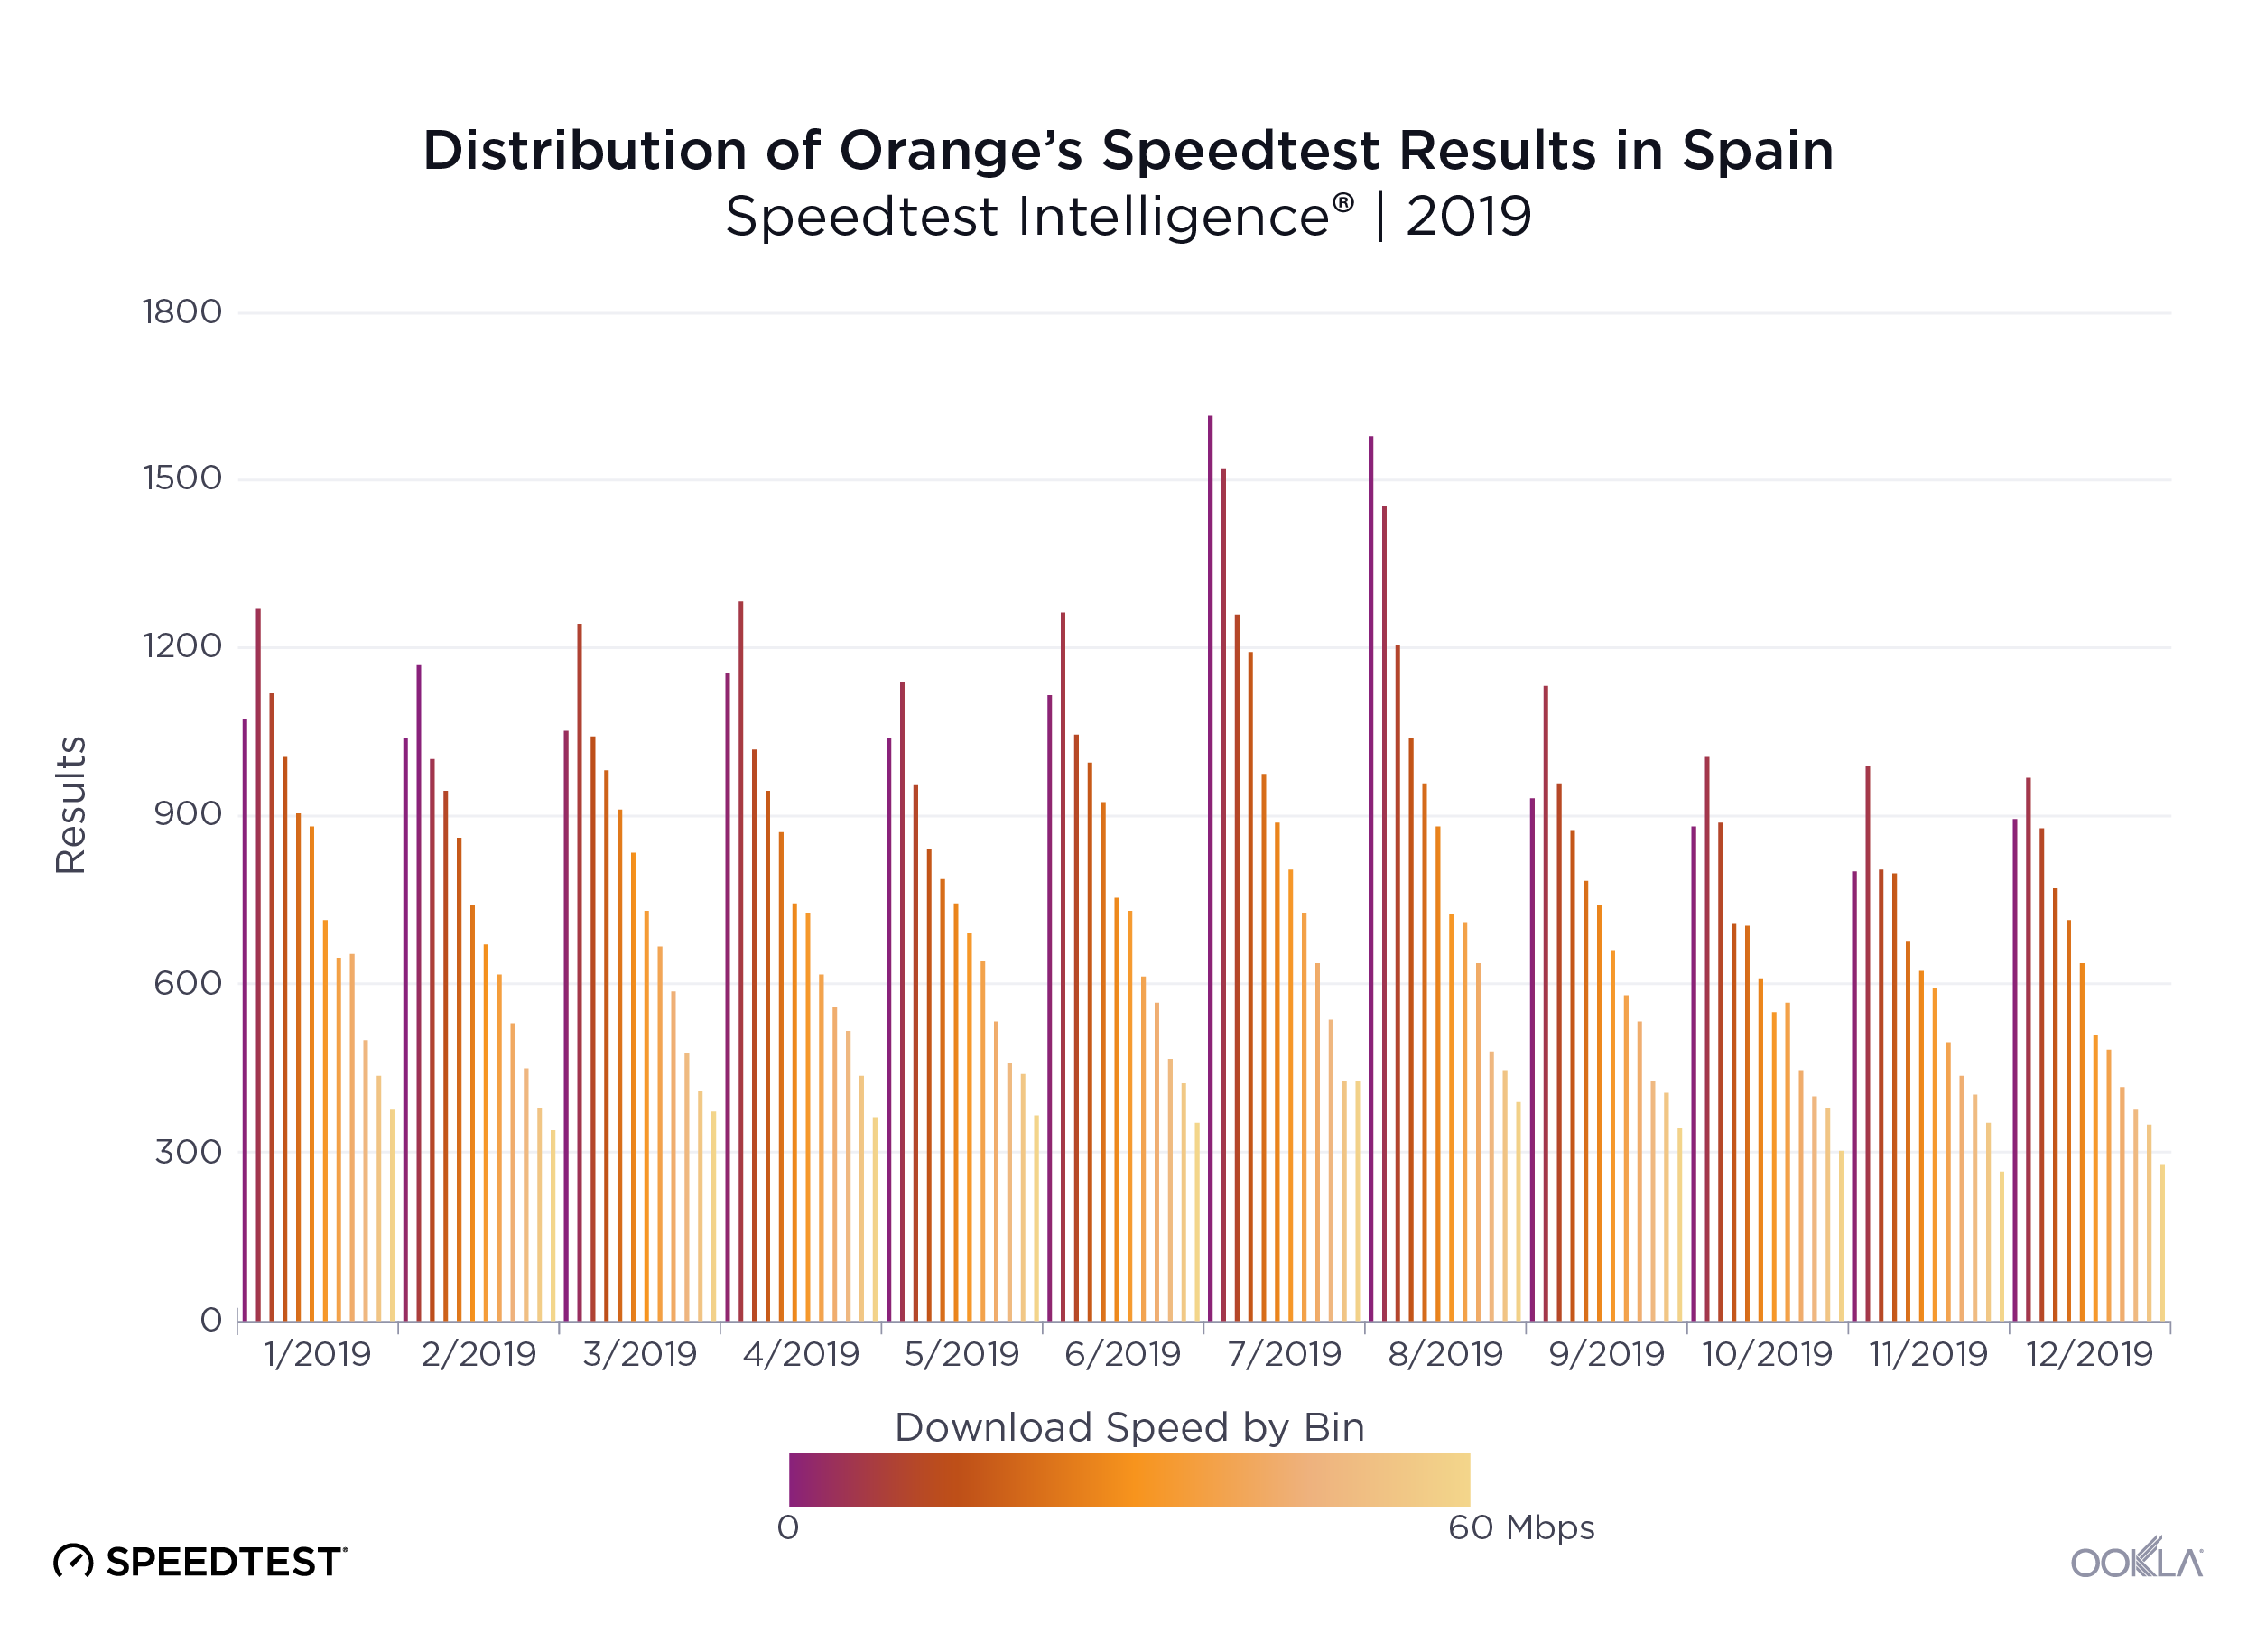
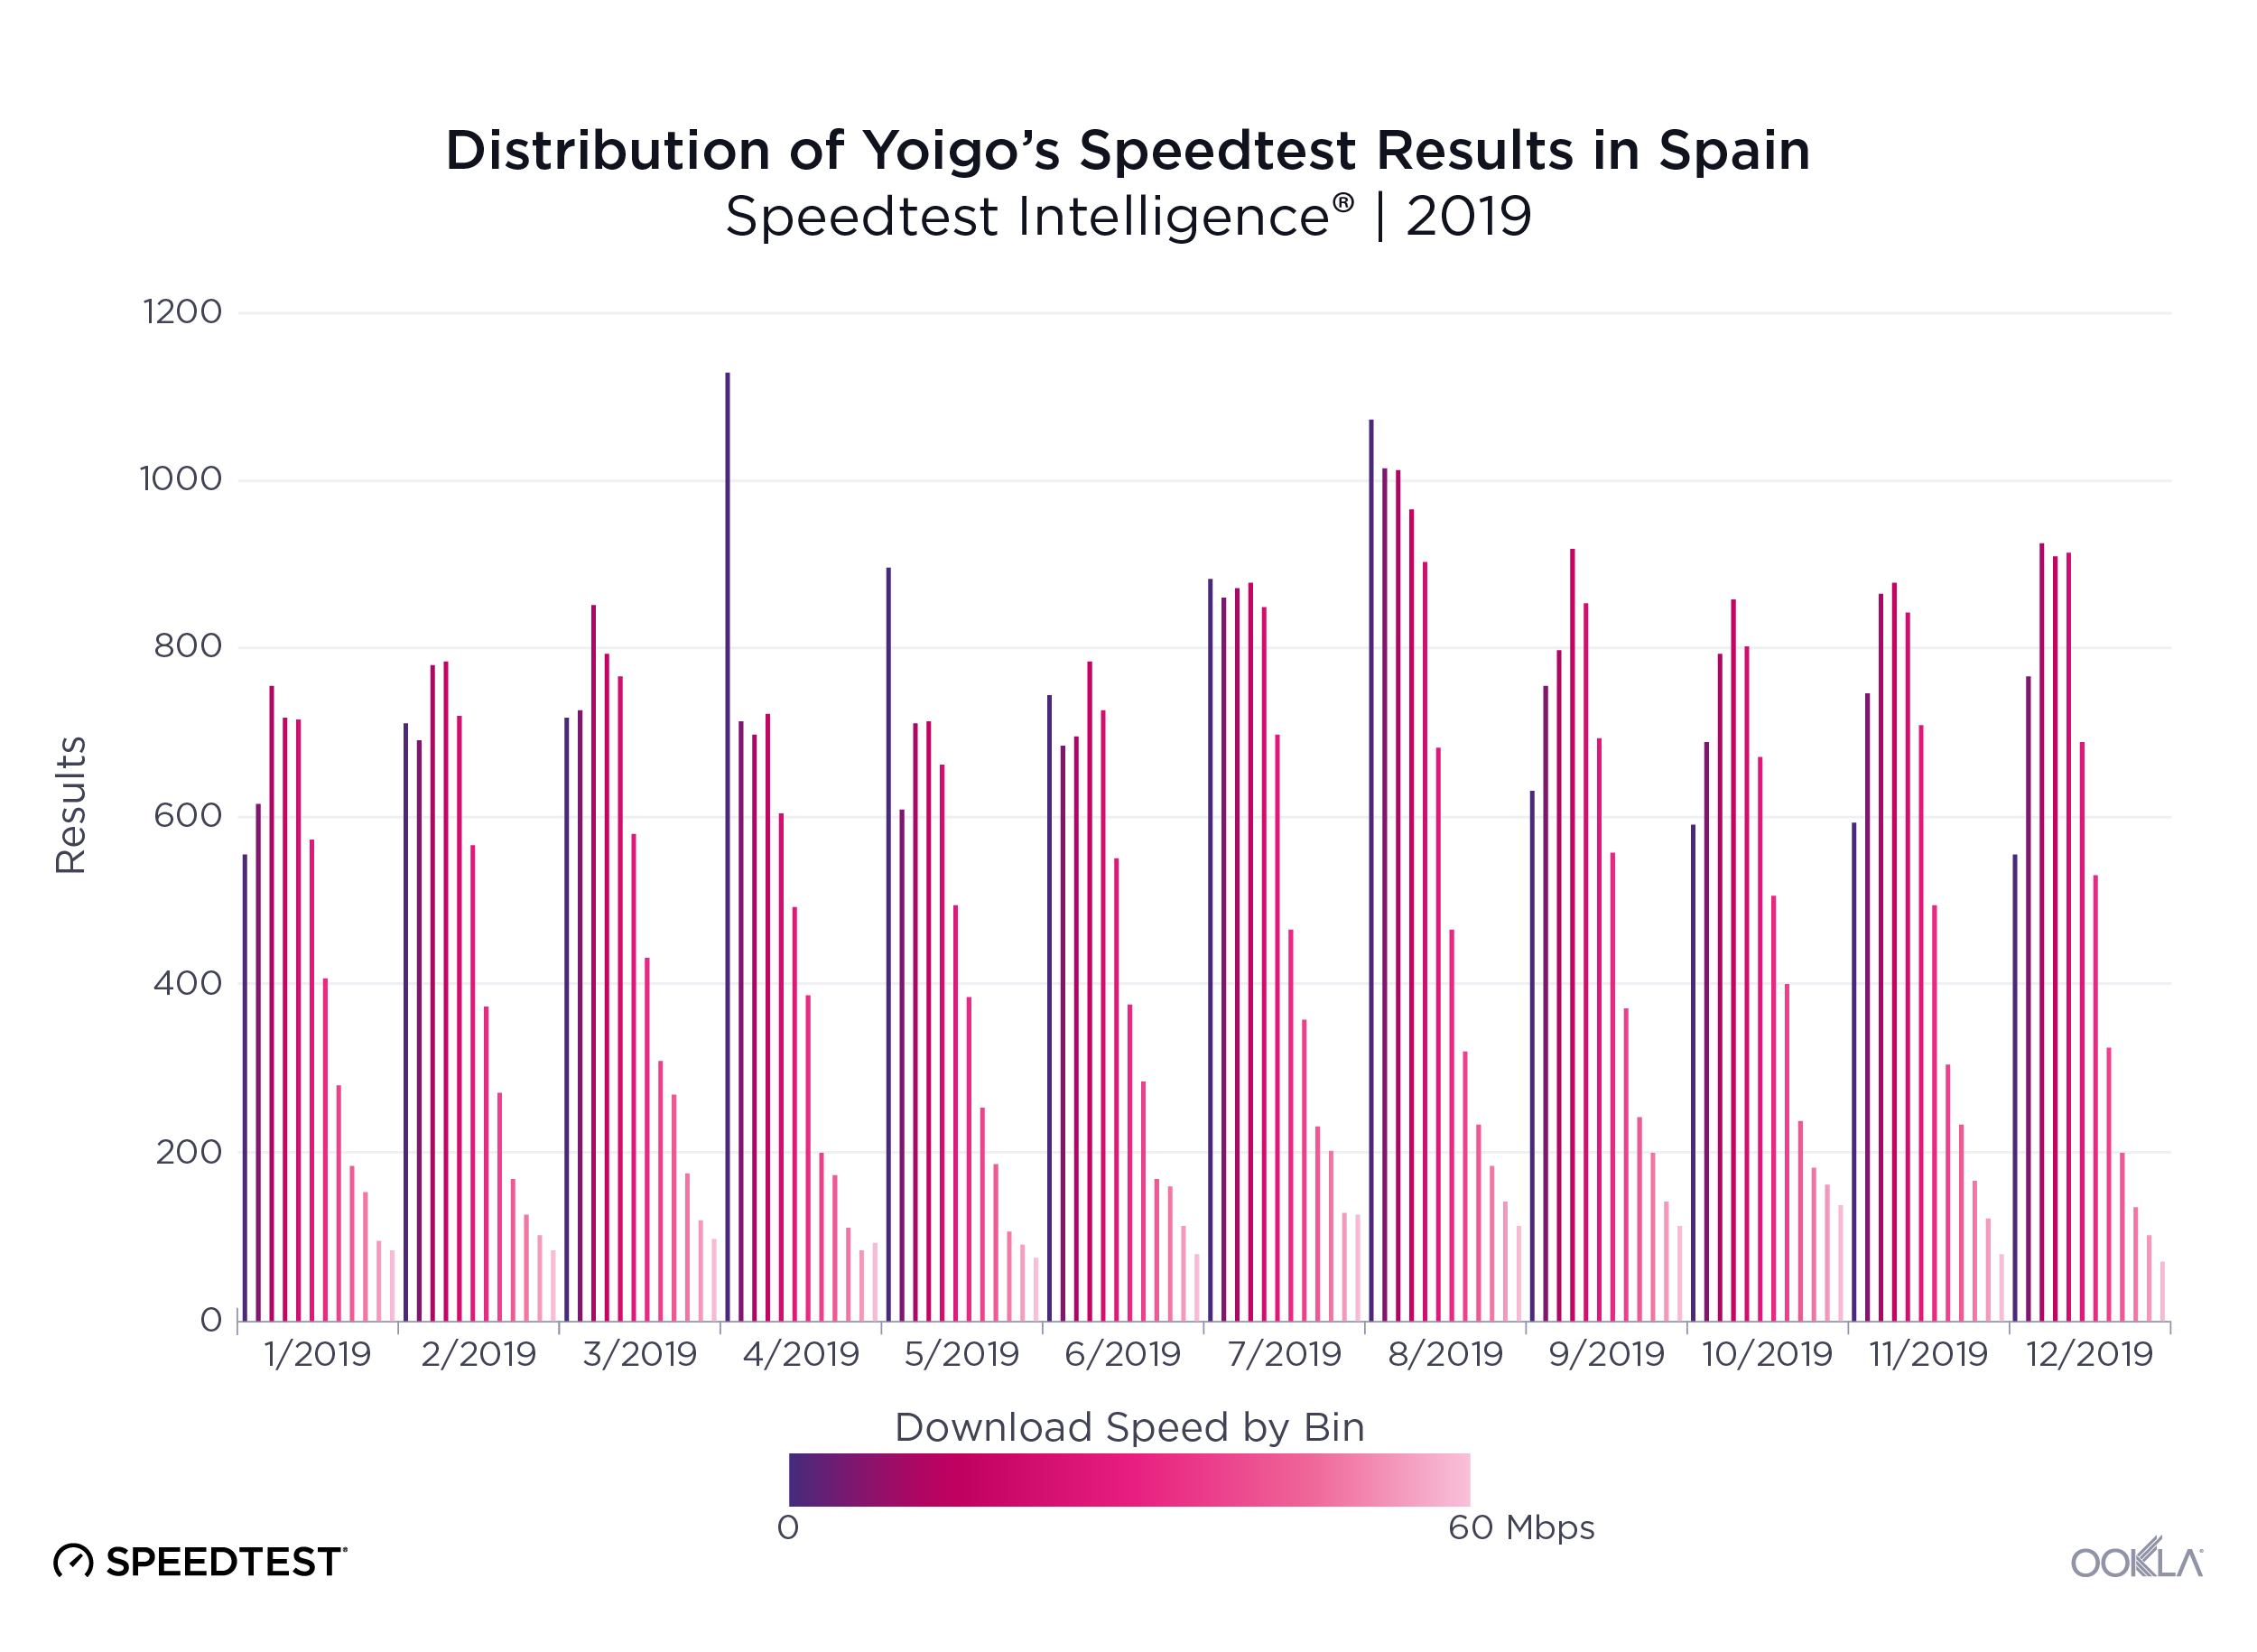
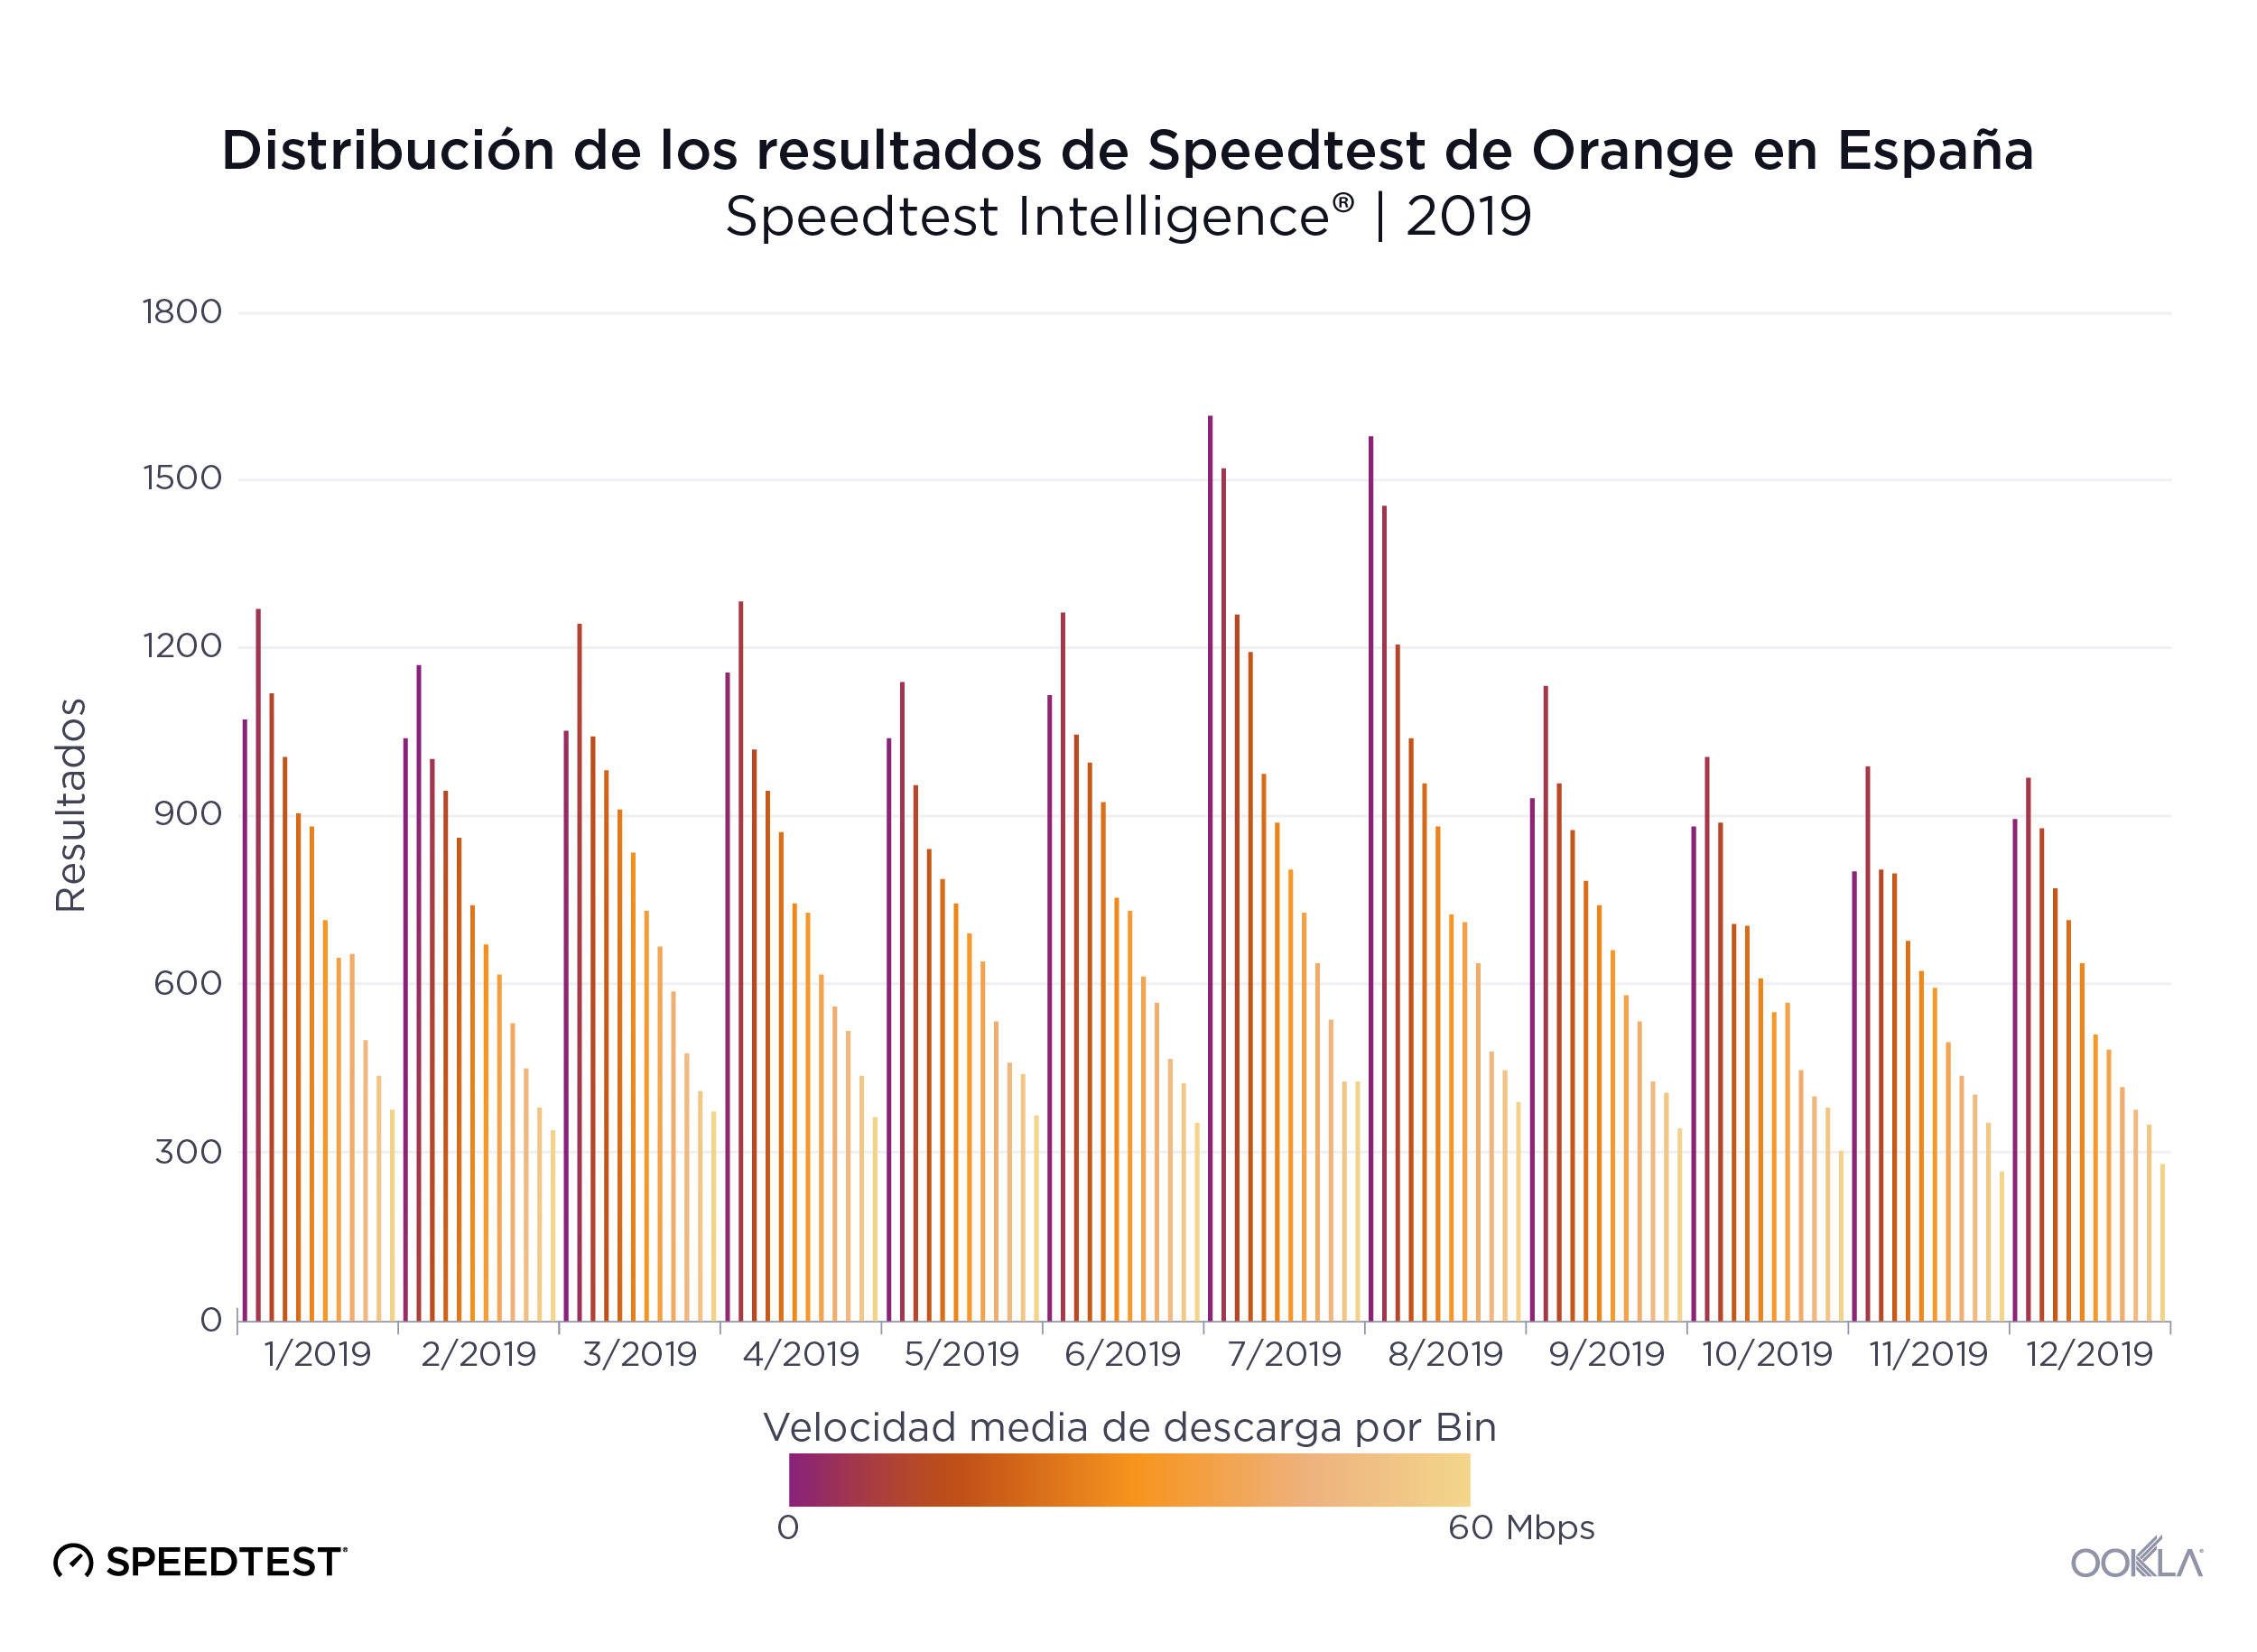
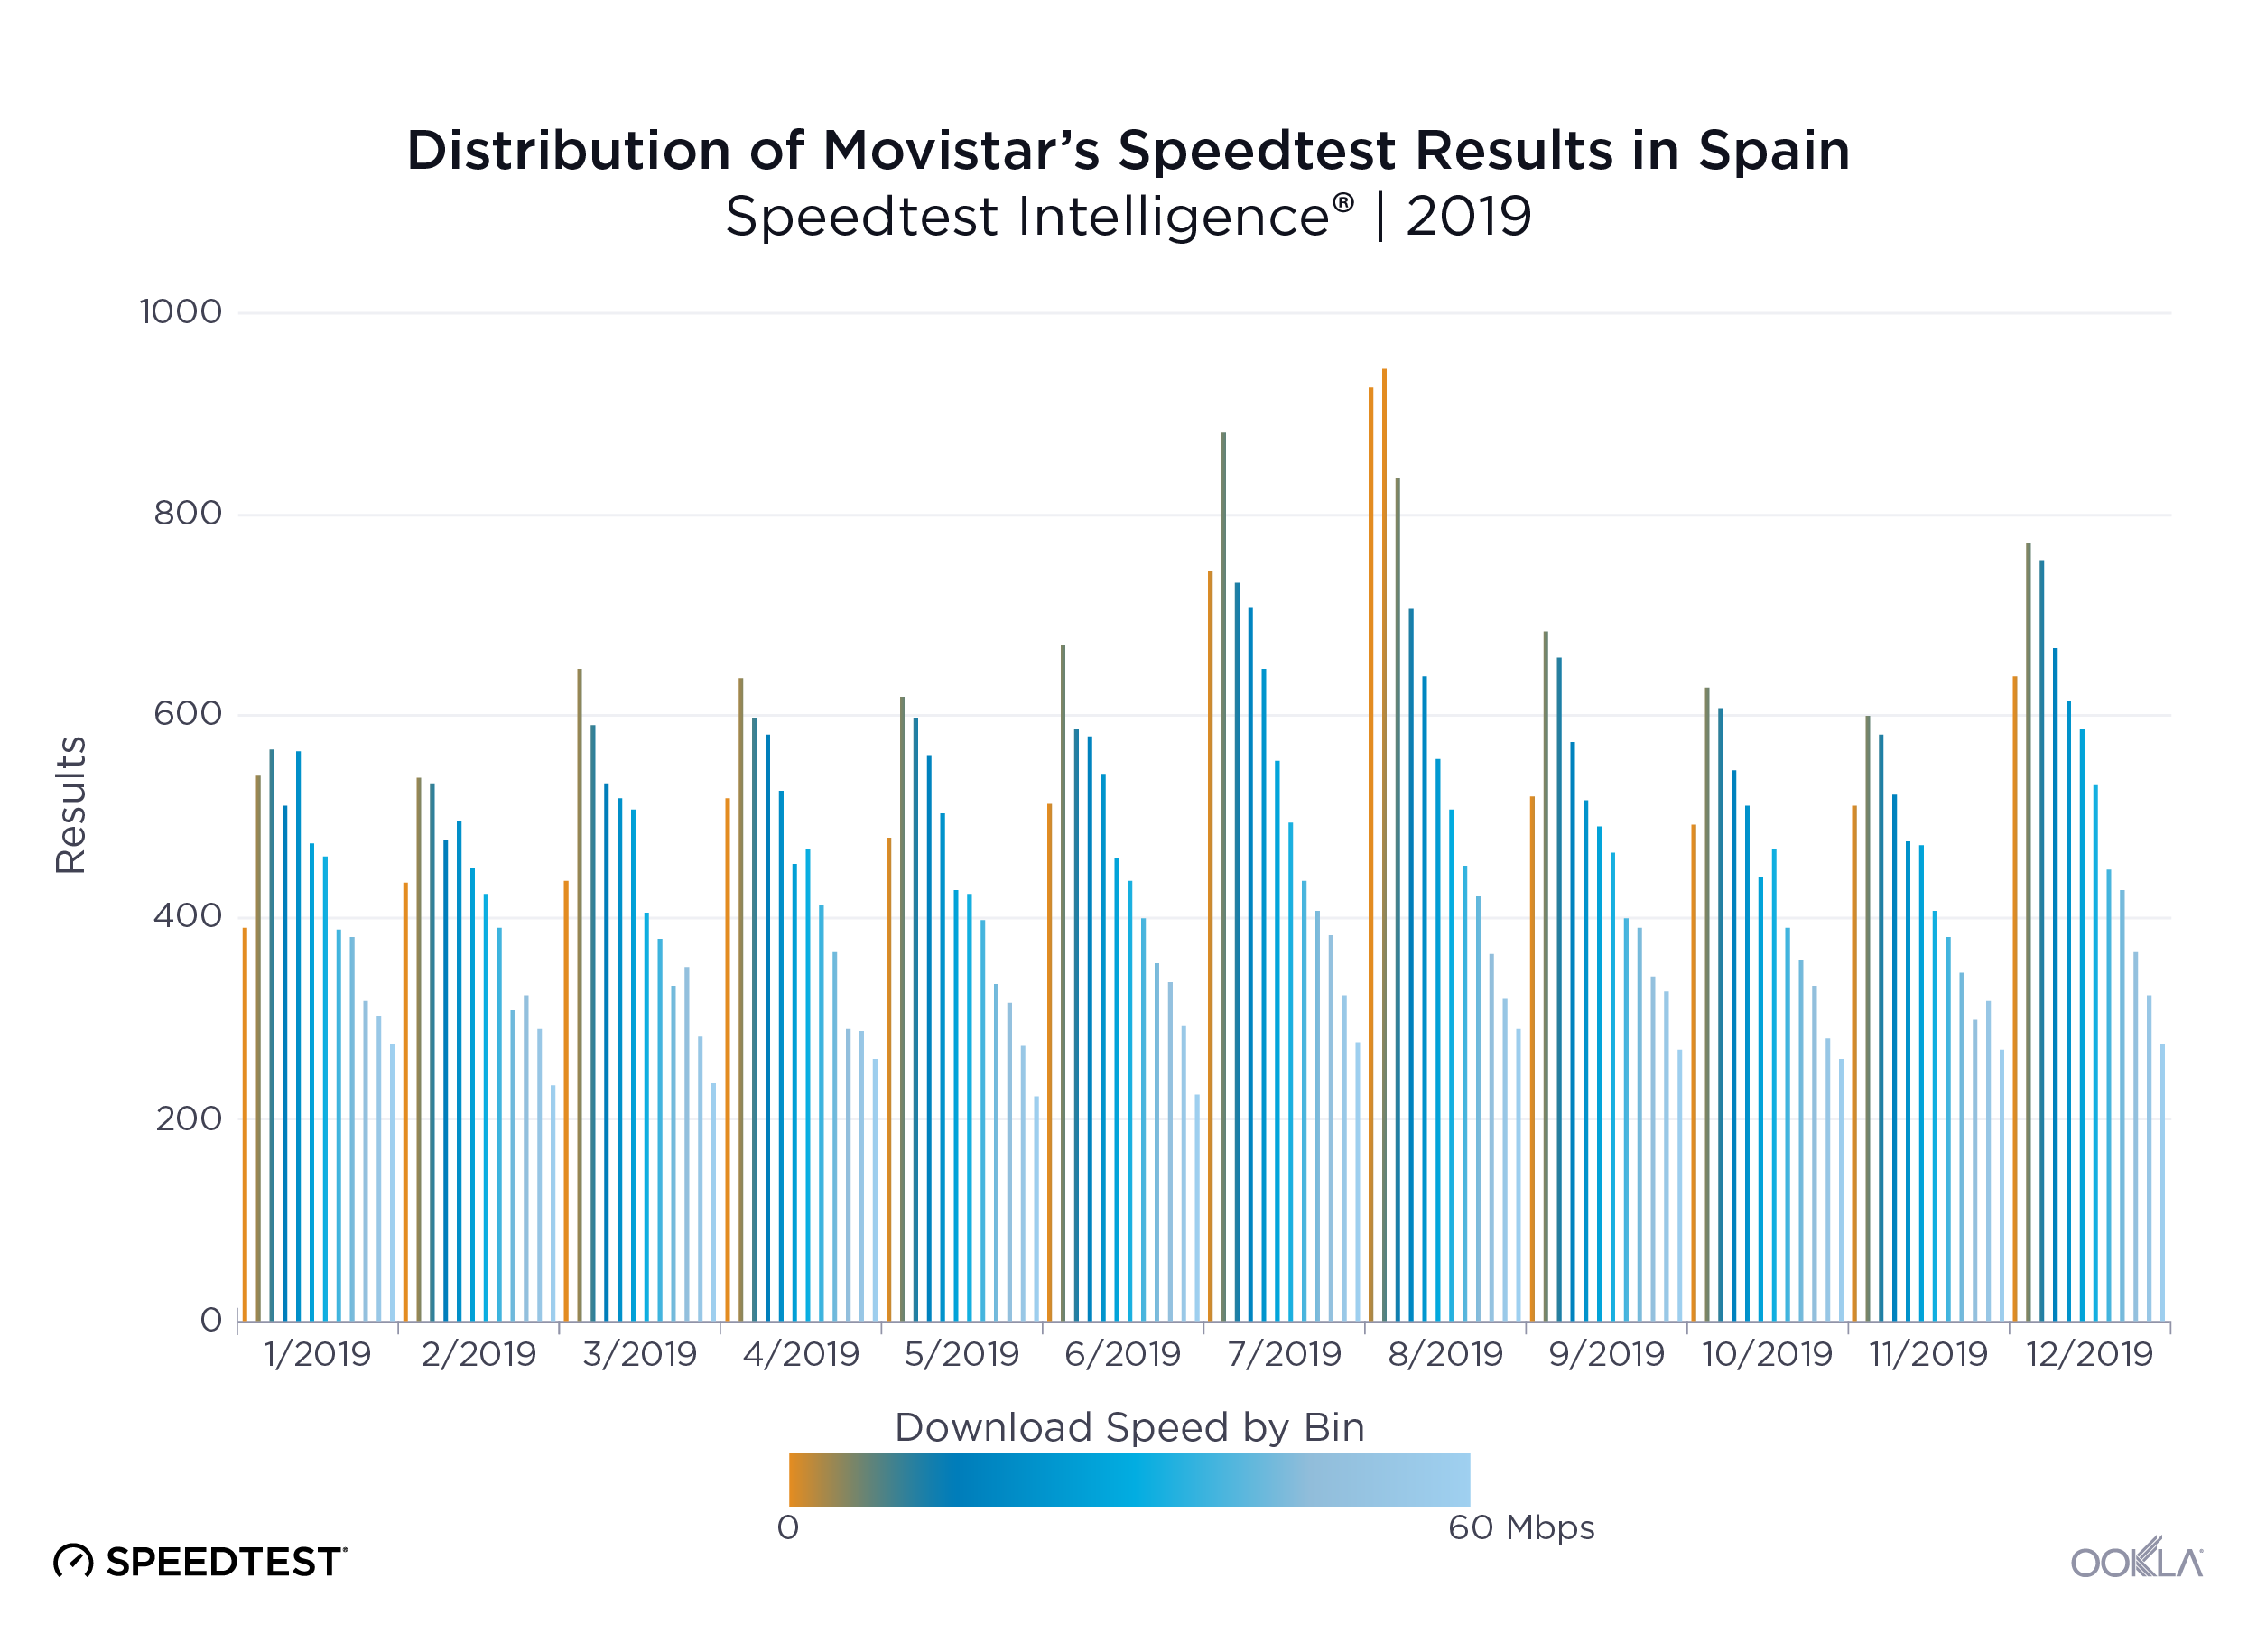
In contrast, we see more even distributions of download speeds among all other mobile operators in Spain.
Ookla_Distribution-Speedtest-Results_Movistar_Spain_0220-3_en
Ookla_Distribution-Speedtest-Results_Orange_Spain_0220-3_en
Ookla_Distribution-Speedtest-Results_Yoigo_Spain_0220-3_en

MÁSMÓVIL and Movistar (mobile) offer the most consistent speeds

Speed is important, but if those speeds are inconsistent, it becomes difficult for users to reliably use their devices to stream HD video, browse the web or use online gaming. We used Speedtest data to calculate each top provider’s APS (Acceptable Performance Score) in Spain during Q3-Q4 2019.

APS for fixed broadband measures the percentage of samples that equal or exceed a download speed of 25 Mbps and also equal or exceed an upload speed of 3 Mbps. MÁSMÓVIL provided the most consistent experience in Spain on fixed broadband in Q3-Q4 2019 with an APS of 81.6%. Movistar was in last place with an APS of 61.9%.

Speed Consistency by Provider on Fixed Broadband
Speedtest Intelligence® | Q3-Q4 2019
Provider APS
MÁSMÓVIL 81.6%
Orange 75.1%
Vodafone 73.5%
Movistar 61.9%

APS on mobile measures the percentage of samples that equal or exceed a download speed of 5 Mbps and also equal or exceed an upload speed of 1 Mbps. Movistar took the top spot for consistency on mobile broadband with an APS of 88.9%. Vodafone had the lowest consistency score with an APS of 79.8%.

Speed Consistency by Operator on Mobile
Speedtest Intelligence® | Q3-Q4 2019
Provider APS
Movistar 88.9%
Orange 84.3%
Yoigo 82.6%
Vodafone 79.8%

Madrid led fixed and mobile broadband speeds
Ookla_Fixed-Broadband-Speeds_Spain_0220-1
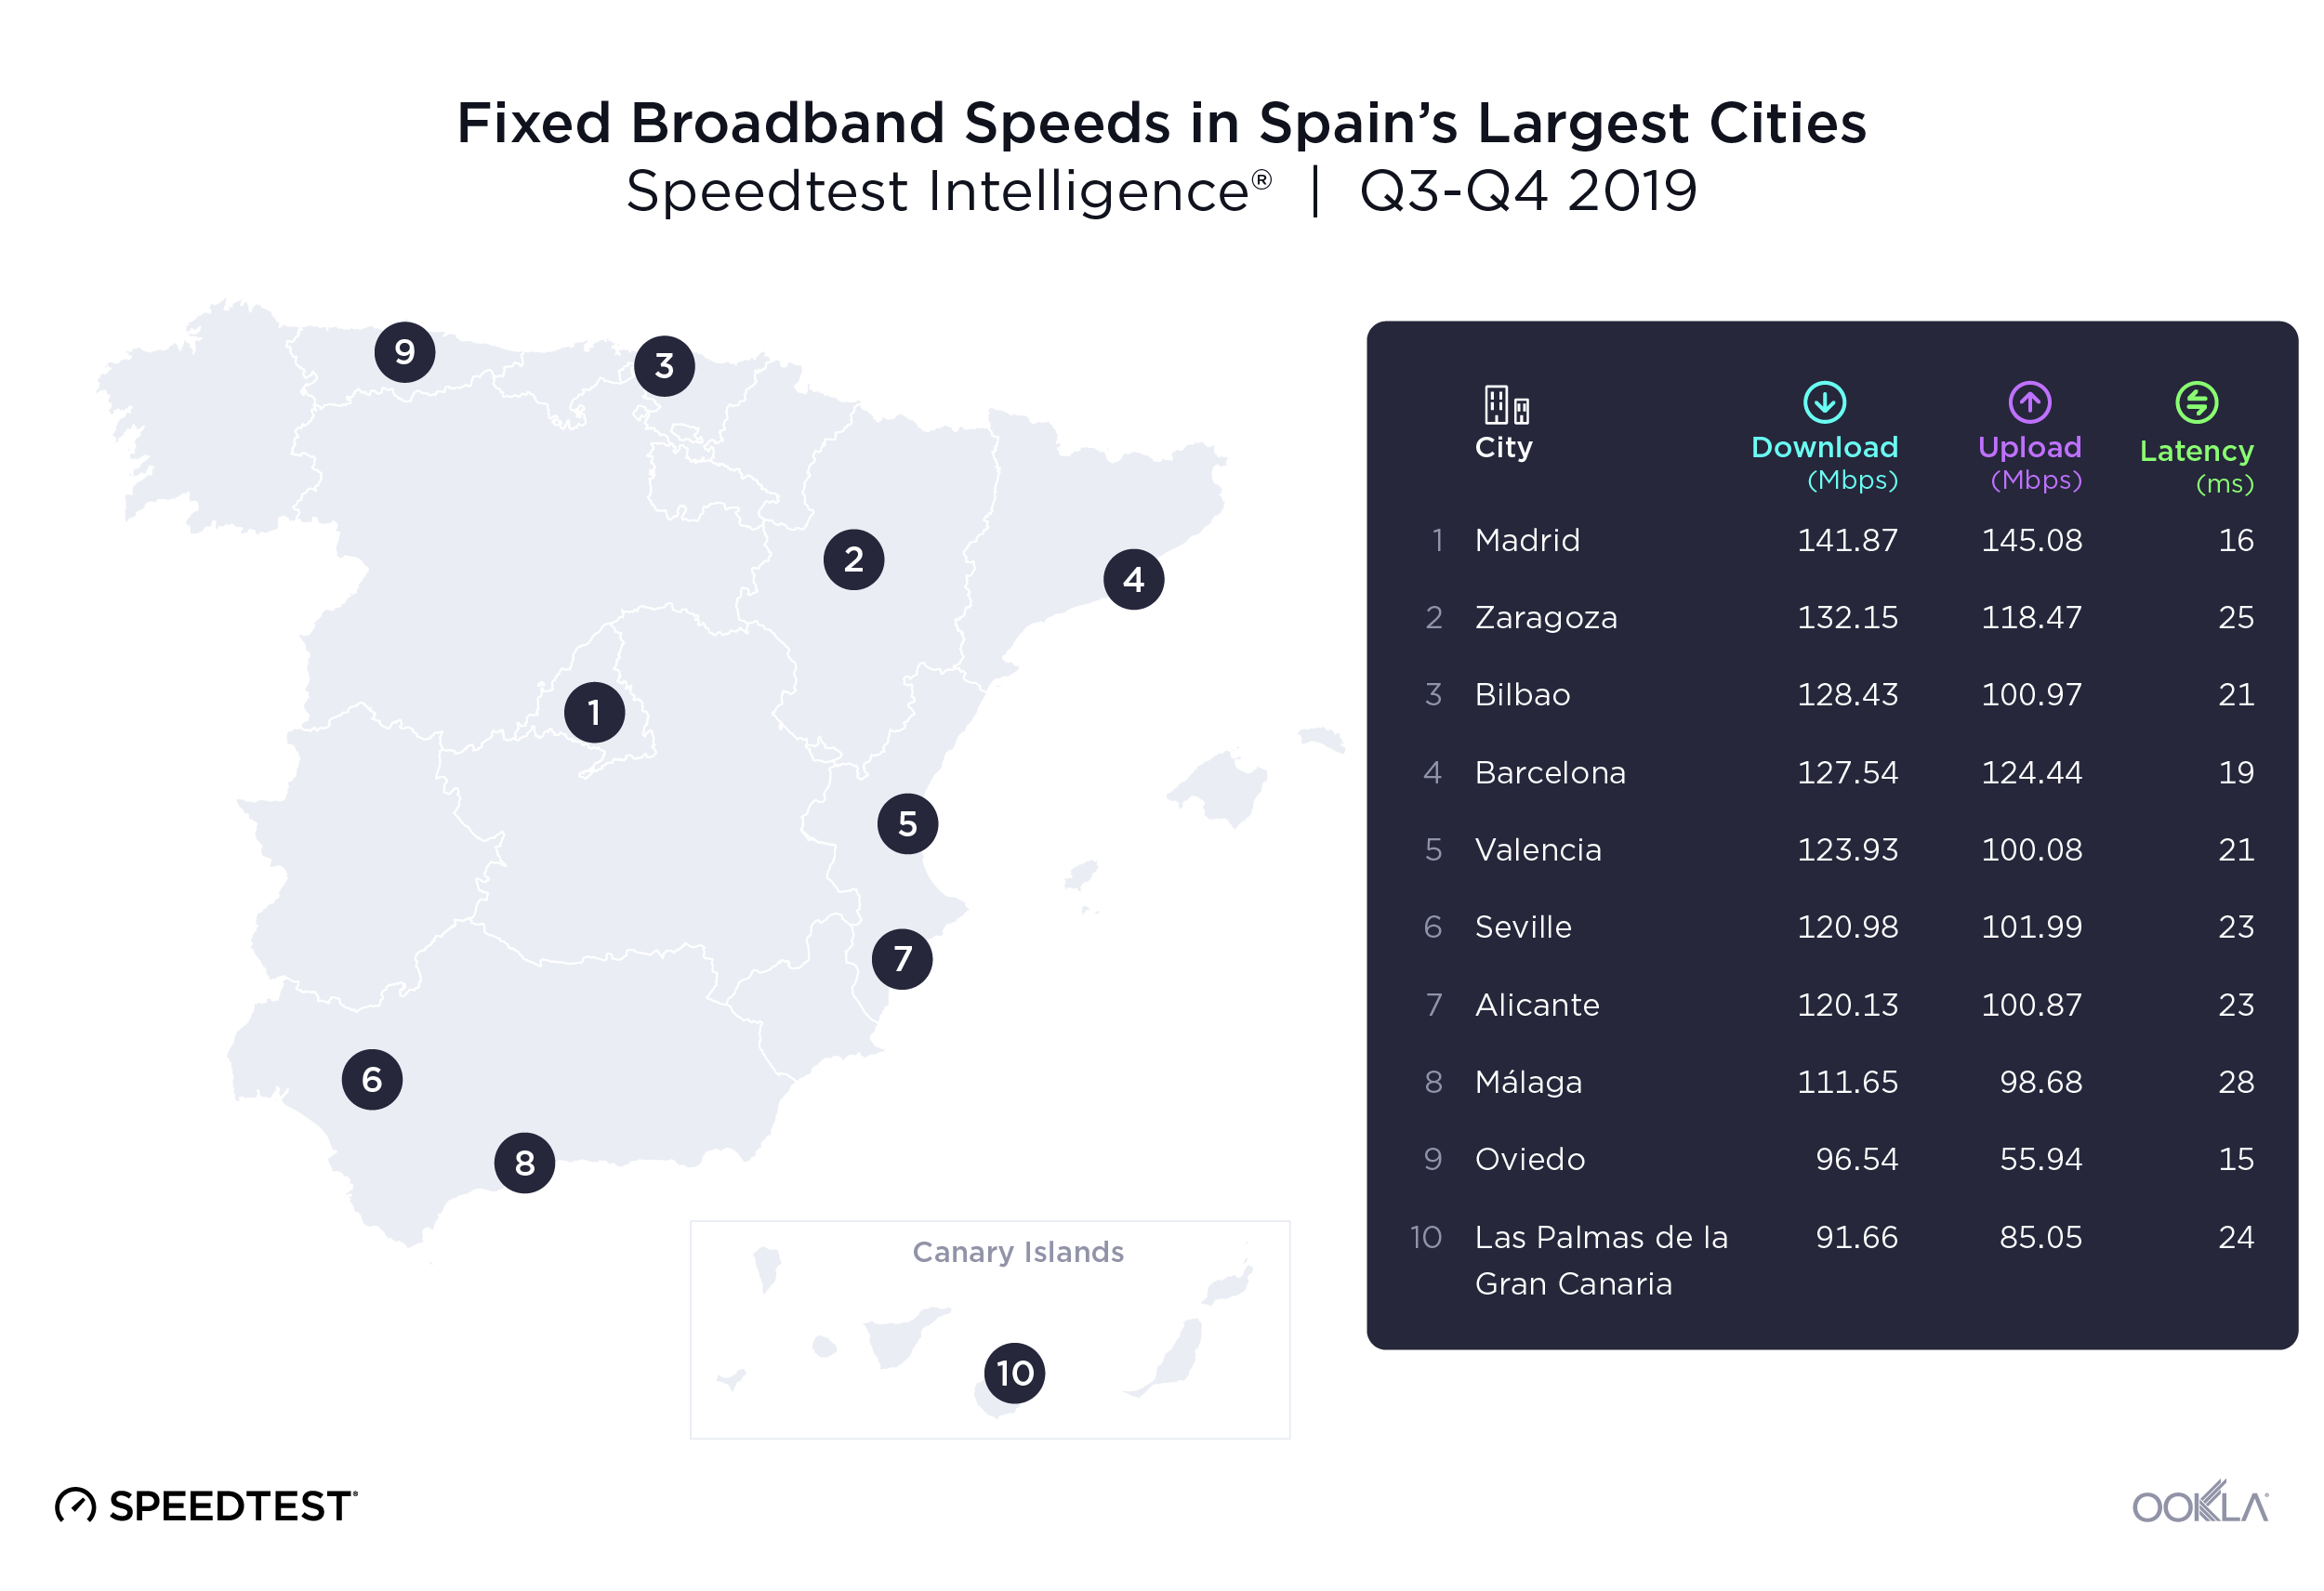
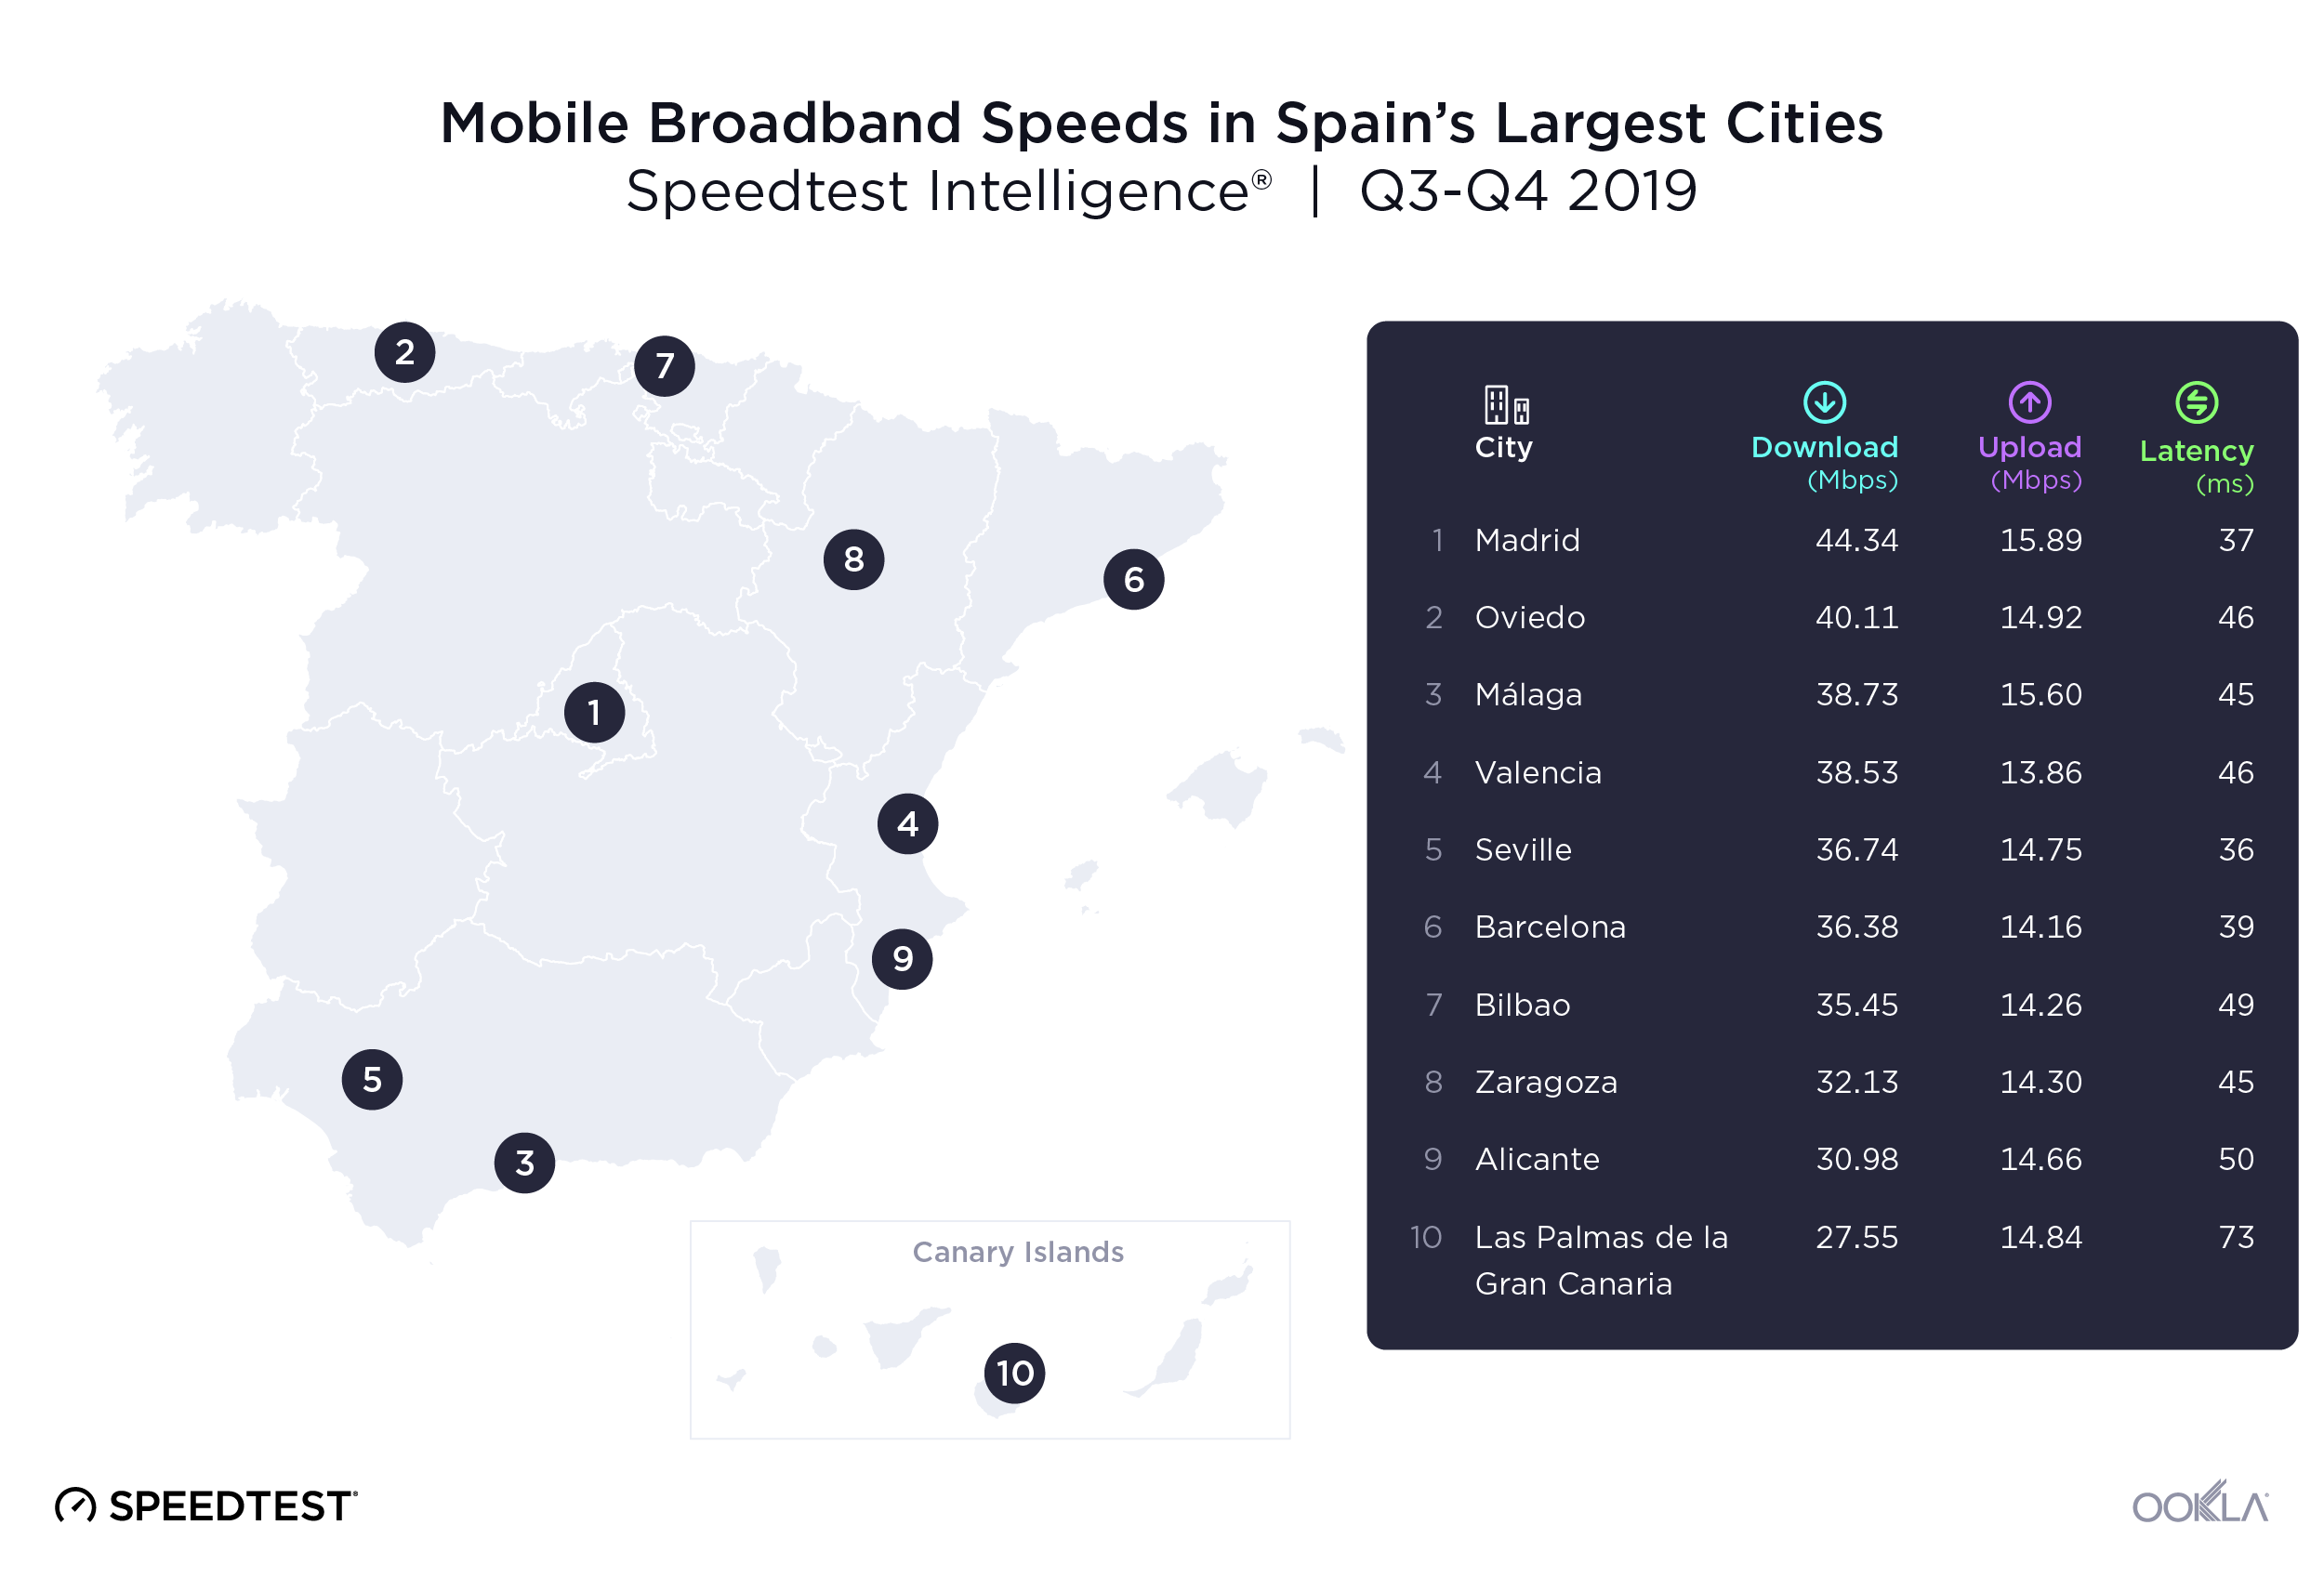
We used Speedtest data from 2,183,336 user-initiated tests to investigate internet speeds in Spain’s ten most populous cities during Q3-Q4 2019. Madrid had the fastest mean download speeds on both fixed broadband and mobile.

Mean download speeds on fixed broadband ranged from 141.87 Mbps in Madrid to 91.66 Mbps in Las Palmas de la Gran Canaria, a 35.4% difference. Madrid also had the fastest mean upload speed over fixed broadband at 145.08 Mbps. Oviedo took the last place in upload speeds on fixed broadband with a 61.4% slower upload speed than Madrid.

Oviedo had the lowest latency over fixed broadband of the cities on our list during Q3-Q4 2019 at 15 ms. Málaga had the highest latency at 28 ms.
Ookla_Mobile-Broadband-Speeds_Spain_0220-1
The gap between fastest and slowest speeds between Spanish cities on mobile broadband was similar to what we saw fixed broadband during Q3-Q4 2019. Madrid once again led in performance on mobile broadband with a mean download speed of 44.35 Mbps and a mean upload speed of 15.89 Mbps. Las Palmas was in last place on download speeds with a 37.9% slower mean download speed than Madrid. Valencia had the slowest mean upload speed over mobile at 13.86 Mbps. Seville had the lowest latency over mobile at 36 ms during Q3-Q4 2019 and Las Palmas had the highest mobile latency at 73 ms.

Zaragoza led 4G Availability in Spain’s most populous cities

4G Availability in Spain’s Largest Cities
Speedtest Intelligence® | Q3-Q4 2019
City 4G Availability
Zaragoza 97.2%
Valencia 97.1%
Seville 96.8%
Málaga 96.7%
Oviedo 95.4%
Madrid 95.1%
Las Palmas de la Gran Canaria 95.0%
Alicante 94.6%
Bilbao 94.3%
Barcelona 87.7%

4G Availability was higher in Spain’s largest cities than the country’s average, with Zaragoza having the highest 4G Availability at 97.2% of tested locations. Barcelona had the lowest 4G Availability on our list at 87.7%.

MÁSMÓVIL was fastest fixed broadband provider in 6 cities

Looking specifically at Speed Score in individual Spanish cities during Q3-Q4 2019, we found MÁSMÓVIL was the fastest provider in six cities: Málaga, Seville, Zaragoza, Madrid, Valencia and Alicante. Adamo, the fastest fixed provider in Barcelona, had the highest Speed Score on the list at 185.29. Vodafone was the fastest provider in Bilbao and Oviedo.

Fixed Broadband Performance by Operator in Spain’s Largest Cities
Speedtest Intelligence® | Q3-Q4 2019
City Provider Speed ScoreTM
Barcelona Adamo 185.29
Málaga MÁSMÓVIL 156.24
Seville MÁSMÓVIL 148.78
Madrid MÁSMÓVIL 145.83
Bilbao Vodafone 144.65
Zaragoza MÁSMÓVIL 144.40
Oviedo Vodafone 143.85
Valencia MÁSMÓVIL 143.99
Alicante MÁSMÓVIL 143.72
Las Palmas Orange 114.46

Looking at the fastest Spanish providers on mobile broadband for each city during Q3-Q4 2019, Movistar dominated the list with the fastest Speed Score in 7 cities. Movistar also had the highest Speed Score overall at 52.04 in Seville. Vodafone was the fastest mobile provider in Madrid (35.67). Orange was the fastest provider in Barcelona (35.37) and Oviedo (45.10).

Mobile Performance by Operator in Spain’s Largest Cities
Speedtest Intelligence® | Q3-Q4 2019
City Provider Speed ScoreTM
Seville Movistar 52.04
Valencia Movistar 50.80
Alicante Movistar 50.36
Málaga Movistar 48.97
Bilbao Movistar 48.86
Oviedo Orange 45.10
Zaragoza Movistar 40.79
Madrid Vodafone 35.67
Las Palmas Movistar 35.37
Barcelona Vodafone 31.37

We look forward to following these markets and investigating the changing landscape of internet performance and mobile coverage in Europe. Want to learn more about fixed and mobile speeds in different markets? Click here to read more Ookla Research.

Editor’s note: This article was updated on March 4, 2020 to correct an editing error that incorrectly reported the figures for mobile APS.

Velocidades de banda ancha fija y móvil, y disponibilidad de 4G en España

Hemos investigado el rendimiento de la banda ancha fija y móvil, así como la disponibilidad de 4G en España. También hemos comparado las velocidades y la cobertura españolas con las de los países europeos vecinos, así como el rendimiento y la disponibilidad de 4G de los principales proveedores de las diez ciudades más grandes de España en el segundo semestre de 2019. Además de clasificar a los proveedores españoles por su velocidad y cobertura máximas, también hemos analizado los efectos de los planes móviles con limitaciones de velocidad basándonos en los resultados de Speedtest® y hemos clasificado a los proveedores según la constancia del rendimiento de sus redes.

España y Francia fueron los países más rápidos de nuestra lista de banda ancha fija

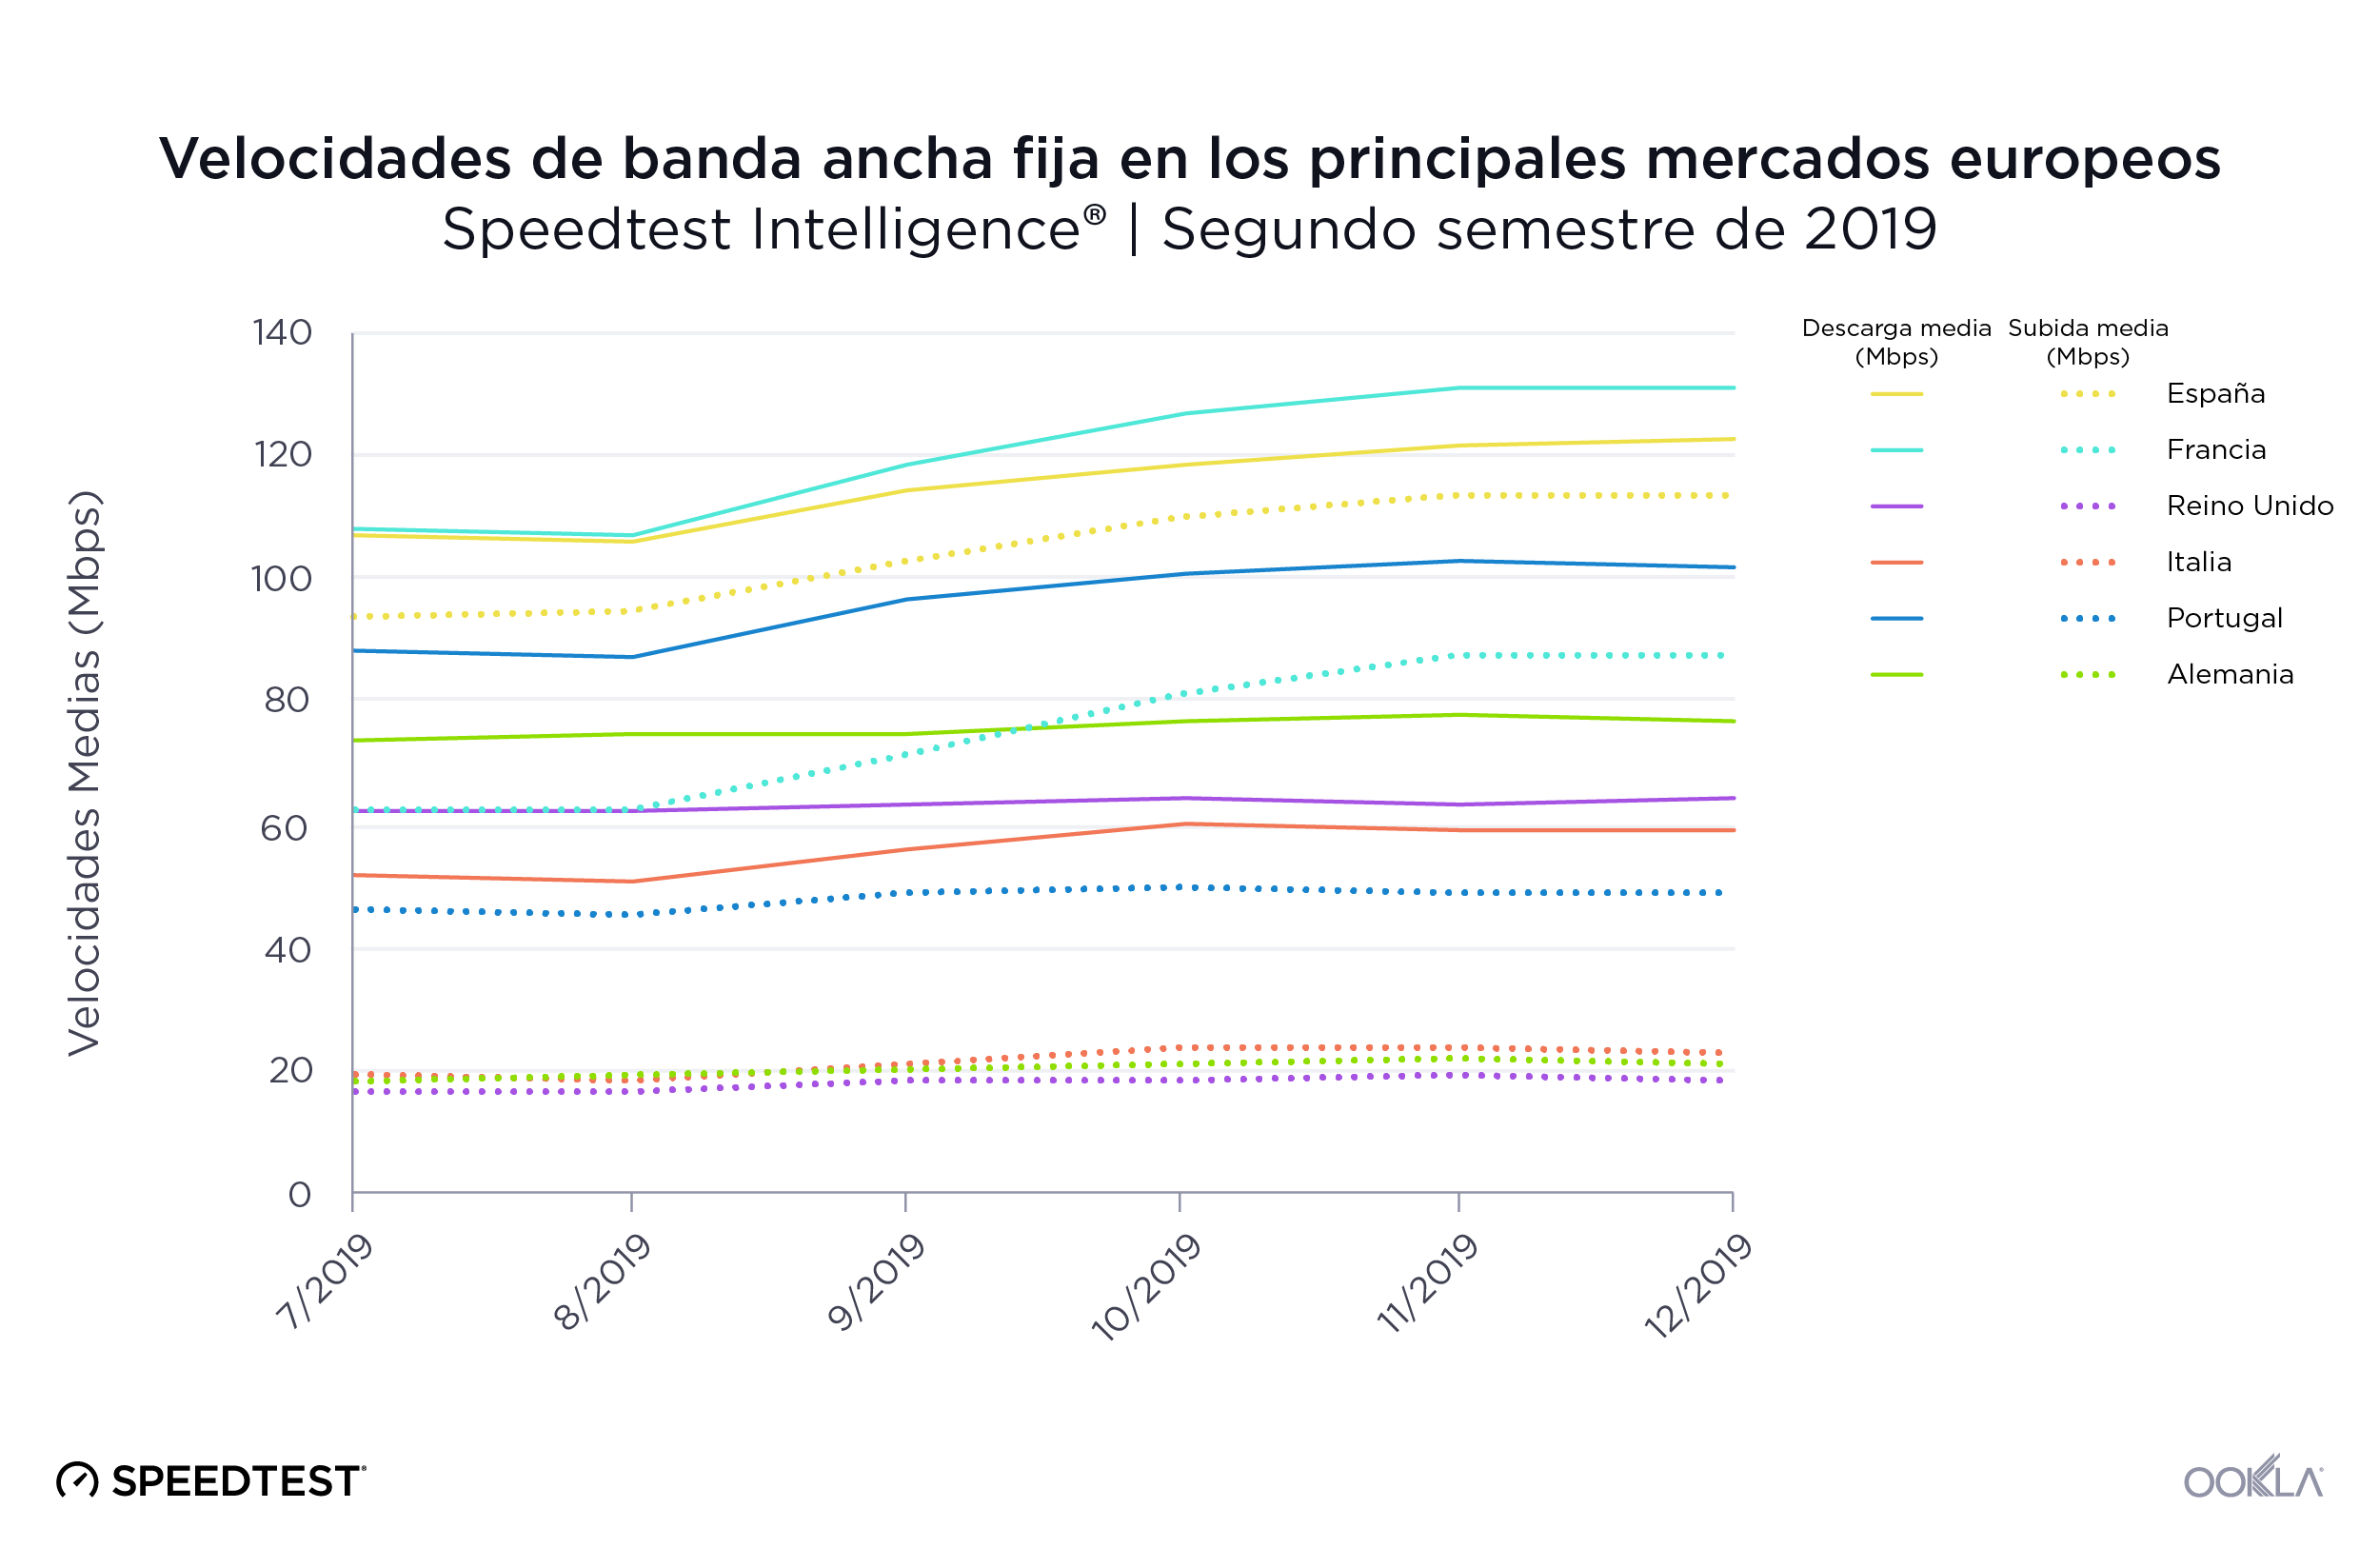
Hemos comparado el rendimiento de la banda ancha fija de España a nivel de país con varios otros países de la Europa occidental en el segundo semestre de 2019. España obtuvo una buena posición en cuanto a velocidad de descarga media en banda ancha fija, con 113,72 Mbps, en segundo lugar solo después de los 119,37 Mbps de Francia. España registró la velocidad de subida media más alta de esta lista: 103,72 Mbps. Italia obtuvo la velocidad de descarga media más baja de esta lista, 56,72 Mbps, mientras que el Reino Unido registró la velocidad de subida media más baja, 18,28 Mbps.
fixed-broadband-speeds-sp-2

Francia registró el mayor aumento en la velocidad de descarga media del segundo semestre de 2019, con el 21,5 %, seguida de Portugal y Italia, con el 15,4 %, y España, con el 14,5 %. Las velocidades se mantuvieron relativamente invariables durante este periodo en Italia, Reino Unido y Alemania.

Un análisis de la latencia en banda ancha fija en el segundo semestre de 2019 reveló una clasificación por rendimiento muy distinta. Portugal se anotó la latencia más baja de este periodo: 16 ms. Alemania y Reino Unido empataron en el segundo puesto con 23 ms. España resultó tercera (25 ms), Italia cuarta (30 ms) y Francia quinta (32 ms).

España, cuarto país en velocidad de descarga en Internet móvil
mobile-speeds-sp-3

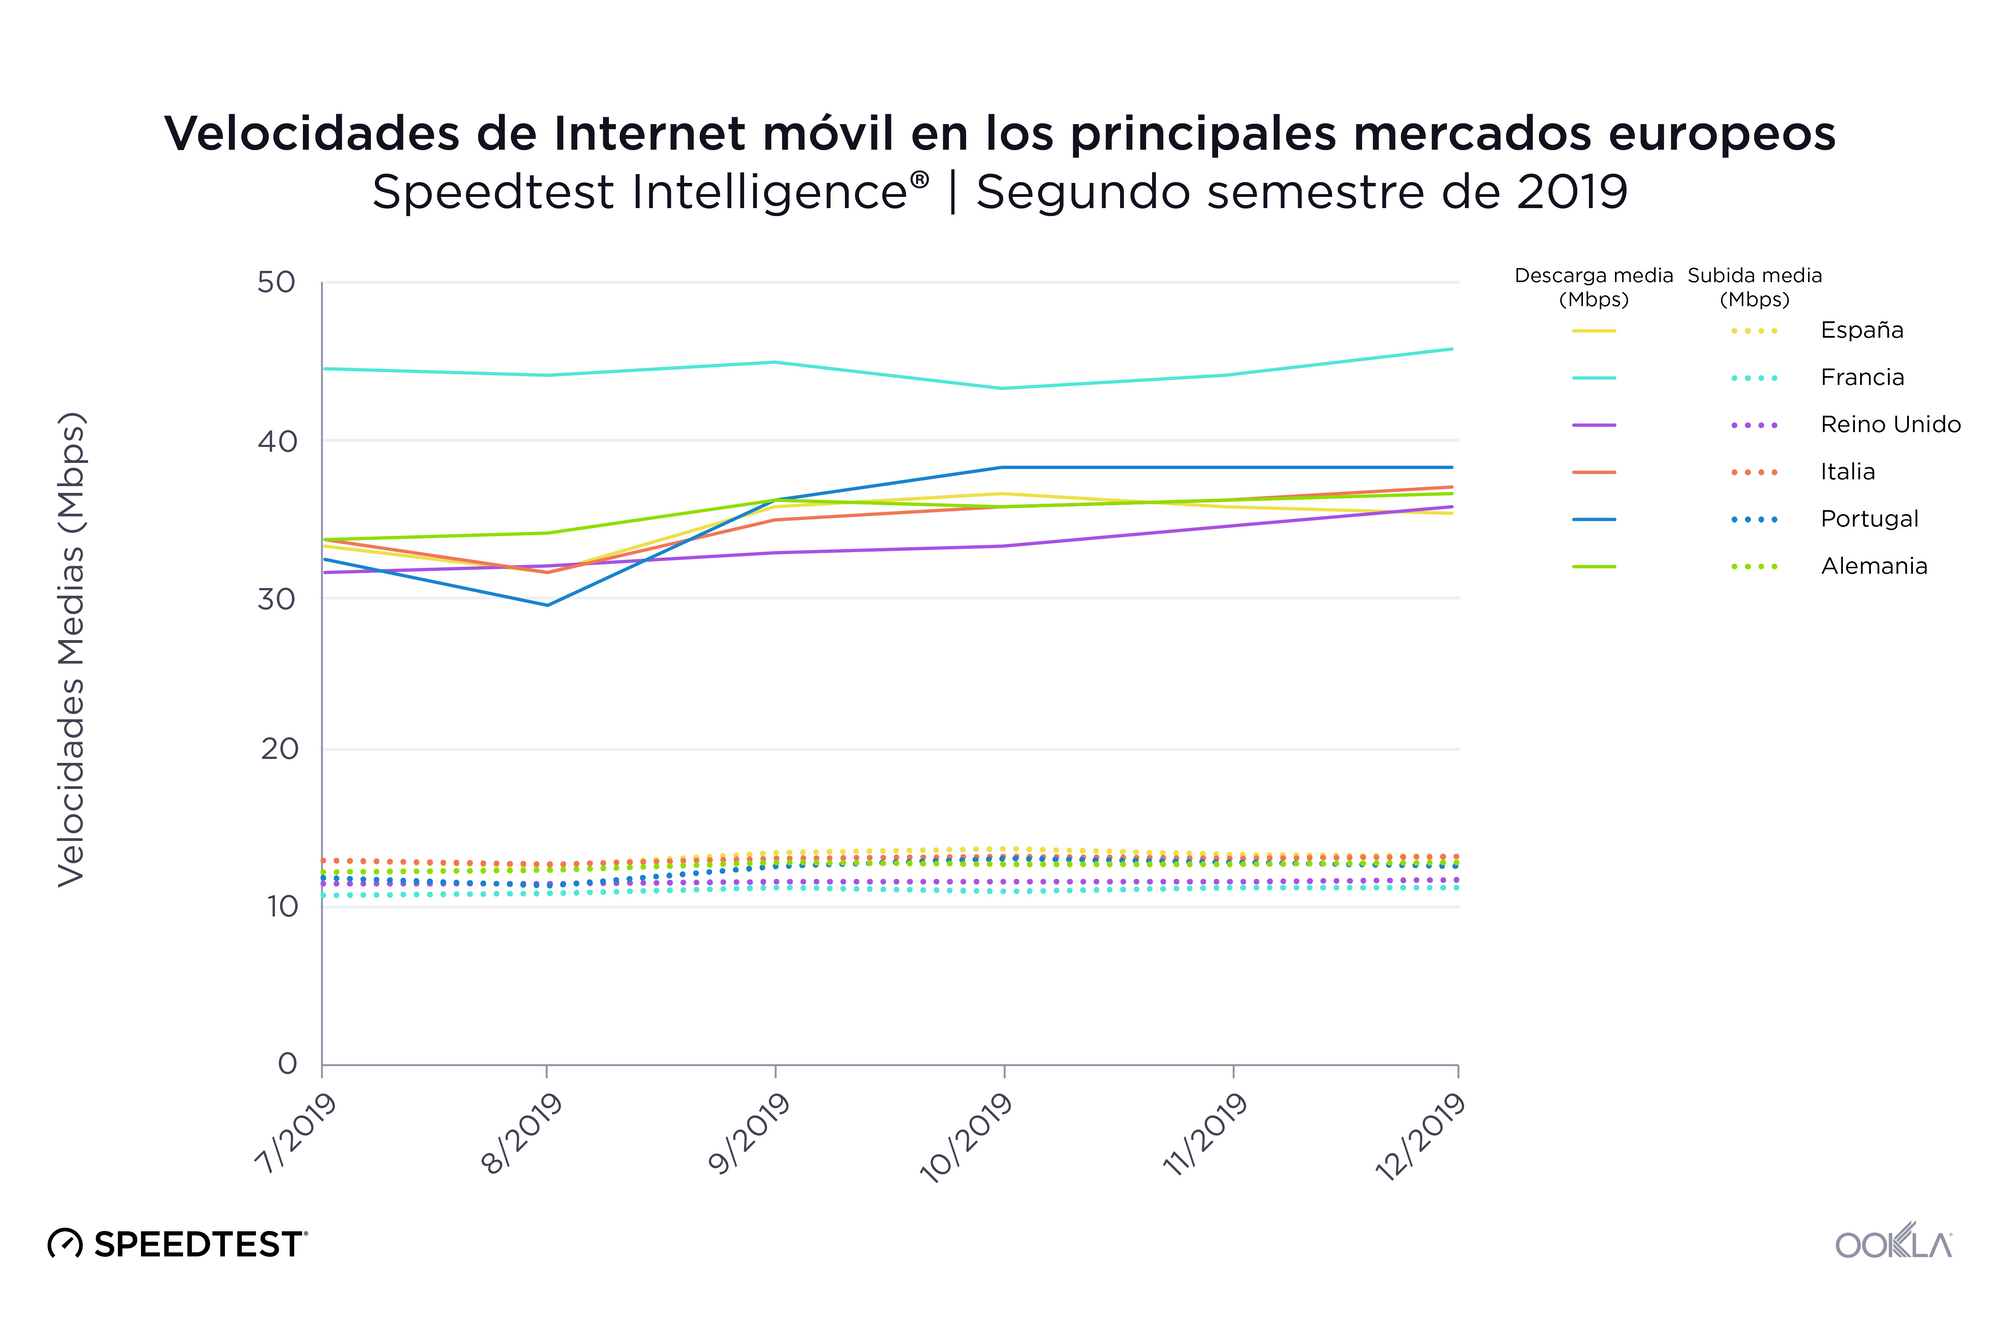
La clasificación de España en velocidad de descarga media por móvil no fue tan buena como la de banda ancha fija, quedándose con un cuarto puesto con 33,97 Mbps en el segundo semestre de 2019. Esto supuso una velocidad un 22,8 % más lenta que la del primer país clasificado, Francia. Sin embargo, España registró las velocidades de subida medias más altas en Internet móvil, con 13,12 Mbps en el segundo semestre de 2019.

Portugal experimentó el mayor aumento en velocidad de descarga de Internet móvil en el segundo semestre de 2019, el 18,4 %. La velocidad de descarga media de España en Internet móvil aumentó solo un 6,7 % en este periodo. Francia registró el menor aumento de velocidad de descarga de Internet móvil, un 2,8 %.

Como vimos en la banda ancha fija, la latencia móvil más baja fue la de Portugal, con 32 ms. Alemania fue segunda con 41 ms, Francia tercera con 43 ms, Reino Unido cuarto con 44 ms, España quinta con 47 ms e Italia última con 52 ms.

Reino Unido y España, líderes en disponibilidad de 4G

Utilizamos datos de exploraciones de cobertura de Speedtest en Android para comparar la disponibilidad de 4G en cada mercado en el segundo semestre de 2019. Mientras que el Reino Unido mostró la mayor disponibilidad de 4G con el 88,8 %, España y Francia ocuparon el segundo lugar, con 4G disponible en el 87,7 % de las ubicaciones probadas. Durante ese período, Alemania tuvo la menor disponibilidad de 4G con un 72,1 %.

Disponibilidad de 4G en los principales mercados europeos
Speedtest Intelligence® | Segundo semestre de 2019
País Disponibilidad de 4G
Reino Unido 88,8 %
España 87,7 %
Francia 87,7 %
Italia 86,7 %
Portugal 85,0 %
Alemania 72,1 %

Si nos fijamos específicamente en los principales proveedores móviles de España, Orange ofreció la mayor disponibilidad de 4G con un 88,1 %. Movistar fue segundo, Yoigo tercero, y Vodafone cuarto.

Disponibilidad de 4G por proveedor en España
Speedtest Intelligence® | Segundo semestre de 2019
Proveedor Disponibilidad de 4G
Orange 88,1 %
Movistar 87,7 %
Yoigo 87,4 %
Vodafone 86,1 %

Los despliegues de 5G en España se están expandiendo
5G-Deployments-in-Spain-0220_es
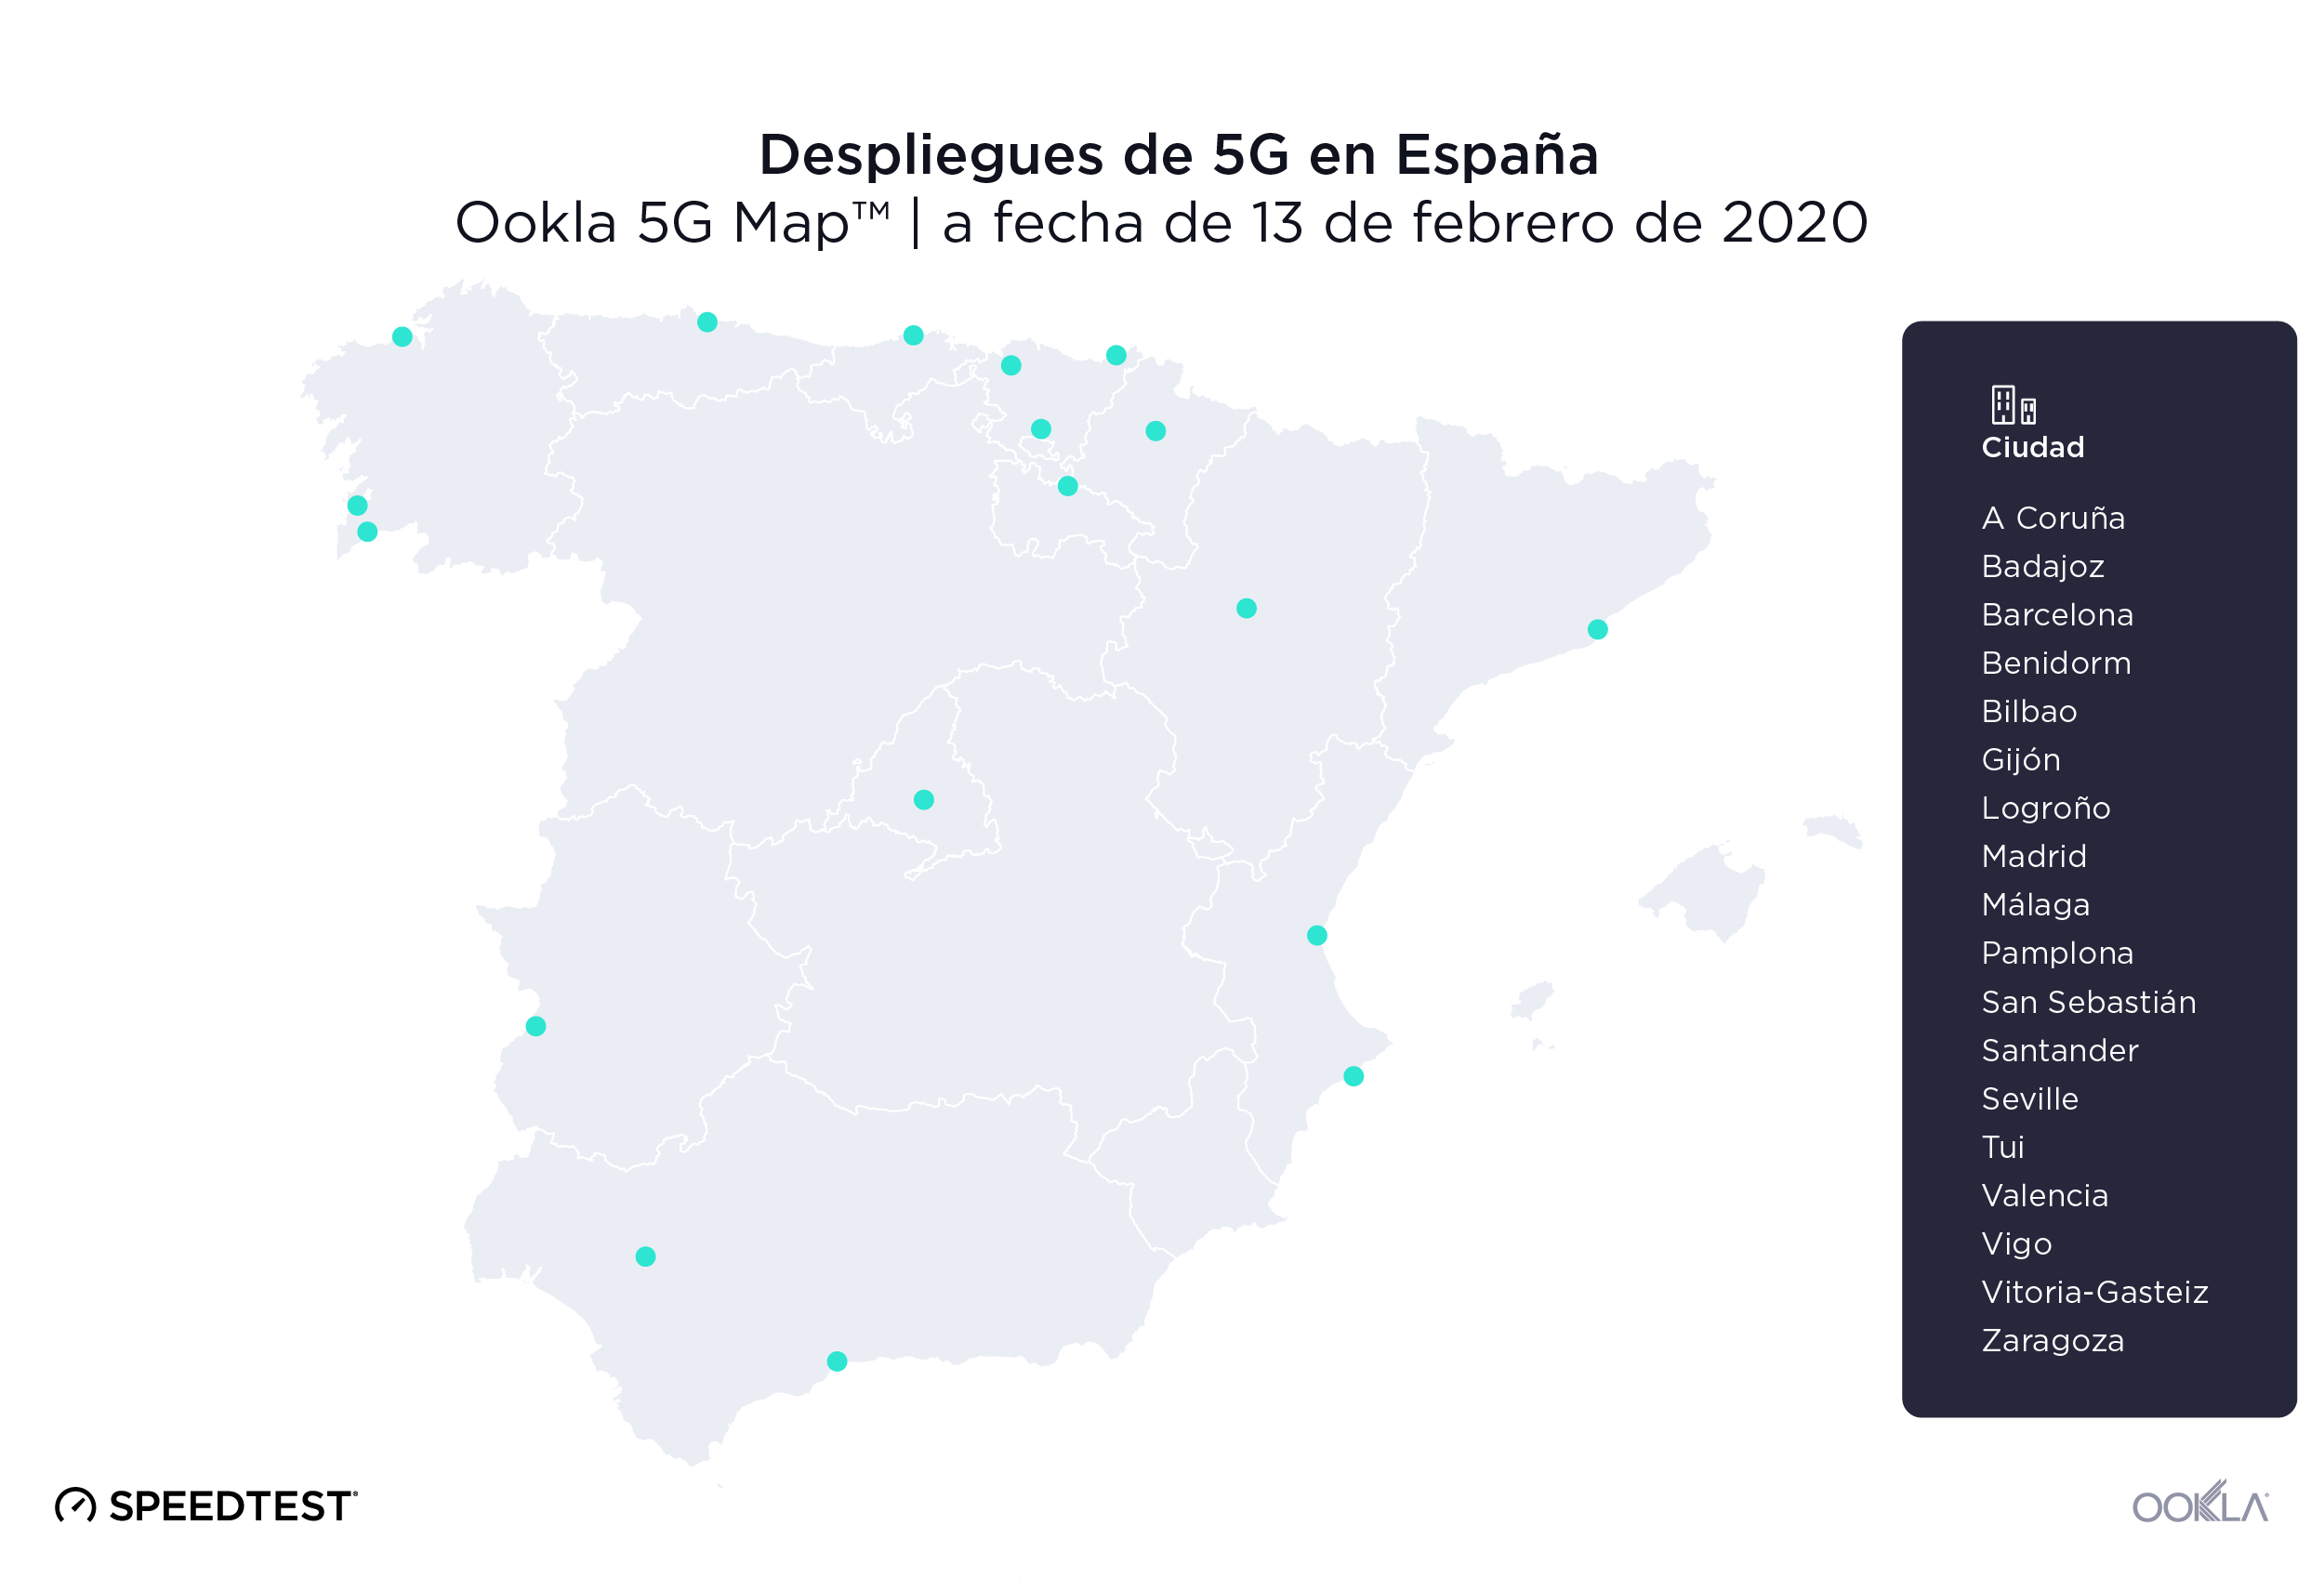
El entusiasmo por el 5G es evidente en España. Vodafone desplegó 5G comercialmente disponible en un total de 18 ciudades españolas a fecha del 13 de febrero de 2020, incluidas Barcelona, Madrid, Valencia, Málaga y Bilbao. Los datos de Speedtest revelan que en España la velocidad media de descarga en 5G en el segundo semestre de 2019 fue de 350,68 Mbps (velocidad superior a la media nacional para Internet móvil) y la velocidad de subida media por 5G fue de 31,82 Mbps. La latencia media por 5G en España fue de 27 ms en el segundo semestre de 2019.

MÁSMÓVIL fue el proveedor de banda ancha fija más rápido de España

Al utilizar Speed Score™, sistema que combina mediciones de velocidades de descarga y de subida, para comparar los principales proveedores de servicios de Internet de España en el segundo semestre de 2019, descubrimos que MÁSMÓVIL obtuvo los mejores resultados, con una puntuación de 133,75 en banda ancha fija. Orange ocupó el segundo lugar con 115,25, seguido de Vodafone (105,07) y Movistar (103,01).

Rendimiento de la banda ancha fija en España por proveedor
Speedtest Intelligence® | Segundo semestre de 2019
Proveedor Speed ScoreTM
MÁSMÓVIL 133,75
Orange 115,25
Vodafone 105,07
Movistar 103,01

Movistar fue el operador móvil más rápido de España

Movistar obtuvo la máxima puntuación de velocidad de entre los operadores móviles de España en el segundo semestre de 2019, con 37,76. Orange fue segundo con 33,02, Vodafone la tercera con 26,34 y Yoigo cuarta con 22,43. Como veremos más adelante, el rendimiento general de la velocidad puede verse afectado por los límites de velocidad y los planes de tarifas vigentes en España.

Rendimiento de Internet móvil en España por operador
Speedtest Intelligence® | Segundo semestre de 2019
Proveedor Speed ScoreTM
Movistar 37,76
Orange 33,02
Vodafone 26,34
Yoigo 22,43

La limitación de velocidad afecta al rendimiento general

La limitación de la velocidad, una restricción de servicio impuesta a una conexión de Internet por los operadores, permite a estos ofrecer también planes que se centren en la asequibilidad más que en el rendimiento máximo.
Ookla_Distribution-Speedtest-Results_Vodafone_Spain_0220-3_es
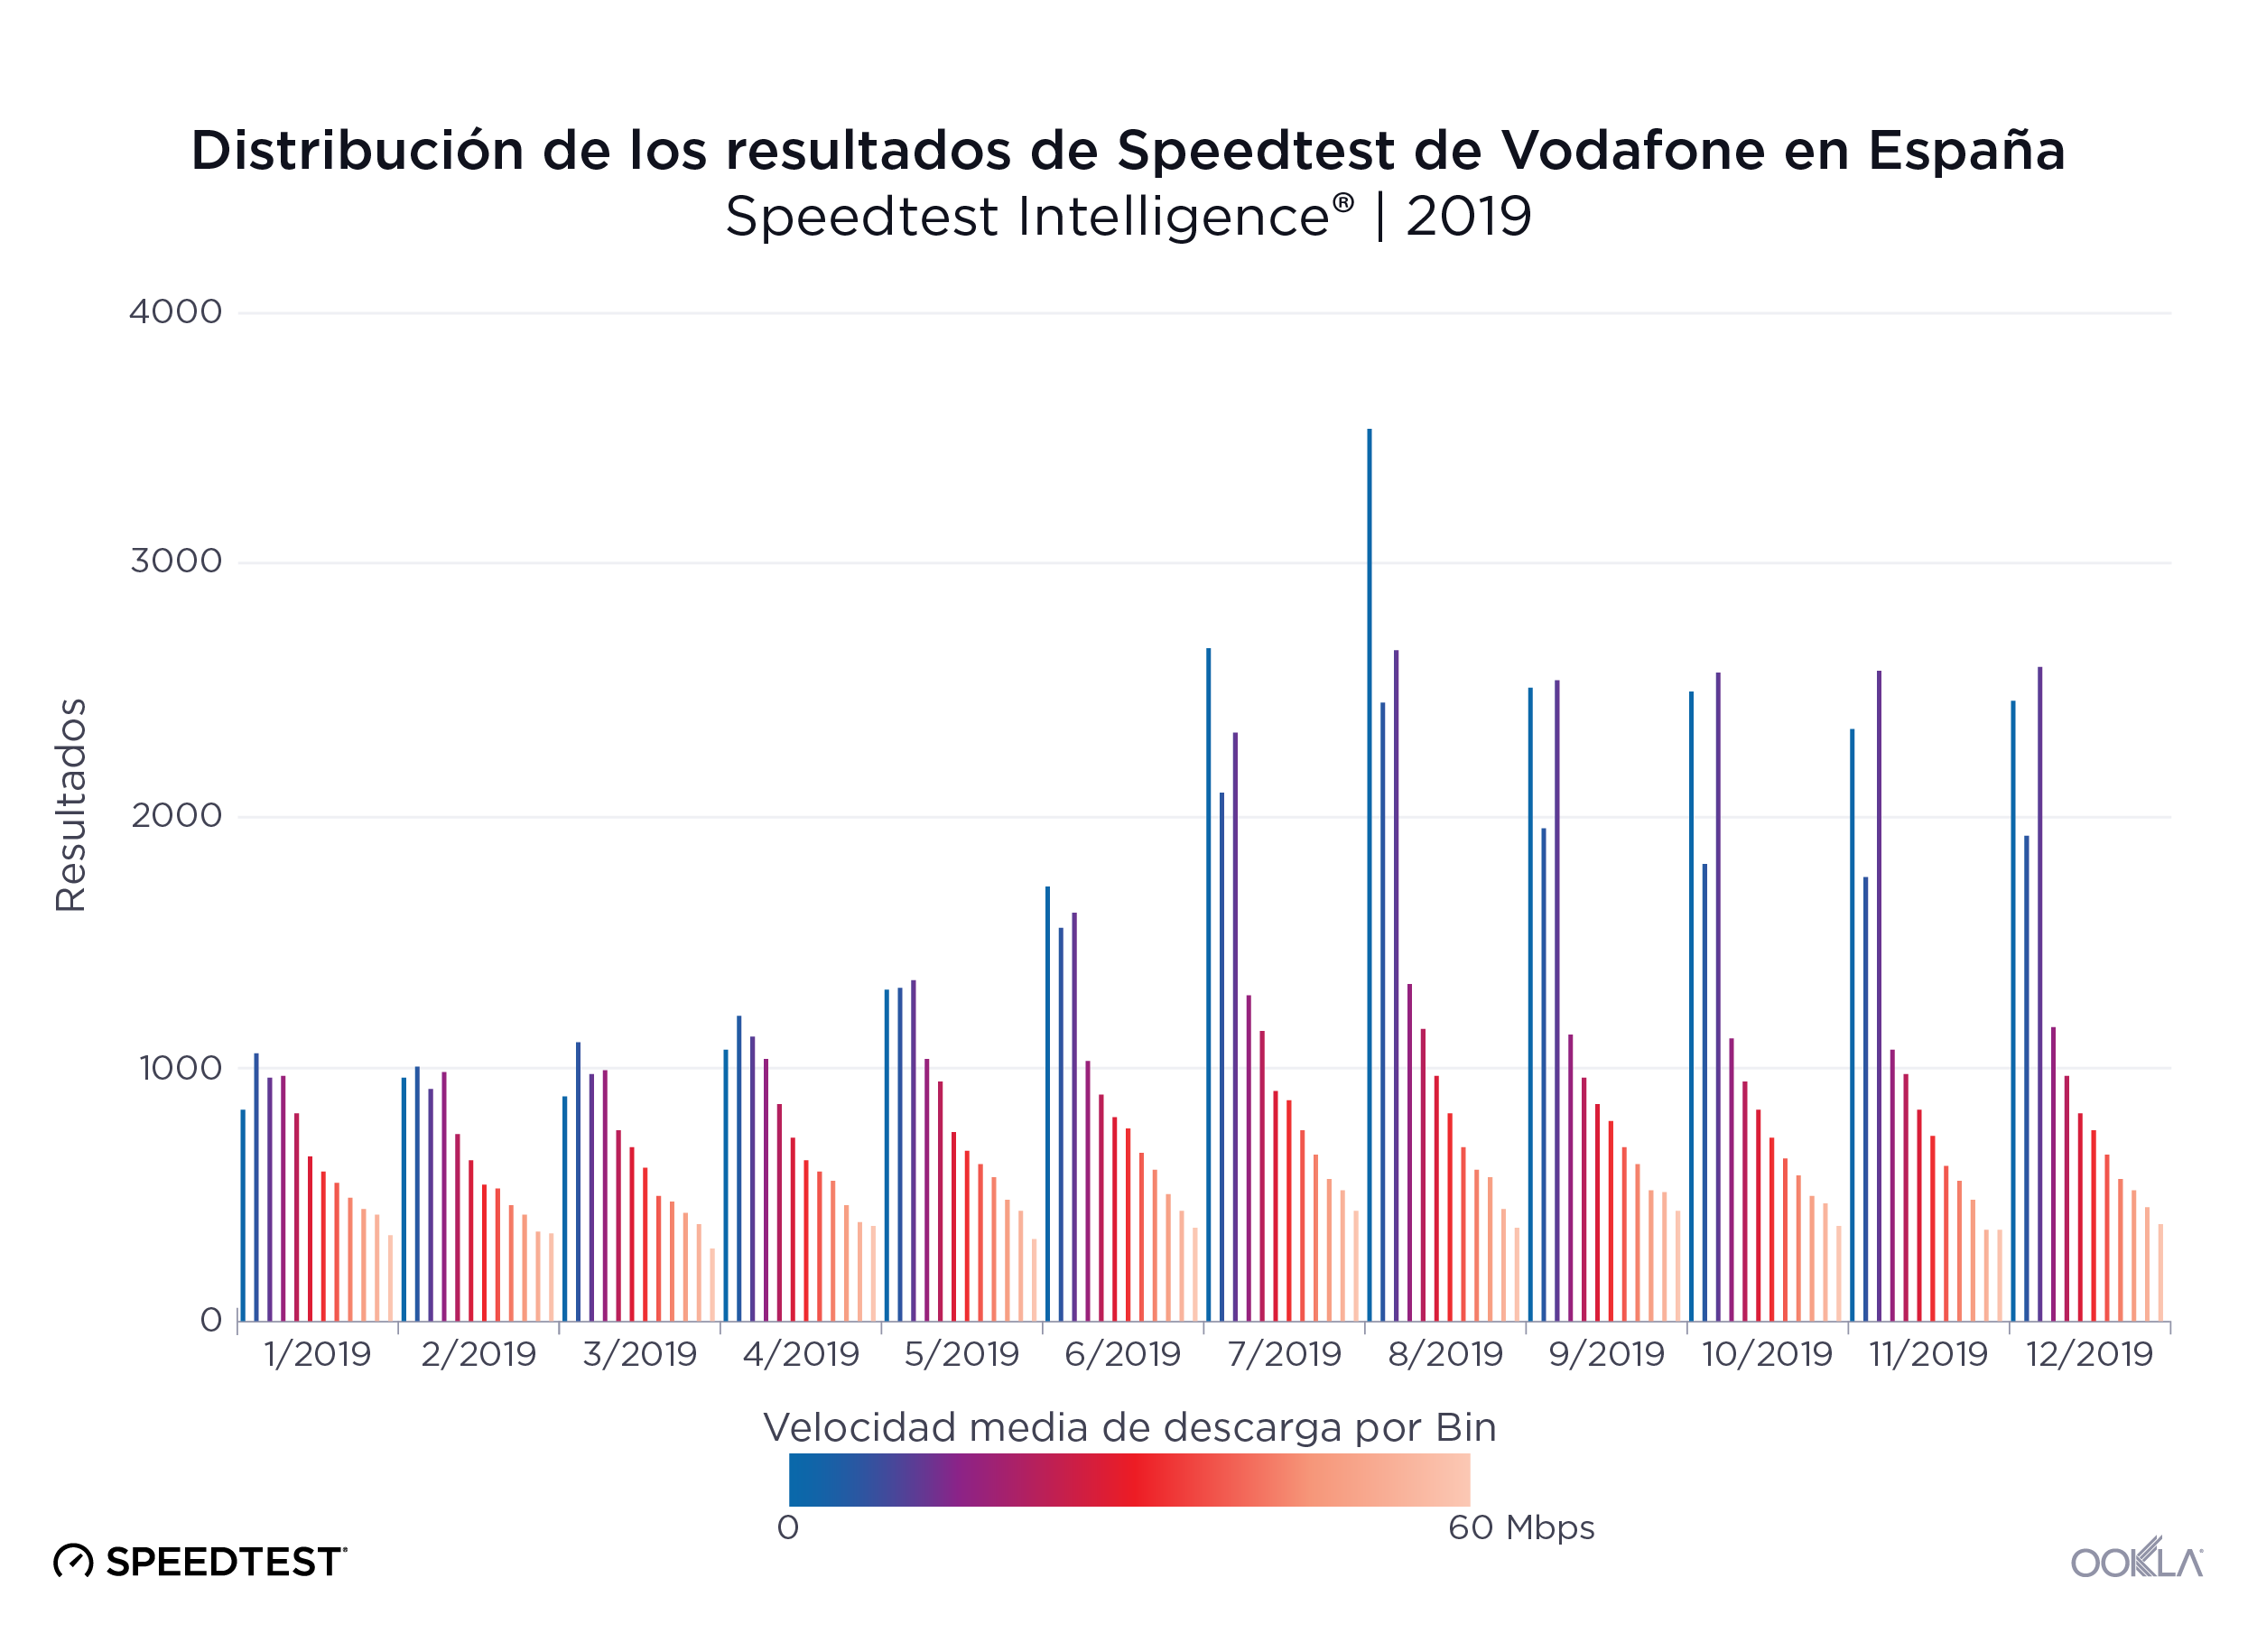
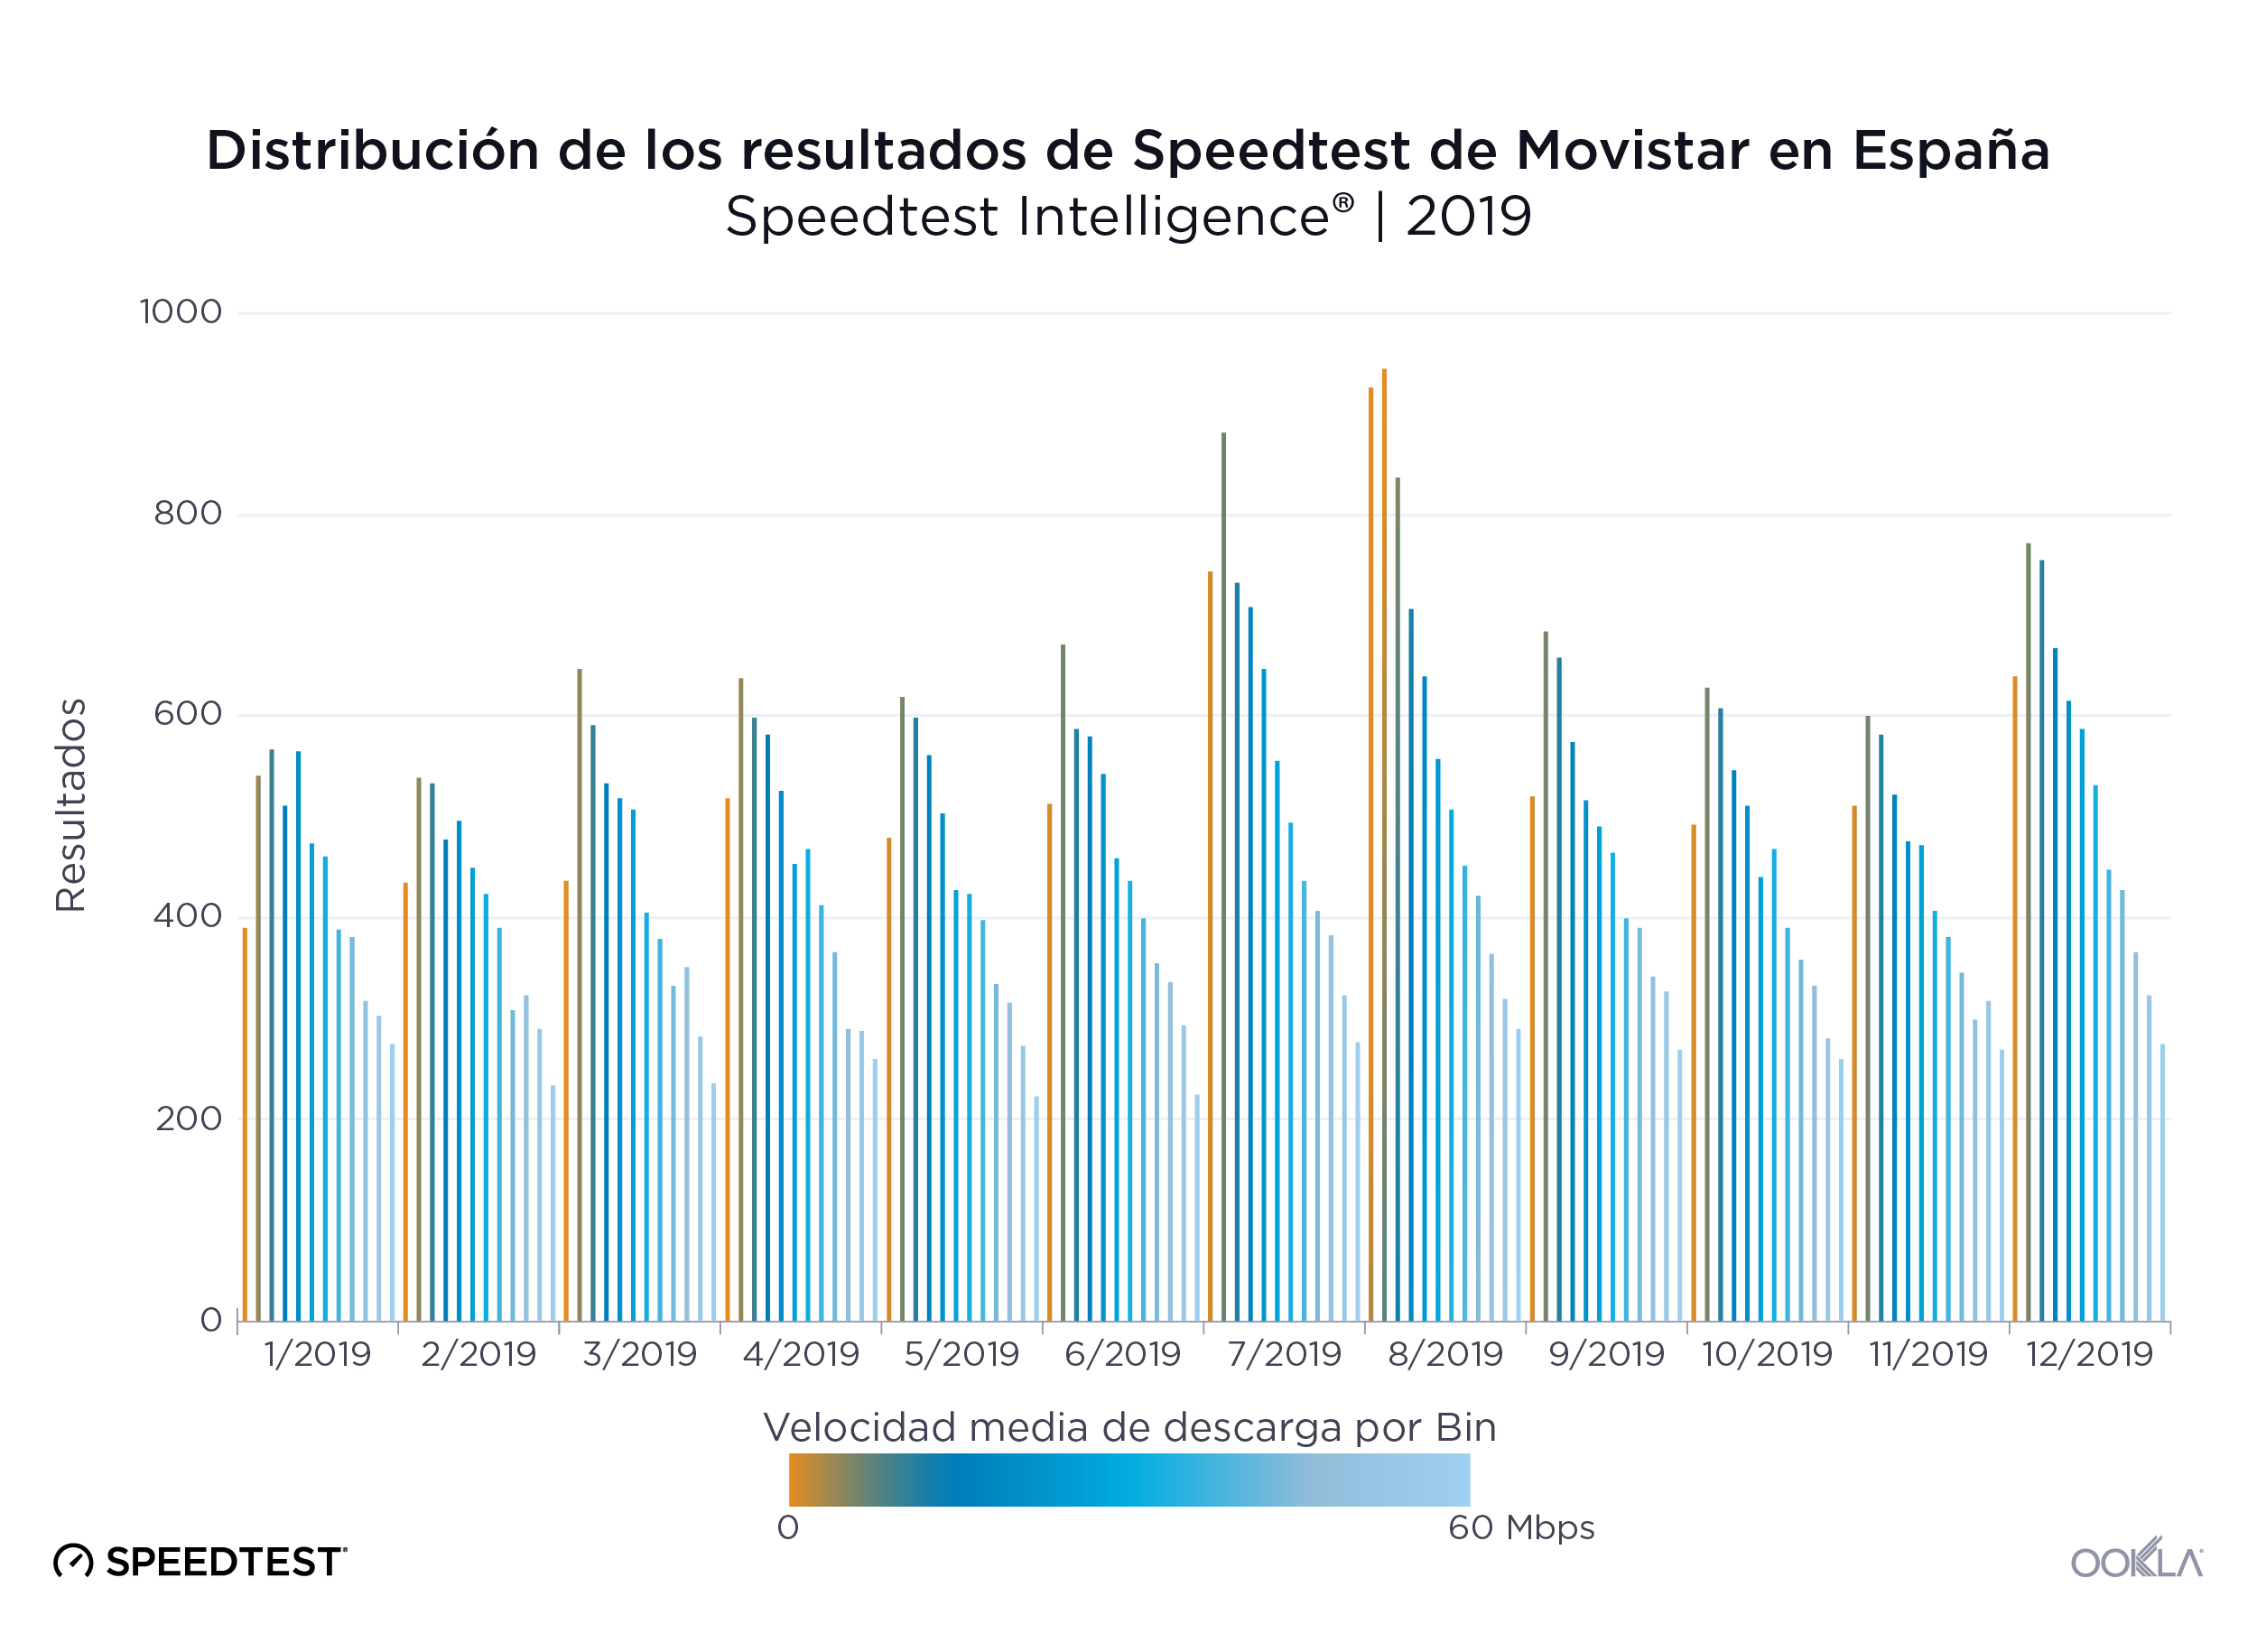
En el gráfico anterior se muestra cómo los planes de suscripción con limitación de velocidad introducidos por Vodafone afectaron a la distribución de las velocidades de descarga. Aunque esos planes (con limitaciones de 2 Mbps y 10 Mbps, respectivamente) estaban disponibles desde abril, no vemos un efecto verdadero en las velocidades medias hasta mayo y junio cuando las medidas de 0-5 Mbps y 10-15 Mbps empiezan a sobresalir.

En cambio, en el resto de operadores móviles de España vemos distribuciones más uniformes de las velocidades de descarga.
Ookla_Distribution-Speedtest-Results_Movistar_Spain_0220-3_es
Ookla_Distribution-Speedtest-Results_Orange_Spain_0220-3_es
Ookla_Distribution-Speedtest-Results_Yoigo_Spain_0220-3_es

MÁSMÓVIL y Movistar (móvil) ofrecen las velocidades más constantes

La velocidad es importante, pero si no es constante, resulta difícil que los usuarios utilicen sus dispositivos con fiabilidad para transmitir vídeo de alta definición, navegar por la web o jugar en línea. Utilizamos los datos de Speedtest para calcular la PRA (puntuación de rendimiento aceptable) de cada uno de los principales proveedores de España durante el segundo semestre de 2019.

La PRA de banda ancha fija mide el porcentaje de muestras que igualan o superan una velocidad de descarga de 25 Mbps y que también igualan o superan una velocidad de subida de 3 Mbps. MÁSMÓVIL proporcionó el mayor nivel de constancia de España en banda ancha fija en el segundo semestre de 2019 con una PRA de 81,6 %. Movistar quedó en último lugar con una PRA del 61,9 %.

Constancia de velocidad por proveedor en banda ancha fija
Speedtest Intelligence® | Segundo semestre de 2019
Proveedor PRA
MÁSMÓVIL 81,6 %
Orange 75,1 %
Vodafone 73,5 %
Movistar 61,9 %

La PRA de Internet móvil mide el porcentaje de muestras que igualan o superan una velocidad de descarga de 5 Mbps y que también igualan o superan una velocidad de subida de 1 Mbps. Movistar ocupó el primer lugar en constancia de banda ancha móvil con una PRA del 88,9 %, Vodafone obtuvo la puntuación más baja en constancia con una PRA del 79,8 %.

Constancia de velocidad por operador en Internet móvil
Speedtest Intelligence® | Segundo semestre de 2019
Proveedor PRA
Movistar 88,9 %
Orange 84,3 %
Yoigo 82,6 %
Vodafone 79,8 %

Madrid lideró las velocidades de banda ancha fija y móvil
Ookla_Fixed-Broadband-Speeds_Spain_0220_es-2
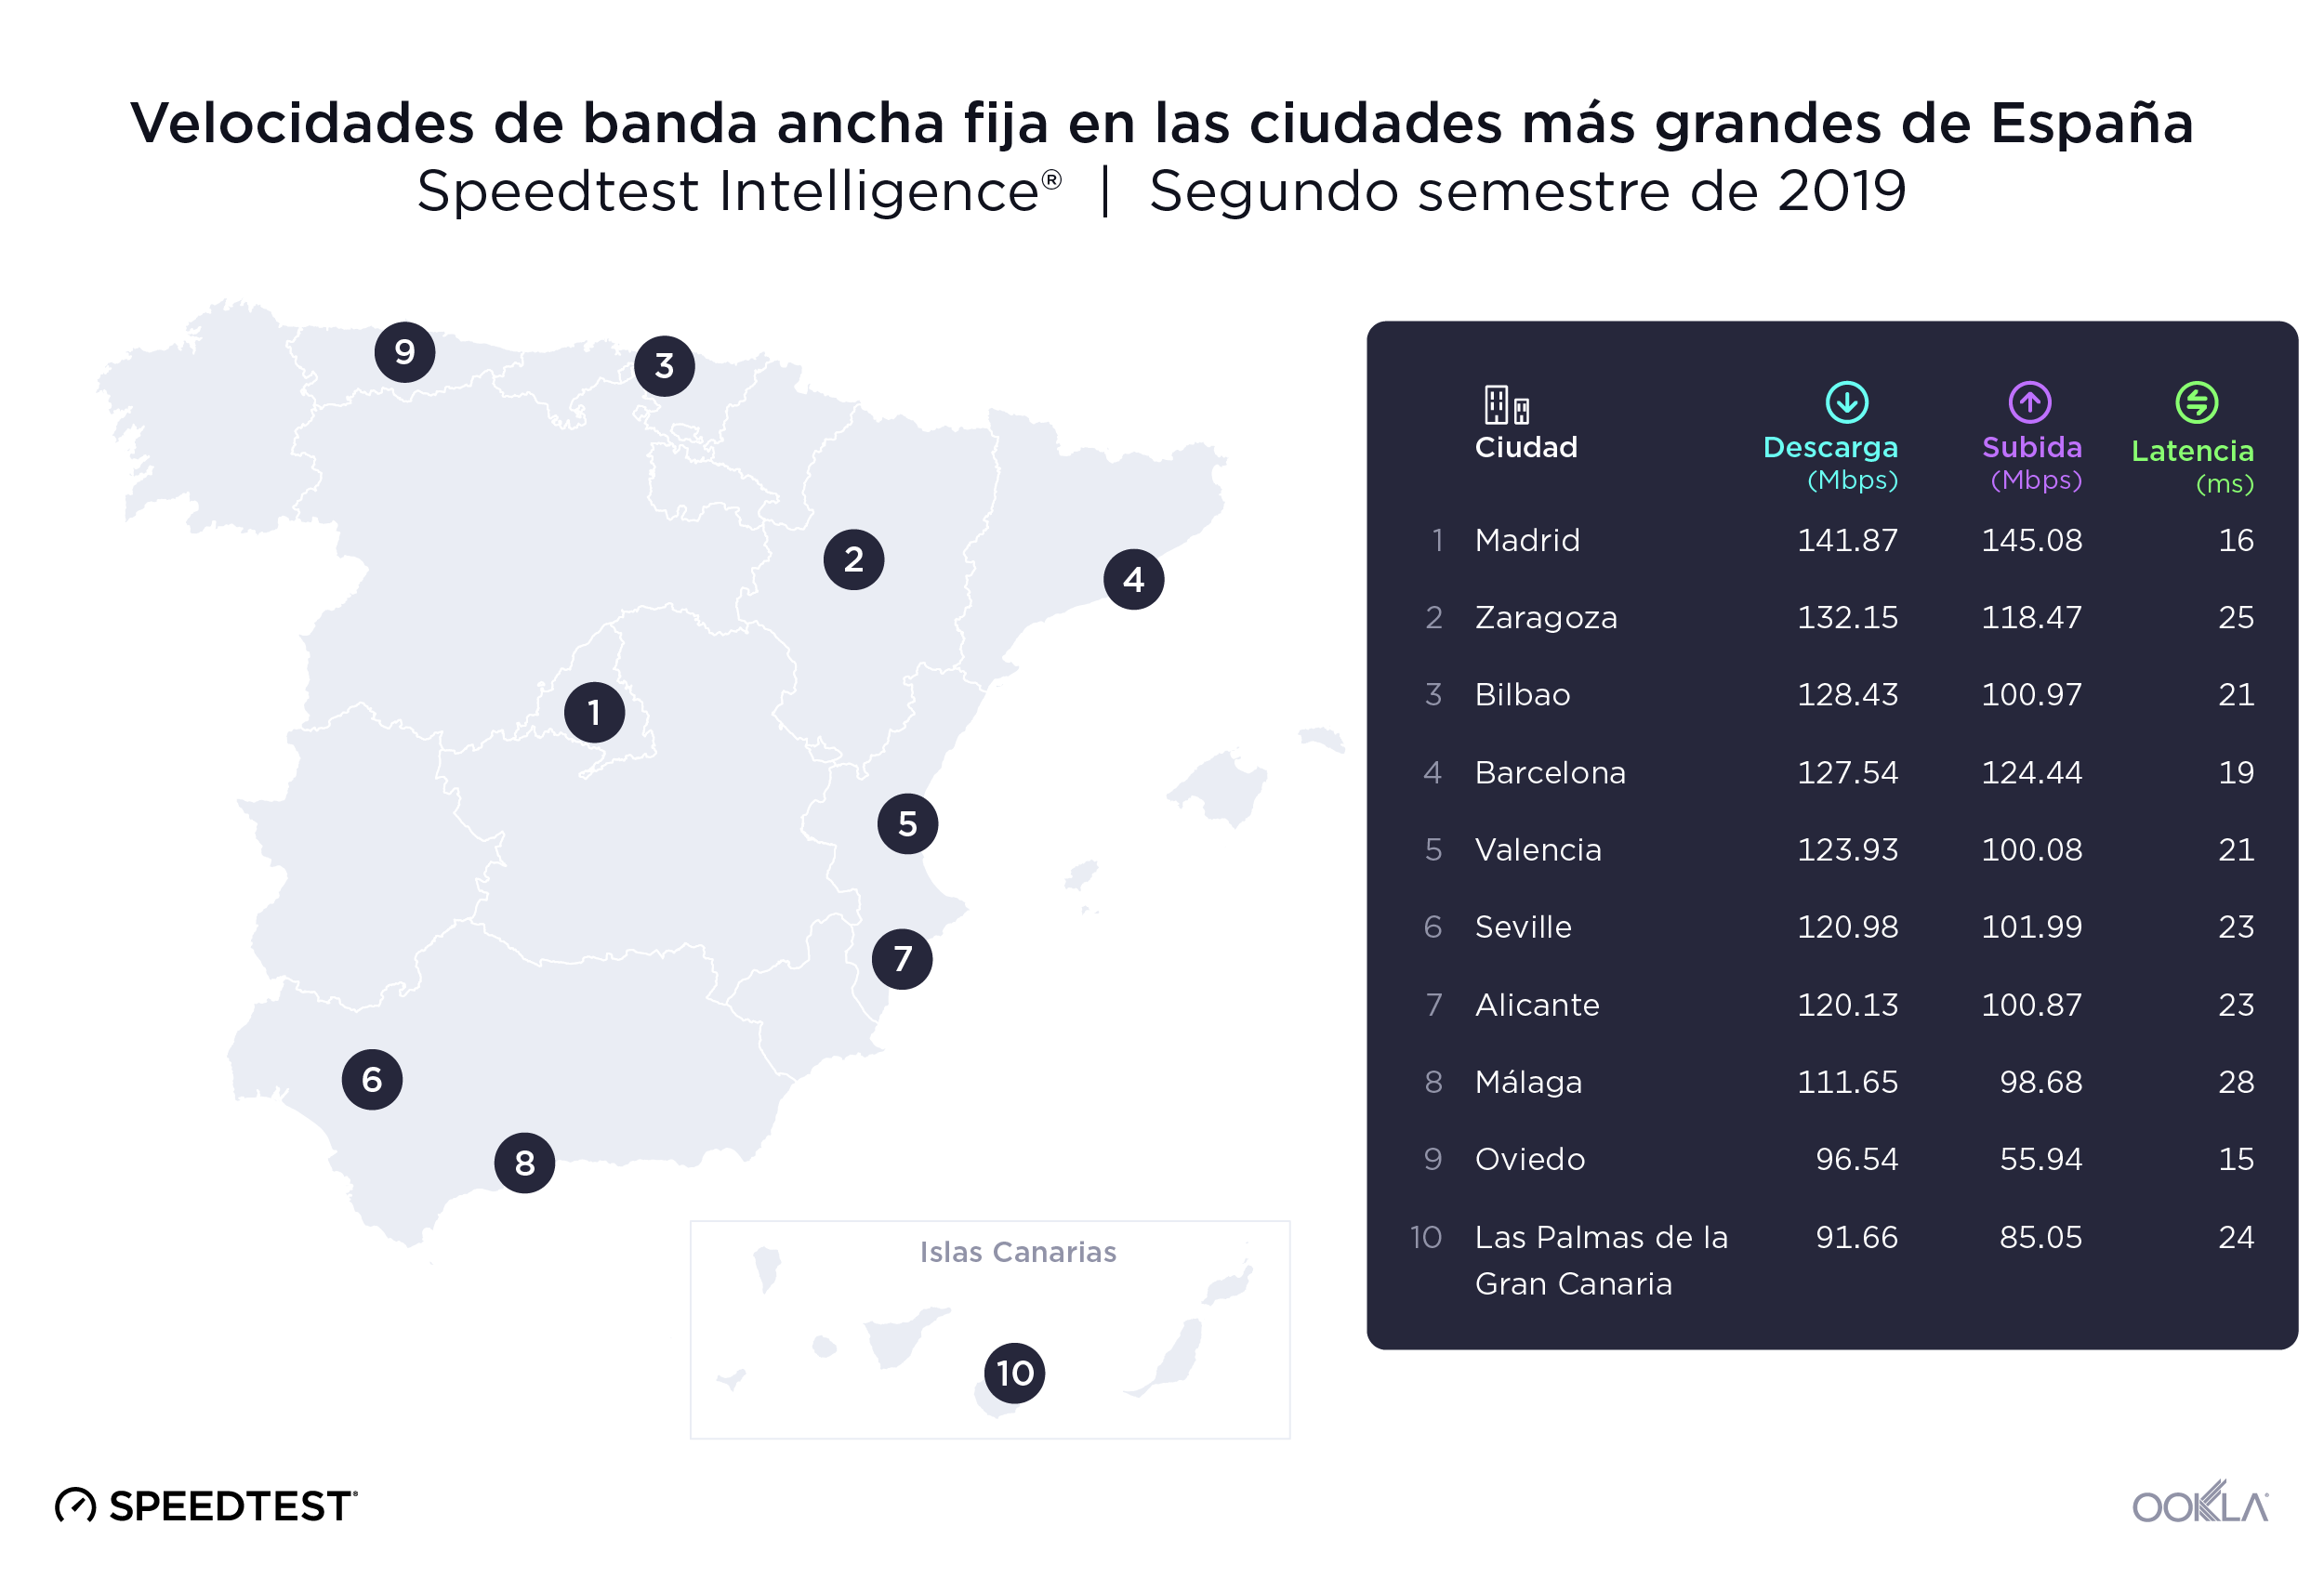
Para estudiar las velocidades de Internet de las diez ciudades más pobladas de España en el segundo semestre de 2019 utilizamos los datos de Speedtest de 2.183.336 pruebas realizadas por los usuarios. Madrid registró las velocidades medias de descarga más altas tanto en banda ancha fija como en Internet móvil.

Las velocidades medias de descarga por banda ancha fija oscilaron entre los 141,87 Mbps de Madrid y los 91,66 Mbps de Las Palmas de la Gran Canaria, una diferencia del 35,4 %. Madrid registró también la velocidad de subida media más alta por banda ancha fija, con 145,08 Mbps. Oviedo ocupó el último lugar en velocidad de subida por banda ancha fija con un 61,4 % menos de velocidad de subida que Madrid.

Oviedo tuvo la menor latencia en banda ancha fija de las ciudades de nuestra lista durante el segundo semestre de 2019, con 15 ms. Málaga registró la latencia más alta, con 28 ms.
Ookla_Mobile-Broadband-Speeds_Spain_0220_es-1
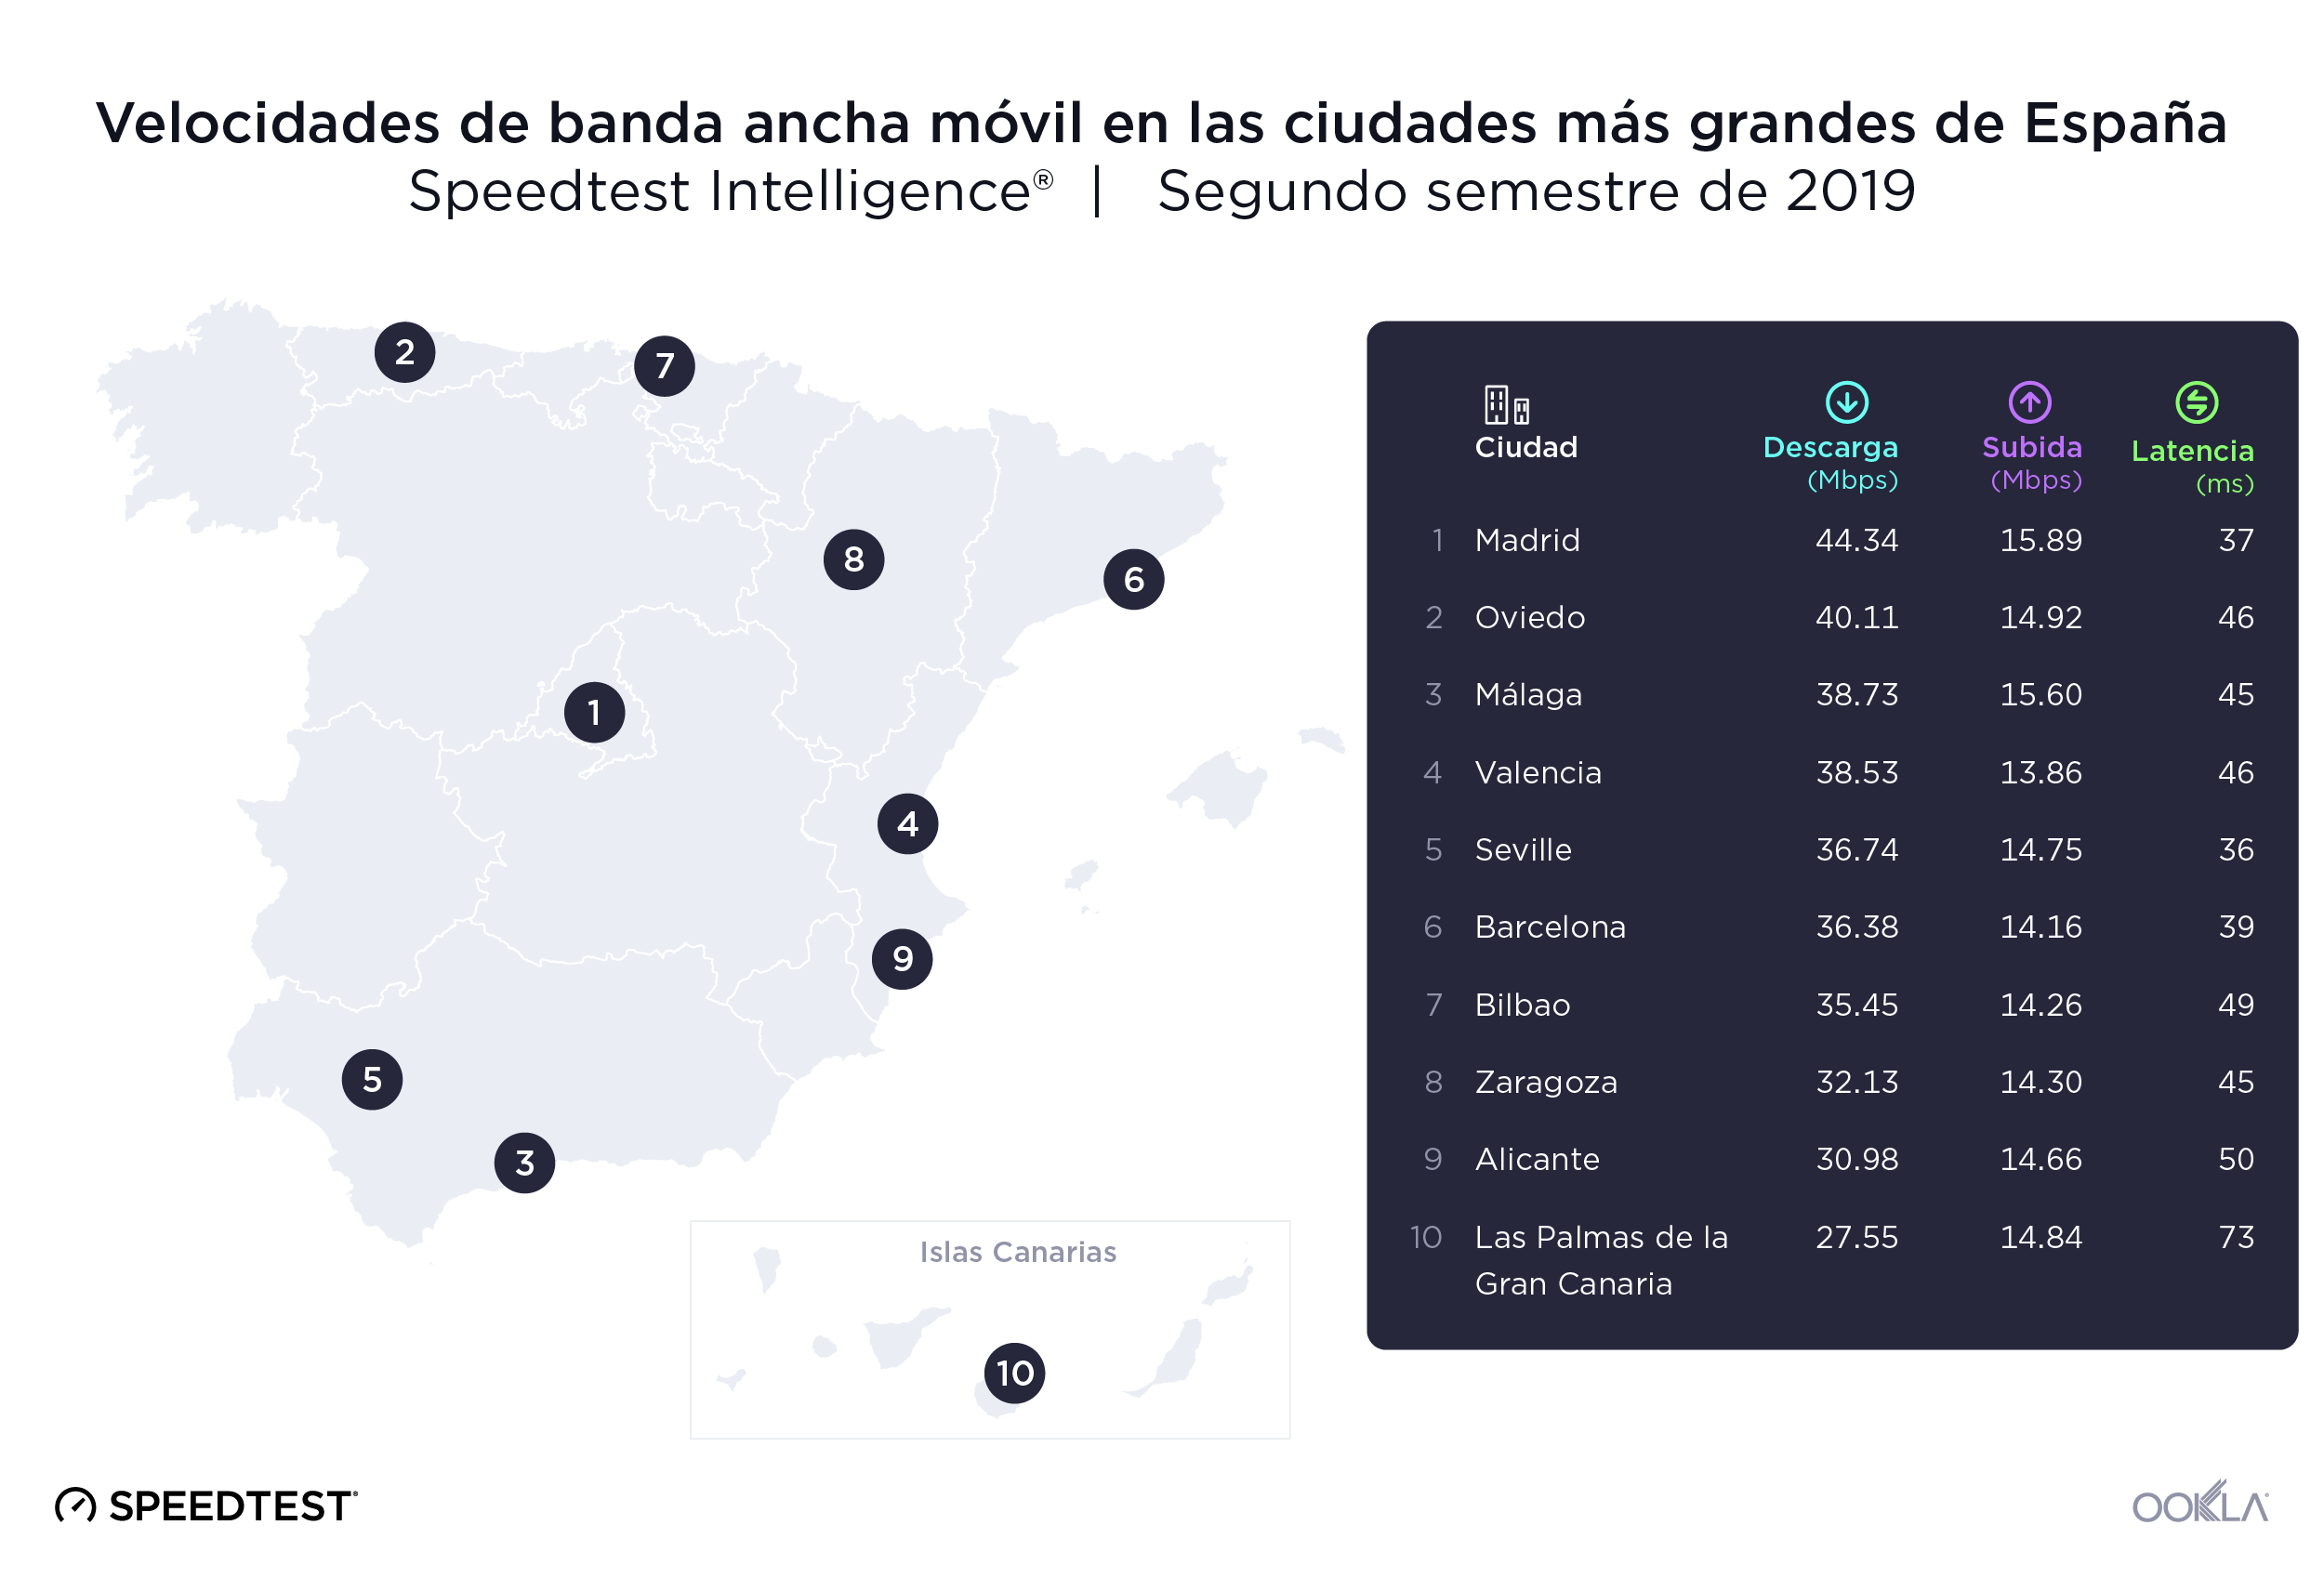
La brecha entre las velocidades más rápidas y más lentas de las ciudades españolas por banda ancha móvil fue similar a la que apreciamos en la banda ancha fija en el segundo semestre de 2019. Madrid volvió a liderar el rendimiento de la banda ancha móvil con una velocidad media de descarga de 44,35 Mbps y una velocidad media de subida de 15,89 Mbps. Las Palmas quedó en último lugar en velocidades de descarga con un 37,9 % menos de velocidad media de descarga que Madrid. Valencia registró la velocidad de subida media más baja por Internet móvil: 13,86 Mbps. Sevilla obtuvo la menor latencia por Internet móvil con 36 ms en el segundo semestre de 2019 y Las Palmas registró la mayor latencia por Internet móvil con 73 ms.

Zaragoza lideró la disponibilidad de 4G en las ciudades españolas más pobladas

Disponibilidad de 4G en las ciudades más grandes de España
Speedtest Intelligence® | Segundo semestre de 2019
Ciudad Disponibilidad de 4G
Zaragoza 97,2 %
Valencia 97,1 %
Sevilla 96,8 %
Málaga 96,7 %
Oviedo 95,4 %
Madrid 95,1 %
Las Palmas de la Gran Canaria 95,0 %
Alicante 94,6 %
Bilbao 94,3 %
Barcelona 87,7 %

La disponibilidad de 4G en las ciudades más grandes de España superó el promedio del país, siendo Zaragoza la de mayor disponibilidad de 4G con el 97,2 % de las ubicaciones analizadas. Barcelona tuvo la menor disponibilidad de 4G de nuestra lista, con el 87,7 %.

MÁSMÓVIL fue el proveedor de banda ancha fija más rápido de 6 ciudades

Si nos fijamos específicamente en la puntuación de velocidad en cada una de las ciudades españolas en el segundo semestre de 2019, vemos que MÁSMÓVIL fue el proveedor más rápido en seis ciudades: Málaga, Sevilla, Zaragoza, Madrid, Valencia y Alicante. Adamo, el proveedor fijo más rápido de Barcelona, consiguió la puntuación de velocidad más alta de la lista con 185,29. Vodafone fue el proveedor más rápido en Bilbao y Oviedo.

Rendimiento de la banda ancha fija por operador en las ciudades más grandes de España
Speedtest Intelligence® | Segundo semestre de 2019
Ciudad Proveedor Speed ScoreTM
Barcelona Adamo 185,29
Málaga MÁSMÓVIL 156,24
Sevilla MÁSMÓVIL 148,78
Madrid MÁSMÓVIL 145,83
Bilbao Vodafone 144,65
Zaragoza MÁSMÓVIL 144,40
Valencia MÁSMÓVIL 143,99
Oviedo Vodafone 143,85
Alicante MÁSMÓVIL 143,72
Las Palmas Orange 114,46

Si nos fijamos en los proveedores españoles más rápidos en banda ancha móvil de cada ciudad en el segundo semestre de 2019, Movistar dominó la lista con la puntuación de velocidad más alta en 7 ciudades. Movistar consiguió también la puntuación de velocidad máxima, con 52,04 en Sevilla. Vodafone fue el proveedor de Internet móvil más rápido en Madrid (35,67). Orange fue el proveedor más rápido de Barcelona (35,37) y Oviedo (45,10).

Rendimiento de Internet móvil por operador en las ciudades más grandes de España
Speedtest Intelligence® | Segundo semestre de 2019
Ciudad Proveedor Speed ScoreTM
Sevilla Movistar 52,04
Valencia Movistar 50,80
Alicante Movistar 50,36
Málaga Movistar 48,97
Bilbao Movistar 48,86
Oviedo Orange 45,10
Zaragoza Movistar 40,79
Madrid Vodafone 35,67
Barcelona Orange 35,37
Las Palmas Movistar 31,37

Nos encantará seguir la evolución de estos mercados y estudiar el cambiante panorama del rendimiento de Internet y de la cobertura móvil en Europa. Si desea obtener más información sobre las velocidades fijas y móviles en diferentes mercados, haga clic aquí para leer más información de Ookla.

Nota del editor: Este artículo fue actualizado el 4 de marzo del 2020 que para corregir un error de edición que reportaba cifras incorrectas del PRA móvil.

Ookla retains ownership of this article including all of the intellectual property rights, data, content graphs and analysis. This article may not be quoted, reproduced, distributed or published for any commercial purpose without prior consent. Members of the press and others using the findings in this article for non-commercial purposes are welcome to publicly share and link to report information with attribution to Ookla.

| March 31, 2020

Exploring Internet Performance in Malaysia

Internet performance in Malaysia as a whole is similar to performance in other major Southeast Asian markets, but performance within Malaysia varies greatly at the state and city level. This article explores the current state of Malaysia’s fixed broadband and mobile network performance, including data on: internet speeds, latency and 4G Availability at the country level. We include information on how Malaysia compares to major Southeast Asian countries and examines performance variations across Malaysian states and cities during Q3-Q4 2019.

Malaysia’s fixed broadband ranks third in Southeast Asia

Ookla_Fixed_Speeds_Chart_Malaysia_0320
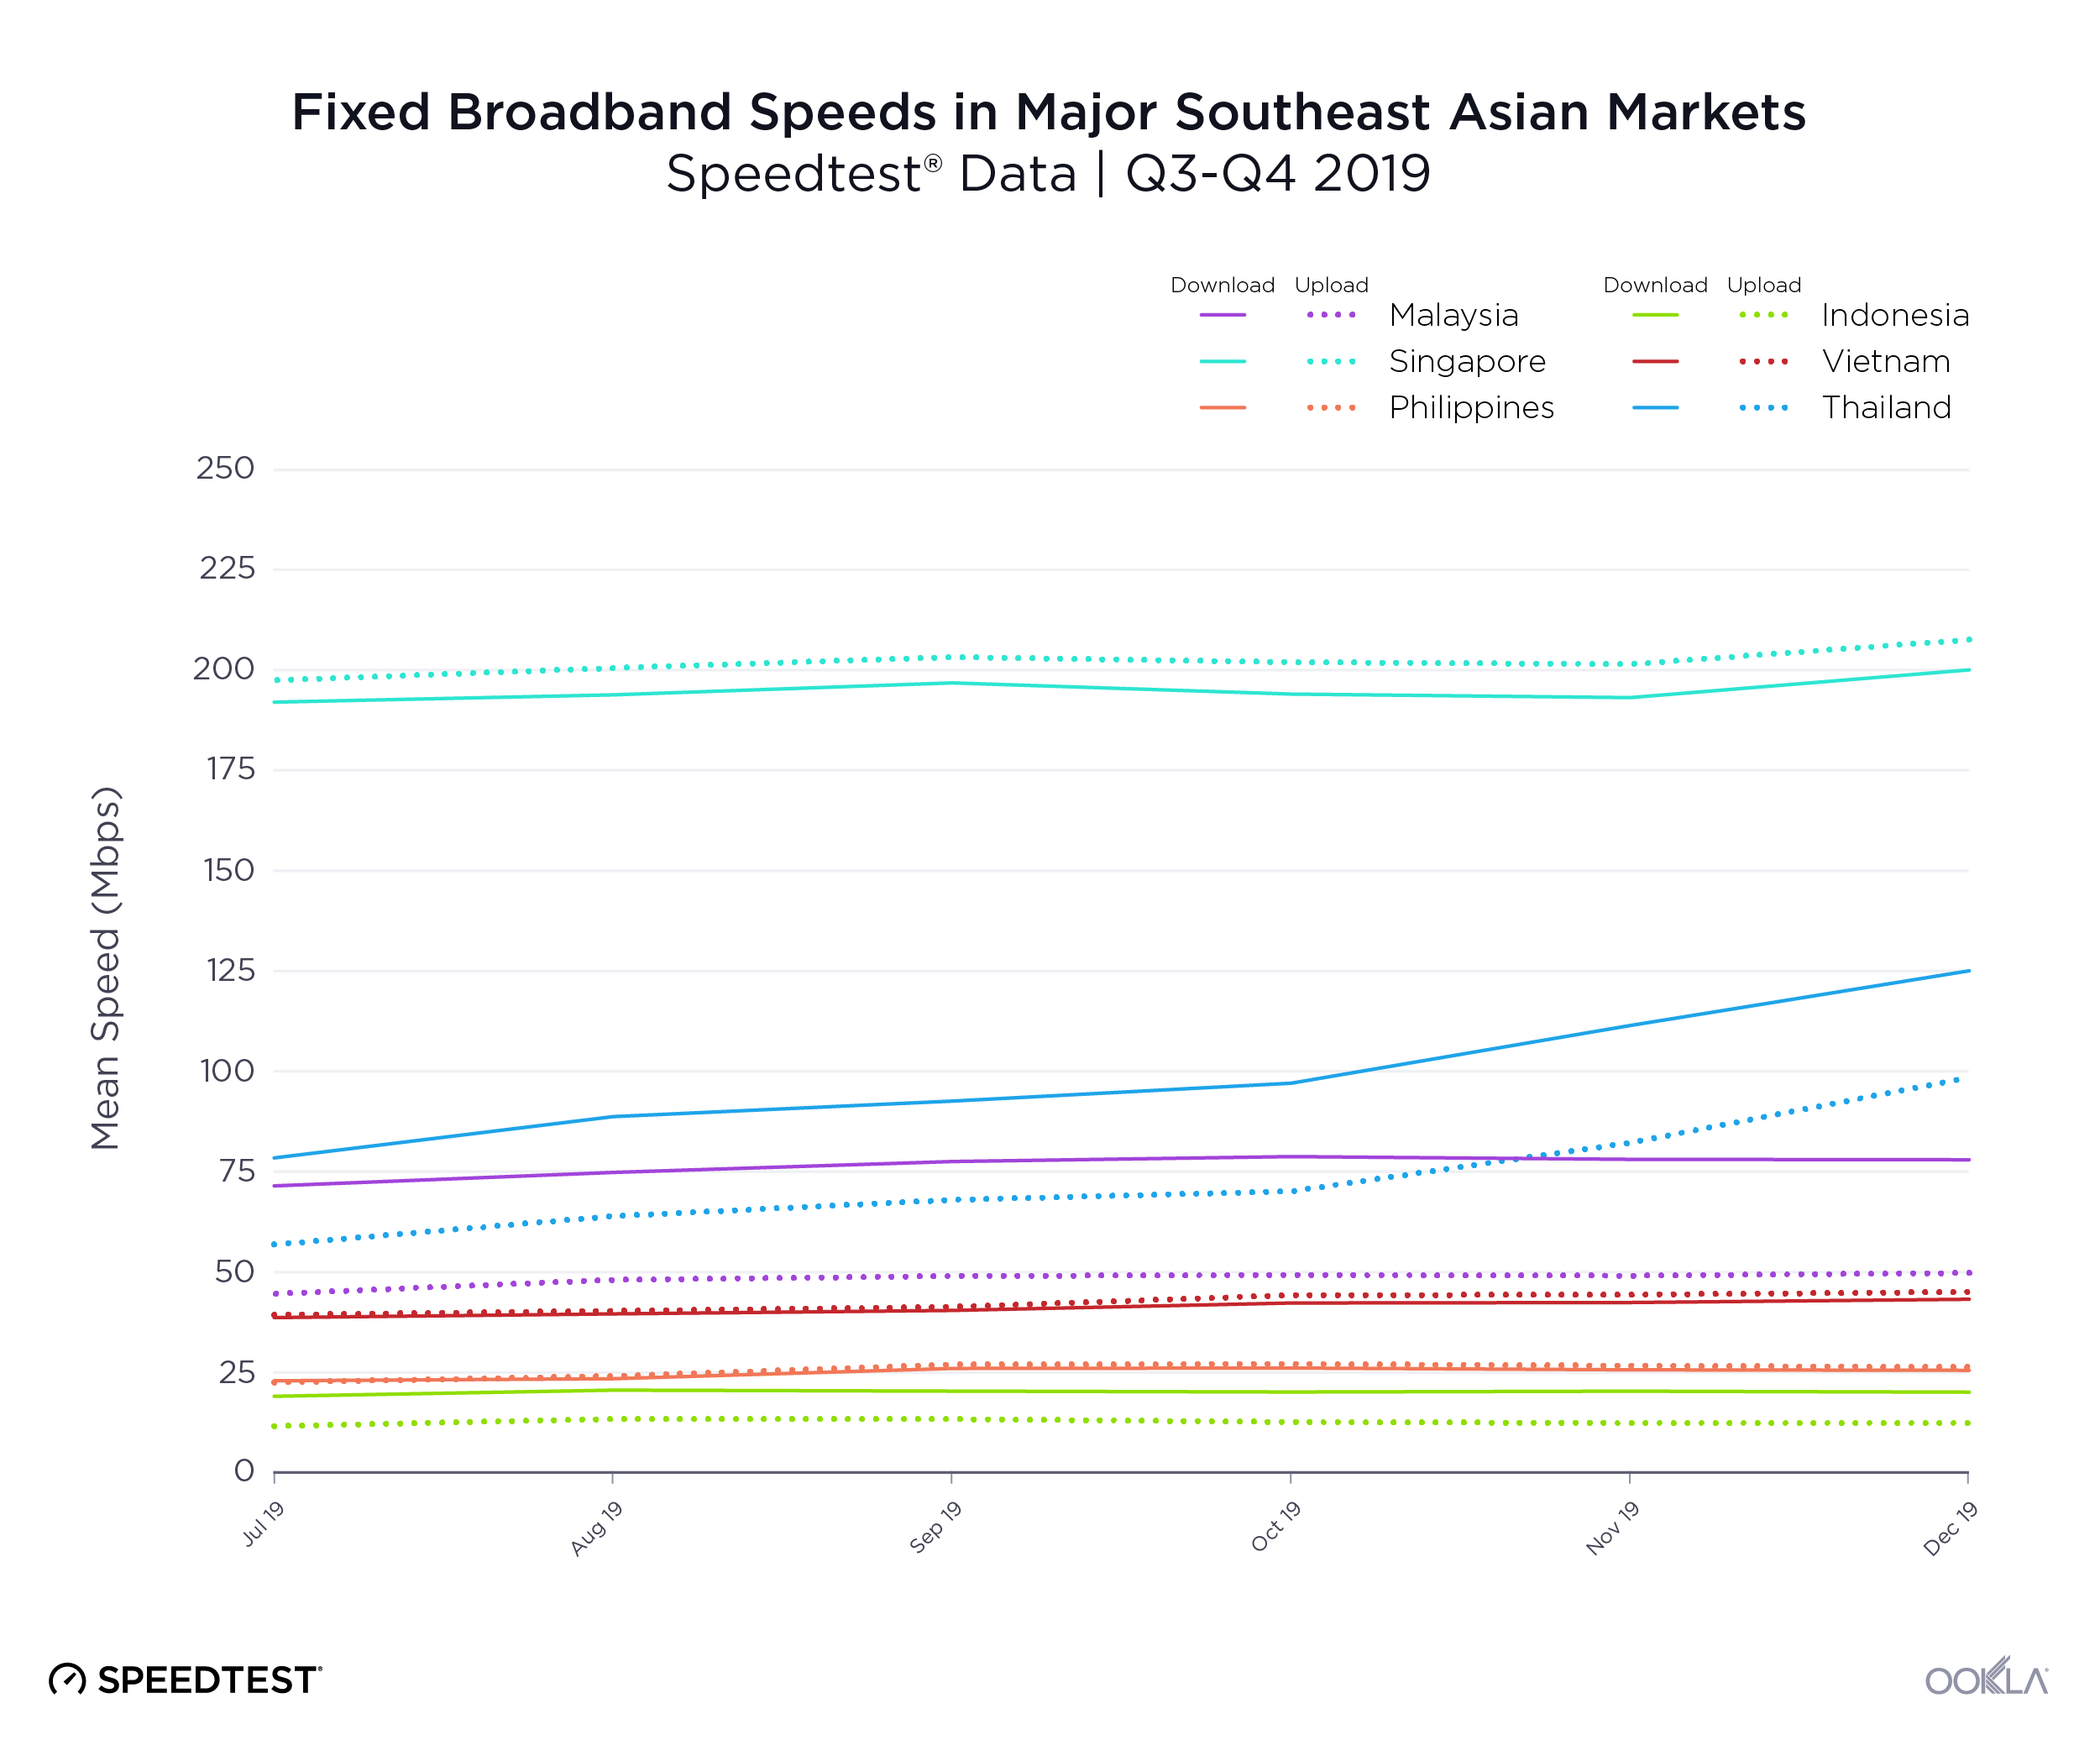
We compared Malaysia’s fixed broadband performance at the country level to other major markets in Southeast Asia during Q3-Q4 2019. Singapore ranked first on our list for both download and upload speeds over fixed broadband with a mean download speed of 191.89 Mbps and a mean upload speed of 199.32 Mbps. Malaysia ranked third for download speed with a mean speed of 76.69 Mbps. Indonesia had the slowest mean download and upload speeds over fixed broadband during this period. At 20.49 Mbps, Indonesia’s mean download speed was 836.6% slower than that of Singapore.

Thailand showed the highest increase in mean download speed over fixed broadband during Q3-Q4 2019 at 59.4%. Vietnam, the Philippines and Malaysia had more modest increases in mean download speed at 11.8%, 11.3% and 9.1%, respectively. Indonesia followed Malaysia with a 5.4% increase in mean download speed over fixed broadband. Singapore’s mean download speed increased only by 4.2% during this period.

Speedtest data for latency in major Southeast Asian markets during Q3-Q4 2019 revealed Vietnam had the lowest latency on the list at 9 ms. Singapore was second at 11 ms, Malaysia was in a less favourable fifth place with a latency of 24 ms, followed only by the Philippines with the highest latency on the list at 34 ms.

Malaysia ranks fourth in Southeast Asia for mobile broadband download speed

Ookla_Mobile_Speeds_Chart_Malaysia_0320
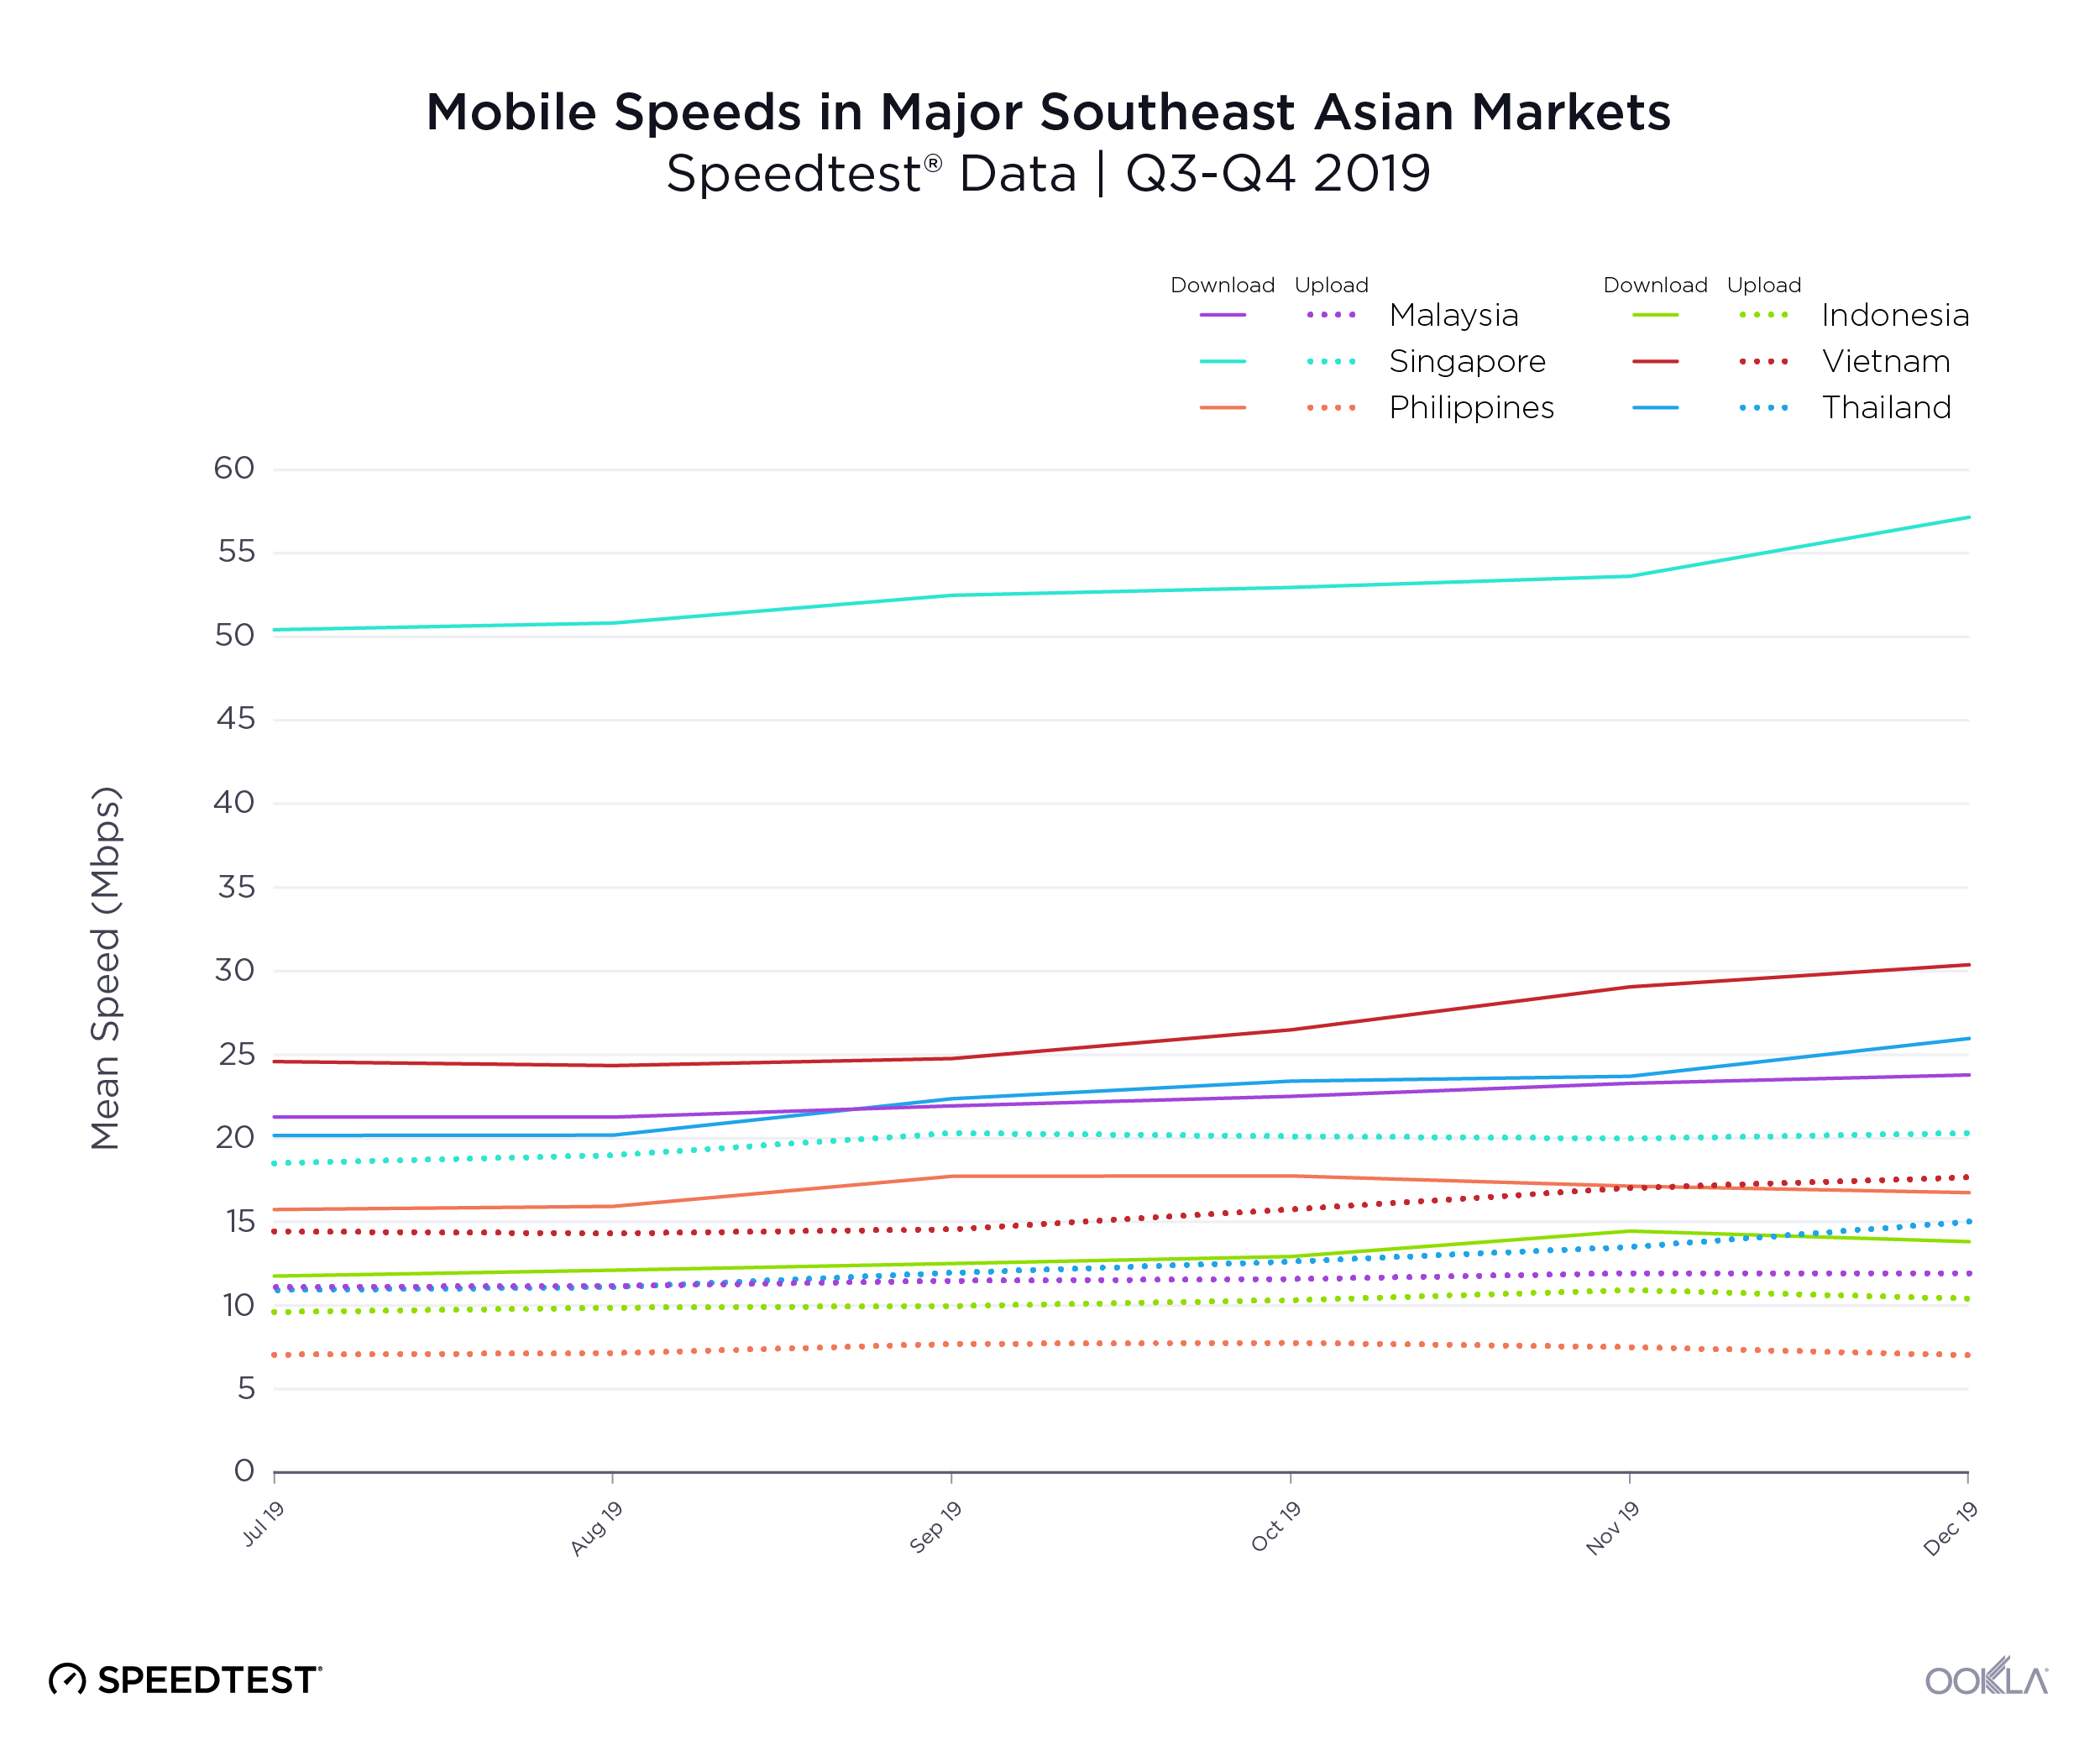
During Q3-Q4 2019, Singapore had the fastest mean download speed on mobile in major Southeast Asian markets at 52.28 Mbps, followed by Vietnam at 26.28 Mbps. Malaysia ranked fourth for mean download speed over mobile with 22.12 Mbps, while Indonesia was last with 12.65 Mbps.

Rankings for mean upload speed over mobile during Q3-Q4 2019 followed almost the same rankings as we saw for download speed with Singapore at the top of the list at 19.62 Mbps. Malaysia ranked fourth with a mean upload speed of 11.40 Mbps over mobile. In this category, the Philippines ranked last with a mean upload speed of 7.12 Mbps on mobile.

Thailand experienced the largest increase in mobile download speed during Q3-Q4 2019 at 28.7%. Vietnam followed closely with an increase of 23.5% in mean download speed. Malaysia was third with an increase of 11.8% in mean download speed on mobile broadband, only slightly better than the 6.4% increase in mean download speed in the Philippines.

Malaysia was second only to the Philippines for mobile latency during Q3-Q4 2019 at 29 ms. Thailand had the highest latency on this list at 52 ms.

How Malaysian mobile operators are preparing for 5G

Malaysian mobile operators spent the better half of 2019 conducting 5G field trials and signing multiple memorandums of understanding (MoUs) with infrastructure vendors in preparation for commercial deployments.

In February 2019, Maxis and Huawei signed an MoU under which the two companies agreed to collaborate on 5G field trials. By October, the two companies inked a deal ensuring a full-fledged deployment of 5G equipment and services, which also involves modernizing the existing LTE infrastructure supplied by Huawei.

Similarly, U Mobile and ZTE followed up with an MoU in March, but the operator signed a three-year contract with Nokia in which the vendor will supply Single RAN and transport infrastructure, paving the way towards commercial 5G rollouts.

According to the Malaysian Communications and Multimedia Commission (MCMC), 5G commercial rollouts are projected for Q3 2020 using spectrum allocations in the 700MHz, 3.5GHz and 26GHz-28GHz millimeter wave frequency bands.

In January 2020, numerous 5G related announcements were made by Malaysian operators. Telekom Malaysia and Digi Telecommunications announced a 5G demonstration project during which the two operators will be exploring both mobile and fixed 5G use cases. Under this project, Digi will operate Radio Access and Core network while leveraging fiber backhaul provided by Telekom Malaysia. The two operators also explored 5G network sharing possibilities. In parallel, Telekom Malaysia and U Mobile joined forces to explore network sharing opportunities both with shared and dedicated spectrum licenses. This will help the two operators better understand the economic and technological efficiencies associated with 5G network sharing.

We have been tracking the progress of 5G testing across Malaysia using Speedtest data and have seen multiple operators achieve download speeds over 1 Gbps, upload speeds over 100 Mbps and single-digit latency. Celcom and Maxis have successfully conducted 5G MOCN (Multi Operator Core Network) limited trials, reaching peak download speeds of over 1.1 Gbps. MOCN functionality allows two or more operators to use the same radio access network while maintaining individual network cores. During the same month, Telekom Malaysia successfully tested standalone 5G using aggregated 700MHz and 3.5GHz achieving a downlink throughput of 1.5 Gbps.

Selangor had the fastest fixed broadband in Malaysia

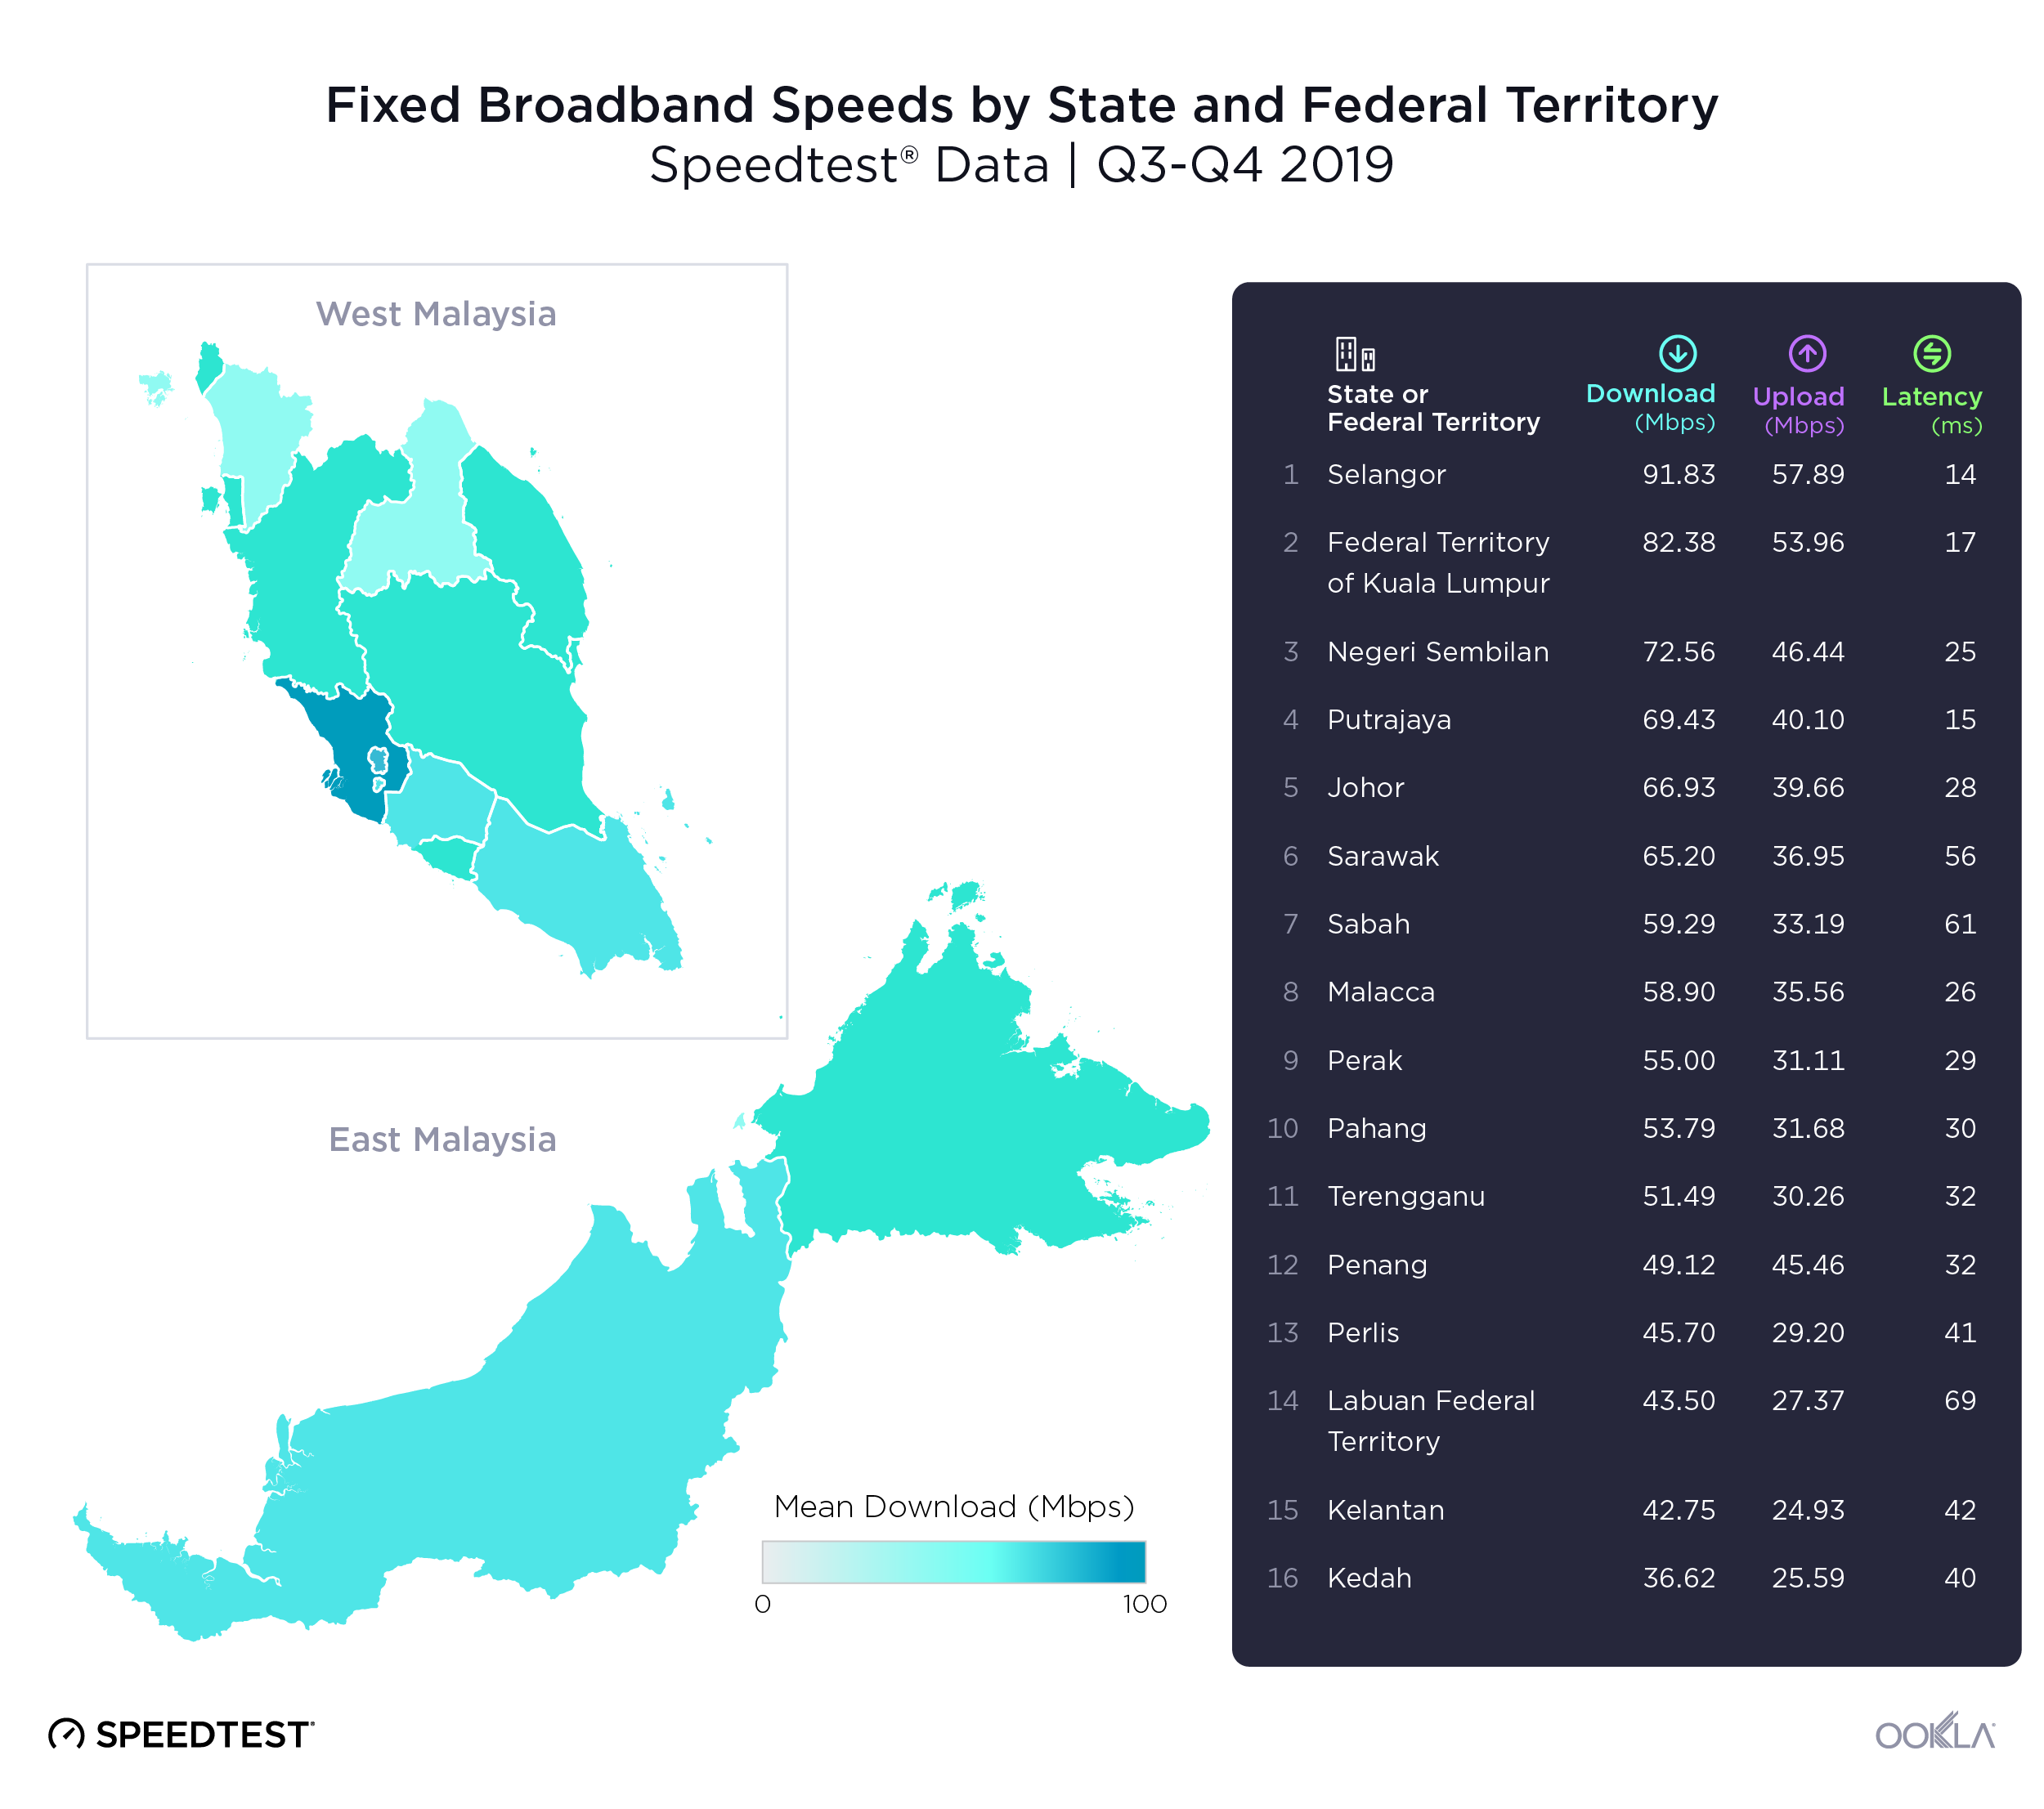
We explored internet speeds and 4G Availability in Malaysia’s 13 states and 3 federal territories using Speedtest data during Q3-Q4 2019.
Ookla_Malaysia_States_Fixed-Broadband-Speeds_0320
Selangor had the fastest mean download and upload speeds on fixed broadband during Q3-Q4 2019, as well as having the lowest latency (14 ms). Mean download speeds on fixed broadband ranged from a high of 91.83 Mbps in Selangor to a low of 36.62 Mbps in Kedah, a 60.1% difference. Selangor’s mean upload speed over fixed broadband was 57.89 Mbps while Kelantan had the slowest mean upload speed over fixed broadband at 24.93 Mbps. Labuan had the highest latency at 69 ms over fixed broadband during this period.
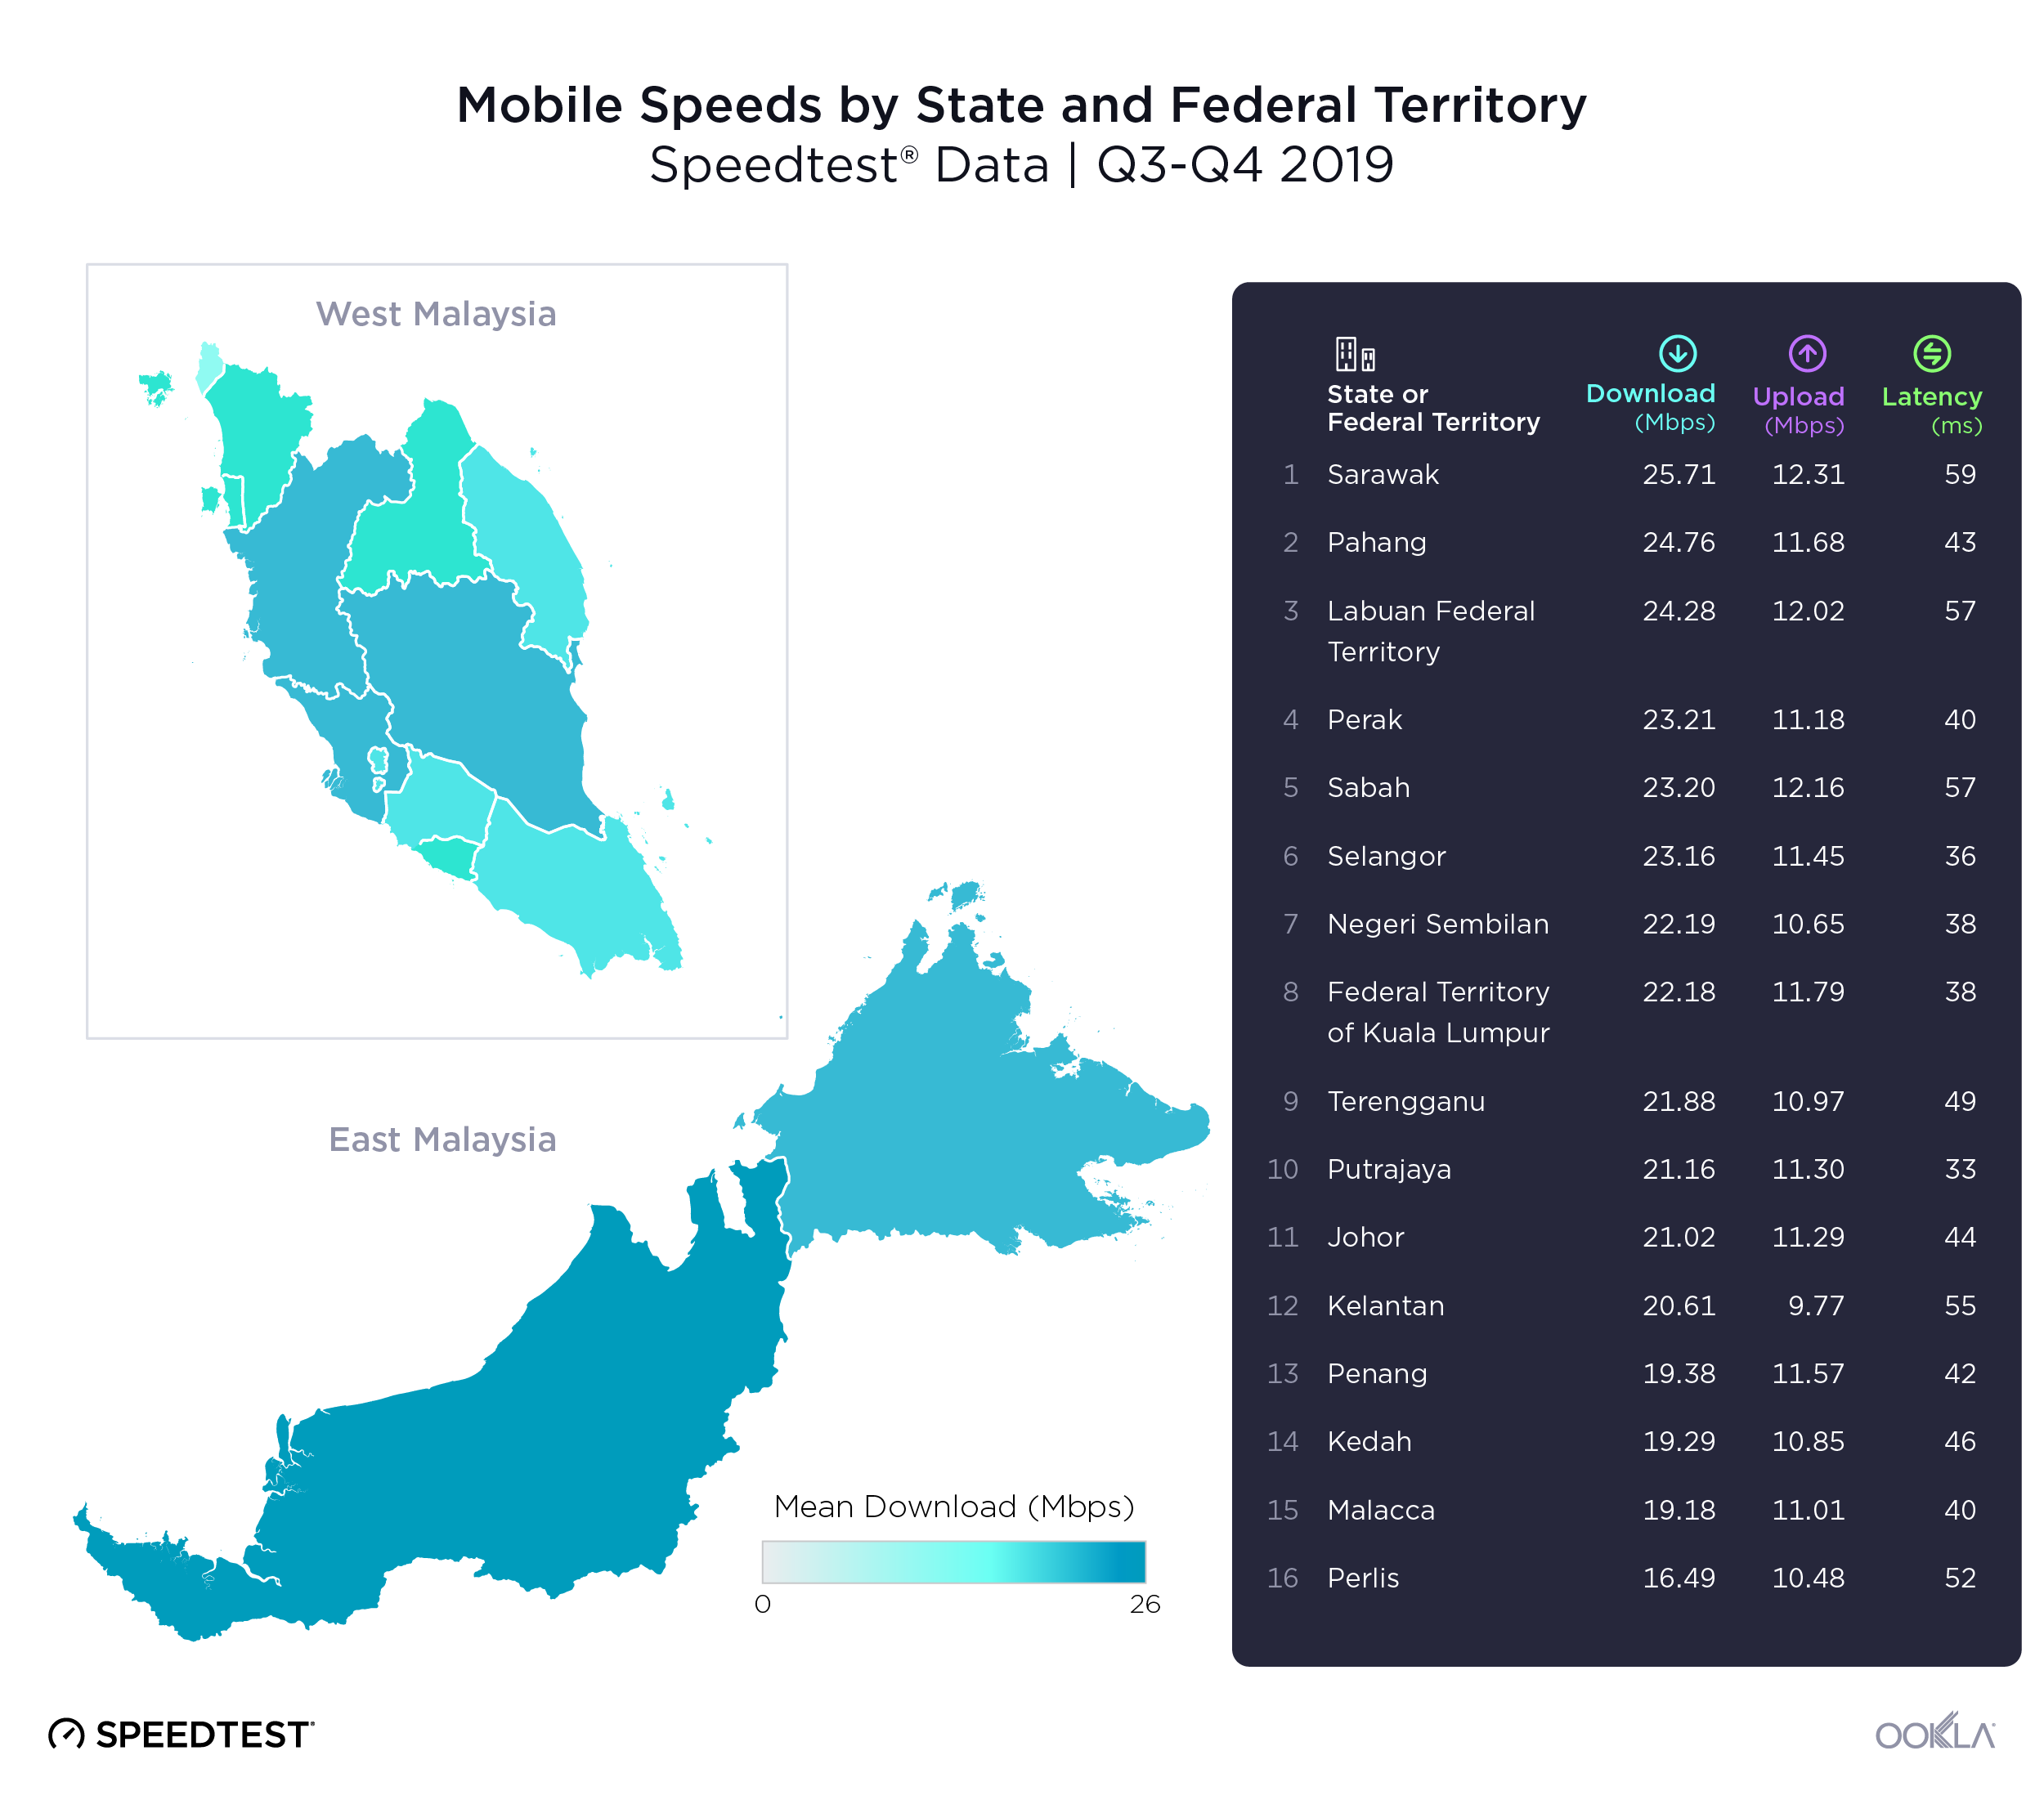
Ookla_Malaysia_States_Mobile-Speeds_0320
The difference between fastest and slowest speeds on mobile broadband was smaller than that of fixed broadband. Sarawak led the group with the fastest mean download and upload speeds on mobile broadband at 25.71 Mbps and 12.31 Mbps, respectively. Perlis was slowest with a mean download speed of 16.49 Mbps, a 35.9% difference. Kelantan had the slowest mean upload speed on mobile at 9.77 Mbps. Latency rankings over mobile were very different among the states and territories than those for speeds. The Federal Territory of Putrajaya had the lowest mobile latency during Q3-Q4 2019 at 33 ms. Sarawak had the highest mobile latency at 59 ms during this period.

4G dominates throughout Malaysia

Ookla_Malaysia_Best-Available-Signal_0320
The map above illustrates the best available mobile technologies throughout the country of Malaysia as represented in Speedtest data. We saw 4G available in most parts of Malaysia that were tested, especially in the western coast of the Malaysian peninsula. The second most prevalent signal was 3G, often found at the edges of places where 4G is more readily available. 2G is the least available signal and is found mostly in East Malaysia, near Brunei. 5G is currently not commercially available in the country, but deployments are expected by Q3 2020.
Ookla_Malaysia_States_4G-Availability_0320
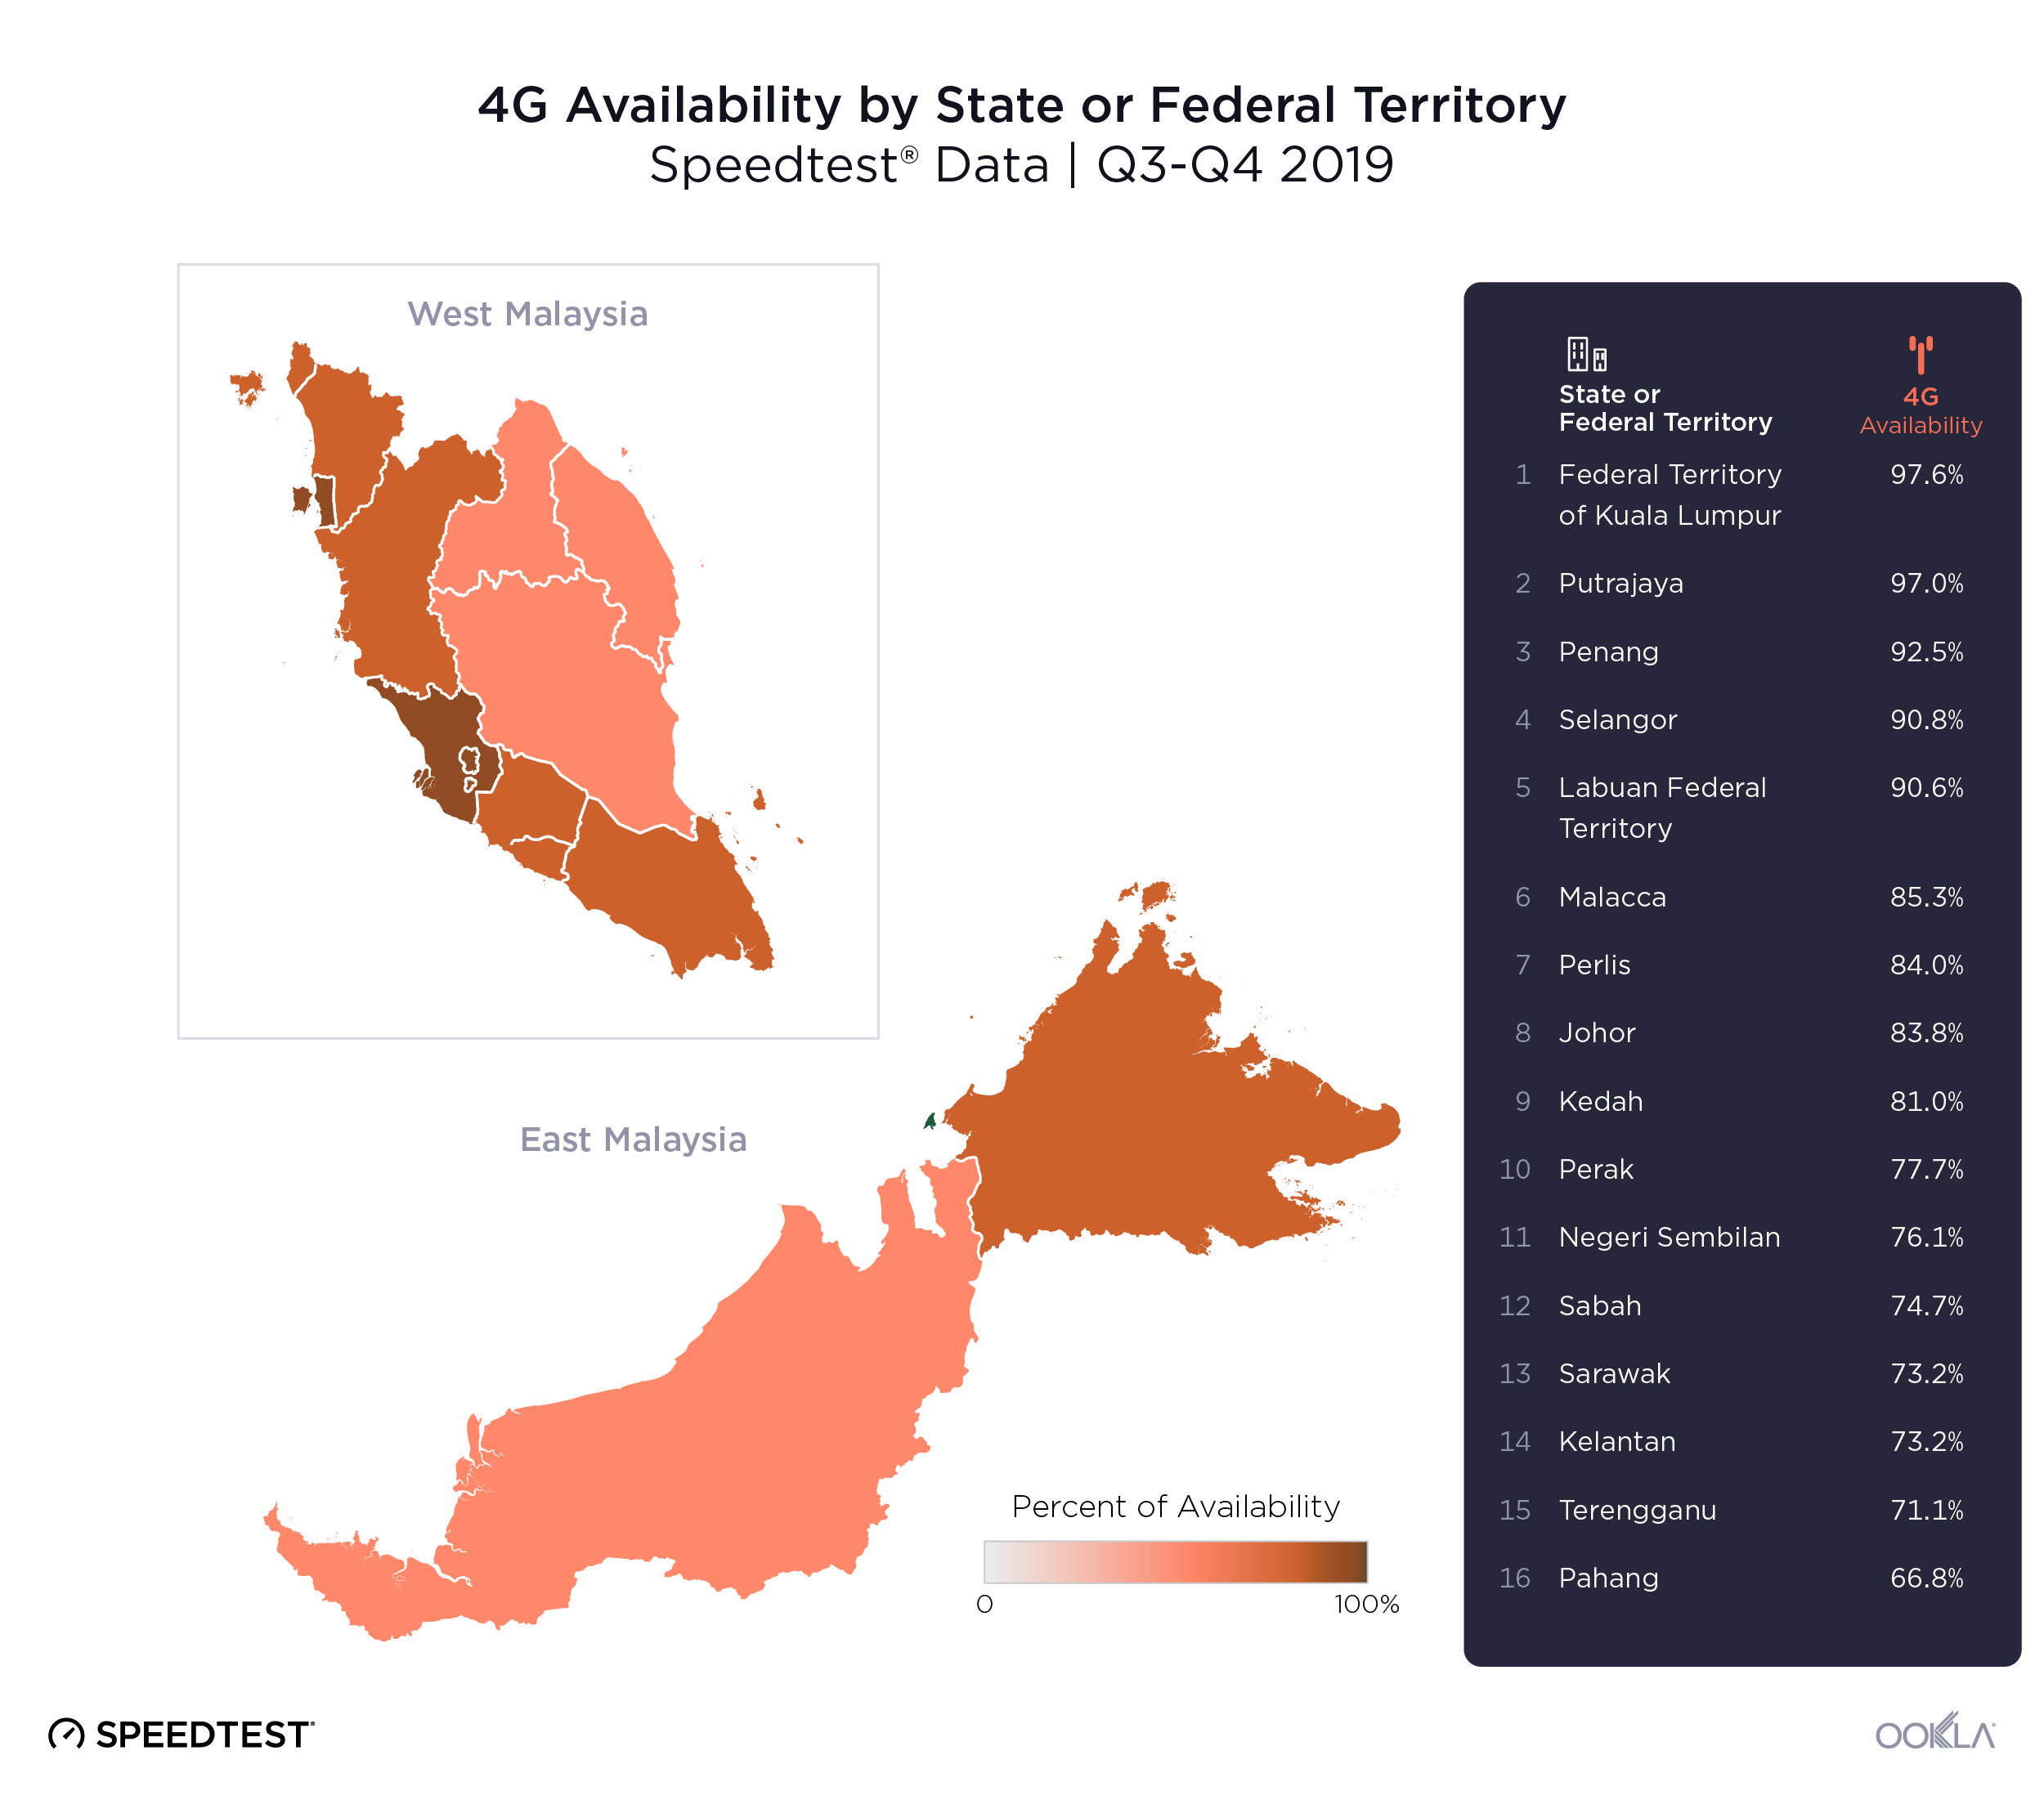
The Federal Territory of Kuala Lumpur had the highest 4G Availability with 97.6% of tested locations showing access to 4G during Q3-Q4 2019. Pahang had the lowest 4G Availability at 66.8%.

Kuala Lumpur was fastest city for fixed broadband

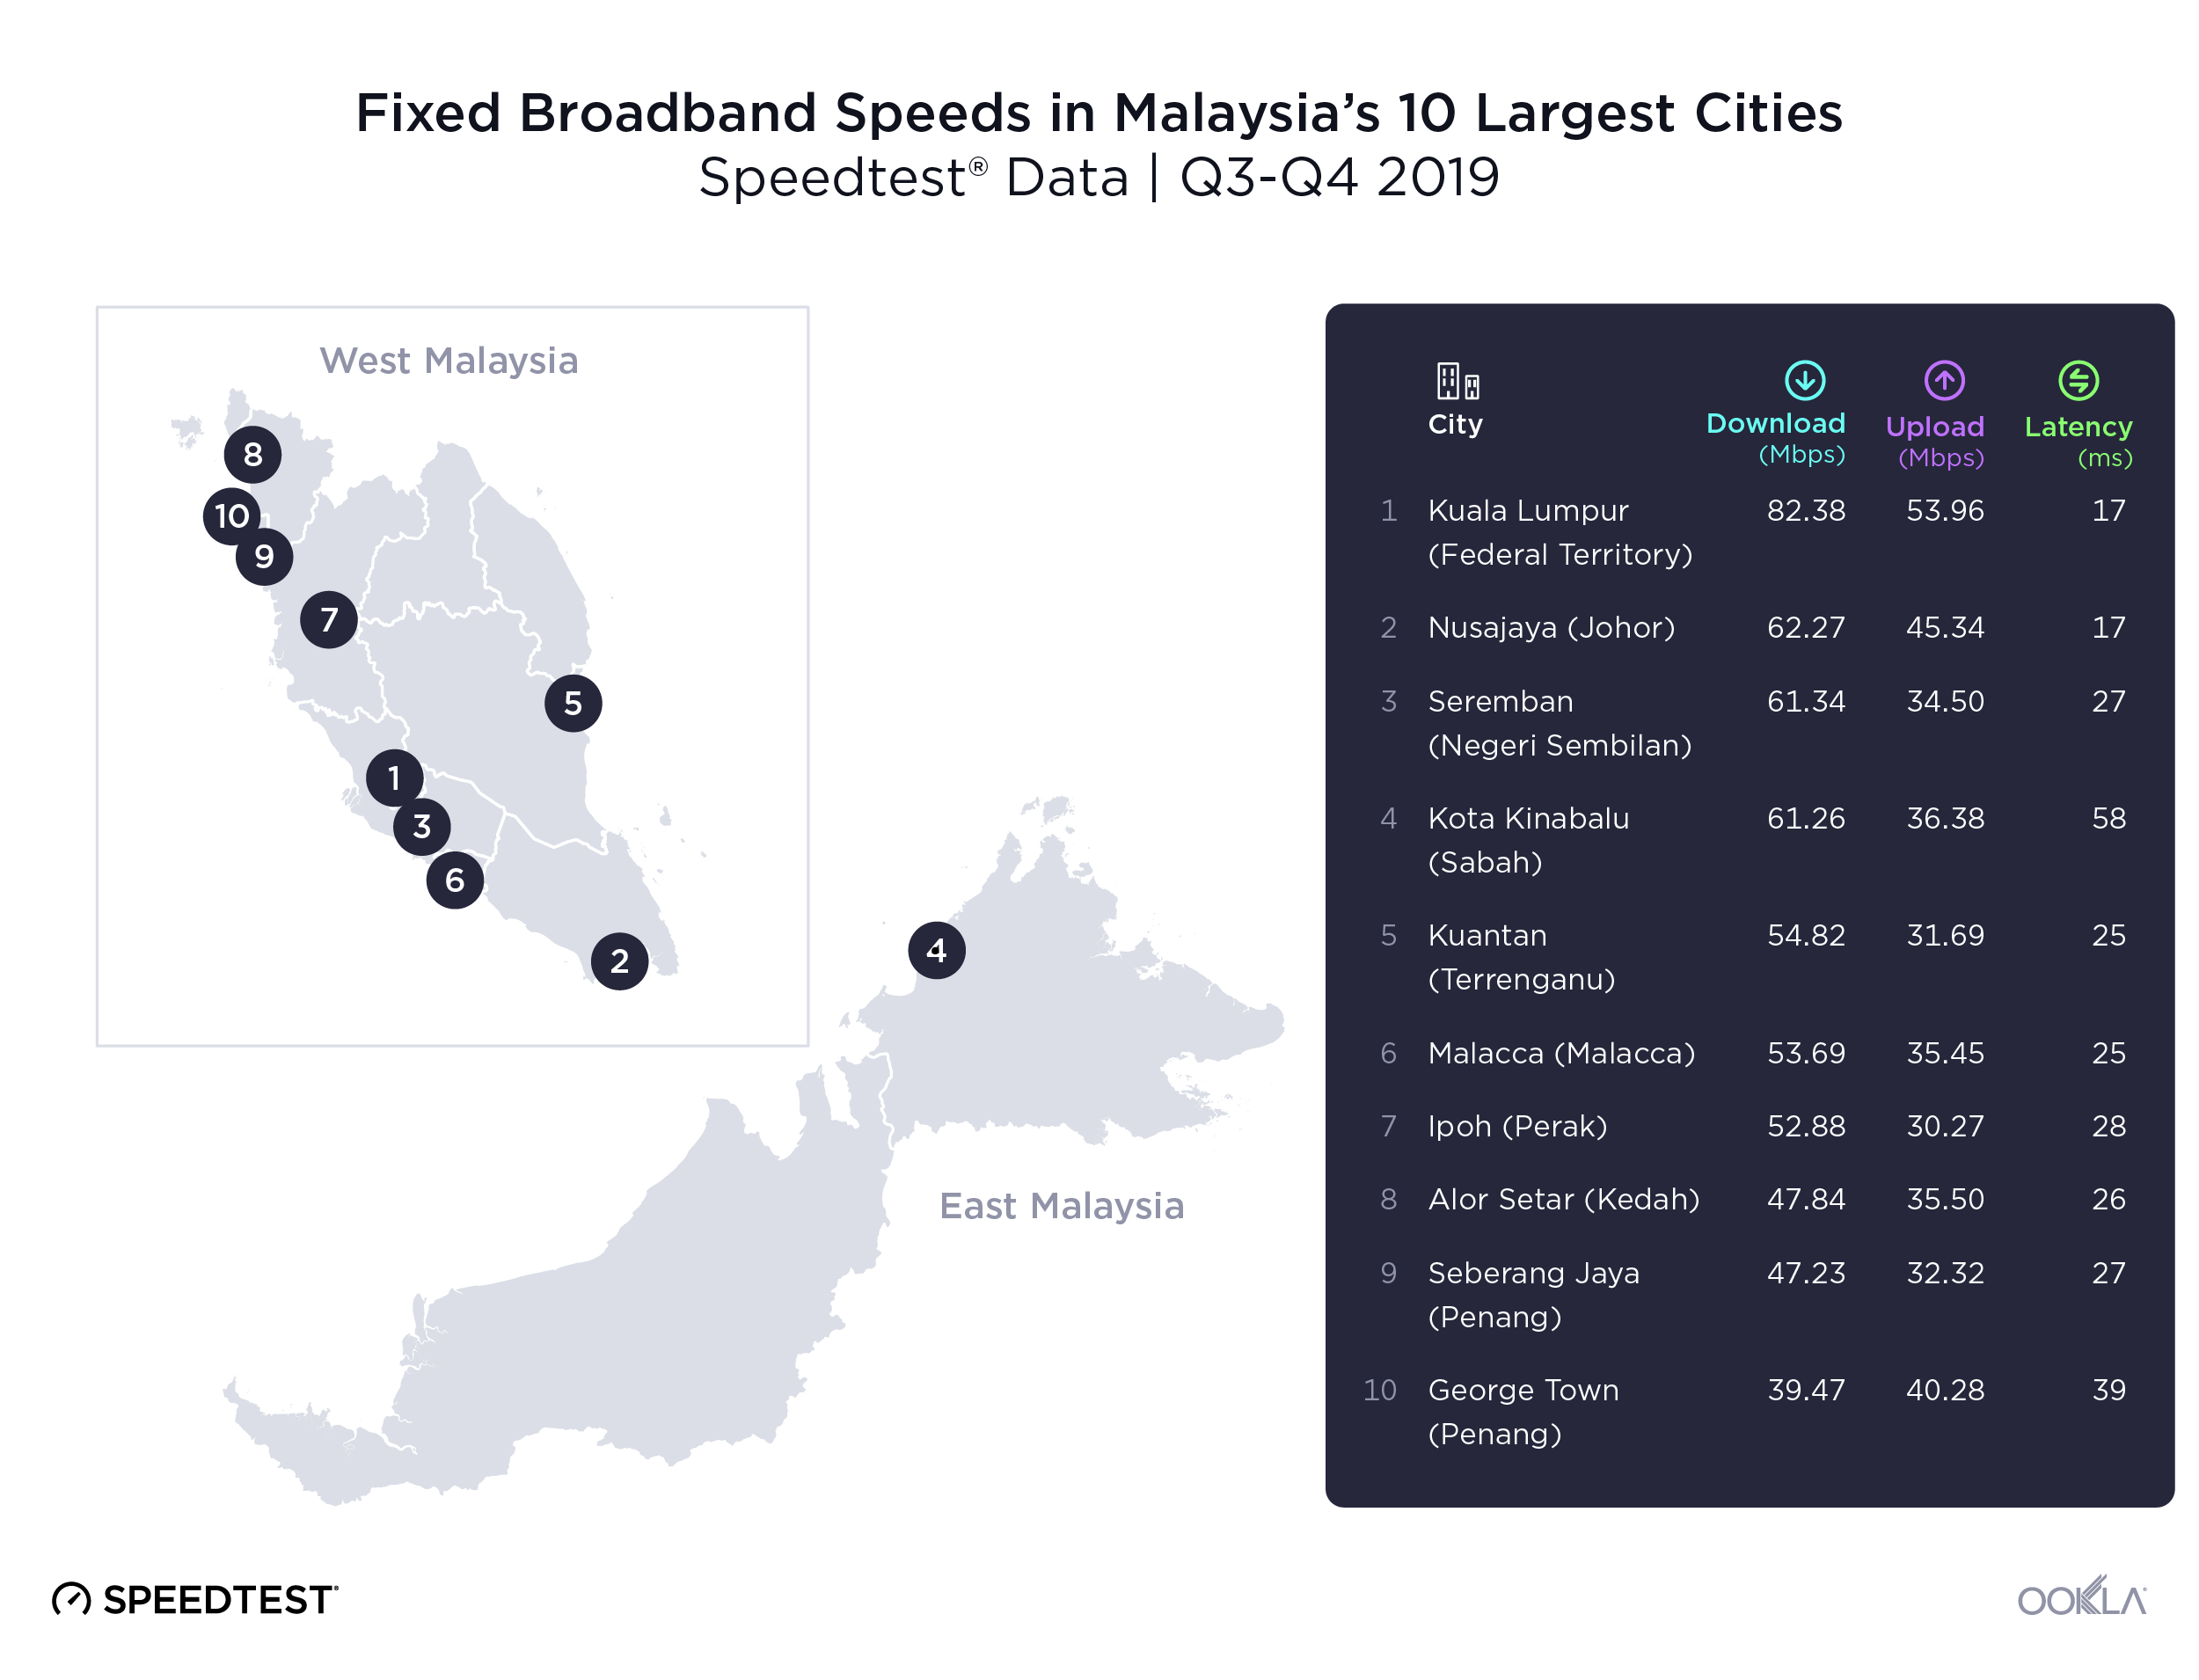
Speedtest data on internet speeds and 4G Availability in Malaysia’s 10 largest cities during Q3-Q4 2019 revealed a stark difference in speeds between cities on fixed broadband. The nation’s capital of Kuala Lumpur led the group with the fastest mean download and upload speeds on fixed broadband at 82.38 Mbps and 53.96 Mbps, respectively. George Town had the slowest mean download speed on fixed broadband at 39.47 Mbps, 52.1% slower than Kuala Lumpur. Ipoh was last for mean upload speed over fixed broadband at 30.27 Mbps, 43.9% slower than Kuala Lumpur.
Ookla_Malaysia_Cities_Fixed-Broadband-Speeds_0320

Kuala Lumpur came on top once again with the lowest mean latency over fixed broadband on the list at 17 ms during Q3-Q4 2019. Kota Kinabalu showed the highest mean latency over fixed broadband at 58 ms.

Nusajaya ranks first among cities for mobile broadband

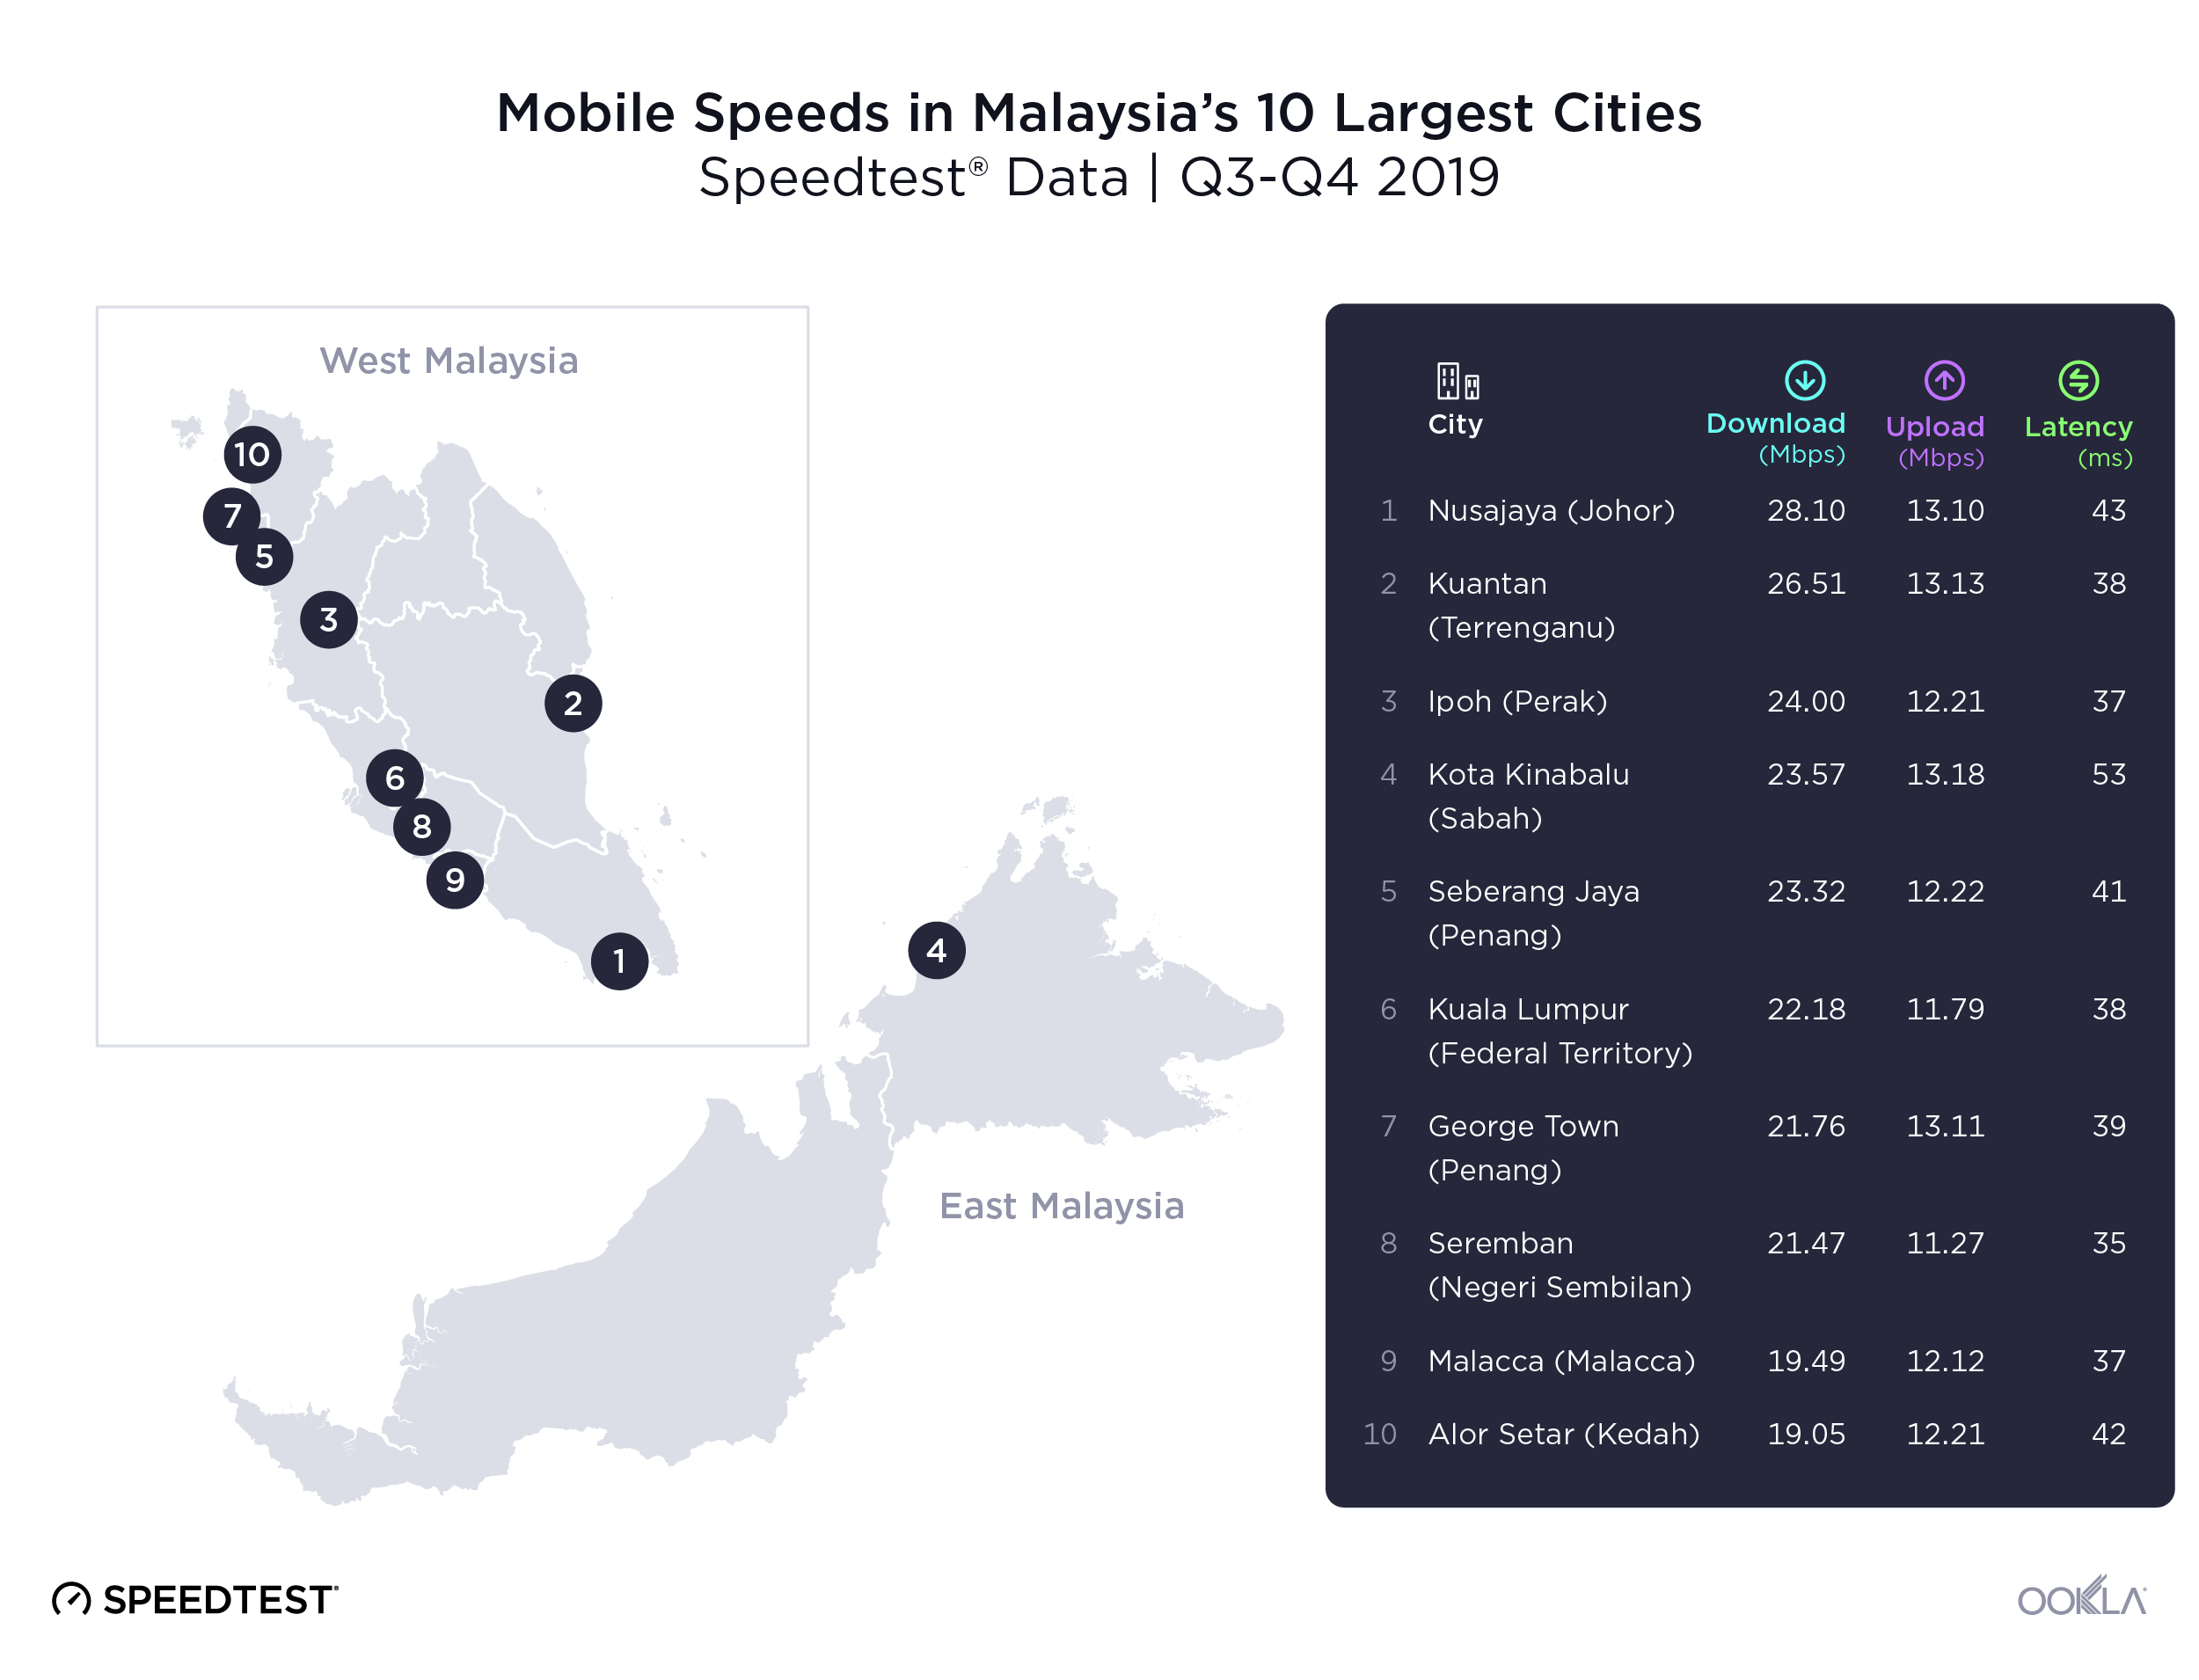
Differences in speed on mobile broadband were not as stark as those on fixed broadband for Malaysia’s ten largest cities during Q3-Q4 2019. First-place Nusajaya showed a mean download speed on mobile of 28.10 Mbps, followed closely by Kuantan at 26.51 Mbps. Alor Setar ranked last with a mean download speed of 19.05 Mbps, a 32.2% difference from Nusajaya.
Ookla_Malaysia_Cities_Mobile-Speeds_0320
Upload speeds on mobile showed a very different ranking from download speeds with Kota Kinabalu first with a mean upload speed of 13.18 Mbps. Kuala Lumpur was second to last at 11.79 Mbps, followed only by Seremban with a mean upload speed of 11.27 Mbps.

Latency over mobile was higher than latency over fixed for most cities during Q3-Q4 2019. First place Seremban had the lowest latency at 35 ms. Kota Kinabalu was last at 53 ms.

We’ll continue to follow Malaysia’s internet speeds, mobile performance and 5G deployments. If you’d like to learn more about internet speeds in Southeast Asia and other markets around the world, click here to read more insights from Ookla.

Editor’s note: This article was updated on March 31 to correct a typo in the second paragraph that incorrectly identified Malaysia’s mean download speed.

Ookla retains ownership of this article including all of the intellectual property rights, data, content graphs and analysis. This article may not be quoted, reproduced, distributed or published for any commercial purpose without prior consent. Members of the press and others using the findings in this article for non-commercial purposes are welcome to publicly share and link to report information with attribution to Ookla.

| July 28, 2020

Exploring the Online Gaming Experience in Latin America

Español | Português

Online gaming is on the rise in Latin America and all over the world. This is creating a demand for lower-latency network connections so gamers can enjoy a seamless, lag-free gameplay experience. According to data from Speedtest Intelligence® during Q2 2020, latency varied greatly across both countries and cities in the five most robust economies in Latin America, providing some gamers with an unexpected advantage. Read on for details about latency on mobile and fixed broadband in Argentina, Brazil, Chile, Colombia and Mexico to see where users are likely to have the best gaming experience both nationwide and in each country’s most populous cities.

Latency, the reaction time of a connection, is a key metric in gaming. For the best gaming experience, users should look for a latency of 59 ms or less. The data below provides the mean latency for each location. Mobile latency is applicable for games played on mobile devices, while latency on fixed broadband measures latency while playing PC and console games.

Brazil had lowest latency on fixed broadband, Argentina on mobile

Ookla_Latin_America_latency_countries_0720_en

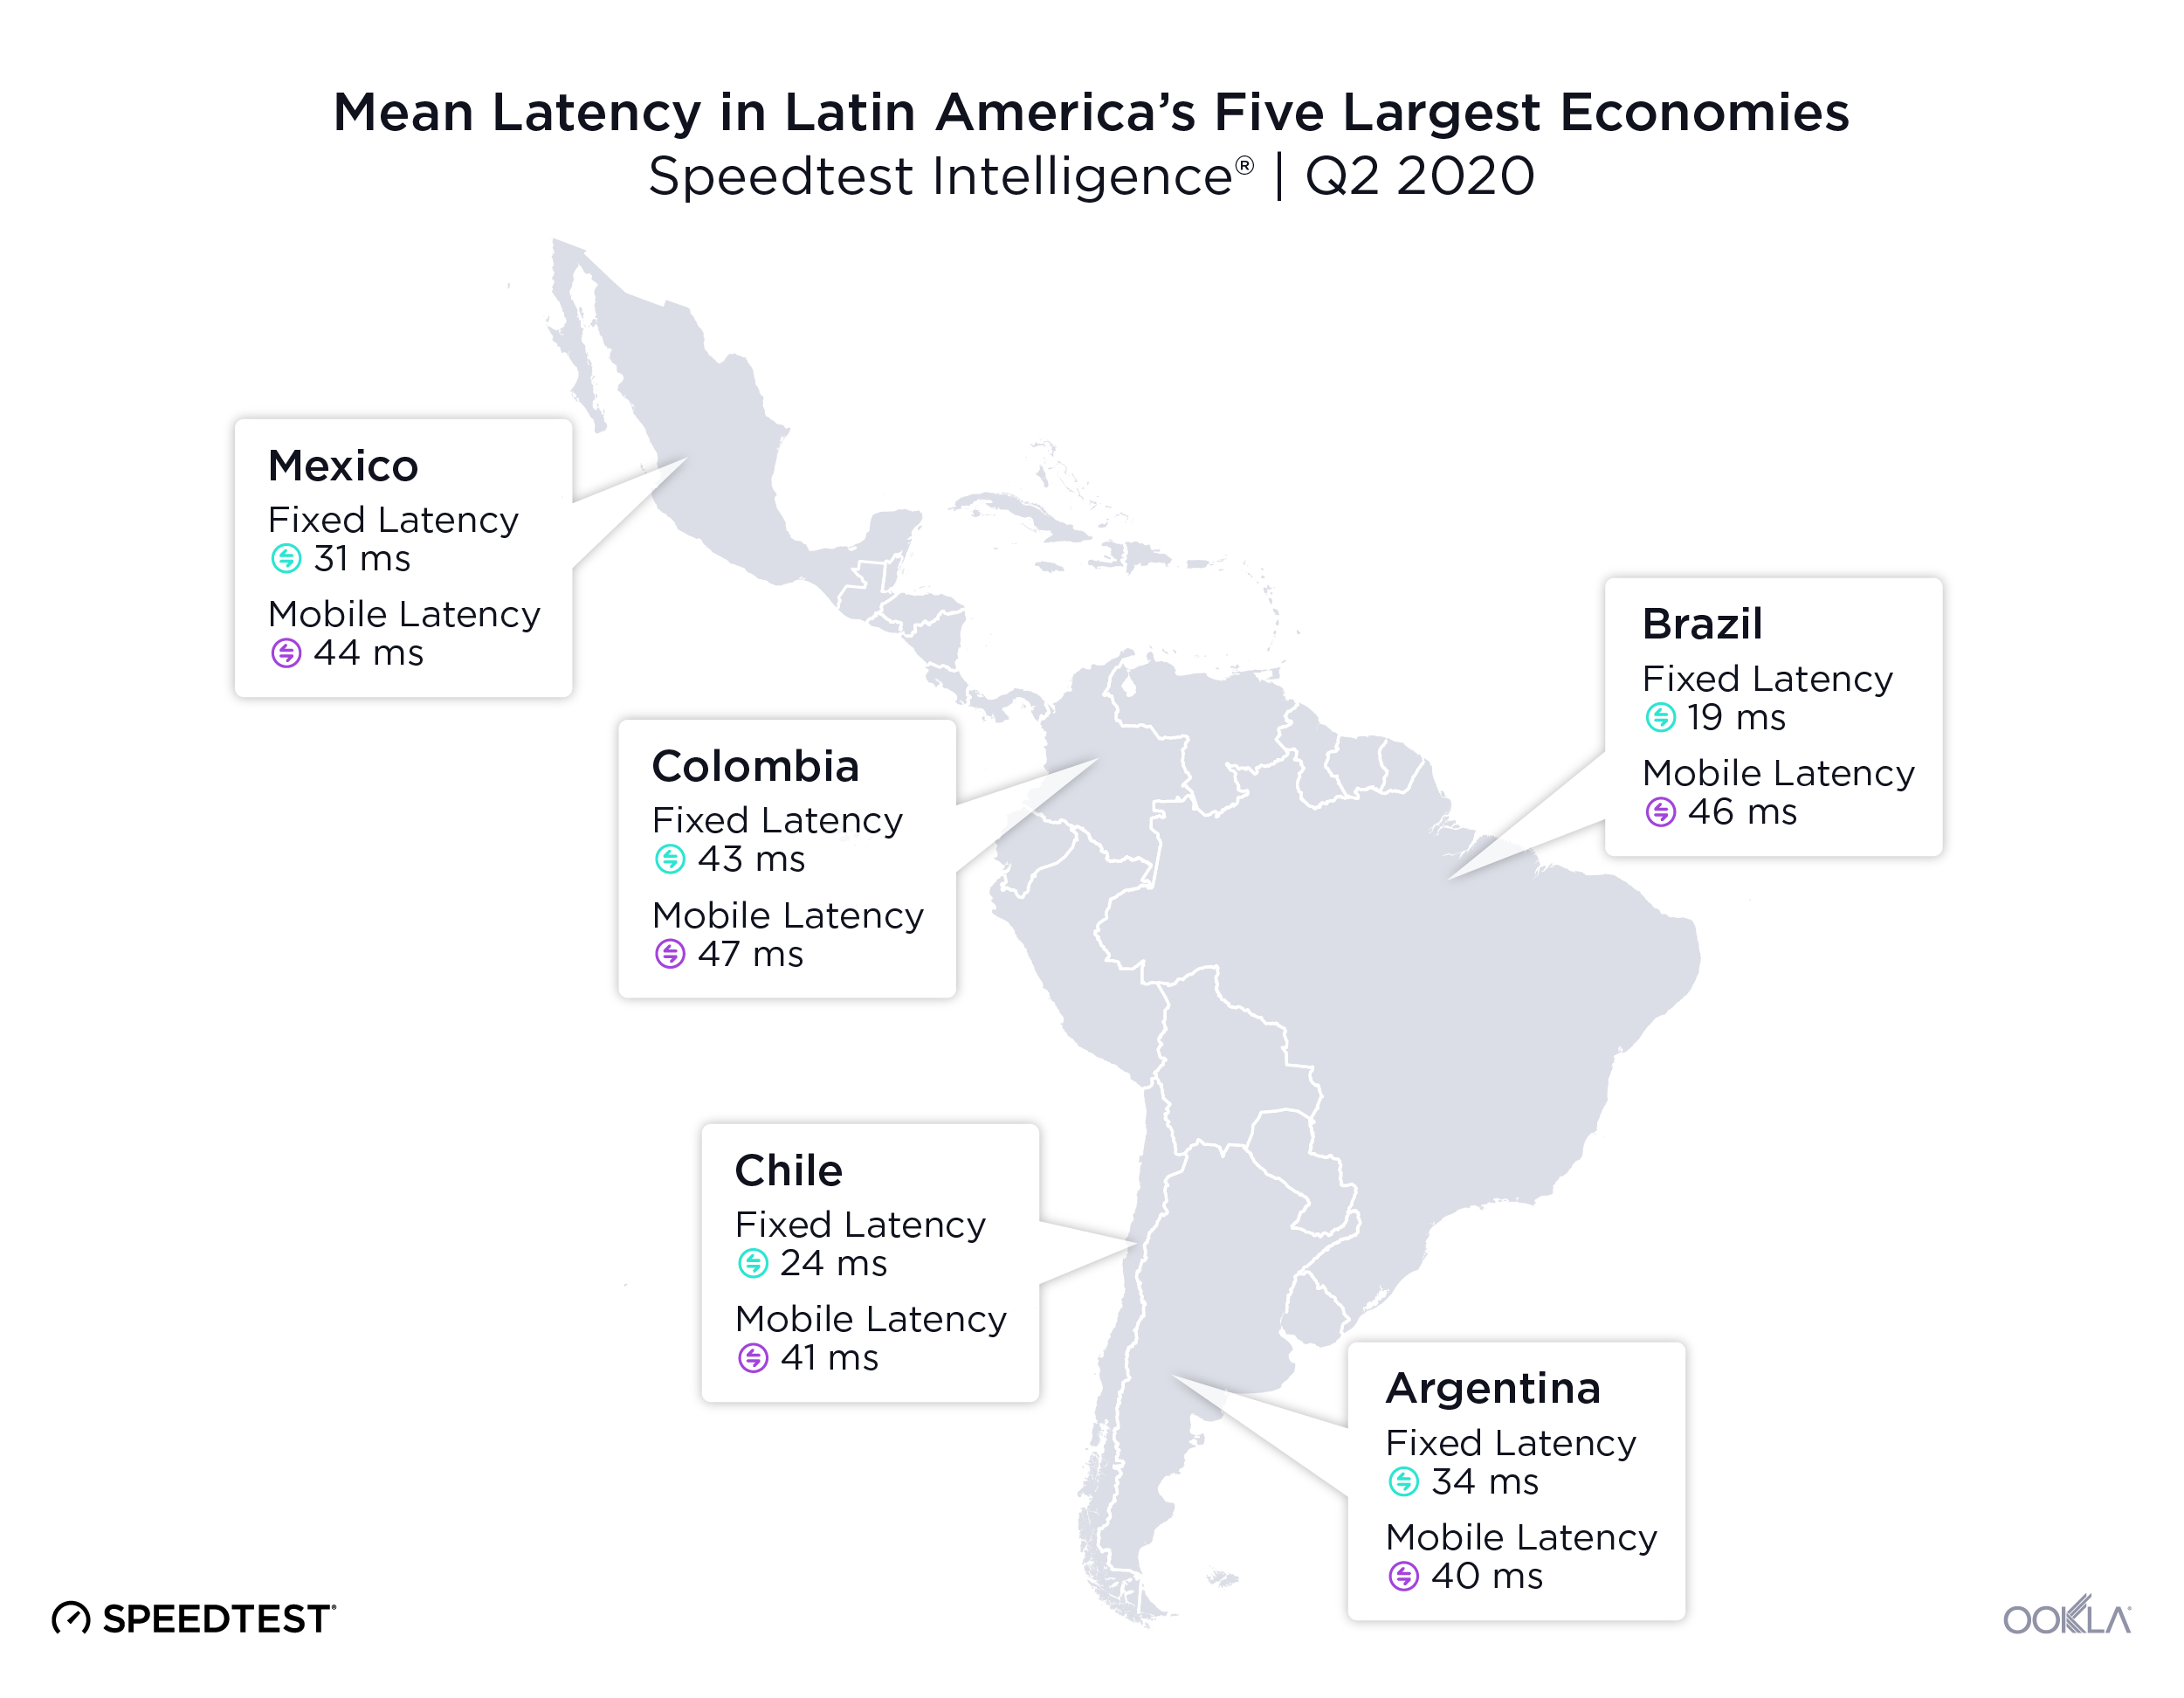
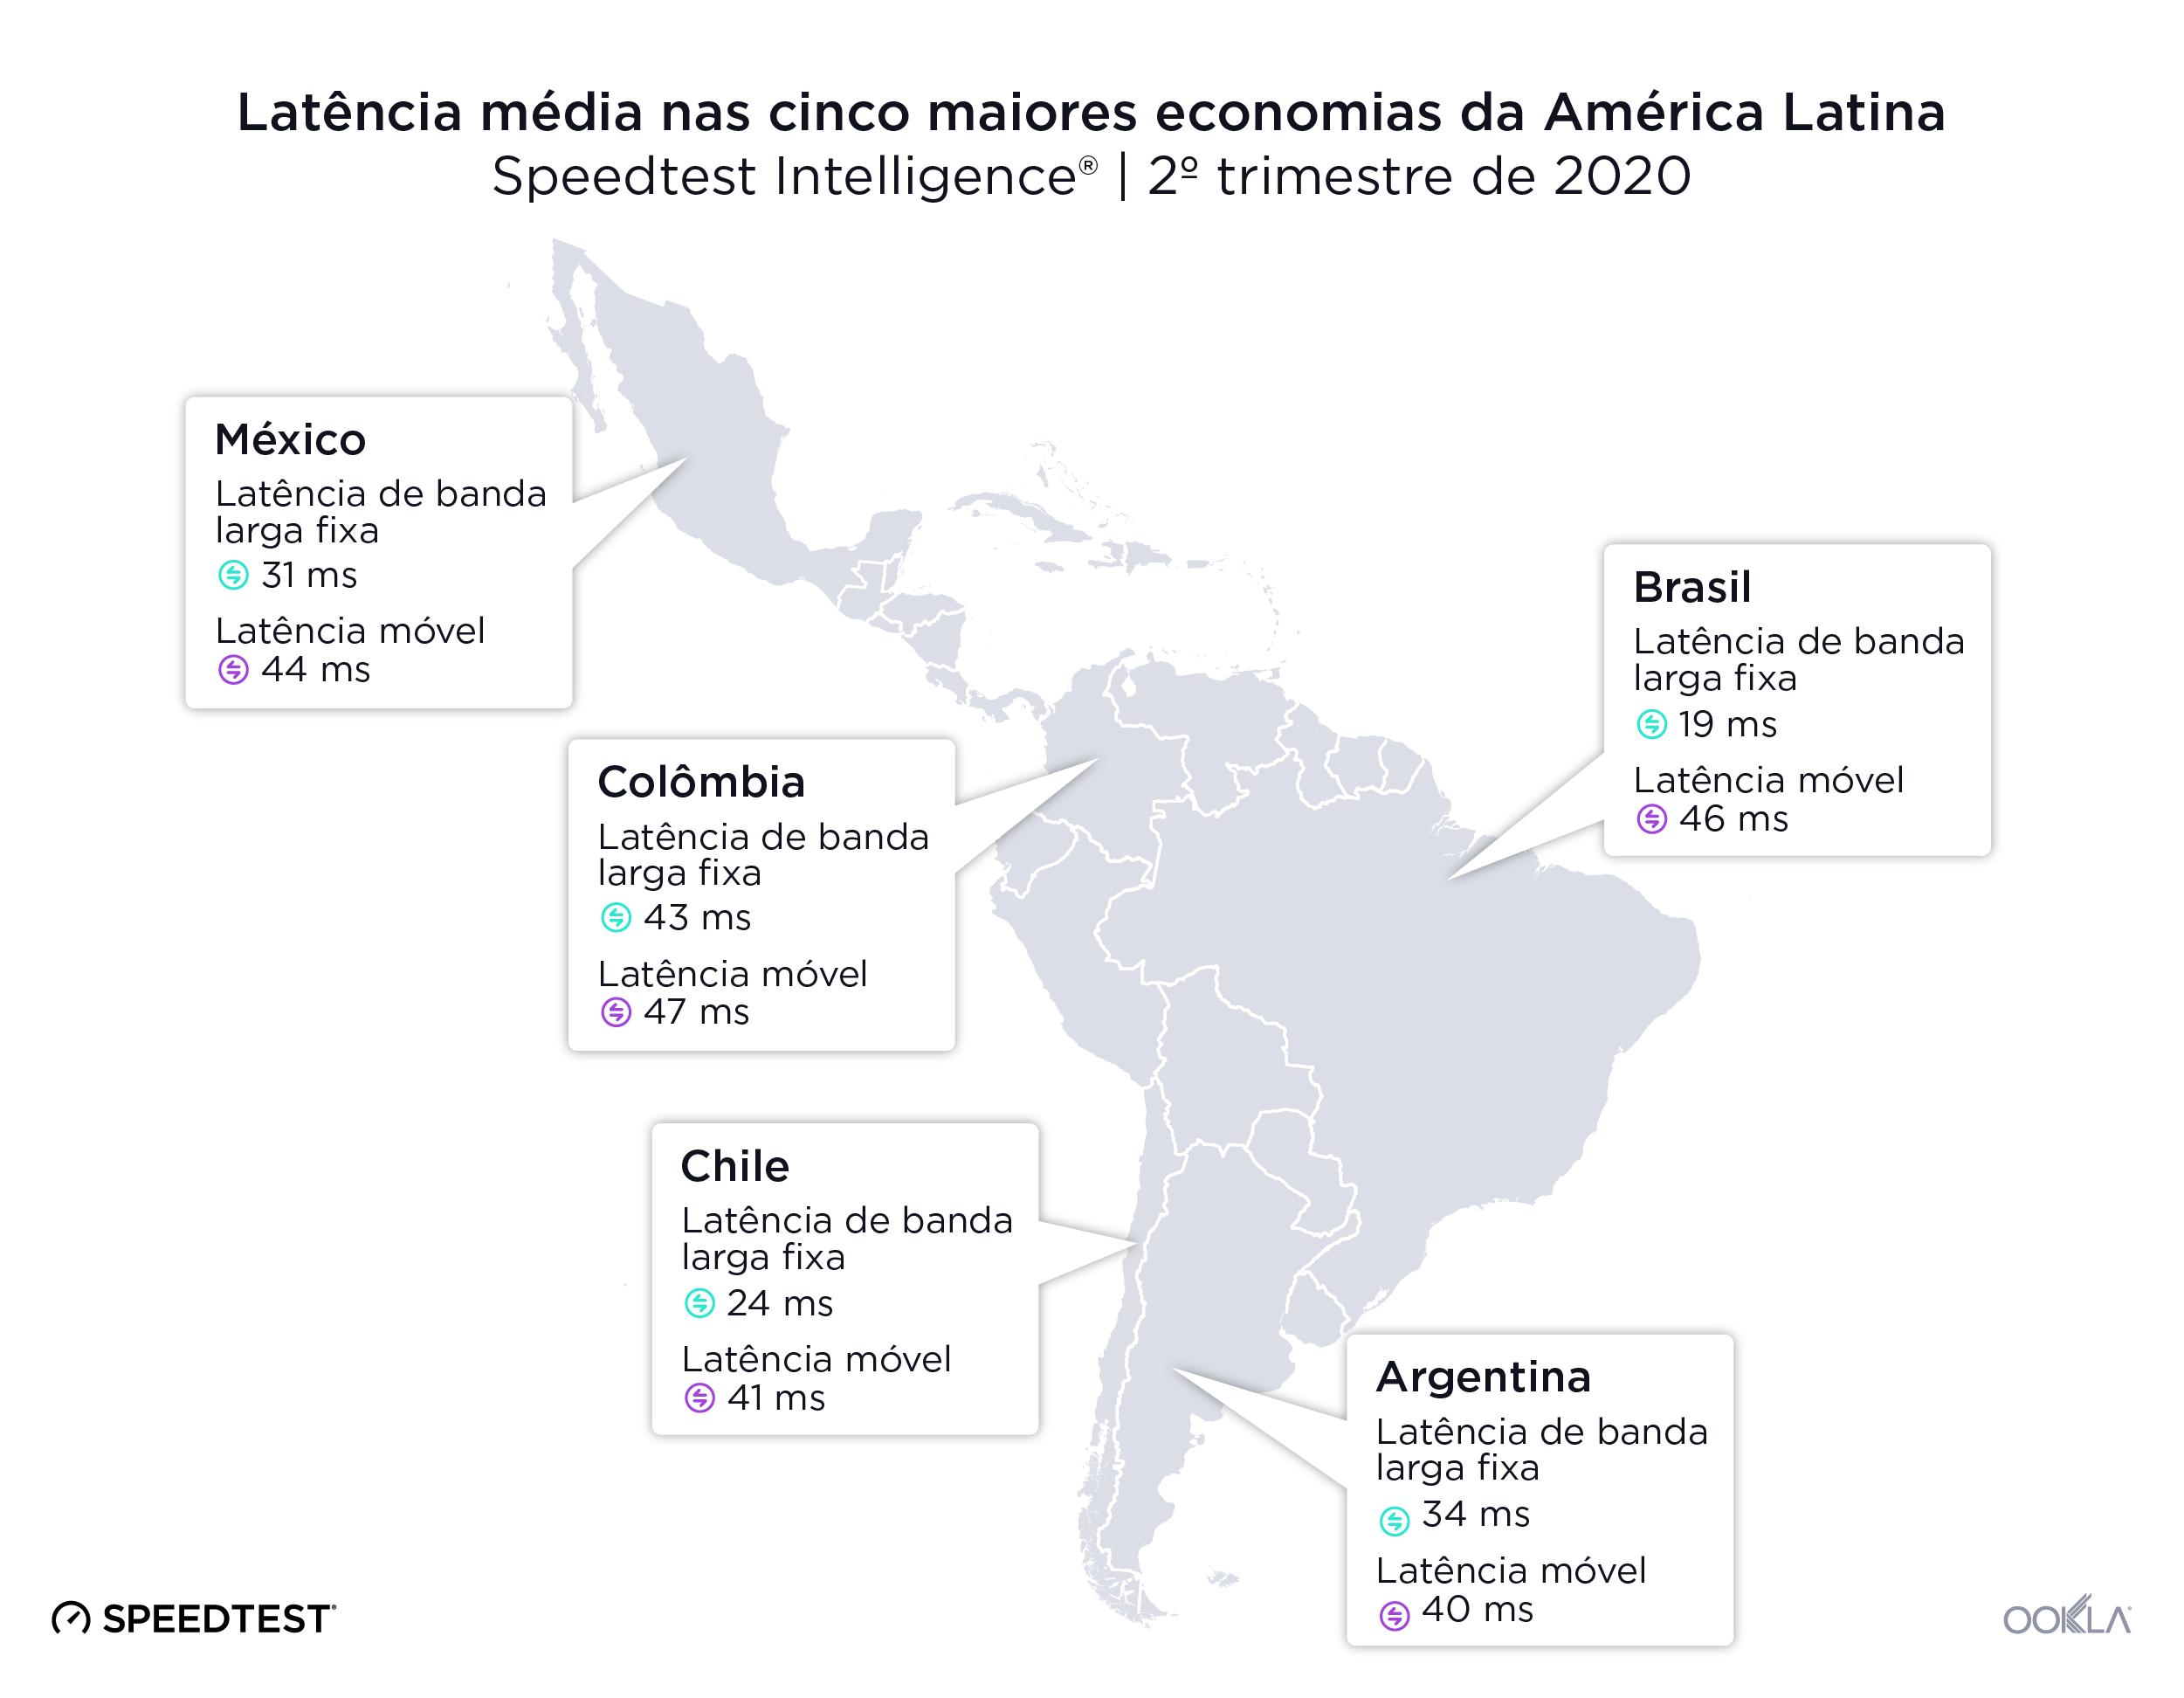
Gamers in Brazil enjoyed the lowest mean latency on fixed broadband during Q2 2020 at 19 ms. Brazil was followed by Chile, Mexico and Argentina. Colombia had the highest latency on fixed broadband during this period at 43 ms.

Recent investments in fiber all across the region resulted in improved latencies when comparing Q2 2019 and Q2 2020. Brazil showed the biggest improvement in fixed broadband latency compared to Q2 2019, decreasing from 23 ms in Q2 2019 to 19 ms in Q2 2020. Latency in Mexico also decreased, dropping from 34 ms in Q2 2019 to 31 ms in Q2 2020. The other three countries on our list experienced little to no change in latency on fixed broadband between Q2 2019 and Q2 2020.

There was less variation between countries in mobile latency during Q2 2020. Argentina had the best latency on mobile at 40 ms, followed closely by Chile at 41 ms. Colombia had the highest mobile latency during this period at 47 ms.

Mexico experienced the largest improvement in their mobile latency when comparing Q2 2019 to Q2 2020. Mobile latency improved from 57 ms in Q2 2019 to 44 ms in Q2 2020. The other countries on our list saw smaller improvements in their mobile latency during this period. In Chile, mobile latency actually increased year over year, from 38 ms in Q2 2019 to 41 ms in Q2 2020.

Deployments of 5G in the region have recently begun, including the launch of 5G DSS technology in Brazil. Though the technology is still fairly new to Latin America, it has the potential to radically improve latency over what 4G-capable devices currently offer.

Internet speeds increased during the pandemic

Having a fast internet connection is also important to gamers. We’ve been using data from Speedtest Intelligence to track internet performance at a global level during the pandemic. While some countries experienced a dip in speeds in March, on the whole, internet speeds on fixed broadband have increased in Argentina, Brazil, Chile, Colombia and Mexico since the baseline week of March 2, 2020. Except for Chile, these countries have also experienced an increase in mobile speeds, ranging from a 2% increase in Colombia to a 19% increase in Mexico.

São Paulo had lowest fixed broadband latency, tied with Buenos Aires on mobile

Ookla_Latin_America_latency_cities_0720_en2
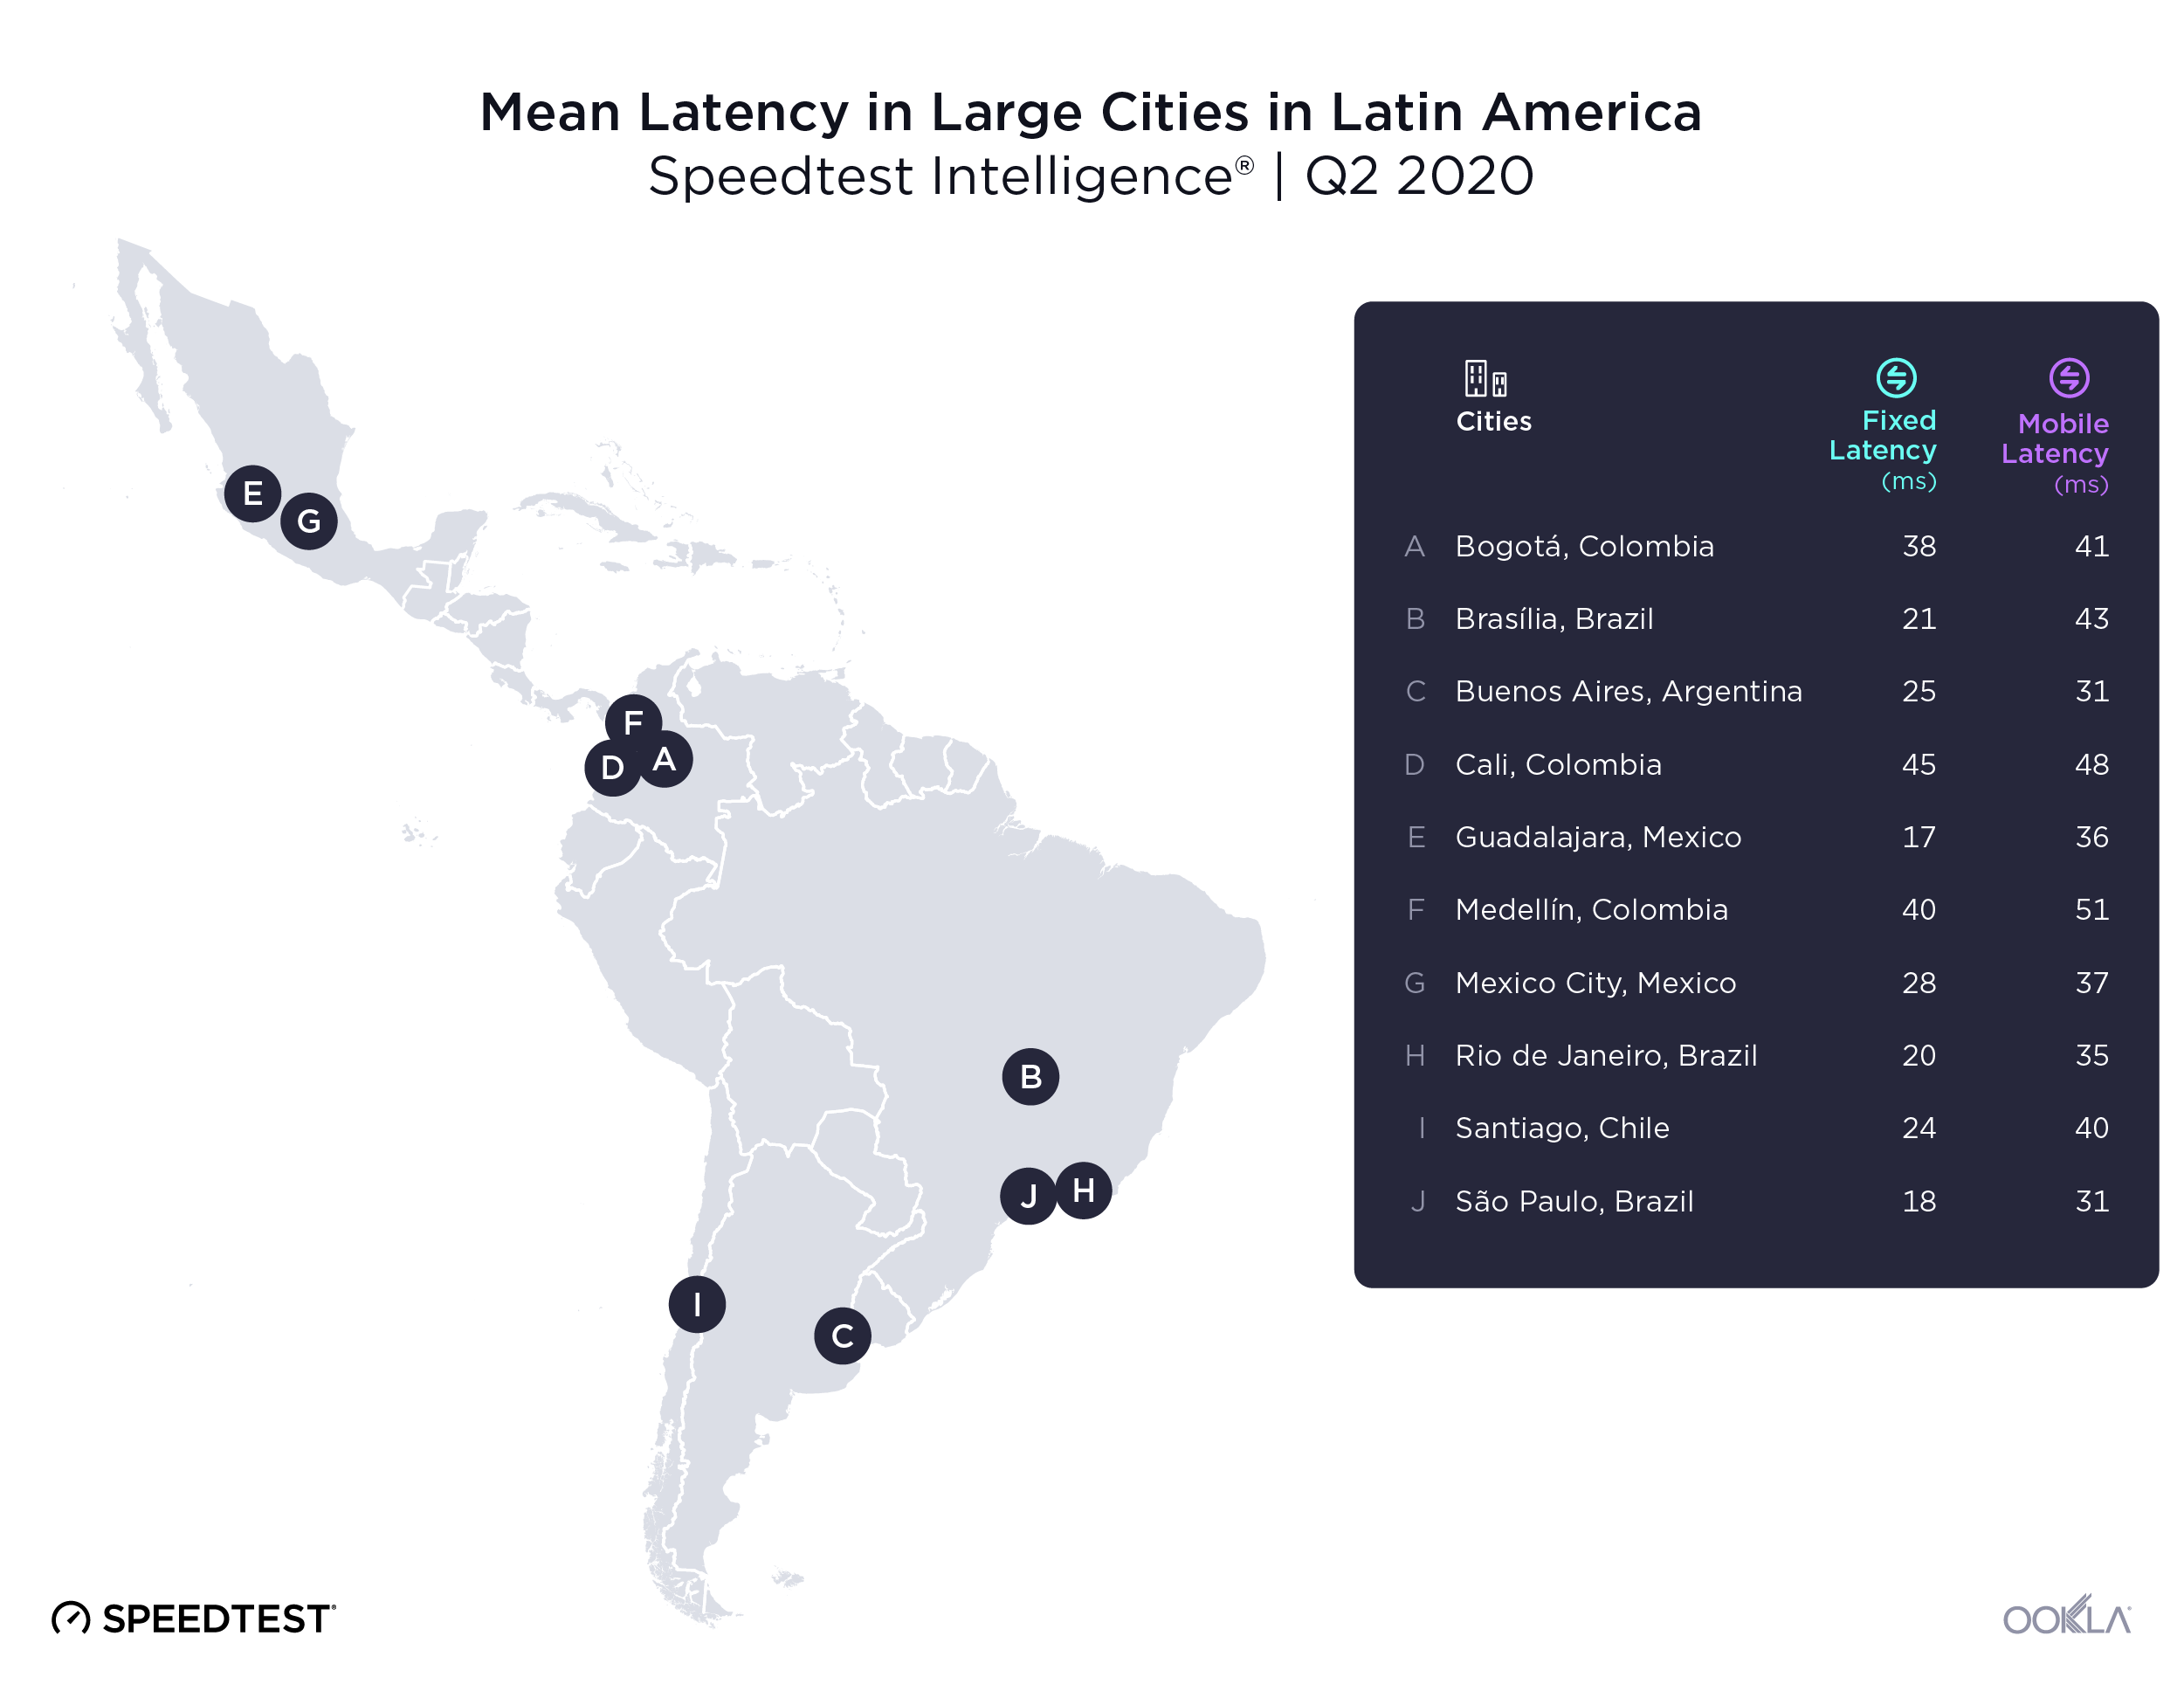
Fixed broadband latency in some of Latin America’s largest cities ranged from Guadalajara’s 17 ms to 45 ms in Cali. Guadalajara, São Paulo and Rio de Janeiro had the lowest fixed broadband latencies on our list during Q2 2020 at 17 ms, 18 ms and 20 ms, respectively. The Colombian cities of Bogotá, Medellín and Cali showed the highest latencies over fixed broadband on our list at 38 ms, 40 ms and 45 ms, respectively. All cities on this list still showed fixed broadband latencies below 59 ms, the recommended measurement for a smooth gaming experience.

When comparing year-over-year results from Q2 2019, we saw increases in fixed broadband latency in almost all cities in Q2 2020. Cali was the only city on the list where latency improved, down from 49 in Q2 2019 to 45 ms in Q2 2020.

São Paulo and Buenos Aires tied for the lowest mobile latency on our list during Q2 2020 at 31 ms. Rio de Janeiro followed at 35 ms, respectively. Brasília, Cali and Medellín took the last three places on the list with mobile latencies of 43 ms, 48 ms and 51 ms, respectively.

Mexico City’s and São Paolo’s mobile latencies improved significantly in Q2 2020 compared to Q2 2019. Mexico City’s mobile latency decreased from 53 ms to 37 ms during the same period. In São Paolo, mobile latency decreased from 40 ms in Q2 2019 to 31 ms in Q2 2020. Only one city on our list did not show an improvement in mobile latency when comparing Q2 2019 to Q2 2020 — Santiago, where mobile latency increased from 36 ms to 40 ms during this period.

Devoted gamers in Latin America will be glad to hear that Internet speeds and mobile latency are improving in many parts of Latin America. We look forward to seeing if fixed broadband latency makes it to the next level in the near future. If you’re interested in learning more about internet performance in other parts of the world, visit Ookla ResearchTM.


Exploramos la experiencia de juegos en línea en América Latina

Los juegos en línea están en aumento en América Latina y en todo el mundo. Esto crea una demanda de conexiones de red con latencia más baja para que los jugadores puedan disfrutar una experiencia de juego sin demoras ni problemas. Según los datos de Speedtest Intelligence® durante el segundo trimestre de 2020, la latencia varió mucho entre ambos países y ciudades en las cinco economías más sólidas de América Latina, lo que les da a algunos jugadores una ventaja inesperada. Lea los detalles sobre la latencia en banda ancha móvil y fija en Argentina, Brasil, Chile, Colombia y México para ver qué usuarios es probable que tengan la mejor experiencia de juego en toda la nación y en las ciudades más pobladas del país.

La latencia, el tiempo de reacción de una conexión, es una métrica clave en el juego en línea. Para lograr la mejor experiencia de juego en línea, los usuarios deben buscar una latencia de 59 ms o menos. Los datos siguientes indican la latencia media para cada ubicación. La latencia móvil se aplica a los juegos que se juegan en dispositivos móviles, mientras que la latencia de banda ancha fija se mide cuando se juega en consolas y computadoras.

Brasil tiene la latencia más baja en banda ancha fija y Argentina, en móvil

Ookla_Latin_America_latency_countries_0720_es
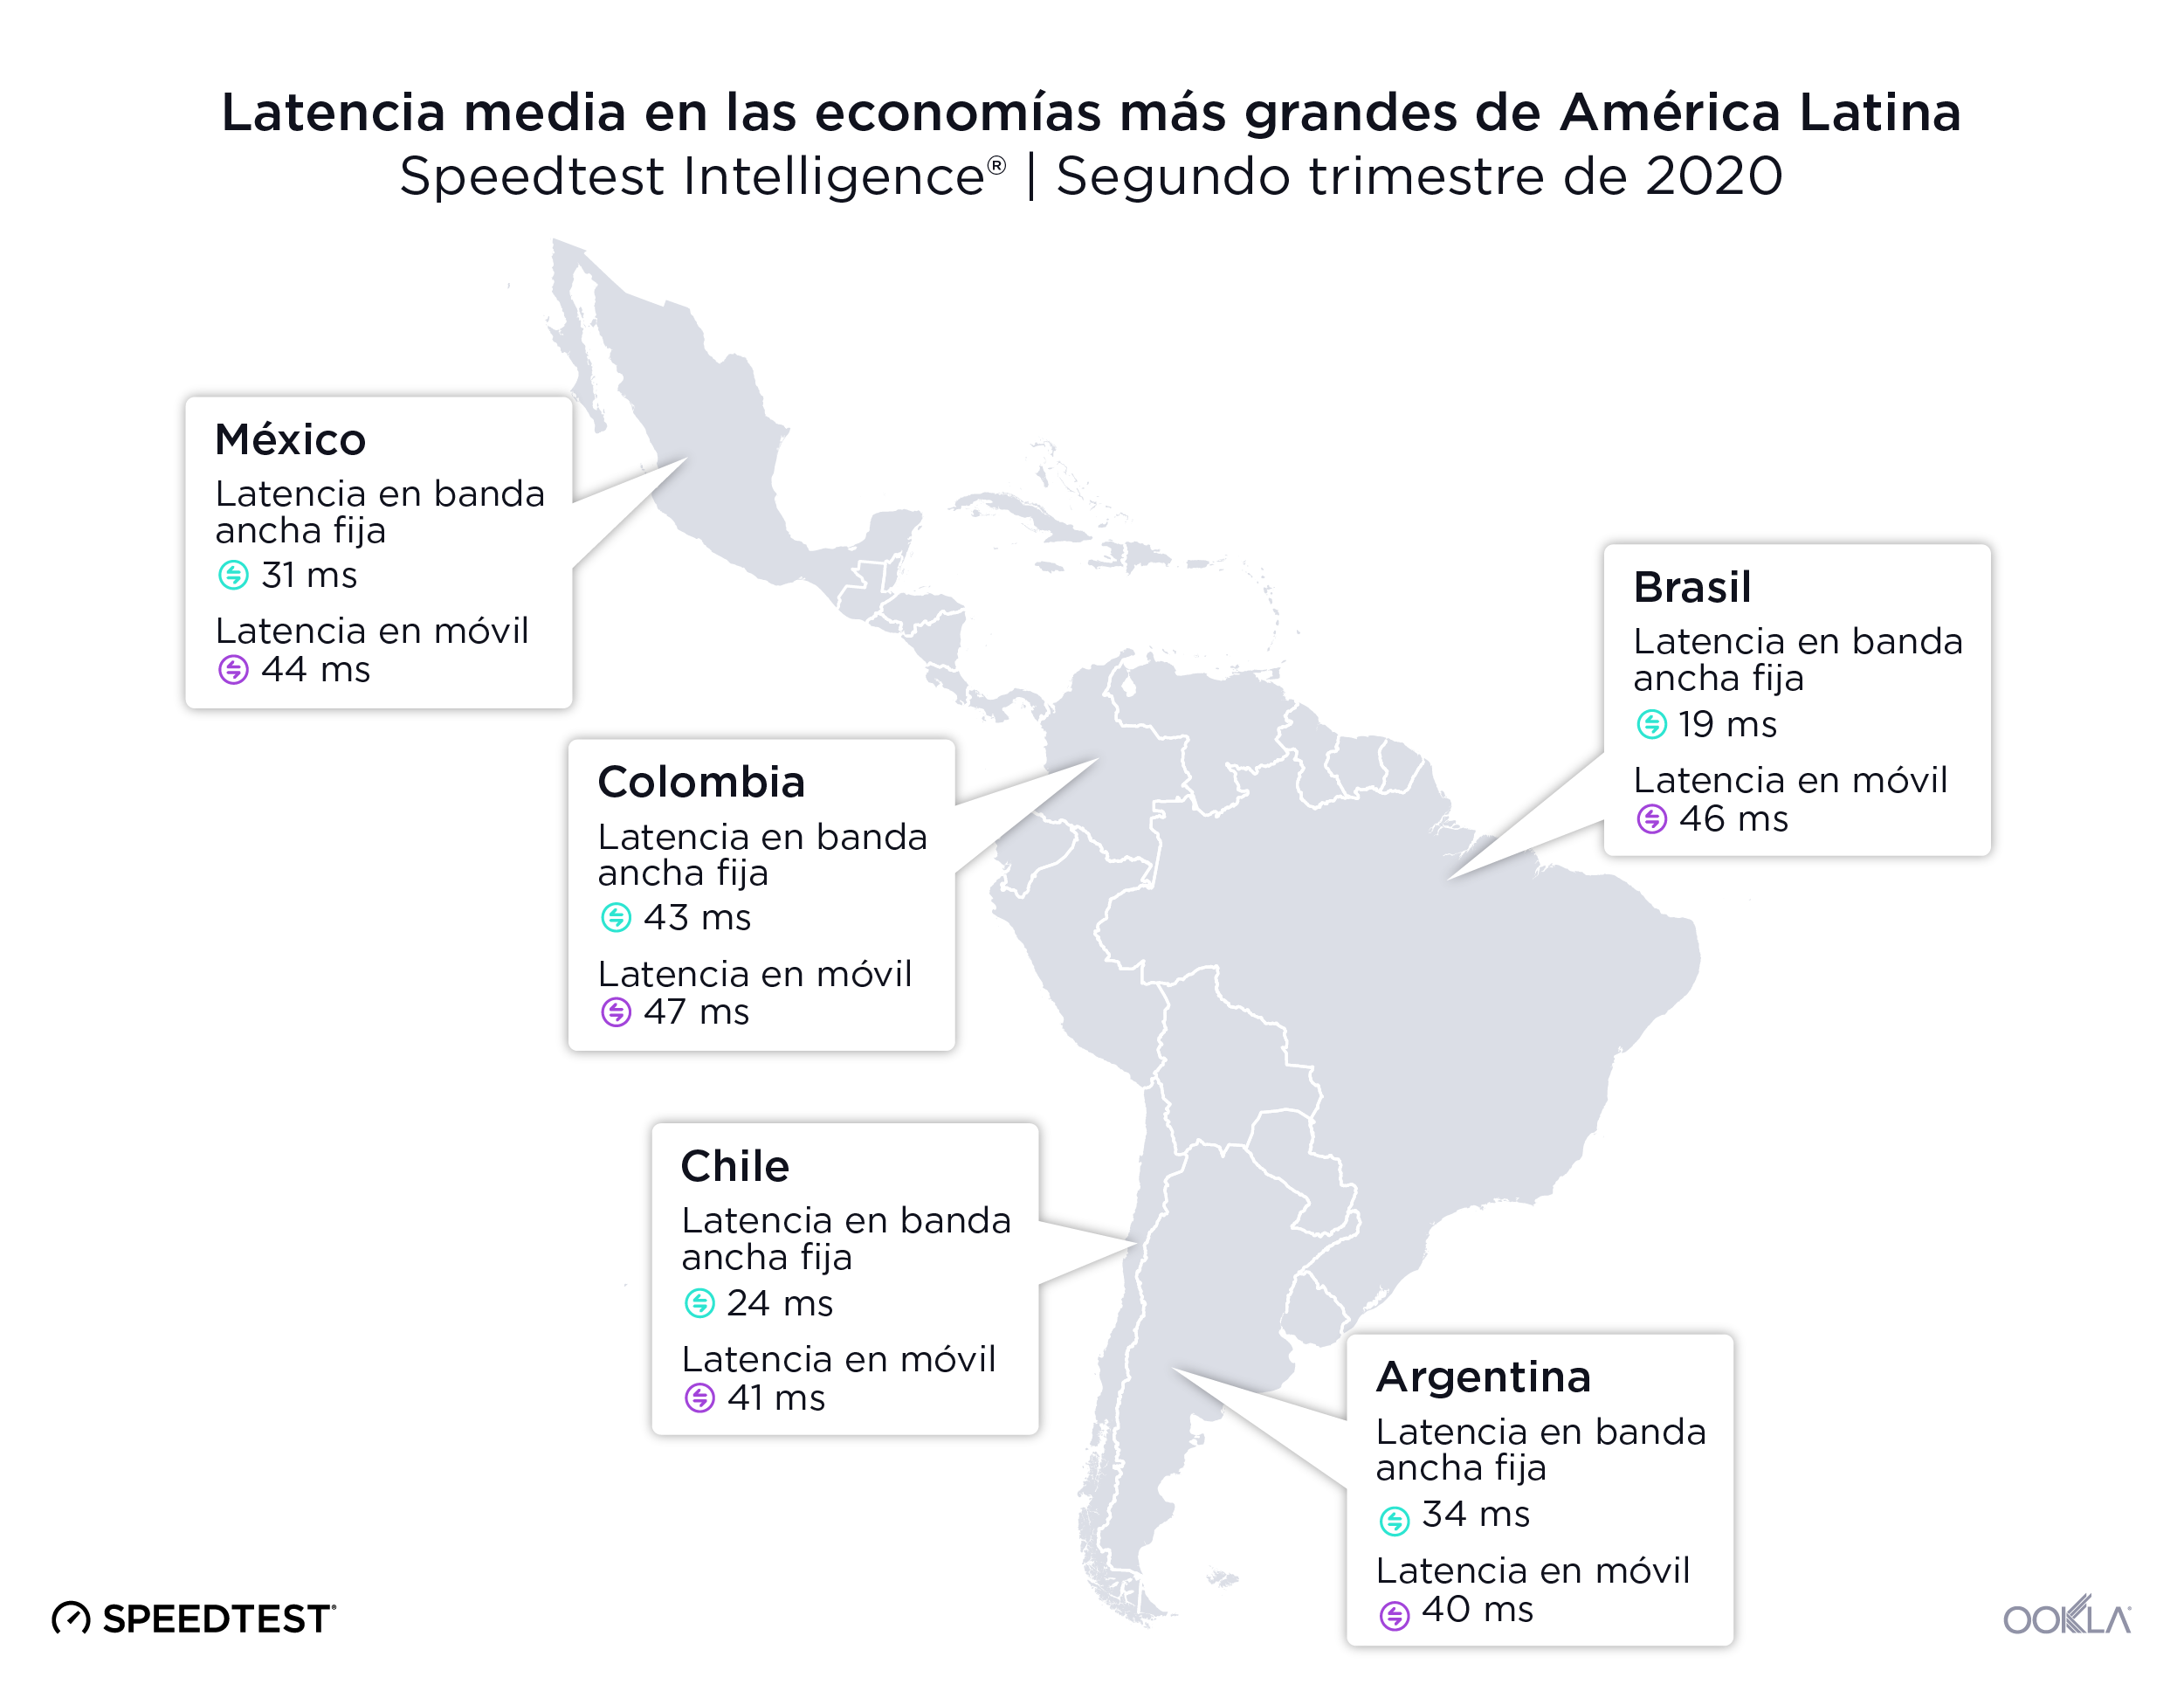
Los jugadores en Brasil disfrutaron la latencia media más baja en banda ancha fija durante el segundo trimestre de 2020 con 19 ms. A Brasil, lo siguieron Chile, México y Argentina. Colombia tuvo la latencia más alta en banda ancha fija durante este período con 43 ms.

Las inversiones recientes en cable de fibra óptica en toda la región dieron como resultado mejores latencias cuando comparamos el segundo trimestre de 2019 y el segundo trimestre de 2020. Brasil mostró una gran mejora en la latencia de banda ancha fija en comparación con el segundo trimestre de 2019, que disminuyó de 23 ms en el segundo trimestre de 2019 a 19 ms en el segundo trimestre de 2020. La latencia en México también cayó de 34 ms en el segundo trimestre de 2019 a 31 ms en el segundo trimestre de 2020. Los otros tres países de nuestra lista no experimentaron prácticamente ningún cambio en la latencia de banda ancha fija entre el segundo trimestre de 2019 y el segundo trimestre de 2020.

Hubo una variación entre los países en la latencia móvil durante el segundo trimestre de 2020. Argentina tuvo la mejor latencia móvil en 40 ms, seguido por Chile con 41 ms. Colombia tuvo la latencia móvil más alta durante este período con 47 ms.

México experimentó la mejora más amplia en su latencia móvil cuando se compara el segundo trimestre de 2019 y el segundo trimestre de 2020. La latencia móvil mejoró de 57 ms en el segundo trimestre de 2019 a 44 ms en el segundo trimestre de 2020. Los demás países de nuestra lista tuvieron pequeñas mejoras en su latencia móvil durante este período. En Chile, la latencia móvil aumentó año tras año, de 38 ms en el segundo trimestre 2019 a 41 ms en el segundo trimestre de 2020.

Las implementaciones de 5G en la región han comenzado recientemente, incluyendo el lanzamiento de la tecnología 5G DSS en Brasil. Aunque la tecnología todavía es bastante nueva en América Latina, tiene el potencial de mejorar radicalmente la latencia sobre lo que ofrecen actualmente los dispositivos con capacidad 4G.
Las velocidades de Internet aumentaron durante la pandemia

Tener una conexión a Internet rápida también es importante. Hemos usado datos de Speedtest Intelligence para rastrear el rendimiento de Internet a nivel global durante la pandemia. Si bien algunos países sufrieron una caída en las velocidades en Marzo, en líneas generales, las velocidades de banda ancha fija aumentaron en Argentina, Brasil, Chile, Colombia y México desde la semana de referencia del 2 de marzo de 2020. Salvo por Chile, estos países también experimentaron un aumento en las velocidades móviles, que varió de un aumento de 2 % en Colombia a un aumento de 19 % en México.

São Paulo tuvo la latencia de banda ancha fija más baja junto con Buenos Aires en móvil

Ookla_Latin_America_latency_cities_0720es-01
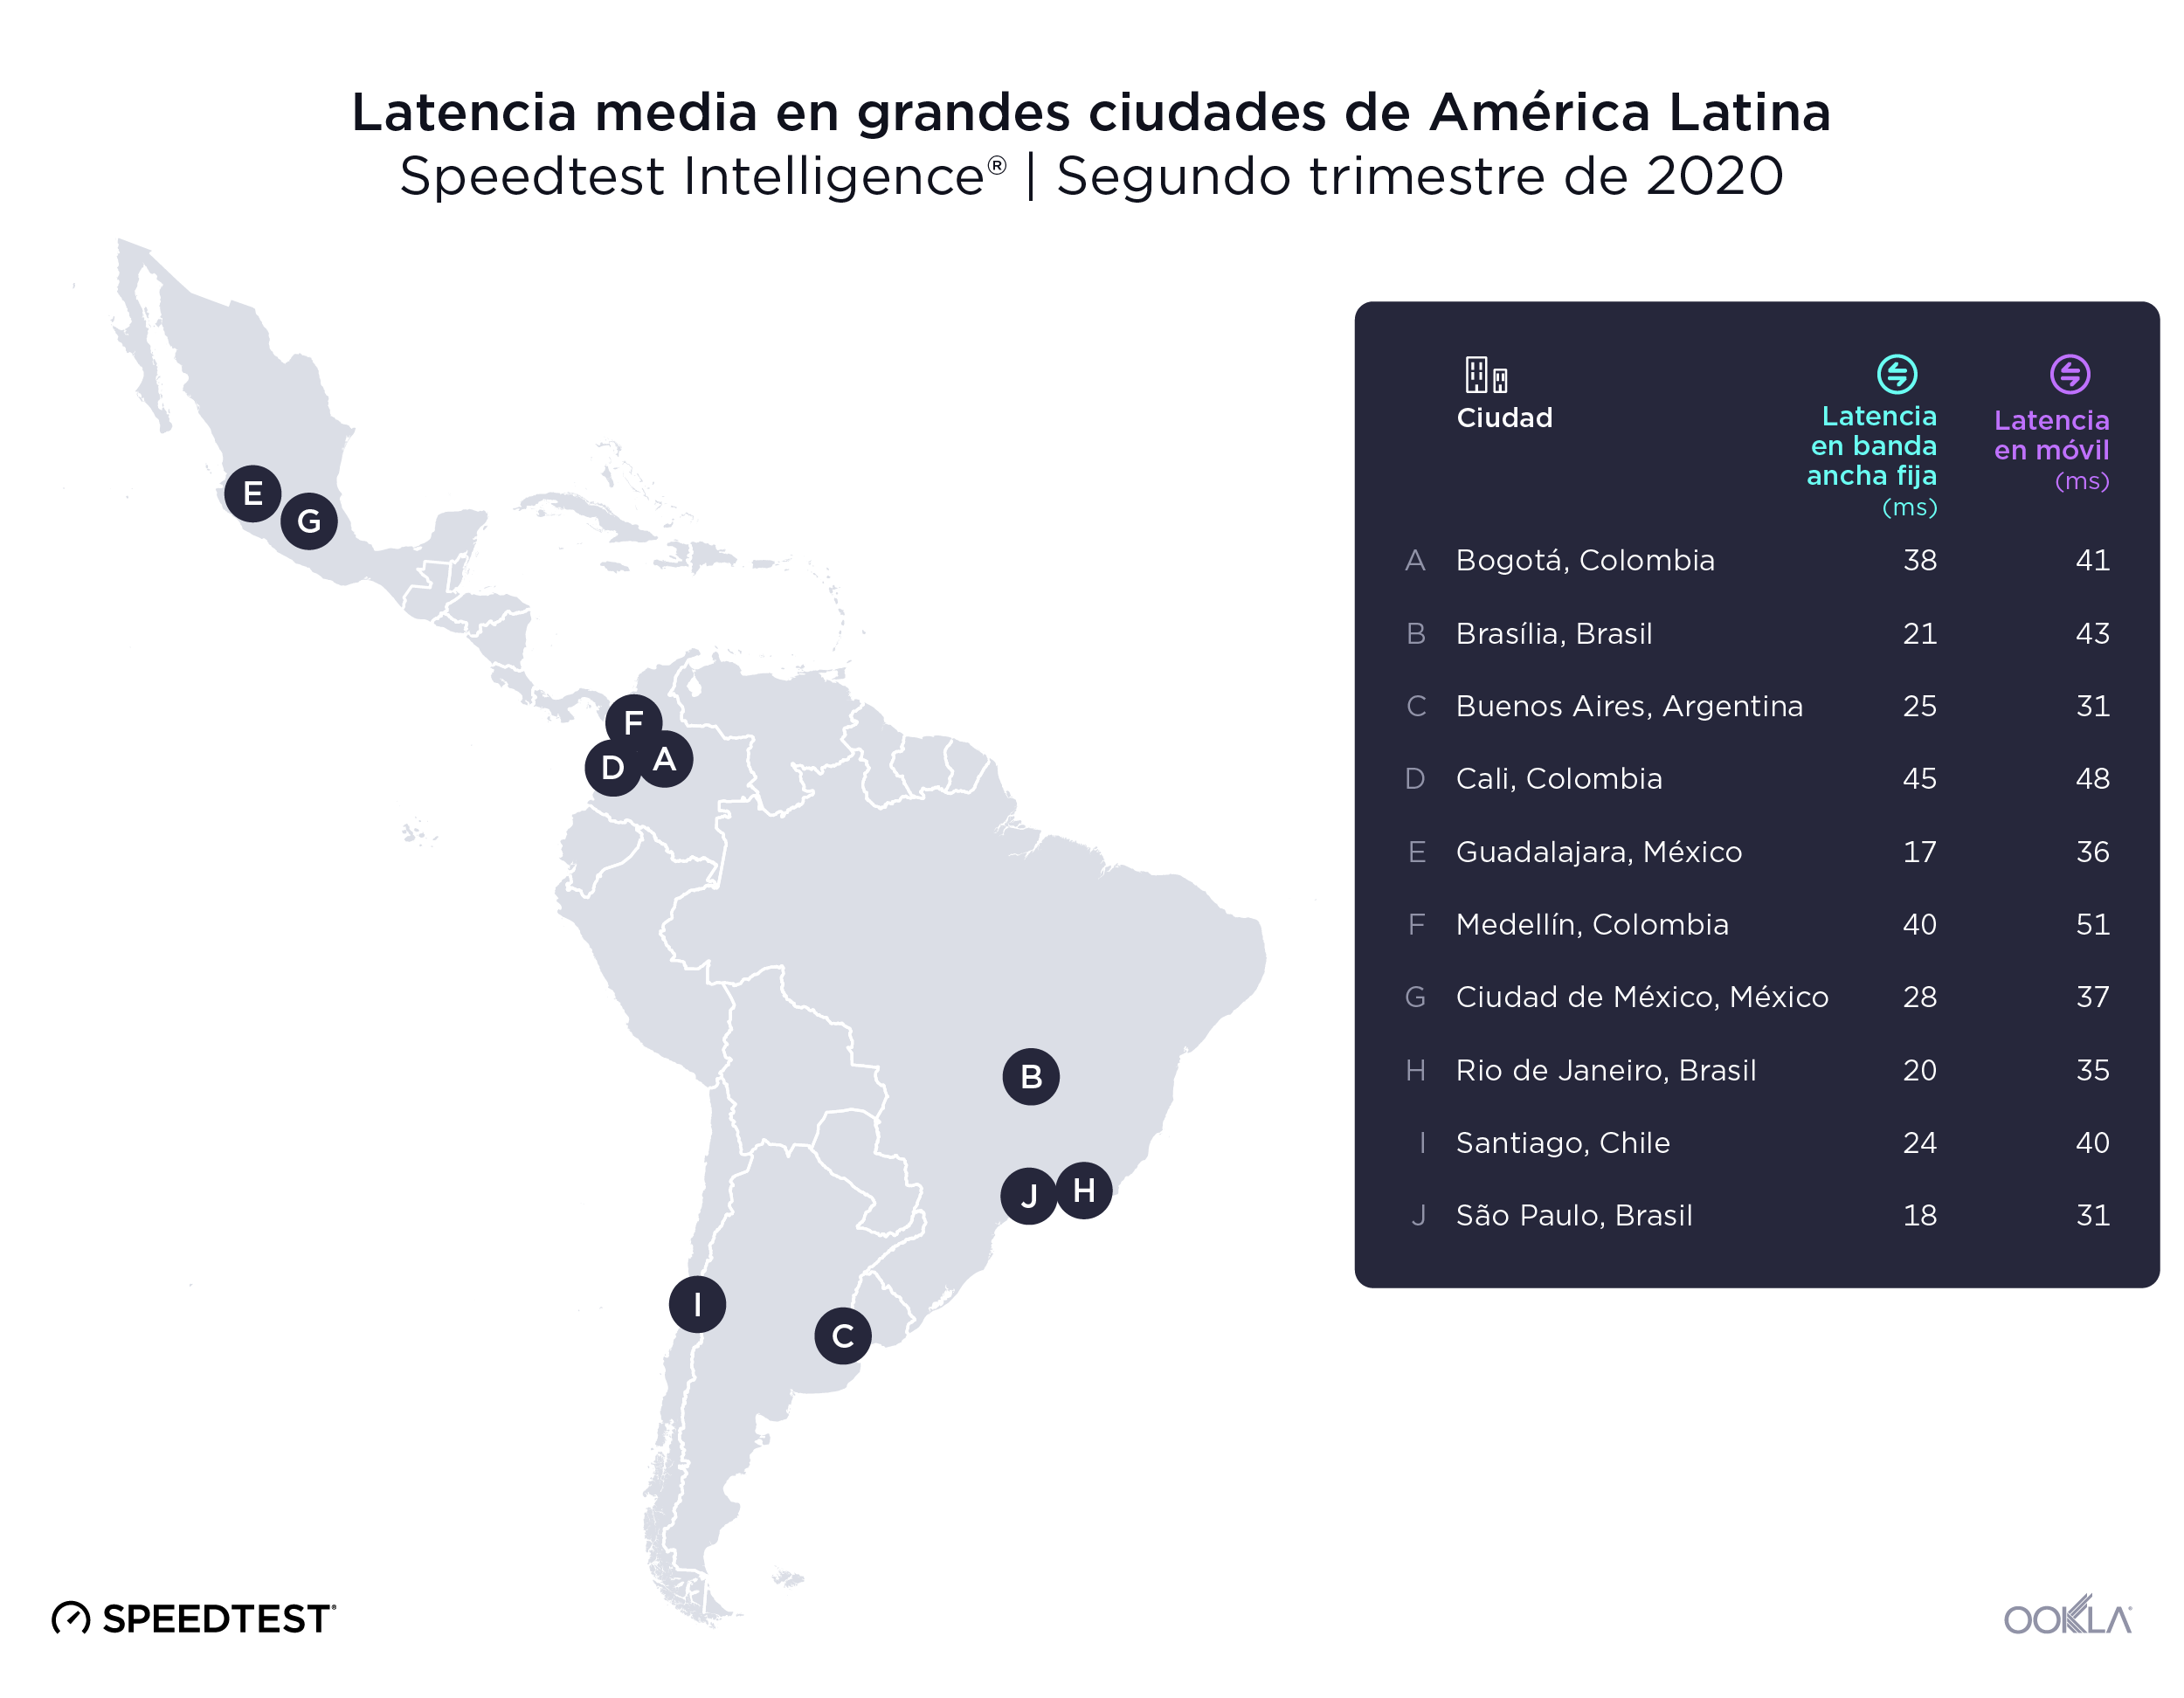
Latencia de banda ancha fija en algunas de las ciudades más grandes de América Latina, desde 17 ms en Guadalajara a 45 ms en Cali. Guadalajara, São Paulo y Río de Janeiro tuvieron la latencia de banda ancha fija más baja de nuestra lista durante el segundo trimestre de 2020 con 17 ms, 18 ms y 20 ms, respectivamente. Las ciudades colombianas de Bogotá, Medellín y Cali tuvieron las latencias más altas de banda ancha fija de nuestra lista con 38 ms, 40 ms y 45 ms, respectivamente. Todas las ciudades de esta lista tuvieron latencias de banda ancha fija por debajo de 59 ms, la medición recomendada para una experiencia de juego en línea sin problemas.

Al comparar los resultados año tras año del segundo trimestre de 2019, notamos aumentos en la latencia de banda ancha fija en casi todas las ciudades en el segundo trimestre de 2020. Cali fue la única ciudad de la lista en la que la latencia mejoró, desde 49 en el segundo trimestre de 2019 a 45 ms en el segundo trimestre de 2020.

São Paulo y Buenos Aires empataron con la latencia móvil más baja de la lista durante el segundo trimestre de 2020 con 31 ms. Río de Janeiro siguido con 34 ms. Brasilia, Cali y Medellín ocuparon los últimos tres puestos de la lista con latencias móviles de 43 ms, 48 ms y 51 ms, respectivamente.

La latencia móvil de Ciudad de México y São Paulo mejoró notablemente en el segundo trimestre de 2020 en comparación con el segundo trimestre de 2019. La latencia móvil de Ciudad de México cayó de 53 ms a 37 ms durante el mismo período. La latencia móvil en São Paulo cayó de 40 ms en el segundo trimestre de 2019 a 31 ms en el segundo trimestre de 2020. Solo una ciudad de nuestra lista no demostró mejoras en la latencia móvil al comparar el segundo trimestre de 2019 con el segundo trimestre de 2020, Santiago, donde la latencia móvil aumentó de 36 ms a 40 ms durante este período.

Los jugadores experimentados les gustará saber que las velocidades de internet y la latencia móvil están mejorando en muchas partes de América Latina. Deseamos ver cómo la latencia de banda ancha fija pasa al próximo nivel en un futuro cercano. Si desea obtener más información sobre el rendimiento de Internet en otras partes del mundo, visite Ookla ResearchTM.


Explorando a experiência de jogos online na América Latina

Os jogos online estão em alta na América Latina e no mundo inteiro. Isso está criando uma demanda por conexões de rede de baixa latência para que os jogadores possam desfrutar de uma experiência de jogo sem problemas nem atrasos. De acordo com dados da Speedtest Intelligence®, durante o segundo trimestre de 2020, a latência variou bastante entre países e cidades nas cinco economias mais fortes da América Latina, dando a alguns jogadores uma vantagem inesperada. Continue lendo para saber mais sobre a latência de banda larga móvel e fixa na Argentina, Brasil, Chile, Colômbia e México e ver em que país e em quais das cidades mais populosas os usuários provavelmente terão a melhor experiência de jogo.

A latência, ou o tempo de reação de uma conexão, é uma métrica fundamental nos jogos. Para ter a melhor experiência de jogo, os usuários devem ver a latência de 59 ms ou menos. Os dados abaixo mostram a latência média de cada local. A latência móvel é aplicável a jogos em dispositivos móveis, enquanto a latência de banda larga fixa mede a latência ao jogar no PC e em consoles.

O Brasil teve a menor latência de banda larga fixa e a Argentina teve a menor latência móvel

Ookla_Latin_America_latency_countries_0720_pt
Os jogadores no Brasil tiveram a menor latência média de banda larga fixa durante o segundo trimestre de 2020, com 19 ms. O Brasil foi seguido por Chile, México e Argentina. A Colômbia teve a maior latência de banda larga fixa durante esse período, com 43 ms.

Investimentos recentes em fibra em toda a região resultaram em latências aprimoradas ao comparar o segundo trimestre de 2019 e o segundo trimestre de 2020. O Brasil mostrou a maior melhoria na latência de banda larga fixa em comparação com o segundo trimestre de 2019, diminuindo de 23 ms para 19 ms no segundo trimestre de 2020. A latência no México também diminuiu, passando de 34 ms no segundo trimestre de 2019 para 31 ms no segundo trimestre de 2020. Os outros três países da nossa lista tiveram pouca ou nenhuma alteração na latência de banda larga fixa entre o segundo trimestre de 2019 e o segundo trimestre de 2020.

Os países tiveram menos variação na latência móvel durante o segundo trimestre de 2020. A Argentina teve a melhor latência em dispositivos móveis, com 40 ms, seguida de perto pelo Chile, com 41 ms. A Colômbia teve a maior latência móvel durante esse período, com 47 ms.

No segundo trimestre de 2020, o México conseguiu a maior melhoria na latência móvel em comparação com o segundo trimestre de 2019. A latência móvel melhorou de 57 ms no segundo trimestre de 2019 para 44 ms no segundo trimestre de 2020. A latência móvel dos outros países da lista melhorou um pouco menos durante esse período. No Chile, a latência móvel inclusive aumentou de um ano para outro, de 38 ms no segundo trimestre de 2019 para 41 ms no segundo trimestre de 2020.

As implementações de 5G na região começaram recentemente, incluindo o lançamento da tecnologia 5G DSS no Brasil. Embora a tecnologia ainda seja relativamente nova na América Latina, ela tem o potencial de melhorar radicalmente a latência sobre o que os dispositivos com capacidade 4G oferecem atualmente.

A velocidade da Internet aumentou durante a pandemia

Ter uma conexão rápida com a Internet também é importante para os jogadores. Usamos dados da Speedtest Intelligence para acompanhar o desempenho da Internet em nível global durante a pandemia. Embora alguns países tenham tido uma queda nas velocidades em março, no geral, as velocidades de Internet de banda larga fixa aumentaram na Argentina, no Brasil, no Chile, na Colômbia e no México desde a semana base de 2 de março de 2020. Exceto no Chile, esses países também tiveram um aumento nas velocidades em dispositivos móveis, variando de um aumento de 2% na Colômbia até um aumento de 19% no México.

São Paulo teve a menor latência de banda larga fixa, enquanto Buenos Aires em dispositivos móveis

Ookla_Latin_America_latency_cities_0720_pt2
A latência de banda larga fixa em algumas das maiores cidades da América Latina variou de 17 ms em Guadalajara a 45 ms em Cali. Guadalajara, São Paulo e Rio de Janeiro tiveram as menores latências de banda larga fixa da nossa lista durante o segundo trimestre de 2020, com 17 ms, 18 ms e 20 ms, respectivamente. As cidades colombianas de Bogotá, Medellín e Cali apresentaram as maiores latências em banda larga fixa em nossa lista, com 38 ms, 40 ms e 45 ms, respectivamente. Todas as cidades desta lista ainda apresentaram latências em banda larga fixa abaixo de 59 ms, a medida recomendada para uma experiência de jogo sem problemas.

Ao comparar os resultados ano a ano para o segundo trimestre de 2019, vimos aumentos na latência de banda larga fixa em quase todas as cidades no segundo trimestre de 2020. Cali foi a única cidade da lista em que a latência melhorou, passando de 49 ms no segundo trimestre de 2019 para 45 ms no segundo trimestre de 2020.

São Paulo e Buenos Aires empataram na menor latência móvel da nossa lista durante o segundo trimestre de 2020, com 31 ms. Rio de Janeiro em seguida, com 35 ms. Brasília, Cali e Medellín ocuparam os três últimos lugares da lista, com latências móveis de 43 ms, 48 ms e 51 ms, respectivamente.

As latências móveis da Cidade do México e de Guadalajara melhoraram significativamente no segundo trimestre de 2020, em comparação com o segundo trimestre de 2019. A latência móvel na Cidade do México diminuiu de 53 ms para 37 ms no mesmo período. A latência móvel em São Paulo caiu de 40 ms no segundo trimestre de 2019 para 31 ms no segundo trimestre de 2020. Apenas uma cidade da nossa lista não mostrou melhoria na latência móvel na comparação entre o segundo trimestre de 2019 e o segundo trimestre de 2020: Santiago. Lá, a latência móvel aumentou de 36 ms para 40 ms durante esse período.

Quem gosta de jogos eletrônicos na América Latina ficará muito feliz em saber que as velocidades da Internet e a latência móvel estão melhorando em muitas partes da região. Estamos ansiosos para ver se a latência de banda larga fixa alcançará outro nível em um futuro próximo. Se você estiver interessado em aprender mais sobre o desempenho da Internet em outras partes do mundo, visite Ookla ResearchTM.

Ookla retains ownership of this article including all of the intellectual property rights, data, content graphs and analysis. This article may not be quoted, reproduced, distributed or published for any commercial purpose without prior consent. Members of the press and others using the findings in this article for non-commercial purposes are welcome to publicly share and link to report information with attribution to Ookla.

| August 12, 2020

Mobile Speeds Lead in Southern Africa

In many parts of the world, consumers are used to fixed broadband speeds that vastly outpace those on mobile. Not so in Southern Africa where the infrastructure challenges associated with improving fixed-line broadband have often made mobile a more attractive option for consumers. Today we are exploring mean and median download speeds on both mobile and fixed broadband in Botswana, Eswatini, Lesotho, Namibia and South Africa during Q2 2020 using Speedtest Intelligence®.

This article uses two measures to describe “typical” internet performance: mean and median. Mean, which people are often most familiar with, is calculated by adding all data points together and dividing by the number of data points. Median is the middle value in a series. Approximately half of the observed values are lower than the median, and half are greater. Both mean and median have advantages and disadvantages. Because median is less impacted by rare instances of values that are extremely high or low, it is more “robust” than mean at representing the data that have already been seen. Mean, on the other hand, is much more sensitive to high and low values. Because its value can change more quickly, the mean can be more informative about what values to expect in the future. Importantly, while mean and median are both informative on their own, viewing them in combination can reveal how “skewed” the data are. With Speedtest® data, this can indicate when certain customers are receiving service that is notably fast or slow among other things.

South Africa had fastest speeds on fixed broadband

Ookla_Southern-Africa_fixed_downloads_0820
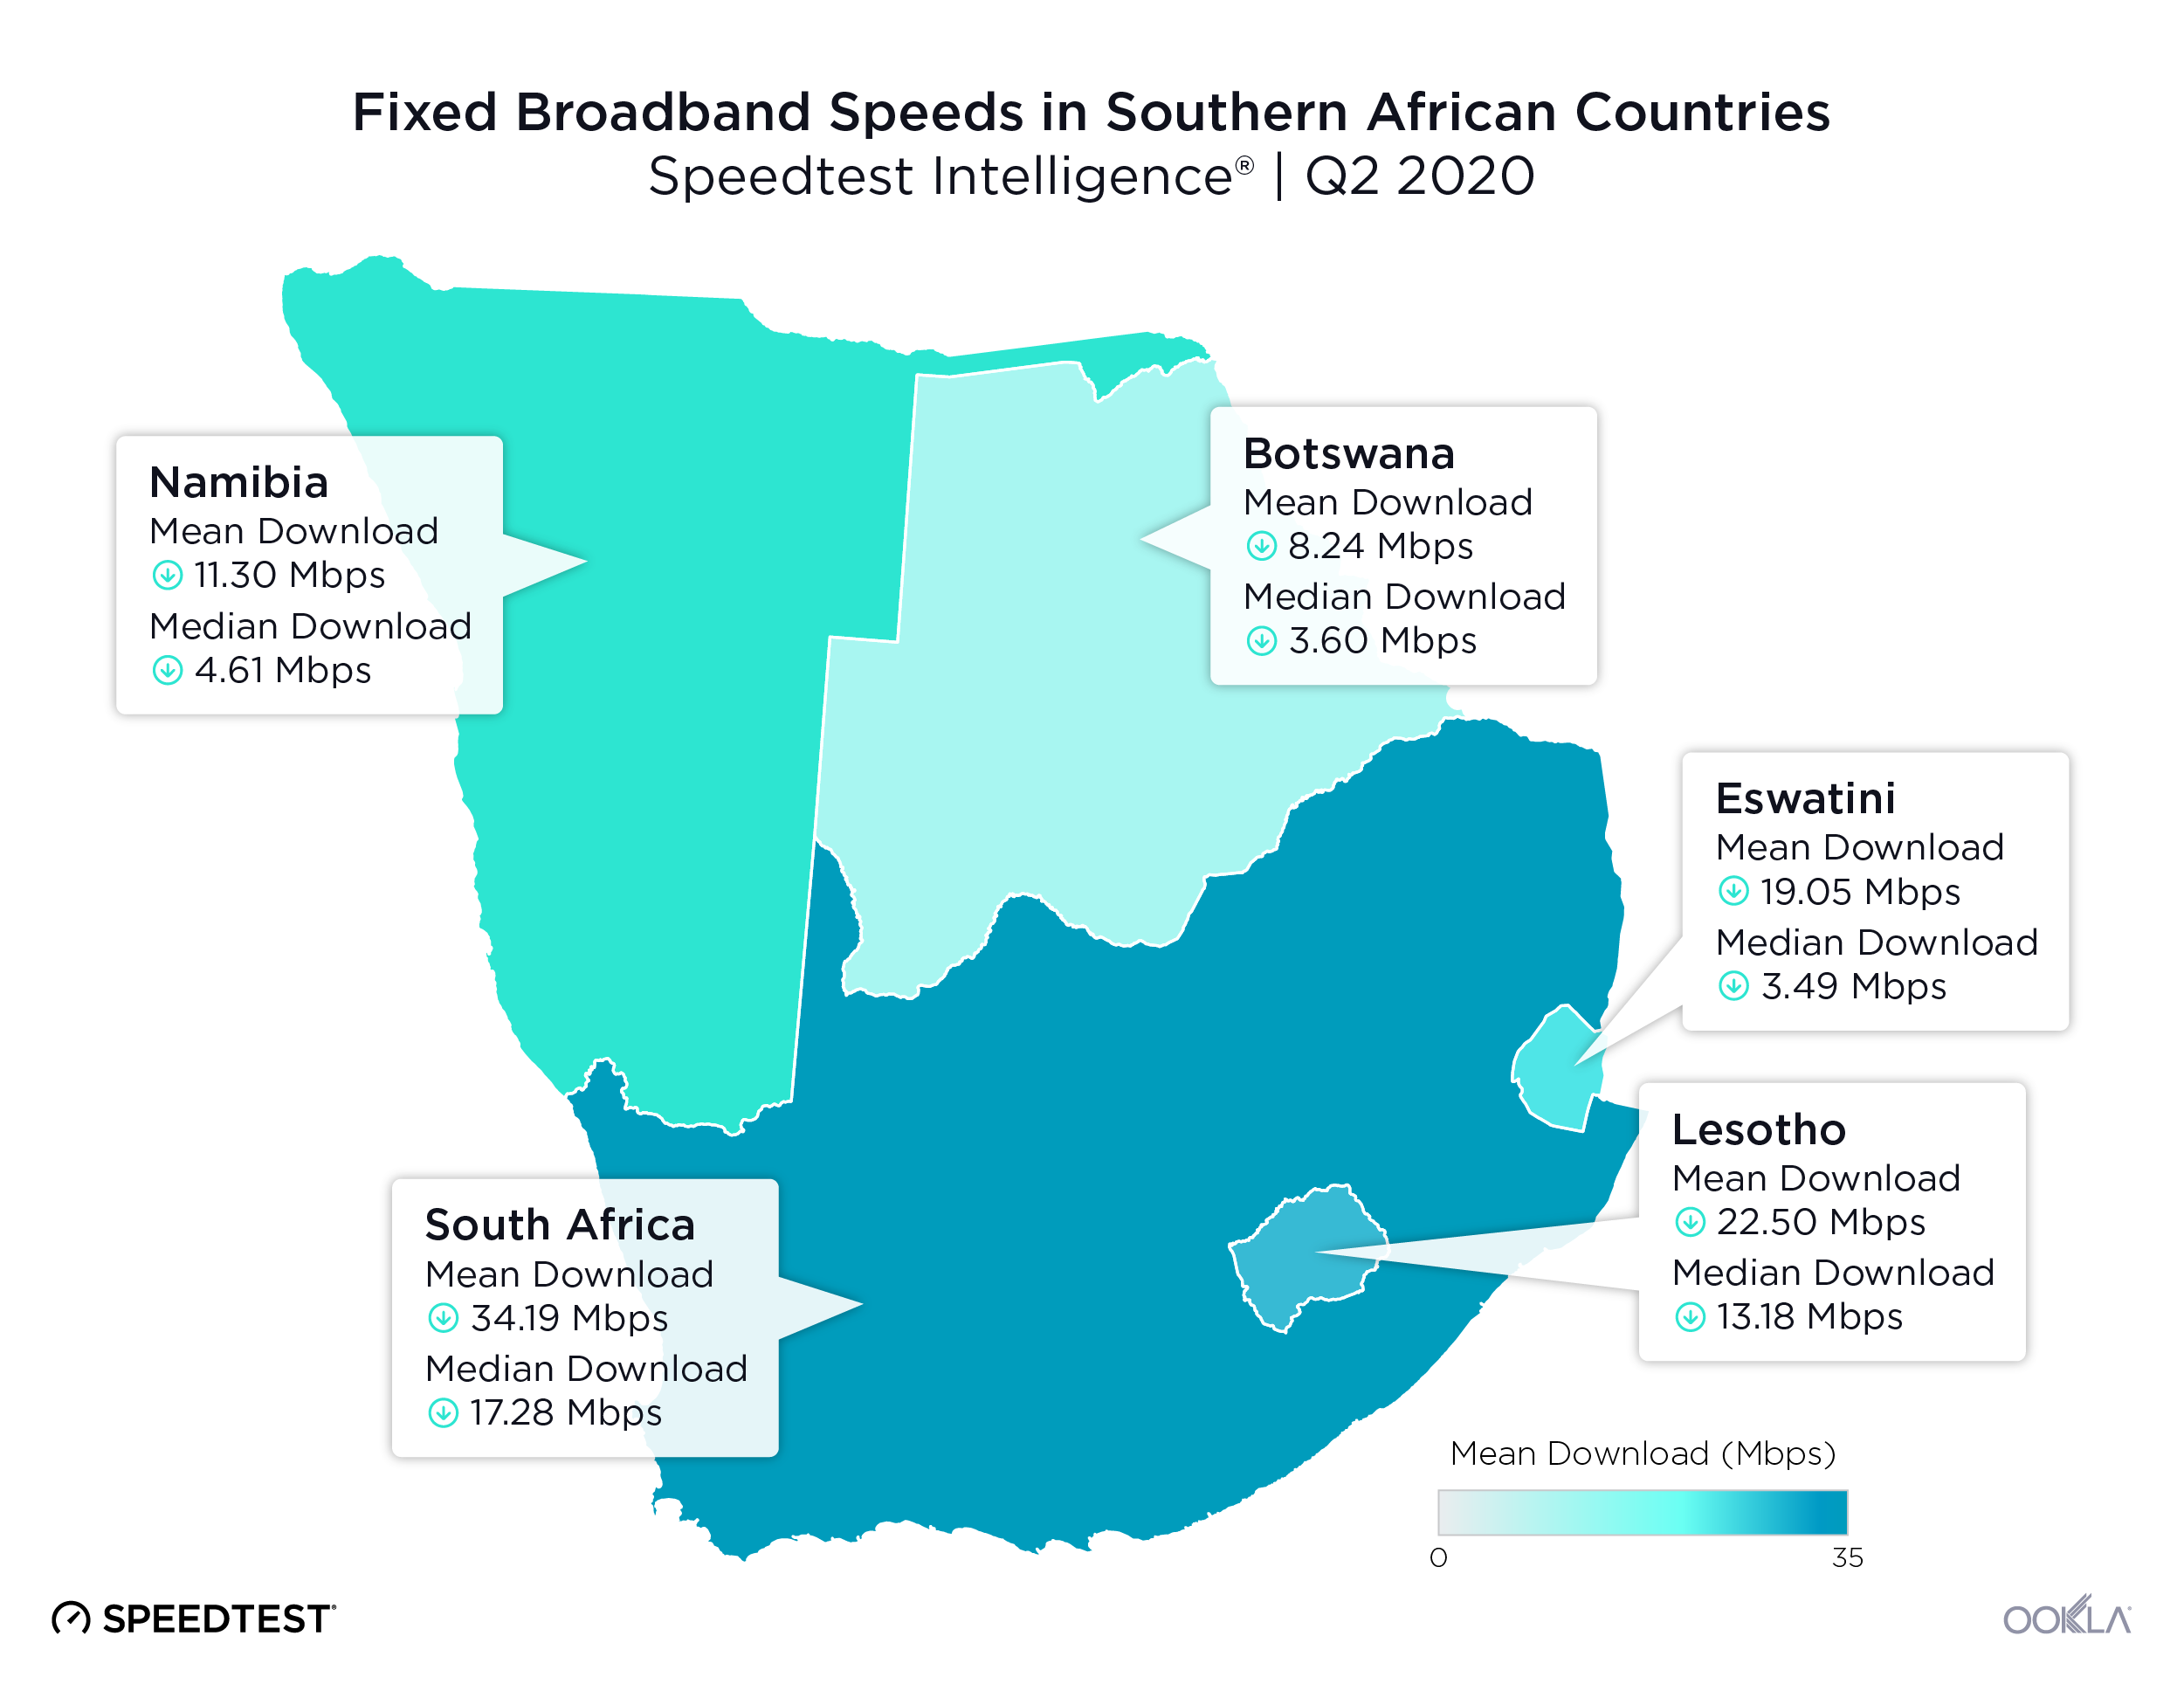
Mean download speeds over fixed broadband varied greatly between Southern African countries during Q2 2020. South Africa showed the fastest mean download speeds on our list at 34.19 Mbps, followed by Lesotho at 22.50 Mbps. Botswana had the slowest mean download speed at 8.24 Mbps, 75.3% slower than South Africa.

The differences between countries are much smaller when comparing median speeds, indicating that a smaller number of faster connections is bringing up the mean. This effect was least obvious in Botswana. Median speeds on fixed broadband ranged from a high of 17.28 Mbps in South Africa to a low of 3.49 Mbps in Eswatini. Lesotho followed South Africa closely with 13.18 Mbps, while Botswana almost tied with Eswatini at the bottom of the list at 3.60 Mbps. This leaves Eswatini with a very large skew between mean and median download speed, showing that there is a large difference between the speeds consumers experience. The smaller gap between median and mean speeds in South Africa shows that customers are more likely overall to have faster service.

South Africa had fastest mean download speeds on mobile

Ookla_Southern-Africa_mobile_downloads_0820
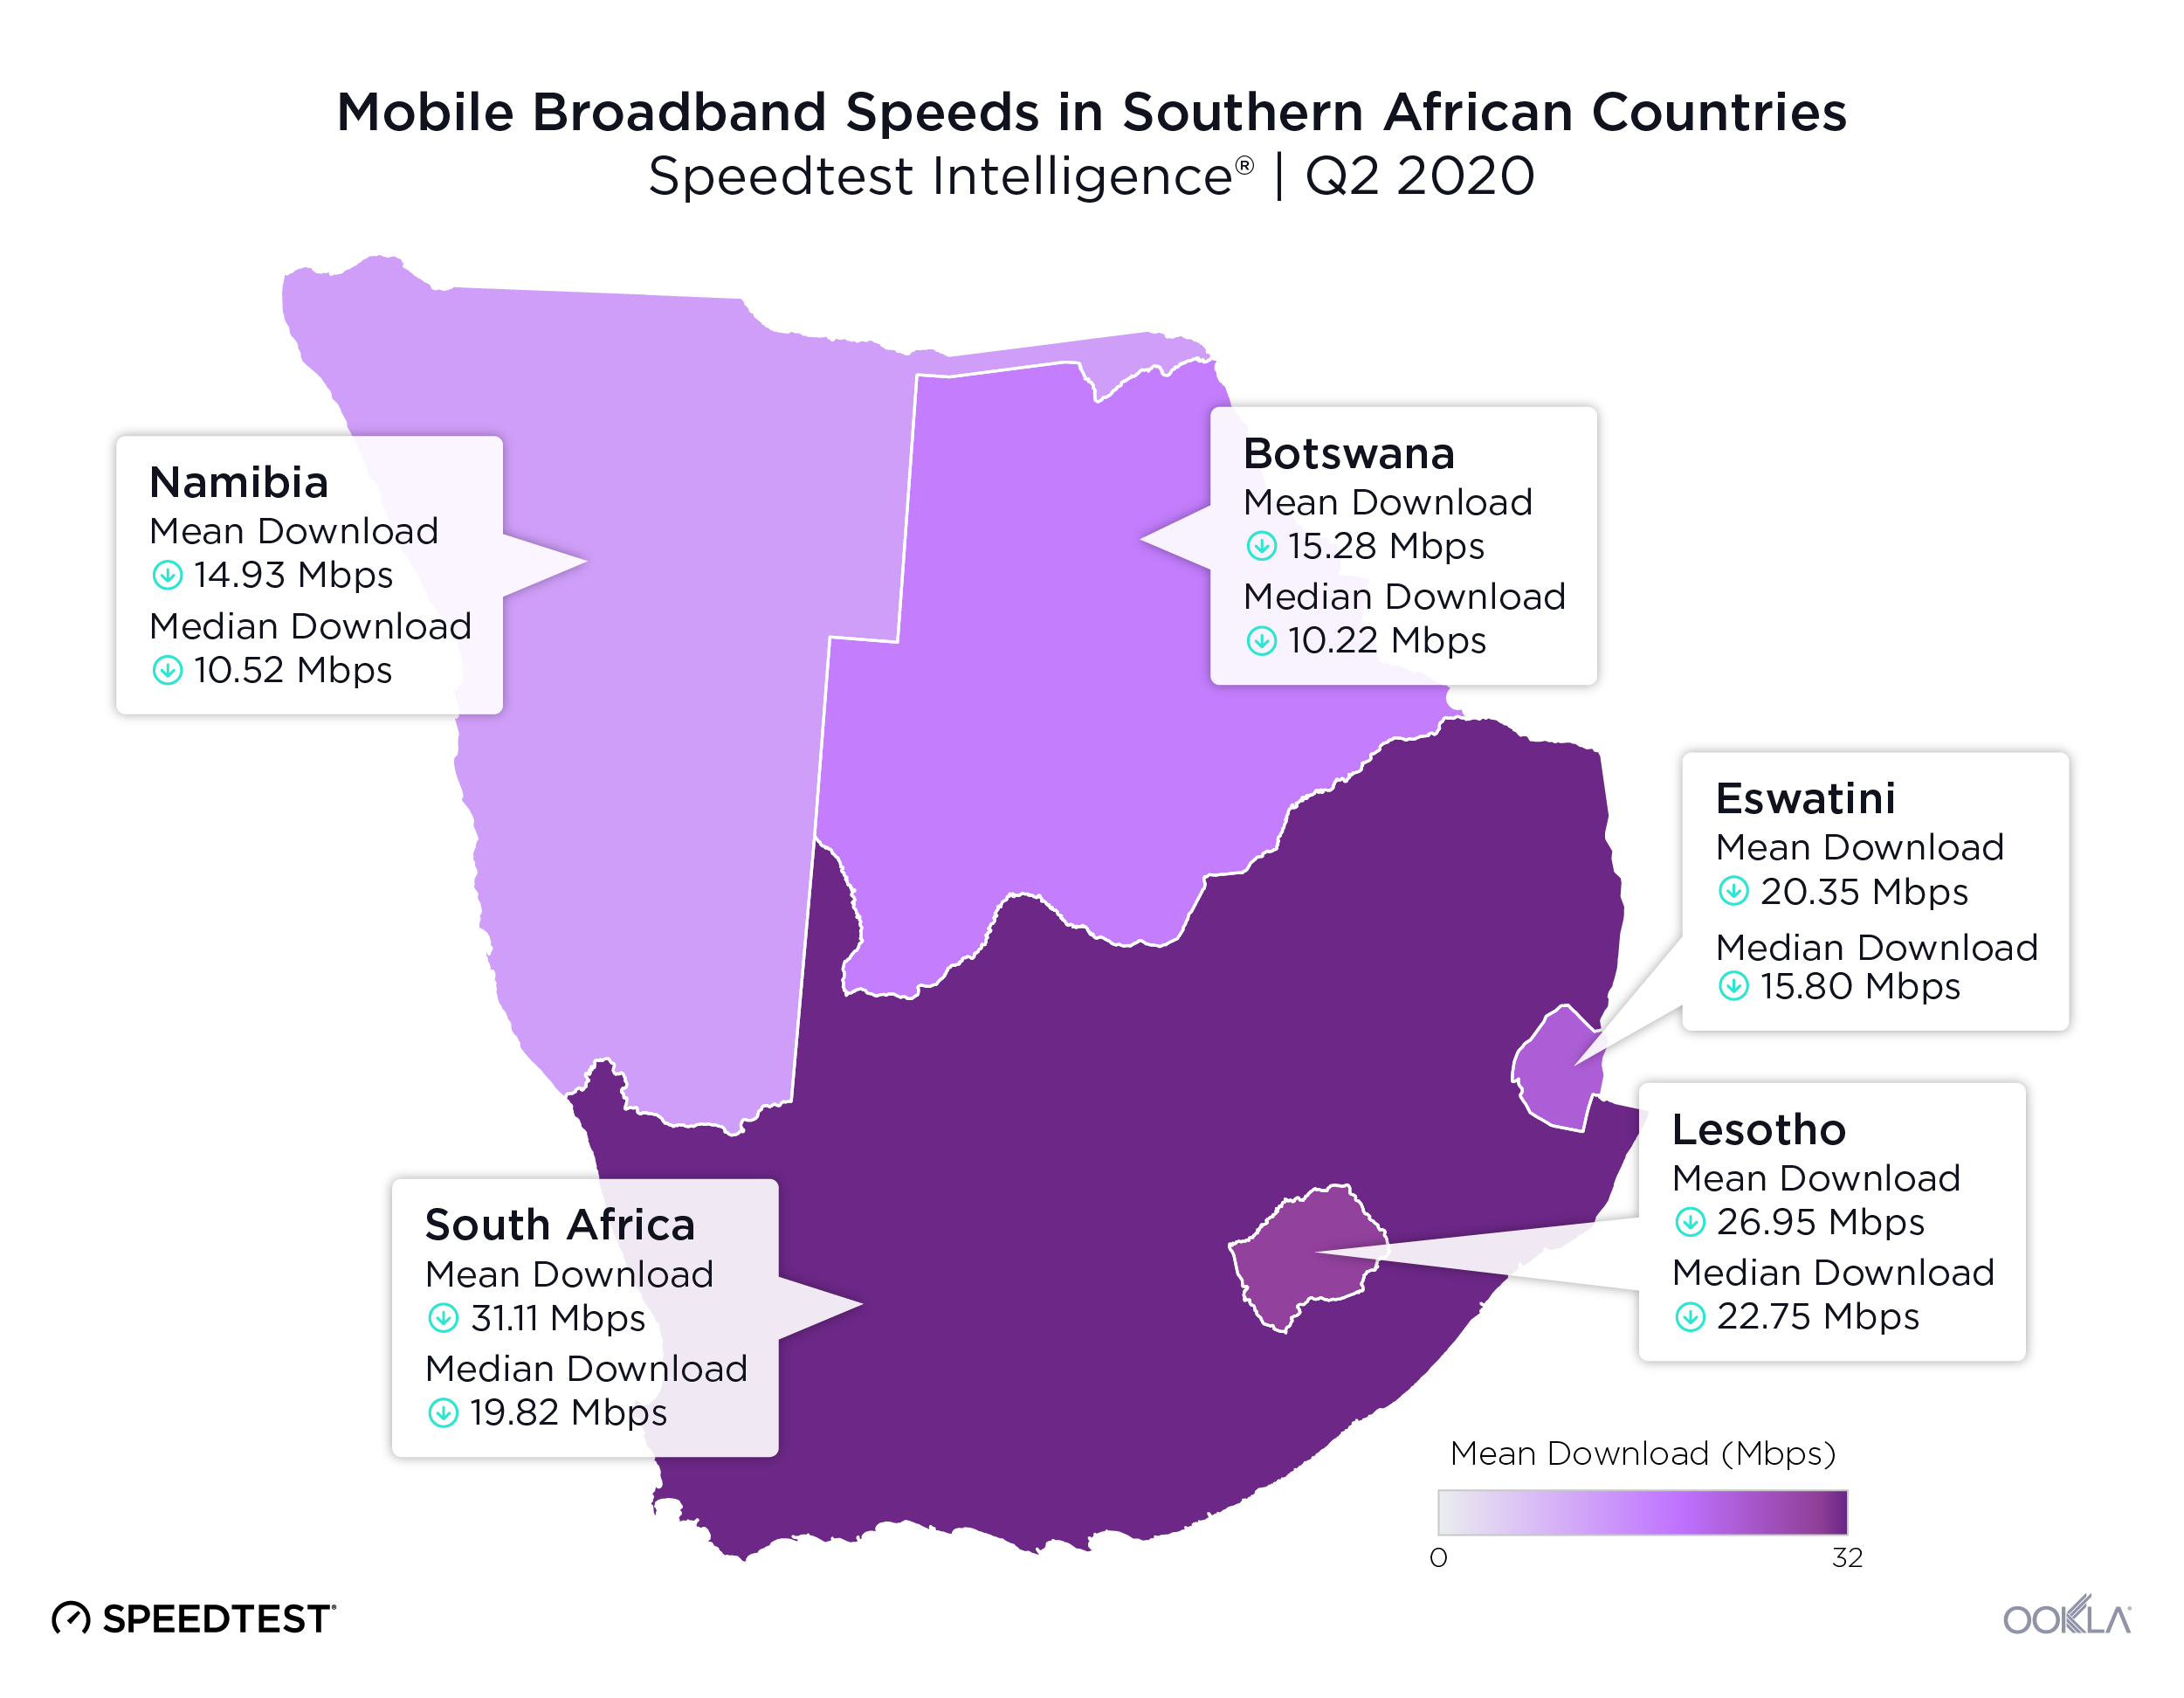
The disparity in mean download speed on mobile was less severe during Q2 2020 than we saw on fixed broadband, ranging from 31.11 Mbps in South Africa to 14.93 Mbps in Namibia. Namibia’s mean download speed on mobile broadband was 52.0% slower than South Africa’s. South Africa is also the only country on this list with commercially available 5G, according to the Ookla 5G Map™. 5G will have a much larger impact on mean speeds than on median.

Median download speeds on mobile broadband compared much more closely with mean download speeds than we saw when we were looking at fixed broadband. This indicates that more consumers are experiencing similar speeds without the top-tier outliers we saw on fixed broadband. Lesotho had the fastest median download speed on mobile at 22.75 Mbps and was followed closely by South Africa at 19.82 Mbps. Namibia and Botswana had the slowest median download speeds on mobile at 10.52 Mbps and 10.22 Mbps, respectively.

Mean and median mobile download speeds were closest to equal in Lesotho, indicating their mobile service is uniformly strong across the country and consumers experience relatively similar speeds. Lesotho’s smaller footprint is advantageous to mobile operators because there is less area to cover with mobile service, but the mountainous nature of the country often provides an infrastructure challenge that operators appear to have risen to.

Median download speeds on mobile were faster than on fixed broadband throughout Southern Africa

Ookla_Southern-Africa_mobile-vs-fixed_downloads_0820
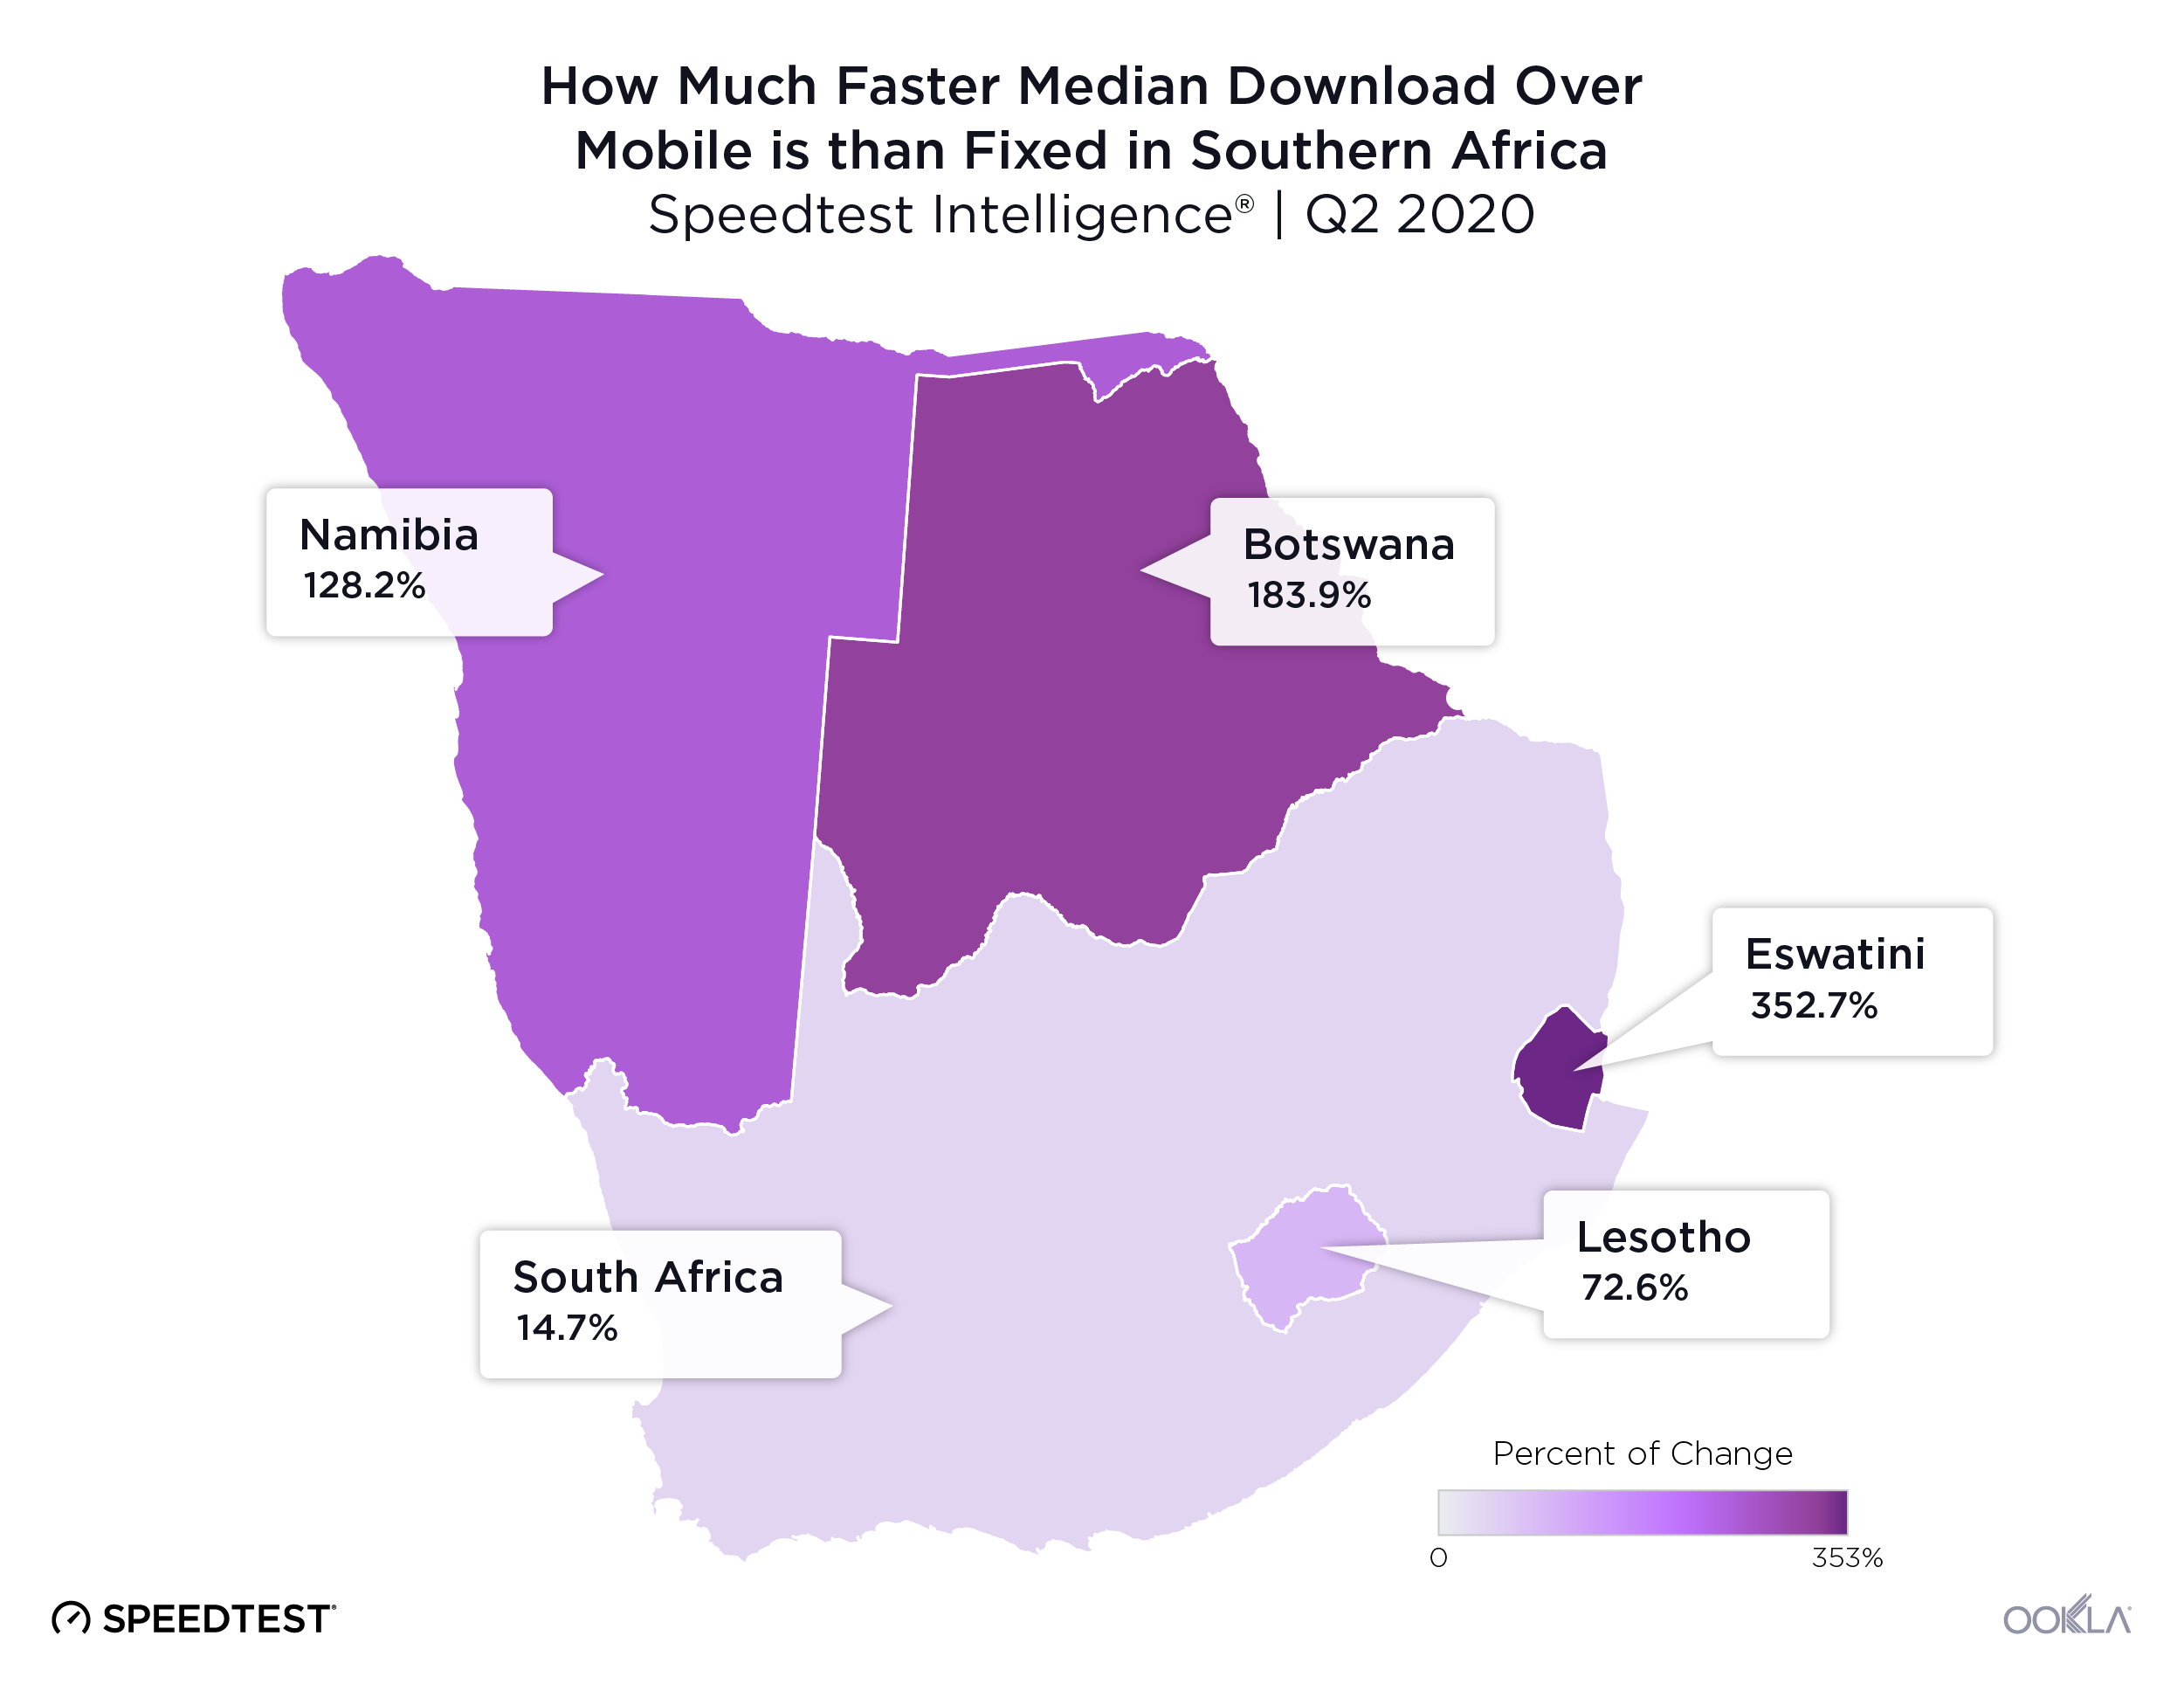
In Q2 2020, there was a considerable difference in median download speeds between mobile and fixed broadband in all Southern African countries. Most notably, Eswatini’s median download speed on mobile was 352.7% faster than its median download speed on fixed broadband. With the exception of South Africa, all countries in Southern Africa also showed higher mean download speeds on mobile than those on fixed.

Lesotho led 4G Availability in Southern Africa

Ookla_Southern-Africa_4G-availability_0820-1
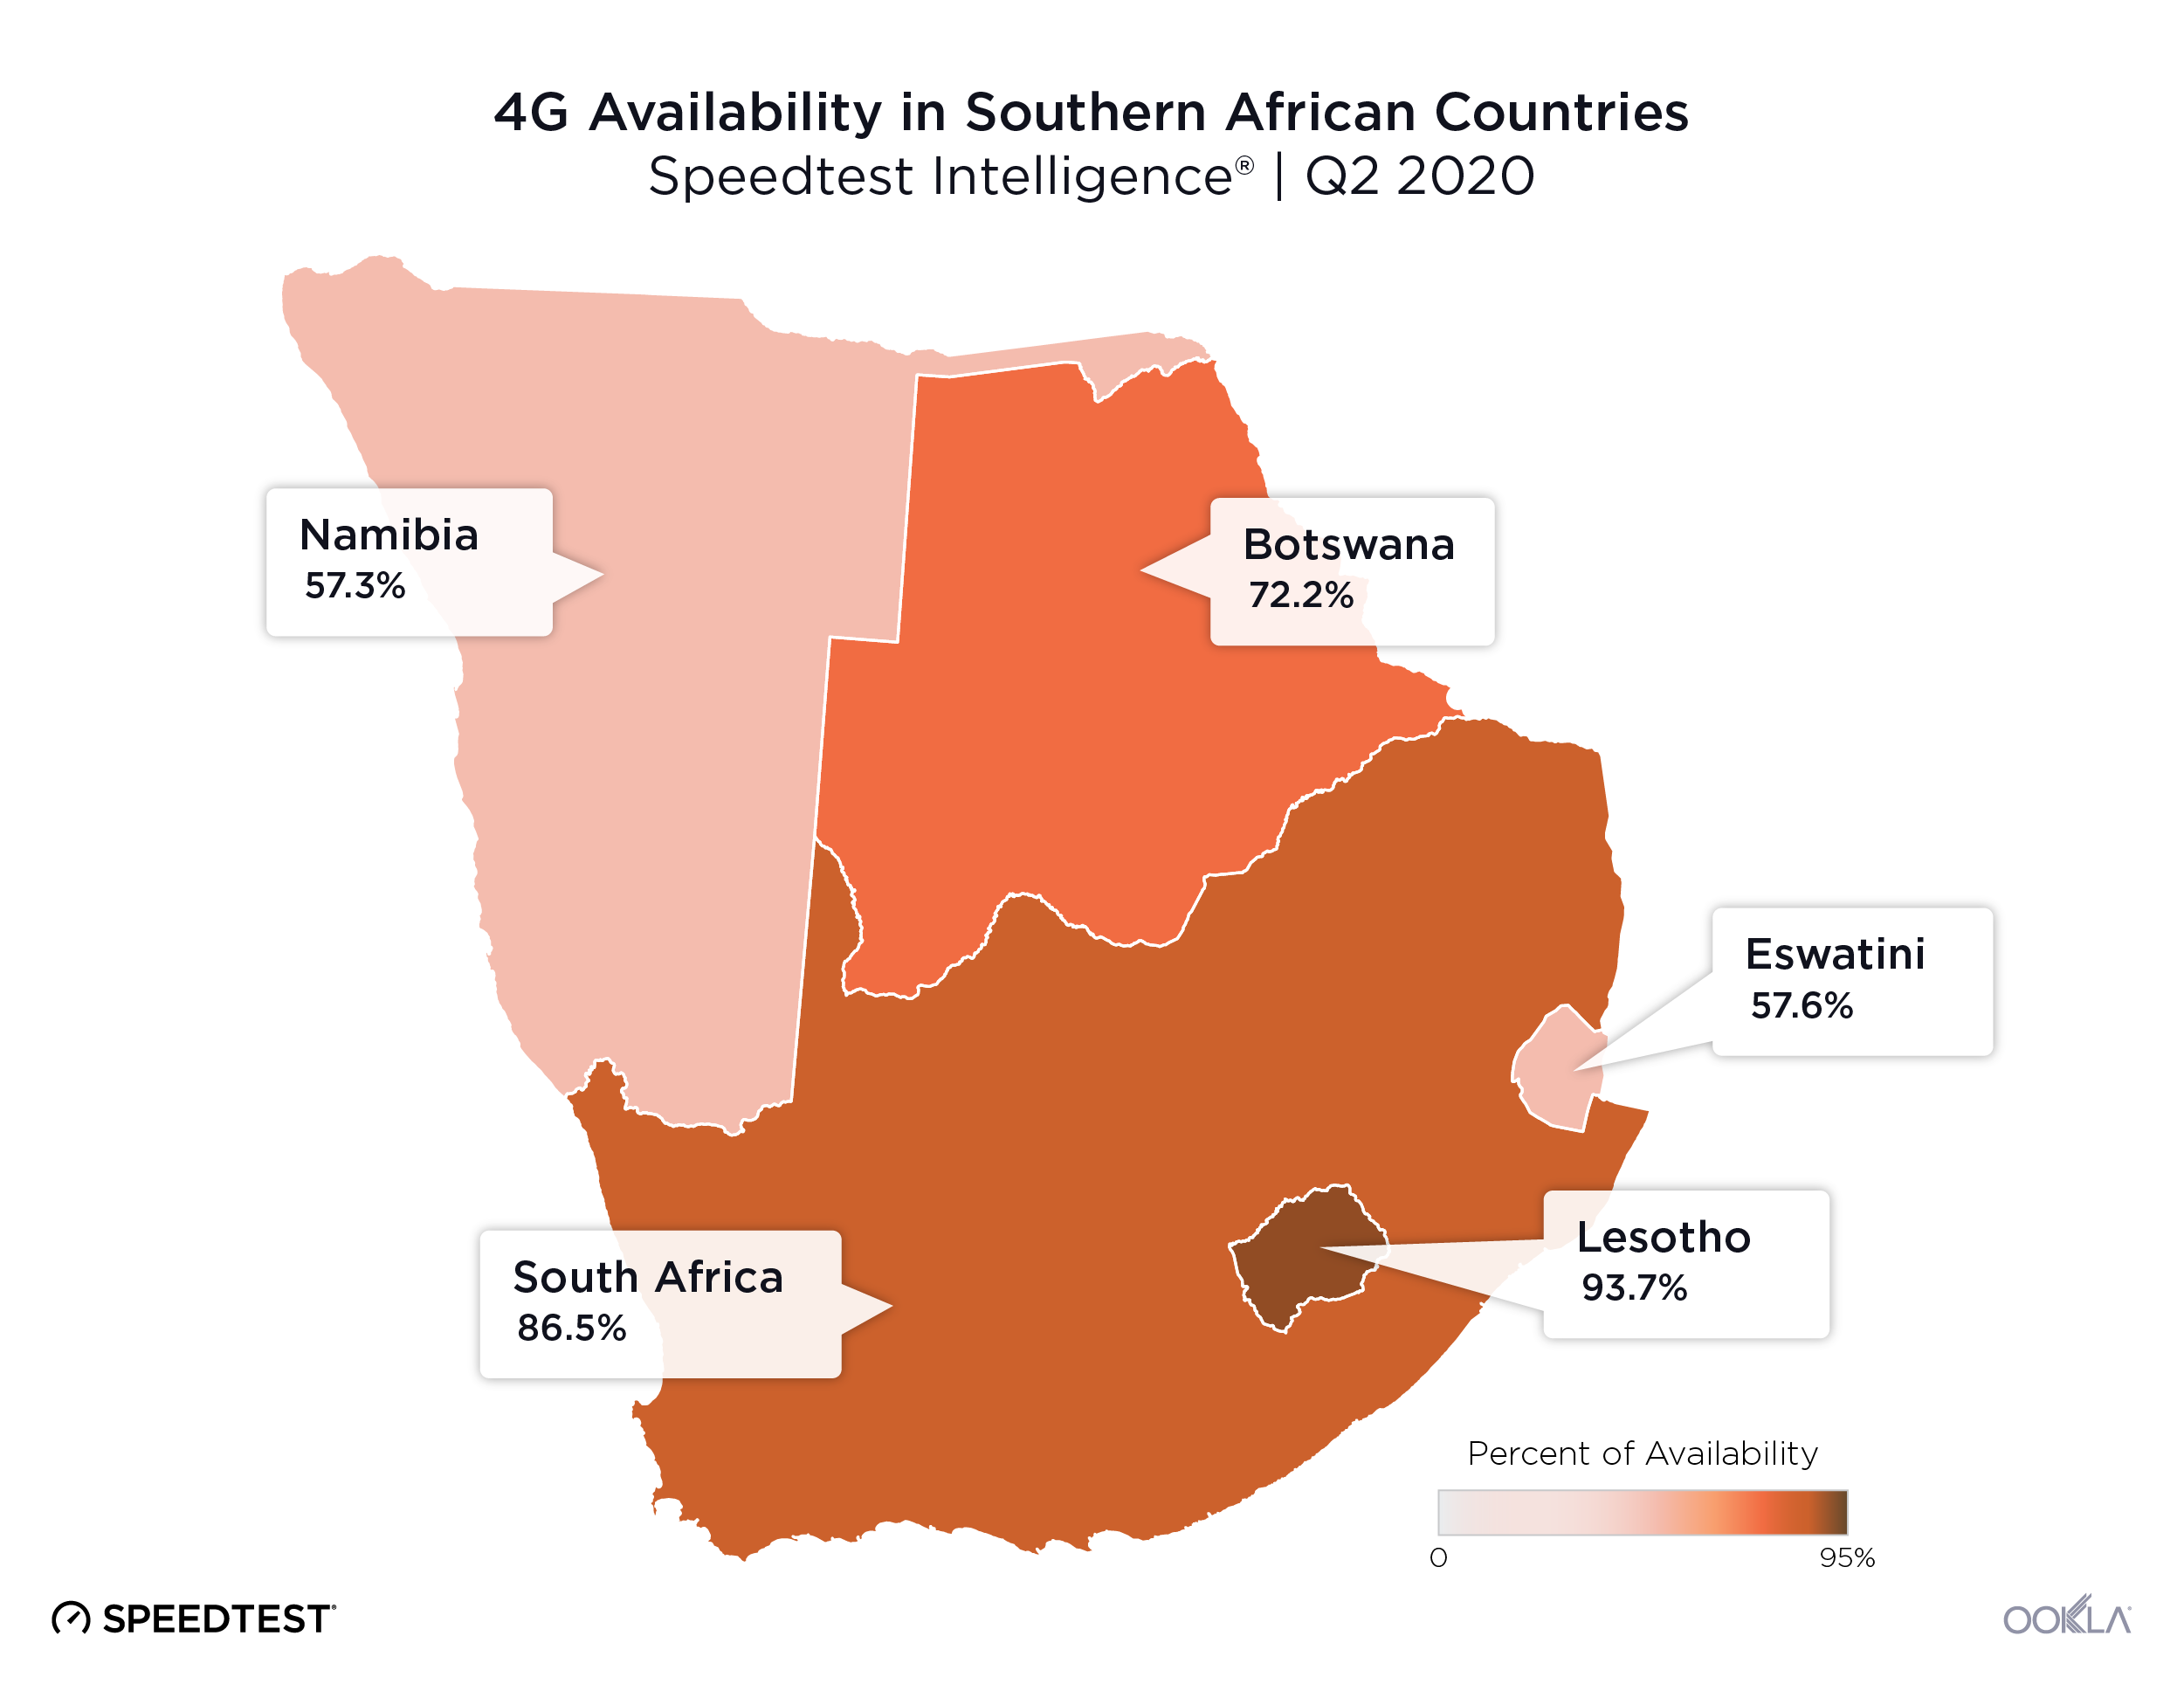
We used data from Speedtest coverage scans on Android to compare 4G Availability across Southern Africa during Q2 2020. 4G Availability ranged between a high of 93.7% in Lesotho and a low of 57.3% in Namibia.

We look forward to seeing if fixed broadband speeds improve across Southern Africa in the near future or if Southern Africa is showing a path for continued mobile dominance. To read more about internet performance in other markets, visit Ookla Research™.

Ookla retains ownership of this article including all of the intellectual property rights, data, content graphs and analysis. This article may not be quoted, reproduced, distributed or published for any commercial purpose without prior consent. Members of the press and others using the findings in this article for non-commercial purposes are welcome to publicly share and link to report information with attribution to Ookla.

| September 8, 2020

Exploring the Relationship Between Network Performance and NPS in Taiwan


中文

Network performance is a key element of customer experience, but it may not be the only deciding factor in how a customer perceives their mobile operator and their service. Using data from Speedtest Intelligence®, we compared performance for mobile network operators (MNOs) in Taiwan during Q2 2020. We also compared provider performance to Speedtest Consumer Sentiment™ data on five-star ratings and Net Promoter Score (NPS) to understand how network performance impacts customer satisfaction.

Chunghwa Telecom was fastest in Taiwan

Mobile performance in Taiwan has improved at the country level over the last year. Mean download speed on mobile reached 42.81 Mbps in Q2 2019 and increased 9.8% to 46.99 Mbps in Q2 2020. For context, Taiwan ranked 18th in the world for mobile download speed in July 2020 according to the Speedtest Global Index™.
Taiwan_Speed_Score_Q2_2020_en

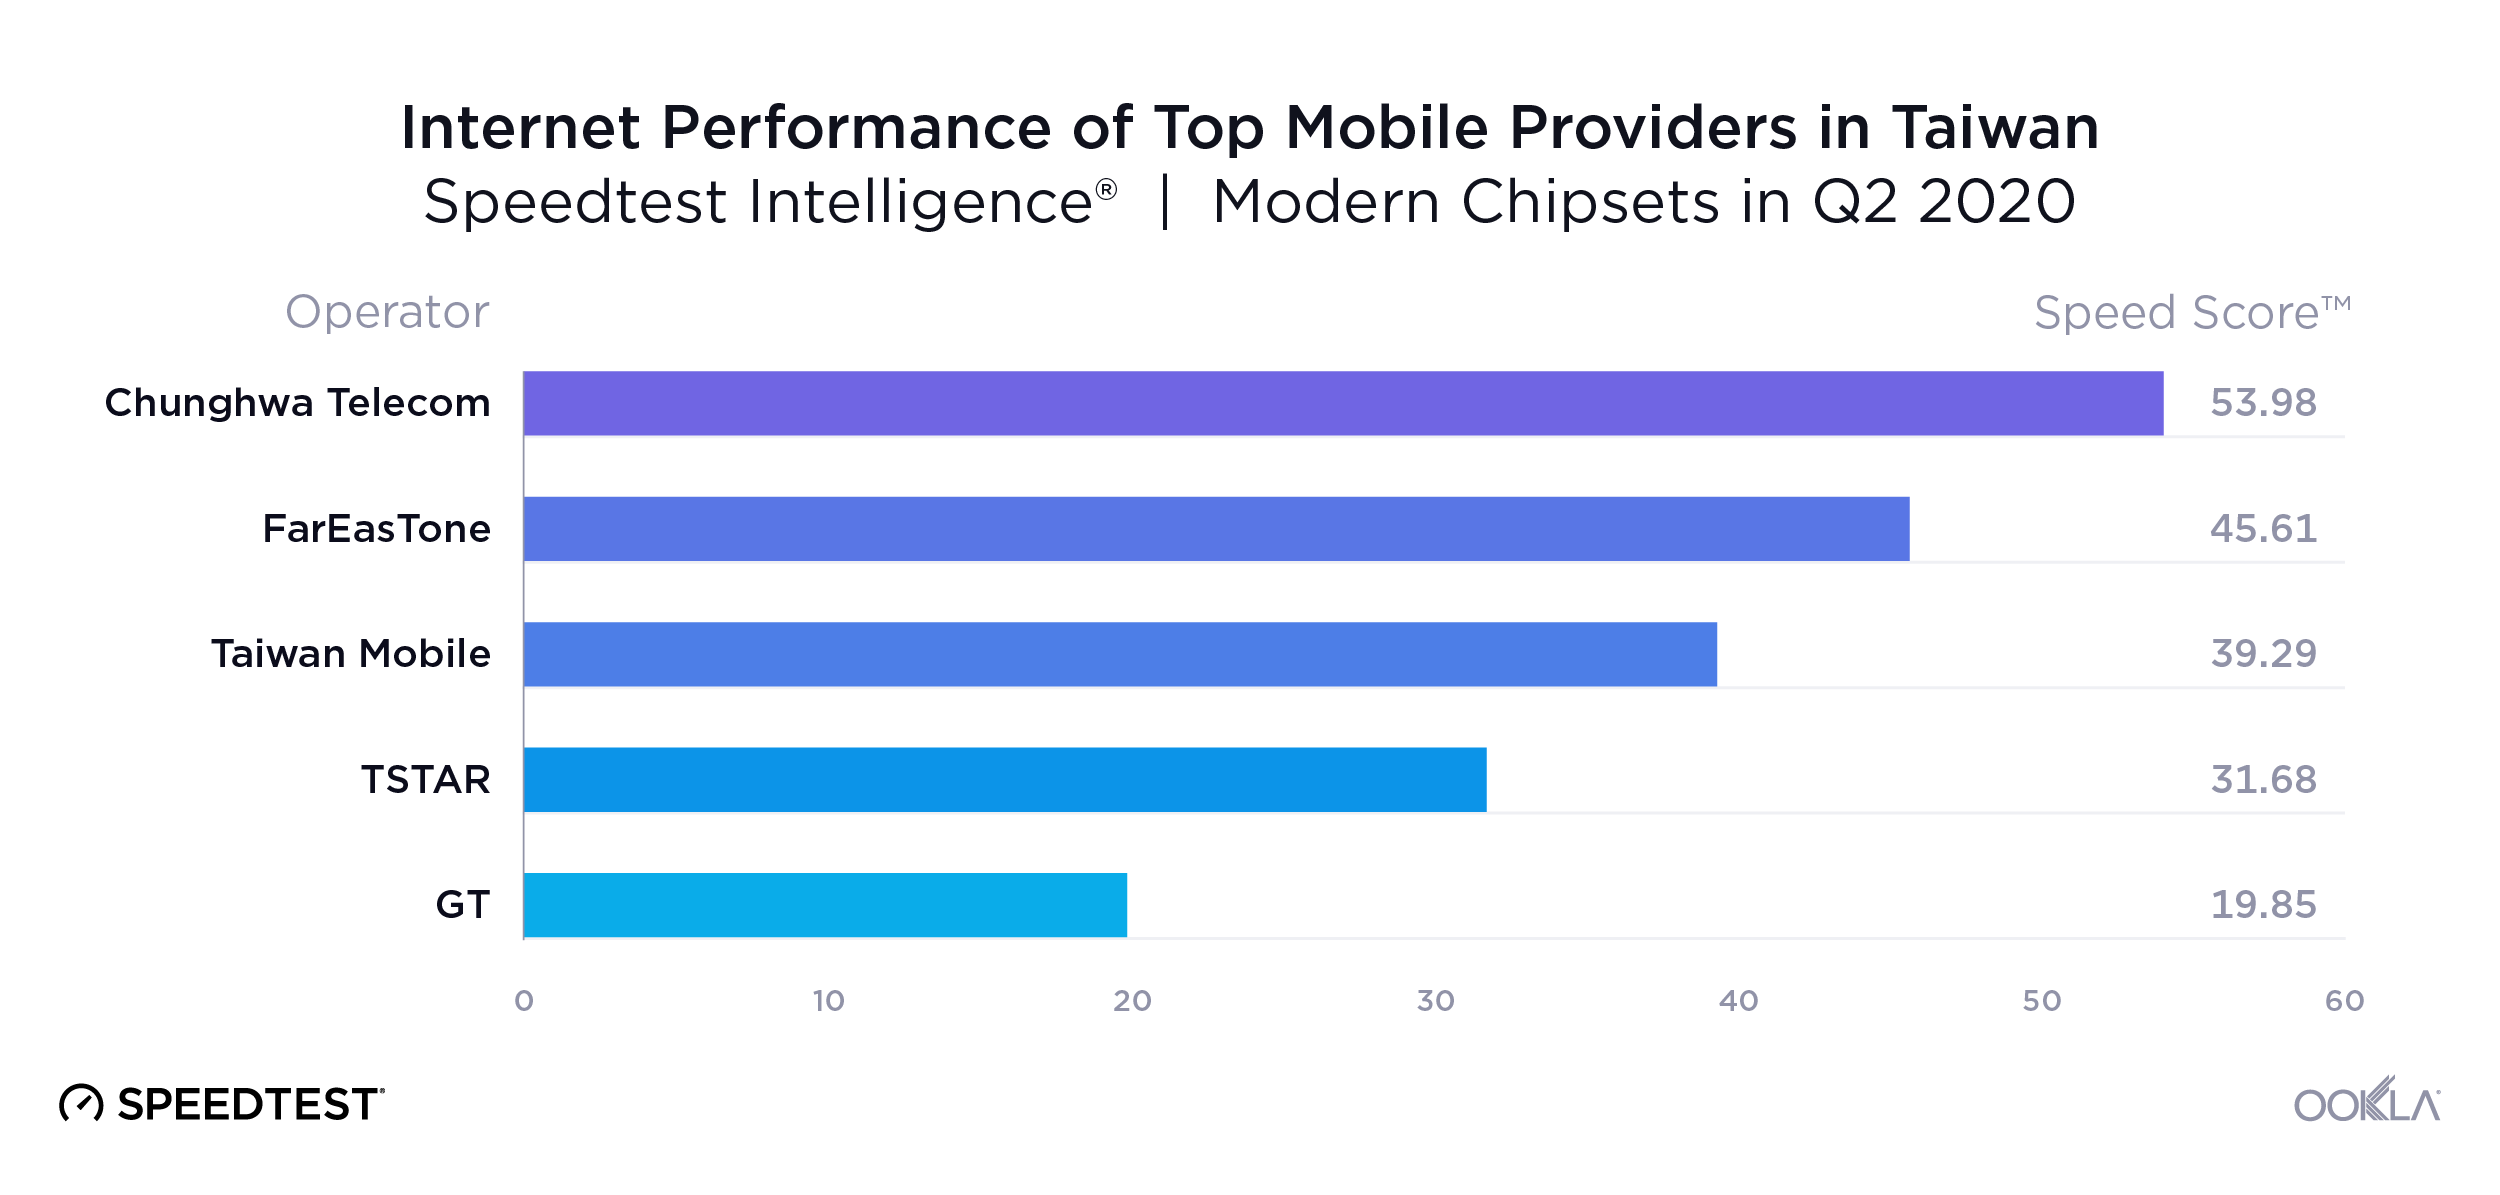
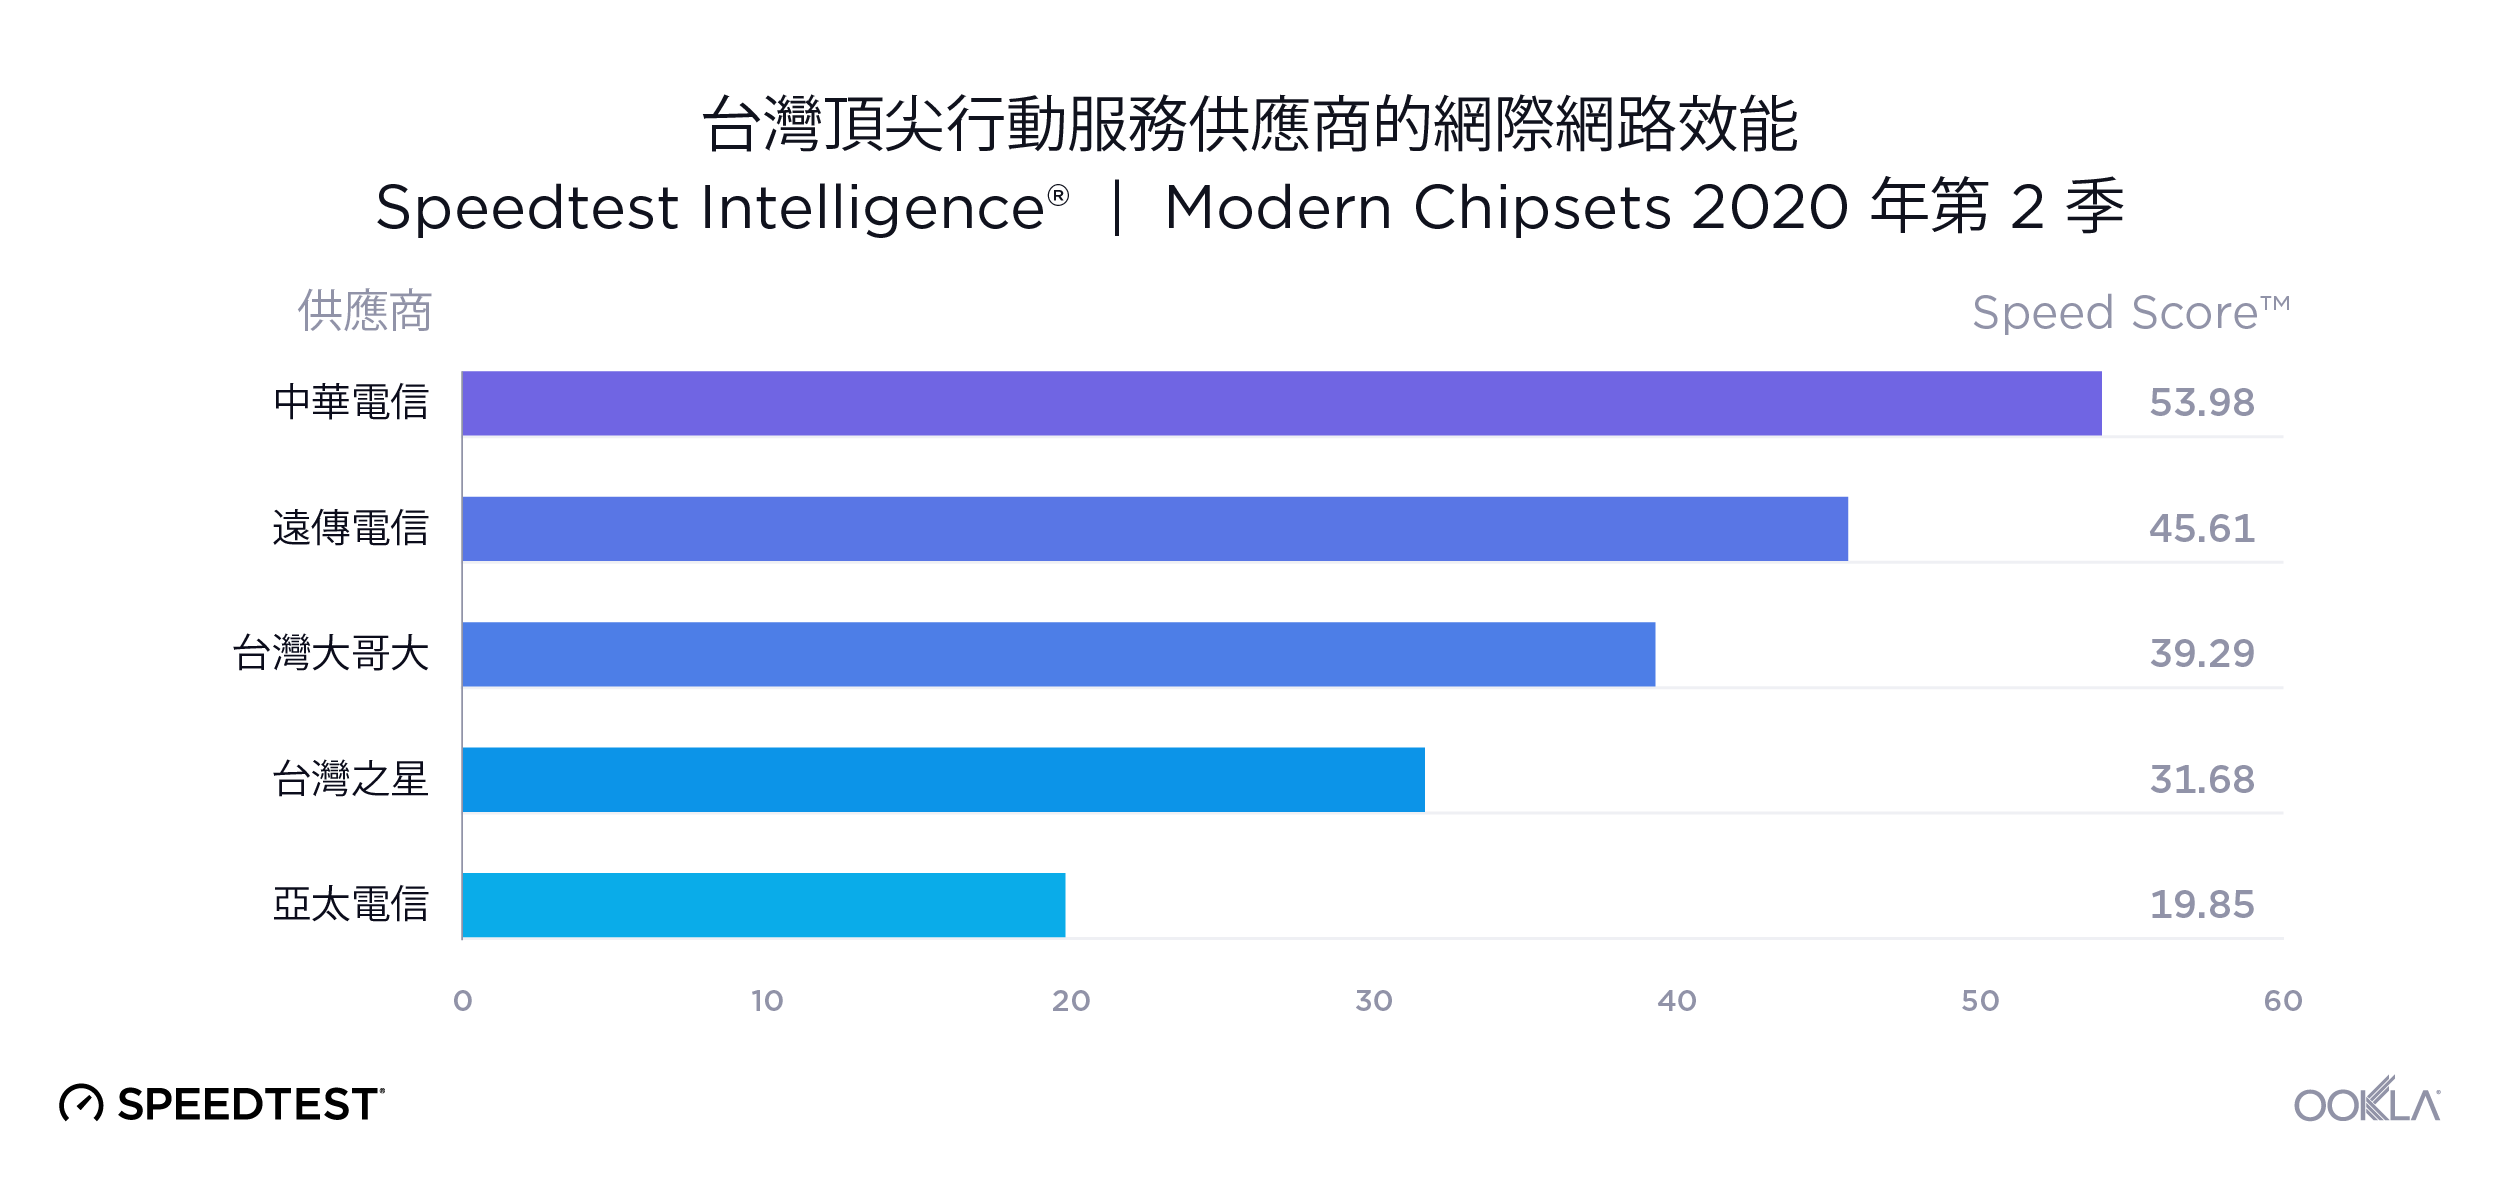
We compared mobile performance for top providers in Taiwan using Speed Score™ and found Chunghwa Telecom was the fastest provider in Taiwan in Q2 2020 with a Speed Score of 53.98 on modern chipsets. Chunghwa Telecom was followed by FarEasTone and Taiwan Mobile. The three fastest providers on the list have also deployed 5G in different areas of Taiwan. TSTAR was fourth on our list with a Speed Score of 31.68, while GT was fifth with 19.85.

Chunghwa Telecom was highest-rated mobile provider in Q2 2020

Speedtest Consumer Sentiment data is gathered from single-question surveys presented to users at the end of a Speedtest®. This data set provides rich insights into customer satisfaction over time, as well as competitive benchmarking, by providing data on both customers’ overall satisfaction with their network providers (based on a five-star scale) and Net Promoter Score (NPS). By comparing Q2 2020 ratings data from Taiwan’s top providers with their Speed Score during the same period, we can explore the relationship between customer satisfaction and network performance. This article reflects the ratings and NPS of Speedtest users on modern chipsets and does not imply that the results would be the same when looking at Consumer Sentiment data from users across all technologies.
Taiwan_Speed_Score_Rating_Q2_2020_en

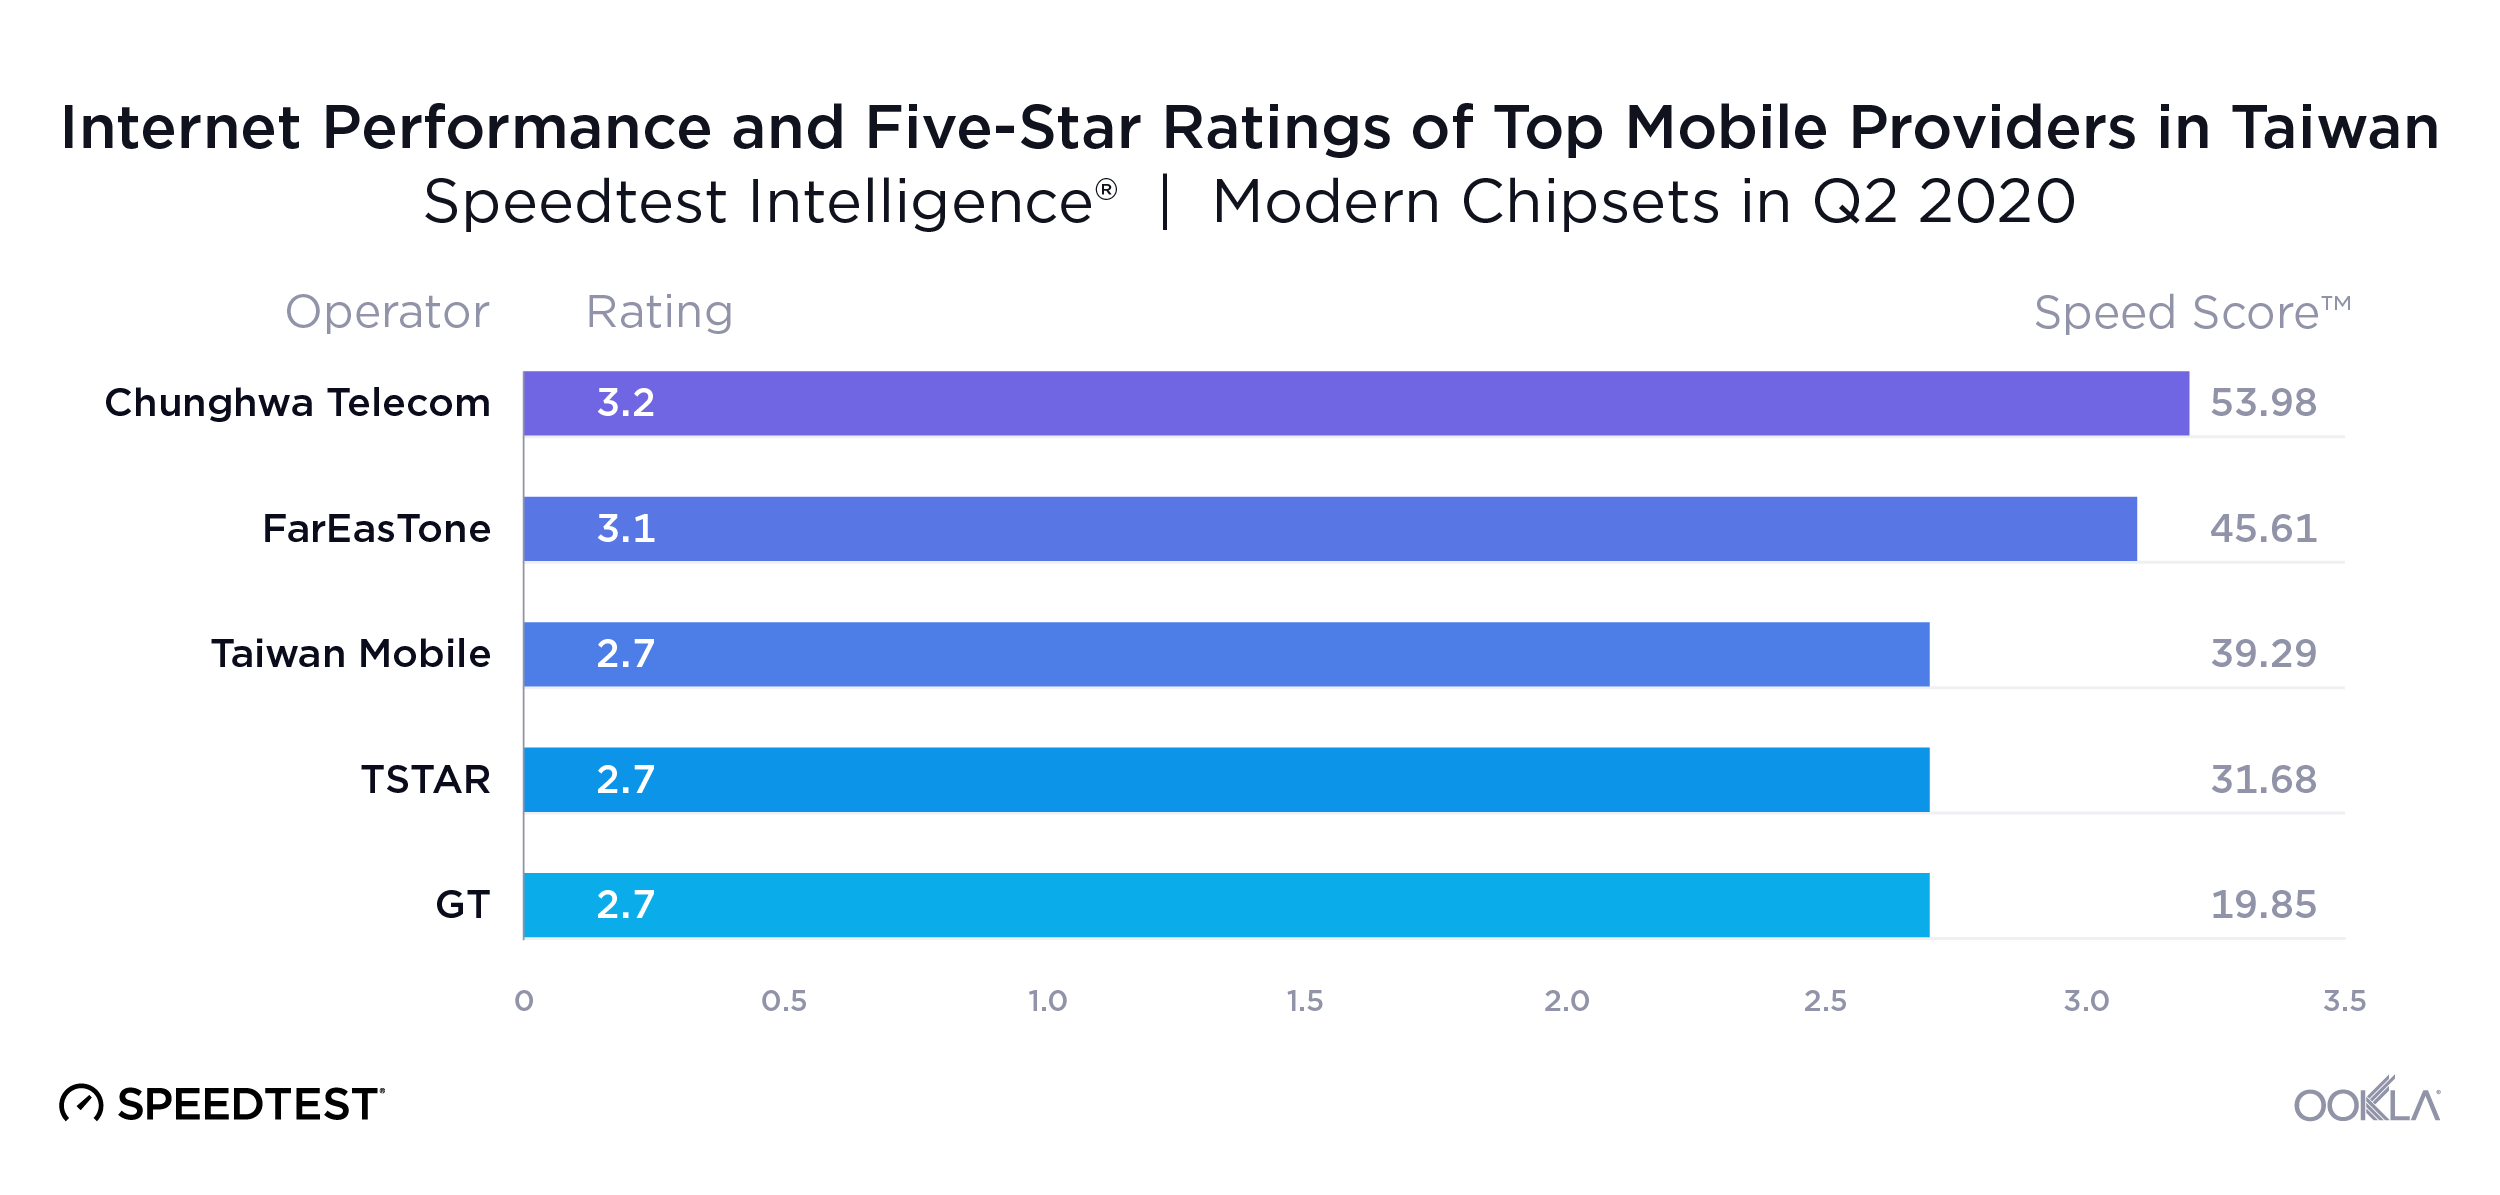
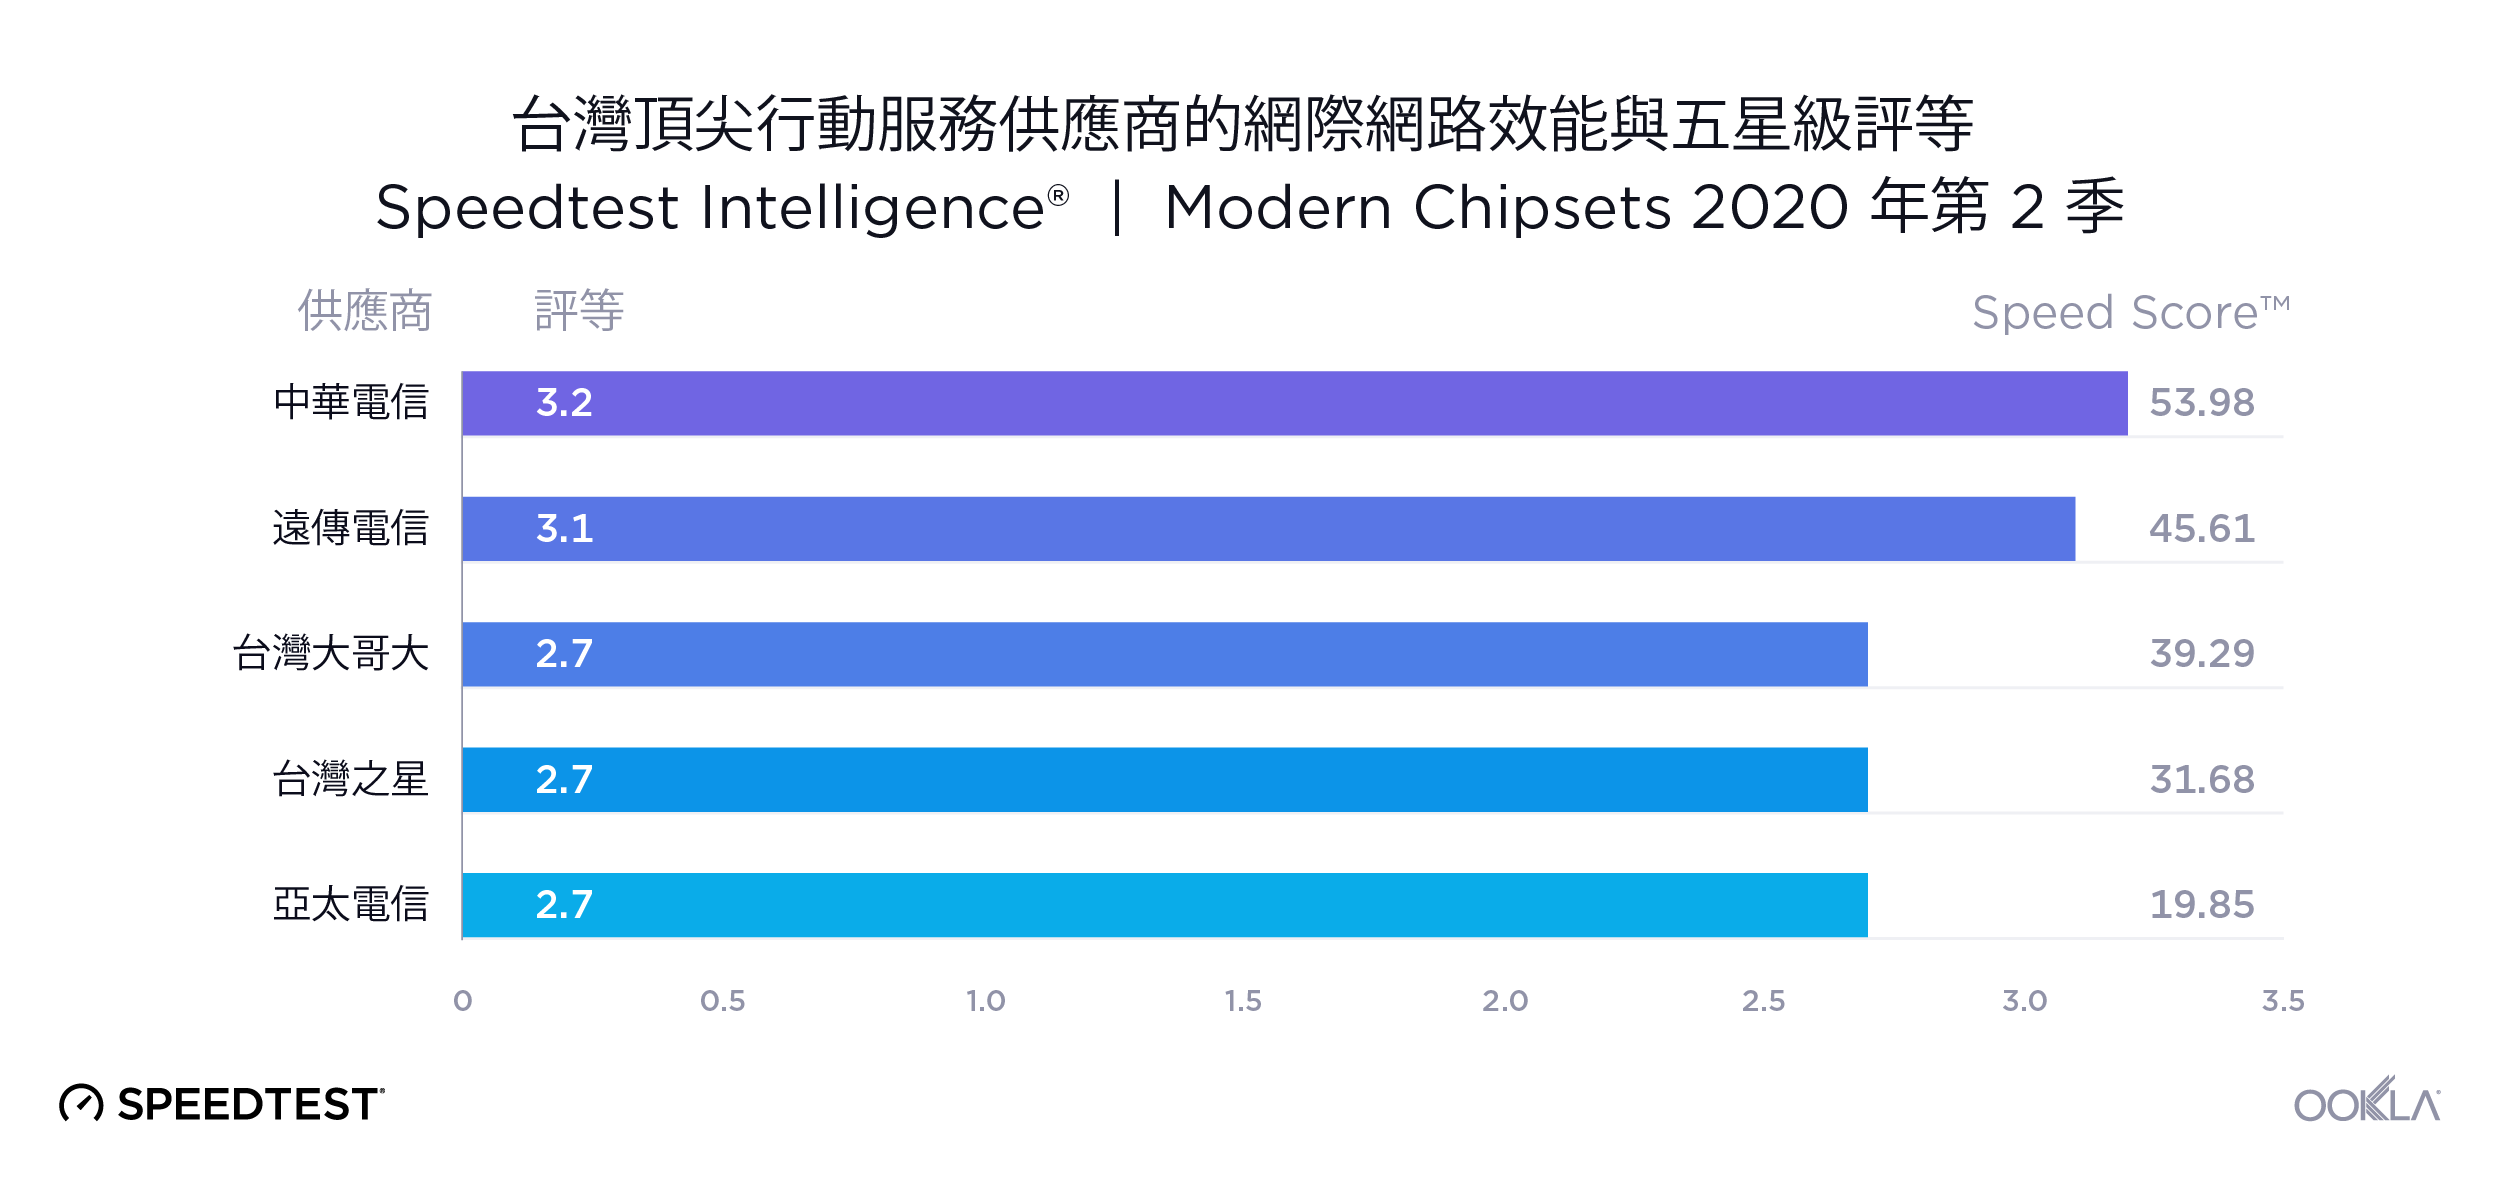
Taiwan’s fastest providers during Q2 2020 also had the highest Consumer Sentiment ratings. Chunghwa Telecom was the highest-rated provider (in addition to being the fastest on our list), while FarEasTone followed with a rating of 3.1 stars. Taiwan Mobile, TSTAR and GT all had an average rating of 2.7 stars, despite a wide difference in Speed Score.

Chunghwa Telecom had highest NPS

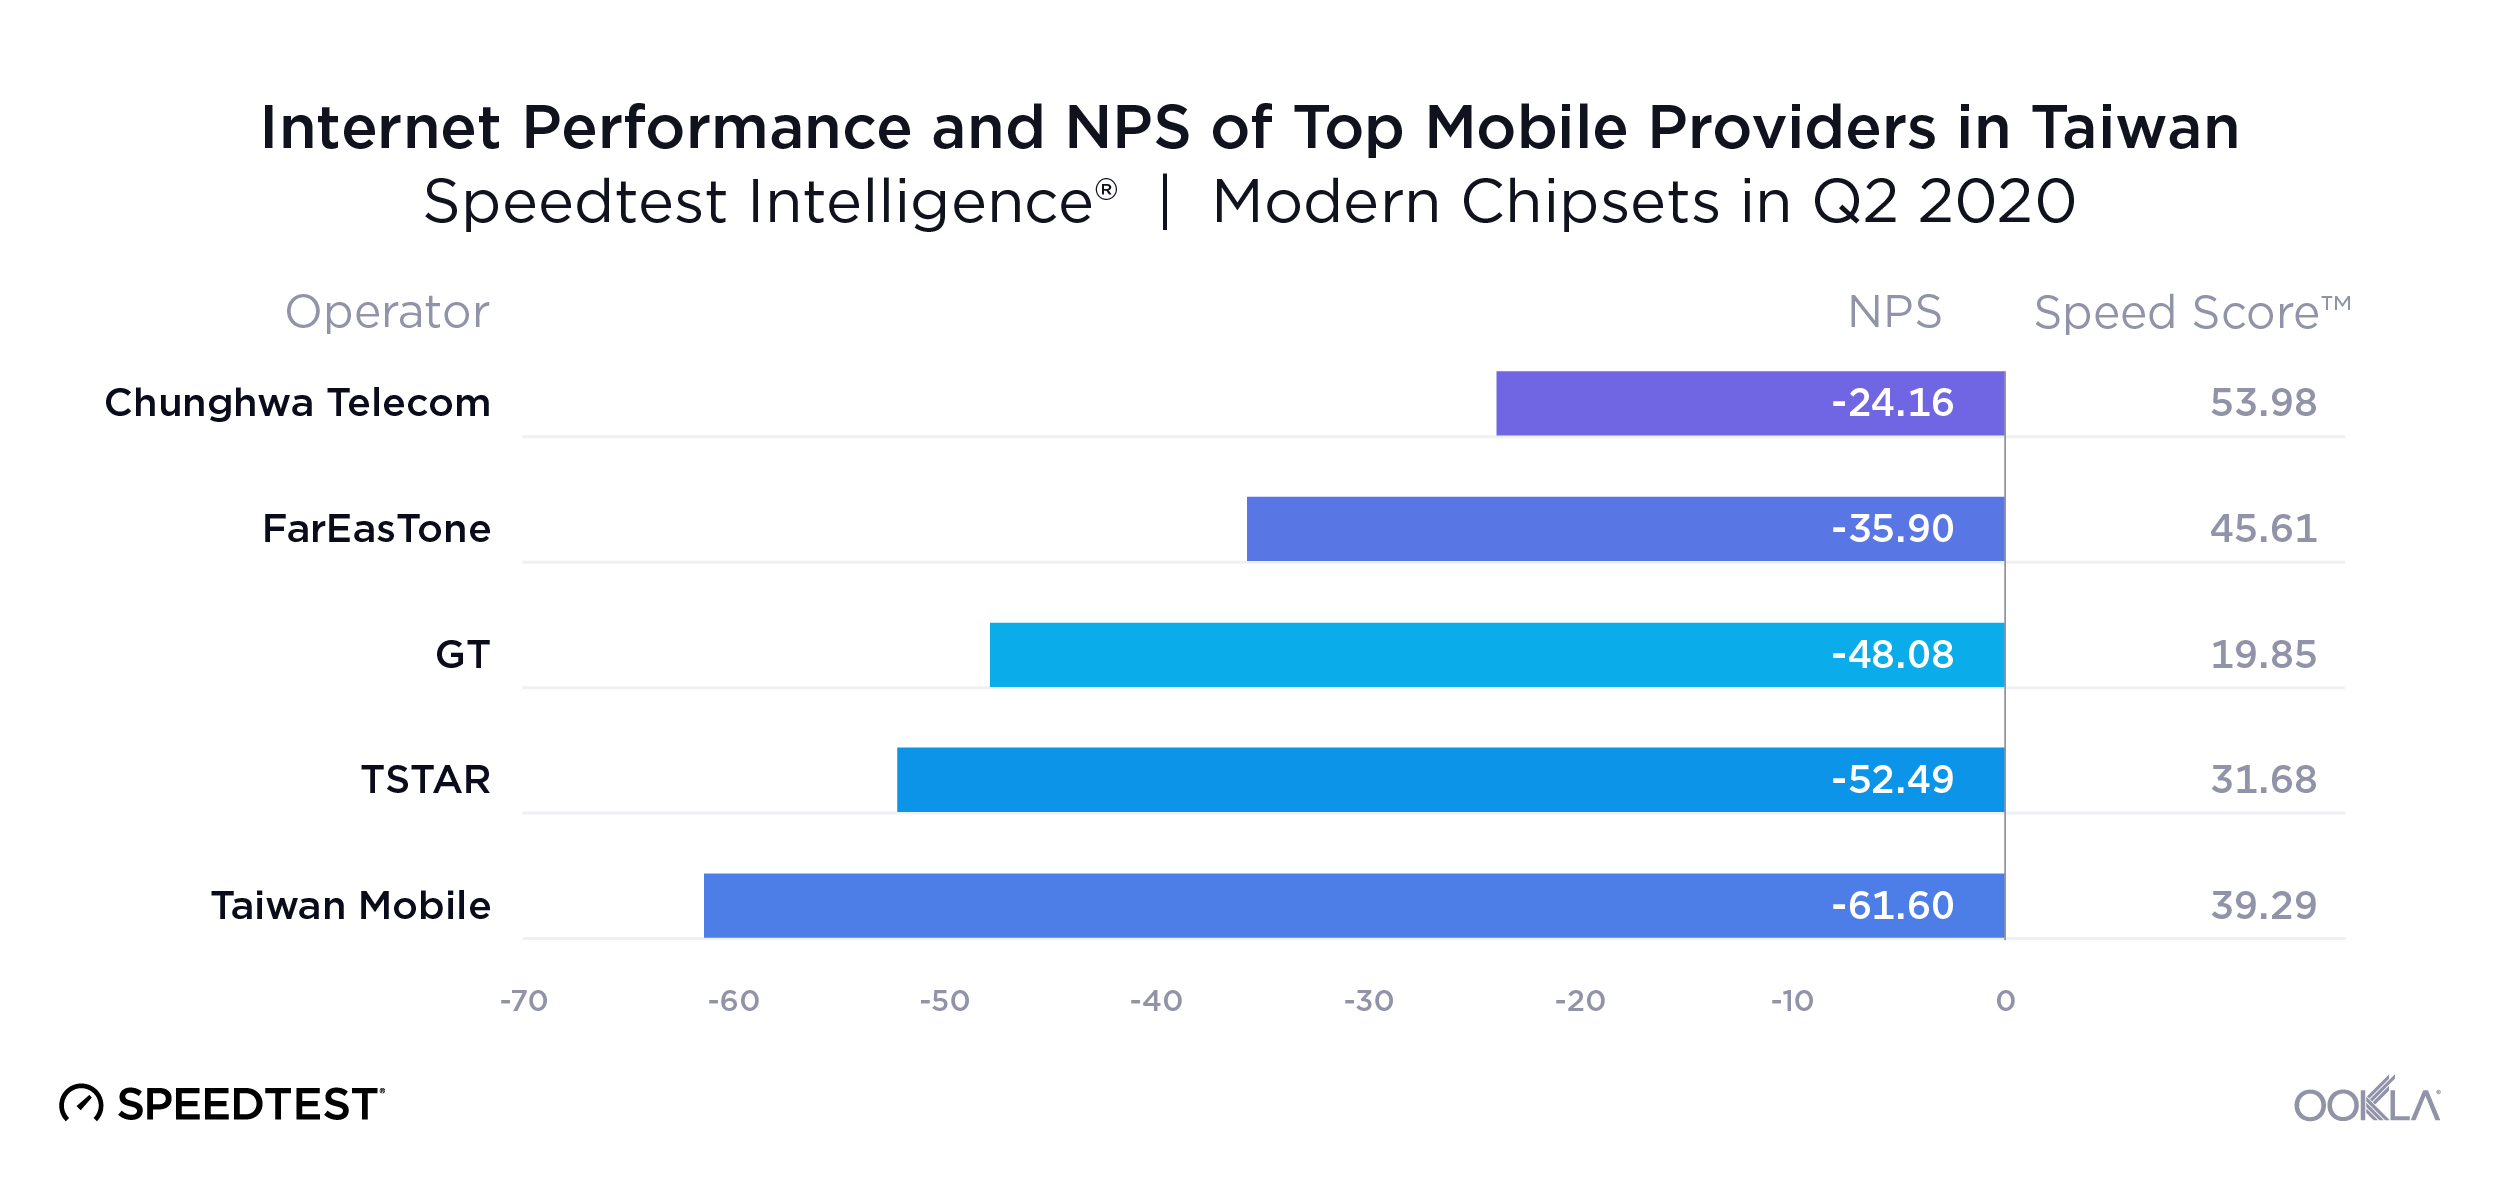
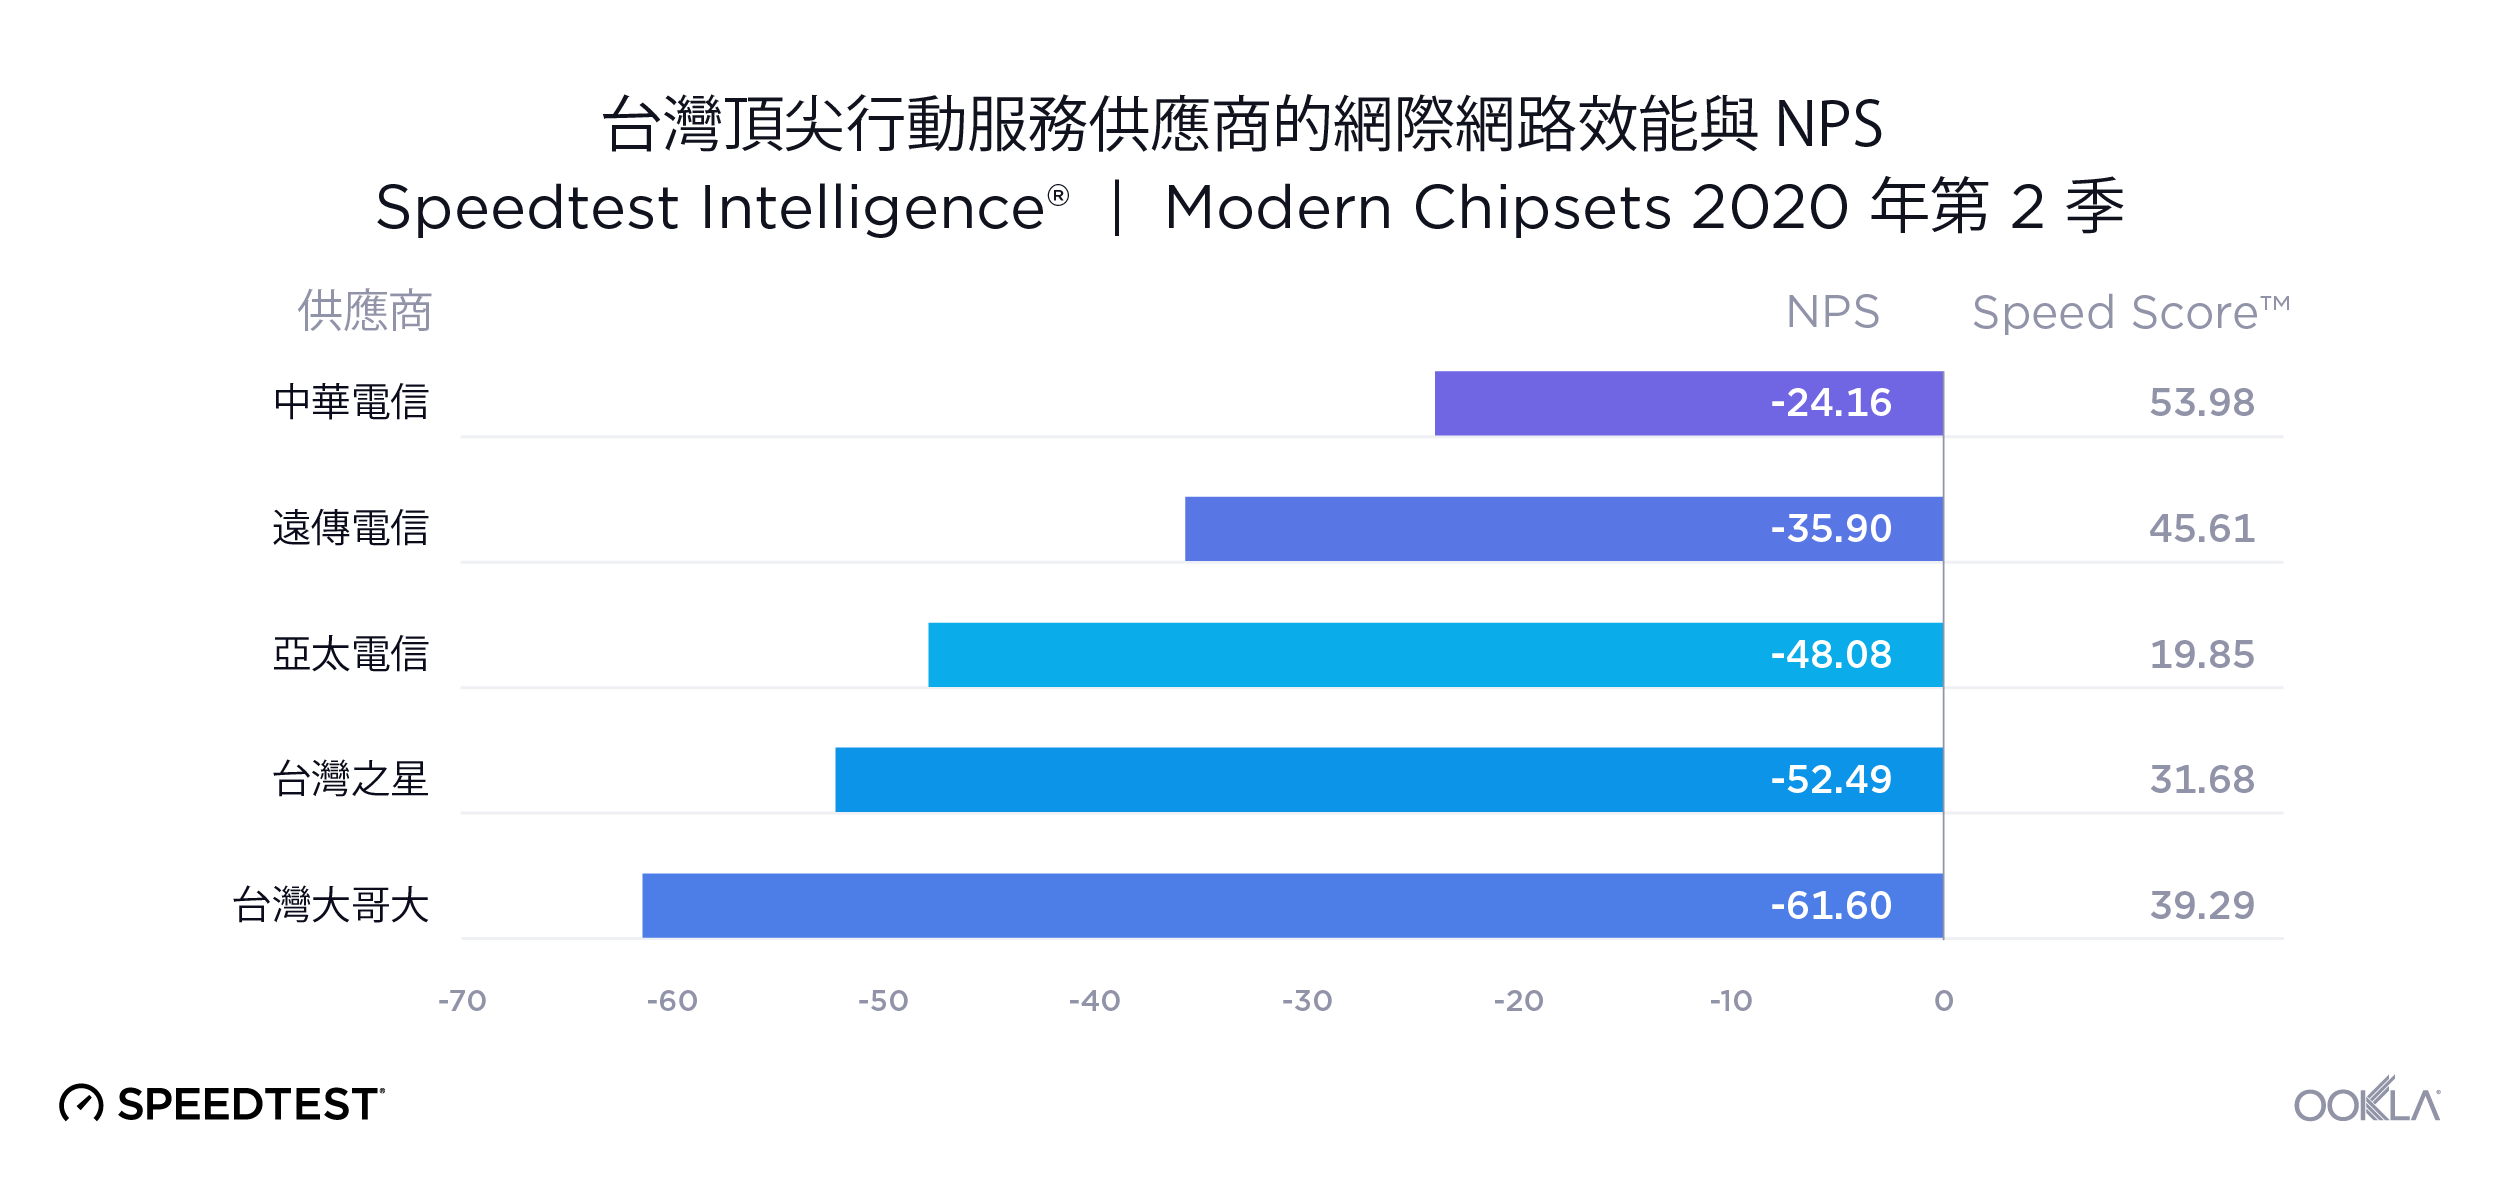
Speedtest customers are also asked how likely they are to recommend their provider to friends or family on a 0 to 10 scale. We compared the resulting Net Promoter Score (NPS) with Speed Score to see how performance relates to a customer’s likelihood of recommending a provider. NPS ratings are categorized into Detractors (score 0-6), Passives (score 7-8), and Promoters (score 9-10). NPS is calculated as (% Promoters – % Detractors) x 100. Any NPS score above 0 indicates that a provider’s audience is more loyal than not.
Taiwan_Speed_Score_NPS_Q2_2020_en-1

The ranking of top providers by NPS revealed a different order than we saw with performance and ratings. All of Taiwan’s top providers showed a negative NPS, indicating that fewer customers were likely to recommend their operator’s service to friends and family. Chunghwa Telecom and FarEasTone were ranked first and second for NPS, respectively, which aligned with the rankings for network performance. However, GT was third in NPS, but was ranked fifth for performance, and Taiwan Mobile ranked fifth for NPS and third in performance.

A provider’s performance, network availability and quality can all impact a customer’s overall satisfaction. In Taiwan, top-performing operators had the highest ratings and NPS, but ratings and NPS for operators with lower performance indicated that other factors may also shape customers’ perspectives. We look forward to seeing how network speeds improve as Taiwanese providers continue rolling out 5G, and we will continue to monitor Consumer Sentiment data for the region. To read more about Consumer Sentiment and how to track and benchmark customer satisfaction over time, click here.


探索在台灣網路效能與 NPS 之間的關係

網路效能是客戶經驗的關鍵要素,但是就客戶對於行動電信業者及其服務水準的看法而言,這並不是唯一的決定因素。藉由 Speedtest Intelligence® 提供的資料,我們針對台灣 2020 年第 2 季的行動網路業者 (MNO) 的效能進行了比較。同時,我們還在五星級評等和淨推薦分數 (NPS) 方面,將服務供應商效能與 Speedtest Consumer Sentiment™ 相關資料進行了比較,以瞭解網路效能對於客戶滿意度所造成的影響。

中華電信是台灣速度最快的電信公司

在過去的一年裡,台灣的行動效能已經獲得國家級的改善。在 2019 年第 2 季,行動平均下載速度達到 42.81 Mbps,而在 2020 年第 2 季則增加 9.8%,達到 46.99 Mbps。另外,根據 全球網速排行榜™ 的資料,在 2020 年 7 月,台灣的行動下載速度排名為全球第 18 名。
Taiwan_Speed_Score_Q2_2020_tw-1

我們使用 Speed Score™ 針對台灣地區 頂尖服務供應商 的行動效能進行比較,發現中華電信是 2020 年第 2 季台灣地區速度最快的供應商,其 現代晶片組 的速度評分為 53.98。在中華電信之後,遠傳電信和台灣大哥大分居二、三名。名單上速度排名前三的供應商也已經 在台灣各區域部署 5G。台灣之星在名單上位列第四,速度評分為 31.68,而亞太電信速度評分為 19.85,排名第五。

中華電信是2020 年第 2 季評分最高的行動服務供應商

我們在 Speedtest® 結束時向使用者呈現單一問題調查問卷,並透過該問卷收集 Speedtest 消費者情緒資料。 本資料集藉由提供有關客戶對於其網路服務供應商的整體滿意度(以五星級評等)和淨推薦分數 (NPS) 的資料,提供關於客戶滿意度隨著時間變化而不斷變化的豐富見解以及競爭性基準。透過在 2020 年第 2 季比較台灣頂尖服務供應商在同一時期的速度評等,我們能夠探究客戶滿意度於網路效能之間的關係。本文章反映的是 Speedtest 使用者對於現代晶片組的評等與 NPS,並未暗示倘若查看所有技術領域使用者的消費者信心資料時,其結果仍會相同。
Taiwan_Speed_Score_Rating_Q2_2020_tw-1

在 2020 年第 2 季,台灣速度最快的服務供應商同時也獲得最高的消費者信心評等。中華電信是評等最高的供應商(同時也是名單上速度最快的供應商),而遠傳電信緊跟在後,獲得 3.1 顆星的評等。台灣大哥大、台灣之星以及亞太電信三者儘管在速度評分數差異極大,但是皆獲得 2.7 顆星的評分。

中華電信 NPS 最高

我們詢問 Speedtest 客戶是否願意向親友推薦他們的供應商,並要求提供 0 到 10 的分數。我們將淨推薦分數 (NPS) 結果與速度評分進行比較,以瞭解效能與客戶推薦供應商之意願度之間的關聯。NPS 評分歸類為貶低者(0-6 分)、消極者(7-8 分)以及推薦者(9-10 分)。NPS 的計算方式為 (% 推薦者 – % 貶低者) x 100。NPS 分數超過 0 即表示在服務供應商的受訪對象中,忠誠者超過不忠誠者。
Taiwan_Speed_Score_NPS_Q2_2020_tw-2

按 NPS 所得出的頂尖服務供應商排名順序與按效能及評等所得出的排名順序不同。台灣所有頂尖服務供應商都出現負值的 NPS,表示有較少的客戶願意向其親友推薦自己使用的電信業者服務。中華電信和遠傳電信在 NPS 的排名分居一二,此排名也與網路效能的排名一致。但是亞太電信在 NPS 的排名為第三,而在效能的排名卻是第五;台灣大哥大的 NPS 排名為第五,效能排名則是第三。

服務供應商的效能、網路可用性與品質都會影響客戶整體的滿意度。在台灣,效能最佳的電信業者也擁有最高的評等和 NPS,但效能較低的電信業者的評等與 NPS 卻顯示還有其他因素也可能會影響客戶的看法。我們期望台灣的服務供應商在推廣 5G 服務的過程中也能夠提升網路速度,我們也會持續監測此地區的消費者信心資料。若要閱讀更多有關消費者信心以及如何長期追蹤客戶滿意度並設立基準,請 按此處

Ookla retains ownership of this article including all of the intellectual property rights, data, content graphs and analysis. This article may not be quoted, reproduced, distributed or published for any commercial purpose without prior consent. Members of the press and others using the findings in this article for non-commercial purposes are welcome to publicly share and link to report information with attribution to Ookla.

| October 28, 2020

Upgrades in Mobile Speeds in India Come with Expanded 4G Availability

India’s mobile network market has seen astounding growth and evolution since the country’s first mobile call in 1995. Local operators’ efforts to improve and expand 4G coverage across the country have provided customers in India with an increasingly fast and modern mobile internet experience. Data from Speedtest IntelligenceTM reveals details on performance across India’s mobile network landscape. Read on for information on speeds at the regional, country and city level and to see which operator offered the fastest service Q3 2020.

India trailed Pakistan for mobile speeds

India showed the second fastest mean download speed over mobile among the largest South Asian countries during Q3 2020, with Pakistan showing 39.7% faster mobile download speed than India. Bangladesh was third for download speed and second for upload speed. India had the slowest mean upload speed on the list at 4.18 Mbps.
Mobile-Internet-Speeds-Chart_Pakistan_India_Bangladesh_1020

Both India and Pakistan showed improved mean download speeds over mobile when comparing Q3 2019 to Q3 2020. India saw an 11.6% increase while Pakistan’s mean mobile download speeds increased by 24.1% during the same period. Bangladesh saw a smaller increase of 6.3% in mean download speed over mobile. Upload speeds remained mostly flat across South Asia’s largest countries, with only Pakistan showing a slight improvement year over year.

India also ranked second for 4G speeds

Looking specifically at performance over 4G LTE in the largest countries in South Asia during Q3 2020, the countries’ speeds followed a similar pattern, with Pakistan’s mean download speed over 4G coming in 51.3% faster than India’s 12.05 Mbps. Bangladesh closely followed India for download speed.
4G-Speeds-Chart_Pakistan_India_Bangladesh_1020

Upload speeds over 4G varied considerably more by country than we saw for download speeds. India showed the slowest mean upload speed over 4G at 4.25 Mbps — 65.6% slower than Pakistan’s.

Vi India was fastest over 4G

Vi India was the fastest mobile operator over 4G in India during Q3 2020 with the fastest mean download and upload speeds among top providers. Airtel followed Vi India with a mean download speed of 13.58 Mbps, while Jio showed a mean download speed of 9.71 Mbps in Q3 2020.
4G-Speeds_India_providers_1020-2

India led in 4G Availability

India had the highest 4G Availability among the largest South Asian countries during Q3 2020 with 93.7% of tested locations showing 4G available according to data from Speedtest® coverage scans on Android. Bangladesh followed with a 4G Availability of 78.6%, while Pakistan had the lowest 4G Availability during this period at 72.9%.
4G-availability_Pakistan_India_Bangladesh_1020

Jio leads for 4G Availability in India

Jio had the highest 4G Availability among top providers in India at 99.7% during Q3 2020. Airtel followed Jio closely with 4G available in 98.7% of tested locations during the same period. Vi India was third at 91.1%.
4G-Availability_India_providers_1020

Mobile speeds vary among India’s largest cities

Country-wide averages don’t reflect the differences in performance that occur across a country as large as India. We looked at mobile download speeds for all cellular technologies in the 15 most populous cities in India during Q3 2020 to get a better picture of how consumers experience the internet.
Ookla_Mobile-Internet-Speeds_India_1020-1

Hyderabad had the fastest mean download speed over mobile during this period at 14.35 Mbps, followed closely by Mumbai at 13.55 Mbps and Visakhapatnam at 13.40 Mbps. The slowest mean download speeds on our list were measured in Nagpur (10.44 Mbps), Kanpur (9.45 Mbps) and Lucknow (8.67 Mbps). The mean download speed in first-place Hyderabad was 65.5% faster than that in Lucknow.

We will continue to monitor India’s internet speeds as operators expand 4G networks and introduce 5G networks throughout the country. Want to know how your internet is performing? Take a Speedtest to understand and report on your operator’s performance.

Ookla retains ownership of this article including all of the intellectual property rights, data, content graphs and analysis. This article may not be quoted, reproduced, distributed or published for any commercial purpose without prior consent. Members of the press and others using the findings in this article for non-commercial purposes are welcome to publicly share and link to report information with attribution to Ookla.

| November 18, 2020

ICYMI: Ookla Data and Research from October 2020

Highlights from the Speedtest Global IndexTM

Global-Index-Tweet-Image-Oct-2020
These are the top stories from October 2020:

  • Australia is back in the top 5 for mobile for the first time since November 2019.
  • Luxembourg had a substantial rank change on mobile, moving up 11 places. This is likely due to two thirds of Luxembourg’s top providers now providing 5G.
  • The U.S. has finally broken the top thirty on mobile for the first time, coming in at 27th. Again, this is likely due to new 5G developments.
  • With Andorra’s largest fixed broadband provider offering 300 Mbps and 700 Mbps service plans, the country has seen a steady increase in monthly performance since February of this year.
  • Cyprus has seen steady increases in fixed broadband speed over the last few months, with one of the country’s top providers now offering fixed broadband plans up to 300 Mbps. The country now ranks 68th.

Articles worth a second look

Rakuten is Leveraging O-RAN to Reimagine Mobile and it Could Change the Way We Use Our Phones Forever

Discover how O-RAN works and how Rakuten is using a fully virtual, cloud-native mobile network approach to disrupt mobile markets around the world.

Upgrades in Mobile Speeds in India Come with Expanded 4G Availability


Comparing India to neighboring countries for mobile internet speeds and 4G Availability, this market snapshot includes information about the country’s fastest operators.

Make Better Funding Decisions with Accurate Broadband Network Data: A Guide for Federal, State and Local Governments (White Paper)


Federal, state and local policymakers are tasked with spending on broadband development. Learn how inaccurate data on network performance negatively impacts these government funding efforts with this white paper, including a case study from New York.

How to Improve In-Building Network Performance and Coverage with Crowdsourced Data (White Paper)


Use this white paper to learn how to discover heavily populated buildings with poor network coverage or quality — then how to make low-cost improvements to indoor network performance and coverage.

“Unable to Connect” — The Most Significant Online Service Outages in Q3 2020


Discover which online services around the world suffered the most widely reported incidents in Q3 2020 based on data from Downdetector®.

How Downdetector Works


Learn how Downdetector spots outages, assesses the geography of issues and determines how many problem reports it takes to indicate an incident with a site or online service.

Ookla retains ownership of this article including all of the intellectual property rights, data, content graphs and analysis. This article may not be quoted, reproduced, distributed or published for any commercial purpose without prior consent. Members of the press and others using the findings in this article for non-commercial purposes are welcome to publicly share and link to report information with attribution to Ookla.

| December 7, 2020

The Relationship Between Network Performance and Customer Satisfaction in the Philippines


Tagalog

An increased reliance on internet services and demand for better connectivity has prompted the Philippine government to further improve the country’s internet quality and affordability by facilitating providers to expand infrastructure throughout the country. This has caused internet speeds in the Philippines to rise in the last few years. Using data from Speedtest Intelligence®, we analyzed fixed broadband and mobile network performance in the Philippines and compared the top mobile network operators (MNOs) and fixed broadband providers (ISPs) during Q2-Q3 2020. We also compared provider performance to Speedtest Consumer Sentiment™ data on five-star ratings and Net Promoter Score (NPS) to understand how network performance impacts customer satisfaction.

Internet speeds have increased, but the Philippines still falls behind much of the world

Internet speeds in the Philippines have increased dramatically since Q3 2016, showing a 477.0% improvement in median download speed over fixed broadband during the last four years — from 3.18 Mbps in Q3 2016 to 18.35 Mbps in Q3 2020. Upload speeds over fixed broadband also increased.

Philippines_Fixed-Broadband_graph_1220-2

Median speeds on all technologies over mobile have also improved, but at a much slower pace, showing a 99.1% increase in download speed over the last four years. In fact, median performance decreased between Q3 2019 and Q3 2020 for both download and upload speed when compared to the previous year.

Philippines_Mobile-Internet_graph_1220-2

Despite these overall improvements in network performance, the Philippines still lags behind most countries on the Speedtest Global Index™. The Philippines ranked 111th on mobile and 107th on fixed broadband as of October 2020. In an effort to improve mobile network performance and availability in the country, the current administration has helped in reducing red tape to allow new towers to be built. The Philippines will need to continue removing barriers to infrastructure enhancements and increasing connectivity across the country in order to improve these rankings.

Smart and PLDT were the fastest providers during Q2-Q3 2020

We compared Q2-Q3 2020 internet performance for top providers in the Philippines using Speed Score™. On mobile, results only consider devices that use modern chipsets.

Internet Performance of Top Mobile Operators in the Philippines
Speedtest Intelligence® | Modern Chipsets in Q2-Q3 2020
Provider Speed ScoreTM
Smart 19.97
Globe 13.47

Smart had the fastest Speed Score among top mobile operators in the Philippines at 19.97 during Q2-Q3 2020. Globe showed the second fastest Speed Score at 13.47.

Internet Performance of Top ISPs in the Philippines
Speedtest Intelligence® | Q2-Q3 2020
Provider Speed ScoreTM
PLDT 24.67
Converge ICT 22.44
SKY 18.25
Globe 9.74
Smart 7.60

PLDT was the fastest fixed broadband provider during Q2-Q3 2020 with a Speed Score of 24.76. Converge ICT was second, while SKY was third.

Smart was highest rated mobile network operator, PLDT highest rated fixed broadband provider

We compared five-star ratings and NPS data to providers’ performance to understand how speeds impacted customer perceptions of Philippine providers. Speedtest Consumer Sentiment data is gathered from single-question surveys presented to users at the end of a Speedtest®. This data set provides rich insights into customer satisfaction over time, as well as competitive benchmarking, by providing data on both Net Promoter Score (NPS) and customers’ overall satisfaction with their network providers.

Internet Performance and Five-Star Ratings of Top Mobile Operators in the Philippines
Speedtest Intelligence® | Modern Chipsets in Q2-Q3 2020
Provider Speed ScoreTM Rating
Smart 19.97 3.3
Globe 13.47 2.5

Ratings aligned with performance among top mobile operators in the country during Q2-Q3 2020. Smart was the fastest mobile operator and had the highest rating during this period at 3.3 stars. Globe was second with a rating of 2.5 stars.

Internet Performance and Five-Star Ratings of Top ISPs in the Philippines
Speedtest Intelligence® | Q2-Q3 2020
Provider Speed ScoreTM Rating
PLDT 24.67 2.7
Converge ICT 22.44 3.1
SKY 18.25 2.4
Globe 9.74 2.3
Smart 7.60 2.7

Converge ICT showed the highest rating among users in the Philippines during Q2-Q3 2020. PLDT and Smart tied for second, followed by SKY and Globe.

Smart had highest NPS on mobile, Converge ICT on fixed broadband

Speedtest users are also asked how likely they are to recommend their provider to friends or family on a 0 to 10 scale. NPS ratings are categorized into Detractors (score 0-6), Passives (score 7-8), and Promoters (score 9-10). NPS is calculated as (% Promoters – % Detractors) x 100. Any NPS score above 0 indicates that a provider’s audience is more loyal than not. We compared the resulting Net Promoter Score (NPS) with Speed Score to see how performance relates to a user’s likelihood of recommending a provider.

Internet Performance and NPS of Top Mobile Operators in the Philippines
Speedtest Intelligence® | Modern Chipsets in Q2-Q3 2020
Provider Speed ScoreTM NPS
Smart 19.97 -20.79
Globe 13.47 -61.63

Smart had the highest NPS during Q2-Q3 2020 in addition to being the fastest provider. Both Smart and Globe showed negative NPS during this period. This suggests that users are less likely to recommend these mobile operators to their friends and family.

Internet Performance and NPS of Top ISPs in the Philippines
Speedtest Intelligence® | Q2-Q3 2020
Provider Speed ScoreTM Rating
PLDT 24.67 -46.39
Converge ICT 22.44 -16.51
SKY 18.25 -60.87
Globe 9.74 -65.52
Smart 7.60 -49.18

Fixed broadband performance did not align with NPS during Q2-Q3 2020 in the Philippines. Converge ICT had the highest NPS at -16.51, followed by PLDT and Smart. PLDT was the fastest provider during this period, but showed a NPS that was much lower than that of Converge ICT. All providers had negative NPS during this period, which indicates that across networks in the Philippines, users are not likely to recommend their provider — and that performance and customer satisfaction do not always align.

We’re optimistic that continued infrastructure improvements will lead to better performance, and we’ll continue to evaluate whether those outcomes will lead to increased customer satisfaction. To measure your internet speeds and provide feedback on the performance of your provider, take a Speedtest.


Ang Ugnayan sa Pagitan ng Performance ng Network at Kasiyahan ng Customer sa Pilipinas

Ang pagdami ng umaasa sa mga serbisyo ng internet at ang pangangailangan para sa mas mahusay na connectivity ay nag-udyok sa gobyerno ng Pilipinas na pahusayin pa ang kalidad at pagiging abot-kaya ng internet sa bansa sa pamamagitan ng pagtulong sa mga provider na paramihin ang imprastraktura sa buong bansa. Dahil dito, bumilis ang internet sa Pilipinas sa loob ng nakalipas na ilang taon. Gamit ang data mula sa Speedtest Intelligence®, sinuri namin ang performance ng fixed broadband at mobile network sa Pilipinas at ipinaghambing namin ang mga nangungunang mobile network operator (mga MNO) at fixed broadband provider (mga ISP) noong Q2-Q3 2020. Inihambing din namin ang performance ng provider sa data ng Speedtest Consumer Sentiment™ tungkol sa mga five-star na rating at sa Net Promoter Score (NPS) para maunawaan kung paano nakakaapekto ang performance ng network sa kasiyahan ng customer.

Bumilis ang internet, ngunit ang Pilipinas ay napag-iiwanan pa rin ng karamihan ng mga bansa sa buong mundo

Lubos na bumilis ang internet sa Pilipinas mula noong Q3 2016, na nagpapakita ng 477.0% na paghusay sa median na bilis ng pag-download gamit ang fixed broadband sa nakalipas na apat na taon — mula sa 3.18 Mbps noong Q3 2016, naging 18.35 Mbps ito noong Q3 2020. Bumilis din ang pag-upload gamit ang fixed broadband.

Philippines_Fixed-Broadband_graph_1220-2_ph

Nagkaroon din ng paghusay sa mga median na bilis sa lahat ng teknolohiya gamit ang mobile, ngunit mas mabagal ang naging paghusay nito, na nagpapakita ng 99.1% pagbilis sa pag-download sa nakalipas na apat na taon. Sa katunayan, bumaba ang median na performance sa pagitan ng Q3 2019 at Q3 2020 para sa bilis ng pag-download at bilis ng pag-upload kung ihahambing sa nakaraang taon.

Philippines_Mobile-Internet_graph_1220-2_ph

Sa kabila ng mga kabuuang paghusay na ito sa performance ng network, ang Pilipinas ay napag-iiwanan pa rin ng karamihan ng mga bansa sa Speedtest Global IndexTM. Ika-111 ang rank ng Pilipinas sa mobile at ika-107 naman ang rank nito sa fixed broadband mula noong Oktubre 2020. Para mapahusay ang performance at availability ng mobile network sa bansa, tumulong ang kasalukuyang administrasyon na bawasan ang red tape para makapagtayo ng mga bagong tower. Kakailanganin ng Pilipinas na patuloy na mag-alis ng mga balakid sa mga pagpapahusay sa imprastraktura at pagpaparami ng connectivity sa buong bansa para mapataas ang mga ranking na ito.

Ang Smart at PLDT ang pinakamabibilis na provider noong Q2-Q3 2020

Ipinaghambing namin ang performance ng internet para sa mga nangungunang provider noong Q2-Q3 2020 sa Pilipinas gamit ang Speed ScoreTM. Sa mobile, isinasaalang-alang lang ng mga resulta ang mga device na gumagamit ng mga bagong chipset.

Performance ng Internet ng Mga Nangungunang Mobile Operator sa Pilipinas
Speedtest Intelligence® | Mga Bagong Chipset noong Q2-Q3 2020
Provider Speed ScoreTM
Smart 19.97
Globe 13.47

Ang Smart ang may pinakamabilis na Speed Score kumpara sa mga nangungunang mobile operator sa Pilipinas sa Speed Score na 19.97 noong Q2-Q3 2020. Ang Globe ang nagpakita ng pangalawang pinakamabilis na Speed Score sa Speed Score na 13.47.

Performance ng Internet ng Mga Nangungunang ISP sa Pilipinas
Speedtest Intelligence® | Q2-Q3 2020
Provider Speed ScoreTM
PLDT 24.67
Converge ICT 22.44
SKY 18.25
Globe 9.74
Smart 7.60

Ang PLDT ang pinakamabilis na fixed broadband provider noong Q2-Q3 2020 na may Speed Score na 24.76. Pumangalawa ang Converge ICT, habang pumangatlo naman ang SKY.

Ang Smart ang mobile network operator na may pinakamataas na rating, at ang PLDT ang fixed broadband provider na may pinakamataas na rating

Inihambing namin ang mga five-star na rating at data ng NPS sa performance ng mga provider para maunawaan kung paano nakakaapekto ang mga bilis sa mga opinyon ng customer tungkol sa mga provider sa Pilipinas. Nakakalap ang data ng Speedtest Consumer Sentiment mula sa mga isang tanong na survey na ipinapakita sa mga user pagkatapos magsagawa ng Speedtest®. Ang set ng data na ito ay nagbibigay ng mga makabuluhang insight sa kasiyahan ng customer sa paglipas ng panahon, pati na rin ng competitive benchmarking, sa pamamagitan ng pagbibigay ng data tungkol sa Net Promoter Score (NPS) at kabuuang kasiyahan ng mga customer sa kanilang mga network provider.

Performance ng Internet at Mga Five-Star na Rating ng Mga Nangungunang Mobile Operator sa Pilipinas
Speedtest Intelligence® | Mga Bagong Chipset noong Q2-Q3 2020
Provider Speed ScoreTM Rating
Smart 19.97 3.3
Globe 13.47 2.5

Tumugma ang mga rating sa performance ng lahat ng nangungunang mobile operator sa bansa noong Q2-Q3 2020. Ang Smart ang pinakamabilis na mobile operator at ito ang may pinakamataas na rating noong panahong ito sa rating na 3.3 stars. Ang Globe ang pumangalawa na may rating na 2.5 stars.

Performance ng Internet at Mga Five-Star na Rating ng Mga Nangungunang ISP sa Pilipinas
Speedtest Intelligence® | Q2-Q3 2020
Provider Speed ScoreTM Rating
PLDT 24.67 2.7
Converge ICT 22.44 3.1
SKY 18.25 2.4
Globe 9.74 2.3
Smart 7.60 2.7

Ang Converge ICT ang nagpakita ng pinakamataas na rating mula sa lahat ng user sa Pilipinas noong Q2-Q3 2020. Pumangalawa ang PLDT at Smart na may parehong rating, na sinundan ng SKY at Globe.

Ang Smart ang nagkaroon ng pinakamataas na NPS sa mobile, at ang Converge ICT naman ang nagkaroon ng pinakamataas na NPS sa fixed broadband

Tinanong din ang mga user ng Speedtest kung ano ang posibilidad na irerekomenda nila sa mga kaibigan o pamilya ang kanilang provider sa scale na 0 hanggang 10. Nakakategorya ang mga rating ng NPS sa Detractors (score na 0-6), Passives (score na 7-8), at Promoters (score na 9-10). Kinakalkula ang NPS bilang (% Promoters – % Detractors) x 100. Ipinahihiwatig ng anumang NPS score na mas mataas sa 0 na ang audience ng provider ay mas loyal. Inihambing namin ang nagreresultang Net Promoter Score (NPS) sa Speed Score para makita kung paano nauugnay ang performance sa posibilidad na irekomenda ng user ang isang provider.

Performance ng Internet at NPS ng Mga Nangungunang Mobile Operator sa Pilipinas
Speedtest Intelligence® | Mga Bagong Chipset noong Q2-Q3 2020
Provider Speed ScoreTM NPS
Smart 19.97 -20.79
Globe 13.47 -61.63

Ang Smart ang nagkaroon ng pinakamataas na NPS noong Q2-Q3 2020 bukod pa sa pagiging pinakamabilis na provider. Nagpakita ng negatibong NPS ang Smart at Globe noong panahong ito. Ipinapahiwatig nito na maliit ang posibilidad na irerekomenda ng mga user sa kanilang mga kaibigan at pamilya ang mga mobile operator na ito.

Performance ng Internet at NPS ng Mga Nangungunang ISP sa Pilipinas
Speedtest Intelligence® | Q2-Q3 2020
Provider Speed ScoreTM Rating
PLDT 24.67 -46.39
Converge ICT 22.44 -16.51
SKY 18.25 -60.87
Globe 9.74 -65.52
Smart 7.60 -49.18

Hindi tumugma ang performance ng fixed broadband sa NPS noong Q2-Q3 2020 sa Pilipinas. Ang Converge ICT ang nagkaroon ng pinakamataas na NPS sa NPS na -16.51, na sinundan ng PLDT at Smart. Ang PLDT ang pinakamabilis na provider noong panahong ito, ngunit nagpakita ito ng NPS na lubos na mas mababa kaysa sa NPS ng Converge ICT. Negatibo ang NPS ng lahat ng provider noong panahong ito, na nagpapahiwatig na sa lahat ng network sa Pilipinas, malamang na hindi irekomenda ng mga user ang kanilang provider — at hindi palaging tugma ang performance at kasiyahan ng customer.

Umaasa kami na ang mga patuloy na pagpapahusay sa imprastraktura ay magreresulta sa mas maayos na performance, at patuloy naming susuriin kung ang mga resultang iyon ay hahantong sa higit pang kasiyahan ng customer. Para sukatin ang bilis ng iyong internet at makapagbigay ng feedback tungkol sa performance ng provider mo, magsagawa ng Speedtest.

Ookla retains ownership of this article including all of the intellectual property rights, data, content graphs and analysis. This article may not be quoted, reproduced, distributed or published for any commercial purpose without prior consent. Members of the press and others using the findings in this article for non-commercial purposes are welcome to publicly share and link to report information with attribution to Ookla.