| February 13, 2023

mmWave Clocks Gigabit Speeds in the U.S. but Lacks Maturity Elsewhere

In this article, we will look at the real-life performance of mmWave in the United States, reflect on its progress so far across the globe, and discuss what the future holds.

Key takeaways

  • mmWave received additional spectrum as part of Release 17, in addition to the spectrum already allocated by Rel-15 and WRC-19. 5G connectivity using mmWave substantially improves 5G performance (increasing theoretical speeds to up to 5 Gbps). At the same time, it comes with a challenge because of its limited range, which can be easily blocked or obscured, necessitating a high degree of network densification, which comes with additional Capex. 
  • After initial enthusiasm, operators’ appetite for the mmWave band spectrum has been lackluster, with only two auctions taking place in 2022. However, we see a renewed interest, which could lead to more spectrum allocations and network launches. 
  • Due to the limited rollout of mmWave 5G networks, the device ecosystem has lagged behind other 5G spectrum bands. While support for mmWave spectrum bands across smartphones is skewed heavily towards the  U.S., an increase in spectrum launches and networks combined with a declining ASP should lead to a growing adoption worldwide. 
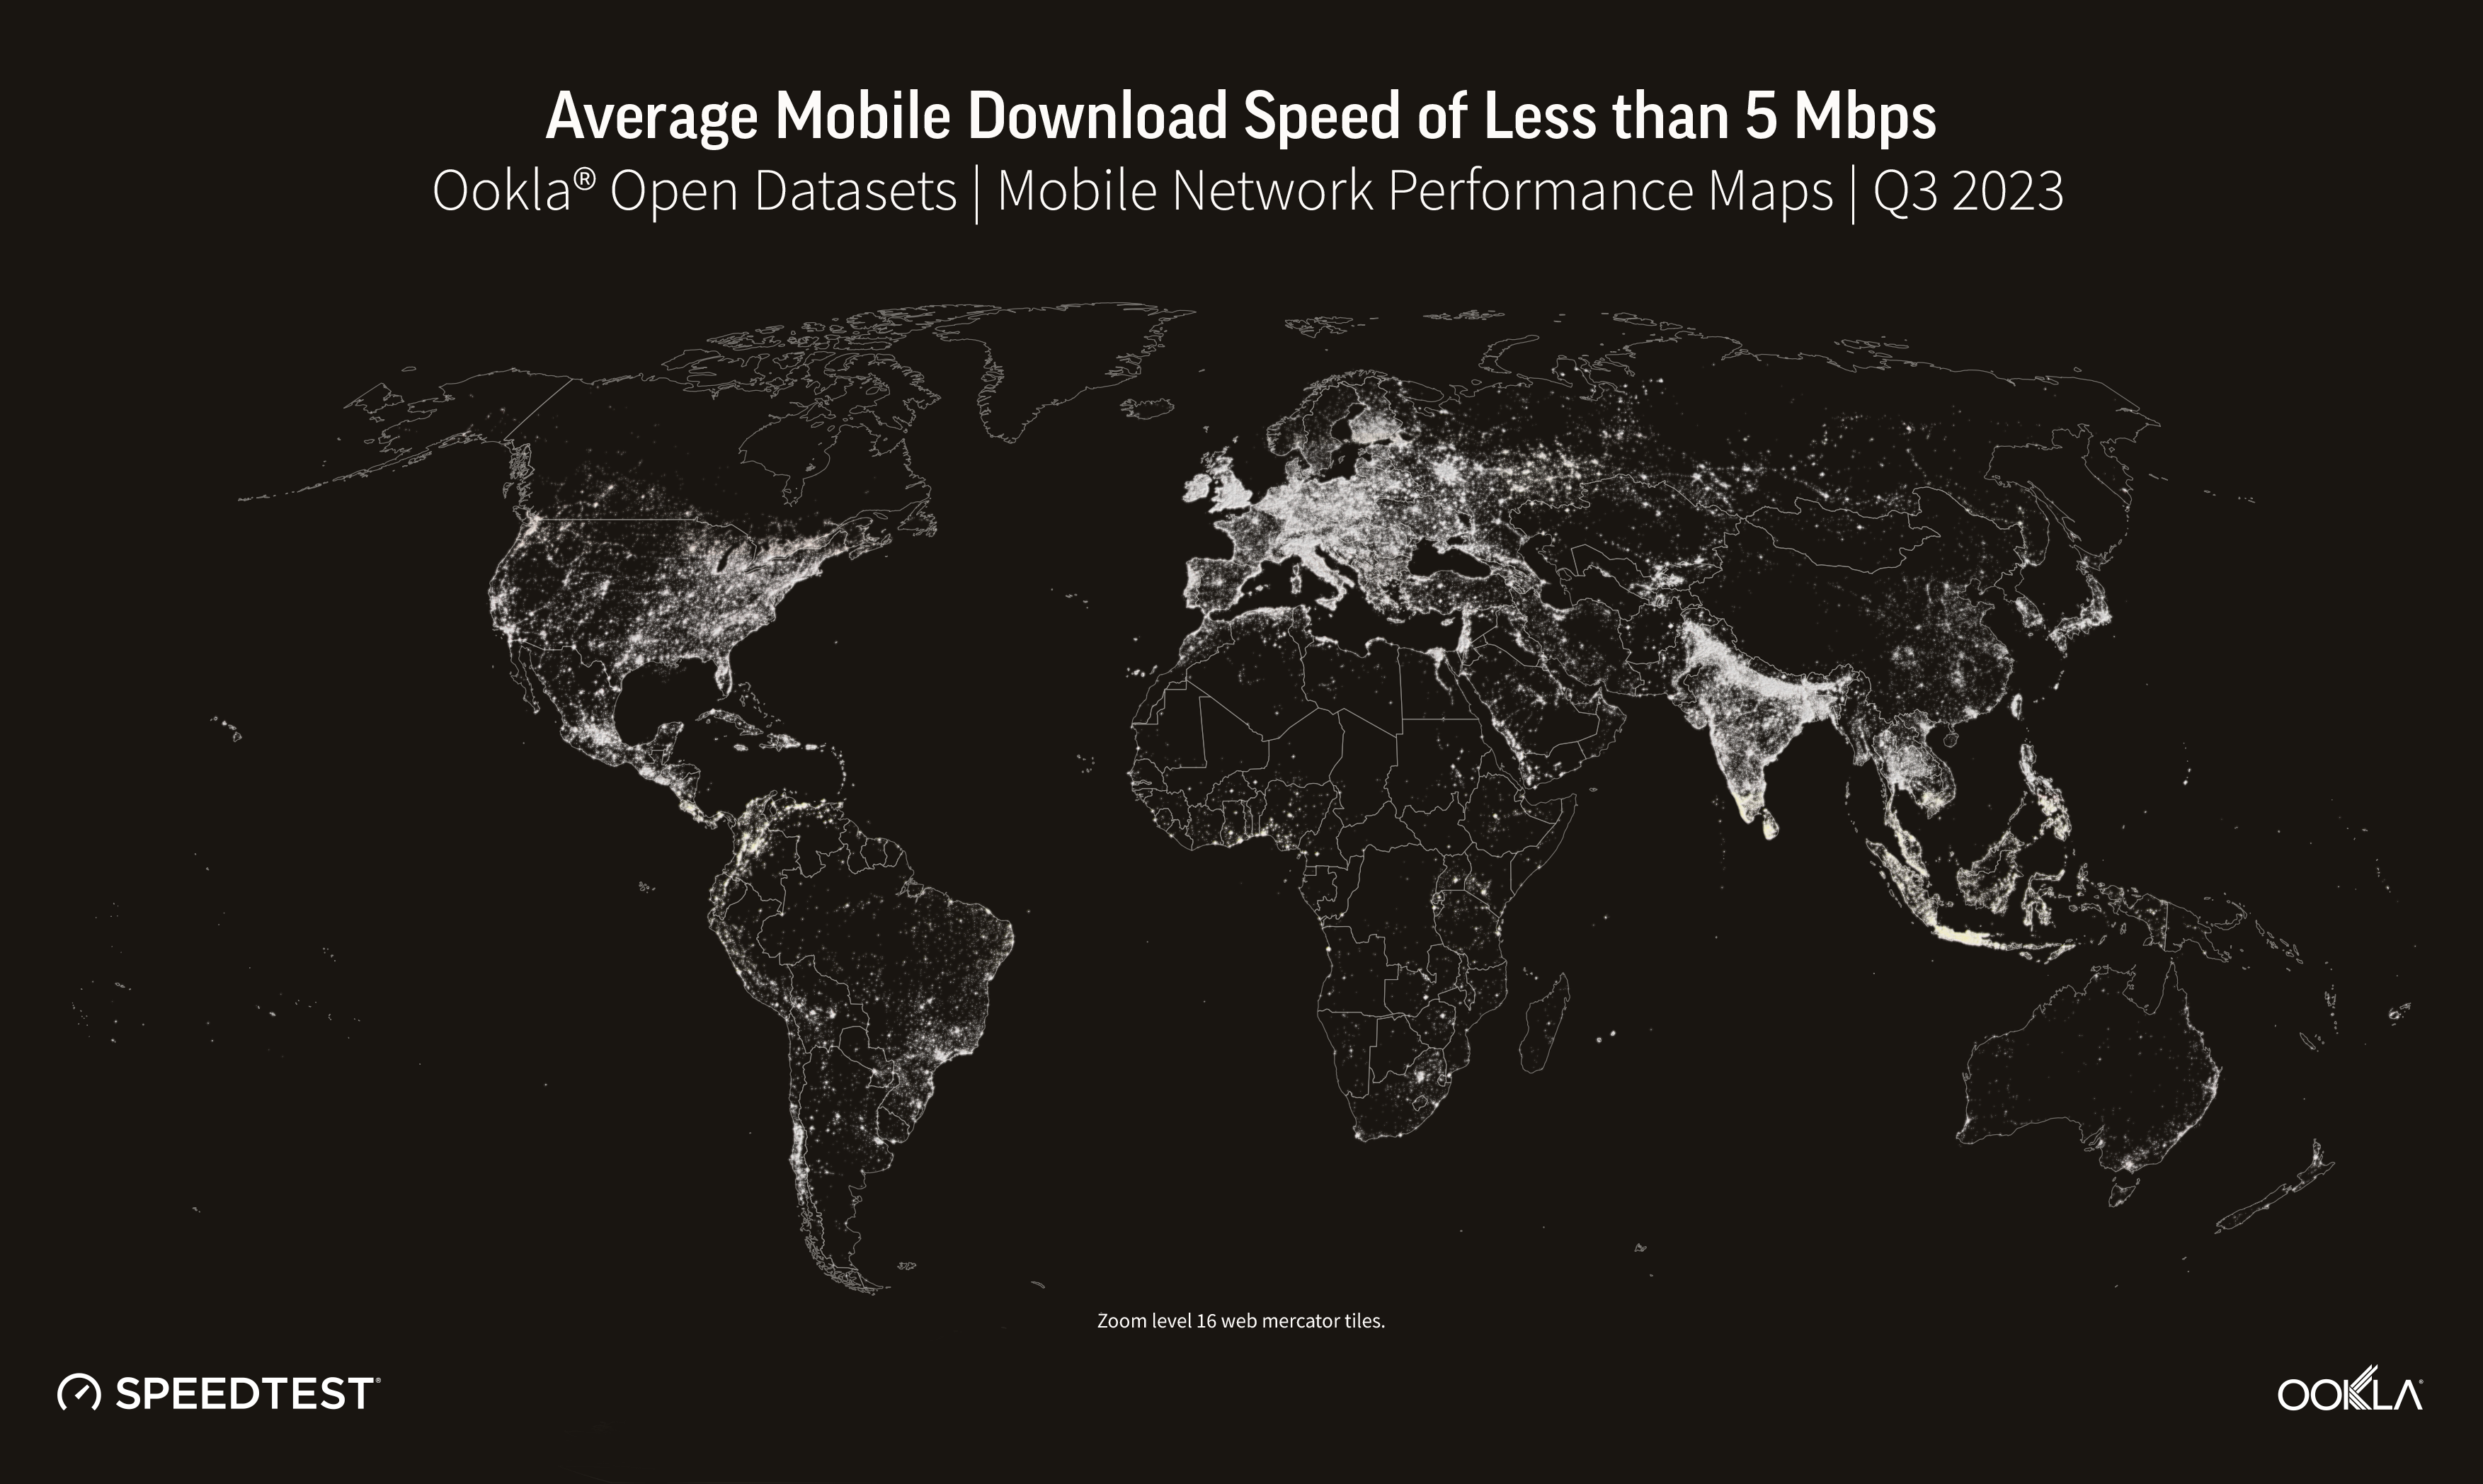
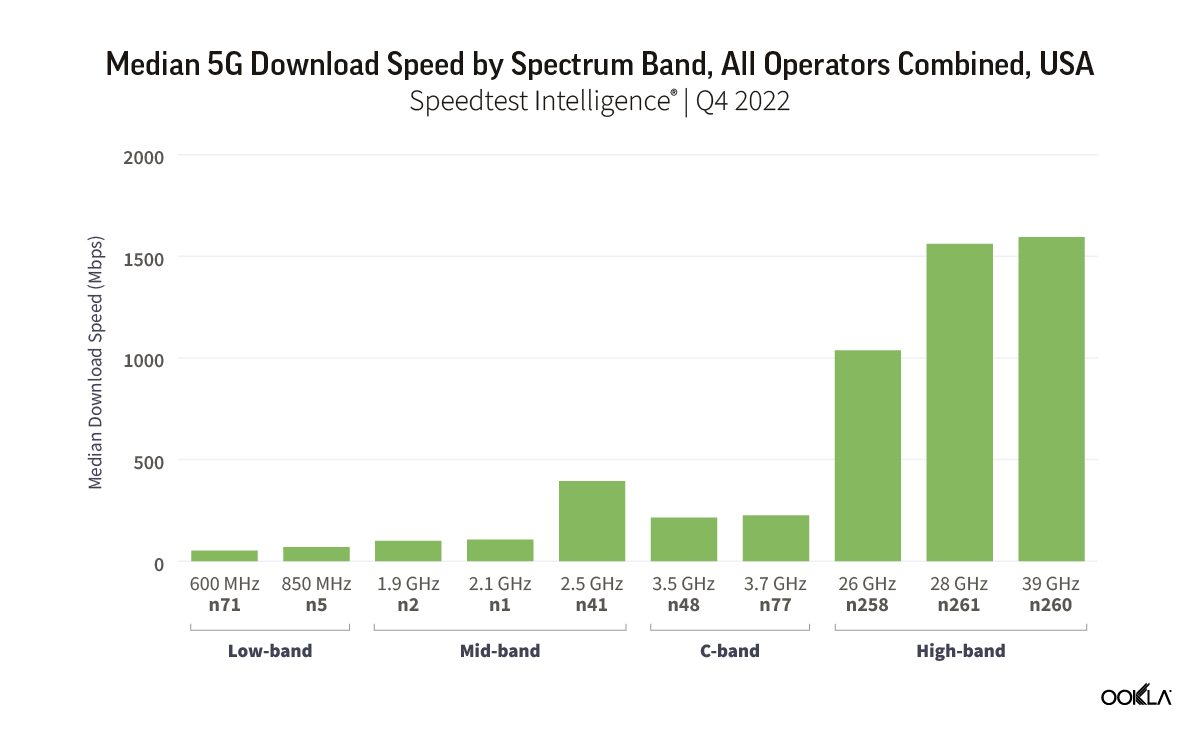
  • Ookla® Q4 2022 data from the U.S. shows mmWave is achieving mind blowing speeds — almost 1.6 Gbps median 5G download speed — 26 times faster than the median 5G speed on low-band, almost seven times faster than the C-band, and four times than mid-band. 
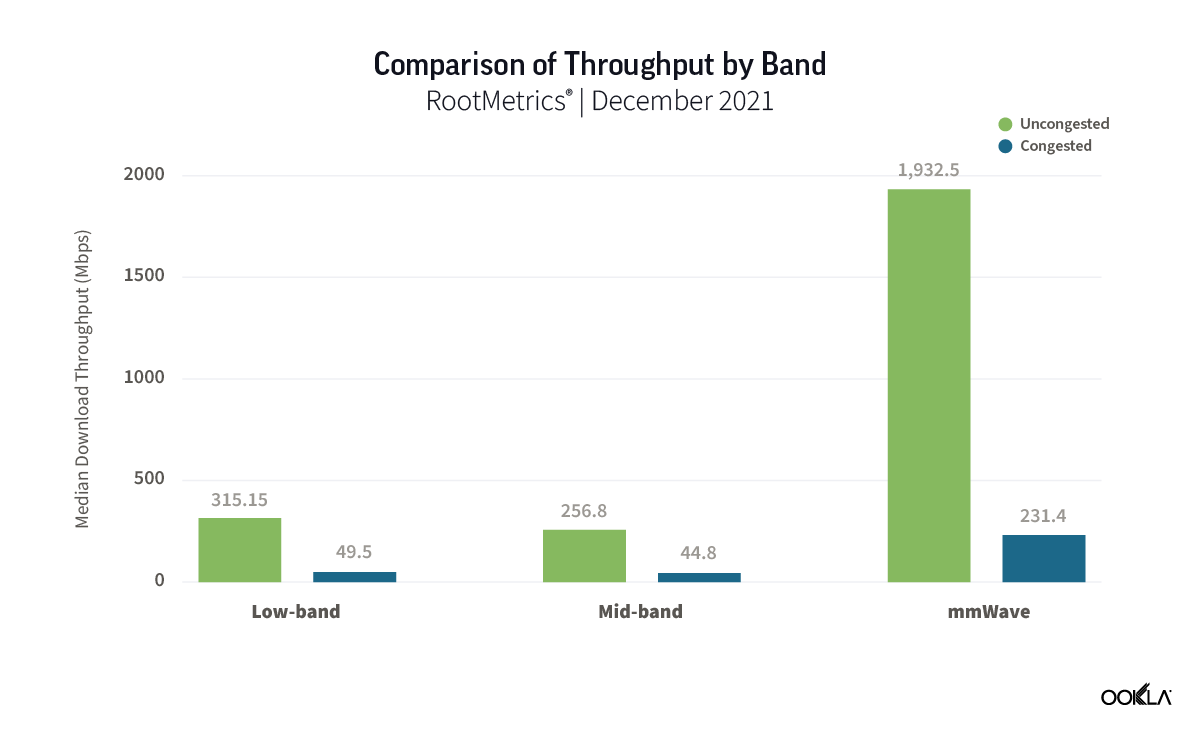
  • RootMetrics® tested mmWave performance simulating congested network environments and concluded that even in such conditions, mmWave spectrum could achieve four times faster throughput than mid- and low-band spectrum.

mmWave spectrum allocation and commercialization 

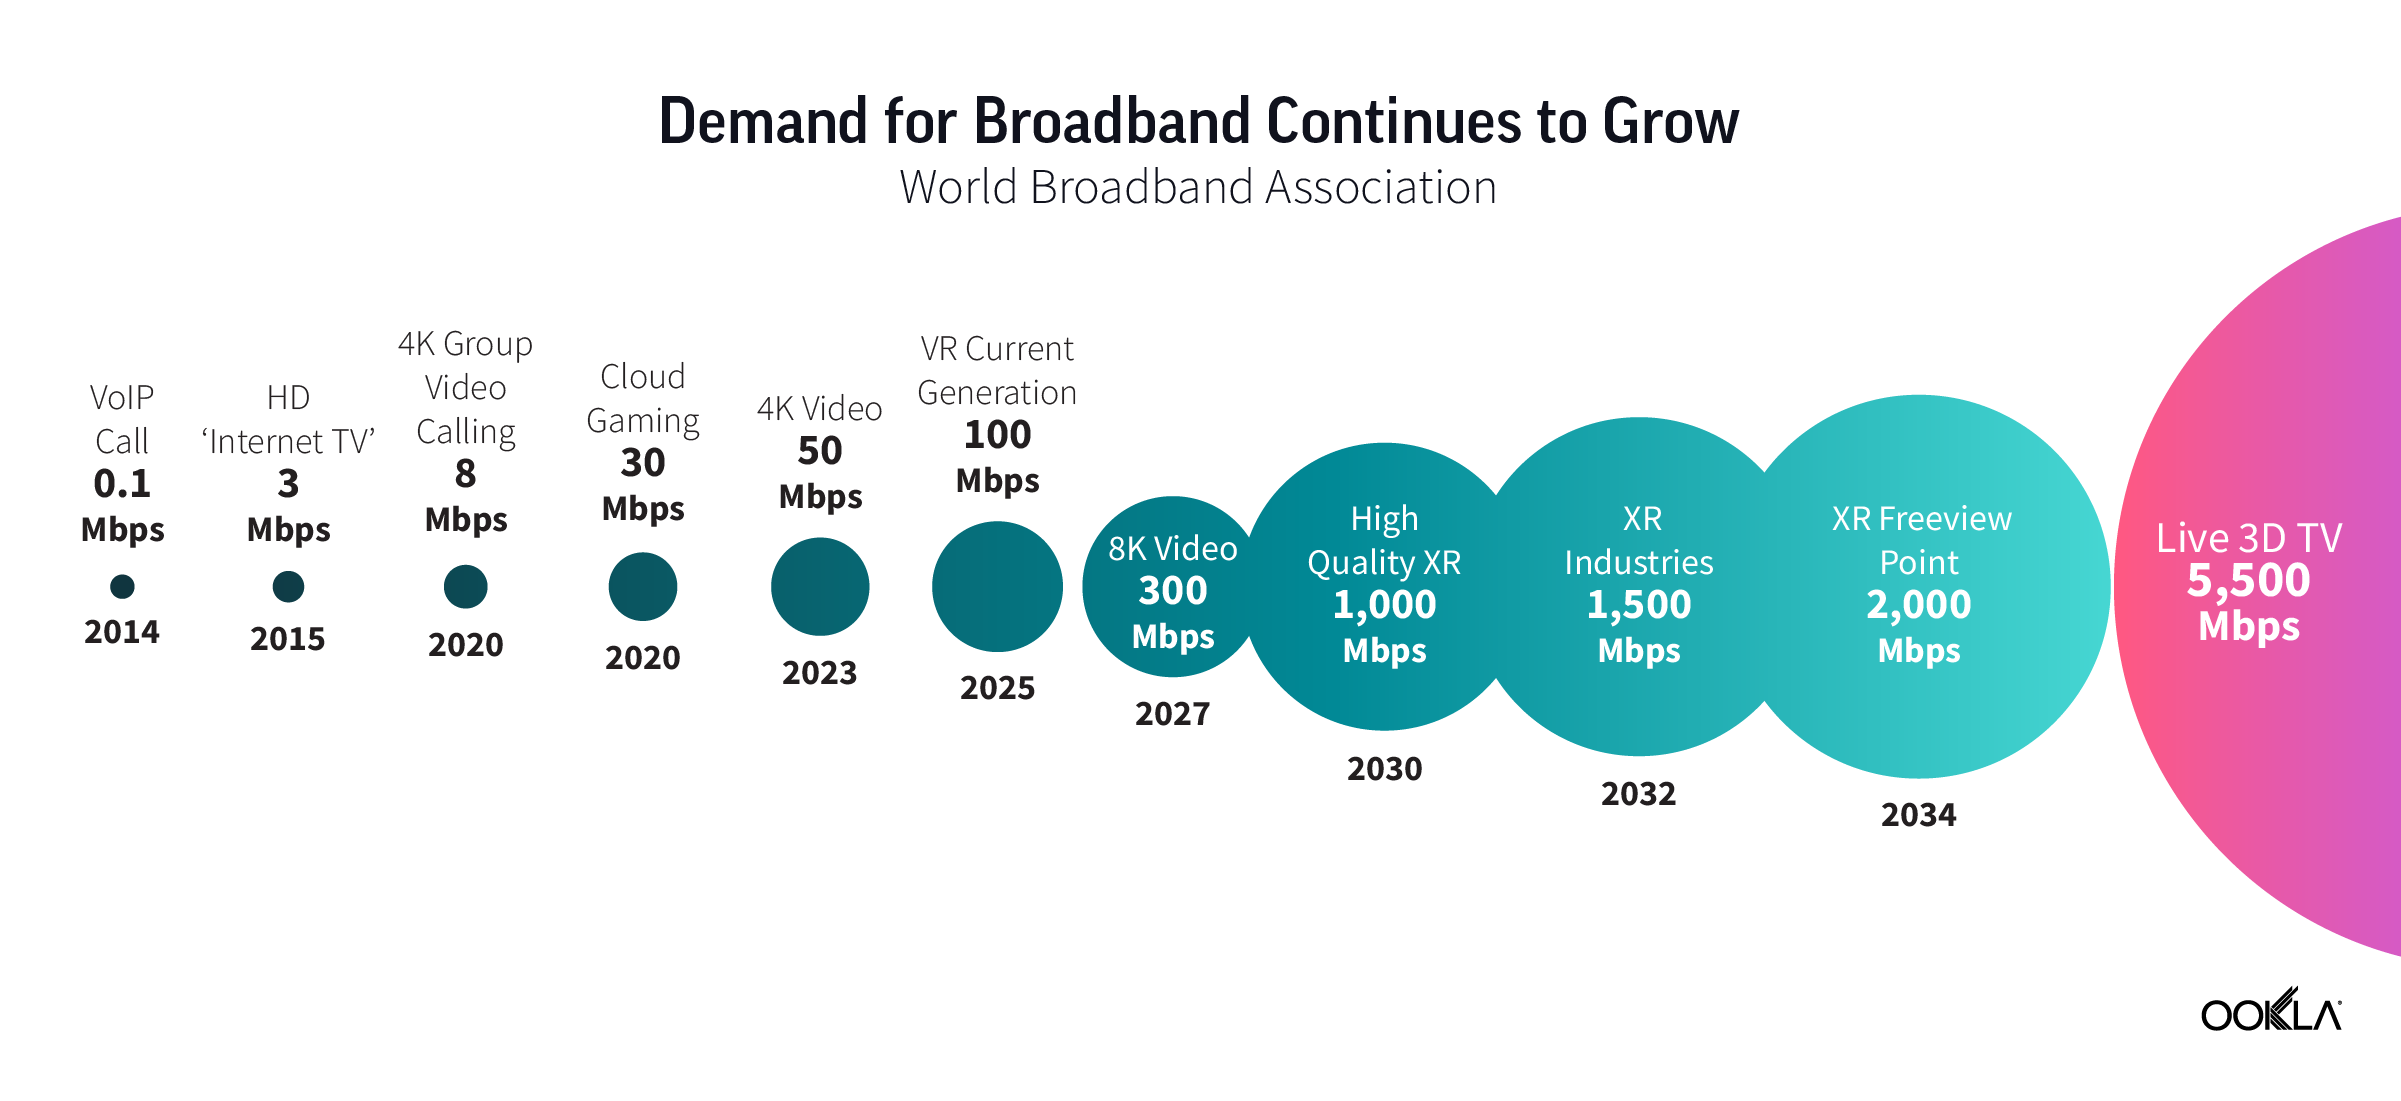
Oftentimes, consumers complain about 5G speeds, sold on the promise of ultra-fast mobile networks. Such speeds can only be delivered utilizing the mmWave spectrum band. Up until and including 4G LTE, operators have been deploying networks in the sub-6 GHz spectrum. It was only with Release 15 that the telecom standards body 3GPP extended the spectrum ranges available for mobile networks. Frequency bands for 5G New Radio (NR) are separated into two frequency ranges: 

  • Frequency Range 1 (FR1) refers to sub-6 GHz frequency bands, traditionally used by previous network generations, which have been further extended to cover potential new spectrum offerings from 410 MHz to 7125 MHz.
  • Frequency Range 2 (FR2) refers to frequencies above 24 GHz.

Chart of mmWave 5G frequency bands

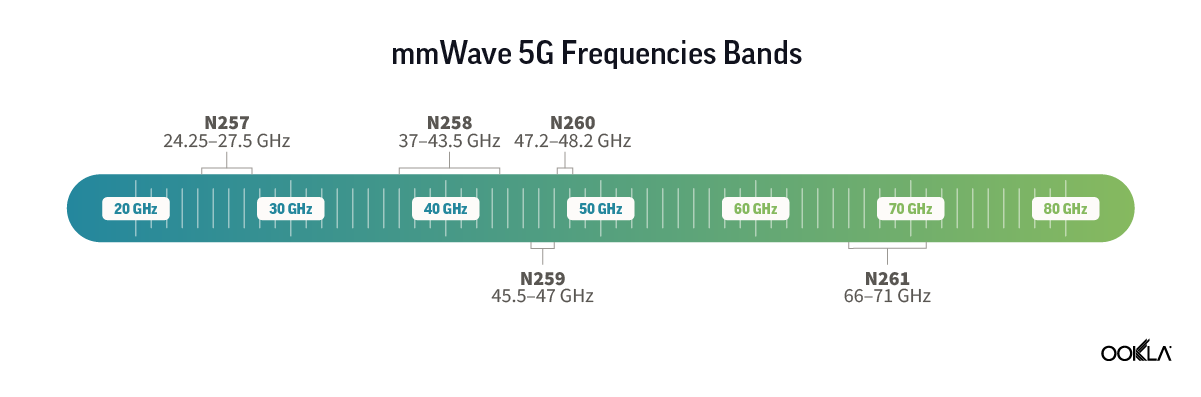
Furthermore, in November 2019, delegates of the World Radiocommunication Conference (WRC-19) identified additional radio frequency bands for IMT-2020 (the name ITU uses for 5G standards). These frequency bands are 24.25-27.5 GHz, 37-43.5 GHz, 45.5-47 GHz, 47.2-48.2, and 66-71 GHz. 3GPP’s recently completed Release 17 has further expanded the mmWave spectrum frequency range from 24.25-52.6 GHz up to 71 GHz, including support for the global 60 GHz unlicensed band.

So far, mmWave spectrum allocation has been lackluster across Europe, following initial enthusiasm in the U.S., Japan, and South Korea. According to Global Mobile Suppliers Association (GSA), 26 countries have licensed mmWave worldwide. In 2022, only two auctions took place in India and Spain in the 26 GHz frequency band. The Indian auction itself was a subject of intense debate and lobbying against its allocation in the 28 GHz band by the satellite providers. The regulator auctioned the 26 GHz band to minimize overlaps and interference issues.

Map of mmWave spectrum auctions worldwide

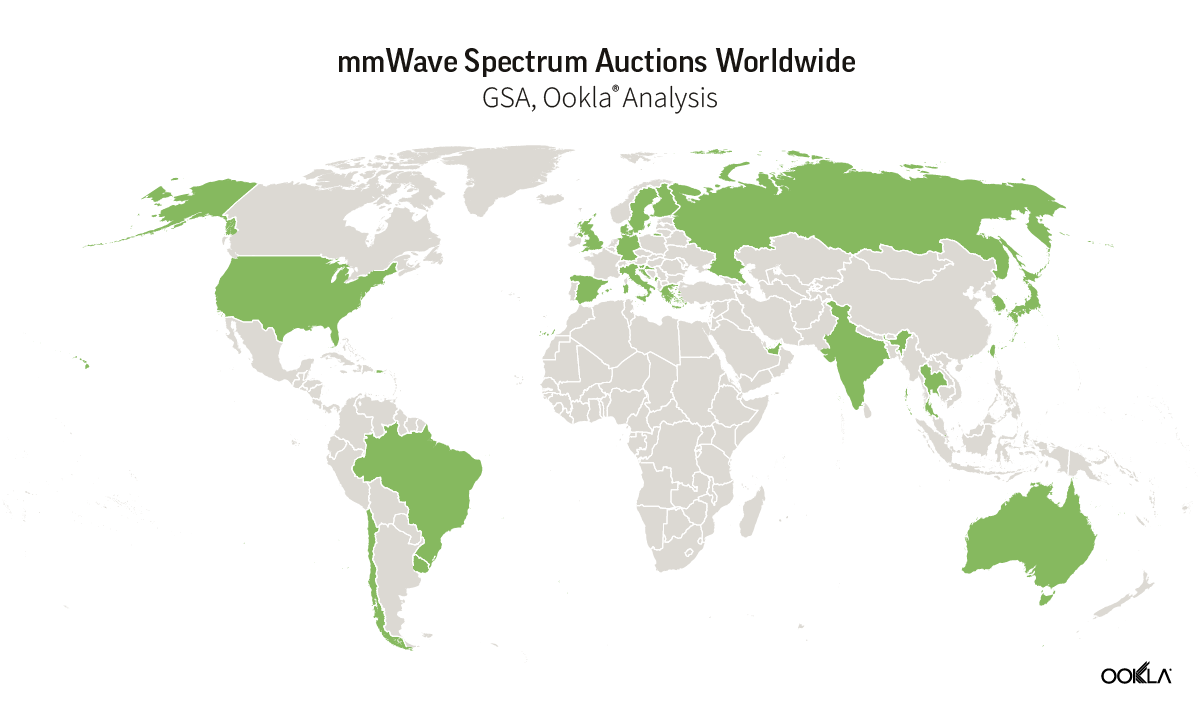
However, the momentum for mmWave spectrum allocations is growing, especially in Europe. While 14 countries in Europe have licensed mmWave so far, more are planning to do so e.g., Hungary, Austria, and the United Kingdom, which should lead to more deployments and create economies of scale that the mmWave device ecosystem currently lacks. 

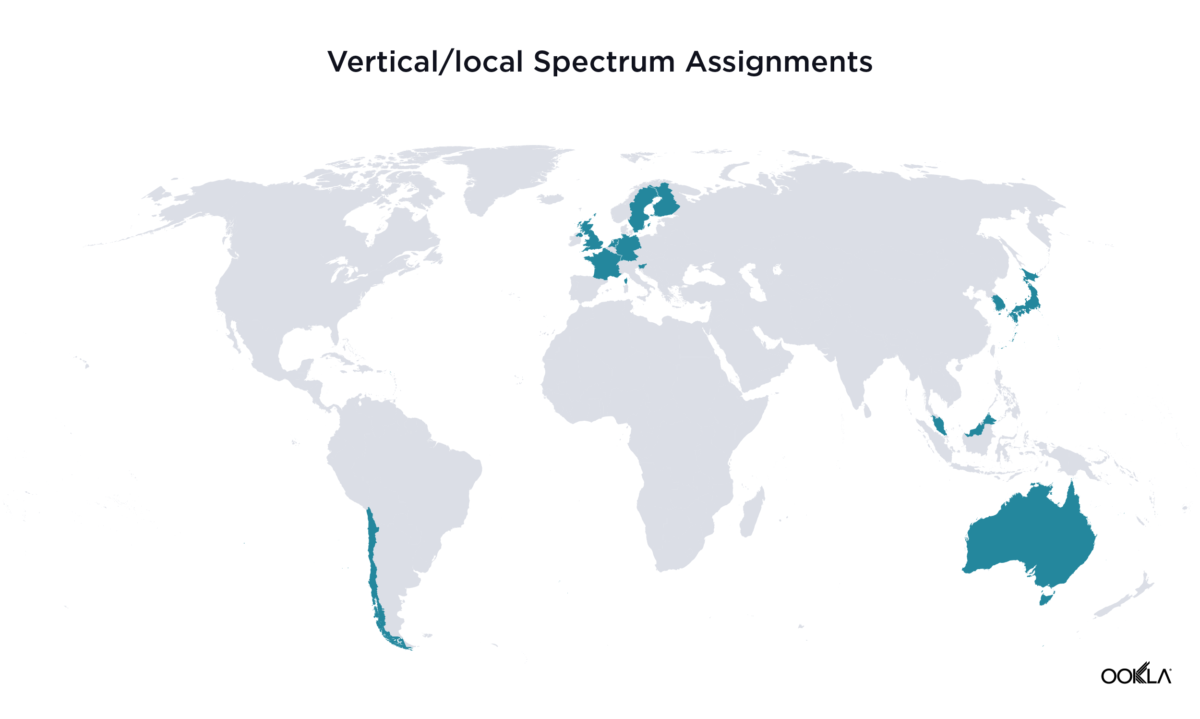
Beyond consumers, mmWave can address the needs of enterprise applications that require higher bandwidth and lower latency, such as factory robots or AGVs. For example, Italian manufacturer Exor International partnered with Intel, TIM, and JMA Wireless to build an end-to-end smart factory in Verona to showcase the benefits that Industry 4.0 brings to manufacturing utilizing sub-6 GHz and 26 GHz spectrum. It is worth noting that several regulators have created an encouraging environment for enterprises to deploy their own dedicated networks by allocating spectrum for vertical use across mid- and high-frequency bands. So far, ten countries have set aside mmWave spectrum for enterprises, including Australia, Denmark, Germany, Greece, Japan, Hong Kong, Finland, Sweden, South Korea, and the U.K. Japanese Fujitsu deployed a private 5G network combining 4.7 GHz SA and 28 GHz. 

The growing pains of the mmWave device ecosystem 

The South Korean example offers a cautionary tale regarding 5G mmWave readiness.

In 2018, three operators — SK, KT, and LG U+ — spent 620 billion Won ($435 million) on a five-year license for the 28 GHz spectrum. As part of the license conditions, operators had to deploy 15,000 base stations by the end of 2021. Following an audit by the Ministry of Science and IT (MSIT), KT and LGU+ had their licenses revoked, and SK Telecom was reduced by six months. One key challenge operators pointed to was the need for a mature mmWave devices ecosystem in the market.

Looking at the latest GSA data, this is indeed the case. Across the commercially available 5G devices that GSA has identified spectrum support information, most devices (85.7%) support the sub-6GHz band and only 8.9% mmWave spectrum.

Chart of number of announced 5G devices by spectrum band

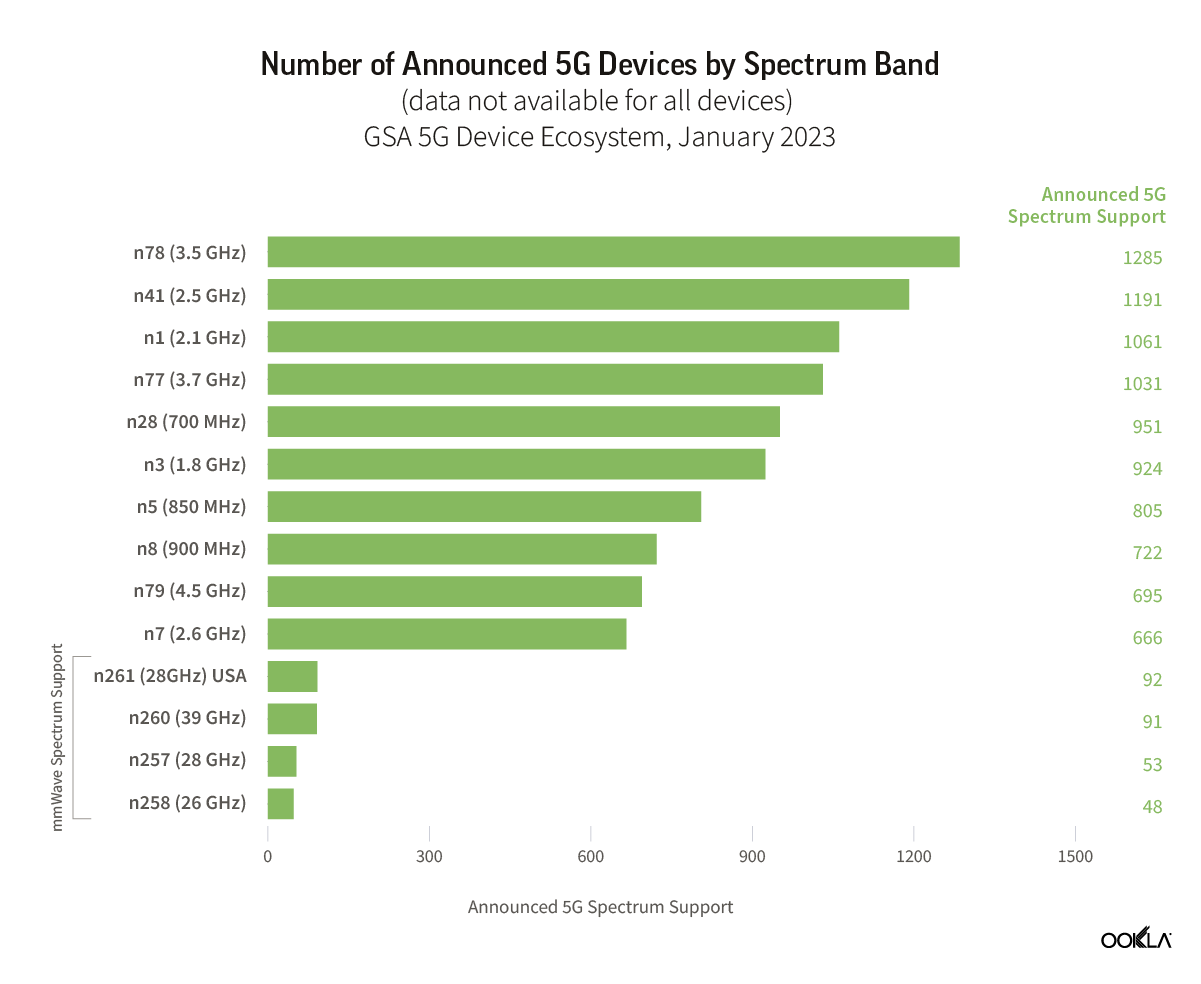
However, mmWave device availability differs depending on the geography with smartphone availability heavily skewed to the U.S. For instance, all ‌iPhone 12‌-14 models in the U.S. support both mmWave and sub–6 GHz 5G connectivity; this was not the case in South Korea. Across Android-based smartphones, the story is similar. The Pixel 6 Pro includes mmWave 5G support only in the U.S., Australia, and Japan. There is also a price difference across devices that offer support for mmWave. For example, Google Pixel 6 is available in two versions in the U.S. — an unlocked version with sub-6 GHz 5G for $599 and another with mmWave 5G for $699. The latter is offered via operators such as Verizon and AT&T. The price difference is likely due to the mmWave requirement for specialized radio hardware and antennas. Yet, on average, the price delta between sub-6 GHz and mmWave smartphones is narrowing down to $10- $20, Counterpoint Research shows. 

Furthermore, Counterpoint sees consumer awareness and adoption growing in the U.S. According to its U.S. smartphone users survey, 60% of users checked before purchasing whether a 5G Smartphone has 5G mmWave capability, while 43% of users in the future plan to subscribe to 5G mmWave services and smartphones. Beyond the U.S., Counterpoint sees one billion cumulative 5G mmWave smartphone shipments between 2019 and 2026, with mmWave smartphone penetration reaching 26% by 2026, compared to 13% in 2022.

mmWave supports FWA 

Fixed Wireless Access (FWA) is often considered one of the most successful 5G use cases as we recently pointed out. Some operators leverage mmWave to offer FWA services, for example, in April 2022, US Cellular launched 5G Home Internet using mmWave spectrum (28 GHz and 39 GHz) in partnership with Qualcomm and Inseego across ten cities. In Italy, Fastweb collaborated with Qualcomm to commercialize 5G SA mmWave services in March 2022, following a partnership to deliver 5G FWA to 400 cities. Vendors are vying to address this opportunity too. Recently, Mavenir launched an FWA solution that supports massive MIMO and 5G mmWave for 4G, 5G NSA, and 5G SA deployments. This FWA platform has been deployed by several customers, such as 360 Communications, RINA Wireless, Triangle Communications in the U.S., and Quickline in the U.K. 

mmWave delivers on the promise of gigabit speeds 

The U.S. is a global leader in using mmWave spectrum, with AT&T, T-Mobile, and Verizon using mmWave to offer mobile service, while US Cellular deploys it for FWA. Speedtest Intelligence® data shows that 5G connectivity using mmWave can reach staggering speeds of up to 1.6 Gbps. Comparing 5G performance across spectrum bands across mobile operators in the U.S. used for 5G services low-, mid-, C-band, and high-band (mmWave) it is clear that mmWave delivers superior performance. Our data shows that users on 5G mmWave achieved speeds that are 4.29 times faster than mid-band, 6.86 times faster than C-band, and a staggering 26.1 times faster than a low band.

Chart of median 5G download speed by spectrum band in the US

Due to its high throughput, mmWave is particularly useful for streaming and gaming. For example, at CES 2023, Razer unveiled its new Razer Edge, the first Android handheld gaming tablet on the market. The device can play games locally on the device or stream them remotely via 5G. The Razer Edge 5G became available from Verizon on January 26. 

Mmwave also offers the advantage of lower latency — anything over 20 ms will give gamers a headache, according to Qualcomm

mmWave helps with network congestion too 

Speaking at the Citi 2023 Communications, Media & Entertainment conference, Kyle Malady — Verizon’s Executive VP, President of Global Networks & Technology, noted that the operator has deployed over 40,000 mmWave nodes, which support its 5G services in dense, urban environments. He also stated, “And now that millimeter wave technology turns into a tool for RF engineers to use in hotspots that they have and C-Band.” 

A RootMetrics study supports this, based on several tests conducted in December 2021 to simulate the performance of the 5G spectrum in a congested environment. While, unsurprisingly, the results showed speeds in congested environments were slower on all bands than when congestion wasn’t present, there was a difference when it came to bands in use: mmWave 5G delivered a median download speed of 231.40 Mbps, which was over four times faster than the speeds recorded on either mid-band or low-band 5G, both of which were below 50 Mbps (44.80 Mbps on mid-band and 49.50 Mbps on low-band). To put mmWave’s capacity boost in a different perspective, its speed of 231.40 Mbps with congestion was nearly as fast as the 256.80 Mbps recorded on mid-band 5G without congestion. RootMetrics’ study showed that mmWave provides speeds 4-5 times faster than those of mid- and low-band in congested circumstances, delivering on its promise of providing greater capacity and faster speeds under heavy network load. 

Chart of comparison of throughput by band

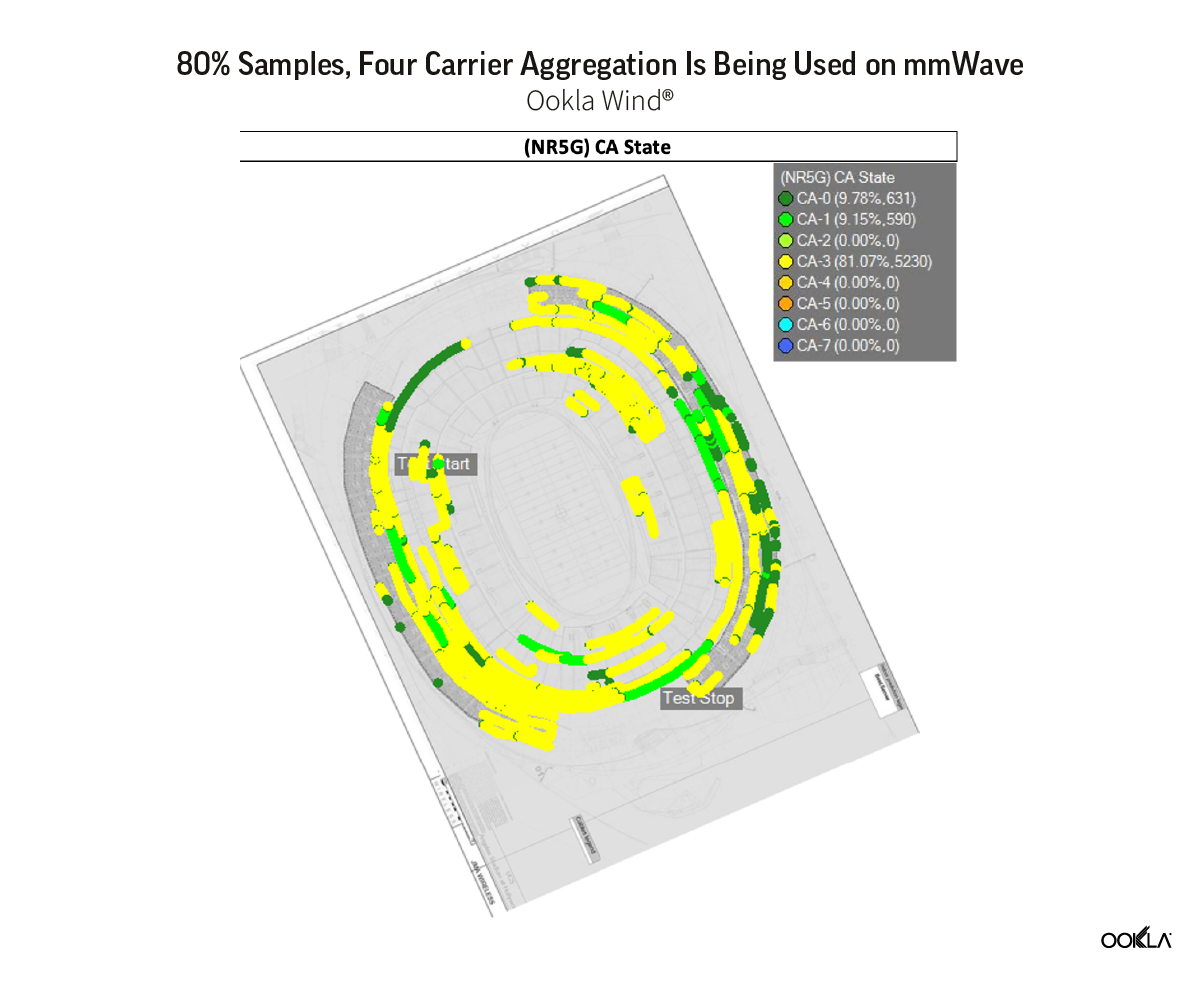
Millimeter wave also lends additional capacity in dense areas such as stadiums. Poor performance during events such as concerts stems from the networks needing to deal with extra demand and becoming congested. Constraints on the spectrum allocated to 5G today can impact performance more in places like stadiums than in other areas because many users are concentrated in a small space and share the same limited spectrum. To illustrate how mmWave enables better network performance, we can look to Ookla Wind® walk testing data, which can show the benefits of mmWave in terms of 5G bandwidth. Since each carrier is 100 MHz wide, a test showed that a stadium used four carriers aggregated 80% of the time, which resulted in 400 MHz of 5G bandwidth. In turn, this helped to achieve higher 5G capacity and lower latency. 

Illustration of 80% samples, four Carrier Aggregation is being used on mmWave

Another benefit of mmWave that the Wind test showed is that with the mmWave 5G NSA network, most of the user data traffic is carried by mmWave spectrum only (contrary to other 5G bands in NSA). This reduces the load on the LTE network. This, in turn, allows legacy users with non-5G capable devices to use an LTE network that is less congested because it doesn’t have to support 5G devices as well. 

We will examine the relationship between spectrum and 5G performance in future articles. Subscribe to Ookla Research to stay up to date on our analyses. 

Ookla retains ownership of this article including all of the intellectual property rights, data, content graphs and analysis. This article may not be quoted, reproduced, distributed or published for any commercial purpose without prior consent. Members of the press and others using the findings in this article for non-commercial purposes are welcome to publicly share and link to report information with attribution to Ookla.

| May 10, 2021

Prevalent and Fast Wi-Fi in Thailand Drives Improvements in Internet Speeds

Thailand has witnessed significant improvement in fixed broadband internet speeds over the past couple of years, as fiber-to-the-home (FTTH) continues to grow strongly in major metropolitan areas. And then the pandemic hit. With COVID-19, companies across the globe adapted to working from home, and people began spending more time online with the implementation of lockdowns. This led to a surge in overall internet traffic for internet service providers (ISPs), especially on fixed networks. We used data from Speedtest Intelligence® to analyze the effect of this in Thailand during Q1-Q4 2020 to determine if the increase in traffic slowed internet speeds and degraded end-user experience. We also looked closely at Wi-Fi in Thailand to see how increased usage affected speeds.

Thailand jumps in international rankings

Data from the Speedtest Global Index during 2020 shows Thailand managed the challenges of increased traffic comparatively well, climbing from a ninth-place position for mean fixed broadband speed in January 2020 to third place in December 2020. Singapore and Hong Kong held on to the first- and second-place, respectively, throughout the year.
ookla_speedtest_global_index_rank_change_2020-2

Thailand second fastest ASEAN country for fixed broadband

ASEAN is one of the fastest growing internet markets in the world, and data from Speedtest Intelligence shows the number of fixed broadband users in ASEAN countries grew by 40.7% year-over-year, from 22.97 million unique users in 2019 to 32.31 million users in 2020. Impressively, speed has kept up with demand in Thailand where the mean download speed over fixed broadband during 2020 was 166.81 Mbps, ranking the country second-fastest among ASEAN member states. Singapore was first with a mean download speed of 214.39 Mbps over fixed broadband during the same period. Other ASEAN countries lag far behind Singapore and Thailand for fixed broadband internet speeds, with Indonesia ranking last on the list with an average download speed of 22.07 Mbps during 2020. We have omitted Myanmar from this analysis due to the current political situation.
ookla_mean_fixed_broadband_speeds_asean_2020-2

Wi-Fi usage increased during the pandemic

The percentage of time people spend on Wi-Fi is one indicator of the amount of time people spend at home and Speedtest Intelligence shows an increase in Wi-Fi usage during the pandemic. In Thailand, Android mobile phone users spent 7.4% more time on Wi-Fi in December 2020 when compared with January 2020. This effect was not limited to Thailand, all ASEAN countries showed an increase in Wi-Fi usage since the onset of COVID restrictions in March 2020.
ookla_time_spent_wi-fi_asean_2020

Wi-Fi speeds are improving throughout Thailand’s provinces

A comparison of Speedtest Intelligence data from Q1 2020 to that from Q4 2020 showed mean Wi-Fi speeds on modern Android devices have improved throughout the country.
ookla_wi-fi_speeds_android_thailand_2020

Speedtest Intelligence data from Q4 2020 showed Phrae province was the fastest of Thailand’s 77 provinces, boasting an average download speed of 462.14 Mbps in Q4 2020. Sing Buri and Sa Kaeo provinces were second and third fastest at 367.14 Mbps and 304.33 Mbps, respectively. Mean download speeds in the other provinces vary widely in the range of 180-300 Mbps. Satun and Uthai Thani provinces displayed some of the slowest speeds in the country with mean download speeds of 180.77 Mbps and 180.37 Mbps, respectively.

Mean Wi-Fi Speeds on 5 GHz Using Modern Android Devices in 10 Fastest Thai Provinces and Bangkok
Speedtest Intelligence® | 2020
Nan282.32189.1749.2%

Province Q4 Download Speed (Mbps) Q1 Download Speed (Mbps) % Change
Phrae 462.14 228.55 102.2%
Sing Buri 367.14 295.35 24.3%
Sa Kaeo 304.33 174.07 74.8%
Kanchanaburi 291.09 202.98 43.4%
Ranong 286.76 287.68 -0.3%
Phang-nga 286.01 210.43 35.9%
Uttaradit 281.16 234.41 19.9%
Phuket 280.77 220.44 27.4%
Lopburi 275.66 197.27 39.7%
Bangkok 260.15 225.33 15.5%

Regulatory changes should increase investment in Thailand’s fixed broadband

The Thai government has recently made some changes to improve its regulatory framework which should attract more investment in fixed broadband, which in turn will facilitate the transition from DSL and cable to fiber.

In addition, fixed-line operators in Thailand have been focusing on developing FTTH networks in urban areas. ISPs now offer gigabit broadband plans (capable of speeds greater than or equal to 1 Gbps) as part of their primary packages. Gigabit broadband connections are now available in major cities like Bangkok, Phuket, and Chiang Mai.

The National Broadcasting and Telecommunications Commission (NBTC) also announced 10 GB free mobile broadband data for all the subscribers to facilitate work from home measures urged by the government during the COVID-19 pandemic. NBTC issued a guideline to all fixed broadband ISPs to upgrade the speed of home internet to at least 100 Mbps for all clients completely free of charge.

Is your provider measuring up? Take a Speedtest to find out. This data is used by ISPs and regulators worldwide to identify how to improve networks.

Editor’s Note: A previous version of this article showed data that did not reflect the entire picture of the network providers performance. To avoid confusion, we have have removed this section.

Ookla retains ownership of this article including all of the intellectual property rights, data, content graphs and analysis. This article may not be quoted, reproduced, distributed or published for any commercial purpose without prior consent. Members of the press and others using the findings in this article for non-commercial purposes are welcome to publicly share and link to report information with attribution to Ookla.

| March 7, 2018

India’s Digital Divide: How Broadband Speed Splits the Nation

India ranked 67th in the world in February for download speed over fixed broadband based on the Speedtest Global IndexTM, with an average speed of 20.72 Mbps. But averaging across a country as large and diverse as India can mask some pretty important differences.

To get a fuller picture of fixed broadband performance on the Indian subcontinent, we’re taking a look at the average download speeds in every state and union territory that showed Speedtest results for more than 100 users in February 2018. We’re also comparing speeds in the 20 largest cities in India.

Exploring internet speeds in India’s states and union territories

India is making strides in an area where many countries struggle — connecting rural communities to the internet. Fiber connections have been extended to 250,000 (2.5 lakh) rural villages in India so far under the first phase of Bharat Net. In addition, Phase 2 of Bharat Net will expand the number of Wi-Fi hotspots that connect villages to broadband from 38,000 to 500,000 (5 lakh) so that every village in India has at least one.

This investment in rural connectivity might be one reason that the average broadband speeds we’ve seen across India’s states and union territories don’t seem to correlate to population density. South India occupies four of the five top spots on the list of states and union territories with the fastest broadband download speeds in India, and North India holds four of the top ten. Karnataka is fastest with a mean download speed of 28.46 Mbps during the month of February, 37.4% faster than the country as a whole. Tamil Nadu is close behind at 27.94 Mbps.

On the other end of the spectrum, Northeast India accounts for four of the five slowest states and union territories we analyzed and seven of the ten slowest. Mizoram is the slowest with a mean download speed of 3.62 Mbps in February, 82.5% slower than the country as a whole. Manipur takes second-to-last place at 4.30 Mbps and Tripura barely edges into third-to-last place at 4.52 Mbps.

Which city in India has the fastest fixed broadband?

Fastest Cities in India Feb 2018

When looking at the 20 largest cities in India, Chennai is the fastest with a mean download speed over fixed broadband that’s 57.7% faster than India’s as a whole. Bengaluru, Hyderabad, Visakhapatnam and Delhi all score above the country’s average.

The slowest of these large cities, Patna, was 62.4% slower than the country’s average for mean download speed. Nagpur, Jaipur, Kanpur, and Ahmedabad round out the bottom five. It’s also notable that the download speeds of Kanpur, Lucknow, Pune and Nagpur are significantly slower than that of their respective states.

Is your broadband living up to these speeds? Take a Speedtest on the web or from our desktop apps to show us what speeds you’re seeing.

Ookla retains ownership of this article including all of the intellectual property rights, data, content graphs and analysis. This article may not be quoted, reproduced, distributed or published for any commercial purpose without prior consent. Members of the press and others using the findings in this article for non-commercial purposes are welcome to publicly share and link to report information with attribution to Ookla.

| November 15, 2021

Improving the Speedtest Global Index with Data on Median Speeds

The Speedtest Global Index has long been the go-to resource for detailed information about internet performance around the world. It’s about to get even better. Starting today, we are also including data on median performance to better reflect the speeds a user is more likely to achieve in a market and we will eventually transition to only displaying median speeds. While we initially planned to switch entirely to median on February 15, 2022, we have extended the date the “mean” tab will be available until February 15, 2023 to allow regulators who rely on this information to transition over to the new metric. Read on for details as to why we are making this switch and the impact we expect it to have on world rankings for fixed broadband and mobile internet speeds.

How to get the data you want

We have included a toggle at the top of the Speedtest Global Index so you can switch between median and mean speeds. The default view for this toggle shows median speeds as that will be the metric used on the Speedtest Global Index going forward.

ookla_global-index_mean_median_1121

This toggle will be available at the top of the page for the next three months. This gives you time to adjust to the new metric and play with the comparisons between median and mean to gain a deeper understanding of why we are making this change. Speaking of which …

We are making this change because median is a better measure of everyday experience

Median is a measure that captures the typical user’s experience. In statistical terms, median is less likely to be influenced by outliers than mean is. The chart below shows how median and mean return very different values when considering a simple number set of ten values.

ookla_median_vs_mean_1121-01

You can see how that one final value of 99 draws the mean, the arithmetical average, way up whereas the median continues to reflect the typical value of the set.

As 5G and gigabit internet have expanded across the globe, we are seeing more and more high speed results on Speedtest®. This is worth celebrating, but mean values can mask the fact that not everyone’s internet is improving. Switching the Speedtest Global Index to median allows countries where a greater share of people have high speed internet to rank higher on the Index, rather than rewarding countries where a few areas have really high speeds and everyone else is left waiting.

This changes the rankings, but not for everyone

Changing the Speedtest Global Index from mean to median shakes up the global rankings quite a bit. Namibia jumps 23 places on mobile while Ireland drops 28 places on mobile. Countries like South Korea where 5G is well established and widely available see little change in their mobile rankings. On fixed broadband, Algeria sees a dramatic increase of 30 places while Venezuela suffers the largest drop of 35 places. You can see how this affects the top 10 list in the graphic below.

ookla_speedtest_global_index_rank_change_1121-01

In the example we gave above, we saw how rare, but extremely large values can sway the mean. The same is true with extremely low numbers. Countries whose rankings increase with the switch to median were likely held back by small numbers of low-performing tests.

And here are the countries that see the largest changes in rank, both positive and negative.

ookla_speedtest_global_index_rank_increase_1121-01

ookla_speedtest_global_index_rank_decrease_1121-01

The Speedtest Global Index remains the best source for worldwide internet rankings. See how your country is affected by this new view and see how well internet speeds are improving where you live and if everyone is seeing the same benefit.

Editor’s note: This article was updated on April 18 to note the extended deadline for discontinuing the “mean” tab.

Ookla retains ownership of this article including all of the intellectual property rights, data, content graphs and analysis. This article may not be quoted, reproduced, distributed or published for any commercial purpose without prior consent. Members of the press and others using the findings in this article for non-commercial purposes are welcome to publicly share and link to report information with attribution to Ookla.

| February 23, 2022

5G in Europe: Reflecting on the Progress So Far and Mapping the Future

Having recently published our five 5G predictions for 2022, we now turn our focus on the current 5G landscape in Europe, examining how European countries and players compare versus their international peers. We will also look at the factors that influence 5G adoption, e.g. spectrum assignments and recent trends in terms of private 5G and network virtualization. While a lot of progress have been made so far, and some operators offer lightning speeds, the picture is mixed across the continent and the ambitions set by the European Union remain just that. Ambitions. We have already reflected on the progress towards the EU’s 5G Action Plan targets in “5G in Europe: EU Targets Require a Rethink. In Special Report 03/2022: 5G roll-out in the EU: delays in deployment of networks with security issues remaining unresolved the European Court of Auditors (ECA) warns that Europe is falling behind the following targets set in the 2016 Action Plan: 

  • 5G to be rolled out across all urban areas and all major transport routes by 2025
  • Further amended in March 2021, to achieve EU-wide 5G coverage by 2030

The audit shows that there are delays in 5G network rollouts and in transposing the EU’s objectives into member states’ national 5G strategies or broadband plans. The ECA also warns that this could result in a digital divide between different parts of the EU in terms of quality and ability to access 5G services. 

In the article below we will examine the following:

  • Current 5G landscape in Europe
  • 5G performance across Europe 
  • Private 5G networks on the horizon 
  • Addressing the virtualization challenge at the EU level

Current 5G landscape in Europe

According to GSMA Intelligence data, 84 operators deployed 5G services in 31 countries as of January 2022. The State of Digital Communications report published by the European Telecommunications Network Operators’ Association (ETNO) states that the uptake of 5G in Europe accounts for only 2.8% of the total mobile connections, compared to 13.4% in the United States and 29.3% in South Korea: despite being available to 62% of the population.

​Spectrum plays a critical role in 5G deployments.

As per the EC 2016 5G Action Plan, countries across the EU were meant to make low-band spectrum available for use by June 30, 2020, and mid- and high-band spectrums by December 31, 2020. Yet, as the chart shows, four countries out of 30 analyzed are yet to assign spectrum. The delays related to spectrum assignment stem from multiple reasons ranging from the impact of COVID-19 on schedules to cross-border coordination with non-EU countries to weak demand from the operators’ side.  

3G network sunsetting advancing 

As operators look to optimize their network operations and costs and refarm spectrum for 4G and 5G, the pace of 2G/3G network shutdowns is increasing. However, the situation across Europe is more complicated than elsewhere. Based on public announcements, European operators will support 2G in the short term, phasing out 3G instead. The reasons for this are long term contracts with enterprises such as utility companies and automotive OEMs that need the 2G networks to be maintained but also eCall (emergency call) obligations. All new vehicle model types approved from March 31, 2018 and sold in the European Union are equipped with eCall, which uses circuit-switched services on 2G/3G network. 

A case in point being Vodafone U.K.’s recent announcement about phasing out 3G starting in 2023, while still offering 2G until the 2030s to support roaming and M2M/IoT devices. ​​Vodafone isn’t alone — Telefónica Deutschland (O2) announced last year it has accelerated the shutdown of its 3G network in various regions of Germany. 

5G performance across Europe

The important question is whether delays in spectrum assignments and supporting multiple network generations have affected the operators’ ability to deliver on 5G’s promise of faster speeds.

Comparing median 5G download speeds, it is apparent that the United Arab Emirates and South Korea are far ahead of the pack with over 500 Mbps median download speed in Q4 2021 according to Speedtest Intelligence®. However, Bulgaria, Norway, Saudi Arabia, and Sweden also made it to the 300 Mbps+ club.

In some cases, in the absence of dedicated 5G spectrum or to supplement existing spectrum, operators are using Dynamic Spectrum Sharing (DSS) to use the same spectrum band for different RAN technologies, which are allocated in real time. For instance, Swisscom has announced that it covers 99% of the country’s population with 5G, which borrows spectrum from its LTE network. The operator said that its 5G service on the 3.5 GHz (C-band) spectrum reaches 62% of the Swiss population. C-band spectrum is considered a sweet spot for 5G, as it strikes a good balance between capacity and coverage. 

The picture is slightly different when it comes to 5G Availability — the percentage of users on 5G-capable devices that spend most of the time with access to 5G networks. Not surprisingly, the U.S. is in the lead with 50% 5G Availability, having had 5G networks for almost three years and a large pool of customers with 5G capable devices. Most recently after much ado, Verizon and AT&T have finally launched 5G in mid (C-band) in an effort to catch up with T-Mobile’s 5G performance.

Within Europe, the Netherlands comes first, followed by Cyprus and Bulgaria. During its Q4 2021 results announcement KPN announced that it has modernized over 4,000 sites to date, and that its 5G network already covers more than 80% of the population using 700 MHz spectrum. The operator’s 5G strategy is focused on enabling a wider ecosystem but also on providing differentiating services for B2B customers in specific industries. 

Telemach Slovenia topped the charts in terms of median download speeds over 5G in Q4 2021. The operator is combining existing LTE spectrum with the 3.5 GHz and 700 MHz spectrum awarded in April 2021. Another operator from the United Group, Vivacom Bulgaria, also fared very well in this ranking. In April 2021, the operator won 100 MHz in the 3.7-3.8 GHz band for BGN4.6 million (€2.35m) but it had already launched the 5G network before with a temporary license in November 2020. András Pali, Vivacom CTO in an interview stated that the operator plans to invest 120 million in infrastructure in 2021. Vivacom utilizes DSS combining frequencies in 1.8, 2.1 and 3.6 GHz bands for 5G, so there is no compromise between coverage and speed.  

Swedish operators perform well in the ranking – three out of the four national operators rank as the top 10 fastest European players. Whilst Cyta has came in as the seventh fastest 5G provider, the operator has been recognised as the fastest mobile network in Europe in November 2021.

Private 5G networks on the horizon in Europe

We postulated in our recent blog that 5G networks will become a platform for innovation.

Enterprises, however, have a range of choices to secure 5G spectrum:

  • Public networks with SLAs 
  • Public networks with network slicing or local infrastructure (edge computing) 
  • Private (non-standalone) network utilizing either their own or operator-owned spectrum.

Germany has been the hotbed for the localized spectrum. German industrial players such as Siemens and Bosch, who have been at the forefront of the Industry 4.0 movement, have already been awarded 5G spectrum and are experimenting with private 5G networks. For instance, Bosch put its first campus network into operation at its Industry 4.0 lead plant in 2020, and it is testing 5G applications at 10 plants worldwide. 

Other European countries have followed suit in assigning 5G spectrum for private networks including: France, the U.K., Sweden, Finland, and Croatia. It is important to note, though, that until the 5G devices ecosystem matures, the majority of private networks will continue to be 4G/LTE, despite using equipment that is 5G ready. Fortunately, private wireless using 4G/LTE can power the majority of OT use cases as it brings major improvements in capabilities vs legacy wireless technology. 

In its latest private networks (Q4 2021) count, Nokia sees a similar trend. According to the latest data shared by Nokia, 87% of customer networks were 4.9G/LTE, 13% were 5G only— mostly composed of test networks for universities and deployments in countries where the vertical spectrum is more suitable for 5G private wireless — while the remainder had both technologies — often made of customers running the main operations with 4G/LTE while trialing and validating 5G in their labs/part of their operation. Nokia also anticipates chipsets based on Release 16 to come to market in 2023, which is slightly later than previously expected. This will result in the ability to start validating Release 16 5G industrial features (reliable latency) to convince industrial OEMs of the capabilities of 5G. Release 17 and later releases are expected to power new innovative use cases and to integrate 5G in their systems/machines/etc., but the timeframe is not known at this point in time.

Vodafone is one of the operators that is upbeat on the potential for private networks in Europe stating that a million companies in Europe could benefit from private mobile networks by the end of the decade

Addressing the virtualization challenge at the EU level 

Networks are increasingly becoming virtualized and disaggregated. Rakuten was the first operator to disrupt the established RAN market and has been joined by Dish Network and German 1&1 Drillish, which is working with Rakuten and NEC. 

Open-RAN Deployments
Company Supplier Date Application Notes
KDDI (au) Samsung and Fujitsu 2022 Commercial 5G SA Open-RAN site powered by virtualized Radio Access Network (vRAN) in Kawasaki, Kanagawa prefecture
Vodafone UK Dell, Intel, Wind River and Samsung 2022 5G Open-RAN site in Bath, UK
BT Nokia 2022 RAN Intelligent Controller (RIC) Open-RAN trial in Hull, UK
Telefonica NEC 2021 Open-RAN trials Spain, Germany, U.K. and Brazil
Orange Samsung, Dell, Intel and Nokia 2021 Testing interoperability between components Open-RAN lab
Deutsche Telekom Dell, Fujitsu, Intel, Mavenir, NEC and Supermicro 2021 Multi-vendor, including massiveMIMO capabilities “O-RAN Town” in the city of Neubrandenburg, Germany
NTT DoCoMo Fujitsu, NEC and Nokia 2021 Multi-vendor interoperability for 4G and 5G base stations
1&1 Drillisch AG (greenfield) Rakuten and NEC 2021 Open-RAN 5G network Goal to serve 25% of the German population by 2025 and 50% by 2030 with Open-RAN network
Dish (greenfield) Altiostar, Mavenir and Fujitsu 2020 Open-RAN software integration
Rakuten (greenfield) 2020 Cloud native solutions

Many European markets have banned Chinese network equipment, and a number of European telcos are in the process of removing existing kits from their networks. Although this is good news for European vendors and smaller players, leading European operators voiced concerns that more actions are needed and have called for EU support. In November 2021, five leading telco groups: Deutsche Telekom (DT), Orange, Telefonica, Telecom Italia (TIM), and Vodafone Group, published a joint report to highlight the urgency of collaboration on Open RAN. The report, which is aimed at policymakers, EU member states and the wider ecosystem, concludes that in order for Europe to remain competitive in the 5G but also in the 6G era, Open RAN has to become a pillar of the Industrial Policy and Digital Compass strategy. The report also highlighted the risk of Europe falling behind the rest of the world — there are 13 major Open-RAN players compared to 57 elsewhere — with the majority of European telcos at the early stages of development without commercial relationships in place. These operators are active proponents of Open-RAN. In June 2021, they also voiced their Open-RAN technical priorities to foster ecosystem development. Open RAN Technical Priority Document represents the joint requirements of DT, Orange, TIM, Telefonica, and Vodafone, following the MOU they signed earlier. The whitepaper is designed to show vendors where to focus to enable European deployments based on operators’ timelines. It is important for telcos to work in collaboration with vendors so that everyone has a similar set of expectations — including support for “mix and match” integration models to avoid vendor lock-in.

The disaggregation and virtualization of RAN is closely linked with edge computing since Open-RAN can be deployed in a cloud environment using virtualized or containerized network functions. This opens up opportunities for further innovation. In recognition of that, the UK set a goal of having 35% of its telecom network traffic carried over Open-RAN by 2030. Vodafone switched on the first U.K. 5G Open-RAN site and opened a dedicated R&D center in Malaga, Spain to accelerate the digital, supported by the investment of €225 million over the next five years.

During the COVID-19 pandemic, chipset shortages have affected industries, and although telco has fared relatively well, sectors such as automotive have been much harder hit (car production has decreased by one third in 2021). However, the EU is looking to bring this dependency closer to home, providing significant funding in the form of the digital fund, to bring chip manufacturing to Europe. Intel has committed to spend €80bn expanding its EU manufacturing capacity and just recently the EC has proposed the European Chips Act to facilitate achieving is ambition of doubling the EU’s share in global production to 20% in 2030. This could have a major impact on 5G in Europe, so could have other initiatives to improve 5G infrastructure such as 5G coverage along cross-border corridors and 5G for smart communities. Lastly, access to skills and talent in emerging technologies (AI, ML) also suffers from uneven geographical spread. Partnerships will be critical and educational programmes will be needed to bring the talent home to ensure Europe doesn’t fall behind in this area too, especially when it comes to developer skills.

Ookla® will be at MWC Barcelona 2022 later this month. Come visit us at our Stand 2I28 in Hall 2, to talk with us about the 5G trend. 

Ookla retains ownership of this article including all of the intellectual property rights, data, content graphs and analysis. This article may not be quoted, reproduced, distributed or published for any commercial purpose without prior consent. Members of the press and others using the findings in this article for non-commercial purposes are welcome to publicly share and link to report information with attribution to Ookla.

| December 19, 2024

Global Broadband Development: Using Ookla Data to Bridge the Digital Divide

The global digital divide continues to widen. While nearly a quarter of consumer broadband subscribers in developed markets now use gigabit plans – projected to reach 50% by 2029 – developing countries often struggle to keep pace. This emerging “digital divide 2.0” represents not only a gap in access to basic connectivity, but also in the quality of broadband infrastructure. With pioneering countries like Singapore implementing nationwide 10-gigabit strategies, advanced markets are rapidly deploying high-speed fiber networks, whereas emerging markets often struggle to maintain even basic connectivity standards.

To better understand these disparities, comprehensive network data can offer valuable insights into connectivity performance. The Fiber Development Index (FDI) – a collaboration between Ookla, the World Broadband Association (WBBA), and Omdia – benchmarks fiber development across 93 countries by analyzing infrastructure development, market trends, and quality of experience measurements. Using median download and upload speeds, latency, and jitter data from Speedtest Intelligence, the FDI provides crucial insights into actual broadband performance and availability worldwide.

In this article, we’ll examine the current state of global broadband development, explore what sets market leaders apart, and analyze some key challenges facing U.S. broadband expansion. For deeper insights into these topics, including expert analysis from Ookla, the WBBA, and Omdia, watch our full webinar!

Global Broadband Trends

The demand for high-speed broadband continues to surge, with fixed broadband growing at a remarkable rate. Between 2020 and 2023, fixed broadband saw 20% growth compared to just 5% for mobile broadband, and similar growth is projected over the next few years. Three key factors drive this increased demand for gigabit and multi-gigabit connectivity:

  • Connected devices: The number of connected devices per household typically doubles every five years, with projections showing an average of a staggering 45 devices per household by 2030.
  • High-bandwidth applications: Modern applications demand increasingly higher speeds, from 50 Mbps for 4K video to 300 Mbps for 8K content, with next-generation XR applications requiring speeds up to 1 Gbps.
  • Cloud shift: Usage patterns are rapidly evolving from primarily saving files locally to accessing cloud-based services for storage and computing, a transition accelerated by XR and AI applications.

Looking ahead to 2028-2029, about half of all fixed broadband connections worldwide are expected to be gigabit-capable. This shift to fiber networks, which enable both higher speeds and improved latency, is necessary to support these evolving demands.

Fiber Development Index (FDI) Findings

The Fiber Development Index provides unprecedented visibility into global broadband development, analyzing 93 countries across multiple metrics including investment patterns (infrastructure funding, market incentives, regulatory policies) and real-world performance data. 

To enable meaningful comparisons between markets at different stages of development, the FDI organizes countries into three distinct clusters:

  • Cluster One – Advanced Markets: These highly developed fiber broadband markets – such as Singapore, the UAE, and Qatar – demonstrate the impact of strong government support and clear national strategies. Singapore highlights cluster one success stories, with its nationwide fiber initiative.
  • Cluster Two – Transitioning Markets: Markets with developed broadband infrastructure actively expanding their fiber adoption. France, Chile, Switzerland, Australia, and the Netherlands have all improved their FDI rankings through expanded fiber coverage and improved performance metrics.
  • Cluster Three – Emerging Markets: Regions with low overall broadband penetration often face fundamental connectivity challenges. However, success stories like Peru, which jumped 11 spots in the FDI rankings, show how targeted investment and regulatory improvements can accelerate development.

This clustering approach shows that successful fiber deployment isn’t only about current performance; it’s also about the trajectory of improvement and the policies enabling that growth. For example, while Switzerland and Hungary show similar fiber penetration rates, Switzerland’s higher FDI ranking reflects its continued investment in core networks – illustrating how infrastructure commitment can shape a country’s development path.

Solutions and Best Practices

Understanding what drives success in leading markets can help guide countries working to close their own digital divides. From Singapore’s comprehensive strategy for fiber deployment to Peru’s improvements in regulatory policy and infrastructure investment, successful countries share a few key characteristics in their regulatory approaches and usage of data-driven decision making:

  • Effective Regulatory Framework: Leading markets implement detailed national broadband plans with specific targets and timelines. They streamline municipal approvals, promote infrastructure sharing, and provide financial incentives through universal service funds.
  • Data-Driven Planning: Speedtest Intelligence metrics provide granular data on network performance – including speeds, latency, and jitter, among other KPIs – revealing where networks are underperforming against FCC broadband speed standards. These insights help operators target infrastructure investments for maximum impact.
  • Market-Specific Strategies: Success looks different across markets. For example, while Singapore pursues its nationwide 10-gigabit fiber service, other countries are focused on expanding basic fiber coverage. Speedtest Intelligence metrics can help countries set realistic goals based on their current development stage.

U.S. Broadband Progress

To see how these global trends and challenges play out in a specific market, the U.S. presents a unique example of broadband development, with significant variations across states in both coverage and performance. In early 2024, the FCC raised its minimum broadband speed standard from 25/3 Mbps (25 download/3 upload) to 100/20 Mbps (100 download/20 upload), setting a higher bar for adequate connectivity. 

Speedtest Intelligence data from the first half of 2024 reveals how service providers, regulators, and state governments are both making progress and facing persistent challenges in meeting these new standards.

  • State Leadership: New Jersey leads the nation with 66.4% of Speedtest users achieving FCC minimum standards of 100 Mbps download speed and 20 Mbps upload speed, followed by Connecticut, North Dakota, and Maryland.
  • Urban-Rural Divide: The gap between rural and urban connectivity access varies dramatically by state. Washington state in particular shows a stark urban-rural divide, with 61.1% of urban residents having access to the FCC’s minimum broadband standards, compared to just 28.7% of rural residents. Delaware demonstrates more equity, with 69.2% of urban residents and 66.8% of rural residents having access to these same standards.
  • Infrastructure Challenges: Geographic and terrain factors significantly impact deployment costs and feasibility. States like Alaska face unique challenges with frozen ground and vast distances between population centers, making traditional fiber deployment particularly complex and expensive. Data-driven approaches can help identify where alternative solutions might be more practical.

Breaking Down the Digital Divide
Percentage of urban and rural Speedtest users in each state with access to broadband speeds of 100/20 Mbps.

To learn more about connectivity performance in U.S. states, check out our recent analyst report looking at broadband speeds across the 50 states. 

Future Outlook 

The path toward closing the digital divide requires a multi-faceted approach that combines strategic infrastructure investments, supportive regulatory policies, and data-driven decision making. While fiber remains the gold standard for future-proof connectivity, a hybrid approach incorporating fixed wireless access and satellite technology may offer interim solutions for challenging deployments.

Looking ahead, the industry faces several key developments:

  • Accelerating Gigabit Adoption: The shift from basic broadband to gigabit connectivity will continue, with projections showing 50% of connections reaching gigabit speeds by 2029.
  • Investment Priorities: BEAD funding and similar initiatives worldwide will shape deployment strategies, particularly in underserved areas.
  • Technology Integration: Markets will likely adopt hybrid approaches, using a mix of fiber, fixed wireless, and satellite technology to ensure complete coverage. 

Understanding this evolving landscape requires comprehensive network intelligence. Ookla’s complementary datasets – combining Speedtest’s crowdsourced performance metrics, RootMetrics’ controlled drive testing data, and Downdetector’s service outage monitoring – provide stakeholders with the complete picture needed to make informed decisions about broadband development.

For a deeper dive into global broadband development, including detailed analysis of the Fiber Development Index and expert insights from WBBA and Omdia, watch our full webinar on demand!


Ookla retains ownership of this article including all of the intellectual property rights, data, content graphs and analysis. This article may not be quoted, reproduced, distributed or published for any commercial purpose without prior consent. Members of the press and others using the findings in this article for non-commercial purposes are welcome to publicly share and link to report information with attribution to Ookla.

| August 9, 2017

Rank Internet Speeds Around the World with Speedtest Global Index

We’re pleased to announce Speedtest Global IndexTM, a monthly ranking of global mobile and fixed broadband speeds. At Ookla, our mission is to make the internet faster by providing data and insights on real-world internet speeds. As part of that mission, we’re making Speedtest data available to you in a new, interactive format.

Based on the billions of consumer-initiated tests taken all over the world using Speedtest, this resource displays the latest information on which countries have the fastest mobile and fixed broadband and which have the slowest.

How you can use Speedtest Global Index

The home page gives you a quick overview of how countries rank, how that rank has changed in the last month, and the download speed that rank is based on.

Top 5 countries

Click on an individual country to see 12 months’ worth of data including historic download and upload speeds over mobile and fixed broadband.

Use these country pages to spot spikes and dips in internet performance on a country level. Uncover trends and detect potential storylines.

Mouseover a dot on the trendline to see the average speed and worldwide ranking for that particular month, giving you the depth of data you need to tell richer stories.

Your source for data on global internet speeds

We hope you’ll come to see Speedtest Global Index as a go-to resource for global internet performance data. Take this data and use it to tell stories that help make the internet faster in your home country and around the world. Feel free to cite Speedtest Global Index as a source and link to it as needed.

We’ll update Speedtest Global Index with data based on the previous month at the beginning of every month so you’ll have fresh statistics and an early eye on new developments.


Ookla retains ownership of this article including all of the intellectual property rights, data, content graphs and analysis. This article may not be quoted, reproduced, distributed or published for any commercial purpose without prior consent. Members of the press and others using the findings in this article for non-commercial purposes are welcome to publicly share and link to report information with attribution to Ookla.

| February 16, 2023

Spectrum: An Essential Ingredient to Ensure Good 5G Performance

We have recently written about 5G performance at length, ranked the countries, looked at operators’ 5G strategies, and even commented on consumers’ perception of 5G performance. Most recently, we commented on the state of the worldwide 5G in 2022 and the fastest 5G mobile devices. This article will examine the relationship between spectrum and 5G performance.

Key takeaways:

  • Based on Speedtest Intelligence® data, we can see a significant variance between countries in median 5G speed, with four broad clusters of 5G performance emerging: 5G Leaders, High Performers, Improvers, and 5G Outliers. 
  • 5G performance depends heavily on the operator’s 5G spectrum holding.
  • The larger the allocation of the C-band spectrum, the faster the 5G download speed, with the contiguous spectrum enhancing performance further. 
  • Operators with access to 100 MHz of contiguous spectrum, e.g., in the U.A.E. and South Korea, led the 5G global ranking in Q4 2022 with a median download speed of 516.15 Mbps and 511.70 Mbps, respectively.
  • Access to low-band spectrum is just one factor that impacts 5G Availability. 

Four tiers of 5G performance 

Looking at market-level Speedtest Intelligence data, we can see significant variance in median 5G download speeds between the 52 countries we analyzed. We identified four broad clusters of 5G performance as measured by median 5G download speed.

chart of 5g performance clusers basd on median 5g download speed across a sample of countries5G Leaders: > 300 Mbps

These markets are the 5G pioneers, being among the first to launch 5G services, and are continually pushing the boundaries of 5G performance with median download speeds typically greater than 300 Mbps. High-performant 5G markets have allocated substantial amounts of spectrum for 5G use, particularly with wide allocations in the coveted C-band, and have assigned and, in some cases, begun limited use of mmWave spectrum. In some cases, we see a trade-off between 5G performance and 5G Availability (the proportion of time users with 5G capable devices spend connected to 5G networks).

5G High Performers: 200 – 300 Mbps

These markets share many of the characteristics of 5G leaders, having made an adequate spectrum allocation for 5G use and fostered competition between operators, which has helped spur network investment. However, they lag behind 5G Leaders based on their level of network densification. They typically use Dynamic Spectrum Sharing (DSS), which allows operators to share spectrum between network generations, but it can weigh on performance. Median 5G download performance in these markets typically ranges from 200 Mbps to 300 Mbps. We don’t generally see as much of a trade-off between performance and 5G Availability in these markets. 

5G Improvers: < 200 Mbps

These markets typically have limited C-band availability or a regulatory environment promoting strong price competition, with operator investment constrained. As a result,  median 5G download speeds are between 100- 200 Mbps in these markets. In some cases — for example, in the U.S. and U.K., we see 5G spectrum allocations (based on spectrum currently in use) giving a significant advantage to one player in the market, which has then sought to capitalize on this through aggressive 5G network deployment. Furthermore, with the exception of the U.S., which had a 5G Availability of 56.0% in Q4 2022, 5G Improvers all have 5G Availability in the low double digits, ranging from 13.5% in Japan to 19.2% in Germany. 

5G Outliers

Only in a few markets did 5G performance drop below 100 Mbps. Polish performance can be explained by the lack of a dedicated 5G spectrum; Polkomtel trading under the Plus brand, utilizing 50 MHz of spectrum in the 2.6 GHz band, and all other operators deploying 5G using DSS in the 2.1 GHz spectrum band. Spain, on the other hand, has assigned spectrum across all three bands, with C-band blocks ranging from 80MHz (MasMovil) to 110 MHz (Orange), and most recently, awarded mmWave too. However, operators focus on meeting coverage obligations that rely heavily on the 700 MHz band. For example, Movistar’s 5G network reached a total of 1,719 municipalities at the end of 2022, equivalent to 83% of the population. 

Fast 5G and good 5G Availability don’t always go hand in hand  

chart of medan 5g and availability in select markets

Using Speedtest Intelligence data, we examined a relationship between the country’s 5G median download speed and 5G Availability. And for the most part, there isn’t one. Fast networks don’t immediately come with high 5G Availability. For example, the U.A.E. and South Korea have topped our ranking in terms of the fastest median download speed over 5G at 549.70 Mbps and 496.63 Mbps, respectively, during Q4 2022. Yet, when it comes to 5G Availability, the U.S. came first in the ranking at 56.0% in Q4 2022, South Korea’s 5G Availability stood at 35.1%, while the U.A.E recorded a 5G Availability of 7.7% in Q4 2022. 

All eyes on spectrum

The key to understanding 5G is understanding operators’ 5G spectrum holding. There are two key considerations to keep in mind when discussing the spectrum for 5G: speed performance and geographical coverage. Regulators assign 5G spectrum across three spectrum ranges: low, mid (lower mid-band and upper/C-band), and high (mmWave).

Low-band (sub-1GHz) spectrum can travel farther, cover a greater geographical region, and provide deeper penetration within buildings, given its good propagation characteristics. But, the low band spectrum cannot deliver “true” 5G speeds, peaking at 100 Mbps median download speed. Another challenge is that these frequency bands are in high demand and in low supply, and in some countries, still used for analog television. 

Mid-band spectrum (1-6 GHz spectrum) is the so-called “sweet spot” for 5G, especially the upper mid-band (C-band), which offers the best of both worlds in terms of coverage and capacity.

Existing networks such as 2G, 3G, and 4G already use the lower mid-band. This spectrum band has been the 4G data traffic capacity layer, often used in Frequency Division Duplex (FDD) mode. FDD is a technique that uses separate frequency bands at the transmitter and receiver sides. For example, the U.S. and China used the 2.6 GHz spectrum band in Time Division Duplex (TDD) mode to drive their 5G deployment. Most counties will use TDD for 5G network rollout. This means that the 5G base station and end-user device use the same channel to transmit simultaneously, potentially creating interference issues while allowing more flexibility. Furthermore, this spectrum band will grow in importance as legacy networks are retired and spectrum refarmed.

The upper mid-band, especially 3.3 GHz to 3.8 GHz (otherwise known as C-band), offers a good combination of propagation and capacity. 3GPP standards currently support a 100 MHz wide channel and a maximum bandwidth of 400 MHz in carrier aggregation mode.

The high band, also called the millimeter wave (mmWave), spectrum can deliver super-fast speeds (thinking gigabits) but has limited range. Recently we published an article looking at the mmWave performance and recent developments.

Using Speedtest Intelligence background data, we can gain insights into which spectrum bands operators use for 5G. 

chart of spectrum band distribution

  • High band (mmWave) accounted for less than 1% of the scans in four countries: Japan, U.S., Qatar, and Australia.
  • Most countries used the mid-band spectrum.
    • C-band spectrum is used by all countries that have allocated it (21 out of 23 countries), with a notable exception of the Netherlands and Poland, which will finally auction the 3.5 GHz spectrum, set to take place in the summer of 2023. 
    • All countries we have analyzed, bar South Korea, use lower mid-band partially due to operators switching off their legacy networks (2G/3G) and refarming their existing spectrum holdings to support 5G networks rollout.
  • Low band was used by 78% of analyzed countries (18 out of 23) across our sample. 

Addressing spectral challenges via DSS and CA comes at a cost

The ITU minimum technical requirements to meet 5G performance requirements identify at least 100 MHz channel per operator and up to 1 GHz per operator in mmWave bands. This, however, is only sometimes the case. We can see imbalances in terms of operators’ performance within a country, which can be partially explained by having larger spectral resources. For example, Three UK benefited from having the largest, dedicated 5G spectrum — 140 MHz of frequency across several 5G spectrum bands, including a 100 MHz block of continuous spectrum in the 3.3-3.8 GHz band, which positions it well in terms of median download speeds compared to other U.K. operators.

In the absence of a dedicated 5G spectrum or to supplement the existing spectrum, operators can use two technologies to aid their 5G deployment: Dynamic Spectrum Sharing (DSS) and Carrier Aggregation (CA). DSS enables operators to allocate spectrum flexibly across low-, mid-, and high-bands and switch between LTE and 5G New Radio depending on network demand. However, there is a downside to that in terms of 5G performance. For example, in Poland, apart from Plus, all other operators deployed 5G using DSS in the 2.1 GHz spectrum band, which can partially explain why they have lower speeds.

Conversely, CA enables operators to use two or more bands together, integrating them as one big block to deploy 5G. This allows for the aggregation of non-contiguous spectrum blocks, but it impacts performance by introducing latency and signaling overhead. 

Access to low-band spectrum has a positive impact on 5G Availability, but it is not the only factor at play

chart of 5g availability and the use of low-band spectrum

Ookla® data indicates that 5G coverage, which is often enabled by having access to a dedicated low-band spectrum (600 – 900 MHz), is just one part of the puzzle when it comes to 5G Availability. Low-band (700 MHz) spectrum, initially used for LTE, is now allocated to 5G because it allows extended coverage. According to the GSA, the 700 MHz spectrum band is particularly precious. GSA’s data shows that spectrum at 700 MHz has generated an average of $0.309/MHz/pop in assignments and auctions since 2015, significantly above the average price for C-band. For example, India’s highly anticipated 5G spectrum auction garnered $0.380MH/pop for 700 MHz compared to $0.031/MHz/pop for C-band. 

Qatar, Saudi Arabia, South Korea, and the U.A.E. don’t have any 5G devices using low-band spectrum simply because there has been no spectrum assigned in this band to 5G services. During the initial 5G auction in 2016, South Korea’s 700 MHz spectrum remained unsold. 

Other essential aspects driving 5G Availability are the affordability and availability of 5G-capable smartphones, 5G tariffs, and end-user demand. Case in point, despite the lack of low-band spectrum, South Korea reached a 5G Availability of 35.1% in Q4 2022, driven by customer adoption and 5G network densification. According to the Ministry of Science and ICT, in November 2022, there were 27.5 million 5G subscriptions in South Korea, equivalent to 36% of all mobile subscriptions. According to its Communication Agency, there are 215,000 5G base stations, which translates into 319 people per 5G base station, nearly seven times more than the EU and 13 times more than the U.S.

A country’s geography impacts 5G coverage too. For example, in addition to having access to low band spectrum, the Netherlands benefits from being flatter and more densely populated, resulting in a greater ability to expand 5G coverage. 

Another factor at play is the spectrum license conditions that stipulate coverage requirements, for instance, as part of the 700MHz licenses in the Netherlands, there is a minimum speed of 8 Mbps in 98% of the cases in each municipality of the country in 2022.

While the relationship between low-band spectrum and 5G Availability is not a direct one, we wanted to investigate whether there is a link between the median 5G download speed and the C-band spectrum. 

Larger the share of the C-Band spectrum, the faster the 5G download speed

chart of 5g download speed and the use of c-band spectrum

Our analysis found that access to C-band spectrum typically translates into a faster median 5G download speed. Unsurprisingly, operators are keen to deploy 5G services using C-band spectrum. According to GSA, since the end of 2015, 54 countries have auctioned, assigned, or renewed licenses for C-band spectrum. 

All eyes on 5G Leaders

Countries where operators solely rely on the mid-band spectrum for 5G, and where 5G services have been available for more than 13 quarters have achieved over 300 Mbps median download speed in Q4 2022. Bulgaria is an exception, having launched services just over two years ago. We can also conclude that operators’ overall spectrum holding and whether they have access to a contiguous spectrum matters, too. Contiguous spectrum helps achieve faster speeds, lower latency, and improved spectral efficiency. 

U.A.E.: Emirati operators – Etisalat and Du –  use two carrier spectrum in the 3.5 GHz and 2.5 GHz frequency range, each carrier at 100 MHz, to establish a 5G network. This results in speeds exceeding 500 Mbps. The U.A.E. had a median 5G download speed of 511.70 Mbps in Q4 2022. 

South Korea: KT and SKT bought a 100 MHz channel each in 2018. In July 2022, LG+ secured an additional 20 MHz C-band spectrum, bringing its total spectrum holding to 100 MHz. Alongside the 5G spectrum auction, the government outlined the rollout milestones for the operators’ 3.5 GHz rollout: 22,500 base stations by the end of 2021, 45,000 by the end of 2023, and 150,000 at completion. Thanks to that, South Korea has the most base stations per population. South Korea is one of the early adopters of 5G, having commercialized 5G in 2019 and over a third of all mobile subscriptions on 5G. One of the reasons behind South Korea’s fast-paced 5G adoption is the support from the government, which adopted the 2021 action plan for the “Digital New Deal” to support 5G development and a wider digital transformation. 

Qatar: Qatar, clocking a median 5G download speed of 462.15 Mbps and 5G Availability of 50.7% in Q4 2022, delivers the best of the worlds — good speeds and 5G Availability. In November 2022, Qatar’s Communications Regulatory Authority (CRA) amended the mobile licenses held by Vodafone Qatar and Ooredoo Qatar in early 2019, authorizing each operator to utilize 100 MHz of C-band spectrum and committing them to roll out commercial 5G networks before the end of 2020 in all densely populated areas. Operators’ heavy investment into their network to achieve near-universal service coverage and incentives to migrate users to 5G networks has paid off. We have closely monitored 5G performance during the recent World Cup. Not only did Qatari 5G networks manage to withstand the additional network load that World Cap brought, but it has also improved in performance, with the median 5G download performance hitting 472.13 Mbps in November 2022. 

Saudi Arabia: Operators in the KSA have access to more than 1000 MHz of licensed spectrum for IMT use in the low- and mid-band ranges. Saudi regulator – CST (Communication, Space and Technology Commission) – championed data-driven, evidence-based policy decisions to enable a 5G rollout by conducting analysis of spectrum usage, the performance of various bands, and existing network infrastructure to see where investments had been made within certain bands (e.g., extra capacity in specific bands in urban areas and coverage of rural areas using adequate bands). If you would like to find out more, read this case study

Bulgaria: In April 2021, Vivacom Bulgaria won 100 MHz in the 3.7-3.8 GHz band for BGN4.6 million (€2.35 million). Vivacom utilizes DSS, combining frequencies in 1.8, 2.1, and 3.6 GHz bands for 5G. A1 Bulgaria, on the other hand, uses a dedicated 100 MHz band.

We will continue to monitor 5G performance across the world and investigate the factors that impact 5G performance. If you want to learn more about 5G performance, head to Ookla ResearchTM and subscribe to our newsletter to stay up to date with our latest analyses. 

Ookla retains ownership of this article including all of the intellectual property rights, data, content graphs and analysis. This article may not be quoted, reproduced, distributed or published for any commercial purpose without prior consent. Members of the press and others using the findings in this article for non-commercial purposes are welcome to publicly share and link to report information with attribution to Ookla.

| December 20, 2023

U.S. - The Rise of 5G FWA & The Battle for Fixed Broadband Customers

Fixed-wireless access (FWA) has emerged as a key 5G use case. Cellular providers in many markets are using FWA to easily enter and compete in fixed broadband markets, while fixed ISPs with access to 5G spectrum are utilizing it as a complementary access technology, allowing them to target locations where fiber access networks are not present. FWA can also be a solution to help bridge the digital divide in more remote locations where it’s uneconomical to lay fiber to connect premises.

The U.S. is at the forefront of fixed wireless access (FWA) development, with many of its major wireless carriers, including T-Mobile, Verizon, AT&T and UScellular targeting expansion. T-Mobile has built up a lead in terms of 5G fixed-wireless market share, with Verizon following closely, and AT&T recently launching a new FWA service – AT&T Internet Air. We examined Ookla Speedtest data to understand how FWA performance is evolving in the U.S., and how it is impacting churn in the market.

Key takeaways

  • T-Mobile & Verizon 5G FWA performance holding up well nationally. Despite strong customer growth, both T-Mobile and Verizon have maintained performance levels over the past year according to Speedtest data. Both ISPs recorded similar median download speeds in Q3 2023, although T-Mobile maintains an edge on median upload performance. Despite this, there are significant differences in performance at a State-level, and for urban versus rural locations.
  • Cable & DSL providers bear the brunt of user churn. The FWA value proposition is clearly resonating most with existing cable and DSL customers, which make up the vast bulk of churners to both T-Mobile’s and Verizon’s FWA services. It’s not one-way traffic however, with T-Mobile’s larger user base in particular showing some attrition to cable providers. In rural locations where options are more limited, FWA services are increasingly going head to head, with over 10% of users joining Verizon’s FWA service coming from T-Mobile.
  • Clear signs that download performance could be a key contributor to churn in the market. Our analysis of the customers of major ISPs in the US that have churned to T-Mobile’s FWA service shows that their median download performance before churning was below the median performance of all customers of these ISPs, indicating a performance short-fall that is likely contributing towards churn.
  • Further C-band spectrum will serve to strengthen FWA’s case. The release and deployment of additional C-band spectrum for all three national cellular carriers, and AT&T’s new FWA service will drive further performance gains, and further competitive pressure in 2024.

T-Mobile and Verizon FWA scaling strongly and national performance holding up well

Launched during the COVID-19 pandemic, FWA services from T-Mobile and Verizon have seen strong growth over the past three years. Aided by disruptive pricing strategies, no annual contracts, and ease of installation (self-install), net additions remain strong for both ISPs. T-Mobile’s current FWA plan retails for $50/month, but that falls to $30/month for customers subscribing to its Magenta MAX mobile plan. Verizon prices at a slight premium to T-Mobile, with its FWA service currently retailing for $60/month, but falling to $35/month with select 5G mobile plans. On the back of their success we’ve also recently seen AT&T update its FWA strategy, launching AT&T Internet Air in August 2023, with a similar pricing strategy.

Fixed Wireless Access (FWA) Customers – T-Mobile & Verizon
Company Reporting | Q3 2020 – Q3 2023

Utilizing the same 5G spectrum that its mobile customer base accesses, both T-Mobile and Verizon have been at pains to point out how they manage the on-boarding of new FWA customers, in order to limit any negative impact on performance for both cellular and FWA customers. The release and rollout of additional C-band spectrum for all three operators will provide extra headroom and the potential for improved 5G FWA performance, while T-Mobile has begun testing 5G Standalone mmWave, and has indicated that this could be utilized for 5G FWA in the future. 

Performance on T-Mobile’s and Verizon’s 5G FWA services has held up well to date, although it lags behind median download performance of the major cable and fiber ISPs. The median download speed across the US for all fixed providers combined in Q3 2023 was 207.42 Mbps. T-Mobile has recorded consistent median download speed over the past four quarters, reaching 122.48 Mbps in Q3 2023 based on Speedtest data, but saw its median upload performance erode slightly, down from 19.76 Mbps in Q4 2022, to 17.09 Mbps in Q3 2023. Verizon on the other hand improved its median download performance when compared to Q4 2022, reaching a similar level to T-Mobile, of 121.23 Mbps in Q3 2023. However, its upload performance remained lower than T-Mobile’s, at 11.53 Mbps.

U.S. 5G Fixed Wireless Access (FWA) Performance
Speedtest® Data – Custom Analysis | Q4 2022 – Q3 2023

Churn data shows Cable & DSL providers losing out to FWA

In order to understand the impact of these 5G FWA services on the U.S. fixed broadband market, we examined Speedtest data to identify users that had churned since Q2 2022 – when these services started to scale and really impact the rest of the market.

Our data shows that the bulk of churn to both T-Mobile’s and Verizon’s 5G FWA services in that time was from cable and DSL providers. Furthermore, it doesn’t skew towards rural locations, with both T-Mobile and Verizon seeing approximately 80% of their gross additions in urban locations. The aggressive pricing strategies of FWA providers have driven prices down across the market, with cable providers for example offering slimmed down broadband and content packages at competitive prices, while AT&T Fiber now prices its entry fiber package of 300 Mbps at $55/month.

Fixed Wireless Access New Recruits – Distribution of 5G FWA Gross Additions by ISP
Speedtest® Data – Custom Analysis | Q2 2022 – Q3 2023

While cable operators bear the brunt of churn to 5G FWA services at present, their strategic response in competing on price is seeing some FWA subscribers move back to cable – a trend which the availability of FWA services with no annual contracts makes easier. Speedtest data shows that Cox for example, saw 7.3% of gross additions come from previous users of T-Mobile’s FWA service, while for Spectrum and XFINITY, former T-Mobile FWA users accounted for 6.3% and 6.0%, respectively. 

In rural locations where FWA performance lags that of urban locations, and where cable providers have less overlap with FWA service, there is a more even spread of churn to FWA, between cable and DSL providers. In addition, we see stronger churn to rival FWA services, with Verizon’s FWA service attracting 11.1% of its gross additions from T-Mobile, and T-Mobile recording 2.7% of its gross additions from Verizon’s FWA users.

Users that churn experience improved network performance

With the larger FWA customer base, we ran an analysis of Speedtest data of users churning to and from T-Mobile’s 5G FWA service over the period Q2 2022 – Q3 3023, to understand if there were clear drivers for this churn. We found that the median download speed for the subset of users churning to T-Mobile, was consistently below the median of all users, for each ISP, highlighting the importance of ISPs ensuring consistent performance across their user base.

Targeting Churn – Performance Prior to Churning to T-Mobile's 5G FWA Service
Speedtest® Data – Custom Analysis | Q2 2022 – Q3 2023

Users moving to T-Mobile’s 5G FWA service, and those churning away from it, experienced an increase in median download performance. Those users joining T-Mobile’s FWA service over the period Q2 2022 – Q3 2023, recorded an increase in their median download speed of 13.04 Mbps. On the other hand, those users churning away from T-Mobile saw their median download performance increase by 85.53 Mbps. Users joining Spectrum, Optimum, Cox and XFINITY from T-Mobile’s 5G FWA service experienced median download speeds in excess of 100 Mbps faster, highlighting the significant performance advantages that cable and fiber providers maintain over FWA.

Targeting Churn – Performance for Customers Churning Away From T-Mobile’s 5G FWA Service
Speedtest® Data – Custom Analysis | Q2 2022 – Q3 2023

State and urban/rural analysis reveal 5G FWA performance gaps

While median performance has remained relatively stable for both operators over the past year, regional performance, and between urban and rural locations, varies significantly. The performance of 5G FWA services depends heavily on the spectrum bands available in each location, as well as the fact these FWA services do not rely on outdoor consumer premise equipment (CPE), with wireless signals having to navigate into the home. The deployment of additional C-band spectrum will help improve performance over time, however, users and ISPs who do not locate CPE externally, will have to continue to navigate the intricacies of available spectrum bands and CPE positioning within the home.

Rural locations predictably fared worse than urban locations for both T-Mobile and Verizon 5G FWA service, given differences in spectrum availability, and also distance from cell sites, although the difference was starker for Verizon’s FWA service, which recorded a median of 155.77 Mbps in urban locations during Q3 2023, but only 51.41 Mbps in rural locations. T-Mobile increased rural FWA performance, up from 82.20 Mbps in Q4 2022, to 91.96 Mbps in Q3 2023. Verizon on the other hand focussed more heavily on urban locations, with the 155.77 Mbps it achieved in Q3 2023 a sizeable increase on the 125.55 Mbps it recorded in Q4 2022.

Urban vs Rural 5G FWA performance
Speedtest® Data – Custom Analysis | Q3 2023

Setting a minimum threshold of 100 samples for Q3 2023, Speedtest data showed Verizon recorded a median 5G FWA download speed of 181.77 Mbps in Nebraska, followed by 160.56 Mbps in Colorado, and 150.24 Mbps in Kansas. At the other end of the scale, Verizon 5G FWA users in Mississippi recorded median download speeds of 31.54 Mbps, of 36.72 Mbps in Wyoming, and 46.92 Mbps in West Virginia. Upload performance followed a similar trend, with a high of 16.74 Mbps in Nebraska, and a low of 4.20 in Mississippi.

T-Mobile’s 5G FWA service saw median download performance hit a high of 189.58 Mbps in Hawaii during Q3 2023, and like Verizon was strong in Nebraska, with 150.53 Mbps, while Oregon followed with 145.11 Mbps. States with lower median download speeds for T-Mobile included Vermont with 63.31 Mbps, South Dakota with 65.38 Mbps, and like T-Mobile, West Virginia with 67.23 Mbps. Median upload performance for T-Mobile’s 5G FWA service also varied significantly, reaching 41.62 Mbps in Hawaii, but falling to 9.74 Mbps in North Dakota.

We’ll continue to monitor the progress of FWA in the U.S., and the competitive response from cable, DSL, fiber and even satellite providers, as the battle for users intensifies. To find out more about Speedtest Intelligence data and insights, please contact us here.

Ookla retains ownership of this article including all of the intellectual property rights, data, content graphs and analysis. This article may not be quoted, reproduced, distributed or published for any commercial purpose without prior consent. Members of the press and others using the findings in this article for non-commercial purposes are welcome to publicly share and link to report information with attribution to Ookla.

| December 19, 2023

The State of Worldwide Connectivity in 2023

To gain insight into the current performance of networks, we analyzed Speedtest® data in Q3 2023. Our analysis compares changes in 5G performance to the previous year, identifies the top 10 countries with the best performance, and discusses customer satisfaction with 5G. We also ranked countries based on the performance of their fixed networks and investigated the connectivity gap across the world.

5G | Fixed | Connectivity for All

Key takeaways 

  • Global 5G download speed improved. The median global 5G download speed experienced a substantial 20% increase in Q3 2023, reaching 203.04 Mbps, compared to 168.27 Mbps in Q3 2022. This improvement aligns with a significant rise in global 5G subscriptions, indicating positive progress in user adoption of 5G and the performance of 5G networks. 
  • Top 5G performers have shifted. The top 10 countries for 5G performance witnessed notable changes, with the United Arab Emirates claiming the top spot, surpassing South Korea. Malaysia, India, and the Dominican Republic also made significant strides, showcasing a dynamic shift in the global 5G landscape.
  • Speedtest user ratings indicate room for 5G improvement. Despite advancements in 5G technology, there has been a decline in the Net Promoter Score (NPS) among 5G users. Factors contributing to this dissatisfaction could include unmet expectations and discrepancies between actual 5G speeds and advertised speeds.
  • Fixed Networks Advancements. On a global scale, fixed networks demonstrated significant performance improvement, with a 19% increase in median download speed (83.95 Mbps) and a 28% increase in upload speed (38.32 Mbps) in Q3 2023 compared to the previous year. This highlights the ongoing transition to more advanced broadband technologies, particularly Fiber-to-the-Home (FTTH).
  • The imperative of closing the connectivity gaps. Despite improvements in global connectivity, there are still areas that fall outside of network coverage. Speedtest® data highlights disparities in internet performance between fixed and mobile networks across different regions, emphasizing the importance of addressing connectivity challenges worldwide.

5G Networks

Global 5G download speed improvements

Illustration of 5G Median Performance Worldwide

The median global 5G download speed has experienced a noteworthy surge, registering a 20% increase and reaching 203.04 Mbps in Q3 2023, compared to 168.27 Mbps in Q3 2022, according to Speedtest Intelligence® data. This improvement coincides with a substantial rise in global 5G connections, reaching 1.4 billion according to GSMA Intelligence, representing a 65% year-on-year increase from 872 million a year ago. 

In terms of upload speed and latency, only a very modest improvement of 1% occurred. Median 5G upload speeds reached 18.93 Mbps in Q3 2023, compared to 18.71 Mbps in the same period last year; multi-server latency, a critical metric for network responsiveness, improved from 45 ms in Q3 2022 to 44 ms in Q3 2023. 

Speedtest users experiencing the top 10% of 5G download speeds globally have seen a 9% increase, rising from 525.54 Mbps in Q3 2022 to 573.12 Mbps in Q3 2023. However, speeds have not yet reached Gigabit levels, primarly because of network economics. 5G was originally designed to deliver peak data rates of up to 20 Gbps based on IMT-2020 requirements, but we are still a ways off before gigabit speeds become the new normal. For instance, symmetrical download, upload speeds, and ultra-low latency haven’t been realized, partially because the vast majority of 5G networks are not ‘true 5G’ as they have been deployed in Non-Standalone (NSA) mode, meaning they rely on a 4G LTE network core. According to GSA, over 40 operators have launched 5G standalone (SA) in public networks, but the rollout is not yet complete. Nevertheless, the industry is actively exploring the prospect of 5G Advanced, which promises symmetrical upload and download speeds and ultra-low latency, signaling a proactive stance ahead of the eventual transition to 6G.

Malaysia joined South Korea and the U.A.E at 5G speeds podium

Chart of Fastest Countries for Median 5G Download Speed

During Q3 2023, the United Arab Emirates and South Korea stood out as leaders in 5G performance, boasting the fastest median 5G download speeds globally at 592.01 Mbps and 507.59 Mbps, respectively. Our top 10 list also includes Malaysia, Qatar, Brazil, the Dominican Republic, Kuwait, Macau, Singapore, and India. The shift in the top 10 rankings reveals dynamic changes, with Malaysia, the Dominican Republic, and India making significant strides, while Bulgaria, Saudi Arabia, New Zealand, and Bahrain dropped out of the rankings.

The U.A.E showcased a 14% increase in its median 5G download speed, reaching 592.01 Mbps in Q3 2023, up from 511.68 Mbps in Q3 2022, allowing the U.A.E to take the top spot from South Korea. Key factors contributing to the U.A.E.’s 5G leadership include fierce market competition driven by Etisalat and du, resulting in extensive 5G coverage and widespread access to 5G services. Additionally, the allocation of a 100 MHz of contiguous spectrum, as discussed in our 5G spectrum article, has played a pivotal role in achieving faster speeds, lower latency, and improved spectral efficiency.

The regional shift in 5G performance leadership is noteworthy. In 2022, half of the top 10 countries were from the Middle East, while in 2023, the same proportion hailed from the Asia Pacific region. Our analysis suggests that early adopters in the Asia Pacific region have outperformed major European markets in 5G performance, due to factors such as early spectrum availability and supportive government policies.

Malaysia’s remarkable achievement in reaching the third spot globally for 5G download speed, with a reported speed of 485.24 Mbps in Q3 2023, is particularly noteworthy. Despite launching its nationwide 5G network less than two years ago, Malaysia’s unconventional deployment strategy has proven effective. India has also made a significant leap, with its median 5G download speed of 312.26 Mbps allowing India to reach the top 10 worldwide. The country’s climb of 72 places on the Speedtest Global Index™ between September 2022 and August 2023 is primarily credited to the launch of 5G. Following a 5G spectrum auction in India, operators have successfully addressed network congestion issues by offloading 4G traffic onto 5G networks.

In Brazil, 5G download speed increased 1.4 times, jumping from 312.09 Mbps in Q3 2022 to 443.93 Mbps in Q3 2023. Before Brazil’s 5G spectrum auction, operators had offered 5G using DSS since July 2020. While DSS can provide broad 5G coverage, its speeds are often similar to those on 4G LTE networks. In November of 2021, however, Brazil’s multi-band 5G spectrum auction closed, which not only generated BRL47.2 billion ($8.5 billion) in total commitments, but it also allowed operators to deliver much faster speeds on dedicated 5G spectrum compared to DSS. National operators – Telefonica Brasil (Vivo), Claro Brazil, and TIM Brazil – ended up with 40 MHz or 50 MHz in the 2.3 GHz spectrum band and 100 MHz each in the 3.5 GHz band. The subsequent simultaneous activation of 5G networks in July 2022 marked a transformative moment with the continuous expansion of 5G services to 623 municipalities by December 2023. An upcoming spectrum auction expects to improve Brazil’s 5G standing even further.

The Dominican Republic’s entry into the top 10 fastest 5G countries was marked by its official launch of 5G services in December 2021, making it the first Caribbean nation and the third in Latin America to adopt a 5G network.

Disparity Between 5G Performance and Consumer Perception

The Net Promoter Score (NPS) is a tool that gauges customer loyalty and satisfaction. At the end of Speetest, users may be asked to answer “How likely is it that you would recommend [provider] to a friend or colleague?” on a scale from 0-10. Net Promoter Scores are applied to both users and providers. Users are categorized into Detractors (score 0-6), Passives (score 7-8), and Promoters (score 9-10). NPS is the percent of Promoters minus the percent of Detractors and is displayed in the range from -100 to 100. Providers are ranked in descending order of NPS. NPS categorizes users into Detractors (those that score 0-6), Passives (scores between 7 and 8), and Promoters (scores of 9-10). NPS represents the percentage of Promoters minus the percent of Detractors displayed in the range from -100 to 100. 

In our article discussing whether 5G was meeting customer expectations, we found that 5G users typically rate their network operator with NPS scores universally higher than those for 4G LTE users. In Q3 2023, that trend continued, as 5G  users that were on 5G network when answering the NPS question still scored higher than those on 4G across all markets analyzed. It isn’t surprising given that at a global level, 5G had a 637% better median download speed than 4G and a 130% better median upload speed. 

Chart of NPS Score, 5G Compared to 4G

While 5G NPS still outpaces scores on 4G, our data shows that 5G NPS has been decreasing annually. This could point to the fact that excitement about 5G as a new technology is waning as users become used to faster speeds, or as customers await new use cases that can take advantage of the faster speeds that 5G can provide. After all, we are still waiting for that killer app for 5G, the way the video and streaming were for 4G. 

While it is difficult to fully explain the reasons behind the 5G NPS decrease without further research, we can clearly see that network performance isn’t the only factor at play influencing NPS declines. Others can include customer care, pricing, and other services. For example, in South Korea, one of the first countries to launch 5G with one of the world’s fastest speeds, consumers scored 5G networks -41.47 in Q3 2023 compared to -20.51 in Q3 2022. 

In March 2021, South Korean consumers launched a class action suit against operators because they felt they were being misled by the promises of 5G in the country. Recently, South Korea’s antitrust regulator fined three 5G operators a total of 33.6 billion won ($25.06 million) for making exaggerated claims about the level of performance their networks could achieve. South Korean operators claimed consumers could experience theoretical 5G speeds, which are not practically achievable in a “real world” environment, as factors such as spectrum usage, network densification, user location, and device capability significantly affect actual performance. Our data shows that the top 10% of 5G users in South Korea experienced speeds of 1.004 Gbps in Q3 2023, which, although impressive, are far lower than the advertised 20 Gbps speeds. 

Chart of 5G NPS Score Change Year on Year

Fixed Networks

Fiber driving fixed performance gains 

Illustration of Fixed Median Performance Worldwide

On a global scale, fixed networks have demonstrated significant advancements, achieving a median download speed of 83.95 Mbps and an upload speed of 38.32 Mbps in Q3 2023, per Speedtest Intelligence data. This signifies a substantial 19% improvement in download speed and an impressive 28% enhancement in upload speed compared to those in 2022. This also indicates that more fixed connections have migrated to fiber networks.

According to the World Broadband Association (WBBA) report titled “Next Generation Broadband Roadmap 2023 to 2030” Fiber-to-the-Home (FTTH) is identified as the natural progression from copper-based xDSL broadband networks. The shift towards FTTH varies across different countries and regions, but the industry is committed to embracing more advanced and efficient broadband technologies. 

Oftentimes, despite improvement in underlying broadband technology, Wi-Fi is the bottleneck that reduces customer experience. Our research has shown that Wi-Fi performance can lag behind ethernet in markets where advanced cable and fiber connections are replacing legacy broadband technology (such as DSL or coax cable). Wi-Fi speeds typically range from 30-40% of ethernet, indicating a need to accelerate the adoption of more advanced Wi-Fi technologies and optimize the home network environment.

The UAE, Singapore, and Hong Kong are in the lead for fixed

Chart of Fastest Countries for Fixed Broadband Download Speed

The United Arab Emirates (UAE) and Singapore led the way in fixed network performance.

The UAE achieved a median download speed of 247.63 Mbps in Q3 2023, representing a notable 1.83 times increase compared to the previous year. Most customers in the UAE have access to fiber networks, and additional measures have been implemented by operators in the region to enhance internet speeds, such as increasing the minimum download speed from 250 Mbps to 500 Mbps and offering price discounts to incentivize users to upgrade to higher-tier plans. 

Singapore also leads on the 2023 Fiber Development Index (FDI), with maximum scores in seven of the nine metrics. Singapore, along with Qatar and South Korea, has achieved 100% FTHH coverage. One of the reasons for this success, besides having a smaller area, is that Singapore’s regulator mandates building owners and real estate developers to provide adequate space, facilities, and accessibility for network operators to pre-install fiber networks.

Hong Kong also demonstrated significant progress, with a 37% increase in median download speed and a 40% increase in upload speed. To track broadband adoption, the Office of the Communications Authority (OFCA) in Hong Kong monitors broadband adoption by advertised speed and technology mix; as of August 2023, 66% of residential clients already subscribed to the Internet with a download speed equal to or greater than 1 Gbps.

Chile has seen a 14% improvement in median download speed and a 29% improvement in upload speed on the back of a greater fiber adoption. Chile has been the top-performing fixed broadband market across Latin America, consistently outperforming other regional markets but over the last three years, it has also closed the performance gap with other leading markets globally. Chile’s strong fixed broadband performance — an anomaly in the region — is primarily due to strong competition among Chilean ISPs. Chile has seven ISPs with over 5% market share, all heavily focused on migrating customers to fiber. 

Thailand is a newcomer to the ranking as FTTH continues to grow strongly. FTTH constitutes an impressive 95% of fixed broadband users in Thailand, equivalent to around 58.96% of household penetration. Operators have been actively rolling out fiber in adherence to the Digital Thailand National Policy.

In the United States, there has been a 26% improvement in median download speed and a 7% improvement in upload speed. In this very competitive market, with a range of access technologies vying for customers, a combination of migration to fiber, 5G fixed-wireless access (FWA), and faster cable connections is helping drive higher performance levels. In line with the demand for faster network performance in the market, the FCC recently announced that it is seeking input on a planned increase to its definition of broadband/high-speed internet to 100 Mbps download and 20 Mbps upload, up from the current 25 Mbps download and 3 Mbps upload standard.

As discussed in our recent article, several European countries are making substantial progress in offering high-speed broadband. Across Europe, Denmark had the fastest median download speed for fixed broadband (196.43 Mbps), followed by Spain (176.08 Mbps) and France (170.51 Mbps). Denmark experienced a 25% improvement in median download speed and a 16% improvement in upload speed. Spain also showed significant improvement, with a 32% increase in median download speed and a 29% increase in upload speed. France exhibited even stronger progress, with a 53% increase in median download speed and a 41% increase in upload speed. The speed gains we’ve seen in Spain and France are correlated with an increase in fiber adoption; for example, Spain boasts nearly 90% fiber optic coverage, thanks to private initiatives and government support, while France expects a full-fiber rollout by 2025.

Connectivity for All

The imperative of closing the connectivity gap

Massive investments are being made to bridge the connectivity gap as recognition of connectivity as a fundamental human right is growing. According to a WBBA Whitepaper, a high level of broadband penetration is critical to the country’s socioeconomic development. However, it’s not only about being connected to the network per se; the quality of that broadband connection is equally crucial. Unlike other utility services like gas and electricity, where quality is generally stable, with broadband, the quality of the network experience is crucial to ensure users can benefit fully from multiple applications.

To assess the digital divide, we mapped mobile and fixed internet performance using data from the Open Data Initiative, which Ookla provides as part of Ookla for Good

Determining where a digital divide exists is a complex issue that involves identifying where network infrastructure is located, where people need connectivity, and how affordable it is. Although it can be challenging to dig into a specific location, it is evident that there are varying levels of Internet performance worldwide. A quick glance at our data shows that fixed broadband customers are more likely to experience faster networks (measured as an average download speed of 100 Mbps and above) than mobile across the Americas and Europe. The opposite is true for mobile networks across Africa and APAC, where mobile networks are often the primary means of connectivity. Compared to urban areas, rural communities are often ill-equipped for broadband access. Due to a lack of bandwidth (and therefore slower speeds), people in these areas need help doing many things on the internet, such as streaming videos. The US regulator FCC defines broadband in the United States as access to  25 Mbps download and 3 Mbps upload speeds. Areas without those speeds are classified as broadband “digital deserts,” even if those areas have internet access. Although broadband definitions can vary considerably from country to country, we can see in the next section that many areas fall outside any standards of connectivity globally.

Despite the world becoming increasingly connected, many rural and remote areas still struggle to access the internet. For example, large swathes of South America and Africa fall outside terrestrial network coverage. As discussed in our recent article, cellular networks are critical to connecting individuals and businesses as internet access in Africa is predominantly mobile. Before we can start discussing 5G, connecting communities with the internet in general is a priority. Affordable 4G smartphones and targeted financing for under-served demographics are key for bridging the digital divide and reducing poverty, as a World Bank study found that 4G coverage can help cut poverty by up to 4.3%. 

5G technology can potentially replace fixed internet access in situations where the cost of fiber deployments is high and rolling out traditional fixed broadband networks isn’t commercially viable. However, in countries like Indonesia, satellite technology may be a more effective solution for connecting remote areas. While 5G Fixed Wireless Access (FWA) and satellite technology can complement each other, the adoption of satellite technology is currently limited by factors such as coverage, device affordability, and service cost. As revealed in our recent article, Starlink outperforms GEO satellites and is a suitable replacement for fixed networks in rural areas. While it may not match the leading cable or fiber providers in terms of median speeds or multi-server latency, satellite internet provides a viable alternative in places where cable and fiber access networks are unavailable. This is mainly due to a more consistent distribution of download performance across Speedtest samples, unlike FWA and DSL-based services, where performance is impacted by the distance from the cell site or exchange/DSLAM.

Fixed and mobile network operators across the globe widely use Speedtest data to enhance Internet quality, improve accessibility, and inform network expansion. The United States Federal Communications Commission and the Malaysian Communications and Multimedia Commission rely on Speedtest data to ensure accountability of telecommunications entities and allocate funds for rural and urban connectivity development. Ookla also licenses data to NGOs and educational institutions to help bridge the digital divide between areas with and without modern Internet access. Our mapping data is used to track results and determine whether broadband infrastructure can handle growth as more people connect devices and technologies demand more bandwidth. We are also actively involved in discussing best practices for ensuring digital transformation and connectivity for all in the APAC region, Central Asia, and Europe. If you are interested in working with us, please reach out. 

Keep track of how well your country is performing on Ookla’s Speedtest Global Index and get advice on how to plan and optimize your network.

Ookla retains ownership of this article including all of the intellectual property rights, data, content graphs and analysis. This article may not be quoted, reproduced, distributed or published for any commercial purpose without prior consent. Members of the press and others using the findings in this article for non-commercial purposes are welcome to publicly share and link to report information with attribution to Ookla.