| January 27, 2021

There's a Problem With Your Connection — The Most Significant Outages of Q4 2020


“We’re experiencing problems” was a common phrase faced by users who encountered outages during Q4 2020. We are continuing our series tracking outages in online services using Downdetector® data from Q4 2020. Once more we have focused on seven categories: cloud services, email service providers, financial services, gaming, internet service providers, social media and streaming services.

Cloud services

Downdetector_AWS_Outage_0121-1

Amazon Web Services (November 25, 2020): 1,313 reports at peak

Users of Amazon’s cloud service noticed a disruption in their service on November 25. Most users stated they were having problems with the AWS Console. The outage affected users in India, Japan, the Netherlands and the U.S. At the peak of outage reports at 8:45 a.m. Pacific, there were 1,313 logged issues in the U.S.

Email service providers

Downdetector_Gmail_Outage_0121

Gmail (December 14, 2020): 90,409 reports at peak

On December 14, users were unable to access their Gmail accounts for over an hour. That day, there were over 90,000 logged issues with the email service provider in the U.S. Users were unable to log into their accounts, send or receive emails. The outage also affected users in Finland, Germany, India, Japan, Poland, the Philippines and Spain.

Financial services

Downdetector_Schwab_Ameritrade_Outage_0121-2

Charles Schwab (November 9, 2020): 17,906 reports at peak

Charles Schwab users experienced problems when trying to log into their accounts on November 9, most likely caused by a surge in activity after news about the Pfizer COVID-19 vaccine were published. The outage lasted for a little over an hour, and there were 17,906 reported issues at the peak of the outage at 6:45 a.m. Pacific. Most error logs came from Chicago, Dallas, and New York City.

TD Ameritrade (November 9, 2020): 8,014 reports at peak

This electronic trading platform also had an outage early in the morning of November 9. Users from Chicago, Dallas, Houston and Brooklyn logged issues on Downdetector and were unable to access their account. At the peak of outage reports at 7:00 a.m. Pacific, there were 8,014 issues logged in the U.S.

Merrill Lynch (November 24, 2020): 2,850 reports at peak

While Merrill Lynch was not immune to reported problems on November 9, the financial service experienced a larger outage on November 24. Users in the U.S. logged 2,850 issues at the peak of the outage at 7:15 a.m. Pacific that day.

Gaming

Downdetector_Steam_Outage_0121

Steam (December 9, 2020): 29,212 reports at peak

The release of the popular game Cyberpunk 77, which created a large volume of traffic on Steam, was the likely cause of Steam’s outage on December 9. Users anxious to download the newly released game became frustrated when the platform was suddenly unavailable. In the U.S. alone, there were 29,212 reported issues on Downdetector.

Internet service providers

Downdetector_Vodafone_Outage_0121

Vodafone Germany (November 23, 2020): 122,627 reports at peak

Vodafone Germany’s mobile service experienced a disruption on November 23. Users from all over Germany (including Berlin, Hamburg and Munich) logged problems with their mobile service that day. At the peak of outage reports, there were 122,627 logged issues.

AT&T (December 25, 2020): 10,617 reports at peak

On Christmas Day, AT&T users in the U.S. reported problems with their mobile and internet services due to an explosion near an AT&T telecommunications hub. Downdetector logged 10,617 issues from users located in cities including Chattanooga, Lexington and Nashville.

Bouygues Telecom (December 2, 2020): 1,984 reports at peak

French users of Bouygues Telecom (primarily in Paris), noticed a disruption in their mobile service on December 2. Customers were unable to make or receive calls or use their mobile internet service for about four hours. At the peak of outage reports, there were 1,984 logged issues.

Social media

Downdetector_Discord_Outage_0121-1

Discord (November 9, 2020): 47,017 reports at peak

The instant messaging platform encountered a problem on November 9. Users in Italy, Germany, the U.K. and the U.S. recorded problems with the server connection. That day, there were almost 50,000 reports of issues on Discord in the U.S.

Telegram (December 16, 2020): 35,836 reports at peak

Telegram users in Russia reported issues with the messaging app on December 16. The outage lasted less than an hour, but Downdetector still received over 35,000 logs from users that day. The app also experienced a smaller outage on October 3 with 20,801 logged issues from users.

VKontakte (October 5, 2020): 6,427 reports at peak

VKontakte, also known as VK, had a disruption in service on October 5. Users of the Russian social media platform rushed to Downdetector to log outage reports when they were unable to log into their accounts. That day, there were 6,427 logs of issues at the peak of the outage reports.

Streaming services

Downdetector_YouTube_Outage_0121

YouTube (November 11, 2020): 357,876 reports at the peak

The Google-owned video streaming service had trouble loading content for their users on November 11. Logs of issues with the service were recorded in Australia, France, Japan, Italy, the U.K and the U.S. Over 300,000 logs were recorded in the U.S. at the peak of the outage reports at 3:30 p.m. Pacific.

Spotify (November 27, 2020): 16,802 reports at the peak

On November 27, users of the popular music streaming service logged issues with the platform. Users in Germany, the U.K. and the U.S. were unable to stream their favorite songs or podcasts. Downdetector recorded 16,802 logs of issues in the U.S. at the peak of the outage reports.

Want to know when an online service is down? Keep up with outages by visiting Downdetector.

Ookla retains ownership of this article including all of the intellectual property rights, data, content graphs and analysis. This article may not be quoted, reproduced, distributed or published for any commercial purpose without prior consent. Members of the press and others using the findings in this article for non-commercial purposes are welcome to publicly share and link to report information with attribution to Ookla.

| June 14, 2021

Exploring Fixed Broadband Network Performance Across Russia

читать по русски

Fixed broadband speeds are on the rise in Russia with a 36.9% increase in download speed during the past year and the country ranked 51st in the world for fixed broadband speed as of April 2021, according to the Speedtest Global Index. Internet performance in Russia varies greatly at the oblast and city level with a clear trend of decreased performance in less populated areas. This article explores the state of Russia’s fixed broadband network performance, including data on: internet speeds, consistency and customer sentiment around providers.

MTS leads fixed broadband performance in Russia

ookla_speedtest_fixed_speeds_russia_0621_en

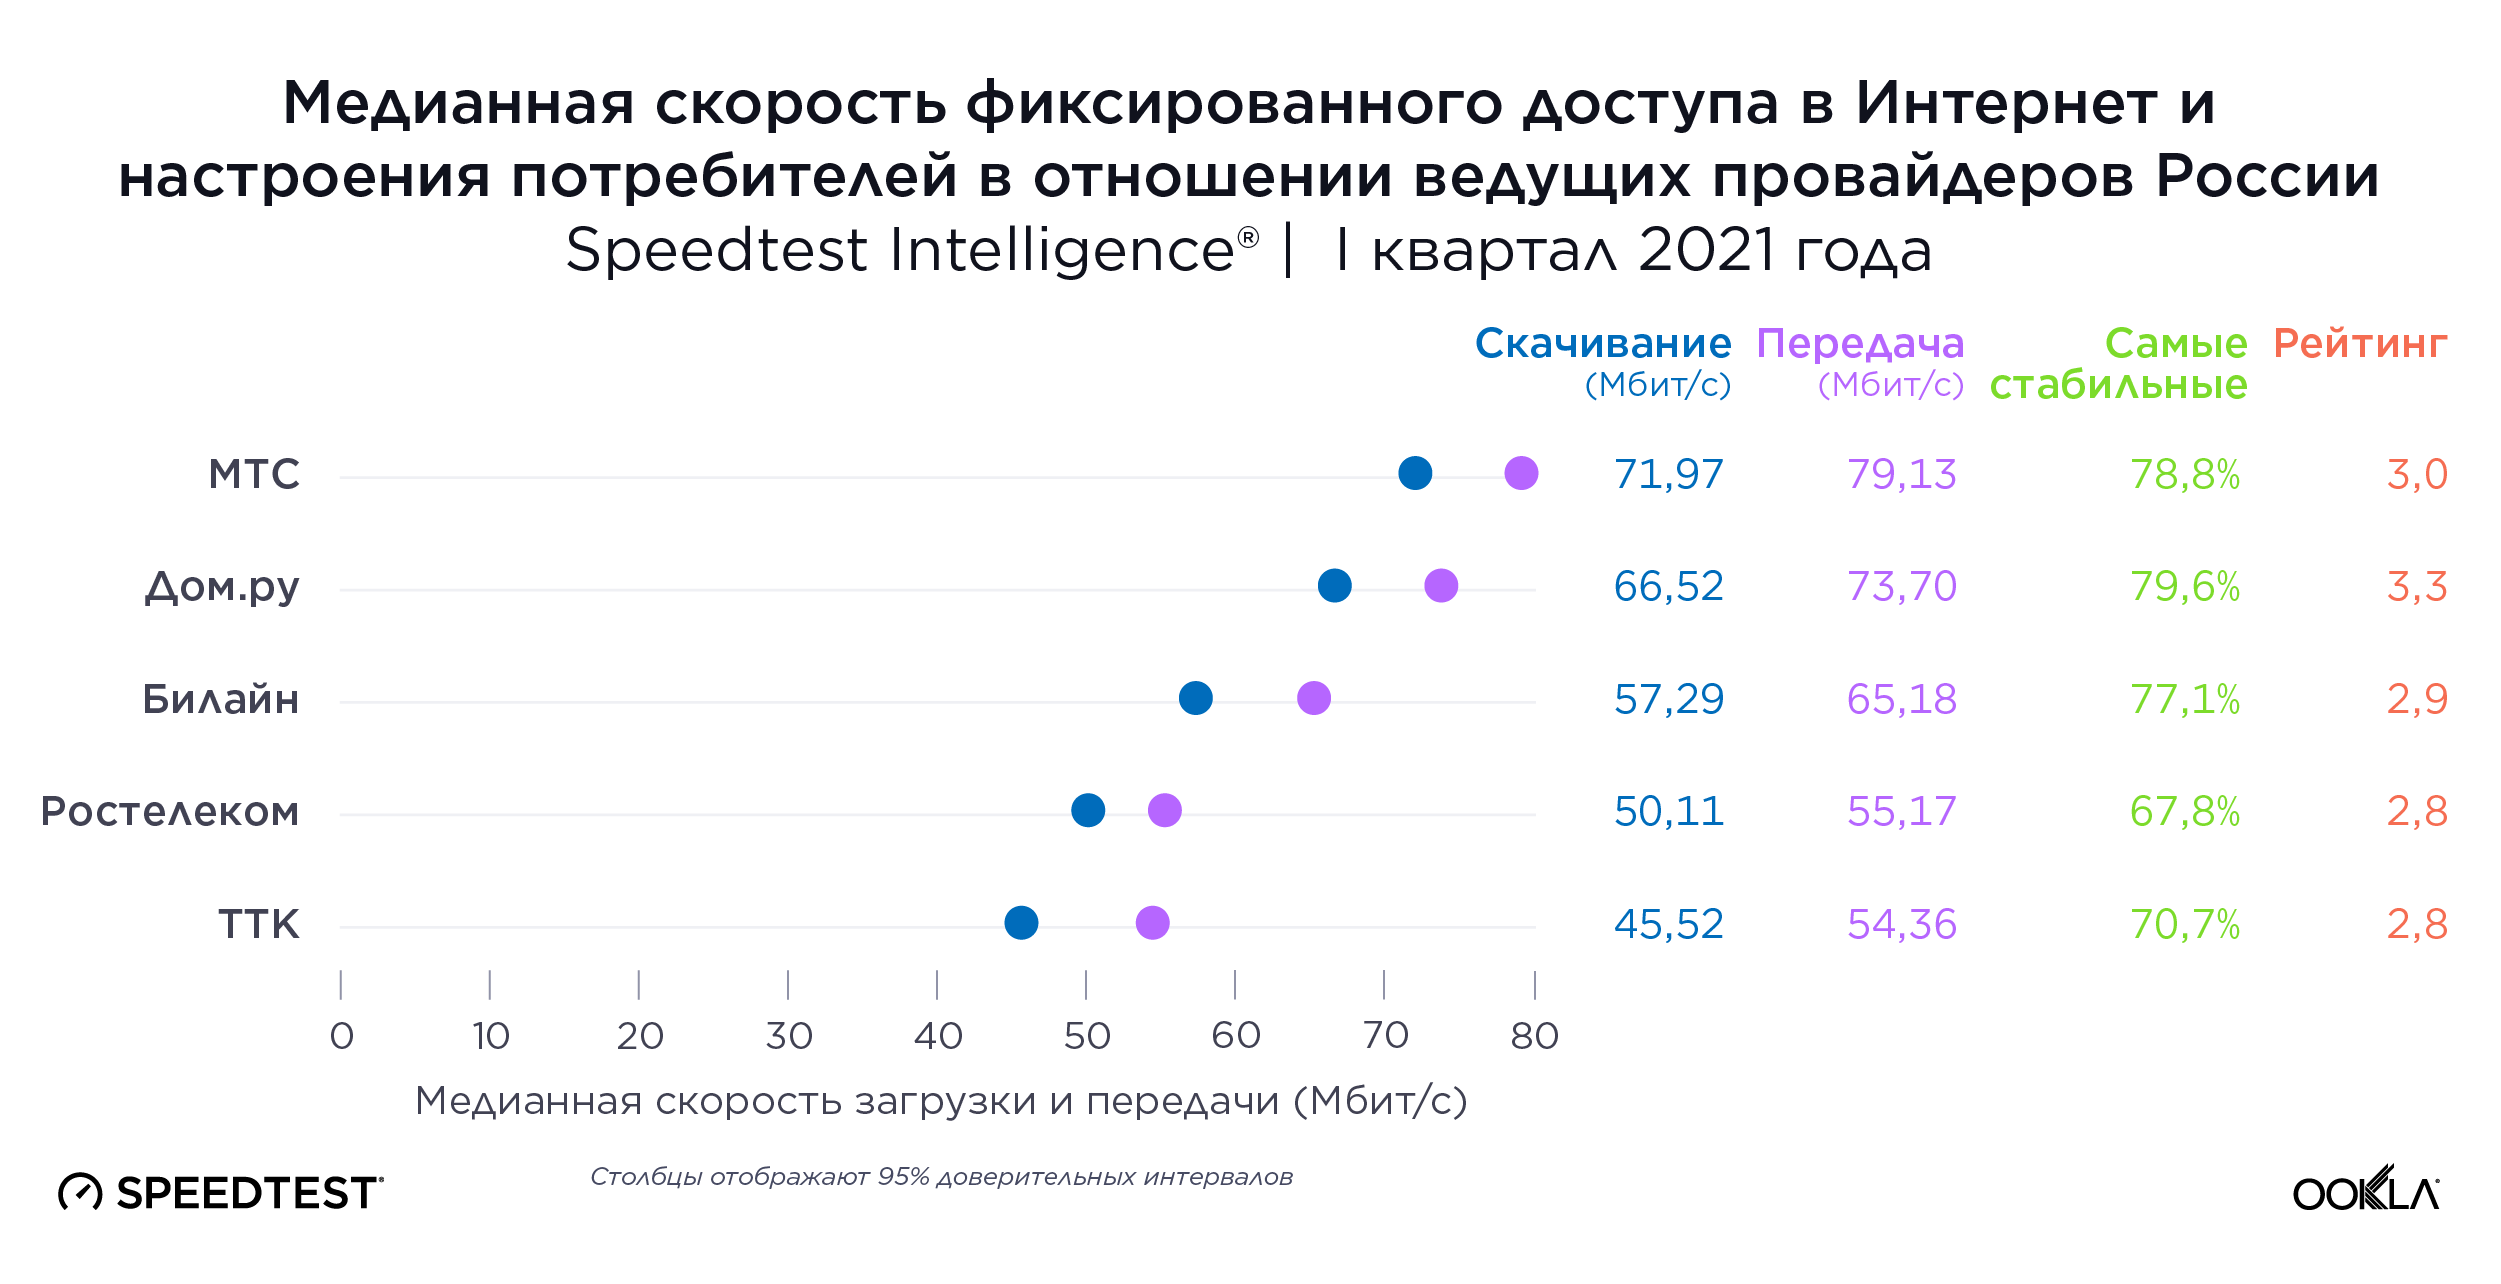
Download speeds for Russian providers varied greatly in Q1 2021, with MTS showing the fastest median download and upload speeds at 71.97 Mbps and 79.13 Mbps, respectively. This put MTS slightly faster than Dom.ru who had a median download speed of 66.52 Mbps and median upload speed of 73.70 Mbps. Next was Beeline who had a median download speed of 57.29 Mbps and a median upload speed of 65.18 Mbps. The slowest two providers across Russia were Rostelecom and TTK with download speeds of 50.11 Mbps and 45.52 Mbps, and upload speeds of 55.17 Mbps and 54.36 Mbps, respectively.

Speedtest Consumer Sentiment data provides rich insights into customer satisfaction over time, as well as competitive benchmarking, by providing data on customers’ overall satisfaction with their network providers (based on a five-star scale). This data set is gathered from single-question surveys presented to users at the end of a Speedtest. Dom.ru received the highest rating during Q1 2021 at 3.3 stars and MTS coming in close behind at 3.0. Beeline, Rosetelecom and TTK were within .1 stars of each other with five-star ratings of 2.9, 2.8, and 2.8, respectively. While there was no statistical winner for most consistent internet experience amongst telecommunication providers Dom.ru had a score of 79.6%, MTS a score of 78.8%, Beeline a score of 77.1%, TTK a score of 70.7%, and Rostelecom a score of 67.8%.

Novosibirsk Oblast had the fastest median download speed, while slowest Magadan Oblast was 45.4% behind

ookla_fixed_broadband_russia_oblast_map_0621b_en

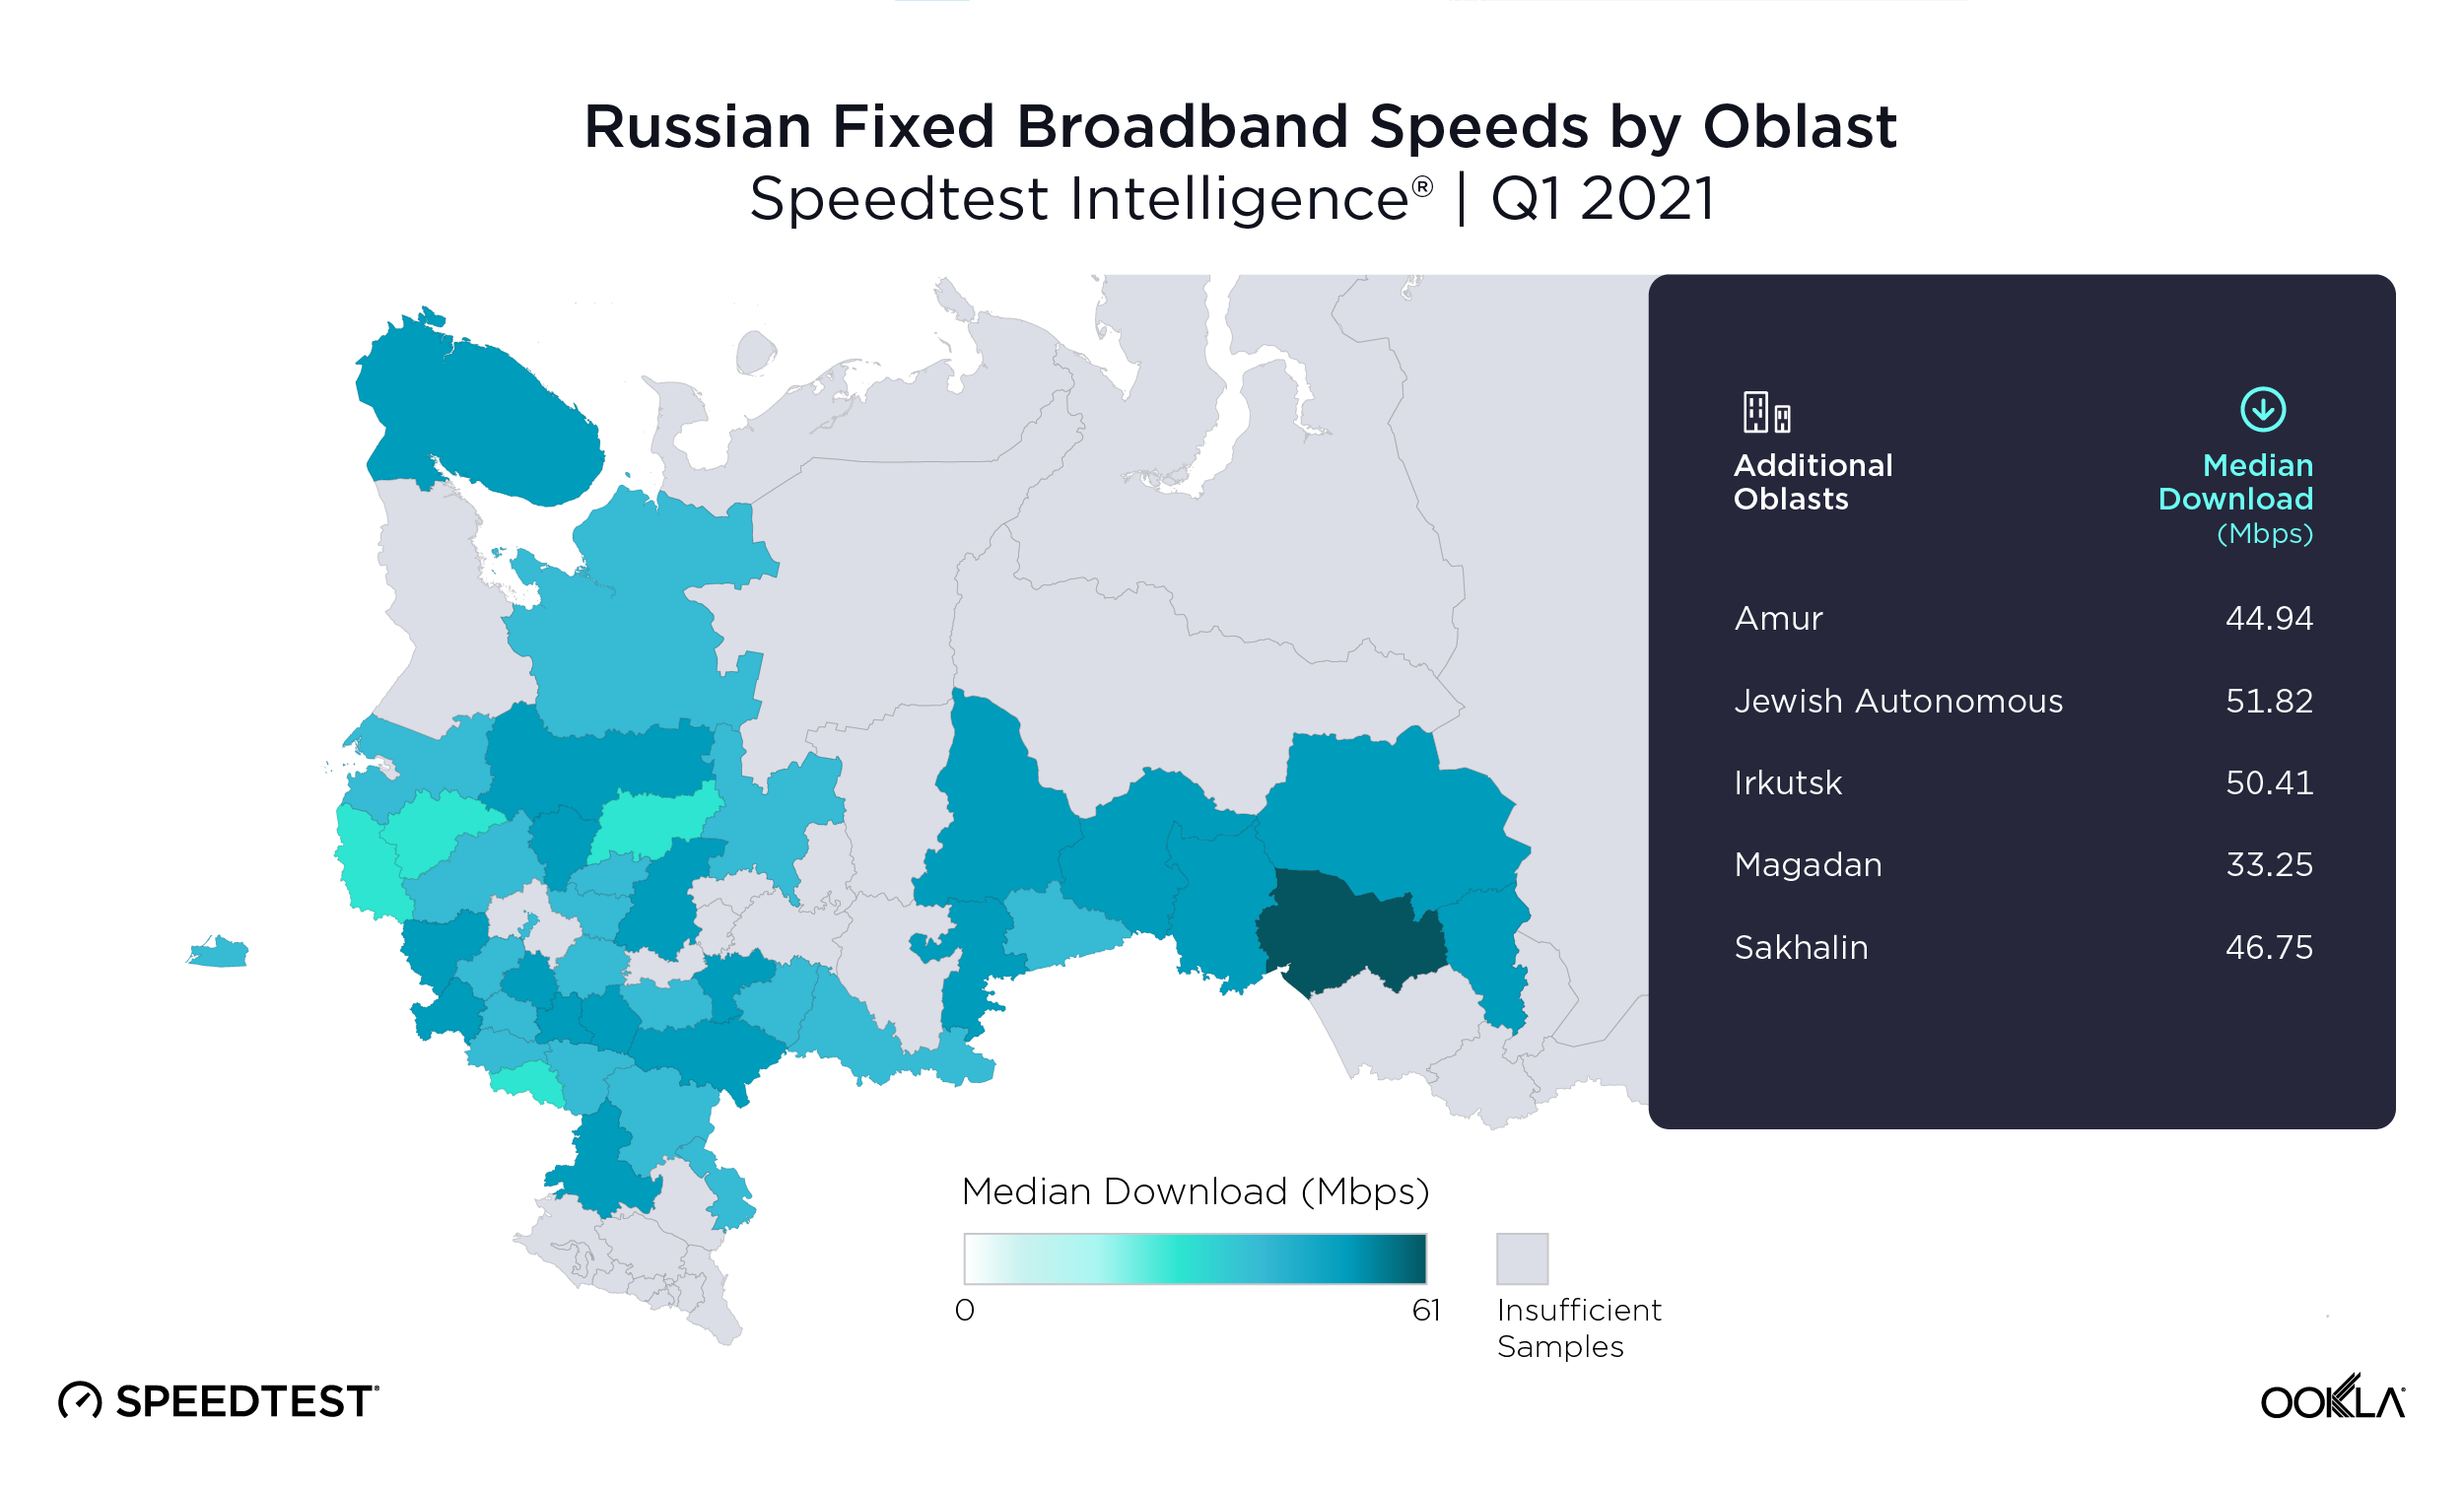
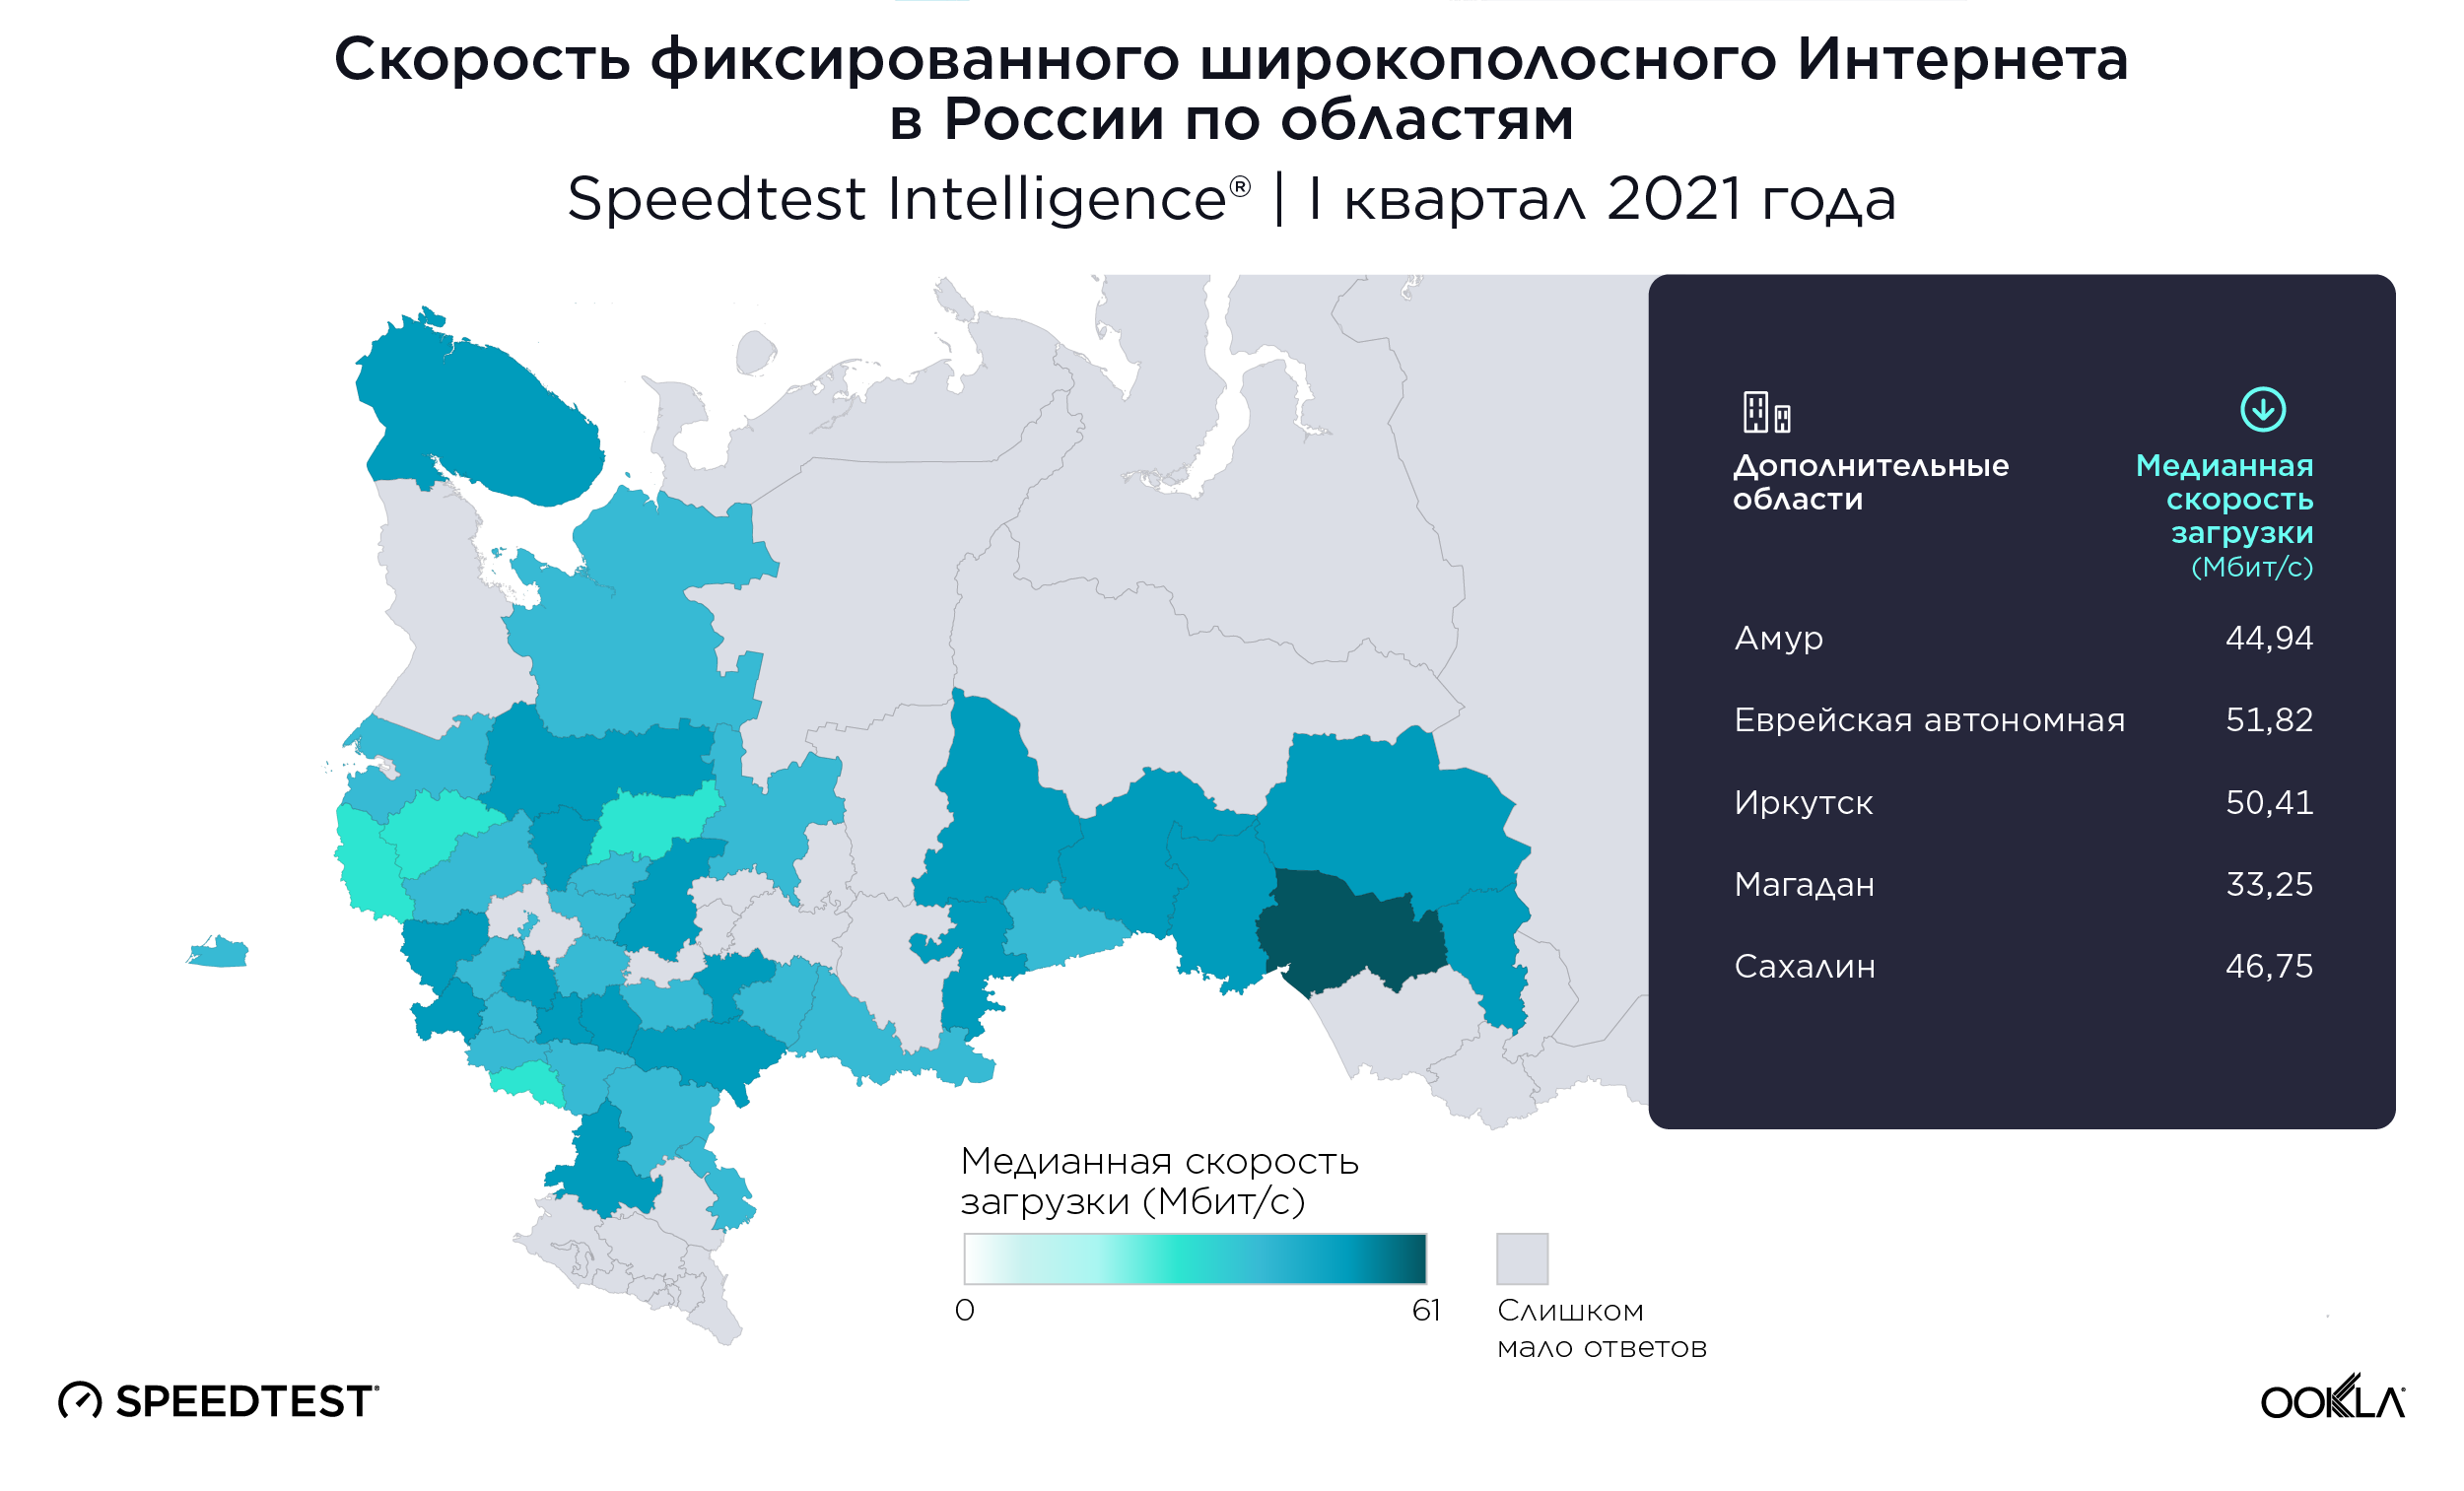
Median fixed broadband speeds varied widely between oblasts in Q1 2021, with median download speeds between 33.25 Mbps and 60.93 Mbps. Novosibirsk Oblast was the fastest with a median download speed of 60.93 Mbps. Murmansk Oblast, Kemerovo Oblast and Tomsk Oblast were close behind with median download speeds of 59.32 Mbps, 59.31 Mbp, and 59.01 Mbps, respectively. The Oblast of Chelyabinsk had a median download speed of 58.61 Mbps, Bryansk 57.80 Mbps and Lipetsk 57.38 Mbps. The eighth, ninth and tenth best performing oblasts were Sverdlovsk Oblast at 55.59 Mbps, Nizhny Novgorod Oblast at 53.41 Mbps, and Tula Oblast at 52.70 Mbps.

The slowest oblast was Magadan with a median download speed of 33.25 Mbps during Q1 2021, 45.4% slower than that in Novosibirsk Oblast. Kostroma Oblast, Belgorod Oblast, Pskov Oblast and Novgorod Oblast experienced median download speeds of 36.05 Mbps, 36.77 Mbps, 36.85 Mbps and 39.43 Mbps, respectively. Arkhangelsk was the sixth slowest oblast with a median download speed of 44.11 Mbps, followed by Amur Oblast with a speed of 44.94 Mbps, and Kaliningrad Oblast with a median speed of 45.31 Mbps. Penza, Kurgan and Leningrad oblasts came within 0.14 Mbps of each other with median download speeds of 46.00 Mbps, 46.10 Mbps, and 46.14 Mbps, respectively.

Moscow had the fastest fixed broadband in Q1 2021

ookla_fixed_broadband_speeds_russia_cities_0621_en-3

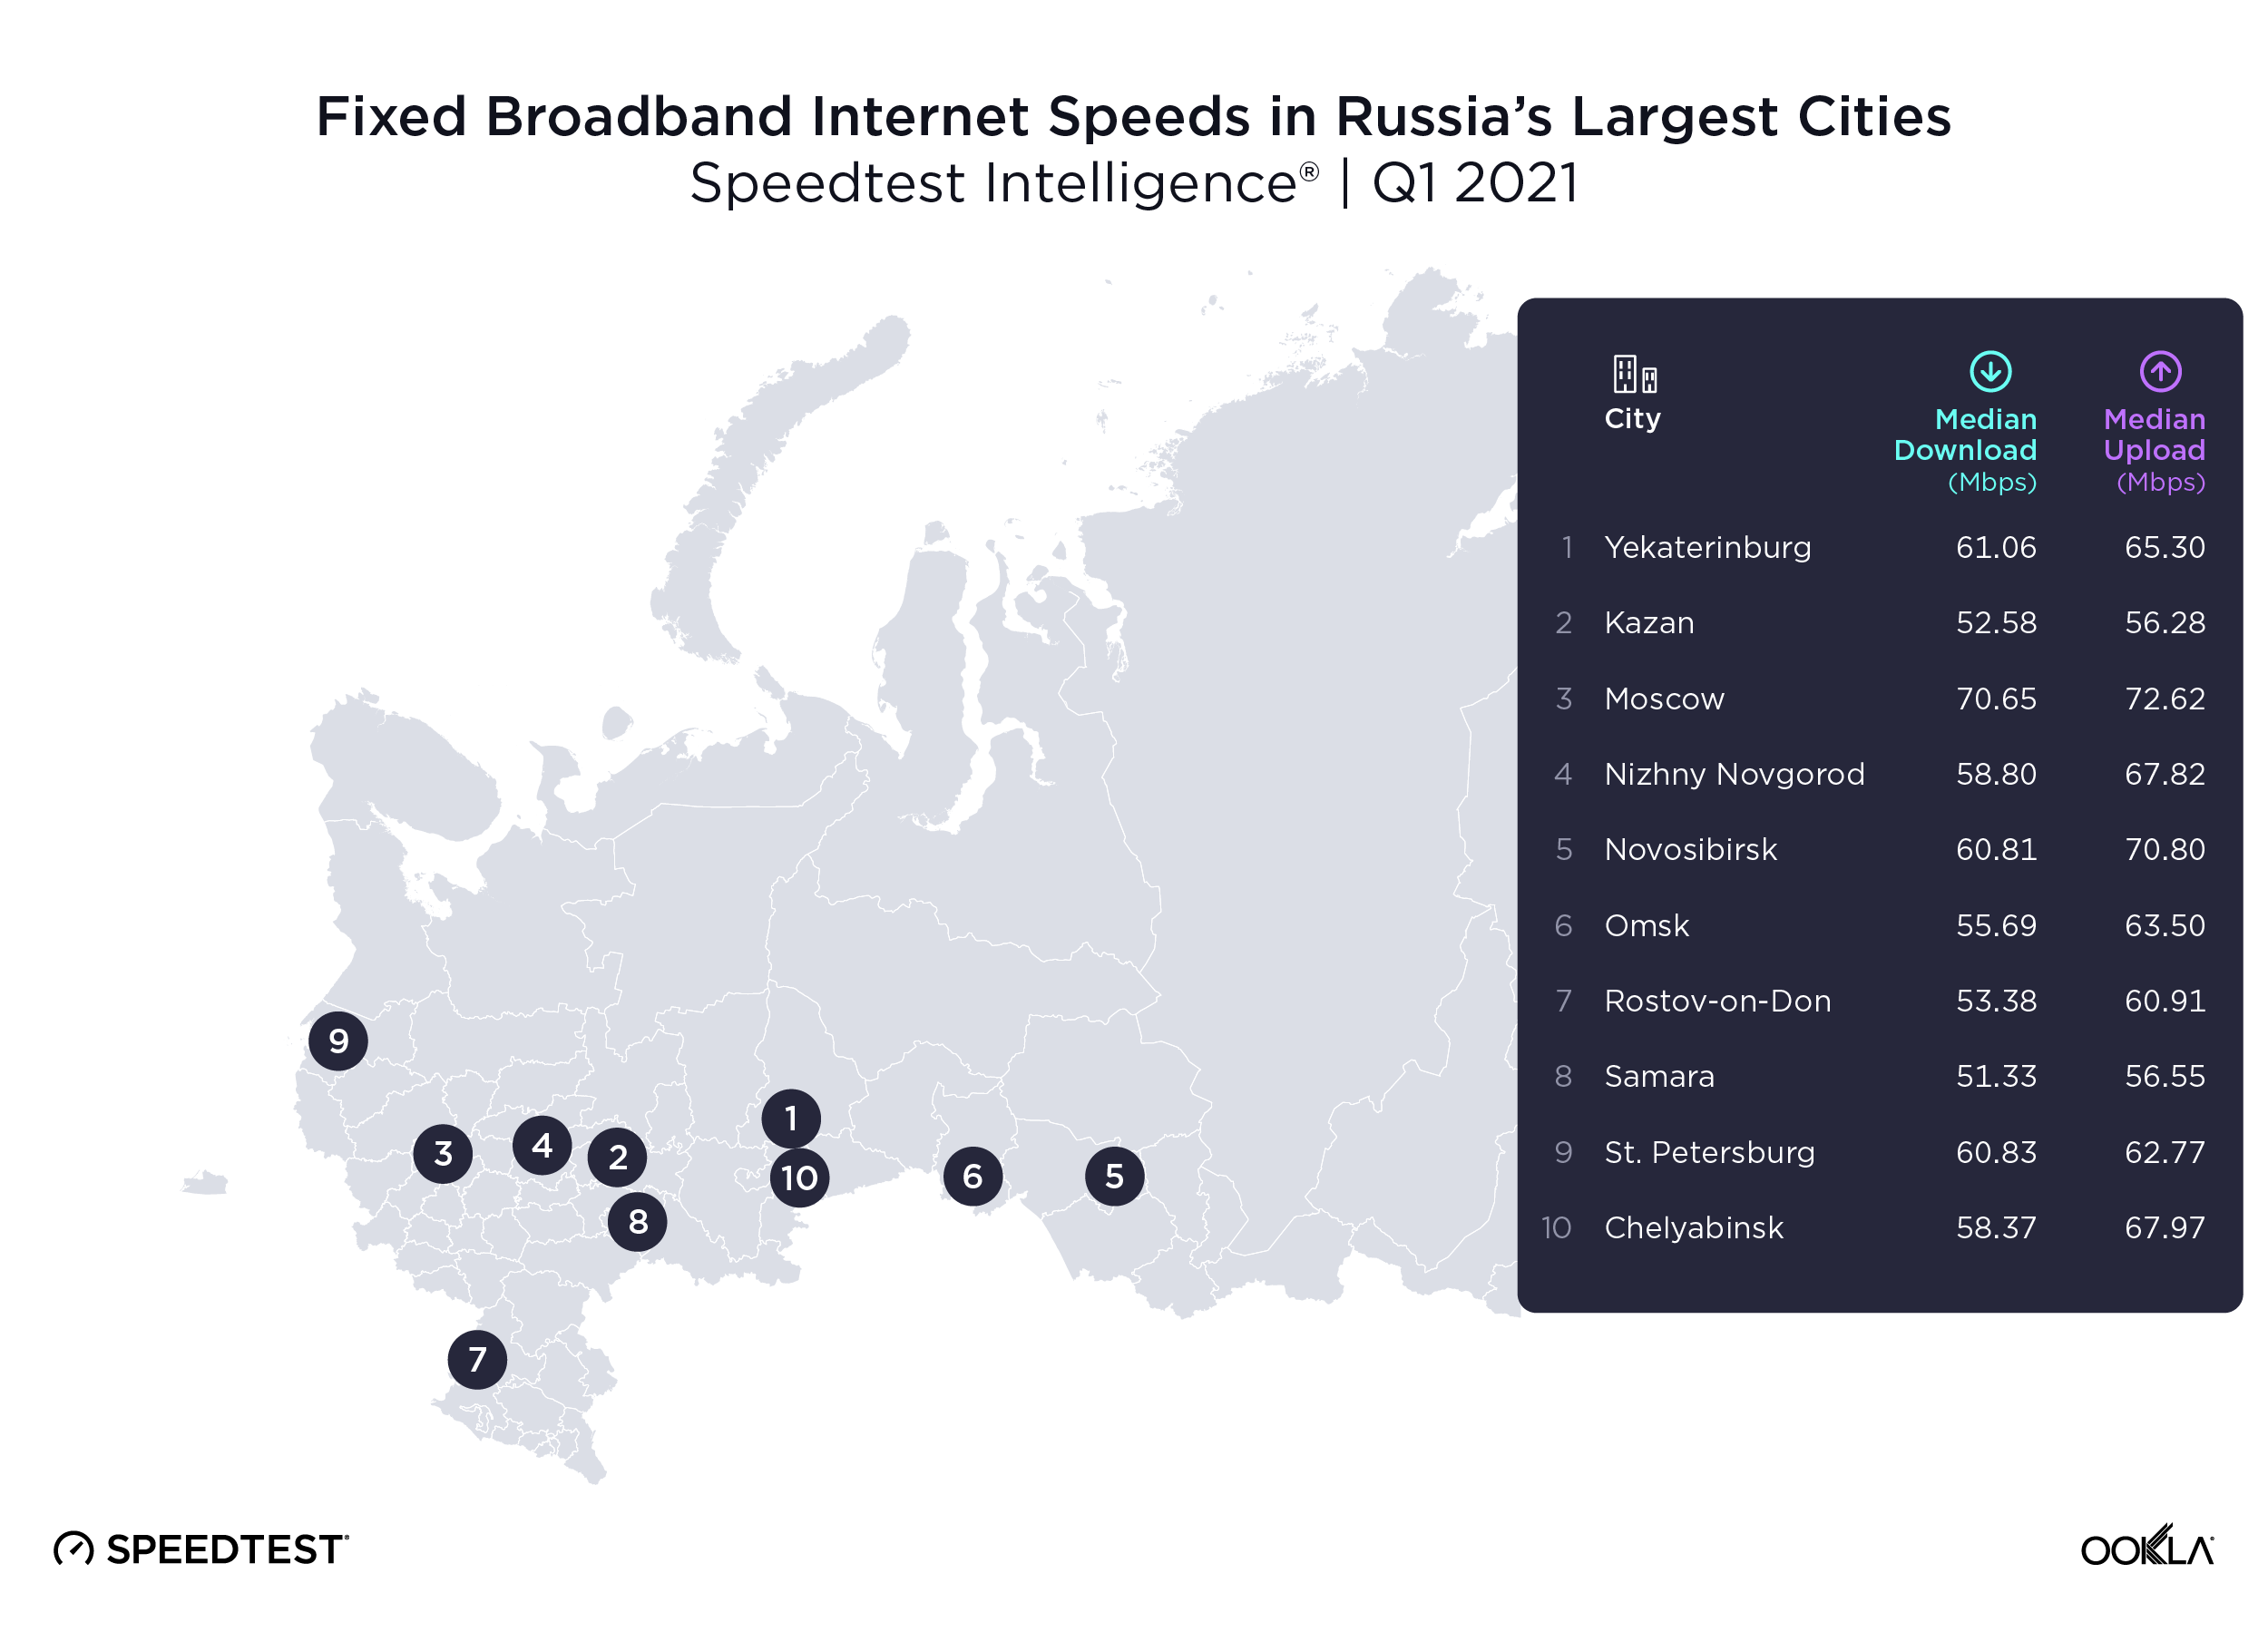
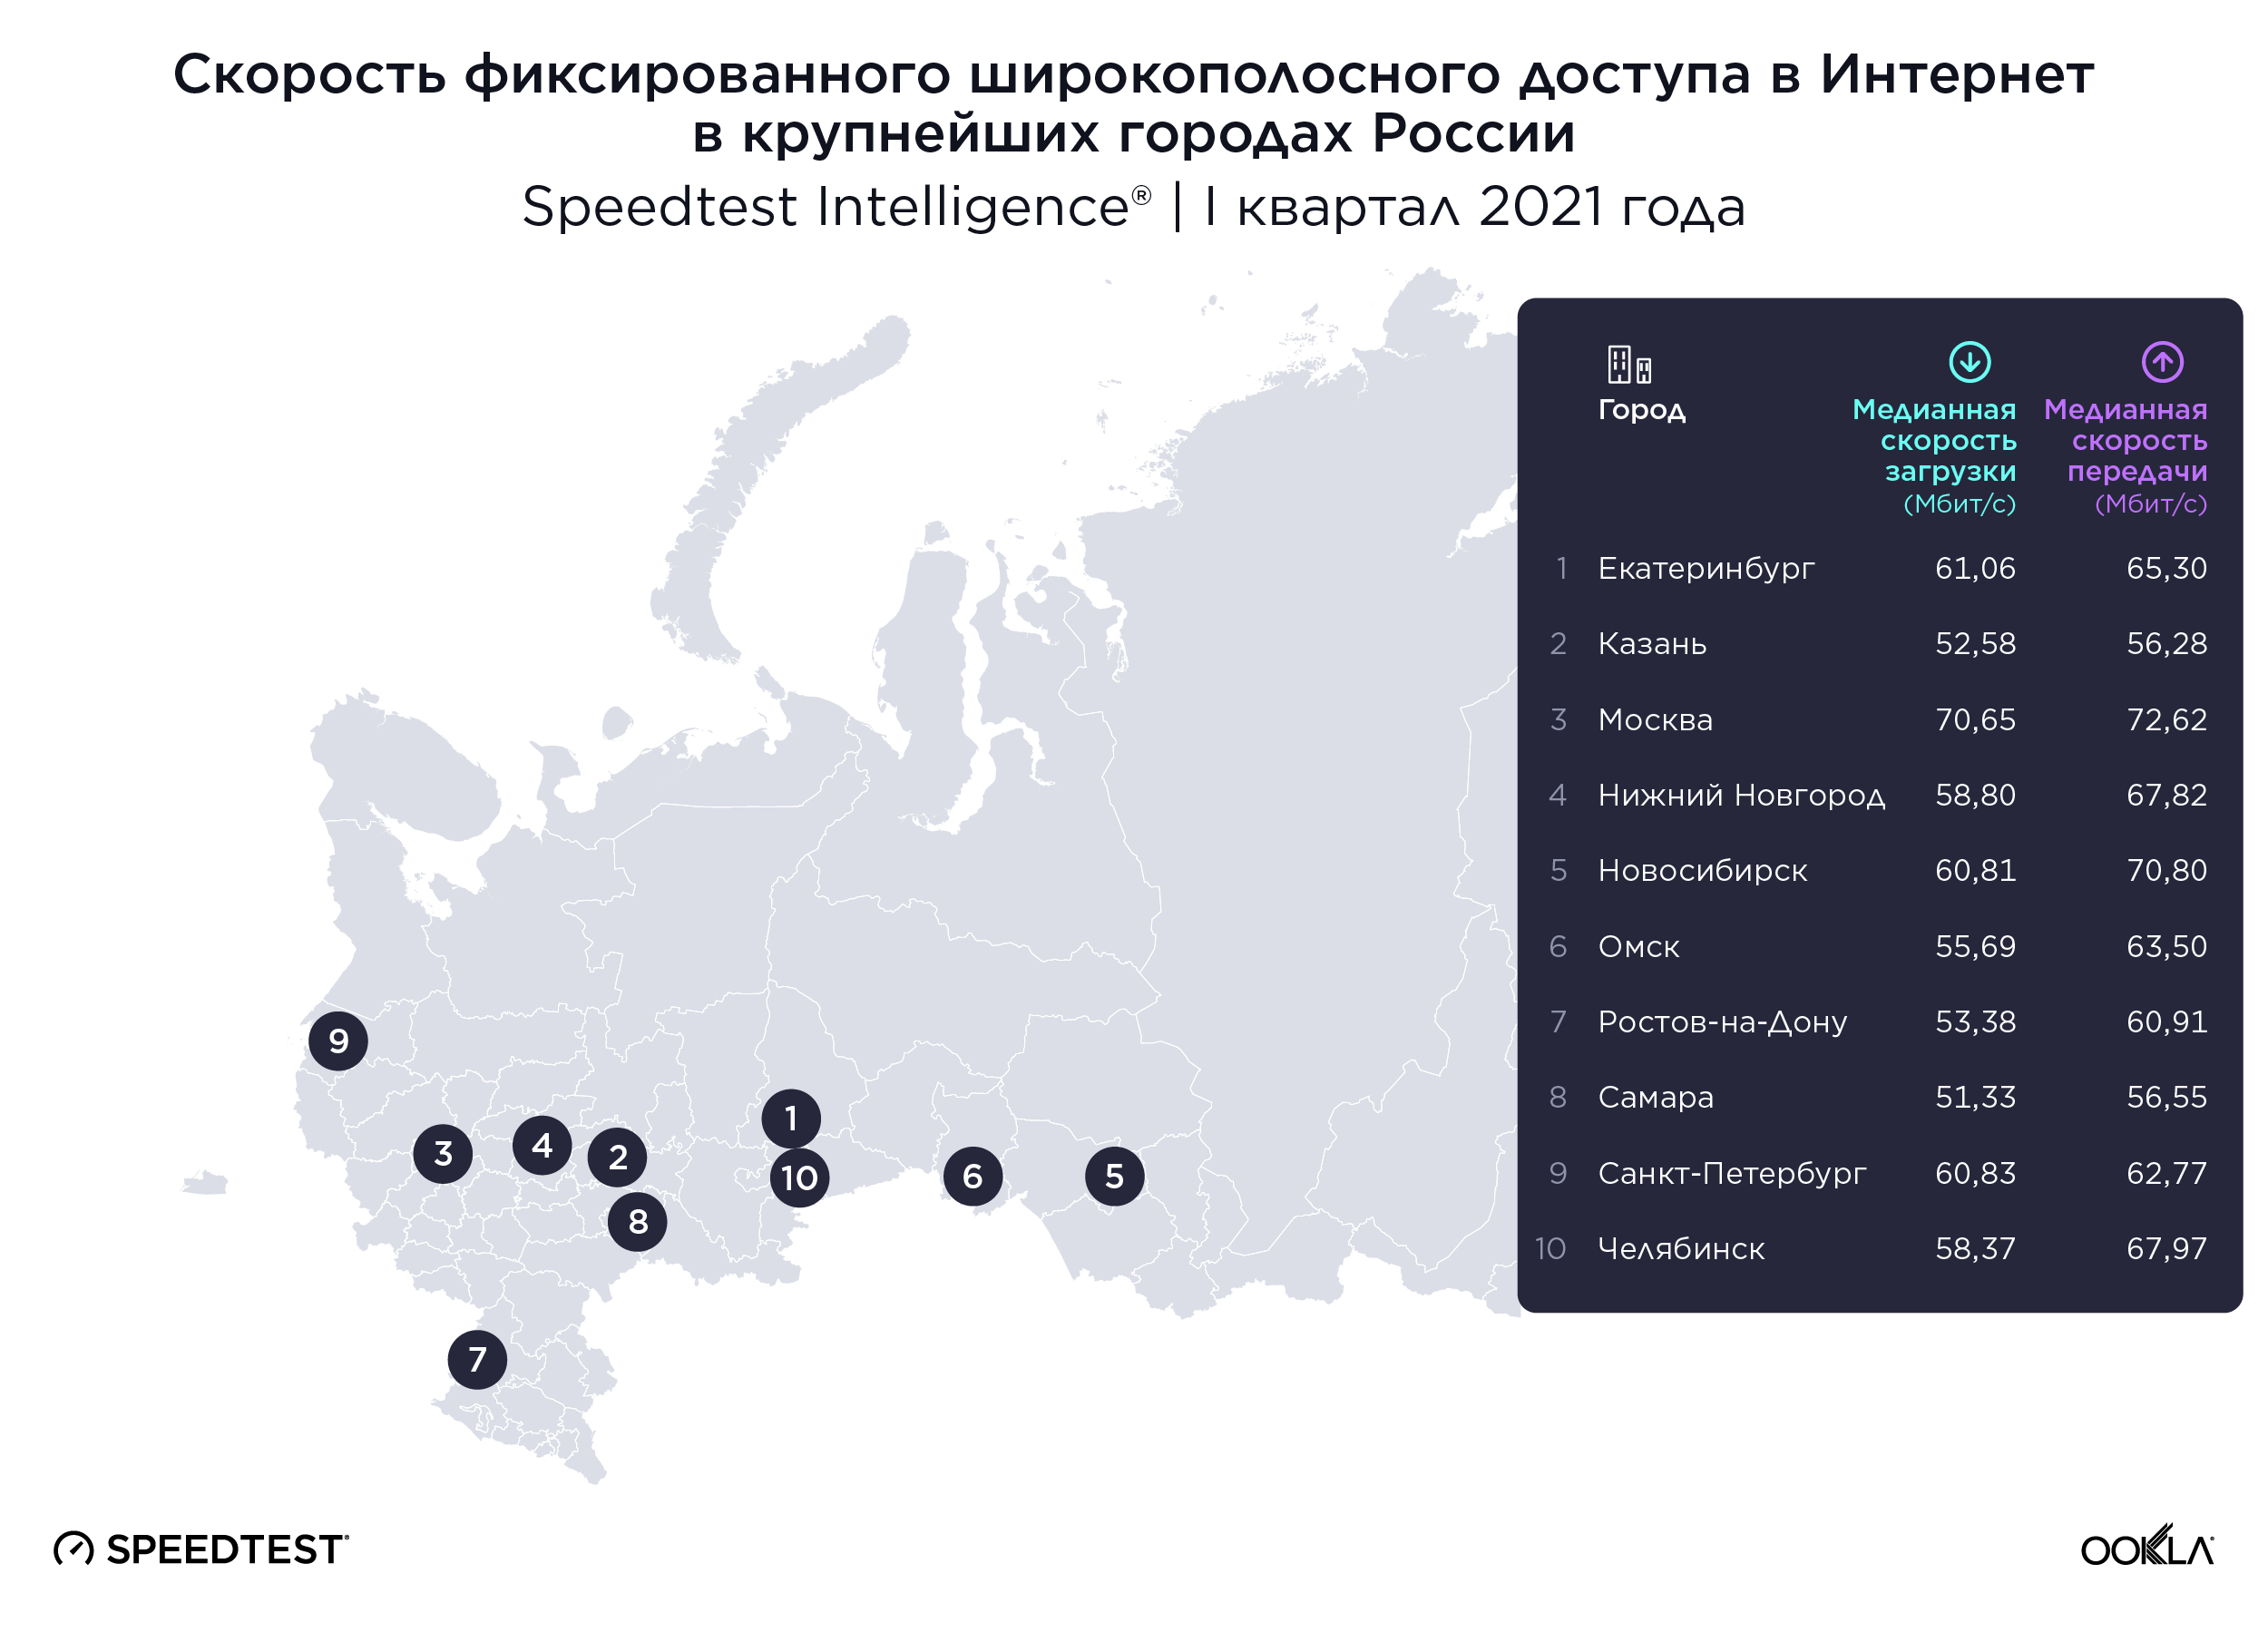
Looking at the 10 most populous cities in Russia, we found that Moscow had the fastest median download speed in Q1 2021 with 70.65 Mbps. Yekaterinburg, St. Petersburg and Novosibirsk were within 1 Mbps of each other with median downloads speeds of 61.06 Mbps, 60.83 Mbps and 60.81 Mbps, respectively. Nizhny Novgorod had median download speeds of 58.80 Mbps and Chelyabinsk 58.37 Mbps. The three cities with the slowest median download speeds were Rostov-on-Don, Kazan and Samara at 53.38 Mbps, 52.58 Mbps and 51.33 Mbps, respectively. Moscow achieved a 37.6% faster download speed than Samara.

City rankings by fixed broadband upload speeds were somewhat similar to what we saw for median download speeds with Moscow being the fastest again with a median upload speed of 72.62 Mbps. Novosibirsk came in second for upload speed at 70.80 Mbps. Chelyabinsk and Nizhny Novgorod came within 0.2 Mbps of each other measuring upload speeds of 67.97 Mbps and 67.82 Mbps, respectively, while Yekaterinburg came in at 65.30 Mbps and Omsk at 63.50 Mbps. St. Petersburg was seventh at 62.77 Mbps, Rostov-on-Don eighth at 60.91 Mbps, Samara ninth at 56.55 Mbps and Kazan last at 56.28 Mbps.

Fastest and most consistent provider varies by city

ookla_fixed_broadband_russia_provider_0621_en-2

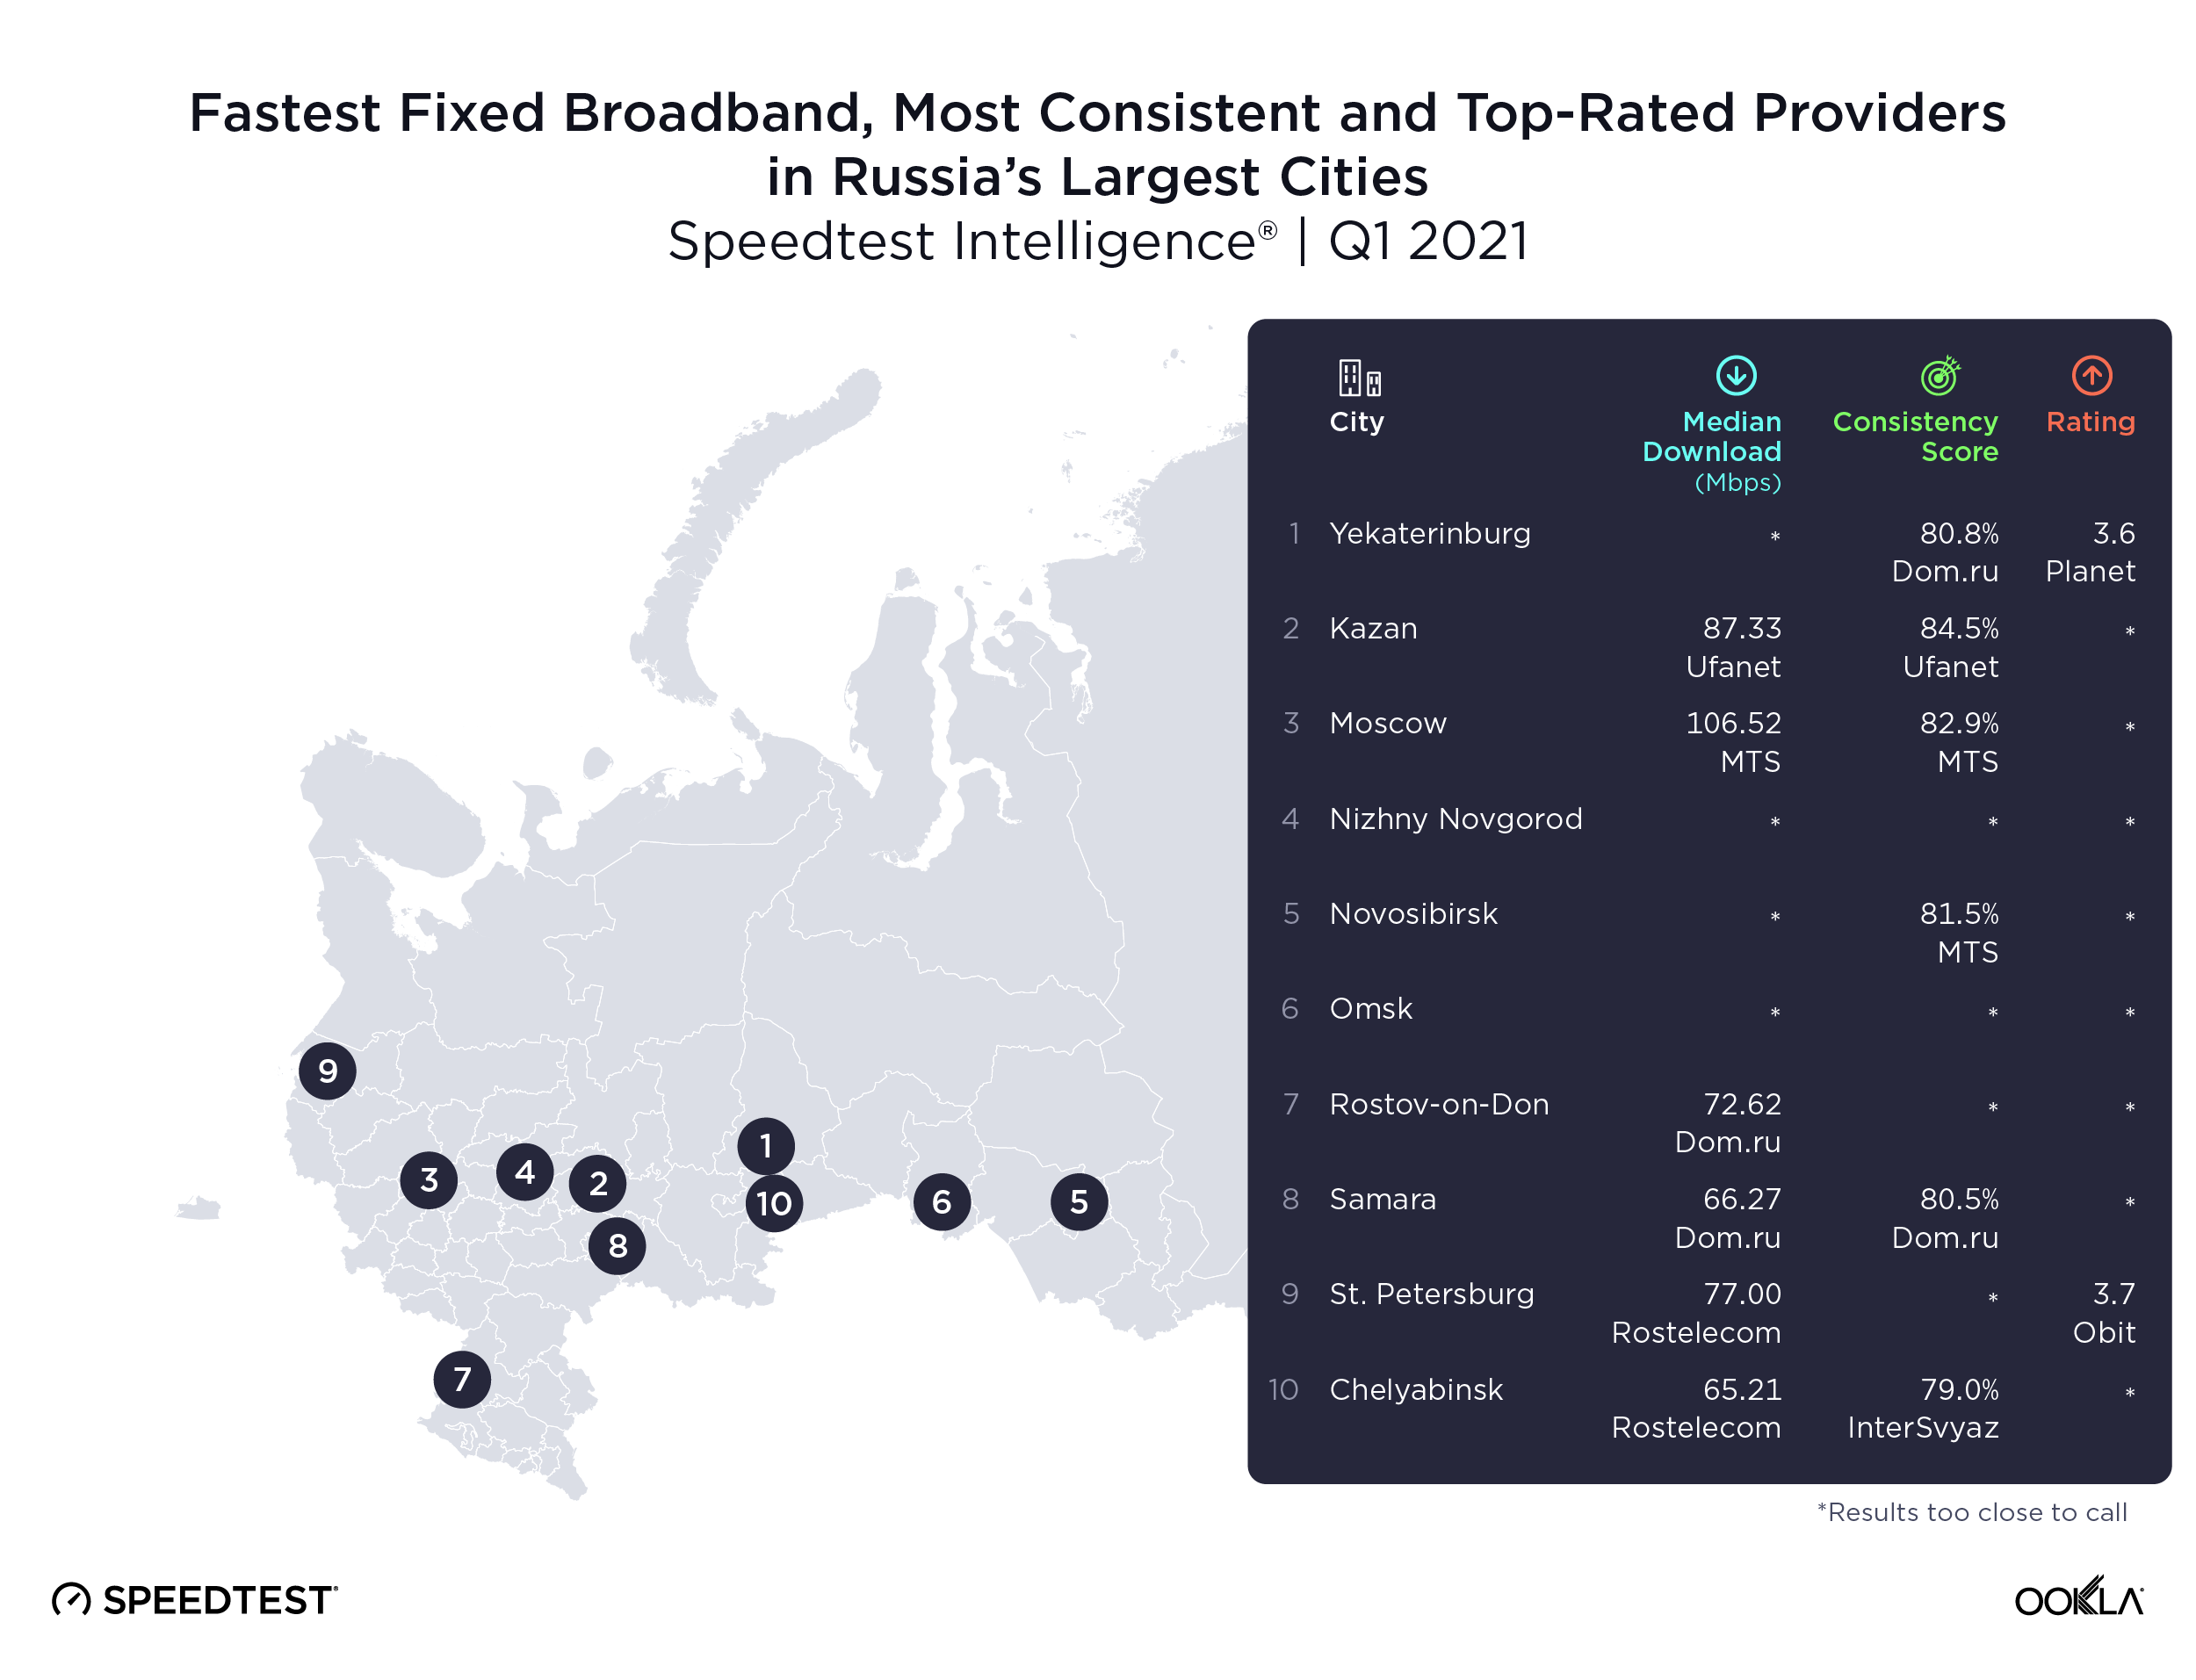
MTS was the internet service provider with the fastest median download speed in Moscow during Q1 2021 at 106.52 Mbps. Rostelecom was the fastest provider in Chelyabinsk (65.21 Mbps) and St. Petersburg (77.00 Mbps). Ufanet was the fastest provider in Kazan (87.33 Mbps) and Dom.ru was fastest in Rostov-on-Don (72.62 Mbps) and Samara (66.27 Mbps). Performance was too close to call a fastest provider in Nizhny Novgorod, Novosibirsk, Omsk and Yekaterinburg.

The provider with the highest Consistency Score — the percentage of a provider’s data samples that meet a 25 Mbps minimum download speed and 3 Mbps minimum upload speed — also varied across the largest Russian cities. MTS had the highest Consistency Score in Moscow (82.9%) and Novosibirsk (81.5%). Dom.ru had the highest Consistency Score in Samara (80.5%) and Yekaterinburg (80.8%). InterSvayz led the way in Consistency Score for Chelyabinsk (79.0%), while Ufanet had the highest Consistency Score in Kazan (84.5%).

We also used Consumer Sentiment data to analyze how users perceive their internet service providers. This data shows how consumers rated operators in each city on a 5-star scale. In St. Petersburg, Obit received the highest rating with 3.7 stars, while in Yekaterinburg, Planet received a rating of 3.6 stars. In Chelyabinsk, Moscow, Novosibirsk and Omsk there were no statistical winners for ratings, however the providers with ratings on the higher end were as follows: Dom.ru (3.3 stars) and InterSvyaz (3.2 stars) in Chelyabinsk; MTS (3.4 stars and WiFire (3.4 stars) in Moscow; Novotelecom (3.3 stars) and SiberiaNet (3.3 stars) in Novosibirsk; and Dom.ru (3.0 stars) and Omsk Cable Net (3.0 stars) in Omsk. We have not reported ratings data from Kazan, Nizhny Novgorod, Rostov-on-Don or Samara because there were too few samples in those cities.

We’ll continue to follow Russia’s fixed broadband performance and consumer sentiment data to see how performance and satisfaction change over time. If you’d like to learn more about internet speeds in Russia and other markets around the world, click here to read more insights from Ookla®.


Анализ скорости фиксированного широкополосного доступа в Интернет в России

Скорость фиксированного широкополосного доступа в России растет: за последний год скорость загрузки увеличилась на 36,9%. По состоянию на апрель 2021 года страна занимает 51 место по скорости фиксированного широкополосного доступа согласно данным Speedtest Global Index™. Скорость Интернета в России значительно отличается в зависимости от области и города с явной тенденцией к снижению в менее населенных районах. В этой статье исследуется состояние скорости фиксированного широкополосного доступа в Интернет в России, в том числе анализируются данные о скорости Интернета, стабильности и настроениях потребителей в отношении провайдеров.

МТС лидирует по показателям фиксированного широкополосного доступа в Интернет в России

ookla_speedtest_fixed_speeds_russia_0621_ru

В I квартале 2021 года скорость загрузки у российских провайдеров значительно различалась, при этом МТС показала самые высокие медианные скорости загрузки и передачи — 71,97 Мбит/с и 79,13 Мбит/с соответственно. Таким образом, скорость МТС оказалась выше, чем у «Дом.ру», чья медианная скорость загрузки составила 66,52 Мбит/с, а передачи — 73,70 Мбит/с. Следующей была компания «Билайн» со средней скоростью загрузки 57,29 Мбит/с и средней скоростью передачи 65,18 Мбит/с. Двумя самыми медленными провайдерами в России оказались «Ростелеком» и ТТК со скоростью загрузки 50,11 Мбит/с и 45,52 Мбит/с, а скоростью передачи — 55,17 Мбит/с и 54,36 Мбит/с соответственно.

Данные Speedtest Consumer Sentiment™ предоставляют подробные сведения об удовлетворенности клиентов с течением времени, а также сравнительный анализ конкурентов, за счет данных об общей удовлетворенности клиентов своими сетевыми провайдерами (по пятибалльной шкале). Этот набор данных, собранных в ходе опросов, состоящих из одного вопроса, задаваемого пользователям в конце Speedtest. Компания «Дом.ру» получила наивысший рейтинг за І квартал 2021 года — 3,3 балла, на втором месте МТС — 3,0 балла. «Билайн», «Ростелеком» и ТТК оказались в пределах 0,1 балла друг от друга с результатами 2,9, 2,8 и 2,8 баллов по пятибалльной шкале соответственно. Хотя среди провайдеров услуг связи не было статистического победителя по наиболее стабильной работе, компания «Дом.ру» получила оценку 79,6%, МТС —78,8%, «Билайн» — 77,1%, ТТК — 70,7%, а «Ростелеком» — 67,8%.

Самая высокая медианная скорость загрузки была в Новосибирской области, а самая низкая — в Магаданской области составляла на 45,4% меньше

ookla_fixed_broadband_russia_oblast_map_0621b_ru

В I квартале 2021 года медианные скорости фиксированного широкополосного доступа широко варьировались между областями, при этом медианная скорость загрузки составляла от 33,25 Мбит/с до 60,93 Мбит/с. В Новосибирской области наблюдалась самая высокая медианная скорость загрузки — 60,93 Мбит/с. Мурманская, Кемеровская и Томская области продемонстрировали близкие результаты со скоростями загрузки 59,32 Мбит/с, 59,31 Мбит/с и 59,01 Мбит/с соответственно. Медианная скорость загрузки в Челябинской области составила 58,61 Мбит/с, в Брянской — 57,80 Мбит/с, а в Липецкой — 57,38 Мбит/с. На восьмом, девятом и десятом местах оказались Свердловская область со скоростью 55,59 Мбит/с, Нижегородская область со скоростью 53,41 Мбит/с и Тульская область со скоростью 52,70 Мбит/с.

Самой медленный результат продемонстрировала Магаданская область со скоростью загрузки 33,25 Мбит/с за I квартал 2021 года, что на 45,4% ниже, чем в Новосибирской области. В Костромской, Белгородской, Псковской и Новгородской областях скорости загрузки составили 36,05 Мбит/с, 36,77 Мбит/с, 36,85 Мбит/с и 39,43 Мбит/с соответственно. Архангельская область оказалась шестой среди самых медленных областей со скоростью загрузки 44,11 Мбит/с. За ней следуют Амурская область со скоростью 44,94 Мбит/с и Калининградская область со скоростью 45,31 Мбит/с. Результаты Пензенской, Курганской и Ленинградской областях варьировались в пределах 0,14 Мбит/с со скоростью загрузки 46,00 Мбит/с, 46,10 Мбит/с и 46,14 Мбит/с соответственно.

В I квартале 2021 года самый быстрый фиксированный широкополосный доступ в Интернет наблюдался в Москве

ookla_fixed_broadband_speeds_russia_cities_0621_ru-1

Изучив 10 самых густонаселенных городов России, мы обнаружили, что в I квартале 2021 года у Москвы была самая высокая медианная скорость загрузки —70,65 Мбит/с. Различие результатов Екатеринбурга, Санкт-Петербурга и Новосибирска находилось в пределах 1 Мбит/с со средней скоростью загрузки 61,06 Мбит/с, 60,83 Мбит/с и 60,81 Мбит/с соответственно. Медианная скорость загрузки в Нижнем Новгороде составляла 58,80 Мбит/с, а в Челябинске — 58,37 Мбит/с. Три города с самой низкой скоростью загрузки: Ростов-на-Дону, Казань и Самара имеют показатели 53,38 Мбит/с, 52,58 Мбит/с и 51,33 Мбит/с соответственно. Скорость загрузки в Москве составляла на 37,6% выше, чем в Самаре.

Рейтинг городов по скоростям фиксированной широкополосной передачи был в некоторой степени похож на то, что мы наблюдали для скоростей загрузки, причем Москва снова оказалась самой быстрой со скоростью передачи 72,62 Мбит/с. Новосибирск продемонстрировал второй результат по скорости передачи — 70,80 Мбит/с. Результаты Челябинска и Нижнего Новгорода различались на 0,2 Мбит/с при скорости передачи 67,97 Мбит/с и 67,82 Мбит/с соответственно. В Екатеринбурге скорость составляла 65,30 Мбит/с, а в Омске — 63,50 Мбит/с. Санкт-Петербург оказался на седьмом месте со скоростью 62,77 Мбит/с, на восьмом — Ростов-на-Дону со скоростью 60,91 Мбит/с, затем Самара — 56,55 Мбит/с и на последнем месте Казань — 56,28 Мбит/с.

Самый быстрый и стабильный провайдер зависит от города

ookla_fixed_broadband_russia_provider_0621_ru-2

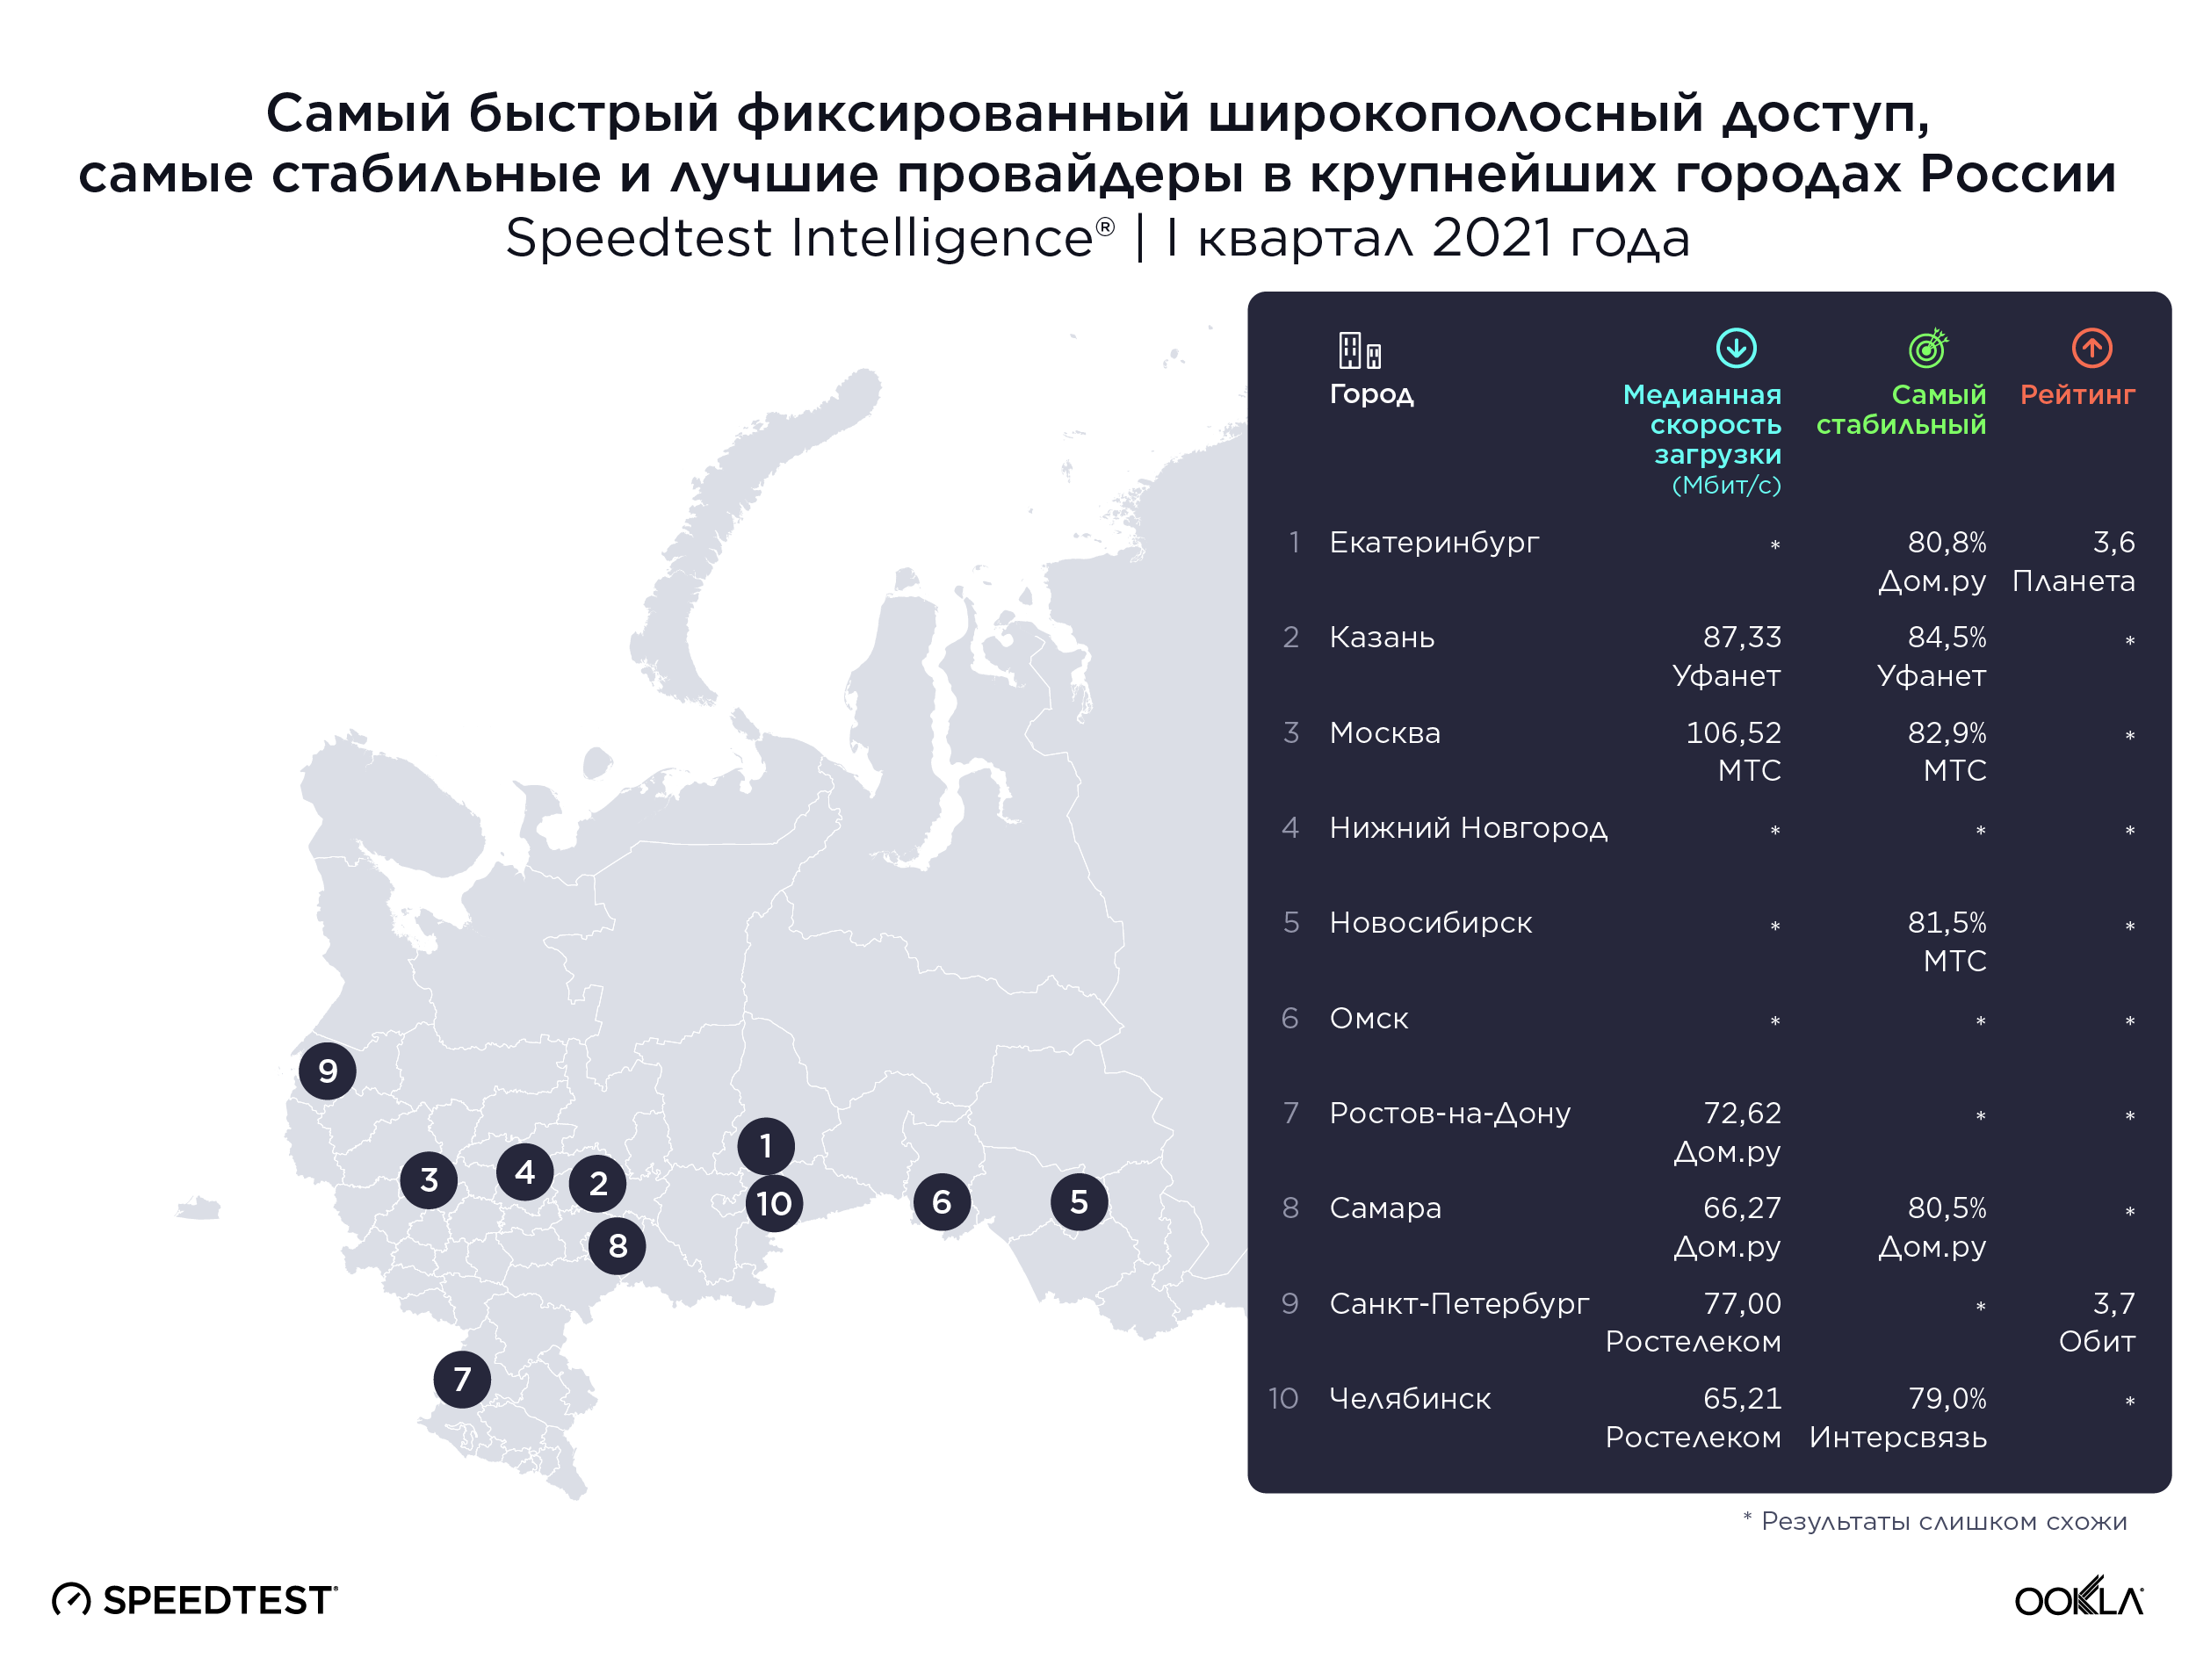
Провайдер с самым высоким показателем стабильности — процент выборок данных провайдера, отвечающих минимальной скорости загрузки 25 Мбит/с и минимальной скорости передачи 3 Мбит/с, также варьировался в крупнейших городах России. У МТС самый высокий показатель стабильности в Москве (82,9%) и Новосибирске (81,5%). Наивысший показатель стабильности «Дом.ру» был в Самаре (80,5%) и Екатеринбурге (80,8%). «Интерсвязь» лидирует по показателю стабильности в Челябинске (79,0%), в то время как «Уфанет» имеет самый высокий показатель стабильности в Казани (84,5%).

Мы также использовали данные о настроениях потребителей, чтобы проанализировать, как пользователи воспринимают своих интернет-провайдеров. Эти данные показывают, как потребители оценили операторов в каждом городе по пятибалльной шкале. В Санкт-Петербурге наивысший рейтинг получила компания «Обит» — 3,7 балла, а в Екатеринбурге «Планета» — 3,6 балла. В Челябинске, Москве, Новосибирске и Омске не было статистических победителей рейтингов, однако провайдеры с более высоким рейтингом были следующими: «Дом.ру» (3,3 балла) и «Интерсвязь» (3,2 балла) в Челябинске; МТС (3,4 балла) и WiFire (3,4 балла) в Москве; «Новотелеком» (3,3 балла) и SiberiaNet (3,3 балла) в Новосибирске; а также «Дом.ру» (3,0 балла) и «Омские кабельные сети» (3,0 балла) в Омске. Мы не представили данные рейтингов из Казани, Нижнего Новгорода, Ростова-на-Дону и Самары, поскольку в этих городах было слишком мало выборок.

Мы продолжим следить за показателями скорости фиксированного широкополосного доступа в Интернет в России и настроениями потребителей, чтобы увидеть, как скорость и удовлетворенность меняются с течением времени. Если вы хотите узнать больше о скорости Интернета в России и на других рынках по всему миру, нажмите [здесь] (/insights/blog/), чтобы получить больше информации от Ookla.

Ookla retains ownership of this article including all of the intellectual property rights, data, content graphs and analysis. This article may not be quoted, reproduced, distributed or published for any commercial purpose without prior consent. Members of the press and others using the findings in this article for non-commercial purposes are welcome to publicly share and link to report information with attribution to Ookla.

| December 6, 2021

Ookla Video Analytics Reveals the State of Global Video Experience


Video is essential to today’s internet across the world. We use it to watch shows and movies, stream live events and even keep up to date on our favorite cats on social media. Ookla® launched video testing in the Speedtest® app for iOS and Android earlier this year so consumers can measure the quality of their video experience. Already, millions of video tests have been initiated by consumers. Today we’re sharing some of that data to provide insight into video experience around the world, specifically, we’ve analyzed adaptive start time and highest overall video resolution over all mobile technologies, 5G and fixed broadband in select countries during Q3 2021.

Switzerland had the fastest adaptive start time for all mobile technologies, South Africa fastest for 5G

Video streaming services use adaptive bitrate technology

All modern video streaming platforms use adaptive bitrate technology to automatically adjust video quality based on network conditions and device capabilities in order to display the highest quality video that a device can support, while minimizing buffering and slow video start time. Speedtest Video Analytics provides deep insights and competitive benchmarking for device and network video streaming capabilities.

Adaptive start time — the time it takes for adaptive bitrate playback to initiate — allows us to see how quickly videos are loading. A 2012 study found that users will leave a video if it doesn’t begin playing within two seconds. We have to imagine in 2021, that timeframe is being squeezed even further. Our analysis shows how countries are performing against this important benchmark.

ookla_adaptive-start-time_all-mobile-tech_1121-01-3

Speedtest Intelligence® reveals that Switzerland had the fastest median adaptive start time for all mobile technologies combined among the countries we analyzed at 1.02 seconds during Q3 2021. South Korea and Norway were close behind at 1.07 seconds and 1.10 seconds, respectively. Five more countries achieved a median adaptive start time at or under 1.25 seconds during Q3 2021, including Hong Kong (SAR) and Croatia (1.17 seconds), Portugal (1.24 seconds), and Kuwait and Mexico (1.25 seconds). All but three of the remaining countries we surveyed achieved a median adaptive start time between 1.25 seconds and 2.00 seconds during Q3 2021 except Colombia (2.11 seconds), Saudi Arabia (2.12 seconds) and India (2.13 seconds).

Most 5G-capable video tests showed blazing fast adaptive start times

ookla_adaptive-start-time_5g_1121-01

We’ve seen median 5G download speeds zoom ahead of traditional mobile technologies, even reaching median download speeds 10 times faster than on 4G LTE. It’s no surprise Video Analytics revealed adaptive start time was often much faster on 5G than on all mobile technologies combined. Five countries achieved median adaptive start times faster than 1.00 second during Q3 2021: South Africa (0.73 seconds), Switzerland (0.79 seconds), Norway (0.82 seconds), Hong Kong (0.86 seconds) and South Korea (0.90 seconds). Video Analytics shows the only countries with a median 5G adaptive start time slower than 1.25 seconds were the United States (1.27 seconds), Brazil (1.42 seconds) and Saudi Arabia (1.94 seconds).

Five countries’ adaptive start time improved more than 0.25 seconds on 5G compared to all technologies combined during Q3 2021: the Philippines (-0.62 seconds), South Africa (-0.53 seconds), Brazil (-0.39 seconds), Hong Kong (-0.31 seconds) and Norway (-0.29 seconds). However, several countries showed a less than 0.20 second improvement when comparing adaptive start rate on 5G to that on all technologies combined during Q3 2021: the U.S. (-0.14 seconds), Bahrain (-0.16 seconds), South Korea and Saudi Arabia (-0.17 seconds), and the United Kingdom (U.K.) and France (-0.18 seconds).

Adaptive start time is not always faster on fixed broadband

ookla_adaptive-start-time_fixed_1121-01-1

Speedtest Intelligence showed a narrower range for adaptive start time on fixed broadband than on 5G with every country on our list achieving between 0.67 and 1.85 seconds during Q3 2021. Ten countries on our list achieved a median adaptive start time faster than 1.00 second during Q3 2021: South Korea (0.67 seconds), Norway (0.74 seconds), Hong Kong (0.75 seconds), Switzerland (0.76 seconds), the U.K. (0.79 seconds), France (0.86 seconds), the U.S. (0.87 seconds), Spain (0.88 seconds), Portugal (0.89 seconds) and Italy (0.98 seconds).

Twenty out of the 24 countries we surveyed had a median fixed broadband adaptive start time faster than 1.50 seconds during Q3 2021. Colombia (1.50 seconds), Egypt (1.59 seconds), Turkey (1.64 seconds) and Saudi Arabia (1.85 seconds) were the only countries with a median adaptive start time slower than 1.50 seconds on fixed broadband during Q3 2021.

South Korea video tests reached 4K resolutions at the highest proportion on mobile and fixed broadband

Video resolution is incredibly important in the experience of streaming video and the higher the resolution, the more definition and clarity we are able to see. These days, the difference between an SD and 4K experience is gigantic. Resolution is measured in the numbers of pixels in a 16:9 ratio, with 2160 pixel height representing a 4K picture. Video Analytics measures the resolution rates, which represent the portion of samples that reach a particular resolution. In this analysis, we evaluated the resolution rates for 4K, typically the highest resolution users will need.

ookla_highest-video-resolution_all-mobile-tech_1121-01

Using Speedtest Intelligence, we found South Korea and Switzerland had the highest overall successful resolution rates for all mobile technologies combined during Q3 2021, reaching 4K resolutions 80.4% and 80.3% of the time, respectively. Croatia (79.7%), Kuwait (77.4%) and Norway (75.4%) were the only other countries on our list that achieved 4K video resolution more than 75.0% of the time. Only seven countries on our list did not reach a 4K resolution at least 50% of the time on all mobile technologies combined: the Philippines (38.4%), India (41.1%), Indonesia (44.8%), Colombia (45.3%), Mexico (46.3%), Russia (49.7%) and Egypt (49.9%).

5G led to higher video resolution, but 4K mobile devices still remain rare

ookla_highest-video-resolution_5g_1121-01

5G provided a higher resolution for mobile devices during Q3 2021 than all technologies combined. Every country we surveyed reached a 4K resolution over 80.0% of the time over 5G. In fact, six out of the 14 countries we surveyed for 5G achieved a 4K resolution more than 90.0% of the time, including South Korea (95.9%), Norway (94.5%), Kuwait (94.0%), South Africa (93.6%), Switzerland (92.6%) and France (91.5%). On the lower end of our list, only Italy (81.9%), Brazil (83.9%) and the U.S. (83.9%) achieved 4K resolutions less than 85.0% of the time.

While this is great news for the future of mobile devices, 4K resolutions in mobile devices still aren’t common: Sony is the only popular device manufacturer producing 4K mobile devices. In the meantime, users who can connect to 5G through either a hot spot or fixed wireless access (FWA) will reap the benefits of being able to stream on 4K devices like computers, televisions or tablets.

South Korean fixed broadband delivers ultra-high definition resolutions

ookla_highest-video-resolution_fixed_1121-01

Speedtest Intelligence reveals South Korea had the highest fixed broadband 4K resolution rate among countries surveyed at 92.2% during Q3 2021. Other countries that achieved 4K resolution rates above 85.0% on fixed broadband during Q3 2021 included: Switzerland (89.4%), Hong Kong (87.6%), Norway (87.1%) and the U.S. (86.7%). Every other country in our analysis achieved 4K resolution rates between 65.0% and 85.0%, except Egypt (49.5%), Indonesia (52.5%), the Philippines (64.2%) and Turkey (64.3%).

Video Analytics gives you the information you need about your video playback

We’re excited to share more about video performance and quality of experience using Video Analytics in the coming months. In the meantime, if you want to learn more about Video Analytics and how it can help you benchmark and improve your network, please join our upcoming webinar, December 9 by clicking here.

Ookla retains ownership of this article including all of the intellectual property rights, data, content graphs and analysis. This article may not be quoted, reproduced, distributed or published for any commercial purpose without prior consent. Members of the press and others using the findings in this article for non-commercial purposes are welcome to publicly share and link to report information with attribution to Ookla.

| March 14, 2019

Ditch the Lag: Cities with Great Gaming Culture and Low Ping

Yes, you can game from anywhere with an internet connection. But if you’re at all competitive, it’s nice to play from somewhere with low ping and fast internet speeds. Plus when you need to leave the house, it’s extra nice to know you’re also surrounded by gamer culture. We’ve examined February 2019 Speedtest results in 35 cities that are known for their esports events, gaming conferences, game companies and more to find out who has the advantage and ranked them based on their ping.

The top contenders

Eleven_Gaming_Cities_0219

First place Bucharest, Romania is home to super-low ping, a lightning fast download speed and a thriving gaming culture. From Bucharest Gaming Week (which includes the CS:GO Southeast Europe Championship and the FIFA National Tournament) to their numerous local game studios, Bucharest is a great place to be a gamer whether you’re online or out and about.

The next five gaming cities with the lowest pings are all in Asia. Hangzhou, China comes in second overall with a fast ping and world-class download speeds. This city is so devoted to its gamers that it opened a $280 million gaming “city” in 2018 and plans 14 new esports arenas before 2022. Coming in third, Chengdu, China has an equally low ping to our first two contenders and serves as one of two host locations in China for the Global Mobile Game Confederation (GMGC). Both Hangzhou and Chengdu are also franchise holders in the Overwatch League, giving local gaming fans something to cheer about. Fourth place Singapore, host of the 5th Annual GameStart Convention in October 2018, had only a slightly slower ping than the first four cities and the fastest download speed of any of the cities we considered.

South Korea is home to the fifth and sixth best cities for gamers. A satellite city of Seoul, Seongnam-si boasts the Pangyo Techno Valley (a.k.a. the Silicon Valley of Korea) and numerous game development companies. Perfect for a city with a 9 ms ping. Though Incheon’s ping was a little slower at 12 ms, gamers there can console themselves with the city’s gamer cred — the 2018 League of Legends World Championship was held in Incheon’s Munhak Stadium.

Coming in at number seven, Budapest, Hungary is an emerging game city, having hosted its first big esports event (the V4 Future Sports Festival) in 2018, but a 12 ms ping makes them a strong contender. More established Malmö, Sweden is number eight with a slightly slower average download speed but the city is headquarters to Massive Entertainment, creators of Tom Clancy’s The Division series, Far Cry 3, Assassin’s Creed: Revelations and many more.

Vancouver, Canada, North America’s only qualifier for the top gaming cities list, comes in at number nine with a 12 ms ping and many gaming companies including the Canadian arms of Nintendo of Canada and EA (Electronic Arts). We included both Shanghai, China and Moscow, Russia on the top gamer cities list as both had a 12 ms ping as well, though the internet speeds in Shanghai are superior. Shanghai will also host the International Dota 2 in 2019 while Moscow is known for Epicenter.

The rest of the pack

Notably absent from the list above is most of the western hemisphere. Cities in North America were held back by their high pings. Cities in South America suffered from high pings and also slow internet speeds — something that esports leagues have complained is a barrier to investment.

Our full list of gaming cities provides wider geographical representation, even if the internet performance is not always as stellar. You’ll find Los Angeles in 27th place, behind Seattle, Boston and Las Vegas. And São Paulo, Brazil has the best showing in Latin America at 23rd.

Internet Performance in 35 Cities with a Gaming Culture
Speedtest Results | February 2019
City Ping (ms) Mean Download (Mbps) Mean Upload (Mbps)
Bucharest, Romania 8 172.13 126.57
Hangzhou, China 8 125.93 29.54
Chengdu, China 8 101.92 33.80
Singapore 9 196.43 200.08
Seongnam-si, South Korea 9 155.25 114.83
Incheon, South Korea 12 139.84 102.91
Budapest, Hungary 12 132.72 54.46
Malmö, Sweden 12 126.28 105.67
Vancouver, Canada 12 117.55 50.23
Shanghai, China 12 75.14 30.06
Moscow, Russia 12 64.56 63.59
Oslo, Norway 13 115.46 69.03
Hong Kong, Hong Kong (SAR) 14 167.59 161.14
Zürich, Switzerland 14 144.36 109.39
Seattle, United States 15 138.50 79.88
Stockholm, Sweden 15 134.16 93.83
Auckland, New Zealand 15 92.05 53.30
Toronto, Canada 16 134.75 67.42
Boston, United States 17 152.42 60.87
Las Vegas, United States 17 141.69 41.22
Chennai, India 17 48.40 42.93
Cologne, Germany 18 63.77 18.36
São Paulo, Brazil 18 46.43 21.57
Jakarta, Indonesia 18 17.88 10.21
Mumbai, India 19 23.40 19.26
Paris, France 20 161.04 93.68
Los Angeles, United States 20 121.00 23.57
London, United Kingdom 20 63.58 23.18
Rio de Janeiro, Brazil 20 36.50 13.33
Buenos Aires, Argentina 21 34.31 6.40
Katowice, Poland 22 83.99 20.91
Mexico City, Mexico 25 37.66 15.39
Sydney, Australia 25 34.20 9.61
Santiago, Chile 26 56.13 18.49
Tokyo, Japan 28 99.24 101.90

Of course, die-hard gamers will know that a low ping in your city won’t necessarily save you if you’re playing on a distant server.

What’s the ping like in your city? Take a Speedtest and see if your connection is hurting your gameplay.

Ookla retains ownership of this article including all of the intellectual property rights, data, content graphs and analysis. This article may not be quoted, reproduced, distributed or published for any commercial purpose without prior consent. Members of the press and others using the findings in this article for non-commercial purposes are welcome to publicly share and link to report information with attribution to Ookla.

| June 28, 2017

Seeking Out the Fastest Free Wi-Fi at European Airports

If Europe is on your travel itinerary this summer, you probably want to know which airports offer free Wi-Fi and whether the service is fast enough for you to handle all of life’s last minute details before jetting across the continent. We took a look at Speedtest data from March through May 2017 from twelve of Europe’s busiest airports to help you find out.

Fastest airport Wi-Fi

It’s a good thing many airports in Europe offer paid Wi-Fi options if you want better speeds, because speeds on the free Wi-Fi everywhere besides Moscow and Munich are slow.

Moscow’s Sheremetyevo International Airport has the fastest free Wi-Fi in Europe, about equal to the mobile Wi-Fi country average in Russia of 27.96 Mbps, although you’ll need a Russian phone number to access the airport Wi-Fi.

Germany’s second busiest airport, Munich, comes in a close second. Both airports have even faster upload speeds than download, so you can spend your layover safely stowing those vacation pics in the cloud. Munich’s Wi-Fi is 36% slower than Germany’s average download speed over mobile Wi-Fi of 37.94 Mbps.

The rest of the airports offer speeds that are much slower than the average mobile Wi-Fi speeds in their respective countries: Spain (42.72 Mbps), the UK (41.98 Mbps), Italy (21.02 Mbps), and the Netherlands (57.07 Mbps).

For comparison, Hong Kong’s International Airport offers free Wi-Fi with an average speed of 8.93 Mbps while the three largest airports in mainland China offer service ranging from 2.40 to 3.72 Mbps. Those are the slowest airports in Asia, read about the fastest.

Oddly, we saw no Speedtest results in Istanbul’s Atatürk Airport or at either of Paris’ two airports on the published free airport Wi-FI SSIDs during the time we surveyed. At both Orly and Charles de Gaulle, though, we did see networks called “*WIFI-AIRPORT”. If those are indeed the free airport Wi-Fi networks, Charles de Gaulle would rank 7th in Europe at 2.33 Mbps and Orly would rank 8th at 2.32 Mbps.

You can help us get accurate speed data for those airports by taking a Speedtest using the airport’s free Wi-Fi.

Fastest airport cell

In cases where you can’t connect to Wi-Fi, you’ll be delighted to find that cellular service in these airports is much, much faster than the Wi-Fi.

Munich Airport has the fastest average download speed on cellular with Rome’s Fiumicino Airport and Istanbul’s Atatürk Airport ranking a very close second and third, respectively. And Istanbul has the fastest average upload speed on cell networks.

In many cases, cellular service at these airports is faster than average speeds in the country as a whole. The airports in Munich, Istanbul, and Moscow are all more than twice as fast as that in their respective countries of Germany (23.05 Mbps), Turkey (29.45 Mbps) and Russia (14.92 Mbps). Cell downloads at Rome’s Fiumincino Airport are 56% faster than Italy’s average of 32.52 Mbps over the same period.

The Spanish and British airports we surveyed offer download speeds that are loosely comparable to the averages in their respective countries: Spain’s average is 28.32 Mbps and the UK’s is 25.92 Mbps. Download speed at Paris’s two airports is harder to summarize with the speed at Charles de Gaulle 27% slower than the country average of 29.08 Mbps while Orly’s downloads coming in 54% slower than the country. And Amsterdam’s Schiphol download speed is only half as fast as that in the Netherlands overall (47.38 Mbps).

If you want to know more, read our full country reports on Germany, Turkey and the United Kingdom.

Wi-Fi or cell?

Given those painful Wi-Fi speeds, this is kind of a no-brainer, but we thought you might want to see just how slow the Wi-Fi is at various airports compared to the cellular service.

We omitted data about the Istanbul and Paris airports from these graphs because we can’t verify the Wi-Fi SSIDs, but you get the point: when in doubt in Europe, use cellular service rather than free airport Wi-Fi.

Regional trends

You might be surprised how similar and how different Wi-Fi and cellular service can be at two different airports in the same country or even the same city.

Heathrow vs. Gatwick

The free Wi-Fi at Heathrow and Gatwick is similarly bad but you’ll get faster downloads at Heathrow and slightly faster uploads at Gatwick.

Charles de Gaulle vs. Orly

Wi-Fi downloads at Charles de Gaulle and Orly on the *WIFI-AIRPORT are almost exactly as awfully slow as each other. But on cellular, Charles de Gaulle has significantly faster download and upload speeds.

Barcelona Airport vs. Madrid-Barajas

Barcelona Airport’s slow 5.72 Mbps download speed over Wi-Fi is more than twice as fast as the 2.11 Mbps at Madrid–Barajas Airport. When it comes to cellular, however, Madrid’s downloads are 28% faster and their uploads are 15% faster than those in Barcelona.

Frankfurt Airport vs. Munich Airport

Munich Airport’s Wi-Fi download speed is more than three times faster than Frankfurt’s and Munich’s upload speed is nearly two and a half times faster. Munich also shows an average download speed over cellular that is 67% faster than Frankfurt’s while Munich’s uploads are 59% faster.

If your experience of internet performance at European airports is different than what’s reported here, take a Speedtest on Android or iOS so we can see what you’re experiencing. We’ll be watching for big changes and reporting on them here.

Up next in our fastest airports in the world series, we’ll be looking at internet speeds at the busiest airports in Africa.

Ookla retains ownership of this article including all of the intellectual property rights, data, content graphs and analysis. This article may not be quoted, reproduced, distributed or published for any commercial purpose without prior consent. Members of the press and others using the findings in this article for non-commercial purposes are welcome to publicly share and link to report information with attribution to Ookla.

| January 24, 2018

GOOOOAL: Which World Cup Finalist Scored the Fastest Internet in their Capital City?

Whether you call it soccer or football, everyone calls the World Cup fun. We couldn’t wait for the actual match-ups in June, so we decided to pit the qualifying countries against one another to see who has the fastest internet speeds in their capital cities. The results might surprise you.

Get ready to watch Russia best Brazil and Portugal defeat Iran; meanwhile, Argentina and Nigeria and Belgium and England are preparing for penalty shoot-outs.

Using data from Speedtest Intelligence for Q3-Q4 2017, we’ve calculated which capital cities of World Cup-qualifying countries have the fastest mobile and fixed broadband speeds. We also took a peek at the fastest carriers and internet service providers (ISPs) in each capital using Speed Score, a comprehensive metric that combines measures of internet performance at all levels.

Mobile winners

Iceland’s sixth place ranking for mobile download speed in the Speedtest Global IndexTM virtually assured that Reykjavík would come out at the top of the list of fastest World Cup contenders. Canberra represents Australia well with a second place finish for mobile download speeds among World Cup capitals. And Brussels, Belgium barely surpasses Bern, Switzerland for a third place finish.

Mobile Internet Speeds
Capitals of World Cup Qualifying Countries | Q3 – Q4 2017
Country Capital City Average Download (Mbps) Average Upload (Mbps)
Iceland Reykjavík 55.49 21.53
Australia Canberra 44.24 12.60
Belgium Brussels 42.52 16.74
Switzerland Bern 42.02 17.52
South Korea Seoul 41.85 14.15
Denmark Copenhagen 41.78 18.29
Croatia Zagreb 41.16 16.40
Sweden Stockholm 40.12 12.63
Spain Madrid 38.30 14.02
Portugal Lisbon 30.60 11.39
Serbia Belgrade 30.33 12.49
France Paris 29.03 9.26
Poland Warsaw 26.94 9.84
Germany Berlin 25.83 9.51
England London 25.09 11.49
Russia Moscow 21.89 8.49
Japan Tokyo 19.89 7.10
Uruguay Montevideo 19.82 11.49
Mexico Mexico City 19.11 11.51
Peru Lima 18.33 12.90
Tunisia Tunis 18.27 8.07
Brazil Brasília 18.00 8.64
Morocco Rabat 17.32 9.76
Colombia Bogotá 16.87 9.50
Nigeria Abuja 16.17 6.76
Iran Tehran 15.05 7.04
Argentina Buenos Aires 13.77 7.70
Egypt Cairo 13.15 6.33
Panama Panama City 12.89 8.45
Saudi Arabia Riyadh 12.28 8.88
Senegal Dakar 8.85 3.81
Costa Rica San José 5.97 3.33

Looking at the group draw, Group A fares the worst with 16th place Moscow, Russia being the capital city with the fastest mobile downloads in the group. In Group B, Spain comes out on top. Australia wins Group C, Iceland takes Group D, Switzerland leads Group E and South Korea has the fastest mobile download speed in Group F. Belgium finishes first in Group G and Poland prevails in Group H, despite a 13th place finish overall.

From a regional perspective, European capitals top the rankings with all 14 European World Cup capitals sitting in the top half of the list. Latin American, Middle Eastern and African cities fare worst. Asia’s two contenders are split with Seoul boasting the fifth fastest mobile download speed among World Cup capitals and Tokyo, Japan coming in 17th.

The fastest World Cup capital in Latin America (Montevideo, Uruguay) shows a 64.3% slower mobile download speed than Reykjavík. First place among African World Cup capitals, Rabat, Morocco is 68.8% slower than Reykjavík for mobile downloads. And Tehran, Iran, the fastest World Cup capital in the Middle East, is 72.9% slower than Reykjavík.

Fastest carriers

We also looked into which carriers were fastest in each of the 32 World Cup capital cities.

With Speed Scores ranging from 8.89 in Dakar, Senegal to 46.57 in Brussels, mobile carrier Orange was fastest in four cities and tied for fastest in one. Vodafone was fastest in both Lisbon, Portugal and Madrid, Spain with comparable Speed Scores in the two locations. The rest of the cities show the diversity of fastest carriers that you might expect from a worldwide competition.

Fastest Carriers Speeds
Capitals of World Cup Qualifying Countries | Q3 – Q4 2017
Country Capital City Fastest Carrier Speed Score
Argentina Buenos Aires Personal 16.15
Australia Canberra Telstra 50.21
Belgium Brussels Orange 46.57
Brazil Brasília Claro 24.72
Colombia Bogotá Avantel 20.93
Costa Rica San José ICE 8.30
Croatia Zagreb Hrvatski Telekom 49.35
Denmark Copenhagen TDC / Telia 45.34 / 45.09
Egypt Cairo Orange 16.50
England London EE 36.83
France Paris Orange 33.15
Germany Berlin Telekom 53.54
Iceland Reykjavík Nova 64.61
Iran Tehran MTN IranCell 15.89
Japan Tokyo SoftBank 27.26
Mexico Mexico City AT&T 20.26
Morocco Rabat inwi 20.51
Nigeria Abuja MTN 29.23
Panama Panama City Cable & Wireless Panama / Movistar 14.85 / 14.80
Peru Lima Entel Peru 20.73
Poland Warsaw T-Mobile 36.07
Portugal Lisbon Vodafone 42.44
Russia Moscow MegaFon 37.06
Saudi Arabia Riyadh Zain 13.20
Senegal Dakar Orange 8.89
Serbia Belgrade Vip mobile 45.56
South Korea Seoul LG U+ 50.03
Spain Madrid Vodafone 40.17
Sweden Stockholm Telia 54.49
Switzerland Bern Sunrise / Swisscom 42.14 / 41.91
Tunisia Tunis Ooredoo / Orange 19.90 / 19.89
Uruguay Montevideo Antel 20.35

Fixed broadband winners

Given that Iceland ranks second in the world for fixed broadband download speed on the Speedtest Global Index and has the world’s highest gigabit user penetration (GUP), we’re not surprised to see Reykjavík shut out the competition by coming out on top of World Cup contenders for fixed broadband speed, too. Seoul, South Korea comes in second for fixed broadband download speed among World Cup capitals and Paris, France takes third.

Fixed Broadband Internet Speeds
Capitals of World Cup Qualifying Countries | Q3 – Q4 2017
Country Capital City Average Download (Mbps) Average Upload (Mbps)
Iceland Reykjavík 142.89 154.28
South Korea Seoul 130.75 131.96
France Paris 112.58 55.86
Sweden Stockholm 98.77 66.68
Spain Madrid 86.59 73.43
Japan Tokyo 75.88 70.46
Denmark Copenhagen 72.74 52.13
Switzerland Bern 68.82 54.44
Poland Warsaw 62.57 16.19
Portugal Lisbon 55.80 30.97
England London 52.53 16.12
Germany Berlin 46.84 9.52
Russia Moscow 45.25 42.96
Belgium Brussels 43.25 9.63
Panama Panama City 29.11 5.93
Australia Canberra 28.85 12.46
Serbia Belgrade 26.45 5.59
Croatia Zagreb 26.20 11.40
Mexico Mexico City 24.11 10.14
Uruguay Montevideo 23.02 5.82
Argentina Buenos Aires 22.03 4.26
Brazil Brasília 21.57 5.29
Saudi Arabia Riyadh 20.93 9.05
Peru Lima 18.15 3.51
Colombia Bogotá 13.43 6.48
Morocco Rabat 11.83 2.51
Iran Tehran 9.33 4.18
Costa Rica San José 8.79 4.29
Nigeria Abuja 8.07 5.27
Tunisia Tunis 7.82 4.49
Senegal Dakar 7.42 3.11
Egypt Cairo 5.61 1.92

Group A again suffers on the fixed side with leader Russia coming in 13th based on Moscow’s fixed broadband download speed. Spain’s still the front-runner of Group B. France takes Group C, Iceland wins Group D, Switzerland tops Group E, South Korea reigns over Group F, England heads up Group G and Japan starts Group H based on average download speeds over fixed broadband in their respective capitals.

European capitals again fare well, with 12 of the 14 placing in the top half of fastest World Cup capitals for fixed broadband download speed. Belgrade, Serbia and Zagreb, Croatia rank 17th and 18th, respectively. Tokyo ranks much better for fixed broadband download speed than for mobile, which puts both Asian World Cup capitals in the top six.

With the exception of Panama City, Panama, which ranks 15th, all Latin American World Cup capitals are in the bottom half of the list for download speed over fixed broadband. As are all Middle Eastern and African capital cities.

Panama City’s fixed broadband download speed is 79.6% slower than Reykjavík’s. Riyadh, Saudia Arabia boasts the title of fastest World Cup capital in the Middle East, but is still 85.4% slower for fixed broadband downloads than Reykjavík. The fastest World Cup capital in Africa — Rabat, Morocco — is 91.7% slower than Reykjavík.

Fastest providers

Comparing Speed Scores for fixed broadband across World Cup capitals, Vodafone had wins in Berlin, Germany and Lisbon and Orange took Paris and tied for first in Madrid. The rest of the fastest ISPs vary by location as listed below:

Fastest ISPs Speeds
Capitals of World Cup Qualifying Countries | Q3 – Q4 2017
Country Capital City Fastest ISP Speed Score
Argentina Buenos Aires Cablevisión Fibertel 21.72
Australia Canberra iiNet 33.23
Belgium Brussels Telenet 66.95
Brazil Brasília NET Virtua 27.30
Colombia Bogotá ETB 19.17
Costa Rica San José Cabletica 8.28
Croatia Zagreb vip 30.23
Denmark Copenhagen Fiberby 103.26
Egypt Cairo TE Data 4.84
England London Hyperoptic 117.40
France Paris Orange 107.20
Germany Berlin Vodafone 55.46
Iceland Reykjavík Nova 278.06
Iran Tehran Mobin Net 11.74
Japan Tokyo So-net 118.05
Mexico Mexico City Axtel 45.83
Morocco Rabat Maroc Telecom 9.25
Nigeria Abuja MTN 10.73
Panama Panama City Cable Onda 25.08
Peru Lima Movistar 16.64
Poland Warsaw UPC 82.72
Portugal Lisbon Vodafone 61.80
Russia Moscow MGTS 62.00
Saudi Arabia Riyadh STC 16.46
Senegal Dakar Tigo 6.42
Serbia Belgrade SBB 34.60
South Korea Seoul KT 162.45
Spain Madrid Masmovil / Orange 101.52 / 101.34
Sweden Stockholm Ownit 158.78
Switzerland Bern Fiber7 241.93
Tunisia Tunis TOPNET 7.61
Uruguay Montevideo Antel 22.01

Did your team not come out as expected? Or are you defending a tight match? Take a Speedtest on Android, iOS or on the web and we’ll check back in on scores closer to the main event.

Ookla retains ownership of this article including all of the intellectual property rights, data, content graphs and analysis. This article may not be quoted, reproduced, distributed or published for any commercial purpose without prior consent. Members of the press and others using the findings in this article for non-commercial purposes are welcome to publicly share and link to report information with attribution to Ookla.

| July 24, 2019

Touring Mobile Performance with the Speedtest Global Index

Lire en français

At Ookla we celebrate speed and the individuals and companies that dedicate their lives to being the fastest at whatever they do. That’s why this month’s big race in France is so exciting. To cheer all the worn out tires that go into making a great event, we compared the mobile performance of cyclists’ home countries using the Speedtest Global IndexTM. We also looked at download speed in the race’s start and stop cities to see which has the best internet speed advantage.

Which countries’ mobile speeds are breaking away from the main group

The Speedtest Global Index ranks countries based on their download speeds over mobile and fixed broadband. To honor the big race, we narrowed that field to just the countries competing this year and looked at their mobile performance over the past 12 months. We had to leave Eritrea off the list as there were not sufficient samples in the country during the time period to qualify for the Speedtest Global Index.

mobile-performance-chart-final

Mobile speeds in Norway have exploded to the point that they’ve led the pack every single month for the past year. Even when Norway slipped to second in the world for mobile, behind South Korea, they still led all the countries currently touring. Canada’s mobile speeds started strong and rallied to surpass Australia and the Netherlands. These four countries were up in front of the pack for the entire year.

Up next in the chasing group, there was a lot more movement. France started a long climb in September 2018 that took them from 29th in the world for mobile download speed to 17th. This also helped France pass New Zealand and Austria. Belgium started strong but then they fell back in the bunch. The Czech Republic regrouped slightly in April to improve their ranking to a career high of 11, but recently they’ve fallen back to just above where they ranked 12 months ago.

All the way back in the broom wagon, Colombia fell behind early and couldn’t find their second wind. Costa Rica’s decline started later but still left them in second to last place.

Mobile performance in Tour cities

Cyclists and fans are visiting many different cities for the different stages of the race. We compared mean download speeds over mobile in some of the start and stop cities during Q2 2019 to see which were in front and which were chasing. Note that according to the Ookla 5G MapTM, no cities in France or Belgium have commercially-available 5G as of this writing.

Mobile Performance in Tour Start and Stop Cities
Speedtest Data | Q2 2019
City Mean Download (Mbps) Mean Upload (Mbps)
Saint-Étienne, France 60.99 13.08
Reims, France 59.05 13.95
Nancy, France 58.48 14.66
Mulhouse, France 57.60 13.57
Toulouse, France 55.31 12.68
Belfort, France 53.46 13.19
Tarbes, France 53.26 12.92
Pau, France 52.27 13.14
Nîmes, France 51.10 12.84
Rambouillet, France 51.09 12.13
Colmar, France 50.52 13.97
Mâcon, France 48.57 14.42
Paris, France 46.76 11.18
Brussels, Belgium 45.81 16.56
Albi, France 44.49 12.22
Chalon-sur-Saône, France 42.99 12.89
Saint-Dié-des-Vosges, France 35.44 11.93
Gap, France 27.77 8.24

Saint-Étienne led a tight pack that included Reims, Nancy and Mulhouse which all showed mobile download speeds above 57 Mbps. Toulouse, Belfort, Tarbes, Pau, Nîmes, Rambouillet and Colmar were chasing with mobile download speeds between 50 and 56 Mbps.

We hope that last-place Gap and second-to-last Saint-Dié-des-Vosges were regrouping rather than taking a rest day as they showed mobile download speeds that were significantly slower than the rest of the cities.

Not all locations had sufficient samples to be included in our list, so if you want to know what mobile speeds are like at the Pont du Gard (or anywhere else), take a Speedtest on Android or iOS.

Chapeau to all the teams! May the rest of the race feel flat and fast.


Embarquez pour le tour des performances mobiles avec le Speedtest Global Index

Chez Ookla, nous vouons une véritable passion à la vitesse. Et alors que la Grande Boucle bat son plein en France, nous comptons bien la célébrer comme il se doit ! En parallèle de la lutte acharnée que se livrent les valeureuses équipes, nous avons comparé les performances mobiles des pays d’origine des coureurs en utilisant le Speedtest Global IndexTM. Nous avons également mesuré la vitesse de téléchargement dans les villes-étapes pour découvrir laquelle peut se vanter de disposer du meilleur débit Internet.

Performances mobiles : quels pays s’échappent du peloton ?

Le Speedtest Global Index classe les pays en fonction de leur vitesse de téléchargement haut débit mobile et fixe. Pour rendre hommage au Tour, nous avons uniquement examiné les performances mobiles des pays en lice au cours des douze derniers mois. L’Érythrée n’est malheureusement pas au rendez-vous en raison d’un nombre d’échantillons de données insuffisant.

mobile-performance-chart-final

Grâce à une vitesse de téléchargement mobile ultrarapide, la Norvège a trusté la première place du classement tout au long de l’année. Si le pays a rétrogradé à la deuxième place mondiale juste derrière la Corée du Sud, il a littéralement survolé les débats dans le cadre de notre compétition. De son côté, le Canada a démarré fort, en parvenant même à dépasser l’Australie et les Pays-Bas. Ces quatre pays ont réussi une formidable échappée tout au long de l’année.

Derrière, le groupe de poursuivants s’est organisé pour réduire l’écart. Grâce à une folle remontée en septembre 2018, la France est passée de la 29e à la 17e place mondiale, coiffant au poteau la Nouvelle-Zélande et l’Autriche. Après un très bon départ, la Belgique s’est malheureusement retrouvée engluée dans le peloton. La République Tchèque a mis un petit coup d’accélérateur en avril pour atteindre la 11e place (une première !). Elle a ensuite connu une baisse de régime qui l’a vu terminer juste au-dessus de son classement de l’année dernière.

En queue de peloton, la Colombie a rapidement été distancée et n’est jamais parvenue à trouver un second souffle. Malgré ses bonnes intentions, le Costa Rica a quant à lui fini avant-dernier.

Performances mobiles dans les villes-étapes

Les coureurs et les fans visitent de nombreuses villes lors des différentes étapes du Tour. Nous avons comparé les vitesses moyennes de téléchargement mobile dans certaines de ces villes au cours du deuxième trimestre 2019 afin d’établir un classement. Notez que selon l’Ookla 5G MapTM, aucune ville de France ou de Belgique ne propose actuellement la 5G.

Performances mobiles dans les villes-étapes
Données Speedtest Data | Deuxième trimestre 2019
Ville Débit descendant moyen (Mbps) Débit ascendant moyen (Mbps)
Saint-Étienne, France 60,99 13,08
Reims, France 59,05 13,95
Nancy, France 58,48 14,66
Mulhouse, France 57,60 13,57
Toulouse, France 55,31 12,68
Belfort, France 53,46 13,19
Tarbes, France 53,26 12,92
Pau, France 52,27 13,14
Nîmes, France 51,10 12,84
Rambouillet, France 51,09 12,13
Colmar, France 50,52 13,97
Mâcon, France 48,57 14,42
Paris, France 46,76 11,18
Bruxelles, Belgique 45,81 16,56
Albi, France 44,49 12,22
Chalon-sur-Saône, France 42,99 12,89
Saint-Dié-des-Vosges, France 35,44 11,93
Gap, France 27,77 8,24

Au coude-à-coude avec Reims, Nancy et Mulhouse, Saint-Étienne s’est imposée dans un groupe relevé affichant une vitesse de téléchargement mobile supérieure à 57 Mbps. Dans son sillage, Toulouse, Belfort, Tarbes, Pau, Nîmes, Rambouillet et Colmar ont fait bonne figure avec une vitesse comprise entre 50 et 56 Mps.

Gap et Saint-Dié-des-Vosges, respectivement dernier et avant-dernier, n’ont jamais semblé pouvoir suivre le rythme du peloton, avec une vitesse bien inférieure à celle des autres villes.

Faute d’un nombre d’échantillons de données suffisant, cette liste n’est pas exhaustive. Si vous souhaitez connaître la vitesse de téléchargement mobile de Pont du Gard ou de toute autre ville, effectuez un Speedtest sur Android ou iOS.

Un grand bravo à toutes les équipes ! Nous vous souhaitons bonne chance pour le reste de la course !

Ookla retains ownership of this article including all of the intellectual property rights, data, content graphs and analysis. This article may not be quoted, reproduced, distributed or published for any commercial purpose without prior consent. Members of the press and others using the findings in this article for non-commercial purposes are welcome to publicly share and link to report information with attribution to Ookla.

| September 4, 2019

In-Depth Analysis of Changes in World Internet Performance Using the Speedtest Global Index

A lot has changed in the two years since 2017 when we first began ranking mobile and fixed broadband speeds of countries around the world with the Speedtest Global IndexTM. 5G is being deployed around the world and fiber continues to make gigabit speeds a reality in more and more countries. We’ve been tracking it all and are here to report on how much speeds have increased, which countries are leading internet performance and which are falling behind, and what trends we see across continents.

World mobile speed increased 21.4% with fixed broadband up 37.4%

World-Download-Speeds-2019-OG2

Looking just at the last year, the world’s mean download speed over mobile increased 21.4% from 22.81 Mbps in July 2018 to 27.69 Mbps in July 2019. Mean upload speed over mobile increased 18.1% from 9.13 Mbps to 10.78 Mbps. The world average for download speed over fixed broadband increased 37.4% from 46.48 Mbps in July 2018 to 63.85 Mbps in July 2019. Mean upload speed over fixed broadband increased 48.9% from 22.52 Mbps to 33.53 Mbps.

Shake-ups in the country rankings for internet performance

Fastest-Countries-Mobile-2018-2019

Mobile speeds in the fastest countries have skyrocketed in the past year which has dramatically shifted the rankings. South Korea, which was not even in the top ten a year ago, saw a 165.9% increase in mean download speed over mobile during the past 12 months, in large part due to 5G. Switzerland’s mean download speed increased 23.5%. Canada’s was up 22.2%, Australia 21.2%, the Netherlands 17.3%, UAE 11.1%, Malta 10.3% and Norway 5.8%. Qatar remained in the top ten, although the country’s mean download speed over mobile actually dropped 1.4% from July 2018 to July 2019.

Individual mobile operators can make a huge difference in a country’s speeds. In 2017 we were excited to see Telenor uncap their mobile speeds, which drove Norway to the top of the Speedtest Global Index. A big part of South Korea’s mobile success in the past year is the way KT, LG U+ and SK Telecom banded together to release 5G at the same time. Switzerland has also benefited from 5G and Sunrise leads the country with 262 5G deployments across the country while Swisscomm has 52.

Fastest-Countries-Fixed-2018-2019

Fixed broadband rankings on the Speedtest Global Index have not changed as dramatically during the past 12 months as those on mobile. Singapore remains the fastest country with an increase in mean download speed over fixed broadband of 5.6%. Taiwan had the largest jump in speeds among the top 10 with a 166.5% improvement in fixed download speed between July 2018 and July 2019. Mean download speed over fixed broadband increased 52.4% in South Korea, 26.4% in Macau, 21.7% in Romania, 21.0% in Switzerland, 19.3% in the United States and 3.5% in Hong Kong.

Monaco and Andorra did not have enough tests to qualify for the Speedtest Global Index one year ago, but massive fixed broadband improvements in both countries inspired us to lower our test count threshold for inclusion and also share these smaller countries’ success stories.

Technologies paving the way: 5G and gigabit

The presence of 5G is not enough to change a market

As discussed above, 5G has the potential to rocket a country to the top of the mobile rankings on the Speedtest Global Index. In practice, we’ve seen 5G speeds that were over 1000% faster than those on LTE.

Mobile-Download-Speeds-by-Country

In reality, though, unless 5G is commercially available widely across a country and from all mobile operators (as was the case in South Korea), the change in speeds at the country level is not that significant. Though commercial 5G was launched widely across Switzerland by Sunrise and Swisscom in April 2019, the country’s mean download speed only increased 2.8% in the three months since. The average mobile download speed in the U.S. has actually declined slightly since 5G was initially deployed. This is because 5G is still only available in a very limited number of markets to consumers with 5G-capable devices.

Visit the Ookla 5G Map for the latest on 5G deployments across the globe.

Gigabit is a game-changer, if you can get it

Unlike 5G, fiber connections have been rolling out since 2007, opening up the possibility of gigabit-speed fixed broadband. That said, it’s costly and time-intensive to lay miles and miles of fiber so progress has varied widely across the globe.

Gigabit-Test---Performance_Singapore-1

Geographically small countries like Singapore have the advantage when it comes to fiber, because It’s easier and cheaper to lay fiber optic cable across the country’s small footprint. Singaporean internet service providers (ISPs) have used this advantage to go beyond mere gigabit and offer connections as fast as 10 Gbps. This is reflected both in Singapore’s dominance of the fixed rankings on the Speedtest Global Index and in the fact that 2.87% of their total Speedtest results over fixed broadband are gigabit-speed (800 Mbps or higher).

Gigabit-Test---Performance_Brazil-1

Brazil offers a good contrast for how difficult it can be for gigabit to reach the masses. While the first Brazilian ISP to offer fiber-to-the-premises (FTTP) initially did so in 2007, easy access to gigabit speeds was slow to follow. However, that may be starting to change. Between June and July 2019 we saw a large uptick in gigabit-speed results in Brazil, where the proportion of gigabit speed tests increased from 0.02% of total fixed broadband tests to 0.17%. This corresponded with a large increase in mean download speed at the country level.

Comparing world mobile and fixed broadband at a glance

We were curious to see just how different internet performance experiences were around the world, so we plotted average mobile download speed against average download speed on fixed broadband. All of the graphs below use a percentage difference from the global average, a number that changed between 2018 and 2019.

fade-Performance-vs-Global---Quadrant-All

Speed Leaders

There was not much change in the list of countries that showed above-average download speeds on both mobile and fixed broadband between July 2018 and July 2019, the “Speed Leaders.” What did change was that fixed broadband speeds increased significantly enough among the group to bring the whole pack closer to Singapore and Hong Kong. On the mobile axis, South Korea’s major increase in download speed made that country more of an outlier, pushing the boundaries of what great performance can look like.

Fixed-Focused countries

Between July 2018 and July 2019 we saw the number of countries considered to be “Fixed-Focused” (having faster download speeds over fixed broadband than the world average while their average mobile download speeds were slower than average) increase. Ireland was the only country that solidly fit this category in 2018. Thailand and Chile started near the midline for fixed speeds and below-average for mobile speeds in 2018. 2019 found both countries squarely in the Fixed-Focused category. Israel also edged into this category as their mobile download speed fell between July 2018 and 2019.

Mobile-Focused countries

The “Mobile-Focused” category saw the most movement between July 2018 and July 2019 as some countries (the UAE and Qatar) increased their fixed speeds sufficiently to join the Speed Leaders. Meanwhile, Bosnia and Herzegovina’s mobile download speed increased year-over-year to move them into the Mobile-Focused quadrant. Georgia’s mobile download speed decreased enough to move them from Mobile-Focused to Speed Laggers.

It will be interesting to see how many of these Mobile-Focused countries double down on their mobile investments and explore 5G alternatives to fixed broadband.

Speed Laggers

No country wants to be in the position of having slower than average mobile and fixed broadband speeds. We saw 57 countries in this “Speed Laggers” quadrant in July 2018 and 78 in July 2019. This increase is mostly due to our expansion of the number of countries we consider for the Speedtest Global Index based on test count. There were enough countries in this category that we’ve considered them separately by continent below.

Regional views of mobile and fixed broadband performance

Mobile-and-Fixed-Broadband-Improvement-by-Continent-02

We aggregated Speedtest results by continent to analyze mobile and fixed broadband performance by continent.

Mobile-and-Fixed-Performance-by-Continent-01

Asia had the highest percentage increase in mobile download speed followed by North America, Oceania, South America, Africa and Europe. Oceania had the fastest mean download speed in July 2019. North America placed second, Europe third, Asia fourth, South America fifth and Africa sixth.

On the fixed broadband side, South America saw the highest percentage increase in download speed. Asia came in second, Europe third, Africa fourth, North America fifth and Oceania sixth. North America had the fastest mean download speed in July 2019. Europe was second, Asia third, and Oceania fourth. As we saw with mobile, South America and Africa again ranked fifth and sixth, respectively.

A zoomed-in view of the speed quadrants separated by continent offers a more detailed view of each country’s role in these rankings.

Africa mostly lags in internet speeds

2019-Performance-vs-Global---Africa

In July 2019, all but two African countries in the Speedtest Global Index fell into the Speed Laggers category, having mobile and fixed broadband speeds that were below global averages. The exceptions were South Africa and Guinea, which both had fast enough mobile speeds to place them in the mobile-focused quadrant.

Asian markets show a wide breadth of internet performance

2019-Performance-vs-Global---Asia

Asia was the most diverse continent we examined in terms of internet performance. We saw a plurality of countries in each of the four quadrants in July 2019. Most of the Speed Leaders were in East Asia: China, Hong Kong (SAR), Japan, Macau (SAR), South Korea, and Taiwan. If we include Singapore, another Speed Leader, these are among the wealthiest nations in Asia (using GDP per capita). Two of Asia’s Fixed-Focused countries are in Southeast Asia (Malaysia and Thailand) and one is in the Middle East (Israel).

The Speed Laggers category contained countries from South Asia (including Afghanistan, India and Pakistan), Southeast Asia (Brunei, Cambodia, the Philippines and Vietnam) and the Middle East (Jordan). Mobile-Focused countries in Asia were mostly Middle Eastern, including Kuwait, Lebanon, Oman, Saudi Arabia and Turkey.

European mobile performance is mostly strong, fixed varies

2019-Performance-vs-Global---Europe

With the exception of Ireland, the European countries on the Speedtest Global Index fell into the Speed Leaders, Mobile-Focused, and Speed Laggers categories. All of the Speed Laggers (Belarus, Kazakhstan, Russia and the Ukraine) were from Eastern Europe. Countries from Southeast Europe (including Albania, Bosnia and Herzegovina, Croatia, Greece, Montenegro, Moldova, Serbia and Slovenia) and Central Europe (Austria and the Czech Republic) made up the bulk of the Mobile-Focused category.

Speed Leaders included countries from the Baltics (Estonia, Latvia and Lithuania), the Nordics (Denmark, Norway and Sweden), Central Europe (Poland and Romania), and Western Europe (including Belgium, France, Germany, the Netherlands, and Spain).

North American internet performance is sharply divided

2019-Performance-vs-Global---North-America

Canada and the U.S. are the only two North American countries in the Speed Leaders category. Panama is the only North American country under Fixed-Focused. Mexico and all of the Central American countries fall into the Speed Laggers category. There are no North American countries that are Mobile-Focused.

Each country in Oceania has a very different internet story

2019-Performance-vs-Global---Ocean

Oceania is represented in three of the four quadrants: Speed Leaders (New Zealand), Mobile-Focused (Australia) and Speed Laggers (Papua New Guinea) with Fiji straddling the divide between Speed Laggers and Mobile-Focused.

South America mostly lags in mobile and fixed internet speeds

2019-Performance-vs-Global---South-America

Most of the South American countries represented on the Speedtest Global Index are in the Speed Laggers quadrant (Argentina, Bolivia, Brazil, Colombia, Ecuador, Paraguay, Peru, Suriname and Venezuela). Chile is an exception, being part of the Fixed-Focused group, as is Uruguay which sits in Mobile-Focused.

Global internet speeds are improving on average and 5G and gigabit are compounding those advances where available. However, not all countries are benefitting equally. We’ll be interested to see how 5G continues to push mobile speeds in the next year and also whether 5G Wi-Fi becomes a game changer for fixed broadband. Remember to check the Speedtest Global Index on a monthly basis for updated country rankings. And take a Speedtest to make sure your experience is represented in your country’s averages.

Editor’s Note: This article was edited on September 10, 2019 to correct an error in the labeling on the first image. The colors in a later image were updated for consistency.

Ookla retains ownership of this article including all of the intellectual property rights, data, content graphs and analysis. This article may not be quoted, reproduced, distributed or published for any commercial purpose without prior consent. Members of the press and others using the findings in this article for non-commercial purposes are welcome to publicly share and link to report information with attribution to Ookla.

| March 13, 2020

Tracking COVID-19’s Impact on Global Internet Performance (Updated July 20)

We are no longer updating this article as internet speeds in most countries have stabilized to pre-pandemic levels. For ongoing information about internet speeds in specific countries, visit the Speedtest Global IndexTM or contact our press team.

Ookla® closely monitored the impact of COVID-19 on the performance and quality of global mobile and broadband internet networks in the early days of the pandemic. We shared regular information based on Ookla data to assist in the understanding of this unprecedented situation. You can still download the July 20, 2020 CSV here which contains all the public data we tracked in this article. If you are looking for information on internet or online service outages, please check Downdetector®.

Ookla retains ownership of this article including all of the intellectual property rights, data, content graphs and analysis. This article may not be quoted, reproduced, distributed or published for any commercial purpose without prior consent. Members of the press and others using the findings in this article for non-commercial purposes are welcome to publicly share and link to report information with attribution to Ookla.

| January 4, 2021

Slack Starts the New Year Late


2021 started with a sigh today as workers across the globe rushed back to their desks only to find that Slack was down. Users flocked to Downdetector® to report problems with Slack across the globe just after 7:00 a.m. Pacific. Issues were reported in Asia (Japan), Australia, Europe (Finland, France, Germany, Italy, the Netherlands, Poland, Russia, Spain, Sweden and the United Kingdom), North America (United States and Canada) and South America (Brazil). The most frequently reported issue was the inability to connect at all and the majority of reports came from the U.S.

Downdetector_Slack_Outage_1020

Although the spike has passed and the outage seems to be resolving itself, the service is not fully operational yet. Now might be a good time to take a breath and catch up on all that post-holiday email. The little red notification will be back on your desktop soon enough.

Downdetector data can help your team resolve service issues faster and improve customer experience when an outage occurs, which becomes all the more important during periods of high usage. Contact us here to learn how your network operations center can get faster outage detection.

Ookla retains ownership of this article including all of the intellectual property rights, data, content graphs and analysis. This article may not be quoted, reproduced, distributed or published for any commercial purpose without prior consent. Members of the press and others using the findings in this article for non-commercial purposes are welcome to publicly share and link to report information with attribution to Ookla.