| September 26, 2018

These Small Countries are Leading Broadband Speeds

One of our missions at Ookla® is to improve internet speeds around the world by giving people direct access to the speed of their connection via our flagship product Speedtest®. We’re very proud of having inspired Telenor to boost mobile speeds in Norway, fueling the debate over Australia’s National Broadband Network and providing the independent data that has impacted technology policy in Scotland, to name a few.

Besides articles here on Speedtest Insights, one of the primary ways we publicly share this data is through the Speedtest Global Index. But some places that don’t qualify for the Global Index — either because they aren’t UN Member States or Permanent Observers or they don’t meet the monthly unique user counts (670 results for mobile and 3,333 for fixed broadband) — still have fantastic internet speed stories to tell…

Except where noted, all of the following stories are based on Speedtest Intelligence™ data from Q1-Q2 2018.

Rapid rises in Andorra’s fixed broadband speeds

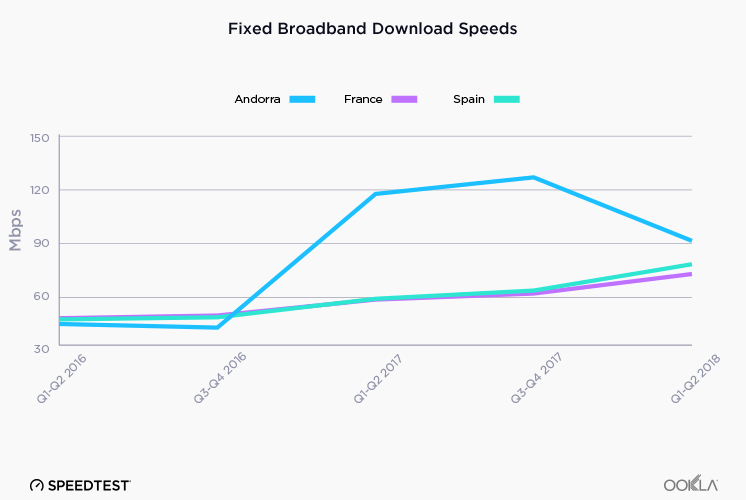
Two years ago, fixed broadband speeds in the Principality of Andorra were unremarkable and the country’s mean download speed lagged about 5 Mbps behind neighboring France and Spain. Then Andorra Telecom completed a renovation of its fiber optic network and download speeds shot up. They’ve since slowed a little, something that often happens as customers pile onto faster connections, but Andorra’s mean download speed of 89.39 Mbps in August 2018 beats Spain’s by 17.5% and France’s by 26.8%.

“Fixed Broadband Download Speeds” Subtitle: Andorra, France and Spain”

Jersey’s fixed broadband skyrockets practically overnight

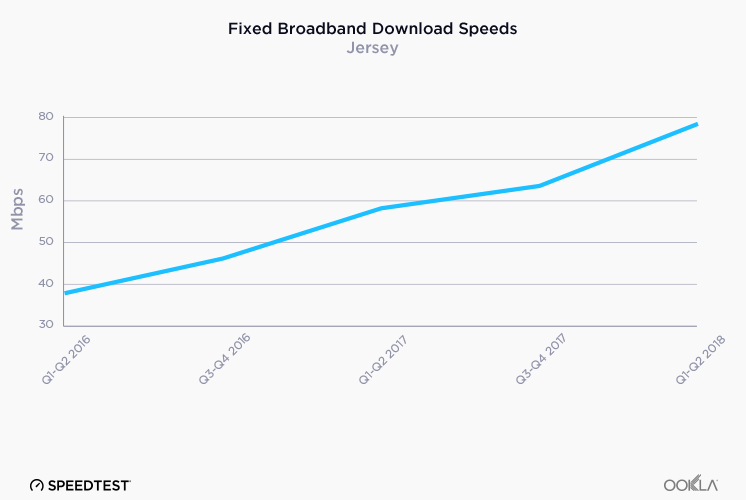
Fixed broadband speeds on the island of Jersey (the largest of the Channel Islands, situated in the English Channel) were on a steady upward trend, seeing a 106% increase between Q1-Q2 2016 and Q1-Q2 2018.

“Fixed Broadband Download Speeds” Subtitle: Jersey”

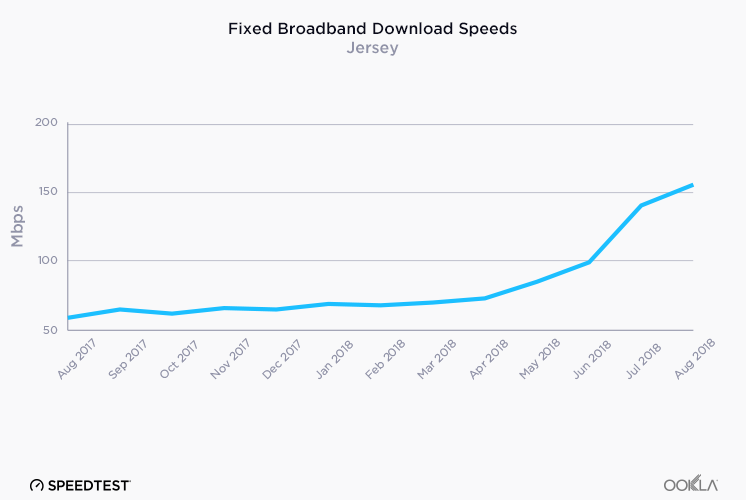
However, between June and August 2018 the download speed jumped a further 56.6% to reach a mean of 155.41 Mbps.

“Fixed Broadband Download Speeds” Subtitle: Jersey”

This jump coincides with a full-fiber rollout across the island.

Monaco makes a long-term bet on fixed broadband

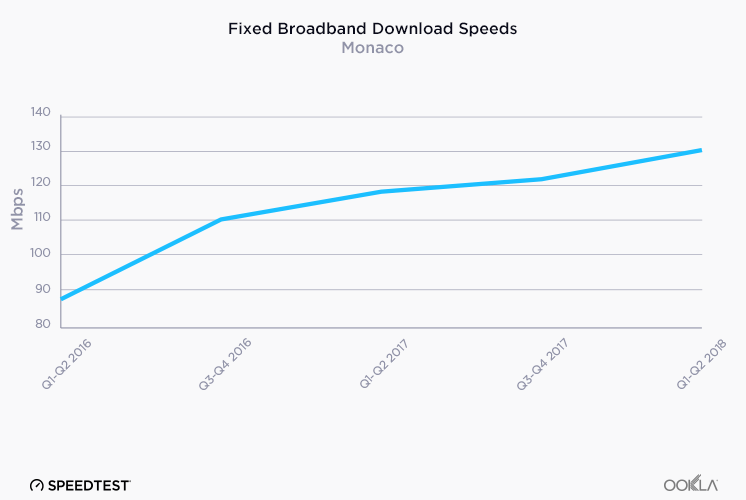
Monaco’s world-class fixed broadband speeds date to 2016 when Monaco Telecom made gigabit-level service available to all residences through Fiber-to-the-Home (FTTH). By Q1-Q2 2018 the mean download speed over fixed broadband in Monaco was 130.05 Mbps.

“Fixed Broadband Download Speeds” Subtitle: Monaco”

These smaller countries do have an advantage when it comes to things like fewer miles of fiber optic cable needed to actually serve every home. Still, there are lessons larger nations can learn from the successes of Andorra, Jersey and Monaco. One such area is future-proofing network upgrades by fully deploying the best available technology, which ensures that Internet Service Providers don’t have to manage a patchwork of cable types or dig up all the roads again in the near term.

It’s also important to note that these rapid broadband speeds make Andorra, Jersey and Monaco that much more attractive to a growing (and increasingly global) tech sector.

Is your company leading the way to faster internet speeds at a national level? Learn more about the network insights available from Speedtest Intelligence.

Editor’s note: This article was updated on October 1, 2018 to correct a scale issue on one of the charts.

Ookla retains ownership of this article including all of the intellectual property rights, data, content graphs and analysis. This article may not be quoted, reproduced, distributed or published for any commercial purpose without prior consent. Members of the press and others using the findings in this article for non-commercial purposes are welcome to publicly share and link to report information with attribution to Ookla.

| August 21, 2018

Which College Campus Scores the Fastest Wi-Fi?

It’s back to school in the U.S., which can only mean it’s time for the college football season. We care about those long-standing rivalries as much as you do, and we couldn’t wait until game day to pit our favorite teams against each other. So we found a new angle for all that “my team is better than yours” energy: who has the fastest campus Wi-Fi speeds?

To get a pregame answer to “who’s the best?” we looked at download speed for all Wi-Fi Speedtest results. We limited data to those from the internet service provider (ISP) for each campus for the first half of 2018. For context, the average Wi-Fi download speed in the U.S. was 81.91 Mbps during Q1-Q2 2018.

Old Wagon Wheel (October 5, 2018)

Utah vs BYU

Utah is home to the first big grudge match of the year and it’s here that we find Utah State’s Wi-Fi is more than twice as fast as BYU’s. Sorry, Cougars! It’s worth noting that Utah State has the fastest Wi-Fi of any campus discussed in this article. Utah State’s Wi-Fi is even 36.8% faster than the average Wi-Fi download speed for the state of Utah in Q1-Q2 2018.

Florida State–Miami (October 6, 2018)
Florida vs Miami

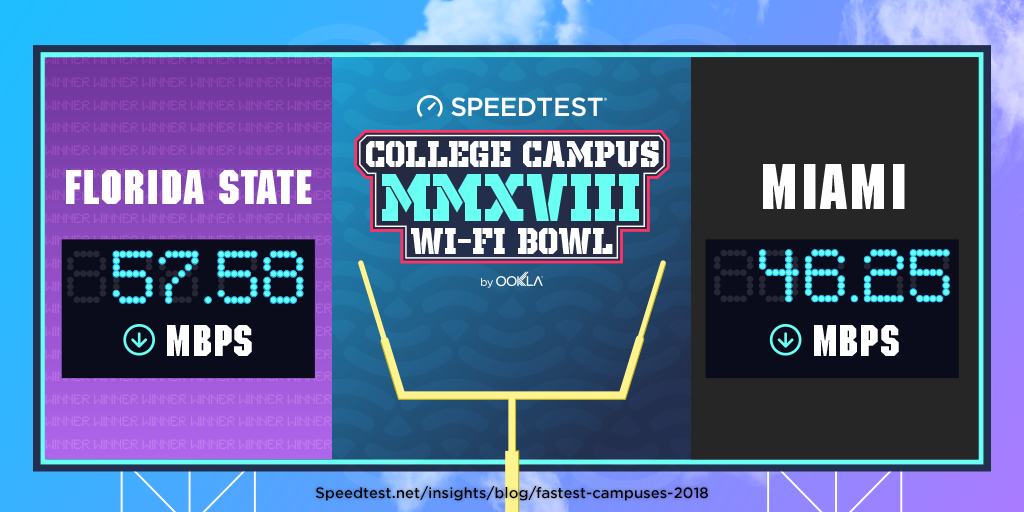
Our next matchup pits the Florida State Seminoles against the Miami Hurricanes in a rivalry that’s often one of the most-watched football games. If you’re watching that game over Wi-Fi, though, you’ll want to do it from the Tallahassee campus because their Wi-Fi is 24.5% faster than what you’ll find at the University of Miami. Even though that’s 24.2% slower than the state of Florida’s average Wi-Fi speed of 75.96 Mbps during the same period.

Red River Showdown (October 6, 2018)
Texas Vs Oklahoma

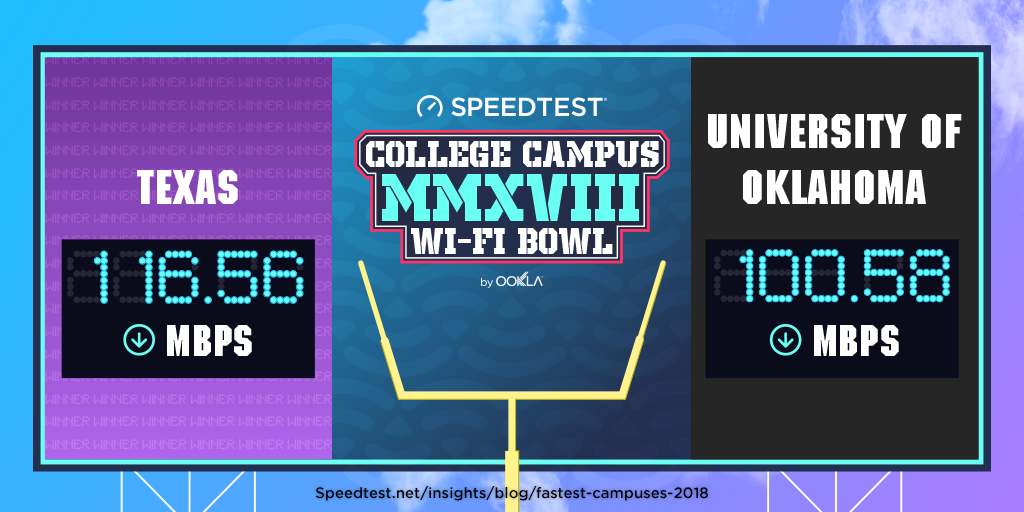
For over 100 years, the Oklahoma Sooners have been battling the Texas Longhorns. We can’t say who will win the THREE trophies awarded to the winner of this year’s game, but we can say that on the Wi-Fi front it’s Texas for the win (though both schools have speeds worth bragging about).

Third Saturday in October (October 20, 2018)
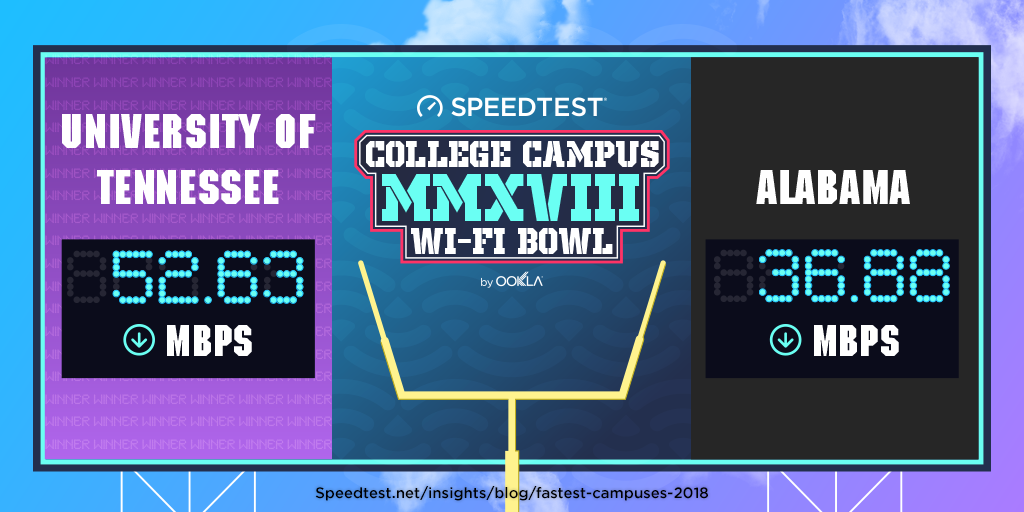
Tennessee Vs Alabama

When Alabama’s Crimson Tide meets the Tennesseee Volunteers on the field in Knoxville this year, they will be coming from behind (at least when it comes to Wi-Fi speeds). That’s because the average download speed on the University of Tennessee campus network is 42.7% faster than at Alabama.

World’s Largest Outdoor Cocktail Party (October 27, 2018)
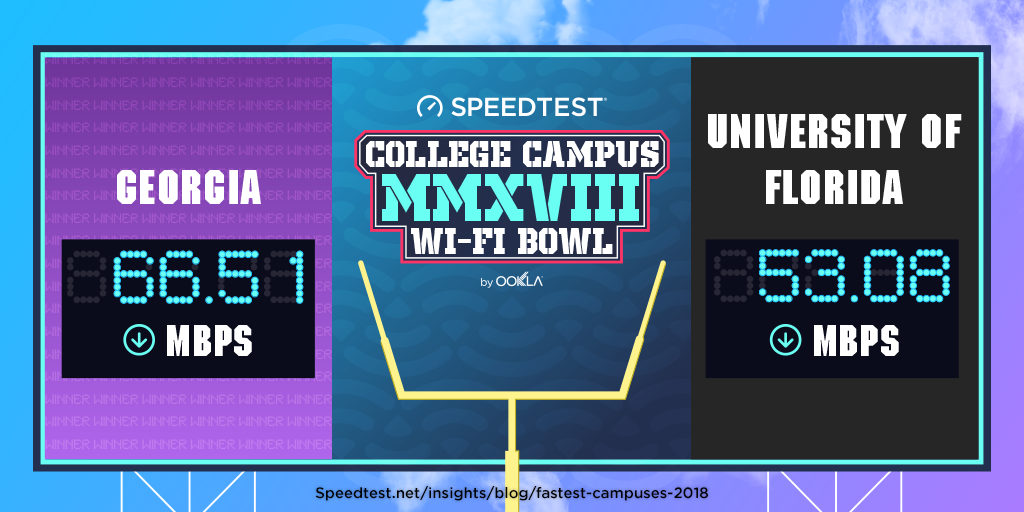
Georgia Vs Florida

What will the crowd be discussing as they tailgate in advance of the Florida-Georgia game? Georgia Bulldog fans might be bragging about their Wi-Fi speeds, which are 23.8% faster than those at the University of Florida. Don’t bring it up among the Florida Gators, though. Unless you want ‘em to get fighting mad.

Saban Bowl (November 3, 2018)
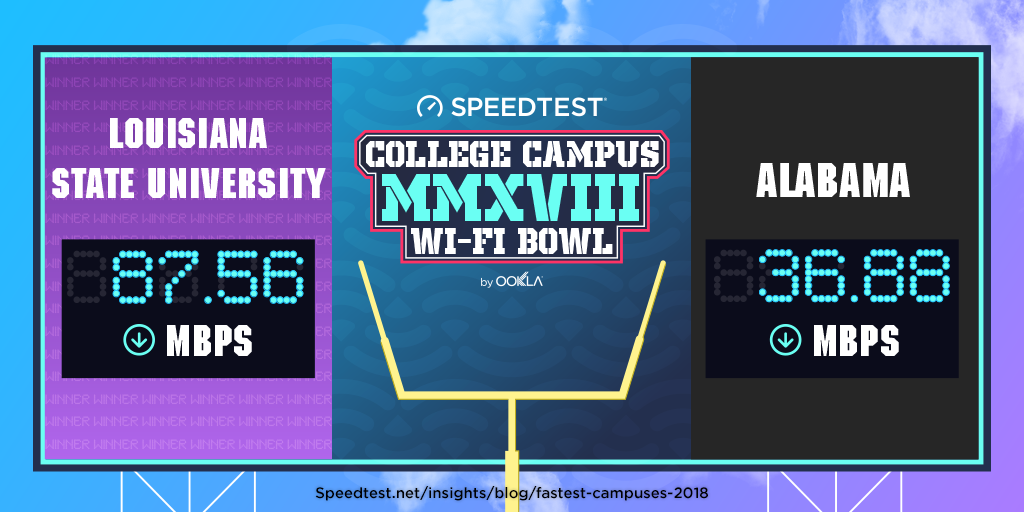
LSU Vs Alabama

We already know from the Third Saturday in October that Wi-Fi speeds are a sore subject for Alabama fans. Hopefully they’ll have won the game against the Tennessee Volunteers because their Wi-Fi matchup with the LSU Tigers is even more brutal. The average download speed over Wi-Fi on the Louisiana State University network is 137.4% faster than on Alabama’s.

Bedlam Series (November 10, 2018)

Oklahoma Vs Oklahoma State

The Oklahoma Sooners couldn’t beat the Texas Longhorns when it came to Wi-Fi download speed, but they’ve got the Oklahoma State Cowboys nicely handled with a 14.5% lead in this intrastate rivalry. Still, considering that the average Wi-Fi download speed for the state of Oklahoma was 67.58 Mbps during the same period, both these schools are doing well.

Big Game (November 17, 2018)
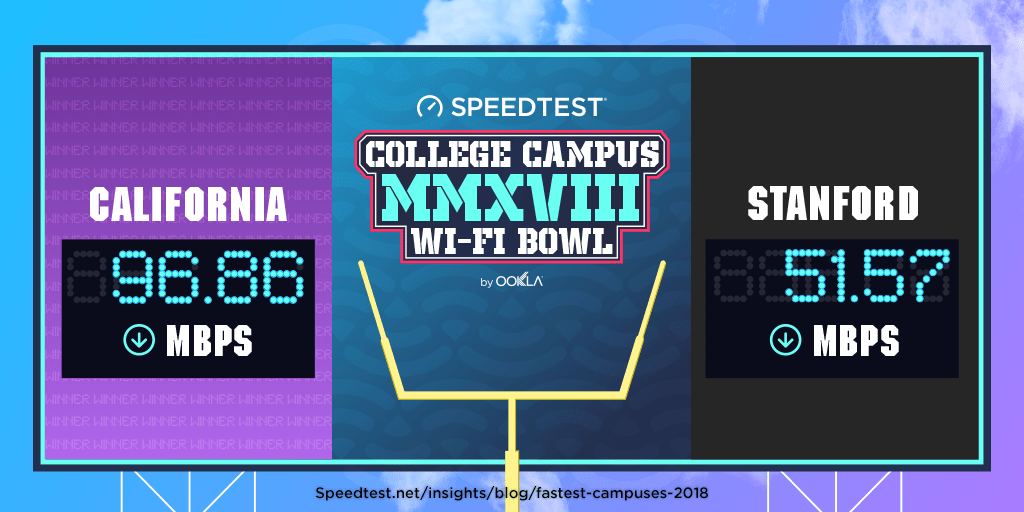
Cal Vs Standord
The California Golden Bears have met the Stanford Cardinal team on the field 120 times but we’re pretty sure this is the first time they’re face to face on Wi-Fi speeds. We were a little surprised to find how thoroughly California trounces Stanford with an 87.8% lead when it comes to download speed. For comparison, the state of California showed a mean Wi-Fi download speed of 87.71 Mbps in Q1-Q2 2018.

The Game (November 17, 2018)
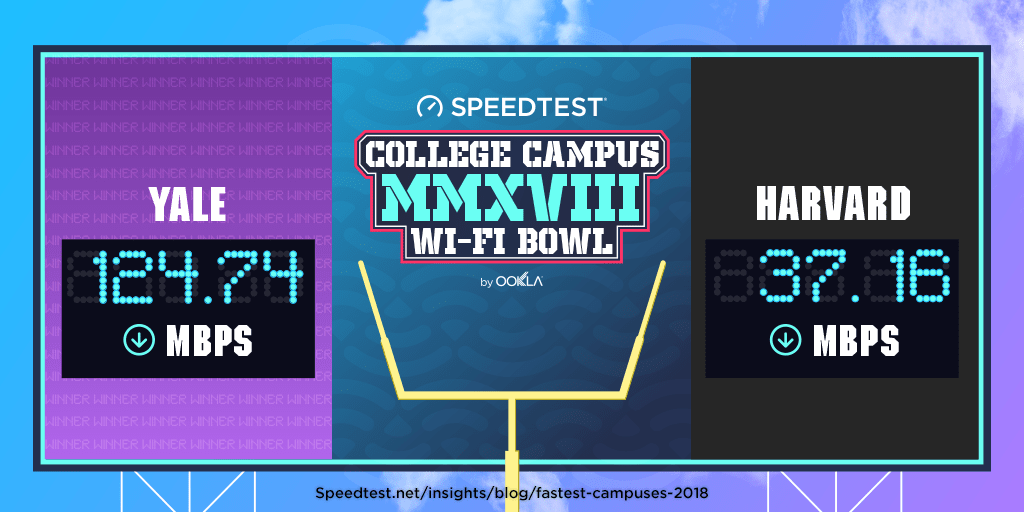
Yale Vs Harvard

If Wi-Fi was football (and we admit it’s not), it would take a hail mary for Harvard to beat Yale with Wi-Fi speeds like these. We’re not going to rub in this defeat by calculating the percentage here.

The Crosstown Showdown (November 17, 2018)
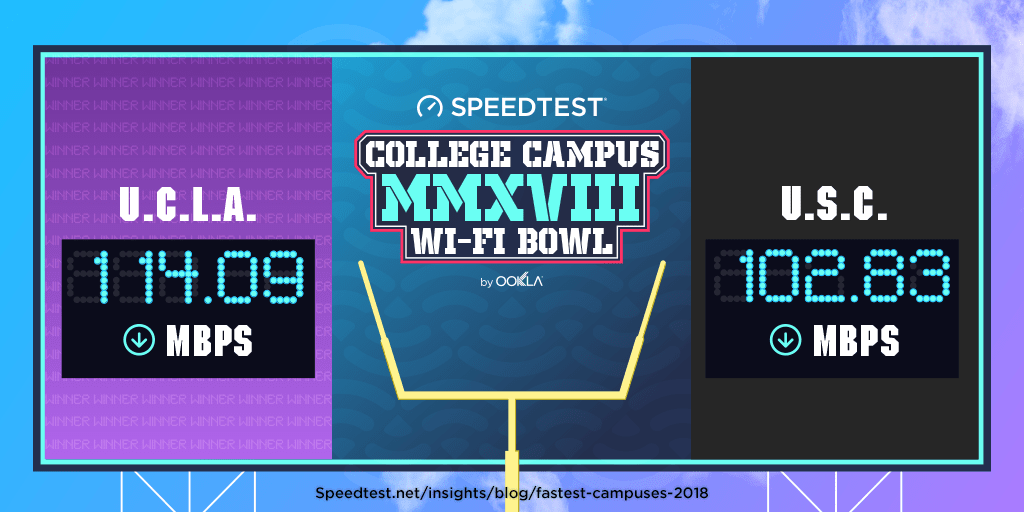
UCLA Vs USC

Yes, we know no one actually calls it this, but it’s catchy, right? We love to see a close match-up like this when it comes to Wi-Fi speeds. If download was the only determinant, the Victory Bell would be painted blue (this year) to honor UCLA’s win. Both schools well outpace L.A.’s average Wi-Fi download speed of 86.17 Mbps during the same period.

Apple Cup (November 23, 2018)
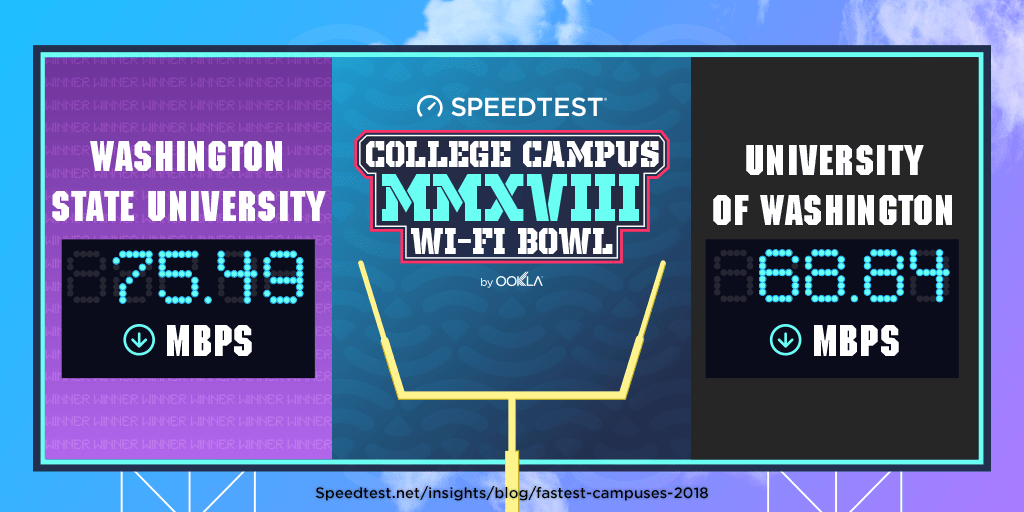
As Ookla’s headquarters are located in Seattle, this one’s personal for us. All dirt roads may lead to Pullman, but the office Dawgs have to concede that Wazzu has the better Wi-Fi download speed. With an average download speed of 94.34 Mbps over Wi-Fi for Washington state as a whole, both schools have some room to make up.

Civil War (November 23, 2018)
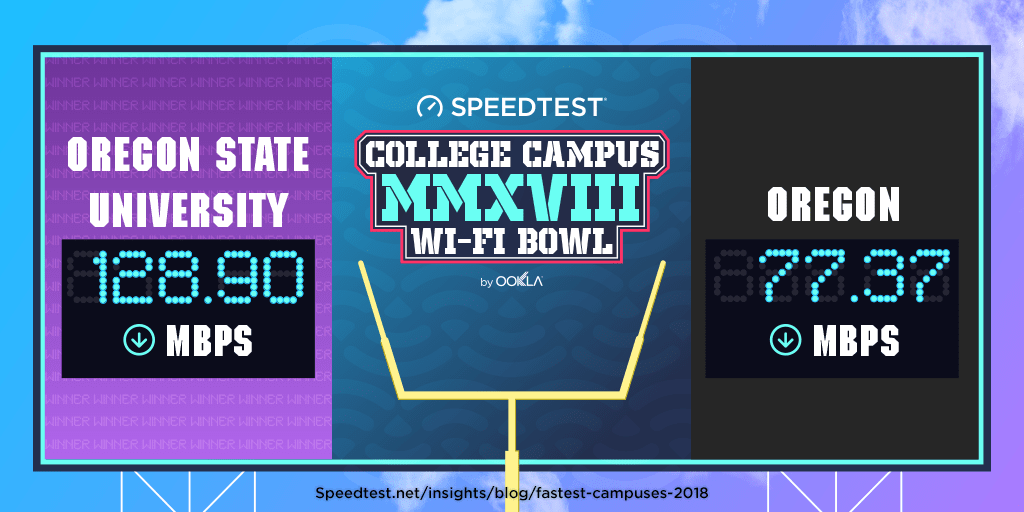
Oregon Vs Oregon State
Oregon may lead this 124-year-old rivalry when it comes to football games, but the Oregon State Beavers have it when it comes to Wi-Fi download speed with a 66.6% lead over the Oregon Ducks. For comparison, the average Wi-Fi download speed in Oregon state was 82.25 Mbps during the same period.

Clean, Old-Fashioned Hate (November 24, 2018)
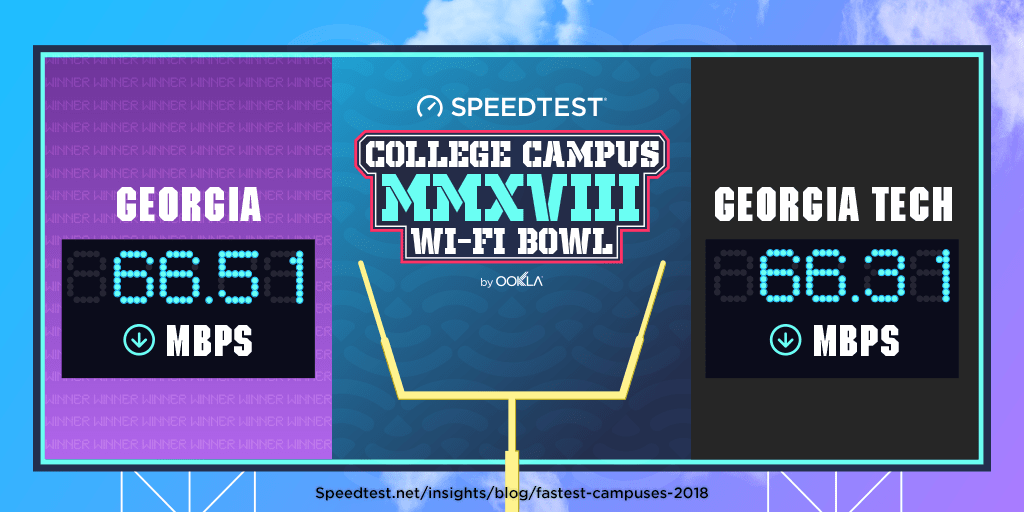
Georgia Vs Georgia Tech

Clean, old-fashioned hate indeed. The Wi-Fi contest between Georgia and Georgia Tech is technically too close to call. Well done Georgia Bulldogs and Georgia Tech Yellow Jackets! Both schools are relatively far behind the state of Georgia’s average of 80.02 Mbps for Wi-Fi downloads in Q1-Q2 2018.

Duel in the Desert (November 24, 2018)
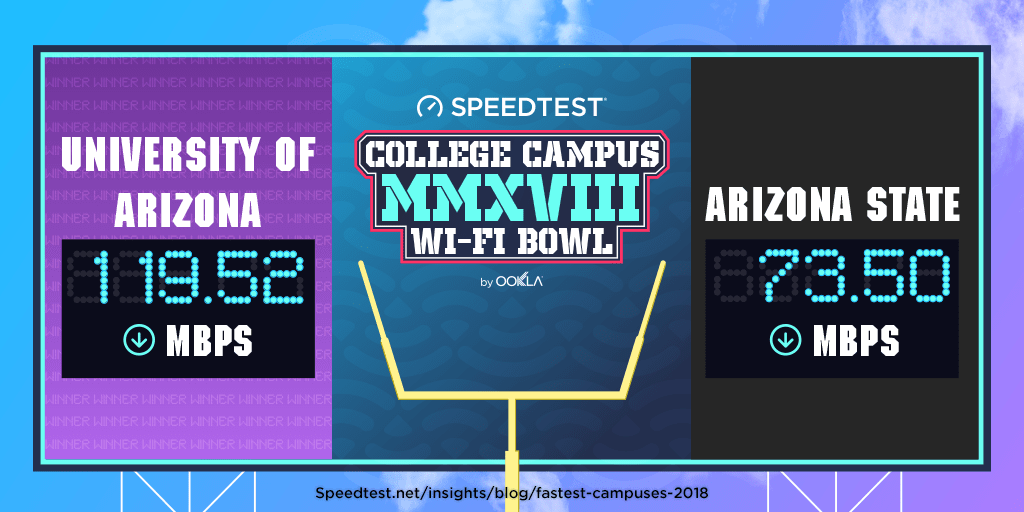
If the Territorial Cup was awarded for fastest Wi-Fi, it would go to the Arizona Wildcats who have a 62.6% lead in download speed over the Arizona State Sun Devils (and the fourth fastest campus Wi-Fi of any school in this article). In case you’re wondering, the average Wi-Fi download speed in the state of Arizona was 83.71 during the same period.

Iron Bowl (November 24, 2018)
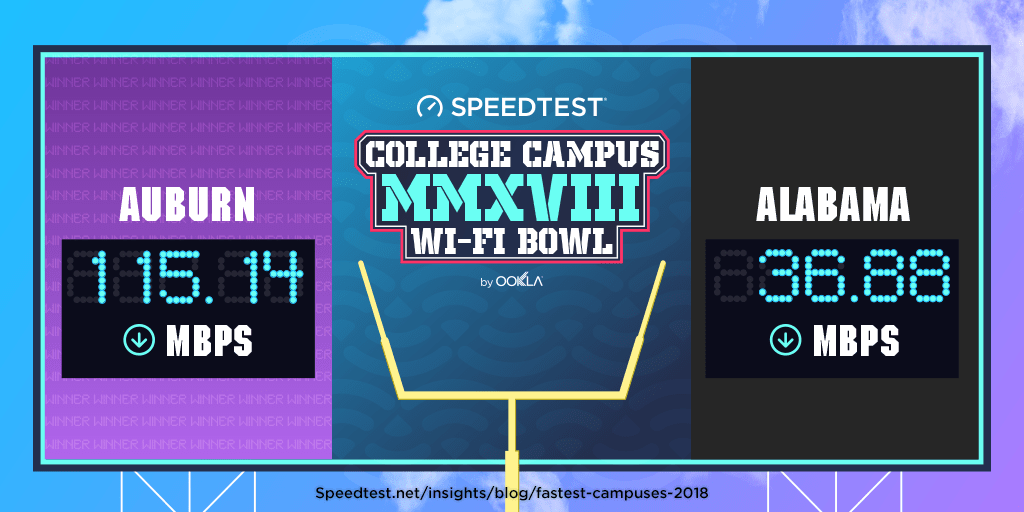
Auburn Vs Alabama

Poor Alabama, if you didn’t have so many rivalries… Auburn for the win here as the Tigers come in with a blazing fast Wi-Fi download speed on their campus network. At least Alabama’s Crimson Tide rocks football? The state of Alabama’s average download speed over Wi-Fi was 58.58 Mbps.

Notre Dame–USC (November 24, 2018)
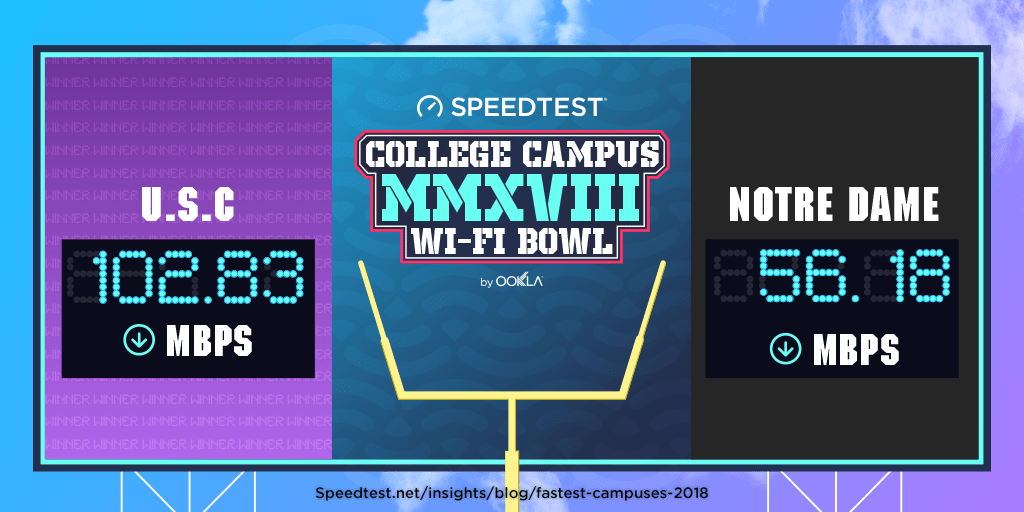
Notre Dame Vs USC

We’re sorry to say that Notre Dame would not be awarded the Jeweled Shillelagh if this game was based on Wi-Fi speed, as the USC Trojans dominate with an 83.0% faster download speed on their campus network than the Fighting Irish.

Paul Bunyan’s Axe (November 24, 2018)
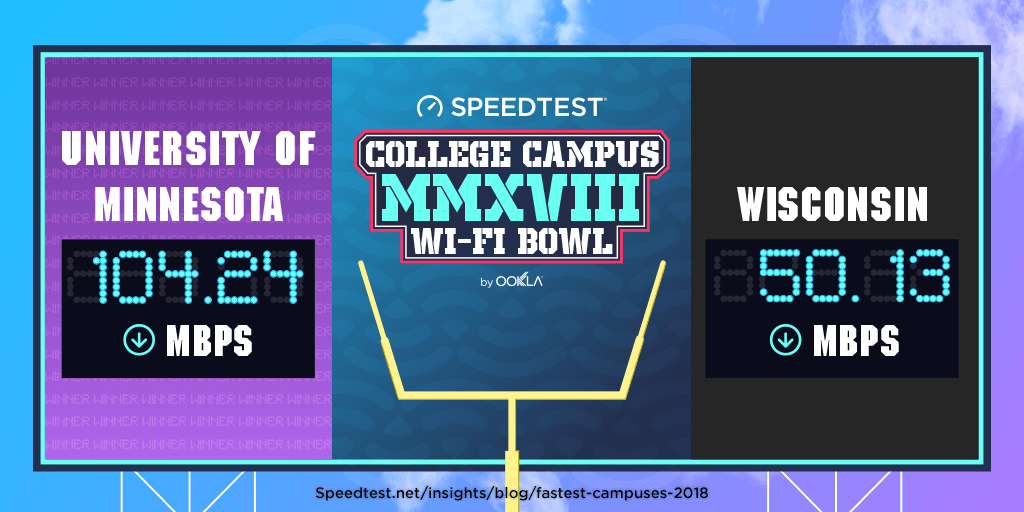
Minnesota Vs Wisconsin

No one was worried about Wi-Fi when the Minnesota Golden Gophers and the Wisconsin Badgers first met on the field back in 1890. Wisconsin should start worrying now, though, because the download speed on Minnesota’s campus network is less than half of what Wisconsin enjoys.

Backyard Brawl (September 3, 2022)
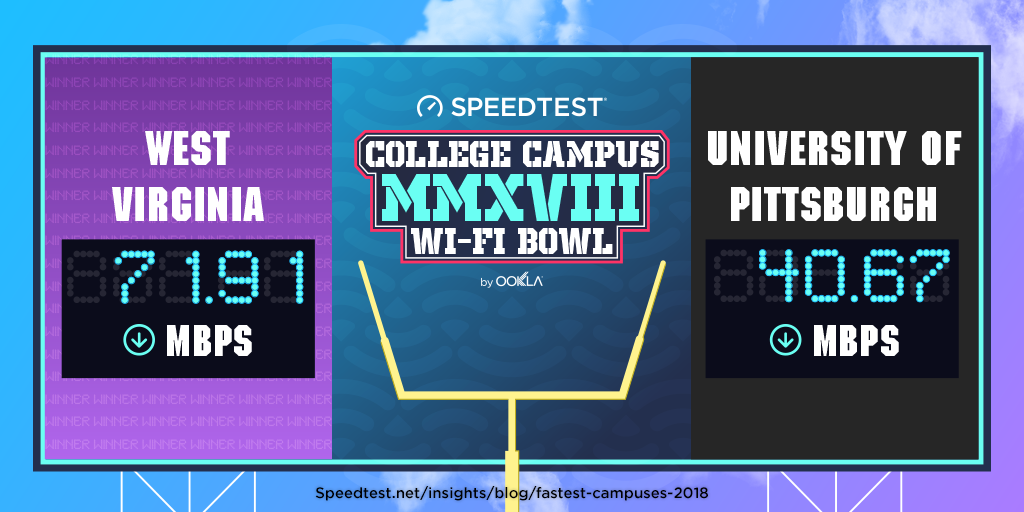
Pittsburgh Vs W. Virginia

You might have to wait until 2022 to watch the Pittsburgh Panthers kick off against the West Virginia Mountaineers, but we can tell you right now which of the two campuses has the fastest Wi-Fi: West Virginia University by 76.8%.

Texas–Texas A&M (in memoriam)

Texas Vs Texas

Unless there’s some conference rearrangement, we may never get to watch Texas A&M’s Aggies play the Texas Longhorns again. But this rivalry dies hard in Texas (and anywhere else fans bleed orange or maroon). If the campuses were to face off today using Wi-Fi download speed alone, the Longhorns would have it. Hook ‘em.

Both campuses do well to beat the state of Texas’s 88.85 Mbps average download speed over Wi-Fi.

A full look at the campus Wi-Fi standings

To understand where the campus Wi-Fi networks we examined rank overall, we compiled all the above results. Oregon State takes first place, Utah State second and Yale third. On the other end of the spectrum, the University of Alabama was in last place, Harvard was second to last and the University of Pittsburgh third to last.

Campus Wi-Fi Speeds
Speedtest Data | Q1-Q2 2018
Campus Mean Download (Mbps)
Oregon State University 128.90
Utah State University 125.46
Yale 124.74
University of Arizona 119.52
University of Texas, Austin 116.56
Auburn University 115.14
UCLA 114.09
Texas A&M 105.78
University of Minnesota 104.24
University of Southern California 102.83
University of Oklahoma 100.58
University of California, Berkeley 96.86
Oklahoma State University 87.86
Louisiana State University 87.56
University of Oregon 77.37
Washington State University 75.49
Arizona State University 73.50
West Virginia University 71.91
University of Washington 68.84
Brigham Young University 67.42
University of Georgia 66.51
Georgia Tech 66.31
Ohio State University 62.14
Florida State University 57.58
University of Notre Dame 56.18
University of Florida 53.08
University of Tennessee 52.63
Stanford 51.57
University of Wisconsin, Madison 50.13
University of Miami 46.25
University of Pittsburgh 40.67
Harvard 37.16
University of Alabama 36.88

Is your favorite team not listed here (ahem, Clemson, Michigan, Lehigh)? Take a Speedtest using the Wi-Fi on your campus network, and we’ll check back next year to see how the rivalries stack up.

Ookla retains ownership of this article including all of the intellectual property rights, data, content graphs and analysis. This article may not be quoted, reproduced, distributed or published for any commercial purpose without prior consent. Members of the press and others using the findings in this article for non-commercial purposes are welcome to publicly share and link to report information with attribution to Ookla.
| August 14, 2018

Could Your Mobile Network Handle Millions of New Users Overnight? Preparing for the Hajj

On August 20, millions of people will arrive in Mecca, Saudi Arabia to complete the Hajj, a ritual pilgrimage required of all able Muslims once during a lifetime. Though we don’t expect internet speed will be anyone’s top concern during this sacred period, we were curious how well the local network handles all that extra traffic.

To get a better idea of what this year’s pilgrims might experience, we’ve used Speedtest data to look at download speeds in Mecca before and during last year’s Hajj. We’ve also analyzed roaming speeds from the first half of 2018 for visitors from countries that represent four of the largest groups of pilgrims to understand how roaming agreements might affect performance.

How Mecca’s mobile network performs during the Hajj

Arriving pilgrims more than double the population of Mecca, an influx that could cripple a mobile network. Instead, our data shows a 12.1% decline in mobile download speed in Mecca during the 2017 Hajj, far less of an impact than we’d expect. Not only does the Saudi government invest heavily in ensuring a positive experience during the Hajj, it’s been said that Mecca spends the entire year preparing. From this small decline in speeds, we’d say that whatever mobile networks and the Saudi government are doing to shore up their mobile networks is working.

How the Hajj Affects Download Speeds
Saudi Arabia | 2017 | Measured in Mbps
Location Before the Hajj
(August 1-August 29)
During the Hajj
(August 30-September 3)
Mecca 11.46 10.07
Saudi Arabia 10.85 11.57

Comparatively, speeds in Saudi Arabia actually increased 6.6% during the Hajj.

Mobile speeds in Saudi Arabia have increased dramatically in the past year, with July 2018 showing an average download speed of 29.59 Mbps in Mecca. Even if this speed dips slightly during the Hajj, pilgrims should, on average, enjoy strong mobile speeds.

How roaming affects these speeds

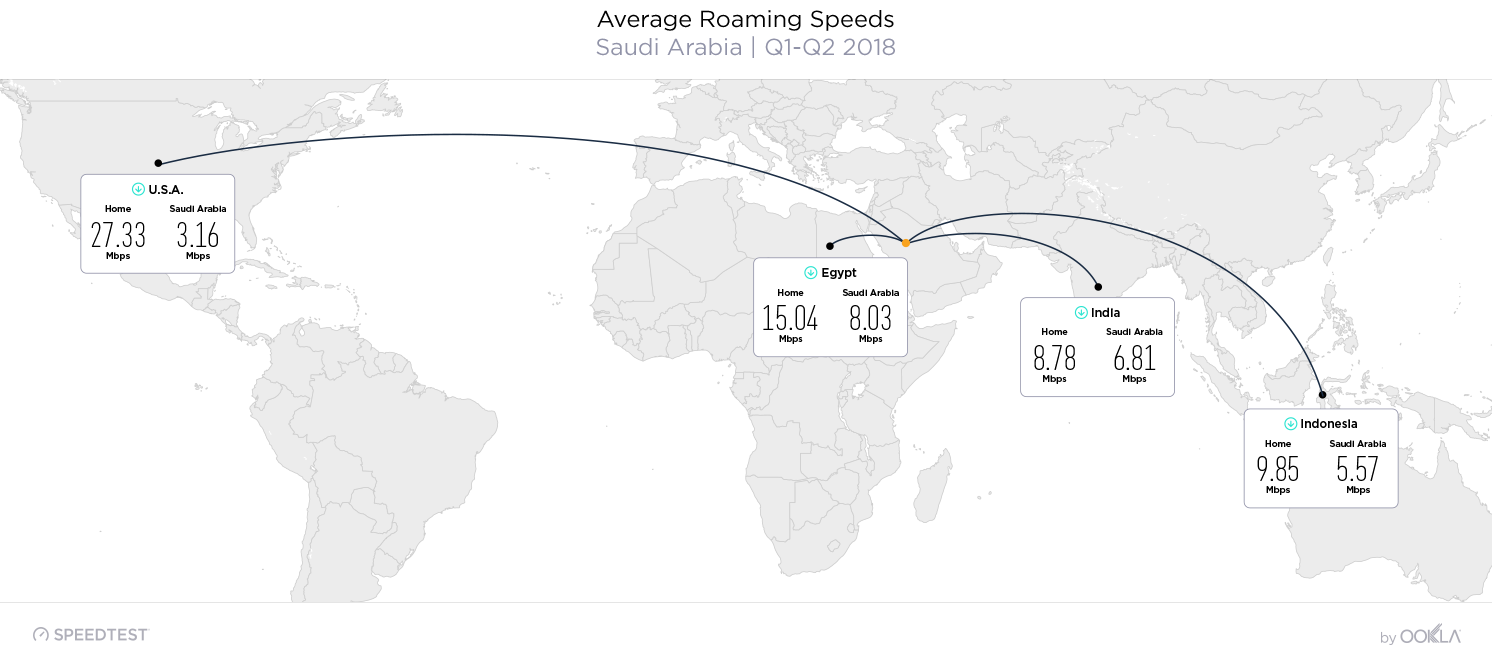
But travelers don’t experience average speeds. In fact, a visitor’s roaming speeds can vary widely based on their home carrier’s individual agreement with carriers in the country they’re visiting as well as what type of mobile plan an individual has signed up for. To better understand how that affects visitors to Saudi Arabia, we looked at Speedtest results for roaming tests taken by people from Egypt, India, Indonesia and the United States during the first half of 2018.


In all cases, download speeds declined (as you might expect). Visitors from India saw the smallest decrease (22.4%). Indonesian travelers experienced download speeds 43.5% slower than those they’d see at home. Egyptians experienced a 46.6% decrease and Americans a painful 88.4%.

What about Mina and Arafat?

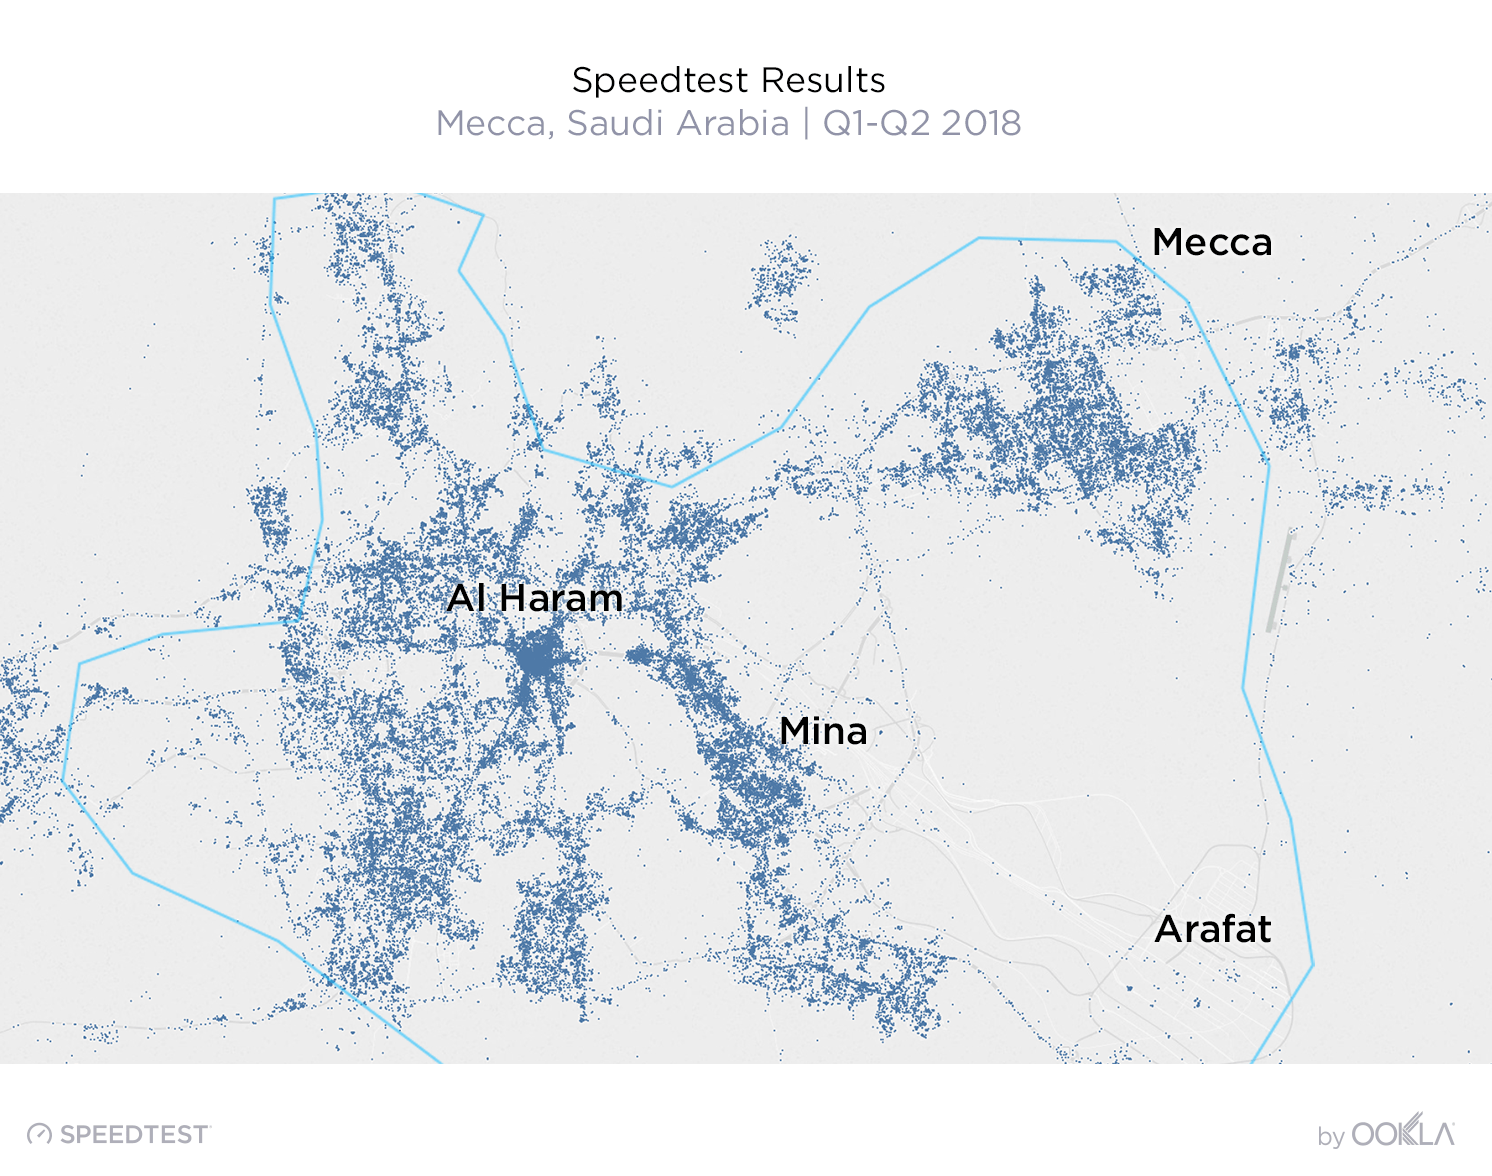
We looked at Speedtest results for areas around Mecca during the first half of 2018 to find out if pilgrims will have coverage during the farther-reaching portions of the Hajj.

Speedtest Results - Mecca, Saudi Arabia

We were glad to see there is some connectivity along the route to Mina and Arafat, should travelers need it.

While the Saudi mobile network appears to be up to the massive challenge of serving millions of pilgrims, roaming speeds can leave something to be desired. It might be worth talking to your carrier about the roaming speeds you can expect before you get on that plane.

Our hope is that this information may be valuable to those who need it during their travels and better illuminate network conditions for those preparing for the Hajj.

Ookla retains ownership of this article including all of the intellectual property rights, data, content graphs and analysis. This article may not be quoted, reproduced, distributed or published for any commercial purpose without prior consent. Members of the press and others using the findings in this article for non-commercial purposes are welcome to publicly share and link to report information with attribution to Ookla.

| June 26, 2018

Comparing Mobile Markets in South America’s Largest Economies

Though some of the largest economies in South America have struggled in recent years, the size of the region’s economies and populations make it worth watching from a telecommunications perspective. As such, we took a look at data from Speedtest Intelligence® from Q1 2018 to understand which countries are making the biggest strides in mobile internet speeds.

Which South American country has the fastest mobile speeds?

Peru had the fastest mean download speed during Q1 2018 of any of the countries on our list. Brazil showed a 28.7% increase over the same period last year to rank second. Third place Chile’s download speed actually declined slightly. Though Argentina came in fifth, the country’s 25.8% improvement in mobile download speed is impressive.

Download Speeds in South America’s Largest Economies
Q1 2018
Country Mean Download (Mbps) % Change YOY
Peru 20.00 10.9%
Brazil 16.95 28.7%
Chile 16.26 -1.2%
Colombia 15.74 8.9%
Argentina 14.39 25.8%
Venezuela 7.95 -10.1%

It’s not surprising that Venezuela shows the slowest mobile speed given the country’s economic collapse which has caused operational problems for many corporations. Unfortunately, Venezuela’s last place position is accompanied by a 10.1% decline in mobile download speed.

Mobile speeds in South America’s largest cities

Comparing mean download speeds in the continent’s 10 most populous cities, we found that Rio was the fastest city in South America in Q1 2018. Lima, the second fastest city, was the only city in the top five not located in Brazil.

Salvador, Buenos Aires, Rio, Brasília and São Paulo all saw impressive double-digit increases in their mobile download speeds over the same period the year before.

Download Speeds in South America’s Largest Cities
Q1 2018
City Mean Download (Mbps) % Change YOY
Rio de Janeiro, Brazil 22.40 30.4%
Lima, Peru 21.32 -3.5%
Brasília, Brazil 19.55 27.5%
Salvador, Brazil 18.25 41.7%
São Paulo, Brazil 18.02 21.1%
Bogotá, Colombia 16.67 4.1%
Santiago, Chile 15.98 0.4%
Buenos Aires, Argentina 15.48 33.8%
Fortaleza, Brazil 14.33 4.4%
Caracas, Venezuela 9.06 -11.6%

Venezuela again fares poorly with a mean mobile download speed of 9.06 Mbps in Caracas, a decline of 11.6% since Q1 2017. Caracas was not the only city where internet speeds decreased, however, Lima saw a 3.5% decline.

How forward-looking carriers are improving their infrastructure (and speeds)

Carriers are a driving force in improving speeds in any market, so we dug into what some of the largest players in these six countries are doing to improve the speeds their customers are experiencing.

Avantel (Colombia)

Over the past four years, Avantel has been delivering a very competitive experience mainly using its AWS spectrum assets. Using Nokia’s modular infrastructure, Avantel has been able to seamlessly integrate IMS into the core and successfully launch services such as Voice over LTE (VoLTE), enabling a more efficient use of spectrum assets.

Bitel (Peru)

After launching LTE in the 900MHz band in 500 towns and cities at the tail end of 2016, Vietnamese-backed operator Bitel has committed to expanding their coverage and adding a capacity layer in the 2.6 GHz band over the next three years. This will surely offer a boost in performance and overall user experience.

Claro (Argentina, Brazil, Chile, Colombia, Peru)

In Brazil, Claro’s leading LTE network uses a healthy mix of low, mid and high frequency bands offering depth of coverage across a wide area. Using carrier aggregation, the operator is able to increase the speeds for users with capable handsets in 140 cities. In good signal conditions modern devices equipped with four receive antennas (4×4 MIMO) and capable of processing 8-bits per transmission (256 QAM) should allow subscribers to achieve even higher peak and average data rates in many areas. In some areas of São Paulo the operator is able to offer peak speeds of 1 Gbps by aggregating licensed (2.5 GHz) with the unlicensed (5 GHz) spectrum using technology called License-Assisted Access (LAA). In preparation for 5G, Claro and Ericsson staged a demo utilizing 100 MHz-wide channels of spectrum in the 15 GHz band, achieving speeds of up to 4.5 Gbps.

Entel Movil (Chile, Peru)

In Chile, the second largest mobile operator Entel Chile is leveraging its 700 MHz and 2600 MHz spectrum assets to provide a solid user experience across its footprint. In addition, a partnership with Ericsson ensures a rich portfolio of advanced LTE features and future upgradability to the upcoming technologies, including 5G.

Movilnet (Venezuela)

Following the launch of LTE in the 2100 MHz spectrum band in 2017, Movilnet is looking to expand its LTE capacity in 2019 as the CDMA sunset is scheduled for tail end of this year.

Movistar (Argentina, Chile, Colombia, Peru, Venezuela)

The major player across the South American continent is Movistar, owned by Spain’s Telefonica. Using its scale and financial might, the brand is able to provide an extremely competitive mobile experience by leveraging the latest LTE technologies, including Higher Order MIMO and Higher Order Modulation. This improves speeds, lowers the resource utilization and increases the network efficiency.

Nextel (Brazil)

In Brazil, Nextel’s LTE network is delivered over the 1800 MHz spectrum band, and the limited LTE spectrum assets (15 MHz wide) are making it difficult for the carrier to compete with larger operators. But with the help of Huawei’s LTE-Advanced equipment, the carrier is able to maximize the spectral efficiency by installing the 4T4R (four-transmit, four-receive) radios at cell sites in order to deliver speeds up to 225 Mbps in selected areas. It’s worth noting that Nextel Brazil is one of the last iDEN operators in the world, and the carrier has been delaying the sunset of this network technology originally launched in 1998. Once iDEN is decommissioned, the 800 MHz spectrum assets could be repurposed to deliver significant improvements in radio access, specifically in terms of network propagation and penetration.

Oi (Brazil)

After a recent financial struggle, which included filing the largest bankruptcy request in Brazil’s history, Oi is getting ready to launch LTE-Advanced in July with a plan to cover 26 cities by the end of 2018. Using two frequency bands (1800 MHz and 2600 MHz), Oi is looking to offer competitive network experience to over 40 million of its subscribers.

Personal (Argentina)

Telecom Personal now covers more than 1,000 cities and towns which make up more than 80% of the population of Argentina. About two-thirds of all the traffic is now carried over the carrier’s LTE network which supports the speeds in excess of 100 Mbps by combining 700 MHz, 2100 MHz and 2600 MHz spectrum bands. Together with Nokia, Telecom Personal successfully completed 5G trials in Buenos Aires using 400 MHz of the millimeter wave spectrum in the 28 GHz band, reaching speeds of 10 Gbps.

Telefonica Brasil (Brazil)

Telefonica Brasil, operating as Vivo, holds a similar spectrum portfolio to Claro of Band 28, Band 3 and Band 7 assets. Using the available tools from the LTE-A toolbox (carrier aggregation, 256 QAM and 4×4 MIMO), the operator is able to offer speeds in excess of 530 Mbps in selected areas on capable devices powered by Qualcomm Snapdragon X16 and X20 LTE modems. Vivo also offers Voice Over LTE (VoLTE) service in two markets, Rio Verde and Brasília.

TIM Brasil (Brazil)

Leveraging a long-term partnership with Nokia, TIM Brasil has been able to provide LTE service across many regions of the country. Using Nokia’s scalable “5G-ready” AirScale radio platform, TIM has been able to deliver the latest LTE-Advanced network features and pave the way for the upcoming 5G wave. TIM also prides itself in being the first Latin American VoLTE operator, launching the service in Brasília in July 2017 and subsequently in 20 additional markets.

Tigo (Colombia)

Back in April, Tigo has activated carrier aggregation in parts of Bogotá, claiming the title of the first LTE-Advanced network in Colombia. As a result, users in the busiest areas of the nation’s capital should be able to experience speeds in excess of 100 Mbps.

WOM (Chile)

After the initial launch of LTE in 2015 and the continued rollout in 2016, WOM continues to provide LTE service in the 2100 MHz band, and aims to expand its market share over the next 5 years from 11% to 25%.

Learn more about the insights offered from Speedtest Intelligence, including data on the speed and quality of your networks and those of your competitors.

Ookla retains ownership of this article including all of the intellectual property rights, data, content graphs and analysis. This article may not be quoted, reproduced, distributed or published for any commercial purpose without prior consent. Members of the press and others using the findings in this article for non-commercial purposes are welcome to publicly share and link to report information with attribution to Ookla.

| June 12, 2018

How Much Have Wi-Fi Speeds Improved at the Largest Airports in the US and Canada?

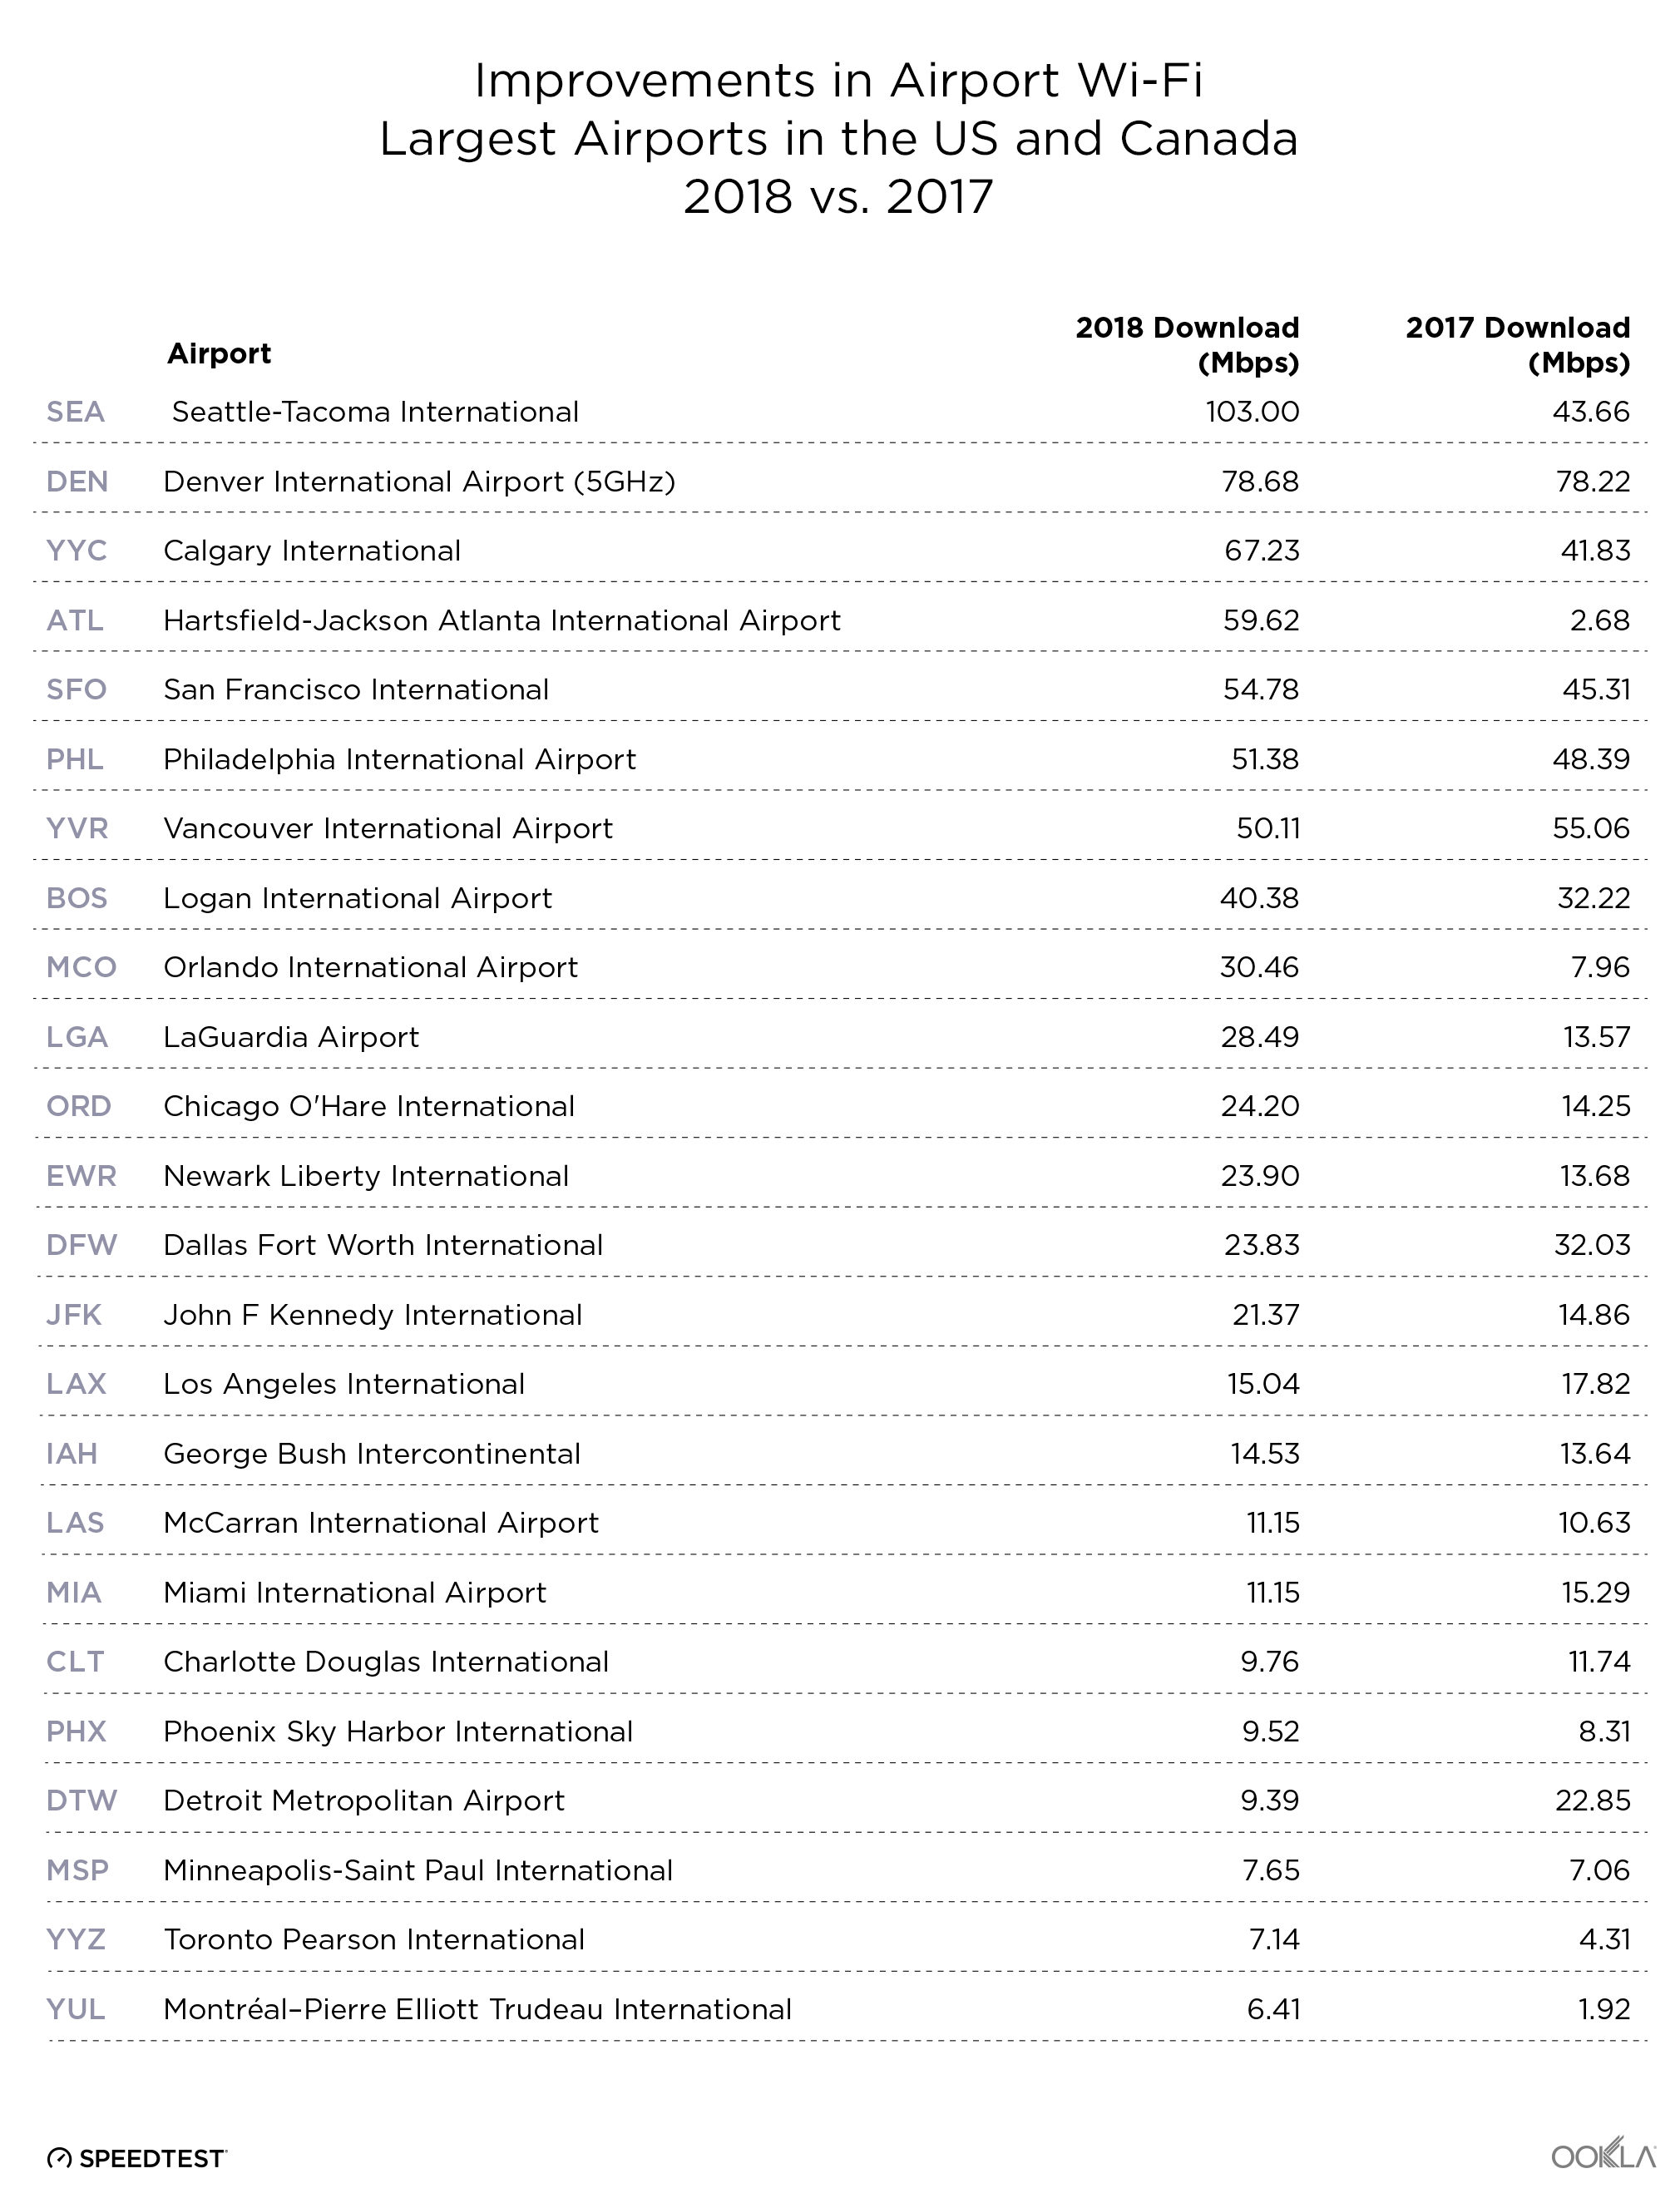
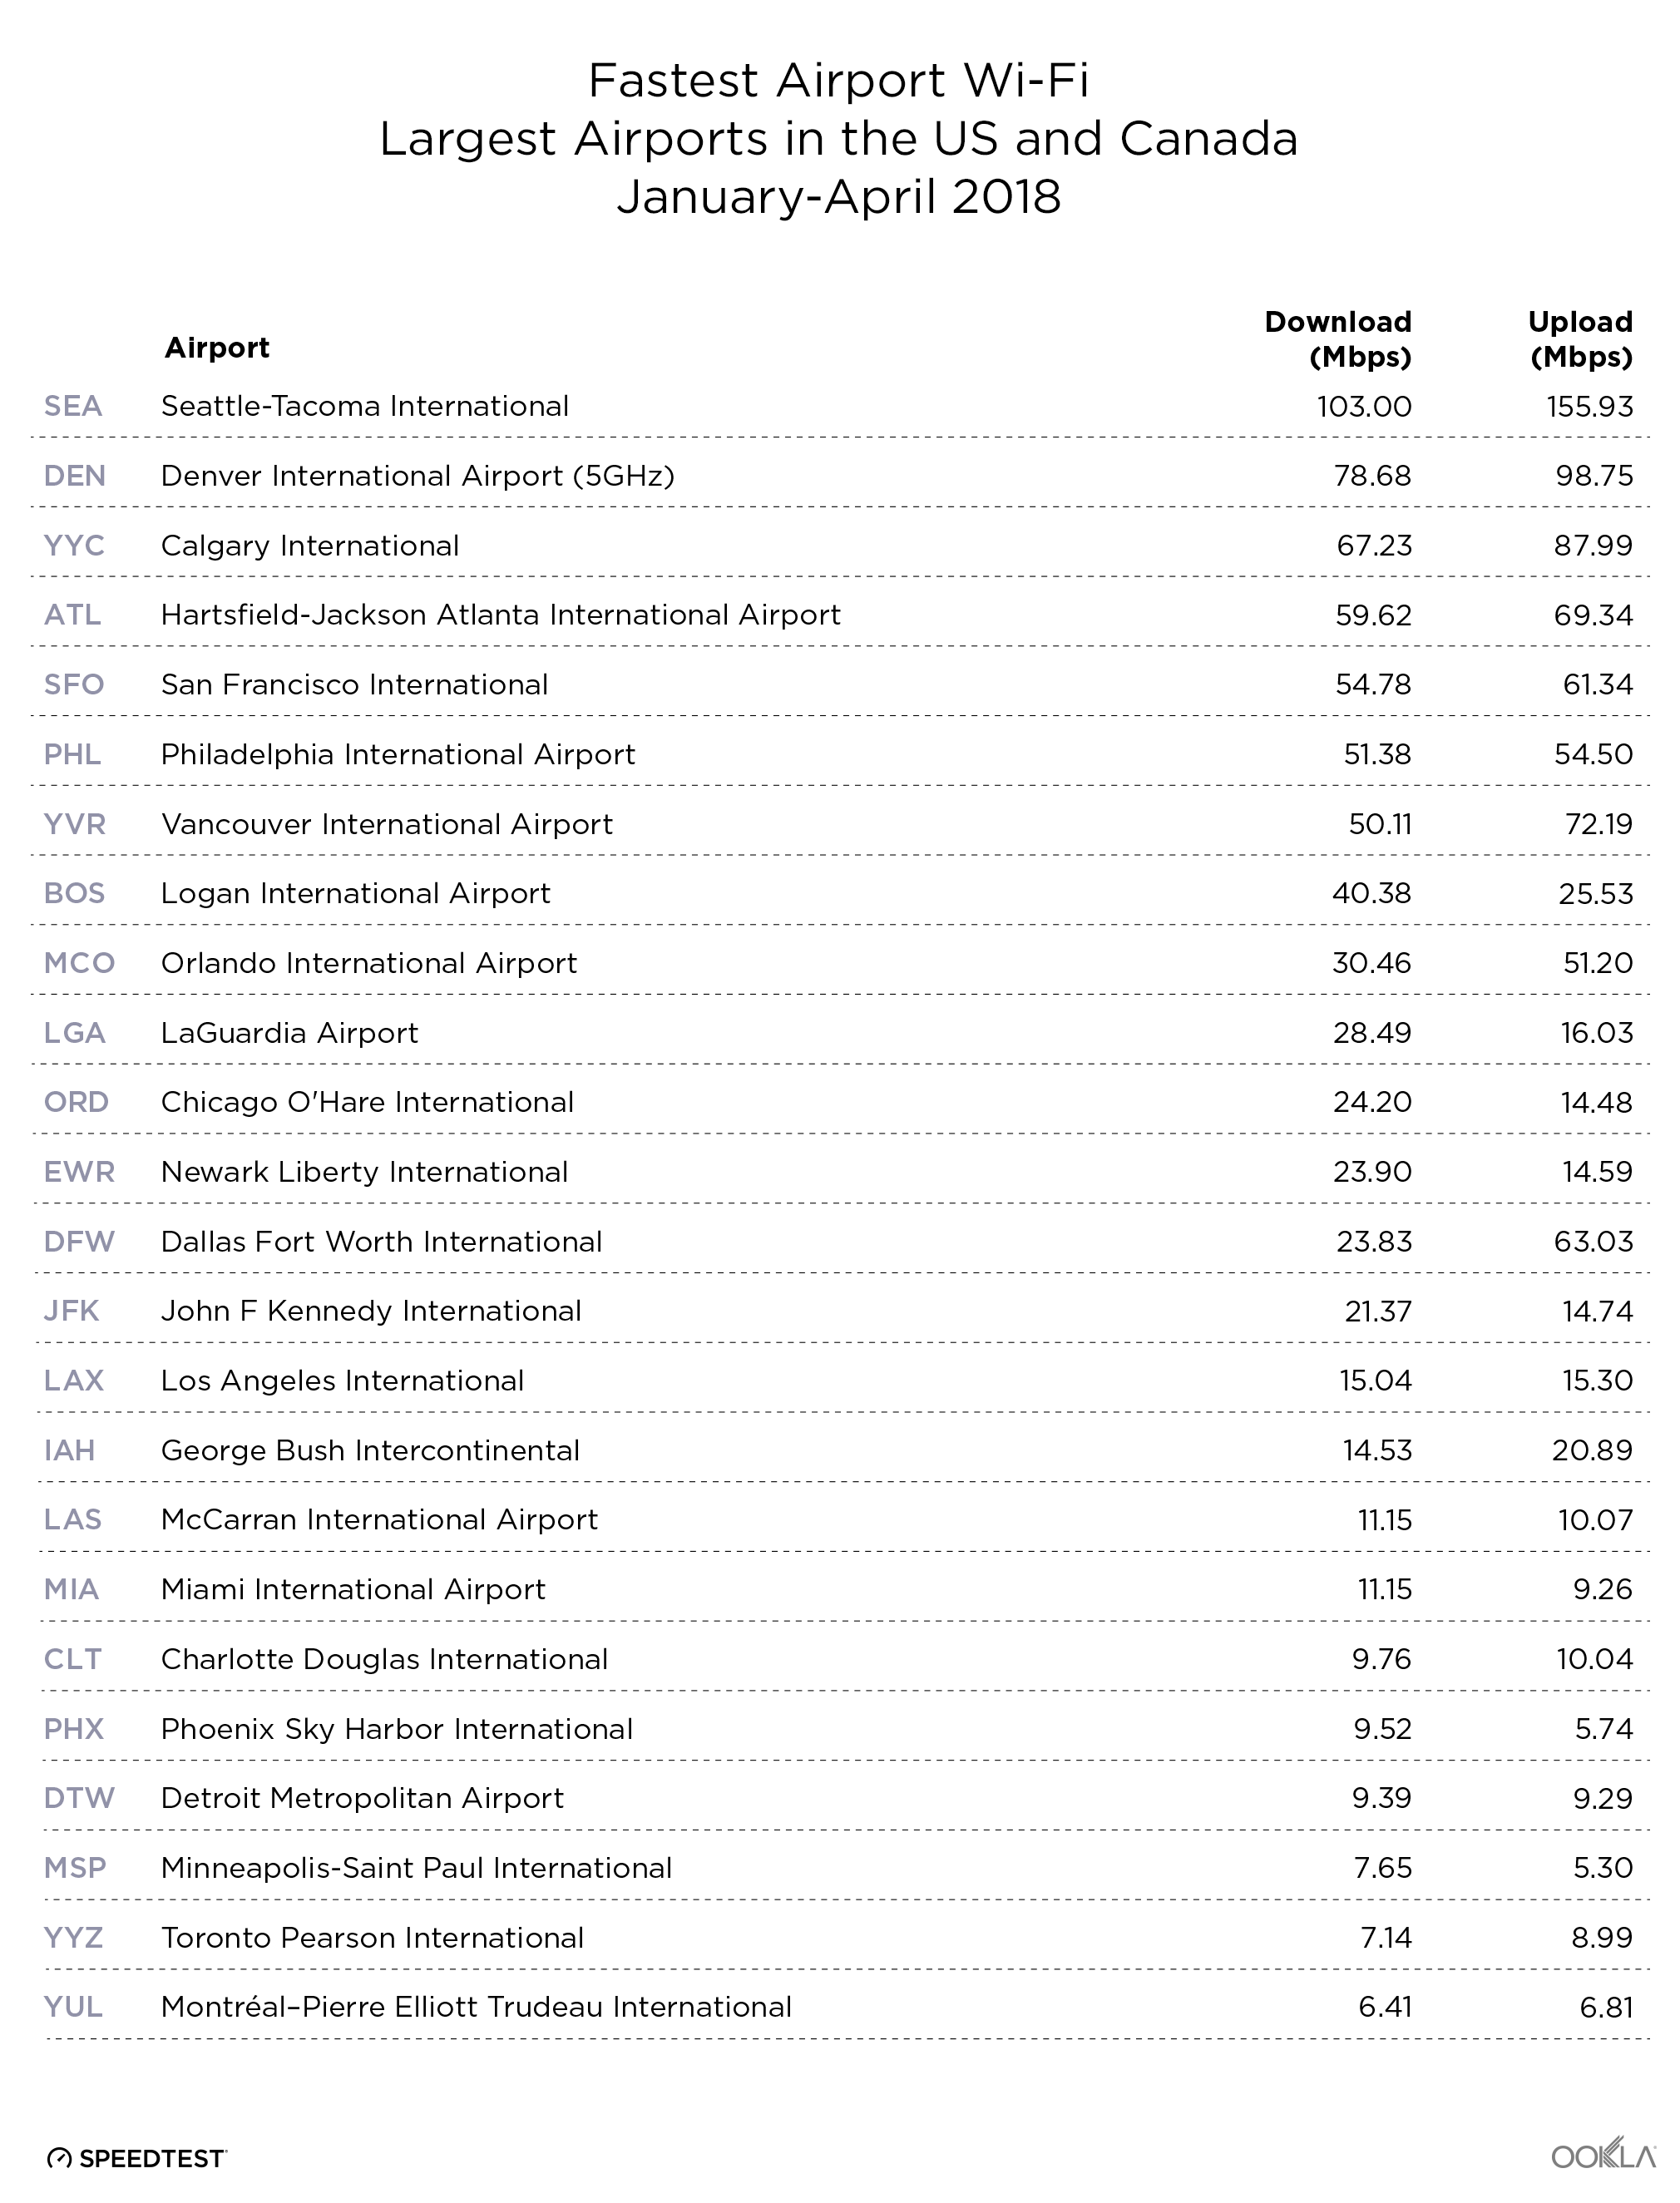
Summer’s here and travelers across North America are flooding airports with suitcases and mobile devices, so we’re back with a fresh look at Wi-Fi speeds in the busiest airports in the U.S. and Canada. We can’t help you with the long security lines, but we can give you a heads up on whether the Wi-Fi’s fast enough to keep you entertained or if you’re better off wandering in search of the best coffee on each concourse.

This year we looked at Speedtest results from January through April 2018 on free Wi-Fi at each airport. We then compared this year’s speeds with those from March through May 2017 as outlined in our fastest airports coverage last year.

Seattle takes the lead

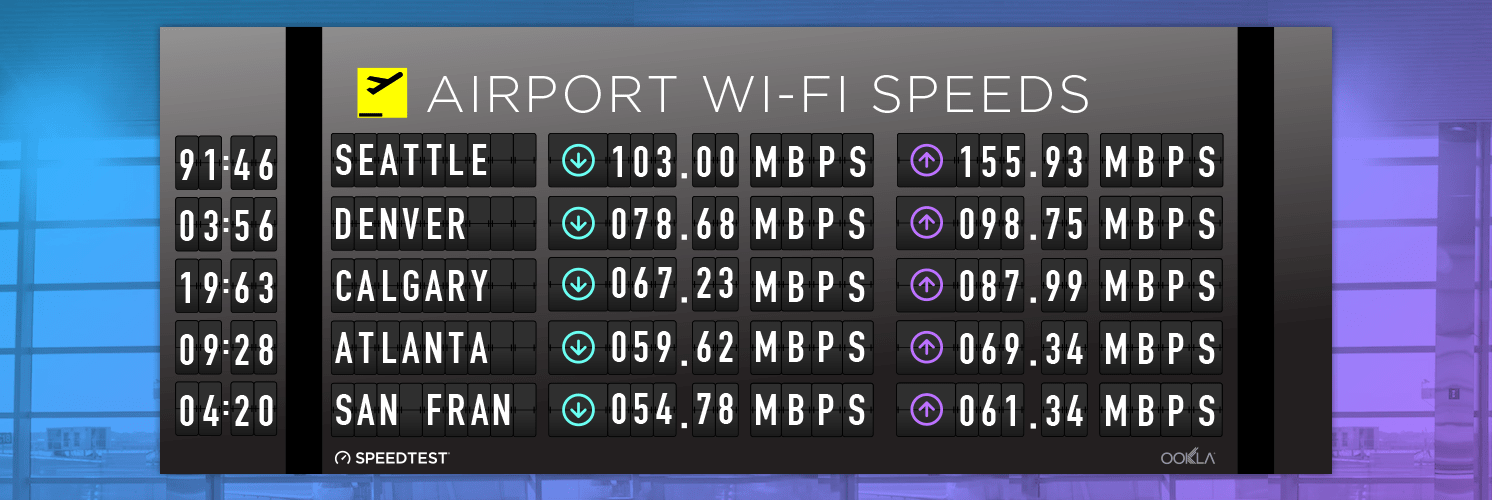
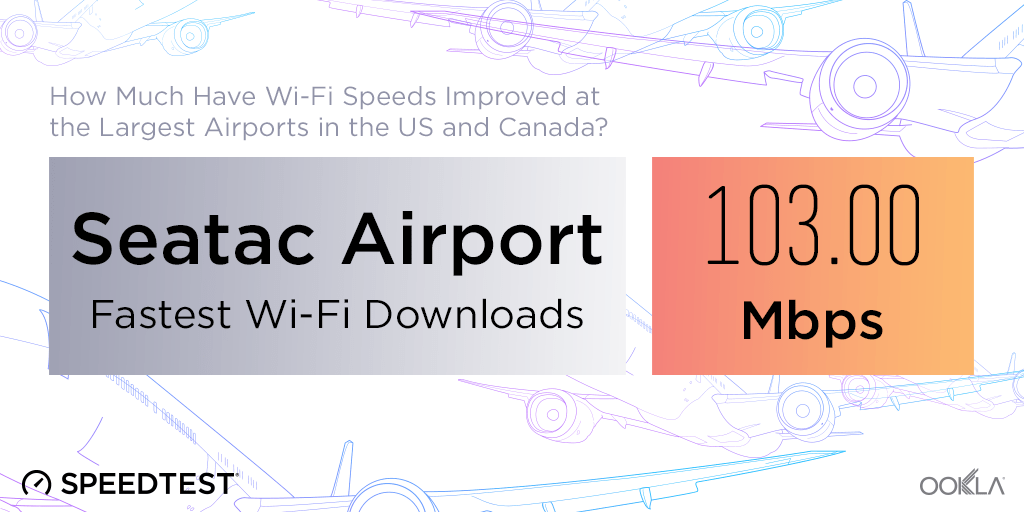
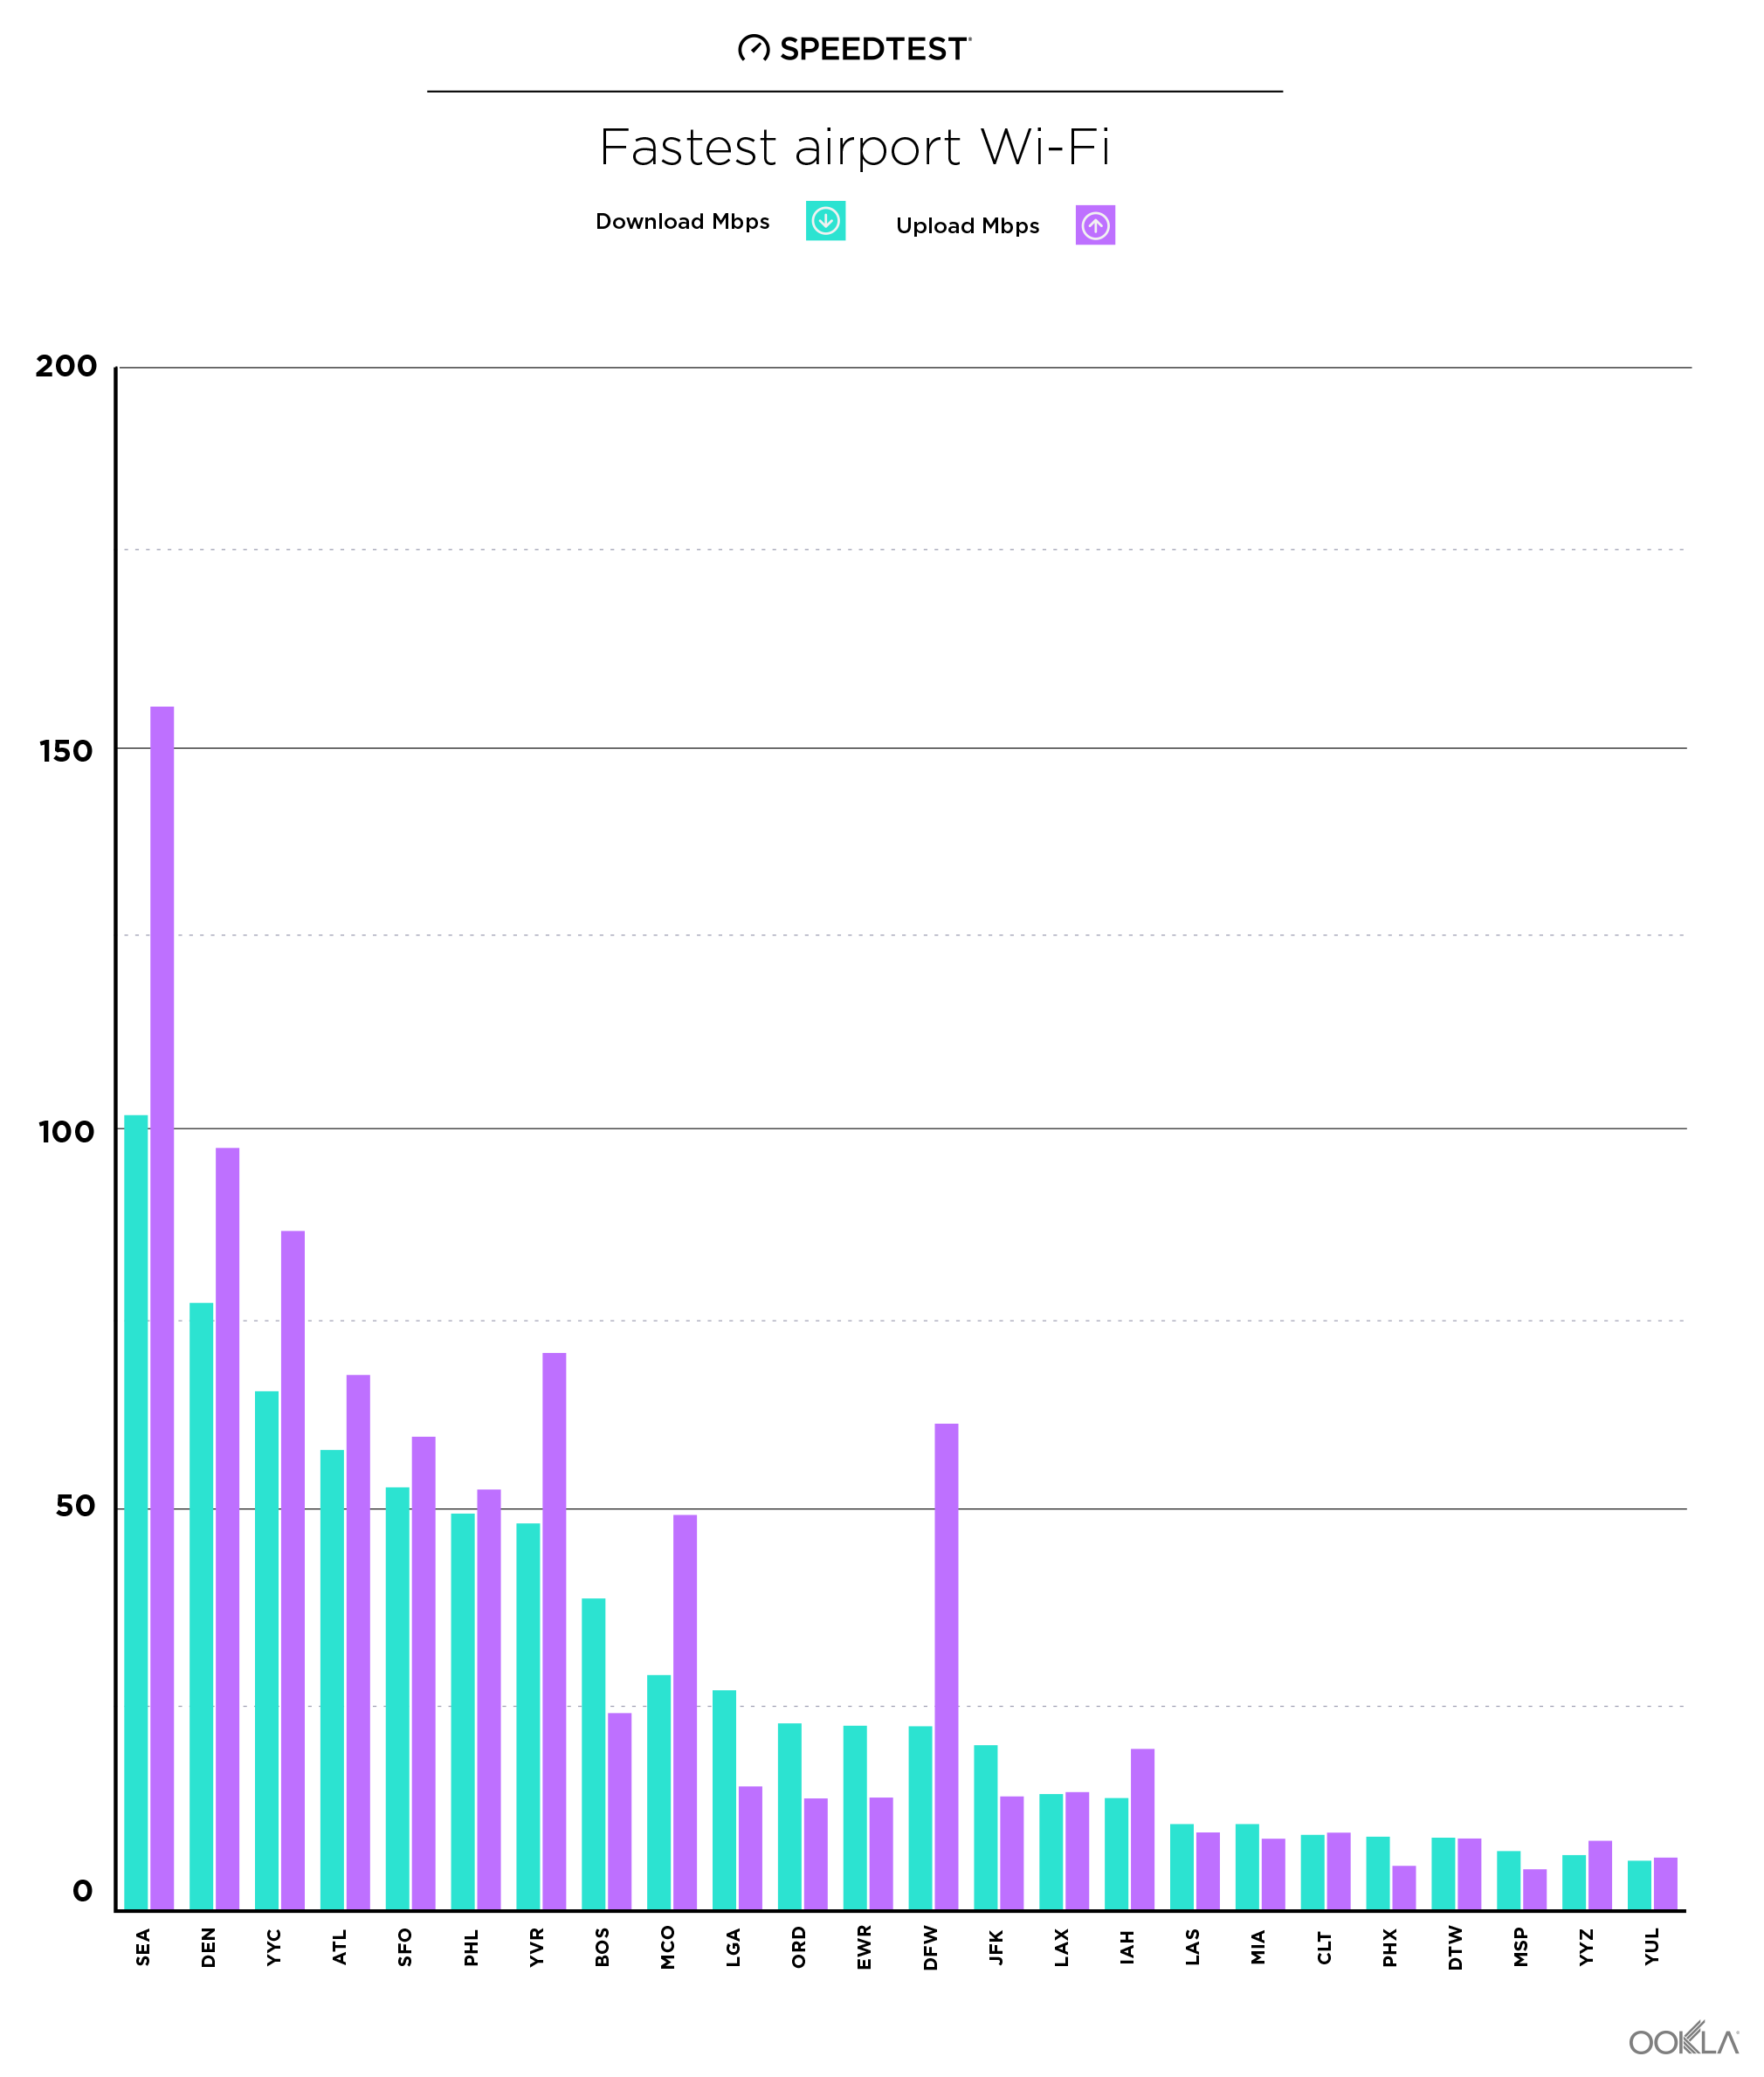
Seattle has now taken the crown of fastest airport Wi-Fi in North America from Denver, a strong contender that had held the title for two years running. Seattle’s also faster than our other global winners from last year including Gold Coast Airport in Australia, Congonhas-São Paulo Airport in Brazil, Dubai International, Seoul Incheon International Airport in South Korea, Sheremetyevo International Airport in Russia and Mohammed V International Airport in Morocco.

One interesting note about Denver’s Wi-Fi setup is that they appear to have separate SSIDs set up for 5 GHz and 2.4 GHz connections. The 5 GHz band is very effective for providing lots of capacity within relatively short distance and usually at faster speeds. But some older devices only operate on 2.4 GHz connections, so it’s nice to see that option called out, and 2.4 GHz can provide connectivity over a longer distance which could be crucial at a large airport like Denver. With a mean download speed of 18.04 Mbps, Denver’s 2.4 GHz SSID was significantly slower than its 5 GHz counterpart. We saw a similar split of service when investigating speeds at Seoul Incheon International Airport.

Third place Calgary had the fastest Wi-Fi download speed of any of the airports we looked at in Canada.

There are far too many airports on this list with a mean download of less than 10 Mbps. Free Wi-Fi is good. Free Wi-Fi that’s fast enough to keep travelers happily entertained is even better.

Atlanta’s massive improvement

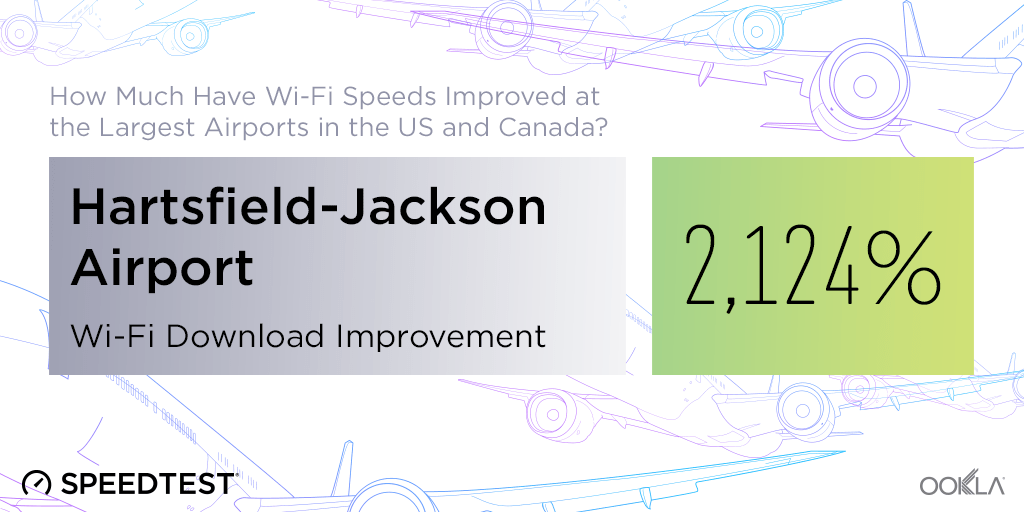
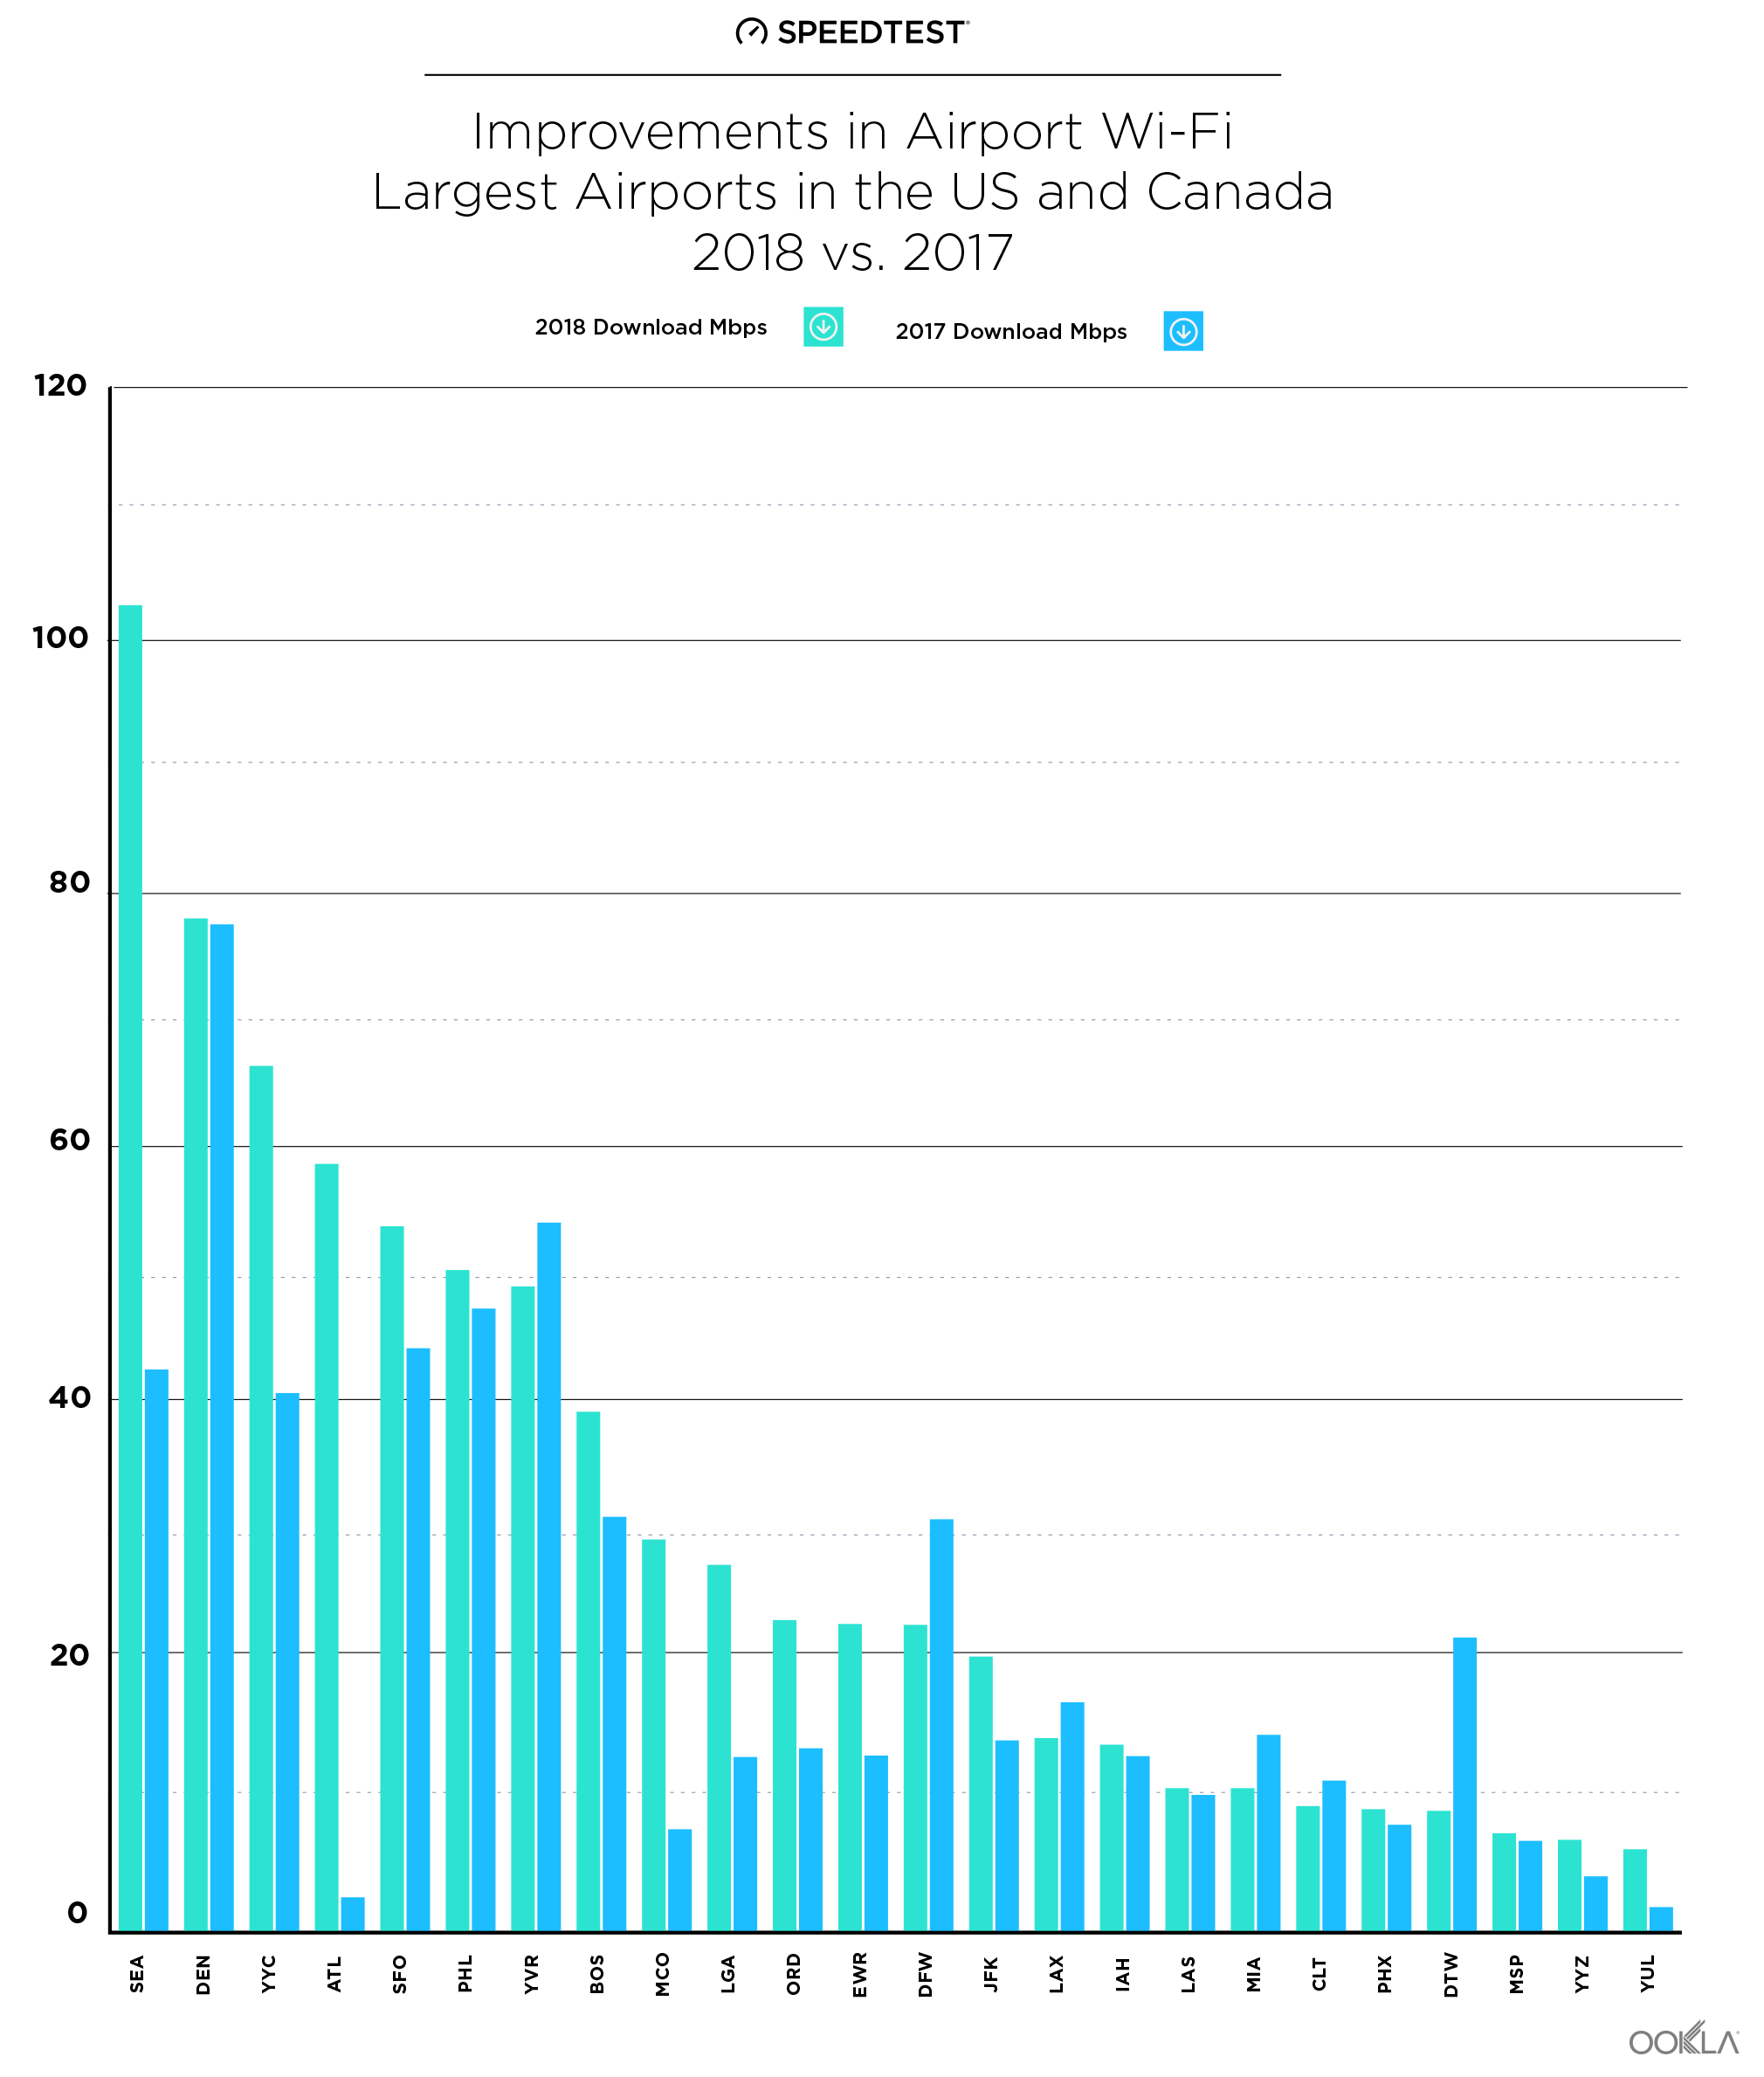
In Atlanta, mean download speed over Hartsfield-Jackson’s free public Wi-Fi jumped over 2,124% since last year, despite being out of commission for 10 days after a cyber attack. Other airports with very impressive improvements to mean download speed over Wi-Fi include Orlando (over 282%) and Montréal (over 233%).


Keeping on top of Wi-Fi improvements can make all the difference in a fast-paced world. For example though Denver’s still fast, their speeds remained relatively flat while Seattle’s jumped 135.9% to take the lead.

What does it take to vastly improve the speeds on a Wi-Fi network? In 2014, Atlanta built a free wireless network based on 802.11a/b/g/n technology. According to Sharon Brown, Assistant General Manager of IT Operations at Hartsfield-Jackson Atlanta International Airport, the improvements we saw are related to recent implementation of approximately 1400 Cisco 3802 access points which use 802.11ac Wave 2 and m-Gig technology. This supports a higher wireless network speed and more robust wireless coverage throughout the passenger terminal. They’re also using four Cisco 8540 next-generation Wireless LAN Controllers, operating in high availability mode and 3850XU switches with UPOE capabilities to support the 3802 access points at a network speed of 5.5G. The 3850 switches also allow for 10G uplinks to the distribution layer of the network. And three 20G circuits from the local carrier help facilitate all that passenger traffic. A professional site survey utilizing Ekahau® Site Survey Pro is part of ongoing efforts Atlanta is making to fine-tune their network.

Orlando’s Wi-Fi network benefited from similar upgrades. Jason Gross, Assistant Manager of Networks at Greater Orlando Aviation Authority said, “At the time that the Ookla report came out last year, we were in the midst of replacing our older 802.11b/g/n APs with newer 802.11ac Wave 2 APs.” As part of larger renovation projects at the airport, Gross said, “We engaged our Wi-Fi equipment vendor, Aruba Networks, to work out a design that would provide better coverage and more consistent service to our customers. The design involves steering more clients to the 5 GHz band and implementing a high-density design to cover the 2.4 GHz and 5 GHz channels in a non-overlapping manner. This makes it more likely for a client to connect to an access point on a clearer channel.” The Orlando airport has also removed a 10 Mbps cap and increased their bandwidth to the internet from 1 Gbps to 5 Gbps. Orlando continuously monitors utilization to ensure they always have enough capacity to meet demand from the travelling public.

Overall improvement is great, but it’s also important to note that speed still matters. For example, the mean download speed at Montréal–Pierre Elliott Trudeau International is still at the bottom of our list despite a massive percentage improvement.

And there were far too many airports that saw declines in Wi-Fi speeds including: Detroit (58.9% decrease), Miami (27.1% decline) and Dallas Fort Worth (25.6% decline).

How are the speeds where you’re traveling? Take a Speedtest on iOS or Android to help us all better understand internet performance around the globe.

Ookla retains ownership of this article including all of the intellectual property rights, data, content graphs and analysis. This article may not be quoted, reproduced, distributed or published for any commercial purpose without prior consent. Members of the press and others using the findings in this article for non-commercial purposes are welcome to publicly share and link to report information with attribution to Ookla.

| May 15, 2018

Analyzing the Reach of South Africa’s Modern Mobile Speeds

Though South Africa has the fastest average mobile download speed in Africa (22.42 Mbps in Q1 2018), the story is not that simple. Download speed in the country’s fastest province (Free State) was 38.7% faster than that in the slowest (Northern Cape), while speeds in the country’s largest cities are relatively similar.

To better understand South Africa’s mobile landscape, we analyzed data from Speedtest Intelligence® during Q1 2018. We considered mean speeds for each of the country’s provinces and the five most populous cities.

South Africa’s fastest (and slowest) provinces

The three South African provinces with the fastest average download speeds (Free State, KwaZulu-Natal and Gauteng) are all in the center of the country. Of those, both KwaZulu-Natal and Gauteng are densely populated while Free State is less so.

The two slowest provinces (Northern Cape and North West) are both along South Africa’s northern border and are among the country’s least densely populated. The third slowest province, Mpumalanga, is more centrally located with a border along Gauteng and the countries of Mozambique and the Kingdom of eSwatini (formerly known as Swaziland).

Mobile speeds in South Africa’s largest cities

Looking at South Africa’s five most populous cities, we find that the mean download speed in first-place Durban during Q1 2018 was 17.3% faster than that of fifth-place Cape Town.

Mobile Internet Speeds in South Africa’s Largest Cities
Q1 2018
City Download (Mbps) Upload (Mbps)
Durban 26.66 9.12
Pretoria 24.25 8.54
Johannesburg 23.62 9.17
Soweto 22.90 8.71
Cape Town 22.72 7.33

The band of speeds these cities fall into is relatively narrow, though. And although Pretoria’s download speed was 5.9% faster than that in nearby Soweto, a casual user would not notice the difference in performance between the two.

How fast is your mobile connection? Take a Speedtest on Android or iOS to show us what speeds you’re experiencing.

Ookla retains ownership of this article including all of the intellectual property rights, data, content graphs and analysis. This article may not be quoted, reproduced, distributed or published for any commercial purpose without prior consent. Members of the press and others using the findings in this article for non-commercial purposes are welcome to publicly share and link to report information with attribution to Ookla.

| May 2, 2018

The American Globetrotter's Guide to Roaming Speeds

Mobile roaming has come a long way from the days when I spent most of my tour of China touring hotel lobbies desperately hoping to connect my U.S. flip phone to the Wi-Fi. Not only can you actually get a signal in most countries these days, some carriers offer special packages for the jet set so you don’t have to pay extra for roaming calls and data.

But how are the speeds?

Using Q1 2018 Speedtest® data, we’re here to report on mobile roaming speeds for U.S. consumers in 15 popular destinations, including which carriers are fastest where. For overall speeds we look at data from all devices and when we analyze carriers we look only at data for modern (LTE-capable) devices.

Where roaming speeds will (and will not) let you down

Get thee to Canada! Our analysis of roaming Speedtest results found that U.S. customers in Canada saw a mean download speed of 42.03 Mbps during Q1 2018. That’s not quite as fast as the 45.28 Mbps Canadians receive on their home mobile networks, but it beats the 27.08 Mbps average in the U.S.

Roaming Speeds for U.S. Customers Abroad
Q1 2018
Country Download (Mbps) Upload (Mbps)
Canada 42.03 13.50
South Korea 21.81 8.60
Mexico 18.02 10.18
Spain 13.23 7.09
Italy 12.70 6.38
France 12.48 5.45
Australia 11.84 6.96
Japan 10.91 4.79
United Kingdom 10.40 5.68
Germany 9.02 4.03
Costa Rica 7.72 4.11
China 7.05 3.91
Dominican Republic 5.75 3.58
India 2.96 1.96
The Bahamas 1.70 2.99

Second place South Korea showed roaming speeds for U.S. travelers about half as fast as those in Canada. Mexico was third fastest. The middle tier of the roaming speed ranking is taken up mostly by western European countries (with Japan and Australia to break up the pack).

At the bottom of the spectrum, Bahamian roaming speeds are painfully slow. They aren’t much better in India or the Dominican Republic.

A lot of factors go into the roaming speeds you’ll experience abroad, including how carriers prioritize out of country traffic, something that’s decided between each individual carrier in each individual country.

How does your carrier stack up?

Your roaming experience on your next trip is going to depend a lot on which carrier you have, so we broke our roaming speed analysis of Speedtest results on modern devices down to the carrier level.

US Carrier Speeds While Roaming Abroad
Q1 2018 | Mean Download (Mbps)
Country AT&T Sprint T-Mobile Verizon Wireless
Australia 21.24 N/A 2.14 22.14
Canada 26.53 27.65 53.56 43.22
China 17.23 4.77 1.15 13.15
Costa Rica 13.67 N/A 0.70 14.86
Dominican Republic 11.00 N/A 0.57 7.68
France 22.72 N/A 1.96 26.30
Germany 20.55 N/A 1.86 20.58
India 4.92 1.70 0.79 7.13
Italy 24.05 N/A 1.99 25.19
Japan 18.22 24.79 1.40 11.46
Mexico 19.95 9.66 17.22 22.35
South Korea 27.97 17.49 21.67 N/A
Spain 29.27 N/A 1.18 24.82
The Bahamas 1.79 N/A 0.25 3.53
United Kingdom 19.87 9.07 1.74 16.61

From the above, it looks like there’s no one right answer for the fastest roaming carrier. And there are other things to consider when roaming, too, like does your carrier offer a special plan that includes free roaming or are you paying through the nose.

It’s important to remember that roaming comes at a cost to carriers, which means that if your carrier includes free or low-cost roaming on almost all types of plans, the trade-off might be that you get slower speeds than you would with another carrier.

So if speed is your primary criterion, there are two standouts on this list. Verizon wins eight of the 15 countries we analyzed and AT&T wins six. T-Mobile and Sprint each win one country. We excluded Sprint from the running in eight countries because of a low number of test results.

Are you roaming (for business or pleasure) this summer? Take a Speedtest on Android or iOS to show us how fast (or slow) your connection is.

Ookla retains ownership of this article including all of the intellectual property rights, data, content graphs and analysis. This article may not be quoted, reproduced, distributed or published for any commercial purpose without prior consent. Members of the press and others using the findings in this article for non-commercial purposes are welcome to publicly share and link to report information with attribution to Ookla.

| April 17, 2018

EU Roaming is Free! But is it Fast?

When the European Commission put an end to roaming charges within the European Union (EU) last summer, they gave residents of member countries the freedom to take their mobile phones with them on vacation without fearing the bill when they got home. But how well are those phones performing when faced with foreign cell towers?

To find out, we took a look at Speedtest data from the first quarter of 2018 to see which countries’ residents are having the best (and worst) internet speed experiences abroad.

How much download speeds drop when you cross a border

The mean download speed in the EU when customers are at home is 30.57 Mbps, but that slows 16.6% to 25.50 Mbps when Europeans roam across a border.

Because your experience of speeds abroad is going to be based on what you’re used to, we compared countries based on the amount download speeds decreased rather than the actual speed abroad. Italians enjoyed a 15.4% increase in download speed when traveling. Estonians, Latvians and the Portuguese also saw faster downloads abroad.

Mobile Download Speeds
EU Countries | Q1 2018
Country Local (Mbps) Roaming (Mbps) % Change
Austria 31.62 28.66 -9.4%
Belgium 44.56 26.00 -41.7%
Bulgaria 35.71 22.31 -37.5%
Croatia 34.75 31.36 -9.8%
Cyprus 25.34 23.40 -7.7%
Czech Republic 38.30 25.78 -32.7%
Denmark 42.55 22.40 -47.4%
Estonia 31.98 34.24 7.1%
Finland 32.68 29.99 -8.2%
France 32.35 24.47 -24.4%
Germany 26.03 26.00 -0.1%
Greece 34.48 28.40 -17.6%
Hungary 46.10 26.01 -43.6%
Ireland 19.98 19.00 -4.9%
Italy 30.32 34.98 15.4%
Latvia 27.37 28.97 5.8%
Lithuania 36.80 28.28 -23.2%
Luxembourg 42.43 22.46 -47.1%
Malta 42.14 25.05 -40.6%
Netherlands 53.07 25.46 -52.0%
Poland 22.05 20.29 -8.0%
Portugal 26.45 27.44 3.7%
Romania 28.74 21.95 -23.6%
Slovakia 28.79 23.73 -17.6%
Slovenia 28.42 27.15 -4.5%
Spain 31.94 24.32 -23.9%
Sweden 38.23 26.13 -31.7%
United Kingdom 26.16 21.08 -19.4%

On the other end of the spectrum, Dutch travelers experienced a 52% decrease in download speed when using mobile phones elsewhere in the EU. Residents of Denmark, Luxembourg, Hungary, Belgium and Malta all saw decreases of more than 40% when roaming.

In some cases, the decrease in download speed is due to the country’s relative speed. For example, the Netherlands has recently had the third fastest mobile speeds in the world according to the Speedtest Global Index so its residents are likely to see much slower speeds when traveling anywhere but Norway and Iceland. Other differences are probably better explained by how carriers prioritize out of country traffic, a decision that’s made between each individual carrier in each individual country.

Slow or not, at least roaming no longer comes with extra fees for EU residents. Unless you’re British, of course. With Brexit looming, not only could citizens of the UK have to return to paying roaming fees, the download speed they’ll be paying for abroad will be 19.4% slower than it is at home.

Again, a lot of factors go into what speeds you experience while roaming the continent. We hope this data will help you make an informed choice about your carrier depending on what your roaming data needs are. Share your experience by taking a Speedtest on Android or iOS

Ookla retains ownership of this article including all of the intellectual property rights, data, content graphs and analysis. This article may not be quoted, reproduced, distributed or published for any commercial purpose without prior consent. Members of the press and others using the findings in this article for non-commercial purposes are welcome to publicly share and link to report information with attribution to Ookla.

| March 7, 2018

India’s Digital Divide: How Broadband Speed Splits the Nation

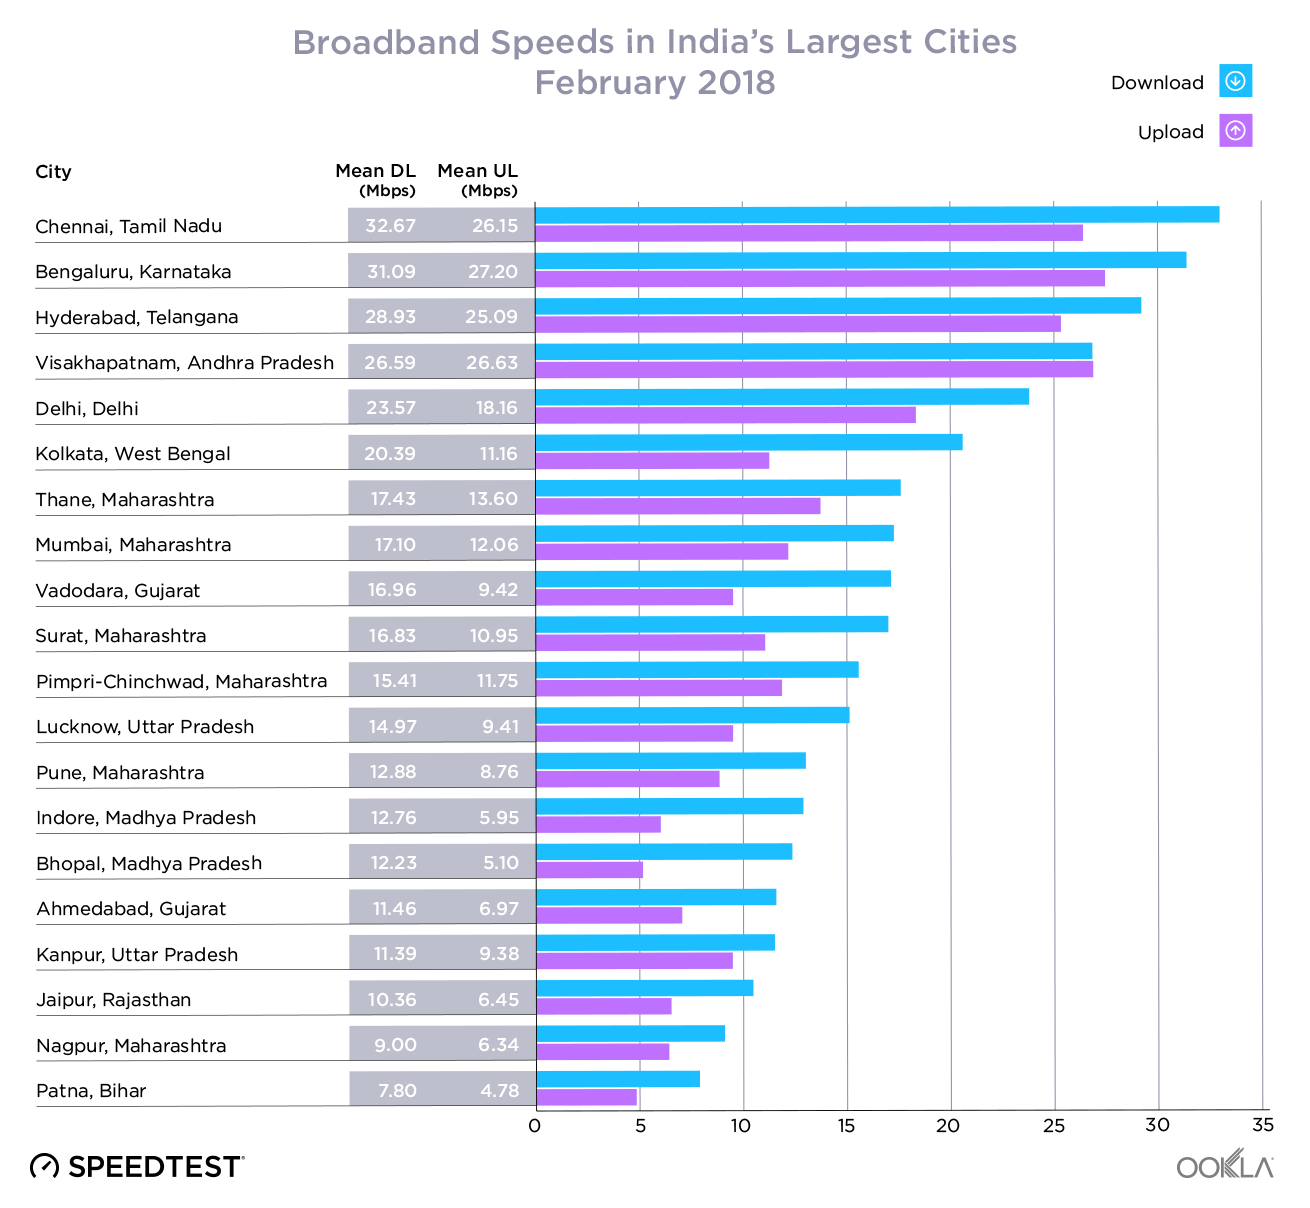
India ranked 67th in the world in February for download speed over fixed broadband based on the Speedtest Global IndexTM, with an average speed of 20.72 Mbps. But averaging across a country as large and diverse as India can mask some pretty important differences.

To get a fuller picture of fixed broadband performance on the Indian subcontinent, we’re taking a look at the average download speeds in every state and union territory that showed Speedtest results for more than 100 users in February 2018. We’re also comparing speeds in the 20 largest cities in India.

Exploring internet speeds in India’s states and union territories

India is making strides in an area where many countries struggle — connecting rural communities to the internet. Fiber connections have been extended to 250,000 (2.5 lakh) rural villages in India so far under the first phase of Bharat Net. In addition, Phase 2 of Bharat Net will expand the number of Wi-Fi hotspots that connect villages to broadband from 38,000 to 500,000 (5 lakh) so that every village in India has at least one.

This investment in rural connectivity might be one reason that the average broadband speeds we’ve seen across India’s states and union territories don’t seem to correlate to population density. South India occupies four of the five top spots on the list of states and union territories with the fastest broadband download speeds in India, and North India holds four of the top ten. Karnataka is fastest with a mean download speed of 28.46 Mbps during the month of February, 37.4% faster than the country as a whole. Tamil Nadu is close behind at 27.94 Mbps.

On the other end of the spectrum, Northeast India accounts for four of the five slowest states and union territories we analyzed and seven of the ten slowest. Mizoram is the slowest with a mean download speed of 3.62 Mbps in February, 82.5% slower than the country as a whole. Manipur takes second-to-last place at 4.30 Mbps and Tripura barely edges into third-to-last place at 4.52 Mbps.

Which city in India has the fastest fixed broadband?

Fastest Cities in India Feb 2018

When looking at the 20 largest cities in India, Chennai is the fastest with a mean download speed over fixed broadband that’s 57.7% faster than India’s as a whole. Bengaluru, Hyderabad, Visakhapatnam and Delhi all score above the country’s average.

The slowest of these large cities, Patna, was 62.4% slower than the country’s average for mean download speed. Nagpur, Jaipur, Kanpur, and Ahmedabad round out the bottom five. It’s also notable that the download speeds of Kanpur, Lucknow, Pune and Nagpur are significantly slower than that of their respective states.

Is your broadband living up to these speeds? Take a Speedtest on the web or from our desktop apps to show us what speeds you’re seeing.

Ookla retains ownership of this article including all of the intellectual property rights, data, content graphs and analysis. This article may not be quoted, reproduced, distributed or published for any commercial purpose without prior consent. Members of the press and others using the findings in this article for non-commercial purposes are welcome to publicly share and link to report information with attribution to Ookla.

| February 14, 2018

Android or iOS, Who’s Winning Gold in the Global Speed Race?

All eyes are on South Korea this month as the world’s top athletes compete to stand on top of that all-important podium. But what we’re interested in is how their mobile networks are holding up back home. So we took a look at Speedtest results to get a global picture of the competition between Android and iOS — the operating system that powers all those Apple devices — by comparing speeds, top devices and operating systems by country.

In order to qualify for this round of analysis, countries had to show Speedtest results from at least 670 unique mobile devices during January 2018.

Who’s faster? #TeamAndroid or #TeamiOS?

You might think that speeds on Android and iOS are relatively similar within a country. Not true.

While the average country-level speeds we report in the Speedtest Global Index are a good indicator of the baseline internet speeds in a country (and how they compare with the world), there’s more to the story. From device age to market saturation, there are a lot of factors that play into potential differences in speeds experienced by users on Android versus those on iOS.

But those effects vary by country. And this is where things get really interesting.

Android’s best showings

Android devices saw a faster mean download than those on iOS in 25 of the countries we surveyed. Android download speeds were 24.9% higher than those on iOS in Iraq, 23.9% in South Africa, 19.0% in Mongolia, 17.2% in Hong Kong and 12.8% in Kuwait.

Where iOS wins

On the other hand, when iOS devices are faster, they’re a lot faster. There are 60 countries on our list where the mean download speed on iOS is more than 10% higher than that on Android. Highlights include: Thailand where mean speed for iOS results was 60.5% faster than those over Android, Nigeria (51.7%), Kenya (43.4%), Bangladesh (41.5%) and Japan (38.3%).

What devices are people really using?

Poke around the above map a little and you’ll see the list of the four most common devices we were able to identify in our results.

Apple dominates

With only 28 different models of iPhone in our results and 1,983 different types of Android phones, math is on Apple’s side when it comes to ranking for top devices. The iPhone 7 takes the top spot in 72 countries, including Brazil, Germany, Italy, Russia, Saudi Arabia and the United Kingdom. The iPhone 6 leads the list in 12 countries, including China, Malaysia and Thailand. Georgia was the only country whose most common device was the iPhone 5.

Android wins for diversity

While only 16 countries showed an Android device as the most common phone in our data, it was refreshing to see a wide number of brand names. The Samsung Galaxy S7 topped the list in Croatia, Israel and Peru. The Samsung Galaxy S7 Edge was the leading device in Honduras, Pakistan and Tunisia. The Samsung Galaxy S8 was the most popular device in Serbia.

Six countries showed the Xiaomi Redmi Note 4 as their most popular device, including Bangladesh, Belarus, Greece, India, Indonesia and the Ukraine. The Xiaomi Redmi 4X was the most common device in Kyrgyztan. In Finland the most common device in our results was the OnePlus 3T. In Algeria it was the Oppo F1s.

The diversity of manufacturers increases as we look beyond the top spot. Despite difficulty cracking the US market, the Huawei Honor 8 is the number 2 phone in Finland and two Huawei models make number 4 in Nigeria and Serbia. We also saw a lot more Samsungs in the number 3 and 4 slots.

Ookla retains ownership of this article including all of the intellectual property rights, data, content graphs and analysis. This article may not be quoted, reproduced, distributed or published for any commercial purpose without prior consent. Members of the press and others using the findings in this article for non-commercial purposes are welcome to publicly share and link to report information with attribution to Ookla.