| January 31, 2018

Which Mobile Carrier Won Sunday’s Big Football Game?

Football’s biggest game is this weekend and we’re excited to hear if all the reported mobile and Wi-Fi investments at U.S. Bank Stadium are up to the challenge on Sunday. We’ll follow up on that next week, but in the meantime we’re limbering up by checking out mobile internet speeds at the Eagles’ and Patriots’ home stadiums over the season. We’re also offering a preview of the performance we’ve seen at U.S. Bank Stadium so far this season.

We looked at stadium speeds for August 1, 2017 through January 30, 2018 and compared speeds by carrier using Speed Score — a combined measure of each provider’s download and upload speed at the 10th, 50th and 90th percentiles — on modern devices (i.e. not your grandfather’s flip phone).

Lincoln Financial Field, home of the Eagles

If we were handicapping teams based on mobile speeds at their home fields, the Eagles would be in sore shape for Sunday. Although Verizon had the best speeds of the season, the carrier’s Speed Score at Lincoln Financial Field was 63.6% lower than it was at Gillette Stadium. Still, Verizon’s Speed Score was 59.2% higher than AT&T’s, 121.3% higher than Sprint’s and 220.7% higher than T-Mobile’s.


Speedtest Cellular Internet Results

Lincoln Financial Field | 2017 Season
Carrier speeds based on Speed Score for modern devices

Carrier Speed Score
Verizon Wireless 27.90
AT&T 17.52
Sprint 12.61
T-Mobile 8.70

Gillette Stadium, where the Patriots go to win

The Patriots won’t need to stage one of their famous comebacks to claim a win for mobile internet speeds on their home turf. Looking at speeds at Gillette Stadium, Verizon wins again with the fastest Speed Score of them all. Add to that every major carrier had faster speeds here than they did in Philadelphia. Verizon was 174.4% faster in Foxborough than in Philly, AT&T was 25.2% faster, Sprint jumped 143.9% and T-Mobile saw a 173.0% increase in Speed Score when comparing their performance at Gillette Stadium with that at Lincoln Financial Field.


Speedtest Cellular Internet Results

Gillette Stadium | 2017 Season
Carrier speeds based on Speed Score for modern devices

Carrier Speed Score
Verizon Wireless 76.56
Sprint 30.76
T-Mobile 23.75
AT&T 21.93

U.S. Bank Stadium, the place to be on Sunday

The U.S. Bank Stadium in Minneapolis was designed with big events like Sunday’s football game in mind from the capacity, to the readerboards to the app. But what we’re really interested in is the tech. With Wi-Fi access points literally built into the railings, U.S. Bank Stadium should be the ideal place to live-stream any game or event. As for cellular, there’s a distributed antenna system that should keep fans connected.

Season internet speeds play-by-play

Examining internet performance at U.S. Bank Stadium for all home games during the regular stadium, the impressive speeds bode well for the big day.

Team cellular vs. team Wi-Fi

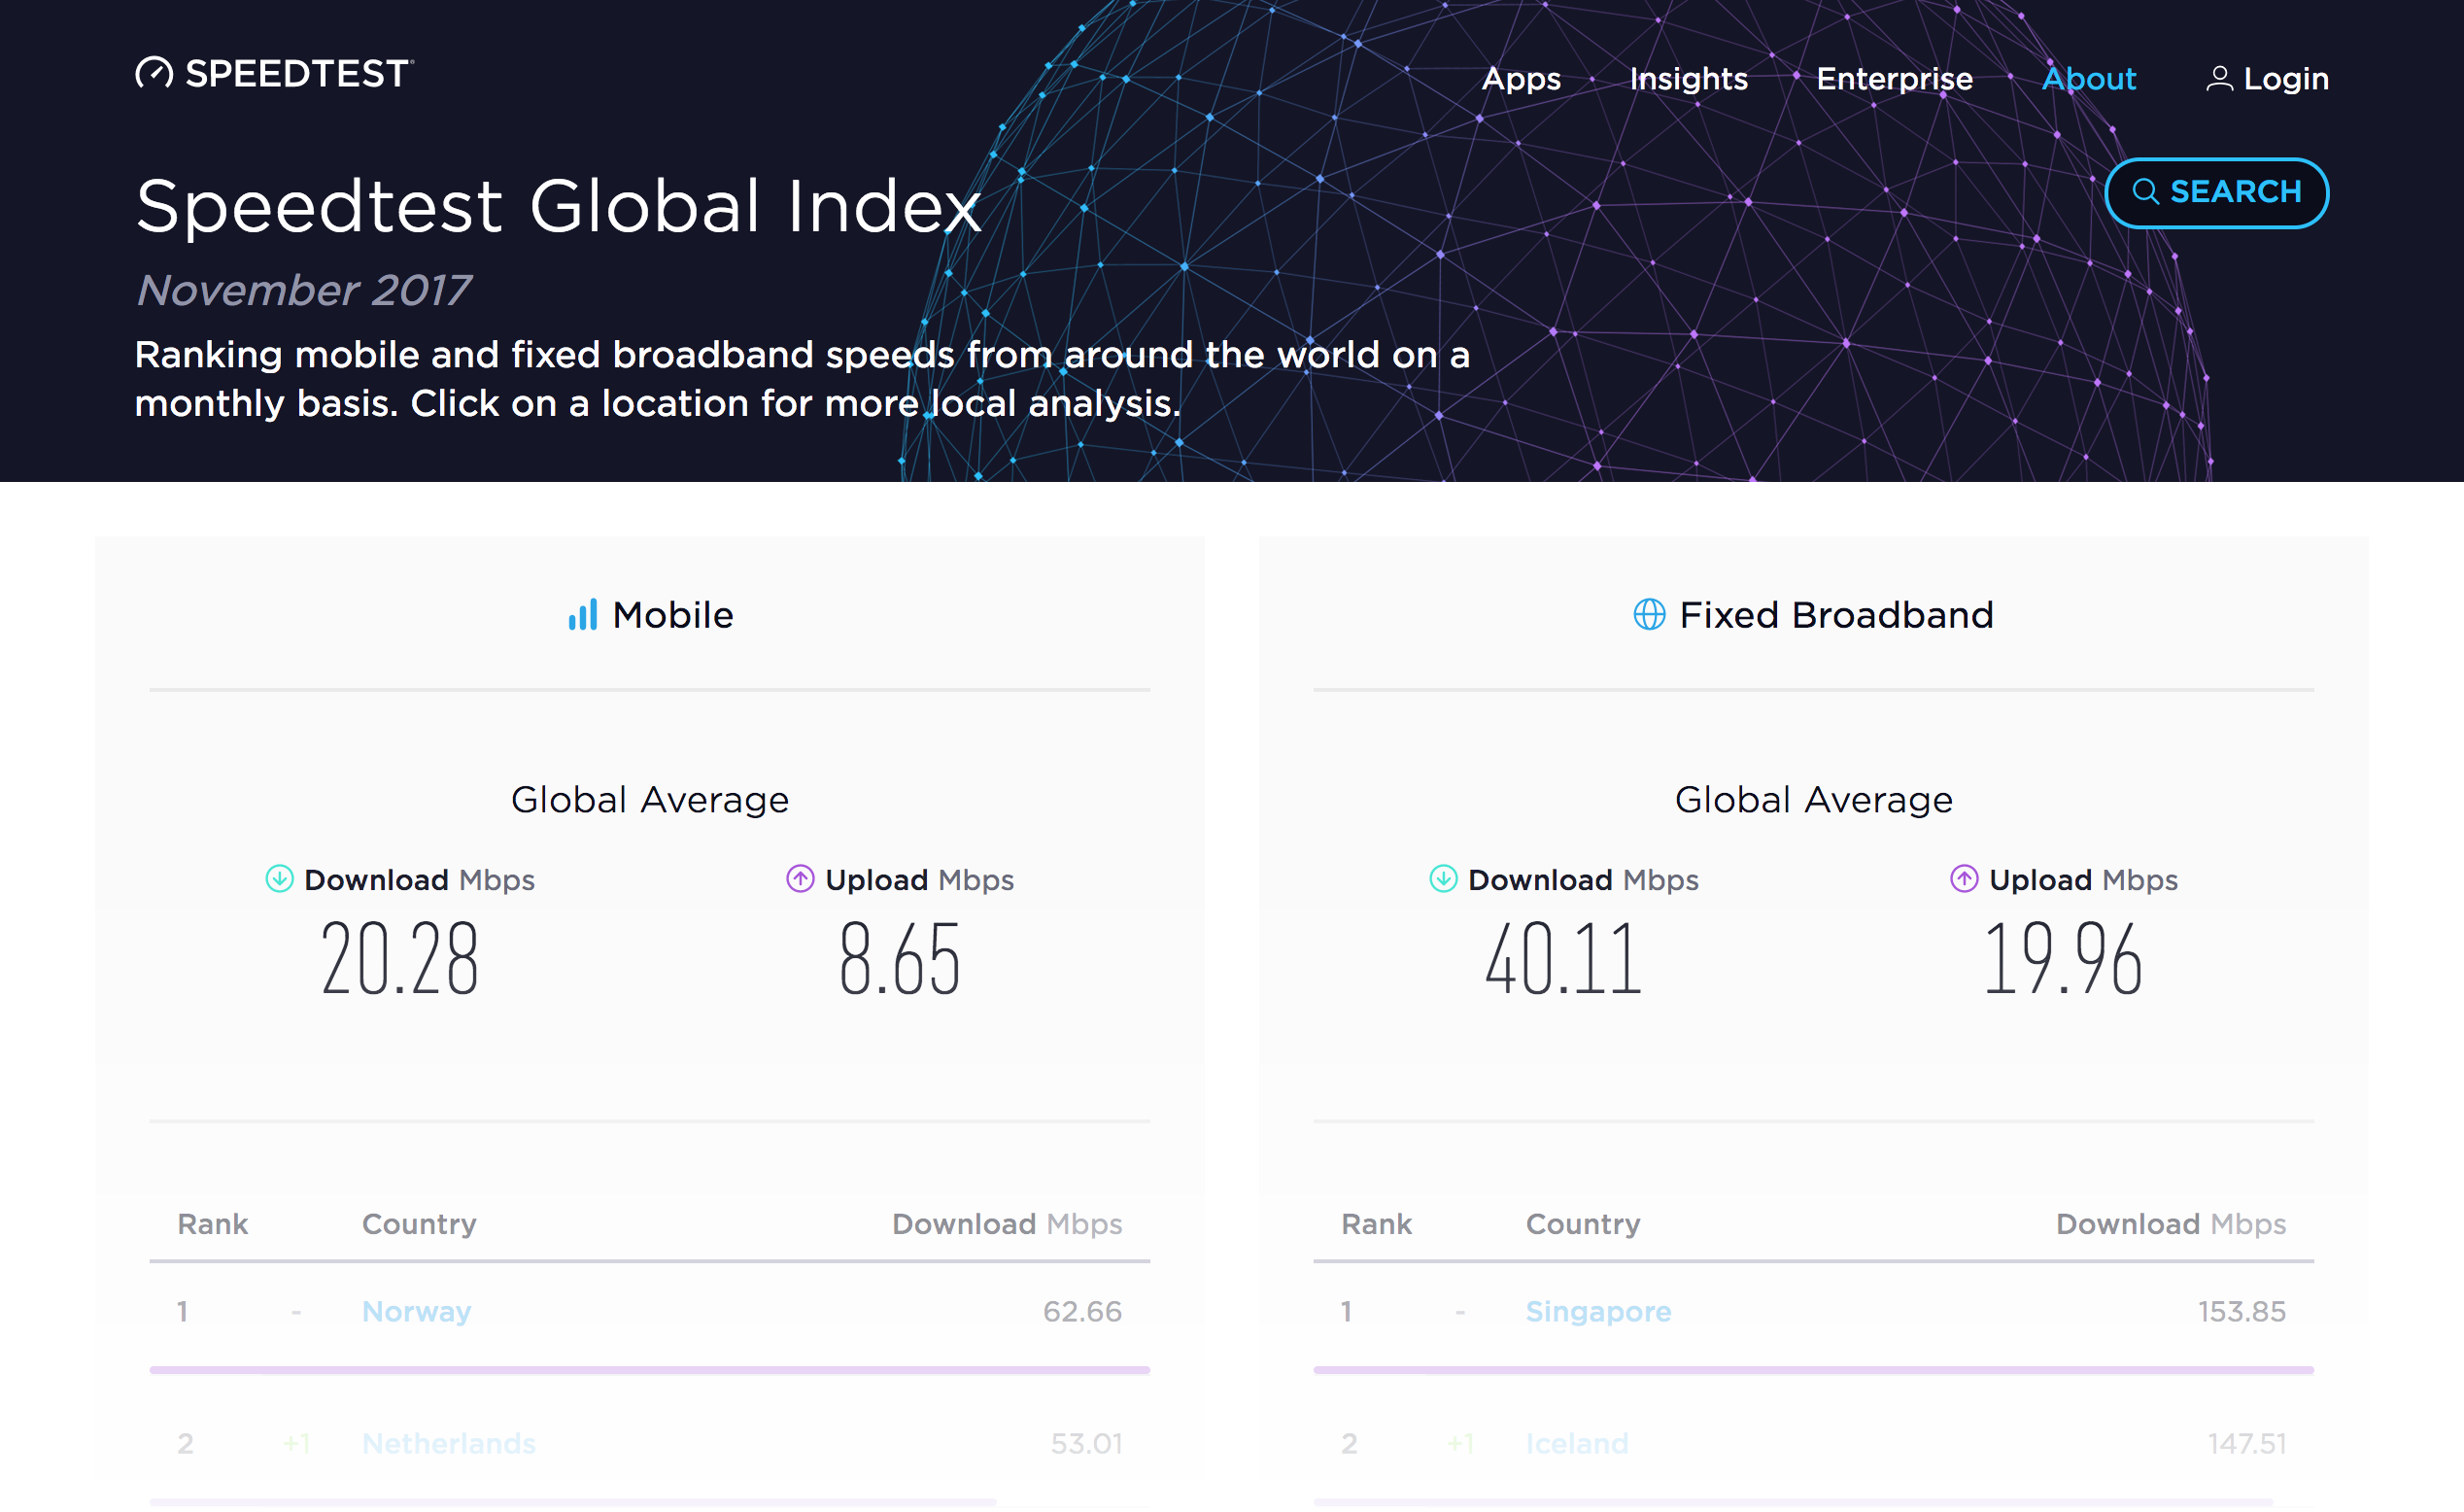
Cellular speeds at U.S. Bank Stadium far exceeded the U.S. average throughout the 2017 football season. On the date with the slowest speeds, September 24, downloads were still 62.6% faster than the average for the U.S. during that month and 5.9% faster than Minneapolis’s average download speed for September 2017.


Speedtest Cellular and Mobile Wi-Fi Results

U.S. Bank Stadium | 2017 Season
Stadium speeds based on mean speeds for all results

Day Cell – Mean Download (Mbps) Cell – Mean Upload (Mbps) Wi-Fi – Mean Download (Mbps) Wi-Fi – Mean Upload (Mbps)
Sep 11, 2017 59.61 23.14 27.87 28.45
Sep 24, 2017 38.99 18.30 21.65 25.75
Oct 1, 2017 41.98 21.35 21.82 28.07
Oct 15, 2017 62.54 23.54 29.37 25.92
Oct 22, 2017 53.05 26.83 30.01 29.11
Nov 19, 2017 69.02 24.97 22.03 25.38
Dec 17, 2017 59.25 22.05 18.84 17.65
Dec 31, 2017 63.15 22.88 14.10 16.41

Meanwhile, the Wi-Fi might be free at U.S. Bank Stadium and the average speed does exceed that of the free Wi-Fi we’ve seen at many North American airports, including LAX and JFK, but it’s still not as fast as we’d hoped. Especially given all the hype. Free Wi-Fi is a great resource to have, but in most cases you’ll get faster speeds using your mobile carrier’s network on game day.

Carrier performance

T-Mobile had the fastest Speed Score at U.S. Bank Stadium. On average, T-Mobile was 18.6% faster than Verizon, 65.1% faster than AT&T and 107.4% faster than Sprint.


Speedtest Cellular Internet Results

U.S. Bank Stadium | 2017 Season
Carrier speeds based on Speed Score for modern devices

Carrier Speed Score
T-Mobile 87.44
Verizon Wireless 73.74
AT&T 52.96
Sprint 42.15

What to expect during the big game

Our technical evangelist, Milan Milanović, dug a little deeper into some upgrades mobile carriers have been working on to make sure their networks are game-ready. Here’s what he found:

  • AT&T’s upgrades include deploying over 800 antennas throughout the stadium, providing a more than 200% increase in capacity. Additional legacy spectrum assets have been refarmed (Band 5) and coupled with advanced LTE technologies. AT&T is expected to keep up with the increased traffic demand.
  • Verizon has added 48% more antenna nodes at the stadium, which are largely invisible (tucked under the seats, handrails, etc.). In addition to over 50 MHz of deployed capacity, Verizon is activating Higher Order MIMO and Higher Order Modulation together with three-channel carrier aggregation. You could say Verizon has their game face on.
  • Sprint’s network within the stadium also relies on 800 nodes and a distributed antenna system (DAS) powered by small cells. This will deliver 40 MHz of TDD capacity in the 2.5 GHz frequency band. Sprint will rely on two-channel carrier aggregation in the downlink to provide required downlink capacity. It will be interesting to see if this network configuration will be sufficient to support the inevitable spike in upload traffic, especially during halftime.
  • T-Mobile has increased the node capacity within the stadium by a factor of 30 in addition to the already deployed 4×4 MIMO, 256 QAM and three-channel carrier aggregation LTE techniques. They have also allocated additional spectrum assets to LTE in order to provide 45 MHz of downlink capacity, upgraded backhaul at and around the event and centralized radio access technology by the way of uplink CoMP (Coordinated Multipoint). This centralized radio access technology is designed to improve uplink data rates and network efficiency, with the added benefit of extending a smartphone’s battery life.

His assessment for fans on the big day? Bring your best devices for the best performance (for you and others). Users with smartphones equipped with four receive antennas will be able to experience the fastest speeds possible. In the process, they’ll also contribute to higher network efficiency by virtue of more quickly completing tasks that improve spectrum resource utilization and therefore the overall capacity of the network. Sunday’s event will also be a test of which operator has most aggressively seeded these highly efficient handsets into the hands of consumers.

Game day stats

You’ve probably seen the wide swing in reported speeds from the big game, and, now that Eagles fans have almost recovered from Sunday’s celebration, we’re here to set the record straight.

Cellular speeds

Looking at speeds at U.S. Bank Stadium between 3:30 p.m. and 8 p.m. on Sunday, we found that the mean cellular download speed at the stadium was faster than we’d seen at any game, all season long. Not a lot faster, but, given the 7.2 terabytes of data used during Sunday’s game, we’re impressed.


Speedtest Cellular Internet Results

U.S. Bank Stadium | During the Big Game
Stadium speeds based on mean speeds for all results

Day Cell – Mean Download (Mbps) Cell – Mean Upload (Mbps)
Feb 4, 2018 69.09 15.93

Which carrier won?


Speedtest Cellular Internet Results

U.S. Bank Stadium | During the Big Game
Carrier speeds based on Speed Score for modern devices

Carrier Speed Score
T-Mobile 114.72
AT&T 58.54
Verizon Wireless 50.66
Sprint 33.24

Comparing carriers based on Speed Score between 3:30 p.m. and 8 p.m. on Sunday, T-Mobile not only came out on top, but they trounced their season average, with a 31.2% jump in speeds. T-Mobile’s game-winning Speed Score was also 96.0% faster than runner-up AT&T who came in second and saw a 10.5% increase in speeds on game day.

Despite significant efforts on the technology side, the other two major carriers saw declines in Speed Scores on the big day. Verizon Wireless came in third and saw a 31.3% decrease from their season average while Sprint’s fourth-place finish was 21.1% slower than their all-season number.

How ‘bout that Wi-Fi?

We could not find any Speedtest results on “#USBANKSTADIUM”, the stadium’s reported Wi-Fi SSID, which leads us to believe that the powers that be switched the SSID to “#SBFAN” for the big event. If this is the case, the game day Wi-Fi download speed at U.S. Bank Stadium was in the low to mid range of what we saw during the rest of the season.


Speedtest Mobile Wi-Fi Results

U.S. Bank Stadium | During the Big Game
Stadium speeds based on mean speeds for all results

Day Wi-Fi – Mean Download (Mbps) Wi-Fi – Mean Upload (Mbps)
Feb 4, 2018 20.71 23.36

Was the big game worth the big investment? Likely. Huge crowds hungry to share the experience on social media can clog up networks and destroy cellular speeds. We’ll be interested to see how this year’s performance changes carriers’ playbooks for 2019.!

Ookla retains ownership of this article including all of the intellectual property rights, data, content graphs and analysis. This article may not be quoted, reproduced, distributed or published for any commercial purpose without prior consent. Members of the press and others using the findings in this article for non-commercial purposes are welcome to publicly share and link to report information with attribution to Ookla.

| January 24, 2018

GOOOOAL: Which World Cup Finalist Scored the Fastest Internet in their Capital City?

Whether you call it soccer or football, everyone calls the World Cup fun. We couldn’t wait for the actual match-ups in June, so we decided to pit the qualifying countries against one another to see who has the fastest internet speeds in their capital cities. The results might surprise you.

Get ready to watch Russia best Brazil and Portugal defeat Iran; meanwhile, Argentina and Nigeria and Belgium and England are preparing for penalty shoot-outs.

Using data from Speedtest Intelligence for Q3-Q4 2017, we’ve calculated which capital cities of World Cup-qualifying countries have the fastest mobile and fixed broadband speeds. We also took a peek at the fastest carriers and internet service providers (ISPs) in each capital using Speed Score, a comprehensive metric that combines measures of internet performance at all levels.

Mobile winners

Iceland’s sixth place ranking for mobile download speed in the Speedtest Global IndexTM virtually assured that Reykjavík would come out at the top of the list of fastest World Cup contenders. Canberra represents Australia well with a second place finish for mobile download speeds among World Cup capitals. And Brussels, Belgium barely surpasses Bern, Switzerland for a third place finish.

Mobile Internet Speeds
Capitals of World Cup Qualifying Countries | Q3 – Q4 2017
Country Capital City Average Download (Mbps) Average Upload (Mbps)
Iceland Reykjavík 55.49 21.53
Australia Canberra 44.24 12.60
Belgium Brussels 42.52 16.74
Switzerland Bern 42.02 17.52
South Korea Seoul 41.85 14.15
Denmark Copenhagen 41.78 18.29
Croatia Zagreb 41.16 16.40
Sweden Stockholm 40.12 12.63
Spain Madrid 38.30 14.02
Portugal Lisbon 30.60 11.39
Serbia Belgrade 30.33 12.49
France Paris 29.03 9.26
Poland Warsaw 26.94 9.84
Germany Berlin 25.83 9.51
England London 25.09 11.49
Russia Moscow 21.89 8.49
Japan Tokyo 19.89 7.10
Uruguay Montevideo 19.82 11.49
Mexico Mexico City 19.11 11.51
Peru Lima 18.33 12.90
Tunisia Tunis 18.27 8.07
Brazil Brasília 18.00 8.64
Morocco Rabat 17.32 9.76
Colombia Bogotá 16.87 9.50
Nigeria Abuja 16.17 6.76
Iran Tehran 15.05 7.04
Argentina Buenos Aires 13.77 7.70
Egypt Cairo 13.15 6.33
Panama Panama City 12.89 8.45
Saudi Arabia Riyadh 12.28 8.88
Senegal Dakar 8.85 3.81
Costa Rica San José 5.97 3.33

Looking at the group draw, Group A fares the worst with 16th place Moscow, Russia being the capital city with the fastest mobile downloads in the group. In Group B, Spain comes out on top. Australia wins Group C, Iceland takes Group D, Switzerland leads Group E and South Korea has the fastest mobile download speed in Group F. Belgium finishes first in Group G and Poland prevails in Group H, despite a 13th place finish overall.

From a regional perspective, European capitals top the rankings with all 14 European World Cup capitals sitting in the top half of the list. Latin American, Middle Eastern and African cities fare worst. Asia’s two contenders are split with Seoul boasting the fifth fastest mobile download speed among World Cup capitals and Tokyo, Japan coming in 17th.

The fastest World Cup capital in Latin America (Montevideo, Uruguay) shows a 64.3% slower mobile download speed than Reykjavík. First place among African World Cup capitals, Rabat, Morocco is 68.8% slower than Reykjavík for mobile downloads. And Tehran, Iran, the fastest World Cup capital in the Middle East, is 72.9% slower than Reykjavík.

Fastest carriers

We also looked into which carriers were fastest in each of the 32 World Cup capital cities.

With Speed Scores ranging from 8.89 in Dakar, Senegal to 46.57 in Brussels, mobile carrier Orange was fastest in four cities and tied for fastest in one. Vodafone was fastest in both Lisbon, Portugal and Madrid, Spain with comparable Speed Scores in the two locations. The rest of the cities show the diversity of fastest carriers that you might expect from a worldwide competition.

Fastest Carriers Speeds
Capitals of World Cup Qualifying Countries | Q3 – Q4 2017
Country Capital City Fastest Carrier Speed Score
Argentina Buenos Aires Personal 16.15
Australia Canberra Telstra 50.21
Belgium Brussels Orange 46.57
Brazil Brasília Claro 24.72
Colombia Bogotá Avantel 20.93
Costa Rica San José ICE 8.30
Croatia Zagreb Hrvatski Telekom 49.35
Denmark Copenhagen TDC / Telia 45.34 / 45.09
Egypt Cairo Orange 16.50
England London EE 36.83
France Paris Orange 33.15
Germany Berlin Telekom 53.54
Iceland Reykjavík Nova 64.61
Iran Tehran MTN IranCell 15.89
Japan Tokyo SoftBank 27.26
Mexico Mexico City AT&T 20.26
Morocco Rabat inwi 20.51
Nigeria Abuja MTN 29.23
Panama Panama City Cable & Wireless Panama / Movistar 14.85 / 14.80
Peru Lima Entel Peru 20.73
Poland Warsaw T-Mobile 36.07
Portugal Lisbon Vodafone 42.44
Russia Moscow MegaFon 37.06
Saudi Arabia Riyadh Zain 13.20
Senegal Dakar Orange 8.89
Serbia Belgrade Vip mobile 45.56
South Korea Seoul LG U+ 50.03
Spain Madrid Vodafone 40.17
Sweden Stockholm Telia 54.49
Switzerland Bern Sunrise / Swisscom 42.14 / 41.91
Tunisia Tunis Ooredoo / Orange 19.90 / 19.89
Uruguay Montevideo Antel 20.35

Fixed broadband winners

Given that Iceland ranks second in the world for fixed broadband download speed on the Speedtest Global Index and has the world’s highest gigabit user penetration (GUP), we’re not surprised to see Reykjavík shut out the competition by coming out on top of World Cup contenders for fixed broadband speed, too. Seoul, South Korea comes in second for fixed broadband download speed among World Cup capitals and Paris, France takes third.

Fixed Broadband Internet Speeds
Capitals of World Cup Qualifying Countries | Q3 – Q4 2017
Country Capital City Average Download (Mbps) Average Upload (Mbps)
Iceland Reykjavík 142.89 154.28
South Korea Seoul 130.75 131.96
France Paris 112.58 55.86
Sweden Stockholm 98.77 66.68
Spain Madrid 86.59 73.43
Japan Tokyo 75.88 70.46
Denmark Copenhagen 72.74 52.13
Switzerland Bern 68.82 54.44
Poland Warsaw 62.57 16.19
Portugal Lisbon 55.80 30.97
England London 52.53 16.12
Germany Berlin 46.84 9.52
Russia Moscow 45.25 42.96
Belgium Brussels 43.25 9.63
Panama Panama City 29.11 5.93
Australia Canberra 28.85 12.46
Serbia Belgrade 26.45 5.59
Croatia Zagreb 26.20 11.40
Mexico Mexico City 24.11 10.14
Uruguay Montevideo 23.02 5.82
Argentina Buenos Aires 22.03 4.26
Brazil Brasília 21.57 5.29
Saudi Arabia Riyadh 20.93 9.05
Peru Lima 18.15 3.51
Colombia Bogotá 13.43 6.48
Morocco Rabat 11.83 2.51
Iran Tehran 9.33 4.18
Costa Rica San José 8.79 4.29
Nigeria Abuja 8.07 5.27
Tunisia Tunis 7.82 4.49
Senegal Dakar 7.42 3.11
Egypt Cairo 5.61 1.92

Group A again suffers on the fixed side with leader Russia coming in 13th based on Moscow’s fixed broadband download speed. Spain’s still the front-runner of Group B. France takes Group C, Iceland wins Group D, Switzerland tops Group E, South Korea reigns over Group F, England heads up Group G and Japan starts Group H based on average download speeds over fixed broadband in their respective capitals.

European capitals again fare well, with 12 of the 14 placing in the top half of fastest World Cup capitals for fixed broadband download speed. Belgrade, Serbia and Zagreb, Croatia rank 17th and 18th, respectively. Tokyo ranks much better for fixed broadband download speed than for mobile, which puts both Asian World Cup capitals in the top six.

With the exception of Panama City, Panama, which ranks 15th, all Latin American World Cup capitals are in the bottom half of the list for download speed over fixed broadband. As are all Middle Eastern and African capital cities.

Panama City’s fixed broadband download speed is 79.6% slower than Reykjavík’s. Riyadh, Saudia Arabia boasts the title of fastest World Cup capital in the Middle East, but is still 85.4% slower for fixed broadband downloads than Reykjavík. The fastest World Cup capital in Africa — Rabat, Morocco — is 91.7% slower than Reykjavík.

Fastest providers

Comparing Speed Scores for fixed broadband across World Cup capitals, Vodafone had wins in Berlin, Germany and Lisbon and Orange took Paris and tied for first in Madrid. The rest of the fastest ISPs vary by location as listed below:

Fastest ISPs Speeds
Capitals of World Cup Qualifying Countries | Q3 – Q4 2017
Country Capital City Fastest ISP Speed Score
Argentina Buenos Aires Cablevisión Fibertel 21.72
Australia Canberra iiNet 33.23
Belgium Brussels Telenet 66.95
Brazil Brasília NET Virtua 27.30
Colombia Bogotá ETB 19.17
Costa Rica San José Cabletica 8.28
Croatia Zagreb vip 30.23
Denmark Copenhagen Fiberby 103.26
Egypt Cairo TE Data 4.84
England London Hyperoptic 117.40
France Paris Orange 107.20
Germany Berlin Vodafone 55.46
Iceland Reykjavík Nova 278.06
Iran Tehran Mobin Net 11.74
Japan Tokyo So-net 118.05
Mexico Mexico City Axtel 45.83
Morocco Rabat Maroc Telecom 9.25
Nigeria Abuja MTN 10.73
Panama Panama City Cable Onda 25.08
Peru Lima Movistar 16.64
Poland Warsaw UPC 82.72
Portugal Lisbon Vodafone 61.80
Russia Moscow MGTS 62.00
Saudi Arabia Riyadh STC 16.46
Senegal Dakar Tigo 6.42
Serbia Belgrade SBB 34.60
South Korea Seoul KT 162.45
Spain Madrid Masmovil / Orange 101.52 / 101.34
Sweden Stockholm Ownit 158.78
Switzerland Bern Fiber7 241.93
Tunisia Tunis TOPNET 7.61
Uruguay Montevideo Antel 22.01

Did your team not come out as expected? Or are you defending a tight match? Take a Speedtest on Android, iOS or on the web and we’ll check back in on scores closer to the main event.

Ookla retains ownership of this article including all of the intellectual property rights, data, content graphs and analysis. This article may not be quoted, reproduced, distributed or published for any commercial purpose without prior consent. Members of the press and others using the findings in this article for non-commercial purposes are welcome to publicly share and link to report information with attribution to Ookla.

| December 12, 2017

The World’s Internet Speeds Increased More than 30% in 2017. Are You Keeping Up?

In a world where business and life are increasingly fast and global, you want to know if your country’s internet is up to speed. In August, we launched Speedtest Global IndexTM to provide you that objective look at internet performance around the world. Knowing what your speeds are and how they compare to your neighbors’ makes for a good story, but what was missing was a benchmark. To provide you that worldwide context, we’re introducing Global Speed, the average internet speed of the world, to the top of the Speedtest Global Index.

You can still use the Speedtest Global Index to see download and upload speeds by country and rank who’s fastest and slowest. Here we’ve paired data about those individual country speeds over the past year with the new global averages call out which countries have improved most over the past year, who’s shown the least improvement and what speeds are like in the world’s most populous countries. Read on to see who’s winning the internet speed race and who has a lot of catching up to do.

The comparisons here are based on Speedtest data from November 2016-November 2017. We used the same monthly threshold for this article that we do for inclusion in the Speedtest Global Index: to be ranked in each category, countries must have at least 670 Speedtest results from unique users on mobile and at least 3,333 for fixed broadband. Although we use the word “country” throughout, you will notice some regions like Hong Kong and Puerto Rico that are large or autonomous enough to call out as separate entities, even though they are not separate countries. Global speeds are a weighted average of all samples from around the world.

Global download speeds are up more than 30% across the board

With a mean global speed of 20.28 Mbps, mobile downloads increased 30.1% over the last 12 months and mobile uploads increased 38.9%. A global average of 40.11 Mbps makes fixed broadband downloads 97.8% faster than mobile and this speed increased 31.6% during the same period. Uploads over fixed broadband showed the smallest increase of 25.9%.

Global Internet Speeds
November 2016 – November 2017
Download: November 2017 Average (Mbps) Download: Year Over Year Increase Upload: November 2017 Average (Mbps) Upload: Year Over Year Increase
Mobile 20.28 30.1% 8.65 38.9%
Fixed 40.11 31.6% 19.96 25.9%

In November 2017, 119 countries boasted a faster mobile download speed than the global average while 134 were slower. On the fixed broadband side, 71 countries and regions beat the global average download speed and 185 were slower. As we reported last week, gigabit Speedtest results are rolling in from across the planet, but their distribution across continents is wildly uneven.

Most improved countries

It was a good year for Laotian mobile speeds. With a 249.5% jump in mobile download speeds, Laos showed the largest improvement in the world. Vietnam came in second with an increase of 188.7% and Trinidad and Tobago was third at 133.1%. All of the countries listed on the table below are to be commended for making mobile internet faster.

Countries with the Largest Improvement
Mobile Download Speed

November 2016 – November 2017
Year Over Year Increase November 2017 Speed (Mbps)
Laos 249.5% 13.77
Vietnam 188.7% 19.54
Trinidad and Tobago 133.1% 11.68
Hong Kong (SAR) 102.6% 35.64
Lebanon 92.3% 24.50
Cyprus 90.2% 26.14
Republic of the Union of Myanmar 81.0% 11.72
Costa Rica 80.9% 7.89
Cambodia 70.5% 14.97
Sudan 68.9% 9.85

The tiny island of Reunion, a region of France off the coast of Africa, saw the largest improvement in download speed over fixed broadband in the world with a gain of 141.5%. Guatemala was second at 116.7% and Ghana third at 82.1%.

Countries with the Largest Improvement
Fixed Broadband Download Speed

November 2016 – November 2017
Year Over Year Increase November 2017 Speed (Mbps)
Reunion 141.5% 62.64
Guatemala 116.7% 12.04
Ghana 82.1% 18.96
Peru 80.1% 16.48
India 76.9% 18.82
Panama 76.6% 28.62
Italy 72.1% 31.58
Libya 67.6% 3.84
Argentina 62.2% 15.49
Kenya 60.9% 15.59

In some countries, notably Libya, a small gain in megabits per second (Mbps) can result in a large percentage increase. Although the actual performance improvement is small, we’re glad to see speeds moving in the right direction.

Speeds in some countries declined

On the flip side, there were far too many countries and regions where internet speeds decreased. The devastation of Puerto Rico’s mobile infrastructure by Hurricane Maria surely contributed to the island’s 39.8% drop in mobile download speed during the past twelve months. Uzbekistan saw a decline of 31.8% and Côte d’Ivoire 26.1%.

Countries with the Smallest Improvement
Mobile Download Speed

November 2016 – November 2017
Year Over Year Change November 2017 Speed (Mbps)
Puerto Rico -39.8% 8.53
Uzbekistan -31.8% 6.47
Côte d’Ivoire -26.1% 10.95
Brunei -23.4% 9.83
Thailand -19.7% 13.38
Iraq -16.8% 3.12
Algeria -10.8% 7.19
Nigeria -8.4% 9.90
Bangladesh -7.4% 4.97
Morocco -6.3% 15.03

Algeria saw the largest decrease in download speed over fixed broadband speed in the world at 23.9%. Dips of 9.1% in Ecuador and 6.5% in Latvia were less troubling but still moving in the wrong direction.

Countries with the Smallest Improvement
Fixed Broadband Download Speed

November 2016 – November 2017
Year Over Year Change November 2017 Speed (Mbps)
Algeria -23.9% 3.76
Ecuador -9.1% 10.40
Latvia -6.5% 47.25
Tunisia -3.2% 6.90
Iraq -1.1% 7.87
Syria -0.3% 7.12
Taiwan 0.5% 42.32
Maldives 1.0% 12.04
Namibia 1.2% 9.74
Jamaica 1.5% 19.11

Performance in the world’s most populous countries

With 57% of the world’s population, any internet performance improvements seen in the world’s ten most populous countries have a wide reach. Pakistan came out on top of the world’s largest countries with a 56.2% jump in mobile download speed during the past 12 months. India came in second in this category at 42.4% and Brazil third at 27.6% .

World’s Most Populous Countries
Improvement in Mobile Downloads

November 2016 – November 2017
Year Over Year Change November 2017 Speed (Mbps)
Pakistan 56.2% 13.08
India 42.4% 8.80
Brazil 27.6% 16.25
Japan 23.5% 21.67
United States 22.0% 26.32
Russia 19.2% 15.80
Indonesia 18.1% 9.73
China 3.3% 31.22
Bangladesh -7.4% 4.97
Nigeria -8.4% 9.90

At the other end of the spectrum, Nigeria’s mobile download speed actually dropped 8.4% and Bangladesh’s dipped 7.4%. China showed only a modest 3.3% increase in mobile download speed in 2017.

On the fixed broadband side, India came out on top of the world’s most populous countries for improvements to download speed during the past 12 months with an increase of 76.9%, beating China’s second place 42.3% increase and a 37.3% gain in the U.S.

World’s Most Populous Countries
Improvement in Fixed Broadband Downloads

November 2016 – November 2017
Year Over Year Change November 2017 Speed (Mbps)
India 76.9% 18.82
China 42.3% 61.24
United States 37.3% 75.94
Japan 20.7% 73.51
Indonesia 18.9% 13.38
Brazil 18.5% 17.80
Pakistan 15.5% 6.13
Russia 14.6% 36.90
Bangladesh 13.7% 16.14
Nigeria 3.8% 9.53

Nigeria again came out at the bottom of the world’s largest countries, this time with a 3.8% increase in download speed over fixed broadband.

We’ll revisit global internet speeds periodically here on our blog, but you can keep up to date on the latest trends in worldwide internet speeds by visiting the Speedtest Global Index. It’s updated every month with individual country data and, now, global averages. Keep track of your country’s performance and see how you rank against the world.

Ookla retains ownership of this article including all of the intellectual property rights, data, content graphs and analysis. This article may not be quoted, reproduced, distributed or published for any commercial purpose without prior consent. Members of the press and others using the findings in this article for non-commercial purposes are welcome to publicly share and link to report information with attribution to Ookla.

| December 6, 2017

Mapping Gigabit: Where in the World We’ve Seen Gigabit-speed Results

Gigabit-speed internet is all over the map, literally. With the exception of Antarctica, we found Speedtest results on fixed broadband gigabit speeds (download speeds of 750 Mbps or faster) on every continent. While some continents were better represented than others, we were heartened to see just how far gigabit internet has spread across the globe.

Using data from Speedtest Intelligence during the period August 1, 2017 – November 28, 2017, we defined gigabit tests as any result with a download speed in excess of 750 Mbps for the purposes of this article. While gigabit technically means 1,000 Mbps (or 1 Gbps), that’s the available speed and device limitations and throughput overhead often limit the actual performance of a connection. We’ve also calculated a gigabit user penetration (GUP) figure that represents the number of users who have gigabit results divided by the total population of the country.

Note that gigabit service is often highly localized, so just because your country (or even city) is represented does not mean that you can get gigabit at your house.

Continents with the Most Gigabit Speedtest Results
August 1, 2017 – November 28, 2017
Region Number of Tests Number of Users Mean Download (Mbps) Mean Upload (Mbps)
North America 256,210 163,260 866.54 555.09
Europe 210,638 146,062 868.80 418.17
Asia 141,674 70,544 852.28 570.79
Australasia 11,792 7,188 879.70 520.43
South America 1,093 831 845.04 672.86
Africa 723 525 844.85 559.65

What might not be obvious is that North America has the largest number of gigabit tests. Europe is close behind and Asia takes third. Gigabit-speed results fall off dramatically in Australasia, South America and Africa.

Cities with the most tests are likewise spread across the globe from Hong Kong and Singapore to Austin, Texas.

Global Cities with the Most Gigabit Speedtest Results
August 1, 2017 – November 28, 2017
City Country/Region Number of Tests Number of Users Mean Download (Mbps) Mean Upload (Mbps)
Hong Kong Hong Kong (SAR) 58,051 15,037 872.99 637.09
Singapore Singapore 42,469 26,421 886.77 677.34
Paris France 17,211 11,891 860.71 672.39
New York United States 14,509 8,637 854.58 667.06
Bucharest Romania 13,977 8,615 842.61 707.09
San Francisco United States 8,525 3,899 859.41 733.37
Toronto Canada 7,320 4,319 839.01 627.89
Milan Italy 7,184 4,447 855.95 476.41
Budapest Hungary 6,958 4,319 848.34 571.25
Austin United States 6,045 3,960 859.49 744.89

North America

When looking at the top ten locations for gigabit tests in North America, the U.S. dominates with nearly ten times the number of tests as second-place Canada. Mexico comes in a distant third.

North American Countries with the Most Gigabit Speedtest Results
August 1, 2017 – November 28, 2017
Country/Region Number of Tests Number of Users Mean Download (Mbps) Mean Upload (Mbps) GUP
United States 228,475 145,551 866.54 555.09 0.04%
Canada 26,616 16,897 871.46 319.00 0.05%
Mexico 638 520 839.13 754.97 0.00%
Puerto Rico 344 189 828.09 640.15 0.01%
Dominican Republic 36 26 835.04 520.70 0.00%
Guadeloupe 21 15 899.16 239.94 0.00%
Panama 15 7 823.69 72.70 0.00%
Trinidad and Tobago 14 14 827.42 735.84 0.00%
Barbados 12 7 883.45 220.43 0.00%
Martinique 10 7 944.56 238.61 0.00%

Digging deeper into the data, Canada is first place for gigabit user penetration (GUP) in North America with 0.05% of people having received a gigabit speed result. The U.S. has a GUP of 0.04%, Puerto Rico 0.01% and Mexico 0.00%. Gigabit tests pop up elsewhere on the continent, but the numbers are low enough that the service appears to be either prohibitively expensive or available to a very small segment of the population.

Canada, Guadeloupe, Barbados and Martinique have much slower upload speeds than downloads. Asynchronous speeds, when download speed is radically different from upload, like this frequently occur when gigabit is delivered over cable rather than fiber. Panama’s upload speed is especially slow for gigabit service.

Nine ISPs in the U.S. showed more than 1,000 gigabit-level results with AT&T Internet coming out on top. Canada had two ISPs that met the 1,000 test threshold with Rogers having the most.

North American Cities with the Most Gigabit Speedtest Results
August 1, 2017 – November 28, 2017
City Country/Region Number of Tests Number of Users Mean Download (Mbps) Mean Upload (Mbps)
New York United States 14,509 8,637 854.58 667.06
San Francisco United States 8,525 3,899 859.41 733.37
Toronto Canada 7,320 4,319 839.01 627.89
Austin United States 6,045 3,960 859.49 744.89
Houston United States 3,518 2,061 853.92 647.13
Kansas City, MO United States 3,135 2,229 871.52 628.74
Seattle United States 3,040 1,961 822.84 578.96
Charlotte United States 2,934 1,773 856.05 769.20
San Antonio United States 2,901 1,780 861.50 681.93
Dallas United States 2,433 1,499 841.77 729.27

At the city level, all but one of the ten North American cities with the largest number of gigabit tests are in the U.S. This isn’t surprising given the volume of tests in the U.S. versus the rest of the continent. Several of these cities were ranked among the fastest in the U.S. in our recent market snapshot.

Europe

Among the ten European countries with the most gigabit tests, France comes out on top with nearly four times as many tests as second-place Romania.

European Countries with the Most Gigabit Speedtest Results
August 1, 2017 – November 28, 2017
Country/Region Number of Tests Number of Users Mean Download (Mbps) Mean Upload (Mbps) GUP
France 94,269 65,437 877.68 254.05 0.10%
Romania 23,552 14,997 856.94 470.48 0.08%
Hungary 20,487 15,093 867.51 241.52 0.15%
Italy 15,822 9,896 871.29 236.80 0.02%
Switzerland 7,947 6,073 850.61 771.78 0.07%
Ukraine 5,852 4,051 873.57 677.24 0.01%
Netherlands 4,225 3,285 872.46 730.00 0.02%
Denmark 4,223 3,191 860.26 716.82 0.06%
Iceland 3,604 2,446 884.64 860.23 0.71%
Sweden 3,532 2,439 864.62 639.76 0.02%

Gigabit test penetration is another matter entirely with Iceland, the continent’s least populated country, coming first in the world for GUP with 0.71%. Hungary and Monaco are second and third with 0.15% and France is fourth. Lithuania, Jersey, Romania, Switzerland, Luxembourg and Denmark all have GUPs that are higher than any seen in North America.

Italy has a much slower mean upload speed than download for gigabit results. This asynchronicity usually means that gigabit is delivered over cable rather than fiber.

France has the most ISPs with 1,000 or more gigabit test results with four. Orange slightly edges out Bouygues for number of tests. Hungary, Italy and Lithuania have two ISPs apiece that meet the threshold with DIGI having the most in Hungary and Vodafone in Italy. Skynet and Telia are virtually tied in Lithuania. In Romania only Digi showed more than 1,000 gigabit tests during the period. In Ukraine and the U.K. we only saw Lanet and Hyperoptic, respectively, meeting the criteria.

European Cities with the Most Gigabit Speedtest Results
August 1, 2017 – November 28, 2017
City Country/Region Number of Tests Number of Users Mean Download (Mbps) Mean Upload (Mbps)
Paris France 17,211 11,891 860.71 672.39
Bucharest Romania 13,977 8,615 842.61 707.09
Milan Italy 7,184 4,447 855.95 476.41
Budapest Hungary 6,958 4,319 848.34 571.25
Lyon France 4,379 2,962 880.79 219.38
Kiev Ukraine 4,254 2,921 842.36 745.55
Vilnius Lithuania 2,414 1,945 869.76 717.92
Marseille France 2,320 1,530 868.89 400.53
Turin Italy 2,299 1,275 873.64 175.66
Reykjavík Iceland 2,166 1,413 884.52 778.67

The ten European cities with the largest number of gigabit tests are well distributed throughout the continent. France holds three spots with Paris, Lyon and Marseille, while Italy holds two with Milan and Turin. Not surprisingly, most of the remaining cities are capitals of the countries they represent.

Asia

As the city with the most gigabit tests in the world, Hong Kong also tops Asia. Singapore is second, Russia third, and Japan a close fourth.

Asian Countries with the Most Gigabit Speedtest Results
August 1, 2017 – November 28, 2017
Country/Region Number of Tests Number of Users Mean Download (Mbps) Mean Upload (Mbps) GUP
Hong Kong 58,051 15,037 872.99 637.09 0.20%
Singapore 42,469 26,421 886.77 677.34 0.47%
Russia 9,923 7,666 889.75 571.38 0.01%
Japan 9,128 6,600 808.31 645.69 0.01%
South Korea 5,761 4,640 827.78 724.92 0.01%
India 2,760 1,547 874.98 692.43 0.00%
China 2,354 1,524 848.91 435.53 0.00%
Thailand 2,111 1,242 848.46 369.85 0.00%
Israel 1,920 1,137 878.52 488.73 0.01%
Philippines 1,535 980 856.26 569.88 0.00%

Gigabit user penetration (GUP) shows that Singapore has the largest percentage of users with gigabit tests per capita in Asia and the second largest in the world. Hong Kong comes in second in Asia and Macau third. All three beat the GUPs of any country in North America and are competitive with what’s seen in Europe.

Upload speeds in the ten Asian countries with the most gigabit tests are much more consistent with gigabit expectations than they are in North America or Europe which likely means that fiber is prevalent.

Singapore had five ISPs with more than 1,000 gigabit tests with SingTel coming in first for volume. Hong Kong had three with NETVIGATOR showing by far the most tests. India, Russia and South Korea each only showed one ISP that met the 1,000 gigabit test threshold. Those ISPs were ACT, Rostelecom and KT, respectively.

Asian Cities with the Most Gigabit Speedtest Results
August 1, 2017 – November 28, 2017
City Country/Region Number of Tests Number of Users Mean Download (Mbps) Mean Upload (Mbps)
Hong Kong Hong Kong (SAR) 58,051 15,037 872.99 637.09
Singapore Singapore 42,469 26,421 886.77 677.34
Seoul South Korea 3,688 2,971 838.86 661.27
Saint Petersburg Russia 2,021 1,411 853.75 660.11
Hyderabad India 1,416 859 884.32 662.62
Chiyoda Japan 1,336 967 840.09 543.03
Moscow Russia 1,185 896 838.54 690.63
Perm Russia 1,113 883 942.74 327.28
Macau Macau (SAR) 966 384 831.81 845.07
Petah Tikva Israel 813 383 865.03 580.17

As Hong Kong and Singapore top the list of cities with the highest gigabit test volume in the world, they also win Asia. Russia has three cities on the list.

Australasia

New Zealand has ten times as many gigabit speed tests as Australia. No other country in Australasia showed gigabit tests during the period we studied.

Australasian Countries with the Most Gigabit Speedtest Results
August 1, 2017 – November 28, 2017
Country/Region Number of Tests Number of Users Mean Download (Mbps) Mean Upload (Mbps) GUP
New Zealand 10,832 6,458 866.91 464.42 0.13%
Australia 956 726 903.62 621.10 0.00%

New Zealand’s gigabit user penetration (GUP) was a globally competitive 0.13% while Australia’s barely registered.

Mean upload speed on gigabit tests in Australia are faster than those in New Zealand, though both countries show competitive speeds which likely means that gigabit service is delivered over fiber.

In New Zealand we saw two ISPs that topped the 1,000 gigabit test threshold we set with MyRepublic slightly edging out Spark in gigabit test volume. No ISP in Australia showed 1,000 or more gigabit results in the period we studied.

Australasian Cities with the Most Gigabit Speedtest Results
August 1, 2017 – November 28, 2017
City Country/Region Number of Tests Number of Users Mean Download (Mbps) Mean Upload (Mbps)
Auckland New Zealand 4,842 2,681 861.30 498.28
Christchurch New Zealand 1,402 706 865.43 452.40
Wellington New Zealand 763 465 830.37 400.74
Lower Hutt New Zealand 551 361 846.45 384.60
Dunedin New Zealand 386 242 850.17 378.93
Hamilton New Zealand 385 188 871.34 506.14
Sydney Australia 172 101 907.97 678.12
Porirua New Zealand 122 86 834.68 349.24
Tauranga New Zealand 113 69 861.28 484.67
Tamahere New Zealand 61 48 873.57 477.33

All but one of the cities with the highest volume of gigabit tests in Australasia were in New Zealand with Auckland coming in first, Christchurch second and Wellington third. Sydney represents for Australia at seventh.

South America

South America has about one tenth the number of gigabit results compared to Australasia. Brazil has the most, while Peru, Argentina, Chile and Colombia show enough tests to indicate that gigabit service is available but not at all common. We saw a scattering of tests in Paraguay, Bolivia and Ecuador, but they were sparse enough that we’re not prepared to say gigabit internet is truly available in those countries.

South American Countries with the Most Gigabit Speedtest Results
August 1, 2017 – November 28, 2017
Country/Region Number of Tests Number of Users Mean Download (Mbps) Mean Upload (Mbps) GUP
Brazil 643 466 844.87 683.65 0.00%
Peru 139 121 842.75 657.95 0.00%
Argentina 98 88 852.33 549.25 0.00%
Chile 95 70 842.88 751.91 0.00%
Colombia 89 63 844.74 655.26 0.00%

No country in South America showed a gigabit user penetration (GUP) that rounded higher than 0.00%, but mean upload speeds on gigabit tests were more consistently strong in all countries than on any other continent which we would expect to be true if gigabit was delivered over fiber.

Similarly, because of the overall volume of tests, we saw no ISP with more than 1,000 tests.

South American Cities with the Most Gigabit Speedtest Results
August 1, 2017 – November 28, 2017
City Country/Region Number of Tests Number of Users Mean Download (Mbps) Mean Upload (Mbps)
Rio de Janeiro Brazil 76 62 825.36 810.89
Buenos Aires Argentina 62 53 863.71 604.84
Santiago Chile 61 54 841.49 745.66
Bogotá Colombia 58 37 826.31 684.34
San Miguel Peru 52 48 836.41 561.17
Salvador Brazil 46 41 787.51 735.29
San Borja Peru 32 32 857.22 847.14
São Paulo Brazil 30 26 819.34 626.76
Santana de Parnaíba Brazil 26 10 880.58 840.19
Santiago de Surco Peru 23 23 858.76 805.75

While the number of tests in all cities in South America is low, Brazil boasts not only the city with the largest number of gigabit tests (Rio), but three other cities on the above list. Buenos Aires, Argentina and Santiago, Chile are neck and neck for second in test volume. Peru has three cities on the list.

Africa

For the most part, gigabit-speed internet does not seem to have come to Africa. South Africa is the main exception as the only country with more than 100 gigabit results during the period we studied. Kenya, Algeria, Namibia and Reunion show enough results to suggest that an elite few have access to gigabit speeds. We can’t say whether that’s for reasons of infrastructure or price. We also spotted Gigabit results in Botswana, Egypt, Ghana, Mauritius and Nigeria, but those were very rare and not necessarily indicative that gigabit service is available.

African Countries with the Most Gigabit Speedtest Results
August 1, 2017 – November 28, 2017
Country/Region Number of Tests Number of Users Mean Download (Mbps) Mean Upload (Mbps) GUP
South Africa 560 383 859.06 556.61 0.00%
Kenya 46 39 803.20 581.40 0.00%
Algeria 34 32 799.76 575.62 0.00%
Namibia 21 16 833.33 622.48 0.00%
Reunion 18 13 823.89 357.91 0.00%

No country in Africa showed a gigabit user penetration (GUP) that rounded higher than 0.00% and the test volume was low enough that no ISP had more than 1,000 gigabit results.

African Cities with the Most Gigabit Speedtest Results
August 1, 2017 – November 28, 2017
City Country/Region Number of Tests Number of Users Mean Download (Mbps) Mean Upload (Mbps)
Cape Town South Africa 153 120 864.69 723.17
Johannesburg South South Africa 136 103 856.19 484.43
Sandton South Africa 65 32 817.85 499.56
Randburg South Africa 52 30 854.43 385.01
Nairobi Kenya 45 38 801.11 590.09
Pretoria South Africa 34 21 859.63 463.39
Windhoek Namibia 21 16 833.33 622.48
Johannesburg South Africa 18 11 796.53 214.87
Krugersdorp South Africa 15 7 834.64 99.52
Midrand South Africa 14 10 918.12 738.05

All but two of the African cities with the largest volume of gigabit tests are in South Africa. Cape Town comes in first for test volume with Johannesburg South second and Sandton third. Nairobi represents for Kenya and Windhoek for Namibia.

Are you seeing gigabit-level service that we missed? Take a Speedtest on our desktop app for MacOS or Windows so we can count you in when we update our data.

Ookla retains ownership of this article including all of the intellectual property rights, data, content graphs and analysis. This article may not be quoted, reproduced, distributed or published for any commercial purpose without prior consent. Members of the press and others using the findings in this article for non-commercial purposes are welcome to publicly share and link to report information with attribution to Ookla.

| October 31, 2017

LinkNYC Proves Public Wi-Fi Can be Free, Fast and Far-reaching

Two years ago, LinkNYC set out to provide New Yorkers with free Wi-Fi using a network of Links that offer “superfast, free public Wi-Fi, phone calls, device charging and a tablet for access to city services, maps and direction.” The experiment worked, and we’re here to report on how fast the network really is, whether it holds up to heavy use and which parts of the city are seeing the most benefit.

What is LinkNYC?

LinkNYC uses kiosks (“Links”) to provide internet connectivity to the five boroughs (Manhattan, Brooklyn, Queens, the Bronx, and Staten Island). The project resulted from a competition initiated by the New York City government to find a new use for the City’s payphones. Service at the first 500 Links was available by the end of 2015. One thousand, one hundred and sixty-four are active as of this writing with another 215 installed and awaiting final connection. The project aims to have 7,500 Links online by the end of 2023. Each link is connected to the LinkNYC fiber network and is capable of speeds up to 1 Gbps. The Links use 802.11ac Wave 2 access points with support for 4×4:4 MU-MIMO.

LinkNYC was created by CityBridge, a consortium of companies including Intersection (a portfolio company of Alphabet Inc.’s Sidewalk Labs), Qualcomm and CIVIQ Smartscapes. Beyond a $300 million capital investment from CityBridge, LinkNYC is funded through advertising revenues from ads shown on screens on the Links themselves and is projected to create more than $500 million in revenue for the City of New York.

How fast is fast?

Speedtest data reveals LinkNYC offered up a mean download speed of 158.98 Mbps and a mean upload of 123.01 Mbps in September 2017. This free network is faster by 74% and 165%, respectively, than New York City’s average download and upload speeds over mobile Wi-Fi. New York’s mobile Wi-Fi download and upload speeds for all networks combined are respectively 249% and 312% faster than those over cellular networks. That means LinkNYC users are seeing download speeds 511% faster than they would be if they were connecting on cellular networks. LinkNYC’s mean upload speed was 996% faster than cellular.

New York City Speedtest Results
September 2017
Connection Type Mean Download (Mbps) Mean Upload (Mbps)
LinkNYC Mobile Wi-Fi 158.98 123.01
Mobile Wi-Fi 90.89 46.27
Cellular 25.98 11.22

Even better, we can see that the speeds available on LinkNYC are improving rapidly. Though the Speedtest results fluctuate somewhat on a day-by-day basis, on January 1, 2017, the average download speed was 95.70 Mbps and the upload was 81.50 Mbps. On September 30, the daily average download speed peaked at 201.00 Mbps and the upload speed was 177.10 Mbps.

Sample Speeds by Day

These daily speeds likely reflect limitations of mobile devices, not those of the LinkNYC network.

One thing to note is that while the LinkNYC network is reportedly capable of 1 Gbps speeds, most mobile devices are not. The Speedtest results graphed above are likely limited by a world where the peak achievable speed for an iPhone 5 maxes out at around 100 Mbps and an iPhone 7 at around 560 Mbps.

To top it off, LinkNYC’s daily speeds are faster still than the averages for the U.S. as a whole. In September, we saw a mean download speed over mobile Wi-Fi of 66.25 Mbps in the U.S., while cellular came in at 23.98 Mbps. Mean upload speed over mobile Wi-Fi for the U.S. was 23.59 Mbps, while cellular was 8.38 Mbps.

Is it secure?

LinkNYC actually has two networks — one called “LinkNYC Free Wi-Fi” that’s open and available to all and “LinkNYC Private.” Hotspot 2.0-compatible devices are automatically prompted to join this second network which is protected using WPA2 encryption and Hotspot 2.0 technology which facilitates cellular-like roaming on capable devices. That means that once a phone joins the “LinkNYC Private” network, the phone’s connection to the network is handed off from access point to access point as a user moves throughout the city. Most carriers have offered Hotspot 2.0-capable phones since 2014 (T-Mobile has for much longer).

We can’t say for certain that the private network is secure, but the fact that it is encrypted likely makes it more secure than your average coffee shop connection. In light of the recently discovered global WPA2 vulnerability, we asked LinkNYC how vulnerable their network was. The response was: “The Link private network is not at risk. The combination of access point firmware and the network configuration assure the integrity of encrypted WPA2.”

Speeds over the two networks are similar with downloads over “LinkNYC Private” Hotspot 2.0 network just 9.4% faster than those on “LinkNYC Free Wi-Fi”. This could be due to the fact that newer phones are both more likely to offer faster speeds and to be Hotspot 2.0-ready as well as the fact that fewer users are accessing this second network.

LinkNYC Speedtest Results
January 1 – October 11, 2017
Connection Type Mean Download (Mbps) Mean Upload (Mbps)
LinkNYC Free Wi-Fi 131.84 100.97
LinkNYC Private 144.21 106.98

Do speeds hold up during peak periods?

Yes, yes they do. The graph below shows that even during periods with the highest volume of tests (from 3-4 p.m.), the LinkNYC network maintains peak download speeds. The slowest download speeds, seen from 5-6 a.m. and 8-9 a.m., still maintain an average download speed over 120 Mbps.

NUMBER OF TESTS BY DAY GRAPH

The far-reaching impact of LinkNYC

How many people are using it?

According to LinkNYC, the network sees 300,000 users per day. We saw 19,289 Speedtest tests taken with Speedtest over the LinkNYC network from 7,594 unique users from January 1, 2017 through October 11, 2017. This compares with the 2,436,040 Speedtest results from 322,851 users on all mobile Wi-Fi networks in New York City during the same period.

Where can you get it?

As described above, Links are rolling out rapidly. You can see the current map of available Links here, but we found that the map at today’s writing corresponds closely with the map of Speedtest results we’ve seen over the past year.

SPEEDTEST RESULTS ON AVAILABLE LINKS

Much of Manhattan is covered by Links, with the exception of Washington Heights north of the George Washington Bridge and lower Manhattan below Worth St. Links are sparser in the Bronx with nothing north of West Kingsbridge Road or east of Webster Ave. (north of 161st) and Third Ave. (south of 161st).

The alignment of Links along major thoroughfares becomes more obvious in Queens and Brooklyn. In this area, we see a large gap around Bushwick and Ridgewood with nothing south of 39th St. and Clarendon Rd. A whole swath of northeast Queens (bordered by Grand Central Parkway) also exists in a Link-free zone.

Meanwhile, in Staten Island you’ll find Links on sections of Hylan Blvd. and Richmond Rd. with a few scattered in between.

Links are required to have a range of at least 150 feet, although a spokesperson for LinkNYC reported a Speedtest result as fast as 80 Mbps at 400 feet. At either distance, people living in neighborhoods with a more sparse Link distribution may not have access near home.

PERFORMANCE MAP

The map above shows that speeds vary not by neighborhood but by distance from a Link.

Can I use it at home?

If you’re lucky enough to live near a Link, you actually can use it for your home internet; there’s nothing in the terms of service to say otherwise. But, unless you’re sitting within the unassisted range of a Link, we wouldn’t recommend it.

We were able to identify Speedtest results that were using extenders and/or repeaters to rebroadcast the service farther into a building, and those tests showed speeds 57% slower than New York’s 90.89 Mbps average for downloads over mobile Wi-Fi.

LinkNYC Speedtest Results
January 1–October 11, 2017
Connection Type Mean Download (Mbps) Mean Upload (Mbps)
Unsampled Results from Extenders and Repeaters 38.87 30.71
Overall LinkNYC Results 158.98 123.01

Approaches to municipal Wi-Fi

LinkNYC’s ad-based, public-private partnership is only one approach to municipal Wi-Fi. In Leiden, Netherlands, a non-profit organization set up an independent, community-based network run by volunteers. Venice offers free Wi-Fi to all residents and Longmont, Colorado offers free municipal Wi-Fi in several locations, mostly parks, as part of their Gig City initiative.

LinkNYC isn’t the first free Wi-Fi network, but it’s one of the largest. And, despite some bumps along the way, it’s successfully bringing fast, free public Wi-Fi to the masses. The project is so successful that CityBridge has just extended the same model to London as InLinkUK.

Are you enjoying free mobile Wi-Fi on either LinkNYC or InLinkUK? Take a Speedtest on Android or iOS so we can share details about the performance of these networks over the long haul. Select the CityBridge server when taking your test to get the most accurate results.

Ookla retains ownership of this article including all of the intellectual property rights, data, content graphs and analysis. This article may not be quoted, reproduced, distributed or published for any commercial purpose without prior consent. Members of the press and others using the findings in this article for non-commercial purposes are welcome to publicly share and link to report information with attribution to Ookla.

| October 3, 2017

Spooky Speeds: Investigating Mobile Performance at Some of the Eeriest Places on Earth

Have you ever wondered if ghosts use the internet too? While we can’t quite picture Casper using a cellphone, we can say that there are some odd things happening with cellular internet speeds at some of the spookiest places we’ve ever heard of. For the month of October, we’ll be counting down the haunted houses, mysterious mansions and peculiar prisons to find the fastest Speedtest results on mobile and reveal where specters might be interfering with the spectrum.

Look for new data on Spooky Speeds posted right here every Tuesday, Wednesday and Thursday until Halloween.

13. Calcasieu Parish Courthouse

Download 2.74 Mbps, Upload 0.34 Mbps

Calcasieu Parish Courthouse

Is the ghost of Toni Jo Henry, the first woman executed in the state of Louisiana, interfering with mobile signals at this Louisiana courthouse? Toni is already notorious for causing flickering lights and other electrical blips at this, the site of her execution for killing Joseph Calloway during a carjacking on the way to spring her beloved from jail. Three trials and one trip to the electric chair later, it seems cell signals might be her next target as mobile download speeds at the courthouse are 85% slower than those in the surrounding town.

12. Château de Châteaubriant

Download 3.82 Mbps, Upload 0.24 Mbps

Château de Châteaubriant

Poisoned or bled to death? We may never know what truly happened to Françoise de Foix, mistress of King Francis I, after her husband discovered her betrayal. What we do know is that her ghost reportedly walks the halls of this 11th century French castle every October 16, the anniversary of her death. We also know that mobile downloads at the castle are 87% slower than in the rest of the small village of Châteaubriant. Spectral interference or stone walls? You decide…

11. Winchester Mystery House

Download 5.54 Mbps, Upload 2.47 Mbps

Winchester Mystery House

Was the widow Winchester duped into building this labyrinthine house by a Boston psychic? Perhaps. Or perhaps a guilty conscience led her to want to create a home for the spirits of those killed by rifles built by her husband. But the stairways aren’t the only things that lead nowhere in this famous California mansion, the mobile download speeds are an abysmal 78% slower than those in San Jose as a whole. The lesson? Don’t count on calling for outside help if you’re trapped in the Witch’s Cap.

10. Alcatraz Island

Download 6.56 Mbps, Upload 5.92 Mbps

Alcatraz Island

With a mobile download speed that’s 48% slower than nearby San Francisco, the jury’s still out on whether the ghosts at this famous island prison are interfering with cell reception or it’s just a little too far from the nearest cell tower. Either way, we would not want to be locked in Cell 14D with any of the spirits reported to haunt The Rock, especially the likes of Al Capone and the Butcher. For that matter, we’ll steer clear of the moaning ghosts of cell blocks A, B and C while we’re at it.

9. The Tower of London

Download 12.34, Upload 6.67 Mbps

The Tower of London

From Thomas Becket to Anne Boleyn, murdered princes to the White Lady, this paragraph is not long enough to name all the ghosts associated with this castle on the River Thames. During its more than 900 years of life, this building has seen more than its fair share of death and its reputation as the most haunted building in England is well-earned. We don’t think all those ghosts are messing with the cellular spectrum, though, as the mobile download speed here is ever so slightly faster than London’s average.

8. Cuban Club

Download 14.80 Mbps, Upload 4.19 Mbps

Cuban Club

Flickering flashlights, a murdered board member and an actor’s suicide on stage mark this building that once housed a mutual aid society for Cuban residents of Tampa, Florida as one of the most haunted buildings in the U.S. Is this really the voice of Jimmy, the boy who’s said to have drowned in the basement pool? Either way, wait to watch that video until after you’ve left the building — the mobile download speed inside is 42% slower than in the rest of Tampa.

7. St. Augustine Lighthouse

Download 18.79 Mbps, Upload 3.78 Mbps

St. Augustine Lighthouse

The tragic drowning of three children one July afternoon in 1873 was the start of the most famous haunting in this lighthouse’s history. A light keeper also fell to his death while repainting the lighthouse in the mid-19th century. But the story isn’t all bad, because visitors report hearing the girls laughing from the top of the tower and the light keeper is reportedly still keeping watch over his beloved tower. Perhaps happy ghosts cause less spectrum interference, because mobile download speeds at the lighthouse are only 22% slower than in the rest of St. Augustine.

6. The Stanley Hotel

Download 19.76 Mbps, Upload 4.74 Mbps

The Stanley Hotel

This picturesque hotel offers an extravaganza of ghoulish ghosts — so much so that a stay here inspired Stephen King to write The Shining. While you won’t find Jack Torrance running around with his axe (thank goodness!), the fourth floor is filled with the voices of otherworldly children. One ghost plays piano in the ballroom while another turns lights on and off (he even takes requests). And the mobile download speed is 26% faster than in town. All the better to stream a little Kubrick with…

5. (Dracula’s) Bran Castle

Download 24.15 Mbps, Upload 8.06 Mbps

Dracula's Bran Castle

A mere image of this Transylvanian fortress inspired Bram Stoker to write one of the greatest horror novels of all time. Though the legend of Count Dracula is likely greatly exaggerated (if not entirely made up), the appeal is real and visitors flock from all over the world to tour the castle. If you go, it’ll be easy to post selfies because the mobile download speeds are 40% faster than those in nearby Bran.

4. The Banff Springs Hotel

Download 27.84 Mbps, Upload 12.19 Mbps

The Banff Springs Hotel

Was it an architectural mistake that created a secret room in this Alberta hotel or some otherworldly force? Since that space was exposed by fire there have been reports of strange noises, a family was murdered but the little girl’s fingerprints still appear on mirrors and a bride who tripped on her wedding gown reappears on the stairs where she died. The paranormal forces seem strong here with a 36% slower mobile download speed at the hotel than in town. Whatever you do, don’t hand your precious phone to the bellman. It’s said he never would retire, but he sure does appear and disappear at will.

3. The Skirrid Inn

Download 44.07 Mbps, Upload 22.03 Mbps

The Skirrid Inn

Another haunted hotel, this Welsh inn is over 900 years old. It once served as a courtroom where as many as 180 people were hanged from an oak beam. Visitors report rope burns accompanied by a choking sensation, and the hanging judge purportedly remains in residence on the upper floors. Friendlier ghosts are also in residence, including a chambermaid and a clergyman, and one night money levitated above the bar. If the spooks are affecting the cellular spectrum, it’s in a positive way as the mobile download speed at the Skirrid Inn is 52% faster than the average for Monmouthshire county.

2. Akershus Fortress

Download 60.84 Mbps, Upload 13.28 Mbps

Akershus Fortress

Built to protect Oslo, this complex has housed dungeons, royal tombs and a prison. These days it’s the site of official banquets. Ghost hunters, though, will be more interested in the reports of otherworldly screams and rattling chains that echo through the halls after dark. You may encounter Mantelgeisten, a faceless maiden in a long robe, but pray you never meet Malcanisen, a ghoulish dog that’s rumored to portend death within three months for anyone he meets. All this psychic activity doesn’t seem to affect mobile speeds at the castle, though. They’re only 5% slower than Oslo as a whole.

1. Fort George

Download 99.68 Mbps, Upload 21.23 Mbps

Fort George

By far the location with the fastest mobile download speeds on our list of haunts, this War of 1812 battle site doesn’t disappoint when it comes to spooky activity, either. From red-coated soldiers to “The Woman in the Mirror”, the fort is filled with apparitions, inexplicable footsteps and doors that open and close themselves. We have to wonder if those spirits have a magical effect on cellular signals, too, because downloads at the fort are 163% faster than in town.

We hope you enjoyed this tour of mobile internet speeds at spooky locales. While the internet speed data is solid, we cannot actually say if it’s the ghosts causing the anomalies we saw. We can say that we’ll be careful approaching any of these places after dark. Especially on Halloween…


Ookla retains ownership of this article including all of the intellectual property rights, data, content graphs and analysis. This article may not be quoted, reproduced, distributed or published for any commercial purpose without prior consent. Members of the press and others using the findings in this article for non-commercial purposes are welcome to publicly share and link to report information with attribution to Ookla.

| September 19, 2017

Exploring the Internet in Antarctica

In our coverage of the fastest airports on each continent we left one out — Antarctica. Because, as much as we’d love to, we do not have a ton of data from Antarctica to tell you which airfield has the fastest Wi-Fi. But being off the beaten path is kind of the point of visiting Antarctica, isn’t it?

We’re actually delighted to be able to share any data from Antarctica with you at all. Normally we’d sift through data and aggregate it before it’s analyzed to make sure you’re getting a really reliable look at average speeds. Given that there’s nothing average about Antarctica, though, we’re sharing raw Speedtest data from July 2017 for tests taken on mobile Wi-Fi and cellular networks.

Mobile Wi-Fi

During that time we saw three tests over Wi-Fi at field stations (that also have air strips):

July 2017 Speedtest Results
Antarctica Field Stations
Location Download (Mbps) Upload (Mbps) Ping (ms) ISP
Base Presidente Eduardo Frei Montalva 1.32 0.67 598 Movistar
Showa Station 0.57 2.67 1313 ROIS
General Bernardo O’Higgins Base 1.03 0.07 739 Claro

These research stations are spread far and wide with one each on the Antarctic Peninsula, East Ongul Island, and King George Island.

Based on those tests, we’d say that there definitely is internet available on Antarctica, but in most cases the speeds are glacially slow. Which is what we’d expect from a continent served entirely by satellites. According to an AMA with a Utilities Mechanic at McMurdo Station, “The internet is fast enough to browse reddit, but they restrict the bandwidth to social media websites and youtube, because EVERYONE is trying to use these all the time and the science teams have higher priority access. Online gaming would only be possible in the really early hours of the morning, and even then the ping would be incredibly high.” His Speedtest result from January 2016 showed a download speed of 1.79 Mbps and an upload of 0.82 Mbps with a ping of 1969 ms.

Cellular tests

We also saw one test over cellular networks in July that occurred near Terleckijtoppen Peak and somewhat close to Tor Field Station. This was by far the fastest test result we saw in all of Antarctica during the time period we studied:

July 2017 Speedtest Results
Near Terleckijtoppen Peak, Antarctica
Latitude Longitude Download (Mbps) Upload (Mbps) Ping (ms) ISP
-71.822 10.3419 25.94 27.74 26 DNA

There is 4G on Antarctica. Argentina’s Movistar launched a 4G network at Marambio Base in January. We haven’t seen any tests over it yet, but we’d like to. If you’re living, working or traveling in a remote location on the planet (or off!) please take a Speedtest and share your results with us using the hashtag “#FarFlungSpeeds”.

This article was updated on September 19 to remove results we later determined to be geographically invalid.

Ookla retains ownership of this article including all of the intellectual property rights, data, content graphs and analysis. This article may not be quoted, reproduced, distributed or published for any commercial purpose without prior consent. Members of the press and others using the findings in this article for non-commercial purposes are welcome to publicly share and link to report information with attribution to Ookla.

| September 12, 2017

The Inside Story on U.K. Internet Speeds

You may have read in Speedtest Global Index that the United Kingdom has the 41st fastest mobile download speed and the 25th fastest fixed broadband speed in the world for the month of August. This is true, but the U.K.’s complex geography makes the story much more nuanced than that. This month we’ve gone beyond the country-level statistics available in the Speedtest Global Index to give you a peek at the deeper story.

Mobile speeds are relatively even

Average mobile speeds across the four countries of the U.K. didn’t actually vary that much during the month of August 2017. Downloads in England are 2.5% faster than the UK as a whole. In Scotland, they are 10.5% slower than the UK average, 6.9% slower in Northern Ireland and 4.8% slower in Wales. But even in Scotland, the download speed is decent. Mobile upload speeds don’t fluctuate, either from England’s 1.7% faster than U.K. average to Wales 8.7% slower than U.K. average.

Mobile Speeds United Kingdom

This does not mean that all mobile internet users in the U.K. connect at these speeds, even on a country-level. In June, Ofcom published a report saying that 56% of rural users in the U.K. were satisfied with their mobile service, compared with 72% of urban users.

Fixed broadband speeds vary… a lot

England’s mean download and upload speeds over fixed broadband are on par with those in the U.K. as a whole, but that’s where the story of relatively comparable internet speeds across the U.K. breaks down.

Scotland’s fixed broadband speed is a whopping 36.8% faster than the U.K. average. Download speeds in Wales and Northern Ireland, on the other hand, are 35.6% and 46.3% slower than the U.K. average. Northern Ireland’s average is slower than Ofcom’s 30 Mbps superfast designation and Wales’s average is not much better. Upload speeds in these two areas are 21.5% and 29.0% slower, respectively, than the U.K. average.

Fixed Mean Speeds United Kingdom

About those slow areas…

The government of Wales has been working on project Superfast Cymru to bring “access to high speed broadband to the majority of homes and businesses in Wales that cannot get it through the private sector’s own commercial programmes.” And the BBC reported in March 2017 that “Speeds of 24Mbps plus are now available in about nine out of every 10 homes and businesses in Wales.”

Northern Ireland has undertaken a similar endeavor with the Superfast Rollout Project and in December 2016, Ofcom’s Northern Ireland director wrote that superfast broadband was available to eight in 10 homes in Northern Ireland.

But these projects have been rolling out for awhile, and while nearly 650,000 Welsh premises newly had access courtesy of Superfast Cymru, download speeds in Wales only increased 12.8% over the last year. The Northern Ireland Broadband Improvement Project has been under way since February 2014 and the past year saw an increase of only 15.2% in download speeds. These compare with increases of 33.3% in England and 63.5% in Scotland during the same period.

So why are internet speeds still so different?

Subscription rates

Access does not mean that people are subscribing to higher tier plans. For example, the House of Commons library reported that seven out of ten of the slowest council wards in the U.K. were in Wales. This is borne out when we look at median speeds rather than mean speeds:

MedianFixed Speeds United Kingdom
Because the median speeds are the most frequently occurring speeds, these numbers more accurately reflect what people are subscribing to, not what they could achieve in a given location.

Rural population

Extending fiber to rural areas can be expensive and not all providers are willing to invest in areas with smaller populations where the rate of return is likely to be lower.

Looking at rural population statistics from across the U.K., this could be one reason why service is slower in Northern Ireland and Wales. In Northern Ireland, 33.2% of people lived in areas with a population of 3,000 or less. Compare that with Scotland’s 18% or England where 17.6% of people lived in areas of 10,000 or less. In Wales that number is closer to 32%. Urban vs. rural designations in Wales are a bit more tricky, but the Government of Wales considers a combination of areas designated as “less sparse rural” and three subsets of “sparsest” areas to be rural; that combination of areas houses 20.5% of the Welsh population.

These numbers don’t necessarily mean that higher percentages of rural population leads to slower fixed broadband speeds, but there is a correlation.

Whatever the cause of the wide difference in fixed broadband speeds across countries of the U.K., it’s clear that Wales and Northern Ireland still have a lot of catching up to do, particularly if they want to take full advantage of the digital economy.

Ookla retains ownership of this article including all of the intellectual property rights, data, content graphs and analysis. This article may not be quoted, reproduced, distributed or published for any commercial purpose without prior consent. Members of the press and others using the findings in this article for non-commercial purposes are welcome to publicly share and link to report information with attribution to Ookla.

| August 10, 2017

How Norway Came to Have the Fastest Mobile Internet in the World

Thirteen months ago Norway did not have the fastest mobile internet speeds in the world. In fact, with an average download speed of 31.09 Mbps, the country ranked only 11th globally for mobile speeds in August 2016. By September 2016, however, the country’s average download speed had jumped 41% to 43.73 Mbps which ranked Norway #1 in the world for mobile download speed. This has continued to increase over the last year to 52.59 Mbps in July 2017 and Norway has maintained that first place ranking with a significant lead.

That’s an impressive 69% year-over-year gain for download speeds, and it begs the question: what caused the increase?

Telenor leads the way

On September 4, 2016, Telenor removed a cap on mobile speeds. According to Telenor’s Head of Mobile, Bjørn Ivar Moen, Telenor originally had rate limits on some plans to allow customers to choose from a range of subscription options.

Ultimately, though, Moen says “We knew we had the best and fastest mobile network in Norway and felt it was wrong not to give this advantage to our customers. We also felt comfortable that the network would handle max speed to all our customers due to the job done on capacity and coverage in the network all over Norway.”

The graph below shows that Norway’s sudden climb to #1 on the Speedtest Global Index is directly related to that jump in Telenor’s mobile speeds.

Norway and Telenor

And customers are happy. According to Moen, customers reported that the ability “to use the network with real 4G+ speed and coverage was really felt as a difference in their daily use.” Moen also said Telenor has seen no negative effects from uncapping these speeds.

What about other mobile carriers?

Being the fastest country in the world requires more than just one fast carrier. Though Telenor has offered the fastest mobile speeds in Norway ever since, second place Telia also increased their speeds significantly in 2016. Looking at download speeds on all devices, Telia’s mobile speed increased 42% from 33.34 Mbps in October 2016 to 47.24 Mbps in December 2016.

Telenor & Telia

The fast mobile speeds that Telenor and Telia are achieving are especially impressive considering the mountains and fjords of Norway, geographical challenges that carriers in other countries don’t necessarily have to face.

Broader benefits of fast speeds

The work these two carriers did to put Norway in first place in the world for mobile speeds for the last year benefits not just their customers but the country as a whole.

Having the fastest mobile speeds in the world creates a favorable climate for new digital solutions in all areas of society — from health care and transportation to entertainment services. We can’t wait to see what innovations develop as a result and how other carriers and markets follow suit.

Are there other stories like this?

Yes! There are many interesting stories like this happening behind the scenes all the time in the telecom market. Our new site, Speedtest Global Index, can help pinpoint increases and drops in internet speeds that signal market shifts on a country level. Check it out today.

Ookla retains ownership of this article including all of the intellectual property rights, data, content graphs and analysis. This article may not be quoted, reproduced, distributed or published for any commercial purpose without prior consent. Members of the press and others using the findings in this article for non-commercial purposes are welcome to publicly share and link to report information with attribution to Ookla.

| August 9, 2017

Rank Internet Speeds Around the World with Speedtest Global Index

We’re pleased to announce Speedtest Global IndexTM, a monthly ranking of global mobile and fixed broadband speeds. At Ookla, our mission is to make the internet faster by providing data and insights on real-world internet speeds. As part of that mission, we’re making Speedtest data available to you in a new, interactive format.

Based on the billions of consumer-initiated tests taken all over the world using Speedtest, this resource displays the latest information on which countries have the fastest mobile and fixed broadband and which have the slowest.

How you can use Speedtest Global Index

The home page gives you a quick overview of how countries rank, how that rank has changed in the last month, and the download speed that rank is based on.

Top 5 countries

Click on an individual country to see 12 months’ worth of data including historic download and upload speeds over mobile and fixed broadband.

Use these country pages to spot spikes and dips in internet performance on a country level. Uncover trends and detect potential storylines.

Mouseover a dot on the trendline to see the average speed and worldwide ranking for that particular month, giving you the depth of data you need to tell richer stories.

Your source for data on global internet speeds

We hope you’ll come to see Speedtest Global Index as a go-to resource for global internet performance data. Take this data and use it to tell stories that help make the internet faster in your home country and around the world. Feel free to cite Speedtest Global Index as a source and link to it as needed.

We’ll update Speedtest Global Index with data based on the previous month at the beginning of every month so you’ll have fresh statistics and an early eye on new developments.


Ookla retains ownership of this article including all of the intellectual property rights, data, content graphs and analysis. This article may not be quoted, reproduced, distributed or published for any commercial purpose without prior consent. Members of the press and others using the findings in this article for non-commercial purposes are welcome to publicly share and link to report information with attribution to Ookla.