| February 21, 2019

10 Gbps? There's a Speedtest for That

Internet speeds keep getting faster and faster and Speedtest is ready to measure the fastest speed available — the 10 Gbps connection.


If you can’t see the above video, please check your Adblock settings.

Most of us don’t need a 10 Gbps test, yet…

Ten gigabits per second is 10 times faster than the gigabit connection your techie friend has been bragging about. For most of us, a connection this fast is overkill (right now), as you can watch a 4K Ultra streaming movie with just 25 Mbps. But there are some ISPs around the globe that are already offering 10 Gbps service.

10 Gbps opens the doors

People who upload and download huge files will love 10 Gbps. Whether you’re uploading large videos to share with clients, downloading 100 videos in the final seconds before leaving for your trip, waiting on huge game patches, or hosting the world’s largest LAN party at your house, 10 Gbps will change your life.

Having a 10 Gbps Speedtest means that organizers of huge events like Mobile World Congress (MWC) can use Speedtest to ensure that their infrastructure is fast enough to serve thousands of attendees.

Achieving a 10 Gbps Speedtest result

To get a 10 Gbps Speedtest result, you need a connection that fast and devices that are capable of handling those speeds. We tested between two Mac Minis with 9000 byte jumbo frames.

Web browsers max out around 3 Gbps, so we used our our desktop app. The test is data- intensive — our multi-thread test used over 17 GB to measure the download speed and nearly 13 GB to measure upload. We have many servers that can handle tests this large, so if you are trying to replicate our result and think your test is being limited by the server you’re using, try another.

Again, this is what a 10 Gbps Speedtest result looks like:


You’ll note that the test doesn’t quite hit 10 Gbps. This is because any connection is subject to overhead. So a 1 Gbps payload usually loses 6-9% to overhead and a 10 Gbps connection loses about the same percentage.

To see a 10 Gbps Speedtest in action, schedule a meeting at MWC or come see us in Hall 2 at Booth 2i25.

Ookla retains ownership of this article including all of the intellectual property rights, data, content graphs and analysis. This article may not be quoted, reproduced, distributed or published for any commercial purpose without prior consent. Members of the press and others using the findings in this article for non-commercial purposes are welcome to publicly share and link to report information with attribution to Ookla.

| February 20, 2019

An Expansive Analysis of European Mobile Roaming Speeds and Behaviors

Last year we took a look at how free roaming was working out for EU citizens in terms of speeds and latency. This year we’ve expanded our analysis to all European countries and included data on Wi-Fi roaming behavior. We’ve also added a little insight into how roaming might affect download speeds for visitors to Mobile World Congress (MWC) in Barcelona from February 25- 28, 2019.

Except where noted, this analysis is based on Speedtest data from Android devices on 4G LTE cellular connections during Q3-Q4 2018. We included data on any country with greater than 30 samples in all categories.

Most Europeans experience slower downloads while roaming

Roaming traffic is subject to deals struck between individual mobile operators on how that traffic will be prioritized, so roaming speeds can depend not only on the country of origin but also the country of destination and the plan a subscriber has selected.

Consider the following table where an Albanian experiences a mean download speed of 54.56 Mbps at home and then 38.47 Mbps while roaming elsewhere in Europe. This is expected as a roamer does not usually have a direct relationship with the mobile operator handling their data and calls abroad.

Mean Mobile Download Speeds in Europe
Speedtest Data | Q3-Q4 2018
Country Local Speed (Mbps) Roaming Speed (Mbps) % Difference
Austria 38.23 35.78 -6.4%
Belarus 16.15 19.49 20.7%
Belgium 52.58 35.42 -32.6%
Bulgaria 47.28 32.35 -31.6%
Croatia 43.83 43.60 -0.5%
Cyprus 37.13 20.58 -44.6%
Czech Republic 44.91 13.43 -70.1%
Denmark 48.83 34.89 -28.6%
Estonia 36.43 38.98 7.0%
Finland 39.33 38.20 -2.9%
France 39.94 34.97 -12.5%
Germany 33.77 28.57 -15.4%
Greece 41.35 38.08 -7.9%
Hungary 49.57 28.19 -43.1%
Iceland 69.27 35.58 -48.6%
Ireland 28.23 31.49 11.6%
Italy 32.18 43.12 34.0%
Kazakhstan 22.93 13.80 -39.8%
Latvia 30.88 33.79 9.4%
Liechtenstein 56.48 36.66 -35.1%
Lithuania 41.49 33.43 -19.4%
Luxembourg 50.91 25.08 -50.7%
Malta 56.34 34.27 -39.2%
Montenegro 45.45 49.97 10.0%
Netherlands 56.06 33.86 -39.6%
Norway 68.49 38.69 -43.5%
Poland 28.74 29.71 3.4%
Portugal 32.06 36.95 15.3%
Romania 36.64 30.74 -16.1%
Russia 20.91 20.47 -2.1%
Serbia 43.41 21.64 -50.1%
Slovakia 33.47 31.80 -5.0%
Slovenia 35.51 36.41 2.5%
Spain 36.07 22.37 -38.0%
Sweden 44.87 34.59 -22.9%
Switzerland 47.59 30.36 -36.2%
Turkey 38.19 28.77 -24.7%
Ukraine 26.07 25.48 -2.3%
United Kingdom 30.84 38.76 25.7%

Residents of the Czech Republic will face massive speed disappointment when roaming through the rest of Europe. Other countries with much better speeds at home than abroad include Luxembourg, Serbia, Iceland and Cyprus.

In ten European countries, citizens experience faster mobile downloads while roaming than they do at home. These include: Italy, the United Kingdom, Belarus, Portugal, Ireland, Montenegro, Latvia, Estonia, Poland and Slovenia. Most of these are among the slowest countries on this list, so it would make sense that their citizens would experience better speeds elsewhere in Europe than they do at home.

Europeans are connected to Wi-Fi most of the time

Customers sometimes try to get better speeds and avoid roaming fees (for those outside the E.U.) and data overages by connecting to Wi-Fi. The following table compares the percentage of time spent on Wi-Fi by a resident of a country with that of a visitor to the country.

Percentage of Time Spent on Wi-Fi in Europe
Speedtest Data | Q3-Q4 2018
Country Local Customers Visitors % Difference
Albania 61.9% 59.8% -3.4%
Andorra 73.6% 69.0% -6.2%
Armenia 61.5% 68.1% 10.7%
Austria 65.6% 36.7% -44.1%
Azerbaijan 67.0% 70.7% 5.5%
Belarus 63.9% 58.3% -8.9%
Belgium 71.1% 32.9% -53.7%
Bosnia and Herzegovina 71.9% 66.0% -8.2%
Bulgaria 65.2% 46.8% -28.2%
Croatia 66.1% 41.0% -38.0%
Cyprus 70.9% 58.4% -17.7%
Czech Republic 75.1% 38.9% -48.1%
Denmark 70.4% 52.9% -24.9%
Estonia 61.2% 45.6% -25.4%
Finland 56.6% 47.1% -16.7%
France 60.2% 43.1% -28.5%
Georgia 61.4% 62.2% 1.3%
Germany 72.2% 42.4% -41.3%
Greece 73.5% 52.2% -28.9%
Hungary 71.9% 35.0% -51.3%
Iceland 65.7% 58.2% -11.4%
Ireland 67.2% 52.4% -22.0%
Italy 64.1% 48.9% -23.7%
Kazakhstan 57.7% 64.7% 12.3%
Latvia 60.9% 43.8% -28.1%
Liechtenstein 71.7% 58.2% -18.9%
Lithuania 66.8% 43.3% -35.1%
Luxembourg 63.6% 26.0% -59.1%
Macedonia 65.3% 52.9% -18.9%
Malta 74.3% 58.0% -22.0%
Moldova 67.2% 67.3% 0.2%
Montenegro 63.6% 65.2% 2.5%
Netherlands 73.0% 42.5% -41.7%
Norway 74.7% 59.7% -20.1%
Poland 62.5% 48.1% -23.1%
Portugal 69.1% 54.7% -20.9%
Romania 62.4% 48.7% -21.9%
Russia 58.8% 65.9% 12.2%
San Marino 66.8% 39.7% -40.6%
Serbia 68.6% 61.2% -10.7%
Slovakia 69.6% 35.1% -49.6%
Slovenia 63.3% 26.4% -58.3%
Spain 70.8% 53.0% -25.2%
Sweden 71.8% 44.9% -37.4%
Switzerland 62.4% 47.2% -24.4%
Turkey 61.7% 73.0% 18.4%
Ukraine 61.5% 62.4% 1.5%
United Kingdom 71.3% 54.0% -24.3%

Finland showed the lowest time spent on Wi-Fi by residents at 56.6%. Kazakhstan was second at 57.7% followed by Russia (58.8%), France (60.2%) and Latvia (60.9%). The Czech Republic showed the highest time spent on Wi-Fi by residents at 75.1%. Norway was second at 74.7% followed by Malta (74.3%), Andorra (73.6%) and Greece (73.5%).

When it comes to time spent on Wi-Fi by visitors, Luxembourg had the lowest percentage at 26.0%. Slovenia was second at 26.4% followed by Belgium (32.9%), Hungary (35.0%) and Slovakia (35.1%). Turkey showed the highest time spent on Wi-Fi by visitors at 73.0%. Azerbaijan was second at 70.7% followed by Andorra (69.0%), Armenia (68.1%) and Moldova (67.3%).

Luxembourg saw the largest difference in time spent on Wi-Fi between residents and visitors with visitors using Wi-Fi 59.1% less than residents. Slovenia was close behind at 58.3%, followed by Belgium (53.7%) and Hungary (51.3%). On the other end of the spectrum, visitors to Turkey were on Wi-Fi 18.4% longer than residents followed by Kazakhstan (12.3%) and Russia (12.2%).

Roaming dramatically increases latency in Europe

Because roaming signals are routed through a user’s home network, latency is always an issue in roaming. Speedtest data shows that latency while roaming is a much larger issue for residents of some countries than it is for others.

Comparing European Latency In-Country and Abroad
Speedtest Data | Q3-Q4 2018
Country Local Latency (ms) Roaming Latency (ms) % Difference
Austria 24 83 245.8%
Belarus 32 75 134.4%
Belgium 24 81 237.5%
Bulgaria 24 126 425.0%
Croatia 32 86 168.8%
Cyprus 20 194 870.0%
Czech Republic 24 86 258.3%
Denmark 24 98 308.3%
Estonia 23 78 239.1%
Finland 26 104 300.0%
France 42 87 107.1%
Germany 33 87 163.6%
Greece 27 137 407.4%
Hungary 22 94 327.3%
Iceland 18 163 805.6%
Ireland 34 114 235.3%
Italy 52 116 123.1%
Kazakhstan 35 164 368.6%
Latvia 24 94 291.7%
Liechtenstein 40 90 125.0%
Lithuania 26 108 315.4%
Luxembourg 23 73 217.4%
Malta 18 141 683.3%
Montenegro 18 42 133.3%
Netherlands 26 81 211.5%
Norway 36 109 202.8%
Poland 33 104 215.2%
Portugal 27 102 277.8%
Romania 26 131 403.8%
Russia 42 161 283.3%
Serbia 22 76 245.5%
Slovakia 30 69 130.0%
Slovenia 21 69 228.6%
Spain 45 118 162.2%
Sweden 30 118 293.3%
Switzerland 26 75 188.5%
Turkey 26 115 342.3%
Ukraine 35 116 231.4%
United Kingdom 37 107 189.2%

Residents of Cyprus saw an average latency of 194 ms while roaming in Europe. The country with the second highest latency for residents roaming abroad was Kazakhstan at 164 ms, followed by Iceland (163 ms). Russia (161 ms) and Malta (141 ms). In contrast, Montenegro had a lower latency for residents roaming abroad than Italy did for residents using their mobile phones locally.

Roaming performance at MWC

MWC, the largest mobile conference in the world, has Barcelona teeming with visitors from across the globe all trying to connect to their home networks. During February 2018 we saw an average download speed of 34.31 Mbps while roaming in Barcelona and a mean latency of 201 ms. Visitors from the U.K. saw an average download speed of 49.00 Mbps and a mean latency of 111 ms, while those from Italy averaged a download of 32.88 Mbps and a latency of 128 ms.

What will the performance look like at this year’s conference? Schedule a meeting or come see us in Hall 2 at Booth 2i25 to learn more about our roaming data.

Ookla retains ownership of this article including all of the intellectual property rights, data, content graphs and analysis. This article may not be quoted, reproduced, distributed or published for any commercial purpose without prior consent. Members of the press and others using the findings in this article for non-commercial purposes are welcome to publicly share and link to report information with attribution to Ookla.

| February 11, 2019

Analyzing India’s 4G Availability: Including a Look at the 15 Largest Cities

It’s a good time to be a mobile customer in India with Airtel expanding its LTE service in major cities using the 900 MHz band and Jio making continuous progress on its mission to provide 4G coverage to all Indians. All this good news made us want to check in to see what cellular availability in India currently looks like.

We analyzed General Availability and 4G Availability using coverage data from 250,138,853 samples on 595,034 enabled devices during Q3-Q4 2018. General Availability is the percentage of an operator’s known locations where a device has access to any kind of service (including roaming). 4G Availability is then the percentage of an operator’s known locations where a device has access to LTE service (including roaming). We compared these results across Indian mobile operators to see which provides the best availability.    

Cellular service is widely available across India

General Availability statistics are good for all of India’s major mobile operators. In a country where there are only 1.33 fixed broadband subscriptions per 100 people, access to mobile internet is critical. Jio’s General Availability was best, with users finding service in 99.3% of locations. Airtel was second at 99.1%, followed closely by Vodafone (99.0%) and Idea (98.9%).

Percentage of Locations With Cellular Service
India | Q3-Q4 2018
Operator General Availability (%)
Jio 99.3
Airtel 99.1
Vodafone 99.0
Idea 98.9

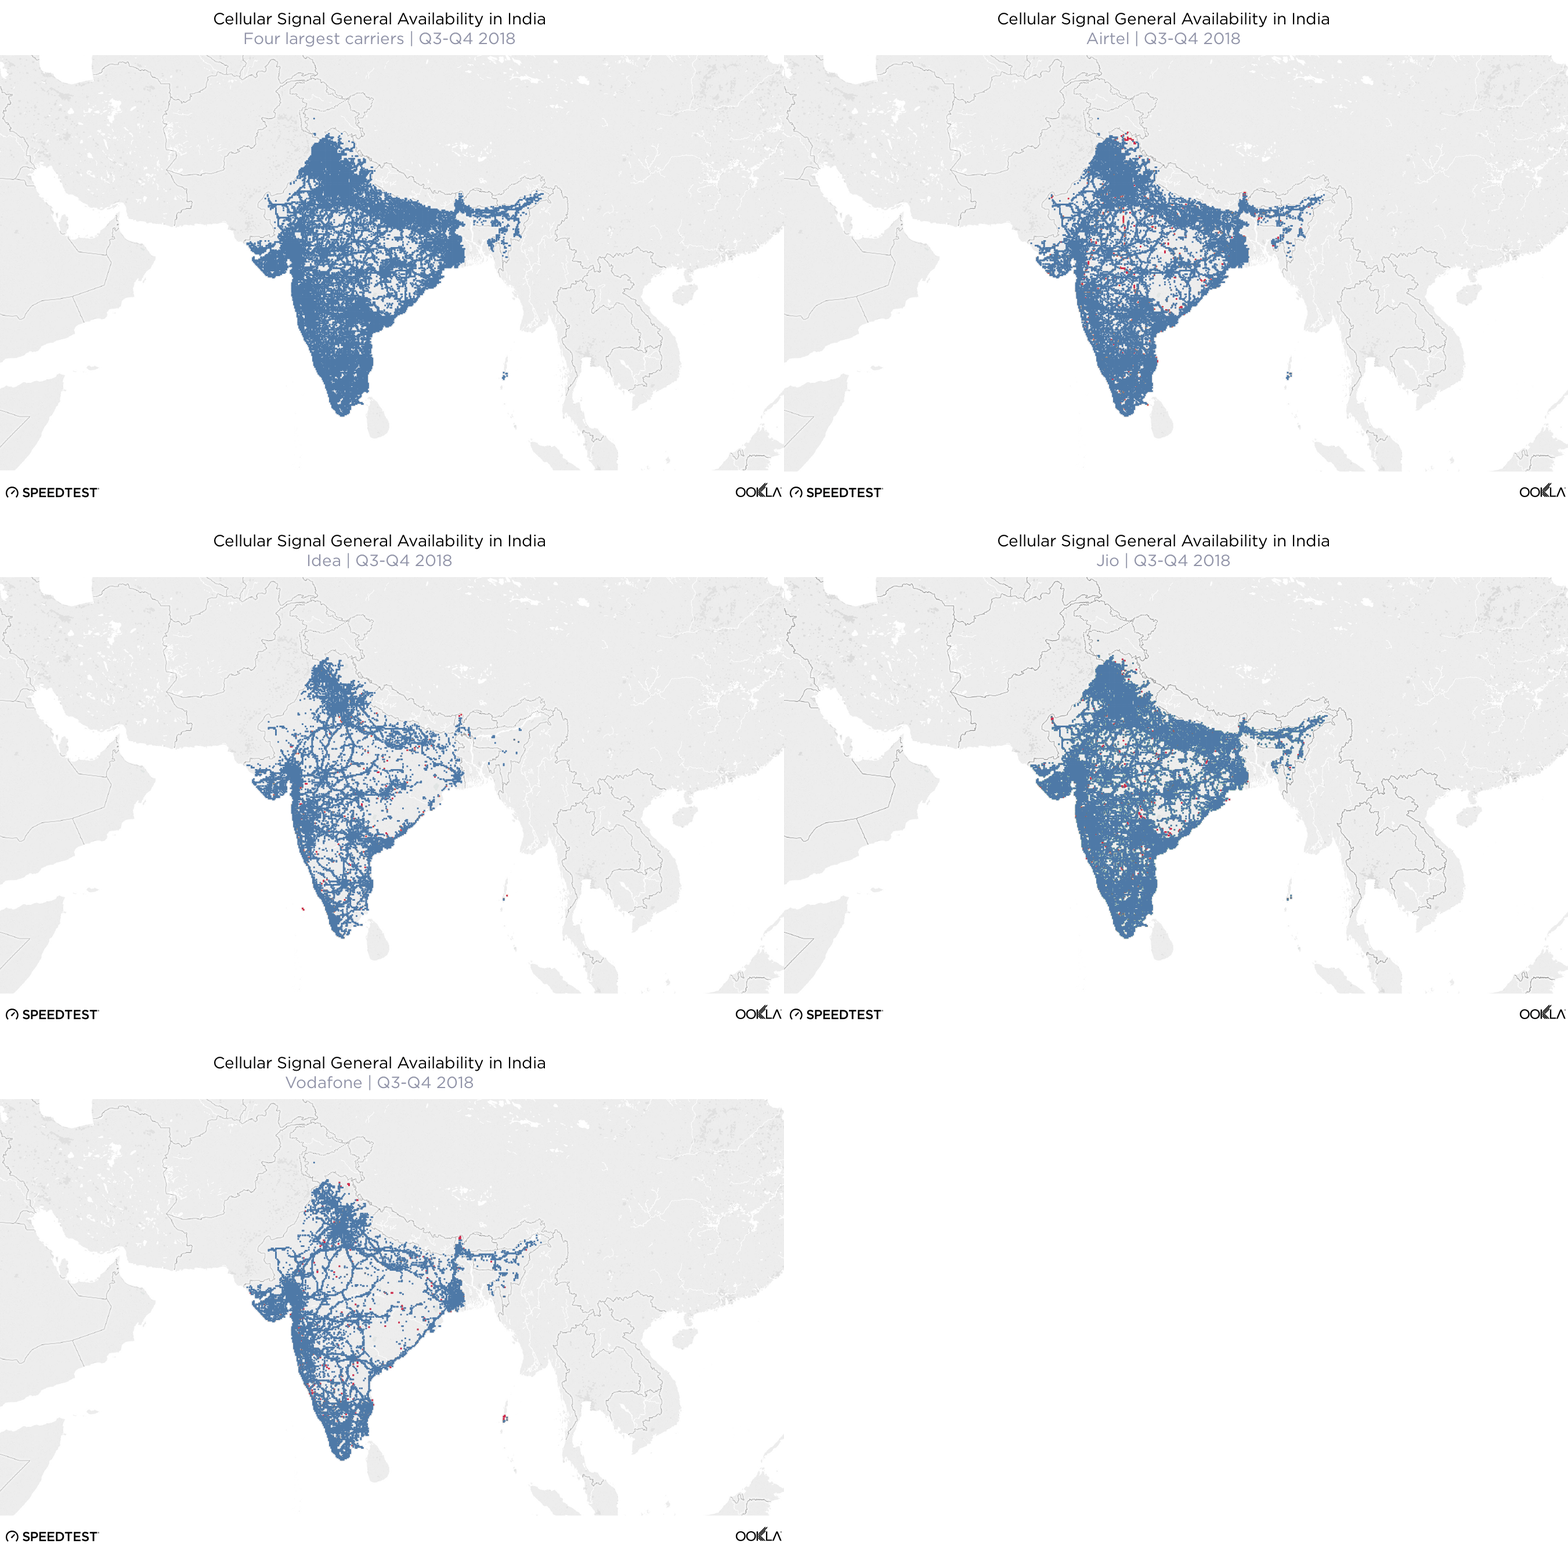
As you can see from the map below, most areas in India are covered by at least one of the country’s four largest mobile operators.

All-Carrer-Map-Animate-1

Coverage data relies on the presence of a user in a location, so it’s normal to see the majority of results that show coverage (seen in blue) coming from the most populated areas. When a sample is taken and a user does not have cellular coverage (seen in red), that data is transmitted later. Areas that show no dot are places where no coverage data was collected. These gaps often correspond with national parks or other remote areas that people visit less frequently.

Jio showed the densest pattern of coverage samples for General Availability across India, with only a few areas where coverage data showed no service.

Airtel’s pattern of coverage samples showed only slightly less areas with coverage. Airtel had only slightly more “no service” areas, particularly in Maharashtra, Uttar Pradesh and Himachal Pradesh.

Idea and Vodafone had a similar density of coverage samples showing coverage, but were strong in different parts of the country. Idea showed more density in Andhra Pradesh and Madhya Pradesh, while Vodafone was stronger in Tamil Nadu and West Bengal. Neither showed a large number of “no service” areas.

4G availability in India depends on your mobile operator

LTE connections, while widely available in much of India, depend heavily on which mobile operator a consumer has chosen. At a country-level, Jio shows an impressive 98.8% 4G Availability. That means that a Jio customer has access to LTE service at 98.8% of surveyed locations. Airtel is second at 90.0%, followed by Vodafone (84.6%) and Idea (82.8%).

Percentage of Locations with LTE Service
India | Q3-Q4 2018
Operator 4G Availability (%)
Jio 98.8
Airtel 90.0
Vodafone 84.6
Idea 82.8

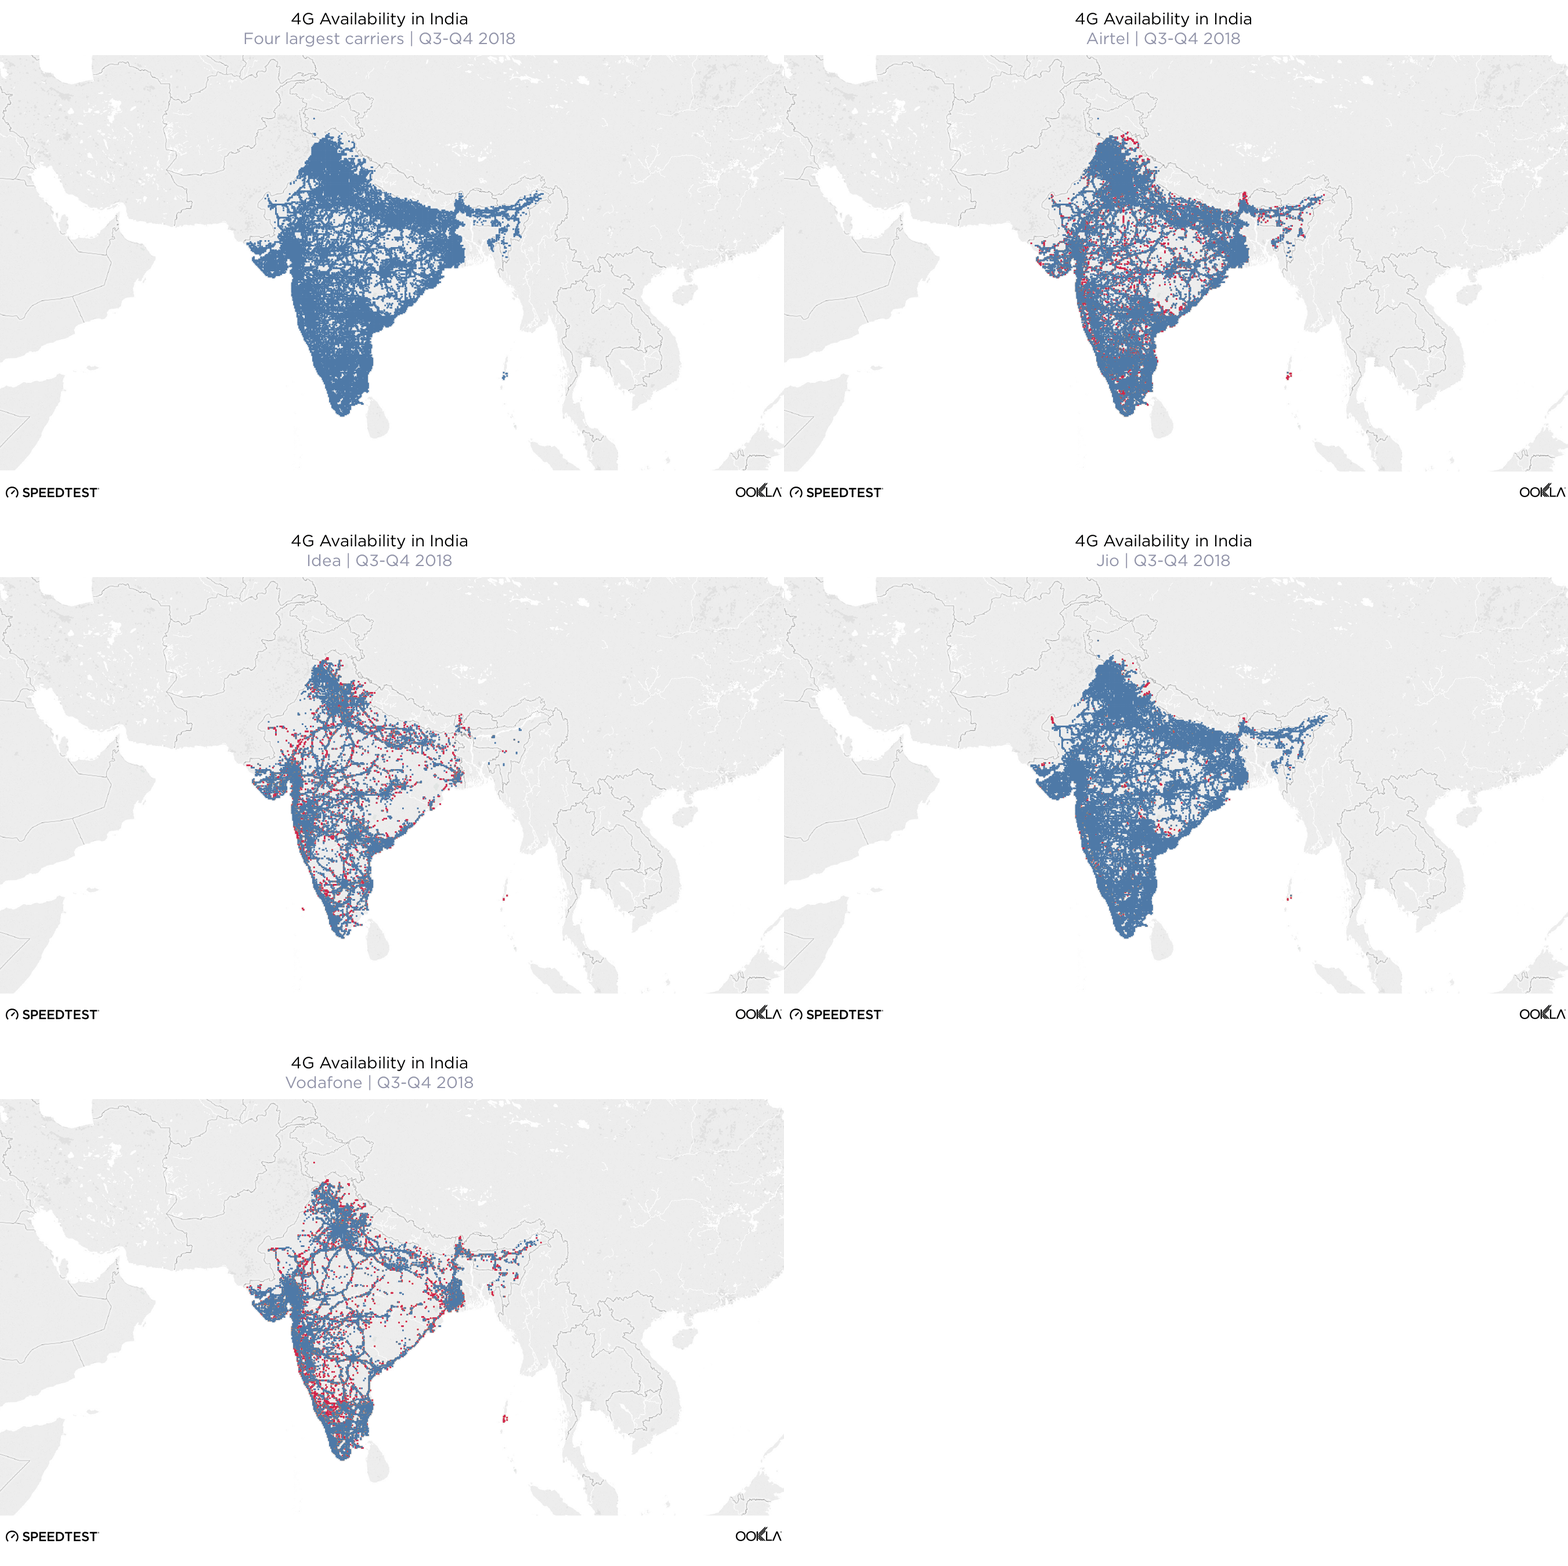
Coverage data from the four largest mobile operators reveals that LTE is not available in all the areas that general cell service is in India. This is especially true in the center of the country, in Sikkim and in the Andaman Islands.

LTE-Carrer-Map-Animate-2

Except for a few red spots at the edges of Uttarakhand, Rajasthan, Sikkim and the Andaman Islands, Jio’s 4G Availability map is nearly identical to their General Availability map.

Airtel’s 4G Availability map is still very dense, but shows gaps in LTE coverage in many areas of the country including portions of Maharashtra, Madhya Pradesh and Karnataka.

As we saw with overall scores, the 4G Availability map for Vodafone reveals that the operator’s LTE coverage is not as robust as their overall coverage. We saw major gaps in Vodafone’s LTE in Karnataka in particular and smaller gaps in northeastern India in general (with the exception of the most populated areas of West Bengal).

Idea’s 4G Availability map shows gaps in LTE service across the country, especially in less densely populated areas.

4G Availability does not equal fast speeds

Until 5G is rolled out, LTE is the fastest connection type available to consumers. India shows us, however, that 4G Availability does not automatically equate to fastest service. To compare which of India’s largest mobile operators is fastest, we’ve used Speed ScoreTM, a combined measure of download and upload speed that incorporates several tiers of performance.

Comparing Speeds for India’s Largest Mobile Operators
Q3-Q4 2018
Operator Speed Score (all cell) Speed Score (4G LTE)
Airtel 10.34 11.23
Vodafone 8.19 9.13
Jio 7.11 7.11
Idea 6.20 7.02

Airtel was the fastest mobile operator in India during Q3-Q4 2018, regardless of whether a customer was on LTE or not. The ranking of the other operators does not change based on LTE use with Vodafone taking second fastest, Jio third and Idea fourth.

As the above table shows, Jio’s commitment to LTE remained unwavering as demonstrated by the fact that the operator’s Speed Score did not change when looking at all technologies or on LTE alone. We cannot say why Jio’s speeds were slower than those of Airtel and Vodafone, but it’s likely a combination of network congestion and users accessing the Jio network with slower phones.

We’ll be interested to see how these numbers improve in the near term as operators continue to build out their networks.

How general and LTE availability look in India’s largest cities

Country-wide averages can hide a lot of information. To get a clearer picture of the customer experience across the country, we looked at General and 4G Availability as well as operator speeds in the 15 largest cities in India.

General Availability is strong

india-general-avail-map-1

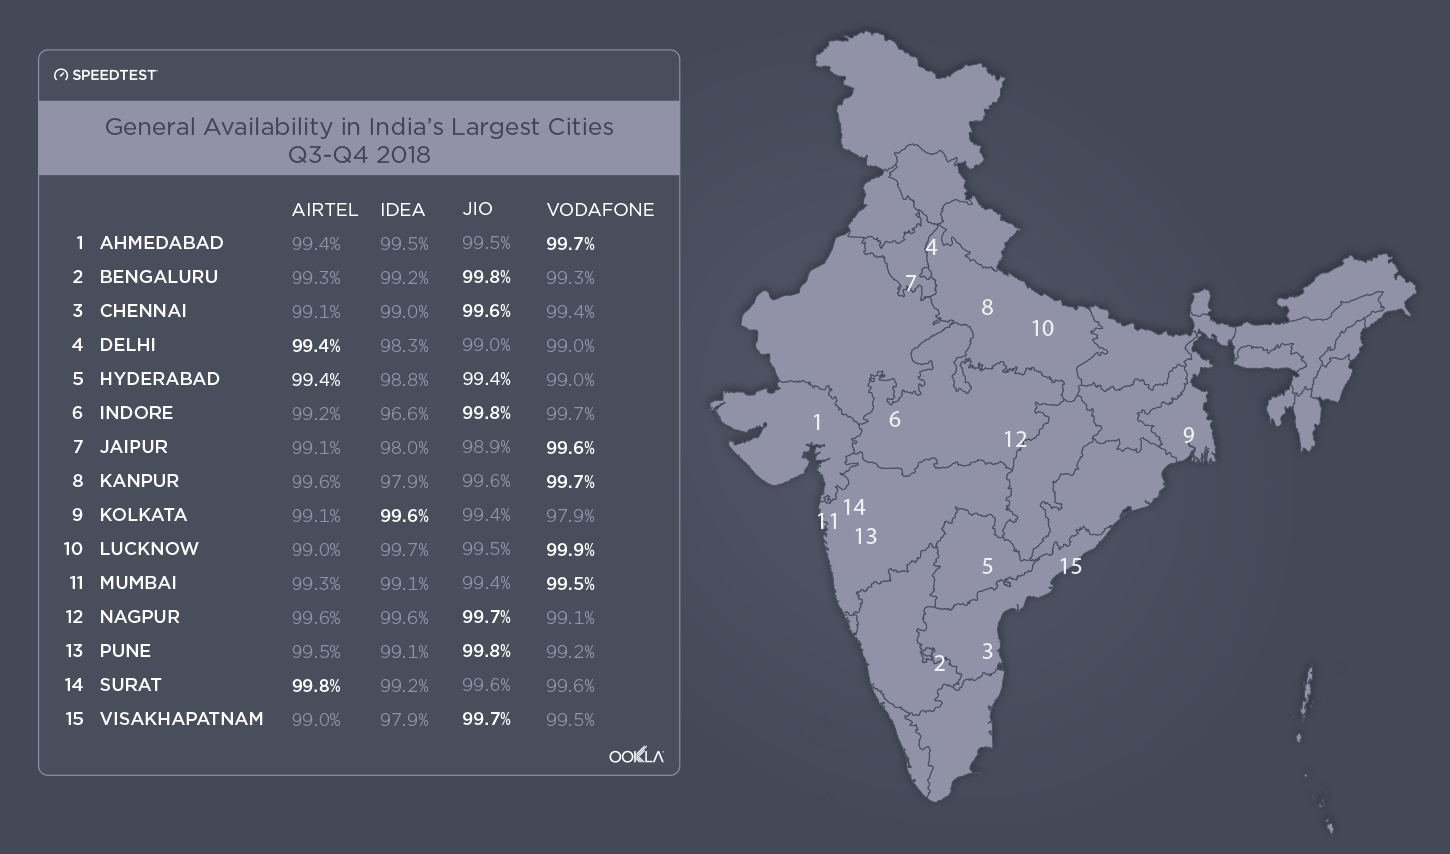
General Availability was good (in the 98-99% range) for India’s largest mobile operators in most of India’s 15 largest cities. Airtel showed General Availability of 99% or higher in all 15. Jio’s lowest score (in Jaipur) was still high at 98.9%. Vodafone’s only score below 99% was in Kolkata (97.9%). Idea, on the other hand, showed General Availability scores below 99% in six cities: Hyderabad (98.8%), Delhi (98.3%), Jaipur (98.0%), Kolkata (97.9%), Visakhapatnam (97.9%) and Indore (96.6%).

While these scores are all good, consistent mobile service is important to quality of life. If a consumer is living in one of the small sections of these cities that are not well served by their mobile operator it could mean they don’t have access to internet at home, school or where they do business.

4G Availability is all over the map

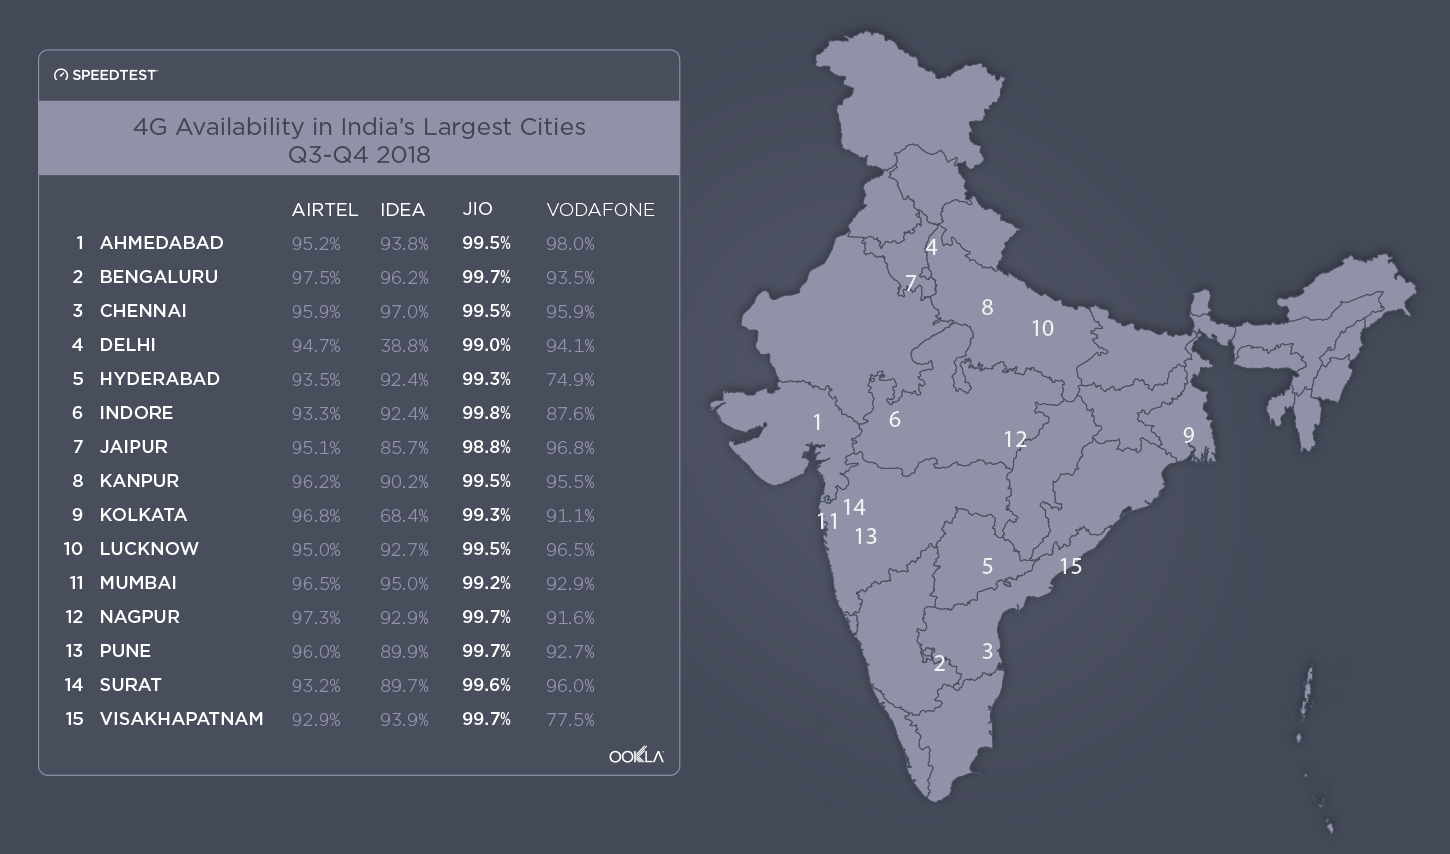
India’s largest mobile operators were not nearly as consistent with their 4G Availability in India’s largest cities during Q3-Q4 2018 as they were with General Availability. The exception was Jio, which still only showed one city (Jaipur) that was barely below 99%. This is no surprise given Jio’s 98.8% country-wide 4G Availability.

india-4g-avail-map-2

Airtel’s 4G Availability ranged from 92.9% in Visakhapatnam to 97.5% in Bengaluru. Vodafone’s 4G Availability ranged from 74.9% in Hyderabad to 98.0% in Ahmedabad, with two cities in the 70-79.9% band and one in the 80-89.9% band. Idea had the widest spread in 4G Availability — from 38.8% in Delhi to 96.2% in Bengaluru. This includes one city in the 60-69.9% band and three in the 80-89.9% band.

Taking a weighted average of the 4G Availability scores based on number of samples, Kanpur showed the best 4G Availability in India during Q3-Q4 2018 at 98.2%. Bengaluru and Lucknow tied for second and third at 97.6%. Delhi was at the bottom of the list with 93.0%, Kolkata second to last at 95.4% and Pune third to last at 95.9%.

The availability of LTE in India’s largest cities contrasts with our analysis of fixed broadband speeds from last year, which found Chennai, Bengaluru and Hyderabad on top. In that analysis, Delhi ranked fifth, Kanpur fourth to last and Lucknow in the middle.

How a combined Vodafone-Idea could change the map

Vodafone and Idea merged in 2018, but the brands continue to operate independently. If that were to change, we’d expect to see better General Availability for all customers as the two brands’ coverage areas are complementary. 4G Availability would also improve, but not immediately to the level of that of Jio or Airtel because many gaps would remain. In the long run, though, combining operations could allow the two brands to reallocate resources and invest in better LTE coverage, particularly in Karnataka.

Interested in learning more about General Availability and 4G Availability? Schedule a demo at  Mobile World Congress or come see us in Hall 2 at Stand 2I25.

Ookla retains ownership of this article including all of the intellectual property rights, data, content graphs and analysis. This article may not be quoted, reproduced, distributed or published for any commercial purpose without prior consent. Members of the press and others using the findings in this article for non-commercial purposes are welcome to publicly share and link to report information with attribution to Ookla.

| February 3, 2019

Super Speeds at Sunday’s Big Game

Most of us ordinary humans just finished watching the Patriots (eventually) trounce the Rams on the biggest TV we could find, but 75,000 lucky individuals saw Gostkowski’s 41-yard field goal and that controversial halftime performance LIVE in Atlanta’s Mercedes-Benz Stadium. And if you’ve been watching social media at all, you know that they were all sharing their experiences online. But were people struggling with stadium Wi-Fi and surrounding cell networks to get those messages out?

Short answer: the internet speeds were far superior to the game play.

The long answer is that providing fast, consistent connectivity for this many people in a small area is hard. A lot of prep went into making sure today’s fans could connect to the internet when and how they wanted to.

Why it’s so hard to provide fast internet to large crowds

Congestion is the main blocker for mobile operators and stadium engineers trying to provide high-quality, fast internet at sporting events.

On cellular, operators generally invest in enough cell towers to provide service to an area on an average day. But when a large crowd tries to use that same infrastructure to connect on a game day, there just isn’t enough network capacity to serve the whole crowd.

As for the Wi-Fi, Jussi Kiviniemi, Senior Vice President at Ekahau explains, “If the Wi-Fi network is designed at the same time as the stadium is built, then the Wi-Fi access points can be placed in optimal locations. This is because one can affect the cabling of the stadium at this time. The challenge comes if the Wi-Fi is designed, or re-designed, after the stadium has been designed and built.” He identifies the biggest internet killer as “the number of people using their mobile devices, combined with the fact that a stadium is an open area. This means a lot of the devices are using the same frequency, thus interfering with one another and reducing one anothers’ performance.” Ekahau was recently acquired by Ookla.

Mobile operators were prepared for the big game

Today’s big game is no ordinary sporting event, though, and operators have been preparing their game plan to give their customers the best service possible since last year. Here’s how:

The stadium Wi-Fi was designed for this traffic

As a newer facility, Mercedes-Benz Stadium was designed with technology in mind including an initial Wi-Fi setup that included 1,800 wireless access points and 80 Gbps of internet bandwidth capacity supported by 4,000 miles of fiber cable.

Kiviniemi described typical stadium Wi-Fi set-up options, saying most stadiums use any one or a combination of the following:

  • Handrail: Wi-Fi access points (APs) mounted on the handrails of the stadium. This requires specially made antennas.
  • Overhead: APs mounted up high in the structures. This requires highly directional antennas to work well.
  • Under seat: This requires specialized casings for the Wi-Fi access points that are mounted under the stadium seats.

Kiviniemi added, “Wi-Fi at a stadium is tough and needs super-careful RF (radio frequency) planning. The biggest stadiums, including the Mercedes-Benz Stadium, are built by the best Wi-Fi engineers in business. The number of client devices connected to Wi-Fi, the openness of the area, the building’s structural shape and limited mounting locations for Wi-Fi access points are some of the main challenges.”

The level of detail that goes into planning stadium Wi-Fi is extraordinary. A couple of years ago, Chuck Lukaszewski of HPE-Aruba suggested that stadiums plan to support one device for every two people and target having 75% of users on a 5 GHz band and 25% on the 2.4 GHz band. We can only assume that stadiums today are planning for more devices and for more of those devices to be on the more modern 5 GHz band. The planning is so detailed that Wi-Fi engineers are considering the percentage of frames transmitted that actually contain data.

If you’re interested in delving in deeper, Ekahau has recommended specs for stadium Wi-Fi set-up as recently as 2018, and will be hosting a new webinar on Wi-Fi in high-capacity spaces on February 12, 2019.

About those game speeds

Cellular speeds for the win

Overall cellular speeds were awesome. Compared to the Peach Bowl, also played at Mercedes-Benz Stadium just over a month ago, average download speed over mobile increased 19.4% to 71.23 Mbps. Considering fans at last year’s big game used more than 7.2 TB of data on AT&T’s network alone, we expected to see a drop in cellular speeds, but all that prep seems to have paid off for mobile operators today. This was 122.5% faster than the average download speed over cellular in the U.S. during December 2018.

We compared the big four mobile operators from kick-off to 30 minutes after the game ended to see who won. Here’s what we saw:

Mobile Operator Performance at the Big Game
Mercedes-Benz Stadium | February 3, 2019
Operator Mean Download (Mbps)
T-Mobile 101.53
Sprint 93.28
Verizon 72.51
AT&T 34.88

T-Mobile was the fastest, followed by Sprint and then Verizon. AT&T came in last.

Verizon was routing most of their customers through their own Wi-Fi network, where we saw an average download speed of 46.42 Mbps.

Mercedes-Benz Stadium Wi-Fi stood strong

Official stats on Wi-Fi internet usage during today’s game have not yet been announced, but in January 2018 fans at Mercedes-Benz Stadium used 12 terabytes of data at the 2018 College Football Playoff championship. The average Speedtest result during that game showed a download speed of 53.95 Mbps. Considering that last year’s big game in Minneapolis used over 16 TB of data and the average Wi-Fi download speed was 20.71 Mbps (in the mid to low range of speeds we’d seen there over the year), we expected Wi-Fi speeds at Mercedes-Benz Stadium to dip under heavy usage. They did not.

Wi-Fi Performance at Mercedes-Benz Stadium
Based on Speedtest results
Game Mean Download (Mbps) Mean Upload (Mbps)
The Big Game – February 3, 2019 30.98 31.35
Peach Bowl – December 29, 2018 30.36 33.28
College Championship – January 8, 2018 53.95 53.04

It’s hard to overestimate the strain an event like this puts on a Wi-Fi network, even more so when a stadium full of fans is waiting for something, anything to happen on the field. While the average download speed during today’s game was just slightly faster than it was at the Peach Bowl, and less than it had been during last year’s college championship, fans turning to the internet for their entertainment would not have been disappointed. Though Wi-Fi provided by Verizon was faster than the stadium Wi-Fi, Verizon’s Wi-Fi likely had to serve far fewer people.

Are you getting the download and upload speeds you need at your favorite sporting event? Take a Speedtest to find out.

Ookla retains ownership of this article including all of the intellectual property rights, data, content graphs and analysis. This article may not be quoted, reproduced, distributed or published for any commercial purpose without prior consent. Members of the press and others using the findings in this article for non-commercial purposes are welcome to publicly share and link to report information with attribution to Ookla.

| January 23, 2019

Canadian ISP Doubles Speeds, Canada Jumps 9 Places in World Ranking

How would you like it if your Internet Service Provider (ISP) decided to double your speeds overnight? On December 3, 2018, Canadian ISP Shaw did just that. And the results were so impactful that Canada jumped nine places in the Speedtest Global Index, from 16th fastest country in the world in November 2018 to 7th in December 2018 as Canada’s average download speed over fixed broadband increased from 91.05 to 108.75 Mbps.

The upgrade also helped Shaw rise from third to second place ISP in Canada based on Speed ScoreTM, a measure that combines download and upload speeds at a variety of performance tiers.

Fastest ISPs in Canada
Based on Speed Score for ISPs with 3% or more of Speedtest results

ISP November 2018 December 2018
Rogers 147.96 146.08
Shaw 82.78 136.71
Bell Canada 100.36 103.33
TELUS 66.59 69.59
Vidéotron 56.44 59.30
Cogeco 51.59 51.30
Teksavvy 29.59 30.97

Shaw’s Speed Score increased 65.1% between November 2018 and December 2018. Bell Canada’s increased 3.0%, TELUS 4.5%, Vidéotron’s 5.1% and Teksavvy’s 4.7%. Rogers’ Speed Score decreased slightly, as did that of Cogeco. All ISPs have improved since our report on Q1-Q2 2018 performance and Rogers remains the fastest provider in Canada.

Only some Canadian cities see the speed boost

The Shaw effect becomes very evident when we compare fixed broadband speeds in Canada’s largest cities. Cities where Shaw is a major player saw large increases in speeds; the rest did not. The exception was Québec City whose speed increase was actually a recovery toward a previous high seen in April 2018.

Change in Fixed Broadband Download Speed (Mbps)
Canada’s Largest Cities

City November 2018 December 2018 Change in Speed Fastest ISP
London, Ontario 130.93 121.18 -7.4% Rogers
Halifax, Nova Scotia 122.88 123.17 0.2% Bell Canada
Toronto, Ontario 117.36 123.14 4.9% Rogers
Ottawa, Ontario 115.36 113.35 -1.7% Rogers
Calgary, Alberta 92.26 143.66 55.7% Shaw
Edmonton, Alberta 91.72 136.06 48.3% Shaw
Vancouver, British Columbia 86.47 121.90 41.0% Shaw
Québec City, Québec 84.78 104.31 23.0% Bell Canada
Winnipeg, Manitoba 75.26 138.20 83.6% Shaw
Montreal, Québec 59.06 65.36 10.7% Bell Canada

In Vancouver, Shaw’s December speed increase was significant enough to unseat Novus, the fastest ISP in that city for the rest of 2018. The fastest ISP remained unchanged in all other cities on the list.

This highlights the radical impact ISPs can have on a country’s overall speed. And it’s not just happening in Canada; Deutsche Telekom expanded 250 Mbps service to an additional 2.3 million customers in Germany. We’ll be watching to see how this and improvements by other ISPs impact country-level speeds across the world.

Ookla retains ownership of this article including all of the intellectual property rights, data, content graphs and analysis. This article may not be quoted, reproduced, distributed or published for any commercial purpose without prior consent. Members of the press and others using the findings in this article for non-commercial purposes are welcome to publicly share and link to report information with attribution to Ookla.

| December 10, 2018

The World’s Internet in 2018: Faster, Modernizing and Always On

When it comes to the internet, the news is mostly good for 2018. Download and upload speeds are increasing across the globe on both mobile and fixed broadband. 5G is on the horizon and gigabit service is expanding.

We looked at data from Speedtest IntelligenceTM, Ookla’s flagship data platform, from December 2017 through November 2018, to analyze everything from global internet speeds to the world’s fastest countries to when people are online. We also investigated which parts of the world are seeing the most benefit from high speed LTE on mobile and gigabit speeds on fixed broadband.

Mobile speeds increased more than 15% in 2018

Graphic-Tables-Final-v2_mobile-average-speed-3

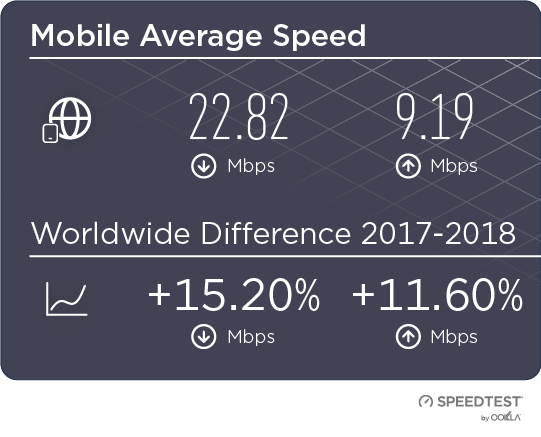
The world’s average mobile download speed of 22.82 Mbps increased 15.2% over the past year, while mobile upload speed increased 11.6% to reach 9.19 Mbps.

Graphic-Tables-Final-v2_android-vs-ios-1

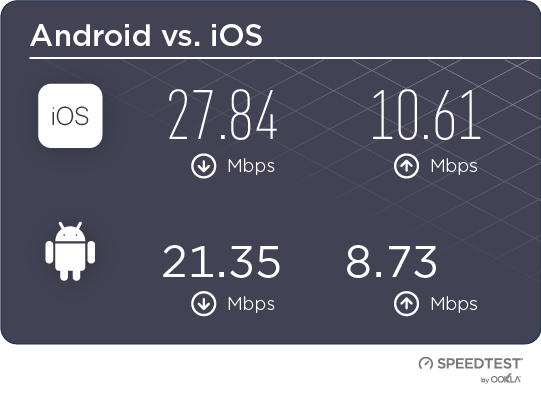
With a mean download speed of 27.84 Mbps and a mean upload of 10.61 Mbps, worldwide speeds on iOS devices were faster than those on Android (21.35 Mbps download, 8.73 Mbps upload) in 2018. This is likely due to market factors as Android devices are more popular in emerging markets where internet speeds tend to be slower.

However, download speed on Android devices increased 19.0% and upload speed increased 15.1%, more than those on iOS (18.0% increase for download and 11.1% increase for upload), which is good news for those emerging markets.

Fixed broadband speeds increased more than 26% in 2018

Graphic-Tables-Final-v2_fixed-average

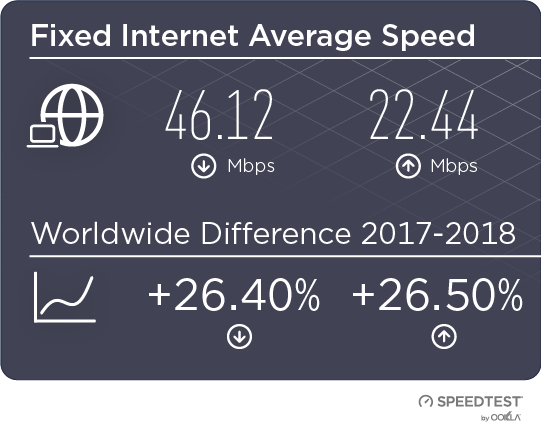
On a global level, fixed broadband speeds were nearly twice as fast as those on mobile in 2018. The world’s average download speed on fixed broadband was 46.12 Mbps, 26.4% faster than last year. Upload speed increased 26.5% to 22.44 Mbps.

All said, though, both mobile and fixed broadband speeds increased at a slower rate in 2018 than they did in 2017.

Countries with the fastest internet in 2018

Graphic-Tables-Final-v2_top-5-mobile

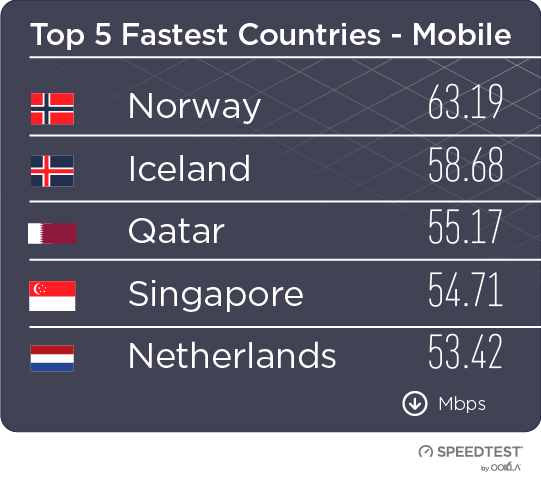
The countries with the fastest mean download speeds over mobile in the past 12 months were: Norway (63.19 Mbps), Iceland (58.68 Mbps), Qatar (55.17 Mbps), Singapore (54.71 Mbps) and the Netherlands (53.42 Mbps).

Graphic-Tables-Final-v2_top-5-fixed

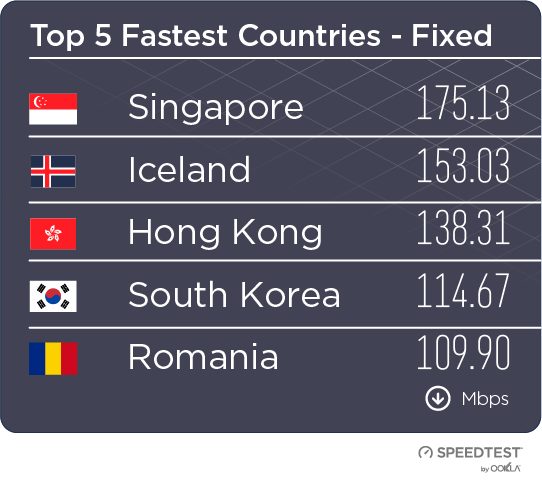
Singapore showed the world’s fastest mean download speeds over fixed broadband during the past twelve months at 175.13 Mbps. Next fastest were Iceland (153.03 Mbps), Hong Kong (138.31 Mbps), South Korea (114.67 Mbps) and Romania (109.90 Mbps).

To keep up with month-to-month internet speeds at a global level, visit the Speedtest Global Index.

Most improved countries for 2018 internet speeds

Graphic-Tables-Final-v2_most-improved-mobile

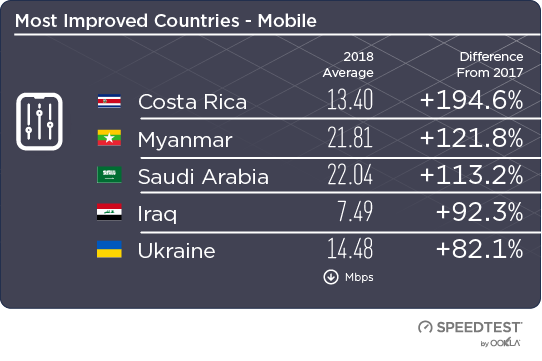
Costa Rica saw the largest increase in mobile download speed over the past year at 194.6%. Myanmar was second with 121.8%, Saudi Arabia third (113.2%), Iraq fourth (92.3%) and the Ukraine fifth (82.1%).

The countries with the largest improvements in upload speeds were Bangladesh (179.2%), the Ukraine (172.5%), Costa Rica (163.4%), Myanmar (146.9%) and Iraq (126.7%).

Graphic-Tables-Final-v2_most-improved-fixed

Paraguay saw the biggest increase in mean download speed over fixed broadband in the world over the past year at 268.6%. Guyana was second with 113.5%, Libya third (108.0%), Malaysia fourth (89.5%) and Laos fifth (76.2%).

Libya showed the most improvement in mean upload speed over fixed broadband during the past twelve months at 176.4%. Guyana was second with 116.1%, Malaysia third (95.2%), Belize fourth (88.9%) and Iraq fifth (76.8%).

4G is increasing mobile speeds

2017-2018-LTE-growth

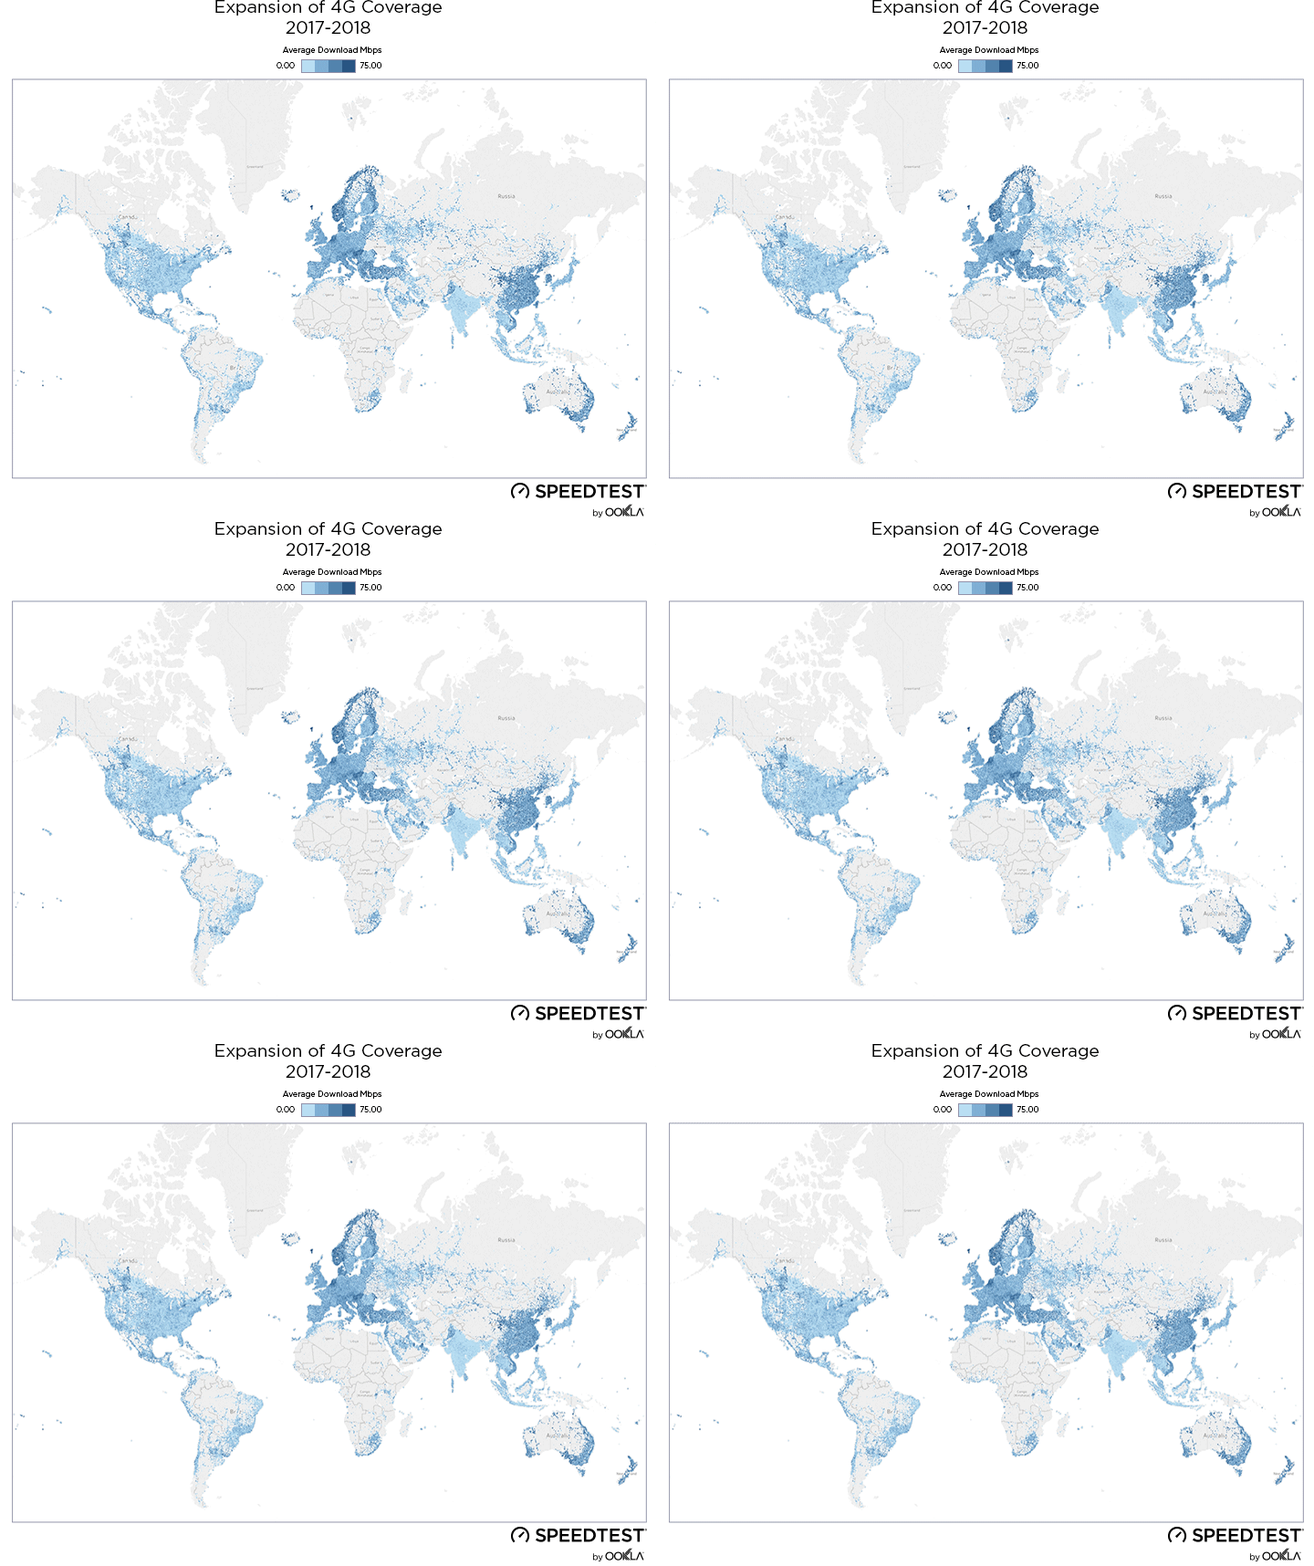
When we looked specifically at Speedtest results on 4G, we saw that mean download speeds increased in most countries. Costa Rica was most improved for 4G download speed as was the case with overall download speed on mobile increasing 184.3% year over year. Saudi Arabia was second at 110.2% and Myanmar third at 78.0%.

Most encouragingly, we saw the number of Speedtest results over 4G increase in all but 15 countries. This could indicate that 4G availability is expanding. Tanzania saw the greatest increase with 355.0% more tests over 4G in 2018 than in 2017. Malta was second at 267.2% and Algeria third at 143.7%. We can see this expansion on the map above as 4G results fill in areas of the globe that were previously blank.

Gigabit coverage is expanding globally

gigabit-fade-1

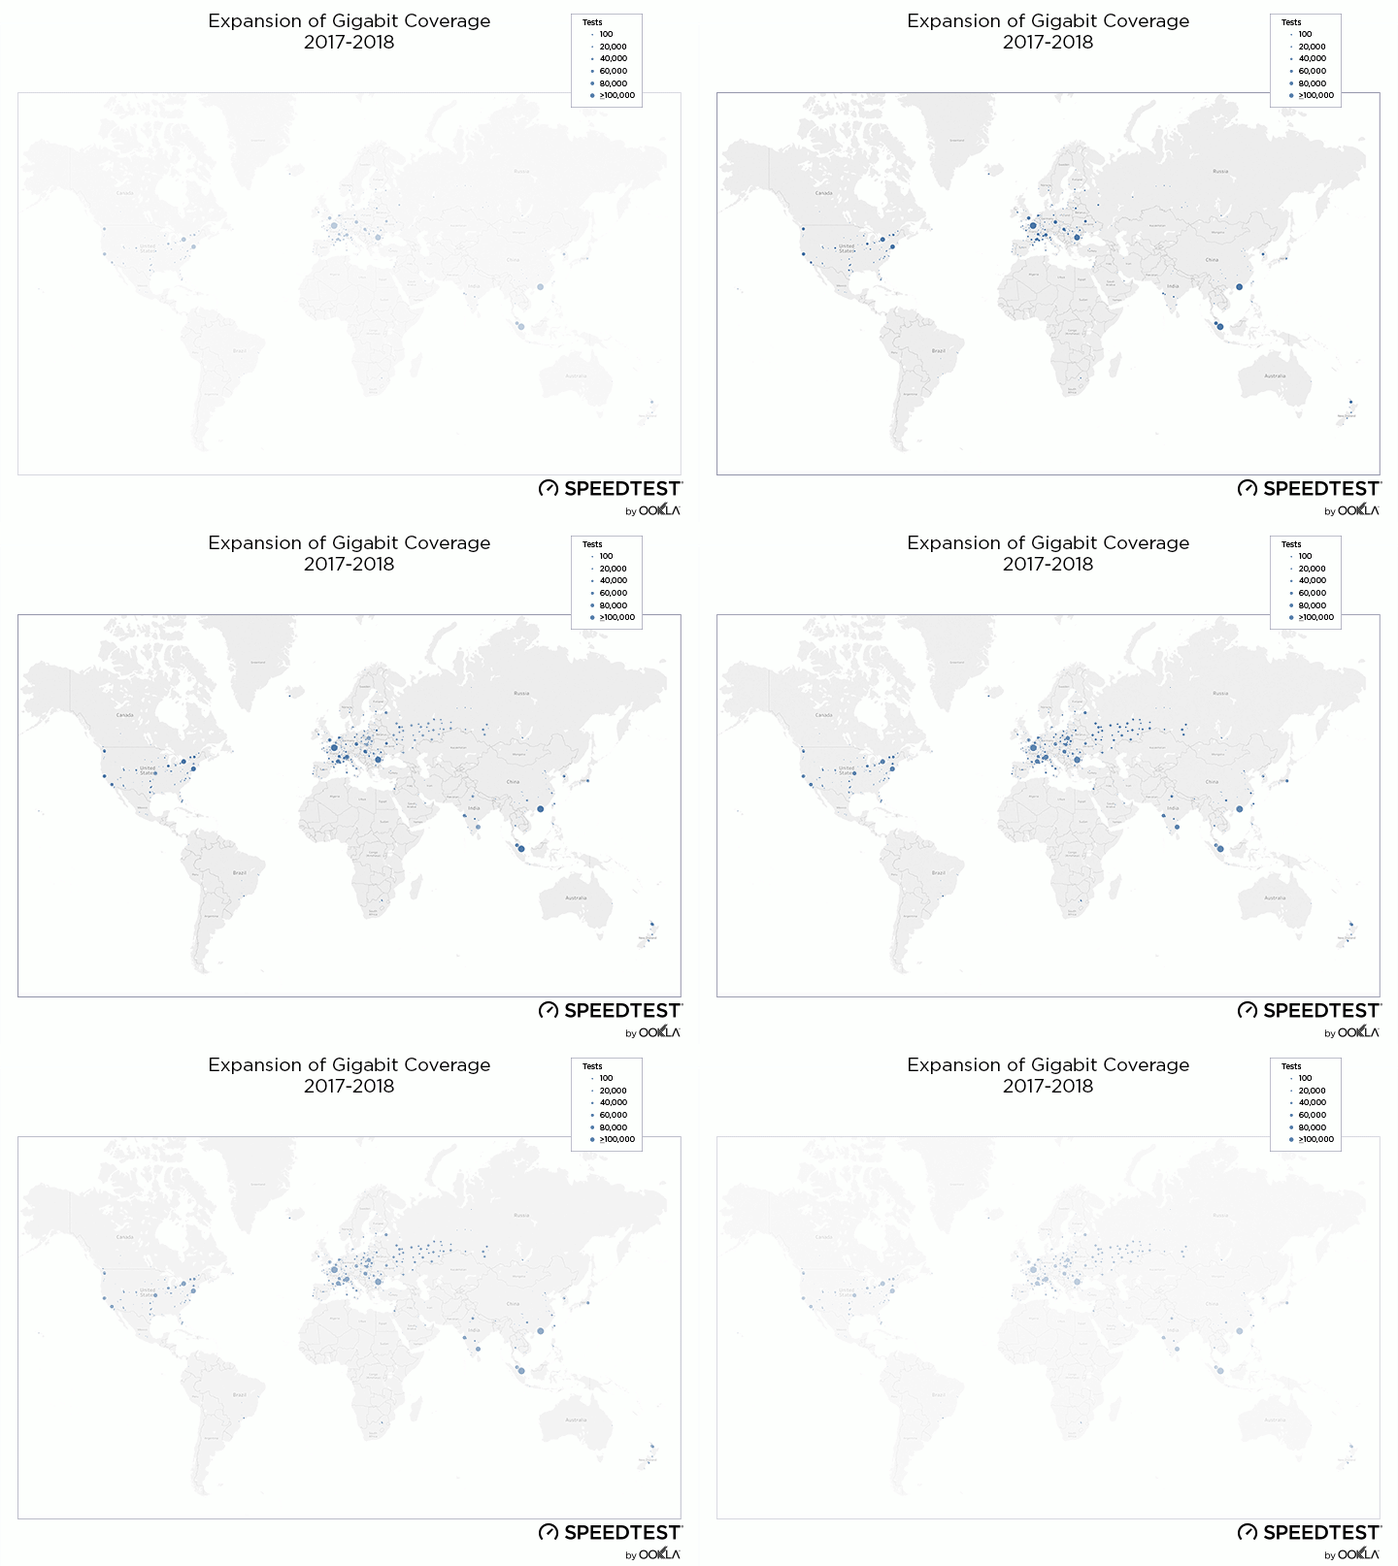
Gigabit is in the news as ISPs across the globe expand their high-speed networks. We looked at Speedtest results on fixed broadband in excess of 750 Mbps to see which cities are benefitting most. Comparing locations with 100 or more gigabit-speed results in 2017 with those in 2018, that expansion becomes obvious. In 2017, 60 countries met our gigabit test threshold. In 2018, 16 additional countries joined our gigabit list. We’re also seeing that more cities around the world now have access to gigabit speeds.

Also exciting is that cities which already had gigabit in 2017 saw increases in the number of gigabit-speed results in 2018 as ISPs continue to build out infrastructure across cities. Many cities saw their first real gigabit expansion in 2018. For example, we saw the number of gigabit tests in New Delhi increase from 119 gigabit speed results in 2017 to 20,239 in 2018, that’s a mind-boggling 16,908% increase. Chennai, India saw a 7,481% increase (from 763 to 57,840) and Cormeilles-en-Parisis, France jumped 6,480%. Huge leaps in the number of gigabit-speed results were also seen in Gdańsk, Poland (6,338%); Rome, Italy (4,909%); Lancashire, United Kingdom (3,962%); Ota, Japan (3,240%); São Paulo, Brazil (2,947%); Hangzhou, China (2,669%) and Turda, Romania (2,636%).

When people are online

point-3-sec-final-1

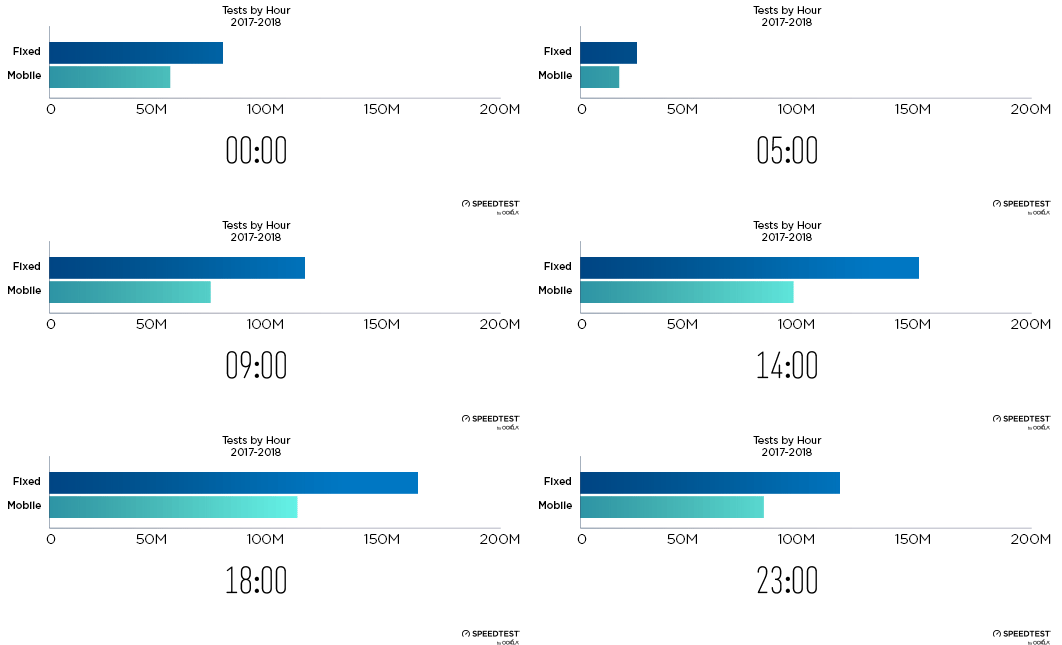
The internet is always on, but we were surprised to see how consistently and steeply usage fell off on both mobile and fixed broadband after 9 pm local time. Normalizing the time of day for Speedtest results from around the globe, we found that usage bottoms out at 4 am and then climbs steeply again until 10 am. From there, the internet gets gradually busier until that night time drop off.

Internet in the world’s largest countries

The world’s five most populous countries are notably absent from the lists of fastest and most improved countries on mobile and fixed broadband. China, India, the U.S., Indonesia and Brazil represent about 46% of the world’s population, which makes their internet speeds worth noting nonetheless.

Internet Speeds in the World’s Largest Countries
Speedtest Data | December 2017-November 2018
Country Mean Mobile Download Speed (Mbps) % Improvement in Mobile Speed Mean Fixed Download Speed (Mbps) % Improvement in Fixed Speed
China 30.96 -5.8% 76.03 42.5%
India 9.11 15.2% 23.00 50.4%
United States 28.50 22.3% 92.77 37.3%
Indonesia 10.39 5.3% 14.89 18.3%
Brazil 18.65 29.3% 22.95 39.4%

Mobile internet speeds in the world’s largest countries

China had the fastest average mobile download speed among the world’s most populous countries in the past twelve months. However, China’s mobile download speed decreased during that time. The United States is fast catching up with China on mobile download speed.

Brazil occupied a middle ground for mobile download speed among the world’s most populous countries and showed the fastest rate of increase. India and Indonesia were at the bottom of this list. While the two nations show similar mobile download speeds to each other, India’s mobile download speed is improving much more quickly than Indonesia’s.

Fixed broadband speeds in the largest countries in the world

The United States showed the fastest fixed broadband download speed among the world’s most populous countries over the past year. China was second, India and Brazil nearly tie for third and Indonesia follows.

India showed the largest improvement in mean download speed over fixed broadband of the world’s five largest countries. China was second, Brazil third, the U.S. fourth and Indonesia fifth.

We’ll be back throughout 2019 to report on the state of the world’s internet as it evolves. Until then, take a Speedtest to find out how your network compares.

Ookla retains ownership of this article including all of the intellectual property rights, data, content graphs and analysis. This article may not be quoted, reproduced, distributed or published for any commercial purpose without prior consent. Members of the press and others using the findings in this article for non-commercial purposes are welcome to publicly share and link to report information with attribution to Ookla.

| December 5, 2018

Best Metros for Remote Workers: Where Fast Internet Meets Affordable Homes

“Work from anywhere with an internet connection” is a common refrain in today’s growing tech economy. If you want both a fast internet connection and an affordable home, use this list to discover the location of your new remote “office.”

Looking at Speedtest data from the 100 largest Metropolitan Statistical Areas (MSAs) in the U.S. during September 2018, we ranked each by their Speed Score over fixed broadband. Speed Score is a weighted measure of mean download and upload speeds that also considers performance at the lowest and highest tiers.

We then partnered with Zillow to compare our rankings to their data on median home value. Cities that ranked comparatively high for Speed Score and low for median home value made our list. The results present some interesting opportunities for digital nomads looking for a new home base.

Map-Legend-Speed-Score-3

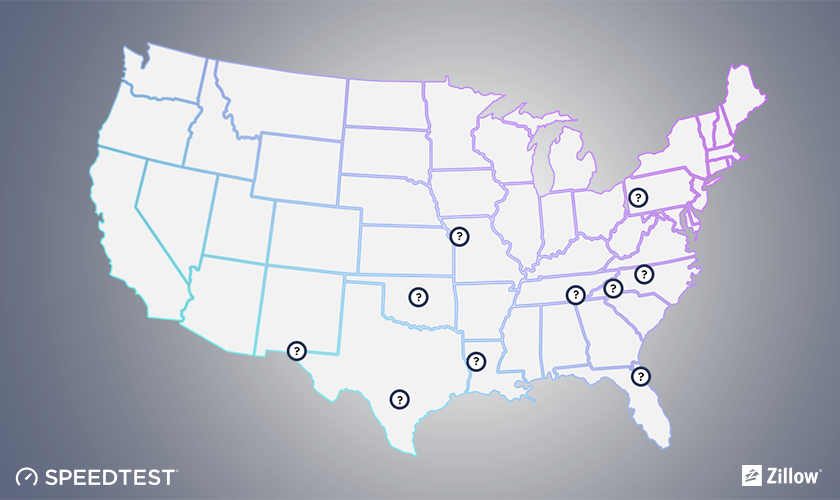
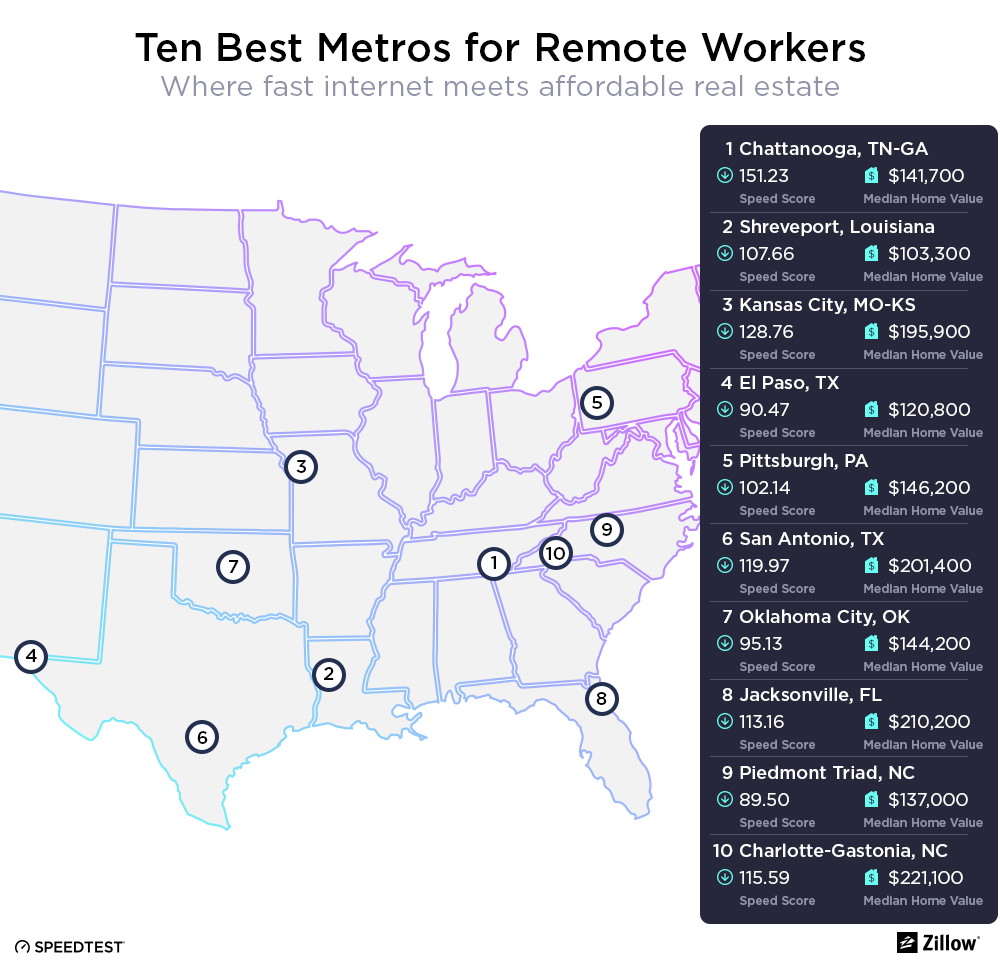
Chattanooga takes the number one spot with a blend of fast internet speeds and affordable housing stock that make working from home (WFH) easy and appealing. Shreveport is number two and Kansas City places third. Five of the top ten metros were located in the Southeast and three in the Southwest. The western U.S. was notably absent from the top ten.

More affordable and fast cities if you plan to work from home

If you didn’t find your new best life on the map above, here is the full list of 25 places remote workers should consider. Each has the fast internet speeds that will keep you connected and the affordable home values that could help you reimagine your budget.

25 Best Cities for Remote Workers
Where fast internet meets affordable real estate

Based on September 2018 data from Speedtest and Zillow

WFH Rank MSA Name Speed Score Gigabit? Median Home Value
1 Chattanooga, TN-GA 151.23 Y $141,700
2 Shreveport, LA 107.66 N $103,300
3 Kansas City, MO-KS 128.76 Y $195,900
4 El Paso, TX 90.47 N $120,800
5 Pittsburgh, PA 102.14 Y $146,200
6 San Antonio, TX 119.97 Y $201,400
7 Oklahoma City, OK 95.13 Y $144,200
8 Jacksonville, FL 113.16 Y $210,200
9 Piedmont Triad, NC 89.50 Y $137,000
10 Charlotte-Gastonia, NC 115.59 Y $221,100
11 York, PA 103.04 Y $180,100
12 Wilmington, DE-NJ-MD 110.73 Y $219,800
13 Harrisburg, PA 100.22 Y $172,300
14 Raleigh-Durham, NC 128.91 Y $263,400
15 Houston, TX 104.94 Y $206,900
16 Syracuse, NY 82.75 N $128,800
17 Philadelphia, PA 110.86 Y $238,400
18 Baton Rouge, LA 90.86 Y $162,400
19 Davenport-Rock Island-Moline, IA/IL 83.85 Y $129,800
20 Wichita, KS 87.14 Y $143,600
21 Youngstown-Warren, OH 72.48 N $89,900
22 Louisville, KY-IN 91.04 Y $170,400
23 Richmond, VA 110.72 Y $235,900
24 Atlanta, GA 104.45 Y $216,700
25 Baltimore, MD 111.66 Y $260,500

The Southeast picks up another seven metros when looking at the full list of the 25 best metros for remote workers with a grand total of 12. North Carolina is home to three. As the Louisville, KY MSA straddles a regional border, we counted it in both the Southeast and the Midwest.

The Midwest and the Northeast are each home to five metros that made our list of best places to WFH. While the metros in the Midwest are spread widely, there’s a tight concentration of contenders in southeastern Pennsylvania. Pair those with Baltimore, MD and Wilmington, DE and you have a nice cluster of places to work from home that are a mere train ride away from one of a certain mega retailer’s new headquarters.

Four metros on our list of 25 best metros for remote workers are in the Southwest, three of which are in Texas. Sadly, the western U.S. loses out completely. Though left coast tech hubs like Silicon Valley and Seattle have access to internet speeds that make developers drool, high median home prices keep them out of the running. Instead, these digital strongholds are fast becoming the kinds of places that remote workers flee in the great rush toward more livable second cities.

Nine of the metros on our list are located in the rust belt. Could an economic resurgence be in the cards in these former manufacturing powerhouses? Maybe. What is certain is that these metros all contain two important ingredients to attract the kinds of people who innovate, create and build.

Do they have gigabit?

We all love fast internet, but not all metros have the infrastructure in place to offer gigabit speeds. If you need (or want) these super-fast speeds for work (or play), the “Gigabit?” column shows a “Y” for all metros where we saw at least 100 samples where download speeds exceeded 750 Mbps. Only four of the metros on our list failed to meet that threshold.

Of course access to gigabit is not always uniform across cities, so check with local internet service providers (ISPs) to verify these speeds are available at your new address.

Seeking out your own remote work haven? Zillow can help you find just the right place for your new home office. Just make sure you ask the seller to take a Speedtest before closing escrow.

Ookla retains ownership of this article including all of the intellectual property rights, data, content graphs and analysis. This article may not be quoted, reproduced, distributed or published for any commercial purpose without prior consent. Members of the press and others using the findings in this article for non-commercial purposes are welcome to publicly share and link to report information with attribution to Ookla.

| November 19, 2018

Uncovering Which Latin American Countries have Adequate Internet Speeds (and Which Do Not)

Leer en español | Leia em Português

Latin America is a booming market for internet. Between a rapid increase in broadband subscribers and some of the most engaged mobile internet users, Latin Americans are smartphone savvy and looking for first world connection speeds. Trouble is, some markets don’t have access to the kind of fast mobile and broadband speeds that encourage economies to grow.

We analyzed Speedtest data on mobile and fixed broadband speeds from across Latin America during Q2-Q3 2018. The list includes sovereign countries and other generally recognized territories, except for Saint Barthélemy which did not show a significant test volume. We’ve broken down each set of results by the speeds typically needed for various activities:
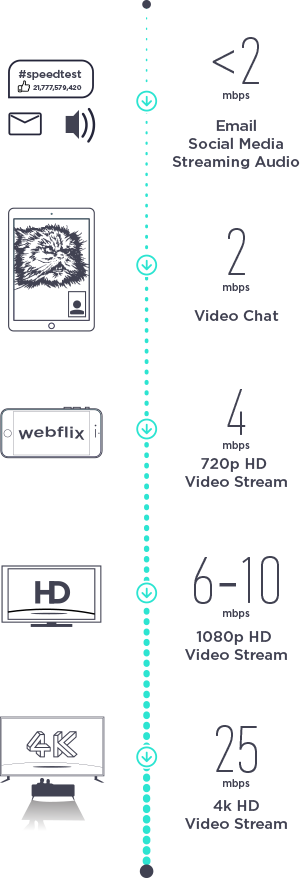

The results revealed deep divides in which countries are getting the speeds they need to easily connect to the world at large, those that have adequate connections and those that are struggling to connect.

Which country has the fastest mobile speeds in Latin America?

According to the GSMA, “Smartphones have been instrumental in establishing Latin America as one of the world’s largest consumers of social media, with the vast majority of usage occurring over mobile networks.” So who’s able to use those smartphones to their full capability and who’s better off using broadband?

4K Video Streamers

Our first group is made up of countries that should have the mean mobile download speeds to navigate even the most data-intensive mobile experiences. Martinique leads, ranking first in Latin America with a mean download speed over mobile that’s faster even than France. Guadeloupe is a close second.

Latin American Countries with Mobile Speeds > 25 Mbps
Speedtest Data | Q2-Q3 2018
Country Mean Download (Mbps) Mean Upload (Mbps)
Martinique 35.27 9.64
Guadeloupe 32.85 8.35

HD Streamers

The next group contains countries where residents should have the mobile speeds they need for HD streaming (at 1080p), video chat and social media. Uruguay tops this list to rank third in Latin America for mobile download speed. Saint Martin, Mexico, French Guiana, Ecuador, Peru and Honduras all show mobile download speeds faster than 20 Mbps.

Latin American Countries with Mobile Speeds 6-25 Mbps
Speedtest Data | Q2-Q3 2018
Country Mean Download (Mbps) Mean Upload (Mbps)
Uruguay 23.10 11.39
Saint Martin 22.65 8.00
Mexico 22.05 11.78
French Guiana 21.40 6.84
Ecuador 21.37 8.21
Peru 20.83 12.86
Honduras 20.36 10.33
Nicaragua 19.68 8.36
Brazil 18.50 7.52
Bolivia 17.33 11.03
Chile 16.32 9.07
Colombia 16.11 8.85
Argentina 15.40 7.77
Dominican Republic 14.90 8.28
Guatemala 14.89 9.48
Costa Rica 14.59 6.56
Puerto Rico 14.36 8.41
Paraguay 12.67 7.61
Panama 12.30 8.54
Haiti 9.33 3.41
El Salvador 8.83 4.17
Venezuela 7.74 4.33

Nicaragua, Brazil, Bolivia, Chile, Colombia, Argentina, the Dominican Republic, Guatemala, Costa Rica, Puerto Rico, Paraguay and Panama all show average mobile download speeds that are faster than the 6-10 Mbps recommended for HD video streaming on 1080p. This is important as growing segments of this region consume media primarily over mobile connections.

Learn more about Brazil’s mobile market in our Brazil Market Snapshot.

Video Chat and Email

The mobile speeds picture is not so good in Cuba where mobile speeds are slow enough that residents might struggle to use smartphones for more than one-to-one video chats and emails.

Latin American Countries with Mobile Speeds < 6 Mbps
Speedtest Data | Q2-Q3 2018
Country Mean Download (Mbps) Mean Upload (Mbps)
Cuba 5.34 1.92

Looking at the countries with the slowest speeds in Latin America, we can see they have all faced significant structural challenges including war, poverty and natural disaster. They are also countries that clearly need significant mobile investment.

While mobile infrastructure might not be the first thing these slowest countries choose to invest in, improving speeds in these areas could also significantly boost their economies by creating an environment that’s ripe for new startups and investment.

Fixed broadband

The speeds needed to complete internet tasks are similar on fixed broadband to what they are on mobile. What’s not the same is the list of countries in the 4K Video Streamers category.

4K Video Streamers

Chile jumps to the top when considering mean download speeds over fixed broadband in Latin America. Uruguay is second, Puerto Rico third, Panama fourth, Martinique fifth and Paraguay sixth. All of these Latin American countries have fast enough fixed broadband speeds to allow residents to easily do anything they’d like online.

Latin American Countries with Fixed Broadband Speeds > 25 Mbps
Speedtest Data | Q2-Q3 2018
Country Mean Download (Mbps) Mean Upload (Mbps) % Difference in Download Mobile Over Fixed
Chile 47.40 9.28 -190.44%
Uruguay 35.97 9.38 -55.71%
Puerto Rico 35.39 7.85 -146.45%
Panama 34.94 7.21 -184.07%
Martinique 29.71 11.39 15.76%
Paraguay 27.84 8.00 -119.73%

In almost all of these countries our analysis shows that fixed broadband download speeds are significantly faster than those on mobile. The exception is Martinique, which has faster mobile downloads than those on fixed broadband.

HD Streamers

The next group contains countries whose fixed broadband download speeds are good enough for video chat but where heavier uses like online gaming and streaming might not be as enjoyable. Brazil tops this list, ranking 7th in Latin America for download speed over fixed broadband. Brazil is followed by Guadeloupe, French Guiana, Peru, Mexico, Argentina, the Dominican Republic, Colombia, Ecuador, Costa Rica, Saint Martin, El Salvador, Haiti, Guatemala, Honduras, Bolivia and Nicaragua.

Latin American Countries with Fixed Broadband Speeds 6-25 Mbps
Speedtest Data | Q2-Q3 2018
Country Mean Download (Mbps) Mean Upload (Mbps) % Difference in Download Mobile Over Fixed
Brazil 23.64 10.57 -27.78%
Guadeloupe 23.31 9.34 29.04%
French Guiana 22.58 11.45 -5.51%
Peru 22.43 4.90 -7.68%
Mexico 22.37 8.53 -1.45%
Argentina 19.68 4.24 -27.79%
Dominican Republic 14.16 3.83 4.97%
Colombia 13.79 5.86 14.40%
Ecuador 13.08 9.69 38.79%
Costa Rica 11.39 3.61 21.93%
Saint Martin 9.13 5.54 59.69%
El Salvador 8.38 3.14 5.10%
Haiti 8.33 6.42 10.72%
Guatemala 7.94 3.78 46.68%
Honduras 7.32 4.36 64.05%
Bolivia 6.96 3.13 59.84%
Nicaragua 6.62 3.39 66.36%

With the exception of Guadeloupe, the six fastest countries in this group all have faster fixed broadband speeds than those on mobile. From the Dominican Republic on down the list, the rest of the countries in this group have faster mobile download speeds than those on fixed broadband.

Video Chat and Email

Venezuela joins Cuba on this list of countries in Latin America with fixed broadband download speeds slower than 6 Mbps. Though both countries have faster mobile download speeds than they do on fixed broadband. Which is good, because residents might need to resort to their phones to do more than simple video chats or email.

Latin American Countries with Fixed Broadband Speeds < 6 Mbps
Speedtest Data | Q2-Q3 2018
Country Mean Download (Mbps) Mean Upload (Mbps) % Difference in Download Mobile Over Fixed
Venezuela 3.96 1.50 48.84%
Cuba 3.73 4.07 30.15%

As we saw with mobile internet, there are many countries in Latin America that could use a solid investment in fixed broadband speeds. That is, unless providers are ready for mobile to be the primary vehicle consumers use to access the internet.

Mobile and broadband internet performance at a city level

Fort-de-France, Martinique ranks a strong first for mobile speed among the largest cities in Latin America, Marigot, Saint Martin second and Basse-Terre, Guadeloupe third. On the other end of the mobile spectrum, Havana ranks last followed by San Salvador, El Salvador and Caracas, Venezuela.

Internet Performance in Latin American Cities
Speedtest Data | Q2-Q3 2018
City Mobile Download (Mbps) Mobile Upload (Mbps) Fixed Download (Mbps) Fixed Upload (Mbps) % Difference in Download Mobile Over Fixed
Asunción, Paraguay 14.58 8.57 43.49 8.86 -198.29%
Basse-Terre, Guadeloupe 27.73 8.61 21.20 8.15 23.55%
Belo Horizonte, Brazil 19.00 7.86 28.38 6.62 -49.37%
Bogotá, Colombia 15.89 9.48 16.46 7.16 -3.59%
Brasília, Brazil 22.20 9.29 29.27 7.79 -31.85%
Buenos Aires, Argentina 16.40 8.53 27.56 5.31 -68.05%
Cali, Colombia 22.35 12.11 13.10 5.16 41.39%
Caracas, Venezuela 8.83 5.13 5.10 2.04 42.24%
Cayenne, French Guiana 22.66 7.86 25.32 14.67 -11.74%
Curitiba, Brazil 22.60 8.31 32.58 17.65 -44.16%
Ecatepec de Morelos, Mexico 16.67 10.35 19.89 3.98 -19.32%
Fort-de-France, Martinique 36.00 10.34 43.60 21.47 -21.11%
Fortaleza, Brazil 18.85 8.63 26.20 10.33 -38.99%
Guatemala City, Guatemala 16.09 10.33 9.60 5.10 40.34%
Guayaquil, Ecuador 23.61 9.43 14.44 9.42 38.84%
Havana, Cuba 4.47 1.26 2.99 3.10 33.11%
La Paz, Bolivia 16.92 11.81 7.16 3.20 57.68%
Lima, Peru 22.23 14.89 27.52 6.66 -23.80%
Managua, Nicaragua 21.04 8.89 6.87 3.52 67.35%
Manaus, Brazil 14.83 7.16 20.92 4.10 -41.07%
Marigot, Saint Martin 28.97 9.23 9.62 5.45 66.79%
Medellín, Colombia 17.58 9.17 14.76 6.87 16.04%
Mexico City, Mexico 21.41 11.22 29.81 12.41 -39.23%
Montevideo, Uruguay 23.30 11.65 38.39 10.12 -64.76%
Panama City, Panama 12.18 8.82 37.02 7.88 -203.94%
Port-au-Prince, Haiti 10.08 3.71 8.94 6.63 11.31%
Quito, Ecuador 21.01 7.75 15.54 11.59 26.04%
Rio de Janeiro, Brazil 22.02 9.02 28.62 10.36 -29.97%
Salvador, Brazil 17.85 7.44 20.43 6.09 -14.45%
San José, Costa Rica 14.69 6.92 12.39 4.74 15.66%
San Juan, Puerto Rico 16.05 9.76 50.13 15.64 -212.34%
San Salvador, El Salvador 8.65 4.23 10.26 3.88 -18.61%
Santiago, Chile 16.05 9.35 42.69 12.37 -165.98%
Santo Domingo, Dominican Republic 15.15 8.87 17.86 4.47 -17.89%
São Paulo, Brazil 20.74 8.41 36.54 17.45 -76.18%
Sucre, Bolivia 14.81 11.18 4.86 3.24 67.18%
Tegucigalpa, Honduras 26.24 13.61 7.39 2.91 71.84%

Denser and more urban locations are easier and more cost-effective places to deploy improvements to mobile infrastructure, so if speeds are slow in these areas, it’s a good sign that speeds are much worse elsewhere in the country.

On the fixed broadband side, San Juan, Puerto Rico ranks first in Latin America, followed by Fort-de-France, Martinique and Asunción, Paraguay. The city with the slowest fixed broadband download speed of those we analyzed is Havana, Cuba followed by Sucre, Bolivia and Caracas Venezuela.

Now that you know whether your country or city is rated for 4K video streaming, HD video streaming or just video chat and email, it’s time to find out if your speeds are above or below average. Take a Speedtest on Android, iOS or the web and tweet to us at @speedtest to share your experience.


Revelamos qué países de América Latina tienen velocidades de Internet adecuadas (y cuáles no)

América Latina es un mercado en expansión para Internet. Entre el rápido aumento de los suscriptores a la banda ancha y algunos de los usuarios de Internet móvil más activos, podemos decir que los latinoamericanos son conocedores de los teléfonos inteligentes y pretenden alcanzar las velocidades de conexión del primer mundo. El problema es que algunos mercados no tienen acceso a los tipos de velocidades de banda ancha y móvil rápidas que impulsan el crecimiento de las economías.

Analizamos los datos de Speedtest sobre velocidades de banda ancha móvil y fija de toda América Latina durante el segundo y tercer trimestres de 2018. La lista incluye países soberanos y otros territorios generalmente reconocidos, con la excepción de San Bartolomé, que no presentó un volumen de prueba significativo. Desglosamos cada conjunto de resultados por las velocidades que, en general, se necesitan para diversas actividades:

Los resultados revelaron grandes diferencias en los países que obtienen las velocidades que necesitan para conectarse de manera sencilla con el resto del mundo, los que tienen conexiones adecuadas y los que tienen dificultades de conexión.

¿Cuál es el país de América Latina que tiene las velocidades móviles más rápidas?

De acuerdo con la Asociación GSM, los “teléfonos inteligentes han sido fundamentales para que América Latina se convirtiera en uno de los más grandes consumidores de redes sociales del mundo, ya que la mayor parte de ese consumo se produce en redes móviles”. Por lo tanto, ¿quién puede aprovechar al máximo los teléfonos inteligentes y a quién le conviene usar la banda ancha?

Transmisores de video en 4K

Nuestro primer grupo está compuesto por países que deberían tener las velocidades medias de descarga móvil necesarias para admitir las experiencias móviles con el uso más intensivo de datos. Martinica lidera el grupo ocupando el primer lugar de América Latina con una velocidad media de descarga móvil más rápida que incluso la de Francia. Guadalupe ocupa el segundo lugar.

Países de América Latina con velocidades móviles superiores a 25 Mbps
Datos de Speedtest | T2-T3 2018
País Enlace descendente móvil (Mbps) Enlace ascendente móvil (Mbps)
Martinica 35,27 9,64
Guadeloupe 32,85 8,35

Transmisores en HD

El siguiente grupo incluye países en que los residentes deberían tener las velocidades móviles que necesitan para transmisión en HD (a 1080p), videollamada y redes sociales. Uruguay encabeza esta lista ocupando el tercer puesto de América Latina en cuanto a velocidad de descarga móvil. San Martín, México, Guayana Francesa, Ecuador, Perú y Honduras presentan velocidades de descarga móvil superiores a 20 Mbps.

Países de América Latina con velocidades móviles de 6 a 25 Mbps
Datos de Speedtest | T2-T3 2018
País Enlace descendente móvil (Mbps) Enlace ascendente móvil (Mbps)
Uruguay 23,10 11,39
San Martín 22,65 8,00
México 22,05 11,78
Guayana Francesa 21,40 6,84
Ecuador 21,37 8,21
Perú 20,83 12,86
Honduras 20,36 10,33
Nicaragua 19,68 8,36
Brasil 18,50 7,52
Bolivia 17,33 11,03
Chile 16,32 9,07
Colombia 16,11 8,85
Argentina 15,40 7,77
República Dominicana 14,90 8,28
Guatemala 14,89 9,48
Costa Rica 14,59 6,56
Puerto Rico 14,36 8,41
Paraguay 12,67 7,61
Panamá 12,30 8,54
Haití 9,33 3,41
El Salvador 8,83 4,17
Venezuela 7,74 4,33

Nicaragua, Brasil, Bolivia, Chile, Colombia, Argentina, República Dominicana, Guatemala, Costa Rica, Puerto Rico, Paraguay y Panamá presentan velocidades medias de descarga móvil superiores a los 6-10 Mbps recomendados para transmisión de video en HD a 1080p. Esto es importante, ya que los segmentos en crecimiento de esta región utilizan los medios principalmente mediante conexiones móviles.

Conozca más sobre el mercado móvil brasileño.

Videollamada y correo electrónico

El panorama de las velocidades móviles no es muy bueno en Cuba, donde las velocidades móviles son tan lentas que los residentes tienen dificultades para usar teléfonos inteligentes para correos electrónicos y videollamadas entre más de dos personas.

Países de América Latina con velocidades móviles inferiores a 6 Mbps
Datos de Speedtest | T2-T3 2018
País Enlace descendente móvil (Mbps) Enlace ascendente móvil (Mbps)
Cuba 5,34 1,92

Si analizamos los países con las velocidades más lentas de América Latina, podemos observar que todos han enfrentado desafíos estructurales significativos, entre ellos, guerras, pobreza y desastres naturales. Además, son países que, sin dudas, necesitan una importante inversión en redes móviles.

Si bien la infraestructura móvil puede no ser lo primero en que eligen invertir los países más lentos, al mejorar las velocidades en estas áreas, también se podrían impulsar significativamente sus economías mediante la creación de entornos preparados para nuevas empresas emergentes e inversiones.

Banda ancha fija

Las velocidades necesarias para realizar tareas en Internet son similares para la banda ancha fija y la banda ancha móvil. Lo que no es igual es la lista de países dentro de la categoría de transmisores de video en 4K.

Transmisores de video en 4K

Chile asciende al primer lugar cuando consideramos las velocidades medias de descarga mediante banda ancha fija en América Latina. Uruguay ocupa el segundo lugar; Puerto Rico, el tercero; Panamá, el cuarto; Martinica, el quinto; y Paraguay, el sexto. Todos estos países latinoamericanos cuentan con velocidades de banda ancha fija lo suficientemente rápidas para permitir que los residentes hagan lo que quieran con facilidad en Internet.

Países de América Latina con velocidades de banda ancha fija superiores a 25 Mbps
Datos de Speedtest | T2-T3 2018
País Enlace descendente fijo (Mbps) Enlace ascendente fijo (Mbps) Diferencia porcentual entre las descargas mediante banda ancha móvil y fija
Chile 47,40 9,28 -190,44%
Uruguay 35,97 9,38 -55,71%
Puerto Rico 35,39 7,85 -146,45%
Panamá 34,94 7,21 -184,07%
Martinica 29,71 11,39 15,76%
Paraguay 27,84 8,00 -119,73%

Nuestro análisis muestra que, en casi todos estos países, las velocidades de descarga de banda ancha fija son significativamente más rápidas que las de banda ancha móvil. La única excepción es Martinica, donde las velocidades de descarga móvil son más rápidas que las de banda ancha fija.

Transmisores en HD

El siguiente grupo incluye países cuyas velocidades de descarga de banda ancha fija son lo suficientemente buenas para videollamadas, pero donde los usos más intensivos, como los juegos y las transmisiones en línea, pueden no resultar tan placenteros. Brasil encabeza esta lista ocupando el séptimo lugar en América Latina para velocidad de descarga mediante banda ancha fija. A continuación de Brasil, se ubican Guadalupe, Guayana Francesa, Perú, México, Argentina, República Dominicana, Colombia, Ecuador, Costa Rica, San Martín, El Salvador, Haití, Guatemala, Honduras, Bolivia y Nicaragua.

Países de América Latina con velocidades de banda ancha fija de 6 a 25 Mbps
Datos de Speedtest | T2-T3 2018
País Enlace descendente fijo (Mbps) Enlace ascendente fijo (Mbps) Diferencia porcentual entre las descargas mediante banda ancha móvil y fija
Brasil 23,64 10,57 -27,78%
Guadeloupe 23,31 9,34 29,04%
Guayana Francesa 22,58 11,45 -5,51%
Perú 22,43 4,90 -7,68%
México 22,37 8,53 -1,45%
Argentina 19,68 4,24 -27,79%
República Dominicana 14,16 3,83 4,97%
Colombia 13,79 5,86 14,40%
Ecuador 13,08 9,69 38,79%
Costa Rica 11,39 3,61 21,93%
San Martín 9,13 5,54 59,69%
El Salvador 8,38 3,14 5,10%
Haití 8,33 6,42 10,72%
Guatemala 7,94 3,78 46,68%
Honduras 7,32 4,36 64,05%
Bolivia 6,96 3,13 59,84%
Nicaragua 6,62 3,39 66,36%

Con la excepción de Guadalupe, los seis países más rápidos de este grupo tienen velocidades de banda ancha fija más rápidas que las de banda ancha móvil. A partir de la República Dominicana hasta el final de la lista, el resto de los países de este grupo tienen velocidades de descarga móvil más rápidas que las velocidades de banda ancha fija.

Videollamada y correo electrónico

Venezuela ocupa el mismo lugar que Cuba en esta lista de países de América Latina con velocidades de descarga de banda ancha fija inferiores a 6 Mbps. Sin embargo, ambos países tienen velocidades de descarga móvil más rápidas que las velocidades de descarga por banda ancha fija. Esto es positivo, porque los residentes pueden necesitar recurrir a sus teléfonos para mucho más que solamente simples videollamadas o correos electrónicos.

Países de América Latina con velocidades móviles inferiores a 6 Mbps
Datos de Speedtest | T2-T3 2018
País Enlace descendente fijo (Mbps) Enlace ascendente fijo (Mbps) Diferencia porcentual entre las descargas mediante banda ancha móvil y fija
Venezuela 3,96 1,50 48,84%
Cuba 3,73 4,07 30,15%

Tal como observamos con el uso de Internet móvil, hay muchos países latinoamericanos donde sería recomendable realizar inversiones sólidas en velocidades de banda ancha fija. Es decir, a menos que los proveedores estén preparados para que la banda ancha móvil sea el principal medio que los consumidores utilizan para acceder a Internet.

Rendimiento de Internet por banda ancha fija y móvil en las ciudades

Fort-de-France (Martinica) ocupa cómodamente el primer lugar en cuanto a velocidad móvil entre las ciudades más grandes de América Latina. Marigot (San Martín) ocupa el segundo lugar y Basse-Terre (Guadalupe), el tercero. En el otro extremo del espectro móvil, La Habana ocupa el último lugar, seguida de San Salvador (El Salvador) y Caracas (Venezuela).

Rendimiento de Internet en ciudades latinoamericanas

Datos de Speedtest | Q2-Q3 2018
Ciudad Descarga móvil (Mbps) Carga móvil (Mbps) Descarga fijo (Mbps) Carga fijo (Mbps) Diferencia porcentual entre las descargas mediante banda ancha móvil y fija
Asunción, Paraguay 14,58 8,57 43,49 8,86 -198,29%
Basse-Terre, Guadeloupe 27,73 8,61 21,20 8,15 23,55%
Belo Horizonte, Brasil 19,00 7,86 28,38 6,62 -49,37%
Bogotá, Colombia 15,89 9,48 16,46 7,16 -3,59%
Brasília, Brazil 22,20 9,29 29,27 7,79 -31,85%
Buenos Aires, Argentina 16,40 8,53 27,56 5,31 -68,05%
Cali, Colombia 22,35 12,11 13,10 5,16 41,39%
Caracas, Venezuela 8,83 5,13 5,10 2,04 42,24%
Cayena, Guayana Francesa 22,66 7,86 25,32 14,67 -11,74%
Ciudad de Guatemala, Guatemala 16,09 10,33 9,60 5,10 40,34%
Ciudad de México, México 21,41 11,22 29,81 12,41 -39,23%
Ciudad de Panamá, Panamá 12,18 8,82 37,02 7,88 -203,94%
Curitiba, Brasil 22,60 8,31 32,58 17,65 -44,16%
Ecatepec de Morelos, México 16,67 10,35 19,89 3,98 -19,32%
Fort-de-France, Martinica 36,00 10,34 43,60 21,47 -21,11%
Fortaleza, Brasil 18,85 8,63 26,20 10,33 -38,99%
Guayaquil, Ecuador 23,61 9,43 14,44 9,42 38,84%
La Habana, Cuba 4,47 1,26 2,99 3,10 33,11%
La Paz, Bolivia 16,92 11,81 7,16 3,20 57,68%
Lima, Perú 22,23 14,89 27,52 6,66 -23,80%
Managua, Nicaragua 21,04 8,89 6,87 3,52 67,35%
Manaos, Brasil 14,83 7,16 20,92 4,10 -41,07%
Marigot, San Martín 28,97 9,23 9,62 5,45 66,79%
Medellín, Colombia 17,58 9,17 14,76 6,87 16,04%
Montevideo, Uruguay 23,30 11,65 38,39 10,12 -64,76%
Puerto Príncipe, Haití 10,08 3,71 8,94 6,63 11,31%
Quito, Ecuador 21,01 7,75 15,54 11,59 26,04%
Río de Janeiro, Brasil 22,02 9,02 28,62 10,36 -29,97%
Salvador, Brasil 17,85 7,44 20,43 6,09 -14,45%
San José, Costa Rica 14,69 6,92 12,39 4,74 15,66%
San Juan, Puerto Rico 16,05 9,76 50,13 15,64 -212,34%
San Salvador, El Salvador 8,65 4,23 10,26 3,88 -18,61%
Santiago, Chile 16,05 9,35 42,69 12,37 -165,98%
Santo, Domingo, República Dominicana 15,15 8,87 17,86 4,47 -17,89%
San Pablo, Brasil 20,74 8,41 36,54 17,45 -76,18%
Sucre, Bolivia 14,81 11,18 4,86 3,24 67,18%
Tegucigalpa, Honduras 26,24 13,61 7,39 2,91 71,84%

Las ubicaciones más urbanas y con mayor densidad de población son lugares donde es más fácil y económico implantar mejoras para la infraestructura móvil; por lo tanto, si las velocidades son lentas en estas áreas, es una buena señal que las velocidades sean aún más lentas en otros lugares del país.

En cuanto a la banda ancha fija, San Juan (Puerto Rico) ocupa el primer lugar de América Latina, seguida de Fort-de-France (Martinica) y Asunción (Paraguay). La ciudad con la velocidad de descarga de banda ancha fija más lenta de las que analizamos es La Habana (Cuba), seguida de Sucre (Bolivia) y Caracas (Venezuela).

Ahora que sabe si su país o su ciudad son aptos para transmisión de video en 4K, transmisión de video en HD o solo para videollamadas y correo electrónico, es momento de averiguar si las velocidades están por encima o por debajo de la media. Realice un Speedtest en Android, iOS o la Web y envíenos un tuit a @speedtest para compartir su experiencia.


Revelando quais países da América Latina têm velocidade de internet adequada (e quais não têm)

A América Latina é um mercado em expansão para a internet. A população da América Latina vivenciou um crescimento rápido no número de assinantes de banda larga, tem alguns dos usuários de internet móvel mais engajados do mundo, sabe usar bem seus smartphones e busca velocidades de conexão de primeiro mundo. O problema é que alguns mercados não têm acesso às velocidades rápidas de banda larga móvel e fixa que encorajam o crescimento econômico.

Analisamos dados do Speedtest quanto à velocidade de banda larga móvel e fixa de toda a América Latina durante o segundo e o terceiro trimestres de 2018. Essa lista inclui países soberanos e outros territórios geralmente reconhecidos, exceto São Bartolomeu, que não exibiu um volume de teste significativo. Detalhamos cada conjunto de resultados de acordo com as velocidades tipicamente necessárias para diversas atividades.

O resultado revelou que existe uma divisão em três grandes grupos: países que atingem as velocidades necessárias para se conectar com facilidade com o resto do mundo, países que atingem conexões adequadas e países que enfrentam dificuldades de conexão.

Qual país tem a maior velocidade de internet móvel na América Latina?

De acordo com o GSMA, “os smartphones foram e são essenciais para estabelecer a América Latina como um dos maiores consumidores de redes sociais do mundo, com grande parte do uso ocorrendo em redes móveis.” Então queremos saber: que países conseguem usar smartphones em sua capacidade total e que países dependem mais de banda larga fixa?

Streamers de vídeo em 4K

Nosso primeiro grupo é composto por países que atingem velocidades médias de download móvel ideal até mesmo para as experiências móveis que mais usam dados. Martinica está na liderança, ocupando a primeira posição na América Latina e contando com uma velocidade média de download em banda larga móvel mais rápida do que a da França. Guadalupe fica em segundo lugar, com pouca diferença.

Países da América Latina com velocidades móveis maiores que 25 Mbps
Dados de Speedtest | T2-T3 2018
País Veloc. de download (Mbps) Veloc. de upload (Mbps)
Martinica 35,27 9,64
Guadeloupe 32,85 8,35

Streamers de HD

No próximo grupo estão países nos quais os residentes têm velocidade móvel suficiente para streaming HD (em 1080p), chat por vídeo e redes sociais. O Uruguai ocupa o primeiro lugar da lista, ficando em terceiro na América Latina em questão de velocidade de download móvel. São Martinho, México, Guiana Francesa, Equador, Peru e Honduras apresentam velocidades de download móvel mais rápidas do que 20 Mbps.

Países da América Latina com velocidades móveis entre 6 e 25 Mbps
Dados de Speedtest | T2-T3 2018
País Veloc. de download (Mbps) Veloc. de upload (Mbps)
Uruguai 23,10 11,39
São Martinho 22,65 8,00
México 22,05 11,78
Guiana Francesa 21,40 6,84
Equador 21,37 8,21
Peru 20,83 12,86
Honduras 20,36 10,33
Nicarágua 19,68 8,36
Brasil 18,50 7,52
Bolívia 17,33 11,03
Chile 16,32 9,07
Colômbia 16,11 8,85
Argentina 15,40 7,77
República Dominicana 14,90 8,28
Guatemala 14,89 9,48
Costa Rica 14,59 6,56
Porto Rico 14,36 8,41
Paraguai 12,67 7,61
Panamá 12,30 8,54
Haiti 9,33 3,41
El Salvador 8,83 4,17
Venezuela 7,74 4,33

Nicarágua, Brasil, Bolívia, Chile, Colômbia, Argentina, República Dominicana, Guatemala, Costa Rica, Porto Rico, Paraguai e Panamá têm velocidades de download móvel médias mais rápidas do que os 6 a 10 Mbps recomendados para streaming de vídeo HD em 1080p. Isso é importante, pois cada vez mais segmentos dessa região consomem mídia primariamente por conexões móveis.

Saiba mais sobre o mercado de telefonia móvel do Brasil.

Chat por vídeo e e-mail

A cena da velocidade móvel não é tão boa em Cuba, onde as velocidades móveis são baixas a ponto de os residentes terem problemas para usar smartphones quando o uso vai além de chats de vídeo com duas pessoas e troca de e-mails.

Países da América Latina com velocidades móveis abaixo de 6 Mbps
Dados de Speedtest | T2-T3 2018
País Veloc. de download (Mbps) Veloc. de upload (Mbps)
Cuba 5,34 1,92

Observando os países com as velocidades mais baixas da América Latina, podemos constatar que todos eles enfrentaram desafios estruturais significativos, tais como guerra, pobreza e desastres naturais. Também são países que claramente precisam de investimento móvel significativo.

Embora a infraestrutura móvel possa não ser a primeira coisa na qual esses países mais lentos escolhem investir, a melhoria das velocidades nessas áreas também pode impulsionar significativamente suas economias ao criar um ambiente propício para novas startups e investimentos.

Banda larga fixa

As velocidades necessárias para realizar as tarefas da internet são semelhantes na banda larga fixa e móvel. Mas a lista de países na categoria Streamers de vídeo em 4K não é igual.

Streamers de vídeo em 4K

O Chile pula para o primeiro lugar quando consideramos as velocidades médias de download em banda larga fixa na América Latina. O Uruguai fica em segundo, Porto Rico em terceiro, Panamá em quarto, Martinica em quinto e Paraguai em sexto. Todos esses países da América Latina têm velocidades de banda larga fixa rápidas o suficiente para permitir que os residentes façam o que quiserem on-line e com facilidade.

Países da América Latina com velocidades de banda larga fixa maior que 25 Mbps
Dados de Speedtest | T2-T3 2018
País Veloc. de download (Mbps) Veloc. de upload (Mbps) Percentual de diferença na veloc. de download de banda larga móvel em relação a banda larga fixa
Chile 47,40 9,28 -190,44%
Uruguai 35,97 9,38 -55,71%
Porto Rico 35,39 7,85 -146,45%
Panamá 34,94 7,21 -184,07%
Martinica 29,71 11,39 15,76%
Paraguai 27,84 8,00 -119,73%

Em quase todos esses países, nossa análise revela que as velocidades de download de banda larga fixa são significativamente mais rápidas do que as velocidades de redes móveis. A exceção é Martinica, que tem velocidades de downloads móveis mais rápidas do que as velocidades downloads de banda larga fixa.

Streamers de HD

O próximo grupo contém países cujas velocidades de download de banda larga fixa são boas o suficiente para chat por vídeo, mas não são ideais para usos que exigem maior velocidade, tais como jogos on-line e streaming. O Brasil ocupa a primeira posição nessa lista e a 7ª na América Latina para velocidade de download em banda larga fixa. Depois do Brasil, temos Guadalupe, Guiana Francesa, Peru, México, Argentina, República Dominicana, Colômbia, Equador, Costa Rica, São Martinho, El Salvador, Haiti, Guatemala, Honduras, Bolívia e Nicarágua.

Países da América Latina com velocidades de banda larga fixa entre 6 e 25 Mbps
Dados de Speedtest | T2-T3 2018
País Veloc. de download (Mbps) Veloc. de upload (Mbps) Percentual de diferença na veloc. de download de banda larga móvel em relação a banda larga fixa
Brasil 23,64 10,57 -27,78%
Guadeloupe 23,31 9,34 29,04%
Guaiana Francesa 22,58 11,45 -5,51%
Peru 22,43 4,90 -7,68%
México 22,37 8,53 -1,45%
Argentina 19,68 4,24 -27,79%
República Dominicana 14,16 3,83 4,97%
Colômbia 13,79 5,86 14,40%
Equador 13,08 9,69 38,79%
Costa Rica 11,39 3,61 21,93%
São Martinho 9,13 5,54 59,69%
El Salvador 8,38 3,14 5,10%
Haiti 8,33 6,42 10,72%
Guatemala 7,94 3,78 46,68%
Honduras 7,32 4,36 64,05%
Bolívia 6,96 3,13 59,84%
Nicarágua 6,62 3,39 66,36%

Com a exceção de Guadalupe, os seis países mais rápidos deste grupo têm velocidades de banda larga fixa mais rápidas do que as de banda larga móvel. Da República Dominicana para baixo na lista, os outros países do grupo têm velocidades de download de banda larga móvel mais rápidas do que as de banda larga fixa.

Chat por vídeo e e-mail

A Venezuela se junta a Cuba na lista de países da América Latina com velocidades de download de banda larga fixa inferiores a 6 Mbps. Apesar disso, ambos os países terem velocidades de download de banda larga móvel mais rápidas do que as de banda larga fixa. Isso é positivo, já que é possível que os residentes precisem usar seus telefones para coisas mais complexas do que simples chats por vídeo ou e-mail.

Países da América Latina com velocidades móveis abaixo de 6 Mbps
Dados de Speedtest | T2-T3 2018
País Veloc. de download (Mbps) Veloc. de upload (Mbps) Percentual de diferença na veloc. de download de banda larga móvel em relação a banda larga fixa
Venezuela 3,96 1,50 48,84%
Cuba 3,73 4,07 30,15%

Como vimos com a internet móvel, para muitos países na América Latina seria útil ter um investimento maciço em velocidades de banda larga fixa. Quer dizer, a menos que os provedores estejam prontos para que a banda larga móvel seja o principal veículo que os consumidores usam para acessar a internet.

Desempenho de internet com banda larga móvel e fixa por cidade

Fort-de-France, em Martinica, ocupa a primeira posição no quesito velocidade móvel com bastante vantagem em relação às outras cidades importantes da América Latina. Marigot, em São Martinho, fica em segundo, e Basse-Terre, em Guadalupe, em terceiro. No outro extremo do espectro de redes móveis, a cidade de Havana é a última, seguida por San Salvador, El Salvador e Caracas, na Venezuela.

Desempenho da internet
em cidades latino-americanas

Dados de Speedtest | Q2-Q3 2018
Cidade Download móvel (Mbps) Upload móvel (Mbps) Download fixa (Mbps) Upload fixa (Mbps) Percentual de diferença na veloc. de download de banda larga móvel em relação a banda larga fixa
Asunción, Paraguai 14,58 8,57 43,49 8,86 -198,29%
Basse-Terre, Guadeloupe 27,73 8,61 21,20 8,15 23,55%
Belo Horizonte, Brasil 19,00 7,86 28,38 6,62 -49,37%
Bogotá, Colômbia 15,89 9,48 16,46 7,16 -3,59%
Brasília, Brazil 22,20 9,29 29,27 7,79 -31,85%
Buenos Aires, Argentina 16,40 8,53 27,56 5,31 -68,05%
Cali, Colômbia 22,35 12,11 13,10 5,16 41,39%
Caracas, Venezuela 8,83 5,13 5,10 2,04 42,24%
Cayenne, Guaiana Francesa 22,66 7,86 25,32 14,67 -11,74%
Cidade de Guatemala, Guatemala 16,09 10,33 9,60 5,10 40,34%
Cidade de México, México 21,41 11,22 29,81 12,41 -39,23%
Cidade de Panamá, Panamá 12,18 8,82 37,02 7,88 -203,94%
Curitiba, Brasil 22,60 8,31 32,58 17,65 -44,16%
Ecatepec de Morelos, México 16,67 10,35 19,89 3,98 -19,32%
Fort-de-France, Martinica 36,00 10,34 43,60 21,47 -21,11%
Fortaleza, Brasil 18,85 8,63 26,20 10,33 -38,99%
Guayaquil, Equador 23,61 9,43 14,44 9,42 38,84%
Havana, Cuba 4,47 1,26 2,99 3,10 33,11%
La Paz, Bolívia 16,92 11,81 7,16 3,20 57,68%
Lima, Peru 22,23 14,89 27,52 6,66 -23,80%
Managua, Nicarágua 21,04 8,89 6,87 3,52 67,35%
Manaus, Brasil 14,83 7,16 20,92 4,10 -41,07%
Marigot, São Martinho 28,97 9,23 9,62 5,45 66,79%
Medellín, Colômbia 17,58 9,17 14,76 6,87 16,04%
Montevideo, Uruguai 23,30 11,65 38,39 10,12 -64,76%
Port-au-Prince, Haiti 10,08 3,71 8,94 6,63 11,31%
Quito, Equador 21,01 7,75 15,54 11,59 26,04%
Rio de Janeiro, Brasil 22,02 9,02 28,62 10,36 -29,97%
Salvador, Brasil 17,85 7,44 20,43 6,09 -14,45%
San José, Costa Rica 14,69 6,92 12,39 4,74 15,66%
San Juan, Porto Rico 16,05 9,76 50,13 15,64 -212,34%
San Salvador, El Salvador 8,65 4,23 10,26 3,88 -18,61%
Santiago, Chile 16,05 9,35 42,69 12,37 -165,98%
Santo, Domingo, República Dominicana 15,15 8,87 17,86 4,47 -17,89%
São Paulo, Brasil 20,74 8,41 36,54 17,45 -76,18%
Sucre, Bolívia 14,81 11,18 4,86 3,24 67,18%
Tegucigalpa, Honduras 26,24 13,61 7,39 2,91 71,84%

Locais mais densos e urbanos são locais mais fáceis e econômicos para implementar melhorias na infraestrutura móvel, portanto, se as velocidades forem lentas nessas áreas, é um bom sinal de que as velocidades são muito piores em outros lugares do país.

No que diz respeito à banda larga fixa, San Juan, em Porto Rico, ocupa a primeira posição na América Latina, seguida por Fort-de-France, em Martinica, e Asunción, no Paraguai. A cidade com a velocidade de download de banda larga fixa mais lenta dentre as que analisamos é Havana, em Cuba, seguida por Sucre, na Bolívia e Caracas, na Venezuela.

Agora que você sabe a classificação do seu país ou cidade para streaming de vídeo em 4K, streaming de vídeo em HD ou apenas chat por vídeo e e-mail, é hora de descobrir se suas velocidades estão acima ou abaixo da média. Faça o Speedtest no Android, iOS, ou na web e mande um tweet para @speedtest para compartilhar sua experiência.
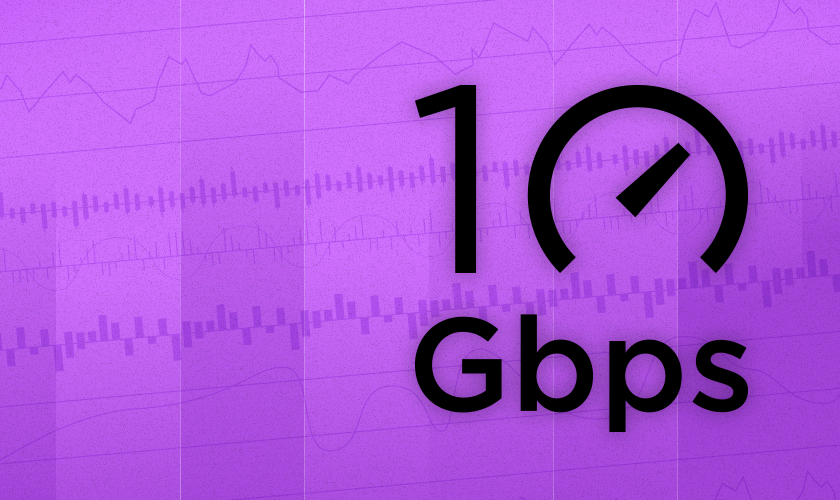

Ookla retains ownership of this article including all of the intellectual property rights, data, content graphs and analysis. This article may not be quoted, reproduced, distributed or published for any commercial purpose without prior consent. Members of the press and others using the findings in this article for non-commercial purposes are welcome to publicly share and link to report information with attribution to Ookla.

| October 16, 2018

Why Ookla Uses Consumer-initiated Testing to Measure Internet Speed (Video)

At Ookla, the company behind Speedtest, we use consumer-initiated testing to determine the speed and performance of global networks. People often ask us why we take this approach. The short answer is that we believe consumer-initiated testing is the most accurate way to measure real world internet speeds, because it reflects when and where people actually use the internet. The long(er) answer is right here in this video that we hope you’ll enjoy…

Why Speedtest uses consumer-initiated testing


As you saw, it’s important that consumer-initiated testing meets three basic criteria:

  1. Data must come from various devices and contexts
  2. The testing server must be nearby
  3. The number of tests being analyzed must be statistically significant

That’s why we’re grateful to the millions of people all over the globe who use Speedtest every day to determine the speed of their internet connection. You help us report the most accurate and reliable picture of internet speeds across the world.

What about other testing methods?

The limits of drive testing

Drive testing is one common way that mobile operators measure networks. They like it because they can get a repeatable sample of tests taken on the same device in the same place. But drive testing is limited to where cars can actually drive, and most areas that they do test are only measured infrequently. If you want to learn more about the limits of drive testing and why they matter, we have a video for that, too…


To learn even more about different internet measurement methods and their strengths and weaknesses, read our full description here.

Ookla retains ownership of this article including all of the intellectual property rights, data, content graphs and analysis. This article may not be quoted, reproduced, distributed or published for any commercial purpose without prior consent. Members of the press and others using the findings in this article for non-commercial purposes are welcome to publicly share and link to report information with attribution to Ookla.

| October 8, 2018

Just How Much Does Roaming Affect Mobile Performance in Southeast Europe?

This week the Wholesale Agreements and Solutions Group (WAS) will be meeting in Rovinj, Croatia as part of a GSMA working group to discuss the big deals that will affect worldwide roaming speeds over the next year. That made us curious — what kinds of roaming speeds might these telecom execs experience while they’re deciding our roaming fate?

We looked into Speedtest Intelligence® data from over 2.7 million consumer-initiated tests in Southeast Europe during Q1-Q2 2018 on devices using LTE networks to see how median speeds and latency were affected as mobile users roamed around the region. Roaming speeds include Android results only.

Though we expected to see a general decline in speeds and increase in latency (the time it takes for data to travel from your phone to the nearest server and back) while roaming, we were surprised by how much a person’s home country affected their mobile roaming experience.

Albania, Bosnia and Herzegovina, Macedonia and Montenegro are excluded from this analysis due to insufficient sample size during the examined time period. Data for Serbia includes the disputed region of Kosovo.

There’s no correlation between local download speed and decrease in roaming speed

Median Local vs. Roaming Download Speeds
Southeast Europe
Q1-Q2 2018 | 4G LTE
Country Local Download (Mbps) Roaming Download (Mbps) % Difference
Bulgaria 37.97 18.21 -52.0%
Croatia 34.50 31.67 -8.2%
Greece 33.61 27.87 -17.1%
Romania 28.47 20.89 -26.6%
Serbia 34.19 30.32 -11.3%
Slovenia 26.26 28.26 7.6%
Turkey 29.93 21.75 -27.3%

Slovenians are the only Southeast Europeans who see better mobile speeds while traveling than they do at home. Considering Slovenia’s local mobile download speed is the lowest on this list, we can presume that residents are encountering better infrastructure abroad and seeing better speeds as a result.

That does not that mean that countries with the fastest local download speeds see the largest declines in speed when roaming. For example, Bulgaria shows the fastest median mobile download speed in Southeast Europe and sees the largest declines in download speed when roaming. But Croatia, which has the second fastest mobile download speed in Southeast Europe, shows the second smallest decline in download speed when roaming.

On the other hand, Romania, which ranks sixth on our list for median local download speed shows the third largest decline when roaming. While Turkey, which ranks fifth in the region for local download speed, shows the second largest decline when roaming.

In fact, roaming speed is affected by in-country infrastructure and also by how operators prioritize out of country traffic. These decisions are made between each individual operator in each individual country, often at meetings like those in Rovinj this week where operators negotiate who has access to what networks and how much that access should cost them. This is why some operators offer extensive roaming packages and why those often come at a cost.

Roaming dramatically increases latency

Latency is measured in milliseconds, and a mobile user usually won’t notice a lag between taking an action on their phone and seeing an expected result when latency is low. Even in Croatia, the country with the highest local latency on our list, latency is very close to what the rest of the countries experience.

Median Local vs. Roaming Latency
Southeast Europe
Q1-Q2 2018 | 4G LTE
Country Local Latency (ms) Roaming Latency (ms) % Difference
Bulgaria 23 135 487.0%
Croatia 26 84 223.1%
Greece 23 144 526.1%
Romania 24 118 391.7%
Serbia 19 31 63.2%
Slovenia 19 67 252.6%
Turkey 24 130 441.7%

However, latency can skyrocket when roaming as some operators route a user’s traffic back through their home country, which leads to a much different user experience. This is definitely what we found in our analysis of Southeast Europe. As we saw with download speed, the percentage change between local and roaming latency was not correlated to local latency.

For example, Slovenia and Serbia show the same median local latencies (19 ms), but Slovenia shows a large increase in latency while Serbia’s increase is the smallest on our list.

This is because latency, like roaming speed, is a lot more complex than simply what infrastructure consumers are on. There’s also the matter of network agreements… the very deals that telecom execs are hammering out right now in Rovinj.

Are you at WAS? Stop by booth 23. We’d love to share a sneak peek of our roaming data with you. We have the insights and data for use in decisioning, sales, negotiation and quality steering related to wholesale and roaming solutions.

Ookla retains ownership of this article including all of the intellectual property rights, data, content graphs and analysis. This article may not be quoted, reproduced, distributed or published for any commercial purpose without prior consent. Members of the press and others using the findings in this article for non-commercial purposes are welcome to publicly share and link to report information with attribution to Ookla.