| May 10, 2021

Prevalent and Fast Wi-Fi in Thailand Drives Improvements in Internet Speeds

Thailand has witnessed significant improvement in fixed broadband internet speeds over the past couple of years, as fiber-to-the-home (FTTH) continues to grow strongly in major metropolitan areas. And then the pandemic hit. With COVID-19, companies across the globe adapted to working from home, and people began spending more time online with the implementation of lockdowns. This led to a surge in overall internet traffic for internet service providers (ISPs), especially on fixed networks. We used data from Speedtest Intelligence® to analyze the effect of this in Thailand during Q1-Q4 2020 to determine if the increase in traffic slowed internet speeds and degraded end-user experience. We also looked closely at Wi-Fi in Thailand to see how increased usage affected speeds.

Thailand jumps in international rankings

Data from the Speedtest Global Index during 2020 shows Thailand managed the challenges of increased traffic comparatively well, climbing from a ninth-place position for mean fixed broadband speed in January 2020 to third place in December 2020. Singapore and Hong Kong held on to the first- and second-place, respectively, throughout the year.
ookla_speedtest_global_index_rank_change_2020-2

Thailand second fastest ASEAN country for fixed broadband

ASEAN is one of the fastest growing internet markets in the world, and data from Speedtest Intelligence shows the number of fixed broadband users in ASEAN countries grew by 40.7% year-over-year, from 22.97 million unique users in 2019 to 32.31 million users in 2020. Impressively, speed has kept up with demand in Thailand where the mean download speed over fixed broadband during 2020 was 166.81 Mbps, ranking the country second-fastest among ASEAN member states. Singapore was first with a mean download speed of 214.39 Mbps over fixed broadband during the same period. Other ASEAN countries lag far behind Singapore and Thailand for fixed broadband internet speeds, with Indonesia ranking last on the list with an average download speed of 22.07 Mbps during 2020. We have omitted Myanmar from this analysis due to the current political situation.
ookla_mean_fixed_broadband_speeds_asean_2020-2

Wi-Fi usage increased during the pandemic

The percentage of time people spend on Wi-Fi is one indicator of the amount of time people spend at home and Speedtest Intelligence shows an increase in Wi-Fi usage during the pandemic. In Thailand, Android mobile phone users spent 7.4% more time on Wi-Fi in December 2020 when compared with January 2020. This effect was not limited to Thailand, all ASEAN countries showed an increase in Wi-Fi usage since the onset of COVID restrictions in March 2020.
ookla_time_spent_wi-fi_asean_2020

Wi-Fi speeds are improving throughout Thailand’s provinces

A comparison of Speedtest Intelligence data from Q1 2020 to that from Q4 2020 showed mean Wi-Fi speeds on modern Android devices have improved throughout the country.
ookla_wi-fi_speeds_android_thailand_2020

Speedtest Intelligence data from Q4 2020 showed Phrae province was the fastest of Thailand’s 77 provinces, boasting an average download speed of 462.14 Mbps in Q4 2020. Sing Buri and Sa Kaeo provinces were second and third fastest at 367.14 Mbps and 304.33 Mbps, respectively. Mean download speeds in the other provinces vary widely in the range of 180-300 Mbps. Satun and Uthai Thani provinces displayed some of the slowest speeds in the country with mean download speeds of 180.77 Mbps and 180.37 Mbps, respectively.

Mean Wi-Fi Speeds on 5 GHz Using Modern Android Devices in 10 Fastest Thai Provinces and Bangkok
Speedtest Intelligence® | 2020
Province Q4 Download Speed (Mbps) Q1 Download Speed (Mbps) % Change
Phrae 462.14 228.55 102.2%
Sing Buri 367.14 295.35 24.3%
Sa Kaeo 304.33 174.07 74.8%
Kanchanaburi 291.09 202.98 43.4%
Ranong 286.76 287.68 -0.3%
Phang-nga 286.01 210.43 35.9%
Nan 282.32 189.17 49.2%
Uttaradit 281.16 234.41 19.9%
Phuket 280.77 220.44 27.4%
Lopburi 275.66 197.27 39.7%
Bangkok 260.15 225.33 15.5%

Regulatory changes should increase investment in Thailand’s fixed broadband

The Thai government has recently made some changes to improve its regulatory framework which should attract more investment in fixed broadband, which in turn will facilitate the transition from DSL and cable to fiber.

In addition, fixed-line operators in Thailand have been focusing on developing FTTH networks in urban areas. ISPs now offer gigabit broadband plans (capable of speeds greater than or equal to 1 Gbps) as part of their primary packages. Gigabit broadband connections are now available in major cities like Bangkok, Phuket, and Chiang Mai.

The National Broadcasting and Telecommunications Commission (NBTC) also announced 10 GB free mobile broadband data for all the subscribers to facilitate work from home measures urged by the government during the COVID-19 pandemic. NBTC issued a guideline to all fixed broadband ISPs to upgrade the speed of home internet to at least 100 Mbps for all clients completely free of charge.

Is your provider measuring up? Take a Speedtest to find out. This data is used by ISPs and regulators worldwide to identify how to improve networks.

Editor’s Note: A previous version of this article showed data that did not reflect the entire picture of the network providers performance. To avoid confusion, we have have removed this section.

Ookla retains ownership of this article including all of the intellectual property rights, data, content graphs and analysis. This article may not be quoted, reproduced, distributed or published for any commercial purpose without prior consent. Members of the press and others using the findings in this article for non-commercial purposes are welcome to publicly share and link to report information with attribution to Ookla.

| September 7, 2021

5G in Austria: Evaluating Performance Two Years After Launch

Auf Deutsch lesen

Austria has been held up as an example of a pioneer European 5G-market, having announced its 5G Strategy in April 2018, which has since been incorporated in the nation’s Broadband Strategy 2030. This strategy includes a number of 5G targets: commitments to early 5G trials, the rollout of 5G in all state capitals by the end of 2020 (which it has achieved), coverage of all main traffic routes in the country by the end of 2023 and nationwide 5G coverage by the end of 2025. We analyzed Speedtest Intelligence® data from Q1-Q2 2021 to see how performance is tracking two years on from launch. We compared Austrian 5G speeds to those of its regional peers and examined how its operators 5G networks perform across the country.

Key spectrum auctions are opening up Austria’s 5G market

Despite COVID-19 related delays, the Austrian regulator has completed the auction of spectrum in key 5G bands. The first auction in early 2019 saw all three national mobile operators acquire contiguous bands at least equal to the EU’s recommended 80-100 MHz in the C-band. A follow up multi-band auction (which included spectrum in the 700 MHz band) was conducted in September 2020 and included obligations to cover a range of not-spots (areas of zero mobile broadband coverage) and partial not-spots (areas of coverage by only one network operator).

Having access to large contiguous blocks of spectrum in the key C-band will allow Austrian operators to make more efficient use of their spectrum resources and better support high-bandwidth, low-latency 5G use cases. Austria already looks set to advance with standalone (SA) 5G networks, with Drei Austria recently announcing a trial in the capital Vienna and plans to launch a commercial 5G SA network in spring 2022. Notably, operators have complained that the high cost of mobile mast rental has slowed 5G rollout.

Switzerland had the fastest 5G among Austria’s European peers during Q1-Q2 2021

5G performance has seen some wild swings over the past year in Austria and its European peer countries in the region. Switzerland ended Q2 2021 with the fastest median 5G download speed on this list at 177.33 Mbps, followed by France (169.16 Mbps), Austria (143.98 Mbps), Germany (142.71 Mbps) and Italy (122.54 Mbps).
ookla_5g_performance_eu_0921_en-1

Switzerland was also fastest for median upload speed over 5G during Q2 2021 at 36.37 Mbps, followed by Germany (26.22 Mbps), Austria (21.97 Mbps), Italy (16.43 Mbps) and France (15.95 Mbps). We often see 5G speeds decline after the initial launch period as more users adopt the technology, which adds congestion to cell sites. Additionally, the use of Dynamic Spectrum Sharing (DSS) allows operators to expand 5G coverage through the use of existing spectrum bands and incorporates bands at lower frequencies that can lead to slower median speeds.

Drei Austria was the fastest operator in Austria for 5G

5G performance varied widely among Austria’s top providers during Q1-Q2 2021 but Drei Austria had the fastest median 5G download speed at 183.04 Mbps. Accounting for statistical uncertainty, this was at least 21% faster than the nearest competitor. Magenta Telekom and A1 Telekom had slower 5G download speeds at 145.18 Mbps and 111.07 Mbps, respectively. For median 5G upload speeds, Magenta Telekom placed first at 24.43 Mbps.
ookla_5g_performance_providers_at_0921_en-1

Innsbruck trumps Vienna on 5G download and upload speeds

While there was no statistical winner among Austrian capitals, Innsbruck had a median 5G download speed at 169.43 Mbps, which was demonstrably faster than Vienna’s median download speed of 144.93 Mbps. Since there was no clear winner among all state capitals, this indicates operators’ 5G rollouts to date have not prioritized any single state capital, and that they are currently managing the balance between providing 5G capacity with demand on the new network. Within the capital Vienna, Drei Austria’s 5G network showed the fastest performance during Q1-Q2 2021 achieving a median download speed of 193.66 Mbps.
ookla_5g_performance_at_map_0921_en-1

Austria has clearly seen a ramp up in mobile network speeds with the arrival of 5G. We’ll be interested to see if other providers make the necessary investments to catch up to Drei. This could bring up speeds across the country and improve Austria’s standing relative to its peers in the Speedtest Global Index, where it ranked 31st for mobile speed in July 2021. Learn more about how Speedtest Intelligence can help you benchmark your 5G performance against competitors.


5G in Österreich im Performance-Test zwei Jahre nach dem Start

Österreich gilt als einer der 5G-Pioniermärkte in Europa. Bereits im April 2018 verkündete Österreich seine 5G-Strategie, die inzwischen in die nationale Breitbandstrategie 2030 integriert wurde. Diese Strategie enthält eine Reihe von 5G-Zielen: eine Verpflichtungen zu ersten frühzeitigen 5G-Tests, die mittlerweile bereits umgesetzt Einführung von 5G in allen Landeshauptstädten zum Zeitpunkt Ende 2020, die Abdeckung aller Hauptverkehrswege des Landes bis Ende 2023 und eine landesweite 5G-Versorgung bis Ende 2025.

Zwei Jahre nach dem kommerziellen 5G-Start in Österreich haben wir unsere Speedtest Intelligence® Daten aus Q1-Q2 2021 analysiert, um zu sehen, wie sich die Performance von 5G im Land entwickelt hat. Wir haben untersucht, wie die 5G-Netze der Betreiber im ganzen Land abschneiden, und die 5G-Übertragungsraten jenen vergleichbarer europäischer Länder in der Region gegenübergestellt.

Frequenzauktionen machen Weg frei für Österreichs 5G-Markt

Trotz COVID-19-bedingter Verzögerungen hat die österreichische Regulierungsbehörde die Versteigerung der Frequenzbänder für 5G mittlerweile abgeschlossen. Bei der ersten Auktion Anfang 2019 erwarben alle drei nationalen Mobilfunkbetreiber zusammenhängende Bänder, die mindestens den von der EU empfohlenen 80-100 MHz im C-Band entsprechen. Eine nachfolgende Multi-Band-Auktion, die auch Frequenzen im 700-MHz-Band umfasste, wurde im September 2020 durchgeführt und beinhaltete Verpflichtungen zur Abdeckung einer Reihe von Not-Spots (Gebiete ohne mobile Breitbandabdeckung) und von partiellen Not-Spots (Gebiete mit Abdeckung durch nur einen Netzbetreiber).

Der Zugang zu großen, zusammenhängenden Frequenzblöcken im wichtigen C-Band wird es den österreichischen Betreibern ermöglichen, ihre Frequenzressourcen effizienter zu nutzen und 5G-Anwendungsfälle mit hoher Bandbreite und geringer Latenz noch besser zu unterstützen. Österreich scheint hierfür auch bereits mit 5G standalone (SA)-Netzen voranzukommen. Drei Austria hat kürzlich einen Test in der Hauptstadt Wien angekündigt und plant, schon im Frühjahr 2022 ein kommerzielles 5G SA-Netz in Betrieb zu nehmen. Zugleich beklagen die Betreiber jedoch, dass die hohen Kosten für die Anmietung von Mobilfunkmasten die Einführung von 5G verlangsamt haben.

Schweiz mit schnellstem 5G unter Österreichs Peers in Q1-Q2 2021

Die 5G-Performance hat im vergangenen Jahr in Österreich und anderen vergleichbaren europäischen Ländern in der Region stark geschwankt. Im Q2 2021 hatte die Schweiz die Nase vorne mit einer mittleren 5G-Download-Geschwindigkeit von 177,33 Mbps, gefolgt von Frankreich (169,16 Mbps), Österreich (143,98 Mbps), Deutschland (142,71 Mbps) und Italien (122,54 Mbps).
ookla_5g_performance_eu_0921_de-1

Auch bei den Upload-Raten erreichte die Schweiz in Q2 2021 mit 36,37 Mbit/s bei 5G den besten Mittelwert, gefolgt von Deutschland (26,22 Mbit/s), Österreich (21,97 Mbit/s), Italien (16,43 Mbit/s) und Frankreich (15,95 Mbit/s). Nach der anfänglichen Einführungsphase sinken die 5G-Geschwindigkeiten häufig, denn die Zahl der 5G-Kunden steigt allmählich an, was zu einer stärkeren Belastung der Mobilfunkstandorte führt. Außerdem nutzen die Betreiber zunehmend bestehende Frequenzbänder für 5G mittels Dynamic Spectrum Sharing (DSS). Die Betreiber sind so in der Lage, die 5G-Abdeckung zu erweitern und niedrigere Frequenzbänder einzubeziehen. Die durchschnittliche Übertragungsgeschwindigkeit kann sich dadurch verlangsamen.

Drei mit schnellstem 5G-Netz in Österreichs in Q1-Q2 2021

Die 5G-Performance hat in Q1-Q2 2021 zwischen den österreichischen Top-Providern stark variiert. Drei Austria hatte mit 183,04 Mbit/s im Mittelwert die schnellste 5G-Download-Geschwindigkeit. Unter Berücksichtigung der statistischen Schwankungsbreite war das 5G Netz von Drei damit mindestens 21 % schneller als jenes des nächsten Mitbewerbers. Magenta Telekom und A1 Telekom erreichten langsamere 5G-Download-Geschwindigkeiten von 145,18 Mbit/s bzw. 111,07 Mbit/s. Bei der mittleren 5G-Upload-Rate lag Magenta Telekom mit 24,43 Mbit/s an erster Stelle.
ookla_5g_performance_providers_at_0921_de-1

Innsbruck übertrumpft Wien bei 5G-Download- und Upload

Unter den österreichischen Landeshauptstädten zeigte sich statistisch betrachtet kein eindeutiger Gewinner. In der mittleren Download-Geschwindigkeit war 5G in Innsbruck mit 169,43 Mbit/s aber augenscheinlich schneller als Wien mit 144,93 Mbit/s. Dass es keinen eindeutigen Gewinner unter den Landeshauptstädten gab, lässt darauf schließen, dass die Betreiber beim 5G-Rollout bisher keine Region signifikant priorisiert haben und dass ihnen derzeit eine gute Balance zwischen der Bereitstellung von 5G-Kapazität und der Nachfrage im neuen Netz gelingt.

In der Hauptstadt Wien erreichte das 5G-Netz von Drei Austria in Q1-Q2 2021 die schnellsten Übertragungsraten mit einer mittleren Download-Geschwindigkeit von 193,66 Mbit/s.
ookla_5g_performance_at_map_0921_de

Die Geschwindigkeit der Mobilfunknetze in Österreich hat sich mit der Einführung von 5G deutlich erhöht. Wir sind gespannt, ob die anderen Anbieter die notwendigen Investitionen tätigen, um zu Drei aufzuschließen. Das könnte die Internet-Geschwindigkeiten im ganzen Land erhöhen und Österreichs Position im Vergleich zu anderen Ländern im Speedtest Global Index verbessern. Zuletzt lag Österreich im Juli 2021 bei der Mobilfunk-Geschwindigkeit auf Platz 31. Erfahren Sie mehr darüber, wie Speedtest Intelligence Ihnen helfen kann, Ihre 5G-Leistung mit jener Ihrer Wettbewerber zu vergleichen.

Ookla retains ownership of this article including all of the intellectual property rights, data, content graphs and analysis. This article may not be quoted, reproduced, distributed or published for any commercial purpose without prior consent. Members of the press and others using the findings in this article for non-commercial purposes are welcome to publicly share and link to report information with attribution to Ookla.

| December 1, 2021

Four Video Experience Metrics ISPs and Mobile Operators Should Care About [Webinar]

Video content is now the dominant form of global network traffic, and consumers are spending more time than ever watching videos on streaming services and social media platforms. When a customer subscribes to your internet service or mobile network, they are ultimately paying for a service that allows them to consume content. They expect to be able to watch videos at a high quality without interruption, and if you can’t deliver a great video streaming experience, it’s likely that you’ll end up with a dissatisfied customer.

It’s important for ISPs and operators to understand their customers’ real-life connectivity and quality of experience when they are consuming video content. Understanding the streaming experience starts with analyzing the right video KPIs — metrics that will help you measure and improve video performance on your network, as well as prioritize marketing and engineering efforts where you have excellent or poor performance.

Register for our December 9 webinar to learn about the latest industry research and best practices for accurately measuring the end-user’s experience in real-world conditions — so you can deliver world-class video streaming quality.

Which metrics should you care about?

Major video content providers and platforms like Netflix, Hulu, Youtube, Instagram and Facebook all use industry-standard metrics to ensure that their users are having good experiences. If you’re looking to improve your customers’ video streaming experience on your network, these are the video metrics that you should pay attention to:

1. Start delays

A start delay is the time from when the user hits “play” to when the video starts playing. Hitting play and having to wait a long time for the video to begin is not a good streaming experience.

2. Start failures

A start failure is when the user attempted to play a video but it failed to start. Failed playback usually leads to customer dissatisfaction with the streaming service or network provider.

3. Rebuffering ratio

This is the time spent stalling divided by the time spent playing back video. You can also look at stall proportion to understand the frequency of rebuffering events.

4. Average bitrate

This is the average media bitrate of the video played. In adaptive bitrate streaming, lower bitrate means lower quality video and a higher bitrate means a higher quality video, so you should be aiming to provide a higher average bitrate than your competitors.

Video Analytics in Speedtest Intelligence® captures each of these metrics and surfaces data from millions of video tests initiated in Speedtest® by consumers all over the world. To learn more about what you can do with these metrics, such as finding areas of opportunity for expansion, competitive benchmarking and promoting a superior video experience, join the webinar on Thursday, December 9.

The webinar will take place for APAC time zones at 11 a.m. GMT +8 (8:30 a.m. Mumbai, 10 a.m. Bangkok/Jakarta, 11 a.m. Manila/Singapore/Beijing/Kuala Lumpur, 12 p.m. Tokyo/Seoul, 2 p.m. Sydney), and a recording will be provided for registrants who can’t join the live presentation. Register now.

Ookla retains ownership of this article including all of the intellectual property rights, data, content graphs and analysis. This article may not be quoted, reproduced, distributed or published for any commercial purpose without prior consent. Members of the press and others using the findings in this article for non-commercial purposes are welcome to publicly share and link to report information with attribution to Ookla.

| October 21, 2020

5G Claims Gone Wrong: The Dangers of Bad Data

5G is in the news as competing operators roll out deployments in a race to have the fastest service in the most places. At Ookla®, we’ve observed astonishing 5G speeds that live up to the hype. But 5G headlines can be confusing for consumers who are trying to sift through conflicting claims that are often based on limited (if not deeply flawed) data. 5G as a technology is also rapidly evolving, which makes sound data collection that addresses the nuances of these shifts even more important.

As the industry leader in internet testing, Ookla has over 15 years of experience measuring emerging technologies. We’re here to share some lessons learned about what goes into making an authoritative claim that consumers can rely on. We’ll also look closely at some recent examples from the United Kingdom where a multitude of methodological shortcomings from unseasoned data providers have led to unreliable network claims. While this article is focused on U.K. examples, the same methodology critiques apply to active 5G claims from the same data providers in other markets.

Poor data leads to spurious claims, examples from the U.K.

Operators are eager to use designations like “fastest,” “best coverage” and “most improved” because these messages resonate with customers. But without proper data and careful analysis backing them, these labels are meaningless and potentially misleading. Ookla has a team of data scientists dedicated to ensuring our claims about networks are accurate, representative and fair.

In recent months we’ve seen a series of conflicting claims being made in the U.K. market. These claims are not based on robust, proven data collection and processing practices. As a result, consumers are being misled about which operators are truly providing the best experience.

Poor 5G identification muddles what’s being measured

As 5G is an emerging technology, it needs to reach a certain level of both adoption and maturity before comparative performance claims can be made in new markets. The U.K. is one such hotbed of 5G activity where every operator is racing to be crowned the best. This well-intended desire of operators to show off new capabilities has led to dubious claims being made in the market. Namely, competing operators are making similar claims about their network capabilities, while differing data providers are publishing reports based upon very limited and flawed data. This can lead consumers to make decisions based on questionable reporting — or to purchase services that aren’t even available in their area.

device-identification
Not all 5G-capable devices natively identify 5G when reporting the connection type to applications. That’s why Ookla has directly partnered with device manufacturers worldwide to implement accurate in-app 5G detection in Speedtest®. Data providers who do not couple robust in-app detection with strict filtering criteria are highly likely to mis-identify a wide range of 5G connections and ultimately show speeds that do not accurately reflect the network’s actual 5G service capability.

Failure to measure full throughput undervalues high-speed connections

Modern technologies like 5G are capable of achieving gigabit speeds and beyond. Unless a testing solution is capable of measuring the full throughput of a user’s connection, measured speeds will not reflect the network’s real-world performance. The Ookla Speedtest Methodology uses a distributed network of servers to fully maximize a connection in the foreground, on demand, that can accurately measure speeds up to 10 Gbps. Other data providers like Opensignal, nPerf and umlaut either test to remote CDNs, test in the background or — worse still — hide their tests in third-party apps that are completely unrelated to network diagnostics.

dedicated-measuring-1
The Opensignal methodology allows for a blend of testing methods. However, their public reporting consistently makes no distinction between results derived from these differing methodologies and presents them as a simple national average. This mix of methodologies introduces the possibility that any reported differences in download speed among operators may be due to differences in testing and not due to differences in the actual services that they provide.

Opensignal’s test methodology also tends to seriously undervalue the full capability of networks. Because a significant amount of demand must be generated on the network before 5G carrier aggregation can even take effect, shorter-duration and background tests are incapable of ensuring that the network assigns a sufficient number of component carriers to the user equipment (UE) to trigger a 5G connection. Data providers that only pass along a small file do not fully saturate a network connection and often cannot place enough demand on the network to trigger a 5G connection, leaving devices — and speeds — stuck registering 4G.

For example, Opensignal recently reported that the average 5G download speed in the U.K. was 130.1 Mbps. Ookla’s data for that same time period, on the other hand, reported a dramatically higher mean download speed of 187.49 Mbps (95%CI [185.57, 189.42]). This range of 185.57-189.42 Mbps is a 95% confidence interval, which represents the range of values in which the true value is likely to be. Ookla’s large sample sizes combined with rigorous statistical testing ensure that all claims that we make stand on solid ground. To their credit, Opensignal also includes uncertainty in their reported speeds, but because it is unclear — though important — what their confidence intervals represent, we cannot compare them directly.

If networks wish to demonstrate that they truly are the fastest, they must employ methodologies that test using the full capacity of the connection, rather than a small file passed to a distant server. This is especially true when considering the high speeds achieved with 5G.

Inadequate sample sizes falsely represent reality

Data providers with small test volumes from a limited number of locations do not have the statistical power needed to draw sound conclusions about network performance.

sample-volume

As the industry’s most trusted source for consumer throughput testing, Speedtest users performed over 19.4 million tests daily during Q3 2020. We see real-time results on almost every mobile and fixed broadband network in the world — including just about every device make and model — which provides an unmatched view of how the internet is currently performing at a global scale.

For example, nPerf published a U.K. report which was based on less than 36,000 test samples taken over a 12-month period. For comparison, Ookla collects over 15,000 tests every day in the U.K. It took Ookla less than three days to collect the same amount of data that nPerf collected in a year. Generally speaking, lower sample counts tend to produce results with much less statistical certainty. This particular report from nPerf showed wildly different results than all others released in the market — unsurprisingly, given their limited sample size. This put Vodafone on the defensive as rivals ran TV ads to debunk nPerf’s claim, which was meant to bolster Vodafone’s network offerings.

ookla-vs-nPerf-1

Drive testing misses areas where users are most likely to connect

Driving pre-configured test equipment on pre-configured routes in static, lab-like conditions has been a staple of network reporting for a long time. While drive testing removes several potentially confounding variables, this data is not representative of real users’ experiences. Using drive testing as a proxy measurement of user experience always proved troublesome, given the optimized nature of the pre-selected routes and equipment involved. When you take into consideration that 5G is an emerging technology — with limited network coverage and limited device penetration — using drive testing as a tool to back claims about how a customer may experience a 5G network is disingenuous, at best.

5G speeds are only important to measure where customers actually have access to that service. Both umlaut and Rootmetrics have reported on 5G performance in London based on drive testing results. Only the Rootmetrics report included an availability metric, which showed that while Vodafone was slightly faster in London, their 5G signal was only available on 5% of the route driven — compared to 28% for EE. Narrow measurements taken from a small number of devices, in cars, in a test environment, on a small number of routes over a small time period do not provide a sufficient sample to underpin the claim of “fastest 5G” in one of the world’s foremost cities.

drive-test-map-2

Each time a user takes a Speedtest, a snapshot of the internet is captured for that specific time, place, device and network. Because these tests are initiated by consumers when and where they need performance data, Speedtest gives users accurate information about internet speeds at the times and locations that are important to them. When aggregated, these measurements describe the network’s real-world, round-the-clock performance and its ability to meet the needs of its users. Our volume of data allows us to accurately describe and compare performance, including how much time consumers spend connected to 5G. For example, we can look at results across all devices to quantify the performance that the average user is experiencing or narrow our focus to 5G-capable devices, which allows us to fully assess the high-end capabilities offered in modern deployments.

Poor data science causes untrustworthy results

Other telecommunications data providers each have their own indices that they use when awarding “winners.” Unfortunately, most of these are based upon unclear and, at times, unsound ranking systems. From nPoints to Rootscores, compound scores hide an operator’s actual performance from consumers who simply want to know what performance they can expect. Arbitrary data periods seem altered to suit the highest bidder among network operators, device definitions are unclear, and data samples are minuscule. This produces the desirable commercial outcome for the data providers, but it does not give consumers transparent information about which operator will actually serve them best.

Basing claims on flawed data confuses consumers. Worse still, conflicting or misleading claims can substantially degrade a customer’s perception and trust in their network operator. Basing regulatory policy on this flawed data can lead to devastating consequences, such as poorly allocating government funding and deepening the digital divide for underserved populations, particularly in a world where we are all relying on connectivity more than ever before.

Good data makes for justifiable claims

As we found in our recent U.K. market analysis, the 3 network has by far the fastest median download speed over 5G in the U.K. This analysis is based on over 60,000 Speedtest results taken over 5G by more than 16,000 devices in the U.K. during Q3 2020. In all, there were over 500,000 samples of Speedtest results in the U.K during Q3 2020. EE shows the highest Time Spent on 5G by 5G-capable devices at 10.9%, with 3 coming in at a distant second and Vodafone third.

5g-median-uk-1

Squandering marketing budgets to promote claims based on unsound data or unsound methodologies helps no one — not the customer, the operator or even the company providing the unsound claim. When Ookla stands behind a claim of “fastest” or “best” network in a country, we do so only when a strict set of conditions has been met. Being a trusted source of consumer information was our first function and it remains the driver behind our mission.

Ookla retains ownership of this article including all of the intellectual property rights, data, content graphs and analysis. This article may not be quoted, reproduced, distributed or published for any commercial purpose without prior consent. Members of the press and others using the findings in this article for non-commercial purposes are welcome to publicly share and link to report information with attribution to Ookla.

| November 10, 2020

Make Better Funding Decisions with Accurate Broadband Network Data: A Guide for Federal, State and Local Governments [White Paper]

State and federal officials are charged with spending billions of dollars in funding to improve broadband availability, particularly in rural areas. While many yearly budgets had already earmarked money for broadband development projects before COVID-19, the pandemic has highlighted deep digital divides at a time when the public is more reliant than ever on the internet for work, education and other essential services.

Federal, state and local governments need accurate data on broadband availability and network performance to correctly allocate this funding to serve the most constituents. This data drives budget and spending decisions — and historically, a significant portion of these funds have been misdirected by relying on bad data.

In this new Ookla® white paper, we share a case study where misleading data from Measurement Lab (M-Lab) led a U.S. Congressional office to an incomplete picture of broadband performance in Upstate New York. The white paper also includes a guide to the key considerations a savvy policymaker should take when evaluating network data on which to base funding decisions.


Using broadband network data to understand — and close — the digital divide

The shift to working and learning from home has underscored the need for high-speed connectivity across the entire country. Many households are trying to do much more with their internet connections than they ever have before. As more family members in a household use an internet connection for teleconferencing or distance learning, their need for internet speeds will go beyond the FCC minimum guidelines of what constitutes a broadband connection: 25 Mbps download speed and 3 Mbps upload speed.

In the U.S., legislators whose districts include rural areas have long been aware of the “digital divide” created by a lack of broadband access — and the economic and educational opportunities rural communities miss out on because of this divide. While urban dwellers usually have access to high-speed connections at or near their home addresses, sometimes broadband service can be cost prohibitive. Their rural counterparts are faced with the additional challenge of a lack of connectivity in their area. To commercial internet service providers (ISPs), there is a tipping point where population density is too low to make investments in high-speed internet infrastructure profitable.

Broadband funding efforts are often focused on closing this digital divide by targeting the most under-served communities for investment and development.

The dangers of using bad data to prioritize broadband funding

The white paper explores a case study where inaccurate network performance data created an incomplete picture of broadband access in Upstate New York. In August 2020, the office of Congressman Anthony Brindisi, New York, District 22, U.S. House of Representatives, released a report highlighting the lack of broadband service across the district. New York’s District 22 (NY-22) is large, and the people of the district are somewhat evenly distributed between city and country life, with 57.5% living in urban areas and 42.5% (roughly four out of ten people) living in rural areas. Like so many rural regions of the U.S., broadband has not yet reached all constituents in NY-22.

The report provided valuable insights gleaned from constituents’ direct feedback on their connectivity, and the congressman’s office made excellent recommendations on how the district should approach improving broadband access. However, our concern with the rest of the report is that it was based on network performance test results that painted an inaccurate picture of what many constituents were actually experiencing in the district. The presented results greatly underestimated the speeds being delivered by internet service providers (ISPs) throughout most of the study area while overestimating speeds in some others. The speeds included in the report used network performance information exclusively from tests taken with M-Lab.

The speeds measured by Speedtest® for the same areas during the same time period are dramatically higher in most areas, which indicates that some constituents can already achieve network speeds that meet FCC minimums — meaning that additional infrastructure investments are unnecessary. By relying on numbers that inaccurately indicate lower speeds than reality, the congressman’s office runs the danger of targeting certain areas for funding that already have adequate broadband service. Resources are limited, and these funds should be allocated to areas that lack the connectivity needed to meet the FCC’s minimum of 25 Mbps download speed and 3 Mbps upload speed.

The table below shows comparisons of the median download and upload throughputs for the twenty ZIP codes specified in the report as having the “worst” speeds within NY-22. Looking at Ookla and M-Lab data side by side, you can see that M-Lab vastly under-reported the network throughput in every single “worst” ZIP code in the congressional report.
Ookla_NY22_slowest_zips_chart_1120

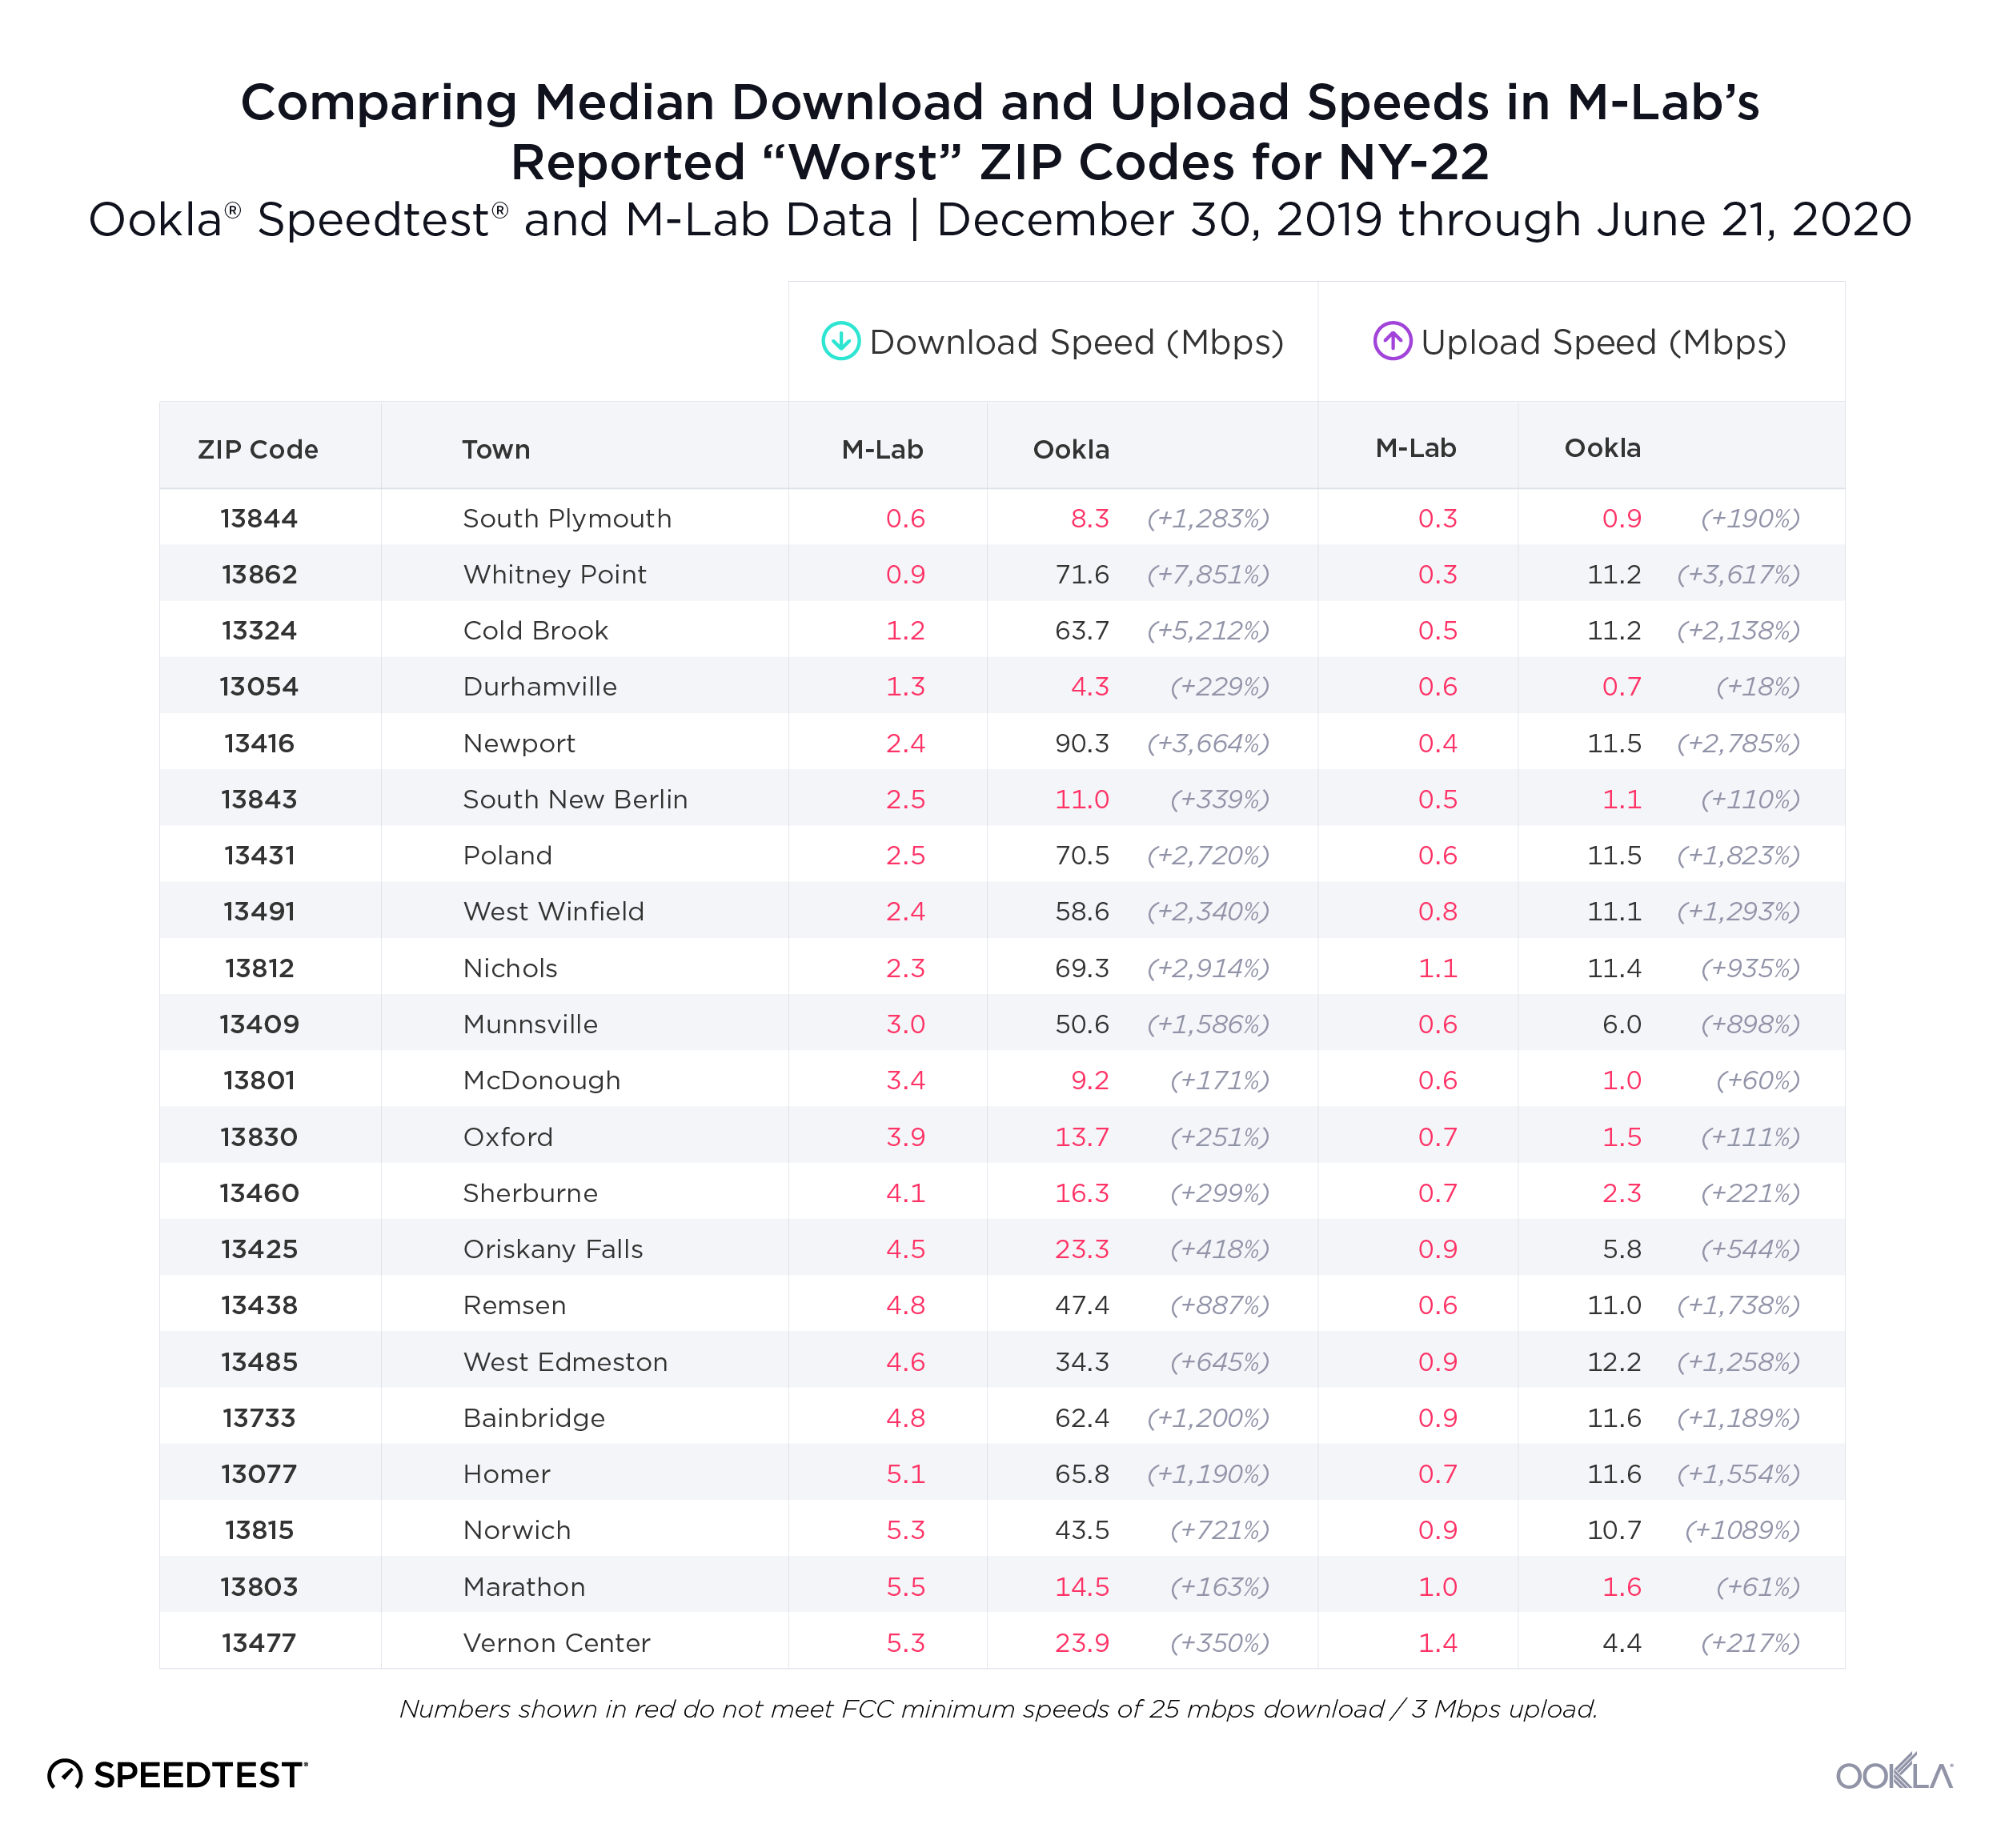
The ZIP code showing the least amount of difference between Ookla and M-Lab data was 13803 (Marathon) where M-Lab’s recorded median was 5.5 Mbps and the median from Ookla data was 14.5 Mbps. This means the typical speed in Marathon measured by Ookla’s Speedtest was over two and a half times as fast as the average measurement captured by M-Lab. On the other end of the scale, in Whitney Point, M-Lab’s recorded median was 0.9 Mbps while Ookla measured a median of 71.6 Mbps, almost eighty times faster.

Contrary to M-Lab’s data, Ookla data determined that 12 of the listed ZIP codes met the FCC minimum threshold of 25 Mbps download and 3 Mbps upload, with two additional ZIP codes falling just below the thresholds.

A policymaker looking at M-Lab’s data alone might incorrectly assume that every single listed ZIP code in the district is wildly underserved. In this case, funding may be allocated to areas that already have adequate broadband service, leaving underserved constituents without connectivity.

When bad data leads to underserved communities

In a few outlying ZIP codes, the speeds measured by Ookla were actually much slower than those measured by M-Lab. Below is a comparison of the “best” ZIP codes in NY-22, as reported by M-Lab, compared to Speedtest results.

While the majority of their data vastly under-reported network speeds, we zoomed in on one example where M-Lab’s data looked questionable in the very rural town of New Berlin (13411). M-Lab results showed a median download speed of 103.5 Mbps, but the median upload speed of 102.6 Mbps looked too good to be true. If this measurement was accurate, it would be outstanding service for such an isolated community. M-Lab’s report names New Berlin’s ZIP code the fastest in the entire district, which may have come as a shock to the residents there.
Ookla_NY22_fastest_zips_chart_1120

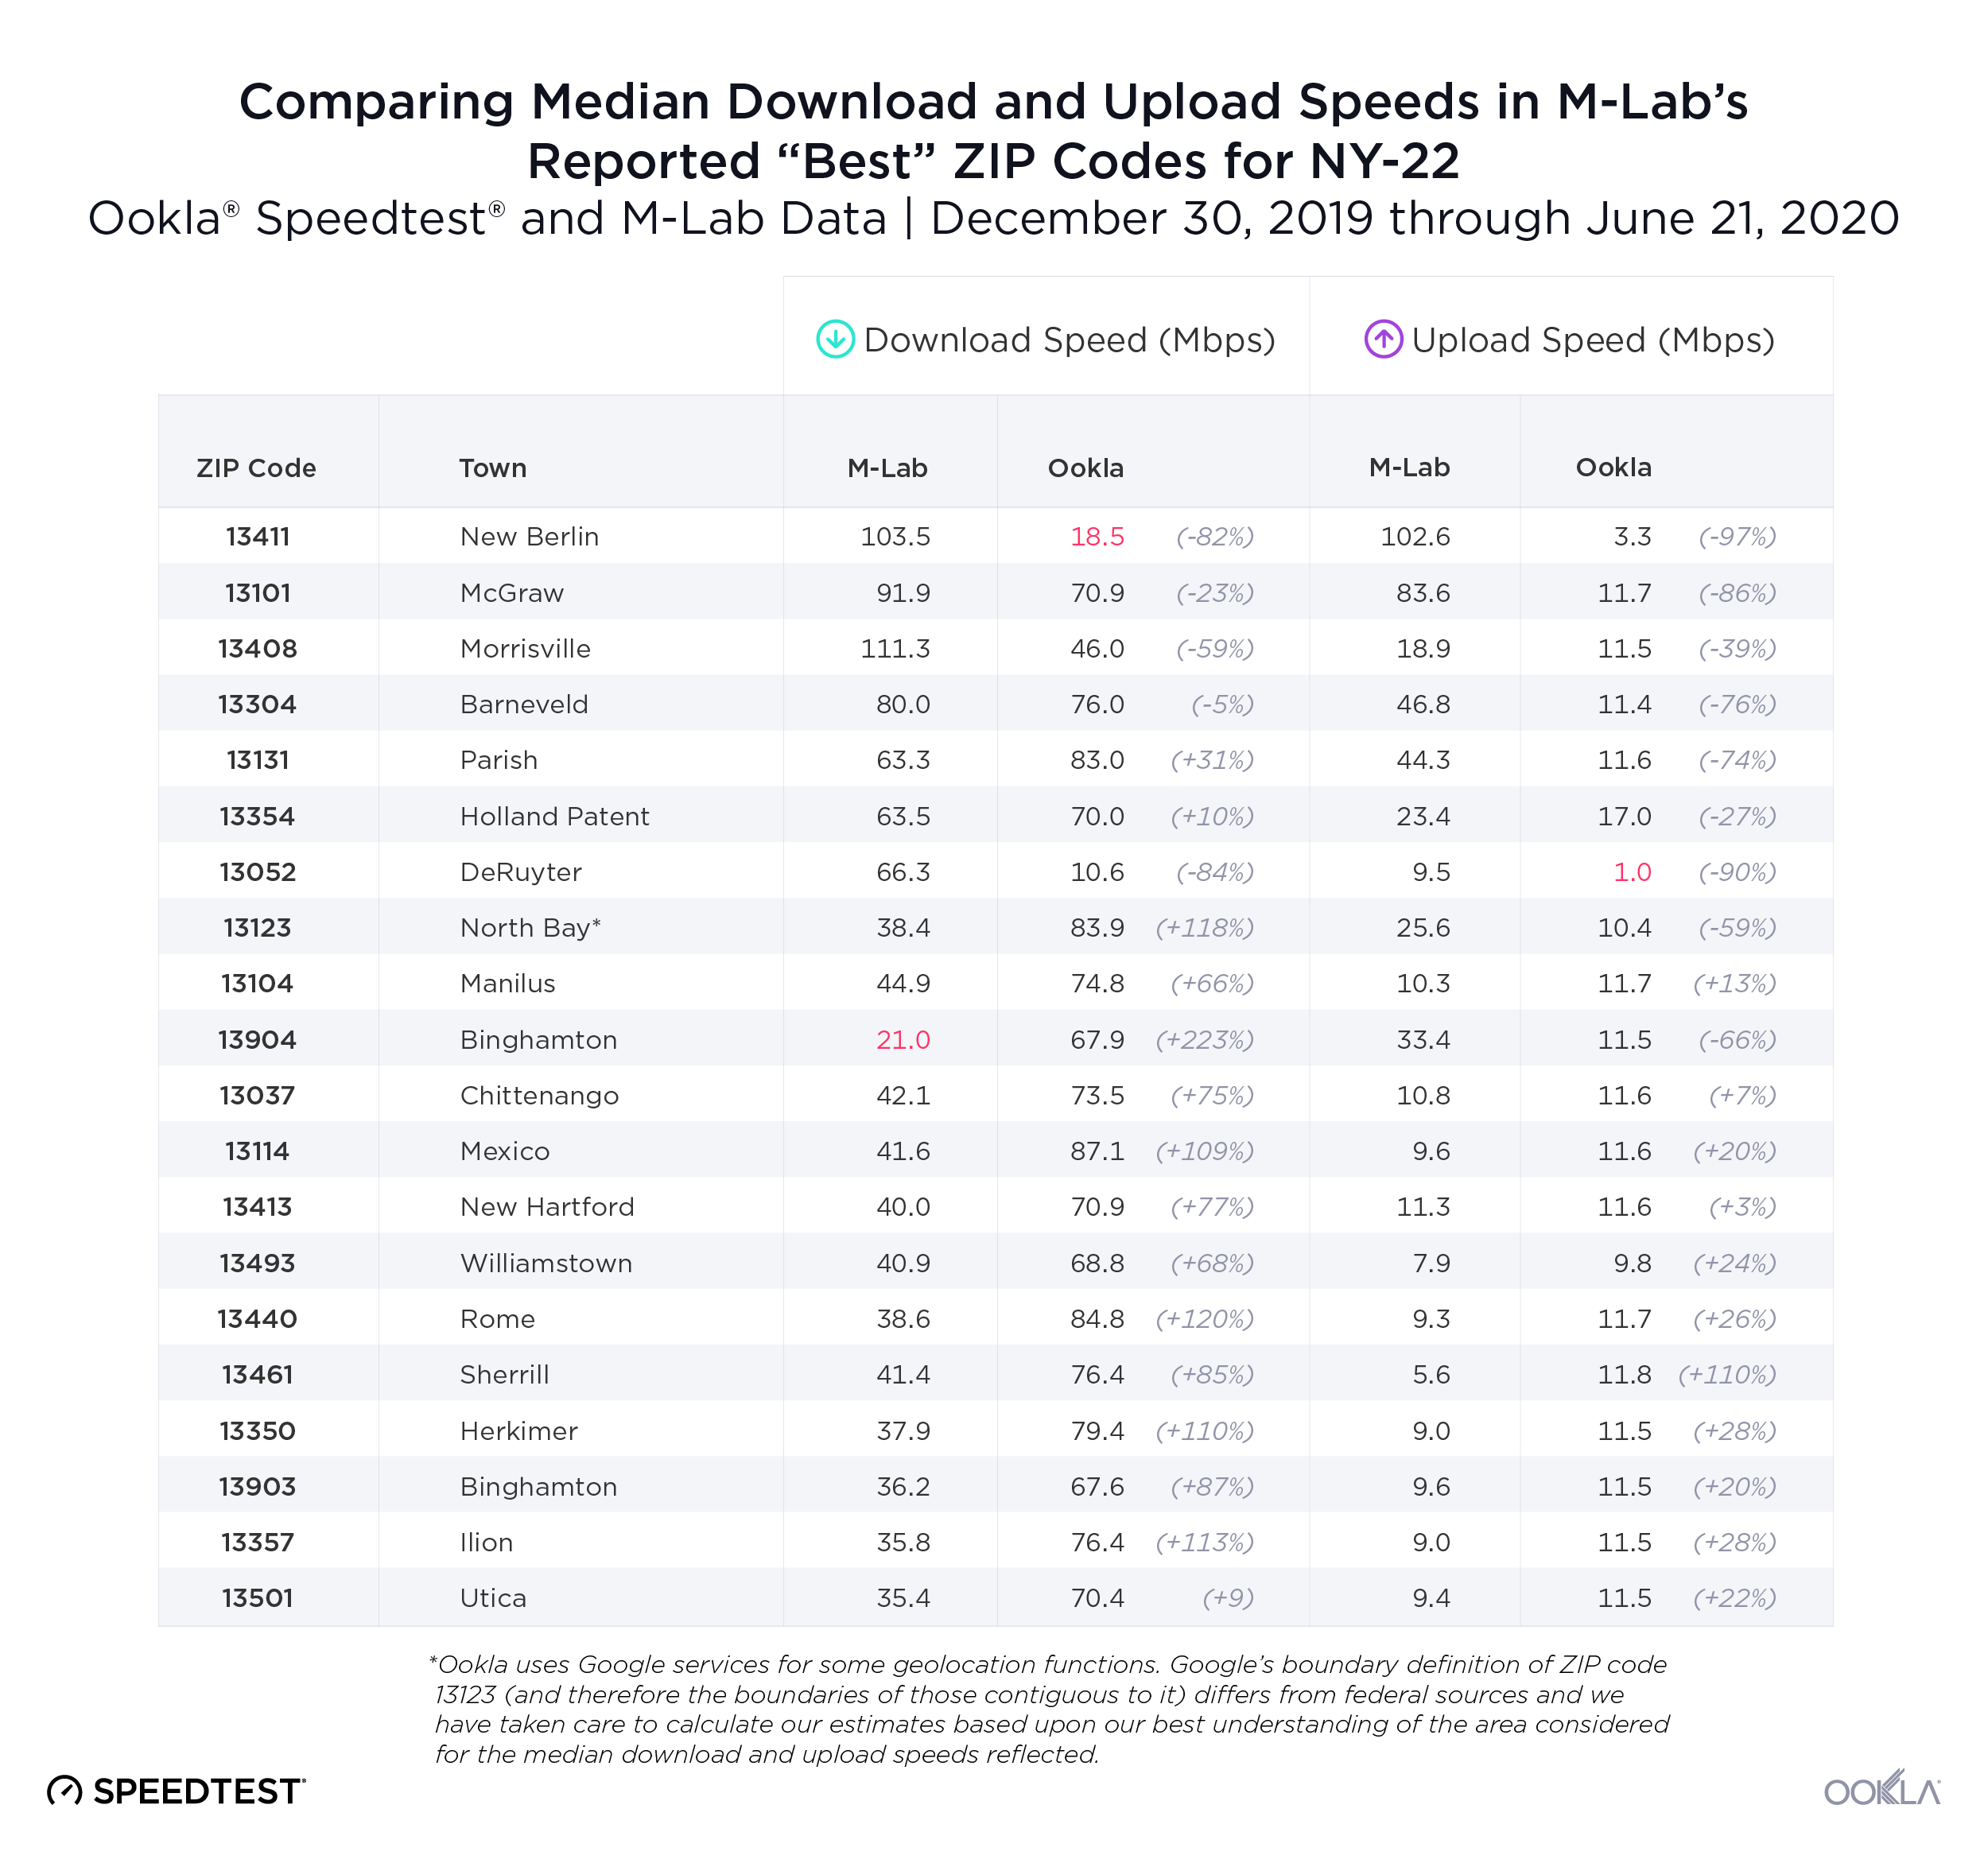
Ookla’s results for the New Berlin ZIP code show a strikingly different picture: a median download speed of 18.5 Mbps and median upload speed of 3.3 Mbps. While the upload number meets FCC minimums, the download certainly does not. If ZIP codes are used to determine eligibility for broadband funding, the M-Lab results would indicate that the area around New Berlin is not in need of broadband infrastructure assistance.

While reporting data aggregated by ZIP code is common among network testing providers like M-Lab, Ookla does not recommend using ZIP codes as an arbitrary boundary for measuring broadband performance.

ZIP codes were created for a single purpose — to efficiently deliver the mail via linear routes. While an urban ZIP code may contain several neighborhoods in the same city, rural ones can encompass several small communities many miles apart from one another. ZIP code names do not reflect every community served, and are usually named for the community that hosts the postal facility.

The disparities between network data providers

Federal, state and local policymakers need to use the most accurate, comprehensive data available on the networks when deciding where to spend broadband funding. However, not all network testing providers are created equal.

To accurately measure the download speed of an internet connection, a testing application such as Ookla’s Speedtest or M-Lab’s Network Diagnostic Tool, running on the end users’ machine, pings dedicated testing servers to send as much data as possible. The testing application then measures how much data it receives back from the servers during a period of time (usually 10 or 15 seconds).
Test2_graphic_1102

Each test requires a large enough data transfer to ensure that it fully saturates the network connection and measures the full throughput capability. With ISPs offering high-speed connectivity such as optical fiber to the home, this problem is only getting worse. These connections are able to handle speeds between 1 and 2 Gbps, roughly 40 to 80 times more than the minimum broadband speed of 25 Mbps.

Some network testing providers, however, do not have adequate testing infrastructure to account for normal demand on the network, and thus are incapable of accurately measuring peak network speed.

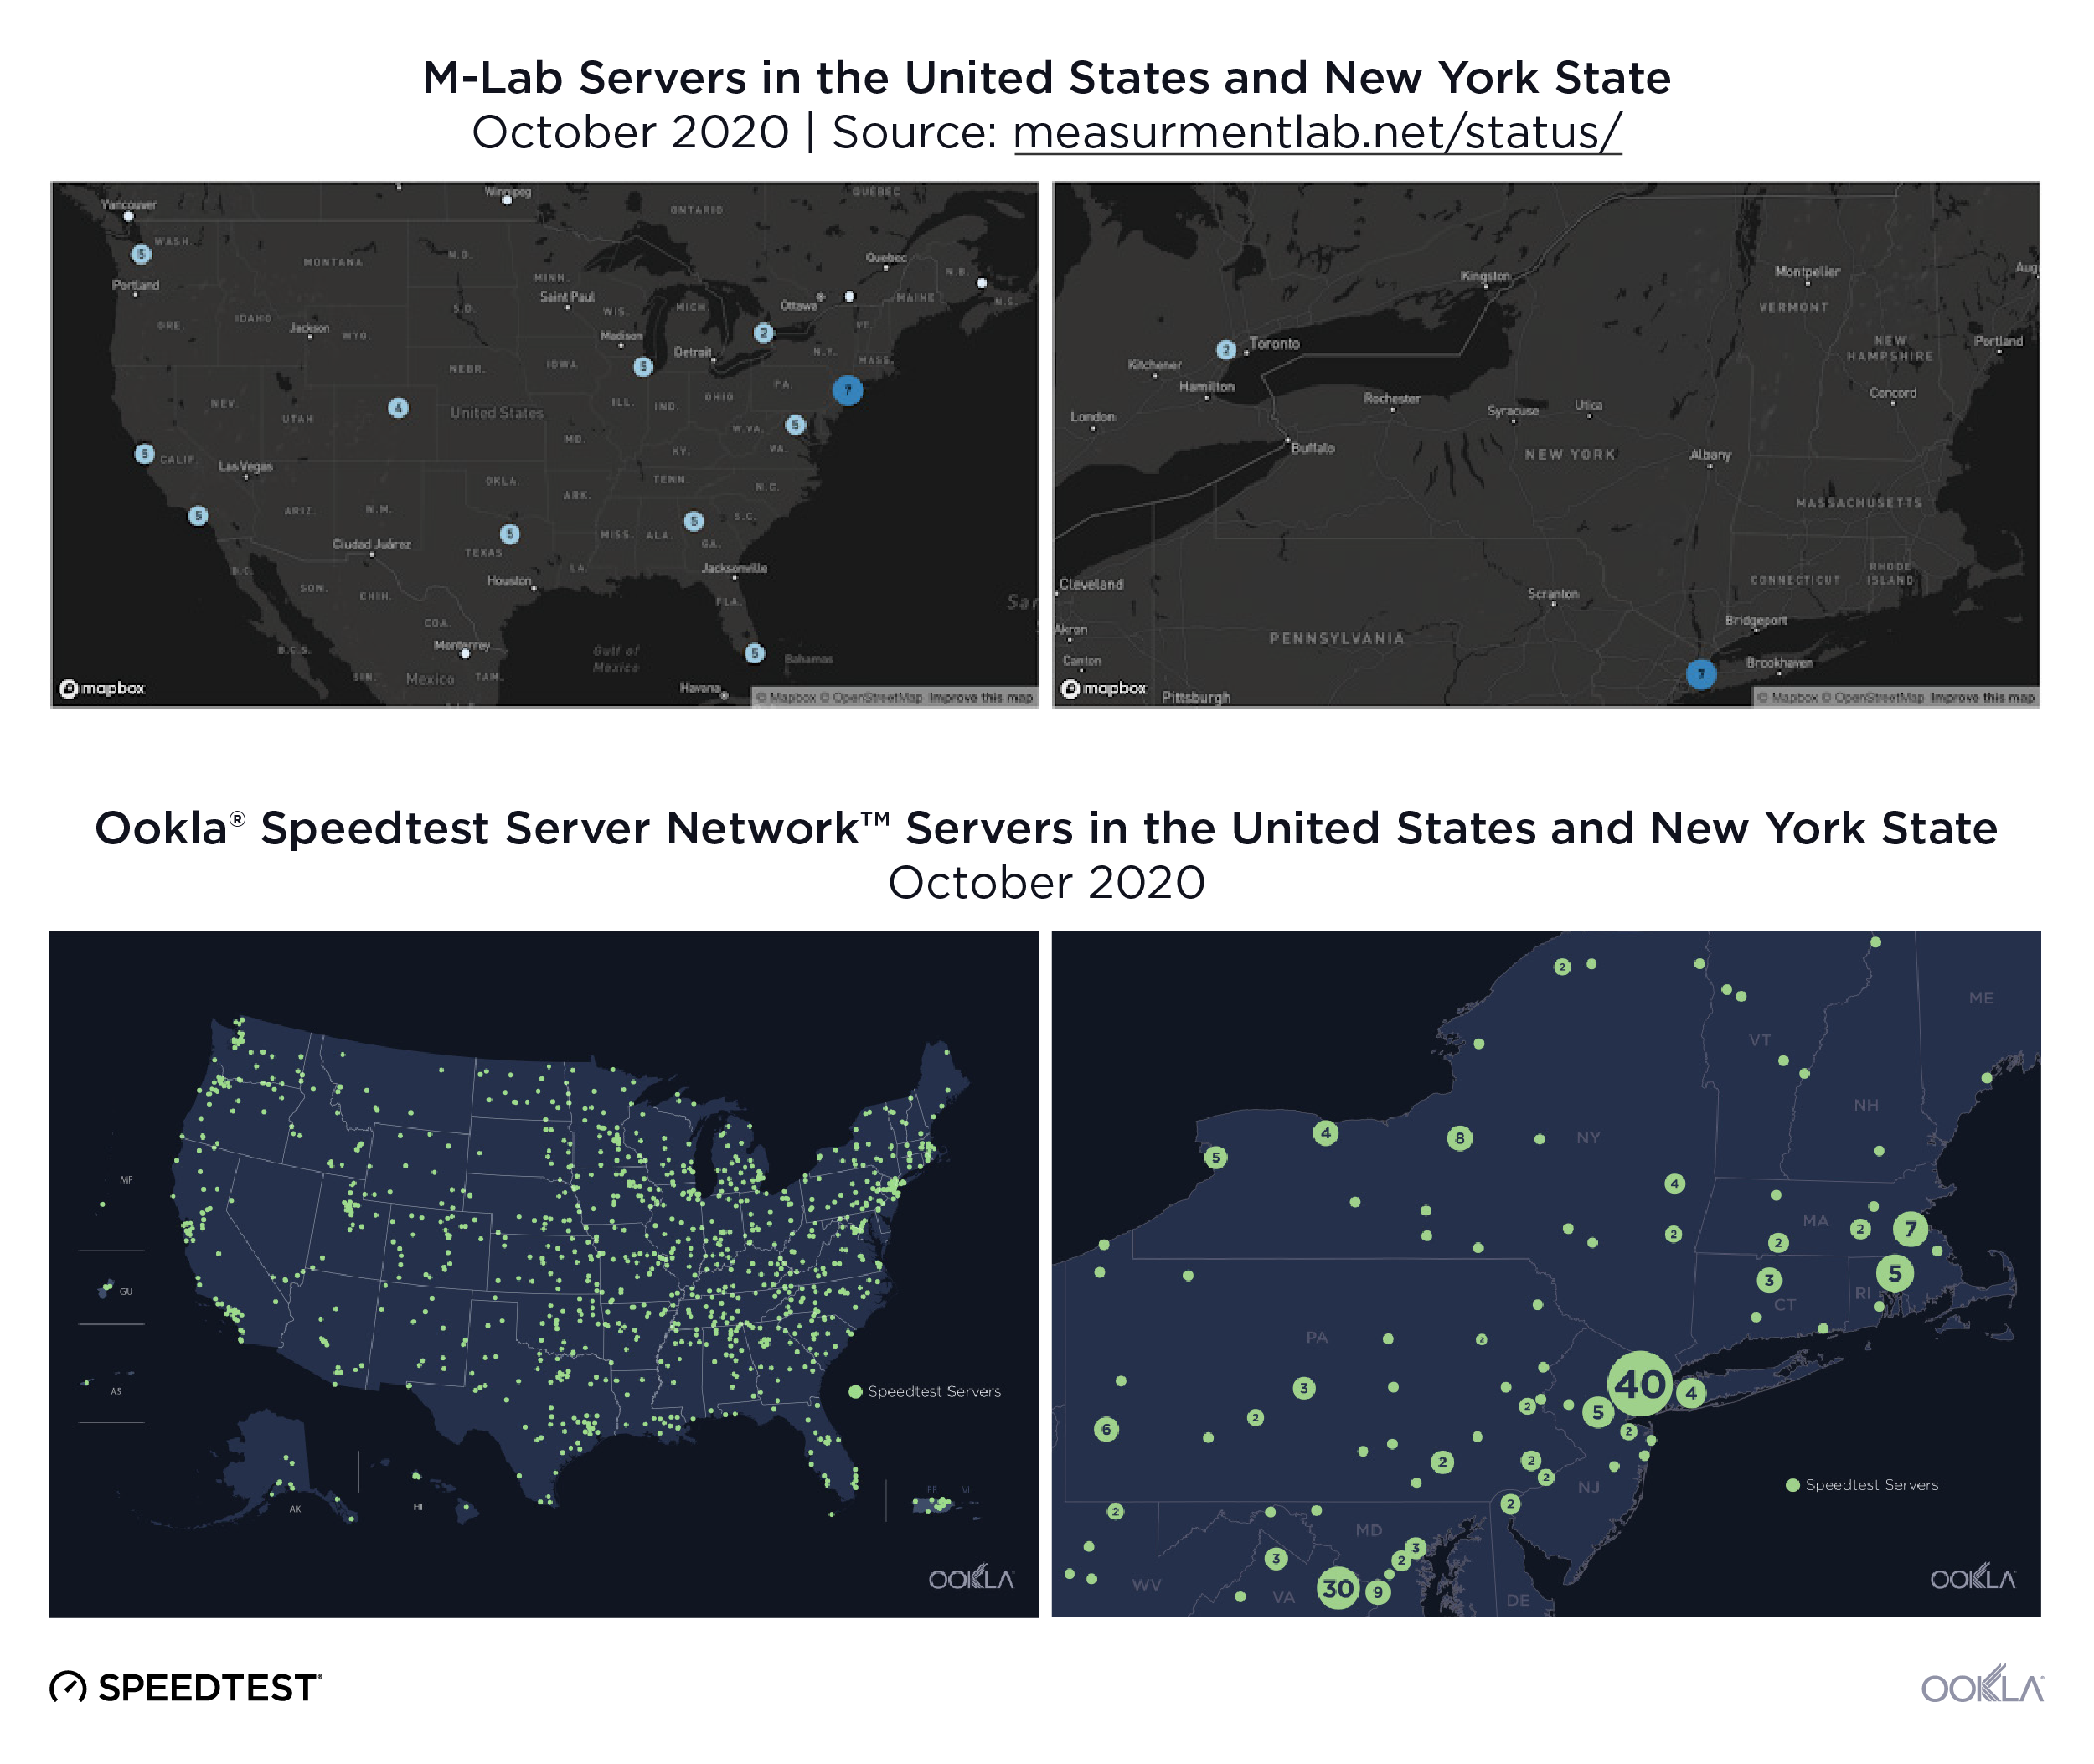
Since M-Lab is a Google partner, search engine results drive traffic their way for performance testing. This is not because they are the best test, but because of the relationship between the two organizations. In fact, M-Lab’s testing infrastructure is extremely limited in a way that produces inferior testing outcomes. Currently, M-Lab has fewer than 60 servers across the entire United States listed on their infrastructure map below (with no servers shown in Alaska, Hawaii or the U.S. territories.)

The Speedtest Server Network™ was purpose-built to manage a global scale of volume, with testing servers strategically located in every country and most major population centers. We have over 12,000 servers in the network, with more than 1,600 in the United States and 68 servers in New York State alone.
Ookla_server-location-comparison_US_NY_1120

When a user takes a test through M-Lab, the test measures the speed between the user’s device and a single — and often distant — server. When data travels between the user’s device and a distant server it may have to traverse many network “hops” (when a packet of data is passed from one network segment to the next) to get there. The additional lag time this introduces to the test results can negatively impact the user’s perception of the local network’s performance. If the server being used for that specific test is also trying to run many other tests at the same time, it may not have sufficient capacity to provide an accurate result. If there are multiple users simultaneously testing their high-speed connection, the tests might consume all the available throughput from a single test server, thus denying other users the capacity required to measure their own connection. Simply put, M-Lab’s infrastructure is insufficient for internet performance testing in the modern era.

Learn how bad data can negatively impact government funding

There are billions of dollars of federal, state and local government funding at stake — not to mention the educational opportunities and livelihoods of millions of constituents. It is critical that policymakers vet their data sources to fully understand the broadband landscape in their jurisdictions — and prioritize spending to best serve their most vulnerable constituents.

Download the full white paper to learn the five considerations every policymaker should take into account when evaluating data sources for their broadband funding decisions.

Ookla retains ownership of this article including all of the intellectual property rights, data, content graphs and analysis. This article may not be quoted, reproduced, distributed or published for any commercial purpose without prior consent. Members of the press and others using the findings in this article for non-commercial purposes are welcome to publicly share and link to report information with attribution to Ookla.

| November 23, 2020

5G Advances Across the U.K., but Access Varies Widely by Country

The United Kingdom has seen considerable advances in 5G during the past year, but access to this emerging technology continues to be uneven across countries of the U.K. Looking at Q3 2020, data from Speedtest Intelligence® and Ookla Cell Analytics™ reveals how 5G affected overall mobile speeds, which country had the fastest 5G and where access was lacking. We also shed light on which operator had the fastest 5G in the U.K. as a whole and in London, specifically.

5G is 518% faster than 4G in the U.K.

5G speeds in the U.K. far exceeded those on 4G during Q3 2020 with the mean download speed over 5G coming in 517.8% faster than median download speed over 4G. The U.K’s mean upload speed over 5G was 121.5% faster than that over 4G.

Mean Mobile Speeds in the United Kingdom
Speedtest Intelligence® | Q3 2020
5G Download (Mbps) 5G Upload (Mbps) 4G Download (Mbps) 4G Upload (Mbps)
United Kingdom 186.97 21.38 30.26 9.65

Scotland had the fastest 5G download speed

Scotland brought up the national average for 5G speeds in the U.K. during Q3 2020 with a 6.1% faster mean download speed than we saw in the U.K. as a whole. England was the second fastest country in the U.K. for mean download speed over 5G and Wales was third. While 5G download speeds were promising in Northern Ireland, the volume of data did not meet our rigorous sampling guidelines. We’ll be interested to see how speeds there develop as more users access the networks.

Mean Mobile Speeds in the United Kingdom
Speedtest Intelligence® | Q3 2020
5G Download (Mbps) 5G Upload (Mbps) 4G Download (Mbps) 4G Upload (Mbps)
England 184.48 21.49 31.05 9.69
Scotland 198.39 22.05 28.60 9.87
Wales 171.12 21.49 26.26 9.02

Three was the fastest operator for 5G in the U.K.

As we’ve previously reported, 3 was the fastest mobile operator over 5G in the U.K during Q3 2020 with a median download speed of 201.12 Mbps. EE had the highest percentage of 5G Time Spent (when subscribers’ 5G-capable devices are connected to 5G).

How operators in the U.K. are using spectrum for 4G

The distribution of low, mid and high spectrum bands is evenly spread across all mobile operators in the U.K. All four operators hold licenses in the 800 MHz frequency band, while Vodafone and O2 hold additional 900 MHz licenses — some of which are still used to support the legacy 2G and 3G services. Three and Vodafone hold 20 MHz each of the 1500 MHz supplemental downlink band 32, and all four operators hold 1800 MHz and 2100 MHz licenses. It’s worth noting that EE holds a massive 40 MHz contiguous slice in the 1800 MHz band and 20 MHz in the 2100 MHz band.

O2 holds an additional 40 MHz contiguous spectrum block in the 2300 MHz (TDD) band. In the 2600 MHz capacity band, O2 holds a single 20 MHz block, Vodafone holds two 20 MHz blocks, while EE operates on a whopping 50 MHz slice of spectrum.

Given the spectrum distribution in the mid- and high-capacity bands, and the increased proliferation of devices with modern chipsets capable of aggregating multiple LTE component carriers, it’s fairly easy to see why EE has been able to consistently deliver the fastest LTE speeds in recent years.

5G-specific spectrum allocation in the U.K.

When it comes to 5G, all operators have deployed 5G non-standalone networks in the 3.5GHz to 3.6GHz band (n78). EE and O2 operate their 5G networks using 40 MHz slices, Vodafone holds a 50 MHz license, while 3 was able to secure a 100 MHz license during the 5G auction — the largest possible channel width defined for FR1 networks. Given the massive advantage over its 5G competitors, 3 is able to consistently deliver the fastest 5G speeds.

The upcoming Ofcom spectrum auction in early 2021 should offer additional capacity in the 3.6-3.8 GHz range as well as the 700 MHz band, which should enable much wider 5G coverage across the U.K. Devices capable of aggregating low and mid 5G spectrum bands are also expected in the first half of 2021, which should allow operators to efficiently roll out standalone 5G and deliver broader 5G coverage with even faster speeds and ultra low latency.

England has the majority of 5G deployments in the U.K.

The Ookla 5G MapTM showed 5G deployments in 199 cities or towns in the U.K. as of November 4, 2020. 5G was commercially available in 176 English cities, and there were 14 5G cities or towns in Scotland, five in Wales and four in Northern Ireland.

This compares with 29 5G cities in the whole U.K. at this time last year: 22 in England, three each for Scotland and Wales and one in Northern Ireland.

Ookla_UK_5G_Deployment_Map_1120

5G coverage varies by operator

Not all operators are deploying 5G cell sites in the same areas. Data from Cell Analytics measures where customers of each operator are accessing 5G and how strong that 5G signal is in each area. The following maps show 5G signal strength greater than -110 dBm for each operator.

Ookla_UK_Coverage_3_1120

Ookla_UK_Coverage_EE_1120-3

Ookla_UK_Coverage_O2_1120-3

Ookla_UK_Coverage_Vodafone_1120-3

Three and EE show larger areas of measured coverage in most parts of the U.K., especially in and around Belfast, Birmingham and London. Vodafone shows a larger area of coverage around Glasgow and Newcastle upon Tyne. O2 shows a much smaller coverage area with clusters in and around Belfast, Leeds and London.

London’s 5G download speed was slower than the national average

London saw a mean download speed over 5G of 167.06 Mbps in Q3 2020, 10.6% slower than that in the U.K. as a whole. London’s median 5G upload speed of 22.92 Mbps was 7.2% faster than that in the U.K as a whole.

Mean 5G Performance in London
Speedtest Intelligence® | Q3 2020
Download (Mbps) Upload (Mbps)
London 167.06 22.92

We’d like to be able to report which country’s capital city had the fastest 5G, but this technology is still emerging and there were not enough samples to responsibly determine a winner outside of London. We will be watching these markets carefully and will report back when there is additional information.

Three was the fastest operator in London

Three showed the fastest mean download speed over 5G among mobile operators in London during Q3 2020. O2 was second, an important distinction as many other data providers do not have sufficient samples to include O2 in their analyses. Vodafone was third and EE fourth.

5G Performance by Operator in London
Speedtest Intelligence® | Q3 2020
Operator Mean Download (Mbps) Mean Upload (Mbps) Top 10% Download (Mbps) Top 10% Upload (Mbps)
3 196.02 18.93 362.46 43.74
O2 181.19 15.55 289.65 24.35
Vodafone 166.77 25.50 288.17 41.42
EE 142.86 26.83 245.73 52.21

We also analyzed the fastest 10% of Speedtest results over 5G for each operator to evaluate what speeds each network is capable of reaching at this time. Three had the fastest download speed in this category by far and EE led for upload speed.

England showed the highest time spent on 5G

Ookla_UK_5G_Time-Spent_Map_1120-3

We calculated the proportion of time that users with 5G-capable devices spent on 5G in the United Kingdom and found that England had the highest 5G Time Spent during Q3 2020 at 5.6%. This was higher than the average 5G Time Spent for the U.K. of 5.3%. Scotland had the second highest 5G Time Spent in the U.K. at 3.0% and Wales was third. As above, we have not included data for Northern Ireland because samples were too few. 5G Time Spent includes time spent on both 5G and 5G roaming.

While the rapid spread of 5G across the U.K. is exciting and speeds are promising, the benefits of 5G are spread unevenly across the nation — and time spent on 5G is still very low. We’ll be excited to see this technology expand and to analyze how 5G improves mobile performance across the U.K.

Ookla retains ownership of this article including all of the intellectual property rights, data, content graphs and analysis. This article may not be quoted, reproduced, distributed or published for any commercial purpose without prior consent. Members of the press and others using the findings in this article for non-commercial purposes are welcome to publicly share and link to report information with attribution to Ookla.

| September 16, 2021

How to Challenge the FCC’s Mobile Service Funding Eligibility Decisions [Webinar]


As part of the initiative to bring advanced wireless services to unserved areas in rural America, the Federal Communications Commission (FCC) is in charge of allocating billions of dollars in funding to mobile network operators. Funding eligibility is based on broadband availability data submitted by mobile operators and aggregated into coverage maps by the FCC. FCC coverage maps often overstate the availability of networks in some areas because operators show their footprint expanding to locations where they have minimal coverage. The FCC has introduced a new Mobile Service Challenge Process to help address this issue.

Register for our September 30 webinar to learn more about the Mobile Service Challenge Process and how to challenge FCC coverage maps with crowdsourced coverage information.


What is the Mobile Service Challenge Process?

The FCC’s Mobility Fund Phase II would have allocated up to $4.53 billion for mobile operators to bring 4G LTE to rural America. Unfortunately, the program was suspended in 2019 due to a finding that coverage data submitted by three providers likely overstated actual coverage in many instances.

In 2020, the The Broadband DATA Act was signed into law and required the FCC to improve the way broadband data is collected, verified and reported. In response to The Broadband DATA Act, the FCC recently released a Public Notice that proposes procedures for testing the accuracy of carrier coverage maps and outlines a Mobile Service Challenge Process.

The Mobile Service Challenge Process will allow operators to challenge FCC broadband data using crowdsourced network performance tests that show an “on-the-ground” truth that differs from the FCC coverage map. Challenging parties are required to present a sufficient number of tests within a hexagon to illustrate gaps in carrier coverage.

Using Ookla® data to contest FCC funding decisions

This article will explore how Ookla data and targeted field testing can be used to contest coverage data that determines funding eligibility. Register for our September 30 webinar to learn more about navigating the FCC’s Mobile Service Challenge Process.

Determine where on-the-ground truth differs from FCC data

A comparison of Ookla Cell Analytics™ data with FCC coverage data shows where there are discrepancies and underserved areas. Operator-provided coverage data is shown in the FCC’s Mobile LTE Coverage Map below. Looking at State Highway 119 near the popular Golden Gate Canyon recreation area in north central Colorado as an example, we can see that AT&T and Verizon both claim to have 4G LTE coverage on the majority of the highway.

fcc_hwy119_lte_map_0921

However, the crowdsourced measurement data in Cell Analytics shows poor signal quality along State Highway 119. In the image below, you can see that both AT&T and Verizon have significant areas with no service along the highway. This indicates that the on-the-ground truth may be different from the FCC coverage maps.

ookla_cell-analytics_hwy119_lte_map_0921

Perform targeted walk or drive tests within an underserved area

Once you’ve determined that State Highway 119 is likely an unserved area, you can use Ookla Wind™, a handset-based testing solution, to perform a targeted data collection campaign within the hexagon to confirm network availability, signal strength, throughput and other KPIs. The images below show drive tests performed on the AT&T and Verizon networks along Highway 119. The results show that the signal strength is very weak (shown in red) along most of the route. You can use this data to fill out the FCC challenge process. Once the area has officially been determined as eligible for funding, you can bid for funding allocation.

ookla_wind_hwy119_lte_map_0921

ookla_wind_hwy119_vzw_lte_map_0921

Validate your improved coverage and throughput

After you’ve received FCC funding to build out new infrastructure in a rural area, you’ll need to prove that you’ve used those funds properly. Cell Analytics can also be used to validate KPIs like improved coverage and faster throughput on your network within that area. The ability to show the outcome of these enhancements could help you secure more funding in the future.

Cell Analytics and Wind will equip you with the real-world network performance data that you need to challenge FCC eligibility decisions and influence funding allocation. To learn more about navigating the Mobile Service Challenge Process, tune into the webinar on Thursday, September 30 at 7 a.m. Pacific (10 a.m. Eastern). A recording will be provided for registrants who can’t make the live presentation. Register now.

Ookla retains ownership of this article including all of the intellectual property rights, data, content graphs and analysis. This article may not be quoted, reproduced, distributed or published for any commercial purpose without prior consent. Members of the press and others using the findings in this article for non-commercial purposes are welcome to publicly share and link to report information with attribution to Ookla.

| September 28, 2021

TRAI Attempts to Kick-Start the Indian Fixed Broadband Market


Key takeaways

  • New fixed broadband speed categories of “Basic”, “Fast” and “Super-fast” throw the performance of Indian States under the spotlight.
  • Ookla® Speedtest Intelligence® data shows only 2.5% of current Indian fixed connections fail to meet TRAI’s new 2 Mbps broadband grade.
  • Delhi tops the list for “Super-fast” broadband connections (>300 Mbps), but that equates to a mere 1.5% of its connections; the remaining states fare worse, with Sikkim recording zero.
  • Rajasthan tops the list for “Fast” broadband connections (50 Mbps – 300 Mbps) at 45.9% of connections, while Gujarat and Maharashtra lag far behind with 19.8% and 25.8%, respectively.
  • Rural locations fare worse than urban, but the gap is not as large as expected, with 3.4% of rural connections failing to achieve broadband speeds, versus 2.3% of urban connections.

TRAI redefines broadband in India

TRAI, the Telecom Regulatory Authority of India, recently published a raft of recommendations as part of a “RoadMap to Promote Broadband Connectivity and Enhanced Broadband speed.” These are designed to help achieve the goals of the National Digital Communications Policy (NDCP-2018), which targets universal broadband provision of 50 Mbps, as well as breaking into the top-50 of the ITU’s ICT Development Index, by 2022.

The most prominent of these recommendations targets increased fixed broadband network rollout and adoption. According to TRAI, current broadband penetration levels in India are approximately 55%. Mobile accounts for the lion’s share of this, having grown strongly since the launch of 4G, while the Indian fixed broadband market remains underpenetrated, at approximately 9.1% of Indian households at the end 2020.

The details include a wide range of proposals designed to alleviate network deployment challenges, in particular relating to Right of Way (RoW) permissions, as well as encouraging India’s multitude of cable TV providers to offer broadband services. In addition, TRAI proposed a pilot Direct Benefit Transfer scheme, to subsidize broadband service in rural locations. Beyond these proposals, TRAI also recommended:

  • A change to India’s definition of broadband (for fixed and mobile), increasing from the current 512 Kbps to 2 Mbps from the point-of-presence (POP) of the service provider, to the subscriber
  • New categories of fixed broadband speed beyond this new baseline, including:
    • “Basic” (2-50 Mbps),
    • “Fast” (50-300 Mbps) and
    • “Super-fast” (>300 Mbps)

TRAI’s new speed tiers to drive improved internet performance

New speed tiers align India with ITU’s IDI Index

For TRAI, the introduction of a new minimum speed alongside speed tiers, helps it bring its definition of broadband into the present, while also allowing it to monitor and report on a key plank of the NDCP-2018 — India’s advancement up the ITU’s ICT Development Index (IDI).

Broadband definitions vary widely around the world in terms of throughput , from the original OECD definition of a minimum of 256 Kbps, which is still used in many markets, to markets such as the U.S., where even the current minimum of 25 Mbps download and 3 Mbps upload is no longer considered sufficient. Part of the rationale for TRAI’s recommended increase to the minimum download speed is that the 512 Kbps threshold introduced in 2013 can no longer handle even basic internet use cases. This has been thrown into sharp relief by the pandemic, which forced an unprecedented number of people to learn and work from home. In effect, traffic inflation has raised the minimum download speed for basic internet services in TRAI’s estimation to 2 Mbps. Furthermore, the introduction of speed tiers will allow Indian broadband performance to be linked to a new indicator the ITU has introduced within its ICT Development Index (IDI), in which the Indian Government is targeting a top-50 place by 2022.

Vast majority of fixed broadband connections already meet the new minimum speed threshold

Speedtest uses the Speedtest Server Network™, a global network of high-performance servers, ready to test the maximum sustained throughput of the user’s connection (download and upload speeds) and report back on key network health metrics. There are Speedtest servers in virtually every country and major population center worldwide, which means we can accurately reflect the service provided from the operator’s POP to the end-user. Our data shows only 0.5% of Indian fixed subscribers did not have access to broadband speeds under the old definition. The new definition doesn’t shift the needle much, increasing that underserved proportion of subscribers to 2.5% as of Q2 2021.

ookla_consumer-percentage_india_0921-01

The natural conclusion from the above chart is that TRAI should consider a higher speed threshold for its definition of broadband. When the United States Federal Communications Commission (F.C.C.) changed their definition of broadband in 2015, the proportion of U.S. households without access to broadband speeds hit 20%. However, with fixed broadband penetration in India below 10% of households, TRAI’s new definition serves as a marker in the sand, designed to track performance as the fixed broadband market begins to unlock.

Much emphasis is placed on the myriad of cable TV providers already present in the market, with TRAI’s recommendation on AGR fees, alongside other remedies, designed to encourage them to branch out and provide broadband to their customer bases. However, as detailed in TRAI’s submission to the DoT, many of these cable companies are sub-scale and rely on out-dated network infrastructure. If and when they start signing up internet customers, we may well see the proportion of users that fall below the broadband definition increase.

Wide variation in performance among Indian states

Access to India’s new broadband speed categories varies widely from state to state. The new minimum threshold for broadband only renders an additional 2% of households without access to broadband speeds, however this is skewed by India’s more populous states and cities. At a state/union territory level, this value varies from a low of 1.6% in Delhi, to a high of 7.6% in the largely rural State of Sikkim. This split continues when we look at the new broadband speed categories, with over 70% of connections in the States of Gujarat and Maharashtra falling into the “Basic” speed category, while almost half of connections in the States of Delhi, Rajasthan, Tamil Nadu, Chandigarh and Kamataka were at least “Fast” (>50 Mbps). The availability of “Super-fast” broadband in India is very low, ranging from a high of 1.5% of connections in Delhi, to 0% in Sikkim.

ookla_consumer-percentage_india_states_0921-01

Urban-rural performance gap not as wide as expected

Indian fixed broadband penetration remains low and is heavily skewed towards urban areas. While 65.1% of the Indian populace live in rural areas (based on World Bank estimates for 2020), TRAI data shows that they account for a mere 5.6% of total fixed broadband connections. A comparison of Speedtest Intelligence data against rural and urban locations (based on India’s 2011 census) fails to show a large disparity between the two when looking at TRAI’s new speed categories, with 58.7% of connections in urban areas falling within the “Basic” speed category, compared to 61.7% in rural areas.

ookla_consumer-percentage_india_urban_0921-01

A more detailed segmentation of performance between rural and urban areas shows a wider performance gap, with rural locations tending to have a higher proportion of connections supporting speeds of less than 25 Mbps, while urban locations had a much higher share of connections with speeds greater than 100 Mbps. This is understandable given the lack of a modern fixed network infrastructure in many parts of rural India, coupled with challenges that the country’s ambitious BharatNet infrastructure project has encountered.

Our data shows that many connections currently sit at the boundary between “Basic” and “Fast” broadband, and this should serve as encouragement to India’s providers to boost fixed network performance and thereby drive mass market adoption of “Fast” broadband.

New speed categories to provide more clarity on network performance to Indian consumers

In addition to driving faster speeds and improved availability of fixed broadband, these changes will bring more clarity for Indian consumers when selecting a fixed broadband subscription. At Ookla, we’re fully aware that reporting on network speeds helps spur network operator competition and infrastructure investment. Introducing speed categories goes one step further, as operators in countries that have implemented this will naturally begin to include these speed categories in their marketing and products. They will also target network investment at increasing the proportion of their footprint that supports higher-tier broadband speeds.

For the Indian government and TRAI, this move will provide much needed visibility into the state of broadband within India, to better track performance and the reach of different access technologies, and to target and tweak remedies and incentives to spur further adoption.

Ookla retains ownership of this article including all of the intellectual property rights, data, content graphs and analysis. This article may not be quoted, reproduced, distributed or published for any commercial purpose without prior consent. Members of the press and others using the findings in this article for non-commercial purposes are welcome to publicly share and link to report information with attribution to Ookla.

| November 30, 2021

5G in Europe: EU Targets Require a Rethink

Monitoring progress of the EU’s Digital Decade

We recently attended the European 5G Observatory’s workshop, “5G in the Digital Decade,” which provided an overview of progress towards the EU’s 5G Action Plan targets and also looked ahead to the new targets as set out in the EU Digital Decade. The European Commission presented its vision of the region’s Digital Decade in March 2021, providing targets (the Digital Compass) for the digital transformation of Member States by 2030. Progress towards these targets is measured through the existing Digital Economy and Society Index (DESI), a key component of which focuses on connectivity. The relevant 2030 goals here are to provide Gigabit access to all EU households and 5G coverage in all populated areas.

The connectivity component of DESI is made up of a mix of demand and supply-side factors, including fixed and mobile broadband coverage and take-up, 5G spectrum availability and broadband pricing. The latest iteration was published in November using 2020 data, with Denmark, the Netherlands and Spain securing the top three spots for connectivity, and Greece and Bulgaria the bottom two.

ookla_desi_eu_markets_1121-01

As 5G evolves, so should the Commission’s 5G targets

The Commission’s DESI has evolved from its inception in 2014 to now track the Digital Compass’ targets. However, 5G is a rapidly evolving technology, and it was clear from the discussion during the Observatory’s workshop that there will be a need to review the actual targets and by implication the measurement criteria. The key concern lies in the “5G everywhere” target, both from a coverage and a performance perspective. As the end goal is the digital transformation of Member States, 5G coverage should be extended beyond the current target of all populated areas, to provide greater geographical coverage — in particular to support emerging vertical industry needs, for example in agriculture or logistics.

In terms of 5G performance, the ITU’s IMT-2020 requirements are for a user-experienced data rate of 100 Mbps download and 50 Mbps upload. However, not all 5G networks are created equally. The increasing use of dynamic spectrum sharing (DSS) means that operators can boost 5G coverage and capacity by using existing spectrum formerly dedicated to other generations of mobile technology. As a result, network performance will vary widely based on the bands used. There are also differences in 5G rollout, with initial 5G radio equipment tending to be deployed on existing tower infrastructure, and the coverage of higher capacity C-band spectrum will be limited relative to that of lower frequency bands as result.

ookla_median-download-speeds_europe_1121-01

Divergence between the DESI and end-user internet speed

What’s also interesting are the outliers and how their performance differs from their position within the DESI. Bulgaria (which came second to last in the connectivity portion of the DESI), does lag behind the European average on fixed broadband speeds, but is significantly faster on mobile speeds. Bulgaria’s median mobile download speed of 83.71 Mbps makes it the seventh fastest market globally. The reverse is true for Spain, which came third in the DESI, and where median fixed download speeds of 118.25 Mbps are well above the European average, putting it in 11th place globally, but where mobile speeds of 34.63 Mbps lag well behind the European average, and place it 51st globally. Other examples of divergence between the DESI and actual internet speeds on the ground include markets such as Belgium, Cyprus, Estonia and Lithuania.

To support Member States, the Commission has proposed a “Path to the Digital Decade”, a governance framework which in addition to the development of roadmaps at a Member State level and regular reporting on progress, will also include a framework to address progress shortfalls and support for multi-country projects. Member States have been encouraged to make use of the Recovery and Resilience Facility, an EU-wide fund of EUR 723.8 billion designed to mitigate the impact of the COVID-19 pandemic, from which they are required to devote at least 20% of their allocation to digital projects. As of October 2021, digital investment plans totalled 26% of the fund, of which 11% is dedicated to connectivity. With such significant public funds directed at improving connectivity, and the digital services that it underpins, the Commission must ensure that its targets and measurement methodology keep pace with the evolution of network technologies.

Ookla retains ownership of this article including all of the intellectual property rights, data, content graphs and analysis. This article may not be quoted, reproduced, distributed or published for any commercial purpose without prior consent. Members of the press and others using the findings in this article for non-commercial purposes are welcome to publicly share and link to report information with attribution to Ookla.

| December 14, 2021

Ookla Acquires RootMetrics

Ookla® has acquired RootMetrics®, bringing together two industry leaders that deliver outstanding network connectivity insights to the world. Together they will combine the industry-standard first-party crowdsourced data from Speedtest® with the RootMetrics’ scientifically controlled drive and walk testing data collection for the benefit of the mobile operators who build the networks and the consumers who rely on them.

Ookla CEO and co-founder Doug Suttles says, “Ookla plus RootMetrics fully enables the network assessment trifecta of crowd measurement, controlled testing and consumer perception—with a sustainable business model that should thrive through the privacy revolution.”

Mobile operators, network infrastructure providers and governments will be able to jointly leverage Ookla and RootMetrics’ respective network performance analytics, software products, testing capabilities and data science methodologies to better understand, market, deploy and optimize their networks. With RootMetrics and Ookla’s recently acquired Wind™ platform, Ookla’s portfolio of real-time mobile network coverage and performance measurement solutions now extends to traditional drive testing, indoor walk testing and live event monitoring.

“Becoming part of Ookla completes the vision that Doug and I shared when we first met years ago,” says RootMetrics CEO Kevin Hasley. “With our combined experience and expertise we can better help our customers overcome challenges, optimize their networks and create opportunities. I am very excited to see our joint future unfold.”

As part of Ookla, RootMetrics will continue to serve customers in the same capacity.

Ookla retains ownership of this article including all of the intellectual property rights, data, content graphs and analysis. This article may not be quoted, reproduced, distributed or published for any commercial purpose without prior consent. Members of the press and others using the findings in this article for non-commercial purposes are welcome to publicly share and link to report information with attribution to Ookla.